united states
securities and exchange commission
washington, d.c. 20549
form n-csr
certified shareholder report of registered management
investment companies
Investment Company Act file number 811-22549
Northern Lights Fund Trust II
(Exact name of registrant as specified in charter)
225 Pictoria Drive, Suite 450, Cincinnati, Ohio 45246
(Address of principal executive offices) (Zip code)
The Corporation Trust Company
1209 Orange Street Wilmington, DE 19801
(Name and address of agent for service)
Registrant's telephone number, including area code: 631-490-4300
Date of fiscal year end: 5/31
Date of reporting period: 5/31/22
Item 1. Reports to Stockholders.
| |
| |
| |
| |
| |
 |
| |
| |
| |
| |
| |
| Longboard Managed Futures Strategy Fund |
| |
| Class A Shares (Symbol: WAVEX) |
| Class I Shares (Symbol: WAVIX) |
| |
| Longboard Alternative Growth Fund |
| |
| Class A Shares (Symbol: LONAX) |
| Class I Shares (Symbol: LONGX) |
| |
| |
| |
| |
| |
| |
| |
| |
| |
| |
| Annual Report |
| |
| May 31, 2022 |
| |
| |
| |
| |
| |
| |
| |
| |
| |
| |
| Distributed by Northern Lights Distributors, LLC |
| Member FINRA/SIPC |
| |
| |
| |
| |
| |
Longboard Managed Futures Strategy Fund - 2021/2022
Dear Shareholders:
We are pleased to present you with the Longboard Managed Futures Strategy Fund Annual Report for the reporting period June 1, 2021 to May 31, 2022.
The Longboard Managed Futures Strategy Fund operates an unconstrained trend-following strategy to participate in nearly 120 global futures markets. Asset classes include commodities, currencies, equities, and fixed income. The Managed Futures Strategy Fund (Class I) was up +6.42%1 during the fiscal year ending May 31, 2022.
At the business level, we continue to adapt to the changing environment in a post-pandemic world. The Fund has now been trading for more than ten years in a mutual fund format while the managed futures sector has undergone significant consolidation. Our correlation to the stock market has remained near zero. We are in a period where the uncertainty surrounding the stock market’s post COVID strength has caused investors to look to alternative assets. As an alternative asset, we remain committed to the need for diversification. The world has seen how quickly the backdrop of the global economy can change. These periods require diligent risk management and reliable diversification.
Why consider investing?
Our fund seeks to add significant diversification benefits to an unbalanced portfolio. Ultimately, we believe this requires a portfolio to be less dependent on favorable outcomes for the equity market to deliver the portfolio results that you seek during equity selloffs.
What should I expect from this fund as an owner?
The fund seeks to produce positive absolute returns. Historically, the fund has produced near zero correlation to the U.S. stock market, as represented by the S&P 500 total return index. This means returns were largely independent of the stock market. Since inception through May 31, 2022, the correlation to the U.S. stock market was 0.02. The fund strives to be an effective risk-reducer in environments where global stocks are selling off.
What is our process?
Traditional investments2 are normally long-only so they take directional long exposure to equities and fixed income. With our fund, you are accessing approximately 120 markets within the sectors of equities, fixed income, commodities, and currencies. We have the ability to buy and go long or sell and go short any of these markets independent to what is happening elsewhere. We seek to maintain diversification across asset classes and actively manage risk in a way that index and traditional managers do not.
What caused the fund to outperform last year?
Last year, the fund outperformed its benchmark index, the ICE Bank of America Merrill Lynch 3-Month U.S. Treasury Bill Index. The benchmark returned +0.14% for the one-year period ending
May 31, 2022, compared to the fund’s performance of +6.421% for the same period for Class I. As supply chain constraints and rising interest rates continued, WAVIX was able to catch trends in assets not correlated to the stock market. During this time, our long exposure to commodities in an inflationary environment contributed to the majority of the outperformance.
Regards,

Cole Wilcox
Chief Investment Officer
Portfolio Manager

Sarah Baldwin
Managing Director of Investments
Portfolio Manager
Monthly Performance (6/1/2021 – 5/31/2022)
| | Jun. | Jul. | Aug. | Sept. | Oct | Nov. | Dec. | Jan. | Feb. | Mar. | April | May |
| | 2021 | 2021 | 2021 | 2021 | 2021 | 2021 | 2021 | 2022 | 2022 | 2022 | 2022 | 2022 |
| WAVIX (Class I) | -2.14% | -1.09% | 0.00% | -0.60% | 1.92% | -3.76% | 1.99% | 0.42% | 1.46% | 4.11% | 4.22% | -0.47% |
| WAVEX (Class A) | -2.08% | -1.11% | 0.00% | -0.61% | 1.85% | -3.83% | 2.01% | 0.43% | 1.48% | 3.97% | 4.19% | -0.57% |
| WAVIX (Class A Max Load) | -7.74% | -6.76% | -5.77% | -6.35% | -3.97% | -9.32% | -3.84% | -5.32% | -4.39% | -1.97% | -1.79% | -6.32% |
| ICE Bank of America Merrill Lynch 3-Month U.S. Treasury Bill Index | 0.00% | 0.01% | 0.00% | 0.01% | 0.00% | 0.01% | 0.01% | -0.01% | 0.01% | 0.03% | 0.02% | 0.07% |
Performance (as of 5/31/2022)
| | | | | | SINCE WAVIX | |
| | 2022 YTD | | | | INCEPTION | SINCE WAVEX |
| | Return | 1Y | 3Y | 5Y | (6/27/2012) | INCEPTION (3/22/2013) |
| WAVIX (Class I) | 10.58% | 6.42%1 | 6.46% | 0.94% | 2.60% | — |
| WAVEX (Class A) | 10.43% | 6.19% | 6.15% | 0.66% | — | 2.19% |
| WAVEX (Class A Max Load*) | 4.11% | 0.05% | 4.07% | -0.53% | — | 1.53% |
| ICE Bank of America Merrill Lynch 3-Month U.S. Treasury Bill Index | 0.12% | 0.14% | 0.69% | 1.12% | 0.64% | 0.68% |
WAVIX inception date: 6/27/2012 (I Share); WAVEX inception date: 3/22/2013 (A Share)
The performance data quoted here represents past performance. Current performance may be lower or higher than the performance data quoted above. Investment return and principal value will fluctuate, so that shares, when redeemed, may be worth more or less than their original cost. Past performance is no guarantee of future results. For performance information current to the most recent month-end, please call toll-free 855.294.7540.
| * | Inclusive of maximum sales load of 5.75%. Total annual operating expenses are 3.24% and 2.99% for Class A and I respectively. |
Definitions
| 1 | Calculated based on traded NAV, which may differ from final 5/31/22 NAV |
| 2 | Traditional Investments: Long-only stocks, long-only bonds, cash |
Commodity: A basic good used in commerce that is interchangeable with other goods of the same type; most often used as inputs in the production of other goods or services.
Currency: A system of money in general use in a particular country; a medium of exchange for goods and services.
Futures Contract: An agreement traded on an organized exchange to buy or sell assets, especially commodities or shares, at a fixed price but to be delivered and paid for later.
ICE Bank of America Merrill Lynch 3-Month U.S. Treasury Bill Index: An unmanaged index that is comprised of a single U.S. Treasury issue with approximately three months to final maturity, purchased at the beginning of each month and held for one full month.
Long: A long position describes what an investor has purchased when they buy a security or derivative with the expectation that it will rise in value.
Short: A trading technique in which an investor sells a security with the expectation that it will decrease in value, generally with the intention of repurchasing it or covering it later at a lower price.
PAST PERFORMANCE IS NOT NECESSARILY INDICATIVE OF FUTURE RESULTS.
1675-NLD-06/14/2022
Longboard Alternative Growth Fund - 2021/2022
Dear Shareholders:
We are pleased to present you with the Longboard Alternative Growth Fund Annual Report for the reporting period June 1, 2021 to May 31, 2022.
The Longboard Alternative Growth Fund features a tactical investment process with an objective to deliver long term capital appreciation that attempts to meet or exceed the returns of a traditional 60% stocks / 40% bonds portfolio. Said another way, we use traditional assets but attempt to deliver nontraditional results.
The Alternative Growth Fund (Class I) was down -3.47% for the fiscal year ended May 31, 2022.
At the business level, we continue to adapt to the changing environment in a post-pandemic world. The Fund has now been trading for more than seven years in a mutual fund format. Our correlation to the stock market has remained near 0.45. We are in a period where the uncertainty surrounding the stock market’s post-COVID strength has caused investors to seek diversification. As an alternative asset, we remain committed to the need for diversification in all market environments. The world has seen how quickly the backdrop of the global economy can change and looking ahead, inflation, interest rate hikes and geopolitical tension bring renewed concern regarding the sustainability of post-COVID economic strength. These periods require diligent risk management.
Why consider investing?
A traditional moderate risk portfolio1 of 60% stocks and 40% bonds is generally considered diversified and balanced. Our fund seeks to help investors reduce dependence on favorable outcomes for equity markets and achieve more portfolio balance without compromising returns.
Who was this fund designed for?
| ● | Investors searching for a bond replacement in the current low interest rate environment. |
| ● | Investors looking to diversify a traditional long-only equity portfolio. |
| ● | Investors seeking the potential to hedge against equity market downturns. |
What should I expect from this fund as an owner?
In environments when a moderate risk portfolio is performing very poorly, the fund’s tactical investment process seeks to lower correlation to the stock market. The degree of non-correlation should generally be expected to be higher in challenging equity markets and lower in strong equity markets. Historically, the fund has been an effective risk-reducer in environments when a moderate risk 60% stocks / 40% bonds portfolio is doing particularly poorly. Beginning in December 2021, the fund began issuing income in the form of a quarterly 1.75% distribution in
order to meet the needs of some investors to access capital in a tax efficient manner. This feature does not impact the investment strategies or the total return of the fund if a distribution is not taken.
What is our process?
Unlike traditional long-only equity investments, our fund is tactical and seeks to actively regulate its equity market exposure based on current market trends. The fund’s proprietary investment process identifies market leaders and laggards. It ranks the relative strength of the market as a whole and uses that data to adjust individual positions and stock market risk. When markets are doing well, this fund typically has an overweight of equities relative to a traditional portfolio, but as conditions become challenging, this fund attempts to adjust its exposure seeking lower correlation to equities. Our investment process actively manages risk in a way that index and traditional or passive investments do not.
What caused the fund to outperform last year?
Last year, the Fund outperformed the benchmark, the Morningstar Moderate Target Risk Index, slightly. In the second half of 2021, the Fund had slightly higher exposure to the stock market than a traditional 60/40. As we moved further into 2022, we saw the ferocity with which stocks rebounded reverse. Primarily the large cap growth stocks, technology in particular, have experienced large drawdowns. Being tactical in nature, we began to cut risk and have taken off a sizable amount of equity risk compared to a 60/40 portfolio. As interest rates and inflation have risen, we have seen the Finance and Energy sectors outperform. With rising interest rates impacting the bond sleeve of a 60/40 we were overall able to not experience as much drawdown compared to our benchmark. Our tactical methodology has allowed us to utilize traditional assets in a way that generates non-traditional results. This has allowed the Fund to experience less drawdown than a 60/40 and we should expect a rotation back into equities if broader trends reverse.
Regards,
Cole Wilcox
Chief Investment Officer
Portfolio Manager
Sarah Baldwin
Managing Director of Investments
Portfolio Manager
Monthly Performance (6/1/2021 – 5/31/2022)
| | Jun. | Jul. | Aug. | Sept. | Oct | Nov. | Dec. | Jan. | Feb. | Mar. | April | May |
| | 2021 | 2021 | 2021 | 2021 | 2021 | 2021 | 2021 | 2022 | 2022 | 2022 | 2022 | 2022 |
| LONGX (Class I) | 0.07% | 0.98% | 1.75% | -3.12% | 4.20% | -1.39% | 3.33% | -5.41% | -0.47% | 0.56% | -3.86% | 0.28% |
| LONAX (Class A) | 0.00% | 0.98% | 1.75% | -3.18% | 4.20% | -1.39% | 3.28% | -5.47% | -0.47% | 0.56% | -3.85% | 0.21% |
| LONAX (Class A Max Load) | -5.72% | -4.80% | -4.08% | -8.74% | -1.79% | -7.06% | -2.68% | -10.90% | -6.20% | -5.20% | -9.36% | -5.66% |
| Morningstar Moderate Target Risk Index | 0.65% | 0.72% | 1.31% | -2.65% | 2.46% | -1.81% | 2.81% | -3.77% | -1.53% | 0.07% | -5.85% | 0.29% |
Performance (as of 5/31/2022)
| | | | | | SINCE LONGX | SINCE LONAX |
| | 2022 YTD | | | | INCEPTION | INCEPTION |
| | Return | 1Y | 3Y | 5Y | (3/19/2015) | (12/09/2015) |
| LONGX (Class I) | -8.72% | -3.47% | 13.44% | 9.04% | 7.89% | — |
| LONAX (Class A) | -8.83% | -3.75% | 13.15% | 8.72% | — | 8.19% |
| LONAX (Class A Max Load)* | -14.07% | -9.26% | 10.94% | 7.44% | — | 7.20% |
| Morningstar Moderate Target Risk Index | -10.47% | -7.42% | 7.22% | 6.32% | 6.01% | 7.20% |
LONGX inception date: 3/19/2015 (I Share); LONAX inception date: 12/09/2015 (A Share)
The performance data quoted here represents past performance. Current performance may be lower or higher than the performance data quoted above. Investment return and principal value will fluctuate, so that shares, when redeemed, may be worth more or less than their original cost. Past performance is no guarantee of future results. For performance information current to the most recent month-end, please call toll-free 855.294.7540.
| * | Inclusive of maximum sales load of 5.75%. Total annual operating expenses are 2.24% and 1.99% for Class A and I respectively. |
Definitions
| 1 | Traditional Moderate Risk Portfolio – This is a common description of a portfolio where 60% is allocated to stocks and 40% of the portfolio is allocated to bonds. This portfolio may be represented by the Morningstar Moderate Target Risk Index. |
Short: Selling an asset such as a stock, commodity or currency, with the expectation that the asset will decrease in value.
Long: Buying an asset such as a stock, commodity or currency, with the expectation that the asset will rise in value.
PAST PERFORMANCE IS NOT NECESSARILY INDICATIVE OF FUTURE RESULTS.
1674-NLD-06/14/2022
Longboard Managed Futures Strategy Fund
PORTFOLIO REVIEW (Unaudited)
May 31, 2022
The Fund’s performance figures* for the periods ended May 31, 2022, as compared to its benchmarks:
| | | | | Annualized | Annualized |
| | | Annualized | Annualized | Since Inception** - | Since Inception*** - |
| | One Year | Three Year | Five Year | May 31, 2022 | May 31, 2022 |
| Longboard Managed Futures Strategy Fund - Class A | 6.19% | 6.15% | 0.66% | N/A | 2.19% |
| Longboard Managed Futures Strategy Fund - Class A with load | 0.05% | 4.07% | (0.53)% | N/A | 1.53% |
| Longboard Managed Futures Strategy Fund - Class I | 6.42% | 6.46% | 0.94% | 2.60% | N/A |
| ICE Bank of America Merrill Lynch 3-Month U.S. Treasury Bill Index (a) | 0.14% | 0.69% | 1.12% | 0.64% | 0.68% |
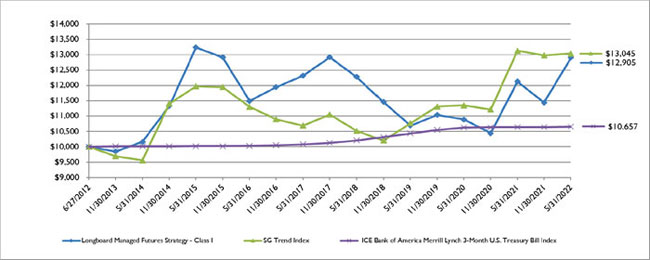
| SG Trend Index (b) | 24.92% | 15.03% | 8.92% | 5.11% | 5.78% |
| * | The performance data quoted here represents past performance. The performance comparison includes reinvestment of all dividends and capital gains and has been adjusted for the Class A maximum applicable sales charge of 5.75%. Current performance may be lower or higher than the performance data quoted above. Past performance is no guarantee of future results. The investment return and principal value of an investment will fluctuate so that investor’s shares, when redeemed, may be worth more or less than their original cost. Total returns are calculated with the traded NAV on May 31, 2022, which may differ from what is presented in the financial highlights. The returns shown do not reflect the deduction of taxes that a shareholder would pay on Fund distributions or on the redemption of Fund shares. Performance figures for periods greater than 1 year are annualized. The Fund’s total annualized operating expenses are 3.24% for Class A and 2.99% for Class I shares per the October 1, 2021, prospectus. For performance information current to the most recent month-end, please call toll-free 1-855-294-7540. |
| ** | Inception date for Class I is June 27, 2012. |
| *** | Inception date for Class A is March 22, 2013. |
| (a) | The ICE Bank of America Merrill Lynch 3-month U.S. Treasury Bill Index is an index of short-term U.S. Government securities with a remaining term to final maturity of less than three months. |
| (b) | The SG Trend Index is designed to track the 10 largest (by AUM) trend following CTAs and is equal-weighted and reconstituted annually. The index calculates the net daily rate of return for a pool of trend following based hedge fund managers. |
Comparison of the Change in Value of a $10,000 Investment
The Fund’s Top Asset Classes are as follows:
| Holdings by Asset Class | | % Net Assets | |
| U.S. Treasury Bill | | | 37.9 | % |
| Other Assets in Excess of Liabilities + | | | 62.1 | % |
| | | | 100.0 | % |
| + | Includes unrealized appreciation/(depreciation) on derivative contracts. |
Please refer to the Schedule of Investments in this Annual Report for a detailed listing of the Portfolio’s holdings.
Longboard Alternative Growth Fund
PORTFOLIO REVIEW (Unaudited)
May 31, 2022
The Fund’s performance figures* for the periods ended May 31, 2022, as compared to its benchmarks:
| | | | | Annualized | Annualized |
| | | Annualized | Annualized | Since Inception** - | Since Inception*** - |
| | One Year | Three Year | Five Year | May 31, 2022 | May 31, 2022 |
| Longboard Alternative Growth Fund - Class A | (3.75)% | 13.15% | 8.72% | N/A | 8.19% |
| Longboard Alternative Growth Fund - Class A with load | (9.26)% | 10.94% | 7.44% | N/A | 7.20% |
| Longboard Alternative Growth Fund - Class I | (3.47)% | 13.44% | 9.04% | 7.89% | N/A |
| Morningstar Moderate Target Risk Index (a) | (7.42)% | 7.22% | 6.32% | 6.01% | 7.20% |
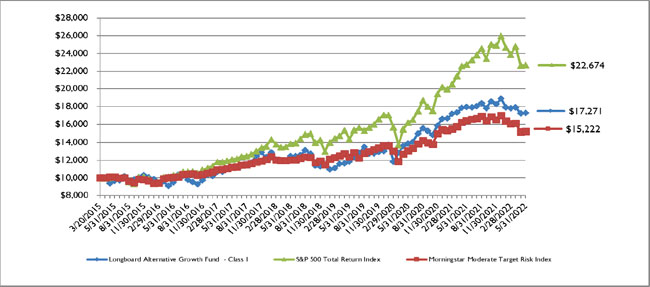
| S&P 500 Total Return Index (b) | (0.30)% | 16.44% | 13.38% | 12.04% | 13.56% |
| * | The performance data quoted here represents past performance. The performance comparison includes reinvestment of all dividends and capital gains and has been adjusted for the Class A maximum applicable sales charge of 5.75%. Current performance may be lower or higher than the performance data quoted above. Past performance is no guarantee of future results. The investment return and principal value of an investment will fluctuate so that investor’s shares, when redeemed, may be worth more or less than their original cost. The returns shown do not reflect the deduction of taxes that a shareholder would pay on Fund distributions or on the redemption of Fund shares. Performance figures for periods greater than 1 year are annualized. The Fund’s total annualized operating expenses are 2.24% for Class A and 1.99% for Class I shares per the October 1, 2021, prospectus. For performance information current to the most recent month-end, please call toll-free 1-855-294-7540. |
| ** | Inception date for Class I is March 19, 2015. |
| *** | Inception date for Class A is December 9, 2015. |
| (a) | The Morningstar Target Risk Index family is designed to meet the needs of investors who would like to maintain a target level of equity exposure through a portfolio diversified across equities, bonds and inflation-hedged instruments. The Morningstar Moderate Target Risk Index seeks approximately 60% exposure to global equity markets. The Adviser has elected to change the benchmark for the Fund. Going forward, the Morningstar Moderate Target Risk TR USD Index will replace the S&P 500 Total Return Index as the Fund’s primary broad-based index. The S&P 500 Total Return Index will continue to be shown for a period. |
Longboard Alternative Growth Fund (the “Fund”) are not sponsored, endorsed, sold or promoted by Morningstar, Inc. or any of its affiliates (all such entities, collectively, “Morningstar Entities”). The Morningstar Entities make no representation or warranty, express or implied, to individuals who invest in the Fund or any member of the public regarding the advisability of investing in equity securities generally or in the Fund’s in particular or the ability of the Fund to track the Morningstar Indices or general equity market performance. THE MORNINGSTAR ENTITIES DO NOT GUARANTEE THE ACCURACY AND/OR THE COMPLETENESS OF THE FUND OR ANY DATA INCLUDED THEREIN AND MORNINGSTAR ENTITIES SHALL HAVE NO LIABILITY FOR ANY ERRORS, OMISSIONS, OR INTERRUPTIONS THEREIN. One cannot invest directly in an index.
| (b) | The S&P 500 Total Return Index (S&P 500) is a domestic equity index consisting of 500 stocks representing approximately 75% of the total U.S. equity market focusing on the large-cap sector of the U.S. equities market. The index includes the 500 leading companies in leading industries of the U.S. economy. |
The index returns are unmanaged and do not reflect the deduction of any fees or expenses.
Comparison of the Change in Value of a $10,000 Investment
The Fund’s Top Asset Classes are as follows:
| Holdings by Asset Class | | % Net Assets | |
| U.S. Treasury Bills | | | 89.5 | % |
| Other Assets in Excess of Liabilities + | | | 10.5 | % |
| | | | 100.0 | % |
| + | Includes unrealized appreciation/(depreciation) on derivative contracts. |
Please refer to the Schedule of Investments in this Annual Report for a detailed listing of the Portfolio’s holdings.
LONGBOARD MANAGED FUTURES STRATEGY
CONSOLIDATED SCHEDULE OF INVESTMENTS
May 31, 2022
| Principal | | | | | Coupon Rate | | | | | |
| Amount ($) | | | | | (%) | | Maturity | | Fair Value | |
| | | | | U.S. GOVERNMENT & AGENCIES — 37.9% | | | | | | | | |
| | | | | U.S. TREASURY BILL — 37.9% | | | | | | | | |
| | 15,000,000 | | | United States Treasury Bill(a) (Cost $14,978,267) | | 0.000 | | 08/04/22 | | $ | 14,974,178 | |
| | | | | | | | | | | | | |
| | | | | TOTAL INVESTMENTS - 37.9% (Cost $14,978,267) | | | | | | $ | 14,974,178 | |
| | | | | OTHER ASSETS IN EXCESS OF LIABILITIES - 62.1% | | | | | | | 24,498,126 | |
| | | | | NET ASSETS - 100.0% | | | | | | $ | 39,472,304 | |
| OPEN FUTURES CONTRACTS | |
Number of
Contracts | | | Open Long Futures Contracts | | Expiration | | Notional Amount(b) | | | Value and
Unrealized
Appreciation
(Depreciation) | |
| | 2 | | | Carbon Emissions Future(c) | | 12/19/2022 | | $ | 180,358 | | | $ | 29,558 | |
| | 10 | | | CBOT Corn Future(c) | | 07/14/2022 | | | 376,750 | | | | (125 | ) |
| | 3 | | | CBOT Rough Rice Future(c) | | 07/14/2022 | | | 105,270 | | | | 6,330 | |
| | 4 | | | CBOT Soybean Future(c) | | 07/14/2022 | | | 336,650 | | | | 1,450 | |
| | 12 | | | CBOT Soybean Meal Future(c) | | 07/14/2022 | | | 497,760 | | | | (52,560 | ) |
| | 6 | | | CBOT Soybean Oil Future(c) | | 07/14/2022 | | | 280,512 | | | | 18,504 | |
| | 5 | | | CBOT Wheat Future(c) | | 07/14/2022 | | | 271,875 | | | | 2,625 | |
| | 10 | | | Euronext Milling Wheat Future(c) | | 12/12/2022 | | | 207,014 | | | | 31,978 | |
| | 2 | | | Euronext Rapeseed Future(c) | | 07/29/2022 | | | 87,126 | | | | 3,689 | |
| | 10 | | | FTSE 100 Index Future | | 06/17/2022 | | | 955,894 | | | | 62,451 | |
| | 1 | | | ICE Brent Crude Oil Future(c) | | 06/30/2022 | | | 115,600 | | | | 3,870 | |
| | 1 | | | ICE Gas Oil Future(c) | | 07/12/2022 | | | 119,900 | | | | 15,450 | |
| | 1 | | | ICE WTI Crude Oil Futures Contract(c) | | 06/17/2022 | | | 114,670 | | | | 7,120 | |
| | 2 | | | KCBT Hard Red Winter Wheat Future(c) | | 07/14/2022 | | | 116,550 | | | | 8,425 | |
| | 11 | | | LME Lead Future(c) | | 06/15/2022 | | | 598,318 | | | | (63,845 | ) |
| | 3 | | | LME Nickel Future(c) | | 06/15/2022 | | | 510,264 | | | | 67,636 | |
| | 6 | | | LME Primary Aluminum Future(c) | | 06/15/2022 | | | 414,563 | | | | (100,873 | ) |
| | 3 | | | LME Primary Aluminum Future(c) | | 09/21/2022 | | | 209,325 | | | | (5,363 | ) |
| | 4 | | | LME Zinc Future(c) | | 06/15/2022 | | | 392,900 | | | | 24,990 | |
| | 2 | | | LME Zinc Future(c) | | 09/21/2022 | | | 195,750 | | | | (1,475 | ) |
| | 4 | | | MDE Crude Palm Oil Future(c) | | 08/15/2022 | | | 143,960 | | | | (3,223 | ) |
| | 2 | | | NYBOT CSC C Coffee Future(c) | | 07/19/2022 | | | 173,438 | | | | (3,975 | ) |
| | 29 | | | NYBOT CSC Number 11 World Sugar Future(c) | | 06/30/2022 | | | 630,112 | | | | (28,918 | ) |
| | 4 | | | NYBOT CTN Frozen Concentrated Orange Juice A(c) | | 07/11/2022 | | | 106,410 | | | | 5,392 | |
| | 2 | | | NYBOT CTN Number 2 Cotton Future(c) | | 12/07/2022 | | | 122,450 | | | | (2,680 | ) |
| | 1 | | | NYMEX Henry Hub Natural Gas Futures(c) | | 06/28/2022 | | | 81,450 | | | | 8,170 | |
| | 1 | | | NYMEX Light Sweet Crude Oil Future(c) | | 06/21/2022 | | | 114,670 | | | | 2,190 | |
| | 1 | | | NYMEX NY Harbor ULSD Futures(c) | | 06/30/2022 | | | 165,270 | | | | 10,588 | |
| | 1 | | | NYMEX Reformulated Gasoline Blendstock for Oxygen(c) | | 06/30/2022 | | | 164,480 | | | | 6,115 | |
| | 14 | | | Robusta Coffee Future 10-Tonne(c) | | 07/25/2022 | | | 294,840 | | | | 3,220 | |
| | 21 | | | WCE Canola Future(c) | | 11/14/2022 | | | 356,433 | | | | 21,713 | |
| | 17 | | | White Sugar Future(c) | | 07/15/2022 | | | 486,455 | | | | 33,745 | |
| | | | | NET UNREALIZED APPRECIATION FROM OPEN LONG FUTURES CONTRACTS | | | | | | | | | 112,172 | |
See accompanying notes to consolidated financial statements.
LONGBOARD MANAGED FUTURES STRATEGY
CONSOLIDATED SCHEDULE OF INVESTMENTS (Continued)
May 31, 2022
OPEN FUTURES CONTRACTS
Number of
Contracts | | | Open Short Futures Contracts | | Expiration | | Notional Amount(b) | | | Value and
Unrealized
Appreciation
(Depreciation) | |
| | 29 | | | 3 Month Euro Euribor Future | | 12/19/2022 | | $ | 7,716,110 | | | $ | 60,025 | |
| | 9 | | | CBOT 10 Year US Treasury Note | | 09/21/2022 | | | 1,075,077 | | | | 8,650 | |
| | 13 | | | CBOT 2 Year US Treasury Note Future | | 09/30/2022 | | | 2,744,326 | | | | 4,158 | |
| | 12 | | | CBOT 5 Year US Treasury Note | | 09/30/2022 | | | 1,355,436 | | | | 6,470 | |
| | 5 | | | CBOT 30 Year US Treasury Bond | | 09/21/2022 | | | 697,190 | | | | 9,841 | |
| | 30 | | | CME 3 Month Eurodollar Future | | 12/18/2023 | | | 7,270,500 | | | | 57,938 | |
| | 2 | | | CME E-Mini NASDAQ 100 Index Future | | 06/17/2022 | | | 505,860 | | | | (6,460 | ) |
| | 6 | | | CME E-mini Russell 2000 Index Futures | | 06/17/2022 | | | 558,570 | | | | 18,100 | |
| | 3 | | | CME E-Mini Standard & Poor’s MidCap 400 Index | | 06/17/2022 | | | 753,960 | | | | (38,790 | ) |
| | 11 | | | CME Feeder Cattle Future(c) | | 08/25/2022 | | | 908,188 | | | | 42,937 | |
| | 30 | | | CME Live Cattle Future(c) | | 08/31/2022 | | | 1,564,500 | | | | 25,290 | |
| | 3 | | | CME Ultra Long Term US Treasury Bond Future | | 09/21/2022 | | | 467,250 | | | | 10,242 | |
| | 5 | | | COMEX Silver Future(c) | | 07/27/2022 | | | 542,200 | | | | 5,425 | |
| | 6 | | | Eurex 10 Year Euro BUND Future | | 06/08/2022 | | | 976,087 | | | | 104,879 | |
| | 56 | | | Eurex 2 Year Euro SCHATZ Future | | 06/08/2022 | | | 6,618,782 | | | | 59,671 | |
| | 3 | | | Eurex 30 Year Euro BUXL Future | | 06/08/2022 | | | 522,271 | | | | 95,888 | |
| | 12 | | | Eurex 5 Year Euro BOBL Future | | 06/08/2022 | | | 1,629,151 | | | | 93,768 | |
| | 2 | | | Eurex DAX Index Future | | 06/17/2022 | | | 771,547 | | | | (28,598 | ) |
| | 5 | | | Euro-BTP Italian Bond Futures | | 06/08/2022 | | | 680,852 | | | | 94,451 | |
| | 5 | | | HKG Hang Seng China Enterprises Index Future | | 06/29/2022 | | | 235,052 | | | | (13,062 | ) |
| | 3 | | | HKG Hang Seng Index Future | | 06/29/2022 | | | 408,948 | | | | (19,267 | ) |
| | 6 | | | ICE US mini MSCI EAFE Index Futures | | 06/17/2022 | | | 611,100 | | | | (3,450 | ) |
| | 7 | | | ICE US MSCI Emerging Markets EM Index Futures | | 06/17/2022 | | | 372,155 | | | | 8,010 | |
| | 11 | | | LME Lead Future(c) | | 06/15/2022 | | | 598,318 | | | | (3,192 | ) |
| | 3 | | | LME Nickel Future(c) | | 06/15/2022 | | | 510,264 | | | | 414 | |
| | 6 | | | LME Primary Aluminum Future(c) | | 06/15/2022 | | | 414,563 | | | | 62,188 | |
| | 4 | | | LME Zinc Future(c) | | 06/15/2022 | | | 392,900 | | | | 24,965 | |
| | 9 | | | Long Gilt Future | | 09/28/2022 | | | 1,315,267 | | | | 20,174 | |
| | 13 | | | Montreal Exchange 10 Year Canadian Bond Future | | 09/20/2022 | | | 1,305,293 | | | | 16,315 | |
| | 43 | | | Montreal Exchange 3 Month Canadian Bank Acceptance | | 06/13/2022 | | | 8,308,421 | | | | 57,240 | |
| | 37 | | | NYBOT CSC Cocoa Future(c) | | 07/14/2022 | | | 923,521 | | | | (16,910 | ) |
| | 11 | | | NYMEX Platinum Future(c) | | 07/27/2022 | | | 532,565 | | | | (33,135 | ) |
| | 32 | | | OSE Nikkei 225 mini Future | | 06/09/2022 | | | 677,677 | | | | (55,951 | ) |
| | 12 | | | SFE 10 Year Australian Bond Future | | 06/15/2022 | | | 832,044 | | | | 80,653 | |
| | 18 | | | SFE 3 Year Australian Bond Future | | 06/15/2022 | | | 1,253,684 | | | | 35,682 | |
| | 28 | | | SGX FTSE China A50 Futures Contract | | 06/29/2022 | | | 379,568 | | | | (11,088 | ) |
| | 18 | | | SGX MSCI Singapore Index Future | | 06/29/2022 | | | 394,520 | | | | (1,903 | ) |
| | 5 | | | TSE Japanese 10 Year Bond Futures | | 06/13/2022 | | | 5,812,914 | | | | 26,083 | |
| | | | | NET UNREALIZED APPRECIATION FROM OPEN SHORT FUTURES CONTRACTS | | | | | | | | | 797,651 | |
| | | | | | | | | | | | | | | |
| | | | | NET UNREALIZED APPRECIATION FROM OPEN FUTURES CONTRACTS | | | | | | | | $ | 909,823 | |
| (b) | The amounts shown are the underlying reference notional amounts to stock exchange indices and equities upon which the fair value of the futures contracts held by the Fund are based. Notional values do not represent the current fair value of, and are not necessarily indicative of the future cash flows of the Fund’s futures contracts. Further, the underlying price changes in relation to the variables specified by the notional values affects the fair value of these derivative financial instruments. The notional values as set forth within this schedule do not purport to represent economic value at risk to the Fund. |
| (c) | All or a portion of this investment is a holding of the Longboard Fund Limited. |
See accompanying notes to consolidated financial statements.
LONGBOARD MANAGED FUTURES STRATEGY
CONSOLIDATED SCHEDULE OF INVESTMENTS (Continued)
May 31, 2022
Forward Foreign Currency Exchange Contracts
| | | | | | | | | | | | | | | |
| Foreign Currency | | Settlement Date | | Counterparty | | Local Currency | | U.S. Dollar Value | | | Unrealized
Appreciation/(Depreciation) | |
| To Buy: | | To Sell: | | | | | | | | | | | | | | |
| Australian Dollar | | United States Dollars | | 06/15/2022 | | Jefferies | | 1,900,000 | | $ | 1,363,586 | | | $ | (56,417 | ) |
| Brazilian Real | | United States Dollars | | 06/15/2022 | | Jefferies | | 5,200,000 | | | 1,089,799 | | | | 81,461 | |
| British Pound | | United States Dollars | | 06/15/2022 | | Jefferies | | 875,000 | | | 1,102,714 | | | | (8,077 | ) |
| Czech Koruna | | United States Dollars | | 06/15/2022 | | Jefferies | | 23,985,000 | | | 1,039,641 | | | | 39,641 | |
| Japanese Yen | | United States Dollars | | 06/15/2022 | | Jefferies | | 62,500,000 | | | 485,814 | | | | 3,617 | |
| Mexican Peso | | United States Dollars | | 06/15/2022 | | Jefferies | | 62,500,000 | | | 3,166,890 | | | | 146,180 | |
| Norwegian Krone | | United States Dollars | | 06/15/2022 | | Jefferies | | 8,707,770 | | | 928,957 | | | | 28,957 | |
| Swiss Franc | | United States Dollars | | 06/15/2022 | | Jefferies | | 2,500,000 | | | 2,607,772 | | | | 28,041 | |
| Brazilian Real | | United States Dollars | | 09/21/2022 | | Jefferies | | 2,500,000 | | | 509,470 | | | | (2,091 | ) |
| | | | | | | | | | | $ | 12,294,643 | | | $ | 261,312 | |
| To Sell: | | To Buy: | | | | | | | | | | | | | | |
| Australian Dollar | | United States Dollars | | 06/15/2022 | | Jefferies | | 4,000,000 | | $ | 2,870,707 | | | $ | 18,867 | |
| Brazilian Real | | United States Dollars | | 06/15/2022 | | Jefferies | | 5,200,000 | | | 1,089,799 | | | | (9,565 | ) |
| British Pound | | United States Dollars | | 06/15/2022 | | Jefferies | | 1,687,500 | | | 2,126,662 | | | | 94,004 | |
| Canadian Dollar | | United States Dollars | | 06/15/2022 | | Jefferies | | 4,000,000 | | | 3,161,967 | | | | (48,836 | ) |
| Czech Koruna | | United States Dollars | | 06/15/2022 | | Jefferies | | 41,619,600 | | | 1,804,021 | | | | (4,021 | ) |
| Euro | | United States Dollars | | 06/15/2022 | | Jefferies | | 1,125,000 | | | 1,208,344 | | | | 43,387 | |
| Japanese Yen | | United States Dollars | | 06/15/2022 | | Jefferies | | 125,000,000 | | | 971,628 | | | | 108,146 | |
| Mexican Peso | | United States Dollars | | 06/15/2022 | | Jefferies | | 32,500,000 | | | 1,646,783 | | | | (26,037 | ) |
| New Zealand Dollar | | United States Dollars | | 06/15/2022 | | Jefferies | | 2,000,000 | | | 1,303,098 | | | | 63,302 | |
| Norwegian Krone | | United States Dollars | | 06/15/2022 | | Jefferies | | 14,707,680 | | | 1,569,035 | | | | 30,965 | |
| Polish Zloty | | United States Dollars | | 06/15/2022 | | Jefferies | | 3,500,000 | | | 818,149 | | | | (22,351 | ) |
| Swedish Krona | | United States Dollars | | 06/15/2022 | | Jefferies | | 7,713,120 | | | 790,099 | | | | 9,901 | |
| Swiss Franc | | United States Dollars | | 06/15/2022 | | Jefferies | | 3,375,000 | | | 3,520,492 | | | | 78,739 | |
| | | | | | | | | | | $ | 22,880,784 | | | $ | 336,501 | |
| Total | | | | | | | | | | | | | | $ | 597,813 | |
| Foreign Currency | | Settlement
Date | | Counterparty | | Local Currency
Amount to Buy | | Local Currency
Amount to Sell | | U.S. Dollar Market
Value Buy | | U.S. Dollar Market
Value Sell | | | Unrealized
Appreciation/
(Depreciation) | |
| To Buy: | | To Sell: | | | | | | | | | | | | | | | | | | |
| Australian Dollar | | British Pound | | 6/15/2022 | | Jefferies | | 2,178,438 | | 1,250,000 | | 1,563,414 | | | (1,575,305 | ) | | $ | (11,891 | ) |
| Australian Dollar | | Japanese Yen | | 6/15/2022 | | Jefferies | | 2,600,000 | | 228,553,000 | | 1,865,959 | | | (1,776,548 | ) | | | 89,411 | |
| British Pound | | Euro | | 6/15/2022 | | Jefferies | | 2,112,625 | | 2,500,000 | | 2,662,423 | | | (2,685,209 | ) | | | (22,786 | ) |
| British Pound | | Japanese Yen | | 6/15/2022 | | Jefferies | | 1,625,000 | | 258,919,375 | | 2,047,897 | | | (2,012,586 | ) | | | 35,311 | |
| Canadian Dollar | | Australian Dollar | | 6/15/2022 | | Jefferies | | 2,501,240 | | 2,800,000 | | 1,977,210 | | | (2,009,494 | ) | | | (32,284 | ) |
| Canadian Dollar | | Japanese Yen | | 6/15/2022 | | Jefferies | | 1,800,000 | | 162,720,000 | | 1,422,885 | | | (1,264,826 | ) | | | 158,059 | |
| Euro | | Japanese Yen | | 6/15/2022 | | Jefferies | | 4,250,000 | | 564,914,250 | | 4,564,854 | | | (4,391,091 | ) | | | 173,763 | |
| Japanese Yen | | Australian Dollar | | 6/15/2022 | | Jefferies | | 125,903,400 | | 1,400,000 | | 978,650 | | | (1,004,747 | ) | | | (26,097 | ) |
| Japanese Yen | | British Pound | | 6/15/2022 | | Jefferies | | 122,205,000 | | 750,000 | | 949,902 | | | (945,183 | ) | | | 4,719 | |
| Japanese Yen | | Canadian Dollar | | 6/15/2022 | | Jefferies | | 98,830,000 | | 1,000,000 | | 768,208 | | | (790,492 | ) | | | (22,284 | ) |
| Japanese Yen | | Euro | | 6/15/2022 | | Jefferies | | 273,495,999 | | 2,125,000 | | 2,125,890 | | | (2,282,427 | ) | | | (156,537 | ) |
| Japanese Yen | | Swiss Franc | | 6/15/2022 | | Jefferies | | 131,418,000 | | 1,000,000 | | 1,021,515 | | | (1,043,109 | ) | | | (21,594 | ) |
| Swiss Franc | | Japanese Yen | | 6/15/2022 | | Jefferies | | 1,750,000 | | 219,362,500 | | 1,825,441 | | | (1,705,110 | ) | | | 120,331 | |
| Total | | | | | | | | 770,669,702 | | 1,447,294,125 | | $23,774,248 | | $ | (23,486,127 | ) | | $ | 288,121 | |
| NET UNREALIZED APPRECIATION ON FORWARD FOREIGN CURRENCY EXCHANGE CONTRACTS | | | $ | 885,934 | |
See accompanying notes to consolidated financial statements.
LONGBOARD ALTERNATIVE GROWTH FUND
SCHEDULE OF INVESTMENTS
May 31, 2022
| Principal | | | | | Coupon Rate | | | | | |
| Amount ($) | | | | | (%) | | Maturity | | Fair Value | |
| | | | | U.S. GOVERNMENT & AGENCIES — 89.5% | | | | | | | | |
| | | | | U.S. TREASURY BILLS — 89.5% | | | | | | | | |
| | 35,000,000 | | | United States Treasury Bill(a)(c) | | 0.000 | | 06/30/22 | | $ | 34,980,729 | |
| | 35,000,000 | | | United States Treasury Bill(a)(c) | | 0.000 | | 07/28/22 | | | 34,953,727 | |
| | 30,000,000 | | | United States Treasury Bill(a)(c) | | 0.000 | | 08/25/22 | | | 29,925,891 | |
| | | | | TOTAL U.S. GOVERNMENT & AGENCIES (Cost $99,867,344) | | | | | | | 99,860,347 | |
| | | | | | | | | | | | | |
| | | | | TOTAL INVESTMENTS – 89.5% (Cost $99,867,344) | | | | | | $ | 99,860,347 | |
| | | | | OTHER ASSETS IN EXCESS OF LIABILITIES – 10.5% (b) | | | | | | | 11,737,858 | |
| | | | | NET ASSETS - 100.0% | | | | | | $ | 111,598,205 | |
| (b) | Includes unrealized appreciation (depreciation) on swap contract. |
| (c) | All or a portion of this investment is held as collateral for swaps. |
SWAP CONTRACTS *
Notional Value at May 31,
2022 | | | Description | | Counterparty | | Fixed Rate
Received | | Variable Rate Paid | | Maturity Date | | Value/Unrealized
Appreciation
(Depreciation) | |
| $ | 33,596,699 | | | Longboard USD Total
Return Swap A | | Scotiabank | | Total Return
of the
Underlying
Basket | | OBFR + 50 bps on Longs
Notional; OBFR - (35-85bps)
for General Collateral Shorts
Notional | | 3/22/2024 | | $ | (346,260 | ) |
| | | | | | | | | | | | | | | | | |
| | 32,434,477 | | | Longboard USD Total
Return Swap B | | Scotiabank | | Total Return
of the
Underlying
Basket | | OBFR + 50 bps on Longs
Notional; OBFR - (35-85bps)
for General Collateral Shorts
Notional | | 3/24/2023 | | | 1,230,473 | |
| | | | | Total Net Unrealized Appreciation on Total Return Swap Contracts | | $ | 884,213 | |
| * | No upfront payments or receipts |
See accompanying notes to consolidated financial statements.
| LONGBOARD ALTERNATIVE GROWTH FUND |
| SCHEDULE OF INVESTMENTS (Continued) |
| May 31, 2022 |
Additional Information — LongBoard USD Total Return Swap A - Underlying Basket Disclosure *
The following table represents the top 50 individual positions and related values within the total return basket swap as of May 31, 2022.
| * | This investment is a not a direct holding of the Longboard Alternative Growth Fund. The top holdings were determined based on the absolute notional values of the positions within the underlying swap basket. |
| | | | | | | | | Net Unrealized | |
| | | | | | | | | Appreciation | |
| DESCRIPTION | | Shares | | | Notional (a) | | | (Depreciation) | |
| Common Stock | | | | | | | | | | | | |
| Banking | | | | | | | | | | | | |
| Amalgamated Financial Corporation | | | 7,667 | | | $ | 166,604 | | | $ | 12,706 | |
| City Holding Company | | | 2,400 | | | | 197,016 | | | | 8,540 | |
| Columbia Financial, Inc. | | | 9,545 | | | | 198,441 | | | | 932 | |
| FVSbankcorp, Inc. | | | 8,658 | | | | 179,221 | | | | (6,796 | ) |
| Lakeland Financial Corporation | | | 2,312 | | | | 166,834 | | | | (663 | ) |
| Southside Bancshares ,Inc. | | | 4,874 | | | | 196,568 | | | | 1,056 | |
| | | | | | | | | | | | 15,775 | |
| Beverages | | | | | | | | | | | | |
| Constellation Brands, Inc. | | | 737 | | | | 180,911 | | | | (6,672 | ) |
| | | | | | | | | | | | | |
| Biotech & Pharma | | | | | | | | | | | | |
| Amgen, Inc. | | | 718 | | | | 184,339 | | | | 4,863 | |
| Bristol-Myers Squibb Company | | | 2,658 | | | | 200,546 | | | | 9,170 | |
| Merck & Co., Inc. | | | 2,378 | | | | 218,847 | | | | 5,035 | |
| Regeneron Pharmaceuticals | | | 269 | | | | 178,815 | | | | 405 | |
| | | | | | | | | | | | 19,473 | |
| Chemicals | | | | | | | | | | | | |
| Ashland Global Holdings, Inc. | | | 1,536 | | | | 164,383 | | | | (4,767 | ) |
| | | | | | | | | | | | | |
| Electric Utilities | | | | | | | | | | | | |
| American Electric Power | | | 1,862 | | | | 189,980 | | | | 7,339 | |
| Black Hills Corporation | | | 2,366 | | | | 181,378 | | | | (6,715 | ) |
| Edison International | | | 2,940 | | | | 205,535 | | | | (3,474 | ) |
| Entergy Corporation | | | 1,634 | | | | 196,603 | | | | (7,150 | ) |
| Evergy, Inc. | | | 2,951 | | | | 206,393 | | | | 5,237 | |
| Eversource Energy | | | 2,241 | | | | 206,889 | | | | (696 | ) |
| Firstenergy Corporation | | | 3,950 | | | | 169,692 | | | | (18,490 | ) |
| Nrg Energy, Inc. | | | 3,867 | | | | 178,037 | | | | 1,605 | |
| Oklahoma Gas & Electric Company | | | 5,048 | | | | 208,482 | | | | (2,940 | ) |
| Public Service Enterprise | | | 2,488 | | | | 170,528 | | | | (536 | ) |
| WEC Energy Group, Inc. | | | 2,037 | | | | 214,028 | | | | 10,347 | |
| Xcel Energy, Inc. | | | 2,496 | | | | 188,049 | | | | 8,380 | |
| | | | | | | | | | | | (7,093 | ) |
| Food | | | | | | | | | | | | |
| Campbell Soup Company | | | 3,681 | | | | 176,357 | | | | (12,175 | ) |
| Kellogg Company | | | 2,598 | | | | 181,185 | | | | 7,045 | |
| Mondelez | | | 4,400 | | | | 279,664 | | | | 6,855 | |
| Pilgrims Pride Corporation | | | 5,056 | | | | 168,466 | | | | (2,680 | ) |
| | | | | | | | | | | | (955 | ) |
See accompanying notes to consolidated financial statements.
| LONGBOARD ALTERNATIVE GROWTH FUND |
| SCHEDULE OF INVESTMENTS (Continued) |
| May 31, 2022 |
Additional Information — LongBoard USD Total Return Swap A - Underlying Basket Disclosure *
| * | This investment is a not a direct holding of the Longboard Alternative Growth Fund. The top 50 holdings were determined based on the absolute notional values of the positions within the underlying swap basket. |
| | | | | | | | | Net Unrealized | |
| | | | | | | | | Appreciation | |
| DESCRIPTION | | Shares | | | Notional (a) | | | (Depreciation) | |
| Common Stock (Continued) | | | | | | | | | | | | |
| Health Care Facilities & Services | | | | | | | | | | | | |
| Cigna | | | 674 | | | $ | 180,827 | | | $ | (790 | ) |
| | | | | | | | | | | | | |
| Household Products | | | | | | | | | | | | |
| Colgate-Palmolive Company | | | 3,375 | | | | 265,984 | | | | 14,944 | |
| | | | | | | | | | | | | |
| | | | | | | | | | | | | |
| Industrial Intermediate Products | | | | | | | | | | | | |
| Valmont Industries at New York | | | 636 | | | | 163,293 | | | | 533 | |
| | | | | | | | | | | | | |
| Industrial Support Services | | | | | | | | | | | | |
| Macquarie Infrastructure | | | 46,308 | | | | 176,897 | | | | (426 | ) |
| WW Grainger, Inc. | | | 447 | | | | 217,720 | | | | 4,921 | |
| | | | | | | | | | | | 4,495 | |
| Insurance | | | | | | | | | | | | |
| Berkshire Hathaway, Inc. - Class B | | | 713 | | | | 225,294 | | | | (26,567 | ) |
| Donegal Group ,Inc. - Class A | | | 16,022 | | | | 259,236 | | | | 19,679 | |
| Marsh & Mclennan Companies, Inc. | | | 1,754 | | | | 280,552 | | | | (10,485 | ) |
| Safety Insurance Group, Inc. | | | 1,919 | | | | 178,198 | | | | 3,427 | |
| | | | | | | | | | | | (13,946 | ) |
| Medical Equipment & Devices | | | | | | | | | | | | |
| Becton Dickinson And Company | | | 646 | | | | 165,247 | | | | (9,212 | ) |
| | | | | | | | | | | | | |
| Real Estate Investment Trusts | | | | | | | | | | | | |
| Physicians Realty Trust | | | 10,394 | | | | 192,809 | | | | (1,143 | ) |
| Potlatch Corporation | | | 3,296 | | | | 172,908 | | | | (4,769 | ) |
| Realty Income Corporation | | | 2,975 | | | | 202,955 | | | | (11,896 | ) |
| Vici Properties, Inc. | | | 7,734 | | | | 238,594 | | | | 16,038 | |
| | | | | | | | | | | | (1,770 | ) |
| Retail - Discretionary | | | | | | | | | | | | |
| Autozone, Inc. | | | 86 | | | | 177,130 | | | | 3,386 | |
| Genuine Parts Company | | | 1,731 | | | | 236,680 | | | | 6,759 | |
| | | | | | | | | | | | 10,145 | |
| Semiconductors | | | | | | | | | | | | |
| Coherent ,Inc. | | | 611 | | | | 165,557 | | | | 3,361 | |
| CTS Corporation | | | 4,014 | | | | 163,249 | | | | 9,895 | |
| | | | | | | | | | | | 13,256 | |
| Technology Services | | | | | | | | | | | | |
| International Business Machines Corporation | | | 1,389 | | | | 192,849 | | | | 862 | |
| | | | | | | | | | | | | |
| Tobacco & Cannabis | | | | | | | | | | | | |
| Universal Corporation | | | 2,659 | | | | 169,325 | | | | 14,246 | |
See accompanying notes to consolidated financial statements.
| LONGBOARD ALTERNATIVE GROWTH FUND |
| SCHEDULE OF INVESTMENTS (Continued) |
| May 31, 2022 |
Additional Information — LongBoard USD Total Return Swap A - Underlying Basket Disclosure *
| * | This investment is a not a direct holding of the Longboard Alternative Growth Fund. The top 50 holdings were determined based on the absolute notional values of the positions within the underlying swap basket. |
| | | | | | | | | Net Unrealized | |
| | | | | | | | | Appreciation | |
| DESCRIPTION | | Shares | | | Notional (a) | | | (Depreciation) | |
| Common Stock (Continued) | | | | | | | | | | | | |
| | | | | | | | | | | | | |
| Transportation & Logistics | | | | | | | | | | | | |
| CSX Transportation | | | 6,726 | | | $ | 213,820 | | | $ | (7,199 | ) |
| | | | | | | | | | | | | |
| Transportation Equipment | | | | | | | | | | | | |
| Paccar, Inc. | | | 2,187 | | | | 189,919 | | | | 1,247 | |
Additional Information — LongBoard USD Total Return Swap B - Underlying Basket Disclosure *
The following table represents the top 50 individual positions and related values within the total return basket swap as of May 31, 2022.
| * | This investment is a not a direct holding of the Longboard Alternative Growth Fund. The top 50 holdings were determined based on the absolute notional values of the positions within the underlying swap basket. |
| | | | | | | | | Net Unrealized | |
| | | | | | | | | Appreciation | |
| DESCRIPTION | | Shares | | | Notional (a) | | | (Depreciation) | |
| Common Stock | | | | | | | | | | | | |
| Aerospace & Defense | | | | | | | | | | | | |
| L3Harris Technologies, Inc. | | | 583 | | | $ | 140,445 | | | $ | (7,098 | ) |
| Lockheed Martin Corporation | | | 411 | | | | 180,885 | | | | 2,740 | |
| | | | | | | | | | | | (4,358 | ) |
| Automotive | | | | | | | | | | | | |
| Methode Electronic | | | 3,197 | | | | 144,025 | | | | 5,367 | |
| | | | | | | | | | | | | |
| Banking | | | | | | | | | | | | |
| Bancfirst Corporation | | | 1,718 | | | | 155,874 | | | | 26,103 | |
| First Financial Corporation Indiana | | | 3,177 | | | | 142,901 | | | | (3,024 | ) |
| Greene County BanCorp, Inc. | | | 3,571 | | | | 199,940 | | | | 43,727 | |
| Nbt Aktie | | | 3,727 | | | | 137,824 | | | | (5,938 | ) |
| Provident Financial Services | | | 6,389 | | | | 146,883 | | | | (3,120 | ) |
| Servisfirst Bancshares, Inc. | | | 1,763 | | | | 146,964 | | | | (4,486 | ) |
| South Plains Financial, Inc. | | | 5,778 | | | | 142,832 | | | | (12,534 | ) |
| | | | | | | | | | | | 40,728 | |
| Biotech & Pharma | | | | | | | | | | | | |
| Amphastar Pharmaceuticals, Inc. | | | 3,682 | | | | 136,749 | | | | 43,533 | |
| | | | | | | | | | | | | |
| Chemicals | | | | | | | | | | | | |
| FMC Corporation | | | 1,129 | | | | 138,393 | | | | 3,980 | |
See accompanying notes to consolidated financial statements.
| LONGBOARD ALTERNATIVE GROWTH FUND |
| SCHEDULE OF INVESTMENTS (Continued) |
| May 31, 2022 |
Additional Information — LongBoard USD Total Return Swap B - Underlying Basket Disclosure *
| * | This investment is a not a direct holding of the Longboard Alternative Growth Fund. The top 50 holdings were determined based on the absolute notional values of the positions within the underlying swap basket. |
| | | | | | | | | Net Unrealized | |
| | | | | | | | | Appreciation | |
| DESCRIPTION | | Shares | | | Notional (a) | | | (Depreciation) | |
| Common Stock | | | | | | | | | | | | |
| Electric Utilities | | | | | | | | | | | | |
| Centerpoint Energy, Inc. | | | 5,502 | | | $ | 176,339 | | | $ | 17,870 | |
| CMS Energy Corporation | | | 2,671 | | | | 189,748 | | | | 16,648 | |
| Consolidated Edison, Inc. | | | 1,888 | | | | 187,403 | | | | 22,432 | |
| Dominion Resources, Inc. | | | 2,063 | | | | 173,746 | | | | 2,705 | |
| Exelon Corporation | | | 4,170 | | | | 204,956 | | | | 49,406 | |
| Sempra Energy | | | 1,200 | | | | 196,632 | | | | 15,767 | |
| | | | | | | | | | | | 124,828 | |
| Food | | | | | | | | | | | | |
| Cal-Maine Foods, Inc. | | | 2,989 | | | | 142,665 | | | | 1,914 | |
| Flowers Foods, Inc. | | | 5,053 | | | | 139,463 | | | | 6,409 | |
| Hormel Foods Corporation | | | 3,458 | | | | 168,301 | | | | (4,288 | ) |
| Tyson Foods, Inc.- Class A | | | 1,681 | | | | 150,634 | | | | (172 | ) |
| | | | | | | | | | | | 3,863 | |
| Gas & Water Utilities | | | | | | | | | | | | |
| Atmos Energy | | | 1,493 | | | | 173,651 | | | | 807 | |
| Nisource Akite | | | 5,767 | | | | 181,372 | | | | 15,010 | |
| South Jersey Industries, Inc. | | | 3,950 | | | | 137,658 | | | | 7,654 | |
| | | | | | | | | | | | 23,471 | |
| Household Products | | | | | | | | | | | | |
| Church & Dwight Co, Inc. | | | 1,601 | | | | 144,186 | | | | (12,398 | ) |
| | | | | | | | | | | | | |
| Insurance | | | | | | | | | | | | |
| Allstate Corporation | | | 1,081 | | | | 147,762 | | | | (526 | ) |
| Arch Capital Group Ltd. | | | 3,027 | | | | 143,661 | | | | (2,836 | ) |
| Hartford Financial | | | 2,592 | | | | 187,946 | | | | 10,280 | |
| Markel Corporation | | | 104 | | | | 142,421 | | | | (107 | ) |
| Progressive | | | 1,580 | | | | 188,620 | | | | 14,745 | |
| | | | | | | | | | | | 21,556 | |
| Machinery | | | | | | | | | | | | |
| Curtiss Wright | | | 980 | | | | 139,140 | | | | (5,994 | ) |
| | | | | | | | | | | | | |
| Oil & Gas Producers | | | | | | | | | | | | |
| Chevron Corporation | | | 958 | | | | 167,324 | | | | 60,600 | |
| EQT Corporation | | | 3,143 | | | | 149,984 | | | | 65,583 | |
| Exxon Mobil Corporation | | | 1,644 | | | | 157,824 | | | | 41,893 | |
| Valero Energy Corporation | | | 1,100 | | | | 142,560 | | | | 44,856 | |
| | | | | | | | | | | | 212,932 | |
See accompanying notes to consolidated financial statements.
| LONGBOARD ALTERNATIVE GROWTH FUND |
| SCHEDULE OF INVESTMENTS (Continued) |
| May 31, 2022 |
Additional Information — LongBoard USD Total Return Swap B - Underlying Basket Disclosure *
| * | This investment is a not a direct holding of the Longboard Alternative Growth Fund. The top 50 holdings were determined based on the absolute notional values of the positions within the underlying swap basket. |
| | | | | | | | | Net Unrealized | |
| | | | | | | | | Appreciation | |
| DESCRIPTION | | Shares | | | Notional (a) | | | (Depreciation) | |
| Common Stock (Continued) | | | | | | | | | | | | |
| Real Estate Investment Trusts | | | | | | | | | | | | |
| Ares Commercial Real Estate | | | 11,583 | | | $ | 170,270 | | | $ | 935 | |
| CTO Realty Growth, Inc. | | | 2,117 | | | | 139,489 | | | | 19,005 | |
| Gaming And Leisure Properties | | | 4,472 | | | | 209,379 | | | | 6,459 | |
| WP Carey, Inc. | | | 1,941 | | | | 163,316 | | | | 5,415 | |
| | | | | | | | | | | | 31,814 | |
| Retail - Consumer Staples | | | | | | | | | | | | |
| Spartannash Co. | | | 3,936 | | | | 135,438 | | | | 47,744 | |
| | | | | | | | | | | | | |
| Semiconductors | | | | | | | | | | | | |
| Coherent, Inc. | | | 515 | | | | 139,544 | | | | 3,376 | |
| | | | | | | | | | | | | |
| Specialty Finance | | | | | | | | | | | | |
| KKR Real Estate Finance Trust, Inc. | | | 10,650 | | | | 217,473 | | | | 10,008 | |
| Ready Capital Corporation | | | 9,223 | | | | 135,394 | | | | (4,616 | ) |
| Starwood Property Trust, Inc. | | | 7,435 | | | | 177,622 | | | | 5,784 | |
| | | | | | | | | | | | 11,176 | |
| Technology Services | | | | | | | | | | | | |
| Amdocs Ltd. | | | 2,103 | | | | 182,730 | | | | 12,153 | |
| CSG Systems International, Inc. | | | 2,297 | | | | 142,850 | | | | 11,824 | |
| Exlservice Holdings, Inc. | | | 988 | | | | 140,484 | | | | 35,542 | |
| | | | | | | | | | | | 59,519 | |
| Tobacco & Cannabis | | | | | | | | | | | | |
| Altria Group, Inc. | | | 3,464 | | | | 187,368 | | | | 13,509 | |
| | | | | | | | | | | | | |
| Wholesale - Consumer Staples | | | | | | | | | | | | |
| Archer Daniels Midland | | | 2,107 | | | | 191,358 | | | | 46,091 | |
| (a) | Notional value represents the market value (including any fees or commissions) of the positions. |
See accompanying notes to consolidated financial statements.
| The Longboard Funds |
| STATEMENTS OF ASSETS AND LIABILITIES |
| May 31, 2022 |
| | | Longboard Managed | | | Longboard | |
| | | Futures Strategy | | | Alternative | |
| | | Fund * | | | Growth Fund | |
| ASSETS | | | | | | | | |
| Investment in securities at cost | | $ | 14,978,267 | | | $ | 99,867,344 | |
| Investment in securities at fair value | | $ | 14,974,178 | | | $ | 99,860,347 | |
| Cash | | | 15,888,069 | | | | 8,888,842 | |
| Cash Deposits with Broker | | | 6,915,454 | | | | 20,154 | |
| Net unrealized appreciation from open futures contracts | | | 909,823 | | | | — | |
| Net unrealized appreciation on forward foreign currency exchange contracts | | | 885,934 | | | | — | |
| Receivable for Fund shares sold | | | 73 | | | | 2,152,736 | |
| Net unrealized appreciation on total return swap contracts | | | — | | | | 884,213 | |
| TOTAL ASSETS | | | 39,573,531 | | | | 111,806,292 | |
| | | | | | | | | |
| LIABILITIES | | | | | | | | |
| Investment advisory fees payable | | | 100,918 | | | | 181,727 | |
| Payable for Fund shares redeemed | | | — | | | | 25,888 | |
| Distribution (12b-1) fees payable | | | 309 | | | | 472 | |
| | | | 101,227 | | | | 208,087 | |
| NET ASSETS | | $ | 39,472,304 | | | $ | 111,598,205 | |
| | | | | | | | | |
| Net Assets Consist Of: | | | | | | | | |
| Paid in capital | | | 92,890,444 | | | | 114,582,285 | |
| Accumulated deficit | | | (53,418,140 | ) | | | (2,984,080 | ) |
| NET ASSETS | | $ | 39,472,304 | | | $ | 111,598,205 | |
| | | | | | | | | |
| Net Asset Value Per Share: | | | | | | | | |
| Class A Shares: | | | | | | | | |
| Net Assets | | $ | 611,351 | | | $ | 2,485,869 | |
| Shares of beneficial interest outstanding ($0 par value, unlimited shares authorized) | | | 58,890 | | | | 174,314 | |
| Net asset value (Net Assets ÷ Shares Outstanding) and redemption price per share | | $ | 10.38 | | | $ | 14.26 | |
| Maximum offering price per share (maximum sales charge of 5.75%) | | $ | 11.01 | | | $ | 15.13 | |
| | | | | | | | | |
| Class I Shares: | | | | | | | | |
| Net Assets | | $ | 38,860,953 | | | $ | 109,112,336 | |
| Shares of beneficial interest outstanding ($0 par value, unlimited shares authorized) | | | 3,681,037 | | | | 7,657,682 | |
| Net asset value (Net Assets ÷ Shares Outstanding) and redemption price per share | | $ | 10.56 | | | $ | 14.25 | |
| * | Consolidated for Longboard Managed Futures Strategy Fund. |
See accompanying notes to consolidated financial statements.
| The Longboard Funds |
| STATEMENTS OF OPERATIONS |
| For the Year Ended May 31, 2022 |
| | | Longboard Managed | | | Longboard | |
| | | Futures Strategy | | | Alternative Growth | |
| | | Fund * | | | Fund | |
| INVESTMENT INCOME | | | | | | | | |
| Interest | | $ | 20,067 | | | $ | 101,416 | |
| TOTAL INVESTMENT INCOME | | | 20,067 | | | | 101,416 | |
| | | | | | | | | |
| EXPENSES | | | | | | | | |
| Investment advisory fees | | | 1,155,017 | | | | 1,932,242 | |
| Distribution (12b-1) fees: Class A | | | 1,884 | | | | 5,294 | |
| TOTAL EXPENSES | | | 1,156,901 | | | | 1,937,536 | |
| | | | | | | | | |
| NET INVESTMENT LOSS | | | (1,136,834 | ) | | | (1,836,120 | ) |
| | | | | | | | | |
| REALIZED AND UNREALIZED GAIN (LOSS) ON INVESTMENTS | | | | | | | | |
| Net realized gain (loss) from: | | | | | | | | |
| Future contracts | | | 3,979,091 | | | | — | |
| Forward foreign currency exchange contracts | | | (362,158 | ) | | | — | |
| Translation of foreign currencies | | | (344,784 | ) | | | — | |
| Swap Contracts | | | — | | | | 4,789,653 | |
| | | | 3,272,149 | | | | 4,789,653 | |
| Net change in unrealized appreciation (depreciation) on: | | | | | | | | |
| Investments | | | (3,999 | ) | | | (7,617 | ) |
| Future contracts | | | (118,466 | ) | | | — | |
| Forward foreign currency exchange contracts | | | 309,905 | | | | — | |
| Translation of foreign currencies | | | (81,013 | ) | | | — | |
| Swap Contracts | | | — | | | | (7,736,305 | ) |
| | | | 106,427 | | | | (7,743,922 | ) |
| NET REALIZED AND UNREALIZED GAIN (LOSS) ON INVESTMENTS | | | 3,378,576 | | | | (2,954,269 | ) |
| | | | | | | | | |
| NET INCREASE (DECREASE) IN NET ASSETS RESULTING FROM OPERATIONS | | $ | 2,241,742 | | | $ | (4,790,389 | ) |
| * | Consolidated for Longboard Managed Futures Strategy Fund. |
See accompanying notes to consolidated financial statements.
| Longboard Managed Futures Strategy Fund |
| CONSOLIDATED STATEMENTS OF CHANGES IN NET ASSETS |
| | | For the | | | For the | |
| | | Year Ended | | | Year Ended | |
| | | May 31, 2022 | | | May 31, 2021 | |
| FROM OPERATIONS | | | | | | | | |
| Net investment loss | | $ | (1,136,834 | ) | | $ | (1,504,716 | ) |
| Net realized gain from futures contracts, forward foreign currency exchange contracts and translation of foreign currencies | | | 3,272,149 | | | | 2,132,668 | |
| Net change in unrealized appreciation of investments, futures contracts, forward foreign currency exchange contracts and translation of foreign currencies | | | 106,427 | | | | 2,951,374 | |
| Net increase in net assets resulting from operations | | | 2,241,742 | | | | 3,579,326 | |
| | | | | | | | | |
| DISTRIBUTIONS TO SHAREHOLDERS | | | | | | | | |
| Total distributions paid: | | | | | | | | |
| Class A | | | (24,639 | ) | | | (30,571 | ) |
| Class I | | | (1,297,400 | ) | | | (1,282,795 | ) |
| Net decrease in net assets from distributions to shareholders | | | (1,322,039 | ) | | | (1,313,366 | ) |
| | | | | | | | | |
| FROM SHARES OF BENEFICIAL INTEREST | | | | | | | | |
| Proceeds from shares sold | | | | | | | | |
| Class A | | | 18,657 | | | | 10,043 | |
| Class I | | | 4,273,335 | | | | 3,346,937 | |
| Net asset value of shares issued in reinvestment of distributions | | | | | | | | |
| Class A | | | 23,950 | | | | 29,649 | |
| Class I | | | 1,219,063 | | | | 1,193,391 | |
| Payments for shares redeemed | | | | | | | | |
| Class A | | | (353,212 | ) | | | (975,971 | ) |
| Class I | | | (9,212,445 | ) | | | (39,111,685 | ) |
| Net decrease in net assets from shares of beneficial interest | | | (4,030,652 | ) | | | (35,507,636 | ) |
| | | | | | | | | |
| TOTAL DECREASE IN NET ASSETS | | | (3,110,949 | ) | | | (33,241,676 | ) |
| | | | | | | | | |
| NET ASSETS | | | | | | | | |
| Beginning of Year | | | 42,583,253 | | | | 75,824,929 | |
| End of Year | | $ | 39,472,304 | | | $ | 42,583,253 | |
| | | | | | | | | |
| SHARE ACTIVITY | | | | | | | | |
| CLASS A: | | | | | | | | |
| Shares Sold | | | 1,960 | | | | 1,068 | |
| Shares Reinvested | | | 2,581 | | | | 3,350 | |
| Shares Redeemed | | | (36,209 | ) | | | (106,379 | ) |
| Net decrease in shares of beneficial interest outstanding | | | (31,668 | ) | | | (101,961 | ) |
| | | | | | | | | |
| CLASS I: | | | | | | | | |
| Shares Sold | | | 423,385 | | | | 358,253 | |
| Shares Reinvested | | | 129,275 | | | | 132,599 | |
| Shares Redeemed | | | (919,984 | ) | | | (4,218,489 | ) |
| Net decrease in shares of beneficial interest outstanding | | | (367,324 | ) | | | (3,727,637 | ) |
See accompanying notes to consolidated financial statements.
| Longboard Alternative Growth Fund |
| STATEMENTS OF CHANGES IN NET ASSETS |
| | | For the | | | For the | |
| | | Year Ended | | | Year Ended | |
| | | May 31, 2022 | | | May 31, 2021 | |
| FROM OPERATIONS | | | | | | | | |
| Net investment loss | | $ | (1,836,120 | ) | | $ | (762,812 | ) |
| Net realized gain from swap contracts | | | 4,789,653 | | | | 1,652,926 | |
| Net change in unrealized appreciation (depreciation) on investments and swap contracts | | | (7,743,922 | ) | | | 7,740,647 | |
| Net increase (decrease) in net assets resulting from operations | | | (4,790,389 | ) | | | 8,630,761 | |
| | | | | | | | | |
| DISTRIBUTIONS TO SHAREHOLDERS | | | | | | | | |
| From return of capital: | | | | | | | | |
| Class A | | | (76,351 | ) | | | — | |
| Class I | | | (3,672,152 | ) | | | — | |
| Net decrease in net assets from distributions to shareholders | | | (3,748,503 | ) | | | — | |
| | | | | | | | | |
| FROM SHARES OF BENEFICIAL INTEREST | | | | | | | | |
| Proceeds from shares sold: | | | | | | | | |
| Class A | | | 1,538,604 | | | | 701,324 | |
| Class I | | | 48,178,123 | | | | 59,020,020 | |
| Net asset value of shares issued in reinvestment of distributions | | | | | | | | |
| Class A | | | 75,580 | | | | — | |
| Class I | | | 3,593,206 | | | | — | |
| Payments for shares redeemed: | | | | | | | | |
| Class A | | | (592,726 | ) | | | (469,375 | ) |
| Class I | | | (10,165,436 | ) | | | (4,306,658 | ) |
| Net increase in net assets from shares of beneficial interest | | | 42,627,351 | | | | 54,945,311 | |
| | | | | | | | | |
| TOTAL INCREASE IN NET ASSETS | | | 34,088,459 | | | | 63,576,072 | |
| | | | | | | | | |
| NET ASSETS | | | | | | | | |
| Beginning of Year | | | 77,509,746 | | | | 13,933,674 | |
| End of Year | | $ | 111,598,205 | | | $ | 77,509,746 | |
| | | | | | | | | |
| SHARE ACTIVITY | | | | | | | | |
| CLASS A: | | | | | | | | |
| Shares sold | | | 100,901 | | | | 47,987 | |
| Shares reinvested | | | 4,995 | | | | — | |
| Shares redeemed | | | (41,134 | ) | | | (36,093 | ) |
| Net increase in shares of beneficial interest outstanding | | | 64,762 | | | | 11,894 | |
| | | | | | | | | |
| SHARE ACTIVITY - CLASS I | | | | | | | | |
| CLASS I: | | | | | | | | |
| Shares sold | | | 3,145,912 | | | | 4,199,377 | |
| Shares reinvested | | | 237,807 | | | | — | |
| Shares redeemed | | | (685,343 | ) | | | (315,790 | ) |
| Net increase in shares of beneficial interest outstanding | | | 2,698,376 | | | | 3,883,587 | |
See accompanying notes to consolidated financial statements.
| Longboard Managed Futures Strategy Fund |
| CONSOLIDATED FINANCIAL HIGHLIGHTS |
| |
| Per Share Data and Ratios for a Share of Beneficial Interest Outstanding Throughout Each Year |
| | | For the | | | For the | | | For the | | | For the | | | For the | |
| | | Year Ended | | | Year Ended | | | Year Ended | | | Year Ended | | | Year Ended | |
| Class A | | May 31, 2022 | | | May 31, 2021 | | | May 31, 2020 | | | May 31, 2019 | | | May 31, 2018 | |
| Net asset value, beginning of year | | $ | 10.11 | | | $ | 9.33 | | | $ | 9.19 | | | $ | 10.59 | | | $ | 10.64 | |
| Activity from investment operations: | | | | | | | | | | | | | | | | | | | | |
| Net investment loss (1) | | | (0.31 | ) | | | (0.29 | ) | | | (0.20 | ) | | | (0.19 | ) | | | (0.31 | ) |
| Net realized and unrealized gain (loss) on investments | | | 0.90 | | | | 1.28 | | | | 0.34 | | | | (1.21 | ) | | | 0.26 | |
| Total from investment operations | | | 0.59 | | | | 0.99 | | | | 0.14 | | | | (1.40 | ) | | | (0.05 | ) |
| Less distributions from: | | | | | | | | | | | | | | | | | | | | |
| Net investment income | | | (0.32 | ) | | | (0.21 | ) | | | — | | | | — | | | | — | |
| Net realized gains | | | — | | | | — | | | | — | | | | (0.00 | ) (2) | | | — | |
| Total distributions | | | (0.32 | ) | | | (0.21 | ) | | | — | | | | (0.00 | ) (2) | | | — | |
| Net asset value, end of year | | $ | 10.38 | | | $ | 10.11 | | | $ | 9.33 | | | $ | 9.19 | | | $ | 10.59 | |
| Total return (3) | | | 6.19 | % | | | 10.94 | % | | | 1.52 | % | | | (13.19 | )% | | | (0.47 | )% |
| Net assets, at end of year (000s) | | $ | 611 | | | $ | 916 | | | $ | 1,796 | | | $ | 4,304 | | | $ | 46,599 | |
| Ratio of total expenses to average net assets | | | 3.24 | % | | | 3.24 | % | | | 3.24 | % | | | 3.19 | % | | | 3.12 | % |
| Ratio of net investment loss to average net assets | | | (3.23 | )% | | | (3.20 | )% | | | (2.10 | )% | | | (1.87 | )% | | | (2.78 | )% |
| Portfolio turnover rate (4) | | | 0 | % | | | 0 | % | | | 0 | % | | | 0 | % | | | 0 | % |
| (1) | Per share amounts calculated using the average shares method, which more appropriately presents the per share data for the year. |
| (2) | Amounts represents less than $0.005 per share. |
| (3) | Total returns are historical in nature and assume changes in share price, reinvestment of dividends and capital gains distributions, if any. Total returns for periods less than one year are not annualized. |
| (4) | All securities whose maturity or expiration date at the time of acquisition were one year or less are excluded from the portfolio turnover rate calculation. |
See accompanying notes to consolidated financial statements.
| Longboard Managed Futures Strategy Fund |
| CONSOLIDATED FINANCIAL HIGHLIGHTS |
| |
| Per Share Data and Ratios for a Share of Beneficial Interest Outstanding Throughout Each Year |
| | | For the | | | For the | | | For the | | | For the | | | For the | |
| | | Year Ended | | | Year Ended | | | Year Ended | | | Year Ended | | | Year Ended | |
| Class I | | May 31, 2022 | | | May 31, 2021 | | | May 31, 2020 | | | May 31, 2019 | | | May 31, 2018 | |
| Net asset value, beginning of year | | $ | 10.29 | | | $ | 9.52 | | | $ | 9.35 | | | $ | 10.74 | | | $ | 10.77 | |
| Activity from investment operations: | | | | | | | | | | | | | | | | | | | | |
| Net investment loss (1) | | | (0.29 | ) | | | (0.28 | ) | | | (0.18 | ) | | | (0.16 | ) | | | (0.28 | ) |
| Net realized and unrealized gain (loss) on investments | | | 0.92 | | | | 1.31 | | | | 0.35 | | | | (1.23 | ) | | | 0.25 | |
| Total from investment operations | | | 0.63 | | | | 1.03 | | | | 0.17 | | | | (1.39 | ) | | | (0.03 | ) |
| Less distributions from: | | | | | | | | | | | | | | | | | | | | |
| Net investment income | | | (0.36 | ) | | | (0.26 | ) | | | — | | | | — | | | | — | |
| Net realized gains | | | — | | | | — | | | | — | | | | (0.00 | ) (2) | | | — | |
| Total distributions | | | (0.36 | ) | | | (0.26 | ) | | | — | | | | (0.00 | ) (2) | | | — | |
| Net asset value, end of year | | $ | 10.56 | | | $ | 10.29 | | | $ | 9.52 | | | $ | 9.35 | | | $ | 10.74 | |
| Total return (3) | | | 6.53 | % | | | 11.23 | % | | | 1.82 | % | | | (12.91 | )% | | | (0.28 | )% |
| Net assets, at end of year (000s) | | $ | 38,861 | | | $ | 41,668 | | | $ | 74,029 | | | $ | 149,314 | | | $ | 352,647 | |
| Ratio of total expenses to average net assets | | | 2.99 | % | | | 2.99 | % | | | 2.99 | % | | | 2.94 | % | | | 2.88 | % |
| Ratio of net investment loss to average net assets | | | (2.98 | )% | | | (2.95 | )% | | | (1.86 | )% | | | (1.59 | )% | | | (2.52 | )% |
| Portfolio turnover rate (4) | | | 0 | % | | | 0 | % | | | 0 | % | | | 0 | % | | | 0 | % |
| (1) | Per share amounts calculated using the average shares method, which more appropriately presents the per share data for the year. |
| (2) | Amounts represents less than $0.005 per share. |
| (3) | Total returns are historical in nature and assume changes in share price, reinvestment of dividends and capital gains distributions, if any. Total returns for periods less than one year are not annualized. |
| (4) | All securities whose maturity or expiration date at the time of acquisition were one year or less are excluded from the portfolio turnover rate calculation. |
See accompanying notes to consolidated financial statements.
| Longboard Alternative Growth Fund |
| FINANCIAL HIGHLIGHTS |
| |
| Per Share Data and Ratios for a Share of Beneficial Interest Outstanding Throughout Each Year |
| | | For the | | | For the | | | For the | | | For the | | | For the | |
| | | Year Ended | | | Year Ended | | | Year Ended | | | Year Ended | | | Year Ended | |
| Class A | | May 31, 2022 | | | May 31, 2021 | | | May 31, 2020 | | | May 31, 2019 | | | May 31, 2018 (3) | |
| Net asset value, beginning of year | | $ | 15.32 | | | $ | 11.92 | | | $ | 10.18 | | | $ | 11.07 | | | $ | 35.84 | |
| Activity from investment operations: | | | | | | | | | | | | | | | | | | | | |
| Net investment loss (1) | | | (0.33 | ) | | | (0.30 | ) | | | (0.15 | ) | | | (0.10 | ) | | | (0.48 | ) |
| Net realized and unrealized gain (loss) on investments | | | (0.22 | ) | | | 3.70 | | | | 1.89 | | | | (0.50 | ) | | | 4.83 | |
| Total from investment operations | | | (0.55 | ) | | | 3.40 | | | | 1.74 | | | | (0.60 | ) | | | 4.35 | |
| Less distributions from: | | | | | | | | | | | | | | | | | | | | |
| Net investment income | | | — | | | | — | | | | — | | | | (0.29 | ) | | | (29.12 | ) |
| Return of Capital | | | (0.51 | ) | | | — | | | | — | | | | — | | | | — | |
| Total distributions | | | (0.51 | ) | | | — | | | | — | | | | (0.29 | ) | | | (29.12 | ) |
| Net asset value, end of year | | $ | 14.26 | | | $ | 15.32 | | | $ | 11.92 | | | $ | 10.18 | | | $ | 11.07 | |
| Total return (2) | | | (3.75 | )% | | | 28.52 | % | | | 17.09 | % | | | (5.39 | )% | | | 10.86 | % |
| Net assets, at end of year (000s) | | $ | 2,486 | | | $ | 1,678 | | | $ | 1,164 | | | $ | 905 | | | $ | 467 | |
| Ratio of total expenses to average net assets (4) | | | 2.24 | % | | | 2.24 | % | | | 2.24 | % | | | 2.24 | % | | | 2.60 | % |
| Ratio of net investment loss to average net assets | | | (2.13 | )% | | | (2.21 | )% | | | (1.33 | )% | | | (0.96 | )% | | | (2.60 | )% |
| Portfolio turnover rate | | | 0 | % | | | 0 | % | | | 0 | % | | | 0 | % | | | 0 | % |
| (1) | Per share amounts calculated using the average shares method, which more appropriately presents the per share data for the year. |
| (2) | Total returns are historical in nature and assume changes in share price, reinvestment of dividends and capital gains distributions, if any. Total returns for periods less than one year are not annualized. |
| (3) | Effective February 23, 2018, the Fund had a one-for-four reverse stock split. Per Share amounts for the periods have been adjusted to give effect to the one-for-four stock split. |
| (4) | Expense ratios do not include certain expenses of the swap contracts in which the fund invests. |
See accompanying notes to consolidated financial statements.
| Longboard Alternative Growth Fund |
| FINANCIAL HIGHLIGHTS |
| |
| Per Share Data and Ratios for a Share of Beneficial Interest Outstanding Throughout Each Year |
| | | For the | | | For the | | | For the | | | For the | | | For the | |
| | | Year Ended | | | Year Ended | | | Year Ended | | | Year Ended | | | Year Ended | |
| Class I | | May 31, 2022 | | | May 31, 2021 | | | May 31, 2020 | | | May 31, 2019 | | | May 31, 2018 (3) | |
| Net asset value, beginning of year | | $ | 15.29 | | | $ | 11.87 | | | $ | 10.11 | | | $ | 10.96 | | | $ | 35.80 | |
| Activity from investment operations: | | | | | | | | | | | | | | | | | | | | |
| Net investment loss (1) | | | (0.29 | ) | | | (0.28 | ) | | | (0.12 | ) | | | (0.09 | ) | | | (0.44 | ) |
| Net realized and unrealized gain (loss) on investments | | | (0.21 | ) | | | 3.70 | | | | 1.88 | | | | (0.46 | ) | | | 4.80 | |
| Total from investment operations | | | (0.50 | ) | | | 3.42 | | | | 1.76 | | | | (0.55 | ) | | | 4.36 | |
| Less distributions from: | | | | | | | | | | | | | | | | | | | | |
| Net investment income | | | — | | | | — | | | | — | | | | (0.30 | ) | | | (29.20 | ) |
| Return of Capital | | | (0.54 | ) | | | — | | | | — | | | | — | | | | — | |
| Total distributions | | | (0.54 | ) | | | — | | | | — | | | | (0.30 | ) | | | (29.20 | ) |
| Net asset value, end of year | | $ | 14.25 | | | $ | 15.29 | | | $ | 11.87 | | | $ | 10.11 | | | $ | 10.96 | |
| Total return (2) | | | (3.47 | )% | | | 28.81 | % | | | 17.41 | % | | | (4.91 | )% | | | 11.04 | % |
| Net assets, at end of year (000s) | | $ | 109,112 | | | $ | 75,832 | | | $ | 12,769 | | | $ | 10,025 | | | $ | 10,363 | |
| Ratio of total expenses to average net assets (4) | | | 1.99 | % | | | 1.99 | % | | | 1.99 | % | | | 1.99 | % | | | 2.36 | % |
| Ratio of net investment loss to average net assets | | | (1.89 | )% | | | (1.97 | )% | | | (1.07 | )% | | | (0.81 | )% | | | (2.36 | )% |
| Portfolio turnover rate | | | 0 | % | | | 0 | % | | | 0 | % | | | 0 | % | | | 0 | % |
| (1) | Per share amounts calculated using the average shares method, which more appropriately presents the per share data for the year. |
| (2) | Total returns are historical in nature and assume changes in share price, reinvestment of dividends and capital gains distributions, if any. Total returns for periods less than one year are not annualized. |
| (3) | Effective February 23, 2018, the Fund had a one-for-four reverse stock split. Per Share amounts for the periods have been adjusted to give effect to the one-for-four stock split. |
| (4) | Expense ratios do not include certain expenses of the swap contracts in which the fund invests. |
See accompanying notes to consolidated financial statements.
| The Longboard Funds |
| NOTES TO CONSOLIDATED FINANCIAL STATEMENTS |
| May 31, 2022 |
The Longboard Managed Futures Strategy Fund (“LMFSF”) and Longboard Alternative Growth Fund (“LAGF”), (each a “Fund” and collectively “the Funds”) are a diversified and a non-diversified series, respectively, of Northern Lights Fund Trust II (the “Trust”), a statutory trust organized under the laws of the State of Delaware on August 26, 2010, and are registered under the Investment Company Act of 1940, as amended (the “1940 Act”), as open-end management investment companies. LMFSF’s investment objective is to seek positive absolute returns. LAGF’s investment objective is to seek long-term capital appreciation. LMFSF Fund commenced operations on June 27, 2012 and LAGF commenced operations on March 19, 2015.
The Funds currently offer Class A and Class I shares. Class A shares are offered at net asset value plus a maximum sales charge of 5.75%. LAGF launched Class A shares on December 9, 2015. Class I shares are offered at net asset value without an initial sales charge. Each class represents an interest in the same assets of each respective Fund and classes in each Fund are identical except for differences in their sales charge structures and ongoing service and distribution charges. All classes of shares in each respective Fund have equal voting privileges except that each class has exclusive voting rights with respect to its service and/or distribution plans. The Funds’ income, expenses (other than class specific distribution fees) and realized and unrealized gains and losses are allocated proportionately each day based upon the relative net assets of each class.
| 2. | SIGNIFICANT ACCOUNTING POLICIES |
The following is a summary of significant accounting policies followed by the Funds in preparation of their financial statements. The policies are in conformity with accounting principles generally accepted in the United States of America (“GAAP”). The preparation of financial statements requires management to make estimates and assumptions that affect the reported amounts of assets and liabilities and disclosure of contingent assets and liabilities at the date of the financial statements and the reported amounts of income and expenses for the period. Actual results could differ from those estimates. The Funds are an investment company and accordingly follow the investment company accounting and reporting guidance of the Financial Accounting Standards Board (“FASB”) Accounting Standard Codification Topic 946 “Financial Services – Investment Companies”.
Security Valuation – Securities listed on an exchange are valued at the last reported sale price at the close of the regular trading session of the primary exchange on the business day the value is being determined, or in the case of securities listed on NASDAQ at the NASDAQ Official Closing Price (“NOCP”). In the absence of a sale such securities shall be valued at the mean between the current bid and ask prices on the day of valuation. Investments in swap contracts are priced daily based on the underlying equity securities held in the swap. Futures and future options are valued at the final settled price or, in the absence of a settled price, at the last sale price on the day of valuation. Forward foreign currency exchange contracts (“forward currency contracts”) are valued at the forward rate. Investments valued in currencies other than the U.S. dollar are converted to U.S. dollars using exchange rates obtained from pricing services. Short-term debt obligations, including commercial paper investments, having 60 days or less remaining until maturity, at time of purchase, may be valued at amortized cost.
The Funds may hold securities, such as private investments, interests in commodity pools, other non-traded securities or temporarily illiquid securities, for which market quotations are not readily available or are determined to be unreliable. These securities will be valued using the “fair value” procedures approved by the Trust’s Board of Trustees (the “Board”). The Board has delegated execution of these procedures to a fair value team composed of one or more representatives from each of the (i) Trust, (ii) administrator, and (iii) adviser.
| The Longboard Funds |
| NOTES TO CONSOLIDATED FINANCIAL STATEMENTS (Continued) |
| May 31, 2022 |
The team may also enlist third party consultants such as a valuation specialist at a public accounting firm, valuation consultant or financial officer of a security issuer on an as-needed basis to assist in determining a security-specific fair value. The Board has also engaged a third party valuation firm to attend valuation meetings held by the Trust, review minutes of such meetings and report to the Board on a quarterly basis. The Board reviews and ratifies the execution of this process and the resultant fair value prices at least quarterly to assure the process produces reliable results.
Fair Valuation Process – As noted above, the fair value team is composed of one or more representatives from each of the (i) Trust, (ii) administrator, and (iii) adviser. The applicable investments are valued collectively via inputs from each of these groups. For example, fair value determinations are required for the following securities: (i) securities for which market quotations are insufficient or not readily available on a particular business day (including securities for which there is a short and temporary lapse in the provision of a price by the regular pricing source), (ii) securities for which, in the judgment of the adviser, the prices or values available do not represent the fair value of the instrument. Factors which may cause the adviser to make such a judgment include, but are not limited to, the following: only a bid price or an ask price is available; the spread between bid and ask prices is substantial; the frequency of sales; the thinness of the market; the size of reported trades; and actions of the securities markets, such as the suspension or limitation of trading; (iii) securities determined to be illiquid; (iv) securities with respect to which an event that will affect the value thereof has occurred (a “significant event”) since the closing prices were established on the principal exchange on which they are traded, but prior to a Fund’s calculation of its net asset value. Specifically, interests in commodity pools or managed futures pools are valued on a daily basis by reference to the closing market prices of each futures contract or other asset held by a pool, as adjusted for pool expenses. Restricted or illiquid securities, such as private investments or non-traded securities are valued via inputs from the adviser based upon the current bid for the security from two or more independent dealers or other parties reasonably familiar with the facts and circumstances of the security (who should take into consideration all relevant factors as may be appropriate under the circumstances). If the adviser is unable to obtain a current bid from such independent dealers or other independent parties, the fair value team shall determine the fair value of such security using the following factors: (i) the type of security; (ii) the cost at date of purchase; (iii) the size and nature of the Fund’s holdings; (iv) the discount from market value of unrestricted securities of the same class at the time of purchase and subsequent thereto; (v) information as to any transactions or offers with respect to the security; (vi) the nature and duration of restrictions on disposition of the security and the existence of any registration rights; (vii) how the yield of the security compares to similar securities of companies of similar or equal creditworthiness; (viii) the level of recent trades of similar or comparable securities; (ix) the liquidity characteristics of the security; (x) current market conditions; and (xi) the market value of any securities into which the security is convertible or exchangeable.
Forward Currency Contracts - As foreign securities are purchased, a Fund generally enters into forward currency exchange contracts in order to hedge against foreign currency exchange rate risks. The market value of the contract fluctuates with changes in currency exchange rates. The contract is marked- to-market daily and the change in market value is recorded by the Fund as an unrealized gain or loss. As foreign currency contracts are sold, a portion of the contract is generally closed and the Fund records a realized gain or loss equal to the difference between the value of the contract at the time it was opened and the value at the time it was closed. Realized gains and losses from contract transactions are included as a component of net realized gains (losses) from forward foreign currency exchange contracts in the Consolidated Statements of Operations.
Each Fund does not isolate the effect of fluctuations in foreign exchange rates from the effect of fluctuations in the market prices of securities. Such fluctuations are reflected by the Funds as a component of realized and unrealized gains and losses from investments for financial reporting purposes.
| The Longboard Funds |
| NOTES TO CONSOLIDATED FINANCIAL STATEMENTS (Continued) |
| May 31, 2022 |
Futures Contracts – The Funds that trade futures contracts are subject to equity price risk, interest rate risk, and foreign currency exchange rate risk in the normal course of pursuing their investment objectives. Each Fund may purchase or sell futures contracts to gain exposure to, or hedge against, changes in the value of equities, interest rates or foreign currencies or commodities. Initial margin deposits required upon entering into futures contracts are satisfied by the segregation of specific securities or cash as collateral for the account of the broker (the Funds’ agent in acquiring the futures position). During the period the futures contracts are open, changes in the value of the contracts are recognized as unrealized gains or losses by “marking to market” on a daily basis to reflect the market value of the contracts at the end of each day’s trading. Variation margin payments are received or made depending upon whether unrealized gains or losses are incurred. When the contracts are closed, a Fund recognizes a realized gain or loss equal to the difference between the proceeds from, or cost of, the closing transaction and the Fund’s basis in the contract. If a Fund is unable to liquidate a futures contract and/or enter into an offsetting closing transaction, the Fund would continue to be subject to market risk with respect to the value of the contracts and continue to be required to maintain the margin deposits on the futures contracts. The Fund segregates liquid securities having a value at least equal to the amount of the current obligation under any open futures contract. Risks may exceed amounts recognized in the Consolidated Statement of Assets and Liabilities. With futures, there is minimal counterparty credit risk to each Fund since futures are exchange traded and the exchange’s clearinghouse, as counterparty to all exchange traded futures, guarantees the futures against default. The notional value of the derivative instruments outstanding as of May 31, 2022 as disclosed in the Schedule of Investments and the amounts realized and changes in unrealized gains and losses on derivative instruments during the period as disclosed within the Consolidated Statement of Operations serve as indicators of the volume of derivative activity for the Fund.
Swap Agreements – LAGF invests in swaps which are subject to equity price risk, interest rate risk, credit risk, currency risk, counterparty risk and/or commodity risk in the normal course of pursuing its investment objective. The Funds may enter into various swap transactions for investment purposes or to manage interest rate, equity, foreign exchange (currency), or credit risk. These would be two-party contracts entered into primarily to exchange the returns (or differentials in rates of returns) earned or realized on particular pre-determined investments or instruments.
The gross returns to be exchanged or “swapped” between parties are calculated with respect to a notional amount, i.e., the return on or increase in value of a particular dollar amount invested at a particular interest rate, in a particular foreign currency, or in a “basket” of securities representing a particular index or market segment. Changes in the value of swap agreements are recognized as unrealized gains or losses in the Statements of Operations by “marking to market” on a daily basis to reflect the value of the swap agreement at the end of each trading day. Payments received or paid at the beginning of the agreement are reflected as such on the Statements of Assets and Liabilities and may be referred to as upfront payments. The Funds amortize upfront payments and/or accrue for the fixed payment stream on swap agreements on a daily basis with the net amount recorded as a component of unrealized gain or loss on the Statements of Operations. Periodic payments and receipts and liquidation payments received or made at the termination of the swap agreement are recorded as realized gains or losses on the Statements of Operations. The Funds segregate liquid securities having a value at least equal to the amount of their current obligation under any swap transaction. Entering into these agreements involves, to varying degrees, lack of liquidity and elements of credit, market, and counterparty risk in excess of amounts recognized on the Statements of Assets and Liabilities. The Fund’s maximum risk of loss from counterparty credit risk is the discounted net value of the cash flows to be received from the counterparty over the contract’s remaining life, to the extent that that amount is positive.
| The Longboard Funds |
| NOTES TO CONSOLIDATED FINANCIAL STATEMENTS (Continued) |
| May 31, 2022 |
The Funds utilize various methods to measure fair value of all of their investments on a recurring basis. GAAP establishes the hierarchy that prioritizes inputs to valuation methods. The three levels of input are:
Level 1 – Unadjusted quoted prices in active markets for identical assets and liabilities that the Fund has the ability to access.
Level 2 – Observable inputs other than quoted prices included in Level 1 that are observable for the asset or liability, either directly or indirectly. These inputs may include quoted prices for the identical instrument in an inactive market, prices for similar instruments, interest rates, prepayment speeds, credit risk, yield curves, default rates and similar data.
Level 3 – Unobservable inputs for the asset or liability, to the extent relevant observable inputs are not available, representing the Funds’ own assumptions about the assumptions a market participant would use in valuing the asset or liability, and would be based on the best information available.
The availability of observable inputs can vary from security to security and is affected by a wide variety of factors, including, for example, the type of security, whether the security is new and not yet established in the marketplace, the liquidity of markets, and other characteristics particular to the security. To the extent that valuation is based on models or inputs that are less observable or unobservable in the market, the determination of fair value requires more judgment. Accordingly, the degree of judgment exercised in determining fair value is greatest for instruments categorized in Level 3.
The inputs used to measure fair value may fall into different levels of the fair value hierarchy. In such cases, for disclosure purposes, the level in the fair value hierarchy within which the fair value measurement falls in its entirety, is determined based on the lowest level input that is significant to the fair value measurement in its entirety.
The inputs or methodology used for valuing securities are not necessarily an indication of the risk associated with investing in those securities.
The following tables summarize the inputs used as of May 31, 2022 for each Funds’ assets and liabilities measured at fair value on a recurring basis:
LMFSF
| Assets * | | Level 1 | | | Level 2 | | | Level 3 | | | Total | |
| U.S. Treasury Bill | | $ | — | | | $ | 14,974,178 | | | $ | — | | | $ | 14,974,178 | |
| Net unrealized appreciation (depreciation) Open Future Contracts | | | 909,823 | | | | — | | | | — | | | | 909,823 | |
| Net unrealized appreciation (depreciation) Forward Foreign Currency Exchange Contracts | | | — | | | | 885,934 | | | | — | | | | 885,934 | |
| Total | | $ | 909,823 | | | $ | 15,860,112 | | | $ | — | | | $ | 16,769,935 | |
| The Longboard Funds |
| NOTES TO CONSOLIDATED FINANCIAL STATEMENTS (Continued) |
| May 31, 2022 |
LAGF
| Assets * | | Level 1 | | | Level 2 | | | Level 3 | | | Total | |
| U.S. Treasury Bills | | $ | — | | | $ | 99,860,347 | | | $ | — | | | $ | 99,860,347 | |
| Net unrealized appreciation (depreciation) Swap Contracts | | | — | | | | 884,213 | | | | — | | | | 884,213 | |
| Total | | $ | — | | | $ | 100,744,560 | | | $ | — | | | $ | 100,744,560 | |
The Funds’ did not hold any Level 3 securities during the period.
| * | See Schedule of Investments for industry classification. |
Offsetting of Financial Assets and Derivative Assets
The following tables present LMFSF and LAGF derivatives available for offset under a master netting arrangement net of collateral pledged as of May 31, 2022.
LMFSF
| | | | | | | | | | | | Gross Amounts Not Offset in the | | | | |
| | | | | | | | | | | | Consolidated Statements of Assets & | | | | |
| Assets: | | | | | | | | | | | Liabilities | | | | |
| | | | | | Gross Amounts | | | Net Amounts of | | | | | | | | | | |
| | | | | | Offset in the | | | Assets Presented in | | | | | | | | | | |
| | | | | | Consolidated | | | the Consolidated | | | | | | | | | | |
| | | Gross Amounts of | | | Statements of Assets | | | Statements of Assets | | | Financial | | | Cash Collateral | | | | |
| | | Recognized Assets | | | & Liabilities | | | & Liabilities | | | Instruments | | | Received | | | Net Amount | |
| Future Contracts * | | $ | 1,404,666 | | | $ | (494,843 | ) | | $ | 909,823 | | | $ | — | | | $ | — | (1) | | $ | — | |
| Forward Foreign Currency Contracts ** | | | 1,384,082 | | | | (498,148 | ) | | | 885,934 | | | | — | | | | — | (1) | | $ | — | |
| Total | | $ | 2,788,748 | | | $ | (992,991 | ) | | $ | 1,795,757 | | | $ | — | | | $ | — | | | $ | — | |
| (1) | Any over-collateralization of total financial instruments is not shown. Collateral amounts can be found on the Consolidated Statements of Assets and Liabilities as Cash Deposits with Broker. |
| * | Counterparty for the Future Contracts is Marex. |
| ** | Counterparty for the Forward Foreign Currency Contracts is Jefferies Financial Services, Inc. |
LAGF
| | | | | | | | | | | | Gross Amounts Not Offset in the | | | | |
| Assets: | | | | | | | | | | | Statements of Assets & Liabilities | | | | |
| | | | | | Gross Amounts | | | Net Amounts of | | | | | | | | | | |
| | | | | | Offset in the | | | Assets Presented in | | | | | | | | | | |
| | | Gross Amounts of | | | Statements of Assets | | | the Statements of | | | Financial | | | Cash Collateral | | | | |
| | | Recognized Assets | | | & Liabilities | | | Assets & Liabilities | | | Instruments | | | Pledged | | | Net Amount | |
| Swaps Contracts | | $ | 1,230,473 | | | $ | (346,260 | ) | | $ | 884,213 | | | $ | — | | | $ | — | (1) | | $ | — | |
| Total | | $ | 1,230,473 | | | $ | (346,260 | ) | | $ | 884,213 | | | $ | — | | | $ | — | | | $ | — | |
| (1) | Any over-collateralization of total financial instruments is not shown. Collateral amounts can be found on the Consolidated Statements of Assets and Liabilities as Cash Deposits with Broker. Refer to Portfolio of Investments for Treasuries denoted as held as collateral for swaps. |
| The Longboard Funds |
| NOTES TO CONSOLIDATED FINANCIAL STATEMENTS (Continued) |
| May 31, 2022 |
Consolidation of Subsidiary – Longboard Fund Limited (LFL) – The Consolidated Financial Statements of LMFSF include the accounts of LFL, which is a wholly-owned and controlled foreign subsidiary. LMFSF consolidates the results of subsidiaries in which LMFSF holds a controlling economic interest. Controlling economic interest is generally deemed to exist with investment interests comprising greater than 50% of the net asset value of the subsidiary. However, LMFSF may also consider qualitative aspects of control in determining if a controlling economic interest exists. These qualitative control considerations include the nature and organizational structure of the investment, as well as LMFSF’s ability to control the circumstances leading to majority ownership. All inter-company accounts and transactions have been eliminated in consolidation.
LMFSF may invest up to 25% of its total assets in a controlled foreign corporation, which acts as an investment vehicle in order to effect certain investments consistent with the LMFSF’s investment objectives and policies.
A summary of the LMFSF’s investments in the LFL is as follows:
| | Inception Date of | LFL Net Assets at | % Of Net Assets at |
| | LFL | May 31, 2022 | May 31, 2022 |
| LFL | 8/15/2012 | $3,926,335 | 9.95% |
For tax purposes, LFL is an exempted Cayman investment company. LFL has received an undertaking from the Government of the Cayman Islands exempting it from all local income, profits and capital gains taxes. No such taxes are levied in the Cayman Islands at the present time. For U.S. income tax purposes, LFL is a Controlled Foreign Corporation which generates and is allocated no income which is considered effectively connected with U.S. trade of business and as such is not subject to U.S. income tax. However, as a wholly-owned Controlled Foreign Corporation, LFL’s net income and capital gain, to the extent of its earnings and profits, will be included each year in the LMFSF’s investment company taxable income.
In accordance with its investment objectives and through its exposure to the aforementioned managed futures programs, the Funds may have increased or decreased exposure to one or more of the following risk factors defined below:
Commodity Risk – Commodity risk relates to the change in value of commodities or commodity indexes as they relate to increases or decreases in the commodities market. Commodities are physical assets that have tangible properties. Examples of these types of assets are crude oil, heating oil, metals, livestock, and agricultural products.
Credit Risk – Credit risk relates to the ability of the issuer to meet interest and principal payments, or both, as they come due. In general, lower-grade, higher-yield bonds are subject to credit risk to a greater extent than lower-yield, higher-quality bonds.
Equity Risk – Equity risk relates to the change in value of equity securities as they relate to increases or decreases in the general market.
Foreign Exchange Rate Risk – Foreign exchange rate risk relates to the change in the U.S. dollar value of a security held that is denominated in a foreign currency. The U.S. dollar value of a foreign currency denominated security will decrease as the dollar appreciates against the currency, while the U.S. dollar value will increase as the dollar depreciates against the currency.
| The Longboard Funds |
| NOTES TO CONSOLIDATED FINANCIAL STATEMENTS (Continued) |
| May 31, 2022 |
Interest Rate Risk – Interest rate risk refers to the fluctuations in value of fixed-income securities resulting from the inverse relationship between price and yield. For example, an increase in general interest rates will tend to reduce the market value of already issued fixed-income investments, and a decline in general interest rates will tend to increase their value. In addition, debt securities with longer maturities, which tend to have higher yields, are subject to potentially greater fluctuations in value from changes in interest rates than obligations with shorter maturities.
Volatility Risk - Volatility risk refers to the magnitude of the movement, but not the direction of the movement, in a financial instrument’s price over a defined time period. Large increases or decreases in a financial instrument’s price over a relative time period typically indicate greater volatility risk, while small increases or decreases in its price typically indicate lower volatility risk.
Please refer to each Fund’s prospectus for a full listing of risks associated with these investments.
Impact of Derivatives on the Consolidated Statements of Assets and Liabilities:
The following is a summary of the location of derivative investments on LMFSF’s and LAGF’s Consolidated Statements of Assets and Liabilities as of May 31, 2022:
LMFSF
| | | Asset Derivatives | | | Liability Derivatives | |
| Contract Type/ | | Consolidated Statements of Assets and | | | | | Consolidated Statements of Assets and | | | |
| Primary Risk Exposure | | Liabilities Location | | Fair Value | | | Liabilities Location | | Fair Value | |
| Equity Contracts: | | Net Unrealized Appreciation on open futures contracts | | $ | 88,561 | | | Net Unrealized Appreciation on open futures contracts | | $ | (178,569 | ) |
| Commodity contracts: | | Net Unrealized Appreciation on open future contracts | | | 473,977 | | | Net Unrealized Appreciation on open futures contracts | | | (316,274 | ) |
| Interest rate contracts: | | Net Unrealized Appreciation from open future contracts | | | 842,128 | | | Net Unrealized Appreciation from open futures contracts | | | — | |
| Foreign exchange contracts: | | Net Unrealized Appreciation on forward foreign currency exchange contracts | | | 1,384,082 | | | Net Unrealized Appreciation on forward foreign currency exchange contracts | | | (498,148 | ) |
| | | | | $ | 2,788,748 | | | | | $ | (992,991 | ) |
LAGF
| | | Asset Derivatives | | | Liability Derivatives | |
| Contract Type/ | | Statements of Assets and Liabilities | | | | | Statements of Assets and Liabilities | | | |
| Primary Risk Exposure | | Location | | Fair Value | | | Location | | Fair Value | |
| Equity Swap Contracts: | | Net Unrealized Appreciation on swap contracts | | $ | 1,230,473 | | | Net Unrealized Appreciation on swap contracts | | $ | (346,260 | ) |
| | | | | $ | 1,230,473 | | | | | $ | (346,260 | ) |
| The Longboard Funds |
| NOTES TO CONSOLIDATED FINANCIAL STATEMENTS (Continued) |
| May 31, 2022 |
Impact of Derivatives on the Consolidated Statements of Operations:
The following is a summary of the location of derivative investments on each Fund’s Statements of Operations for the year ended May 31, 2022:
| Derivative Investment Type | Location of Gain (Loss) on Derivatives |
| Equity/Currency/Commodity/Interest Rate Contracts | Net realized gain (loss) from forward foreign currency exchange transactions |
| | Net realized gain (loss) from futures contracts |
| | Net realized gain (loss) from swap contracts |
| | Net change in unrealized appreciation (depreciation) from forward foreign currency exchange transactions |
| | Net change in unrealized appreciation (depreciation) from futures contracts |
| | Net change in unrealized appreciation (depreciation) from swap contracts |
The following is a summary of each Fund’s realized gain (loss) and net change in unrealized appreciation/(depreciation) on derivative investments recognized in the Statement of Operations categorized by primary risk exposure for each Fund for the year ended May 31, 2022:
LMFSF
| Realized gain/(loss) on derivatives recognized in the Consolidated Statements of Operations |
| | | | | | | | | | | | | | | Total for the Year | |
| | | | | | | | | | | | | | | Ended | |
| Derivative Investment Type | | Commodity | | | Currency | | | Equity | | | Interest Rate | | | May 31, 2022 | |
| Futures Contracts | | $ | 3,293,811 | | | $ | — | | | $ | 139,860 | | | $ | 545,420 | | | $ | 3,979,091 | |
| Forward Foreign Currency Exchange Contracts | | | — | | | | (362,158 | ) | | | — | | | | — | | | | (362,158 | ) |
| Total | | $ | 3,293,811 | | | $ | (362,158 | ) | | $ | 139,860 | | | $ | 545,420 | | | $ | 3,616,933 | |
| | | | | | | | | | | | | | | | | | | | | |
| Net Change in Unrealized appreciation/(depreciation) on derivatives recognized in the Consolidated Statements of Operations |
| | | | | | | | | | | | | | | Total for the Year | |
| | | | | | | | | | | | | | | Ended | |
| Derivative Investment Type | | Commodity | | | Currency | | | Equity | | | Interest Rate | | | May 31, 2022 | |
| Futures Contracts | | $ | (576,848 | ) | | $ | — | | | $ | (410,935 | ) | | $ | 869,317 | | | $ | (118,466 | ) |
| Forward Foreign Currency Exchange Contracts | | | — | | | | 309,905 | | | | — | | | | — | | | | 309,905 | |
| Total | | $ | (576,848 | ) | | $ | 309,905 | | | $ | (410,935 | ) | | $ | 869,317 | | | $ | 191,439 | |
| The Longboard Funds |
| NOTES TO CONSOLIDATED FINANCIAL STATEMENTS (Continued) |
| May 31, 2022 |
LAGF
| Realized gain/(loss) on derivatives recognized in the Statements of Operations |
| | | | | | | | | | | | | | | Total for the Year | |
| | | | | | | | | | | | | | | Ended | |
| Derivative Investment Type | | Commodity | | | Currency | | | Equity | | | Interest Rate | | | May 31, 2022 | |
| Swap Contracts | | $ | — | | | $ | — | | | $ | 4,789,653 | | | $ | — | | | $ | 4,789,653 | |
| Total | | $ | — | | | $ | — | | | $ | 4,789,653 | | | $ | — | | | $ | 4,789,653 | |
| | | | | | | | | | | | | | | | | | | | | |
| Net Change in Unrealized appreciation/(depreciation) on derivatives recognized in the Statements of Operations |
| | | | | | | | | | | | | | | Total for the Year | |
| | | | | | | | | | | | | | | Ended | |
| Derivative Investment Type | | Commodity | | | Currency | | | Equity | | | Interest Rate | | | May 31, 2022 | |
| Swap Contracts | | $ | — | | | $ | — | | | $ | (7,736,305 | ) | | $ | — | | | $ | (7,736,305 | ) |
| Total | | $ | — | | | $ | — | | | $ | (7,736,305 | ) | | $ | — | | | $ | (7,736,305 | ) |
Security Transactions and Related Income – Security transactions are accounted for on trade date. Interest income is recognized on an accrual basis. Discounts are accreted and premiums are amortized on securities purchased over the lives of the respective securities. Dividend income is recorded on the ex-dividend date. Realized gains or losses from sales of securities are determined by comparing the identified cost of the security lot sold with the net sales proceeds.
Dividends and Distributions to Shareholders – Dividends from net investment income, if any, are declared and paid annually for LMFSF and quarterly for LAGF. Distributable net realized capital gains, if any, are declared and distributed annually in December. Dividends from net investment income and distributions from net realized gains are determined in accordance with federal income tax regulations, which may differ from GAAP. These “book/tax” differences are considered either temporary (i.e., deferred losses, capital loss carry forwards) or permanent in nature. To the extent these differences are permanent in nature, such amounts are reclassified within the composition of net assets based on their federal tax-basis treatment; temporary differences do not require reclassification. Dividends and distributions to shareholders are recorded on ex-dividend date.
Federal Income Taxes – The Funds intend to continue to comply with the requirements of the Internal Revenue Code applicable to regulated investment companies and to distribute all of their taxable income to their shareholders. Therefore, no provision for Federal income tax is required. The Funds recognizes the tax benefits of uncertain tax positions only where the position is “more likely than not” to be sustained assuming examination by tax authorities. Management has analyzed the Funds’ tax positions and has concluded that no liability for unrecognized tax benefits should be recorded related to uncertain tax positions taken on returns filed for open tax years May 31, 2019 to May 31, 2021 or expected to be taken in the Funds’ May 31, 2022 tax returns. The Funds identify their major tax jurisdictions as U.S. Federal, Ohio and foreign jurisdictions where the Funds make significant investments. The Funds are not aware of any tax positions for which it is reasonably possible that the total amounts of unrecognized tax benefits will change materially in the next twelve months.
Foreign Currency – The accounting records of the Funds are maintained in U.S. dollars. Investment securities, foreign currencies, and other assets and liabilities denominated in a foreign currency, and income receipts and expense payments are translated into U.S. dollars using the prevailing exchange rate at the London market close. Purchases and sales of securities are translated into U.S. dollars at the contractual currency rates established at
| The Longboard Funds |
| NOTES TO CONSOLIDATED FINANCIAL STATEMENTS (Continued) |
| May 31, 2022 |
the approximate time of the trade. Net realized gains and losses and settlement dates on securities transactions and the difference between income accrued versus income received. The effects of changes in foreign currency exchange rates on investments in securities are included with the net realized and unrealized gain or loss on investment securities.
Expenses – Expenses of the Trust that are directly identifiable to a specific fund are charged to that fund. Expenses, which are not readily identifiable to a specific fund, are allocated in such a manner as deemed equitable (as determined by the Board), taking into consideration the nature and type of expense and the relative sizes of the funds in the Trust.
Indemnification – The Trust indemnifies its officers and trustees for certain liabilities that may arise from the performance of their duties to the Trust. Additionally, in the normal course of business, the Funds enter into contracts that contain a variety of representations and warranties and which provide general indemnities. The Funds’ maximum exposure under these arrangements is unknown, as this would involve future claims that may be made against the Funds that have not yet occurred. However, based on experience, the Funds expect the risk of loss due to these warranties and indemnities to be remote.
| 3. | INVESTMENT TRANSACTIONS |
For the year ended May 31, 2022, cost of purchases and proceeds from sales of portfolio securities, other than short-term investments, amounted to $0 and $0, for both LMFSF and LAGF. All investments held by the Fund throughout the year ended May 31, 2022 had maturities or settlement dates of less than one year from the time they were acquired and are considered short term investments.
| 4. | INVESTMENT ADVISORY AGREEMENT AND TRANSACTIONS WITH RELATED PARTIES |
Longboard Asset Management, LP (the “Funds’ Manager”) serves as the Funds’ Investment Adviser (the “Adviser”). Pursuant to the Advisory Agreement, LMFSF pays the Adviser a unitary management fee (the Investment Advisory fee) for the services and facilities it provides at the annual rate of 2.99% of the Fund’s average daily net assets up to $250 million, 2.75% on assets between $250 million and $450 million and 1.99% on assets greater than $450 million. Pursuant to the Advisory Agreement, LAGF pays the Adviser a unitary management fee for the services and facilities it provides at the annual rate of 1.99% of the Fund’s average daily net assets. The unitary management fee is paid on a monthly basis. During the year ended May 31, 2022, LMFSF incurred $1,155,017 in advisory fees and LAGF incurred $1,932,242 in advisory fees.
Out of the unitary management fee, the Adviser pays substantially all expenses of each Fund, including the cost of transfer agency, custody, fund administration, legal, audit and other services, except for interest expenses, distribution fees or expenses, brokerage expenses, taxes and extraordinary expenses not incurred in the ordinary course of the Funds’ business. The Adviser’s unitary management fee is designed to pay substantially all the Funds’ expenses and to compensate the Adviser for providing services for the Fund.
The Board has adopted the Trust’s Master Distribution and Shareholder Service Plan (the “Plan”) pursuant to Rule 12b-1 under the 1940 Act. The Plan provides that a monthly service and/or distribution fee is calculated by
| The Longboard Funds |
| NOTES TO CONSOLIDATED FINANCIAL STATEMENTS (Continued) |
| May 31, 2022 |
the Funds at an annual rate of 0.25% of the average daily net assets attributable to the Class A and is paid to Northern Lights Distributors, LLC (the “Distributor”), to provide compensation for ongoing distribution-related activities or services and/or maintenance of the Funds’ shareholder accounts, not otherwise required to be provided by the Adviser. The Plan is a compensation plan, which means that compensation is provided regardless of 12b-1 expenses incurred. For the year ended May 31, 2022, LMFSF paid $1,884 in 12b-1 fees and LAGF paid $5,294 in 12b-1 fees.
The Distributor acts as the Funds’ principal underwriter in a continuous public offering of the Funds’ Class A and Class I shares. On the sales of LMFSF Class A shares, for the year ended May 31, 2022, the Distributor received no underwriting commissions, as such, nothing was retained by the principal underwriter or other affiliated broker-dealers. On the sales of LAGF Class A shares, for the year ended May 31, 2022, the Distributor received $47,099 in underwriting commissions, of which $4,686 was retained by the principal underwriter or other affiliated broker-dealers. These are not expenses to each Fund, rather, a charge to share sale proceeds.
In addition, certain affiliates of the Distributor provide services to the Funds as follows:
Ultimus Fund Solutions, LLC (“UFS”) – an affiliate of the Distributor, provides administration, fund accounting, and transfer agent services to the Trust. Pursuant to separate servicing agreements with UFS, the Adviser pays UFS customary fees for providing administration, fund accounting, and transfer agency services to the Funds. Certain officers of the Trust are also officers of UFS, and are not paid any fees directly by the Funds for serving in such capacities.
Northern Lights Compliance Services, LLC (“NLCS”) – NLCS, an affiliate of UFS and the Distributor, provides a Chief Compliance Officer to the Trust, as well as related compliance services, pursuant to a consulting agreement between NLCS and the Trust. Under the terms of such agreement, NLCS receives customary fees from the Adviser.
Blu Giant, LLC (“Blu Giant”) – Blu Giant, an affiliate of UFS and the Distributor, provides EDGAR conversion and filing services as well as print management services for the Funds on an ad-hoc basis. For the provision of these services, Blu Giant receives customary fees from the Adviser.
The beneficial ownership, either directly or indirectly, of more than 25% of the voting securities of each Fund creates presumption of the control of the Funds, under section 2(a)9 of the Act. As of May 31, 2022, Charles Schwab & Co. held 40.0% and 40.6% of the voting securities of LMFSF and LAGF, respectively. The Trust has no knowledge as to whether all or any portion of the shares owned of record by Charles Schwab & Co. are also owned beneficially.
| The Longboard Funds |
| NOTES TO CONSOLIDATED FINANCIAL STATEMENTS (Continued) |
| May 31, 2022 |
| 6. | DISTRIBUTIONS TO SHAREHOLDERS AND TAX COMPONENTS OF CAPITAL |
The tax character of Funds’ distributions for the years ended May 31, 2022 and May 31, 2021 was as follows:
| For the period ended May 31, 2022: |
| | | Ordinary | | | Long-Term | | | Return | | | | |
| Portfolio | | Income | | | Capital Gains | | | of Capital | | | Total | |
| Longboard Managed Futures Strategy Fund | | $ | 1,322,039 | | | $ | — | | | $ | — | | | $ | 1,322,039 | |
| Longboard Alternative Growth Fund | | | — | | | | — | | | | 3,748,503 | | | | 3,748,503 | |
| | | | | | | | | | | | | | | | | |
| For the period ended May 31, 2021: |
| | | Ordinary | | | Long-Term | | | Return | | | | |
| Portfolio | | Income | | | Capital Gains | | | of Capital | | | Total | |
| Longboard Managed Futures Strategy Fund | | $ | 1,313,366 | | | $ | — | | | $ | — | | | $ | 1,313,366 | |
| Longboard Alternative Growth Fund | | | — | | | | — | | | | — | | | | — | |
As of May 31, 2022, the components of accumulated earnings/(deficit) on a tax basis were as follows:
| | | Undistributed | | | Undistributed | | | Post October Loss | | | Capital Loss | | | Other | | | Unrealized | | | Total | |
| | | Ordinary | | | Long-Term | | | and | | | Carry | | | Book/Tax | | | Appreciation/ | | | Accumulated | |
| Portfolio | | Income | | | Capital Gains | | | Late Year Loss | | | Forwards | | | Differences | | | (Depreciation) | | | Earnings/(Deficits) | |
| Longboard Managed Futures Strategy Fund | | $ | 898,517 | | | $ | — | | | $ | — | | | $ | (33,183,385 | ) | | $ | (21,995,856 | ) | | | 862,584 | | | $ | (53,418,140 | ) |
| Longboard Alternative Growth Fund | | | — | | | | — | | | | (799,713 | ) | | | (3,061,583 | ) | | | — | | | | 877,216 | | | | (2,984,080 | ) |
The difference between book basis and tax basis accumulated net investment income (loss), unrealized appreciation (depreciation) and accumulated net realized gain (loss) from investments is primarily attributable to mark-to-market on open 1256 futures contracts and foreign currency contracts, and tax adjustments for a wholly owned subsidiary. The unrealized appreciation (depreciation) in the table above includes unrealized foreign currency gains of $24,844 for the Longboard Managed Futures Strategy Fund Late year losses incurred after December 31 within the fiscal year are deemed to arise on the first business day of the following fiscal year for tax purposes. The Longboard Alternative Growth Fund incurred and elected to defer such late year losses of $799,713.
At May 31, 2022, the Funds had capital loss carry forwards (“CLCF”) for federal income tax purposes available to offset future capital gains as follows:
| | | Non-Expiring | | | | | | | |
| Portfolio | | Short-Term | | | Long-Term | | | Total | | | CLCF Utilized | |
| Longboard Managed Futures Strategy Fund | | $ | 27,234,179 | | | $ | 5,949,206 | | | $ | 33,183,385 | | | $ | 976,197 | |
| Longboard Alternative Growth Fund | | | (2,836,599 | ) | | | 5,898,182 | | | | 3,061,583 | | | | 4,789,653 | |
| The Longboard Funds |
| NOTES TO CONSOLIDATED FINANCIAL STATEMENTS (Continued) |
| May 31, 2022 |
Permanent book and tax differences, primarily attributable to the book/tax basis treatment of net operating losses and reclass of distributions resulted in reclassification for the tax year ended May 31, 2022, for the Funds as follows:
| | | Paid | | | | |
| | | In | | | Accumulated | |
| Portfolio | | Capital | | | Earnings (Losses) | |
| Longboard Managed Futures Strategy Fund | | $ | — | | | $ | — | |
| Longboard Alternative Growth Fund | | | (5,279,942 | ) | | | 5,279,942 | |
| 7. | AGGREGATE UNREALIZED APPRECIATION AND DEPRECIATION – TAX BASIS |
| | | | | | Gross Unrealized | | | Gross Unrealized | | | Net Unrealized | |
| | | Tax Cost | | | Appreciation | | | Depreciation | | | Appreciation | |
| Longboard Managed Futures Strategy Fund | | $ | 15,882,507 | | | $ | 2,763,685 | | | $ | (1,876,257 | ) | | $ | 887,428 | |
| Longboard Alternative Growth Fund | | $ | 99,867,344 | | | $ | 884,213 | | | $ | (6,997 | ) | | $ | 877,216 | |
| 8. | NEW ACCOUNTING PRONOUNCEMENT |
In March 2020, FASB issued ASU 2020-04, Reference Rate Reform (Topic 848): Facilitation of the Effects of Reference Rate Reform on Financial Reporting (’‘ASU 2020-04’’). The amendments in ASU 2020- 04 provide optional temporary financial reporting relief from the effect of certain types of contract modifications due to the planned discontinuation of LIBOR and other interbank-offered based reference rates. ASU 2020- 04 is effective for certain reference rate-related contract modifications that occur during the period March 12, 2020 through December 31, 2022. Management is currently evaluating the impact, if any of applying this ASU.
In October 2020, the Securities and Exchange Commission (“SEC”) adopted new regulations governing the use of derivatives by registered investment companies (“Rule 18f-4”). Rule 18f-4 will impose limits on the amount of derivatives a Fund can enter into, eliminate the asset segregation framework currently used by funds to comply with Section 18 of the 1940 Act, and require funds whose use of derivatives is greater than a limited specified amount to establish and maintain a comprehensive derivatives risk management program and appoint a derivatives risk manager. Funds will be required to comply with Rule 18f-4 by August 19, 2022. It is not currently clear what impact, if any, Rule 18f-4 will have on the availability, liquidity or performance of derivatives. Management is currently evaluating the potential impact of Rule 18f-4 on the Funds. When fully implemented, Rule 18f -4 may require changes in how a Fund uses derivatives, adversely affect the Fund’s performance and increase costs related to the Funds’ use of derivatives.
Subsequent events after the date of the Statement of Assets and Liabilities have been evaluated through the date the financial statements were issued. Management has determined that no other events or transactions occurred requiring adjustment or disclosure in the financial statements.
Dividends: The Board declared the following quarterly dividend for LAGF:
| Fund | | Dividend Per Share | | Record Date | | Payable Date |
| Longboard Alternative Growth Fund - Class A | | 0.2398 | | 6/1/2022 | | 6/3/2022 |
| Longboard Alternative Growth Fund - Class I | | 0.2488 | | 6/1/2022 | | 6/3/2022 |
Report of Independent Registered Public Accounting Firm
To the Trustees of Northern Lights Fund Trust II
and the Shareholders of Longboard Managed Futures Strategy Fund
Opinion on the Financial Statements
We have audited the accompanying consolidated statement of assets and liabilities of Longboard Managed Futures Strategy Fund (the Fund), including the consolidated schedule of investments, as of May 31, 2022, the related consolidated statement of operations for the year then ended, the consolidated statements of changes in net assets for each of the two years in the period then ended, and the related notes to the consolidated financial statements (collectively, the financial statements), and the financial highlights for each of the five years in the period then ended. In our opinion, the financial statements and financial highlights present fairly, in all material respects, the financial position of the Fund as of May 31, 2022, the results of its operations for the year then ended, the changes in net assets for each of the two years in the period then ended, and the financial highlights for each of the five years in the period then ended, in conformity with accounting principles generally accepted in the United States of America.
Basis for Opinion
These financial statements are the responsibility of the Fund’s management. Our responsibility is to express an opinion on the Fund’s financial statements and financial highlights based on our audits. We are a public accounting firm registered with the Public Company Accounting Oversight Board (United States) (PCAOB) and are required to be independent with respect to the Fund in accordance with U.S. federal securities laws and the applicable rules and regulations of the Securities and Exchange Commission and the PCAOB.
We conducted our audits in accordance with the standards of the PCAOB. Those standards require that we plan and perform the audit to obtain reasonable assurance about whether the financial statements are free of material misstatement, whether due to error or fraud. The Fund is not required to have, nor were we engaged to perform, an audit of its internal control over financial reporting. As part of our audits, we are required to obtain an understanding of internal control over financial reporting but not for the purpose of expressing an opinion on the effectiveness of the Fund’s internal control over financial reporting. Accordingly, we express no such opinion.
Our audits included performing procedures to assess the risks of material misstatement of the financial statements, whether due to error or fraud, and performing procedures that respond to those risks. Such procedures included examining, on a test basis, evidence regarding the amounts and disclosures in the financial statements. Our procedures included confirmation of securities owned as of May 31, 2022, by correspondence with the custodian and brokers. Our audits also included evaluating the accounting principles used and significant estimates made by management, as well as evaluating the overall presentation of the financial statements. We believe that our audits provide a reasonable basis for our opinion.
/s/ RSM US LLP
We have served as the auditor of one or more Longboard Asset Management, LP advised investment companies since 2013.
Denver, Colorado
July 29, 2022
Report of Independent Registered Public Accounting Firm
To the Board of Trustees of Northern Lights Fund Trust II
and the Shareholders of Longboard Alternative Growth Fund
Opinion on the Financial Statements
We have audited the accompanying statement of assets and liabilities of Longboard Alternative Growth Fund (the Fund), including the schedule of investments, as of May 31, 2022, the related statement of operations for the year then ended, the statements of changes in net assets for each of the two years in the period then ended, and the related notes to the financial statements (collectively, the financial statements), and the financial highlights for each of the five years in the period then ended. In our opinion, the financial statements and financial highlights present fairly, in all material respects, the financial position of the Fund as of May 31, 2022, the results of its operations and its cash flows for the year then ended, the changes in net assets for each of the two years in the period then ended, and the financial highlights for each of the five years in the period then ended, in conformity with accounting principles generally accepted in the United States of America.
Basis for Opinion
These financial statements are the responsibility of the Fund’s management. Our responsibility is to express an opinion on the Fund’s financial statements and financial highlights based on our audits. We are a public accounting firm registered with the Public Company Accounting Oversight Board (United States) (PCAOB) and are required to be independent with respect to the Fund in accordance with U.S. federal securities laws and the applicable rules and regulations of the Securities and Exchange Commission and the PCAOB.
We conducted our audits in accordance with the standards of the PCAOB. Those standards require that we plan and perform the audit to obtain reasonable assurance about whether the financial statements are free of material misstatement, whether due to error or fraud. The Fund is not required to have, nor were we engaged to perform, an audit of its internal control over financial reporting. As part of our audits, we are required to obtain an understanding of internal control over financial reporting but not for the purpose of expressing an opinion on the effectiveness of the Fund’s internal control over financial reporting. Accordingly, we express no such opinion.
Our audits included performing procedures to assess the risks of material misstatement of the financial statements, whether due to error or fraud, and performing procedures that respond to those risks. Such procedures included examining, on a test basis, evidence regarding the amounts and disclosures in the financial statements. Our procedures included confirmation of securities owned as of May 31, 2022, by correspondence with the custodian, broker and swap counterparty. Our audits also included evaluating the accounting principles used and significant estimates made by management, as well as evaluating the overall presentation of the financial statements. We believe that our audits provide a reasonable basis for our opinion.
/s/ RSM US LLP
We have served as the auditor of one or more Longboard Asset Management, LP advised investment companies since 2013.
Denver, Colorado
July 29, 2022
| The Longboard Funds |
| EXPENSE EXAMPLES (Unaudited) |
| May 31, 2022 |
As a shareholder of the Longboard Funds, you incur the ongoing costs of Investment advisory fees. This example is intended to help you understand your ongoing costs (in dollars) of investing in the Fund and to compare these costs with the ongoing costs of investing in other mutual funds.
The example is based on an investment of $1,000 invested at the beginning of the period and held for the entire period from December 1, 2021 through May 31, 2022.
Actual Expenses
The “Actual Expenses” line in the table below provides information about actual account values and actual expenses. You may use the information below, together with the amount you invested, to estimate the expenses that you paid over the period. Simply divide your account value by $1,000 (for example, an $8,600 account value divided by $1,000 = 8.6), then multiply the result by the number in the table under the heading entitled “Expenses Paid During Period” to estimate the expenses you paid on your account during this period.
Hypothetical Example for Comparison Purposes
The “Hypothetical” line in the table below provides information about hypothetical account values and hypothetical expenses based on the Fund’s actual expense ratio and an assumed rate of return of 5% per year before expenses, which is not the Fund’s actual return. The hypothetical account values and expenses may not be used to estimate the actual ending account balances or expenses you paid for the period. You may use this information to compare this 5% hypothetical example with the 5% hypothetical examples that appear in the shareholder reports of other funds.
Please note that the expenses shown in the table are meant to highlight your ongoing costs only and do not reflect any transactional costs, such as contingent deferred sales charges (loads), or redemption fees. Therefore, the table is useful in comparing ongoing costs only, and will not help you determine the relative total costs of owning different funds. In addition, if these transactional costs were included, your costs would have been higher.
| | | Beginning | | Ending Account | | Expenses Paid During | | Expense Ratio During |
| | | Account Value | | Value | | Period * | | Period ** |
| Actual | | 12/1/21 | | 5/31/22 | | 12/1/21-5/31/22 | | 12/1/21-5/31/22 |
| Longboard Managed Futures Strategy Fund - Class A | | $1,000.00 | | $1,126.50 | | $17.18 | | 3.24% |
| Longboard Managed Futures Strategy Fund - Class I | | 1,000.00 | | 1,127.70 | | 15.86 | | 2.99% |
| Longboard Alternative Growth Fund - Class A | | 1,000.00 | | 941.60 | | 10.85 | | 2.24% |
| Longboard Alternative Growth Fund - Class I | | 1,000.00 | | 943.10 | | 9.64 | | 1.99% |
| | | | | | | | | |
| Hypothetical (5% return before Expenses) | | | | | | | | |
| Longboard Managed Futures Strategy Fund - Class A | | $1,000.00 | | $1,008.78 | | $16.23 | | 3.24% |
| Longboard Managed Futures Strategy Fund - Class I | | 1,000.00 | | 1,010.02 | | 14.98 | | 2.99% |
| Longboard Alternative Growth Fund - Class A | | 1,000.00 | | 1,013.76 | | 11.25 | | 2.24% |
| Longboard Alternative Growth Fund - Class I | | 1,000.00 | | 1,015.01 | | 10.00 | | 1.99% |
| * | Expenses are equal to the average account value over the period, multiplied by each Fund’s annualized expense ratio, multiplied by the number of days in the period (182) divided by the number of days in the fiscal year (365). |
| The Longboard Funds |
| SUPPLEMENTAL INFORMATION (Unaudited) |
| May 31, 2022 |
FACTORS CONSIDERED BY THE TRUSTEES IN THE APPROVAL OF THE RENEWAL OF THE INVESTMENT ADVISORY AGREEMENT
At a Regular meeting (the “Meeting”) of the Board of Trustees (the “Board”) of Northern Lights Fund Trust II (the “Trust”) held on July 27, 2021, the Board, including the disinterested Trustees (the “Independent Trustees”), considered the renewal of the Investment Advisory Agreement between the Trust, on behalf of the Longboard Managed Futures Strategy Fund (“Longboard Managed Futures”), the Longboard Alternative Growth Fund (“Longboard Alternative Growth”, together with Longboard Managed Futures, the “Longboard Funds”) and Longboard Asset Management, LP (“Longboard”), (the “Longboard Advisory Agreement”).
Based on their evaluation of the information provided by Longboard, in conjunction with the Longboard Funds’ other service providers, the Board, by a unanimous vote (including a separate vote of the Independent Trustees), approved the renewal of the Longboard Advisory Agreement with respect to the Longboard Funds.
In advance of the Meeting, the Board requested and received materials to assist them in considering the renewal of the Longboard Advisory Agreement. The materials provided contained information with respect to the factors enumerated below, including the Longboard Advisory Agreement, a memorandum prepared by the Trust’s outside legal counsel discussing in detail the Trustees’ fiduciary obligations and the factors they should assess in considering the renewal of the Longboard Advisory Agreement and comparative information relating to the advisory fee and other expenses of each Longboard Fund. The materials also included due diligence materials relating to Longboard (including due diligence questionnaires completed by Longboard, select financial information of Longboard, bibliographic information regarding Longboard’s key management and investment advisory personnel, and comparative fee information relating to each Longboard Fund) and other pertinent information. At the Meeting, the Independent Trustees were advised by counsel that is experienced in Investment Company Act of 1940 matters and that is independent of fund management and met with such counsel separately from fund management.
The Board then reviewed and discussed the written materials that were provided in advance of the Meeting and deliberated on the renewal of the Longboard Advisory Agreement. The Board relied upon the advice of independent legal counsel and their own business judgment in determining the material factors to be considered in evaluating the Longboard Advisory Agreement and the weight to be given to each such factor. The conclusions reached by the Board were based on a comprehensive evaluation of all of the information provided and were not the result of any one factor. Moreover, each Trustee may have afforded different weight to the various factors in reaching his conclusions with respect to the Longboard Advisory Agreement. In considering the renewal of the Longboard Advisory Agreement, the Board reviewed and analyzed various factors that they determined were relevant, including the factors enumerated below.
Nature, Extent and Quality of Services – The Board reviewed materials provided by Longboard related to the proposed renewal of the Longboard Advisory Agreement, including Longboard’s ADV, a description of the manner in which investment decisions are made and executed and a review of the professional personnel performing services for Longboard, including the individuals that primarily monitor and execute the investment process. The Board noted the efforts made by Longboard to expand its sales team in an effort to aggressively market the Funds and the hiring or rehiring of certain operations and information technology personnel. The Board discussed the extent of Longboard’s research capabilities, the quality of its compliance infrastructure and the experience of its Fund management personnel. Additionally, the Board received satisfactory responses from representatives of Longboard with respect to a series of important questions, including: whether Longboard was involved in any lawsuits or pending regulatory actions; whether Longboard’s management of other accounts would conflict with its management of each Longboard Fund; and whether Longboard has procedures in place to adequately allocate trades among its respective clients. The Board reviewed the description provided by Longboard of its practices for monitoring compliance with each of the Longboard Funds investment limitations, noting that Longboard’s CCO would continually review the portfolio managers’ performance of their duties to ensure compliance under Longboard’s and the Longboard Funds compliance programs. The Board also discussed Longboard’s compliance program with the CCO of the Trust. The Board noted that the CCO of the Trust continued to represent that Longboard’s policies and procedures were reasonably designed to prevent violations of applicable securities laws. The Board also noted Longboard’s
| The Longboard Funds |
| SUPPLEMENTAL INFORMATION (Unaudited)(Continued) |
| May 31, 2022 |
representation that the prospectus and statement of additional information for each of the Longboard Funds accurately describe the investment strategies of each of the Longboard Funds. The Board then reviewed the capitalization of Longboard based on representations made by Longboard and concluded that Longboard was sufficiently well-capitalized, or that its control persons had the ability to make additional contributions in order to meet its obligations to the Longboard Funds. The Board concluded that Longboard had sufficient quality and depth of personnel, resources, investment methods and compliance policies and procedures essential to performing its duties under the Longboard Advisory Agreement and that the nature, overall quality and extent of the management services to be provided by Longboard to each of the Longboard Funds were satisfactory.
Performance – The Board discussed the reports prepared by Broadridge and reviewed the performance of Longboard Managed Futures as compared to its peer group, Morningstar category and benchmark for the one year, three-year, five-year and since inception periods ended June 30, 2021. The Board noted that Longboard Managed Futures outperformed its benchmark and peer group median, and was slightly below its Morningstar category median for the one year and since inception periods but underperformed its peer group median, Morningstar category median and benchmark for the three and five-year periods. The Board noted that Longboard did not intend to make adjustments to the strategy or investment process and that the Adviser had stated that it will continue to adhere to its trend following model. After further discussion, the Board concluded that overall, Longboard Managed Futures past performance was satisfactory and in-line with its investment objective.
The Board also discussed the reports prepared by Broadridge and reviewed the performance of Longboard Alternative Growth as compared to its peer group, Morningstar category and benchmark for the one year, three year, five year and since inception periods ended June 30, 2021, noting that Longboard Alternative Growth outperformed its benchmark, its peer group median and Morningstar category median for each period. The Board recapped earlier discussions with Longboard noting that Longboard Alternative Growth was taking on a higher amount of risk than its peers in exchange for a greater return. The Board further noted that Longboard did not intend to make adjustments to the strategy or investment process. After further discussion, the Board concluded that overall, the Longboard Alternative Growth’s past performance was satisfactory and in-line with its investment objective.
Fees and Expenses – As to the costs of the services to be provided by Longboard, the Board reviewed and discussed each of the Longboard Funds’ unitary fee and overall expenses as compared to its peer group and Morningstar category as presented in the Broadridge Report. The Board reviewed the contractual arrangements for each of the Longboard Funds, noting that Longboard pays substantially all expenses of each of the Longboard Funds, including transfer agency, custody, fund administration, legal, audit and other services, but not interest expenses, distribution fees or expenses, brokerage expenses, taxes and extraordinary expenses not incurred in the ordinary course of each of the Longboard Funds’ business. The Board also noted that the Longboard Advisory Agreement provides for a breakpoint for the Longboard Managed Futures Fund unitary fee so that the fee decreases from 2.99% to 2.75% on assets between $250 million and $450 million and 1.99% on assets greater than $ 450 million. With respect to the Longboard Alternative Growth, the Board noted the unitary fee of 1.99% of Fund assets. Because of the unitary fee structure of each of the Longboard Funds, the Board noted the difficulty when looking for comparable funds. In addition to the Board’s evaluation of the advisory fee, the Board also looked at the all in cost of managing the investment strategy for each of the Longboard Funds and found that total operating expenses, exclusive of certain fees, were capped at 2.99% for the Longboard Managed Futures and 1.99% for the Longboard Alternative Growth as compared to many of their peers which carried significantly higher total operating expenses. The Board concluded that based on Longboard’s experience and expertise as well as the services provided to each of the Longboard Funds, the unitary advisory fees charged by Longboard were not unreasonable.
Profitability – The Board also considered the level of profits that could be expected to accrue to Longboard with respect to each of the Longboard Funds based on profitability reports and analyses reviewed by the Board and the selected financial information provided by Longboard. After review and discussion, the Board concluded that based on the services provided or paid for by Longboard, the current assets of each Fund and the built- in breakpoints, the profits from Longboard’s relationship with the each of the Longboard Funds were not excessive.
| The Longboard Funds |
| SUPPLEMENTAL INFORMATION (Unaudited)(Continued) |
| May 31, 2022 |
Economies of Scale – As to the extent to which each of the Longboard Funds will realize economies of scale as it grows, and whether the fee levels reflect these economies of scale for the benefit of investors, the Board discussed the current size of the Longboard Managed Futures. The Board noted that shareholders would get the benefit of a tiered breakpoint schedule once assets reached the thresholds. The Board also discussed the current size of the Longboard Alternative Growth, along with Longboard’s expectations for growth, and concluded that any further material economies of scale would not be achieved in the near term.
Conclusion – The Board relied upon the advice of counsel, and their own business judgment in determining the material factors to be considered in evaluating the Longboard Advisory Agreement and the weight to be given to each such factor. Accordingly, having requested and received such information from Longboard as the Trustees believed to be reasonably necessary to evaluate the terms of the Longboard Advisory Agreement, and as assisted by the advice of independent counsel, the Board, including a majority of the Independent Trustees, determined that, with respect to the Longboard Advisory Agreement, (a) the terms of the Longboard Advisory Agreement are reasonable; (b) the advisory fee is reasonable; and (c) the Longboard Advisory Agreement is in the best interests of each Longboard Fund and its shareholders. In considering the renewal of the Longboard Advisory Agreement, the Board did not identify any one factor as all important, but rather considered these factors collectively and determined that the renewal of the Longboard Advisory Agreement was in the best interest of each Longboard Fund and its shareholders. Moreover, the Board noted that each Trustee may have afforded different weight to the various factors in reaching his conclusions with respect to the Longboard Advisory Agreement.
| The Longboard Funds |
| SUPPLEMENTAL INFORMATION (Unaudited) |
| May 31, 2022 |
The Trustees and the officers of the Trust are listed below with their present positions with the Trust and principal occupations over at least the last five years. The business address of each Trustee and Officer is 225 Pictoria Drive, Suite 450, Cincinnati, OH 45246. All correspondence to the Trustees and Officers should be directed to c/o Gemini Fund Services, LLC, P.O. Box 541150, Omaha, Nebraska 68154.
Independent Trustees
Name and Year of
Birth | Position/Term of
Office* | Principal Occupation
During the Past Five Years | Number of
Portfolios in
Fund Complex
Overseen by
Trustee** | Other Directorships held by Trustee
During the Past Five Years |
Brian Nielsen
1972 | Trustee Since May 2011 | Trustee of Northern Lights Fund Trust II (since 2011); Special Projects Counsel of NorthStar Financial Services Group, LLC (from 2018 to 2019); Secretary of CLS Investments, LLC (from 2001 to 2018); Secretary of Orion Advisor Services, LLC (from 2001 to 2018); General Counsel and Secretary (from 2003 to 2018) of NorthStar Financial Services Group, LLC; CEO (from 2012 to 2018), Secretary (from 2003 to 2018) and Manager (from 2005 to 2018) of Northern Lights Distributors, LLC; Director, Secretary and General Counsel of Constellation Trust Company (from 2004 to 2018); CEO (from 2015 to 2018), General Counsel and Secretary (from 2011 to 2018) of Northern Lights Compliance Services, LLC; General Counsel and Secretary of Blu Giant, LLC (from 2011 to 2018); Secretary of Gemini Fund Services, LLC (from 2012 to 2018); Manager of Arbor Point Advisors, LLC (from 2012 to 2018); Director, Secretary and General Counsel of NorthStar CTC Holdings, Inc. (from 2015 to 2018) and Secretary and Chief Legal Officer of AdvisorOne Funds (from 2003 to 2018). | 2 | Manager of Northern Lights Distributors, LLC (from 2005 to 2018); Manager of Arbor Point Advisors, LLC (from 2012 to 2018); Director of Constellation Trust Company (from 2004 to 2018) |
Thomas T.
Sarkany
1946 | Trustee Since October 2011 | President, TTS Consultants, LLC (financial services) (since 2010). | 2 | Director, Aquila Distributors; Trustee, Arrow ETF Trust; Trustee, Arrow Investments Trust; Trustee, Northern Lights Fund Trust IV |
Anthony H. Lewis
1946 | Trustee Since May 2011 | Chairman and CEO of The Lewis Group USA (executive consulting firm) (since 2007). | 2 | Director, Member of the Compensation Committee and Member of the Risk Committee of Torotel Inc. (Magnetics, Aerospace and Defense), Trustee, Chairman of the Fair Valuation Committee and Member of the Audit Committee of the Wildermuth Endowment Strategy Fund |
Keith Rhoades
1948 | Trustee Since May 2011 | Retired since 2008. | 2 | NONE |
Randal D. Skalla
1962 | Trustee Since May 2011 | President, L5 Enterprises, Inc. (financial services company) (since 2001). | | Board Member, Orizon Investment Counsel (financial services company) (from 2001 to 2017)�� |
| The Longboard Funds |
| SUPPLEMENTAL INFORMATION (Unaudited)(Continued) |
| May 31, 2022 |
Officers
Name and Year of
Birth | Position/Term of
Office* | Principal Occupation
During the Past Five Years | Number of
Portfolios in
Fund Complex
Overseen by
Trustee** | Other Directorships held by Trustee
During the Past Five Years |
Kevin E. Wolf 1969 | President Since January 2013 | Vice President of The Ultimus Group, LLC; Executive Vice President, Head of Fund Administration and Product (since 2019) and President (2012 - 2019) of Ultimus Fund Solutions, LLC (formerly, Gemini Fund Services, LLC). | N/A | N/A |
Richard Malinowski 1983 | Secretary Since January 2018 | Senior Vice President and Senior Managing Counsel (since February 2020), Senior Vice President Legal Administration (April 2017 to February 2020) and Vice President and Counsel (April 2016 to April 2017) of Ultimus Fund Solutions, LLC (formerly, Gemini Fund Services, LLC). | N/A | N/A |
Erik Naviloff
1968 | Treasurer Since January 2013 | Vice President of Ultimus Fund Solutions, LLC (formerly, Gemini Fund Services, LLC) (since 2011). | N/A | N/A |
| Jared Lahman 1986 | Anti-Money Laundering Officer since January 2022 | Compliance Analyst, Northern Lights Compliance Services, LLC (since January 2019); Manager, Fund Accounting, Gemini Fund Services, LLC (January 2014 to December 2018). | N/A | N/A |
Emile R. Molineaux
1962 | Chief Compliance Officer Since May 2011 | Senior Compliance Officer and CCO of Various clients of Northern Lights Compliance Services, LLC (since 2011). | N/A | N/A |
| * | The term of office for each Trustee and Officer listed above will continue indefinitely. |
| ** | As of May 31, 2022, the Trust was comprised of 21 active portfolios managed by unaffiliated investment advisers. The term “Fund Complex” applies only to the Funds and not to any other series of the Trust. The Funds do not hold themselves out as related to any other series within the Trust for investment purposes, nor do they share the same investment adviser with any other series. |
Privacy Policy
Rev. May 2021
| FACTS | WHAT DOES NORTHERN LIGHTS FUND TRUST II (“NLFT II”) DO WITH YOUR PERSONAL INFORMATION? |
| Why? | Financial companies choose how they share your personal information. Federal law gives consumers the right to limit some but not all sharing. Federal law also requires us to tell you how we collect, share, and protect your personal information. Please read this notice carefully to understand what we do. |
| What? | The types of personal information we collect and share depend on the product or service you have with us. This information can include:
|
● Social Security number ● Employment information ● Account balances | ● Account transactions ● Income ● Investment experience |
| When you are no longer our customer, we continue to share your information as described in this notice. |
| How? | All financial companies need to share a customer’s personal information to run their everyday business - to process transactions, maintain customer accounts, and report to credit bureaus. In the section below, we list the reasons financial companies can share their customer’s personal information; the reasons NLFT II chooses to share; and whether you can limit this sharing. |
| | | |
| Reasons we can share your personal information | Does NLFT II
share? | Can you limit
this sharing? |
For our everyday business purposes —
such as to process your transactions, maintain your account(s), respond to court orders and legal investigations, or report to credit bureaus
| Yes | No |
For our marketing purposes —
to offer our products and services to you
| Yes | No |
For joint marketing with other financial companies
| Yes | No |
For our affiliates’ everyday business purposes —
information about your transactions and experiences
| Yes | No |
For our affiliates’ everyday business purposes —
information about your creditworthiness
| No | We don’t share |
For nonaffiliates to market to you
| No | We don’t share |
| Questions? | Call 1-631-490-4300 |
| Who we are |
| Who is providing this notice? | Northern Lights Fund Trust II |
| What we do |
| How does NLFT II protect my personal information? | To protect your personal information from unauthorized access and use, we use security measures that comply with federal law. These measures include computer safeguards and secured files and buildings.
|
| How does NLFT II collect my personal information? | We collect your personal information, for example, when you
|
● open an account ● give us your income information ● provide employment information | ● provide account information ● give us your contact information |
| We also collect your personal information from others, such as credit bureaus, affiliates, or other companies. |
| Why can’t I limit all sharing? | Federal law gives you the right to limit only ● sharing for affiliates’ everyday business purposes—information about your creditworthiness ● affiliates from using your information to market to you ● sharing for nonaffiliates to market to you State laws and individual companies may give you additional rights to limit sharing. |
| Definitions |
| Affiliates | Companies related by common ownership or control. They can be financial and nonfinancial companies. ● NLFT II has no affiliates. |
| Nonaffiliates | Companies not related by common ownership or control. They can be financial and nonfinancial companies. ● NLFT II does not share with nonaffiliates so they can market to you. |
| Joint marketing | A formal agreement between nonaffiliated financial companies that together market financial products and services to you. ● Our joint marketing partners include other financial service companies. |
PROXY VOTING POLICY
Information regarding how the Fund voted proxies relating to portfolio securities for the most recent twelve month period ended June 30 as well as a description of the policies and procedures that the Fund uses to determine how to vote proxies is available without charge, upon request, by calling 1-855 -294-7540 or by referring to the Securities and Exchange Commission’s (“SEC”) website at http://www.sec.gov.
PORTFOLIO HOLDINGS
Funds file a complete schedule of portfolio holdings with the Securities and Exchange Commission (the “SEC”) for the first and third quarters of each fiscal year as an exhibit to its reports on Form N-PORT, within sixty days after the end of the period. Form N-PORT reports are available at the SEC’s website at www.sec.gov.
| INVESTMENT ADVISOR |
| Longboard Asset Management, LP |
| P.O. BOX 97730 |
| Phoenix, AZ 85060-7730 |
| |
| ADMINISTRATOR |
| Ultimus Fund Solutions, LLC |
| 4221 North 203rd Street, Suite 100 |
| Elkhorn, Nebraska 68022-3474 |
| |
| |
| LBFS-AR22 |
Item 2. Code of Ethics.
(a) As of the end of the period covered by this report, the registrant has adopted a code of ethics that applies to the registrant's principal executive officer, principal financial officer, principal accounting officer or controller, or persons performing similar functions, regardless of whether these individuals are employed by the registrant or a third party.
(b) For purposes of this item, “code of ethics” means written standards that are reasonably designed to deter wrongdoing and to promote:
| (1) | Honest and ethical conduct, including the ethical handling of actual or apparent conflicts of interest between personal and professional relationships; |
| (2) | Full, fair, accurate, timely, and understandable disclosure in reports and documents that a registrant files with, or submits to, the Commission and in other public communications made by the registrant; |
(3) Compliance with applicable governmental laws, rules, and regulations;
| (4) | The prompt internal reporting of violations of the code to an appropriate person or persons identified in the code; and |
(5) Accountability for adherence to the code.
(c) Amendments: During the period covered by the report, there have not been any amendments to the provisions of the code of ethics.
(d) Waivers: During the period covered by the report, the registrant has not granted any express or implicit waivers from the provisions of the code of ethics.
(e) The Code of Ethics is not posted on Registrant’ website.
(f) A copy of the Code of Ethics is attached as an exhibit.
Item 3. Audit Committee Financial Expert.
(a) The Registrant’s board of trustees has determined that Keith Rhoades is an audit committee financial expert, as defined in Item 3 of Form N-CSR. Mr. Rhoades is independent for purposes of this Item.
Item 4. Principal Accountant Fees and Services.
2022 - $ 42,000
2021 - $ 41,500
2022 - None
2021 - None
2022 – $ 7,500
2021 – $ 7,500
Preparation of Federal & State income tax returns, assistance with calculation of required income, capital gain and excise distributions and preparation of Federal excise tax returns.
2022 - None
2021 - None
| (e) | (1) Audit Committee’s Pre-Approval Policies |
The registrant’s Audit Committee is required to pre-approve all audit services and, when appropriate, any non-audit services (including audit-related, tax and all other services) to the registrant. The registrant’s Audit Committee also is required to pre-approve, when appropriate, any non-audit services (including audit-related, tax and all other services) to its adviser, or any entity controlling, controlled by or under common control with the adviser that provides ongoing services to the registrant, to the extent that the services may be determined to have an impact on the operations or financial reporting of the registrant. Services are reviewed on an engagement by engagement basis by the Audit Committee.
| (2) | Percentages of Services Approved by the Audit Committee |
2022 2021
Audit-Related Fees: 0.00% 0.00%
Tax Fees: 0.00% 0.00%
All Other Fees: 0.00% 0.00%
| (f) | During the audit of registrant's financial statements for the most recent fiscal year, less than 50 percent of the hours expended on the principal accountant's engagement were attributed to work performed by persons other than the principal accountant's full-time, permanent employees. |
| (g) | The aggregate non-audit fees billed by the registrant's accountant for services rendered to the registrant, and rendered to the registrant's investment adviser (not including any sub-adviser whose role is primarily portfolio management and is subcontracted with or overseen by another investment adviser), and any entity controlling, controlled by, or under common control with the adviser that provides ongoing services to the registrant: |
2022 - $ 7,500
2021 - $ 7,500
(h) The registrant's audit committee has considered whether the provision of non-audit services to the registrant's investment adviser (not including any sub-adviser whose role is primarily portfolio management and is subcontracted with or overseen by another investment adviser), and any entity controlling, controlled by, or under common control with the investment adviser that provides ongoing services to the registrant, that were not pre-approved pursuant to paragraph (c)(7)(ii) of Rule 2-01 of Regulation S-X, is compatible with maintaining the principal accountant's independence.
Item 5. Audit Committee of Listed Companies. Not applicable to open-end investment companies.
Item 6. Schedule of Investments. See Item 1.
Item 7. Disclosure of Proxy Voting Policies and Procedures for Closed-End Funds. Not applicable to open-end investment companies.
Item 8. Portfolio Managers of Closed-End Management Investment Companies. Not applicable to open-end investment companies.
Item 9. Purchases of Equity Securities by Closed-End Funds. Not applicable to open-end investment companies.
Item 10. Submission of Matters to a Vote of Security Holders. None
Item 11. Controls and Procedures.
(a) Based on an evaluation of the Registrant’s disclosure controls and procedures as of a date within 90 days of filing date of this Form N-CSR, the principal executive officer and principal financial officer of the Registrant have concluded that the disclosure controls and procedures of the Registrant are reasonably designed to ensure that the information required in filings on Form N-CSR is recorded, processed, summarized, and reported by the filing date, including that information required to be disclosed is accumulated and communicated to the Registrant’s management, including the Registrant’s principal executive officer and principal financial officer, as appropriate to allow timely decisions regarding required disclosure.
(b) There were no significant changes in the Registrant’s internal control over financial reporting that occurred during the Registrant’s last fiscal half-year that have materially affected, or are reasonably likely to materially affect, the Registrant’s internal control over financial reporting.
Item 12. Disclosure of Securities Lending Activities for Closed-End Management Investment Companies. - Not applicable to open-end investment companies.
Item 13. Exhibits.
(a)(1) Code of Ethics herewith.
(a)(2) Certifications required by Section 302 of the Sarbanes-Oxley Act of 2002 (and Item 11(a)(2) of Form N-CSR) are filed herewith.
(a)(3) Not applicable for open-end investment companies.
(b) Certifications required by Section 906 of the Sarbanes-Oxley Act of 2002 (and Item 11(b) of Form N-CSR) are filed herewith.
SIGNATURES
Pursuant to the requirements of the Securities Exchange Act of 1934 and the Investment Company Act of 1940, the registrant has duly caused this report to be signed on its behalf by the undersigned, thereunto duly authorized.
(Registrant) Northern Lights Fund Trust II
By (Signature and Title)
/s/ Kevin E. Wolf
Kevin E. Wolf, Principal Executive Officer/President
Date 08/08/22
Pursuant to the requirements of the Securities Exchange Act of 1934 and the Investment Company Act of 1940, this report has been signed below by the following persons on behalf of the registrant and in the capacities and on the dates indicated.
By (Signature and Title)
/s/ Kevin E. Wolf
Kevin E. Wolf, Principal Executive Officer/President
Date 08/08/22
By (Signature and Title)
/s/ Erik Naviloff
Erik Naviloff, Principal Financial Officer/Treasurer
Date 08/08/22