united states
securities and exchange commission
washington, d.c. 20549
form n-csr
certified shareholder report of registered management
investment companies
Investment Company Act file number 811-22549
Northern Lights Fund Trust II
(Exact name of registrant as specified in charter)
225 Pictoria Drive , Suite 450,Cincinnati, Ohio 45246
(Address of principal executive offices) (Zip code)
Eric Kane, Ultimus Fund Solutions, LLC.
80 Arkay Drive, Hauppauge, NY 11788
(Name and address of agent for service)
Registrant's telephone number, including area code: 631-470-2600
Date of fiscal year end: 8/31
Date of reporting period: 8/31/22
Item 1. Reports to Stockholders.

LifeGoal Home Down Payment Investment ETF
(Symbol: HOM)
LifeGoal Conservative Wealth Builder ETF
(Symbol: SAVN)
LifeGoal Wealth Builder ETF
(Symbol: WLTH)
Exchange : NYSE Arca, Inc.
Annual Report
August 31, 2022
| | |
| | |
| | |
| | |
| | |
| | |
| Advised by: | Sub-Advised by: |
| LifeGoal Investments, LLC | Penserra Capital Management LLC |
| 5 Spring Street, # 202 | 4 Orinda Way, Suite 100 |
| Saratoga Springs, NY 12866 | Orinda, CA 94563 |
| | |
www.lifegoalinvestments.com
(888) 920-7275
This report and the financial statements contained herein are submitted for the general information of shareholders and are not authorized for distribution to prospective investors unless preceded or accompanied by an effective prospectus. Nothing herein contained is to be considered an offer of sale or solicitation of an offer to buy shares of the LifeGoal ETF’s. Such offering is made only by prospectus, which includes details as to offering price and other material information.
Distributed by Foreside Fund Services, LLC
Member FINRA
Annual Shareholder Report
August 31, 2022
It is our pleasure to present the annual report for the LifeGoal Investments ETFs for the fiscal period ended August 31, 2022. On behalf of the entire team at LifeGoal Investments, we would like to thank you for your investment in our ETFs.
Performance
Throughout the fiscal period ending August 31, 2022 the stock, bonds, real estate, commodity, and currency markets have been extremely volatile with poor performance across most asset classes. The US Federal Reserve is tightening monetary policy to fight off inflation and the impact on most asset classes is a general re-rating of prices lower.
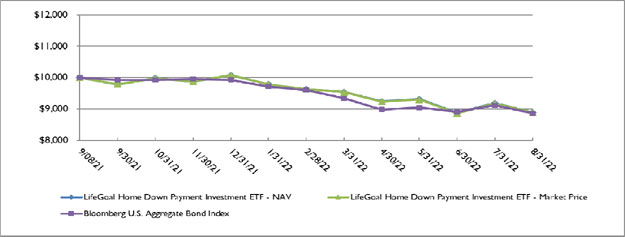
LifeGoal Home Down Payment Investment ETF (HOM) – HOM modestly outperformed its index, the US Bloomberg Aggregate Bond Index since inception. HOM has slightly less than a one-year track record so we can’t speak to the one year performance yet. HOM does not have an appropriate Morningstar Category.
LifeGoal Home Down Payment Investment ETF (HOM) performance since inception (9/8/21) = -11.11% US Bloomberg Aggregate Bond Index since (9/8/21) = -11.39%
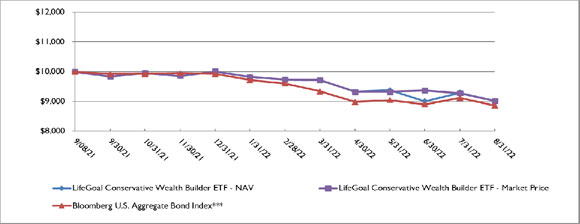
LifeGoal Conservative Wealth Builder ETF (SAVN) – SAVN substantially outperformed its index, US Bloomberg Aggregate Bond Index over this period and since inception. SAVN also substantially outperformed the SP500 index over this period and since inception. SAVN has slightly less than a one-year track record so we can’t speak to the one-year performance yet. SAVN Year to Date performance vs. the Morningstar Category is in the 35th percentile.
LifeGoal Conservative Wealth Builder ETF (SAVN) performance since inception (9/8/21) = -9.84% US Bloomberg Aggregate Bond Index since (9/8/21) = -11.39%
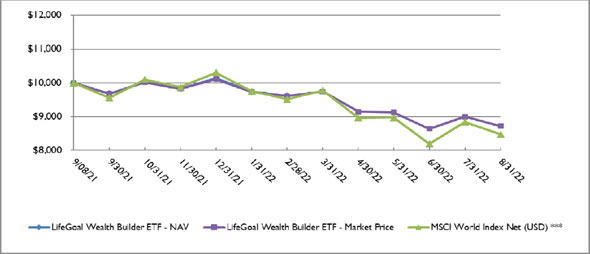
LifeGoal Wealth Builder ETF (WLTH) – WLTH modestly underperformed the US Bloomberg Aggregate Bond Index and the SP 500 Index over this period and since inception. WLTH substantially outperformed the MSCI World Stock index over this period and since inception. WLTH has slightly less than a one-year track record so we can’t speak to the one-year performance yet. WLTH Year to Date performance vs. the Morningstar Category is in the 50th percentile, although LifeGoal believes that WLTH belongs in the Global Allocation Morningstar Category where it would have a higher percentile ranking.
LifeGoal Wealth Builder ETF (WLTH) performance since inception (9/8/21) = -12.81%
US Bloomberg Aggregate Bond Index since (9/8/21) = -11.39%
SP500 Index since (9/8/21) = -12.39%
MSCI World Stock Index (9/8/21) = -15.27%
Market and Fund Performance Commentary
Throughout the fiscal year, the global markets have been challenging for all investors, in all asset classes. This is no surprise as the Federal Reserve is tightening monetary policy, which is causing a rerating of asset prices. As the tightening process runs its course, it is likely the market volatility will normalize. Looking back at the fiscal year, LifeGoal ETFs underlying holdings maintained broad and diversified investment exposure, including HOM, SAVN, and WLTH, which helped our performance. We expect volatility to be the new normal until global inflation is arrested. LifeGoal believes our investment philosophy is well suited for this environment.
LifeGoalInvestments.com
5 Springs Street #202
Saratoga Springs, NY 12866
c/o Ultimus Fund Solutions, LLC
4221 North 203rd Street, Suite 100
Elkhorn, NE 68022
| LifeGoal Home Down Payment Investment ETF |
| PORTFOLIO REVIEW (Unaudited) |
| August 31, 2022 |
| |
The Fund’s performance figures* for the period ended August 31, 2022, as compared to its benchmark:
| | Since Inception** - |
| | August 31, 2022 |
| LifeGoal Home Down Payment Investment ETF - NAV | (11.11)% |
| LifeGoal Home Down Payment Investment ETF - Market Price | (11.11)% |
| Bloomberg U.S. Aggregate Bond Index*** | (11.39)% |
| | |
| * | The Fund’s past performance does not guarantee future results. The investment return and principal value of an investment in the Fund will fluctuate so that an investor’s shares, when redeemed, may be worth more or less than their original cost. The returns shown do not reflect the deduction of taxes a shareholder would pay on Fund distributions, if any, or the redemption of the Fund shares. Current performance of the Fund may be lower or higher than the performance quoted. Performance data current to the most recent month-end may be obtained by visiting www.lifegoalinvestments.com or by calling (888) 920-7275. |
The Fund’s per share net asset value or NAV is the value of one share of the Fund as calculated in accordance with the standard formula for valuing shares. The NAV return is based on the NAV of the Fund and the Market Price Return is based on the Market Price per share of the Fund. Market Price returns are calculated using the closing price and account for distributions from the Fund. Market Price and NAV returns assume that dividends and capital gain distributions have been reinvested in the Fund at Market Price and NAV, respectively. The Fund’s total annual operating expenses, before fee waivers and/or expense reimbursements, is 0.87% per the September 7, 2021 prospectus. After fee waivers and/or expense reimbursements, the Fund’s total annual expenses are 0.60% of net assets per the September 7, 2021 prospectus. The Fund’s total return would have been lower had the adviser not waived a portion of the Fund’s expenses. Please see the Financial Highlights for a more recent expense ratio.
| ** | As of the commencement of operations on September 8, 2021. |
| *** | The Bloomberg U.S. Aggregate Bond Index is a widely recognized, unmanaged index of bond prices. Performance figures include the change in value of the bonds in the index and the reinvestment of interest. The returns shown do not reflect deduction of taxes that a shareholder would pay on Fund distributions or the redemption of Fund shares. Investors cannot invest directly in an index. |
Comparison of the Change in Value of a $10,000 Investment
The Fund’s Top Sectors are as follows:
| Sectors | | % of Net Assets | |
| Exchange-Traded Funds | | | | |
| Fixed Income | | | 61.4 | % |
| Equity | | | 22.3 | % |
| Commodity | | | 4.5 | % |
| Common Stocks | | | | |
| Home Construction | | | 3.3 | % |
| Retail - Discretionary | | | 2.7 | % |
| Retail - Consumer Staples | | | 1.2 | % |
| Metals & Mining | | | 1.1 | % |
| Construction Materials | | | 0.7 | % |
| Forestry, Paper & Wood Products | | | 0.7 | % |
| Transportation & Logistics | | | 0.7 | % |
| Chemicals | | | 0.4 | % |
| Electrical Equipment | | | 0.3 | % |
| Home & Office Products | | | 0.3 | % |
| Other/Cash and Equivalents | | | 0.4 | % |
| | | | 100.0 | % |
| | | | | |
Please refer to the Schedule of Investments in this Annual Report for a detailed listing of the Fund’s holdings.
| LifeGoal Conservative Wealth Builder ETF |
| PORTFOLIO REVIEW (Unaudited) |
| August 31, 2022 |
| |
The Fund’s performance figures* for the period ended August 31, 2022, as compared to its benchmark:
| | Since Inception** - |
| | August 31, 2022 |
| LifeGoal Conservative Wealth Builder ETF - NAV | (9.84)% |
| LifeGoal Conservative Wealth Builder ETF - Market Price | (9.84)% |
| Bloomberg U.S. Aggregate Bond Index*** | (11.39)% |
| | |
| * | The Fund’s past performance does not guarantee future results. The investment return and principal value of an investment in the Fund will fluctuate so that an investor’s shares, when redeemed, may be worth more or less than their original cost. The returns shown do not reflect the deduction of taxes a shareholder would pay on Fund distributions, if any, or the redemption of the Fund shares. Current performance of the Fund may be lower or higher than the performance quoted. Performance data current to the most recent month-end may be obtained by visitingwww.lifegoalinvestments.com or by calling (888) 920-7275. |
The Fund’s per share net asset value or NAV is the value of one share of the Fund as calculated in accordance with the standard formula for valuing shares. The NAV return is based on the NAV of the Fund and the Market Price Return is based on the Market Price per share of the Fund. Market Price returns are calculated using the closing price and account for distributions from the Fund. Market Price and NAV returns assume that dividends and capital gain distributions have been reinvested in the Fund at Market Price and NAV, respectively. The Fund’s total annual operating expenses, before fee waivers and/or expense reimbursements, is 0.82% per the September 7, 2021 prospectus. After fee waivers and/or expense reimbursements, the Fund’s total annual expenses are 0.55% of net assets per the September 7, 2021 prospectus. The Fund’s total return would have been lower had the adviser not waived a portion of the Fund’s expenses. Please see the Financial Highlights for a more recent expense ratio.
| ** | As of the commencement of operations on September 8, 2021. |
| *** | The Bloomberg U.S. Aggregate Bond Index is a widely recognized, unmanaged index of bond prices. Performance figures include the change in value of the bonds in the index and the reinvestment of interest. The returns shown do not reflect deduction of taxes that a shareholder would pay on Fund distributions or the redemption of Fund shares. Investors cannot invest directly in an index. |
Comparison of the Change in Value of a $10,000 Investment
The Fund’s Top Sectors are as follows:
| Sectors | | % of Net Assets | |
| Exchange-Traded Funds | | | | |
| Fixed Income | | | 71.9 | % |
| Equity | | | 16.6 | % |
| Commodity | | | 3.4 | % |
| Common Stocks | | | | |
| Metals & Mining | | | 1.3 | % |
| Retail - Consumer Staples | | | 1.2 | % |
| Oil & Gas Producers | | | 0.9 | % |
| Internet Media & Services | | | 0.8 | % |
| Aerospace & Defense | | | 0.7 | % |
| Transportation & Logistics | | | 0.5 | % |
| Asset Management | | | 0.3 | % |
| Automotive | | | 0.3 | % |
| Biotech & Pharma | | | 0.3 | % |
| Entertainment Content | | | 0.3 | % |
| Other/Cash and Equivalents | | | 1.5 | % |
| | | | 100.0 | % |
| | | | | |
Please refer to the Schedule of Investments in this Annual Report for a detailed listing of the Fund’s holdings.
| LifeGoal Wealth Builder ETF |
| PORTFOLIO REVIEW (Unaudited) |
| August 31, 2022 |
| |
The Fund’s performance figures* for the period ended August 31, 2022, as compared to its benchmark:
| | Since Inception** - |
| | August 31, 2022 |
| LifeGoal Wealth Builder ETF - NAV | (12.81)% |
| LifeGoal Wealth Builder ETF - Market Price | (12.81)% |
| MSCI World Index Net (USD) *** | (15.27)% |
| | |
| * | The Fund’s past performance does not guarantee future results. The investment return and principal value of an investment in the Fund will fluctuate so that an investor’s shares, when redeemed, may be worth more or less than their original cost. The returns shown do not reflect the deduction of taxes a shareholder would pay on Fund distributions, if any, or the redemption of the Fund shares. Current performance of the Fund may be lower or higher than the performance quoted. Performance data current to the most recent month-end may be obtained by visiting www.lifegoalinvestments.com or by calling (888) 920-7275. |
The Fund’s per share net asset value or NAV is the value of one share of the Fund as calculated in accordance with the standard formula for valuing shares. The NAV return is based on the NAV of the Fund and the Market Price Return is based on the Market Price per share of the Fund. Market Price returns are calculated using the closing price and account for distributions from the Fund. Market Price and NAV returns assume that dividends and capital gain distributions have been reinvested in the Fund at Market Price and NAV, respectively. The Fund’s total annual operating expenses, before fee waivers and/or expense reimbursements, is 0.86% per the September 7, 2021 prospectus. After fee waivers and/or expense reimbursements, the Fund’s total annual expenses are 0.59% of net assets per the September 7, 2021 prospectus. The Fund’s total return would have been lower had the adviser not waived a portion of the Fund’s expenses. Please see the Financial Highlights for a more recent expense ratio.
| ** | As of the commencement of operations on September 8, 2021. |
| *** | The MSCI World Index Net (USD) is a broad global equity index that represents large and mid-cap equity performance across all 23 developed markets countries. It covers approximately 85% of the free float-adjusted market capitalization in each country. Investors cannot invest directly in an index. |
Comparison of the Change in Value of a $10,000 Investment
The Fund’s Top Sectors are as follows:
| Sectors | | % of Net Assets | |
| Exchange-Traded Funds | | | | |
| Equity | | | 46.2 | % |
| Fixed Income | | | 36.4 | % |
| Commodity | | | 3.8 | % |
| Common Stocks | | | | |
| Software | | | 2.7 | % |
| Metals & Mining | | | 2.0 | % |
| Automotive | | | 1.3 | % |
| Retail - Consumer Staples | | | 1.3 | % |
| E-Commerce Discretionary | | | 1.0 | % |
| Internet Media & Services | | | 1.0 | % |
| Transportation & Logistics | | | 1.0 | % |
| Aerospace & Defense | | | 0.8 | % |
| Retail - Discretionary | | | 0.8 | % |
| Technology Services | | | 0.8 | % |
| Other/Cash and Equivalents | | | 0.9 | % |
| | | | 100.0 | % |
| | | | | |
Please refer to the Schedule of Investments in this Annual Report for a detailed listing of the Fund’s holdings.
| LIFEGOAL HOME DOWN PAYMENT INVESTMENT ETF |
| SCHEDULE OF INVESTMENTS |
| August 31, 2022 |
| Shares | | | | | Fair Value | |
| | | | | COMMON STOCKS — 11.6% | | | | |
| | | | | CHEMICALS - 0.4% | | | | |
| | 24 | | | Sherwin-Williams Company | | $ | 5,570 | |
| | | | | | | | | |
| | | | | CONSTRUCTION MATERIALS - 0.7% | | | | |
| | 114 | | | Owens Corning | | | 9,317 | |
| | | | | | | | | |
| | | | | ELECTRICAL EQUIPMENT - 0.3% | | | | |
| | 102 | | | Carrier Global Corporation | | | 3,990 | |
| | | | | | | | | |
| | | | | FORESTRY, PAPER & WOOD PRODUCTS - 0.7% | | | | |
| | 192 | | | Trex Company, Inc.(a) | | | 8,984 | |
| | | | | | | | | |
| | | | | HOME & OFFICE PRODUCTS - 0.3% | | | | |
| | 24 | | | Whirlpool Corporation | | | 3,758 | |
| | | | | | | | | |
| | | | | HOME CONSTRUCTION - 3.3% | | | | |
| | 114 | | | DR Horton, Inc. | | | 8,111 | |
| | 138 | | | Lennar Corporation, Class B | | | 8,512 | |
| | 180 | | | Masco Corporation | | | 9,157 | |
| | 162 | | | PulteGroup, Inc. | | | 6,587 | |
| | 204 | | | Toll Brothers, Inc. | | | 8,933 | |
| | | | | | | | 41,300 | |
| | | | | MACHINERY - 0.2% | | | | |
| | 36 | | | Stanley Black & Decker, Inc. | | | 3,172 | |
| | | | | | | | | |
| | | | | METALS & MINING - 1.1% | | | | |
| | 312 | | | Newmont Corporation | | | 12,905 | |
| | | | | | | | | |
| | | | | RETAIL - CONSUMER STAPLES - 1.2% | | | | |
| | 120 | | | Walmart, Inc. | | | 15,906 | |
| | | | | | | | | |
| | | | | RETAIL - DISCRETIONARY - 2.7% | | | | |
| | 60 | | | Floor & Decor Holdings, Inc., Class A(a) | | | 4,882 | |
| | 42 | | | Home Depot, Inc. | | | 12,114 | |
| | 66 | | | Lowe’s Companies, Inc. | | | 12,812 | |
| | | | | | | | | |
See notes to financial statements.
| LIFEGOAL HOME DOWN PAYMENT INVESTMENT ETF |
| SCHEDULE OF INVESTMENTS (Continued) |
| August 31, 2022 |
| Shares | | | | | Fair Value | |
| | | | | COMMON STOCKS — 11.6% (Continued) | | | | |
| | | | | RETAIL - DISCRETIONARY - 2.7% (Continued) | | | | |
| | 36 | | | Williams-Sonoma, Inc. | | $ | 5,355 | |
| | | | | | | | 35,163 | |
| | | | | TRANSPORTATION & LOGISTICS - 0.7% | | | | |
| | 78 | | | CH Robinson Worldwide, Inc. | | | 8,904 | |
| | | | | | | | | |
| | | | | TOTAL COMMON STOCKS (Cost $188,704) | | | 148,969 | |
| | | | | | | | | |
| | | | | EXCHANGE-TRADED FUNDS — 88.2% | | | | |
| | | | | COMMODITY - 4.5% | | | | |
| | 1,074 | | | abrdn Bloomberg All Commodity Strategy K-1 Free | | | 30,169 | |
| | 1,668 | | | Graniteshares Gold Trust(a) | | | 28,256 | |
| | | | | | | | 58,425 | |
| | | | | EQUITY - 22.3% | | | | |
| | 1,764 | | | iShares Core Dividend Growth ETF | | | 86,137 | |
| | 60 | | | iShares ESG MSCI EM Leaders ETF | | | 2,761 | |
| | 324 | | | iShares Global Materials ETF | | | 23,853 | |
| | 714 | | | iShares International Dividend Growth ETF | | | 39,534 | |
| | 522 | | | iShares MSCI Global Min Vol Factor ETF | | | 49,496 | |
| | 768 | | | iShares MSCI USA Small-Cap Min Vol Factor ETF | | | 26,619 | |
| | 360 | | | Utilities Select Sector SPDR Fund | | | 26,762 | |
| | 468 | | | Vanguard Global ex-U.S. Real Estate ETF | | | 20,288 | |
| | 516 | | | WisdomTree Emerging Markets Quality Dividend Growth Fund ARS | | | 11,192 | |
| | | | | | | | 286,642 | |
| | | | | FIXED INCOME - 61.4% | | | | |
| | 4,056 | | | Invesco Taxable Municipal Bond | | | 110,485 | |
| | 2,340 | | | iShares CMBS ETF | | | 111,032 | |
| | 534 | | | iShares ESG Aware USD Corporate Bond ETF | | | 12,298 | |
| | 852 | | | iShares Trust iShares 5-10 Year Investment Grade Corporate Bond ETF | | | 43,341 | |
| | 1,404 | | | Schwab Short-Term U.S. Treasury ETF | | | 68,656 | |
| | 1,188 | | | Schwab US TIPS ETF | | | 66,374 | |
| | 4,542 | | | VanEck J. P. Morgan EM Local Currency Bond ETF | | | 109,417 | |
| | 216 | | | Vanguard Emerging Markets Government Bond ETF | | | 13,310 | |
| | | | | | | | | |
See notes to financial statements.
| LIFEGOAL HOME DOWN PAYMENT INVESTMENT ETF |
| SCHEDULE OF INVESTMENTS (Continued) |
| August 31, 2022 |
| Shares | | | | | Fair Value | |
| | | | | EXCHANGE-TRADED FUNDS — 88.2% (Continued) | | | | |
| | | | | FIXED INCOME - 61.4% (Continued) | | | | |
| | 1,950 | | | Vanguard Intermediate-Term Corporate Bond ETF | | $ | 155,278 | |
| | 1,626 | | | Vanguard Intermediate-Term Treasury ETF | | | 98,210 | |
| | | | | | | | 788,401 | |
| | | | | | | | | |
| | | | | TOTAL EXCHANGE-TRADED FUNDS (Cost $1,223,907) | | | 1,133,468 | |
| | | | | | | | | |
| | | | | TOTAL INVESTMENTS - 99.8% (Cost $1,412,611) | | $ | 1,282,437 | |
| | | | | OTHER ASSETS IN EXCESS OF LIABILITIES - 0.2% | | | 3,120 | |
| | | | | NET ASSETS - 100.0% | | $ | 1,285,557 | |
| | | | | | | | | |
ETF - Exchange-Traded Fund
MSCI - Morgan Stanley Capital International
SPDR - Standard & Poor’s Depositary Receipt
TIPS - Treasury Inflation-Protected Securities
| (a) | Non-income producing security. |
See notes to financial statements.
| LIFEGOAL CONSERVATIVE WEALTH BUILDER ETF |
| SCHEDULE OF INVESTMENTS |
| August 31, 2022 |
| Shares | | | | | Fair Value | |
| | | | | COMMON STOCKS — 8.0% | | | | |
| | | | | AEROSPACE & DEFENSE - 0.7% | | | | |
| | 140 | | | Boeing Company(a) | | $ | 22,435 | |
| | | | | | | | | |
| | | | | ASSET MANAGEMENT - 0.3% | | | | |
| | 14 | | | BlackRock, Inc. | | | 9,329 | |
| | | | | | | | | |
| | | | | AUTOMOTIVE - 0.3% | | | | |
| | 280 | | | Ford Motor Company | | | 4,267 | |
| | 98 | | | General Motors Company | | | 3,745 | |
| | | | | | | | 8,012 | |
| | | | | BANKING - 0.2% | | | | |
| | 56 | | | JPMorgan Chase & Company | | | 6,369 | |
| | | | | | | | | |
| | | | | BIOTECH & PHARMA - 0.3% | | | | |
| | 126 | | | Merck & Company, Inc. | | | 10,755 | |
| | | | | | | | | |
| | | | | CABLE & SATELLITE - 0.1% | | | | |
| | 112 | | | Comcast Corporation, Class A | | | 4,053 | |
| | | | | | | | | |
| | | | | ENTERTAINMENT CONTENT - 0.3% | | | | |
| | 70 | | | Walt Disney Company(a) | | | 7,846 | |
| | | | | | | | | |
| | | | | HOUSEHOLD PRODUCTS - 0.2% | | | | |
| | 84 | | | Colgate-Palmolive Company | | | 6,570 | |
| | | | | | | | | |
| | | | | INTERNET MEDIA & SERVICES - 0.8% | | | | |
| | 238 | | | Alphabet, Inc., Class C(a) | | | 25,978 | |
| | | | | | | | | |
| | | | | LEISURE FACILITIES & SERVICES - 0.3% | | | | |
| | 112 | | | Starbucks Corporation | | | 9,416 | |
| | | | | | | | | |
| | | | | METALS & MINING - 1.3% | | | | |
| | 784 | | | Newmont Corporation | | | 32,426 | |
| | 84 | | | Royal Gold, Inc. | | | 7,720 | |
| | | | | | | | 40,146 | |
| | | | | | | | | |
See notes to financial statements.
| LIFEGOAL CONSERVATIVE WEALTH BUILDER ETF |
| SCHEDULE OF INVESTMENTS (Continued) |
| August 31, 2022 |
| Shares | | | | | Fair Value | |
| | | | | COMMON STOCKS — 8.0% (Continued) | | | | |
| | | | | OIL & GAS PRODUCERS - 0.9% | | | | |
| | 196 | | | Devon Energy Corporation | | $ | 13,842 | |
| | 98 | | | Diamondback Energy, Inc. | | | 13,061 | |
| | | | | | | | 26,903 | |
| | | | | RETAIL - CONSUMER STAPLES - 1.2% | | | | |
| | 294 | | | Walmart, Inc. | | | 38,969 | |
| | | | | | | | | |
| | | | | SEMICONDUCTORS - 0.2% | | | | |
| | 42 | | | Texas Instruments, Inc. | | | 6,938 | |
| | | | | | | | | |
| | | | | SOFTWARE - 0.2% | | | | |
| | 84 | | | Oracle Corporation | | | 6,229 | |
| | | | | | | | | |
| | | | | TECHNOLOGY HARDWARE - 0.2% | | | | |
| | 112 | | | Cisco Systems, Inc. | | | 5,009 | |
| | | | | | | | | |
| | | | | TRANSPORTATION & LOGISTICS - 0.5% | | | | |
| | 112 | | | CH Robinson Worldwide, Inc. | | | 12,785 | |
| | 14 | | | FedEx Corporation | | | 2,951 | |
| | | | | | | | 15,736 | |
| | | | | | | | | |
| | | | | TOTAL COMMON STOCKS (Cost $265,927) | | | 250,693 | |
| | | | | | | | | |
| | | | | EXCHANGE-TRADED FUNDS — 91.9% | | | | |
| | | | | COMMODITY - 3.4% | | | | |
| | 1,694 | | | abrdn Bloomberg All Commodity Strategy K-1 Free | | | 47,584 | |
| | 3,472 | | | Graniteshares Gold Trust(a) | | | 58,816 | |
| | | | | | | | 106,400 | |
| | | | | EQUITY - 16.6% | | | | |
| | 1,736 | | | iShares Core Dividend Growth ETF | | | 84,769 | |
| | 126 | | | iShares ESG MSCI EM Leaders ETF | | | 5,799 | |
| | 560 | | | iShares Global Materials ETF | | | 41,227 | |
| | 2,282 | | | iShares International Dividend Growth ETF | | | 126,355 | |
| | 714 | | | iShares MSCI Global Min Vol Factor ETF | | | 67,701 | |
| | | | | | | | | |
See notes to financial statements.
| LIFEGOAL CONSERVATIVE WEALTH BUILDER ETF |
| SCHEDULE OF INVESTMENTS (Continued) |
| August 31, 2022 |
| Shares | | | | | Fair Value | |
| | | | | EXCHANGE-TRADED FUNDS — 91.9% (Continued) | | | | |
| | | | | EQUITY - 16.6% (Continued) | | | | |
| | 1,792 | | | iShares MSCI USA Small-Cap Min Vol Factor ETF | | $ | 62,111 | |
| | 910 | | | Utilities Select Sector SPDR Fund | | | 67,649 | |
| | 1,386 | | | Vanguard Global ex-U.S. Real Estate ETF | | | 60,083 | |
| | | | | | | | 515,694 | |
| | | | | FIXED INCOME - 71.9% | | | | |
| | 9,576 | | | Invesco Taxable Municipal Bond | | | 260,850 | |
| | 5,460 | | | iShares CMBS ETF | | | 259,077 | |
| | 1,246 | | | iShares ESG Aware USD Corporate Bond ETF | | | 28,695 | |
| | 2,912 | | | iShares Long-Term Corporate Bond ETF | | | 153,783 | |
| | 4,186 | | | Schwab Short-Term U.S. Treasury ETF | | | 204,695 | |
| | 2,772 | | | Schwab US TIPS ETF | | | 154,872 | |
| | 1,862 | | | SPDR Portfolio High Yield Bond ETF | | | 42,509 | |
| | 5,110 | | | VanEck J. P. Morgan EM Local Currency Bond ETF | | | 123,100 | |
| | 3,038 | | | Vanguard Emerging Markets Government Bond ETF | | | 187,202 | |
| | 3,388 | | | Vanguard Intermediate-Term Corporate Bond ETF | | | 269,786 | |
| | 6,972 | | | Vanguard Intermediate-Term Treasury ETF | | | 421,109 | |
| | 1,708 | | | Vanguard Long-Term Corporate Bond ETF | | | 137,187 | |
| | | | | | | | 2,242,865 | |
| | | | | | | | | |
| | | | | TOTAL EXCHANGE-TRADED FUNDS (Cost $2,969,268) | | | 2,864,959 | |
| | | | | | | | | |
| | | | | TOTAL INVESTMENTS - 99.9% (Cost $3,235,195) | | $ | 3,115,652 | |
| | | | | OTHER ASSETS IN EXCESS OF LIABILITIES - 0.1% | | | 2,722 | |
| | | | | NET ASSETS - 100.0% | | $ | 3,118,374 | |
| | | | | | | | | |
ETF - Exchange-Traded Fund
MSCI - Morgan Stanley Capital International
SPDR - Standard & Poor’s Depositary Receipt
TIPS -Treasury Inflation-Protected Securities
| (a) | Non-income producing security. |
See notes to financial statements.
| LIFEGOAL WEALTH BUILDER ETF |
| SCHEDULE OF INVESTMENTS |
| August 31, 2022 |
| Shares | | | | | Fair Value | |
| | | | | COMMON STOCKS — 13.3% | | | | |
| | | | | AEROSPACE & DEFENSE - 0.8% | | | | |
| | 198 | | | Boeing Company(a) | | $ | 31,730 | |
| | | | | | | | | |
| | | | | ASSET MANAGEMENT - 0.6% | | | | |
| | 36 | | | BlackRock, Inc. | | | 23,990 | |
| | | | | | | | | |
| | | | | AUTOMOTIVE - 1.3% | | | | |
| | 1,368 | | | Ford Motor Company | | | 20,848 | |
| | 666 | | | General Motors Company | | | 25,448 | |
| | | | | | | | 46,296 | |
| | | | | E-COMMERCE DISCRETIONARY - 1.0% | | | | |
| | 306 | | | Amazon.com, Inc.(a) | | | 38,792 | |
| | | | | | | | | |
| | | | | INTERNET MEDIA & SERVICES - 1.0% | | | | |
| | 360 | | | Alphabet, Inc., Class C(a) | | | 39,294 | |
| | | | | | | | | |
| | | | | METALS & MINING - 2.0% | | | | |
| | 1,026 | | | Newmont Corporation | | | 42,436 | |
| | 378 | | | Royal Gold, Inc. | | | 34,738 | |
| | | | | | | | 77,174 | |
| | | | | RETAIL - CONSUMER STAPLES - 1.3% | | | | |
| | 360 | | | Walmart, Inc. | | | 47,718 | |
| | | | | | | | | |
| | | | | RETAIL - DISCRETIONARY - 0.8% | | | | |
| | 108 | | | Home Depot, Inc. (The) | | | 31,149 | |
| | | | | | | | | |
| | | | | SOFTWARE - 2.7% | | | | |
| | 144 | | | Microsoft Corporation | | | 37,652 | |
| | 486 | | | Oracle Corporation | | | 36,037 | |
| | 162 | | | Salesforce, Inc.(a) | | | 25,291 | |
| | | | | | | | 98,980 | |
| | | | | TECHNOLOGY SERVICES - 0.8% | | | | |
| | 90 | | | S&P Global, Inc. | | | 31,696 | |
| | | | | | | | | |
See notes to financial statements.
| LIFEGOAL WEALTH BUILDER ETF |
| SCHEDULE OF INVESTMENTS (Continued) |
| August 31, 2022 |
| Shares | | | | | Fair Value | |
| | | | | COMMON STOCKS — 13.3% (Continued) | | | | |
| | | | | TRANSPORTATION & LOGISTICS - 1.0% | | | | |
| | 306 | | | CH Robinson Worldwide, Inc. | | $ | 34,929 | |
| | | | | | | | | |
| | | | | | | | | |
| | | | | TOTAL COMMON STOCKS (Cost $554,514) | | | 501,748 | |
| | | | | | | | | |
| | | | | EXCHANGE-TRADED FUNDS — 86.4% | | | | |
| | | | | COMMODITY - 3.8% | | | | |
| | 2,772 | | | abrdn Bloomberg All Commodity Strategy K-1 Free | | | 77,866 | |
| | 3,942 | | | Graniteshares Gold Trust(a) | | | 66,777 | |
| | | | | | | | 144,643 | |
| | | | | EQUITY - 46.2% | | | | |
| | 4,680 | | | iShares Core Dividend Growth ETF | | | 228,524 | |
| | 810 | | | iShares Global Materials ETF | | | 59,632 | |
| | 1,548 | | | iShares International Dividend Growth ETF | | | 85,713 | |
| | 4,374 | | | iShares MSCI Global Min Vol Factor ETF | | | 414,743 | |
| | 8,766 | | | JPMorgan Equity Premium Income ETF | | | 484,409 | |
| | 1,476 | | | Utilities Select Sector SPDR Fund | | | 109,726 | |
| | 3,132 | | | Vanguard Global ex-U.S. Real Estate ETF | | | 135,772 | |
| | 810 | | | Vanguard Real Estate ETF | | | 75,338 | |
| | 6,714 | | | WisdomTree Emerging Markets Quality Dividend Growth Fund | | | 145,627 | |
| | | | | | | | 1,739,484 | |
| | | | | FIXED INCOME - 36.4% | | | | |
| | 11,934 | | | Invesco Taxable Municipal Bond | | | 325,082 | |
| | 2,988 | | | iShares Long-Term Corporate Bond ETF | | | 157,796 | |
| | 3,564 | | | Schwab US TIPS ETF | | | 199,121 | |
| | 9,504 | | | VanEck J. P. Morgan EM Local Currency Bond ETF | | | 228,951 | |
| | 4,266 | | | Vanguard Emerging Markets Government Bond ETF | | | 262,871 | |
| | 2,430 | | | Vanguard Long-Term Corporate Bond ETF | | | 195,178 | |
| | | | | | | | 1,368,999 | |
| | | | | | | | | |
See notes to financial statements.
| LIFEGOAL WEALTH BUILDER ETF |
| SCHEDULE OF INVESTMENTS (Continued) |
| August 31, 2022 |
| Shares | | | | | Fair Value | |
| | | | | EXCHANGE-TRADED FUNDS — 86.4% (Continued) | | | | |
| | | | | | | | | |
| | | | | | | | | |
| | | | | TOTAL EXCHANGE-TRADED FUNDS (Cost $3,425,713) | | $ | 3,253,126 | |
| | | | | | | | | |
| | | | | TOTAL INVESTMENTS - 99.7% (Cost $3,980,227) | | $ | 3,754,874 | |
| | | | | OTHER ASSETS IN EXCESS OF LIABILITIES - 0.3% | | | 10,083 | |
| | | | | NET ASSETS - 100.0% | | $ | 3,764,957 | |
| | | | | | | | | |
ETF - Exchange-Traded Fund
MSCI - Morgan Stanley Capital International
SPDR - Standard & Poor’s Depositary Receipt
TIPS - Treasury Inflation-Protected Securities
| (a) | Non-income producing security. |
See notes to financial statements.
| The LifeGoal ETFs |
| STATEMENTS OF ASSETS AND LIABILITIES |
| August 31, 2022 |
| | | LifeGoal Home | | | LifeGoal | | | | |
| | | Down Payment | | | Conservative Wealth | | | LifeGoal Wealth | |
| | | Investment ETF | | | Builder ETF | | | Builder ETF | |
| ASSETS | | | | | | | | | | | | |
| Investment securities: | | | | | | | | | | | | |
| At cost | | $ | 1,412,611 | | | $ | 3,235,195 | | | $ | 3,980,227 | |
| At value | | $ | 1,282,437 | | | $ | 3,115,652 | | | $ | 3,754,874 | |
| Cash | | | 14,475 | | | | 17,801 | | | | 19,233 | |
| Receivable for investments sold | | | 215,472 | | | | — | | | | — | |
| Due from Adviser | | | 49,549 | | | | 45,743 | | | | 47,597 | |
| Dividends receivable | | | 224 | | | | 216 | | | | 892 | |
| TOTAL ASSETS | | | 1,562,157 | | | | 3,179,412 | | | | 3,822,596 | |
| | | | | | | | | | | | | |
| LIABILITIES | | | | | | | | | | | | |
| Payable for Fund shares repurchased | | | 215,472 | | | | — | | | | — | |
| Payable to related parties | | | 22,286 | | | | 21,121 | | | | 21,860 | |
| Custody fees payable | | | 10,710 | | | | 10,662 | | | | 8,977 | |
| Accrued expenses and other liabilities | | | 7,489 | | | | 8,553 | | | | 6,165 | |
| Audit fees payable | | | 15,457 | | | | 15,461 | | | | 15,450 | |
| Transfer agent fees payable | | | 5,186 | | | | 5,241 | | | | 5,187 | |
| TOTAL LIABILITIES | | | 276,600 | | | | 61,038 | | | | 57,639 | |
| NET ASSETS | | $ | 1,285,557 | | | $ | 3,118,374 | | | $ | 3,764,957 | |
| | | | | | | | | | | | | |
| Net Assets Consist Of: | | | | | | | | | | | | |
| Paid in capital | | $ | 1,487,174 | | | $ | 3,318,713 | | | $ | 4,086,959 | |
| Accumulated deficit | | | (201,617 | ) | | | (200,339 | ) | | | (322,002 | ) |
| NET ASSETS | | $ | 1,285,557 | | | $ | 3,118,374 | | | $ | 3,764,957 | |
| | | | | | | | | | | | | |
| Net Asset Value Per Share: | | | | | | | | | | | | |
| Net Assets | | $ | 1,285,557 | | | $ | 3,118,374 | | | $ | 3,764,957 | |
| Shares of beneficial interest outstanding ($0 par value, unlimited shares authorized) | | | 150,000 | | | | 350,000 | | | | 450,000 | |
| Net asset value, offering and redemption price per share Assets ÷ Shares Outstanding) | | $ | 8.57 | | | $ | 8.91 | | | $ | 8.37 | |
| | | | | | | | | | | | | |
See notes to financial statements.
| The LifeGoal ETFs |
| STATEMENTS OF OPERATIONS |
| For the Period Ended August 31, 2022 * |
| | | LifeGoal Home | | | LifeGoal | | | | |
| | | Down Payment | | | Conservative | | | LifeGoal Wealth | |
| | | Investment ETF | | | Wealth Builder ETF | | | Builder ETF | |
| INVESTMENT INCOME | | | | | | | | | | | | |
| Dividends | | $ | 40,101 | | | $ | 39,787 | | | $ | 75,002 | |
| TOTAL INVESTMENT INCOME | | | 40,101 | | | | 39,787 | | | | 75,002 | |
| | | | | | | | | | | | | |
| EXPENSES | | | | | | | | | | | | |
| Investment advisory fees | | | 5,427 | | | | 5,538 | | | | 9,359 | |
| Administrative services | | | 59,675 | | | | 59,530 | | | | 59,683 | |
| Legal fees | | | 27,130 | | | | 25,354 | | | | 26,976 | |
| Trustees fees and expenses | | | 21,419 | | | | 21,578 | | | | 22,262 | |
| Custodian fees | | | 20,213 | | | | 19,665 | | | | 18,480 | |
| Transfer agent fees | | | 10,317 | | | | 10,358 | | | | 10,313 | |
| Professional fees | | | 14,349 | | | | 12,360 | | | | 15,726 | |
| Audit fees | | | 15,457 | | | | 15,461 | | | | 15,450 | |
| Exchange listing fees | | | 9,500 | | | | 9,500 | | | | 9,500 | |
| Printing and postage expenses | | | 6,088 | | | | 7,073 | | | | 9,535 | |
| Insurance expense | | | 521 | | | | 521 | | | | 521 | |
| Other Expenses | | | 4,449 | | | | 2,861 | | | | 1,067 | |
| TOTAL EXPENSES | | | 194,545 | | | | 189,799 | | | | 198,872 | |
| | | | | | | | | | | | | |
| Less: Fees waived/expenses reimbursed by the Adviser | | | (189,106 | ) | | | (184,230 | ) | | | (189,466 | ) |
| NET EXPENSES | | | 5,439 | | | | 5,569 | | | | 9,406 | |
| | | | | | | | | | | | | |
| NET INVESTMENT INCOME | | | 34,662 | | | | 34,218 | | | | 65,596 | |
| | | | | | | | | | | | | |
| REALIZED AND UNREALIZED LOSS ON INVESTMENTS | | | | | | | | | | | | |
| Net realized loss on: | | | | | | | | | | | | |
| In-kind redemptions | | | (5,661 | ) | | | (2,567 | ) | | | (4,912 | ) |
| Investments | | | (72,863 | ) | | | (84,776 | ) | | | (96,664 | ) |
| Long-term capital gains distributions from underlying investment companies | | | 1,109 | | | | 852 | | | | — | |
| | | | (77,415 | ) | | | (86,491 | ) | | | (101,576 | ) |
| Net change in unrealized depreciation on: | | | | | | | | | | | | |
| Investments | | | (130,174 | ) | | | (119,543 | ) | | | (225,353 | ) |
| | | | (130,174 | ) | | | (119,543 | ) | | | (225,353 | ) |
| | | | | | | | | | | | | |
| NET REALIZED AND UNREALIZED LOSS ON INVESTMENTS | | | (207,589 | ) | | | (206,034 | ) | | | (326,929 | ) |
| | | | | | | | | | | | | |
| NET DECREASE IN NET ASSETS RESULTING FROM OPERATIONS | | $ | (172,927 | ) | | $ | (171,816 | ) | | $ | (261,333 | ) |
| | | | | | | | | | | | | |
| * | The LifeGoal ETFs commenced operations on September 8, 2021. |
See notes to financial statements.
| LifeGoal Home Down Payment Investment ETF |
| STATEMENT OF CHANGES IN NET ASSETS |
| | | Period Ended | |
| | | August 31, 2022 * | |
| FROM OPERATIONS | | | | |
| Net investment income | | $ | 34,662 | |
| Net realized loss on investments | | | (78,524 | ) |
| Long-term capital gains distributions from underlying investment companies | | | 1,109 | |
| Net change in unrealized depreciation on investments | | | (130,174 | ) |
| Net decrease in net assets resulting from operations | | | (172,927 | ) |
| | | | | |
| DISTRIBUTIONS TO SHAREHOLDERS | | | | |
| Total distributions paid | | | (34,612 | ) |
| Net decrease in net assets resulting from distributions to shareholders | | | (34,612 | ) |
| | | | | |
| FROM SHARES OF BENEFICIAL INTEREST | | | | |
| Proceeds from shares sold | | | 2,167,241 | |
| Cost of shares redeemed | | | (674,145 | ) |
| Net increase in net assets resulting from shares of beneficial interest | | | 1,493,096 | |
| | | | | |
| TOTAL INCREASE IN NET ASSETS | | | 1,285,557 | |
| | | | | |
| NET ASSETS | | | | |
| Beginning of Period | | | — | |
| End of Period | | $ | 1,285,557 | |
| | | | | |
| SHARE ACTIVITY | | | | |
| Shares Sold | | | 225,000 | |
| Shares Redeemed | | | (75,000 | ) |
| Net increase in shares of beneficial interest outstanding | | | 150,000 | |
| | | | | |
| * | LifeGoal Home Down Payment Investment ETF commenced operations on September 8, 2021. |
See notes to financial statements.
| LifeGoal Conservative Wealth Builder ETF |
| STATEMENT OF CHANGES IN NET ASSETS |
| | | Period Ended | |
| | | August 31, 2022 * | |
| FROM OPERATIONS | | | | |
| Net investment income | | $ | 34,218 | |
| Net realized loss on investments | | | (87,343 | ) |
| Long-term capital gains distributions from underlying investment companies | | | 852 | |
| Net change in unrealized depreciation on investments | | | (119,543 | ) |
| Net decrease in net assets resulting from operations | | | (171,816 | ) |
| | | | | |
| DISTRIBUTIONS TO SHAREHOLDERS | | | | |
| Total distributions paid | | | (34,085 | ) |
| Net decrease in net assets resulting from distributions to shareholders | | | (34,085 | ) |
| | | | | |
| FROM SHARES OF BENEFICIAL INTEREST | | | | |
| Proceeds from shares sold | | | 3,554,972 | |
| Cost of shares redeemed | | | (230,697 | ) |
| Net increase in net assets resulting from shares of beneficial interest | | | 3,324,275 | |
| | | | | |
| TOTAL INCREASE IN NET ASSETS | | | 3,118,374 | |
| | | | | |
| NET ASSETS | | | | |
| Beginning of Period | | | — | |
| End of Period | | $ | 3,118,374 | |
| | | | | |
| SHARE ACTIVITY | | | | |
| Shares Sold | | | 375,000 | |
| Shares Redeemed | | | (25,000 | ) |
| Net increase in shares of beneficial interest outstanding | | | 350,000 | |
| | | | | |
| * | LifeGoal Conservative Wealth Builder ETF commenced operations on September 8, 2021. |
See notes to financial statements.
| LifeGoal Wealth Builder ETF |
| STATEMENT OF CHANGES IN NET ASSETS |
| | | Period Ended | |
| | | August 31, 2022 * | |
| FROM OPERATIONS | | | | |
| Net investment income | | $ | 65,596 | |
| Net realized loss on investments | | | (101,576 | ) |
| Net change in unrealized depreciation on investments | | | (225,353 | ) |
| Net decrease in net assets resulting from operations | | | (261,333 | ) |
| | | | | |
| DISTRIBUTIONS TO SHAREHOLDERS | | | | |
| Total distributions paid | | | (65,620 | ) |
| Net decrease in net assets resulting from distributions to shareholders | | | (65,620 | ) |
| | | | | |
| FROM SHARES OF BENEFICIAL INTEREST | | | | |
| Proceeds from shares sold | | | 4,332,838 | |
| Cost of shares redeemed | | | (240,928 | ) |
| Net increase in net assets resulting from shares of beneficial interest | | | 4,091,910 | |
| | | | | |
| TOTAL INCREASE IN NET ASSETS | | | 3,764,957 | |
| | | | | |
| NET ASSETS | | | | |
| Beginning of Period | | | — | |
| End of Period | | $ | 3,764,957 | |
| | | | | |
| SHARE ACTIVITY | | | | |
| Shares Sold | | | 475,000 | |
| Shares Redeemed | | | (25,000 | ) |
| Net increase in shares of beneficial interest outstanding | | | 450,000 | |
| | | | | |
| * | LifeGoal Wealth Builder ETF commenced operations on September 8, 2021. |
See notes to financial statements.
| LifeGoal Home Down Payment Investment ETF |
| FINANCIAL HIGHLIGHTS |
| |
| Per Share Data and Ratios for a Share of Beneficial Interest Outstanding Throughout the Period |
| | | Period Ended | |
| | | August 31, 2022 (1) | |
| Net asset value, beginning of period | | $ | 9.89 | |
| | | | | |
| Activity from investment operations: | | | | |
| Net investment income (2) | | | 0.25 | |
| Net realized and unrealized loss on investments | | | (1.33 | ) |
| Total from investment operations | | | (1.08 | ) |
| | | | | |
| Less distributions from: | | | | |
| Net investment income | | | (0.24 | ) |
| Total distributions | | | (0.24 | ) |
| | | | | |
| Net asset value, end of period | | $ | 8.57 | |
| | | | | |
| Market price, end of period | | $ | 8.57 | |
| | | | | |
| Total return (3)(4) | | | (11.11 | )% |
| | | | | |
| Total Return-Market Price (3)(4) | | | (11.11 | )% |
| | | | | |
| Net assets, at end of period (000s) | | $ | 1,286 | |
| | | | | |
| Ratio of gross expenses to average net assets (5)(6)(7) | | | 15.74 | % |
| Ratio of net expenses to average net assets (5)(6) | | | 0.44 | % |
| Ratio of net investment income to average net assets (5) | | | 2.80 | % |
| Portfolio Turnover Rate (4)(8) | | | 142 | % |
| | | | | |
| (1) | LifeGoal Home Down Payment Investment ETF commenced operations on September 8, 2021. |
| (2) | Per share amounts calculated using the average shares method, which more appropriately presents the per share data for the period. |
| (3) | Total return is calculated assuming a purchase of shares at net asset value on the first day and a sale at net asset value on the last day of the period. Distributions are assumed, for the purpose of this calculation, to be reinvested at the ex-dividend date net asset value per share on their respective payment dates. |
| (6) | Does not include the Fund’s share of the expenses of the underlying investment companies in which the Fund invests. |
| (7) | Represents the ratio of expenses to average net assets absent of fee waviers and/or expense reimbursements by LifeGoal Investments, LLC. |
| (8) | Portfolio turnover rate excludes portfolio securities received or delivered as a result of processing capital share transactions in Creation Units. |
See notes to financial statements.
| LifeGoal Conservative Wealth Builder ETF |
| FINANCIAL HIGHLIGHTS |
| |
| Per Share Data and Ratios for a Share of Beneficial Interest Outstanding Throughout the Period |
| | | Period Ended | |
| | | August 31, 2022 (1) | |
| Net asset value, beginning of period | | $ | 10.13 | |
| | | | | |
| Activity from investment operations: | | | | |
| Net investment income (2) | | | 0.22 | |
| Net realized and unrealized loss on investments | | | (1.20 | ) |
| Total from investment operations | | | (0.98 | ) |
| | | | | |
| Less distributions from: | | | | |
| Net investment income | | | (0.24 | ) |
| Total distributions | | | (0.24 | ) |
| | | | | |
| Net asset value, end of period | | $ | 8.91 | |
| | | | | |
| Market price, end of period | | $ | 8.91 | |
| | | | | |
| Total return (3)(4) | | | (9.84 | )% |
| | | | | |
| Total Return-Market Price (3)(4) | | | (9.84 | )% |
| | | | | |
| Net assets, at end of period (000s) | | $ | 3,118 | |
| | | | | |
| Ratio of gross expenses to average net assets (5)(6)(7) | | | 13.29 | % |
| Ratio of net expenses to average net assets (5)(6) | | | 0.39 | % |
| Ratio of net investment income to average net assets (5) | | | 2.40 | % |
| Portfolio Turnover Rate (4)(8) | | | 151 | % |
| | | | | |
| (1) | LifeGoal Conservative Wealth Builder ETF commenced operations on September 8, 2021. |
| (2) | Per share amounts calculated using the average shares method, which more appropriately presents the per share data for the period. |
| (3) | Total return is calculated assuming a purchase of shares at net asset value on the first day and a sale at net asset value on the last day of the period. Distributions are assumed, for the purpose of this calculation, to be reinvested at the ex-dividend date net asset value per share on their respective payment dates. |
| (6) | Does not include the Fund’s share of the expenses of the underlying investment companies in which the Fund invests. |
| (7) | Represents the ratio of expenses to average net assets absent of fee waviers and/or expense reimbursements by LifeGoal Investments, LLC. |
| (8) | Portfolio turnover rate excludes portfolio securities received or delivered as a result of processing capital share transactions in Creation Units. |
See notes to financial statements.
| LifeGoal Wealth Builder ETF |
| FINANCIAL HIGHLIGHTS |
| |
| Per Share Data and Ratios for a Share of Beneficial Interest Outstanding Throughout the Period |
| | | Period Ended | |
| | | August 31, 2022 (1) | |
| Net asset value, beginning of period | | $ | 9.92 | |
| | | | | |
| Activity from investment operations: | | | | |
| Net investment income (2) | | | 0.30 | |
| Net realized and unrealized loss on investments | | | (1.54 | ) |
| Total from investment operations | | | (1.24 | ) |
| | | | | |
| Less distributions from: | | | | |
| Net investment income | | | (0.31 | ) |
| Total distributions | | | (0.31 | ) |
| | | | | |
| Net asset value, end of period | | $ | 8.37 | |
| | | | | |
| Market price, end of period | | $ | 8.37 | |
| | | | | |
| Total return (3)(4) | | | (12.81 | )% |
| | | | | |
| Total Return-Market Price (3)(4) | | | (12.81 | )% |
| | | | | |
| Net assets, at end of period (000s) | | $ | 3,765 | |
| | | | | |
| Ratio of gross expenses to average net assets (5)(6)(7) | | | 10.36 | % |
| Ratio of net expenses to average net assets (5)(6) | | | 0.49 | % |
| Ratio of net investment income to average net assets (5) | | | 3.42 | % |
| Portfolio Turnover Rate (4)(8) | | | 91 | % |
| | | | | |
| (1) | LifeGoal Wealth Builder ETF commenced operations on September 8, 2021. |
| (2) | Per share amounts calculated using the average shares method, which more appropriately presents the per share data for the period. |
| (3) | Total return is calculated assuming a purchase of shares at net asset value on the first day and a sale at net asset value on the last day of the period. Distributions are assumed, for the purpose of this calculation, to be reinvested at the ex-dividend date net asset value per share on their respective payment dates. |
| (6) | Does not include the Fund’s share of the expenses of the underlying investment companies in which the Fund invests. |
| (7) | Represents the ratio of expenses to average net assets absent of fee waviers and/or expense reimbursements by LifeGoal Investments, LLC. |
| (8) | Portfolio turnover rate excludes portfolio securities received or delivered as a result of processing capital share transactions in Creation Units. |
See notes to financial statements.
| LifeGoal ETFs |
| NOTES TO FINANCIAL STATEMENTS |
| August 31, 2022 |
The LifeGoal Home Down Payment Investment ETF (“HOM”), LifeGoal Conservative Wealth Builder ETF (“SAVN”) and LifeGoal Wealth Builder ETF (“WLTH”) (each a “Fund” and collectively the “Funds”) are each a diversified separate series of Northern Lights Fund Trust II (the “Trust”), a statutory trust organized under the laws of the State of Delaware on August 26, 2010, and are registered under the Investment Company Act of 1940, as amended (the “1940 Act”), as open-end management investment companies. HOM’s investment objective seeks to provide current income and some capital appreciation. SAVN’s investment objective seeks to provide preservation of capital and some capital appreciation. WLTH’s investment objective seeks to provide long term capital appreciation. HOM, SAVN and WLTH commenced operations on September 8, 2021.
| 2. | SIGNIFICANT ACCOUNTING POLICIES |
The following is a summary of significant accounting policies followed by the Funds in preparation of their financial statements. These policies are in conformity with accounting principles generally accepted in the United States of America (“GAAP”). The preparation of financial statements requires management to make estimates and assumptions that affect the reported amounts of assets and liabilities and disclosure of contingent assets and liabilities at the date of the financial statements and the reported amounts of income and expenses for the period. Actual results could differ from those estimates. The Funds are each investment companies and accordingly follow the investment company accounting and reporting guidance of the Financial Accounting Standards Board (“FASB”) Accounting Standards Codification Topic 946 “Financial Services – Investment Companies”.
Securities Valuation – Securities listed on an exchange are valued at the last reported sale price at the close of the regular trading session of the primary exchange on the business day the value is being determined or, in the case of securities listed on NASDAQ at the NASDAQ Official Closing Price (“NOCP”). In the absence of a sale, such securities shall be valued at the mean between the current bid and ask prices on the primary exchange on the day of valuation. Short-term debt obligations having 60 days or less remaining until maturity, at time of purchase, may be valued at amortized cost. Investments in open-end investment companies are valued at net asset value.
Each Fund may hold securities, such as private investments, interests in commodity pools, other non-traded securities or temporarily illiquid securities, for which market quotations are not readily available or are determined to be unreliable. These securities will be valued using the “fair value” procedures approved by the Board of Trustees (the “Board” or “Trustees”). The Board has delegated execution of these procedures to a fair value committee composed of one or more representatives from each of the (i) Trust, (ii) administrator, and (iii) adviser. The committee may also enlist third party consultants, such as a valuation specialist at a public accounting firm, valuation consultant or financial officer of a security issuer, on an as-needed basis to assist in determining a security-specific fair value. The Board has also engaged a third party valuation firm to attend valuation meetings held by the Trust, review minutes of such meetings and report to the Board on a quarterly basis. The Board reviews and ratifies the execution of this process and the resultant fair value prices at least quarterly to assure the process produces reliable results.
Fair Valuation Process – As noted above, the fair value committee is composed of one or more representatives from each of the (i) Trust, (ii) administrator, and (iii) the adviser. The applicable investments are valued collectively via inputs from each of these groups. For example, fair value determinations are required for the following securities: (i) securities for which market quotations are insufficient or not readily available on a particular business day (including securities for which there is a short and temporary lapse in the provision of a price by the regular pricing source); (ii) securities for which, in the judgment of the adviser, the prices or values available do not represent the fair value of the instrument. Factors which may cause an adviser to make such a judgment include, but are not limited to, the following: only a bid price or an ask price is available, the spread between bid and ask prices is substantial, the frequency of sales, the thinness of the market, the size of reported trades, and actions of the securities markets, such as the suspension or limitation of trading; (iii) securities determined to be illiquid; (iv) securities with respect to which an event that will affect the value thereof has occurred (a “significant event”) since the closing prices were established on the principal exchange on which they are traded, but prior to the Funds’ calculation of their net asset values. Specifically, interests in commodity pools or managed futures pools are valued on a daily basis by reference to the closing market prices of each futures contract or other asset held by a pool, as adjusted for pool
| LifeGoal ETFs |
| NOTES TO FINANCIAL STATEMENTS (Continued) |
| August 31, 2022 |
expenses. Restricted or illiquid securities, such as private investments or non-traded securities, are valued via inputs from the adviser based upon the current bid for the security from two or more independent dealers or other parties reasonably familiar with the facts and circumstances of the security (who should take into consideration all relevant factors as may be appropriate under the circumstances). If the adviser is unable to obtain a current bid from such independent dealers or other independent parties, the fair value committee shall determine the fair value of such security using the following factors: (i) the type of security; (ii) the cost at date of purchase; (iii) the size and nature of the applicable Fund’s holdings; (iv) the discount from market value of unrestricted securities of the same class at the time of purchase and subsequent thereto; (v) information as to any transactions or offers with respect to the security; (vi) the nature and duration of restrictions on disposition of the security and the existence of any registration rights; (vii) how the yield of the security compares to similar securities of companies of similar or equal creditworthiness; (viii) the level of recent trades of similar or comparable securities; (ix) the liquidity characteristics of the security; (x) current market conditions; and (xi) the market value of any securities into which the security is convertible or exchangeable.
Valuation of Underlying Fund – The Funds may invest in portfolios of open-end or closed-end investment companies (“underlying fund”). Open-end investment companies are valued at their respective net asset values as reported by such investment companies. Open-end investment companies value securities in their portfolios for which market quotations are readily available at their market values (generally the last reported sale price) and all other securities and assets at their fair value by the methods established by the boards of the underlying fund. The shares of many closed-end investment companies, after their initial public offering, frequently trade at a price per share, which is different than the net asset value per share. Investments in closed-end investment companies are valued at their last sales price. The difference represents a market premium or market discount of such shares. There can be no assurances that the market discount or market premium on shares of any closed-end investment company purchased by the Funds will not change.
The Funds utilize various methods to measure the fair value of all of their investments on a recurring basis. GAAP establishes a hierarchy that prioritizes inputs to valuation methods. The three levels of input are:
Level 1 – Unadjusted quoted prices in active markets for identical assets and liabilities that the Funds have the ability to access.
Level 2 – Observable inputs other than quoted prices included in Level 1 that are observable for the asset or liability, either directly or indirectly. These inputs may include quoted prices for the identical instrument in an inactive market, prices for similar instruments, interest rates, prepayment speeds, credit risk, yield curves, default rates and similar data.
Level 3 – Unobservable inputs for the asset or liability, to the extent relevant observable inputs are not available, representing the Funds’ own assumptions about the assumptions a market participant would use in valuing the asset or liability, and would be based on the best information available.
The availability of observable inputs can vary from security to security and is affected by a wide variety of factors, including, for example, the type of security, whether the security is new and not yet established in the marketplace, the liquidity of markets, and other characteristics particular to the security. To the extent that valuation is based on models or inputs that are less observable or unobservable in the market, the determination of value requires more judgment. Accordingly, the degree of judgment exercised in determining value is greatest for instruments categorized in Level 3.
The inputs used to measure value may fall into different levels of the fair value hierarchy. In such cases, for disclosure purposes, the level in the fair value hierarchy within which the fair value measurement falls in its entirety, is determined based on the lowest level input that is significant to the fair value measurement in its entirety.
| LifeGoal ETFs |
| NOTES TO FINANCIAL STATEMENTS (Continued) |
| August 31, 2022 |
The inputs or methodology used for valuing securities are not necessarily an indication of the risk associated with investing in those securities. The following tables summarize the inputs used as of August 31, 2022 for the Funds’ investments measured at value:
| HOM | |
| Assets * | | Level 1 | | | Level 2 | | | Level 3 | | | Total | |
| Common Stocks | | $ | 148,969 | | | $ | — | | | $ | — | | | $ | 148,969 | |
| Exchange-Traded Funds | | | 1,133,468 | | | | — | | | | — | | | | 1,133,468 | |
| Total | | $ | 1,282,437 | | | $ | — | | | $ | — | | | $ | 1,282,437 | |
| | | | | | | | | | | | | | | | | |
| SAVN | |
| Assets * | | Level 1 | | | Level 2 | | | Level 3 | | | Total | |
| Common Stocks | | $ | 250,693 | | | $ | — | | | $ | — | | | $ | 250,693 | |
| Exchange-Traded Funds | | | 2,864,959 | | | | — | | | | — | | | | 2,864,959 | |
| Total | | $ | 3,115,652 | | | $ | — | | | $ | — | | | $ | 3,115,652 | |
| | | | | | | | | | | | | | | | | |
| WLTH | |
| Assets * | | Level 1 | | | Level 2 | | | Level 3 | | | Total | |
| Common Stocks | | $ | 501,748 | | | $ | — | | | $ | — | | | $ | 501,748 | |
| Exchange-Traded Funds | | | 3,253,126 | | | | — | | | | — | | | | 3,253,126 | |
| Total | | $ | 3,754,874 | | | $ | — | | | $ | — | | | $ | 3,754,874 | |
The Funds did not hold any Level 3 securities during the period.
| * | See Schedules of Investments for industry classification. |
Exchange Traded Funds – The Funds may invest in exchange traded funds (“ETFs”). ETFs are a type of index fund bought and sold on a securities exchange. An ETF trades like common stock and may be actively traded or represent a fixed portfolio of securities designed to track the performance and dividend yield of a particular domestic or foreign market index. The risks of owning an ETF generally reflect the risks of owning the underlying securities they are designed to track, although the lack of liquidity on an ETF could result in it being more volatile. Each ETF is subject to specific risks, depending on the nature of the ETF. Additionally, ETFs have fees and expenses that reduce their value.
Security Transactions and Related Income – Security transactions are accounted for on the trade date. Interest income is recognized on an accrual basis. Discounts are accreted and premiums are amortized on securities purchased over the lives of the respective securities using the effective interest method. Dividend income is recorded on the ex-dividend date. Realized gains or losses from sales of securities are determined by comparing the identified cost of the security lot sold with the net sales proceeds.
Dividends and Distributions to Shareholders – Dividends from net investment income, if any, are declared and paid monthly. Dividends and distributions to shareholders are recorded on the ex-dividend date. Distributable net realized capital gains, if any, are declared and distributed annually. Dividends from net investment income and distributions from net realized gains are determined in accordance with federal income tax regulations, which may differ from GAAP. These “book/tax” differences are considered either temporary (e.g., deferred losses) or permanent in nature. To the extent these differences are permanent in nature, such amounts are reclassified within the composition of net assets based on their federal tax-basis treatment; temporary differences do not require reclassification.
Federal Income Taxes – The Funds comply with the requirements of the Internal Revenue Code applicable to regulated investment companies and to distribute all of their taxable income to shareholders. Therefore, no provision for federal income tax is required.
The Funds recognize the tax benefits of uncertain tax positions only where the position is “more likely than not” to be sustained assuming examination by tax authorities. Management has analyzed the Funds’ tax positions and has concluded that no liability for unrecognized tax benefits should be recorded related to uncertain tax positions taken in the Funds’ August 31, 2022 year-end tax returns. Each Fund identified its major tax jurisdictions as U.S. federal, Ohio and foreign jurisdictions where
| LifeGoal ETFs |
| NOTES TO FINANCIAL STATEMENTS (Continued) |
| August 31, 2022 |
the Fund makes significant investments. The Funds recognize interest and penalties, if any, related to unrecognized tax benefits as income tax expense in the Statements of Operations. During the year, the Funds did not incur any interest or penalties. The Funds are not aware of any tax positions for which it is reasonably possible that the total amounts of unrecognized tax benefits will change materially in the next twelve months.
Expenses – Expenses of the Trust that are directly identifiable to a specific Fund are charged to that Fund. Expenses, which are not readily identifiable to a specific Fund, are allocated in such a manner as deemed equitable (as determined by the Board), taking into consideration the nature and type of expense and the relative sizes of the Funds in the Trust.
Indemnification – The Trust indemnifies its officers and Trustees for certain liabilities that may arise from the performance of their duties to the Trust. Additionally, in the normal course of business, the Funds enter into contracts that contain a variety of representations and warranties and which provide general indemnities. The Funds’ maximum exposure under these arrangements is unknown, as this would involve future claims that may be made against the Funds that have not yet occurred. However, based on experience, the risk of loss due to these warranties and indemnities appears to be remote.
| 3. | INVESTMENT TRANSACTIONS |
For the period ended August 31, 2022, cost of purchases and proceeds from sales of portfolio securities (excluding in-kind transactions and short-term investments) for the Funds were as follows:
| | | Purchases | | | Sales | |
| HOM | | $ | 1,800,728 | | | $ | 1,792,729 | |
| SAVN | | $ | 2,297,772 | | | $ | 2,282,150 | |
| WLTH | | $ | 1,807,297 | | | $ | 1,792,677 | |
For the period ended August 31, 2022, cost of purchases and proceeds from sales of portfolio securities for in-kind transactions for the Funds were as follows:
| | | Purchases | | | Sales | |
| HOM | | $ | 2,156,295 | | | $ | 672,081 | |
| SAVN | | $ | 3,536,912 | | | $ | 229,849 | |
| WLTH | | $ | 4,308,211 | | | $ | 240,395 | |
| 4. | INVESTMENT ADVISORY AGREEMENT AND TRANSACTIONS WITH RELATED PARTIES |
The business activities of the Funds are overseen by the Board. LifeGoal Investments, LLC serves as each Fund’s investment adviser (the “Adviser”) pursuant to an Investment Advisory Agreement with the Trust (the “Advisory Agreement”). The Adviser has engaged Penserra Capital Management LLC as the sub-adviser (the “Sub-Adviser”), to manage the assets of the Funds. Fees incurred under this agreement are paid directly by the Adviser, and not Funds. The Trust has entered into a Global Custody Agreement with Brown Brothers Harriman & Co. (the “Custodian”) to serve as custodian and to act as transfer and shareholder services agent. The Trust has also entered into an Underwriting Agreement with Foreside Fund Services, LLC (the “Distributor” or “Foreside”) to serve as the principal underwriter and distributor for the Funds.
Pursuant to the Advisory Agreement, the Adviser, under the oversight of the Board, directs the daily operations of the Funds and supervises the performance of administrative and professional services provided by others. As compensation for its services and the related expenses borne by the Adviser, the Funds pay the Adviser a fee, computed and accrued daily and paid monthly, at an annual rate of 0.44% of the Fund’s average daily net assets for HOM, an annual rate of 0.39% for SAVN and an annual rate of 0.49% for WLTH. For the period ended August 31, 2022, the Adviser earned $5,427, $5,538, and $9,359
| LifeGoal ETFs |
| NOTES TO FINANCIAL STATEMENTS (Continued) |
| August 31, 2022 |
in advisory fees for HOM, SAVN and WLTH respectively.
Pursuant to a written contract (the “Waiver Agreement”), the Adviser has agreed for HOM, SAVN and WLTH at least until December 31, 2022, to waive a portion of its advisory fee and has agreed to reimburse the Funds for other expenses to the extent necessary so that total expenses incurred (exclusive of any front-end or contingent deferred loads, brokerage fees and commissions, acquired fund fees and expenses, borrowing costs (such as interest and dividend expense on securities sold short) and extraordinary expenses will not exceed 0.44%, 0.39% and 0.49% of average daily net assets for HOM, SAVN and WLTH respectively.
If the Adviser waives any fee or reimburses any expenses pursuant to the Waiver Agreement, and a Fund’s operating expenses are subsequently lower than its limitation in place at time of waiver, the Adviser, on a rolling three-year period, shall be entitled to reimbursement by the Fund provided that such reimbursement does not cause that Fund’s operating expense to exceed 0.44%, 0.39% and 0.49% of average daily net assets for HOM, SAVN and WLTH respectively. If a Fund’s operating expenses subsequently exceed the limitations, the reimbursements for the Fund shall be suspended. For the period ended August 31, 2022, the Adviser waived fees and/or reimbursed expenses in the amount of $189,106 $184,230, and $189,466 for HOM, SAVN and WLTH, respectively, which are subject to recapture by the Adviser before August 31, 2025 pursuant to the Waiver Agreement.
The Adviser may seek reimbursement only for expenses waived or paid by it during the three years prior to such reimbursement; provided, however, that such expenses may only be reimbursed to the extent they were waived or paid after the effective date of the Waiver Agreement (or any similar agreement). The Board may terminate this expense reimbursement arrangement at any time.
The Trust, with respect to the Funds, has adopted an ETF Distribution Agreement (the “Distribution Agreement”). The Funds do not pay the Distributor any fees under the Distribution Agreement.
Ultimus Fund Solutions, LLC (“UFS”) – UFS provides administration and fund accounting services to the Trust. Pursuant to separate servicing agreements with UFS, the Funds pay UFS customary fees for providing administration and fund accounting services to the Funds. Certain officers of the Trust are also officers of UFS, and are not paid any fees directly by the Funds for serving in such capacities.
Northern Lights Compliance Services, LLC (“NLCS”) – NLCS, an affiliate of UFS, provides a Chief Compliance Officer to the Trust, as well as related compliance services, pursuant to a consulting agreement between NLCS and the Trust. Under the terms of such agreement, NLCS receives customary fees from the Fund.
Blu Giant, LLC (“Blu Giant”) – Blu Giant, an affiliate of UFS, provides EDGAR conversion and filing services as well as print management services for the Funds on an ad-hoc basis. For the provision of these services, Blu Giant receives customary fees from the Funds.
| 5. | CAPITAL SHARE TRANSACTIONS |
Shares are not individually redeemable and may be redeemed by the Funds at the net asset value (“NAV”) only in large blocks known as “Creation Units.” Shares are created and redeemed by the Funds only in Creation Unit size aggregations of 25,000 shares for the Funds. Only Authorized Participants or transactions done through an Authorized Participant are permitted to purchase or redeem Creation Units from the Funds. An Authorized Participant is a member or participant of a clearing agency registered with the SEC that has a written agreement with a Fund or one of its service providers that allows the Authorized Participant to place orders for the purchase or redemption of Creation Units. Creation Units are issued and redeemed for cash and/or in-kind for securities. Except when aggregated in Creation Units, the Shares are not redeemable securities of the Funds. In addition, the Funds may impose transaction fees on purchases and redemptions of Fund shares to cover the custodial and other costs incurred by the Funds in effecting trades. A fixed fee may be imposed on each creation and redemption transaction regardless of the number of Creation Units involved in the transaction (“Fixed Fee”). Purchases and redemptions of Creation Units for cash or involving cash-in-lieu are required to pay an additional variable charge to compensate the Funds and their ongoing shareholders for brokerage and market impact expenses relating to Creation Unit transactions (“Variable Charge,” and together with the Fixed Fee, the “Transaction Fees”).
| LifeGoal ETFs |
| NOTES TO FINANCIAL STATEMENTS (Continued) |
| August 31, 2022 |
The Transaction Fees for the Funds are listed in the table below:
| | | | | Fee for ln-Kind and Cash | | | Maximum Additional Variable | |
| | Ticker | | | Purchases | | | Charge for Cash Purchases* | |
| | HOM | | | $250 | | | 2.00%* | |
| | SAVN | | | $250 | | | 2.00%* | |
| | WLTH | | | $250 | | | 2.00%* | |
| * | As a percentage of the amount invested. |
| 6. | AGGREGATE UNREALIZED APPRECIATION AND DEPRECIATION – TAX BASIS |
The identified cost of investments in securities owned by the Funds for federal income tax purposes and its respective gross unrealized appreciation and depreciation at August 31, 2022, were as follows:
| | | | | | Gross | | | Gross | | | Net Unrealized | |
| | | Tax | | | Unrealized | | | Unrealized | | | Appreciation/ | |
| | | Cost | | | Appreciation | | | Depreciation | | | (Depreciation) | |
| Home Down Payment Investment ETF | | $ | 1,412,795 | | | $ | 6,795 | | | $ | (137,153 | ) | | $ | (130,358 | ) |
| Conservative Wealth Builder ETF | | | 3,235,821 | | | | 13,912 | | | | (134,081 | ) | | | (120,169 | ) |
| Wealth Builder ETF | | | 3,986,180 | | | | 23,542 | | | | (254,848 | ) | | | (231,306 | ) |
| 7. | DISTRIBUTIONS TO SHAREHOLDERS AND TAX COMPONENTS OF CAPITAL |
The tax character of fund distributions paid for the period ended August 31, 2022 was as follows:
| For period ended | | Ordinary | | | Long-Term | | | Return of | | | | |
| 8/31/2022 | | Income | | | Capital Gains | | | Capital | | | Total | |
| Home Down Payment Investment ETF | | $ | 34,612 | | | | — | | | | — | | | $ | 34,612 | |
| Conservative Wealth Builder ETF | | | 34,085 | | | | — | | | | — | | | | 34,085 | |
| Wealth Builder ETF | | | 65,620 | | | | — | | | | — | | | | 65,620 | |
As of August 31, 2022, the components of accumulated earnings/(deficit) on a tax basis were as follows:
| | | Undistributed | | | Undistributed | | | Post October Loss | | | Capital Loss | | | Other | | | Unrealized | | | Total | |
| | | Ordinary | | | Long-Term | | | and | | | Carry | | | Book/Tax | | | Appreciation/ | | | Accumulated | |
| | | Income | | | Capital Gains | | | Late Year Loss | | | Forwards | | | Differences | | | (Depreciation) | | | Earnings/(Deficits) | |
| Home Down Payment Investment ETF | | $ | 38 | | | $ | — | | | $ | (70,639 | ) | | $ | (658 | ) | | $ | — | | | $ | (130,358 | ) | | $ | (201,617 | ) |
| Conservative Wealth Builder ETF | | | 122 | | | | — | | | | (79,185 | ) | | | (1,107 | ) | | | — | | | | (120,169 | ) | | | (200,339 | ) |
| Wealth Builder ETF | | | — | | | | — | | | | (90,233 | ) | | | (463 | ) | | | — | | | | (231,306 | ) | | | (322,002 | ) |
The difference between book basis and tax basis undistributed net investment income (loss), accumulated net realized losses, and unrealized depreciation from investments is primarily attributable to the tax deferral of losses on wash sales and adjustments for grantor trusts.
| LifeGoal ETFs |
| NOTES TO FINANCIAL STATEMENTS (Continued) |
| August 31, 2022 |
Capital losses incurred after October 31 within the fiscal year are deemed to arise on the first business day of the following fiscal year for tax purposes. The Funds incurred and elected to defer such capital losses as follows:
| | | Post October | |
| | | Losses | |
| Home Down Payment Investment ETF | | $ | 70,639 | |
| Conservative Wealth Builder ETF | | | 79,185 | |
| Wealth Builder ETF | | | 90,233 | |
At August 31, 2022, the Funds had capital loss carry forwards for federal income tax purposes available to offset future capital gains as follows:
| | | | | | | | | | | | Capital Loss Carry | |
| | | Short-Term | | | Long-Term | | | Total | | | Forwards Utilized | |
| Home Down Payment Investment ETF | | $ | 658 | | | $ | — | | | $ | 658 | | | $ | — | |
| Conservative Wealth Builder ETF | | | 1,107 | | | | — | | | | 1,107 | | | | — | |
| Wealth Builder ETF | | | 463 | | | | — | | | | 463 | | | | — | |
Permanent book and tax differences, primarily attributable to distributions in excess and tax adjustments for realized gain (loss) on in-kind redemptions resulted in reclassifications for the Funds for the period ended August 31, 2022 as follows:
| | | Paid | | | | |
| | | In | | | Distributable | |
| | | Capital | | | Earnings | |
| Home Down Payment Investment ETF | | $ | (5,922 | ) | | $ | 5,922 | |
| Conservative Wealth Builder ETF | | | (5,562 | ) | | | 5,562 | |
| Wealth Builder ETF | | | (4,951 | ) | | | 4,951 | |
Subsequent events after the date of the Statements of Assets and Liabilities have been evaluated through the date the financial statements were issued.
Management has determined that no other events or transactions occurred requiring adjustment or disclosure in the financial statements other than the following.
The Board declared the following distributions after August 31, 2022:
| | | Dividend | | | Record | | Payable |
| Fund | | Per Share | | | Date | | Date |
| HOM | | $ | 0.0132 | | | 9/23/2022 | | 9/28/2022 |
| SAVN | | | 0.0178 | | | 9/23/2022 | | 9/28/2022 |
| WLTH | | | 0.0214 | | | 9/23/2022 | | 9/28/2022 |
| LifeGoal ETFs |
| EXPENSE EXAMPLE (Unaudited) |
| August 31, 2022 |
As a shareholder of one or more of the Funds, you incur two types of costs: (1) transaction costs, including brokerage commissions on purchases and sales of Fund shares; (2) ongoing costs, including management fees and other Fund expenses. This example is intended to help you understand your ongoing costs (in dollars) of investing in the Fund and to compare these costs with the ongoing costs of investing in other funds.
The example is based on an investment of $1,000 invested at the beginning of the period and held for the entire period from March 1, 2022 through August 31, 2022.
Actual Expenses: The first line of the table provides information about actual account values and actual expenses. You may use the information in this line, together with the amount you invested, to estimate the expenses that you paid over the period. Simply divide your account value by $1,000 (for example, an $8,600 account value divided by $1,000 = 8.6), then multiply the result by the number in the first line under the heading entitled “Expenses Paid During the Period” to estimate the expenses you paid on your account during the period.
Hypothetical Examples for Comparison Purposes: The second line of the table below provides information about hypothetical account values and hypothetical expenses based on the Fund’s actual expense ratio and an assumed rate of return of 5% per year before expenses, which is not the Fund’s actual return. The hypothetical account values and expenses may not be used to estimate the actual ending account balance or expenses you paid for the period. You may use this information to compare the ongoing costs of investing in the Fund and other funds. To do so, compare this 5% hypothetical example with the 5% hypothetical examples that appear in the shareholder reports of the other funds.
Please note that the expenses shown in the table are meant to highlight your ongoing costs only and do not reflect any transactional costs which may be applicable to your account. Therefore, the second line of the table is useful in comparing ongoing costs only, and will not help you determine the relative total costs of owning different funds. In addition, if these transactional costs were included, your costs would have been higher.
| | | Beginning | | | Ending | | | Expenses Paid | | | |
| | | Account Value | | | Account Value | | | During Period | | | Fund’s Annualized |
| Actual | | 3/1/2022 | | | 8/31/2022 | | | 3/1/22 – 8/31/22* | | | Expense Ratio |
| HOM | | $ | 1,000.00 | | | $ | 922.80 | | | $ | 2.13 | | | 0.44% |
| SAVN | | $ | 1,000.00 | | | $ | 926.00 | | | $ | 1.89 | | | 0.39% |
| WLTH | | $ | 1,000.00 | | | $ | 906.70 | | | $ | 2.35 | | | 0.49% |
| * | Expenses are equal to the average account value over the period, multiplied by the Fund’s annualized expense ratio, multiplied by the number of days in the period (184) divided by the number of days in the fiscal year (365). |
| | | Beginning | | | Ending | | | Expenses Paid | | | |
| Hypothetical | | Account Value | | | Account Value | | | During Period | | | Fund’s Annualized |
| (5% return before expenses) | | 3/1/2022 | | | 8/31/2022 | | | 3/1/22 – 8/31/22 * | | | Expense Ratio |
| HOM | | $ | 1,000.00 | | | $ | 1,022.99 | | | $ | 2.24 | | | 0.44% |
| SAVN | | $ | 1,000.00 | | | $ | 1,023.24 | | | $ | 1.99 | | | 0.39% |
| WLTH | | $ | 1,000.00 | | | $ | 1,022.74 | | | $ | 2.50 | | | 0.49% |
| * | Expenses are equal to the average account value over the period, multiplied by the Fund’s annualized expense ratio, multiplied by the number of days in the period (184) divided by the number of days in the fiscal year (365). |
| LifeGoal ETFs |
| SUPPLEMENTAL INFORMATION (Unaudited) |
| August 31, 2022 |
FACTORS CONSIDERED BY THE TRUSTEES IN THE APPROVAL OF AN INVESTMENT ADVISORY AGREEMENT
May 18, 2021 Special Meeting
At a special meeting (the “Meeting”) of the Board of Trustees (the “Board”) of Northern Lights Fund Trust II (the “Trust”) held on May 18, 2021, the Board, including the disinterested Trustees (the “Independent Trustees”), considered the approval of the advisory agreement between LifeGoal Investments, LLC (“LifeGoal”) and the Trust on behalf of the LifeGoal Home Down Payment Investment ETF (formerly known as the LifeGoal Home Savings ETF), LifeGoal Conservative Wealth Builder ETF (formerly known as the LifeGoal General Savings ETF) and LifeGoal Wealth Builder ETF (the “LifeGoal Funds”) (the “LifeGoal Advisory Agreement”). The Board further considered the approval of the sub-advisory agreement between LifeGoal and Penserra Capital Management, LLC (“Penserra”) with respect to each LifeGoal Fund (“Penserra Sub-Advisory Agreement’).
Based on their evaluation of the information provided by LifeGoal, in conjunction with each LifeGoal Fund’s other service providers, the Board, by a unanimous vote (including a separate vote of the Independent Trustees), approved the Advisory Agreement with respect to each LifeGoal Fund.
In advance of the Meeting, the Board requested and received materials to assist them in considering the LifeGoal Advisory Agreement. The materials provided contained information with respect to the factors enumerated below, including the LifeGoal Advisory Agreement, a memorandum prepared by the Trust’s outside legal counsel discussing in detail the Trustees’ fiduciary obligations and the factors they should assess in considering the approval of the LifeGoal Advisory Agreement and comparative information relating to the advisory fee and other expenses of each LifeGoal Fund. The materials also included due diligence materials relating to Lifegoal (including due diligence questionnaires completed by LifeGoal, select financial information of LifeGoal, bibliographic information regarding LifeGoal’s key management and investment advisory personnel, and comparative fee information relating to the Fund) and other pertinent information. At the Meeting, the Independent Trustees were advised by counsel that is experienced in Investment Company Act of 1940 matters and that is independent of fund management and met with such counsel separately from fund management.
The Board then reviewed and discussed the written materials that were provided in advance of the Meeting and deliberated on the approval of the LifeGoal Advisory Agreement with respect to each LifeGoal Fund. The Board relied upon the advice of independent legal counsel and their own business judgment in determining the material factors to be considered in evaluating the LifeGoal Advisory Agreement and the weight to be given to each such factor. The conclusions reached by the Board were based on a comprehensive evaluation of all of the information provided and were not the result of any one factor. Moreover, each Trustee may have afforded different weight to the various factors in reaching his conclusions with respect to the LifeGoal Advisory Agreement. In considering the approval of the LifeGoal Advisory Agreement, the Board reviewed and analyzed various factors that they determined were relevant, including the factors enumerated below.
Nature, Extent and Quality of Services. The Board reviewed materials provided by LifeGoal related to the proposed approval of the LifeGoal Advisory Agreement, including its draft ADV, a description of the manner in which investment decisions will be made and executed, and a review of the personnel performing services for the LifeGoal Funds, including the team of individuals that will primarily monitor and execute the investment process. The Board noted that LifeGoal was a newly formed investment adviser with no experience managing a 1940
| LifeGoal ETFs |
| SUPPLEMENTAL INFORMATION (Unaudited) |
| August 31, 2022 |
Act registered fund but that its personnel had many years of experience in the financial services industry and investment management experience in their previous positions. The Board discussed the extent of LifeGoal’s research capabilities, the quality of its compliance infrastructure noting that LifeGoal had engaged an outside compliance consulting firm, Key Bridge Compliance, LLC (“Key Bridge”), to assist in the development and oversight of its compliance program. The Board noted that the personnel at Key Bridge who would be assisting LifeGoal with its compliance program were very experienced in the 1940 Act and experienced in the operations and regulations governing the management of registered investment companies, including exchange-traded funds (“ETFs”). Additionally, the Board received satisfactory responses from representatives of LifeGoal with respect to a series of important questions, including: whether LifeGoal or its principals were involved in any lawsuits or pending regulatory actions; whether the management of other accounts would conflict with its management of the LifeGoal Funds; and whether there are procedures in place to adequately allocate trades among its clients. The Board reviewed the description provided on the practices for monitoring compliance with the LifeGoal Funds’ investment limitations, noting that LifeGoal would actively review the portfolio managers’ performance of their duties to ensure compliance under LifeGoal’s compliance program. The Board discussed the capitalization of LifeGoal, noting that LifeGoal was newly formed, and, based on discussions with the representatives of LifeGoal, concluded that LifeGoal’s principals had the ability to make additional contributions in order to meet their obligations to the LifeGoal Funds. The Board also discussed LifeGoal’s compliance program with the CCO of the Trust. The Board noted that the CCO of the Trust represented that LifeGoal’s policies and procedures were adequate and reasonably designed to prevent violations of applicable securities laws. The CCO of the Trust further represented that he would work closely with LifeGoal and its compliance personnel to ensure close monitoring of the LifeGoal ETFs’ operations and risk management practices. The Board concluded that LifeGoal had sufficient quality and depth of personnel, resources, investment methods and compliance policies and procedures essential to performing its duties under the LifeGoal Advisory Agreement and that the nature, overall quality and extent of the management services to be provided by LifeGoal to the LifeGoal Funds appear to be satisfactory.
Performance. Because the LifeGoal Funds had not yet commenced operations nor had LifeGoal or its portfolio managers managed similar accounts, the Board did not consider past performance.
Fees and Expenses. As to the costs of the services to be provided by LifeGoal, the Board reviewed and discussed the proposed advisory fee for each Fund and anticipated total operating expenses for each Fund as compared to its respective peer group as presented in the Meeting Materials noting that each proposed advisory fee was lower than the average advisory fees of its respective peer group and Morningstar category. The Board then reviewed the proposed contractual arrangements for each LifeGoal Fund noting that LifeGoal was willing to agree to contractually waive or limit its advisory fee and/or reimburse expenses for each Fund in order to limit a Fund’s net annual operating expenses, exclusive of certain fees, for at least a year from the date of each LifeGoal Fund’s initial prospectus so as not to exceed 0.29%, 0.39%, and 0.47% of the average annual net assets for LifeGoal Conservative Wealth Builder ETF, LifeGoal Home Down Payment Investment ETF , and LifeGoal Wealth Builder ETF, respectively, and found such arrangements would be beneficial to shareholders of the respective LifeGoal Fund. The Board concluded that each advisory fee to be charged by LifeGoal with respect to each LifeGoal Fund was not unreasonable.
Profitability. The Board also considered the level of profits that could be expected to accrue to LifeGoal with respect to each LifeGoal Fund based on profitability estimates and analyses provided by LifeGoal and reviewed by the Board. After review and discussion, the Board concluded that, based on the services to be provided by LifeGoal and the projected growth of the LifeGoal Funds, the anticipated level of profit from LifeGoal’s relationship with each LifeGoal Fund was not excessive.
| LifeGoal ETFs |
| SUPPLEMENTAL INFORMATION (Unaudited) |
| August 31, 2022 |
Economies of Scale. As to the extent to which each LifeGoal Fund will realize economies of scale as it grows, and whether the fee levels reflect these economies of scale for the benefit of investors, the Board discussed LifeGoal’s expectations for growth of each LifeGoal Fund, and concluded that any material economies of scale would not be achieved in the near term.
Penserra Sub-Advisory Agreement
The Board then reviewed and discussed the written materials that were provided in advance of the Meeting and deliberated on the approval of the Penserra Sub-Advisory Agreement. In addition to the materials described above, the Board reviewed: (i) the nature and quality of the investment advisory services to be provided by Penserra, including the experience and qualifications of the personnel providing such services; (ii) the investment strategies and style of investing of Penserra; (iii) the performance history of Penserra; and (iv) Penserra’s financial condition, history of operations and ownership structure. In considering the approval of the Penserra Sub-Advisory Agreement, the Board reviewed and analyzed various factors that they determined were relevant, including the factors enumerated below.
Nature, Extent and Quality of Services. As to the nature, quality and extent of the services provided by Penserra, the Board noted the experience of the portfolio management personnel of Penserra, including their experience in the investment field, education and industry credentials. The Board discussed the financial condition of Penserra and reviewed supporting materials. The Board reviewed the materials prepared by Penserra describing its investment process and noted Penserra’s considerable experience executing, settling and reporting trades, adjusting baskets and coordinating custom baskets for ETFs. The Board concluded that Penserra had sufficient quality and depth of personnel, resources, investment methods essential to performing its duties under the Penserra Sub-Advisory Agreement and that the nature, overall quality and extent of investment advisory services to be provided to each of the LifeGoal Funds appear to be satisfactory.
Performance. Because the LifeGoal Funds had not yet commenced operations, the Board did not consider past performance. The Board considered the depth and experience of Penserra and was comfortable they would provide satisfactory performance for each LifeGoal Fund and its shareholders.
Fees and Expenses. As to the costs of the services provided by Penserra, the Board discussed the sub-advisory fee and considered that Penserra is paid by LifeGoal out of its advisory fees and not by each LifeGoal Fund. The Board also looked at the advisory fee split between LifeGoal and Penserra and concluded that the sub-advisory fee paid to Penserra was not unreasonable in light of the quality of the services to be performed by it. The Board also considered, based on statements made and information provided by LifeGoal and Penserra that the Penserra Sub-Advisory Agreement was negotiated at arm’s-length between LifeGoal and Penserra.
Profitability. As to profitability, the Board discussed and noted that Penserra will receive no compensation from LifeGoal, other than the sub-advisory fee earned pursuant to the Penserra Sub-Advisory Agreement. The Board further noted that the sub-advisory fee is paid by Lifegoal out of the advisory fee that it receives and not directly by the LifeGoal Funds. While the Board did not consider the costs of services provided by Penserra or its profitability to be significant factors, nonetheless, based on all these factors and on profitability estimates and analyses provided by Penserra and reviewed by the Board, the Board concluded that anticipated profits from Penserra’s relationship with the LifeGoal Funds were not excessive.
Economies of Scale. The Board noted that the sub-advisory fee is not paid by the LifeGoal Funds, therefore the Board did not consider whether the sub-advisory fee should reflect any potential economies of scale that might be realized as the Funds’ assets increase and rather determined the economies of scale would be evaluated as part of looking at the advisory fee paid to LifeGoal.
| LifeGoal ETFs |
| SUPPLEMENTAL INFORMATION (Unaudited) |
| August 31, 2022 |
Conclusion. The Board members relied upon the advice of independent counsel, and their own business judgment in determining the material factors to be considered in evaluating each of the LifeGoal Advisory Agreement and the Penserra Sub-Advisory Agreement (collectively, the “Advisory Agreements”) and the weight to be given to each such factor. Accordingly, having requested and received such information from LifeGoal and Penserra as the Board believed to be reasonably necessary to evaluate the terms of each of the Advisory Agreements separately, and as assisted by the advice of independent counsel, the Board, including a majority of the Independent Trustees voting separately, determined that with respect to each of the LifeGoal Funds separately that (a) the terms of each of the Advisory Agreements are reasonable; (b) the advisory fee (or sub-advisory fee as applicable) is not unreasonable; and (c) the Advisory Agreements are in the best interests of each of the LifeGoal Funds and their respective shareholders. In considering the approval of each of the LifeGoal Advisory Agreements, the Board did not identify any one factor as all important, but rather considered these factors collectively and determined that approval of each LifeGoal Advisory Agreement was in the best interests of each LifeGoal Fund and its shareholders. Moreover, the Board noted that each Trustee may have afforded different weight to the various factors in reaching his conclusions with respect to each of the Advisory Agreements.
June 24, 2021 Special Meeting
At a special meeting (the “Special Meeting”) of the Board held on June 24, 2021, the Board, including the disinterested Trustees (the “Independent Trustees”), considered the approval of a revised advisory agreement (the “Revised LifeGoal Advisory Agreement”) between LifeGoal Investments, LLC (“LifeGoal”) and the Trust, on behalf of the LifeGoal Home Down Payment Investment ETF, LifeGoal Conservative Wealth Builder ETF and LifeGoal Wealth Builder ETF (the “LifeGoal Funds”).
In advance of the Meeting, the Board requested and received materials to assist them in considering the Revised LifeGoal Advisory Agreement.
It was noted that the Meeting Materials included an updated 15c response from LifeGoal marked to show changes made since the Board last reviewed it at the May 18, 2021 special board meeting along with the Revised LifeGoal Advisory Agreement. The Board discussed the revisions noting that that they included a change regarding the selection process for underlying fund investments to now factor in the ESG status of such funds. It was also noted that the adviser, after further analyzing the advisory fee, their anticipated profitability and peer comparisons, was requesting that the Board approve an adjustment to the advisory fee and expense caps on LifeGoal Home Down Payment Investment ETF, LifeGoal Conservative Wealth Builder ETF and LifeGoal Wealth Builder ETF by slightly raising those fees. The Board also noted and discussed the corresponding changes to the profitability analysis. The board further noted that the expense caps for each of the LifeGoal Funds was set at the same rate as the advisory fee, meaning that the adviser would absorb all the operating expenses for each LifeGoal Fund. It was noted that LifeGoal was requesting that the advisory fee for the LifeGoal Home Down Payment Investment ETF, LifeGoal Conservative Wealth Builder ETF and LifeGoal Wealth Builder ETF be raised from 0.39%, 0.29% and 0.47% to 0.44%, 0.39% and 0.49%, respectively, and that the expense cap be adjusted to 0.44%, 0.39% and 0.49%, respectively, as well. The Board then discussed the proposed new advisory fees and expense caps and compared them against the peer group that the Board had previously reviewed at its regular meeting in April 2021, and its special meeting on May 18, 2021. The Board also reviewed the revised profitability analysis. The Board concluded that the revised advisory fee for each of the LifeGoal Funds remained lower than their respective peer group averages and
| LifeGoal ETFs |
| SUPPLEMENTAL INFORMATION (Unaudited) |
| August 31, 2022 |
were not unreasonable. The Board further reviewed its deliberations, analysis and conclusions from the May 18, 2021 meeting with respect to its approval of the Advisory Agreement between the Trust and LifeGoal and agreed that the same deliberations, analysis and conclusions applied to the Revised Advisory Agreement except further factoring in the advisory fee changes noted above.

REPORT OF INDEPENDENT REGISTERED PUBLIC ACCOUNTING FIRM
To the Shareholders of LifeGoal Home Down Payment Investment ETF, LifeGoal Conservative Wealth
Builder ETF, and LifeGoal Wealth Builder ETF and
Board of Trustees of Northern Lights Fund Trust II
Opinion on the Financial Statements
We have audited the accompanying statements of assets and liabilities, including the schedules of investments, of LifeGoal Home Down Payment Investment ETF, LifeGoal Conservative Wealth Builder ETF, and LifeGoal Wealth Builder ETF (the “Funds”), each a series of Northern Lights Fund Trust II, as of August 31, 2022, the related statements of operations and changes in net assets, the related notes, and the financial highlights for the period September 8, 2021 (commencement of operations) through August 31, 2022 (collectively referred to as the “financial statements”). In our opinion, the financial statements present fairly, in all material respects, the financial position of each of the Funds as of August 31, 2022, the results of their operations, the changes in net assets, and the financial highlights for the period then ended, in conformity with accounting principles generally accepted in the United States of America.
Basis for Opinion
These financial statements are the responsibility of the Funds’ management. Our responsibility is to express an opinion on the Funds’ financial statements based on our audit. We are a public accounting firm registered with the Public Company Accounting Oversight Board (United States) (“PCAOB”) and are required to be independent with respect to the Funds in accordance with the U.S. federal securities laws and the applicable rules and regulations of the Securities and Exchange Commission and the PCAOB.
We conducted our audit in accordance with the standards of the PCAOB. Those standards require that we plan and perform the audit to obtain reasonable assurance about whether the financial statements are free of material misstatement whether due to error or fraud.
Our audit included performing procedures to assess the risks of material misstatement of the financial statements, whether due to error or fraud, and performing procedures that respond to those risks. Such procedures included examining, on a test basis, evidence regarding the amounts and disclosures in the financial statements. Our procedures included confirmation of securities owned as of August 31, 2022, by correspondence with the custodian and brokers; when replies were not received from brokers, we performed other auditing procedures. Our audit also included evaluating the accounting principles used and significant estimates made by management, as well as evaluating the overall presentation of the financial statements. We believe that our audit provides a reasonable basis for our opinion.
We have served as the Funds’ auditor since 2021.

COHEN & COMPANY, LTD.
Cleveland, Ohio
October 28, 2022
COHEN & COMPANY, LTD.
800.229.1099 | 866.818.4538 fax | cohencpa.com
Registered with the Public Company Accounting Oversight Board
| LifeGoal ETFs |
| SUPPLEMENTAL INFORMATION (Unaudited) |
| August 31, 2022 |
LIQUIDITY RISK MANAGEMENT PROGRAM
The Fund has adopted and implemented a written liquidity risk management program as required by Rule 22e-4 (the “Liquidity Rule”) under the 1940 Act. The program is reasonably designed to assess and manage the Fund’s liquidity risk, taking into consideration, among other factors, the Fund’s investment strategy and the liquidity of its portfolio investments during normal and reasonably foreseeable stressed conditions; its short and long-term cash flow projections; and its cash holdings and access to other funding sources.
During the fiscal period ended August 31, 2022, the Trust’s Liquidity Risk Management Program Committee (the “Committee”) reviewed the Fund’s investments and determined that the Fund held adequate levels of cash and highly liquid investments to meet shareholder redemption activities in accordance with applicable requirements. Accordingly, the Committee concluded that (i) the Fund’s liquidity risk management program is reasonably designed to prevent violations of the Liquidity Rule and (ii) the Fund’s liquidity risk management program has been effectively implemented.
| LifeGoal ETFs |
| SUPPLEMENTAL INFORMATION (Unaudited) |
| August 31, 2022 |
The Trustees and the officers of the Trust are listed below with their present positions with the Trust and principal occupations over at least the last five years. The business address of each Trustee and Officer is 225 Pictoria Drive, Suite 450, Cincinnati, OH 45246. All correspondence to the Trustees and Officers should be directed to c/o Gemini Fund Services, LLC, P.O. Box 541150, Omaha, Nebraska 68154.
Independent Trustees
Name and Year
of Birth | Position/Term of
Office* | Principal Occupation
During the Past Five Years | Number of
Portfolios in
Fund Complex
Overseen by
Trustee** | Other Directorships held by Trustee
During the Past Five Years |
Brian Nielsen
1972 | Trustee Since May 2011 | Trustee of Northern Lights Fund Trust II (since 2011); Special Projects Counsel of NorthStar Financial Services Group, LLC (from 2018 to 2019); Secretary of CLS Investments, LLC (from 2001 to 2018); Secretary of Orion Advisor Services, LLC (from 2001 to 2018); General Counsel and Secretary (from 2003 to 2018) of NorthStar Financial Services Group, LLC; CEO (from 2012 to 2018), Secretary (from 2003 to 2018) and Manager (from 2005 to 2018) of Northern Lights Distributors, LLC; Director, Secretary and General Counsel of Constellation Trust Company (from 2004 to 2018); CEO (from 2015 to 2018), General Counsel and Secretary (from 2011 to 2018) of Northern Lights Compliance Services, LLC; General Counsel and Secretary of Blu Giant, LLC (from 2011 to 2018); Secretary of Gemini Fund Services, LLC (from 2012 to 2018); Manager of Arbor Point Advisors, LLC (from 2012 to 2018); Director, Secretary and General Counsel of NorthStar CTC Holdings, Inc. (from 2015 to 2018) and Secretary and Chief Legal Officer of AdvisorOne Funds (from 2003 to 2018). | 3 | Manager of Northern Lights Distributors, LLC (from 2005 to 2018); Manager of Arbor Point Advisors, LLC (from 2012 to 2018); Director of Constellation Trust Company (from 2004 to 2018) |
Thomas T.
Sarkany
1946 | Trustee Since October 2011 | President, TTS Consultants, LLC (financial services) (since 2010). | 3 | Director, Aquila Distributors; Trustee, Arrow ETF Trust; Trustee, Arrow Investments Trust; Trustee, Northern Lights Fund Trust IV |
Anthony H. Lewis
1946 | Trustee Since May 2011 | Chairman and CEO of The Lewis Group USA (executive consulting firm) (since 2007). | 3 | Director, Member of the Compensation Committee and Member of the Risk Committee of Torotel Inc. (Magnetics, Aerospace and Defense), Trustee, Chairman of the Fair Valuation Committee and Member of the Audit Committee of the Wildermuth Endowment Strategy Fund |
Keith Rhoades
1948 | Trustee Since May 2011 | Retired since 2008. | 3 | NONE |
Randal D. Skalla
1962 | Trustee Since May 2011 | President, L5 Enterprises, Inc. (financial services company) (since 2001). | 3 | Board Member, Orizon Investment Counsel (financial services company) (from 2001 to 2017) |
| LifeGoal ETFs |
| SUPPLEMENTAL INFORMATION (Unaudited) (Continued) |
| August 31, 2022 |
Officers
Name and Year
of Birth | Position/Term of
Office* | Principal Occupation
During the Past Five Years | Number of
Portfolios in
Fund Complex
Overseen by
Trustee** | Other Directorships held by Trustee
During the Past Five Years |
Kevin E. Wolf
1969 | President Since January 2013 | Vice President of The Ultimus Group, LLC; Executive Vice President, Head of Fund Administration and Product (since 2019) and President (2012 - 2019) of Ultimus Fund Solutions, LLC (formerly, Gemini Fund Services, LLC). | N/A | N/A |
Erik Naviloff
1968 | Treasurer Since January 2013 | Vice President of Ultimus Fund Solutions, LLC (formerly, Gemini Fund Services, LLC) (since 2011). | N/A | N/A |
Eric Kane
1981 | Secretary Since August 2022 | Vice President and Managing Counsel, Ultimus Fund Solutions, LLC (since 2020); Vice President and Counsel, Gemini Fund Services, LLC (2017-2020), Assistant Vice President, Gemini Fund Services, LLC (2014- 2017), Staff Attorney, Gemini Fund Services, LLC (2013-2014), Law Clerk, Gemini Fund Services, LLC (2009-2013), Legal Intern, NASDAQ OMX (2011), Hedge Fund Administrator, Gemini Fund Services, LLC (2008), Mutual Fund Accountant/Corporate Action Specialist, Gemini Fund Services, LLC (2006-2008). | N/A | N/A |
Emile R.
Molineaux
1962 | Chief Compliance Officer Since May 2011 | Senior Compliance Officer and CCO of Various clients of Northern Lights Compliance Services, LLC (since 2011). | N/A | N/A |
Jared Lahman
1986 | Anti-Money Laundering Officer since January 2022 | Compliance Analyst, Northern Lights Compliance Services, LLC (since January 2019); Manager, Fund Accounting, Gemini Fund Services, LLC (January 2014 to December 2018). | N/A | N/A |
| * | The term of office for each Trustee and Officer listed above will continue indefinitely. |
| ** | As of August 31, 2022, the Trust was comprised of 20 active portfolios managed by unaffiliated investment advisers. The term “Fund Complex” applies only to the Funds and not to any other series of the Trust. The Funds do not hold themselves out as related to any other series within the Trust for investment purposes, nor do they share the same investment adviser with any other series. |
The Funds’ SAI includes additional information about the Trustees and is available free of charge, upon request, by calling toll-free at 1-888-920-7275.
Privacy Policy
Rev. May 2021
| FACTS | WHAT DOES NORTHERN LIGHTS FUND TRUST II (“NLFT II”) DO WITH YOUR PERSONAL INFORMATION? |
| Why? | Financial companies choose how they share your personal information. Federal law gives consumers the right to limit some but not all sharing. Federal law also requires us to tell you how we collect, share, and protect your personal information. Please read this notice carefully to understand what we do. |
| What? | The types of personal information we collect and share depend on the product or service you have with us. This information can include: |
| | ● Social Security number ● Employment information ● Account balances | ● Account transactions ● Income ● Investment experience |
| | When you are no longer our customer, we continue to share your information as described in this notice. |
| How? | All financial companies need to share a customer’s personal information to run their everyday business - to process transactions, maintain customer accounts, and report to credit bureaus. In the section below, we list the reasons financial companies can share their customer’s personal information; the reasons NLFT II chooses to share; and whether you can limit this sharing. |
| | | | |
| Reasons we can share your personal information | Does NLFT II
share? | Can you limit
this sharing? |
For our everyday business purposes --
such as to process your transactions, maintain your account(s), respond to court orders and legal investigations, or report to credit bureaus | Yes | No |
For our marketing purposes --
to offer our products and services to you | Yes | No |
| For joint marketing with other financial companies | Yes | No |
For our affiliates’ everyday business purposes --
information about your transactions and experiences | Yes | No |
For our affiliates’ everyday business purposes --
information about your creditworthiness | No | We don’t share |
| For nonaffiliates to market to you | No | We don’t share |
| Questions? | Call 1-631-490-4300 |
| Who we are |
| Who is providing this notice? | Northern Lights Fund Trust II |
| What we do |
How does NLFT II protect
my personal information? | To protect your personal information from unauthorized access and use, we use security measures that comply with federal law. These measures include computer safeguards and secured files and buildings. |
How does NLFT II collect
my personal information? | We collect your personal information, for example, when you |
● open an account ● give us your income information ● provide employment information | ● provide account information ● give us your contact information |
| We also collect your personal information from others, such as credit bureaus, affiliates, or other companies. |
| Why can’t I limit all sharing? | Federal law gives you the right to limit only ● sharing for affiliates’ everyday business purposes—information about your creditworthiness ● affiliates from using your information to market to you ● sharing for nonaffiliates to market to you State laws and individual companies may give you additional rights to limit sharing. |
| Definitions |
| Affiliates | Companies related by common ownership or control. They can be financial and nonfinancial companies. ● NLFT II has no affiliates. |
| Nonaffiliates | Companies not related by common ownership or control. They can be financial and nonfinancial companies. ● NLFT II does not share with nonaffiliates so they can market to you. |
| Joint marketing | A formal agreement between nonaffiliated financial companies that together market financial products and services to you. ● Our joint marketing partners include other financial service companies. |
PROXY VOTING POLICY
Information regarding how the Funds voted proxies relating to portfolio securities for the most recent twelve-month period ended June 30 as well as a description of the policies and procedures that the Funds use to determine how to vote proxies is available without charge, upon request, by calling (888) 920-7275 or by referring to the Securities and Exchange Commission’s (“SEC”) website at http://www.sec.gov.
PORTFOLIO HOLDINGS
The Funds file a complete schedule of portfolio holdings with the SEC for the first and third quarters of each fiscal year as an exhibit to their reports on Form N-PORT, within sixty days after the end of the period. Form N-PORT reports are available at the SEC’s website at www.sec.gov.
| INVESTMENT ADVISOR |
| LifeGoal Investments, LLC |
| 5 Spring Street, #202 |
| Saratoga Springs, NY 12866 |
| |
| INVESTMENT SUB-ADVISOR |
| Penserra Capital Management LLC |
| 4 Orinda Way, Suite 100 |
| Orinda, CA 94563 |
| |
| ADMINISTRATOR |
| Ultimus Fund Solutions, LLC |
| 225 Pictoria Drive, Suite 450 |
| Cincinnati, OH 45246 |
| |
| |
| |
| LIFEGOAL-AR22 |
(b) Not applicable.
Item 2. Code of Ethics.
(a) As of the end of the period covered by this report, the registrant has adopted a code of ethics that applies to the registrant's principal executive officer, principal financial officer, principal accounting officer or controller, or persons performing similar functions, regardless of whether these individuals are employed by the registrant or a third party.
(b) For purposes of this item, “code of ethics” means written standards that are reasonably designed to deter wrongdoing and to promote:
| (1) | Honest and ethical conduct, including the ethical handling of actual or apparent conflicts of interest between personal and professional relationships; |
| (2) | Full, fair, accurate, timely, and understandable disclosure in reports and documents that a registrant files with, or submits to, the Commission and in other public communications made by the registrant; |
| (3) | Compliance with applicable governmental laws, rules, and regulations; |
| (4) | The prompt internal reporting of violations of the code to an appropriate person or persons identified in the code; and |
| (5) | Accountability for adherence to the code. |
(c) Amendments: During the period covered by the report, there have not been any amendments to the provisions of the code of ethics.
(d) Waivers: During the period covered by the report, the registrant has not granted any express or implicit waivers from the provisions of the code of ethics.
(e) The Code of Ethics is not posted on Registrant’ website.
(f) A copy of the Code of Ethics is attached as an exhibit.
Item 3. Audit Committee Financial Expert.
(a) The Registrant’s board of trustees has determined that Keith Rhoades is an audit committee financial expert, as defined in Item 3 of Form N-CSR. Mr. Rhoades is independent for purposes of this Item 3.
Item 4. Principal Accountant Fees and Services.
2022 – $33,000
2021 – N/A
2022 – None
2021 – N/A
2022 – $9,000
2021 – N/A
Preparation of Federal & State income tax returns, assistance with calculation of required income, capital gain and excise distributions and preparation of Federal excise tax returns.
2022 - None
2021 – N/A
| (e) | (1) Audit Committee’s Pre-Approval Policies |
The registrant’s Audit Committee is required to pre-approve all audit services and, when appropriate, any non-audit services (including audit-related, tax and all other services) to the registrant. The registrant’s Audit Committee also is required to pre-approve, when appropriate, any non-audit services (including audit-related, tax and all other services) to its adviser, or any entity controlling, controlled by or under common control with the adviser that provides ongoing services to the registrant, to the extent that the services may be determined to have an impact on the operations or financial reporting of the registrant. Services are reviewed on an engagement by engagement basis by the Audit Committee.
| (2) | Percentages of Services Approved by the Audit Committee |
2022 2021
Audit-Related Fees: 0.00% 0.00%
Tax Fees: 0.00% 0.00%
All Other Fees: 0.00% 0.00%
| (f) | During the audit of registrant's financial statements for the most recent fiscal year, less than 50 percent of the hours expended on the principal accountant's engagement were attributed to work performed by persons other than the principal accountant's full-time, permanent employees. |
| (g) | The aggregate non-audit fees billed by the registrant's accountant for services rendered to the registrant, and rendered to the registrant's investment adviser (not including any sub-adviser whose role is primarily portfolio management and is subcontracted with or overseen by another investment adviser), and any entity controlling, controlled by, or under common control with the adviser that provides ongoing services to the registrant: |
2022 - $9,000
2021 – N/A
(h) The registrant's audit committee has considered whether the provision of non-audit services to the registrant's investment adviser (not including any sub-adviser whose role is primarily portfolio management and is subcontracted with or overseen by another investment adviser), and any entity controlling, controlled by, or under common control with the investment adviser that provides ongoing services to the registrant, that were not pre-approved pursuant to paragraph (c)(7)(ii) of Rule 2-01 of Regulation S-X, is compatible with maintaining the principal accountant's independence.
(i) Not applicable.
(j) Not applicable.
Item 5. Audit Committee of Listed Companies. The registrant is an issuer as defined in Rule 10A-3 under the Securities Exchange Act of 1934, as amended (the “Exchange Act”) and has a separately-designated standing audit committee established in accordance with Section 3(a)(58)A of the Exchange Act. The registrant’s audit committee members are Keith Rhoades, Brian Nielsen, Randy Skalla, Tony Lewis and Thomas T. Sarkany.
Item 6. Schedule of Investments. Schedule of investments in securities of unaffiliated issuers is included under Item 1.
Item 7. Disclosure of Proxy Voting Policies and Procedures for Closed-End Funds. Not applicable to open-end investment companies.
Item 8. Portfolio Managers of Closed-End Management Investment Companies. Not applicable to open-end investment companies.
Item 9. Purchases of Equity Securities by Closed-End Funds. Not applicable to open-end investment companies.
Item 10. Submission of Matters to a Vote of Security Holders. None
Item 11. Controls and Procedures.
(a) Based on an evaluation of the Registrant’s disclosure controls and procedures as of a date within 90 days of filing date of this Form N-CSR, the principal executive officer and principal financial officer of the Registrant have concluded that the disclosure controls and procedures of the Registrant are reasonably designed to ensure that the information required in filings on Form N-CSR is recorded, processed, summarized, and reported by the filing date, including that information required to be disclosed is accumulated and communicated to the Registrant’s management, including the Registrant’s principal executive officer and principal financial officer, as appropriate to allow timely decisions regarding required disclosure.
(b) There were no significant changes in the Registrant’s internal control over financial reporting that occurred during the period covered by this report that have materially affected, or are reasonably likely to materially affect, the Registrant’s internal control over financial reporting.
Item 12. Disclosure of Securities Lending Activities for Closed-End Management Investment Companies. Not applicable to open-end investment companies.
Item 13. Exhibits.
(a)(1) Code of Ethics filed herewith.
(a)(2) Certifications required by Section 302 of the Sarbanes-Oxley Act of 2002 (and Item 11(a)(2) of Form N-CSR) are filed herewith.
(a)(3) Not applicable for open-end investment companies.
(b) Certifications required by Section 906 of the Sarbanes-Oxley Act of 2002 (and Item 11(b) of Form N-CSR) are filed herewith.
SIGNATURES
Pursuant to the requirements of the Securities Exchange Act of 1934 and the Investment Company Act of 1940, the registrant has duly caused this report to be signed on its behalf by the undersigned, thereunto duly authorized.
(Registrant) Northern Lights Fund Trust II
By (Signature and Title)
/s/ Kevin E. Wolf
Kevin E. Wolf, Principal Executive Officer/President
Date 10/31/22
Pursuant to the requirements of the Securities Exchange Act of 1934 and the Investment Company Act of 1940, this report has been signed below by the following persons on behalf of the registrant and in the capacities and on the dates indicated.
By (Signature and Title)
/s/ Kevin E. Wolf
Kevin E. Wolf, Principal Executive Officer/President
Date 10/31/22
By (Signature and Title)
/s/ Erik Naviloff
Erik Naviloff, Principal Financial Officer/Treasurer
Date 10/31/22