united states
securities and exchange commission
washington, d.c. 20549
form n-csr
certified shareholder report of registered management
investment companies
Investment Company Act file number 811-22549
Northern Lights Fund Trust II
(Exact name of registrant as specified in charter)
225 Pictoria Drive, Suite 450 Cincinnati, OH 45246
(Address of principal executive offices) (Zip code)
Eric Kane, Ultimus Fund Solutions, LLC
80 Arkay Drive Suite 110, Hauppauge, NY 11788
(Name and address of agent for service)
Registrant's telephone number, including area code: 631-470-2600
Date of fiscal year end: 11/30
Date of reporting period: 11/30/22
Item 1. Reports to Stockholders.
| | | |
| | | |
| |  | |
| | | |
| | | |
| | North Star Opportunity Fund | |
| | Class I Shares (Symbol: NSOIX) | |
| | Class A Shares (Symbol: NSOPX) | |
| | | |
| | | |
| | North Star Micro Cap Fund | |
| | Class I Shares (Symbol: NSMVX) | |
| | | |
| | | |
| | North Star Dividend Fund | |
| | Class I Shares (Symbol: NSDVX) | |
| | | |
| | | |
| | North Star Bond Fund | |
| | Class I Shares (Symbol: NSBDX) | |
| | | |
| | | |
| | Annual Report | |
| | November 30, 2022 | |
| | | |
| | | |
| | | |
| | | |
| | | |
| | www.nsinvestfunds.com | |
| | Investor Information: 1-312-580-0900 | |
| | | |
| | | |
| | | |
| | | |
| | | |
| | | |
| | | |
| | | |
| | | |
| | | |
| Distributed by Northern Lights Distributors, LLC | |
| Member FINRA | |
| | | |
| | | |
| | | |
 | www.nsinvest.com |
The North Star Mutual Fund Family consists of four funds; The North Star Opportunity Fund, the North Star Micro Cap Fund, the North Star Dividend Fund, and the North Star Bond Fund. The first three funds share the objective of producing long-term capital appreciation by investing primarily in the common stocks of publicly traded companies that are trading at attractive enterprise values relative to their free cash flow, while the fourth invests in fixed income securities to generate monthly income:
| o | The North Star Opportunity Fund’s range of investments may include smaller, underfollowed companies to the largest multinational organizations as well as fixed income securities. The result is a diversified Micro to Macro portfolio of stocks and fixed income securities. As of November 30, 2022, 63.9% of the portfolio is in large and mid- cap stocks, 11.7% in small and micro-cap stocks, 1.1% in real estate investment trusts, 21.7% in fixed income securities, and 1.6% in cash and equivalents. |
| o | The North Star Micro Cap Fund invests in the common stocks of misunderstood or underfollowed companies with market capitalizations of under $1 billion. |
| o | The North Star Dividend Fund’s primary objective is to generate monthly income. The Fund seeks to achieve its objectives by investing in a diversified portfolio of common stocks of companies with market capitalizations of under $ 2.5 billion which offer attractive dividend yields. |
| o | The North Star Bond Fund will generally focus on bonds and other fixed income securities, with a focus on those issued by companies with market capitalizations of less than $2.5 billion. |
In last year’s annual letter, it was our outlook that GDP and corporate profit growth rates would moderate to more historically normal levels, and that interest rates would rise as monetary policy tightened. While directionally correct, we underestimated the magnitude of the interest rate increases in the first half of 2022, as well as the dramatic decline in real growth rates. Interest rates went from essentially zero percent to their highest levels in fifteen years in just nine months, while GDP turned negative modestly in the first two quarters, satisfying one definition of a recession. We were also only partially right in our optimistic view that the battle against the pandemic would be won through a combination of science and common sense. China has continued to struggle mightily with Covid-19, while in the U.S. new variants of the virus continued to spread, albeit with far fewer hospitalizations and deaths. Inflation remained elevated several months longer than we anticipated, and the labor market was tighter than we predicted, as fewer people joined the labor force resulting in in a record number of job openings. Russia’s invasion of Ukraine in the early spring was a major unforeseen headwind, not only causing a tragic loss of human life, but also disrupting both the global food supply and energy markets, therefore contributing to the inflationary pressures.
| |
Civic Opera Building | 20 N. Wacker Drive | Suite 1416 | Chicago, IL 60606 | Phone: 312.580.0900 | Fax: 312.580.0901
332 Skokie Valley Road | Suite 221 | Highland Park, IL 60035 | Phone: 847.831.8831 | Fax: 847.831.3205 |
| |
| Guiding Investors • Navigating Markets • Decades of Experience |
| |
Securities offered through NewEdge Securities, Inc. member FINRA/SIPC. Financial advice is offered through North Star Investment Management Corp. (North Star)
an SEC Registered Investment Adviser. North Star is not a subsidiary or control affiliate of NewEdge Securities, Inc. |
| |
| www.nsinvest.com |
Recessionary fears dominated the narrative as consumer confidence plummeted to its lowest level in decades, while the yield curve inverted in July and became increasingly negatively sloped through the end of November.
The combination of all these factors led to a very difficult period in the financial markets and for the North Star Family of Funds, with the results for the 12-month period ending 11/30/2022 detailed below:
| Fund | Total Return for
the 12 Month
Period | NAV
11/30/2022 | Distributions
During Period | NAV
11/30/2021 | Total
Assets (in
000’s) |
| North Star Opportunity Fund A | -17.70% | $16.09 | $0.4864 | $20.05 | $19,469 |
| North Star Opportunity Fund I | -17.48% | $16.05 | $0.5354 | $20.00 | $118,346 |
| North Star Micro Cap Fund I | -21.34% | $31.81 | $1.3544 | $41.77 | $93,664 |
| North Star Dividend Fund I | -0.96% | $22.33 | $0.8705 | $23.43 | $87,280 |
| North Star Bond Fund I | -5.79%* | $8.73 | $0.2244 | $9.49 | $27,241 |
| * | The total return is calculated using the traded NAV on November 30, 2022, which may differ from what is presented in the financial highlights. |
Our outlook for 2023 is for very modest GDP and corporate profit growth rates in the early months, with the economy gaining more solid footing as the year progresses. We believe that the yield curve will return to a positive slope through the combination of rising long-term rates and moderating short-term rates.
Finally, we believe that terrific bargains can be found in the types of companies we focus on in the North Star Family of Funds. The business quality characteristics (operating margins, return on equity, and revenue growth history) of the companies in our Funds remain solid, while their valuation measures (enterprise value/EBITDA, price/book, dividend yields) have become significantly more attractive following the share price declines of 2022. These discount valuations are particularly apparent in the consumer discretionary sector, which is an area of concentration in our funds. If there is a rebound in consumer confidence, those shares could benefit disproportionally.
We thank you for your investment in the North Star Funds.
| |
Civic Opera Building | 20 N. Wacker Drive | Suite 1416 | Chicago, IL 60606 | Phone: 312.580.0900 | Fax: 312.580.0901
332 Skokie Valley Road | Suite 221 | Highland Park, IL 60035 | Phone: 847.831.8831 | Fax: 847.831.3205 |
| |
| Guiding Investors • Navigating Markets • Decades of Experience |
| |
Securities offered through NewEdge Securities, Inc. member FINRA/SIPC. Financial advice is offered through North Star Investment Management Corp. (North Star)
an SEC Registered Investment Adviser. North Star is not a subsidiary or control affiliate of NewEdge Securities, Inc. |
| |
| www.nsinvest.com |
Please remember that past performance may not be indicative and is no guarantee of future results. The fund performance data quoted here represents past performance. Current performance may be lower or higher than the performance data quoted above. Investment return and principal value will fluctuate, so that shares, when redeemed, may be worth more or less than their original cost. A Fund’s performance, especially for very short periods of time, should not be the sole factor in making your investment decisions. For current performance information, please visit www.nsinvestfunds.com or call 1-312-580-0900. All performance figures reflect fee waivers and expense subsidies, without which performance figures would have been lower.
The indices shown are for informational purposes only and are not reflective of any investment. As it is not possible to invest in the indices, the data shown does not reflect or compare features of an actual investment, such as its objectives, costs and expenses, liquidity, safety, guarantees or insurance, fluctuation of principal or return, or tax features. Past performance is no guarantee of future results.
S&P 500 Index is an unmanaged composite of 500 large capitalization companies. This index is widely used by professional investors as a performance benchmark for large-cap stocks.
Russell 2000® Index is an unmanaged index that is a widely recognized indicator of small capitalization company performance. It includes approximately 2000 of the smallest securities based on a combination of their market cap and current index membership.
7241-NLD-12192022
| |
Civic Opera Building | 20 N. Wacker Drive | Suite 1416 | Chicago, IL 60606 | Phone: 312.580.0900 | Fax: 312.580.0901
332 Skokie Valley Road | Suite 221 | Highland Park, IL 60035 | Phone: 847.831.8831 | Fax: 847.831.3205 |
| |
| Guiding Investors • Navigating Markets • Decades of Experience |
| |
Securities offered through NewEdge Securities, Inc. member FINRA/SIPC. Financial advice is offered through North Star Investment Management Corp. (North Star)
an SEC Registered Investment Adviser. North Star is not a subsidiary or control affiliate of NewEdge Securities, Inc. |
| |
| North Star Opportunity Fund |
| PORTFOLIO REVIEW (Unaudited) |
| November 30, 2022 |
| |
Comparison of the Change in Value of a $10,000 Investment
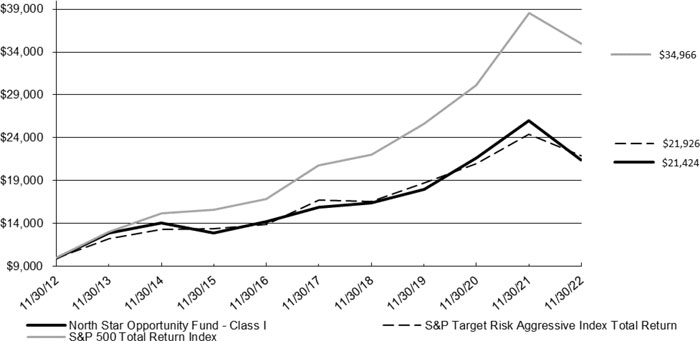
The Fund’s performance* figures for the periods ended November 30, 2022, compared to its benchmark:
| | | | | Since | Since |
| | | Five Year | Ten Year | Inception** | Inception*** |
| | One Year | (Annualized) | (Annualized) | (Annualized) | (Annualized) |
| North Star Opportunity Fund – Class A | (17.70)% | 5.87% | 7.77% | 8.33% | N/A |
| North Star Opportunity Fund – Class A with load | (22.42)% | 4.63% | 7.13% | 7.74% | N/A |
| North Star Opportunity Fund – Class I (a) | (17.48)% | 6.13% | 7.92% | N/A | 5.83% |
| S&P 500 Total Return Index (b) | (9.21)% | 10.98% | 13.34% | 13.89% | 9.05% |
| S&P Target Risk Aggressive Index Total Return (c) | (10.05)% | 5.51% | 8.17% | 8.94% | 6.09% |
| | | | | | |
| * | Past performance is not predictive of future results. The performance comparison includes reinvestment of all dividends and capital gains and has been adjusted for the Class A maximum applicable sales charge of 5.75%. Shares held for less than 30 days are subject to a 2.00% redemption fee. The total operating expense ratios (including indirect expenses), as stated in the Fund’s Prospectus dated April 1, 2022, are 1.56% and 1.32% for Class A and Class I shares, respectively. The investment return and principal value of an investment will fluctuate. An investor’s shares, when redeemed, may be worth more or less than the original cost. Total return is calculated assuming reinvestment of all dividends and distributions. The returns shown do not reflect the deduction of taxes that a shareholder would pay on Fund distributions or on the redemptions of Fund shares. Returns greater than 1 year are annualized. Total returns would have been lower had the advisor not waived its fees and reimbursed a portion of the fund’s expenses. For performance information current to the most recent month-end, please call 1-312-580-0900. |
| ** | Inception date is December 15, 2011. |
| *** | Inception date is December 31, 2006 (Predecessor Fund). |
| (a) | The North Star Opportunity Fund is the successor to the North Star Opportunity Fund, L.P. (the “Predecessor Fund”), which transferred its assets to the Fund in connection with the Fund’s commencement of operations. The Predecessor Fund was managed by the same adviser who currently manages the Fund, and had substantially similar investment objectives and strategies to those of the Fund. The performance includes the performance of the Predecessor Fund prior to the commencement of the Fund’s operations. The |
| North Star Opportunity Fund |
| PORTFOLIO REVIEW (Unaudited) (Continued) |
| November 30, 2022 |
| |
Predecessor Fund’s performance has been adjusted to reflect the annual deduction of fees and expenses applicable to the Class I Shares. The Predecessor Fund was not registered as a mutual fund under the Investment Company Act of 1940, as amended (the “1940 Act”), and therefore was not subject to certain investment restrictions, limitations and diversification requirements imposed by the 1940 Act and the Internal Revenue Code of 1986, as amended (the “Code”). If the Predecessor Fund had been registered under the 1940 Act, its performance may have been different.
| (b) | The S&P 500 Total Return Index is an unmanaged market capitalization-weighted index which is comprised of 500 of the largest U.S. domiciled companies and includes the reinvestment of all dividends. Investors cannot invest directly in an index or benchmark. |
| (c) | The S&P Target Risk Aggressive Index Total Return is designed to measure the performance of aggressive stock-bond allocations to equities, seeking to maximize opportunities for long-term capital accumulation. It may include small allocations to fixed income to enhance portfolio efficiency. Investors cannot invest directly in an index or benchmark. |
The Fund’s Top Ten Industries are as follows:
| Industries | | % of Net Assets | |
| Asset Management | | | 13.4 | % |
| Biotech & Pharma | | | 12.0 | % |
| Healthcare Facilities & Services | | | 5.8 | % |
| Banking | | | 5.3 | % |
| Semiconductors | | | 5.0 | % |
| Entertainment Content | | | 4.9 | % |
| Technology Hardware | | | 3.5 | % |
| Beverages | | | 3.1 | % |
| E-Commerce Discretionary | | | 3.0 | % |
| Internet Media & Services | | | 2.9 | % |
| Other Industries | | | 27.3 | % |
| Short-Term Investment and Other Assets Net of Liabilities | | 13.8 | % |
| | | | 100.0 | % |
| | | | | |
Please refer to the Schedule of Investments in this annual report for a detailed analysis of the Fund’s holdings.
| North Star Micro Cap Fund |
| PORTFOLIO REVIEW (Unaudited) |
| November 30, 2022 |
| |
Comparison of the Change in Value of a $10,000 Investment
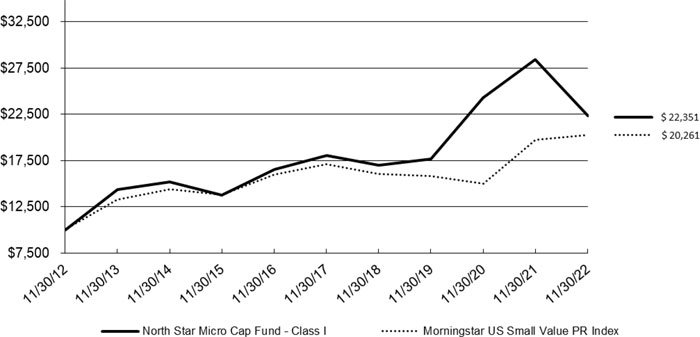
The Fund’s performance* figures for the periods ended November 30, 2022, compared to its benchmark:
| | | | | Since |
| | | Five Year | Ten Year | Inception** |
| | One Year | (Annualized) | (Annualized) | (Annualized) |
| North Star Micro Cap Fund – Class I (a) | (21.34)% | 4.42% | 8.38% | 9.53% |
| Morningstar US Small Value PR Index (b) | 2.53% | 3.43% | 7.32% | 6.31% |
| | | | | |
| * | Past performance is not predictive of future results. The performance comparison includes reinvestment of all dividends and capital gains. Shares held for less than 30 days are subject to a 2.00% redemption fee. The total operating expense ratio (including indirect expenses), as stated in the Fund’s Prospectus dated April 1, 2022, is 1.30% for Class I shares. The investment return and principal value of an investment will fluctuate. An investor’s shares, when redeemed, may be worth more or less than the original cost. Total return is calculated assuming reinvestment of all dividends and distributions. The returns shown do not reflect the deduction of taxes that a shareholder would pay on Fund distributions or on the redemptions of Fund shares. Returns greater than 1 year are annualized. Total returns would have been lower had the advisor not waived its fees and reimbursed a portion of the Fund’s expenses. For performance information current to the most recent month-end, please call 1-312-580-0900. |
| ** | Inception date is December 31, 1997 (Predecessor Fund). |
| (a) | The North Star Micro Cap Fund is the successor to the Kuby Gottlieb Special Value Fund, L.P. (the “Predecessor Fund”), which transferred its assets to the North Star Micro Cap Fund in connection with the North Star Micro Cap Fund’s commencement of operations. The Predecessor Fund was managed by the same adviser who currently manages the North Star Micro Cap Fund, and had substantially similar investment objectives and strategies to those of the North Star Micro Cap Fund. The performance includes the performance of the Predecessor Fund prior to the commencement of the North Star Micro Cap Fund’s operations. The Predecessor Fund’s performance has been adjusted to reflect the annual deduction of fees and expenses applicable to the Class I Shares. The Predecessor Fund was not registered as a mutual fund under the Investment Company Act of 1940, as amended (the “1940 Act”), and therefore was not subject to certain investment restrictions, limitations and diversification requirements imposed by the 1940 Act and the Internal Revenue Code of 1986, as amended (the “Code”). If the Predecessor Fund had been registered under the 1940 Act, its performance may have been different. |
| (b) | The Morningstar US Small Value PR Index measures the performance of small-cap stocks with relatively low prices given anticipated |
| North Star Micro Cap Fund |
| PORTFOLIO REVIEW (Unaudited) (Continued) |
| November 30, 2022 |
| |
per-share earnings, book value, cash flow, sales and dividends. Investors cannot invest directly in an index or benchmark.
The Morningstar US Small Value PR Index is not sponsored, endorsed, sold or promoted by Morningstar, Inc. or any of its affiliates (all such entities, collectively, “Morningstar Entities”). The Morningstar Entities make no representation or warranty, express or implied, to the owners of The Morningstar US Small Value PR Index or any member of the public regarding the advisability of investing in funds categorized as Small Value generally or in The Morningstar US Small Value PR Index in particular or the ability of the North Star Micro Cap Fund to track general Small Value market performance.
THE MORNINGSTAR ENTITIES DO NOT GUARANTEE THE ACCURACY AND/OR THE COMPLETENESS OF THE NORTH STAR MICRO CAP FUND OR ANY DATA INCLUDED THEREIN AND MORNINGSTAR ENTITIES SHALL HAVE NO LIABILITY FOR ANY ERRORS, OMISSIONS, OR INTERRUPTIONS THEREIN.
The Fund’s Top Ten Industries are as follows:
| Industries | | % of Net Assets | |
| Retail - Discretionary | | | 12.5 | % |
| Commercial Support Services | | | 11.5 | % |
| Apparel & Textile Products | | | 8.5 | % |
| Machinery | | | 6.4 | % |
| Leisure Products | | | 5.3 | % |
| Construction Materials | | | 5.1 | % |
| E-Commerce Discretionary | | | 4.9 | % |
| Electrical Equipment | | | 4.6 | % |
| Banking | | | 4.3 | % |
| Industrial Intermediate Prod | | | 3.6 | % |
| Other Industries | | | 24.4 | % |
| Short-Term Investments and Other Assets Net of Liabilities | | 8.9 | % |
| | | | 100.0 | % |
| | | | | |
Please refer to the Schedule of Investments in this annual report for a detailed analysis of the Fund’s holdings.
| North Star Dividend Fund |
| PORTFOLIO REVIEW (Unaudited) |
| November 30, 2022 |
| |
Comparison of the Change in Value of a $10,000 Investment
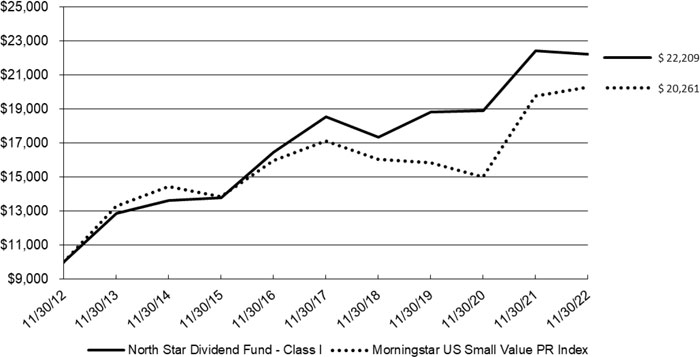
The Fund’s performance* figures for the periods ended November 30, 2022, compared to its benchmark:
| | | | | Since |
| | | Five Year | Ten Year | Inception** |
| | One Year | (Annualized) | (Annualized) | (Annualized) |
| North Star Dividend Fund – Class I (a) | (0.96)% | 3.69% | 8.31% | 9.62% |
| Morningstar US Small Value PR Index (b) | 2.53% | 3.43% | 7.32% | 8.04% |
| | | | | |
| * | Past performance is not predictive of future results. The performance comparison includes reinvestment of all dividends and capital gains. Shares held for less than 30 days are subject to a 2.00% redemption fee. The total operating expense ratio (including indirect expenses), as stated in the Fund’s Prospectus dated April 1, 2022, is 1.37% for Class I shares. The investment return and principal value of an investment will fluctuate. An investor’s shares, when redeemed, may be worth more or less than the original cost. Total return is calculated assuming reinvestment of all dividends and distributions. The returns shown do not reflect the deduction of taxes that a shareholder would pay on Fund distributions or on the redemptions of Fund shares. Returns greater than 1 year are annualized. Total returns would have been lower had the adviser not waived its fees and reimbursed a portion of the Fund’s expenses. For performance information current to the most recent month-end, please call 1-312-580-0900. |
| ** | Inception date is February 1, 2010. |
| (a) | The North Star Dividend Fund is the successor to the North Star Dividend Fund, L.P. (the “Predecessor Fund”), which transferred its assets to the North Star Dividend Fund in connection with the North Star Dividend Fund’s commencement of operations. The Predecessor Fund was managed by the same adviser who currently manages the North Star Dividend Fund, and had substantially similar investment objectives and strategies to those of the North Star Dividend Fund. The performance includes the performance of the Predecessor Fund prior to the commencement of the North Star Dividend Fund’s operations. The Predecessor Fund’s performance has been adjusted to reflect the annual deduction of fees and expenses applicable to the Class I Shares. The Predecessor Fund was not registered as a mutual fund under the Investment Company Act of 1940, as amended (the “1940 Act”), and therefore was not subject to certain investment restrictions, limitations and diversification requirements imposed by the 1940 Act and the Internal Revenue Code of 1986, as amended (the “Code”). If the Predecessor Fund had been registered under the 1940 Act, its performance may have been different. |
| North Star Dividend Fund |
| PORTFOLIO REVIEW (Unaudited) (Continued) |
| November 30, 2022 |
| |
| (b) | The Morningstar US Small Value PR Index measures the performance of small-cap stocks with relatively low prices given anticipated per-share earnings, book value, cash flow, sales and dividends. Investors cannot invest directly in an index or benchmark. |
The Morningstar US Small Value PR Index is not sponsored, endorsed, sold or promoted by Morningstar, Inc. or any of its affiliates (all such entities, collectively, “Morningstar Entities”). The Morningstar Entities make no representation or warranty, express or implied, to the owners of The Morningstar US Small Value PR Index or any member of the public regarding the advisability of investing in funds categorized as Small Value generally or in The Morningstar US Small Value PR Index in particular or the ability of the North Star Dividend Fund to track general Small Value market performance.
THE MORNINGSTAR ENTITIES DO NOT GUARANTEE THE ACCURACY AND/OR THE COMPLETENESS OF THE NORTH STAR DIVIDEND FUND OR ANY DATA INCLUDED THEREIN AND MORNINGSTAR ENTITIES SHALL HAVE NO LIABILITY FOR ANY ERRORS, OMISSIONS, OR INTERRUPTIONS THEREIN.
The Fund’s Top Ten Industries are as follows:
| Industries | | % of Net Assets | |
| Banking | | | 12.2 | % |
| Commercial Support Services | | | 6.6 | % |
| Gas & Water Utilities | | | 5.8 | % |
| Electric Utilities | | | 5.7 | % |
| Electrical Equipment | | | 5.7 | % |
| Asset Management | | | 5.6 | % |
| Apparel & Textile Products | | | 5.2 | % |
| Real Estate Owners & Developers | | | 4.6 | % |
| Chemicals | | | 4.5 | % |
| Home & Office Products | | | 4.1 | % |
| Other Industries | | | 28.4 | % |
| Short-Term Investments and Other Assets Net of Liabilities | | 11.6 | % |
| | | | 100.0 | % |
| | | | | |
Please refer to the Schedule of Investments in this annual report for a detailed analysis of the Fund’s holdings.
| North Star Bond Fund |
| PORTFOLIO REVIEW (Unaudited) |
| November 30, 2022 |
| |
Comparison of the Change in Value of a $10,000 Investment
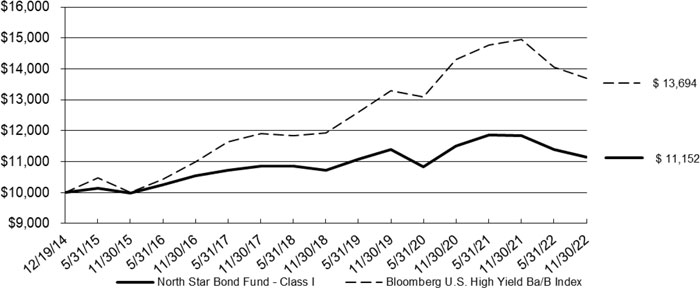
The Fund’s performance* figures for the periods ended November 30, 2022, compared to its benchmark:
| | | | Since |
| | | Five Year | Inception** |
| | One Year | (Annualized) | (Annualized) |
| North Star Bond Fund – Class I | (5.79)% | 0.53% | 1.38% |
| Bloomberg U.S. High Yield Ba/B Index (a) | (8.36)% | 2.83% | 4.03% |
| | | | |
| * | Past performance is not predictive of future results. Shares held for less than 30 days are subject to a 2.00% redemption fee. The performance comparison includes reinvestment of all dividends and capital gains. The total operating expense ratio (including indirect expenses), as stated in the Fund’s Prospectus dated April 1, 2022, is 1.60% for Class I shares. The investment return and principal value of an investment will fluctuate. An investor’s shares, when redeemed, may be worth more or less than the original cost. The North Star Bond Fund Class I return is calculated using the traded NAV on November 30, 2022, which may differ from what is presented in the financial highlights. Total return is calculated assuming reinvestment of all dividends and distributions. The returns shown do not reflect the deduction of taxes that a shareholder would pay on Fund distributions or on the redemptions of Fund shares. Total returns would have been lower had the adviser not waived its fees and reimbursed a portion of the Fund’s expenses. Performance figures are not annualized. For performance information current to the most recent month-end, please call 1-312-580-0900. |
| ** | Inception date is December 19, 2014. |
| (a) | The Bloomberg U.S. High Yield Ba/B Index measures the performance of bonds with Ba or B ratings. Investors cannot invest directly in an index or benchmark. |
| North Star Bond Fund |
| PORTFOLIO REVIEW (Unaudited) (Continued) |
| November 30, 2022 |
| |
The Fund’s Top Ten Industries are as follows:
| Industries | | % of Net Assets | |
| Automotive | | | 10.0 | % |
| Leisure Facilities & Services | | | 9.9 | % |
| Transportation Equipment | | | 9.1 | % |
| Asset Management | | | 8.5 | % |
| Real Estate Investment Trusts | | | 7.9 | % |
| Specialty Finance | | | 5.3 | % |
| Apparel & Textile Products | | | 5.0 | % |
| Health Care Facilities & Services | | | 4.8 | % |
| Home & Office Products | | | 4.8 | % |
| Telecommunications | | | 4.5 | % |
| Other Industries | | | 16.1 | % |
| Short-Term Investments and Other Assets Net of Liabilities | | 14.1 | % |
| | | | 100.0 | % |
| | | | | |
Please refer to the Schedule of Investments in this annual report for a detailed analysis of the Fund’s holdings.
| NORTH STAR OPPORTUNITY FUND |
| SCHEDULE OF INVESTMENTS |
| November 30, 2022 |
| Shares | | | | | Fair Value | |
| | | | | COMMON STOCKS — 76.8% | | | | |
| | | | | ASSET MANAGEMENT - 10.9% | | | | |
| | 65,000 | | | Blackstone, Inc. | | $ | 5,949,450 | |
| | 140,000 | | | Compass Diversified Holdings | | | 2,738,400 | |
| | 74,000 | | | KKR & Company, Inc. | | | 3,842,080 | |
| | 71,000 | | | Sprott, Inc. | | | 2,543,930 | |
| | | | | | | | 15,073,860 | |
| | | | | AUTOMOTIVE - 0.1% | | | | |
| | 131,000 | | | Sono Group N.V.(a) | | | 166,370 | |
| | | | | | | | | |
| | | | | BANKING - 5.3% | | | | |
| | 105,000 | | | Bank of America Corporation | | | 3,974,250 | |
| | 24,000 | | | JPMorgan Chase & Company | | | 3,316,320 | |
| | | | | | | | 7,290,570 | |
| | | | | BEVERAGES - 3.1% | | | | |
| | 50,000 | | | Keurig Dr Pepper, Inc. | | | 1,933,500 | |
| | 12,000 | | | PepsiCo, Inc. | | | 2,226,120 | |
| | | | | | | | 4,159,620 | |
| | | | | BIOTECH & PHARMA - 12.0% | | | | |
| | 28,000 | | | AbbVie, Inc. | | | 4,513,040 | |
| | 40,000 | | | Bristol-Myers Squibb Company | | | 3,211,200 | |
| | 119,000 | | | Pfizer, Inc. | | | 5,965,470 | |
| | 19,000 | | | Zoetis, Inc. | | | 2,928,660 | |
| | | | | | | | 16,618,370 | |
| | | | | CHEMICALS - 1.1% | | | | |
| | 30,000 | | | Mosaic Company (The) | | | 1,539,000 | |
| | | | | | | | | |
| | | | | COMMERCIAL SUPPORT SERVICES - 2.8% | | | | |
| | 284,000 | | | BGSF, Inc. | | | 3,751,640 | |
| | | | | | | | | |
| | | | | E-COMMERCE DISCRETIONARY - 3.0% | | | | |
| | 20,000 | | | Amazon.com, Inc.(a) | | | 1,930,800 | |
| | 410,000 | | | CarParts.com, Inc.(a) | | | 2,222,200 | |
| | | | | | | | 4,153,000 | |
| | | | | | | | | |
The accompanying notes are an integral part of these financial statements.
| NORTH STAR OPPORTUNITY FUND |
| SCHEDULE OF INVESTMENTS (Continued) |
| November 30, 2022 |
| Shares | | | | | Fair Value | |
| | | | | COMMON STOCKS — 76.8% (Continued) | | | | |
| | | | | ELECTRICAL EQUIPMENT - 1.3% | | | | |
| | 840,000 | | | Orion Energy Systems, Inc.(a) | | $ | 1,780,800 | |
| | | | | | | | | |
| | | | | ENTERTAINMENT CONTENT - 4.9% | | | | |
| | 61,000 | | | Madison Square Garden Entertainment Corporation(a) | | | 2,935,320 | |
| | 115,000 | | | Paramount Global, Class B | | | 2,309,200 | |
| | 16,000 | | | Walt Disney Company (The)(a) | | | 1,565,920 | |
| | | | | | | | 6,810,440 | |
| | | | | FOOD - 1.6% | | | | |
| | 14,500 | | | J M Smucker Company (The) | | | 2,233,145 | |
| | | | | | | | | |
| | | | | HEALTH CARE FACILITIES & SERVICES - 4.7% | | | | |
| | 47,000 | | | CVS Health Corporation | | | 4,788,360 | |
| | 3,000 | | | UnitedHealth Group, Inc. | | | 1,643,280 | |
| | | | | | | | 6,431,640 | |
| | | | | INTERNET MEDIA & SERVICES - 2.9% | | | | |
| | 39,000 | | | Alphabet, Inc., Class A(a) | | | 3,938,610 | |
| | | | | | | | | |
| | | | | LEISURE FACILITIES & SERVICES - 0.9% | | | | |
| | 52,000 | | | Wendy’s Company (The) | | | 1,173,120 | |
| | | | | | | | | |
| | | | | LEISURE PRODUCTS - 1.5% | | | | |
| | 100,000 | | | Topgolf Callaway Brands Corporation(a) | | | 2,095,000 | |
| | | | | | | | | |
| | | | | METALS & MINING - 1.2% | | | | |
| | 41,000 | | | Freeport-McMoRan, Inc. | | | 1,631,800 | |
| | | | | | | | | |
| | | | | RESIDENTIAL REIT - 0.6% | | | | |
| | 47,000 | | | UMH Properties, Inc. | | | 827,670 | |
| | | | | | | | | |
| | | | | RETAIL - CONSUMER STAPLES - 2.4% | | | | |
| | 20,000 | | | Target Corporation | | | 3,341,400 | |
| | | | | | | | | |
The accompanying notes are an integral part of these financial statements.
| NORTH STAR OPPORTUNITY FUND |
| SCHEDULE OF INVESTMENTS (Continued) |
| November 30, 2022 |
| Shares | | | | | Fair Value | |
| | | | | COMMON STOCKS — 76.8% (Continued) | | | | |
| | | | | RETAIL - DISCRETIONARY - 1.6% | | | | |
| | 33,000 | | | Boot Barn Holdings, Inc.(a) | | $ | 2,222,550 | |
| | | | | | | | | |
| | | | | SEMICONDUCTORS - 5.0% | | | | |
| | 50,000 | | | Advanced Micro Devices, Inc.(a) | | | 3,881,500 | |
| | 23,000 | | | QUALCOMM, Inc. | | | 2,909,270 | |
| | | | | | | | 6,790,770 | |
| | | | | SPECIALTY REITS - 0.5% | | | | |
| | 16,000 | | | EPR Properties | | | 665,760 | |
| | | | | | | | | |
| | | | | TECHNOLOGY HARDWARE - 3.5% | | | | |
| | 33,000 | | | Apple, Inc. | | | 4,884,990 | |
| | | | | | | | | |
| | | | | TECHNOLOGY SERVICES - 2.2% | | | | |
| | 25,000 | | | Paychex, Inc. | | | 3,100,750 | |
| | | | | | | | | |
| | | | | TRANSPORTATION & LOGISTICS - 1.5% | | | | |
| | 11,000 | | | United Parcel Service, Inc., Class B | | | 2,087,030 | |
| | | | | | | | | |
| | | | | TRANSPORTATION EQUIPMENT - 0.1% | | | | |
| | 15,000 | | | Blue Bird Corporation(a) | | | 177,150 | |
| | | | | | | | | |
| | | | | WHOLESALE - DISCRETIONARY - 2.1% | | | | |
| | 124,096 | | | Acme United Corporation | | | 2,938,593 | |
| | | | | | | | | |
| | | | | TOTAL COMMON STOCKS (Cost $60,147,879) | | | 105,883,648 | |
| | | | | | | | | |
| | | | | PREFERRED STOCKS —1.8% | | | | |
| | | | | ASSET MANAGEMENT — 1.8% | | | | |
| | 42,000 | | | B Riley Financial, Inc., 6.375% | | | 1,004,640 | |
| | 60,000 | | | Compass Diversified Holdings, 7.875% | | | 1,498,800 | |
| | | | | TOTAL PREFERRED STOCKS (Cost $2,423,536) | | | 2,503,440 | |
| | | | | | | | | |
The accompanying notes are an integral part of these financial statements.
| NORTH STAR OPPORTUNITY FUND |
| SCHEDULE OF INVESTMENTS (Continued) |
| November 30, 2022 |
| Principal | | | | | Coupon Rate | | | | | |
| Amount ($) | | | | | (%) | | Maturity | | Fair Value | |
| | | | | CORPORATE BONDS — 6.9% | | | | | | | | |
| | | | | ASSET MANAGEMENT — 0.7% | | | | | | | | |
| | 1,000,000 | | | Blackstone Secured Lending Fund | | 3.6500 | | 07/14/23 | | $ | 988,545 | |
| | | | | | | | | | | | | |
| | | | | AUTOMOTIVE — 1.0% | | | | | | | | |
| | 1,350,000 | | | Ford Motor Company | | 7.1250 | | 11/15/25 | | | 1,387,976 | |
| | | | | | | | | | | | | |
| | | | | HEALTH CARE FACILITIES & SERVICES — 1.1% | | | | | | | | |
| | 500,000 | | | McKesson Corporation | | 3.7960 | | 03/15/24 | | | 492,372 | |
| | 1,000,000 | | | Owens & Minor, Inc. | | 4.3750 | | 12/15/24 | | | 957,690 | |
| | | | | | | | | | | | 1,450,062 | |
| | | | | INSTITUTIONAL FINANCIAL SERVICES — 0.7% | | | | | | | | |
| | 1,000,000 | | | Lazard Group, LLC | | 3.7500 | | 02/13/25 | | | 967,269 | |
| | | | | | | | | | | | | |
| | | | | LEISURE FACILITIES & SERVICES — 1.4% | | | | | | | | |
| | 1,850,000 | | | Wendy’s International, LLC | | 7.0000 | | 12/15/25 | | | 1,867,574 | |
| | | | | | | | | | | | | |
| | | | | OIL & GAS PRODUCERS — 0.6 % | | | | | | | | |
| | 869,000 | | | Murphy Oil Corporation | | 5.7500 | | 08/15/25 | | | 866,575 | |
| | | | | | | | | | | | | |
| | | | | RETAIL - DISCRETIONARY — 0.4% | | | | | | | | |
| | 600,000 | | | Sally Holdings, LLC / Sally Capital, Inc. | | 5.6250 | | 12/01/25 | | | 575,028 | |
| | | | | | | | | | | | | |
| | | | | TRANSPORTATION EQUIPMENT — 1.0% | | | | | | | | |
| | 1,500,000 | | | Trinity Industries, Inc. | | 4.5500 | | 10/01/24 | | | 1,445,550 | |
| | | | | | | | | | | | | |
| | | | | TOTAL CORPORATE BONDS (Cost $9,943,396) | | | | | | | 9,548,579 | |
| | | | | | | | | | | | | |
| | | | | U.S. GOVERNMENT & AGENCIES — 0.7% | | | | | | | | |
| | | | | U.S. TREASURY NOTES — 0.7% | | | | | | | | |
| | 1,000,000 | | | United States Treasury Note (Cost $984,426) | | 0.1250 | | 08/15/23 | | | 967,924 | |
| | | | | | | | | | | | | |
The accompanying notes are an integral part of these financial statements.
| NORTH STAR OPPORTUNITY FUND |
| SCHEDULE OF INVESTMENTS (Continued) |
| November 30, 2022 |
| Shares | | | | | Fair Value | |
| | | | | SHORT-TERM INVESTMENTS — 13.7% | | | | |
| | | | | MONEY MARKET FUNDS - 1.5% | | | | |
| | 2,125,569 | | | First American Treasury Obligations Fund, Class X, 3.73% (Cost $2,125,569)(b) | | $ | 2,125,569 | |
| | | | | | | | | |
| Principal | | | | | Coupon Rate | | | | | |
| Amount ($) | | | | | (%) | | Maturity | | | |
| | | | | U.S. TREASURY BILLS — 12.2% | | | | | | | | |
| | 2,000,000 | | | United States Treasury Bill(c) | | 3.7200 | | 12/29/22 | | | 1,994,107 | |
| | 3,000,000 | | | United States Treasury Bill(c) | | 3.7500 | | 01/05/23 | | | 2,988,956 | |
| | 2,000,000 | | | United States Treasury Bill(c) | | 4.1400 | | 02/09/23 | | | 1,984,028 | |
| | 1,000,000 | | | United States Treasury Bill(c) | | 4.1800 | | 02/23/23 | | | 990,358 | |
| | 1,000,000 | | | United States Treasury Bill(c) | | 4.2900 | | 03/23/23 | | | 986,894 | |
| | 2,000,000 | | | United States Treasury Bill(c) | | 4.2500 | | 04/06/23 | | | 1,970,886 | |
| | 3,000,000 | | | United States Treasury Bill(c) | | 4.6100 | | 05/11/23 | | | 2,939,902 | |
| | 1,000,000 | | | United States Treasury Bill(c) | | 4.5000 | | 06/15/23 | | | 976,302 | |
| | 2,000,000 | | | United States Treasury Bill(c) | | 4.6200 | | 09/07/23 | | | 1,931,278 | |
| | | | | TOTAL U.S. TREASURY BILLS (Cost $16,804,031) | | | | 16,762,711 | |
| | | | | | | | | | | | | |
| | | | | TOTAL SHORT-TERM INVESTMENTS (Cost$1 8,929,600) | | | | | 18,888,280 | |
| | | | | | | | | | | | | |
| | | | | TOTAL INVESTMENTS - 99.9% (Cost $92,428,837) | | | | $ | 137,791,871 | |
| | | | | OTHER ASSETS IN EXCESS OF LIABILITIES - 0.1% | | | | | 22,626 | |
| | | | | NET ASSETS - 100.0% | | | | $ | 137,814,497 | |
| LLC | - Limited Liability Company |
| | |
| NV | - Naamioze Vennootschap |
| | |
| REIT | - Real Estate Investment Trust |
| | |
| (a) | Non-income producing security. |
| (b) | Rate disclosed is the seven day effective yield as of November 30, 2022. |
| (c) | Zero coupon bond. Rate disclosed is the current yield as of November 30, 2022. |
The accompanying notes are an integral part of these financial statements.
| NORTH STAR MICRO CAP FUND |
| SCHEDULE OF INVESTMENTS |
| November 30, 2022 |
| Shares | | | | | Fair Value | |
| | | | | COMMON STOCKS — 91.1% | | | | |
| | | | | APPAREL & TEXTILE PRODUCTS - 8.5% | | | | |
| | 78,000 | | | Delta Apparel, Inc.(a) | | $ | 1,029,600 | |
| | 149,000 | | | Lakeland Industries, Inc.(a) | | | 1,986,170 | |
| | 26,500 | | | Movado Group, Inc. | | | 853,035 | |
| | 102,500 | | | Rocky Brands, Inc. | | | 2,898,700 | |
| | 122,600 | | | Superior Group of Companies, Inc. | | | 1,226,000 | |
| | | | | | | | 7,993,505 | |
| | | | | ASSET MANAGEMENT - 1.1% | | | | |
| | 85,000 | | | Westwood Holdings Group, Inc. | | | 1,021,700 | |
| | | | | | | | | |
| | | | | AUTOMOTIVE - 1.0% | | | | |
| | 33,731 | | | Miller Industries, Inc. | | | 930,638 | |
| | | | | | | | | |
| | | | | BANKING - 4.3% | | | | |
| | 50,500 | | | Bar Harbor Bankshares | | | 1,528,635 | |
| | 50,000 | | | First Busey Corporation | | | 1,303,500 | |
| | 55,000 | | | Territorial Bancorp, Inc. | | | 1,248,500 | |
| | | | | | | | 4,080,635 | |
| | | | | BEVERAGES - 0.1% | | | | |
| | 278,942 | | | Truett-Hurst, Inc.(a),(b), (c) | | | 105,998 | |
| | | | | | | | | |
| | | | | COMMERCIAL SUPPORT SERVICES - 11.5% | | | | |
| | 609,000 | | | ARC Document Solutions, Inc. | | | 1,790,460 | |
| | 38,000 | | | Barrett Business Services, Inc. | | | 3,736,540 | |
| | 148,000 | | | SP Plus Corporation(a) | | | 5,163,720 | |
| | | | | | | | 10,690,720 | |
| | | | | CONSTRUCTION MATERIALS - 5.1% | | | | |
| | 32,150 | | | Apogee Enterprises, Inc. | | | 1,551,238 | |
| | 23,000 | | | United States Lime & Minerals, Inc. | | | 3,196,540 | |
| | | | | | | | 4,747,778 | |
| | | | | E-COMMERCE DISCRETIONARY - 4.9% | | | | |
| | 214,000 | | | 1-800-Flowers.com, Inc., Class A(a) | | | 1,810,440 | |
| | 340,500 | | | CarParts.com, Inc.(a) | | | 1,845,510 | |
| | 47,000 | | | PetMed Express, Inc. | | | 930,600 | |
| | | | | | | | 4,586,550 | |
| | | | | | | | | |
The accompanying notes are an integral part of these financial statements.
| NORTH STAR MICRO CAP FUND |
| SCHEDULE OF INVESTMENTS (Continued) |
| November 30, 2022 |
| Shares | | | | | Fair Value | |
| | | | | COMMON STOCKS — 91.1% (Continued) | | | | |
| | | | | ELECTRICAL EQUIPMENT - 4.6% | | | | |
| | 35,250 | | | Allied Motion Technologies, Inc. | | $ | 1,249,260 | |
| | 117,000 | | | Napco Security Technologies, Inc.(a) | | | 3,086,460 | |
| | | | | | | | 4,335,720 | |
| | | | | ENGINEERING & CONSTRUCTION - 1.3% | | | | |
| | 162,000 | | | Great Lakes Dredge & Dock Corporation(a) | | | 1,185,840 | |
| | | | | | | | | |
| | | | | FOOD - 0.7% | | | | |
| | 9,000 | | | Nathan’s Famous, Inc. | | | 611,100 | |
| | | | | | | | | |
| | | | | HOME & OFFICE PRODUCTS - 3.3% | | | | |
| | 326,000 | | | ACCO Brands Corporation | | | 1,815,820 | |
| | 88,051 | | | Hamilton Beach Brands Holding Company, Class A | | | 1,250,324 | |
| | | | | | | | 3,066,144 | |
| | | | | HOME CONSTRUCTION - 2.5% | | | | |
| | 98,000 | | | Green Brick Partners, Inc.(a) | | | 2,369,640 | |
| | | | | | | | | |
| | | | | HOUSEHOLD PRODUCTS - 1.8% | | | | |
| | 19,800 | | | Central Garden & Pet Company(a) | | | 812,790 | |
| | 157,000 | | | Crown Crafts, Inc. | | | 924,730 | |
| | | | | | | | 1,737,520 | |
| | | | | INDUSTRIAL INTERMEDIATE PROD - 3.6% | | | | |
| | 147,400 | | | Eastern Company (The) | | | 3,390,200 | |
| | | | | | | | | |
| | | | | LEISURE FACILITIES & SERVICES - 2.2% | | | | |
| | 125,600 | | | Century Casinos, Inc.(a) | | | 938,232 | |
| | 86,500 | | | Denny’s Corporation(a) | | | 1,084,710 | |
| | | | | | | | 2,022,942 | |
| | | | | LEISURE PRODUCTS - 5.3% | | | | |
| | 244,000 | | | Escalade, Inc. | | | 2,466,840 | |
| | 43,500 | | | Johnson Outdoors, Inc., Class A | | | 2,460,360 | |
| | | | | | | | 4,927,200 | |
| | | | | MACHINERY - 6.4% | | | | |
| | 21,900 | | | Alamo Group, Inc. | | | 3,295,950 | |
| | 116,499 | | | QEP Company, Inc. (a)(c) | | | 1,625,161 | |
| | | | | | | | | |
The accompanying notes are an integral part of these financial statements.
| NORTH STAR MICRO CAP FUND |
| SCHEDULE OF INVESTMENTS (Continued) |
| November 30, 2022 |
| Shares | | | | | Fair Value | |
| | | | | COMMON STOCKS — 91.1% (Continued) | | | | |
| | | | | MACHINERY - 6.4% (Continued) | | | | |
| | 17,500 | | | Tennant Company | | $ | 1,111,775 | |
| | | | | | | | 6,032,886 | |
| | | | | MEDICAL EQUIPMENT & DEVICES - 1.3% | | | | |
| | 600,000 | | | Accuray, Inc.(a) | | | 1,230,000 | |
| | | | | | | | | |
| | | | | OIL & GAS PRODUCERS - 1.3% | | | | |
| | 162,300 | | | Evolution Petroleum Corporation | | | 1,173,429 | |
| | | | | | | | | |
| | | | | OIL & GAS SERVICES & EQUIPMENT - 0.4% | | | | |
| | 30,000 | | | US Silica Holdings, Inc.(a) | | | 392,700 | |
| | | | | | | | | |
| | | | | REAL ESTATE OWNERS & DEVELOPERS - 1.2% | | | | |
| | 75,000 | | | Postal Realty Trust, Inc. | | | 1,161,750 | |
| | | | | | | | | |
| | | | | RETAIL - DISCRETIONARY - 12.5% | | | | |
| | 52,000 | | | Boot Barn Holdings, Inc.(a) | | | 3,502,200 | |
| | 172,000 | | | Build-A-Bear Workshop, Inc., 218126786 | | | 4,085,000 | |
| | 162,500 | | | Container Store Group, Inc. (The)(a) | | | 771,875 | |
| | 115,000 | | | Duluth Holdings, Inc., Class B(a) | | | 1,007,400 | |
| | 81,563 | | | Ethan Allen Interiors, Inc. | | | 2,320,467 | |
| | | | | | | | 11,686,942 | |
| | | | | TECHNOLOGY HARDWARE - 2.2% | | | | |
| | 83,000 | | | AstroNova, Inc.(a) | | | 975,250 | |
| | 116,200 | | | Turtle Beach Corporation(a) | | | 1,109,710 | |
| | | | | | | | 2,084,960 | |
| | | | | TRANSPORTATION EQUIPMENT - 1.2% | | | | |
| | 97,500 | | | Blue Bird Corporation(a) | | | 1,151,475 | |
| | | | | | | | | |
| | | | | WHOLESALE - DISCRETIONARY - 2.8% | | | | |
| | 109,481 | | | Acme United Corporation | | | 2,592,510 | |
| | | | | | | | | |
| | | | | TOTAL COMMON STOCKS (Cost $64,492,764) | | | 85,310,482 | |
| | | | | | | | | |
The accompanying notes are an integral part of these financial statements.
| NORTH STAR MICRO CAP FUND |
| SCHEDULE OF INVESTMENTS (Continued) |
| November 30, 2022 |
| Shares | | | | | Fair Value | |
| | | | | SHORT-TERM INVESTMENT — 8.9% | | | | |
| | | | | MONEY MARKET FUND - 8.9% | | | | |
| | 8,344,938 | | | First American Treasury Obligations Fund, Class X, 3.73% (Cost $8,344,938)(d) | | $ | 8,344,938 | |
| | | | | | | | | |
| | | | | TOTAL INVESTMENTS - 100.0% (Cost $72,837,702) | | $ | 93,655,420 | |
| | | | | OTHER ASSETS IN EXCESS OF LIABILITIES - 0.0% | | | 8,348 | |
| | | | | NET ASSETS - 100.0% | | $ | 93,663,768 | |
| | | | | | | | | |
| (a) | Non-income producing security. |
| (b) | Affiliated Company – North Star Micro Cap Fund holds in excess of 5% of outstanding voting securities of this security. |
| (c) | Illiquid security. The total fair value of the securities as of November 30, 2022 was $1,731,159, representing 1.8% of net assets. |
| (d) | Rate disclosed is the seven day effective yield as of November 30, 2022. |
The accompanying notes are an integral part of these financial statements.
| NORTH STAR DIVIDEND FUND |
| SCHEDULE OF INVESTMENTS |
| November 30, 2022 |
| Shares | | | | | Fair Value | |
| | | | | COMMON STOCKS — 88.4% | | | | |
| | | | | APPAREL & TEXTILE PRODUCTS - 5.2% | | | | |
| | 27,500 | | | Movado Group, Inc. | | $ | 885,225 | |
| | 79,200 | | | Rocky Brands, Inc. | | | 2,239,776 | |
| | 56,000 | | | Weyco Group, Inc. | | | 1,433,600 | |
| | | | | | | | 4,558,601 | |
| | | | | ASSET MANAGEMENT - 5.6% | | | | |
| | 111,000 | | | Compass Diversified Holdings | | | 2,171,160 | |
| | 50,000 | | | Sprott, Inc. | | | 1,791,500 | |
| | 79,000 | | | Westwood Holdings Group, Inc. | | | 949,580 | |
| | | | | | | | 4,912,240 | |
| | | | | BANKING - 12.2% | | | | |
| | 24,400 | | | Bank of Hawaii Corporation | | | 1,968,348 | |
| | 76,500 | | | Bar Harbor Bankshares | | | 2,315,655 | |
| | 73,000 | | | First Hawaiian, Inc. | | | 1,938,150 | |
| | 43,000 | | | OceanFirstFinancial Corporation | | | 1,004,480 | |
| | 47,200 | | | Old National Bancorp | | | 901,992 | |
| | 26,500 | | | Wintrust Financial Corporation | | | 2,422,895 | |
| | | | | | | | 10,551,520 | |
| | | | | CHEMICALS - 4.5% | | | | |
| | 92,500 | | | Oil-Dri Corp of America | | | 3,024,750 | |
| | 26,400 | | | Valvoline, Inc. | | | 870,672 | |
| | | | | | | | 3,895,422 | |
| | | | | COMMERCIAL SUPPORT SERVICES - 6.6% | | | | |
| | 23,200 | | | ABM Industries, Inc. | | | 1,094,576 | |
| | 212,800 | | | BGSF, Inc. | | | 2,811,088 | |
| | 93,000 | | | Resources Connection, Inc. | | | 1,794,900 | |
| | | | | | | | 5,700,564 | |
| | | | | CONSTRUCTION MATERIALS - 1.7% | | | | |
| | 30,100 | | | Apogee Enterprises, Inc. | | | 1,452,325 | |
| | | | | | | | | |
| | | | | CONTAINERS & PACKAGING - 1.2% | | | | |
| | 46,000 | | | Myers Industries, Inc. | | | 1,073,640 | |
| | | | | | | | | |
| | | | | ELECTRIC UTILITIES - 5.7% | | | | |
| | 31,500 | | | NorthWestern Corporation | | | 1,839,915 | |
| | | | | | | | | |
The accompanying notes are an integral part of these financial statements.
| NORTH STAR DIVIDEND FUND |
| SCHEDULE OF INVESTMENTS (Continued) |
| November 30, 2022 |
| Shares | | | | | Fair Value | |
| | | | | COMMON STOCKS — 88.4% (Continued) | | | | |
| | | | | ELECTRIC UTILITIES - 5.7% (Continued) | | | | |
| | 34,500 | | | Otter Tail Corporation | | $ | 2,057,235 | |
| | 20,000 | | | Unitil Corporation | | | 1,096,400 | |
| | | | | | | | 4,993,550 | |
| | | | | ELECTRICAL EQUIPMENT - 5.7% | | | | |
| | 420,000 | | | LSI Industries, Inc. | | | 4,985,400 | |
| | | | | | | | | |
| | | | | FOOD - 0.7% | | | | |
| | 21,000 | | | Alico, Inc. | | | 649,530 | |
| | | | | | | | | |
| | | | | GAS & WATER UTILITIES - 5.8% | | | | |
| | 152,000 | | | Global Water Resources, Inc. | | | 1,942,560 | |
| | 34,000 | | | Northwest Natural Holding Company | | | 1,703,740 | |
| | 59,500 | | | RGC Resources, Inc. | | | 1,444,660 | |
| | | | | | | | 5,090,960 | |
| | | | | HEALTH CARE FACILITIES & SERVICES - 1.0% | | | | |
| | 31,400 | | | Patterson Companies, Inc. | | | 893,016 | |
| | | | | | | | | |
| | | | | HOME & OFFICE PRODUCTS - 4.1% | | | | |
| | 321,000 | | | ACCO Brands Corporation | | | 1,787,970 | |
| | 64,000 | | | FlexsteelIndustries, Inc. | | | 947,200 | |
| | 110,000 | | | Steelcase, Inc., Class A | | | 872,300 | |
| | | | | | | | 3,607,470 | |
| | | | | HOUSEHOLD PRODUCTS - 2.8% | | | | |
| | 410,000 | | | Crown Crafts, Inc. | | | 2,414,900 | |
| | | | | | | | | |
| | | | | INDUSTRIAL REIT - 1.4% | | | | |
| | 10,300 | | | Innovative Industrial Properties, Inc. | | | 1,248,463 | |
| | | | | | | | | |
| | | | | INSURANCE - 1.0% | | | | |
| | 23,000 | | | Horace Mann Educators Corporation | | | 887,570 | |
| | | | | | | | | |
| | | | | LEISURE PRODUCTS - 2.1% | | | | |
| | 179,000 | | | Escalade, Inc. | | | 1,809,690 | |
| | | | | | | | | |
The accompanying notes are an integral part of these financial statements.
| NORTH STAR DIVIDEND FUND |
| SCHEDULE OF INVESTMENTS (Continued) |
| November 30, 2022 |
| Shares | | | | | Fair Value | |
| | | | | COMMON STOCKS — 88.4% (Continued) | | | | |
| | | | | MACHINERY - 3.2% | | | | |
| | 72,000 | | | Douglas Dynamics, Inc. | | $ | 2,802,240 | |
| | | | | | | | | |
| | | | | OIL & GAS PRODUCERS - 3.3% | | | | |
| | 401,000 | | | Evolution Petroleum Corporation | | | 2,899,230 | |
| | | | | | | | | |
| | | | | PUBLISHING & BROADCASTING - 0.8% | | | | |
| | 166,000 | | | DallasNews Corporation | | | 728,740 | |
| | | | | | | | | |
| | | | | REAL ESTATE OWNERS & DEVELOPERS - 4.6% | | | | |
| | 25,000 | | | McGrath RentCorporation | | | 2,453,000 | |
| | 100,000 | | | Postal Realty Trust, Inc. | | | 1,549,000 | |
| | | | | | | | 4,002,000 | |
| | | | | RETAIL - CONSUMER STAPLES - 1.0% | | | | |
| | 38,000 | | | Village Super Market, Inc., Class A | | | 856,520 | |
| | | | | | | | | |
| | | | | RETAIL - DISCRETIONARY - 3.1% | | | | |
| | 96,300 | | | Ethan Allen Interiors, Inc. | | | 2,739,735 | |
| | | | | | | | | |
| | | | | SPECIALTY FINANCE - 1.8% | | | | |
| | 14,000 | | | GATX Corporation | | | 1,578,500 | |
| | | | | | | | | |
| | | | | TECHNOLOGY SERVICES - 2.7% | | | | |
| | 31,200 | | | John Wiley & Sons, Inc., Class A | | | 1,479,192 | |
| | 15,900 | | | Value Line, Inc. | | | 890,400 | |
| | | | | | | | 2,369,592 | |
| | | | | WHOLESALE - DISCRETIONARY - 0.6% | | | | |
| | 21,000 | | | Acme United Corporation | | | 497,280 | |
| | | | | | | | | |
| | | | | | | | | |
| | | | | TOTAL COMMON STOCKS (Cost $59,932,244) | | | 77,198,698 | |
| | | | | | | | | |
The accompanying notes are an integral part of these financial statements.
| NORTH STAR DIVIDEND FUND |
| SCHEDULE OF INVESTMENTS (Continued) |
| November 30, 2022 |
| Shares | | | | | Fair Value | |
| | | | | SHORT-TERM INVESTMENT — 11.5% | | | | |
| | | | | MONEY MARKET FUND - 11.5% | | | | |
| | 10,056,157 | | | First American Treasury Obligations Fund, Class X, 3.73% (Cost $10,056,157)(a) | | $ | 10,056,157 | |
| | | | | | | | | |
| | | | | TOTAL INVESTMENTS - 99.9% (Cost $69,988,401) | | $ | 87,254,855 | |
| | | | | OTHER ASSETS IN EXCESS OF LIABILITIES - 0.1% | | | 24,950 | |
| | | | | NET ASSETS - 100.0% | | $ | 87,279,805 | |
| | | | | | | | | |
| REIT | - Real Estate Investment Trust |
| (a) | Rate disclosed is the seven day effective yield as of November 30, 2022. |
The accompanying notes are an integral part of these financial statements.
| NORTH STAR BOND FUND |
| SCHEDULE OF INVESTMENTS |
| November 30, 2022 |
| Shares | | | | | Fair Value | |
| | | | | PREFERRED STOCKS — 8.4% | | | | |
| | | | | ASSET MANAGEMENT — 3.5% | | | | |
| | 19,000 | | | B Riley Financial, Inc., 6.375% | | $ | 454,480 | |
| | 19,576 | | | Compass Diversified Holdings, 7.875% | | | 489,008 | |
| | | | | | | | 943,488 | |
| | | | | BANKING — 2.5% | | | | |
| | 16,500 | | | Bank of America Corporation, 4.00% | | | 330,990 | |
| | 19,000 | | | JPMorgan Chase & Company, 4.20% | | | 347,700 | |
| | | | | | | | 678,690 | |
| | | | | ENTERTAINMENT CONTENT — 1.7% | | | | |
| | 15,000 | | | Paramount Global, 5.75% | | | 469,350 | |
| | | | | | | | | |
| | | | | INSTITUTIONAL FINANCIAL SERVICES — 0.7% | | | | |
| | 250,000 | | | Mellon Capital IV - Series 1, 4.00% | | | 196,647 | |
| | | | | | | | | |
| | | | | TOTAL PREFERRED STOCKS (Cost $3,020,527) | | | 2,288,175 | |
| Principal | | | | | Coupon Rate | | | | | |
| Amount ($) | | | | | (%) | | Maturity | | | |
| | | | | CONVERTIBLE BONDS — 12.0% | | | | | | | | |
| | | | | LEISURE PRODUCTS — 2.8% | | | | | | | | |
| | 700,000 | | | Winnebago Industries, Inc. | | 1.5000 | | 04/01/25 | | | 777,875 | |
| | | | | | | | | | | | | |
| | | | | SPECIALTY FINANCE — 5.3% | | | | | | | | |
| | 1,422,000 | | | Blackstone Mortgage Trust, Inc. | | 4.7500 | | 03/15/23 | | | 1,429,110 | |
| | | | | | | | | | | | | |
| | | | | TRANSPORTATION EQUIPMENT — 3.9% | | | | | | | | |
| | 1,106,000 | | | Greenbrier Companies, Inc. (The) | | 2.8750 | | 02/01/24 | | | 1,064,525 | |
| | | | | | | | | | | | | |
| | | | | TOTAL CONVERTIBLE BONDS (Cost $3,183,789) | | | | | | | 3,271,510 | |
| | | | | | | | | | | | | |
| | | | | CORPORATE BONDS — 65.5% | | | | | | | | |
| | | | | APPAREL & TEXTILE PRODUCTS — 5.0% | | | | | | | | |
| | 1,525,000 | | | Under Armour, Inc. | | 3.2500 | | 06/15/26 | | | 1,344,028 | |
| | | | | | | | | | | | | |
The accompanying notes are an integral part of these financial statements.
| NORTH STAR BOND FUND |
| SCHEDULE OF INVESTMENTS (Continued) |
| November 30, 2022 |
| Principal | | | | | Coupon Rate | | | | | |
| Amount ($) | | | | | (%) | | Maturity | | Fair Value | |
| | | | | CORPORATE BONDS — 65.5% (Continued) | | | | | | | | |
| | | | | ASSET MANAGEMENT — 5. 0% | | | | | | | | |
| | 1,000,000 | | | Golub Capital BDC, Inc. | | 3.3750 | | 04/15/24 | | $ | 958,486 | |
| | 500,000 | | | Hercules Capital, Inc. | | 2.6250 | | 09/16/26 | | | 422,967 | |
| | | | | | | | | | | | 1,381,453 | |
| | | | | AUTOMOTIVE — 10.0% | | | | | | | | |
| | 1,350,000 | | | Ford Motor Company | | 7.1250 | | 11/15/25 | | | 1,387,975 | |
| | 1,310,000 | | | Goodyear Tire & Rubber Company (The) | | 9.5000 | | 05/31/25 | | | 1,361,728 | |
| | | | | | | | | | | | 2,749,703 | |
| | | | | ENTERTAINMENT CONTENT — 2.6% | | | | | | | | |
| | 825,000 | | | AMC Networks, Inc. | | 4.7500 | | 08/01/25 | | | 732,159 | |
| | | | | | | | | | | | | |
| | | | | FOOD — 2.9% | | | | | | | | |
| | 800,000 | | | J M Smucker Company (The) | | 3.5000 | | 03/15/25 | | | 777,168 | |
| | | | | | | | | | | | | |
| | | | | HEALTH CARE FACILITIES & SERVICES — 4.8% | | | | | | | | |
| | 1,355,000 | | | Owens & Minor, Inc. | | 4.3750 | | 12/15/24 | | | 1,297,669 | |
| | | | | | | | | | | | | |
| | | | | HOME & OFFICE PRODUCTS — 4.8% | | | | | | | | |
| | 1,360,000 | | | Scotts Miracle-Gro Company (The) | | 5.2500 | | 12/15/26 | | | 1,301,343 | |
| | | | | | | | | | | | | |
| | | | | LEISURE FACILITIES & SERVICES — 9.9% | | | | | | | | |
| | 1,350,000 | | | Brinker International, Inc. | | 3.8750 | | 05/15/23 | | | 1,338,984 | |
| | 1,321,000 | | | Wendy’s International, LLC | | 7.0000 | | 12/15/25 | | | 1,333,550 | |
| | | | | | | | | | | | 2,672,534 | |
| | | | | OIL & GAS PRODUCERS — 2.9 % | | | | | | | | |
| | 800,000 | | | Murphy Oil Corporation | | 5.7500 | | 08/15/25 | | | 797,879 | |
| | | | | | | | | | | | | |
| | | | | REAL ESTATE INVESTMENT TRUSTS — 7.9% | | | | | | | | |
| | 1,375,000 | | | IIP Operating Partnership, L.P. | | 5.5000 | | 05/25/26 | | | 1,214,271 | |
| | 1,000,000 | | | Vornado Realty, L.P. | | 3.5000 | | 01/15/25 | | | 930,545 | |
| | | | | | | | | | | | 2,144,816 | |
| | | | | TELECOMMUNICATIONS — 4.5% | | | | | | | | |
| | 1,275,000 | | | CenturyLink, Inc. | | 5.6250 | | 04/01/25 | | | 1,226,078 | |
| | | | | | | | | | | | | |
The accompanying notes are an integral part of these financial statements.
| NORTH STAR BOND FUND |
| SCHEDULE OF INVESTMENTS (Continued) |
| November 30, 2022 |
| Principal | | | | | Coupon Rate | | | | | |
| Amount ($) | | | | | (%) | | Maturity | | Fair Value | |
| | | | | CORPORATE BONDS — 65.5% (Continued) | | | | | | | | |
| | | | | TRANSPORTATION EQUIPMENT — 5.2% | | | | | | | | |
| | 1,475,000 | | | Trinity Industries, Inc. | | 4.5500 | | 10/01/24 | | $ | 1,421,458 | |
| | | | | | | | | | | | | |
| | | | | TOTAL CORPORATE BONDS (Cost $19,038,179) | | | | | | | 17,846,288 | |
| | | | | | | | | | | | | |
| Shares | | | | | | | | | | | |
| | | | | SHORT-TERM INVESTMENTS — 12.9% | | | | | | | | |
| | | | | MONEY MARKET FUNDS – 4.6% | | | | | | | | |
| | 1,241,488 | | | First American Treasury Obligations Fund, Class X, 3.73% (Cost $1,241,488)(a) | | | 1,241,488 | |
| | | | | | | | | | | | | |
| Principal | | | | | Coupon Rate | | | | | |
| Amount ($) | | | | | (%) | | Maturity | | | |
| | | | | U.S. TREASURY BILLS — 8. 3% | | | | | | | | |
| | 800,000 | | | United States Treasury Bill(b) | | 4.1800 | | 02/23/23 | | | 792,286 | |
| | 600,000 | | | United States Treasury Bill(b) | | 4.2500 | | 04/06/23 | | | 591,266 | |
| | 900,000 | | | United States Treasury Bill(b) | | 4.6600 | | 05/25/23 | | | 880,218 | |
| | | | | TOTAL U.S. TREASURY BILLS (Cost $2,263,770) | | | | 2,263,770 | |
| | | | | | | | | | | | | |
| | | | | TOTAL SHORT-TERM INVESTMENTS (Cost $3,505,258) | | | | | 3,505,258 | |
| | | | | | | | | | | | | |
| | | | | TOTAL INVESTMENTS – 98.8% (Cost $28,747,753) | | | | $ | 26,911,231 | |
| | | | | OTHER ASSETS IN EXCESS OF LIABILITIES - 1.2% | | | | 329,423 | |
| | | | | NET ASSETS - 100.0% | | | | | $ | 27,240,654 | |
| LLC | - Limited Liability Company |
| | |
| LP | - Limited Partnership |
| | |
| REIT | - Real Estate Investment Trust |
| | |
| (a) | Rate disclosed is the seven day effective yield as of November 30, 2022. |
| (b) | Zero coupon bond. Rate disclosed is the current yield as of November 30, 2022. |
The accompanying notes are an integral part of these financial statements.
| North Star Funds |
| STATEMENTS OF ASSETS AND LIABILITIES |
| November 30, 2022 |
| | | North Star | | | North Star | | | North Star | | | North Star | |
| | | Opportunity | | | Micro Cap | | | Dividend | | | Bond | |
| Assets: | | Fund | | | Fund | | | Fund | | | Fund | |
| Investments in Unaffiliated Securities at Cost | | $ | 92,428,837 | | | $ | 72,043,097 | | | $ | 69,988,401 | | | $ | 28,747,753 | |
| Investments in Non-controlled Affiliated Securities at Cost | | | — | | | | 794,605 | | | | — | | | | — | |
| Total Securities at Cost | | | 92,428,837 | | | | 72,837,702 | | | | 69,988,401 | | | | 28,747,753 | |
| Investments in Unaffiliated Securities at Value | | $ | 137,791,871 | | | $ | 93,549,422 | | | $ | 87,254,855 | | | $ | 26,911,231 | |
| Investments in Non-controlled Affiliated Securities at Value | | | — | | | | 105,998 | | | | — | | | | — | |
| Total Securities at Value | | | 137,791,871 | | | | 93,655,420 | | | | 87,254,855 | | | | 26,911,231 | |
| Dividends and Interest Receivable | | | 312,076 | | | | 144,748 | | | | 196,928 | | | | 248,031 | |
| Receivable for Fund Shares Sold | | | 50 | | | | 380 | | | | 137 | | | | 147,000 | |
| Prepaid Expenses and Other Assets | | | 23,353 | | | | 12,668 | | | | 15,304 | | | | 12,805 | |
| Total Assets | | | 138,127,350 | | | | 93,813,216 | | | | 87,467,224 | | | | 27,319,067 | |
| | | | | | | | | | | | | | | | | |
| Liabilities: | | | | | | | | | | | | | | | | |
| Payable for Securities Purchased | | | 63,180 | | | | — | | | | — | | | | — | |
| Payable for Fund Shares Redeemed | | | 41,966 | | | | — | | | | 54,966 | | | | 10,500 | |
| Investment Advisory Fees Payable | | | 103,801 | | | | 74,530 | | | | 70,078 | | | | 18,866 | |
| Distribution (12b-1) Fees Payable | | | 4,640 | | | | — | | | | — | | | | — | |
| Payable to Related Parties | | | 54,782 | | | | 30,852 | | | | 24,577 | | | | 16,136 | |
| Audit and Tax Fees Payable | | | 22,304 | | | | 22,370 | | | | 22,382 | | | | 19,762 | |
| Accrued Expenses and Other Liabilities | | | 22,180 | | | | 21,696 | | | | 15,416 | | | | 13,149 | |
| Total Liabilities | | | 312,853 | | | | 149,448 | | | | 187,419 | | | | 78,413 | |
| | | | | | | | | | | | | | | | | |
| Net Assets | | $ | 137,814,497 | | | $ | 93,663,768 | | | $ | 87,279,805 | | | $ | 27,240,654 | |
| | | | | | | | | | | | | | | | | |
| Composition of Net Assets: | | | | | | | | | | | | | | | | |
| At November 30, 2022, Net Assets consisted of: | | | | | | | | | | | | | | | | |
| Paid-in-Capital | | $ | 87,229,699 | | | $ | 73,139,706 | | | $ | 66,534,775 | | | $ | 30,987,879 | |
| Accumulated Earnings/(Losses) | | | 50,584,798 | | | | 20,524,062 | | | | 20,745,030 | | | | (3,747,225 | ) |
| Net Assets | | $ | 137,814,497 | | | $ | 93,663,768 | | | $ | 87,279,805 | | | $ | 27,240,654 | |
| | | | | | | | | | | | | | | | | |
| Net Asset Value Per Share: | | | | | | | | | | | | | | | | |
| Class I Shares: | | | | | | | | | | | | | | | | |
| Net Assets | | $ | 118,345,841 | | | $ | 93,663,768 | | | $ | 87,279,805 | | | $ | 27,240,654 | |
| Shares of Beneficial Interest Outstanding ($0 par value, unlimited shares authorized) | | | 7,374,245 | | | | 2,944,493 | | | | 3,908,312 | | | | 3,121,465 | |
| Net Asset Value (Net Assets/Shares Outstanding), Offering Price and Redemption Price Per Share* | | $ | 16.05 | | | $ | 31.81 | | | $ | 22.33 | | | $ | 8.73 | (a) |
| Class A Shares: | | | | | | | | | | | | | | | | |
| Net Assets | | $ | 19,468,656 | | | | | | | | | | | | | |
| Shares of Beneficial Interest Outstanding ($0 par value, unlimited shares authorized) | | | 1,210,073 | | | | | | | | | | | | | |
| Net Asset Value (Net Assets/Shares Outstanding) and Redemption Price Per Share* | | $ | 16.09 | | | | | | | | | | | | | |
| Maximum Offering Price Per Share (Maximum Sales Charge of 5.75%) | | $ | 17.07 | | | | | | | | | | | | | |
| | | | | | | | | | | | | | | | | |
| * | The Funds charge a fee of 2.00% on redemptions of shares held for less than 30 days. |
| (a) | The NAV and Offering Price shown above differ from the traded NAV on November 30, 2022 due to financial statement rounding and/or financial statement adjustments. |
The accompanying notes are an integral part of these financial statements.
| North Star Funds |
| STATEMENTS OF OPERATIONS |
| For the Year Ended November 30, 2022 |
| | | North Star | | | North Star | | | North Star | | | North Star | |
| | | Opportunity Fund | | | Micro Cap Fund | | | Dividend Fund | | | Bond Fund | |
| Investment Income | | | | | | | | | | | | | | | | |
| Dividends from Unaffiliated Investments | | $ | 2,674,682 | | | $ | 1,917,557 | | | $ | 3,179,718 | | | $ | 202,024 | |
| Interest | | | 749,481 | | | | 84,178 | | | | 112,315 | | | | 983,785 | |
| Total Investment Income | | | 3,424,163 | | | | 2,001,735 | | | | 3,292,033 | | | | 1,185,809 | |
| | | | | | | | | | | | | | | | | |
| Expenses | | | | | | | | | | | | | | | | |
| Investment Advisory Fees | | | 1,486,701 | | | | 1,018,114 | | | | 855,286 | | | | 245,712 | |
| Administrative Service Fees | | | 151,477 | | | | 107,098 | | | | 84,466 | | | | 39,741 | |
| Third Party Administrative Servicing Fees | | | 140,806 | | | | 100,442 | | | | 88,371 | | | | 28,993 | |
| Distribution (12b-1) Fees - Class A | | | 63,603 | | | | — | | | | — | | | | — | |
| Accounting Service Fees | | | 47,709 | | | | 37,244 | | | | 26,844 | | | | 9,983 | |
| Registration Fees | | | 45,732 | | | | 28,310 | | | | 29,663 | | | | 26,896 | |
| Transfer Agent Fees | | | 42,405 | | | | 19,248 | | | | 21,692 | | | | 15,919 | |
| Legal Fees | | | 29,281 | | | | 23,851 | | | | 25,027 | | | | 25,257 | |
| Trustees’ Fees and Expenses | | | 24,418 | | | | 22,858 | | | | 24,786 | | | | 25,282 | |
| Audit and Tax Fees | | | 22,177 | | | | 23,897 | | | | 23,410 | | | | 21,922 | |
| Printing Expense | | | 18,077 | | | | 11,565 | | | | 9,226 | | | | 4,375 | |
| Custodian Fees | | | 16,787 | | | | 14,019 | | | | 9,348 | | | | 6,331 | |
| Chief Compliance Officer Fees | | | 14,791 | | | | 10,377 | | | | 9,471 | | | | 6,195 | |
| Insurance Expense | | | 13,325 | | | | 12,014 | | | | 9,953 | | | | 7,843 | |
| Other Expenses | | | 21,556 | | | | 11,601 | | | | 21,491 | | | | 5,643 | |
| Total Expenses | | | 2,138,845 | | | | 1,440,638 | | | | 1,239,034 | | | | 470,092 | |
| Fees Waived by the Adviser | | | (70,810 | ) | | | — | | | | — | | | | — | |
| | | | | | | | | | | | | | | | | |
| Net Expenses | | | 2,068,035 | | | | 1,440,638 | | | | 1,239,034 | | | | 470,092 | |
| | | | | | | | | | | | | | | | | |
| Net Investment Income | | | 1,356,128 | | | | 561,097 | | | | 2,052,999 | | | | 715,717 | |
| | | | | | | | | | | | | | | | | |
| Net Realized and Unrealized Gain (Loss) on Investments | | | | | | | | | | | | | | | | |
| Net Realized Gain (Loss): | | | | | | | | | | | | | | | | |
| on Unaffiliated Investments | | | 3,784,490 | | | | (291,870 | ) | | | 2,760,802 | | | | (24,492 | ) |
| on Affiliated Investments | | | — | | | | — | | | | — | | | | — | |
| on Foreign Currency Transactions | | | (149 | ) | | | — | | | | (132 | ) | | | — | |
| Total Net Realized Gain (Loss) | | | 3,784,341 | | | | (291,870 | ) | | | 2,760,670 | | | | (24,492 | ) |
| Net Change in Unrealized Appreciation (Depreciation): | | | | | | | | | | | | | | | | |
| on Unaffiliated Investments | | | (36,083,915 | ) | | | (26,024,194 | ) | | | (5,714,606 | ) | | | (2,463,554 | ) |
| on Affiliated Investments | | | — | | | | (89,122 | ) | | | — | | | | — | |
| on Foreign Currency Translations | | | 40 | | | | — | | | | (23 | ) | | | — | |
| Total Net Change in Unrealized Appreciation (Depreciation) | | | (36,083,875 | ) | | | (26,113,316 | ) | | | (5,714,629 | ) | | | (2,463,554 | ) |
| | | | | | | | | | | | | | | | | |
| Net Realized and Unrealized Loss on Investments | | | (32,299,534 | ) | | | (26,405,186 | ) | | | (2,953,959 | ) | | | (2,488,046 | ) |
| | | | | | | | | | | | | | | | | |
| Net Decrease in Net Assets Resulting From Operations | | $ | (30,943,406 | ) | | $ | (25,844,089 | ) | | $ | (900,960 | ) | | $ | (1,772,329 | ) |
| | | | | | | | | | | | | | | | | |
The accompanying notes are an integral part of these financial statements.
| North Star Funds |
| STATEMENTS OF CHANGES IN NET ASSETS |
| | | North Star Opportunity Fund | |
| | | | | | | |
| | | For the Year | | | For the Year | |
| | | Ended | | | Ended | |
| | | November 30, 2022 | | | November 30, 2021 | |
| Operations | | | | | | | | |
| Net Investment Income | | $ | 1,356,128 | | | $ | 779,864 | |
| Net Realized Gain on Investments | | | 3,784,341 | | | | 4,814,431 | |
| Net Change in Unrealized Appreciation (Depreciation) on Investments | | | (36,083,875 | ) | | | 23,191,957 | |
| Net Increase (Decrease) in Net Assets Resulting From Operations | | | (30,943,406 | ) | | | 28,786,252 | |
| | | | | | | | | |
| Distributions to Shareholders: | | | | | | | | |
| Distributions Paid | | | | | | | | |
| Class I | | | (3,937,509 | ) | | | (351,001 | ) |
| Class A | | | (754,784 | ) | | | (28,883 | ) |
| Total Distributions Paid | | | (4,692,293 | ) | | | (379,884 | ) |
| | | | | | | | | |
| Capital Shares of Beneficial Interest | | | | | | | | |
| Class I Shares: | | | | | | | | |
| Proceeds from Shares Sold (267,472 and 1,307,314 shares, respectively) | | | 4,683,682 | | | | 24,124,943 | |
| Distributions Reinvested (180,663 and 16,426 shares, respectively) | | | 3,434,898 | | | | 337,168 | |
| Cost of Shares Redeemed (418,841 and 820,031 shares, respectively) | | | (7,190,662 | ) | | | (15,329,083 | ) |
| Redemption Fee Proceeds | | | 129 | | | | 9,196 | |
| Total Class I Shares | | | 928,047 | | | | 9,142,224 | |
| | | | | | | | | |
| Class A Shares: | | | | | | | | |
| Proceeds from Shares Sold (26,460 and 339,918 shares, respectively) | | | 488,899 | | | | 6,158,835 | |
| Proceeds from Shares Issued in Connection with Acquisition of Two Oaks Diversified Growth & Income Fund (Note 11) (0 and 1,613,057 shares, respectively) | | | — | | | | 30,279,834 | |
| Distributions Reinvested (39,017 and 1,555 shares, respectively) | | | 753,013 | | | | 28,688 | |
| Cost of Shares Redeemed (415,480 and 2,001,900 shares, respectively) | | | (6,906,248 | ) | | | (37,099,215 | ) |
| Redemption Fee Proceeds | | | — | | | | 10 | |
| Total Class A Shares | | | (5,664,336 | ) | | | (631,848 | ) |
| | | | | | | | | |
| Net Increase (Decrease) in Net Assets From Shares of Beneficial Interest | | | (4,736,289 | ) | | | 8,510,376 | |
| | | | | | | | | |
| Total Increase (Decrease) in Net Assets | | | (40,371,988 | ) | | | 36,916,744 | |
| | | | | | | | | |
| Net Assets | | | | | | | | |
| Beginning of Year | | | 178,186,485 | | | | 141,269,741 | |
| End of Year | | $ | 137,814,497 | | | $ | 178,186,485 | |
| | | | | | | | | |
The accompanying notes are an integral part of these financial statements.
| North Star Funds |
| STATEMENTS OF CHANGES IN NET ASSETS |
| | | North Star | |
| | | Micro Cap Fund | |
| | | | | | | |
| | | For the Year | | | For the Year | |
| | | Ended | | | Ended | |
| | | November 30, 2022 | | | November 30, 2021 | |
| Operations | | | | | | | | |
| Net Investment Income (Loss) | | $ | 561,097 | | | $ | (9,183 | ) |
| Net Realized Gain (Loss) on Investments | | | (291,870 | ) | | | 6,415,408 | |
| Net Change in Unrealized Appreciation (Depreciation) on Investments | | | (26,113,316 | ) | | | 9,326,866 | |
| Net Increase (Decrease) in Net Assets Resulting From Operations | | | (25,844,089 | ) | | | 15,733,091 | |
| | | | | | | | | |
| Distributions to Shareholders: | | | | | | | | |
| Class I Shares: | | | | | | | | |
| Distributions Paid | | | (4,109,397 | ) | | | (7,346 | ) |
| Total Distributions to Shareholders | | | (4,109,397 | ) | | | (7,346 | ) |
| | | | | | | | | |
| Capital Shares of Beneficial Interest | | | | | | | | |
| Class I Shares: | | | | | | | | |
| Proceeds from Shares Sold (162,756 and 497,920 shares, respectively) | | | 5,639,910 | | | | 21,879,552 | |
| Distributions Reinvested (87,913 and 180 shares, respectively) | | | 3,618,517 | | | | 6,491 | |
| Cost of Shares Redeemed (329,150 and 196,295 shares, respectively) | | | (11,922,793 | ) | | | (8,599,627 | ) |
| Redemption Fee Proceeds | | | 368 | | | | 7,163 | |
| Total Class I Shares | | | (2,663,998 | ) | | | 13,293,579 | |
| | | | | | | | | |
| Total Increase (Decrease) in Net Assets | | | (32,617,484 | ) | | | 29,019,324 | |
| | | | | | | | | |
| Net Assets | | | | | | | | |
| Beginning of Year | | | 126,281,252 | | | | 97,261,928 | |
| End of Year | | $ | 93,663,768 | | | $ | 126,281,252 | |
| | | | | | | | | |
The accompanying notes are an integral part of these financial statements.
| North Star Funds |
| STATEMENTS OF CHANGES IN NET ASSETS |
| | | North Star | |
| | | Dividend Fund | |
| | | | | | | |
| | | For the Year | | | For the Year | |
| | | Ended | | | Ended | |
| | | November 30, 2022 | | | November 30, 2021 | |
| Operations | | | | | | | | |
| Net Investment Income | | $ | 2,052,999 | | | $ | 1,622,532 | |
| Net Realized Gain on Investments | | | 2,760,670 | | | | 3,800,909 | |
| Net Change in Unrealized Appreciation (Depreciation) on Investments | | | (5,714,629 | ) | | | 8,693,711 | |
| Net Increase (Decrease) in Net Assets Resulting From Operations | | | (900,960 | ) | | | 14,117,152 | |
| | | | | | | | | |
| Distributions to Shareholders: | | | | | | | | |
| Class I Shares: | | | | | | | | |
| Distributions Paid | | | (3,322,435 | ) | | | (1,400,205 | ) |
| Total Distributions to Shareholders | | | (3,322,435 | ) | | | (1,400,205 | ) |
| | | | | | | | | |
| Capital Shares of Beneficial Interest | | | | | | | | |
| Class I Shares: | | | | | | | | |
| Proceeds from Shares Sold (219,310 and 474,549 shares, respectively) | | | 4,869,224 | | | | 11,414,701 | |
| Distributions Reinvested (117,345 and 47,999 shares, respectively) | | | 2,644,983 | | | | 1,137,294 | |
| Cost of Shares Redeemed (184,157 and 523,013 shares, respectively) | | | (4,017,143 | ) | | | (12,563,697 | ) |
| Redemption Fee Proceeds | | | 89 | | | | 5,001 | |
| Total Class I Shares | | | 3,497,153 | | | | (6,701 | ) |
| | | | | | | | | |
| Total Increase (Decrease) in Net Assets | | | (726,242 | ) | | | 12,710,246 | |
| | | | | | | | | |
| Net Assets | | | | | | | | |
| Beginning of Year | | | 88,006,047 | | | | 75,295,801 | |
| End of Year | | $ | 87,279,805 | | | $ | 88,006,047 | |
| | | | | | | | | |
The accompanying notes are an integral part of these financial statements.
| North Star Funds |
| STATEMENTS OF CHANGES IN NET ASSETS |
| | | North Star | |
| | | Bond Fund | |
| | | | | | | |
| | | For the Year | | | For the Year | |
| | | Ended | | | Ended | |
| | | November 30, 2022 | | | November 30, 2021 | |
| Operations | | | | | | | | |
| Net Investment Income | | $ | 715,717 | | | $ | 776,894 | |
| Net Realized Gain (Loss) on Investments | | | (24,492 | ) | | | 156,401 | |
| Net Change in Unrealized Depreciation on Investments | | | (2,463,554 | ) | | | (111,532 | ) |
| Net Increase (Decrease) in Net Assets Resulting From Operations | | | (1,772,329 | ) | | | 821,763 | |
| | | | | | | | | |
| Distributions to Shareholders: | | | | | | | | |
| Class I Shares: | | | | | | | | |
| Total Distributions Paid | | | (716,355 | ) | | | (849,571 | ) |
| | | | | | | | | |
| Capital Shares of Beneficial Interest | | | | | | | | |
| Class I Shares: | | | | | | | | |
| Proceeds from Shares Sold (186,017 and 487,476 shares, respectively) | | | 1,657,625 | | | | 4,498,836 | |
| Distributions Reinvested (61,789 and 70,641 shares, respectively) | | | 556,249 | | | | 678,123 | |
| Cost of Shares Redeemed (404,190 and 194,610 shares, respectively) | | | (3,597,237 | ) | | | (1,873,718 | ) |
| Total Class I Shares | | | (1,383,363 | ) | | | 3,303,241 | |
| | | | | | | | | |
| Total Increase (Decrease) in Net Assets | | | (3,872,047 | ) | | | 3,275,433 | |
| | | | | | | | | |
| Net Assets | | | | | | | | |
| Beginning of Year | | | 31,112,701 | | | | 27,837,268 | |
| End of Year | | $ | 27,240,654 | | | $ | 31,112,701 | |
| | | | | | | | | |
The accompanying notes are an integral part of these financial statements.
| North Star Funds |
| FINANCIAL HIGHLIGHTS |
| |
| The table below sets forth financial data for one share of beneficial interest outstanding throughout each year. |
| | | North Star Opportunity Fund | |
| | | Class I | |
| | | For the Year | | | For the Year | | | For the Year | | | For the Year | | | For the Year | |
| | | Ended | | | Ended | | | Ended | | | Ended | | | Ended | |
| | | November 30, 2022 | | | November 30, 2021 | | | November 30, 2020 | | | November 30, 2019 | | | November 30, 2018 | |
| Net Asset Value, Beginning of Year | | $ | 20.00 | | | $ | 16.71 | | | $ | 14.00 | | | $ | 13.52 | | | $ | 13.47 | |
| Activity From Investment Operations: | | | | | | | | | | | | | | | | | | | | |
| Net investment income (a) | | | 0.16 | | | | 0.10 | | | | 0.13 | | | | 0.21 | | | | 0.29 | |
| Net gain (loss) from securities (both realized and unrealized) | | | (3.57 | ) | | | 3.23 | | | | 2.69 | | | | 0.99 | | | | 0.13 | |
| Total from operations | | | (3.41 | ) | | | 3.33 | | | | 2.82 | | | | 1.20 | | | | 0.42 | |
| | | | | | | | | | | | | | | | | | | | | |
| Less Distributions From: | | | | | | | | | | | | | | | | | | | | |
| Net investment income | | | (0.11 | ) | | | (0.04 | ) | | | (0.10 | ) | | | (0.20 | ) | | | (0.25 | ) |
| Net realized gains on investments | | | (0.43 | ) | | | (0.00 | ) (b) | | | — | | | | (0.52 | ) | | | (0.12 | ) |
| Return of Capital | | | — | | | | — | | | | (0.01 | ) | | | — | | | | — | |
| Total Distributions | | | (0.54 | ) | | | (0.04 | ) | | | (0.11 | ) | | | (0.72 | ) | | | (0.37 | ) |
| | | | | | | | | | | | | | | | | | | | | |
| Redemption Fees | | | 0.00 | (b) | | | 0.00 | (b) | | | — | | | | 0.00 | (b) | | | — | |
| | | | | | | | | | | | | | | | | | | | | |
| Net Asset Value, End of Year | | $ | 16.05 | | | $ | 20.00 | | | $ | 16.71 | | | $ | 14.00 | | | $ | 13.52 | |
| | | | | | | | | | | | | | | | | | | | | |
| Total Return (c) | | | (17.48 | )% | | | 20.00 | % | | | 20.29 | % | | | 9.61 | % | | | 3.13 | % |
| | | | | | | | | | | | | | | | | | | | | |
| Ratios/Supplemental Data | | | | | | | | | | | | | | | | | | | | |
| Net assets, end of year (in 000’s) | | $ | 118,346 | | | $ | 146,910 | | | $ | 114,330 | | | $ | 93,761 | | | $ | 84,473 | |
| Ratio to average net assets: | | | | | | | | | | | | | | | | | | | | |
| Expenses, Gross (d) | | | 1.35 | % | | | 1.27 | % | | | 1.37 | % | | | 1.34 | % | | | 1.42 | % |
| Expenses, Net of waiver or recapture | | | 1.30 | % | | | 1.30 | % | | | 1.30 | % | | | 1.34 | % (e) | | | 1.42 | % |
| Net investment income | | | 0.93 | % | | | 0.52 | % | | | 0.90 | % | | | 1.58 | % | | | 2.11 | % |
| Portfolio turnover rate | | | 31 | % | | | 30 | % | | | 59 | % | | | 46 | % | | | 44 | % |
| | | | | | | | | | | | | | | | | | | | | |
| (a) | Per share amounts are calculated using the average shares method, which more appropriately presents the per share data for the period. |
| (b) | Less than $0.005 per share. |
| (c) | Total returns are historical in nature and assume changes in share price, reinvestment of dividends and capital gains distributions, if any. Had the Adviser not absorbed a portion of the expenses for the year ended November 30, 2020 and the year ended November 30, 2022, total returns would have been lower. Had the Advisor not recaptured expenses for the year ended November 30, 2021, total return would have been higher. |
| (d) | Represents the ratio of expenses to average net assets absent any fee waivers, expense reimbursements and/or expense recapture by the Adviser. |
| (e) | Effective February 19, 2019, the expense limitation was reduced to 1.30%. |
The accompanying notes are an integral part of these financial statements.
| North Star Funds |
| FINANCIAL HIGHLIGHTS |
| |
| The table below sets forth financial data for one share of beneficial interest outstanding throughout each year. |
| | | North Star Opportunity Fund | |
| | | Class A | |
| | | For the Year | | | For the Year | | | For the Year | | | For the Year | | | For the Year | |
| | | Ended | | | Ended | | | Ended | | | Ended | | | Ended | |
| | | November 30, 2022 | | | November 30, 2021 | | | November 30, 2020 | | | November 30, 2019 | | | November 30, 2018 | |
| Net Asset Value, Beginning of Year | | $ | 20.05 | | | $ | 16.76 | | | $ | 14.05 | | | $ | 13.57 | | | $ | 13.51 | |
| Activity From Investment Operations: | | | | | | | | | | | | | | | | | | | | |
| Net investment income (a) | | | 0.11 | | | | 0.05 | | | | 0.10 | | | | 0.17 | | | | 0.26 | |
| Net gain (loss) from securities (both realized and unrealized) | | | (3.58 | ) | | | 3.26 | | | | 2.69 | | | | 1.00 | | | | 0.13 | |
| Total from operations | | | (3.47 | ) | | | 3.31 | | | | 2.79 | | | | 1.17 | | | | 0.39 | |
| | | | | | | | | | | | | | | | | | | | | |
| Less Distributions From: | | | | | | | | | | | | | | | | | | | | |
| Net investment income | | | (0.06 | ) | | | (0.02 | ) | | | (0.07 | ) | | | (0.17 | ) | | | (0.21 | ) |
| Net realized gains on investments | | | (0.43 | ) | | | — | | | | — | | | | (0.52 | ) | | | (0.12 | ) |
| Return of Capital | | | — | | | | — | | | | (0.01 | ) | | | — | | | | — | |
| Total Distributions | | | (0.49 | ) | | | (0.02 | ) | | | (0.08 | ) | | | (0.69 | ) | | | (0.33 | ) |
| | | | | | | | | | | | | | | | | | | | | |
| Redemption Fees | | | — | | | | 0.00 | (b) | | | 0.00 | (b) | | | 0.00 | (b) | | | — | |
| | | | | | | | | | | | | | | | | | | | | |
| Net Asset Value, End of Year | | | 16.09 | | | | 20.05 | | | | 16.76 | | | | 14.05 | | | | 13.57 | |
| | | | | | | | | | | | | | | | | | | | | |
| Total Return (c) | | | (17.70 | )% | | | 19.73 | % | | | 19.99 | % | | | 9.32 | % | | | 2.92 | % |
| | | | | | | | | | | | | | | | | | | | | |
| Ratios/Supplemental Data | | | | | | | | | | | | | | | | | | | | |
| Net assets, end of year (in 000’s) | | $ | 19,469 | | | $ | 31,276 | | | $ | 26,940 | | | $ | 33,143 | | | $ | 16 | |
| Ratio to average net assets: | | | | | | | | | | | | | | | | | | | | |
| Expenses, Gross (d) | | | 1.60 | % | | | 1.51 | % | | | 1.62 | % | | | 1.55 | % | | | 1.67 | % |
| Expenses, Net of waiver or recapture | | | 1.55 | % | | | 1.54 | % | | | 1.55 | % | | | 1.55 | % (e) | | | 1.67 | % |
| Net investment income | | | 0.65 | % | | | 0.26 | % | | | 0.67 | % | | | 1.27 | % | | | 1.86 | % |
| Portfolio turnover rate | | | 31 | % | | | 30 | % | | | 59 | % | | | 46 | % | | | 44 | % |
| | | | | | | | | | | | | | | | | | | | | |
| (a) | Per share amounts are calculated using the average shares method, which more appropriately presents the per share data for the period. |
| (b) | Less than $0.005 per share. |
| (c) | Total returns are historical in nature and assume changes in share price, reinvestment of dividends and capital gains distributions, if any. Had the Adviser not absorbed a portion of the expenses for the years ended November 30, 2019, November 30, 2020 and November 30, 2022, total returns would have been lower. Had the Advisor not recaptured expenses for the year ended November 30, 2021, total return would have been higher. |
| (d) | Represents the ratio of expenses to average net assets absent any fee waivers, expense reimbursements and/or expense recapture by the Adviser. |
| (e) | Effective February 19, 2019, the expense limitation was reduced to 1.55%. |
The accompanying notes are an integral part of these financial statements.
| North Star Funds |
| FINANCIAL HIGHLIGHTS |
| |
| The table below sets forth financial data for one share of beneficial interest outstanding throughout each year. |
| | | North Star Micro Cap Fund | |
| | | Class I | |
| | | For the Year | | | For the Year | | | For the Year | | | For the Year | | | For the Year | |
| | | Ended | | | Ended | | | Ended | | | Ended | | | Ended | |
| | | November 30, 2022 | | | November 30, 2021 | | | November 30, 2020 | | | November 30, 2019 | | | November 30, 2018 | |
| Net Asset Value, Beginning of Year | | $ | 41.77 | | | $ | 35.74 | | | $ | 26.11 | | | $ | 26.86 | | | $ | 29.47 | |
| Activity From Investment Operations: | | | | | | | | | | | | | | | | | | | | |
| Net investment income (loss) (a) | | | 0.19 | | | | (0.00 | ) (b) | | | (0.00 | ) (b) | | | 0.00 | (b) | | | 0.00 | (b) |
| Net gain (loss) from securities (both realized and unrealized) | | | (8.80 | ) | | | 6.03 | | | | 9.76 | | | | 0.97 | | | | (1.70 | ) |
| Total from operations | | | (8.61 | ) | | | 6.03 | | | | 9.76 | | | | 0.97 | | | | (1.70 | ) |
| | | | | | | | | | | | | | | | | | | | | |
| Less Distributions From: | | | | | | | | | | | | | | | | | | | | |
| Net investment income | | | (0.10 | ) | | | (0.00 | ) (b) | | | (0.08 | ) | | | (0.04 | ) | | | — | |
| Net realized gains on investments | | | (1.25 | ) | | | — | | | | — | | | | (1.62 | ) | | | (0.91 | ) |
| Return of Capital | | | — | | | | — | | | | (0.05 | ) | | | (0.06 | ) | | | — | |
| Total Distributions | | | (1.35 | ) | | | (0.00 | ) | | | (0.13 | ) | | | (1.72 | ) | | | (0.91 | ) |
| | | | | | | | | | | | | | | | | | | | | |
| Redemption Fees | | | 0.00 | (b) | | | 0.00 | (b) | | | 0.00 | (b) | | | — | | | | — | |
| | | | | | | | | | | | | | | | | | | | | |
| Net Asset Value, End of Year | | $ | 31.81 | | | $ | 41.77 | | | $ | 35.74 | | | $ | 26.11 | | | $ | 26.86 | |
| | | | | | | | | | | | | | | | | | | | | |
| Total Return (c) | | | (21.34 | )% | | | 16.88 | % | | | 37.57 | % | | | 4.26 | % | | | (5.87 | )% |
| | | | | | | | | | | | | | | | | | | | | |
| Ratios/Supplemental Data | | | | | | | | | | | | | | | | | | | | |
| Net assets, end of year (in 000’s) | | $ | 93,664 | | | $ | 126,281 | | | $ | 97,262 | | | $ | 74,391 | | | $ | 77,748 | |
| Ratio to average net assets: | | | | | | | | | | | | | | | | | | | | |
| Expenses | | | 1.41 | % | | | 1.29 | % | | | 1.38 | % | | | 1.43 | % | | | 1.39 | % |
| Net investment income (loss) | | | 0.55 | % | | | (0.01 | )% | | | (0.00 | )% (d) | | | 0.02 | % | | | 0.01 | % |
| Portfolio turnover rate | | | 11 | % | | | 9 | % | | | 35 | % | | | 22 | % | | | 32 | % |
| | | | | | | | | | | | | | | | | | | | | |
| (a) | Per share amounts are calculated using the average shares method, which more appropriately presents the per share data for the period. |
| (b) | Less than $0.005 per share. |
| (c) | Total returns are historical in nature and assume changes in share price, reinvestment of dividends and capital gains distributions, if any. |
The accompanying notes are an integral part of these financial statements.
| North Star Funds |
| FINANCIAL HIGHLIGHTS |
| |
| The table below sets forth financial data for one share of beneficial interest outstanding throughout each year. |
| | | North Star Dividend Fund | |
| | | Class I | |
| | | For the Year | | | For the Year | | | For the Year | | | For the Year | | | For the Year | |
| | | Ended | | | Ended | | | Ended | | | Ended | | | Ended | |
| | | November 30, 2022 | | | November 30, 2021 | | | November 30, 2020 | | | November 30, 2019 | | | November 30, 2018 | |
| Net Asset Value, Beginning of Year | | $ | 23.43 | | | $ | 20.05 | | | $ | 20.35 | | | $ | 20.09 | | | $ | 21.93 | |
| Activity From Investment Operations: | | | | | | | | | | | | | | | | | | | | |
| Net investment income (a) | | | 0.53 | | | | 0.43 | | | | 0.37 | | | | 0.52 | | | | 0.49 | |
| Net gain (loss) from securities (both realized and unrealized) | | | (0.76 | ) | | | 3.32 | | | | (0.35 | ) | | | 1.04 | | | | (1.85 | ) |
| Total from operations | | | (0.23 | ) | | | 3.75 | | | | 0.02 | | | | 1.56 | | | | (1.36 | ) |
| | | | | | | | | | | | | | | | | | | | | |
| Less Distributions From: | | | | | | | | | | | | | | | | | | | | |
| Net investment income | | | (0.48 | ) | | | (0.37 | ) | | | (0.30 | ) | | | (0.51 | ) | | | (0.48 | ) |
| Net realized gains on investments | | | (0.39 | ) | | | — | | | | — | | | | (0.78 | ) | | | — | |
| Return of Capital | | | — | | | | — | | | | (0.02 | ) | | | (0.01 | ) | | | — | |
| Total Distributions | | | (0.87 | ) | | | (0.37 | ) | | | (0.32 | ) | | | (1.30 | ) | | | (0.48 | ) |
| | | | | | | | | | | | | | | | | | | | | |
| Redemption Fees (b) | | | 0.00 | | | | 0.00 | | | | 0.00 | | | | 0.00 | | | | 0.00 | |
| | | | | | | | | | | | | | | | | | | | | |
| Net Asset Value, End of Year | | $ | 22.33 | | | $ | 23.43 | | | $ | 20.05 | | | $ | 20.35 | | | $ | 20.09 | |
| | | | | | | | | | | | | | | | | | | | | |
| Total Return (c) | | | (0.96 | )% | | | 18.70 | % | | | 0.36 | % | | | 8.46 | % | | | (6.35 | )% |
| | | | | | | | | | | | | | | | | | | | | |
| Ratios/Supplemental Data | | | | | | | | | | | | | | | | | | | | |
| Net assets, end of year (in 000’s) | | $ | 87,280 | | | $ | 88,006 | | | $ | 75,296 | | | $ | 80,245 | | | $ | 79,134 | |
| Ratio to average net assets: | | | | | | | | | | | | | | | | | | | | |
| Expenses | | | 1.45 | % | | | 1.36 | % | | | 1.48 | % | | | 1.43 | % | | | 1.42 | % |
| Net investment income | | | 2.40 | % | | | 1.79 | % | | | 2.08 | % | | | 2.73 | % | | | 2.21 | % |
| Portfolio turnover rate | | | 22 | % | | | 12 | % | | | 54 | % | | | 15 | % | | | 20 | % |
| | | | | | | | | | | | | | | | | | | | | |
| (a) | Per share amounts are calculated using the average shares method, which more appropriately presents the per share data for the period. |
| (b) | Less than $0.005 per share. |
| (c) | Total returns are historical in nature and assume changes in share price, reinvestment of dividends and capital gains distributions, if any. |
The accompanying notes are an integral part of these financial statements.
| North Star Funds |
| FINANCIAL HIGHLIGHTS |
| |
| The table below sets forth financial data for one share of beneficial interest outstanding throughout each year. |
| | | North Star Bond Fund | |
| | | Class I | |
| | | For the Year | | | For the Year | | | For the Year | | | For the Year | | | For the Year | |
| | | Ended | | | Ended | | | Ended | | | Ended | | | Ended | |
| | | November 30, 2022 | | | November 30, 2021 | | | November 30, 2020 | | | November 30, 2019 | | | November 30, 2018 | |
| Net Asset Value, Beginning of Year | | $ | 9.49 | | | $ | 9.49 | | | $ | 9.69 | | | $ | 9.44 | | | $ | 9.92 | |
| Activity From Investment Operations: | | | | | | | | | | | | | | | | | | | | |
| Net investment income (a) | | | 0.22 | | | | 0.25 | | | | 0.31 | | | | 0.34 | | | | 0.35 | |
| Net gain (loss) from securities (both realized and unrealized) | | | (0.76 | ) | | | 0.02 | | | | (0.22 | ) | | | 0.25 | | | | (0.48 | ) |
| Total from operations | | | (0.54 | ) | | | 0.27 | | | | 0.09 | | | | 0.59 | | | | (0.13 | ) |
| | | | | | | | | | | | | | | | | | | | | |
| Less Distributions From: | | | | | | | | | | | | | | | | | | | | |
| Net investment income | | | (0.22 | ) | | | (0.27 | ) | | | (0.29 | ) | | | (0.34 | ) | | | (0.35 | ) |
| Total Distributions | | | (0.22 | ) | | | (0.27 | ) | | | (0.29 | ) | | | (0.34 | ) | | | (0.35 | ) |
| | | | | | | | | | | | | | | | | | | | | |
| Redemption Fees | | | — | | | | — | | | | 0.00 | (b) | | | 0.00 | (b) | | | 0.00 | (b) |
| | | | | | | | | | | | | | | | | | | | | |
| Net Asset Value, End of Year | | $ | 8.73 | | | $ | 9.49 | | | $ | 9.49 | | | $ | 9.69 | | | $ | 9.44 | |
| | | | | | | | | | | | | | | | | | | | | |
| Total Return (c) | | | (5.69 | )% | | | 2.85 | % | | | 1.07 | % | | | 6.29 | % | | | (1.34 | )% |
| | | | | | | | | | | | | | | | | | | | | |
| Ratios/Supplemental Data | | | | | | | | | | | | | | | | | | | | |
| Net assets, end of year (in 000’s) | | $ | 27,241 | | | $ | 31,113 | | | $ | 27,837 | | | $ | 25,584 | | | $ | 22,539 | |
| Ratio to average net assets: | | | | | | | | | | | | | | | | | | | | |
| Expenses, Gross (d) | | | 1.63 | % | | | 1.59 | % | | | 1.63 | % | | | 1.63 | % | | | 1.68 | % |
| Expenses, Net of expense waiver or recapture | | | 1.63 | % | | | 1.59 | % | | | 1.63 | % | | | 1.63 | % | | | 1.77 | % |
| Net investment income | | | 2.48 | % | | | 2.56 | % | | | 3.35 | % | | | 3.55 | % | | | 3.57 | % |
| Portfolio turnover rate | | | 27 | % | | | 42 | % | | | 55 | % | | | 33 | % | | | 23 | % |
| | | | | | | | | | | | | | | | | | | | | |
| (a) | Per share amounts are calculated using the average shares method, which more appropriately presents the per share data for the period. |
| (b) | Less than $0.005 per share. |
| (c) | Total return represents aggregate total return based on Net Asset Value. Total returns are historical in nature and assume changes in share price, reinvestment of dividends and capital gains distributions, if any. Had the Adviser not recaptured previously waived expenses for the fiscal years ended November 30, 2018 and 2017, total returns would have been higher in those years. |
| (d) | Represents the ratio of expenses to average net assets absent fee waivers, expense reimbursements and/or recapture by the Adviser. |
The accompanying notes are an integral part of these financial statements.
| North Star Funds |
| NOTES TO FINANCIAL STATEMENTS |
| November 30, 2022 |
The North Star Opportunity Fund, the North Star Micro Cap Fund, the North Star Dividend Fund and the North Star Bond Fund (each a “Fund,” and together the “Funds”) are each a series of shares of beneficial interest of the Northern Lights Fund Trust II (the “Trust”), a trust organized under the laws of the State of Delaware on August 26, 2010, and are registered under the Investment Company Act of 1940, as amended (the “1940 Act”), as open-ended management investment companies.
The diversification policy of each Fund is as follows:
Fund
| North Star Opportunity Fund | Diversified |
| North Star Micro Cap Fund | Diversified |
| North Star Dividend Fund | Diversified |
| North Star Bond Fund | Diversified |
The investment objective of each Fund is as follows:
| Fund | Primary Objective |
| North Star Opportunity Fund | To seek long-term capital appreciation |
| North Star Micro Cap Fund | Capital appreciation and to derive income from short term liquid securities |
| North Star Dividend Fund | To generate dividend income and to seek capital appreciation |
| North Star Bond Fund | To generate income, with preservation of capital |
The North Star Micro Cap Fund is the successor to the Kuby Gottlieb Special Value Fund, L.P. (the “Predecessor Micro Cap Fund”), which transferred its assets to the North Star Micro Cap Fund in connection with the North Star Micro Cap Fund’s commencement of operations. The North Star Dividend Fund is the successor to the North Star Dividend Fund, L.P. (the “Predecessor Dividend Fund”), which transferred its assets to the North Star Dividend Fund in connection with the North Star Dividend Fund’s commencement of operations. The North Star Opportunity Fund is the successor to the North Star Opportunity Fund, L.P. (the “Predecessor North Star Opportunity Fund”), which transferred its assets to the Fund in connection with the North Star Opportunity Fund’s commencement of operations. The Predecessor Funds were managed by the same adviser who currently manages the Funds, and have substantially similar investment objectives and strategies to those of the Funds. Each Fund commenced operations on the following dates:
| Fund | Date |
| North Star Opportunity Fund | December 15, 2011 |
| North Star Micro Cap Fund | May 31, 2013 |
| North Star Dividend Fund | May 31, 2013 |
| North Star Bond Fund | December 19, 2014 |
The North Star Micro Cap Fund, the North Star Dividend Fund and the North Star Bond Fund currently offer Class I shares. The North Star Opportunity Fund currently offers Class I and Class A shares. Class A shares are offered at net asset value plus a maximum sales charge of 5.75%. Class I shares are offered at net asset value. Each class represents an interest in the same assets of the Fund and classes are identical except for differences in their sales charge structures and ongoing service and distribution charges. All classes of shares have equal voting privileges except that each class has exclusive voting rights with respect to its service and/or distribution plans. The Funds’ income, expenses (other than class specific distribution fees) and realized and unrealized gains and losses are allocated proportionately each day based upon the relative net assets of each class.
| North Star Funds |
| NOTES TO FINANCIAL STATEMENTS (Continued) |
| November 30, 2022 |
| 2. | SUMMARY OF SIGNIFICANT ACCOUNTING POLICIES |
The following is a summary of significant accounting policies followed by the Funds in preparation of their financial statements. These policies are in conformity with accounting principles generally accepted in the United States of America (“GAAP”). The preparation of financial statements requires management to make estimates and assumptions that affect the reported amounts of assets and liabilities and disclosure of contingent assets and liabilities at the date of the financial statements and the reported amounts of income and expenses for the period. Actual results could differ from those estimates. The Funds are investment companies and accordingly follow the investment company accounting and reporting guidance of the Financial Accounting Standards Board (FASB) Accounting Standard Codification Topic 946 “Financial Services – Investment Companies”.
Securities valuation – Securities listed on an exchange are valued at the last reported sale price at the close of the regular trading session of the primary exchange on the business day the value is being determined, or in the case of securities listed on NASDAQ at the NASDAQ Official Closing Price. In the absence of a sale such securities shall be valued at the mean between the current bid and ask prices on the day of valuation. Short-term investments that mature in 60 days or less may be valued at amortized cost, provided such valuations represent fair value. Debt securities (other than short-term obligations) are valued each day by an independent pricing service approved by the Board of Trustees (the “Board”) based on methods which include consideration of: yields or prices of securities of comparable quality, coupon, maturity and type, indications as to values from dealers, and general market conditions or market quotations from a major market maker in the securities. The independent pricing service does not distinguish between smaller-sized bond positions known as “odd lots” and larger institutional-sized bond positions known as “round lots”. The Funds may fair value a particular bond if the adviser does not believe that the round lot value provided by the independent pricing service reflects fair value of the Funds’ holding. Investments in open-ended investment companies are valued at net asset value.
The Fund may hold securities, such as private investments, interests in commodity pools, other non-traded securities or temporarily illiquid securities, for which market quotations are not readily available or are determined to be unreliable. These securities are valued using the “fair value” procedures approved by the Board. The Board has designated the adviser as its valuation designee (the “Valuation Designee”) to execute these procedures. The Board may also enlist third party consultants such a valuation specialist at a public accounting firm, valuation consultant or financial officer of a security issuer on an as -needed basis to assist the Valuation Designee in determining a security-specific fair value. The Board is responsible for reviewing and approving fair value methodologies utilized by the Valuation Designee, approval of which shall be based upon whether the Valuation Designee followed the valuation procedures established by the Board.
Fair Valuation Process –The applicable investments are valued by the Valuation Designee pursuant to valuation procedures established by the Board. For example, fair value determinations are required for the following securities: (i) securities for which market quotations are insufficient or not readily available on a particular business day (including securities for which there is a short and temporary lapse in the provision of a price by the regular pricing source); (ii) securities for which, in the judgment of the Valuation Designee, the prices or values available do not represent the fair value of the instrument; factors which may cause the Valuation Designee to make such a judgment include, but are not limited to, the following: only a bid price or an asked price is available; the spread between bid and asked prices is substantial; the frequency of sales; the thinness of the market; the size of reported trades; and actions of the securities markets, such as the suspension or limitation of trading; (iii) securities determined to be illiquid; and (iv) securities with respect to which an event that affects the value thereof has occurred (a “significant event”) since the closing prices were established on the principal exchange on which they are traded, but prior to a Fund’s calculation of its net asset value. Specifically, interests in commodity pools or managed futures pools are valued on a daily basis by reference to the closing market prices of each futures contract or other asset held by a pool, as adjusted for pool expenses. Restricted or illiquid securities, such as private investments or non-traded securities are valued based upon the current bid for the security from two or more independent dealers or other parties reasonably familiar with the facts and circumstances of the security (who should take into consideration all
| North Star Funds |
| NOTES TO FINANCIAL STATEMENTS (Continued) |
| November 30, 2022 |
relevant factors as may be appropriate under the circumstances). If a current bid from such independent dealers or other independent parties is unavailable, the Valuation Designee shall determine the fair value of such security using the following factors: (i) the type of security; (ii) the cost at date of purchase; (iii) the size and nature of the Fund’s holdings; (iv) the discount from market value of unrestricted securities of the same class at the time of purchase and subsequent thereto; (v) information as to any transactions or offers with respect to the security; (vi) the nature and duration of restrictions on disposition of the security and the existence of any registration rights; (vii) how the yield of the security compares to similar securities of companies of similar or equal creditworthiness; (viii) the level of recent trades of similar or comparable securities; (ix) the liquidity characteristics of the security; (x) current market conditions; and (xi) the market value of any securities into which the security is convertible or exchangeable.
The Funds utilize various methods to measure the fair value of all of their investments on a recurring basis. GAAP establishes a hierarchy that prioritizes inputs to valuation methods. The three levels of input are:
Level 1 – Unadjusted quoted prices in active markets for identical assets and liabilities that the Fund has the ability to access.
Level 2 – Observable inputs other than quoted prices included in Level 1 that are observable for the asset or liability, either directly or indirectly. These inputs may include quoted prices for the identical instrument on an inactive market, prices for similar instruments, interest rates, prepayment speeds, credit risk, yield curves, default rates and similar data.
Level 3 – Unobservable inputs for the asset or liability, to the extent relevant observable inputs are not available, representing the Fund’s own assumptions about the assumptions a market participant would use in valuing the asset or liability, and would be based on the best information available.
The availability of observable inputs can vary from security to security and is affected by a wide variety of factors, including, for example, the type of security, whether the security is new and not yet established in the marketplace, the liquidity of markets, and other characteristics particular to the security. To the extent that valuation is based on models or inputs that are less observable or unobservable in the market, the determination of fair value requires more judgment. Accordingly, the degree of judgment exercised in determining fair value is greatest for instruments categorized in Level 3.
The inputs used to measure fair value may fall into different levels of the fair value hierarchy. In such cases, for disclosure purposes, the level in the fair value hierarchy within which the fair value measurement falls in its entirety, is determined based on the lowest level input that is significant to the fair value measurement in its entirety.
The inputs or methodology used for valuing securities are not necessarily an indication of the risk associated with investing in those securities. The following tables summarize the inputs used as of November 30, 2022 for the Funds’ investments measured at fair value:
North Star Opportunity Fund
| Assets * | | Level 1 | | | Level 2 | | | Level 3 | | | Total | |
| Common Stocks | | $ | 105,883,648 | | | $ | — | | | $ | — | | | $ | 105,883,648 | |
| Preferred Stocks | | | 2,503,440 | | | | — | | | | — | | | | 2,503,440 | |
| Corporate Bonds | | | — | | | | 9,548,579 | | | | — | | | | 9,548,579 | |
| U.S. Government & Agencies | | | — | | | | 967,924 | | | | — | | | | 967,924 | |
| Short-Term Investments | | | 2,125,569 | | | | 16,762,711 | | | | — | | | | 18,888,280 | |
| Total | | $ | 110,512,657 | | | $ | 27,279,214 | | | $ | — | | | $ | 137,791,871 | |
| North Star Funds |
| NOTES TO FINANCIAL STATEMENTS (Continued) |
| November 30, 2022 |
North Star Micro Cap Fund
| Assets * | | Level 1 | | | Level 2 | | | Level 3 | | | Total | |
| Common Stocks | | $ | 83,579,323 | | | $ | 1,731,159 | | | $ | — | | | $ | 85,310,482 | |
| Short-Term Investment | | | 8,344,938 | | | | — | | | | — | | | | 8,344,938 | |
| Total | | $ | 91,924,261 | | | $ | 1,731,159 | | | $ | — | | | $ | 93,655,420 | |
| | | | | | | | | | | | | | | | | |
| North Star Dividend Fund | | | | | | | | | | | | |
| | | | | | | | | | | | | |
| Assets * | | Level 1 | | | Level 2 | | | Level 3 | | | Total | |
| Common Stocks | | $ | 77,198,698 | | | $ | — | | | $ | — | | | $ | 77,198,698 | |
| Short-Term Investment | | | 10,056,157 | | | | — | | | | — | | | | 10,056,157 | |
| Total | | $ | 87,254,855 | | | $ | — | | | $ | — | | | $ | 87,254,855 | |
| | | | | | | | | | | | | | | | | |
| North Star Bond Fund | | | | | | | | | | | | |
| | | | | | | | | | | | | |
| Assets * | | Level 1 | | | Level 2 | | | Level 3 | | | Total | |
| Preferred Stocks | | $ | 2,288,175 | | | $ | — | | | $ | — | | | $ | 2,288,175 | |
| Convertible Bonds | | | — | | | | 3,271,510 | | | | — | | | | 3,271,510 | |
| Corporate Bonds | | | — | | | | 17,846,288 | | | | — | | | | 17,846,288 | |
| Short-Term Investments | | | 1,241,488 | | | | 2,263,770 | | | | — | | | | 3,505,258 | |
| Total | | $ | 3,529,663 | | | $ | 23,381,568 | | | $ | — | | | $ | 26,911,231 | |
The Funds did not hold any Level 3 securities during the year.
| * | Refer to the Schedules of Investments for security classifications. |
Security Transactions and Investment Income – Investment security transactions are accounted for on a trade date basis. Cost is determined and gains and losses are based upon the specific identification method for both financial statement and federal income tax purposes. Dividend income is recorded on the ex-dividend date and interest income is recorded on the accrual basis. Purchase discounts and premiums on securities are accreted and amortized over the life of the respective securities.
Expenses – Expenses of the Trust that are directly identifiable to a specific fund are charged to that fund. Expenses, which are not readily identifiable to a specific fund, are allocated in such a manner as deemed equitable, taking into consideration the nature and type of expense and the relative sizes of the funds in the Trust.
Federal Income Taxes – Each Fund intends to comply with the requirements of Subchapter M of the Internal Revenue Code applicable to regulated investment companies and will distribute all of its taxable income, if any, to shareholders. Accordingly, no provision for Federal income taxes is required in the financial statements.
Each Fund recognizes the tax benefits of uncertain tax positions only where the position is “more likely than not” to be sustained assuming examination by tax authorities. Management has analyzed the Funds tax positions and has concluded that no liability for unrecognized tax benefits should be recorded related to uncertain tax positions taken on returns filed for open tax years November 30, 2019 to November 30, 2021 or expected to be taken in the Fund’s November 30, 2022 tax returns. Each Fund identifies its major tax jurisdictions as U.S. Federal, Ohio and foreign jurisdictions where the Fund may make significant investments. However, the Funds are not aware of any tax positions for which it is reasonably possible that the total amounts of unrecognized tax benefits will change materially in the next twelve months.
| North Star Funds |
| NOTES TO FINANCIAL STATEMENTS (Continued) |
| November 30, 2022 |
Distributions to Shareholders – The following table summarizes each Fund’s Investment Income and Capital Gain declaration policy:
| Fund | Income Dividends | Capital Gains |
| North Star Opportunity Fund | Quarterly | Annually |
| North Star Micro Cap Fund | Annually | Annually |
| North Star Dividend Fund | Monthly | Annually |
| North Star Bond Fund | Monthly | Annually |
Each Fund records dividends and distributions to its shareholders on the ex-dividend date. Dividends from net investment income and distributions from net realized gains are determined in accordance with federal income tax regulations, which may differ from GAAP. These “book/tax” differences are considered either temporary (e.g., deferred losses, capital loss carryforwards) or permanent in nature. To the extent these differences are permanent in nature, such amounts are reclassified within the composition of net assets based on their federal tax-basis treatment; temporary differences do not require reclassification. Any such reclassifications will have no effect on net assets, results of operations or net asset values per share of each Fund.
Indemnification – The Trust indemnifies its officers and trustees for certain liabilities that may arise from the performance of their duties to the Trust. Additionally, in the normal course of business, the Funds enter into contracts that contain a variety of representations and warranties and which provide general indemnities. Each Fund’s maximum exposure under these arrangements is unknown, as this would involve future claims that may be made against the Fund that have not yet occurred. However, based on experience, the risk of loss due to these warranties and indemnities appears to be remote.
| 3. | INVESTMENT ADVISORY AGREEMENT AND TRANSACTIONS WITH RELATED PARTIES |
Advisory Fees – North Star Investment Management Corp. serves as the Funds’ Investment Adviser (the “Adviser”). Pursuant to an Investment Advisory Agreement with the Funds, the Adviser, under the oversight of the Board, directs the daily operations of the Funds and supervises the performance of administrative and professional services provided by others. Under the terms of the Advisory Agreement, the Adviser receives monthly fees calculated at an annual rate of the average daily net assets of each Fund:
| Fund | Advisory Fee |
| North Star Opportunity Fund | 1.00% on the first $100 million in net assets |
| | 0.90% on net assets greater than $100 million |
| North Star Micro Cap Fund | 1.00% on the first $100 million in net assets |
| | 0.90% on net assets greater than $100 million |
| North Star Dividend Fund | 1.00% on the first $100 million in net assets |
| | 0.90% on net assets greater than $100 million |
| North Star Bond Fund | 0.85% |
For the year ended November 30, 2022, the Adviser earned advisory fees of:
| Fund | | Advisory Fee | |
| North Star Opportunity Fund | | $ | 1,486,701 | |
| North Star Micro Cap Fund | | | 1,018,114 | |
| North Star Dividend Fund | | | 855,286 | |
| North Star Bond Fund | | | 245,712 | |
| North Star Funds |
| NOTES TO FINANCIAL STATEMENTS (Continued) |
| November 30, 2022 |
The Adviser has contractually agreed, at least until March 31, 2024 for North Star Opportunity, North Star Micro Cap, North Star Dividend and North Star Bond Funds, to waive all or part of its management fees and/or make payments to limit Funds expenses (exclusive of any front-end or contingent deferred loads, taxes, leverage interest, brokerage commissions, expenses incurred in connection with any merger or reorganization, dividend expense on securities sold short, acquired fund fees and expenses, or extraordinary expenses such as litigation) so that the total annual operating expenses of the Funds do not exceed 1.55% and 1.30% of the North Star Opportunity Fund’s average net assets, for Class A and Class I shares, respectively, 1.74% of the North Star Micro Cap Fund’s average net assets for Class I shares, 1.74% of the North Star Dividend Fund’s average net assets for Class I shares and 1.79% of the North Star Bond Fund’s average net assets for Class I shares. For the year ended November 30, 2022, the Adviser waived fees in the amount of $70,810 for the Opportunity Fund.
If the Adviser waives any fee or reimburses any expense pursuant to the Waiver Agreement, and the Fund’s Operating Expenses are subsequently less than 1.55% and 1.30% of the North Star Opportunity Fund’s average daily net assets attributable to Class A and Class I shares, respectively, 1.74% of the North Star Micro Cap Fund’s and North Star Dividend Fund’s average daily net assets for Class I shares and 1.79% of the North Star Bond Fund’s average daily net assets for Class I shares, the Adviser shall be entitled to recapture by the Funds for such waived fees or reimbursed expenses provided that such reimbursement does not cause the Funds expenses to exceed 1.55% and 1.30% of the North Star Opportunity Fund’s average daily net assets for Class A and Class I shares, respectively, 1.74% of the North Star Micro Cap Fund’s and North Star Dividend Fund’s average daily net assets for Class I shares and 1.79% of the North Star Bond Fund’s average daily net assets for Class I shares. If Fund Operating Expenses subsequently exceed 1.55% and 1.30% of the North Star Opportunity Fund’s Class A and Class I shares respectively, 1.74% of the North Star Micro Cap Fund’s and North Star Dividend Fund’s Class I shares and 1.79% of the North Star Bond Fund’s Class I shares per annum of the average daily net assets, the reimbursements shall be suspended.
The Adviser may seek reimbursement only for expenses waived or paid by it during the three fiscal years prior to such reimbursement; provided, however, that such expenses may only be reimbursed to the extent they were waived or paid after the date of the Waiver Agreement (or any similar agreement.) The Adviser may recapture expenses only if the expenses are below the expense limitation at the time of the waiver, for North Star Opportunity Fund. The Board may terminate this expense reimbursement arrangement at any time. For the fiscal year ended November 30, 2022, the North Star Micro Cap, North Star Dividend and North Star Bond Funds had no recapture available. Cumulative expenses subject to recapture pursuant to the aforementioned conditions as of November 30, 2022 will expire on November 30 of the following years:
| Fund | Amount | Expiring |
| North Star Opportunity Fund | $32,002 | 2023 |
| | $70,810 | 2025 |
Distributor – The Board has adopted the Trust’s Master Distribution and Shareholder Service Plan (the “Plan”) pursuant to Rule 12b-1 under the 1940 Act. The distributor of the Funds is Northern Lights Distributors, LLC (the “Distributor”). The Board of Trustees of the Northern Lights Fund Trust II has adopted, on behalf of the North Star Opportunity Fund, a Distribution Plan pursuant to Rule 12b-1 under the Investment Company Act of 1940 (the “Plan”), as amended, to pay for certain distribution activities and shareholder services. Under the Plan, the Fund is permitted to pay 0.25% per year of its average daily net assets of Class A shares for such distribution and shareholder service activities. For the year ended November 30, 2022, the North Star Opportunity Fund Class A shares incurred $63,603 in distribution fees.
The Distributor acts as the Funds’ principal underwriter in a continuous offering of each Fund’s shares. For the year ended November 30, 2022, the Distributor received $12,324 in underwriting commissions, of which $2,071 was retained by the principal underwriter for sales of the North Star Opportunity Fund’s Class A shares.
| North Star Funds |
| NOTES TO FINANCIAL STATEMENTS (Continued) |
| November 30, 2022 |
In addition, certain affiliates of the Distributor provide services to the Funds as follows:
Ultimus Fund Solutions, LLC (“UFS”) – an affiliate of the Distributor, provides administration, fund accounting, and transfer agent services to the Trust. Pursuant to separate servicing agreements with UFS, the Fund pays UFS customary fees for providing administration, fund accounting and transfer agency services to the Fund. Certain officers of the Trust are also officers of UFS, and are not paid any fees directly by the Fund for serving in such capacities.
Northern Lights Compliance Services, LLC (“NLCS”) – NLCS, an affiliate of UFS and the Distributor, provides a Chief Compliance Officer to the Trust, as well as related compliance services, pursuant to a consulting agreement between NLCS and the Trust. Under the terms of such agreement, NLCS receives customary fees from the Funds.
Blu Giant, LLC (“Blu Giant”) – Blu Giant, an affiliate of UFS and the Distributor, provides EDGAR conversion and filing services as well as print management services for the Funds on an ad-hoc basis. For the provision of these services, Blu Giant receives customary fees from the Funds.
| 4. | INVESTMENT TRANSACTIONS |
The cost of purchases and proceeds from the sale of securities, other than short-term securities, for the year ended November 30, 2022 were as follows:
| Fund | | Purchases | | | Sales | |
| North Star Opportunity Fund | | $ | 43,299,472 | | | $ | 59,363,692 | |
| North Star Micro Cap Fund | | | 10,805,433 | | | | 23,172,331 | |
| North Star Dividend Fund | | | 16,970,095 | | | | 19,646,239 | |
| North Star Bond Fund | | | 7,315,195 | | | | 9,203,033 | |
The beneficial ownership, either directly or indirectly, of more than 25% of the voting securities of a Fund creates presumption of control of the Fund, under Section 2(a)(9) of the 1940 Act. As of November 30, 2022, NFS LLC held approximately 64.8% of the voting securities the North Star Opportunity Fund, 68.3% of the North Star Micro Cap Fund, 76.8% of the North Star Dividend Fund and 81.0% of the North Star Bond Fund. The Trust has no knowledge as to whether all or any portion of the shares owned of record are also beneficially owned by NFS LLC.
The Funds may assess a short-term redemption fee of 2.00% of the total redemption amount if shareholders sell their shares after holding them for less than 30 days. The redemption fee is paid directly to the Funds. For the year ended November 30, 2022 the North Star Opportunity Fund had $0 and $129 in redemption fees for Class A and Class I, respectively. The North Star Micro Cap Fund had $368 in redemption fees, the North Star Dividend Fund had $89 in redemption fees and the North Star Bond Fund had $0 in redemption fees.
| 7. | INVESTMENTS IN AFFILIATED ISSUERS |
An affiliated issuer is an issuer in which the Fund has ownership of at least 5% of the voting securities. Issuers which are affiliates of the North Star Micro Cap Fund at November 30, 2022, are noted in the Fund’s Schedule of Investments.
North Star Funds
NOTES TO FINANCIAL STATEMENTS (Continued)
November 30, 2022
Transactions during the period with companies which are affiliates are as follows:
North Star Micro Cap Fund
| | | | | | | | | | | | | | | | | | Net Change in | | | | |
| | | | | | | | | | | | Dividends | | | | | | Unrealized | | | | |
| | | Fair Value | | | | | | | | | Credited to | | | Realized | | | Appreciation | | | Fair Value | |
| Description | | 11/30/2021 | | | Purchases | | | Sales | | | Income | | | Gain/(Loss) | | | (Depreciation) | | | 11/30/2022 | |
| Truett-Hurst, Inc. - Class A | | $ | 195,120 | | | $ | — | | | $ | — | | | $ | — | | | $ | — | | | $ | (89,122 | ) | | $ | 105,998 | |
| 8. | AGGREGATE UNREALIZED APPRECIATION AND DEPRECIATION |
The identified cost of investments in securities owned by each Fund for federal income tax purposes, and their respective gross unrealized appreciation and depreciation at November 30, 2022, were as follows:
| | | | | | | | | | | | Net Unrealized | |
| | | | | | Gross Unrealized | | | Gross Unrealized | | | Appreciation/ | |
| Fund | | Tax Cost | | | Appreciation | | | Depreciation | | | (Depreciation) | |
| North Star Opportunity Fund | | $ | 91,956,540 | | | $ | 47,264,750 | | | $ | (1,429,419 | ) | | $ | 45,835,331 | |
| North Star Micro Cap Fund | | | 73,069,381 | | | | 29,599,979 | | | | (9,013,940 | ) | | | 20,586,039 | |
| North Star Dividend Fund | | | 70,240,987 | | | | 20,269,004 | | | | (3,255,136 | ) | | | 17,013,868 | |
| North Star Bond Fund | | | 28,707,065 | | | | 169,399 | | | | (1,965,233 | ) | | | (1,795,834 | ) |
| 9. | DISTRIBUTIONS TO SHAREHOLDERS AND TAX COMPONENTS OF CAPITAL |
The tax character of fund distributions for the following years were as follows:
| | | For the period ended November 30, 2022 | | | For the period ended November 30, 2021 | |
| | | Ordinary | | | Long-Term | | | | | | Ordinary | | | Long-Term | | | | |
| Fund | | Income | | | Capital Gains | | | Total | | | Income | | | Capital Gains | | | Total | |
| North Star Opportunity Fund | | $ | 563,337 | | | $ | 4,128,956 | | | $ | 4,692,293 | | | $ | 343,830 | | | $ | 36,054 | | | $ | 379,884 | |
| North Star Micro Cap Fund | | | 319,631 | | | | 3,789,766 | | | | 4,109,397 | | | | — | | | | 7,346 | | | | 7,346 | |
| North Star Dividend Fund | | | 1,462,632 | | | | 1,859,803 | | | | 3,322,435 | | | | 1,400,205 | | | | — | | | | 1,400,205 | |
| North Star Bond Fund | | | 716,355 | | | | — | | | | 716,355 | | | | 849,571 | | | | — | | | | 849,571 | |
As of November 30, 2022, the components of accumulated earnings/(deficit) on a tax basis were as follows:
| | | Undistributed | | | Undistributed | | | Post October Loss | | | Capital Loss | | | Other | | | Unrealized | | | Total | |
| | | Ordinary | | | Long-Term | | | and | | | Carry | | | Book/Tax | | | Appreciation/ | | | Accumulated | |
| Fund | | Income | | | Capital Gains | | | Late Year Loss | | | Forwards | | | Differences | | | (Depreciation) | | | Earnings/(Deficits) | |
| North Star Opportunity Fund | | $ | 386,067 | | | $ | 4,436,778 | | | $ | (20,439 | ) | | $ | — | | | $ | (52,957 | ) | | $ | 45,835,349 | | | $ | 50,584,798 | |
| North Star Micro Cap Fund | | | 172,645 | | | | — | | | | (27,329 | ) | | | (438,972 | ) | | | 231,679 | | | | 20,586,039 | | | | 20,524,062 | |
| North Star Dividend Fund | | | 528,584 | | | | 3,060,558 | | | | — | | | | — | | | | 142,022 | | | | 17,013,866 | | | | 20,745,030 | |
| North Star Bond Fund | | | 9,725 | | | | — | | | | — | | | | (1,969,714 | ) | | | 8,598 | | | | (1,795,834 | ) | | | (3,747,225 | ) |
| North Star Funds |
| NOTES TO FINANCIAL STATEMENTS (Continued) |
| November 30, 2022 |
The difference between book basis and tax basis unrealized appreciation (depreciation), undistributed ordinary income (loss) and accumulated net realized gain (loss) from investments is primarily attributable to the tax deferral of losses on wash sales, adjustments for tax gain/loss due to the Funds’ conversion from limited partnerships, unamortized organizational costs from fund mergers and tax adjustments for real estate investment trusts, trust preferred securities, C-Corporations with return of capital distributions and perpetual bonds. The unrealized appreciation (depreciation) in the table above includes unrealized foreign currency gains (losses) of $(18) and $2 for the North Start Opportunity Fund and Norths Star Dividend Fund, respectively.
Capital losses incurred after October 31 within the fiscal year are deemed to arise on the first business day of the following fiscal year for tax purposes. The following Funds incurred and elected to defer such capital losses as follows:
| Fund | | Post October Losses | |
| North Star Opportunity Fund | | $ | 20,439 | |
| North Star Micro Cap Fund | | | 27,329 | |
At November 30, 2022, the following Funds had capital loss carry forwards for federal income tax purposes available to offset future capital gains as follows:
| | | Non-Expiring | | | | | | | |
| Fund | | Short-Term | | | Long-Term | | | Total | | | CLCF Utilized | |
| North Star Micro Cap Fund | | $ | 389,365 | | | $ | 49,607 | | | $ | 438,972 | | | $ | — | |
| North Star Bond Fund | | | 869,000 | | | | 1,100,714 | | | | 1,969,714 | | | | — | |
Permanent book and tax differences, primarily attributable to net operating losses, non-deductible expenses, adjustments for the tax gain/loss due to the Funds’ conversion from limited partnerships and adjustments for prior year tax returns, resulted in reclassification for the following Funds for the year ended November 30, 2022, as follows:
| | | Paid | | | Accumulated | |
| | | In | | | Earnings | |
| Fund | | Capital | | | (Losses) | |
| North Star Opportunity Fund | | $ | 273,796 | | | $ | (273,796 | ) |
| North Star Micro Cap Fund | | | 174,431 | | | | (174,431 | ) |
| North Star Dividend Fund | | | (350,058 | ) | | | 350,058 | |
| North Star Bond Fund | | | — | | | | — | |
| 10. | MARKET AND GEOPOLITICAL RISK |
The increasing interconnectivity between global economies and financial markets increases the likelihood that events or conditions in one region or financial market may adversely impact issuers in a different country, region or financial market. Securities in the Fund’s portfolio may underperform due to inflation (or expectations for inflation), interest rates, global demand for particular products or resources, natural disasters, pandemics, epidemics, terrorism, regulatory events and governmental or quasi-governmental actions. The occurrence of global events similar to those in recent years may result in market volatility and may have long term effects on both the U.S. and global financial markets. The current novel coronavirus (COVID-19) global pandemic and the aggressive responses taken by many governments, including closing borders, restricting international and domestic travel, and the imposition of prolonged quarantines or similar restrictions, as well as the forced or voluntary closure of, or operational changes to, many retail and other businesses, has had negative impacts, and in many cases severe negative impacts, on markets worldwide. It is not known how long such impacts, or any
| North Star Funds |
| NOTES TO FINANCIAL STATEMENTS (Continued) |
| November 30, 2022 |
future impacts of other significant events described above, will or would last, but there could be a prolonged period of global economic slowdown, which may impact your Fund investment.
On May 7, 2021, the North Star Opportunity Fund acquired the assets and certain liabilities of the Two Oaks Diversified Growth and Income Fund (the “Acquired Fund”), pursuant to a plan of reorganization, approved by the Board of Trustees of the Trust, of both the Acquired Fund and the North Star Opportunity Fund. Total shares issued by the North Star Opportunity Fund and the total net assets of the Acquired Fund and the North Star Opportunity Fund on the date of the transfer were as follows:
| | | | | | | | | | | | Cost of | |
| | | Shares | | | Total Net | | | Total Net Assets | | | Investments | |
| | | issued by | | | Assets of the | | | of the Fund after | | | Received from | |
| Acquired Fund | | the Fund | | | Acquired Fund | | | Merger | | | Acquired Fund | |
| Two Oaks Diversified Growth and Income Fund | | | 1,613,057 | | | $ | 30,279,834 | * | | $ | 180,826,787 | | | $ | 16,579,239 | |
| * | The net assets of the Acquired Fund includes cash of $2,359,112 and other assets in excess of other liabilities of $2,265. |
As part of the reorganization, for each share they held, shareholders of the Acquired Fund received 0.8828 of the Class A Shares of the North Star Opportunity Fund.
The total net assets of the Acquired Fund before acquisition included unrealized appreciation of $11,339,218. Total net assets of the North Star Opportunity Fund immediately after the transfer were $180,826,787. The transaction was structured to qualify as a tax-free reorganization under the Internal Revenue Code of 1986, as amended.
Subsequent events have been evaluated from the date of the Statement of Assets and Liabilities through the date the financial statements were issued. Management has determined that no events or transactions occurred requiring adjustment or disclosure in the financial statements.
Report of Independent Registered Public Accounting Firm
Board of Trustees of Northern Lights Fund Trust II
and the Shareholders of North Star Opportunity Fund, North Star Micro Cap Fund,
North Star Dividend Fund and North Star Bond Fund
Opinion on the Financial Statements
We have audited the accompanying statements of assets and liabilities of North Star Opportunity Fund, North Star Micro Cap Fund, North Star Dividend Fund and North Star Bond Fund (collectively, the Funds), each a separate series of the Northern Lights Fund Trust II, including the schedules of investments, as of November 30, 2022, the related statements of operations for the year then ended, the statements of changes in net assets for each of the two years in the period then ended, the financial highlights for each of the five years in the period then ended, and the related notes to the financial statements (collectively, the financial statements). In our opinion, the financial statements present fairly, in all material respects, the financial position of the Funds as of November 30, 2022, the results of their operations for the year then ended, the changes in net assets for each of the two years in the period then ended, and the financial highlights for each of the five years in the period then ended, in conformity with accounting principles generally accepted in the United States of America.
Basis for Opinion
These financial statements are the responsibility of the Funds’ management. Our responsibility is to express an opinion on the Funds’ financial statements based on our audits. We are a public accounting firm registered with the Public Company Accounting Oversight Board (United States) (PCAOB) and are required to be independent with respect to the Funds in accordance with U.S. federal securities laws and the applicable rules and regulations of the Securities and Exchange Commission and the PCAOB.
We conducted our audits in accordance with the standards of the PCAOB. Those standards require that we plan and perform the audit to obtain reasonable assurance about whether the financial statements are free of material misstatement, whether due to error or fraud. The Funds are not required to have, nor were we engaged to perform, an audit of their internal control over financial reporting. As part of our audits, we are required to obtain an understanding of internal control over financial reporting but not for the purpose of expressing an opinion on the effectiveness of the Funds’ internal control over financial reporting. Accordingly, we express no such opinion.
Our audits included performing procedures to assess the risks of material misstatement of the financial statements, whether due to error or fraud, and performing procedures that respond to those risks. Such procedures included examining, on a test basis, evidence regarding the amounts and disclosures in the financial statements. Our procedures included confirmation of investments owned as of November 30 2022, by correspondence with the custodians and brokers. Our audits also included evaluating the accounting principles used and significant estimates made by management, as well as evaluating the overall presentation of the financial statements. We believe that our audits provide a reasonable basis for our opinion.
/s/ RSM US LLP
We have served as the auditor of one or more investment companies in the North Star fund complex since 2015.
Denver, Colorado
January 27, 2023
North Star Funds
LIQUIDITY RISK MANAGEMENT PROGRAM (Unaudited)
November 30, 2022
The Funds have adopted and implemented a written liquidity risk management program as required by Rule 22e-4 (the “Liquidity Rule”) under the 1940 Act. The program is reasonably designed to assess and manage the Funds’ liquidity risk, taking into consideration, among other factors, the Funds’ investment strategy and the liquidity of its portfolio investments during normal and reasonably foreseeable stressed conditions; its short and long-term cash flow projections; and its cash holdings and access to other funding sources.
During the fiscal year ended November 30, 2022 the Trust’s Liquidity Risk Management Program Committee (the “Committee”) reviewed the Funds’ investments and determined that the Funds held adequate levels of cash and highly liquid investments to meet shareholder redemption activities in accordance with applicable requirements. Accordingly, the Committee concluded that (i) the Funds’ liquidity risk management program is reasonably designed to prevent violations of the Liquidity Rule and (ii) the Funds’ liquidity risk management program has been effectively implemented.
| North Star Funds |
| EXPENSE EXAMPLE (Unaudited) |
| November 30, 2022 |
As a shareholder of each Fund you incur two types of costs: (1) transaction costs, including sales charges (loads) on purchases of Class A shares; (2) ongoing costs, including management fees; distribution and/or service (12b-1) fees; and other Fund expenses. This example is intended to help you understand your ongoing costs (in dollars) of investing in a Fund and to compare these costs with the ongoing costs of investing in other mutual funds. Please note, the expenses shown in the tables are meant to highlight ongoing costs only and do not reflect any transactional costs.
This example is based on an investment of $1,000 invested for the period of time as indicated in the table below.
Actual Expenses: The first line of the table provides information about actual account values and actual expenses. You may use the information in this line, together with the amount you invested, to estimate the expenses that you paid over the period. Simply divide your account value by $1,000 (for example, an $8,600 account value divided by $1,000 = 8.6), then multiply the result by the number in the first line under the heading entitled “Expenses Paid During the Period” to estimate the expenses you paid on your account during the period.
Hypothetical Examples for Comparison Purposes: The second line of the table below provides information about hypothetical account values and hypothetical expenses based on the Fund’s actual expense ratio and an assumed rate of return of 5% per year before expenses, which is not the Fund’s actual return. The hypothetical account values and expenses may not be used to estimate the actual ending account balance or expenses you paid for the period. You may use this information to compare the ongoing costs of investing in the Fund and other funds. To do so, compare this 5% hypothetical example with the 5% hypothetical examples that appear in the shareholder reports of the other funds.
Please note that the expenses shown in the table are meant to highlight your ongoing costs only and do not reflect any transactional costs which may be applicable to your account. Therefore, the second line of the table is useful in comparing ongoing costs only, and will not help you determine the relative total costs of owning different funds. In addition, if these transactional costs were included, your costs would have been higher.
| | Beginning | Ending | Expenses Paid | |
| | Account Value | Account Value | During Period | Fund’s Annualized |
| Actual | 6/1/2022 | 11/30/2022 | 6/1/2022 – 11/30/2022* | Expense Ratio |
| North Star Opportunity Fund | | | | |
| Class I | $1,000.00 | $938.80 | $6.32 | 1.30% |
| Class A | $1,000.00 | $937.70 | $7.53 | 1.55% |
| North Star Micro Cap Fund | | | | |
| Class I | $1,000.00 | $927.90 | $6.67 | 1.38% |
| North Star Dividend Fund | | | | |
| Class I | $1,000.00 | $1,014.00 | $7.32 | 1.45% |
| North Star Bond Fund | | | | |
| Class I | $1,000.00 | $979.80 | $7.84 | 1.58% |
| * | Expenses are equal to the average account value over the period, multiplied by the Fund’s annualized expense ratio, multiplied by the number of days in the period (183) divided by the number of days in the fiscal year (365). |
| North Star Funds |
| EXPENSE EXAMPLE (Unaudited) (Continued) |
| November 30, 2022 |
| Hypothetical | Account Value | Account Value | During Period | Fund’s Annualized |
| (5% return before expenses) | 6/1/2022 | 11/30/2022 | 6/1/2022 – 11/30/2022* | Expense Ratio |
| North Star Opportunity Fund | | | | |
| Class I | $1,000.00 | $1,018.55 | $6.58 | 1.30% |
| Class A | $1,000.00 | $1,017.30 | $7.84 | 1.55% |
| North Star Micro Cap Fund | | | | |
| Class I | $1,000.00 | $1,018.15 | $6.98 | 1.38% |
| North Star Dividend Fund | | | | |
| Class I | $1,000.00 | $1,017.80 | $7.33 | 1.45% |
| North Star Bond Fund | | | | |
| Class I | $1,000.00 | $1,017.15 | $7.99 | 1.58% |
| * | Expenses are equal to the average account value over the period, multiplied by the Fund’s annualized expense ratio, multiplied by the number of days in the period (183) divided by the number of days in the fiscal year (365). |
| North Star Funds |
| Additional Information (Unaudited) |
| November 30, 2022 |
FACTORS CONSIDERED BY THE TRUSTEES IN APPROVAL OF THE RENEWAL OF AN INVESTMENT ADVISORY AGREEMENT
At a Regular meeting (the “Meeting”) of the Board of Trustees (the “Board”) of Northern Lights Fund Trust II (the “Trust”) held on October 17 and 18, 2022, the Board, including the disinterested Trustees (the “Independent Trustees”), considered the renewal of the Investment Advisory Agreement between the Trust, on behalf of the North Star Opportunity Fund, North Star Dividend Fund, North Star Micro Cap Fund and the North Star Bond Fund (the “North Star Funds”) and North Star Investment Management Corporation (“North Star”) (the “North Star Advisory Agreement”).
Based on their evaluation of the information provided by North Star, in conjunction with each North Star Fund’s other service providers, the Board, by a unanimous vote (including a separate vote of the Independent Trustees), approved the North Star Advisory Agreement with respect to each of the North Star Funds.
In advance of the Meeting, the Board requested and received materials to assist them in considering the North Star Advisory Agreement. The materials provided contained information with respect to the factors enumerated below, including the North Star Advisory Agreement, a memorandum prepared by the Trust’s outside legal counsel discussing in detail the Trustees’ fiduciary obligations and the factors they should assess in considering the continuation of the North Star Advisory Agreement and comparative information relating to the advisory fee and other expenses of each of the North Star Funds. The materials also included due diligence materials relating to North Star (including due diligence questionnaires completed by North Star, select financial information of North Star, bibliographic information regarding North Star’s key management and investment advisory personnel, and comparative fee information relating to the Funds) and other pertinent information. At the Meeting, the Independent Trustees were advised by counsel that is experienced in Investment Company Act of 1940 matters and that is independent of fund management and met with such counsel separately from fund management.
The Board then reviewed and discussed the written materials that were provided in advance of the Meeting and deliberated on the renewal of the North Star Advisory Agreement. The Board relied upon the advice of independent legal counsel and their own business judgment in determining the material factors to be considered in evaluating the North Star Advisory Agreement and the weight to be given to each such factor. The conclusions reached by the Board were based on a comprehensive evaluation of all of the information provided and were not the result of any one factor. Moreover, each Trustee may have afforded different weight to the various factors in reaching his conclusions with respect to the North Star Advisory Agreement. In considering the renewal of the North Star Advisory Agreement, the Board reviewed and analyzed various factors that they determined were relevant, including the factors enumerated below.
Nature, Extent and Quality of Services. The Board reviewed materials provided by North Star related to the proposed renewal of the North Star Advisory Agreement with respect to each of the North Star Funds, including its Form ADV and related schedules, a description of the manner in which investment decisions were made and executed, a review of the personnel performing services for each of the North Star Funds, including the individuals that primarily monitor and execute the investment process. The Board discussed the extent of the research capabilities, the quality of North Star’s compliance infrastructure and the experience of its investment advisory personnel. The Board noted that North Star was an experienced investment adviser with seasoned senior management and that the performance of the North Star Funds supported the quality and experience of the staff. Additionally, the Board received satisfactory responses from the representatives of North Star with respect to a series of important questions, including: whether North Star was involved in any lawsuits or pending regulatory actions; whether the advisory services provided to its other accounts would conflict with the advisory services provided to each of the North Star Funds; whether there were procedures in place to adequately allocate trades among its respective clients; and whether North Star’s CCO had processes in place to review the portfolio managers’ performance of their duties to ensure compliance under North Star’s compliance program. The Board reviewed the information provided on the practices for monitoring compliance with each of the North Star Fund’s investment limitations and discussed North Star’s compliance program with the CCO of the Trust. The Board noted that
| North Star Funds |
| Additional Information (Unaudited) (Continued) |
| November 30, 2022 |
the CCO of the Trust continued to represent that North Star’s policies and procedures were reasonably designed to prevent violations of applicable federal securities laws. The Board also noted North Star’s representation that the prospectus and statement of additional information for the North Star Funds accurately describe the investment strategies of each of the North Star Funds. The Board then reviewed the capitalization of North Star based on financial information provided by and representations made by North Star and its representatives and concluded that North Star was sufficiently well-capitalized in order to meet its obligations to each of the North Star Funds. The Board concluded that North Star had sufficient quality and depth of personnel, resources, investment methods and compliance policies and procedures essential to performing its duties under the North Star Advisory Agreement and that the nature, overall quality and extent of the advisory services to be provided by North Star to each of the North Star Funds were satisfactory.
Performance. The Board discussed the report prepared by Broadridge and reviewed the performance as compared to its peer group, Morningstar category and benchmark for the one year, three year, five year and since inception periods ended September 30, 2022, for each of North Star Opportunity, North Star Micro Cap, North Star Dividend, and North Star Bond. With respect to North Star Opportunity, the Board noted that North Star Opportunity modestly underperformed its peer group median and Morningstar category median, and slightly outperformed its benchmark, the Morningstar Moderately Aggressive Target Risk index, for the one year period, outperformed its peer group median, Morningstar category median and benchmark for the three year and five year periods, and outperformed its benchmark, equaled its peer group median but underperformed its Morningstar category median for the since inception period. The Board reviewed the performance of North Star Micro Cap noting that North Star Micro Cap had underperformed its benchmark, peer group median and Morningstar category median for the one year period, outperformed its peer group median and underperformed its Morningstar category median and benchmark for the three year period, and underperformed the peer group median and Morningstar category median but outperformed its benchmark for the five year and since inception periods. The Board next reviewed the performance of North Star Dividend noting that North Star Dividend had underperformed its benchmark, peer group median and Morningstar category median for the one year and three year periods, and underperformed its peer group median and Morningstar category median, but outperformed its benchmark, for the five year and since inception periods. The Board also reviewed the performance of North Star Bond noting that North Star Bond had outperformed its benchmark, peer group median and Morningstar category median for the one year period but had underperformed its benchmark, peer group median and Morningstar category for the three year, five year and since inception periods. The Board noted that the North Star Bond’s short duration during a sharply declining interest rate environment had contributed to the Fund’s underperformance for longer periods but performance had improved as interest rates began to rise recently. After further discussion, the Board concluded that the performance of each of North Star Opportunity, North Star Micro Cap, North Star Dividend and North Star Bond was acceptable although the Board would continue to monitor the performance of each of the North Star Funds.
Fees and Expenses. As to the costs of the services provided by North Star, the Board reviewed and discussed each of the North Star Fund’s advisory fee and total operating expenses as compared to its peer group and its Morningstar category as presented in the Broadridge Report. The Board noted that the advisory fee for each North Star Fund was near or at the high end of its respective peer group and Morningstar category ranges. The Board further noted that North Star Opportunity, North Star Micro Cap and North Star Dividend were being charged a 0.96%, 0.99% and 1.00% advisory fee by North Star, respectively, which was above the Morningstar category median and peer group median for each Fund although not the highest in their respective peer groups. The Board also noted that, with respect to each of North Star Opportunity, North Star Micro Cap and North Star Dividend, the advisory fee was 1.00% with a reduction to 0.90% on assets above $100 million. With respect to North Star Bond, the Board noted that the Fund’s 0.85% advisory fee was also higher than the peer group median and Morningstar category median and that the Fund’s higher net expense ratio may be explained by relatively lower asset levels than its peers and less ability to benefit from economies of scale.
The Board discussed North Star’s similarly managed accounts which were comparable to North Star Micro Cap and North Star Dividend noting the advisory fee of 0.50% was substantially less than the 1.00% advisory fee charged by North Star for those Funds. The Board noted, however, that North Star had represented to the Board that it charged a
| North Star Funds |
| Additional Information (Unaudited) (Continued) |
| November 30, 2022 |
lower fee for such accounts as they are sub-advisory accounts where North Star only manages a portion of an account portfolio, did not have direct contact with the client and overall North Star provided fewer services and devoted less attention to such accounts.
The Board then reviewed the contractual arrangements for each of the North Star Funds, which stated that North Star had agreed to waive or limit its advisory fee and/or reimburse expenses at least until March 31, 2024, in order to limit net annual operating expenses, exclusive of certain fees, so as not to exceed: 1.55%, 1.55%, and 1.30%, of North Star Opportunity’s average annual net assets for Class A, Class R and Class I Shares, respectively; 2.24%, 1.74%, 1.99% of North Star Dividend’s average annual net assets for Class A, Class I and Class R shares, respectively; 2.24%, 1.74%, and 1.99% of North Star Micro Cap’s average annual net assets for Class A, Class I, Class R shares, respectively; and 2.04%, 1.79% and 2.29% of North Star Bond’s average annual net assets for Class A, Class I shares and Class R shares, respectively. The Board found such arrangements to be beneficial to shareholders. The Board further noted that each North Star Fund was currently operating below each of these expense caps. The Board concluded that based on North Star’s experience, expertise and services provided to the Funds, the advisory fee charged by North Star for each North Star Fund, although at or near the high end of each North Star Fund’s peer group, was not unreasonable.
Profitability. The Board also considered the level of profits that could be expected to accrue to North Star with respect to each of North Star Opportunity, North Star Dividend, North Star Micro Cap, and North Star Bond based on profitability reports and profitability analyses provided by North Star with respect to each North Star Fund. The Board also reviewed the selected financial information of North Star provided by North Star. After review and discussion, the Board concluded that the anticipated profit from North Star’s relationship with each of the North Star Funds was not excessive.
Economies of Scale. As to the extent to which each of the North Star Funds would realize economies of scale as it grew, and whether the fee levels reflect these economies of scale for the benefit of investors, the Board discussed the current size of each of the North Star Funds, noting the existing advisory fee reduction when assets of North Star Opportunity, North Star Dividend, North Star Micro Cap reach $100 million. The Board further considered North Star’s expectations for growth, and concluded that additional material economies of scale would likely not be achieved in the near term.
Conclusion. The Board relied upon the advice of counsel, and their own business judgment in determining the material factors to be considered in evaluating the North Star Advisory Agreement and the weight to be given to each such factor. Accordingly, having requested and received such information from North Star as the Trustees believed to be reasonably necessary to evaluate the terms of the North Star Advisory Agreement, and as assisted by the advice of independent counsel, the Board, including a majority of the Independent Trustees, determined that, with respect to the North Star Advisory Agreement, (a) the terms of the North Star Advisory Agreement are not unreasonable; (b) the advisory fee is not unreasonable; and (c) the North Star Advisory Agreement is in the best interests of each North Star Fund and its respective shareholders. In considering the renewal of the North Star Advisory Agreement, the Board did not identify any one factor as all important, but rather considered these factors collectively and determined that approval of the renewal of the North Star Advisory Agreement was in the best interest of each North Star Fund and its respective shareholders. Moreover, the Board noted that each Trustee may have afforded different weight to the various factors in reaching his conclusions with respect to the North Star Advisory Agreement.
| North Star Funds |
| ADDITIONAL INFORMATION (Unaudited)(Continued) |
| November 30, 2022 |
The Trustees and the officers of the Trust are listed below with their present positions with the Trust and principal occupations over at least the last five years. The business address of each Trustee and Officer is 225 Pictoria Drive, Suite 450, Cincinnati, OH 45246. All correspondence to the Trustees and Officers should be directed to c/o Ultimus Fund Solutions, LLC, P.O. Box 541150, Omaha, Nebraska 68154.
Independent Trustees
Name and
Year of Birth | Position/Term of
Office* | Principal Occupation
During the Past Five Years | Number of
Portfolios in
Fund
Complex
Overseen by
Trustee** | Other Directorships held by
Trustee
During the Past Five Years |
Brian Nielsen 1972 | Trustee Since May 2011 | Trustee of Northern Lights Fund Trust II (since 2011); Special Projects Counsel of NorthStar Financial Services Group, LLC (from 2018 to 2019); Secretary of CLS Investments, LLC (from 2001 to 2018); Secretary of Orion Advisor Services, LLC (from 2001 to 2018); General Counsel and Secretary (from 2003 to 2018) of NorthStar Financial Services Group, LLC; CEO (from 2012 to 2018), Secretary (from 2003 to 2018) and Manager (from 2005 to 2018) of Northern Lights Distributors, LLC; Director, Secretary and General Counsel of Constellation Trust Company (from 2004 to 2018); CEO (from 2015 to 2018), General Counsel and Secretary (from 2011 to 2018) of Northern Lights Compliance Services, LLC; General Counsel and Secretary of Blu Giant, LLC (from 2011 to 2018); Secretary of Gemini Fund Services, LLC (from 2012 to 2018); Manager of Arbor Point Advisors, LLC (from 2012 to 2018); Director, Secretary and General Counsel of NorthStar CTC Holdings, Inc. (from 2015 to 2018) and Secretary and Chief Legal Officer of AdvisorOne Funds (from 2003 to 2018). | 4 | Manager of Northern Lights Distributors, LLC (from 2005 to 2018); Manager of Arbor Point Advisors, LLC (from 2012 to 2018); Director of Constellation Trust Company (from 2004 to 2018) |
Thomas T. Sarkany 1946 | Trustee Since October 2011 | President, TTS Consultants, LLC (financial services) (since 2010). | 4 | Director, Aquila Distributors; Trustee, Arrow ETF Trust; Trustee, Arrow Investments Trust; Trustee, Northern Lights Fund Trust IV |
Anthony H. Lewis 1946 | Trustee Since May 2011 | Chairman and CEO of The Lewis Group USA (executive consulting firm) (since 2007). | 4 | Director, Member of the Compensation Committee and Member of the Risk Committee of Torotel Inc. (Magnetics, Aerospace and Defense), Trustee, Chairman of the Fair Valuation Committee and Member of the Audit Committee of the Wildermuth Endowment Strategy Fund |
Keith Rhoades 1948 | Trustee Since May 2011 | Retired since 2008. | 4 | NONE |
Randal D. Skalla 1962 | Trustee Since May 2011 | President, L5 Enterprises, Inc.(financial services company) (since 2001). | | Board Member, Orizon Investment Counsel (financial services company) (from 2001 to 2017) |
| North Star Funds |
| ADDITIONAL INFORMATION (Unaudited)(Continued) |
| November 30, 2022 |
Interested Trustees and Officers
Name and
Year of Birth | Position/Term
of Office* | Principal Occupation
During the Past Five Years | Number of
Portfolios in
Fund
Complex
Overseen by
Trustee** | Other Directorships held by
Trustee
During the Past Five Years |
Kevin E. Wolf 1969 | President Since January 2013 | Vice President of The Ultimus Group, LLC; Executive Vice President, Head of Fund Administration and Product (since 2019) and President (2012 - 2019) of Ultimus Fund Solutions, LLC (formerly, Gemini Fund Services, LLC). | N/A | N/A |
Eric Kane 1981 | Secretary Since August 2022 | Vice President and Managing Counsel, Ultimus Fund Solutions, LLC (since 2020); Vice President and Counsel, Gemini Fund Services, LLC (2017-2020), Assistant Vice President, Gemini Fund Services, LLC (2014- 2017), Staff Attorney, Gemini Fund Services, LLC (2013-2014), Law Clerk, Gemini Fund Services, LLC (2009-2013), Legal Intern, NASDAQ OMX (2011), Hedge Fund Administrator, Gemini Fund Services, LLC (2008), Mutual Fund Accountant/Corporate Action Specialist, Gemini Fund Services, LLC (2006-2008). | N/A | N/A |
Erik Naviloff 1968 | Treasurer Since January 2013 | Vice President of Ultimus Fund Solutions, LLC (formerly, Gemini Fund Services, LLC) (since 2011). | N/A | N/A |
Jared Lahman 1986 | Anti-Money Laundering Officer since January 2022 | Compliance Analyst, Northern Lights Compliance Services, LLC (since January 2019); Manager, Fund Accounting, Gemini Fund Services, LLC (January 2014 to December 2018). | N/A | N/A |
Emile R. Molineaux 1962 | Chief Compliance Officer Since May 2011 | Senior Compliance Officer and CCO of Various clients of Northern Lights Compliance Services, LLC (since 2011). | N/A | N/A |
| * | The term of office for each Trustee and Officer listed above will continue indefinitely. |
| ** | As of November 30, 2022, the Trust was comprised of 19 active portfolios managed by unaffiliated investment advisers. The term “Fund Complex” applies only to the Funds and not to any other series of the Trust. The Funds do not hold themselves out as related to any other series within the Trust for investment purposes, nor do they share the same investment adviser with any other series. |
The Fund’s Statement of Additional Information (“SAI”) includes additional information about the Trustees and is available free of charge, upon request, by calling toll-free at 1-312-580-0900.
Privacy Policy
Rev. May 2021
| FACTS | WHAT DOES NORTHERN LIGHTS FUND TRUST II (“NLFT II”) DO WITH YOUR PERSONAL INFORMATION? |
| Why? | Financial companies choose how they share your personal information. Federal law gives consumers the right to limit some but not all sharing. Federal law also requires us to tell you how we collect, share, and protect your personal information. Please read this notice carefully to understand what we do. |
| What? | The types of personal information we collect and share depend on the product or service you have with us. This information can include:
|
● Social Security number ● Employment information ● Account balances | ● Account transactions ● Income ● Investment experience |
When you are no longer our customer, we continue to share your information as described in this notice. |
| How? | All financial companies need to share a customer’s personal information to run their everyday business - to process transactions, maintain customer accounts, and report to credit bureaus. In the section below, we list the reasons financial companies can share their customer’s personal information; the reasons NLFT II chooses to share; and whether you can limit this sharing. |
| | |
| Reasons we can share your personal information | Does NLFT II
share? | Can you limit
this sharing? |
For our everyday business purposes —
such as to process your transactions, maintain your account(s), respond to court orders and legal investigations, or report to credit bureaus
| Yes | No |
For our marketing purposes —
to offer our products and services to you
| Yes | No |
For joint marketing with other financial companies
| Yes | No |
For our affiliates’ everyday business purposes —
information about your transactions and experiences
| Yes | No |
For our affiliates’ everyday business purposes —
information about your creditworthiness
| No | We don’t share |
For nonaffiliates to market to you
| No | We don’t share |
| Questions? | Call 1-631-490-4300 |
| Who we are |
| Who is providing this notice? | Northern Lights Fund Trust II |
| What we do |
| How does NLFT II protect my personal information? | To protect your personal information from unauthorized access and use, we use security measures that comply with federal law. These measures include computer safeguards and secured files and buildings. |
| How does NLFT II collect my personal information? | We collect your personal information, for example, when you
|
● open an account ● give us your income information ● ��provide employment information | ● provide account information ● give us your contact information |
| We also collect your personal information from others, such as credit bureaus, affiliates, or other companies. |
| Why can’t I limit all sharing? | Federal law gives you the right to limit only ● sharing for affiliates’ everyday business purposes—information about your creditworthiness ● affiliates from using your information to market to you ● sharing for nonaffiliates to market to you State laws and individual companies may give you additional rights to limit sharing. |
| Definitions |
| Affiliates | Companies related by common ownership or control. They can be financial and nonfinancial companies. ● NLFT II has no affiliates. |
| Nonaffiliates | Companies not related by common ownership or control. They can be financial and nonfinancial companies. ● NLFT II does not share with nonaffiliates so they can market to you. |
| Joint marketing | A formal agreement between nonaffiliated financial companies that together market financial products and services to you. ● Our joint marketing partners include other financial service companies. |
Proxy Voting Policy
Information regarding how the Funds vote proxies relating to portfolio securities for the 12 month period ended June 30th as well as a description of the policies and procedures that the Funds used to determine how to vote proxies is available without charge, upon request, by calling 1-312-580-0900 or by referring to the Securities and Exchange Commission’s (“SEC”) website at http://www.sec.gov.
Portfolio Holdings
Funds file a complete schedule of portfolio holdings with the Securities and Exchange Commission (the “SEC”) for the first and third quarters of each fiscal year as an exhibit to its reports on Form N-PORT, within sixty days after the end of the period. Form N-PORT reports are available at the SEC’s website at www.sec.gov.
Investment Adviser
North Star Investment Management Corp.
20 N. Wacker Drive #1416
Chicago, IL 60606
Administrator
Ultimus Fund Solutions, LLC
225 Pictoria Drive, Suite 450
Cincinnati, OH 45246
NSF-AR22
| (a) | Include a copy of the report transmitted to stockholders pursuant to Rule 30e-1 under the Act (17 CFR 270.30e-1). |
| (b) | Include a copy of each notice transmitted to stockholders in reliance on Rule 30e-3 under the Act (17 CFR 270.30e-3) that contains disclosures specified by paragraph (c)(3) of that rule. |
Item 2. Code of Ethics.
(a) As of the end of the period covered by this report, the registrant has adopted a code of ethics that applies to the registrant's principal executive officer, principal financial officer, principal accounting officer or controller, or persons performing similar functions, regardless of whether these individuals are employed by the registrant or a third party.
(b) For purposes of this item, “code of ethics” means written standards that are reasonably designed to deter wrongdoing and to promote:
| (1) | Honest and ethical conduct, including the ethical handling of actual or apparent conflicts of interest between personal and professional relationships; |
| (2) | Full, fair, accurate, timely, and understandable disclosure in reports and documents that a registrant files with, or submits to, the Commission and in other public communications made by the registrant; |
(3) Compliance with applicable governmental laws, rules, and regulations;
| (4) | The prompt internal reporting of violations of the code to an appropriate person or persons identified in the code; and |
(5) Accountability for adherence to the code.
(c) Amendments: During the period covered by the report, there have not been any amendments to the provisions of the code of ethics.
(d) Waivers: During the period covered by the report, the registrant has not granted any express or implicit waivers from the provisions of the code of ethics.
(e) The Code of Ethics is not posted on Registrant’ website.
(f) A copy of the Code of Ethics is attached as an exhibit.
Item 3. Audit Committee Financial Expert.
(a) The Registrant’s board of trustees has determined that Keith Rhoades is an audit committee financial expert, as defined in Item 3 of Form N-CSR. Mr. Rhoades is independent for purposes of this Item.
Item 4. Principal Accountant Fees and Services.
2022 - $59,000
2021 - $61,500 *
2020 - $57,000
2019 - $58,500
2018 - $56,000
2017 - $55,200
* The audit fees above include additional audit procedures performed necessary to audit the reorganization with Two Oaks Diversified Income and Growth Fund.
2022 - None
2021 - 2,000 *
2020 - None
2019 - None
2018 - $4,000 *
2017 - None
* The audit-related fees above relate to N-14 filings consents paid for by the Advisor.
2022 - $11,000
2021 - $10,600
2020 - $10,000
2019 - $10,000
2018 - $10,000
2017 - $9,000
Preparation of Federal & State income tax returns, assistance with calculation of required income, capital gain and excise distributions and preparation of Federal excise tax returns.
2022 - None
2021 - None
2020 - None
2019 - None
2018 - None
2017 - None
| (e) | (1) Audit Committee’s Pre-Approval Policies |
The registrant’s Audit Committee is required to pre-approve all audit services and, when appropriate, any non-audit services (including audit-related, tax and all other services) to the registrant. The registrant’s Audit Committee also is required to pre-approve, when appropriate, any non-audit services (including audit-related, tax and all other services) to its adviser, or any entity controlling, controlled by or under common control with the adviser that provides ongoing services to the registrant, to the extent that the services may be determined to have an impact on the operations or financial reporting of the registrant. Services are reviewed on an engagement by engagement basis by the Audit Committee.
| (2) | Percentages of Services Approved by the Audit Committee |
2017 2018 2019 2020 2021 2022
Audit-Related Fees: 0.00% 0.00% 0.00% 0.00% 0.00% 0.00%
Tax Fees: 0.00% 0.00% 0.00% 0.00% 0.00% 0.00%
All Other Fees: 0.00% 0.00% 0.00% 0.00% 0.00% 0.00%
| (f) | During the audit of registrant's financial statements for the most recent fiscal year, less than 50 percent of the hours expended on the principal accountant's engagement were attributed to work performed by persons other than the principal accountant's full-time, permanent employees. |
| (g) | The aggregate non-audit fees billed by the registrant's accountant for services rendered to the registrant, and rendered to the registrant's investment adviser (not including any sub-adviser whose role is primarily portfolio management and is subcontracted with or overseen by another investment adviser), and any entity controlling, controlled by, or under common control with the adviser that provides ongoing services to the registrant: |
2022 - $11,000
2021 - $10,600
2020 - $10,000
2019 - $10,000
2018 - $10,000
2017 - $9,000
(h) The registrant's audit committee has considered whether the provision of non-audit services to the registrant's investment adviser (not including any sub-adviser whose role is primarily portfolio management and is subcontracted with or overseen by another investment adviser), and any entity controlling, controlled by, or under common control with the investment adviser that provides ongoing services to the registrant, that were not pre-approved pursuant to paragraph (c)(7)(ii) of Rule 2-01 of Regulation S-X, is compatible with maintaining the principal accountant's independence.
(i) Not applicable
(j) Not applicable
Item 5. Audit Committee of Listed Companies. Not applicable to open-end investment companies.
Item 6. Schedule of Investments. Schedule of investments in securities of unaffiliated issuers is included under Item 1.
Item 7. Disclosure of Proxy Voting Policies and Procedures for Closed-End Funds. Not applicable to open-end investment companies.
Item 8. Portfolio Managers of Closed-End Management Investment Companies. Not applicable to open-end investment companies.
Item 9. Purchases of Equity Securities by Closed-End Funds. Not applicable to open-end investment companies.
Item 10. Submission of Matters to a Vote of Security Holders. None
Item 11. Controls and Procedures.
(a) Based on an evaluation of the Registrant’s disclosure controls and procedures as of a date within 90 days of filing date of this Form N-CSR, the principal executive officer and principal financial officer of the Registrant have concluded that the disclosure controls and procedures of the Registrant are reasonably designed to ensure that the information required in filings on Form N-CSR is recorded, processed, summarized, and reported by the filing date, including that information required to be disclosed is accumulated and communicated to the Registrant’s management, including the Registrant’s principal executive officer and principal financial officer, as appropriate to allow timely decisions regarding required disclosure.
(b) There were no significant changes in the Registrant’s internal control over financial reporting that occurred during the period covered by this report that have materially affected, or are reasonably likely to materially affect, the Registrant’s internal control over financial reporting.
Item 12. Disclosure of Securities Lending Activities for Closed-End Management Investment Companies. Not applicable
Item 13. Exhibits.
(a)(1) Code of Ethics filed herewith.
(a)(2) Certifications required by Section 302 of the Sarbanes-Oxley Act of 2002 (and Item 11(a)(2) of Form N-CSR) are filed herewith.
(a)(3) Not applicable for open-end investment companies.
(b) Certifications required by Section 906 of the Sarbanes-Oxley Act of 2002 (and Item 11(b) of Form N-CSR) are filed herewith.
SIGNATURES
Pursuant to the requirements of the Securities Exchange Act of 1934 and the Investment Company Act of 1940, the registrant has duly caused this report to be signed on its behalf by the undersigned, thereunto duly authorized.
(Registrant) Northern Lights Fund Trust II
By (Signature and Title)
/s/ Kevin E. Wolf
Kevin E. Wolf, Principal Executive Officer/President
Date 1/31/23
Pursuant to the requirements of the Securities Exchange Act of 1934 and the Investment Company Act of 1940, this report has been signed below by the following persons on behalf of the registrant and in the capacities and on the dates indicated.
By (Signature and Title)
/s/Kevin E. Wolf
Kevin E. Wolf, Principal Executive Officer/President
Date 1/31/23
By (Signature and Title)
/s/ Erik Naviloff
Erik Naviloff, Principal Financial Officer/Treasurer
Date 1/31/23