united states
securities and exchange commission
washington, d.c. 20549
form n-csr
certified shareholder report of registered management
investment companies
Investment Company Act file number 811-22549
Northern Lights Fund Trust II
(Exact name of registrant as specified in charter)
225 Pictoria Drive, Suite 450, Cincinnati, Ohio 45246
(Address of principal executive offices) (Zip code)
Kevin Wolf, Gemini Fund Services, LLC
80 Arkay Drive, Hauppauge, NY 11788
(Name and address of agent for service)
Registrant's telephone number, including area code: 631-470-2619
Date of fiscal year end: 12/31
Date of reporting period: 12/31/22
Item 1. Reports to Stockholders.
(a) Include a copy of the report transmitted to stockholders pursuant to Rule 30e-1 under the Act (17 CFR 270.30e-1).
 | Guided by value. |
Annual Report – Shareholder Letter
We suspect that few were sorry to see the calendar turn to 2023. After all, the broad-based S&P 500 and Russell 3000 equity indexes endured a terrible year in which the former ended with a total return of negative 18.1% and the latter minus 19.2%.
There were few places to hide in 2022 as the MSCI Emerging Market and Developed Market equity indexes posted respective losses on a total return basis of 17.7% and 19.9%, while even supposedly safer fixed income instruments stumbled badly. Believe it or not, the Bloomberg Barclays Global and U.S. Aggregate Bond indexes skidded 16.2% and 13.0%, respectively, on a total return basis.
Of course, all those dollops of red ink were not nearly as bad as the massive wallops inflicted on formerly high-flying meme stocks, SPACs (Special Purpose Acquisition Companies), profitless companies and richly valued names, which endured plunges on par with the bursting of the Tech Bubble back in 2000. The New York Times proclaimed, “2022 Was the Year the Music Stopped on Wall Street.” Indeed, a spike in inflation led to a series of rate hikes from a newly hawkish Federal Reserve, despite many not-so-grand economic numbers, forcing a major reassessment of equity valuations.
Not surprisingly, the renewed emphasis on financial fundamentals favored reasonably priced stocks by a wide margin last year, with double-digit percentage return gaps between Growth and Value indexes, even as the latter simply lost less than the former. There are no awards for the declines on Value last year, but we were glad to see that inexpensive stocks held up far better, which is in keeping with the historical evidence when inflation is high, when the Fed is tightening, when interest rates are moving up and when the economy is not robust.
We had our share of winners last year, but many of our stocks were caught in the overall downtrend, and The Al Frank Fund (VALAX) posted a total return of -13.49% for 2022, which compares favorably to the S&P 500 and Russell 3000 indexes but unfavorably with the Russell 3000 Value index’s return of -7.98%. As such, we are now up to 7 negative performance years (1998, 2002, 2008, 2011, 2015, 2018 & 2022) since the launch of The Al Frank Fund in 1998.
Happily, there have been 16 positive years in our history, with the average gains in those green periods dwarfing the losses in the lean years.
We are always focused on the long-term prospects for the stocks we own and the merits of our investment approach, so we remain proud that the since-inception (going back to 1.2.98) return on The Al Frank Fund has been 9.90% per annum through 12.31.22. This compares to 7.67% per annum for the Russell 3000, 7.62% per annum for the S&P 500 and 7.27% per annum for the Russell 3000 Value index.
No doubt, there was plenty about which to worry in 2022, including the war in Ukraine, supply-chain disruptions, inventory management woes, corporate-profit question marks, higher inflation readings and the increased risk of recession, not to mention comments and actions from the Federal Reserve. However, history is filled with plenty of frightening events, yet equities have provided handsome rewards...for those who stick with them.

Keeping in mind that while we have long adhered to a Value strategy, we are equal opportunity stock pickers and a heavy exposure to the Information Technology sector. That sector, along with the Consumer Discretionary, Communication Services and Financial sector, accounted for the lion’s share of the negative return suffered by VALAX. On the other hand, the Energy and Health Care sectors had a positive absolute contribution to performance.
Looking at specific stocks, Exxon Mobil, EOG Resources, Cardinal Health, Merck & Co. and Lockheed Martin were the largest contributors to total return on an absolute basis, while Seagate Technology, Alphabet, Qualcomm, Walt Disney and Lam Research were the biggest negative contributors.
*****
We respect that stocks face headwinds as we head into 2023, with the Federal Reserve estimating real U.S. GDP growth of 0.5%, unemployment of 4.6%, core PCE inflation of 3.5% and a Fed Funds rate of 5.1%. However, given that the average stock ended 2022 in a Bear Market, we think a far more dismal set of economic numbers has been priced into many stocks. Further, we believe higher nominal GDP growth this year, along with generally healthy consumer balance sheets, will support modest corporate profit growth, while we do not think market interest rates will move significantly higher. Warren Buffett states that a pin lies in wait for every bubble, and some balloons are still likely to burst, but plenty of air has been let out of equities while we remain very comfortable with the reasonable valuations of the holdings in the Al Frank Fund.
With more than 24 years of managing The Al Frank Fund, not to mention our 46 years of publishing The Prudent Speculator newsletter, we see no reason today to alter our disciplined approach. We remain comfortable in our basic risk mitigation tools of patiently buying and seeking to harvest a broadly diversified portfolio of what we believe are undervalued stocks, generally of dividend-paying companies, while modestly ebbing and flowing our cash position.
We appreciate the loyalty and trust you have put in our management and we do not take the market gyrations lightly. We are invested right alongside our Al Frank Fund shareholders!
DISCLOSURES
| Performance as of December 31, 2022 |
| | | | | Since Inception |
| | One Year | Five Year | Ten Year | (1/2/98) |
| VALAX | -13.49% | 6.68% | 9.94% | 9.90% |
| Russell 3000 | -19.21% | 8.79% | 12.13% | 7.67% |
| Russell 3000 Value | -7.98% | 6.50% | 10.16% | 7.27% |
Returns greater than one year are annualized.
Advisor Class shares commenced operations on April 30, 2006. Performance shown prior to the inception of the Advisor Class reflects the performance of the Fund’s former Investor Class shares and adjusted to reflect the lower operating expenses of Advisor Class shares. Unadjusted Investor Class performance would have been lower.
Performance data quoted represents past performance; past performance does not guarantee future results. The investment return and principal value of an investment will fluctuate so that an investor’s shares, when redeemed, may be worth more or less than their original cost. Current performance of the fund may be lower or higher than the performance quoted. Performance data current to the most recent month-end may be obtained by calling 1.877.714.2327.
The fund imposes a 2.00% redemption fee on shares held for 60 days or less. Performance data do not reflect the redemption fee. If reflected, total returns would be reduced.
The fund’s operating expenses are 1.42%. However, the advisor has contractually agreed to cap its expenses at 1.24% through at least April 30, 2024, or until the Board of Trustees terminates such agreements.
| Top Ten Holdings as of December 31, 2022 | |
| Deere & Co | 2.3% |
| EOG Resources | 2.3% |
| JPMorgan Chase & Co | 2.3% |
| Caterpillar | 2.2% |
| Apple | 2.1% |
| MetLife | 1.9% |
| Merck & Co | 1.9% |
| Lockheed Martin | 1.9% |
| Exxon Mobil | 1.9% |
| Goldman Sachs Grp | 1.9% |
Portfolio holdings are subject to change without notice and are not intended as recommendations of individual stocks. Current and future portfolio holdings are subject to risk.
Mutual Funds involve risks including the possible loss of principal. Small and medium sized companies may be more vulnerable to adverse business or economic events, and thus a greater risk, than stocks of larger companies. There are risks that when lending portfolio securities, the securities may not be available to the Fund on a timely basis and the Fund may lose the opportunity to sell the securities at a desirable price. The
Advisor follows an investing style that favors value investing and when out of favor may underperform alternate investing styles. The Fund may invest in foreign securities that can be more volatile and less liquid than domestic securities.
The S&P 500 Index is an index tracking the stock performance of 500 large companies listed on exchanges in the United States. The Russell 3000 Index measures the performance of the largest 3000 U.S. companies. It is constructed to provide a comprehensive, unbiased, and stable barometer of the broad market and is reconstituted annually to ensure new and growing equities are reflected. The Russell 3000 Value Index measures the performance of those Russell 3000 Index companies with lower price-to-book ratios and lower forecasted growth values. The MSCI Emerging Markets Index is a free float -adjusted market capitalization index that is designed to measure equity market performance of emerging markets. The MSCI Developed Markets Index is a free float-adjusted market capitalization index that is designed to measure equity market performance of 25 developed markets. The Bloomberg Barclays Global Aggregate Index is a flagship measure of global investment grade debt from 25 local currency markets. The Bloomberg US Aggregate Bond Index is a broad base, market capitalization-weighted bond market index representing intermediate term investment grade bonds traded in the United States. Index results assume the reinvestment of all capital gain and dividend distributions. An investment cannot be made directly into an index.
You should carefully consider the investment objectives, potential risks, management fees, and charges and expenses of the Fund before investing. The Fund’s prospectus contains this and other information about the Fund, and should be read carefully before investing. You may obtain a current copy of the Fund’s prospectus by calling 1.888.263.6443.
Distributed by Northern Lights Distributors, LLC (Member FINRA/SIPC). Kovitz and Northern Lights Distributors, LLC are not affiliated.
16399017-NLD-02062023
Al Frank Fund
PORTFOLIO REVIEW (Unaudited)
December 31, 2022
The Fund’s performance figures* for the periods ended December 31, 2022, compared to its benchmark:
| | | Annualized |
| | | | | Since Inception |
| | One Year | Five Year | Ten Year | (1/2/98) |
| Al Frank Fund - Advisor Class** | (13.49)% | 6.68% | 9.94% | 9.90% |
| S&P 500® Total Return Index*** | (18.11)% | 9.42% | 12.56% | 7.62% |
| Russell 3000® Total Return Index**** | (19.21)% | 8.79% | 12.13% | 7.67% |
Comparison of the Change in Value of a $10,000 Investment
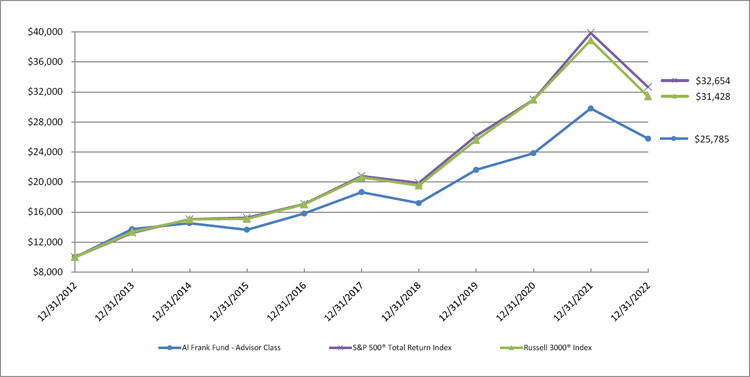
Returns reflect the reinvestment of dividends and capital gains. Fee waivers are in effect. In the absence of fee waivers, returns would have been reduced. The performance data and graphs above do not reflect the deduction of taxes that a shareholder may pay on dividends, capital gain distributions, or redemption of Fund shares. Performance data shown does not reflect the 2.00% redemption fee imposed on shares held 60 days or less. If it did, returns would have been reduced.
| * | Past performance does not guarantee future results. The investment return and principal value of an investment will fluctuate so that an investor’s shares, when redeemed, may be worth more or less than their original cost. Current performance of the Fund may be lower or higher than the performance quoted. Performance data for the most recent month-end is available at www.alfrankfunds.com. The Fund’s total annual operating expenses are 1.42% for the Advisor Class, per the May 1, 2022 prospectus. After fee waivers, the Fund’s total annual operating expenses are 1.24% for the Advisor Class. |
| ** | Advisor Class shares commenced operations on April 30, 2006. Performance shown prior to the commencement of operations of the Advisor Class shares reflects the performance of the Fund’s Investor Class shares which commenced operations on January 2, 1998, and is adjusted to reflect the lower operating expenses of the Advisor Class shares. Unadjusted performance of the Investor Class shares would have been lower. |
| *** | The S&P Total Return 500® Index is a broad based unmanaged capitalization-weighted index of 500 stocks designed to represent the broad domestic market. You cannot invest directly in an index. |
| **** | The Russell 3000® Total Return Index measures the performance of the largest 3,000 U.S. companies determined by total market capitalization. You cannot invest directly in an index. |
| Holdings By Asset Class as of December 31, 2022 | | % of Net Assets | |
| Information Technology | | | 19.7 | % |
| Financials | | | 16.2 | % |
| Industrials | | | 16.0 | % |
| Health Care | | | 14.3 | % |
| Consumer Discretionary | | | 8.0 | % |
| Energy | | | 6.0 | % |
| Communication Services | | | 5.2 | % |
| Materials | | | 4.6 | % |
| Consumer Staples | | | 3.8 | % |
| Real Estate | | | 3.1 | % |
| Utilities | | | 1.2 | % |
| Other, Cash & Cash Equivalents | | | 1.9 | % |
| | | | 100.0 | % |
Please refer to the Schedule of Investments in this annual report for a detailed analysis of the Fund’s holdings.
| AL FRANK FUND |
SCHEDULE OF INVESTMENTS
December 31, 2022 |
| Shares | | | | | Fair Value | |
| | | | | COMMON STOCKS — 98.1% | | | | |
| | | | | COMMUNICATION SERVICES — 5.2% | | | | |
| | | | | CABLE & SATELLITE - 1.1% | | | | |
| | 20,000 | | | Comcast Corporation, Class A | | $ | 699,400 | |
| | | | | | | | | |
| | | | | ENTERTAINMENT CONTENT - 1.2% | | | | |
| | 9,000 | | | Walt Disney Company (The)(a) | | | 781,920 | |
| | | | | | | | | |
| | | | | INTERNET MEDIA & SERVICES - 2.2% | | | | |
| | 13,000 | | | Alphabet, Inc., Class C(a) | | | 1,153,490 | |
| | 2,500 | | | Meta Platforms, Inc., Class A(a) | | | 300,850 | |
| | | | | | | | 1,454,340 | |
| | | | | | | | | |
| | | | | TELECOMMUNICATIONS - 0.7% | | | | |
| | 11,000 | | | Verizon Communications, Inc. | | | 433,400 | |
| | | | | | | | | |
| | | | | TOTAL COMMUNICATION SERVICES (Cost $2,062,690) | | | 3,369,060 | |
| | | | | | | | | |
| | | | | CONSUMER DISCRETIONARY — 8.0% | | | | |
| | | | | AUTOMOTIVE - 1.2% | | | | |
| | 22,500 | | | General Motors Company | | | 756,900 | |
| | | | | | | | | |
| | | | | HOME & OFFICE PRODUCTS - 1.2% | | | | |
| | 5,500 | | | Whirlpool Corporation | | | 778,030 | |
| | | | | | | | | |
| | | | | HOME CONSTRUCTION - 1.2% | | | | |
| | 25,000 | | | MDC Holdings, Inc. | | | 790,000 | |
| | | | | | | | | |
| | | | | LEISURE FACILITIES & SERVICES - 0.8% | | | | |
| | 10,000 | | | Royal Caribbean Cruises Ltd.(a) | | | 494,300 | |
| | | | | | | | | |
| | | | | RETAIL - CONSUMER STAPLES - 1.1% | | | | |
| | 5,000 | | | Target Corporation | | | 745,200 | |
| | | | | | | | | |
| | | | | RETAIL - DISCRETIONARY - 2.5% | | | | |
| | 20,000 | | | Foot Locker, Inc. | | | 755,800 | |
See accompanying notes to financial statements.
| AL FRANK FUND |
| SCHEDULE OF INVESTMENTS (Continued) |
| December 31, 2022 |
| Shares | | | | | Fair Value | |
| | | | | CONSUMER DISCRETIONARY — 8.0% (Continued) | | | | |
| | | | | RETAIL - DISCRETIONARY - 2.5% (Continued) | | | | |
| | 18,500 | | | Kohl’s Corporation | | $ | 467,125 | |
| | 25,000 | | | Nordstrom, Inc. | | | 403,500 | |
| | | | | | | | 1,626,425 | |
| | | | | TOTAL CONSUMER DISCRETIONARY (Cost $3,704,638) | | | 5,190,855 | |
| | | | | | | | | |
| | | | | CONSUMER STAPLES — 3.8% | | | | |
| | | | | FOOD - 0.9% | | | | |
| | 9,650 | | | Tyson Foods, Inc., Class A | | | 600,713 | |
| | | | | | | | | |
| | | | | RETAIL - CONSUMER STAPLES - 1.3% | | | | |
| | 6,000 | | | Walmart, Inc. | | | 850,740 | |
| | | | | | | | | |
| | | | | WHOLESALE - CONSUMER STAPLES - 1.6% | | | | |
| | 10,750 | | | Archer-Daniels-Midland Company | | | 998,137 | |
| | | | | | | | | |
| | | | | TOTAL CONSUMER STAPLES (Cost $742,214) | | | 2,449,590 | |
| | | | | | | | | |
| | | | | ENERGY — 6.0% | | | | |
| | | | | OIL & GAS PRODUCERS - 6.0% | | | | |
| | 11,500 | | | EOG Resources, Inc. | | | 1,489,480 | |
| | 11,000 | | | Exxon Mobil Corporation | | | 1,213,300 | |
| | 19,000 | | | Total Energies S.E. - ADR | | | 1,179,520 | |
| | | | | TOTAL ENERGY (Cost $2,366,010) | | | 3,882,300 | |
| | | | | | | | | |
| | | | | FINANCIALS — 16.2% | | | | |
| | | | | BANKING - 9.2% | | | | |
| | 30,000 | | | Bank of America Corporation | | | 993,600 | |
| | 24,000 | | | Fifth Third Bancorp | | | 787,440 | |
| | 10,850 | | | JPMorgan Chase & Company | | | 1,454,985 | |
| | 45,000 | | | Old National Bancorp | | | 809,100 | |
See accompanying notes to financial statements.
| AL FRANK FUND |
| SCHEDULE OF INVESTMENTS (Continued) |
| December 31, 2022 |
| Shares | | | | | Fair Value | |
| | | | | FINANCIALS — 16.2% (Continued) | | | | |
| | | | | BANKING - 9.2% (Continued) | | | | |
| | 6,000 | | | PNC Financial Services Group, Inc. (The) | | $ | 947,640 | |
| | 22,000 | | | Truist Financial Corporation | | | 946,660 | |
| | | | | | | | 5,939,425 | |
| | | | | INSTITUTIONAL FINANCIAL SERVICES - 1.9% | | | | |
| | 3,500 | | | Goldman Sachs Group, Inc. (The) | | | 1,201,830 | |
| | | | | | | | | |
| | | | | INSURANCE - 3.7% | | | | |
| | 17,000 | | | MetLife, Inc. | | | 1,230,290 | |
| | 11,500 | | | Prudential Financial, Inc. | | | 1,143,790 | |
| | | | | | | | 2,374,080 | |
| | | | | SPECIALTY FINANCE - 1.4% | | | | |
| | 10,000 | | | Capital One Financial Corporation | | | 929,600 | |
| | | | | | | | | |
| | | | | TOTAL FINANCIALS (Cost $4,879,230) | | | 10,444,935 | |
| | | | | | | | | |
| | | | | HEALTH CARE — 14.3% | | | | |
| | | | | BIOTECHNOLOGY & PHARMACEUTICALS - 8.0% | | | | |
| | 4,500 | | | Amgen, Inc. | | | 1,181,880 | |
| | 6,000 | | | Johnson & Johnson | | | 1,059,900 | |
| | 11,000 | | | Merck & Company, Inc. | | | 1,220,450 | |
| | 4,000 | | | Moderna, Inc.(a) | | | 718,480 | |
| | 20,000 | | | Pfizer, Inc. | | | 1,024,800 | |
| | | | | | | | 5,205,510 | |
| | | | | HEALTH CARE FACILITIES & SERVICES - 3.0% | | | | |
| | 12,000 | | | Cardinal Health, Inc. | | | 922,440 | |
| | 11,000 | | | CVS Health Corporation | | | 1,025,090 | |
| | 1 | | | Encompass Health Corporation | | | 60 | |
| | | | | | | | 1,947,590 | |
| | | | | MEDICAL EQUIPMENT & DEVICES - 3.3% | | | | |
| | 8,500 | | | Abbott Laboratories | | | 933,215 | |
See accompanying notes to financial statements.
| AL FRANK FUND |
| SCHEDULE OF INVESTMENTS (Continued) |
| December 31, 2022 |
| Shares | | | | | Fair Value | |
| | | | | HEALTH CARE — 14.3% (Continued) | | | | |
| | | | | MEDICAL EQUIPMENT & DEVICES - 3.3% (Continued) | | | | |
| | 7,000 | | | Medtronic PLC | | $ | 544,040 | |
| | 5,000 | | | Zimmer Biomet Holdings, Inc. | | | 637,500 | |
| | | | | | | | 2,114,755 | |
| | | | | | | | | |
| | | | | TOTAL HEALTH CARE (Cost $5,635,228) | | | 9,267,855 | |
| | | | | | | | | |
| | | | | INDUSTRIALS — 16.0% | | | | |
| | | | | AEROSPACE & DEFENSE - 1.9% | | | | |
| | 2,500 | | | Lockheed Martin Corporation | | | 1,216,225 | |
| | | | | | | | | |
| | | | | COMMERCIAL SUPPORT SERVICES - 1.5% | | | | |
| | 12,000 | | | ManpowerGroup, Inc. | | | 998,520 | |
| | | | | | | | | |
| | | | | DIVERSIFIED INDUSTRIALS - 1.6% | | | | |
| | 6,500 | | | Eaton Corporation PLC | | | 1,020,175 | |
| | | | | | | | | |
| | | | | ELECTRICAL EQUIPMENT - 1.2% | | | | |
| | 4,700 | | | Acuity Brands, Inc. | | | 778,367 | |
| | | | | | | | | |
| | | | | MACHINERY - 4.6% | | | | |
| | 6,000 | | | Caterpillar, Inc. | | | 1,437,360 | |
| | 3,500 | | | Deere & Company | | | 1,500,660 | |
| | | | | | | | 2,938,020 | |
| | | | | RENEWABLE ENERGY - 0.7% | | | | |
| | 6,500 | | | EnerSys | | | 479,960 | |
| | | | | | | | | |
| | | | | TRANSPORTATION & LOGISTICS - 2.8% | | | | |
| | 4,500 | | | FedEx Corporation | | | 779,400 | |
| | 4,250 | | | Norfolk Southern Corporation | | | 1,047,285 | |
| | | | | | | | 1,826,685 | |
See accompanying notes to financial statements.
| AL FRANK FUND |
| SCHEDULE OF INVESTMENTS (Continued) |
| December 31, 2022 |
| Shares | | | | | Fair Value | |
| | | | | INDUSTRIALS — 16.0% (Continued) | | | | |
| | | | | TRANSPORTATION EQUIPMENT - 1.7% | | | | |
| | 4,500 | | | Cummins, Inc. | | $ | 1,090,305 | |
| | | | | | | | | |
| | | | | TOTAL INDUSTRIALS (Cost $4,877,986) | | | 10,348,257 | |
| | | | | | | | | |
| | | | | INFORMATION TECHNOLOGY — 19.7% | | | | |
| | | | | SEMICONDUCTORS - 4.9% | | | | |
| | 25,000 | | | Cohu, Inc.(a) | | | 801,250 | |
| | 18,000 | | | Intel Corporation | | | 475,740 | |
| | 2,150 | | | Lam Research Corporation | | | 903,645 | |
| | 9,000 | | | QUALCOMM, Inc. | | | 989,460 | |
| | | | | | | | 3,170,095 | |
| | | | | SOFTWARE - 4.5% | | | | |
| | 36,000 | | | Gen Digital, Inc. | | | 771,480 | |
| | 5,000 | | | Microsoft Corporation | | | 1,199,100 | |
| | 11,000 | | | Oracle Corporation | | | 899,140 | |
| | | | | | | | 2,869,720 | |
| | | | | TECHNOLOGY HARDWARE - 9.1% | | | | |
| | 10,500 | | | Apple, Inc. | | | 1,364,265 | |
| | 15,500 | | | Benchmark Electronics, Inc. | | | 413,695 | |
| | 18,000 | | | Cisco Systems, Inc. | | | 857,520 | |
| | 30,000 | | | Corning, Inc. | | | 958,200 | |
| | 30,000 | | | Juniper Networks, Inc. | | | 958,800 | |
| | 11,000 | | | NetApp, Inc. | | | 660,660 | |
| | 13,000 | | | Seagate Technology Holdings PLC | | | 683,930 | |
| | | | | | | | 5,897,070 | |
| | | | | TECHNOLOGY SERVICES - 1.2% | | | | |
| | 5,500 | | | International Business Machines Corporation | | | 774,895 | |
| | | | | | | | | |
| | | | | TOTAL INFORMATION TECHNOLOGY (Cost $5,547,805) | | | 12,711,780 | |
See accompanying notes to financial statements.
| AL FRANK FUND |
| SCHEDULE OF INVESTMENTS (Continued) |
| December 31, 2022 |
| Shares | | | | | Fair Value | |
| | | | | MATERIALS — 4.6% | | | | |
| | | | | CHEMICALS - 2.8% | | | | |
| | 4,800 | | | Albemarle Corporation | | $ | 1,040,928 | |
| | 7,500 | | | Celanese Corporation | | | 766,800 | |
| | | | | | | | 1,807,728 | |
| | | | | CONTAINERS & PACKAGING - 1.1% | | | | |
| | 20,500 | | | International Paper Company | | | 709,915 | |
| | | | | | | | | |
| | | | | METALS & MINING - 0.7% | | | | |
| | 10,000 | | | Newmont Corporation | | | 472,000 | |
| | | | | | | | | |
| | | | | TOTAL MATERIALS (Cost $1,700,247) | | | 2,989,643 | |
| | | | | | | | | |
| | | | | REAL ESTATE — 3.1% | | | | |
| | | | | DATA CENTER REIT - 0.9% | | | | |
| | 5,500 | | | Digital Realty Trust, Inc. | | | 551,485 | |
| | | | | | | | | |
| | | | | HEALTH CARE REIT - 0.9% | | | | |
| | 40,000 | | | Physicians Realty Trust | | | 578,800 | |
| | | | | | | | | |
| | | | | RETAIL REIT - 1.3% | | | | |
| | 40,000 | | | Kimco Realty Corporation | | | 847,200 | |
| | | | | | | | | |
| | | | | TOTAL REAL ESTATE (Cost $1,669,331) | | | 1,977,485 | |
| | | | | | | | | |
| | | | | UTILITIES — 1.2% | | | | |
| | | | | ELECTRIC UTILITIES - 1.2% | | | | |
| | 10,000 | | | Pinnacle West Capital Corporation | | | 760,400 | |
| | | | | TOTAL UTILITIES (Cost $804,992) | | | | |
| | | | | | | | | |
| | | | | TOTAL COMMON STOCKS (Cost $33,990,371) | | | 63,392,160 | |
See accompanying notes to financial statements.
| AL FRANK FUND |
| SCHEDULE OF INVESTMENTS (Continued) |
| December 31, 2022 |
| Shares | | | | | Fair Value | |
| | | | | SHORT-TERM INVESTMENT — 1.9% | | | | |
| | | | | MONEY MARKET FUND - 1.9% | | | | |
| | 1,206,212 | | | Fidelity Government Portfolio Institutional Class, 4.06% (Cost $1,206,212)(b) | | | 1,206,212 | |
| | | | | | | | | |
| | | | | TOTAL INVESTMENTS - 100.0% (Cost $35,196,583) | | $ | 64,598,372 | |
| | | | | OTHER ASSETS IN EXCESS OF LIABILITIES - 0.0%(c) | | | 11,469 | |
| | | | | NET ASSETS - 100.0% | | $ | 64,609,841 | |
| ADR | - American Depositary Receipt |
| PLC | - Public Limited Company |
| REIT | - Real Estate Investment Trust |
| (a) | Non-income producing security. |
| (b) | Rate disclosed is the seven-day effective yield as of December 31, 2022. |
| (c) | Amount Represents less than 0.05%. |
See accompanying notes to financial statements.
| Al Frank Fund |
| STATEMENT OF ASSETS AND LIABILITIES |
| December 31, 2022 |
| ASSETS | | | | |
| Investment securities: | | | | |
| At cost | | $ | 35,196,583 | |
| At value | | $ | 64,598,372 | |
| Receivable for Fund shares sold | | | 37 | |
| Dividends and interest receivable | | | 86,186 | |
| Prepaid expenses & other assets | | | 23,443 | |
| TOTAL ASSETS | | | 64,708,038 | |
| | | | | |
| LIABILITIES | | | | |
| Payable for Fund shares redeemed | | | 1,873 | |
| Investment advisory fees payable | | | 56,739 | |
| Audit fees payable | | | 15,700 | |
| Payable to Related Parties | | | 18,110 | |
| Accrued expenses and other liabilities | | | 5,775 | |
| TOTAL LIABILITIES | | | 98,197 | |
| NET ASSETS | | $ | 64,609,841 | |
| | | | | |
| Net Assets Consist Of: | | | | |
| Paid in capital | | $ | 34,876,940 | |
| Accumulated earnings | | | 29,732,901 | |
| NET ASSETS | | $ | 64,609,841 | |
| | | | | |
| Net Asset Value Per Share: | | | | |
| Advisor Class Shares: | | | | |
| Net Assets | | $ | 64,609,841 | |
| Shares of beneficial interest outstanding ($0 par value, unlimited shares authorized) | | | 2,781,021 | |
| Net asset value (Net Assets ÷ Shares Outstanding), offering price and redemption price per share (a) | | $ | 23.23 | |
| (a) | Redemptions of shares held 60 days or less may be assessed a redemption fee of 2.00%. |
See accompanying notes to financial statements.
| Al Frank Fund |
| STATEMENT OF OPERATIONS |
| For the Year ended December 31, 2022 |
| | | | |
| INVESTMENT INCOME | | | |
| Dividends * | | $ | 1,817,516 | |
| Interest | | | 21,687 | |
| TOTAL INVESTMENT INCOME | | | 1,839,203 | |
| | | | | |
| EXPENSES | | | | |
| Investment advisory fees | | | 712,154 | |
| Distribution (12b-1) fees: | | | | |
| Investor Class | | | 48,295 | |
| Administration fees | | | 46,160 | |
| Transfer agent fees | | | 39,824 | |
| Fund accounting fees | | | 31,636 | |
| Registration fees | | | 33,684 | |
| Trustees’ fees | | | 23,772 | |
| Legal fees | | | 25,019 | |
| Compliance officer fees | | | 23,448 | |
| Audit fees | | | 16,201 | |
| Shareholder reporting expense | | | 19,011 | |
| Insurance expense | | | 8,545 | |
| Third party administrative servicing fees | | | 24,394 | |
| Custody fees | | | 4,097 | |
| Other expenses | | | 3,071 | |
| TOTAL EXPENSES | | | 1,059,311 | |
| | | | | |
| Less: Fees waived by the Adviser | | | (129,083 | ) |
| | | | | |
| NET EXPENSES | | | 930,228 | |
| NET INVESTMENT INCOME | | | 908,975 | |
| | | | | |
| REALIZED AND UNREALIZED GAIN/(LOSS) ON INVESTMENTS | | | | |
| Net realized gain from investments | | | 3,578,807 | |
| Net change in unrealized depreciation on investments | | | (15,342,079 | ) |
| | | | | |
| NET REALIZED AND UNREALIZED LOSS ON INVESTMENTS | | | (11,763,272 | ) |
| | | | | |
| NET DECREASE IN NET ASSETS RESULTING FROM OPERATIONS | | $ | (10,854,297 | ) |
| * | Includes withholding tax of $12,707. |
See accompanying notes to financial statements.
| Al Frank Fund |
| STATEMENTS OF CHANGES IN NET ASSETS |
| | | For the | | | For the | |
| | | Year Ended | | | Year Ended | |
| | | December 31, 2022 | | | December 31, 2021 | |
| | | | | | | |
| FROM OPERATIONS | | | | | | | | |
| Net investment income | | $ | 908,975 | | | $ | 466,655 | |
| Net realized gain from investments | | | 3,578,807 | | | | 5,494,885 | |
| Net change in unrealized appreciation/(depreciation) on investments | | | (15,342,079 | ) | | | 11,209,338 | |
| Net increase/(decrease) in net assets resulting from operations | | | (10,854,297 | ) | | | 17,170,878 | |
| | | | | | | | | |
| DISTRIBUTIONS TO SHAREHOLDERS | | | | | | | | |
| Investor Class | | | — | | | | (4,785,124 | ) |
| Advisor Class | | | (5,233,389 | ) | | | (413,166 | ) |
| Net decrease in net assets from distributions to shareholders | | | (5,233,389 | ) | | | (5,198,290 | ) |
| | | | | | | | | |
| FROM SHARES OF BENEFICIAL INTEREST | | | | | | | | |
| Proceeds from shares sold | | | | | | | | |
| Investor Class | | | 575,707 | | | | 6,185,844 | |
| Advisor Class ^ | | | 70,679,652 | | | | 2,825,329 | |
| Net asset value of shares issued in reinvestment of distributions | | | | | | | | |
| Investor Class | | | — | | | | 4,687,204 | |
| Advisor Class | | | 5,128,361 | | | | 408,732 | |
| Payments for shares redeemed | | | | | | | | |
| Investor Class ^ | | | (73,222,287 | ) | | | (11,734,998 | ) |
| Advisor Class | | | (5,097,349 | ) | | | (2,966,989 | ) |
| Redemption fee proceeds | | | | | | | | |
| Investor Class | | | 224 | | | | 3,179 | |
| Advisor Class | | | 34 | | | | 223 | |
| Net decrease in net assets from shares of beneficial interest | | | (1,935,658 | ) | | | (591,476 | ) |
| TOTAL INCREASE/(DECREASE) IN NET ASSETS | | | (18,023,344 | ) | | | 11,381,112 | |
| | | | | | | | | |
| NET ASSETS | | | | | | | | |
| Beginning of Year | | | 82,633,185 | | | | 71,252,073 | |
| End of Year | | $ | 64,609,841 | | | $ | 82,633,185 | |
| ^ | 2,540,476 Investor Class shares converted into 2,533,069 Advisor Class shares, amounting to $70,292,424, on April 7, 2022. |
See accompanying notes to financial statements.
| Al Frank Fund |
| STATEMENTS OF CHANGES IN NET ASSETS (Continued) |
| | | For the | | | For the | |
| | | Year Ended | | | Year Ended | |
| | | December 31, 2022 | | | December 31, 2021 | |
| | | | | | | |
| SHARE ACTIVITY - INVESTOR CLASS | | | | | | | | |
| Shares sold | | | 20,429 | | | | 214,025 | |
| Shares reinvested | | | — | | | | 164,348 | |
| Shares redeemed ^ | | | (2,643,807 | ) | | | (406,040 | ) |
| Net decrease in shares of beneficial interest outstanding | | | (2,623,378 | ) | | | (27,667 | ) |
| | | | | | | | | |
| SHARE ACTIVITY - ADVISOR CLASS | | | | | | | | |
| Shares sold ^ | | | 2,548,230 | | | | 95,655 | |
| Shares reinvested | | | 216,204 | | | | 14,301 | |
| Shares redeemed | | | (203,950 | ) | | | (102,719 | ) |
| Net increase in shares of beneficial interest outstanding | | | 2,560,484 | | | | 7,237 | |
| ^ | 2,540,476 Investor Class shares converted into 2,533,069 Advisor Class shares, amounting to $70,292,424, on April 7, 2022. |
See accompanying notes to financial statements.
| Al Frank Fund |
| FINANCIAL HIGHLIGHTS |
Per Share Data and Ratios for a Share of Beneficial Interest Outstanding Throughout Each Year
| | | Advisor Class | |
| | | Year Ended | | | Year Ended | | | Year Ended | | | Year Ended | | | Year Ended | |
| | | December 31, | | | December 31, | | | December 31, | | | December 31, | | | December 31, | |
| | | 2022 | | | 2021 | | | 2020 | | | 2019 | | | 2018 | |
| Net asset value, beginning of year | | $ | 29.12 | | | $ | 24.92 | | | $ | 24.24 | | | $ | 20.76 | | | $ | 24.83 | |
| Activity from investment operations: | | | | | | | | | | | | | | | | | | | | |
| Net investment income (1) | | | 0.37 | | | | 0.24 | | | | 0.46 | | | | 0.36 | | | | 0.31 | |
| Net realized and unrealized gain/(loss) on investments | | | (4.26 | ) | | | 5.95 | | | | 2.01 | | | | 4.94 | | | | (2.15 | ) |
| Total from investment operations | | | (3.89 | ) | | | 6.19 | | | | 2.47 | | | | 5.30 | | | | (1.84 | ) |
| Less distributions from: | | | | | | | | | | | | | | | | | | | | |
| Net investment income | | | (0.35 | ) | | | (0.26 | ) | | | (0.50 | ) | | | (0.37 | ) | | | (0.32 | ) |
| Net realized gain on investments | | | (1.65 | ) | | | (1.73 | ) | | | (1.29 | ) | | | (1.45 | ) | | | (1.91 | ) |
| Total distributions | | | (2.00 | ) | | | (1.99 | ) | | | (1.79 | ) | | | (1.82 | ) | | | (2.23 | ) |
| Paid in capital from redemption fees (1)(4) | | | 0.00 | | | | 0.00 | | | | 0.00 | | | | 0.00 | | | | 0.00 | |
| Net asset value, end of year | | $ | 23.23 | | | $ | 29.12 | | | $ | 24.92 | | | $ | 24.24 | | | $ | 20.76 | |
| Total return (2) | | | (13.49 | )% | | | 24.98 | % | | | 10.24 | % | | | 25.78 | % | | | (7.83 | )% |
| Net assets, at end of year (000s) | | $ | 64,610 | | | $ | 6,421 | | | $ | 5,316 | | | $ | 5,267 | | | $ | 5,033 | |
| Ratio of gross expenses to average net assets (3) | | | 1.38 | % | | | 1.42 | % | | | 1.43 | % | | | 1.38 | % | | | 1.39 | % |
| Ratio of net expenses to average net assets | | | 1.24 | % | | | 1.24 | % | | | 1.24 | % | | | 1.24 | % | | | 1.24 | % |
| Ratio of net investment income to average net assets | | | 1.45 | % | | | 0.83 | % | | | 2.09 | % | | | 1.54 | % | | | 1.23 | % |
| Portfolio turnover rate | | | 2.67 | % | | | 5.10 | % | | | 3.72 | % | | | 1.78 | % | | | 16.28 | % |
| (1) | Per share amounts calculated using the average shares method, which more appropriately presents the per share data for the year. |
| (2) | Total returns shown exclude the effect of applicable redemption fees. Had the Adviser not waived a portion of the Fund’s expenses, total returns would have been lower. |
| (3) | Represents the ratio of expenses to average net assets absent fee waivers and/or expense reimbursements by the Adviser. |
| (4) | Amount represents less than $0.005 per share. |
See accompanying notes to financial statements.
| Al Frank Fund |
| NOTES TO FINANCIAL STATEMENTS at December 31, 2022 |
NOTE 1 - ORGANIZATION
The Al Frank Fund (the “Fund”) is a diversified series of Northern Lights Fund Trust II (the “Trust”), which is registered under the Investment Company Act of 1940, as amended, (the “1940 Act”) as an open-end management investment company. The investment objective of the Al Frank Fund is long-term capital appreciation. The Al Frank Fund Advisor Class commenced operations on April 30, 2006. Advisor Class Shares are offered at net asset value without the imposition of any sales charge. Effective at the close of business on April 7, 2022, all outstanding Investor Class shares of the Fund were converted to Advisor Class shares of the Fund and Investor Class shares of the Fund were no longer offered for sale to new investors. Investor Class shares had commenced operations on January 2, 1998.
NOTE 2 - SIGNIFICANT ACCOUNTING POLICIES
The following is a summary of significant accounting policies followed by the Fund in preparation of its financial statements. These policies are in conformity with accounting principles generally accepted in the United States of America (“GAAP”). The preparation of financial statements requires management to make estimates and assumptions that affect the reported amounts of assets and liabilities and disclosure of contingent assets and liabilities at the date of the financial statements and the reported amounts of income and expenses for the period. Actual results could differ from those estimates. The Fund is an investment company and accordingly follows the investment company accounting and reporting guidance of the Financial Accounting Standards Board (“FASB”) Accounting Standard Codification Topic 946 “Financial Services – Investment Companies” including FASB Accounting Standard Update “ASU” 2013-08.
| A. | Security Valuation: All investments in securities are recorded at their estimated fair value, as described in Note 3. |
| B. | Federal Income Taxes: It is the Fund’s policy to continue to comply with the requirements of the Internal Revenue Code applicable to regulated investment companies and to distribute substantially all of its taxable income to shareholders. Therefore, no provision for Federal income taxes has been recorded. |
The Fund recognizes the tax benefits of uncertain tax positions only where the position is “more likely than not” to be sustained assuming examination by tax authorities. Management has analyzed the Fund’s tax positions and has concluded that no liability for unrecognized tax benefits should be recorded related to uncertain tax positions taken on returns filed for open tax years ended December 31, 2019 to December 31, 2021, or expected to be taken in the Fund’s December 31, 2022 year-end tax returns. The Fund identifies its major tax jurisdictions as U.S. Federal and the state of Ohio. The Fund is not aware of any tax positions for which it is reasonably possible that the total amounts of unrecognized tax benefits will change materially in the next twelve months.
| C. | Security Transactions, Income and Distributions: Security transactions are accounted for on the trade date. Realized gains and losses on securities sold are determined on the basis of identified cost. Interest income is recorded on an accrual basis. Dividend income and distributions to shareholders are recorded on the ex-dividend date. Withholding taxes on foreign dividends have been provided for in accordance with the Fund’s understanding of the applicable country’s tax rules and rates. Non-cash dividends are included in dividend income on the ex-dividend date at the fair market value of the shares received. |
Investment income, expenses (other than those specific to the class of shares), and realized and unrealized gains and losses on investments are allocated to the separate classes of the Fund’s shares based upon their relative net assets on the date income is earned or expenses, realized and unrealized gains and losses are incurred. The Fund distributes substantially all net investment income, if any, and net realized capital gains, if any, annually. The amount of dividends and distributions to shareholders from net investment income and net realized capital gains is determined in accordance with Federal income tax regulations, which differs from accounting principles generally accepted in the United States of America. To the extent these book/tax differences are permanent, such amounts are reclassified within the capital accounts based on their Federal tax treatment.
| Al Frank Fund |
| NOTES TO FINANCIAL STATEMENTS at December 31, 2022 (Continued) |
| D. | Redemption Fees: The Fund charges a 2% redemption fee to shareholders who redeem shares held for 60 days or less. Such fees are retained by the Fund and accounted for as an addition to paid-in capital. For the year ended December 31, 2022, the Al Frank Fund assessed $258 in redemption fees. |
| E. | Expenses – Expenses of the Trust that are directly identifiable to a specific fund are charged to that fund. Expenses, which are not readily identifiable to a specific fund, are allocated in such a manner as deemed equitable, taking into consideration the nature and type of expense and the relative size of the fund in the Trust. |
| F. | Indemnification – The Trust indemnifies its officers and Trustees for certain liabilities that may arise from the performance of their duties to the Trust. Additionally, in the normal course of business, the Fund enters into contracts that contain a variety of representations and warranties and which provide general indemnities. The Fund’s maximum exposure under these arrangements is unknown, as this would involve future claims that may be made against the Fund that have not yet occurred. However, based on experience, the risk of loss due to these warranties and indemnities appears to be remote. |
NOTE 3 - SECURITIES VALUATION
Securities listed on an exchange are valued at the last reported sale price at the close of the regular trading session of the primary exchange on the business day the value is being determined, or in the case of securities listed on NASDAQ at the NASDAQ Official Closing Price (“NOCP”). In the absence of a sale, such securities shall be valued at the mean between the current bid and ask prices on the day of valuation. Investments valued in currencies other than the U.S. dollar are converted to U.S. dollars using exchange rates obtained from pricing services. Investments in open-end investment companies are valued at net asset value. Short-term debt obligations having 60 days or less remaining until maturity, at time of purchase, may be valued at amortized cost.
The Fund may hold securities, such as private investments, interests in commodity pools, other non-traded securities or temporarily illiquid securities, for which market quotations are not readily available or are determined to be unreliable. These securities are valued using the “fair value” procedures approved by the Board. The Board has designated the adviser as its valuation designee (the “Valuation Designee”) to execute these procedures. The Board may also enlist third party consultants such a valuation specialist at a public accounting firm, valuation consultant or financial officer of a security issuer on an as-needed basis to assist the Valuation Designee in determining a security-specific fair value. The Board is responsible for reviewing and approving fair value methodologies utilized by the Valuation Designee, approval of which shall be based upon whether the Valuation Designee followed the valuation procedures established by the Board.
Fair Valuation Process – The applicable investments are valued by the Valuation Designee pursuant to valuation procedures established by the Board. For example, fair value determinations are required for the following securities: (i) securities for which market quotations are insufficient or not readily available on a particular business day (including securities for which there is a short and temporary lapse in the provision of a price by the regular pricing source); (ii) securities for which, in the judgment of the Valuation Designee, the prices or values available do not represent the fair value of the instrument; factors which may cause the Valuation Designee to make such a judgment include, but are not limited to, the following: only a bid price or an asked price is available; the spread between bid and asked prices is substantial; the frequency of sales; the thinness of the market; the size of reported trades; and actions of the securities markets, such as the suspension or limitation of trading; (iii) securities determined to be illiquid; and (iv) securities with respect to which an event that affects the value thereof has occurred (a “significant event”) since the closing prices were established on the principal exchange on which they are traded, but prior to a Fund’s calculation of its net asset value. Specifically, interests in commodity pools or managed futures pools are valued on a daily basis by reference to the closing market prices of each futures contract or other asset held by a pool, as adjusted for pool expenses. Restricted or illiquid securities, such as private investments or non-traded securities are valued based upon the current bid for the security from two or more independent dealers or other parties reasonably familiar with the facts and circumstances of the security (who should take into consideration all relevant factors as may be appropriate under the circumstances) . If a current bid from such independent dealers or other independent parties is unavailable, the Valuation Designee shall determine the fair value of such security using the following factors: (i) the type of security; (ii) the cost at date of purchase; (iii) the size and nature of the Fund’s holdings; (iv) the discount from market value of unrestricted securities of the same
| Al Frank Fund |
| NOTES TO FINANCIAL STATEMENTS at December 31, 2022 (Continued) |
class at the time of purchase and subsequent thereto; (v) information as to any transactions or offers with respect to the security; (vi) the nature and duration of restrictions on disposition of the security and the existence of any registration rights; (vii) how the yield of the security compares to similar securities of companies of similar or equal creditworthiness; (viii) the level of recent trades of similar or comparable securities; (ix) the liquidity characteristics of the security; (x) current market conditions; and (xi) the market value of any securities into which the security is convertible or exchangeable.
The Fund utilizes various methods to measure fair value of all of its investments on a recurring basis. GAAP establishes the hierarchy that prioritizes inputs to valuation methods. The three levels of input are:
Level 1 – Unadjusted quoted prices in active markets for identical assets and liabilities that the Fund has the ability to access.
Level 2 – Observable inputs other than quoted prices included in Level 1 that are observable for the asset or liability, either directly or indirectly. These inputs may include quoted prices for the identical instrument in an inactive market, prices for similar instruments, interest rates, prepayment speeds, credit risk, yield curves, default rates and similar data.
Level 3 – Unobservable inputs for the asset or liability, to the extent relevant observable inputs are not available, representing the Fund’s own assumptions about the assumptions a market participant would use in valuing the asset or liability, and would be based on the best information available.
The availability of observable inputs can vary from security to security and is affected by a wide variety of factors, including, for example, the type of security, whether the security is new and not yet established in the marketplace, the liquidity of markets, and other characteristics particular to the security. To the extent that valuation is based on models or inputs that are less observable or unobservable in the market, the determination of fair value requires more judgment. Accordingly, the degree of judgment exercised in determining fair value is greatest for instruments categorized in Level 3.
The inputs used to measure fair value may fall into different levels of the fair value hierarchy. In such cases, for disclosure purposes, the level in the fair value hierarchy within which the fair value measurement falls in its entirety, is determined based on the lowest level input that is significant to the fair value measurement in its entirety.
The inputs or methodology used for valuing securities are not necessarily an indication of the risk associated with investing in those securities. The following tables summarize the inputs used as of December 31, 2022 for the Fund’s assets measured at fair value:
| Al Frank Fund | |
| Common Stocks | | Level 1 | | | Level 2 | | | Level 3 | | | Total | |
| Communication Services | | $ | 3,369,060 | | | $ | — | | | $ | — | | | $ | 3,369,060 | |
| Consumer Discretionary | | | 5,190,855 | | | | — | | | | — | | | | 5,190,855 | |
| Consumer Staples | | | 2,449,590 | | | | — | | | | — | | | | 2,449,590 | |
| Energy | | | 3,882,300 | | | | — | | | | — | | | | 3,882,300 | |
| Financials | | | 10,444,935 | | | | — | | | | — | | | | 10,444,935 | |
| Health Care | | | 9,267,855 | | | | — | | | | — | | | | 9,267,855 | |
| Industrials | | | 10,348,257 | | | | — | | | | — | | | | 10,348,257 | |
| Information Technology | | | 12,711,780 | | | | — | | | | — | | | | 12,711,780 | |
| Materials | | | 2,989,643 | | | | — | | | | — | | | | 2,989,643 | |
| Real Estate | | | 1,977,485 | | | | — | | | | — | | | | 1,977,485 | |
| Utilities | | | 760,400 | | | | — | | | | — | | | | 760,400 | |
| Total Common Stocks | | | 63,392,160 | | | | — | | | | — | | | | 63,392,160 | |
| Short-Term Investment | | | | | | | | | | | | | | | | |
| Money Market Fund | | | 1,206,212 | | | | — | | | | — | | | | 1,206,212 | |
| Total Short-Term Investment | | | 1,206,212 | | | | — | | | | — | | | | 1,206,212 | |
| Total Investments | | $ | 64,598,372 | | | $ | — | | | $ | — | | | $ | 64,598,372 | |
There were no Level 3 securities held in the Fund during the year ended December 31, 2022.
| Al Frank Fund |
| NOTES TO FINANCIAL STATEMENTS at December 31, 2022 (Continued) |
NOTE 4 - INVESTMENT ADVISORY AGREEMENT AND TRANSACTIONS WITH RELATED PARTIES
Kovitz Investment Group Partners, LLC serves as the Fund’s investment adviser (the “Adviser”).
Pursuant to an investment advisory agreement with the Fund (the “Advisory Agreement”), the Adviser, under the oversight of the Board, directs the daily operations of the Fund and supervises the performance of administrative and professional services provided by others. As compensation for its services, the Fund pays the Adviser a management fee, computed and accrued daily and paid monthly, at an annual rate of 1.00% of the Fund’s average daily net assets (“Advisory Fees”).
For the year ended December 31, 2022, the Adviser earned $712,154 in Advisory Fees.
Pursuant to a written contract (the “Waiver Agreement”), the Adviser has agreed, at least until April 30, 2024, to waive a portion of its advisory fee and has agreed to reimburse the Fund for other expenses to the extent necessary so that the total expenses incurred by the Fund (excluding any front-end or contingent deferred loads, brokerage fees and commissions, acquired fund fees and expenses, borrowing costs, (such as interest and dividend expense on securities sold short) taxes and extraordinary expenses such as litigation) do not exceed 1.24% of the Fund’s average net assets for Advisor Class shares. Any such reduction made by the Adviser in its fees or payment of expenses which are the Fund’s obligation are subject to reimbursement by the Fund to the Adviser, if so requested by the Adviser, in subsequent fiscal years only if the aggregate amount actually paid by the Fund toward the operating expenses for such fiscal year (taking into account the reimbursement) would not cause the Fund to exceed the expense limitation in effect at the time of the waiver or currently in effect, whichever is lower. The Adviser is permitted to receive reimbursement from the Fund for fees it waived and Fund expenses it paid only if reimbursement is made within three years from the date the fees and expenses were initially waived or reimbursed. Any such reimbursement is also contingent upon the Board’s review and approval at the time the reimbursement is made. Such reimbursement may not be paid prior to the Fund’s payment of current ordinary operating expenses. For the year ended December 31, 2022, the Adviser waived its fees in the amount of $129,083.
Cumulative expenses subject to recapture pursuant to the aforementioned conditions expire as follows:
| | 12/31/2023 | | | 12/31/2024 | | | 12/31/2025 | |
| | $ | 120,036 | | | $ | 146,546 | | | $ | 129,083 | |
During the year ended December 31, 2022, $105,460 of previously waived fees expired unrecouped.
Distributor – The distributor for the Fund is Northern Lights Distributors LLC (the “Distributor”) and acts as the Fund’s principal underwriter in a continuous public offering of the Fund’s shares. The Board had adopted the Trust’s Master Distribution and Shareholder Servicing Plan for Investor Class shares (the “Investor Class Plan”) pursuant to Rule 12b-1 under the 1940 Act to pay for ongoing distribution-related activities or shareholder services. Under the Investor Class Plan, the Fund was permitted to pay a fee at an annual rate of 0.25% of the average daily net assets of the Fund’s Investor Class shares. The Fund paid the Distributor to provide compensation for ongoing distribution-related activities or services and/or maintenance of the Fund’s shareholder accounts, not otherwise required to be provided by the Adviser. The Plan was a compensation plan, which means that compensation was provided regardless of 12b-1 expenses incurred. For the year ended December 31, 2022, the Investor Class shares incurred 12b-1 fees of $48,295. For the year ended December 31, 2022, the Investor Class shares paid the Distributor underwriting fees of $0. Investor Class shares converted to Advisor Class shares on April 7, 2022 and are no longer offered.
| Al Frank Fund |
| NOTES TO FINANCIAL STATEMENTS at December 31, 2022 (Continued) |
In addition, certain affiliates of the Distributor provide services to the Fund as follows:
Ultimus Fund Solutions, LLC (“UFS”) – an affiliate of the Distributor, provides administration, fund accounting, and transfer agent services to the Trust. Pursuant to separate servicing agreements with UFS, the Fund pays UFS customary fees for providing administration, fund accounting and transfer agency services to the Fund. Certain officers of the Trust are also officers of UFS, and are not paid any fees directly by the Fund for serving in such capacities.
Northern Lights Compliance Services, LLC (“NLCS”) – an affiliate of UFS and the Distributor, provides a Chief Compliance Officer to the Trust, as well as related compliance services, pursuant to a consulting agreement between NLCS and the Trust. Under the terms of such agreement, NLCS receives customary fees from the Fund.
Blu Giant, LLC (“Blu Giant”) – an affiliate of UFS and the Distributor, provides EDGAR conversion and filing services as well as print management services for the Fund on an ad-hoc basis. For the provision of these services, Blu Giant receives customary fees from the Fund.
NOTE 5 – PURCHASES AND SALES OF SECURITIES
For the year ended December 31, 2022, the cost of purchases and the proceeds from sales of securities, excluding short-term securities, for the Fund was $1,859,538 and $7,761,477, respectively.
NOTE 6 - AGGREGATE UNREALIZED APPRECIATION & DEPRECIATION – TAX BASIS
| Cost for Federal Tax purposes | | $ | 35,190,223 | |
| | | | | |
| Unrealized Appreciation | | $ | 30,335,915 | |
| Unrealized Depreciation | | | (927,766 | ) |
| Tax Net Unrealized Appreciation | | $ | 29,408,149 | |
NOTE 7 – DISTRIBUTIONS TO SHAREHOLDERS AND TAX COMPONENTS OF CAPITAL
The tax character of portfolio distributions paid for the following years was as follows:
| | | Fiscal Year Ended | | | Fiscal Year Ended | |
| | | December 31, 2022 | | | December 31, 2021 | |
| Ordinary Income | | $ | 908,975 | | | $ | 619,618 | |
| Long-Term Capital Gain | | | 4,324,414 | | | | 4,578,672 | |
| | | $ | 5,233,389 | | | $ | 5,198,290 | |
As of December 31, 2022, the components of accumulated earnings/(deficit) on a tax basis were as follows:
| Undistributed | | | Undistributed | | | | | | Capital Loss | | | Other | | | | | | Total | |
| Ordinary | | | Long-Term | | | Post | | | Carry | | | Book/Tax | | | Unrealized | | | Accumulated | |
| Income | | | Gains | | | October Loss | | | Forwards | | | Differences | | | Appreciation | | | Earnings | |
| $ | — | | | $ | 324,752 | | | $ | — | | | $ | — | | | $ | — | | | $ | 29,408,149 | | | $ | 29,732,901 | |
The difference between book basis and tax basis undistributed net investment income, accumulated net realized gain, and unrealized appreciation from investments is primarily attributable to the tax deferral of losses on wash sales and C-Corporation return of capital distributions.
| Al Frank Fund |
| NOTES TO FINANCIAL STATEMENTS at December 31, 2022 (Continued) |
During the fiscal period ended December 31, 2022, the Fund utilized tax equalization which is the use of earnings and profits distributions to shareholders on redemption of shares as part of the dividends paid deduction for income tax purposes. Permanent book and tax differences, primary attributable to equalization credits, resulted in reclassifications for the Fund for the fiscal year ended December 31, 2022 as follows:
| Paid In | | | Distributable | |
| Capital | | | Earnings | |
| $ | 284,969 | | | $ | (284,969 | ) |
NOTE 8 – SUBSEQUENT EVENTS
Subsequent events after the date of the Statement of Assets and Liabilities have been evaluated through the date the financial statements were issued. Management has determined that no events or transactions occurred requiring adjustment or disclosure in the financial statements.

REPORT OF INDEPENDENT REGISTERED PUBLIC ACCOUNTING FIRM
To the Board of Trustees of Northern Lights Fund Trust II
and the Shareholders of Al Frank Fund
Opinion on the Financial Statements
We have audited the accompanying statement of assets and liabilities of Al Frank Fund, a series of shares of beneficial interest in Northern Lights Fund Trust II (the “Fund”), including the schedule of investments, as of December 31, 2022, and the related statement of operations for the year then ended, the statements of changes in net assets for each of the years in the two-year period then ended and the financial highlights for each of the years in the five-year period then ended, and the related notes (collectively referred to as the “financial statements” ). In our opinion, the financial statements present fairly, in all material respects, the financial position of the Fund as of December 31, 2022, and the results of its operations for the year then ended, the changes in its net assets for each of the years in the two-year period then ended and its financial highlights for each of the years in the five-year period then ended, in conformity with accounting principles generally accepted in the United States of America.
Basis for Opinion
These financial statements are the responsibility of the Fund’s management. Our responsibility is to express an opinion on the Fund’s financial statements based on our audits. We are a public accounting firm registered with the Public Company Accounting Oversight Board (United States) (“PCAOB”) and are required to be independent with respect to the Fund in accordance with the U.S. federal securities law and the applicable rules and regulations of the Securities and Exchange Commission and the PCAOB.
We conducted our audits in accordance with the standards of the PCAOB. Those standards require that we plan and perform the audits to obtain reasonable assurance about whether the financial statements are free of material misstatement, whether due to error or fraud. The Fund is not required to have, nor were we engaged to perform, an audit of its internal control over financial reporting. As part of our audits we are required to obtain an understanding of internal control over financial reporting but not for the purpose of expressing an opinion on the effectiveness of the Fund’s internal control over financial reporting. Accordingly, we express no such opinion.
Our audits included performing procedures to assess the risk of material misstatement of the financial statements, whether due to error or fraud, and performing procedures that respond to those risks. Such procedures included examining, on a test basis, evidence regarding the amounts and disclosures in the financial statements. Our procedures included confirmation of securities owned as of December 31, 2022 by correspondence with the custodian. Our audits also included evaluating the accounting principles used and significant estimates made by management, as well as evaluating the overall presentation of the financial statements. We believe that our audits provide a reasonable basis for our opinion.

BBD, LLP
We have served as the auditor of one or more of the Funds in the Northern Lights Fund Trust II since 2012.
Philadelphia, Pennsylvania
March 1, 2023
| Al Frank Fund |
| EXPENSE EXAMPLES at December 31, 2022 (Unaudited) |
Generally, shareholders of mutual funds incur two types of costs: (1) transaction costs, redemption fees, and exchange fees, and (2) ongoing costs, including management fees and other Fund expenses. This Example is intended to help you understand your ongoing costs (in dollars) of investing in the Fund and to compare these costs with the ongoing costs of investing in other mutual funds. The Example is based on an investment of $1,000 invested in the Advisor Class at the beginning of the period and held for the entire period (7/1/22 – 12/31/22).
Actual Expenses
The first line of the tables below provides information about actual account values and actual expenses, with actual net expenses being limited to 1.24% per the operating expenses limitation agreement for the Al Frank Fund Advisor Class. Although the Fund does not charge a sales load or transaction fees, you will be assessed fees for outgoing wire transfers, returned checks, and stop payment orders at prevailing rates charged by Ultimus Fund Solutions, LLC, the Funds’ transfer agent. The Example below includes, but is not limited to, management fees, 12b-1 fees, fund accounting, custody and transfer agent fees. You may use the information in the first line, together with the amount you invested, to estimate the expenses that you paid over the period. Simply divide your account value by $1,000 (for example, an $8,600 account value divided by $1,000 = 8.6), then multiply the result by the number in the first line under the heading entitled “Expenses Paid During Period’’ to estimate the expenses you paid on your account during this period.
Hypothetical Example for Comparison Purposes
The second line of the tables below provides information about hypothetical account values and hypothetical expenses based on the Fund’s actual expense ratio and an assumed rate of return of 5% per year before expenses, which is not the Fund’s actual return. The hypothetical account values and expenses may not be used to estimate the actual ending account balance or expenses you paid for the period. You may use this information to compare the ongoing costs of investing in the Fund’s and other funds. To do so, compare this 5% hypothetical example with the 5% hypothetical examples that appear in the shareholder reports of the other funds. Please note that the expenses shown in the table are meant to highlight your ongoing costs only and do not reflect any transaction costs, such as redemption fees, or exchange fees. Therefore, the second line of the tables is useful in comparing ongoing costs only and will not help you determine the relative total costs of owning different funds. In addition, if these costs were included, your costs would have been higher.
| | | | | | | | | | | Expenses Paid | | | Expense Ratio | |
| | | | | Beginning Account | | | Ending Account | | | During Period * | | | During Period ** | |
| Actual | | Value 7/1/2022 | | | Value 12/31/2022 | | | 7/1/22-12/31/22 | | | 7/1/22-12/31/22 | |
| Al Frank Fund | | | | | | | | | | | | | | |
| | | Advisor Class | | $ | 1,000.00 | | | $ | 1,044.80 | | | $ | 6.39 | | | | 1.24 | % |
| Hypothetical (5% return before Expenses) | | | | | | | | | | | | | |
| Al Frank Fund | | | | | | | | | | | | | | | | | | |
| | | Advisor Class | | $ | 1,000.00 | | | $ | 1,018.95 | | | $ | 6.31 | | | | 1.24 | % |
| * | Expenses are equal to the average account value over the period, multiplied by the Fund’s annualized expense ratio, multiplied by the number of days in the period (184) divided by the number of days in the fiscal year (365). |
| | | |
| | ** | Annualized |
| Al Frank Fund |
| SUPPLEMENTAL INFORMATION at December 31, 2022 (Unaudited) |
FACTORS CONSIDERED BY THE TRUSTEES IN THE APPROVAL OF THE RENEWAL OF THE INVESTMENT ADVISORY AGREEMENT
At a meeting (the “Meeting”) of the Board of Trustees (the “Board”) of Northern Lights Fund Trust II (the “Trust”) held on October 17 and 18, 2022, the Board, including the disinterested Trustees (the “Independent Trustees”), considered the approval of the renewal of the advisory agreement between Kovitz Investment Group Partners, LLC (“Kovitz”) and the Trust on behalf of the Al Frank Fund (the “Kovitz Advisory Agreement”)
Based on their evaluation of the information provided by Kovitz, in conjunction with the Al Frank Fund’s other service providers, the Board, by a unanimous vote (including a separate vote of the Independent Trustees), approved the Kovitz Advisory Agreement with respect to the Al Frank Fund.
In advance of the Meeting, the Board requested and received materials to assist them in considering the Kovitz Advisory Agreement. The materials provided contained information with respect to the factors enumerated below, including the Kovitz Advisory Agreement, a memorandum prepared by the Trust’s outside legal counsel discussing in detail the Trustees’ fiduciary obligations and the factors they should assess in considering the continuation of the Kovitz Advisory Agreement and comparative information relating to the advisory fee and other expenses of the Al Frank Fund. The materials also included due diligence materials relating to Kovitz (including due diligence questionnaires completed by Kovitz, select financial information of Kovitz, bibliographic information regarding Kovitz’s key management and investment advisory personnel, and comparative fee information relating to the Fund) and other pertinent information. At the Meeting, the Independent Trustees were advised by counsel that is experienced in Investment Company Act of 1940 matters and that is independent of fund management and met with such counsel separately from fund management.
The Board then reviewed and discussed the written materials that were provided in advance of the Meeting and deliberated on the approval of the renewal of the Kovitz Advisory Agreements with respect to the Al Frank Fund. The Board relied upon the advice of independent legal counsel and their own business judgment in determining the material factors to be considered in evaluating the Kovitz Advisory Agreement and the weight to be given to each such factor. The conclusions reached by the Board were based on a comprehensive evaluation of all of the information provided and were not the result of any one factor. Moreover, each Trustee may have afforded different weight to the various factors in reaching his conclusions with respect to the Kovitz Advisory Agreement. In considering the approval of the Kovitz Advisory Agreement, the Board reviewed and analyzed various factors that they determined were relevant, including the factors enumerated below.
Nature, Extent and Quality of Services. The Board reviewed materials provided by Kovitz related to the proposed renewal of the Kovitz Advisory Agreement, including its Form ADV and related schedules, a description of the manner in which investment decisions were made and executed, a review of the personnel performing services for the Al Frank Fund, including the individuals that primarily monitor and execute the investment process. The Board discussed the extent of the research capabilities, the quality of Kovitz’s compliance infrastructure and the experience of its investment advisory personnel. The Board noted that Kovitz was an experienced investment adviser with seasoned senior management and that the performance of the Al Frank Fund supported the quality and experience of the staff. Additionally, the Board received satisfactory responses from the representatives of Kovitz with respect to a series of important questions, including: whether Kovitz was involved in any lawsuits or pending regulatory actions; whether the advisory services provided to its other accounts would conflict with the advisory services provided to the Al Frank Fund; whether there were procedures in place to adequately allocate trades among its respective clients; and whether Kovitz’s CCO had processes in place to review the portfolio managers’ performance of their duties to ensure compliance under Kovitz’s compliance program. The Board reviewed the information provided on the practices for monitoring compliance with the Al Frank Fund’s investment limitations and discussed Kovitz’s compliance program with the CCO of the Trust. The Board noted that the CCO of the Trust continued to represent that Kovitz’s policies and procedures were reasonably designed to prevent violations of applicable federal securities laws. The Board also noted Kovitz’s representation that the prospectus and statement of additional information for the Al Frank Fund accurately describe the investment strategies of the Al Frank Fund. The Board then reviewed the capitalization of Kovitz based on financial information provided by and representations made by Kovitz and its representatives and concluded that Kovitz was sufficiently well-capitalized in order to meet its obligations to the Al Frank Fund. The Board concluded that Kovitz had sufficient quality and depth of personnel, resources, investment methods and compliance policies and
| Al Frank Fund |
| SUPPLEMENTAL INFORMATION at December 31, 2022 (Unaudited)(Continued) |
procedures essential to performing its duties under the Kovitz Advisory Agreement and that the nature, overall quality and extent of the advisory services to be provided by Kovitz to the Al Frank Fund were satisfactory.
Performance. The Board discussed the report prepared by Broadridge and reviewed the performance as compared to its peer group, Morningstar category and benchmark for the one year, three year, five year and since inception periods ended September 30, 2022, for the Al Frank Fund. The Board noted the Al Frank Fund underperformed its peer group median, Morningstar category median, and benchmark, the S&P 500 Index, for the one year, three year and five year periods as well as the Advisor Class since inception period. The Board further noted that the Al Frank Fund’s former Investor Class shares, which commenced operations in 1998, had a longer performance track record and as a result of the longer history was the only fund in its peer group and Morningstar category to outperform the S&P 500 Index since 1998. After further discussion, the Board concluded that the performance of the Al Frank Fund was acceptable and the Board would continue to monitor the performance of the Al Frank Fund.
Fees and Expenses. As to the costs of the services provided by Kovitz, the Board reviewed and discussed the advisory fee and total operating expenses of the Al Frank Fund as compared to its peer group and its Morningstar category as presented in the Broadridge Report. The Board noted that the 1.00% advisory fee was at the top of its Morningstar category and peer group although its net expense ratio was not the highest in its Morningstar category.
The Board then reviewed the contractual arrangements for the Al Frank Fund, which stated that Kovitz had agreed to waive or limit its advisory fee and/or reimburse expenses at least until April 30, 2024, in order to limit net annual operating expenses, exclusive of certain fees, so as not to exceed 1.24% of the Al Frank Fund’s average net assets for Advisor Class shares, and found such arrangements to be beneficial to shareholders. The Board concluded that, based on Kovitz’s experience, expertise and services provided to the Al Frank Fund, the advisory fee charged by Kovitz, although at the high end of the Al Frank Fund’s peer group, was not unreasonable.
Profitability. The Board also considered the level of profits that could be expected to accrue to Kovitz with respect to the Al Frank Fund based on profitability reports and profitability analyses provided by Kovitz. The Board also reviewed the selected financial information of Kovitz provided by Kovitz. After review and discussion, the Board concluded that the anticipated profit from Kovitz’s relationship with the Al Frank Fund was not excessive.
Economies of Scale. As to the extent to which the Al Frank Fund would realize economies of scale as it grows, and whether the fee levels reflect these economies of scale for the benefit of investors, the Board discussed the current size of the Al Frank Fund and Kovitz’s expectations for growth, and concluded that any material economies of scale would likely not be achieved in the near term.
Conclusion. The Board relied upon the advice of counsel, and their own business judgment in determining the material factors to be considered in evaluating the Kovitz Advisory Agreement and the weight to be given to each such factor. Accordingly, having requested and received such information from Kovitz as the Trustees believed to be reasonably necessary to evaluate the terms of the Kovitz Advisory Agreement, and as assisted by the advice of independent counsel, the Board, including a majority of the Independent Trustees voting separately, determined that (a) the terms of the Kovitz Advisory Agreement are not unreasonable; (b) the investment advisory fee payable pursuant to the Kovitz Advisory Agreement is not unreasonable; and (c) the Kovitz Advisory Agreement is in the best interests of the Al Frank Fund and its shareholders. Moreover, the Board noted that each Trustee may have afforded different weight to the various factors in reaching his conclusions with respect to the Kovitz Advisory Agreement.
| Al Frank Fund |
| LIQUIDITY RISK MANAGEMENT PROGRAM (Unaudited) |
| December 31, 2022 |
The Fund has adopted and implemented a written liquidity risk management program as required by Rule 22e-4 (the “Liquidity Rule”) under the 1940 Act. The program is reasonably designed to assess and manage the Fund’s liquidity risk, taking into consideration, among other factors, the Fund’s investment strategy and the liquidity of its portfolio investments during normal and reasonably foreseeable stressed conditions; its short and long-term cash flow projections; and its cash holdings and access to other funding sources.
During the fiscal period ended December 31, 2022, the Trust’s Liquidity Risk Management Program Committee (the “Committee”) reviewed the Fund’s investments and determined that the Fund held adequate levels of cash and highly liquid investments to meet shareholder redemption activities in accordance with applicable requirements. Accordingly, the Committee concluded that (i) the Fund’s liquidity risk management program is reasonably designed to prevent violations of the Liquidity Rule and (ii) the Fund’s liquidity risk management program has been effectively implemented.
| Al Frank Fund |
| SUPPLEMENTAL INFORMATION at December 31, 2022 (Unaudited) |
The Trustees and the officers of the Trust are listed below with their present positions with the Trust and principal occupations over at least the last five years. The business address of each Trustee and Officer is 225 Pictoria Drive, Suite 450, Cincinnati, OH 45246. All correspondence to the Trustees and Officers should be directed to c/o Ultimus Fund Solutions, LLC, P.O. Box 541150, Omaha, Nebraska 68154.
Independent Trustees
Name and Year
of Birth | Position/Term of
Office* | Principal Occupation
During the Past Five Years | Number of
Portfolios in
Fund
Complex
Overseen by
Trustee** | Other Directorships held by Trustee
During the Past Five Years |
Brian Nielsen
1972 | Trustee Since May 2011 | Trustee of Northern Lights Fund Trust II (since 2011); Special Projects Counsel of NorthStar Financial Services Group, LLC (from 2018 to 2019); Secretary of CLS Investments, LLC (from 2001 to 2018); Secretary of Orion Advisor Services, LLC (from 2001 to 2018); General Counsel and Secretary (from 2003 to 2018) of NorthStar Financial Services Group, LLC; CEO (from 2012 to 2018), Secretary (from 2003 to 2018) and Manager (from 2005 to 2018) of Northern Lights Distributors, LLC; Director, Secretary and General Counsel of Constellation Trust Company (from 2004 to 2018); CEO (from 2015 to 2018), General Counsel and Secretary (from 2011 to 2018) of Northern Lights Compliance Services, LLC; General Counsel and Secretary of Blu Giant, LLC (from 2011 to 2018); Secretary of Gemini Fund Services, LLC (from 2012 to 2018); Manager of Arbor Point Advisors, LLC (from 2012 to 2018); Director, Secretary and General Counsel of NorthStar CTC Holdings, Inc. (from 2015 to 2018) and Secretary and Chief Legal Officer of AdvisorOne Funds (from 2003 to 2018). | 1 | Manager of Northern Lights Distributors, LLC (from 2005 to 2018); Manager of Arbor Point Advisors, LLC (from 2012 to 2018); Director of Constellation Trust Company (from 2004 to 2018) |
Thomas T. Sarkany
1946 | Trustee Since October 2011 | President, TTS Consultants, LLC (financial services) (since 2010); President, TTS Associates, Inc. (financial services) (since December 2022). | 1 | Director, Aquila Distributors; Trustee, Arrow ETF Trust; Trustee, Arrow Investments Trust; Trustee, Northern Lights Fund Trust IV |
Anthony H. Lewis
1946 | Trustee Since May 2011 | Chairman and CEO of The Lewis Group USA (executive consulting firm) (since 2007). | 1 | Director, Member of the Compensation Committee and Member of the Risk Committee of Torotel Inc. (Magnetics, Aerospace and Defense), Trustee, Chairman of the Fair Valuation Committee and Member of the Audit Committee of the Wildermuth Endowment Strategy Fund |
Keith Rhoades
1948 | Trustee Since May 2011 | Retired since 2008. | 1 | NONE |
Randal D. Skalla
1962 | Trustee Since May 2011 | President, L5 Enterprises, Inc. (financial services company) (since 2001). | 1 | Board Member, Orizon Investment Counsel (financial services company) (from 2001 to 2017) |
| Al Frank Fund |
| SUPPLEMENTAL INFORMATION at December 31, 2022 (Unaudited)(Continued) |
Officers
Name and Year
of Birth | Position/Term
of Office* | Principal Occupation
During the Past Five Years | Number of
Portfolios in
Fund
Complex
Overseen by
Trustee** | Other Directorships held by Trustee
During the Past Five Years |
Kevin E. Wolf
1969 | President Since January 2013 | Vice President of The Ultimus Group, LLC; Executive Vice President, Head of Fund Administration and Product (since 2019) and President (2012 - 2019) of Ultimus Fund Solutions, LLC (formerly, Gemini Fund Services, LLC). | N/A | N/A |
Eric Kane
1981 | Secretary Since August 2022 | Vice President and Managing Counsel, Ultimus Fund Solutions, LLC (since 2020); Vice President and Counsel, Gemini Fund Services, LLC (2017-2020) | N/A | N/A |
Erik Naviloff
1968 | Treasurer Since January 2013 | Vice President of Ultimus Fund Solutions, LLC (formerly, Gemini Fund Services, LLC) (since 2011). | N/A | N/A |
Jared Lahman
1986 | Anti-Money Laundering Officer since January 2022 | Compliance Analyst, Northern Lights Compliance Services, LLC (since January 2019); Manager, Fund Accounting, Gemini Fund Services, LLC (January 2014 to December 2018). | N/A | N/A |
Emile R. Molineaux
1962 | Chief Compliance Officer Since May 2011 | Senior Compliance Officer and CCO of Various clients of Northern Lights Compliance Services, LLC (since 2011). | N/A | N/A |
| * | The term of office for each Trustee and Officer listed above will continue indefinitely. |
| ** | As of December 31, 2022, the Trust was comprised of 19 active portfolios managed by unaffiliated investment advisers. The term “Fund Complex” applies only to the Fund and not to any other series of the Trust. The Fund does not hold itself out as related to any other series within the Trust for investment purposes, nor does it share the same investment adviser with any other series. |
Privacy Policy
Rev. May 2021
| FACTS | WHAT DOES NORTHERN LIGHTS FUND TRUST II (“NLFT II”) DO WITH YOUR PERSONAL INFORMATION? |
| Why? | Financial companies choose how they share your personal information. Federal law gives consumers the right to limit some but not all sharing. Federal law also requires us to tell you how we collect, share, and protect your personal information. Please read this notice carefully to understand what we do. |
| What? | The types of personal information we collect and share depend on the product or service you have with us. This information can include:
|
● Social Security number ● Employment information ● Account balances | ● Account transactions ● Income ● Investment experience |
When you are no longer our customer, we continue to share your information as described in this notice. |
| How? | All financial companies need to share a customer’s personal information to run their everyday business - to process transactions, maintain customer accounts, and report to credit bureaus. In the section below, we list the reasons financial companies can share their customer’s personal information; the reasons NLFT II chooses to share; and whether you can limit this sharing. |
| | |
| Reasons we can share your personal information | Does NLFT II
share? | Can you limit
this sharing? |
For our everyday business purposes —
such as to process your transactions, maintain your account(s), respond to court orders and legal investigations, or report to credit bureaus
| Yes | No |
For our marketing purposes —
to offer our products and services to you
| Yes | No |
For joint marketing with other financial companies
| Yes | No |
For our affiliates’ everyday business purposes —
information about your transactions and experiences
| Yes | No |
For our affiliates’ everyday business purposes —
information about your creditworthiness
| No | We don’t share |
For nonaffiliates to market to you
| No | We don’t share |
| Questions? | Call 1-631-490-4300 |
| | |
| Who we are |
| Who is providing this notice? | Northern Lights Fund Trust II |
| What we do |
| How does NLFT II protect my personal information? | To protect your personal information from unauthorized access and use, we use security measures that comply with federal law. These measures include computer safeguards and secured files and buildings.
|
| How does NLFT II collect my personal information? | We collect your personal information, for example, when you
|
● open an account ● give us your income information ● provide employment information | ● provide account information ● give us your contact information |
| We also collect your personal information from others, such as credit bureaus, affiliates, or other companies. |
| Why can’t I limit all sharing? | Federal law gives you the right to limit only ● sharing for affiliates’ everyday business purposes—information about your creditworthiness ● affiliates from using your information to market to you ● sharing for nonaffiliates to market to you State laws and individual companies may give you additional rights to limit sharing. |
| Definitions |
| Affiliates | Companies related by common ownership or control. They can be financial and nonfinancial companies. ● NLFT II has no affiliates. |
| Nonaffiliates | Companies not related by common ownership or control. They can be financial and nonfinancial companies. ● NLFT II does not share with nonaffiliates so they can market to you. |
| | |
| Joint marketing | A formal agreement between nonaffiliated financial companies that together market financial products and services to you. ● Our joint marketing partners include other financial service companies. |
Advisor
Kovitz Investment Group Partners, LLC
71 S Wacker Dr., Suite 1860
Chicago, IL 60606
alfrankfunds.com
Distributor
Northern Lights Distributors, LLC
4221 North 203rd Street, Suite 100
Elkhorn, NE 68022
Transfer Agent
Ultimus Fund Solutions, LLC
4221 North 203rd Street, Suite 100
Elkhorn, NE 68022
PROXY VOTING POLICY
Information regarding how the Fund voted proxies relating to portfolio securities for the most recent twelve month period ended June 30 as well as a description of the policies and procedures that the Fund used to determine how to vote proxies is available without charge, upon request, by calling 1-888-263-6443 or by referring to the Securities and Exchange Commission’s (“SEC”) website at http://www.sec.gov.
PORTFOLIO HOLDINGS
The Fund files a complete schedule of portfolio holdings with the SEC for the first and third quarters of each fiscal year as an exhibit to its reports on Form N-PORT, within sixty days after the end of the period. Form N-PORT reports are available at the SEC’s website at www.sec.gov.
This report is intended for shareholders of the Fund and may not be used as sales literature unless preceded or accompanied by a current prospectus. Statements and other information herein are dated and are subject to change.
| | |  |
| | | |
If you have any questions or need help with your account, call our customer service team at: 888.263.6443 The Al Frank Fund’s web site contains resources for both current and potential shareholders, including: ● Performance through the most recent quarter and month-end ● Applications, including new account forms, IRA and IRA transfer forms ● Electronic copies of the Prospectus, Annual Report and Semi-Annual Report All of this information and more is available at: alfrankfunds.com Must be preceded or accompanied by a prospectus. Please refer to the prospectus for important information about the investment company, including investment objectives, risks, charges and expenses. Small company investing involves greater volatility, limited liquidity and other risks. Al Frank-AR-22 | | |
(b) Include a copy of each notice transmitted to stockholders in reliance on Rule 30e-3 under the Act (17 CFR 270.30e-3) that contains disclosures specified by paragraph (c)(3) of that rule.
Item 2. Code of Ethics.
(a) As of the end of the period covered by this report, the registrant has adopted a code of ethics that applies to the registrant's principal executive officer, principal financial officer, principal accounting officer or controller, or persons performing similar functions, regardless of whether these individuals are employed by the registrant or a third party.
(b) For purposes of this item, “code of ethics” means written standards that are reasonably designed to deter wrongdoing and to promote:
| (1) | Honest and ethical conduct, including the ethical handling of actual or apparent conflicts of interest between personal and professional relationships; |
| (2) | Full, fair, accurate, timely, and understandable disclosure in reports and documents that a registrant files with, or submits to, the Commission and in other public communications made by the registrant; |
(3) Compliance with applicable governmental laws, rules, and regulations;
| (4) | The prompt internal reporting of violations of the code to an appropriate person or persons identified in the code; and |
(5) Accountability for adherence to the code.
(c) Amendments: During the period covered by the report, there have not been any amendments to the provisions of the code of ethics.
(d) Waivers: During the period covered by the report, the registrant has not granted any express or implicit waivers from the provisions of the code of ethics.
(e) The Code of Ethics is not posted on Registrant’ website.
(f) A copy of the Code of Ethics is attached as an exhibit.
Item 3. Audit Committee Financial Expert.
(a)(1)ii The board of directors of the fund has determined that the fund does not have an audit committee financial expert serving on its audit committee.
(a)(2) Not applicable.
(a)(3) In this regard, no member of the audit committee was identified as having all of the required technical attributes identified in instruction 2 (b) to item 3 of Form N-CSR to qualify as an “audit committee financial expert,” whether through the type of specialized education or experience required by that instruction. At this time, the board believes the experience provided by each member of the audit committee collectively offers the fund adequate oversight by its audit committee given the fund’s level of financial complexity. The board will from time to time reexamine such belief.
Item 4. Principal Accountant Fees and Services.
2022 - $13,000
2021 - $13,000
2020 - $13,000
2022 - None
2021 - None
2020 - None
2022 - $3,000
2021 - $2,200
2020 - $2,200
Preparation of Federal & State income tax returns, assistance with calculation of required income, capital gain and excise distributions and preparation of Federal excise tax returns.
2022 - None
2021 - None
2020 - None
| (e) | (1) Audit Committee’s Pre-Approval Policies |
The registrant’s Audit Committee is required to pre-approve all audit services and, when appropriate, any non-audit services (including audit-related, tax and all other services) to the registrant. The registrant’s Audit Committee also is required to pre-approve, when appropriate, any non-audit services (including audit-related, tax and all other services) to its adviser, or any entity controlling, controlled by or under common control with the adviser that provides ongoing services to the registrant, to the extent that the services may be determined to have an impact on the operations or financial reporting of the registrant. Services are reviewed on an engagement by engagement basis by the Audit Committee.
| (2) | Percentages of Services Approved by the Audit Committee |
2022 2021 2020
Audit-Related Fees: 0.00% 0.00% 0.00%
Tax Fees: 0.00% 0.00% 0.00%
All Other Fees: 0.00% 0.00% 0.00%
| (f) | During the audit of registrant's financial statements for the most recent fiscal year, less than 50 percent of the hours expended on the principal accountant's engagement were attributed to work performed by persons other than the principal accountant's full-time, permanent employees. |
| (g) | The aggregate non-audit fees billed by the registrant's accountant for services rendered to the registrant, and rendered to the registrant's investment adviser (not including any sub-adviser whose role is primarily portfolio management and is subcontracted with or overseen by another investment adviser), and any entity controlling, controlled by, or under common control with the adviser that provides ongoing services to the registrant: |
2022 - $3,000
2021 - $2,200
2020 - $2,200
(h) The registrant's audit committee has considered whether the provision of non-audit services to the registrant's investment adviser (not including any sub-adviser whose role is primarily portfolio management and is subcontracted with or overseen by another investment adviser), and any entity controlling, controlled by, or under common control with the investment adviser that provides ongoing services to the registrant, that were not pre-approved pursuant to paragraph (c)(7)(ii) of Rule 2-01 of Regulation S-X, is compatible with maintaining the principal accountant's independence.
(i) Not applicable.
(j) Not applicable.
Item 5. Audit Committee of Listed Companies. Not applicable to open-end investment companies.
Item 6. Schedule of Investments. See Item 1.
Item 7. Disclosure of Proxy Voting Policies and Procedures for Closed-End Funds. Not applicable to open-end investment companies.
Item 8. Portfolio Managers of Closed-End Management Investment Companies. Not applicable to open-end investment companies.
Item 9. Purchases of Equity Securities by Closed-End Funds. Not applicable to open-end investment companies.
��
Item 10. Submission of Matters to a Vote of Security Holders. None
Item 11. Controls and Procedures.
(a) Based on an evaluation of the Registrant’s disclosure controls and procedures as of a date within 90 days of filing date of this Form N-CSR, the principal executive officer and principal financial officer of the Registrant have concluded that the disclosure controls and procedures of the Registrant are reasonably designed to ensure that the information required in filings on Form N-CSR is recorded, processed, summarized, and reported by the filing date, including that information required to be disclosed is accumulated and communicated to the Registrant’s management, including the Registrant’s principal executive officer and principal financial officer, as appropriate to allow timely decisions regarding required disclosure.
(b) There were no significant changes in the Registrant’s internal control over financial reporting that occurred during the period covered by this report that have materially affected, or are reasonably likely to materially affect, the Registrant’s internal control over financial reporting.
Item 12. Disclosure of Securities Lending Activities for Closed-End Management Investment Companies. Not applicable to open-end investment companies.
Item 13. Exhibits.
(a)(1) Code of Ethics herewith.
(a)(2) Certifications required by Section 302 of the Sarbanes-Oxley Act of 2002 (and Item 11(a)(2) of Form N-CSR) are filed herewith.
(a)(3) Not applicable for open-end investment companies.
(b) Certifications required by Section 906 of the Sarbanes-Oxley Act of 2002 (and Item 11(b) of Form N-CSR) are filed herewith.
SIGNATURES
Pursuant to the requirements of the Securities Exchange Act of 1934 and the Investment Company Act of 1940, the registrant has duly caused this report to be signed on its behalf by the undersigned, thereunto duly authorized.
(Registrant) Northern Lights Fund Trust II
By (Signature and Title)
/s/ Kevin E. Wolf
Kevin E. Wolf, Principal Executive Officer/President
Date 3/7/23
Pursuant to the requirements of the Securities Exchange Act of 1934 and the Investment Company Act of 1940, this report has been signed below by the following persons on behalf of the registrant and in the capacities and on the dates indicated.
By (Signature and Title)
/s/ Kevin E. Wolf
Kevin E. Wolf, Principal Executive Officer/President
Date 3/7/23
By (Signature and Title)
/s/ Erik Naviloff
Erik Naviloff, Principal Financial Officer/Treasurer
Date 3/7/23