UNITED STATES
SECURITIES AND EXCHANGE COMMISSION
Washington, D.C. 20549
FORM N-CSR
CERTIFIED SHAREHOLDER REPORT OF REGISTERED
MANAGEMENT INVESTMENT COMPANIES
Investment Company Act File Number: 811-22557
| T. Rowe Price Floating Rate Fund, Inc. |
|
| (Exact name of registrant as specified in charter) |
| |
| 100 East Pratt Street, Baltimore, MD 21202 |
|
| (Address of principal executive offices) |
| |
| David Oestreicher |
| 100 East Pratt Street, Baltimore, MD 21202 |
|
| (Name and address of agent for service) |
Registrant’s telephone number, including area code: (410) 345-2000
Date of fiscal year end: May 31
Date of reporting period: May 31, 2017
Item 1. Report to Shareholders
| Floating Rate Fund | May 31, 2017 |
The views and opinions in this report were current as of May 31, 2017. They are not guarantees of performance or investment results and should not be taken as investment advice. Investment decisions reflect a variety of factors, and the managers reserve the right to change their views about individual stocks, sectors, and the markets at any time. As a result, the views expressed should not be relied upon as a forecast of the fund’s future investment intent. The report is certified under the Sarbanes-Oxley Act, which requires mutual funds and other public companies to affirm that, to the best of their knowledge, the information in their financial reports is fairly and accurately stated in all material respects.
REPORTS ON THE WEB
Sign up for our Email Program, and you can begin to receive updated fund reports and prospectuses online rather than through the mail. Log in to your account at troweprice.com for more information.
Manager’s Letter
Fellow Shareholders
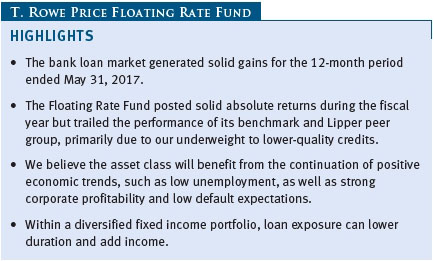
Floating rate loans produced solid absolute results in the fiscal year ended May 31, 2017. The continuation of reasonably positive economic trends, such as low unemployment combined with strong corporate profitability and declining default rates, supported the asset class. Accommodative developed market central bank policies, waning global macroeconomic uncertainty, and firmer oil prices also buoyed investor sentiment. However, the impact of these positive factors was tempered at times by uncertainty about the outlook for fiscal and monetary policy under the Trump administration, concerns about elevated fixed income valuations, and historically low yields. Loans remain a solid risk-adjusted alternative to high yield bonds because of their senior secured position in the capital structure, lower price volatility, and relatively limited exposure to commodity-related sectors.
PORTFOLIO PERFORMANCE
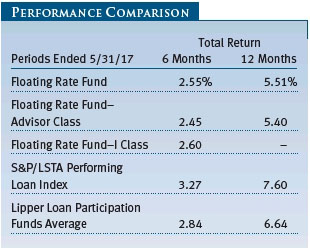
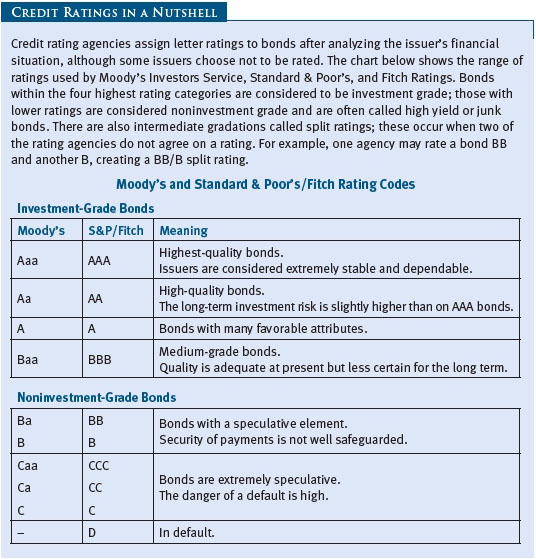
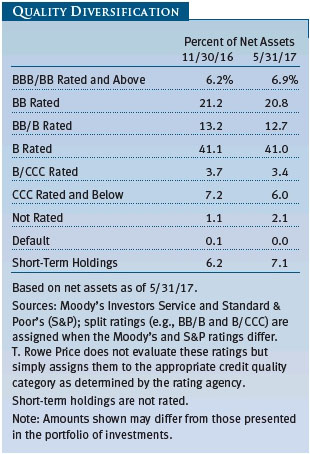
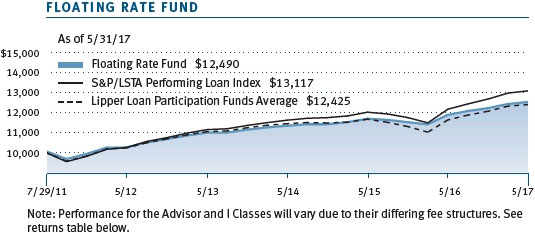
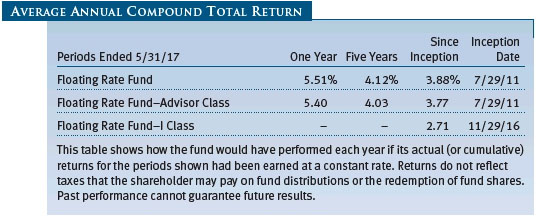
The Floating Rate Fund returned 5.51% for the fiscal year but underperformed the benchmark S&P/LSTA Performing Loan Index and the Lipper peer group. Your portfolio is focused on bank loans and, to a lesser extent, corporate bonds in the higher-quality tiers of the below investment-grade universe; we primarily invest in BB and B rated loans. Although we held a fairly neutral allocation to CCC rated credits, our defensive positioning within that category relative to the benchmark meant that we did not fully participate in the rally among lower-quality loans that largely drove market performance over the past 12 months. (Results for the fund’s Advisor and I Class shares varied slightly, reflecting their different fee structures, asset flows, and other factors.)
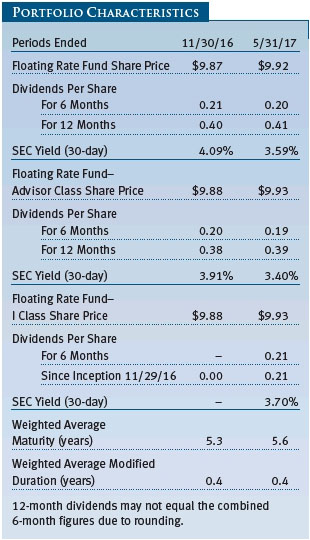
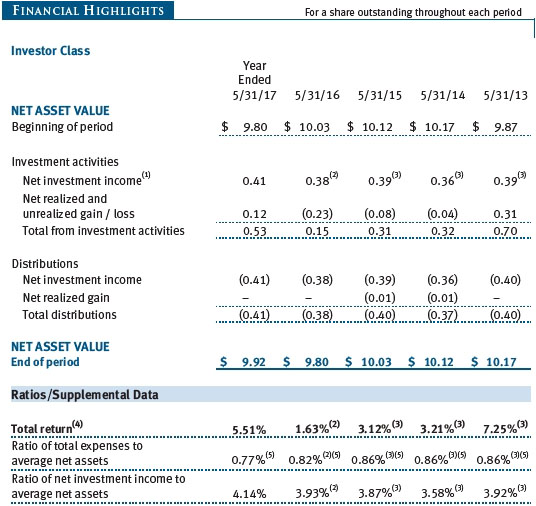
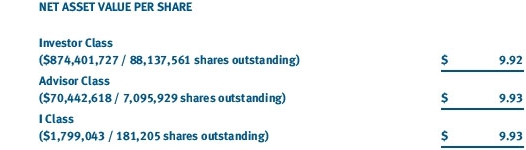
Over the past 12 months, the fund’s share price increased $0.12 to $9.92 from $9.80 at the end of May 2016. As shown in the Portfolio Characteristics table, dividend income totaled $0.20 per share since the end of November and contributed $0.41 for the past 12 months. At the end of our reporting period, the fund’s 3.59% 30-day SEC yield was lower than it was 12 months ago.
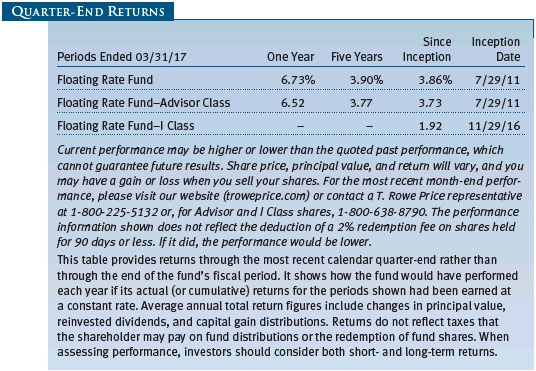
The Floating Rate Fund’s longer-term returns continued to compare favorably with its Lipper peer group, particularly during periods of market volatility. Lipper ranked the fund in the top quartile of its loan participation funds universe for the three-year period ended May 31, 2017. (Based on cumulative total return, the fund ranked 162 of 229, 47 of 208, 72 of 159, and 63 of 141 funds in the Lipper loan participation funds category for the one-, three-, and five-year and since-inception periods ended May 31, 2017, respectively. Past performance cannot guarantee future results.)
MARKET ENVIRONMENT
The pace of U.S. economic growth moderated to an annualized rate of 1.4% in the first quarter of 2017. Much of the final quarter of last year was dominated by the U.S. presidential election. In the wake of the unexpected outcome, anticipation of stimulative fiscal policies under the new administration, such as lower tax rates and increased infrastructure spending, bolstered sentiment toward segments with higher credit risk. At the end of November, OPEC members agreed to cut the cartel’s oil production, pushing the price of a barrel of crude oil back up to nearly $50, providing support for the below investment-grade market. The Federal Reserve announced two 25-basis-point increases in the federal funds target rate range during our fiscal year, with the first in December 2016 and the second during March 2017. The central bank also raised short-term rates by another 25 basis points shortly after our reporting period and is projecting one more rate hike before year-end.
Recent market volatility has highlighted the importance of sound risk management. Because of this evolving environment, T. Rowe Price is taking steps to ensure that our funds function smoothly during transitional periods as the Fed implements policy changes. These measures include assessing the liquidity of our portfolios, conducting stress tests that take various market scenarios into consideration, evaluating risk management strategies to determine appropriate actions, and taking other steps to ensure the continuing smooth operation of our portfolios. We do not believe that your fund will be adversely affected by the conditions we have just mentioned, but we want to inform our shareholders that we are aware of the changing market environment and are monitoring it closely.
FLOATING RATE LOANS BENEFIT FROM RISING INTEREST RATES
Bank loans benefit from rising rates in contrast with most other fixed income investments. Fixed rate bond prices fall when rates rise—unlike loans, whose coupons “float,” or reset higher, typically every three months. A loan’s coupon equals the credit spread (to compensate investors for lending) plus LIBOR (the base rate); the total coupon resets every 90 days (for most loans) based on the LIBOR level, while the spread remains unchanged. LIBOR is the London Interbank Offered Rate, which is the rate at which banks loan money to each other in the London wholesale market. LIBOR comes in several maturities, including one week, one month, and one year, but the most widely used maturity in the loan market is the three-month LIBOR.
To enhance the coupon over the past decade because LIBOR had been so low, most floating rate bank loans were priced with a LIBOR floor. LIBOR floors are a minimum value imposed on the floating rate coupon of an individual bank loan. Some floors are 75 basis points, but the majority are 100 basis points. Only after LIBOR exceeds the floor level do the coupons reset higher. For the first time since the end of 2008, LIBOR rose above 100 basis points and coupons can now reset higher because LIBOR exceeded most floor levels. The three-month LIBOR rate was 1.21% at the end of the reporting period. Accordingly, the fund can receive more income, which is the unique benefit of investing in the asset class relative to most other fixed income sectors.
There are two caveats to bear in mind, however. The first is that not all loan coupons reset simultaneously. Issuers come to market constantly, so the three-month resetting feature of loans is continually occurring based on the issue date. The second, and perhaps more important, caveat is that strong demand for the asset class continues to drive repricing activity. This occurs when companies return to the market to take advantage of benign credit conditions to lower their borrowing costs on existing loans, which reduces the benefit of the floating rate feature for investors.
PORTFOLIO REVIEW
The majority of our companies are performing well, and we have kept our focus on higher-quality loans. At the end of the reporting period, approximately 92% of the portfolio was invested in securities rated split B or higher (including short-term holdings). During the last six months, we kept our credit quality allocations fairly consistent. We are finding value in high yield bonds that are likely to be retired at their first call date. In addition to generating attractive yields, these fixed rate bonds are generally more liquid than loans, further enhancing their appeal.
The fund is largely invested in traditional loan structures with solid covenants and first priority on assets. We typically avoid smaller, less liquid loans. Our short-term holdings weighed on relative returns, which typically occurs during periods of positive market performance. However, we maintain a reserves position to make opportunistic purchases and to meet potential redemptions.
The portfolio’s tactical overweight to the energy sector during the fiscal year benefited relative performance. In 2014 and 2015, we made the decision to materially underweight the energy space and avoid issuers that lacked the cost advantages and balance sheet strength to withstand a sustained period of lower commodity prices. This placed us in an auspicious position to take advantage of opportunities in the energy segment as they arose. As the sector began to recover in the second half of 2016, we purchased select high-coupon credits issued by companies that had taken measures to reduce debt and improve cash flow earlier in the year.
The portfolio’s top industry contribution to relative performance was retail, due to a combination of an underweight allocation and credit selection. Over the past year, we avoided challenged securities and focused on higher-quality issuers as the retail industry faced secular headwinds. Looking ahead, our defensive positioning could become more important as we see the potential for increased defaults in the retail sector through the second half of 2017.
Dollar Tree and BJ’s Wholesale Club are among the few names we like in the retail space. Dollar Tree operates a discount variety store chain and sells an assortment of everyday general merchandise at the $1.00 price point. Despite the headwinds the retail sector faces amid behavioral shifts to online shopping, Dollar Tree continues to generate traffic in its stores. Additionally, we are optimistic about the issuer’s commitment to upgrading its credit profile by deploying much of its free cash flow to pay down debt. (Please refer to the fund’s portfolio of investments for a complete list of holdings and the amount each represents in the portfolio.)
BJ’s Wholesale Club is the leading warehouse club operator on the East Coast. Membership fee income provides a stable and recurring annual earnings stream, and the company boasts exceptional customer loyalty with a high renewal rate among members. Its differentiated product mix, which includes grocery items as well as general merchandise, helps drive frequent store traffic. While most retail names continue to struggle with negative same-store trends, we believe the fee-based wholesale club is a retail channel that is continuing to grow. BJ’s is our largest issuer in the retail segment, and we expect it to continue deleveraging over the next year.
Our underweight to health care benefited relative performance, as did credit selection within the sector. The security selection impact was largely the result of our investment in Valeant Pharmaceuticals. Valeant completed a significant refinancing transaction in the last six months that extended maturities on several loans to 2022. Additionally, the company continued to pay down debt through asset sales and by utilizing free cash flow.
The fund’s underperformance relative to the benchmark was largely the result of our higher-quality preference within the energy sector. Specifically, our decision to avoid lower-rated loans issued by certain offshore energy companies hampered our returns versus the index, as they rallied over the past year from extremely depressed levels. However, we viewed the risk/reward trade-off for these investments to be unfavorable.
OUTLOOK
Overall, we remain constructive on the longer-term prospects for the loan market and anticipate moderate default levels for the remainder of 2017. Steady economic growth, favorable employment trends, and healthy corporate fundamentals are supportive. The asset class should also benefit from its relatively limited exposure to the energy and commodities segments, where the outlook for the second half of the year remains uncertain.
The senior secured status of loans typically delivers less volatile performance relative to high yield bonds. Also, the unique floating rate feature of the asset class means that loans can benefit from coupons resetting higher as rates rise. Because loans are the only fixed income segment where coupons are currently increasing, they can lower duration and add uncorrelated risk within a diversified portfolio. The loan asset class has historically performed exceptionally well relative to other fixed income investments during periods of rising policy rates.
From a technical standpoint, demand for loans outstripped supply over the last 12 months, with a majority of issuance consisting of repricing/refinancing of existing loans rather than new loans issued to the market. Given this dynamic, elevated valuations are currently one of the biggest challenges to the loan market. The percentage of loans trading above par has risen steadily over the past year, so we anticipate only modest capital appreciation over the next six months.
As always, we will continue to work diligently on your behalf. Thank you for your support and confidence in T. Rowe Price.
Respectfully submitted,

Paul M. Massaro
Chairman of the fund’s Investment Advisory Committee
June 27, 2017
The committee chairman has day-to-day responsibility for managing the portfolio and works with committee members in developing and executing the fund’s investment program.
RISKS OF INVESTING IN FLOATING RATE LOAN FUNDS
Floating rate loans are subject to credit risk, the chance that any fund holding could have its credit rating downgraded or that an issuer will default (fail to make timely payments of interest or principal), and liquidity risk, the chance that the fund may not be able to sell loans or securities at desired prices, potentially reducing the fund’s income level and share price. Like bond funds, this fund is exposed to interest rate risk, but credit and liquidity risks may often be more important.
The loans in which the fund invests are often referred to as “leveraged loans” because the borrowing companies have significantly more debt than equity. In many cases, leveraged loans are issued in connection with recapitalizations, acquisitions, leveraged buyouts, and refinancings. Companies issuing leveraged loans typically have a below investment-grade credit rating or may not be rated by a major credit rating agency. Leveraged loan funds could have greater price declines than funds that invest primarily in high-quality bonds, so the securities are usually considered speculative investments.
GLOSSARY
Basis point: One one-hundredth of a percentage point, or 0.01%.
Duration: A measure of a bond fund’s sensitivity to changes in interest rates. For example, a fund with a one-year duration would fall about 1% in response to a one-percentage-point rise in interest rates, and vice versa.
Federal funds rate (or target rate): The interest rate charged on overnight loans of reserves by one financial institution to another in the United States. The Federal Reserve sets a target federal funds rate to affect the direction of interest rates.
SEC yield (30-day): A method of calculating a fund’s yield that assumes all portfolio securities are held until maturity. Yield will vary and is not guaranteed.
S&P/LSTA Performing Loan Index: A benchmark that tracks the performance of the leveraged loan market.
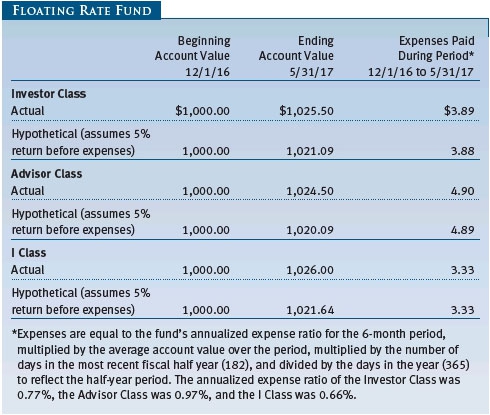
Performance and Expenses
This chart shows the value of a hypothetical $10,000 investment in the fund over the past 10 fiscal year periods or since inception (for funds lacking 10-year records). The result is compared with benchmarks, which may include a broad-based market index and a peer group average or index. Market indexes do not include expenses, which are deducted from fund returns as well as mutual fund averages and indexes.
As a mutual fund shareholder, you may incur two types of costs: (1) transaction costs, such as redemption fees or sales loads, and (2) ongoing costs, including management fees, distribution and service (12b-1) fees, and other fund expenses. The following example is intended to help you understand your ongoing costs (in dollars) of investing in the fund and to compare these costs with the ongoing costs of investing in other mutual funds. The example is based on an investment of $1,000 invested at the beginning of the most recent six-month period and held for the entire period.
Please note that the fund has three share classes: The original share class (Investor Class) charges no distribution and service (12b-1) fee, the Advisor Class shares are offered only through unaffiliated brokers and other financial intermediaries and charge a 0.25% 12b-1 fee, and I Class shares are available to institutionally oriented clients and impose no 12b-1 or administrative fee payment. Each share class is presented separately in the table.
Actual Expenses
The first line of the following table (Actual) provides information about actual account values and expenses based on the fund’s actual returns. You may use the information on this line, together with your account balance, to estimate the expenses that you paid over the period. Simply divide your account value by $1,000 (for example, an $8,600 account value divided by $1,000 = 8.6), then multiply the result by the number on the first line under the heading “Expenses Paid During Period” to estimate the expenses you paid on your account during this period.
Hypothetical Example for Comparison Purposes
The information on the second line of the table (Hypothetical) is based on hypothetical account values and expenses derived from the fund’s actual expense ratio and an assumed 5% per year rate of return before expenses (not the fund’s actual return). You may compare the ongoing costs of investing in the fund with other funds by contrasting this 5% hypothetical example and the 5% hypothetical examples that appear in the shareholder reports of the other funds. The hypothetical account values and expenses may not be used to estimate the actual ending account balance or expenses you paid for the period.
Note: T. Rowe Price charges an annual account service fee of $20, generally for accounts with less than $10,000. The fee is waived for any investor whose T. Rowe Price mutual fund accounts total $50,000 or more; accounts electing to receive electronic delivery of account statements, transaction confirmations, prospectuses, and shareholder reports; or accounts of an investor who is a T. Rowe Price Personal Services or Enhanced Personal Services client (enrollment in these programs generally requires T. Rowe Price assets of at least $250,000). This fee is not included in the accompanying table. If you are subject to the fee, keep it in mind when you are estimating the ongoing expenses of investing in the fund and when comparing the expenses of this fund with other funds.
You should also be aware that the expenses shown in the table highlight only your ongoing costs and do not reflect any transaction costs, such as redemption fees or sales loads. Therefore, the second line of the table is useful in comparing ongoing costs only and will not help you determine the relative total costs of owning different funds. To the extent a fund charges transaction costs, however, the total cost of owning that fund is higher.

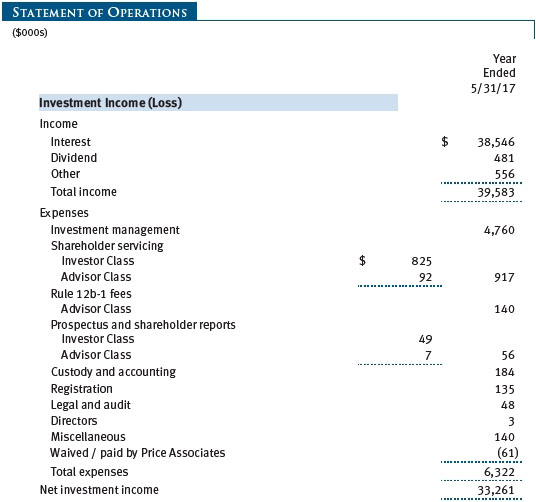
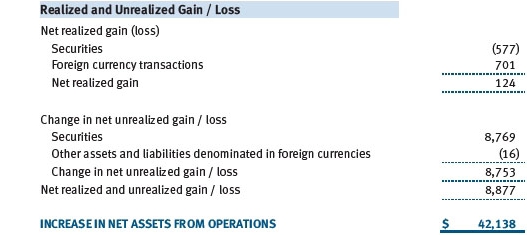
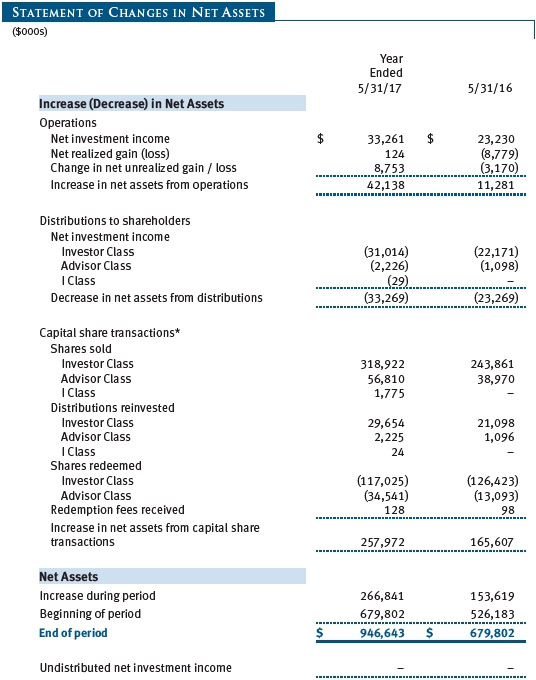
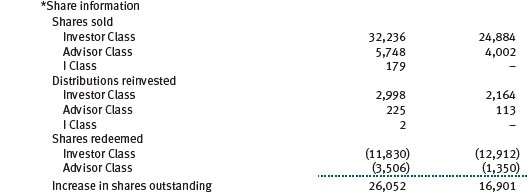
The accompanying notes are an integral part of these financial statements.

The accompanying notes are an integral part of these financial statements.
The accompanying notes are an integral part of these financial statements.


The accompanying notes are an integral part of these financial statements.
The accompanying notes are an integral part of these financial statements.
The accompanying notes are an integral part of these financial statements.
The accompanying notes are an integral part of these financial statements.
| Notes to Financial Statements |
T. Rowe Price Floating Rate Fund (the fund), is registered under the Investment Company Act of 1940 (the 1940 Act) as a diversified, open-end management investment company. The fund seeks high current income and, secondarily, capital appreciation. The fund has three classes of shares: the Floating Rate Fund (Investor Class), the Floating Rate Fund–Advisor Class (Advisor Class), and the Floating Rate Fund–I Class (I Class). Advisor Class shares are sold only through unaffiliated brokers and other unaffiliated financial intermediaries. I Class shares generally are available only to investors meeting a $1,000,000 minimum investment or certain other criteria. The Advisor Class operates under a Board-approved Rule 12b-1 plan pursuant to which the class compensates financial intermediaries for distribution, shareholder servicing, and/or certain administrative services; the Investor and I Classes do not pay Rule 12b-1 fees. Each class has exclusive voting rights on matters related solely to that class; separate voting rights on matters that relate to all classes; and, in all other respects, the same rights and obligations as the other classes.
NOTE 1 - SIGNIFICANT ACCOUNTING POLICIES
Basis of Preparation The fund is an investment company and follows accounting and reporting guidance in the Financial Accounting Standards Board (FASB) Accounting Standards Codification Topic 946 (ASC 946). The accompanying financial statements were prepared in accordance with accounting principles generally accepted in the United States of America (GAAP), including, but not limited to, ASC 946. GAAP requires the use of estimates made by management. Management believes that estimates and valuations are appropriate; however, actual results may differ from those estimates, and the valuations reflected in the accompanying financial statements may differ from the value ultimately realized upon sale or maturity.
Investment Transactions, Investment Income, and Distributions Income and expenses are recorded on the accrual basis. Premiums and discounts on debt securities are amortized for financial reporting purposes. Paydown gains and losses are recorded as an adjustment to interest income. Dividends received from mutual fund investments are reflected as dividend income; capital gain distributions are reflected as realized gain/loss. Dividend income and capital gain distributions are recorded on the ex-dividend date. Income tax-related interest and penalties, if incurred, would be recorded as income tax expense. Investment transactions are accounted for on the trade date. Realized gains and losses are reported on the identified cost basis. Income distributions are declared by each class daily and paid monthly. Distributions to shareholders are recorded on the ex-dividend date.
Currency Translation Assets, including investments, and liabilities denominated in foreign currencies are translated into U.S. dollar values each day at the prevailing exchange rate, using the mean of the bid and asked prices of such currencies against U.S. dollars as quoted by a major bank. Purchases and sales of securities, income, and expenses are translated into U.S. dollars at the prevailing exchange rate on the date of the transaction. The effect of changes in foreign currency exchange rates on realized and unrealized security gains and losses is reflected as a component of security gains and losses.
Class Accounting Shareholder servicing, prospectus, and shareholder report expenses incurred by each class are charged directly to the class to which they relate. Expenses common to all classes and investment income are allocated to the classes based upon the relative daily net assets of each class’s settled shares; realized and unrealized gains and losses are allocated based upon the relative daily net assets of each class’s outstanding shares. The Advisor Class pays Rule 12b-1 fees, in an amount not exceeding 0.25% of the class’s average daily net assets.
Redemption Fees A 2% fee is assessed on redemptions of fund shares held for 90 days or less to deter short-term trading and to protect the interests of long-term shareholders. Redemption fees are withheld from proceeds that shareholders receive from the sale or exchange of fund shares. The fees are paid to the fund and are recorded as an increase to paid-in capital. The fees may cause the redemption price per share to differ from the net asset value per share.
New Accounting Guidance In October 2016, the Securities and Exchange Commission (SEC) issued a new rule, Investment Company Reporting Modernization, which, among other provisions, amends Regulation S-X to require standardized, enhanced disclosures, particularly related to derivatives, in investment company financial statements. Compliance with the guidance is effective for financial statements related to periods ending on or after August 1, 2017; adoption will have no effect on the fund’s net assets or results of operations.
NOTE 2 - VALUATION
The fund’s financial instruments are valued and each class’s net asset value (NAV) per share is computed at the close of the New York Stock Exchange (NYSE), normally 4 p.m. ET, each day the NYSE is open for business. However, the NAV per share may be calculated at a time other than the normal close of the NYSE if trading on the NYSE is restricted, if the NYSE closes earlier, or as may be permitted by the SEC.
Fair Value The fund’s financial instruments are reported at fair value, which GAAP defines as the price that would be received to sell an asset or paid to transfer a liability in an orderly transaction between market participants at the measurement date. The T. Rowe Price Valuation Committee (the Valuation Committee) is an internal committee that has been delegated certain responsibilities by the fund’s Board of Directors (the Board) to ensure that financial instruments are appropriately priced at fair value in accordance with GAAP and the 1940 Act. Subject to oversight by the Board, the Valuation Committee develops and oversees pricing-related policies and procedures and approves all fair value determinations. Specifically, the Valuation Committee establishes procedures to value securities; determines pricing techniques, sources, and persons eligible to effect fair value pricing actions; oversees the selection, services, and performance of pricing vendors; oversees valuation-related business continuity practices; and provides guidance on internal controls and valuation-related matters. The Valuation Committee reports to the Board and has representation from legal, portfolio management and trading, operations, risk management, and the fund’s treasurer.
Various valuation techniques and inputs are used to determine the fair value of financial instruments. GAAP establishes the following fair value hierarchy that categorizes the inputs used to measure fair value:
Level 1 – quoted prices (unadjusted) in active markets for identical financial instruments that the fund can access at the reporting date
Level 2 – inputs other than Level 1 quoted prices that are observable, either directly or indirectly (including, but not limited to, quoted prices for similar financial instruments in active markets, quoted prices for identical or similar financial instruments in inactive markets, interest rates and yield curves, implied volatilities, and credit spreads)
Level 3 – unobservable inputs
Observable inputs are developed using market data, such as publicly available information about actual events or transactions, and reflect the assumptions that market participants would use to price the financial instrument. Unobservable inputs are those for which market data are not available and are developed using the best information available about the assumptions that market participants would use to price the financial instrument. GAAP requires valuation techniques to maximize the use of relevant observable inputs and minimize the use of unobservable inputs. When multiple inputs are used to derive fair value, the financial instrument is assigned to the level within the fair value hierarchy based on the lowest-level input that is significant to the fair value of the financial instrument. Input levels are not necessarily an indication of the risk or liquidity associated with financial instruments at that level but rather the degree of judgment used in determining those values.
Valuation Techniques Debt securities generally are traded in the over-the-counter (OTC) market. Securities with remaining maturities of one year or more at the time of acquisition are valued at prices furnished by dealers who make markets in such securities or by an independent pricing service, which considers the yield or price of bonds of comparable quality, coupon, maturity, and type, as well as prices quoted by dealers who make markets in such securities. Securities with remaining maturities of less than one year at the time of acquisition generally use amortized cost in local currency to approximate fair value. However, if amortized cost is deemed not to reflect fair value or the fund holds a significant amount of such securities with remaining maturities of more than 60 days, the securities are valued at prices furnished by dealers who make markets in such securities or by an independent pricing service. Generally, debt securities are categorized in Level 2 of the fair value hierarchy; however, to the extent the valuations include significant unobservable inputs, the securities would be categorized in Level 3.
Investments in mutual funds are valued at the mutual fund’s closing NAV per share on the day of valuation and are categorized in Level 1 of the fair value hierarchy. Forward currency exchange contracts are valued using the prevailing forward exchange rate and are categorized in Level 2 of the fair value hierarchy. Assets and liabilities other than financial instruments, including short-term receivables and payables, are carried at cost, or estimated realizable value, if less, which approximates fair value.
Thinly traded financial instruments and those for which the above valuation procedures are inappropriate or are deemed not to reflect fair value are stated at fair value as determined in good faith by the Valuation Committee. The objective of any fair value pricing determination is to arrive at a price that could reasonably be expected from a current sale. Financial instruments fair valued by the Valuation Committee are primarily private placements, restricted securities, warrants, rights, and other securities that are not publicly traded.
Subject to oversight by the Board, the Valuation Committee regularly makes good faith judgments to establish and adjust the fair valuations of certain securities as events occur and circumstances warrant. For instance, in determining the fair value of troubled or thinly traded debt instruments, the Valuation Committee considers a variety of factors, which may include, but are not limited to, the issuer’s business prospects, its financial standing and performance, recent investment transactions in the issuer, strategic events affecting the company, market liquidity for the issuer, and general economic conditions and events. In consultation with the investment and pricing teams, the Valuation Committee will determine an appropriate valuation technique based on available information, which may include both observable and unobservable inputs. The Valuation Committee typically will afford greatest weight to actual prices in arm’s length transactions, to the extent they represent orderly transactions between market participants, transaction information can be reliably obtained, and prices are deemed representative of fair value. However, the Valuation Committee may also consider other valuation methods such as a discount or premium from market value of a similar, freely traded security of the same issuer; discounted cash flows; yield to maturity; or some combination. Fair value determinations are reviewed on a regular basis and updated as information becomes available, including actual purchase and sale transactions of the issue. Because any fair value determination involves a significant amount of judgment, there is a degree of subjectivity inherent in such pricing decisions, and fair value prices determined by the Valuation Committee could differ from those of other market participants. Depending on the relative significance of unobservable inputs, including the valuation technique(s) used, fair valued securities may be categorized in Level 2 or 3 of the fair value hierarchy.
Valuation Inputs The following table summarizes the fund’s financial instruments, based on the inputs used to determine their fair values on May 31, 2017:
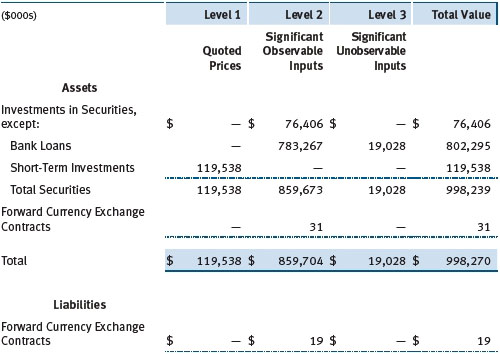
There were no material transfers between Levels 1 and 2 during the year ended May 31, 2017.
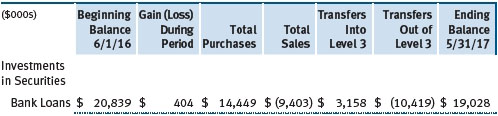
Following is a reconciliation of the fund’s Level 3 holdings for the year ended May 31, 2017. Gain (loss) reflects both realized and change in unrealized gain/loss on Level 3 holdings during the period, if any, and is included on the accompanying Statement of Operations. The change in unrealized gain/loss on Level 3 instruments held at May 31, 2017, totaled $275,000 for the year ended May 31, 2017. Transfers into and out of Level 3 are reflected at the value of the financial instrument at the beginning of the period. During the year, transfers into Level 3 resulted from a lack of observable market data for the security and transfers out of Level 3 were because observable market data became available for the security.
NOTE 3 - DERIVATIVE INSTRUMENTS
During the year ended May 31, 2017, the fund invested in derivative instruments. As defined by GAAP, a derivative is a financial instrument whose value is derived from an underlying security price, foreign exchange rate, interest rate, index of prices or rates, or other variable; it requires little or no initial investment and permits or requires net settlement. The fund invests in derivatives only if the expected risks and rewards are consistent with its investment objectives, policies, and overall risk profile, as described in its prospectus and Statement of Additional Information. The fund may use derivatives for a variety of purposes, such as seeking to hedge against declines in principal value, increase yield, invest in an asset with greater efficiency and at a lower cost than is possible through direct investment, or to adjust portfolio duration and credit exposure. The risks associated with the use of derivatives are different from, and potentially much greater than, the risks associated with investing directly in the instruments on which the derivatives are based. The fund at all times maintains sufficient cash reserves, liquid assets, or other SEC-permitted asset types to cover its settlement obligations under open derivative contracts.
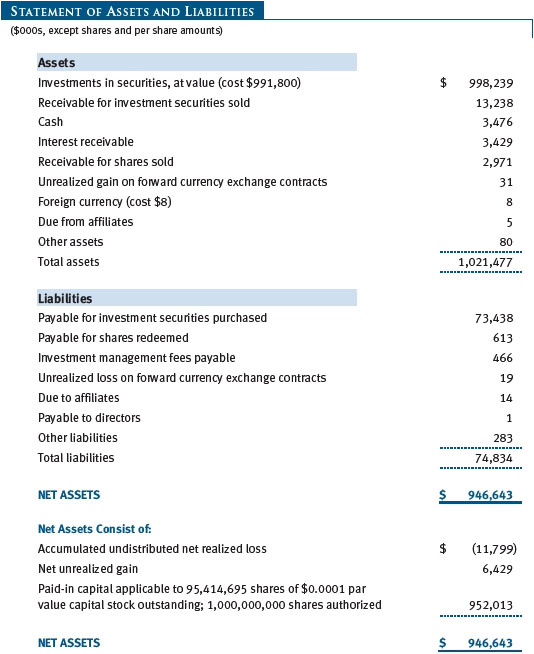
The fund values its derivatives at fair value and recognizes changes in fair value currently in its results of operations. Accordingly, the fund does not follow hedge accounting, even for derivatives employed as economic hedges. Generally, the fund accounts for its derivatives on a gross basis. It does not offset the fair value of derivative liabilities against the fair value of derivative assets on its financial statements, nor does it offset the fair value of derivative instruments against the right to reclaim or obligation to return collateral. As of May 31, 2017, the fund held foreign exchange derivatives with a fair value of $31,000, included in unrealized gain on forward currency exchange contracts, and $19,000, included in unrealized loss on forward currency exchange contracts, on the accompanying Statement of Assets and Liabilities.
Additionally, during the year ended May 31, 2017, the fund recognized $273,000 of realized gain on Foreign Currency Transactions and a $30,000 change in unrealized gain/loss on Foreign Currency Transactions related to its investments in interest rate derivatives; such amounts are included on the accompanying Statement of Operations.
Counterparty Risk and Collateral The fund invests in derivatives, such as bilateral swaps, forward currency exchange contracts, or OTC options, that are transacted and settle directly with a counterparty (bilateral derivatives), and thereby expose the fund to counterparty risk. To mitigate this risk, the fund has entered into master netting arrangements (MNAs) with certain counterparties that permit net settlement under specified conditions and, for certain counterparties, also require the exchange of collateral to cover mark-to-market exposure. MNAs may be in the form of International Swaps and Derivatives Association master agreements (ISDAs) or foreign exchange letter agreements (FX letters).
MNAs govern the ability to offset amounts the fund owes a counterparty against amounts the counterparty owes the fund (net settlement). Both ISDAs and FX letters generally allow termination of transactions and net settlement upon the occurrence of contractually specified events, such as failure to pay or bankruptcy. In addition, ISDAs specify other events, the occurrence of which would allow one of the parties to terminate. For example, a downgrade in credit rating of a counterparty would allow the fund to terminate while a decline in the fund’s net assets of more than a specified percentage would allow the counterparty to terminate. Upon termination, all transactions with that counterparty would be liquidated and a net termination amount determined. ISDAs include collateral agreements whereas FX letters do not. Collateral requirements are determined daily based on the net aggregate unrealized gain or loss on all bilateral derivatives with each counterparty, subject to minimum transfer amounts that typically range from $100,000 to $250,000. Any additional collateral required due to changes in security values is typically transferred the same business day.
Collateral may be in the form of cash or debt securities issued by the U.S. government or related agencies. Cash posted by the fund is reflected as cash deposits in the accompanying financial statements and generally is restricted from withdrawal by the fund; securities posted by the fund are so noted in the accompanying Portfolio of Investments; both remain in the fund’s assets. Collateral pledged by counterparties is not included in the fund’s assets because the fund does not obtain effective control over those assets. For bilateral derivatives, collateral posted or received by the fund is held in a segregated account at the fund’s custodian. As of May 31, 2017, no collateral was pledged by either the fund or counterparties for bilateral derivatives.
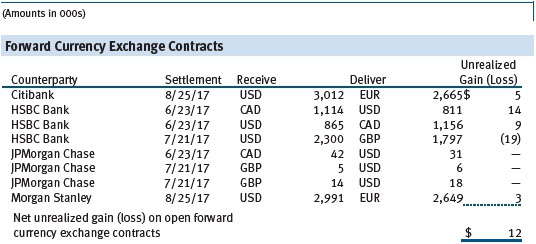
Forward Currency Exchange Contracts The fund is subject to foreign currency exchange rate risk in the normal course of pursuing its investment objectives. It uses forward currency exchange contracts (forwards) primarily to protect its non-U.S. dollar-denominated securities from adverse currency movements relative to the U.S. dollar. A forward involves an obligation to purchase or sell a fixed amount of a specific currency on a future date at a price set at the time of the contract. Although certain forwards may be settled by exchanging only the net gain or loss on the contract, most forwards are settled with the exchange of the underlying currencies in accordance with the specified terms. Forwards are valued at the unrealized gain or loss on the contract, which reflects the net amount the fund either is entitled to receive or obligated to deliver, as measured by the difference between the forward exchange rates at the date of entry into the contract and the forward rates at the reporting date. Appreciated forwards are reflected as assets and depreciated forwards are reflected as liabilities on the accompanying Statement of Assets and Liabilities. Risks related to the use of forwards include the possible failure of counterparties to meet the terms of the agreements; that anticipated currency movements will not occur, thereby reducing the fund’s total return; and the potential for losses in excess of the fund’s initial investment. During the year ended May 31, 2017, the volume of the fund’s activity in forwards, based on underlying notional amounts, was generally between 0% and 2% of net assets.
NOTE 4 - OTHER INVESTMENT TRANSACTIONS
Consistent with its investment objective, the fund engages in the following practices to manage exposure to certain risks and/or to enhance performance. The investment objective, policies, program, and risk factors of the fund are described more fully in the fund’s prospectus and Statement of Additional Information.
Noninvestment-Grade Debt At May 31, 2017, approximately 90% of the fund’s net assets were invested, either directly or through its investment in T. Rowe Price institutional funds, in noninvestment-grade debt, including “high yield” or “junk” bonds or leveraged loans. The noninvestment-grade debt market may experience sudden and sharp price swings due to a variety of factors, including changes in economic forecasts, stock market activity, large sustained sales by major investors, a high-profile default, or a change in market sentiment. These events may decrease the ability of issuers to make principal and interest payments and adversely affect the liquidity or value, or both, of such securities. Investments in noninvestment-grade holdings may be considered speculative.
Restricted Securities The fund may invest in securities that are subject to legal or contractual restrictions on resale. Prompt sale of such securities at an acceptable price may be difficult and may involve substantial delays and additional costs.
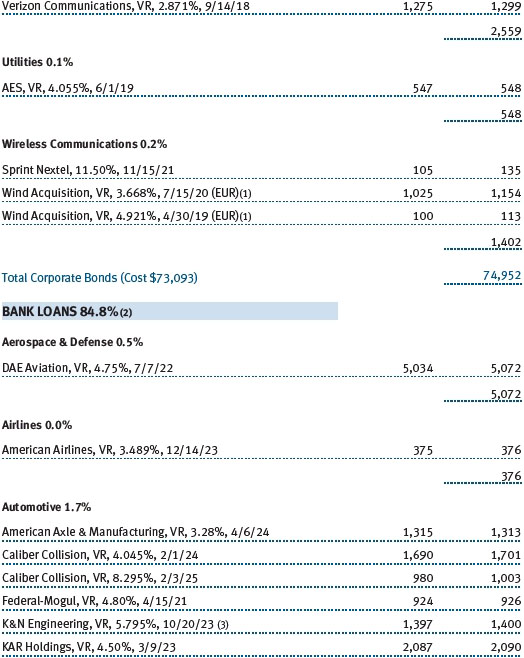
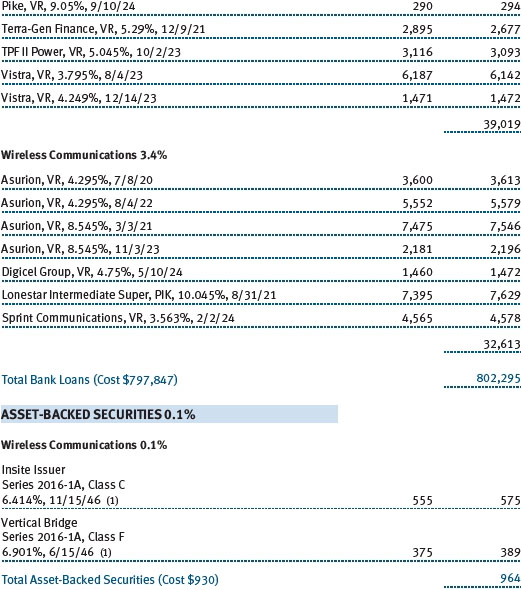
Bank Loans The fund may invest in bank loans, which represent an interest in amounts owed by a borrower to a syndicate of lenders. Bank loans are generally noninvestment grade and often involve borrowers whose financial condition is highly leveraged. Bank loans may be in the form of either assignments or participations. A loan assignment transfers all legal, beneficial, and economic rights to the buyer, and transfer typically requires consent of both the borrower and agent. In contrast, a loan participation generally entitles the buyer to receive the cash flows from principal, interest, and any fee payments on a portion of a loan; however, the seller continues to hold legal title to that portion of the loan. As a result, the buyer of a loan participation generally has no direct recourse against the borrower and is exposed to credit risk of both the borrower and seller of the participation. Bank loans often have extended settlement periods, usually may be repaid at any time at the option of the borrower, and may require additional principal to be funded at the borrowers’ discretion at a later date (unfunded commitments). Until settlement, the fund maintains liquid assets sufficient to settle its unfunded loan commitments. The fund reflects both the funded portion of a bank loan as well as its unfunded commitment in the Portfolio of Investments. However, if a credit agreement provides no initial funding of a tranche, and funding of the full commitment at a future date(s) is at the borrower’s discretion and considered uncertain, a loan is reflected in the Portfolio of Investments only if, and only to the extent that, the fund has actually settled a funding commitment. At May 31, 2017, the fund’s total unfunded commitments not included in the Portfolio of Investments were $5,130,000.
Other Purchases and sales of portfolio securities other than short-term securities aggregated $660,142,000 and $421,943,000, respectively, for the year ended May 31, 2017.
NOTE 5 - FEDERAL INCOME TAXES
No provision for federal income taxes is required since the fund intends to continue to qualify as a regulated investment company under Subchapter M of the Internal Revenue Code and distribute to shareholders all of its taxable income and gains. Distributions determined in accordance with federal income tax regulations may differ in amount or character from net investment income and realized gains for financial reporting purposes. Financial reporting records are adjusted for permanent book/tax differences to reflect tax character but are not adjusted for temporary differences.
The fund files U.S. federal, state, and local tax returns as required. The fund’s tax returns are subject to examination by the relevant tax authorities until expiration of the applicable statute of limitations, which is generally three years after the filing of the tax return but which can be extended to six years in certain circumstances. Tax returns for open years have incorporated no uncertain tax positions that require a provision for income taxes.
Reclassifications between income and gain relate primarily to the recharacterization of distributions. For the year ended May 31, 2017, the following reclassifications were recorded to reflect tax character (there was no impact on results of operations or net assets):

Distributions during the years ended May 31, 2017 and May 31, 2016, totaled $33,269,000 and $23,269,000, respectively, and were characterized as ordinary income for tax purposes. At May 31, 2017, the tax-basis cost of investments and components of net assets were as follows:
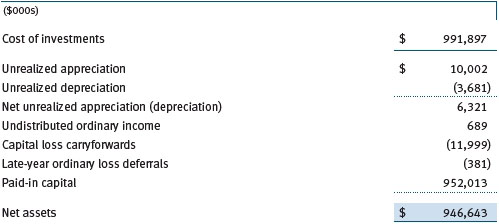
The fund intends to retain realized gains to the extent of available capital loss carryforwards. Net realized capital losses may be carried forward indefinitely to offset future realized capital gains. During the year ended May 31 2017, the fund utilized $85,000 of capital loss carryforwards.
In accordance with federal tax laws applicable to investment companies, all or a portion of net losses resulting from (a) specified gains and losses realized between November 1 and the fund’s fiscal year-end plus (b) ordinary income or loss realized between January 1 and the fund’s fiscal year-end are not recognized for tax purposes until the subsequent year (late-year ordinary loss deferrals); however, such losses are recognized for financial reporting purposes in the year realized.
NOTE 6 - RELATED PARTY TRANSACTIONS
The fund is managed by T. Rowe Price Associates, Inc. (Price Associates), a wholly owned subsidiary of T. Rowe Price Group, Inc. (Price Group). The investment management agreement between the fund and Price Associates provides for an annual investment management fee, which is computed daily and paid monthly. The fee consists of an individual fund fee, equal to 0.30% of the fund’s average daily net assets, and a group fee. The group fee rate is calculated based on the combined net assets of certain mutual funds sponsored by Price Associates (the group) applied to a graduated fee schedule, with rates ranging from 0.48% for the first $1 billion of assets to 0.265% for assets in excess of $650 billion. The fund’s group fee is determined by applying the group fee rate to the fund’s average daily net assets. At May 31, 2017, the effective annual group fee rate was 0.29%.
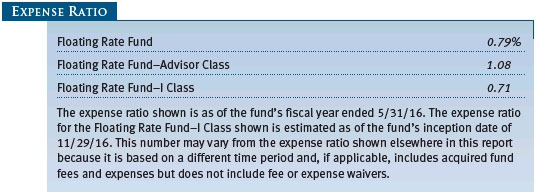
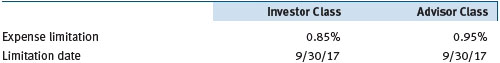
The Investor Class and Advisor Class are each subject to a contractual expense limitation through the limitation dates indicated in the table below. During the limitation period, Price Associates is required to waive its management fee or pay any expenses (excluding interest, expenses related to borrowings, taxes, brokerage, and other non-recurring expenses permitted by the investment management agreement) that would otherwise cause the class’s ratio of annualized total expenses to average net assets (expense ratio) to exceed its expense limitation. Each class is required to repay Price Associates for expenses previously waived/paid to the extent the class’s net assets grow or expenses decline sufficiently to allow repayment without causing the class’s expense ratio to exceed its expense limitation in effect at the time of the waiver. However, no repayment will be made more than three years after the date of a payment or waiver. For the year ended May 31, 2017, the Investor Class operated below its expense limitation.
The I Class is also subject to an operating expense limitation (I Class limit) pursuant to which Price Associates is contractually required to pay all operating expenses of the I Class, excluding management fees, interest, expenses related to borrowings, taxes, brokerage, and other non-recurring expenses permitted by the investment management agreement, to the extent such operating expenses, on an annualized basis, exceed 0.05% of average net assets. This agreement will continue until September 30, 2019, and may be renewed, revised, or revoked only with approval of the fund’s Board. The I Class is required to repay Price Associates for expenses previously paid to the extent the class’s net assets grow or expenses decline sufficiently to allow repayment without causing the class’s operating expenses to exceed the I Class limit in effect at the time of the waiver. However, no repayment will be made more than three years after the date of a payment or waiver.
Pursuant to these agreements, $61,000 of expenses were waived/paid by Price Associates during the year ended May 31, 2017. Including these amounts, expenses previously waived/paid by Price Associates in the amount of $119,000 remain subject to repayment by the fund at May 31, 2017.
In addition, the fund has entered into service agreements with Price Associates and two wholly owned subsidiaries of Price Associates (collectively, Price). Price Associates provides certain accounting and administrative services to the fund. T. Rowe Price Services, Inc. provides shareholder and administrative services in its capacity as the fund’s transfer and dividend-disbursing agent. T. Rowe Price Retirement Plan Services, Inc. provides subaccounting and record-keeping services for certain retirement accounts invested in the Investor Class and I Class. For the year ended May 31, 2017, expenses incurred pursuant to these service agreements were $81,000 for Price Associates; $145,000 for T. Rowe Price Services, Inc.; and $4,000 for T. Rowe Price Retirement Plan Services, Inc. The total amount payable at period-end pursuant to these service agreements is reflected as Due to Affiliates in the accompanying financial statements.
The fund is also one of several mutual funds sponsored by Price Associates (underlying Price funds) in which the T. Rowe Price Spectrum Funds (Spectrum Funds) may invest. None of the Spectrum Funds invest in the underlying Price funds for the purpose of exercising management or control. Pursuant to a special servicing agreement, expenses associated with the operation of the Spectrum Funds are borne by each underlying Price fund to the extent of estimated savings to it and in proportion to the average daily value of its shares owned by the Spectrum Funds. Expenses allocated under this agreements are reflected as shareholder servicing expense in the accompanying financial statements. For the year ended May 31, 2017, the fund was allocated $415,000 of Spectrum Funds’ expenses. Of these amounts, $283,000 related to services provided by Price. At period-end, the amount payable to Price pursuant to this agreements is reflected as Due to Affiliates in the accompanying financial statements. At May 31, 2017, approximately 41% of the outstanding shares of the Investor Class were held by the Spectrum Funds.
The fund may invest in the T. Rowe Price Government Reserve Fund, the T. Rowe Price Treasury Reserve Fund, or the T. Rowe Price Short-Term Fund (collectively, the Price Reserve Funds), open-end management investment companies managed by Price Associates and considered affiliates of the fund. The Price Reserve Funds are offered as short-term investment options to mutual funds, trusts, and other accounts managed by Price Associates or its affiliates and are not available for direct purchase by members of the public. The Price Reserve Funds pay no investment management fees.
As of May 31, 2017, T. Rowe Price Group, Inc., or its wholly owned subsidiaries owned 25,329 shares of the I Class, representing 14% of the I Class’s net assets.
The fund may participate in securities purchase and sale transactions with other funds or accounts advised by Price Associates (cross trades), in accordance with procedures adopted by the fund’s Board and Securities and Exchange Commission rules, which require, among other things, that such purchase and sale cross trades be effected at the independent current market price of the security. During the year ended May 31, 2017, the fund had no purchases or sales cross trades with other funds or accounts advised by Price Associates.
NOTE 7 - BORROWING
The fund may borrow to provide temporary liquidity. The fund, along with several other T. Rowe Price-sponsored mutual funds (collectively, the participating funds), has entered into a $575 million, 364-day, syndicated credit facility (the facility) pursuant to which the participating funds may borrow on a first-come, first-served basis up to the full amount of the facility. Interest is charged to the borrowing fund at a rate equal to 1.00% plus the Federal Funds rate. A commitment fee, equal to 0.15% per annum of the average daily undrawn commitment is accrued daily and paid quarterly; legal and administrative fees are recognized as incurred. All fees are allocated to the participating funds based on each fund’s relative net assets and are reflected as a component of interest expense in the accompanying financial statements. Loans are generally unsecured; however, the fund must collateralize any borrowings under the facility on an equivalent basis if it has other collateralized borrowings. During the year ended May 31, 2017, the fund incurred $99,000 in commitment fees. At May 31, 2017, the fund had no borrowings outstanding under the facility, and the undrawn amount of the facility was $575,000,000.
| Report of Independent Registered Public Accounting Firm |
To the Board of Directors and Shareholders of
T. Rowe Price Floating Rate Fund, Inc.
In our opinion, the accompanying statement of assets and liabilities, including the portfolio of investments, and the related statements of operations and of changes in net assets and the financial highlights present fairly, in all material respects, the financial position of the T. Rowe Price Floating Rate Fund, Inc. (the “Fund”) as of May 31, 2017, the results of its operations for the year then ended, the changes in its net assets for each of the two years in the period then ended and the financial highlights for each of the periods indicated therein, in conformity with accounting principles generally accepted in the United States of America. These financial statements and financial highlights (hereafter referred to as “financial statements”) are the responsibility of the Fund’s management. Our responsibility is to express an opinion on these financial statements based on our audits. We conducted our audits of these financial statements in accordance with the standards of the Public Company Accounting Oversight Board (United States). Those standards require that we plan and perform the audit to obtain reasonable assurance about whether the financial statements are free of material misstatement. An audit includes examining, on a test basis, evidence supporting the amounts and disclosures in the financial statements, assessing the accounting principles used and significant estimates made by management, and evaluating the overall financial statement presentation. We believe that our audits, which included confirmation of securities as of May 31, 2017 by correspondence with the custodian and brokers, and confirmation of the underlying funds by correspondence with the transfer agent, provide a reasonable basis for our opinion.
PricewaterhouseCoopers LLP
Baltimore, Maryland
July 19, 2017
| Tax Information (Unaudited) for the Tax Year Ended 5/31/17 |
We are providing this information as required by the Internal Revenue Code. The amounts shown may differ from those elsewhere in this report because of differences between tax and financial reporting requirements.
The fund’s distributions to shareholders included $8,000 from short-term capital gains.
| Information on Proxy Voting Policies, Procedures, and Records |
A description of the policies and procedures used by T. Rowe Price funds and portfolios to determine how to vote proxies relating to portfolio securities is available in each fund’s Statement of Additional Information. You may request this document by calling 1-800-225-5132 or by accessing the SEC’s website, sec.gov.
The description of our proxy voting policies and procedures is also available on our corporate website. To access it, please visit the following Web page:
https://www3.troweprice.com/usis/corporate/en/utility/policies.html
Scroll down to the section near the bottom of the page that says, “Proxy Voting Policies.” Click on the Proxy Voting Policies link in the shaded box.
Each fund’s most recent annual proxy voting record is available on our website and through the SEC’s website. To access it through T. Rowe Price, visit the website location shown above, and scroll down to the section near the bottom of the page that says, “Proxy Voting Records.” Click on the Proxy Voting Records link in the shaded box.
| How to Obtain Quarterly Portfolio Holdings |
The fund files a complete schedule of portfolio holdings with the Securities and Exchange Commission for the first and third quarters of each fiscal year on Form N-Q. The fund’s Form N-Q is available electronically on the SEC’s website (sec.gov); hard copies may be reviewed and copied at the SEC’s Public Reference Room, 100 F St. N.E., Washington, DC 20549. For more information on the Public Reference Room, call 1-800-SEC-0330.
| Approval of Investment Management Agreement |
Each year, the fund’s Board of Directors (Board) considers the continuation of the investment management agreement (Advisory Contract) between the fund and its investment advisor, T. Rowe Price Associates, Inc. (Advisor). In that regard, at an in-person meeting held on March 6–7, 2017 (Meeting), the Board, including a majority of the fund’s independent directors, approved the continuation of the fund’s Advisory Contract. At the Meeting, the Board considered the factors and reached the conclusions described below relating to the selection of the Advisor and the approval of the Advisory Contract. The independent directors were assisted in their evaluation of the Advisory Contract by independent legal counsel from whom they received separate legal advice and with whom they met separately.
In providing information to the Board, the Advisor was guided by a detailed set of requests for information submitted by independent legal counsel on behalf of the independent directors. In considering and approving the Advisory Contract, the Board considered the information it believed was relevant, including, but not limited to, the information discussed below. The Board considered not only the specific information presented in connection with the Meeting but also the knowledge gained over time through interaction with the Advisor about various topics. The Board meets regularly and, at each of its meetings, covers an extensive agenda of topics and materials and considers factors that are relevant to its annual consideration of the renewal of the T. Rowe Price funds’ advisory contracts, including performance and the services and support provided to the funds and their shareholders.
Services Provided by the Advisor
The Board considered the nature, quality, and extent of the services provided to the fund by the Advisor. These services included, but were not limited to, directing the fund’s investments in accordance with its investment program and the overall management of the fund’s portfolio, as well as a variety of related activities such as financial, investment operations, and administrative services; compliance; maintaining the fund’s records and registrations; and shareholder communications. The Board also reviewed the background and experience of the Advisor’s senior management team and investment personnel involved in the management of the fund, as well as the Advisor’s compliance record. The Board concluded that it was satisfied with the nature, quality, and extent of the services provided by the Advisor.
Investment Performance of the Fund
The Board took into account discussions with the Advisor and reports that it receives throughout the year relating to fund performance. In connection with the Meeting, the Board reviewed the fund’s net annualized total returns for the 1-, 2-, 3-, 4-, and 5-year periods as of September 30, 2016, and compared these returns with the performance of a peer group of funds with similar investment programs and a wide variety of other previously agreed-upon comparable performance measures and market data, including those supplied by Broadridge, which is an independent provider of mutual fund data.
On the basis of this evaluation and the Board’s ongoing review of investment results, and factoring in the relative market conditions during certain of the performance periods, the Board concluded that the fund’s performance was satisfactory.
Costs, Benefits, Profits, and Economies of Scale
The Board reviewed detailed information regarding the revenues received by the Advisor under the Advisory Contract and other benefits that the Advisor (and its affiliates) may have realized from its relationship with the fund, including any research received under “soft dollar” agreements and commission-sharing arrangements with broker-dealers. The Board considered that the Advisor may receive some benefit from soft-dollar arrangements pursuant to which research is received from broker-dealers that execute the fund’s portfolio transactions. The Board received information on the estimated costs incurred and profits realized by the Advisor from managing the T. Rowe Price funds. The Board also reviewed estimates of the profits realized from managing the fund in particular, and the Board concluded that the Advisor’s profits were reasonable in light of the services provided to the fund.
The Board also considered whether the fund benefits under the fee levels set forth in the Advisory Contract from any economies of scale realized by the Advisor. Under the Advisory Contract, the fund pays a fee to the Advisor for investment management services composed of two components—a group fee rate based on the combined average net assets of most of the T. Rowe Price funds (including the fund) that declines at certain asset levels and an individual fund fee rate based on the fund’s average daily net assets—and the fund pays its own expenses of operations (subject to expense limitations agreed to by the Advisor with respect to the fund’s Advisor Class and I Class). At the Meeting, the Board approved an additional 0.005% breakpoint to the group fee schedule, effective May 1, 2017. With the new breakpoint, the group fee rate will decline to 0.265% when the combined average net assets of the applicable T. Rowe Price funds exceed $650 billion. The Board concluded that the advisory fee structure for the fund continued to provide for a reasonable sharing of benefits from any economies of scale with the fund’s investors.
Fees and Expenses
The Board was provided with information regarding industry trends in management fees and expenses. Among other things, the Board reviewed data for peer groups that were compiled by Broadridge, which compared: (i) contractual management fees, total expenses, actual management fees, and non-management expenses of the Investor Class of the fund with a group of competitor funds selected by Broadridge (Investor Class Expense Group); (ii) total expenses and actual management fees of the Advisor Class of the fund with a group of competitor funds selected by Broadridge (Advisor Class Expense Group); and (iii) total expenses, actual management fees, and non-management expenses of the Investor Class of the fund with a broader set of funds within the Lipper investment classification (Expense Universe). The Board considered the fund’s contractual management fee rate, actual management fee rate (which reflects the management fees actually received from the fund by the Advisor after any applicable waivers, reductions, or reimbursements), operating expenses, and total expenses (which reflects the net total expense ratio of the fund after any waivers, reductions, or reimbursements) in comparison with the information for the Broadridge peer groups. Broadridge generally constructed the peer groups by seeking the most comparable funds based on similar investment classifications and objectives, expense structure, asset size, and operating components and attributes and ranked funds into quintiles, with the first quintile representing the funds with the lowest relative expenses and the fifth quintile representing the funds with the highest relative expenses. The information provided to the Board indicated that the fund’s contractual management fee ranked in the fourth quintile (Investor Class Expense Group); the fund’s actual management fee rate ranked in the fourth quintile (Investor Class Expense Group), first quintile (Advisor Class Expense Group), and third quintile (Expense Universe); and the fund’s total expenses ranked in the first and third quintiles (Investor Class Expense Group), first quintile (Advisor Class Expense Group), and second and fourth quintiles (Expense Universe).
The Board also reviewed the fee schedules for institutional accounts and private accounts with similar mandates that are advised or subadvised by the Advisor and its affiliates. Management provided the Board with information about the Advisor’s responsibilities and services provided to subadvisory and other institutional account clients, including information about how the requirements and economics of the institutional business are fundamentally different from those of the mutual fund business. The Board considered information showing that the Advisor’s mutual fund business is generally more complex from a business and compliance perspective than its institutional account business and considered various relevant factors, such as the broader scope of operations and oversight, more extensive shareholder communication infrastructure, greater asset flows, heightened business risks, and differences in applicable laws and regulations associated with the Advisor’s proprietary mutual fund business. In assessing the reasonableness of the fund’s management fee rate, the Board considered the differences in the nature of the services required for the Advisor to manage its mutual fund business versus managing a discrete pool of assets as a subadvisor to another institution’s mutual fund or for an institutional account and that the Advisor generally performs significant additional services and assumes greater risk in managing the fund and other T. Rowe Price funds than it does for institutional account clients.
On the basis of the information provided and the factors considered, the Board concluded that the fees paid by the fund under the Advisory Contract are reasonable.
Approval of the Advisory Contract
As noted, the Board approved the continuation of the Advisory Contract. No single factor was considered in isolation or to be determinative to the decision. Rather, the Board concluded, in light of a weighting and balancing of all factors considered, that it was in the best interests of the fund and its shareholders for the Board to approve the continuation of the Advisory Contract (including the fees to be charged for services thereunder).
| About the Fund’s Directors and Officers |
Your fund is overseen by a Board of Directors (Board) that meets regularly to review a wide variety of matters affecting or potentially affecting the fund, including performance, investment programs, compliance matters, advisory fees and expenses, service providers, and business and regulatory affairs. The Board elects the fund’s officers, who are listed in the final table. At least 75% of the Board’s members are independent of T. Rowe Price Associates, Inc. (T. Rowe Price), and its affiliates; “inside” or “interested” directors are employees or officers of T. Rowe Price. The business address of each director and officer is 100 East Pratt Street, Baltimore, Maryland 21202. The Statement of Additional Information includes additional information about the fund directors and is available without charge by calling a T. Rowe Price representative at 1-800-638-5660.
| Independent Directors | | |
| |
| Name | | |
| (Year of Birth) | | |
| Year Elected* | | |
| [Number of T. Rowe Price | | Principal Occupation(s) and Directorships of Public Companies and |
| Portfolios Overseen] | | Other Investment Companies During the Past Five Years |
| | | |
| Anthony W. Deering | | Chairman, Exeter Capital, LLC, a private investment firm (2004 to |
| (1945) | | present); Director and Advisory Board Member, Deutsche Bank North |
| 2011 | | America (2004 to present); Director, Vornado Real Estate Investment |
| [189] | | Trust (2004 to 2012); Director, Under Armour (2008 to present); |
| | Director, Brixmor Real Estate Investment Trust (2012 to present) |
| | | |
| Bruce W. Duncan | | Chief Executive Officer and Director (2009 to December 2016), |
| (1951) | | Chairman of the Board (January 2016 to present), and President |
| 2013 | | (2009 to September 2016), First Industrial Realty Trust, an owner |
| [189] | | and operator of industrial properties; Chairman of the Board |
| | (2005 to September 2016) and Director (1999 to September |
| | 2016), Starwood Hotels & Resorts, a hotel and leisure company; |
| | Director, Boston Properties (May 2016 to present); Director, Marriott |
| | International, Inc. (September 2016 to present) |
| | | |
| Robert J. Gerrard, Jr. | | Advisory Board Member, Pipeline Crisis/Winning Strategies, a |
| (1952) | | collaborative working to improve opportunities for young African |
| 2013 | | Americans (1997 to present) |
| [189] | | |
| | | |
| Paul F. McBride | | Advisory Board Member, Vizzia Technologies (2015 to present) |
| (1956) | | |
| 2013 | | |
| [189] | | |
| | | |
| Cecilia E. Rouse, Ph.D. | | Dean, Woodrow Wilson School (2012 to present); Professor and |
| (1963) | | Researcher, Princeton University (1992 to present); Member of |
| 2013 | | National Academy of Education (2010 to present); Director, MDRC, |
| [189] | | a nonprofit education and social policy research organization (2011 |
| | to present); Research Associate of Labor Studies Program (2011 |
| | to 2015) and Board Member (2015 to present), National Bureau |
| | of Economic Research (2011 to present); Chair of Committee |
| | on the Status of Minority Groups in the Economic Profession |
| | (2012 to present); Vice President (2015 to present), American |
| | Economic Association |
| | | |
| John G. Schreiber | | Owner/President, Centaur Capital Partners, Inc., a real estate |
| (1946) | | investment company (1991 to present); Cofounder, Partner, and |
| 2011 | | Cochairman of the Investment Committee, Blackstone Real Estate |
| [189] | | Advisors, L.P. (1992 to 2015); Director, General Growth Properties, |
| | Inc. (2010 to 2013); Director, Blackstone Mortgage Trust, a real |
| | estate finance company (2012 to 2016); Director and Chairman of |
| | the Board, Brixmor Property Group, Inc. (2013 to present); Director, |
| | Hilton Worldwide (2013 to present); Director, Hudson Pacific |
| | Properties (2014 to 2016) |
| | | |
| Mark R. Tercek | | President and Chief Executive Officer, The Nature Conservancy (2008 |
| (1957) | | to present) |
| 2011 | | |
| [189] | | |
| |
| *Each independent director serves until retirement, resignation, or election of a successor. |
| Inside Directors | | |
| |
| Name | | |
| (Year of Birth) | | |
| Year Elected* | | |
| [Number of T. Rowe Price | | Principal Occupation(s) and Directorships of Public Companies and |
| Portfolios Overseen] | | Other Investment Companies During the Past Five Years |
| | | |
| Edward C. Bernard | | Director and Vice President, T. Rowe Price; Vice Chairman of the |
| (1956) | | Board, Director, and Vice President, T. Rowe Price Group, Inc.; |
| 2011 | | Chairman of the Board, Director, and President, T. Rowe Price |
| [189] | | Investment Services, Inc.; Chairman of the Board and Director, |
| | T. Rowe Price Retirement Plan Services, Inc., and T. Rowe Price |
| | Services, Inc.; Chairman of the Board, Chief Executive Officer, |
| | Director, and President, T. Rowe Price International and T. Rowe |
| | | Price Trust Company; Chairman of the Board, all funds |
| | | |
| Edward A. Wiese, CFA | | Vice President, T. Rowe Price, T. Rowe Price Group, Inc., T. Rowe |
| (1959) | | Price International, and T. Rowe Price Trust Company |
| 2015 | | |
| [57] | | |
| |
| *Each inside director serves until retirement, resignation, or election of a successor. |
| Officers | | |
| |
| Name (Year of Birth) | | |
| Position Held With Floating Rate Fund | | Principal Occupation(s) |
| | | |
| Darrell N. Braman (1963) | | Vice President, Price Hong Kong, Price |
| Vice President and Secretary | | Singapore, T. Rowe Price, T. Rowe Price Group, |
| | Inc., T. Rowe Price International, T. Rowe Price |
| | Investment Services, Inc., and T. Rowe Price |
| | Services, Inc. |
| | | |
| Brian E. Burns (1960) | | Vice President, T. Rowe Price, T. Rowe Price |
| Vice President | | Group, Inc., and T. Rowe Price Trust Company |
| | | |
| Michael F. Connelly, CFA (1977) | | Vice President, T. Rowe Price and T. Rowe Price |
| Vice President | | Group, Inc. |
| | | |
| Stephen M. Finamore, CPA (1976) | | Vice President, T. Rowe Price and T. Rowe Price |
| Vice President | | Group, Inc. |
| | | |
| Justin T. Gerbereux, CFA (1975) | | Vice President, T. Rowe Price, T. Rowe Price |
| Vice President | | Group, Inc., and T. Rowe Price Trust Company |
| | | |
| John R. Gilner (1961) | | Chief Compliance Officer and Vice President, |
| Chief Compliance Officer | | T. Rowe Price; Vice President, T. Rowe Price |
| | Group, Inc., and T. Rowe Price Investment |
| | Services, Inc. |
| | | |
| David R. Giroux, CFA (1975) | | Vice President, T. Rowe Price, T. Rowe Price |
| Vice President | | Group, Inc., and T. Rowe Price Trust Company |
| | | |
| Steven C. Huber, CFA, FSA (1958) | | Vice President, T. Rowe Price, T. Rowe Price |
| Vice President | | Group, Inc., and T. Rowe Price International |
| | | |
| Paul J. Krug, CPA (1964) | | Vice President, T. Rowe Price, T. Rowe Price |
| Vice President | | Group, Inc., and T. Rowe Price Trust Company |
| | | |
| Paul M. Massaro, CFA (1975) | | Vice President, T. Rowe Price, T. Rowe Price |
| President | | Group, Inc., and T. Rowe Price Trust Company |
| | | |
| Catherine D. Mathews (1963) | | Vice President, T. Rowe Price, T. Rowe Price |
| Treasurer and Vice President | | Group, Inc., and T. Rowe Price Trust Company |
| | | |
| Michael J. McGonigle (1966) | | Vice President, T. Rowe Price and T. Rowe Price |
| Vice President | | Group, Inc. |
| | | |
| David Oestreicher (1967) | | Director, Vice President, and Secretary, T. Rowe |
| Vice President | | Price Investment Services, Inc., T. Rowe |
| | Price Retirement Plan Services, Inc., T. Rowe |
| | Price Services, Inc., and T. Rowe Price Trust |
| | Company; Chief Legal Officer, Vice President, |
| | and Secretary, T. Rowe Price Group, Inc.; Vice |
| | President and Secretary, T. Rowe Price and |
| | T. Rowe Price International; Vice President, |
| | Price Hong Kong and Price Singapore |
| | | |
| John W. Ratzesberger (1975) | | Vice President, T. Rowe Price, T. Rowe Price |
| Vice President | | Group, Inc., and T. Rowe Price Trust Company; |
| | formerly, North American Head of Listed |
| | Derivatives Operation, Morgan Stanley (to 2013) |
| | | |
| Shannon H. Rauser (1987) | | Employee, T. Rowe Price |
| Assistant Secretary | | |
| | | |
| Brian A. Rubin, CPA (1974) | | Vice President, T. Rowe Price, T. Rowe Price |
| Vice President | | Group, Inc., and T. Rowe Price Trust Company |
| | | |
| Deborah D. Seidel (1962) | | Vice President, T. Rowe Price, T. Rowe Price |
| Vice President | | Group, Inc., T. Rowe Price Investment Services, |
| | Inc., and T. Rowe Price Services, Inc. |
| | | |
| Thea N. Williams (1961) | | Vice President, T. Rowe Price, T. Rowe Price |
| Vice President | | Group, Inc., and T. Rowe Price Trust Company |
| |
| Unless otherwise noted, officers have been employees of T. Rowe Price or T. Rowe Price International for at least 5 years. |
Item 2. Code of Ethics.
The registrant has adopted a code of ethics, as defined in Item 2 of Form N-CSR, applicable to its principal executive officer, principal financial officer, principal accounting officer or controller, or persons performing similar functions. A copy of this code of ethics is filed as an exhibit to this Form N-CSR. No substantive amendments were approved or waivers were granted to this code of ethics during the period covered by this report.
Item 3. Audit Committee Financial Expert.
The registrant’s Board of Directors/Trustees has determined that Mr. Bruce W. Duncan qualifies as an audit committee financial expert, as defined in Item 3 of Form N-CSR. Mr. Duncan is considered independent for purposes of Item 3 of Form N-CSR.
Item 4. Principal Accountant Fees and Services.
(a) – (d) Aggregate fees billed for the last two fiscal years for professional services rendered to, or on behalf of, the registrant by the registrant’s principal accountant were as follows:
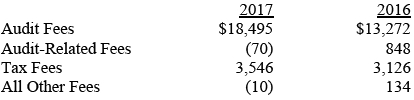
Audit fees include amounts related to the audit of the registrant’s annual financial statements and services normally provided by the accountant in connection with statutory and regulatory filings. Audit-related fees include amounts reasonably related to the performance of the audit of the registrant’s financial statements and specifically include the issuance of a report on internal controls and, if applicable, agreed-upon procedures related to fund acquisitions. Tax fees include amounts related to services for tax compliance, tax planning, and tax advice. The nature of these services specifically includes the review of distribution calculations and the preparation of Federal, state, and excise tax returns. All other fees include the registrant’s pro-rata share of amounts for agreed-upon procedures in conjunction with service contract approvals by the registrant’s Board of Directors/Trustees.
(e)(1) The registrant’s audit committee has adopted a policy whereby audit and non-audit services performed by the registrant’s principal accountant for the registrant, its investment adviser, and any entity controlling, controlled by, or under common control with the investment adviser that provides ongoing services to the registrant require pre-approval in advance at regularly scheduled audit committee meetings. If such a service is required between regularly scheduled audit committee meetings, pre-approval may be authorized by one audit committee member with ratification at the next scheduled audit committee meeting. Waiver of pre-approval for audit or non-audit services requiring fees of a de minimis amount is not permitted.
(2) No services included in (b) – (d) above were approved pursuant to paragraph (c)(7)(i)(C) of Rule 2-01 of Regulation S-X.
(f) Less than 50 percent of the hours expended on the principal accountant’s engagement to audit the registrant’s financial statements for the most recent fiscal year were attributed to work performed by persons other than the principal accountant’s full-time, permanent employees.
(g) The aggregate fees billed for the most recent fiscal year and the preceding fiscal year by the registrant’s principal accountant for non-audit services rendered to the registrant, its investment adviser, and any entity controlling, controlled by, or under common control with the investment adviser that provides ongoing services to the registrant were $1,765,000 and $2,409,000, respectively.
(h) All non-audit services rendered in (g) above were pre-approved by the registrant’s audit committee. Accordingly, these services were considered by the registrant’s audit committee in maintaining the principal accountant’s independence.
Item 5. Audit Committee of Listed Registrants.
Not applicable.
Item 6. Investments.
(a) Not applicable. The complete schedule of investments is included in Item 1 of this Form N-CSR.
(b) Not applicable.
Item 7. Disclosure of Proxy Voting Policies and Procedures for Closed-End Management Investment Companies.
Not applicable.
Item 8. Portfolio Managers of Closed-End Management Investment Companies.
Not applicable.
Item 9. Purchases of Equity Securities by Closed-End Management Investment Company and Affiliated Purchasers.
Not applicable.
Item 10. Submission of Matters to a Vote of Security Holders.
Not applicable.
Item 11. Controls and Procedures.
(a) The registrant’s principal executive officer and principal financial officer have evaluated the registrant’s disclosure controls and procedures within 90 days of this filing and have concluded that the registrant’s disclosure controls and procedures were effective, as of that date, in ensuring that information required to be disclosed by the registrant in this Form N-CSR was recorded, processed, summarized, and reported timely.
(b) The registrant’s principal executive officer and principal financial officer are aware of no change in the registrant’s internal control over financial reporting that occurred during the registrant’s second fiscal quarter covered by this report that has materially affected, or is reasonably likely to materially affect, the registrant’s internal control over financial reporting.
Item 12. Exhibits.
(a)(1) The registrant’s code of ethics pursuant to Item 2 of Form N-CSR is attached.
(2) Separate certifications by the registrant's principal executive officer and principal financial officer, pursuant to Section 302 of the Sarbanes-Oxley Act of 2002 and required by Rule 30a-2(a) under the Investment Company Act of 1940, are attached.
(3) Written solicitation to repurchase securities issued by closed-end companies: not applicable.
(b) A certification by the registrant's principal executive officer and principal financial officer, pursuant to Section 906 of the Sarbanes-Oxley Act of 2002 and required by Rule 30a-2(b) under the Investment Company Act of 1940, is attached.
SIGNATURES
Pursuant to the requirements of the Securities Exchange Act of 1934 and the Investment Company Act of 1940, the registrant has duly caused this report to be signed on its behalf by the undersigned, thereunto duly authorized.
T. Rowe Price Floating Rate Fund, Inc.
| By | | /s/ Edward C. Bernard |
| | | Edward C. Bernard |
| | | Principal Executive Officer |
| |
| Date | | July 18, 2017 | | | | |
Pursuant to the requirements of the Securities Exchange Act of 1934 and the Investment Company Act of 1940, this report has been signed below by the following persons on behalf of the registrant and in the capacities and on the dates indicated.
| By | | /s/ Edward C. Bernard |
| | | Edward C. Bernard |
| | | Principal Executive Officer |
| |
| Date | | July 18, 2017 | | | | |
| |
| |
| By | | /s/ Catherine D. Mathews |
| | | Catherine D. Mathews |
| | | Principal Financial Officer |
| |
| Date | | July 18, 2017 | | | | |