UNITED STATES
SECURITIES AND EXCHANGE COMMISSION
Washington, D.C. 20549
FORM N-CSR
CERTIFIED SHAREHOLDER REPORT OF REGISTERED
MANAGEMENT INVESTMENT COMPANIES
Investment Company Act File Number: 811-22557
| T. Rowe Price Floating Rate Fund, Inc. |
|
| (Exact name of registrant as specified in charter) |
| |
| 100 East Pratt Street, Baltimore, MD 21202 |
|
| (Address of principal executive offices) |
| |
| David Oestreicher |
| 100 East Pratt Street, Baltimore, MD 21202 |
|
| (Name and address of agent for service) |
Registrant’s telephone number, including area code: (410) 345-2000
Date of fiscal year end: May 31
Date of reporting period: May 31, 2020
Item 1. Reports to Shareholders
(a) Report pursuant to Rule 30e-1.
| Floating Rate Fund | May 31, 2020 |
| PRFRX | Investor Class |
| PAFRX | Advisor Class |
| TFAIX | I Class |
| TRIZX | Z Class |
Beginning on January 1, 2021, as permitted by SEC regulations, paper copies of the T. Rowe Price funds’ annual and semiannual shareholder reports will no longer be mailed, unless you specifically request them. Instead, shareholder reports will be made available on the funds’ website (troweprice.com/prospectus), and you will be notified by mail with a website link to access the reports each time a report is posted to the site.
If you already elected to receive reports electronically, you will not be affected by this change and need not take any action. At any time, shareholders who invest directly in T. Rowe Price funds may generally elect to receive reports or other communications electronically by enrolling at troweprice.com/paperless or, if you are a retirement plan sponsor or invest in the funds through a financial intermediary (such as an investment advisor, broker-dealer, insurance company, or bank), by contacting your representative or your financial intermediary.
You may elect to continue receiving paper copies of future shareholder reports free of charge. To do so, if you invest directly with T. Rowe Price, please call T. Rowe Price as follows: IRA, nonretirement account holders, and institutional investors, 1-800-225-5132; small business retirement accounts, 1-800-492-7670. If you are a retirement plan sponsor or invest in the T. Rowe Price funds through a financial intermediary, please contact your representative or financial intermediary or follow additional instructions if included with this document. Your election to receive paper copies of reports will apply to all funds held in your account with your financial intermediary or, if you invest directly in the T. Rowe Price funds, with T. Rowe Price. Your election can be changed at any time in the future.
| T. ROWE PRICE FLOATING RATE FUND |
|
HIGHLIGHTS
| ■ | The Floating Rate Fund posted a loss during the 12 months ended May 31, 2020, but outperformed its benchmark, the S&P/LSTA Performing Loan Index, and the Lipper peer group average. |
| |
| ■ | Macroeconomic uncertainty and significant volatility following the emergence of the coronavirus created a challenging performance environment for risk assets. |
| |
| ■ | Over the past year, we adjusted the portfolio’s exposure to several market segments prior to and at the onset of the global health crisis and made a concerted effort to remain underweight the lowest-quality loans in the B rating tier. |
| |
| ■ | History tells us that when loan prices reach certain low levels, one-year forward returns are typically positive, and we expect this trend to continue. |

Log in to your account at troweprice.com for more information.
*Certain mutual fund accounts that are assessed an annual account service fee can also save money by switching to e-delivery.
CIO Market Commentary
Dear Shareholder
Financial markets recorded mixed results during your fund’s fiscal year, the 12-month period ended May 31, 2020, as the spread of the coronavirus disrupted global economies. Although stocks and bonds experienced extraordinary volatility, historic levels of fiscal and monetary stimulus helped mitigate the losses.
As we entered January, the outlook for 2020 appeared promising. China and the U.S. completed a phase one trade deal that lowered some tariffs, and central bank stimulus in the second half of 2019 appeared to position the economy for further growth. However, market sentiment began to shift amid news of a coronavirus outbreak in China’s Hubei province.
Although the effect was initially muted, with the S&P 500 Index advancing to a record high on February 19, stocks began falling as the virus spread outside China. The major indexes continued their slide as cases mounted in the U.S. and New York City became the epicenter of the pandemic. Governments throughout the world issued stay-at-home orders to contain the virus, and some sectors, such as travel, restaurants, and shopping malls, nearly came to a halt.
Over 40 million Americans filed unemployment claims during the last 10 weeks of the period, and many measures of economic activity, including retail sales and industrial production, experienced record-setting declines. By March 23, the S&P 500 Index had fallen by about a third from the start of the year.
In response to the rapid economic contraction, global central banks took bold accommodative steps, and many governments around the world passed emergency spending packages. The Federal Reserve cut its short-term lending rate to near zero and began purchasing government and corporate bonds to stimulate the economy and supply liquidity in the fixed income market. As a result, the Fed’s balance sheet increased by nearly $3 trillion in three months.
The federal government also provided trillions of dollars in fiscal help in the form of direct payments to many Americans, expanded unemployment insurance, and subsidies to sectors, such as transportation and health care, that had been directly impacted by the pandemic. Boosted by the support, most sectors recouped some of their losses—and the Nasdaq index moved back into positive territory for the year—by the end of May.
For the 12-month period, U.S. large- and mid-cap growth stocks produced robust returns and outperformed small-caps and value shares, which lost ground. Technology and health care stocks performed best within the S&P 500, while energy stocks plunged in response to falling oil prices. A stronger U.S. dollar generally weighed on returns for U.S. investors in foreign securities, but non-U.S. markets were broadly mixed. Japanese stocks posted solid gains, while some emerging regions suffered substantial losses.
In the fixed income universe, Treasuries were the top performers as yields dropped to record lows during the period, and other U.S. investment-grade bonds were also generally positive. High yield bonds finished lower as the default rate in the sector rose to a 10-year high amid the economic downturn.
By the end of the period, markets were encouraged as local governments began to roll back shutdown orders and pharmaceutical companies were focused on developing treatments and a vaccine for the coronavirus. While we are hopeful that a recovery has begun, it is difficult to gauge just how long the acute economic disruption might last. With so much uncertainty still surrounding the pandemic, it is possible that the time frame for returning to a “normalized” environment could be longer than anticipated.
Our portfolio managers are mindful that extreme market dislocations provide opportunities but also present risks, and careful analysis will be required to seek out quality companies that have the financial strength, competitive position, and capable managements to survive the crisis and perhaps emerge even stronger.
We will be carefully monitoring developments, and I believe that our disciplined fundamental research and strategic investing approach will continue to serve our shareholders well in this uncertain environment.
Thank you for your continued confidence in T. Rowe Price.
Sincerely,

Robert Sharps
Group Chief Investment Officer
Management’s Discussion of Fund Performance
INVESTMENT OBJECTIVE
The fund seeks high current income and, secondarily, capital appreciation.
FUND COMMENTARY
How did the fund perform in the past 12 months?
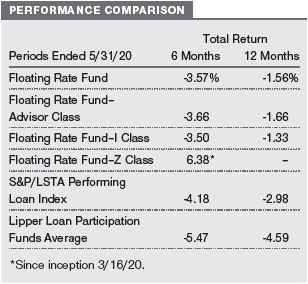
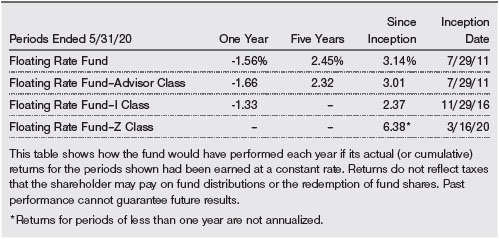
The Floating Rate Fund returned -1.56% in the 12 months ended May 31, 2020, outperforming its benchmark, the S&P/LSTA Performing Loan Index, and the Lipper peer group average. (Results for the fund’s Advisor, I, and Z Class shares varied slightly, reflecting their different fee structure, asset flows, and other factors. Past performance cannot guarantee future results.)
What factors influenced the fund’s performance?
Macroeconomic uncertainty and significant volatility following the emergence of the coronavirus created a challenging performance environment and caused risk assets to retrace the solid gains generated in 2019 and early this year. However, unprecedented stimulus measures, growing optimism around therapeutic treatments for the virus, and the gradual reopening of economies helped financial markets rebound near the end of our reporting period.
Asurion and Kronos, two of our highest-conviction names and the portfolio’s largest holdings, were top contributors to relative performance over the past year. Asurion is a loan-only issuer and global provider of product protection and support services to the wireless, insurance, retail, and home repair service industries. As a handset insurance provider, the company benefits from smartphone sales without depending on the execution of one specific wireless carrier. Asurion’s dominant market position, solid credit profile, near-term revenue visibility, and attractive coupons support our high conviction. (Please refer to the portfolio of investments for a complete list of holdings and the amount each represents in the portfolio.)
Kronos is a leader in the workforce management solutions market. The company’s products address business needs, including monitoring employee time and attendance, scheduling, absence management, and workforce analytics. Its market-leading products and subscription-based business foster loyalty from its diverse customer base consisting of large, well-capitalized companies. Kronos recently completed its merger with Ultimate Software, a leading provider of cloud-based human capital management solutions, and we believe the company’s revenue will not be significantly impacted by coronavirus-related disruptions.
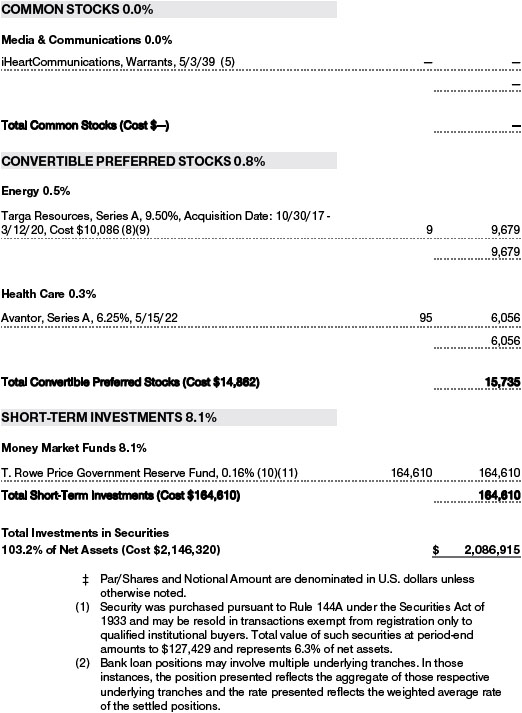
Avantor, a provider of product and service solutions to laboratory and production companies, was a leading contributor in the health care segment. Consistent demand for its products supports the company’s performance, and a large portion of the proceeds from its initial public offering in 2019 was used to pay down debt.
Avoiding problem names in troubled market segments aided relative performance. For example, our significant underweight to industries vulnerable to business disruptions due to the pandemic, such as retail and airlines, benefited. Additionally, not owning lower-quality energy names—including exploration and production companies California Resources and Fieldwood Energy and Seadrill, an owner and operator of offshore drilling platforms—that struggled as oil prices declined sharply made meaningful relative performance contributions.
Clear Channel Worldwide (CCO) and iHeartMedia were notable detractors over the 12-month period. CCO is one of the world’s largest outdoor advertising companies with operations across Asia, Europe, Latin America, and North America. The shutdown of many industries significantly hampered the company’s business. However, CCO recently announced a series of initiatives to improve its liquidity and financial flexibility.
iHeartMedia is a leading global media and entertainment company that emerged from bankruptcy in May 2019. We were a member of the bondholder group leading up to and throughout the restructuring process. Upon exit, we received a package of securities across the new capital structure—including common stock—and were optimistic about the company’s recovery. However, the onset of the pandemic dramatically changed the outlook for advertising and the overall broadcasting segment. We concluded that we would not be able to capture the anticipated upside and exited our equity positions at a loss amid expectations that the company’s business would likely face further near-term disruptions. We also trimmed our loan and bond positions, reducing overall exposure to the name.
Midstream companies EagleClaw and Caprock weighed on relative results as falling oil prices caused a significant decline in drilling activity. Given the current environment and expectations of additional volatility going forward, it will take longer than originally anticipated to generate the earnings and cash flow required for these companies to grow into their capital structures. Nevertheless, we remain invested in these issuers as we believe the value of their long-term prospects and strong sponsor support are not currently reflected in the loans.
How is the fund positioned?
Over the past year, we adjusted the portfolio’s exposure to several market segments prior to and at the onset of the global health crisis. Among financials, greater conviction prompted us to augment our allocation to the insurance broker space through a larger investment in HUB International, North America’s largest private insurance broker. We believe insurance pricing is undergoing multiyear improvement amid hardening market conditions. Additionally, a flexible cost structure and access to capital are significant advantages for insurance brokers in the current environment. This subsector continues to be an area of focus and a driver of returns in the portfolio.
We increased our technology industry allocation as we found value in the first-and second-lien loans and saw greater stability in business models leading up to 2020 and again through the onset of the global health crisis. In our view, software-as-a-service businesses are particularly attractive because the licensing of software to customers provides recurring revenue streams. Following the onset of the coronavirus, most technology companies were able to continue normal operations with employees working remotely, and the industry has generally not encountered earnings issues as a result of the pandemic. The performance of software companies in particular has been resilient, which gave us the confidence to increase our technology sector investment.
While navigating the global financial crisis, we learned that advertising companies are among the first businesses to be negatively impacted by an economic downturn. Consequently, we meaningfully reduced our broadcasting industry exposure at reasonable prices.
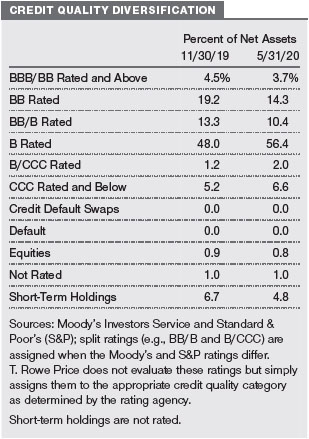
The lower-quality portion of our market—particularly the percentage of loans rated B minus—has increased significantly. Throughout the past year, we made a concerted effort to remain underweight the lowest-quality loans in the B rating tier. The lowest-quality segment of the B rating bucket is vulnerable to being downgraded to the CCC tier. Therefore, our meaningful underweight to loans rated B minus was supportive as we entered the recession and downgrades in our market increased. In our view, underwriting standards deteriorated throughout 2018 and 2019. This shift was reflected in the pricing of loans, in covenants and terms, as well as in the ratings mix of our market, which becomes increasingly important in a downturn or recession when there is more downgrade activity. Consequently, we significantly reduced our new issue participation rate.
What is portfolio management’s outlook?
We are broadly constructive in our performance expectations due to the compelling average dollar price of the loan asset class following the recent sell-off. Valuations have started to recover but remain attractive, and we believe opportunities to generate meaningful income still exist. History tells us that when loan prices reach certain low levels, one-year forward returns are typically positive, and we expect this trend to continue. However, the loan default rate is likely to increase amid bouts of heightened volatility.
If the Federal Reserve pivots to negative interest rates, loans with LIBOR floors—a minimum value imposed on the benchmark component of the floating rate coupon—will provide some income protection. Conversely, the eventual return to a rising rate environment—although unlikely in the near term—should result in potential upside for the asset class. We are optimistic about the efficacy of therapeutic treatments for the virus and believe the reopening of the economy will continue at a measured pace. In recent months, we have taken advantage of attractive entry points in market segments that have been significantly impacted by the pandemic while actively researching lower-dollar opportunities to enhance the portfolio’s total return potential.
The views expressed reflect the opinions of T. Rowe Price as of the date of this report and are subject to change based on changes in market, economic, or other conditions. These views are not intended to be a forecast of future events and are no guarantee of future results.
RISKS OF INVESTING IN FLOATING RATE LOAN FUNDS
Floating rate loans are subject to credit risk, the chance that any fund holding could have its credit rating downgraded or that an issuer will default (fail to make timely payments of interest or principal), and liquidity risk, the chance that the fund may not be able to sell loans or securities at desired prices, potentially reducing the fund’s income level and share price. Like bond funds, this fund is exposed to interest rate risk, but credit and liquidity risks may often be more important.
The loans in which the fund invests are often referred to as “leveraged loans” because the borrowing companies have significantly more debt than equity. In many cases, leveraged loans are issued in connection with recapitalizations, acquisitions, leveraged buyouts, and refinancings. Companies issuing leveraged loans typically have a below investment-grade credit rating or may not be rated by a major credit rating agency. Leveraged loan funds could have greater price declines than funds that invest primarily in high-quality bonds, so the securities are usually considered speculative investments.
BENCHMARK INFORMATION
Note: Lipper, a Thomson Reuters Company, is the source for all Lipper content reflected in these materials. Copyright 2020 © Refinitiv. All rights reserved. Any copying, republication or redistribution of Lipper content is expressly prohibited without the prior written consent of Lipper. Lipper shall not be liable for any errors or delays in the content, or for any actions taken in reliance thereon.
Note: ©2020, S&P Global Market Intelligence. Reproduction of any information, data or material, including ratings (Content) in any form is prohibited except with the prior written permission of the relevant party. Such party, its affiliates and suppliers (Content Providers) do not guarantee the accuracy, adequacy, completeness, timeliness or availability of any Content and are not responsible for any errors or omissions (negligent or otherwise), regardless of the cause, or for the results obtained from the use of such Content. In no event shall Content Providers be liable for any damages, costs, expenses, legal fees, or losses (including lost income or lost profit and opportunity costs) in connection with any use of the Content.

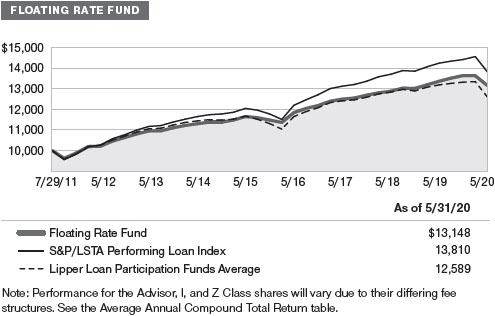
GROWTH OF $10,000
This chart shows the value of a hypothetical $10,000 investment in the fund over the past 10 fiscal year periods or since inception (for funds lacking 10-year records). The result is compared with benchmarks, which include a broad-based market index and may also include a peer group average or index. Market indexes do not include expenses, which are deducted from fund returns as well as mutual fund averages and indexes.
AVERAGE ANNUAL COMPOUND TOTAL RETURN
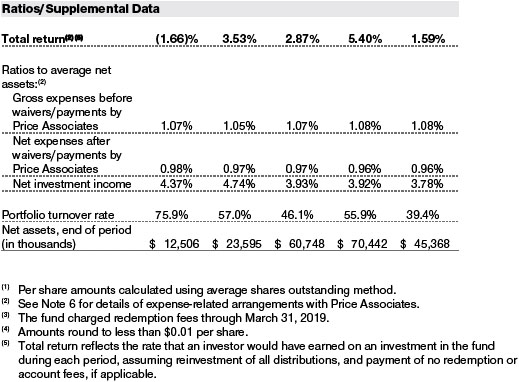
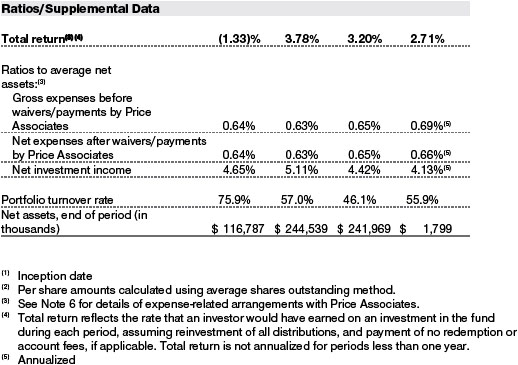
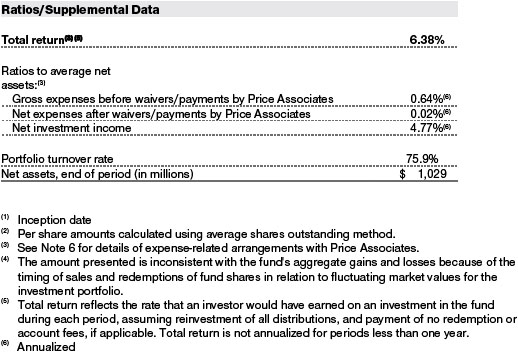
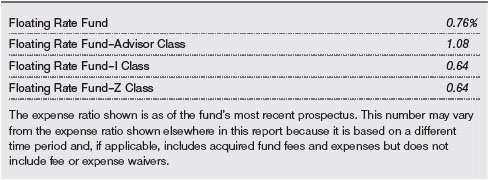
EXPENSE RATIO
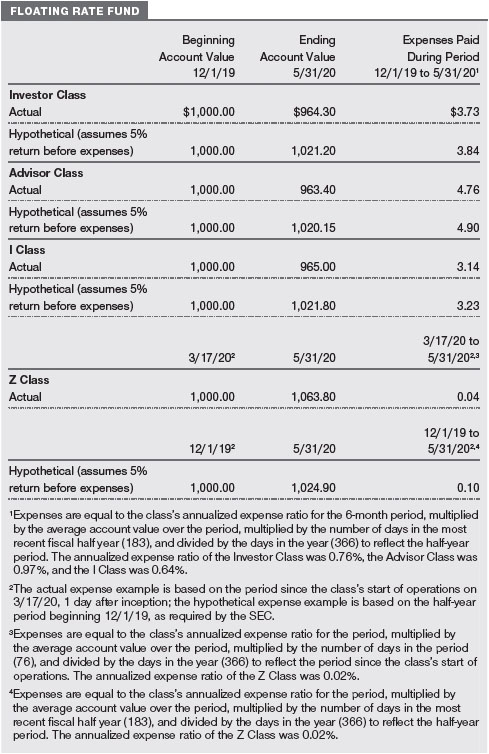
FUND EXPENSE EXAMPLE
As a mutual fund shareholder, you may incur two types of costs: (1) transaction costs, such as redemption fees or sales loads, and (2) ongoing costs, including management fees, distribution and service (12b-1) fees, and other fund expenses. The following example is intended to help you understand your ongoing costs (in dollars) of investing in the fund and to compare these costs with the ongoing costs of investing in other mutual funds. The example is based on an investment of $1,000 invested at the beginning of the most recent six-month period and held for the entire period.
Please note that the fund has four share classes: The original share class (Investor Class) charges no distribution and service (12b-1) fee, Advisor Class shares are offered only through unaffiliated brokers and other financial intermediaries and charge a 0.25% 12b-1 fee, I Class shares are available to institutionally oriented clients and impose no 12b-1 or administrative fee payment, and Z Class shares are offered only to funds advised by T. Rowe Price and other advisory clients of T. Rowe Price or its affiliates that are subject to a contractual fee for investment management services and impose no 12b-1 fee or administrative fee payment. Each share class is presented separately in the table.
Actual Expenses
The first line of the following table (Actual) provides information about actual account values and expenses based on the fund’s actual returns. You may use the information on this line, together with your account balance, to estimate the expenses that you paid over the period. Simply divide your account value by $1,000 (for example, an $8,600 account value divided by $1,000 = 8.6), then multiply the result by the number on the first line under the heading “Expenses Paid During Period” to estimate the expenses you paid on your account during this period.
Hypothetical Example for Comparison Purposes
The information on the second line of the table (Hypothetical) is based on hypothetical account values and expenses derived from the fund’s actual expense ratio and an assumed 5% per year rate of return before expenses (not the fund’s actual return). You may compare the ongoing costs of investing in the fund with other funds by contrasting this 5% hypothetical example and the 5% hypothetical examples that appear in the shareholder reports of the other funds. The hypothetical account values and expenses may not be used to estimate the actual ending account balance or expenses you paid for the period.
Note: T. Rowe Price charges an annual account service fee of $20, generally for accounts with less than $10,000. The fee is waived for any investor whose T. Rowe Price mutual fund accounts total $50,000 or more; accounts electing to receive electronic delivery of account statements, transaction confirmations, prospectuses, and shareholder reports; or accounts of an investor who is a T. Rowe Price Personal Services or Enhanced Personal Services client (enrollment in these programs generally requires T. Rowe Price assets of at least $250,000). This fee is not included in the accompanying table. If you are subject to the fee, keep it in mind when you are estimating the ongoing expenses of investing in the fund and when comparing the expenses of this fund with other funds.
You should also be aware that the expenses shown in the table highlight only your ongoing costs and do not reflect any transaction costs, such as redemption fees or sales loads. Therefore, the second line of the table is useful in comparing ongoing costs only and will not help you determine the relative total costs of owning different funds. To the extent a fund charges transaction costs, however, the total cost of owning that fund is higher.
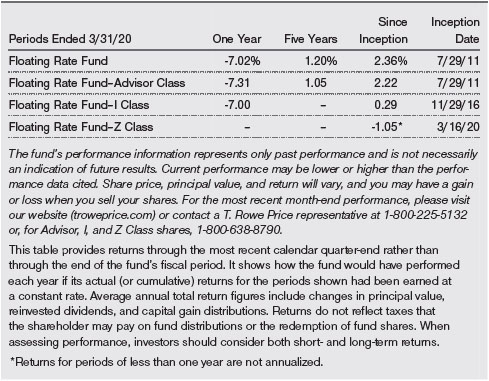
QUARTER-END RETURNS
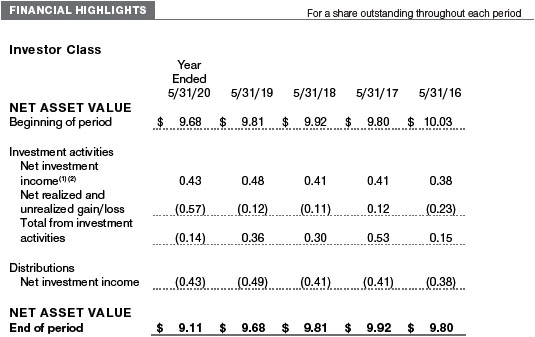
The accompanying notes are an integral part of these financial statements.
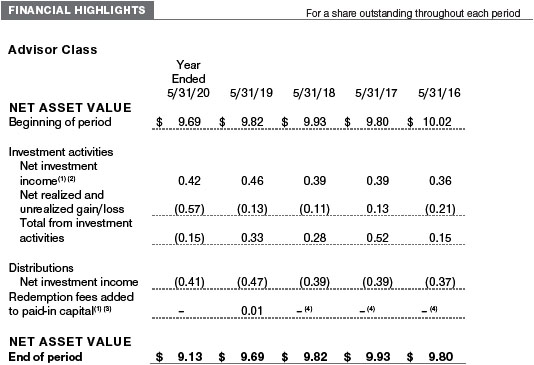
The accompanying notes are an integral part of these financial statements.
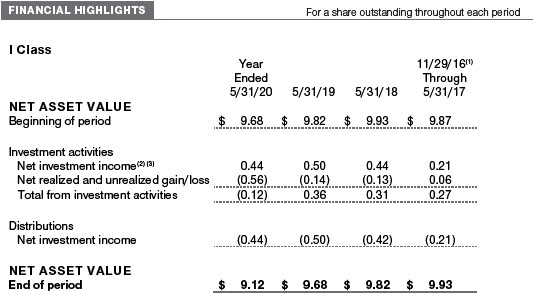
The accompanying notes are an integral part of these financial statements.
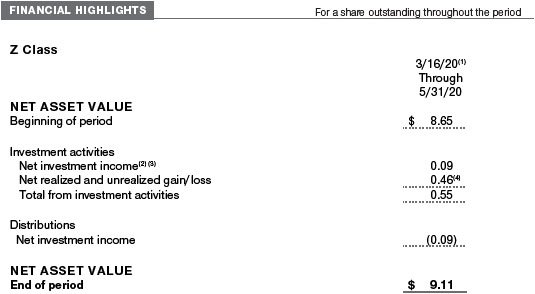
The accompanying notes are an integral part of these financial statements.
May 31, 2020


The accompanying notes are an integral part of these financial statements.
May 31, 2020
The accompanying notes are an integral part of these financial statements.
The accompanying notes are an integral part of these financial statements.
The accompanying notes are an integral part of these financial statements.
| NOTES TO FINANCIAL STATEMENTS |
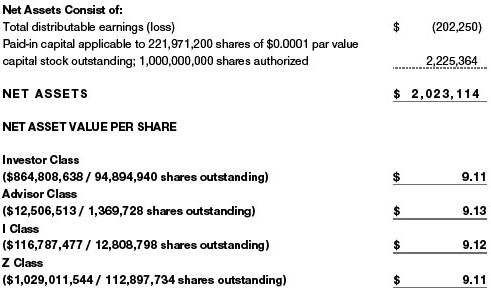
T. Rowe Price Floating Rate Fund, Inc. (the fund) is registered under the Investment Company Act of 1940 (the 1940 Act) as a diversified, open-end management investment company. The fund seeks high current income and, secondarily, capital appreciation. The fund has four classes of shares: the Floating Rate Fund (Investor Class), the Floating Rate Fund–Advisor Class (Advisor Class), the Floating Rate Fund–I Class (I Class), and the Floating Rate Fund–Z Class (Z Class). Advisor Class shares are sold only through various brokers and other financial intermediaries. I Class shares require a $1 million initial investment minimum, although the minimum generally is waived for retirement plans, financial intermediaries, and certain other accounts. The Z Class is only available to funds advised by T. Rowe Price Associates, Inc. and its affiliates and other clients that are subject to a contractual fee for investment management services. The Advisor Class operates under a Board-approved Rule 12b-1 plan pursuant to which the class compensates financial intermediaries for distribution, shareholder servicing, and/or certain administrative services; the Investor, I and Z Classes do not pay Rule 12b-1 fees. Each class has exclusive voting rights on matters related solely to that class; separate voting rights on matters that relate to all classes; and, in all other respects, the same rights and obligations as the other classes.
NOTE 1 - SIGNIFICANT ACCOUNTING POLICIES
Basis of Preparation The fund is an investment company and follows accounting and reporting guidance in the Financial Accounting Standards Board (FASB) Accounting Standards Codification Topic 946 (ASC 946). The accompanying financial statements were prepared in accordance with accounting principles generally accepted in the United States of America (GAAP), including, but not limited to, ASC 946. GAAP requires the use of estimates made by management. Management believes that estimates and valuations are appropriate; however, actual results may differ from those estimates, and the valuations reflected in the accompanying financial statements may differ from the value ultimately realized upon sale or maturity.
Investment Transactions, Investment Income, and Distributions Investment transactions are accounted for on the trade date basis. Income and expenses are recorded on the accrual basis. Realized gains and losses are reported on the identified cost basis. Premiums and discounts on debt securities are amortized for financial reporting purposes. Paydown gains and losses are recorded as an adjustment to interest income. Income tax-related interest and penalties, if incurred, are recorded as income tax expense. Dividends received from mutual fund investments are reflected as dividend income; capital gain distributions are reflected as realized gain/loss. Dividend income and capital gain distributions are recorded on the ex-dividend date. Non-cash dividends, if any, are recorded at the fair market value of the asset received. Distributions to shareholders are recorded on the ex-dividend date. Income distributions are declared by each class daily and paid monthly. A capital gain distribution may also be declared and paid by the fund annually.
Currency Translation Assets, including investments, and liabilities denominated in foreign currencies are translated into U.S. dollar values each day at the prevailing exchange rate, using the mean of the bid and asked prices of such currencies against U.S. dollars as quoted by a major bank. Purchases and sales of securities, income, and expenses are translated into U.S. dollars at the prevailing exchange rate on the respective date of such transaction. The effect of changes in foreign currency exchange rates on realized and unrealized security gains and losses is not bifurcated from the portion attributable to changes in market prices.
Class Accounting Shareholder servicing, prospectus, and shareholder report expenses incurred by each class are charged directly to the class to which they relate. Expenses common to all classes and investment income are allocated to the classes based upon the relative daily net assets of each class’s settled shares; realized and unrealized gains and losses are allocated based upon the relative daily net assets of each class’s outstanding shares. The Advisor Class pays Rule 12b-1 fees, in an amount not exceeding 0.25% of the class’s average daily net assets.
Redemption Fees Prior to April 1, 2019, a 2% fee was assessed on redemptions of fund shares held for 90 days or less to deter short-term trading and to protect the interests of long-term shareholders. Redemption fees were withheld from proceeds that shareholders received from the sale or exchange of fund shares. The fees were paid to the fund and were recorded as an increase to paid-in capital. The fees may have caused the redemption price per share to differ from the net asset value per share.
New Accounting Guidance Effective June 1, 2019, the fund adopted FASB guidance that shortened the amortization period for certain callable debt securities held at a premium. Adoption had no effect on the fund’s net assets or results of operations.
In March 2020, the FASB issued Accounting Standards Update (ASU), ASU 2020-04, Reference Rate Reform (Topic 848) – Facilitation of the Effects of Reference Rate Reform on Financial Reporting, which provides optional, temporary relief with respect to the financial reporting of contracts subject to certain types of modifications due to the planned discontinuation of the London Interbank Offered Rate (LIBOR) and other interbank-offered based reference rates as of the end of 2021. The guidance is effective for certain reference rate-related contract modifications that occur during the period March 12, 2020 through December 31, 2022. Management is currently evaluating the impact, if any, of the ASU on the fund’s financial statements.
Indemnification In the normal course of business, the fund may provide indemnification in connection with its officers and directors, service providers, and/or private company investments. The fund’s maximum exposure under these arrangements is unknown; however, the risk of material loss is currently considered to be remote.
NOTE 2 - VALUATION
The fund’s financial instruments are valued and each class’s net asset value (NAV) per share is computed at the close of the New York Stock Exchange (NYSE), normally 4 p.m. ET, each day the NYSE is open for business. However, the NAV per share may be calculated at a time other than the normal close of the NYSE if trading on the NYSE is restricted, if the NYSE closes earlier, or as may be permitted by the SEC.
Fair Value The fund’s financial instruments are reported at fair value, which GAAP defines as the price that would be received to sell an asset or paid to transfer a liability in an orderly transaction between market participants at the measurement date. The T. Rowe Price Valuation Committee (the Valuation Committee) is an internal committee that has been delegated certain responsibilities by the fund’s Board of Directors (the Board) to ensure that financial instruments are appropriately priced at fair value in accordance with GAAP and the 1940 Act. Subject to oversight by the Board, the Valuation Committee develops and oversees pricing-related policies and procedures and approves all fair value determinations. Specifically, the Valuation Committee establishes procedures to value securities; determines pricing techniques, sources, and persons eligible to effect fair value pricing actions; oversees the selection, services, and performance of pricing vendors; oversees valuation-related business continuity practices; and provides guidance on internal controls and valuation-related matters. The Valuation Committee reports to the Board and has representation from legal, portfolio management and trading, operations, risk management, and the fund’s treasurer.
Various valuation techniques and inputs are used to determine the fair value of financial instruments. GAAP establishes the following fair value hierarchy that categorizes the inputs used to measure fair value:
Level 1 – quoted prices (unadjusted) in active markets for identical financial instruments that the fund can access at the reporting date
Level 2 – inputs other than Level 1 quoted prices that are observable, either directly or indirectly (including, but not limited to, quoted prices for similar financial instruments in active markets, quoted prices for identical or similar financial instruments in inactive markets, interest rates and yield curves, implied volatilities, and credit spreads)
Level 3 – unobservable inputs
Observable inputs are developed using market data, such as publicly available information about actual events or transactions, and reflect the assumptions that market participants would use to price the financial instrument. Unobservable inputs are those for which market data are not available and are developed using the best information available about the assumptions that market participants would use to price the financial instrument. GAAP requires valuation techniques to maximize the use of relevant observable inputs and minimize the use of unobservable inputs. When multiple inputs are used to derive fair value, the financial instrument is assigned to the level within the fair value hierarchy based on the lowest-level input that is significant to the fair value of the financial instrument. Input levels are not necessarily an indication of the risk or liquidity associated with financial instruments at that level but rather the degree of judgment used in determining those values.
Valuation Techniques Debt securities generally are traded in the over-the-counter (OTC) market and are valued at prices furnished by independent pricing services or by broker dealers who make markets in such securities. When valuing securities, the independent pricing services consider the yield or price of bonds of comparable quality, coupon, maturity, and type, as well as prices quoted by dealers who make markets in such securities. Generally, debt securities are categorized in Level 2 of the fair value hierarchy; however, to the extent the valuations include significant unobservable inputs, the securities would be categorized in Level 3.
Equity securities listed or regularly traded on a securities exchange or in the OTC market are valued at the last quoted sale price or, for certain markets, the official closing price at the time the valuations are made. OTC Bulletin Board securities are valued at the mean of the closing bid and asked prices. A security that is listed or traded on more than one exchange is valued at the quotation on the exchange determined to be the primary market for such security. Listed securities not traded on a particular day are valued at the mean of the closing bid and asked prices. Actively traded equity securities listed on a domestic exchange generally are categorized in Level 1 of the fair value hierarchy. OTC Bulletin Board securities, certain preferred securities, and equity securities traded in inactive markets generally are categorized in Level 2 of the fair value hierarchy.
Investments in mutual funds are valued at the mutual fund’s closing NAV per share on the day of valuation and are categorized in Level 1 of the fair value hierarchy. Forward currency exchange contracts are valued using the prevailing forward exchange rate and are categorized in Level 2 of the fair value hierarchy. Swaps are valued at prices furnished by an independent pricing service or independent swap dealers and generally are categorized in Level 2 of the fair value hierarchy; however, if unobservable inputs are significant to the valuation, the swap would be categorized in Level 3. Assets and liabilities other than financial instruments, including short-term receivables and payables, are carried at cost, or estimated realizable value, if less, which approximates fair value.
Thinly traded financial instruments and those for which the above valuation procedures are inappropriate or are deemed not to reflect fair value are stated at fair value as determined in good faith by the Valuation Committee. The objective of any fair value pricing determination is to arrive at a price that could reasonably be expected from a current sale. Financial instruments fair valued by the Valuation Committee are primarily private placements, restricted securities, warrants, rights, and other securities that are not publicly traded.
Subject to oversight by the Board, the Valuation Committee regularly makes good faith judgments to establish and adjust the fair valuations of certain securities as events occur and circumstances warrant. For instance, in determining the fair value of troubled or thinly traded debt instruments, the Valuation Committee considers a variety of factors, which may include, but are not limited to, the issuer’s business prospects, its financial standing and performance, recent investment transactions in the issuer, strategic events affecting the company, market liquidity for the issuer, and general economic conditions and events. In consultation with the investment and pricing teams, the Valuation Committee will determine an appropriate valuation technique based on available information, which may include both observable and unobservable inputs. The Valuation Committee typically will afford greatest weight to actual prices in arm’s length transactions, to the extent they represent orderly transactions between market participants, transaction information can be reliably obtained, and prices are deemed representative of fair value. However, the Valuation Committee may also consider other valuation methods such as a discount or premium from market value of a similar, freely traded security of the same issuer; discounted cash flows; yield to maturity; or some combination. Fair value determinations are reviewed on a regular basis and updated as information becomes available, including actual purchase and sale transactions of the issue. Because any fair value determination involves a significant amount of judgment, there is a degree of subjectivity inherent in such pricing decisions, and fair value prices determined by the Valuation Committee could differ from those of other market participants. Depending on the relative significance of unobservable inputs, including the valuation technique(s) used, fair valued securities may be categorized in Level 2 or 3 of the fair value hierarchy.
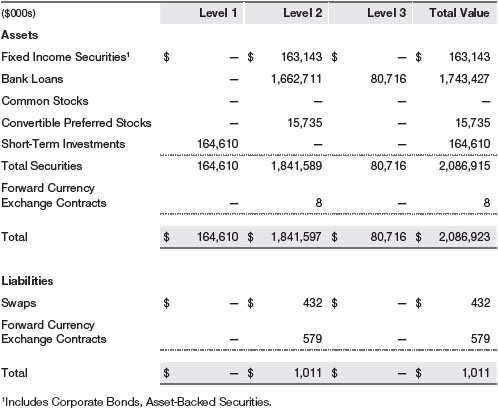
Valuation Inputs The following table summarizes the fund’s financial instruments, based on the inputs used to determine their fair values on May 31, 2020 (for further detail by category, please refer to the accompanying Portfolio of Investments):
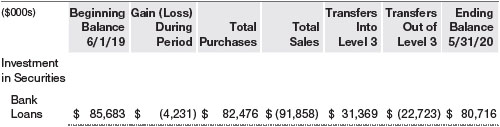
Following is a reconciliation of the fund’s Level 3 holdings for the year ended May 31, 2020. Gain (loss) reflects both realized and change in unrealized gain/loss on Level 3 holdings during the period, if any, and is included on the accompanying Statement of Operations. The change in unrealized gain/loss on Level 3 instruments held at May 31, 2020, totaled $(2,552,000) for the year ended May 31, 2020. During the year, transfers into Level 3 resulted from a lack of observable market data for the security and transfers out of Level 3 were because observable market data became available for the security.
NOTE 3 - DERIVATIVE INSTRUMENTS
During the year ended May 31, 2020, the fund invested in derivative instruments. As defined by GAAP, a derivative is a financial instrument whose value is derived from an underlying security price, foreign exchange rate, interest rate, index of prices or rates, or other variable; it requires little or no initial investment and permits or requires net settlement. The fund invests in derivatives only if the expected risks and rewards are consistent with its investment objectives, policies, and overall risk profile, as described in its prospectus and Statement of Additional Information. The fund may use derivatives for a variety of purposes, such as seeking to hedge against declines in principal value, increase yield, invest in an asset with greater efficiency and at a lower cost than is possible through direct investment, to enhance return, or to adjust portfolio duration and credit exposure. The risks associated with the use of derivatives are different from, and potentially much greater than, the risks associated with investing directly in the instruments on which the derivatives are based. The fund at all times maintains sufficient cash reserves, liquid assets, or other SEC-permitted asset types to cover its settlement obligations under open derivative contracts.
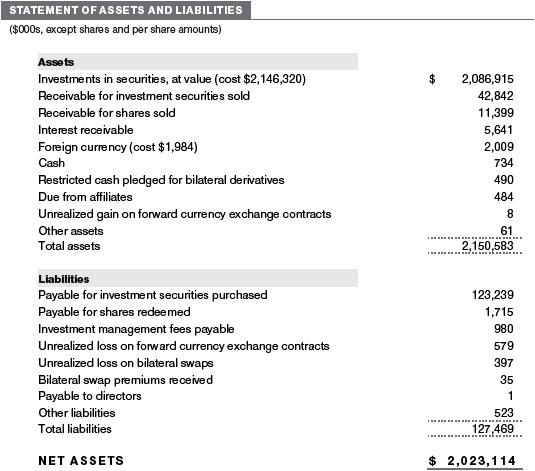
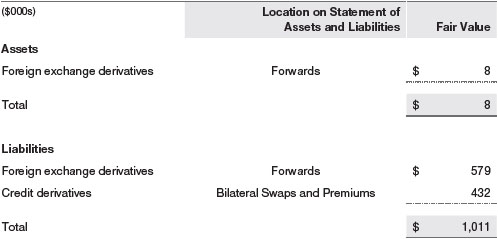
The fund values its derivatives at fair value and recognizes changes in fair value currently in its results of operations. Accordingly, the fund does not follow hedge accounting, even for derivatives employed as economic hedges. Generally, the fund accounts for its derivatives on a gross basis. It does not offset the fair value of derivative liabilities against the fair value of derivative assets on its financial statements, nor does it offset the fair value of derivative instruments against the right to reclaim or obligation to return collateral. The following table summarizes the fair value of the fund’s derivative instruments held as of May 31, 2020, and the related location on the accompanying Statement of Assets and Liabilities, presented by primary underlying risk exposure:
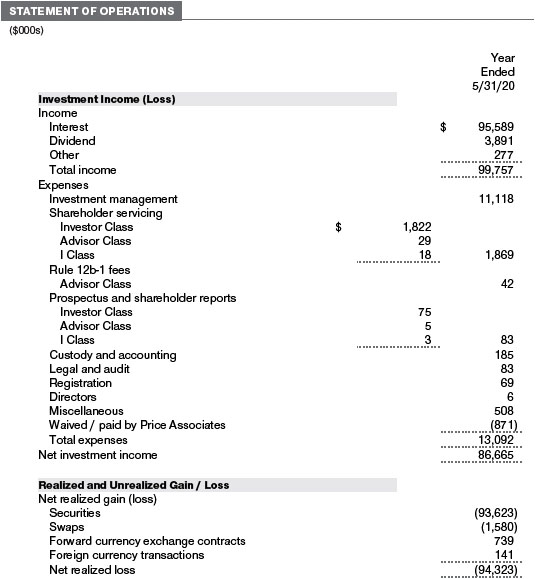
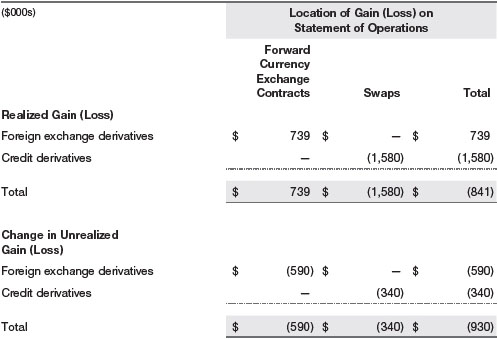
Additionally, the amount of gains and losses on derivative instruments recognized in fund earnings during the year ended May 31, 2020, and the related location on the accompanying Statement of Operations is summarized in the following table by primary underlying risk exposure:
Counterparty Risk and Collateral The fund invests in derivatives, such as bilateral swaps, forward currency exchange contracts, or OTC options, that are transacted and settle directly with a counterparty (bilateral derivatives), and thereby may expose the fund to counterparty risk. To mitigate this risk, the fund has entered into master netting arrangements (MNAs) with certain counterparties that permit net settlement under specified conditions and, for certain counterparties, also require the exchange of collateral to cover mark-to-market exposure. MNAs may be in the form of International Swaps and Derivatives Association master agreements (ISDAs) or foreign exchange letter agreements (FX letters).
MNAs govern the ability to offset amounts the fund owes a counterparty against amounts the counterparty owes the fund (net settlement). Both ISDAs and FX letters generally allow termination of transactions and net settlement upon the occurrence of contractually specified events, such as failure to pay or bankruptcy. In addition, ISDAs specify other events, the occurrence of which would allow one of the parties to terminate. For example, a downgrade in credit rating of a counterparty below a specified rating would allow the fund to terminate, while a decline in the fund’s net assets of more than a specified percentage would allow the counterparty to terminate. Upon termination, all transactions with that counterparty would be liquidated and a net termination amount determined. ISDAs include collateral agreements whereas FX letters do not. Collateral requirements are determined daily based on the net aggregate unrealized gain or loss on all bilateral derivatives with each counterparty, subject to minimum transfer amounts that typically range from $100,000 to $250,000. Any additional collateral required due to changes in security values is typically transferred the next business day.
Collateral may be in the form of cash or debt securities issued by the U.S. government or related agencies. Cash posted by the fund is reflected as cash deposits in the accompanying financial statements and generally is restricted from withdrawal by the fund; securities posted by the fund are so noted in the accompanying Portfolio of Investments; both remain in the fund’s assets. Collateral pledged by counterparties is not included in the fund’s assets because the fund does not obtain effective control over those assets. For bilateral derivatives, collateral posted or received by the fund is held in a segregated account at the fund’s custodian. While typically not sold in the same manner as equity or fixed income securities, OTC and bilateral derivatives may be unwound with counterparties or transactions assigned to other counterparties to allow the fund to exit the transaction. This ability is subject to the liquidity of underlying positions. As of May 31, 2020, cash of $490,000 had been posted by the fund to counterparties for bilateral derivatives. As of May 31, 2020, no collateral was pledged by counterparties to the fund for bilateral derivatives.
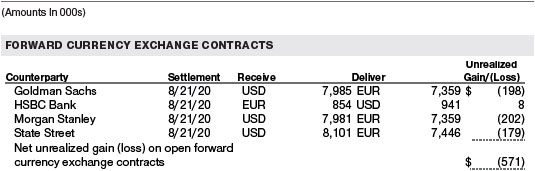
Forward Currency Exchange Contracts The fund is subject to foreign currency exchange rate risk in the normal course of pursuing its investment objectives. It uses forward currency exchange contracts (forwards) primarily to protect its non-U.S. dollar-denominated securities from adverse currency movements and to increase exposure to a particular foreign currency, to shift the fund’s foreign currency exposure from one country to another, or to enhance the fund’s return. A forward involves an obligation to purchase or sell a fixed amount of a specific currency on a future date at a price set at the time of the contract. Although certain forwards may be settled by exchanging only the net gain or loss on the contract, most forwards are settled with the exchange of the underlying currencies in accordance with the specified terms. Forwards are valued at the unrealized gain or loss on the contract, which reflects the net amount the fund either is entitled to receive or obligated to deliver, as measured by the difference between the forward exchange rates at the date of entry into the contract and the forward rates at the reporting date. Appreciated forwards are reflected as assets and depreciated forwards are reflected as liabilities on the accompanying Statement of Assets and Liabilities. Risks related to the use of forwards include the possible failure of counterparties to meet the terms of the agreements; that anticipated currency movements will not occur, thereby reducing the fund’s total return; and the potential for losses in excess of the fund’s initial investment. During the year ended May 31, 2020, the volume of the fund’s activity in forwards, based on underlying notional amounts, was generally between 0% and 2% of net assets.
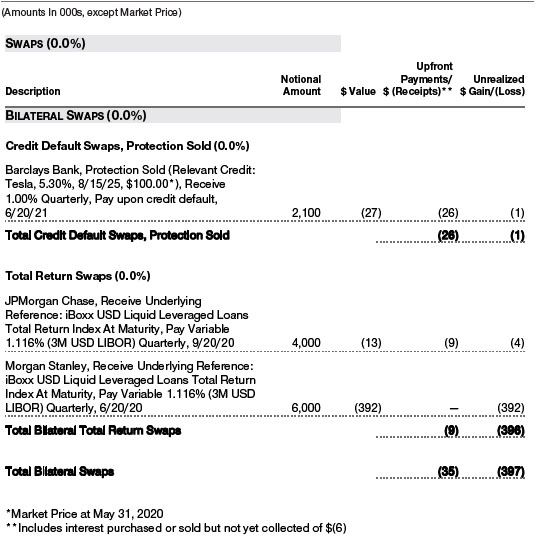
Swaps The fund is subject to credit risk in the normal course of pursuing its investment objectives and uses swap contracts to help manage such risk. The fund may use swaps in an effort to manage both long and short exposure to changes in interest rates, inflation rates, and credit quality; to adjust overall exposure to certain markets; to enhance total return or protect the value of portfolio securities; to serve as a cash management tool; or to adjust portfolio duration and credit exposure. Swap agreements can be settled either directly with the counterparty (bilateral swap) or through a central clearinghouse (centrally cleared swap). Fluctuations in the fair value of a contract are reflected in unrealized gain or loss and are reclassified to realized gain or loss upon contract termination or cash settlement. Net periodic receipts or payments required by a contract increase or decrease, respectively, the value of the contract until the contractual payment date, at which time such amounts are reclassified from unrealized to realized gain or loss. For bilateral swaps, cash payments are made or received by the fund on a periodic basis in accordance with contract terms; unrealized gain on contracts and premiums paid are reflected as assets and unrealized loss on contracts and premiums received are reflected as liabilities on the accompanying Statement of Assets and Liabilities. For bilateral swaps, premiums paid or received are amortized over the life of the swap and are recognized as realized gain or loss in the Statement of Operations. For centrally cleared swaps, payments are made or received by the fund each day to settle the daily fluctuation in the value of the contract (variation margin). Accordingly, the value of a centrally cleared swap included in net assets is the unsettled variation margin; net variation margin receivable is reflected as an asset and net variation margin payable is reflected as a liability on the accompanying Statement of Assets and Liabilities.
Credit default swaps are agreements where one party (the protection buyer) agrees to make periodic payments to another party (the protection seller) in exchange for protection against specified credit events, such as certain defaults and bankruptcies related to an underlying credit instrument, or issuer or index of such instruments. Upon occurrence of a specified credit event, the protection seller is required to pay the buyer the difference between the notional amount of the swap and the value of the underlying credit, either in the form of a net cash settlement or by paying the gross notional amount and accepting delivery of the relevant underlying credit. For credit default swaps where the underlying credit is an index, a specified credit event may affect all or individual underlying securities included in the index and will be settled based upon the relative weighting of the affected underlying security(ies) within the index. Generally, the payment risk for the seller of protection is inversely related to the current market price or credit rating of the underlying credit or the market value of the contract relative to the notional amount, which are indicators of the markets’ valuation of credit quality. As of May 31, 2020, the notional amount of protection sold by the fund totaled $2,100,000 (0.1% of net assets), which reflects the maximum potential amount the fund could be required to pay under such contracts. Risks related to the use of credit default swaps include the possible inability of the fund to accurately assess the current and future creditworthiness of underlying issuers, the possible failure of a counterparty to perform in accordance with the terms of the swap agreements, potential government regulation that could adversely affect the fund’s swap investments, and potential losses in excess of the fund’s initial investment.
Total return swaps are agreements in which one party makes payments based on a set rate, either fixed or variable, while the other party makes payments based on the return of an underlying asset (reference asset), such as an index, equity security, fixed income security or commodity-based exchange-traded fund, which includes both the income it generates and any change in its value. Risks related to the use of total return swaps include the potential for unfavorable changes in the reference asset, the possible failure of a counterparty to perform in accordance with the terms of the swap agreements, potential government regulation that could adversely affect the fund’s swap investments, and potential losses in excess of the fund’s initial investment.
During the year ended May 31, 2020, the volume of the fund’s activity in swaps, based on underlying notional amounts, was generally less than 1% of net assets.
NOTE 4 - OTHER INVESTMENT TRANSACTIONS
Consistent with its investment objective, the fund engages in the following practices to manage exposure to certain risks and/or to enhance performance. The investment objective, policies, program, and risk factors of the fund are described more fully in the fund’s prospectus and Statement of Additional Information.
Noninvestment-Grade Debt The fund invests, either directly or through its investment in other T. Rowe Price funds, in noninvestment-grade debt, including “high yield” or “junk” bonds or leveraged loans. Noninvestment-grade debt issuers are more likely to suffer an adverse change in financial condition that would result in the inability to meet a financial obligation. The noninvestment-grade debt market may experience sudden and sharp price swings due to a variety of factors that may decrease the ability of issuers to make principal and interest payments and adversely affect the liquidity or value, or both, of such securities. Accordingly, securities issued by such companies carry a higher risk of default and should be considered speculative.
Restricted Securities The fund invests in securities that are subject to legal or contractual restrictions on resale. Prompt sale of such securities at an acceptable price may be difficult and may involve substantial delays and additional costs.
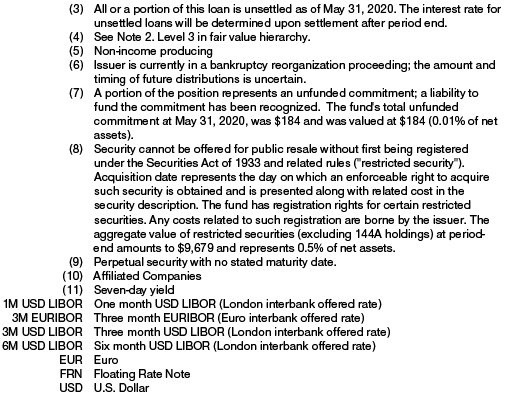
Bank Loans The fund invests in bank loans, which represent an interest in amounts owed by a borrower to a syndicate of lenders. Bank loans are generally noninvestment grade and often involve borrowers whose financial condition is highly leveraged. Bank loans may be in the form of either assignments or participations. A loan assignment transfers all legal, beneficial, and economic rights to the buyer, and transfer typically requires consent of both the borrower and agent. In contrast, a loan participation generally entitles the buyer to receive the cash flows from principal, interest, and any fee payments on a portion of a loan; however, the seller continues to hold legal title to that portion of the loan. As a result, the buyer of a loan participation generally has no direct recourse against the borrower and is exposed to credit risk of both the borrower and seller of the participation. Bank loans often have extended settlement periods, generally may be repaid at any time at the option of the borrower, and may require additional principal to be funded at the borrowers’ discretion at a later date (e.g. unfunded commitments and revolving debt instruments). Until settlement, the fund maintains liquid assets sufficient to settle its unfunded loan commitments. The fund reflects both the funded portion of a bank loan as well as its unfunded commitment in the Portfolio of Investments. However, if a credit agreement provides no initial funding of a tranche and funding of the full commitment at a future date(s) is at the borrower’s discretion and considered uncertain, a loan is reflected in the Portfolio of Investments only if, and only to the extent that, the fund has actually settled a funding commitment.
Other Purchases and sales of portfolio securities other than short-term securities aggregated $1,783,040,000 and $1,357,640,000, respectively, for the year ended May 31, 2020.
NOTE 5 - FEDERAL INCOME TAXES
No provision for federal income taxes is required since the fund intends to continue to qualify as a regulated investment company under Subchapter M of the Internal Revenue Code and distribute to shareholders all of its taxable income and gains. Distributions determined in accordance with federal income tax regulations may differ in amount or character from net investment income and realized gains for financial reporting purposes.
The fund files U.S. federal, state, and local tax returns as required. The fund’s tax returns are subject to examination by the relevant tax authorities until expiration of the applicable statute of limitations, which is generally three years after the filing of the tax return but which can be extended to six years in certain circumstances. Tax returns for open years have incorporated no uncertain tax positions that require a provision for income taxes.
Financial reporting records are adjusted for permanent book/tax differences to reflect tax character but are not adjusted for temporary differences. The permanent book/tax adjustments have no impact on results of operations or net assets and relate primarily to the character of premium payments and unrealized gains and losses on swaps.
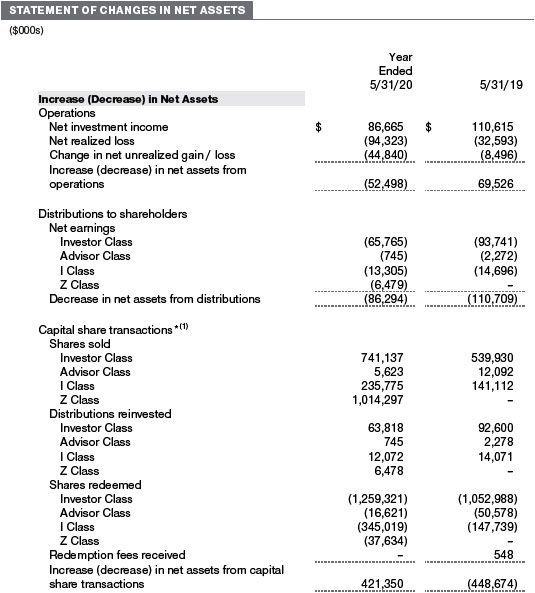
Distributions during the years ended May 31, 2020 and May 31, 2019, totaled $86,294,000 and $110,709,000, respectively, and were characterized as ordinary income for tax purposes. At May 31, 2020, the tax-basis cost of investments, including derivatives, and components of net assets were as follows:
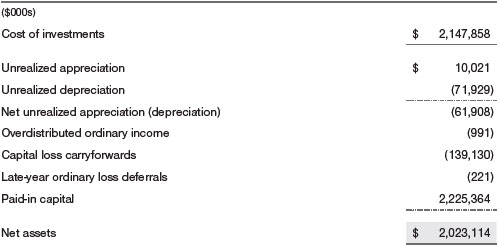
The difference between book-basis and tax-basis net unrealized appreciation (depreciation) is attributable to the deferral of losses from wash sales for tax purposes. The fund intends to retain realized gains to the extent of available capital loss carryforwards. Net realized capital losses may be carried forward indefinitely to offset future realized capital gains. In accordance with federal tax laws applicable to investment companies, all or a portion of losses resulting from (a) net specified losses realized between November 1 and the fund’s fiscal year-end or (b) ordinary losses realized between January 1 and the fund’s fiscal year-end are not recognized for tax purposes until the subsequent year (late-year ordinary loss deferrals); however, such losses are recognized for financial reporting purposes in the year realized.
NOTE 6 - RELATED PARTY TRANSACTIONS
The fund is managed by T. Rowe Price Associates, Inc. (Price Associates), a wholly owned subsidiary of T. Rowe Price Group, Inc. (Price Group). The investment management agreement between the fund and Price Associates provides for an annual investment management fee, which is computed daily and paid monthly. The fee consists of an individual fund fee, equal to 0.30% of the fund’s average daily net assets, and a group fee. The group fee rate is calculated based on the combined net assets of certain mutual funds sponsored by Price Associates (the group) applied to a graduated fee schedule, with rates ranging from 0.48% for the first $1 billion of assets to 0.260% for assets in excess of $845 billion. The fund’s group fee is determined by applying the group fee rate to the fund’s average daily net assets. The fee is computed daily and paid monthly. At May 31, 2020, the effective annual group fee rate was 0.29%.
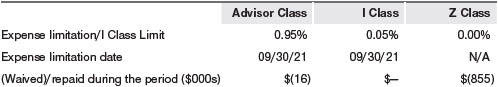
The Advisor Class is subject to a contractual expense limitation through the expense limitation date indicated in the table below. During the limitation period, Price Associates is required to waive its management fee or pay any expenses (excluding interest; expenses related to borrowings, taxes, and brokerage; and other non-recurring expenses permitted by the investment management agreement) that would otherwise cause the class’s ratio of annualized total expenses to average net assets (net expense ratio) to exceed its expense limitation. The class is required to repay Price Associates for expenses previously waived/paid to the extent the class’s net assets grow or expenses decline sufficiently to allow repayment without causing the class’s net expense ratio (after the repayment is taken into account) to exceed the lesser of: (1) the expense limitation in place at the time such amounts were waived; or (2) the class’s current expense limitation. However, no repayment will be made more than three years after the date of a payment or waiver.
The I Class is also subject to an operating expense limitation (I Class Limit) pursuant to which Price Associates is contractually required to pay all operating expenses of the I Class, excluding management fees; interest; expenses related to borrowings, taxes, and brokerage; and other non-recurring expenses permitted by the investment management agreement, to the extent such operating expenses, on an annualized basis, exceed the I Class Limit. This agreement will continue through the expense limitation date indicated in the table below, and may be renewed, revised, or revoked only with approval of the fund’s Board. The I Class is required to repay Price Associates for expenses previously paid to the extent the class’s net assets grow or expenses decline sufficiently to allow repayment without causing the class’s operating expenses (after the repayment is taken into account) to exceed the lesser of: (1) the I Class Limit in place at the time such amounts were paid; or (2) the current I Class Limit. However, no repayment will be made more than three years after the date of a payment or waiver.
The Z Class is also subject to a contractual expense limitation agreement whereby Price Associates has agreed to waive and/or bear all of the Z Class’ expenses (excluding interest; expenses related to borrowings, taxes, and brokerage; and nonrecurring expenses) in their entirety. This fee waiver and/or expense reimbursement arrangement is expected to remain in place indefinitely, and the agreement may only be amended or terminated with approval by the fund’s Board.
Pursuant to these agreements, expenses were waived/paid by and/or repaid to Price Associates during the year ended May 31, 2020 as indicated in the table below. Including these amounts, expenses previously waived/paid by Price Associates in the amount of $115,000 remain subject to repayment by the fund at May 31, 2020. Any repayment of expenses previously waived/paid by Price Associates during the period would be included in the net investment income and expense ratios presented on the accompanying Financial Highlights.
In addition, the fund has entered into service agreements with Price Associates and two wholly owned subsidiaries of Price Associates, each an affiliate of the fund (collectively, Price). Price Associates provides certain accounting and administrative services to the fund. T. Rowe Price Services, Inc. provides shareholder and administrative services in its capacity as the fund’s transfer and dividend-disbursing agent. T. Rowe Price Retirement Plan Services, Inc. provides subaccounting and recordkeeping services for certain retirement accounts invested in the Investor Class. For the year ended May 31, 2020, expenses incurred pursuant to these service agreements were $71,000 for Price Associates; $207,000 for T. Rowe Price Services, Inc.; and $5,000 for T. Rowe Price Retirement Plan Services, Inc. All amounts due to and due from Price, exclusive of investment management fees payable, are presented net on the accompanying Statement of Assets and Liabilities.
The fund is also one of several mutual funds sponsored by Price Associates (underlying Price Funds) in which the T. Rowe Price Spectrum Funds (Spectrum Funds) and T. Rowe Price Retirement Funds (Retirement Funds) may invest. None of the Spectrum Funds or Retirement Funds invest in the underlying Price Funds for the purpose of exercising management or control. Pursuant to special servicing agreements, expenses associated with the operation of the Spectrum Funds and Retirement Funds are borne by each underlying Price Fund to the extent of estimated savings to it and in proportion to the average daily value of its shares owned by the Spectrum Funds and Retirement Funds. This special servicing agreement between the fund and the Retirement Funds terminated on April 7, 2020. Expenses allocated under these special servicing agreements are reflected as shareholder servicing expense in the accompanying financial statements. For the year ended May 31, 2020, the fund was allocated $378,000 of Spectrum Funds’ expenses and $713,000 of Retirement Funds’ expenses. Of these amounts, $509,000 related to services provided by Price. All amounts due to and due from Price, exclusive of investment management fees payable, are presented net on the accompanying Statement of Assets and Liabilities. At May 31, 2020, approximately 42% of the outstanding shares of the Investor Class were held by the Spectrum Funds.
In addition, other mutual funds, trusts, and other accounts managed by Price Associates or its affiliates (collectively, Price Funds and accounts) may invest in the fund and are not subject to the special servicing agreements disclosed above. No Price fund or account may invest for the purpose of exercising management or control over the fund. At May 31, 2020, approximately 100% of the Z Class’s outstanding shares were held by Price Funds and accounts.
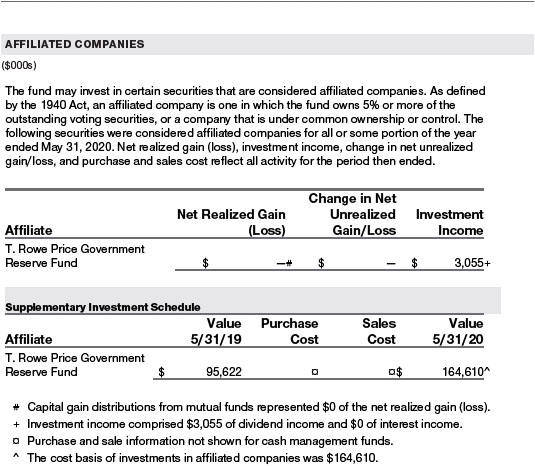
The fund may invest its cash reserves in certain open-end management investment companies managed by Price Associates and considered affiliates of the fund: the T. Rowe Price Government Reserve Fund or the T. Rowe Price Treasury Reserve Fund, organized as money market funds, or the T. Rowe Price Short-Term Fund, a short-term bond fund (collectively, the Price Reserve Funds). The Price Reserve Funds are offered as short-term investment options to mutual funds, trusts, and other accounts managed by Price Associates or its affiliates and are not available for direct purchase by members of the public. Cash collateral from securities lending is invested in the T. Rowe Price Short-Term Fund. The Price Reserve Funds pay no investment management fees.
The fund may participate in securities purchase and sale transactions with other funds or accounts advised by Price Associates (cross trades), in accordance with procedures adopted by the fund’s Board and Securities and Exchange Commission rules, which require, among other things, that such purchase and sale cross trades be effected at the independent current market price of the security. During the year ended May 31, 2020, the fund had no purchases or sales cross trades with other funds or accounts advised by Price Associates.
NOTE 7 - BORROWING
The fund may borrow to provide temporary liquidity. The fund, along with several other T. Rowe Price-sponsored mutual funds (collectively, the participating funds), has entered into a $800 million, 364-day, syndicated credit facility (the facility) pursuant to which the participating funds may borrow on a first-come, first-served basis up to the full amount of the facility. Interest is charged to the borrowing fund at a rate equal to 1.00% plus the Federal Funds rate. A commitment fee, equal to 0.15% per annum of the average daily undrawn commitment is accrued daily and paid quarterly; legal and administrative fees are recognized as incurred. All fees are allocated to the participating funds based on each fund’s relative net assets and are reflected as a component of interest expense in the accompanying financial statements. Loans are generally unsecured; however, the fund must collateralize any borrowings under the facility on an equivalent basis if it has other collateralized borrowings. During the year ended May 31, 2020, the fund incurred $432,000 in commitment fees. At May 31, 2020, the fund had no borrowings outstanding under the facility, and the undrawn amount of the facility was $800,000,000.
NOTE 8 - OTHER MATTERS
Unpredictable events such as environmental or natural disasters, war, terrorism, pandemics, outbreaks of infectious diseases, and similar public health threats may significantly affect the economy and the markets and issuers in which a fund invests. Certain events may cause instability across global markets, including reduced liquidity and disruptions in trading markets, while some events may affect certain geographic regions, countries, sectors, and industries more significantly than others, and exacerbate other pre-existing political, social, and economic risks.
These types of events may also cause widespread fear and uncertainty, and result in, among other things: quarantines and travel restrictions, including border closings; disruptions to business operations and supply chains; exchange trading suspensions and closures, and overall reduced liquidity of securities, derivatives, and commodities trading markets; reductions in consumer demand and economic output; and significant challenges in healthcare service preparation and delivery. The funds could be negatively impacted if the value of a portfolio holding were harmed by such political or economic conditions or events. In addition, the operations of the funds, their investment advisers, and the funds’ service providers may be significantly impacted, or even temporarily halted, as a result of extensive employee illnesses or unavailability, government quarantine measures, and restrictions on travel or meetings and other factors related to public emergencies. Recently, a novel strain of coronavirus (COVID-19) has resulted in disruptions to global business activity and caused significant volatility and declines in global financial markets.
Governmental and quasi-governmental authorities and regulators have in the past responded to major economic disruptions with a variety of significant fiscal and monetary policy changes, including but not limited to, direct capital infusions into companies, new monetary programs, and dramatically lower interest rates. An unexpected or quick reversal of these policies, or the ineffectiveness of these policies, could negatively impact overall investor sentiment and further increase volatility in securities markets.
REPORT OF INDEPENDENT REGISTERED PUBLIC ACCOUNTING FIRM
To the Board of Directors and Shareholders of
T. Rowe Price Floating Rate Fund, Inc.
Opinion on the Financial Statements
We have audited the accompanying statement of assets and liabilities, including the portfolio of investments, of T. Rowe Price Floating Rate Fund, Inc. (the “Fund”) as of May 31, 2020, the related statement of operations for the year ended May 31, 2020, the statement of changes in net assets for each of the two years in the period ended May 31, 2020, including the related notes, and the financial highlights for each of the periods indicated therein (collectively referred to as the “financial statements”). In our opinion, the financial statements present fairly, in all material respects, the financial position of the Fund as of May 31, 2020, the results of its operations for the year then ended, the changes in its net assets for each of the two years in the period ended May 31, 2020 and the financial highlights for each of the periods indicated therein, in conformity with accounting principles generally accepted in the United States of America.
Basis for Opinion
These financial statements are the responsibility of the Fund’s management. Our responsibility is to express an opinion on the Fund’s financial statements based on our audits. We are a public accounting firm registered with the Public Company Accounting Oversight Board (United States) (PCAOB) and are required to be independent with respect to the Fund in accordance with the U.S. federal securities laws and the applicable rules and regulations of the Securities and Exchange Commission and the PCAOB.
We conducted our audits of these financial statements in accordance with the standards of the PCAOB. Those standards require that we plan and perform the audit to obtain reasonable assurance about whether the financial statements are free of material misstatement, whether due to error or fraud.
Our audits included performing procedures to assess the risks of material misstatement of the financial statements, whether due to error or fraud, and performing procedures that respond to those risks. Such procedures included examining, on a test basis, evidence regarding the amounts and disclosures in the financial statements. Our audits also included evaluating the accounting principles used and significant estimates made by management, as well as evaluating the overall presentation of the financial statements. Our procedures included confirmation of securities owned as of May 31, 2020 by correspondence with the custodians, transfer agent and brokers; when replies were not received from brokers, we performed other auditing procedures. We believe that our audits provide a reasonable basis for our opinion.
PricewaterhouseCoopers LLP
Baltimore, Maryland
July 17, 2020
We have served as the auditor of one or more investment companies in the T. Rowe Price group of investment companies since 1973.
TAX INFORMATION (UNAUDITED) FOR THE TAX YEAR ENDED 5/31/20
We are providing this information as required by the Internal Revenue Code. The amounts shown may differ from those elsewhere in this report because of differences between tax and financial reporting requirements.
For taxable non-corporate shareholders, $517,000 of the fund’s income represents qualified dividend income subject to a long-term capital gains tax rate of not greater than 20%.
For corporate shareholders, $517,000 of the fund’s income qualifies for the dividends received deduction.
INFORMATION ON PROXY VOTING POLICIES, PROCEDURES, AND RECORDS
A description of the policies and procedures used by T. Rowe Price funds and portfolios to determine how to vote proxies relating to portfolio securities is available in each fund’s Statement of Additional Information. You may request this document by calling 1-800-225-5132 or by accessing the SEC’s website, sec.gov.
The description of our proxy voting policies and procedures is also available on our corporate website. To access it, please visit the following Web page:
https://www.troweprice.com/corporate/en/utility/policies.html
Scroll down to the section near the bottom of the page that says, “Proxy Voting Policies.” Click on the Proxy Voting Policies link in the shaded box.
Each fund’s most recent annual proxy voting record is available on our website and through the SEC’s website. To access it through T. Rowe Price, visit the website location shown above, and scroll down to the section near the bottom of the page that says, “Proxy Voting Records.” Click on the Proxy Voting Records link in the shaded box.
HOW TO OBTAIN QUARTERLY PORTFOLIO HOLDINGS
Effective for reporting periods on or after March 1, 2019, a fund, except a money market fund, files a complete schedule of portfolio holdings with the Securities and Exchange Commission (SEC) for the first and third quarters of each fiscal year as an exhibit to its reports on Form N-PORT. Prior to March 1, 2019, a fund, including a money market fund, filed a complete schedule of portfolio holdings with the SEC for the first and third quarters of each fiscal year on Form N-Q. A money market fund files detailed month-end portfolio holdings information on Form N-MFP with the SEC each month and posts a complete schedule of portfolio holdings on its website (troweprice.com) as of each month-end for the previous six months. A fund’s Forms N-PORT, N-MFP, and N-Q are available electronically on the SEC’s website (sec.gov).
APPROVAL OF INVESTMENT MANAGEMENT AGREEMENT
Each year, the fund’s Board of Directors (Board) considers the continuation of the investment management agreement (Advisory Contract) between the fund and its investment advisor, T. Rowe Price Associates, Inc. (Advisor), on behalf of the fund. In that regard, at a meeting held on March 9–10, 2020 (Meeting), the Board, including all of the fund’s independent directors, approved the continuation of the fund’s Advisory Contract. At the Meeting, the Board considered the factors and reached the conclusions described below relating to the selection of the Advisor and the approval of the Advisory Contract. The independent directors were assisted in their evaluation of the Advisory Contract by independent legal counsel from whom they received separate legal advice and with whom they met separately.
In providing information to the Board, the Advisor was guided by a detailed set of requests for information submitted by independent legal counsel on behalf of the independent directors. In considering and approving the Advisory Contract, the Board considered the information it believed was relevant, including, but not limited to, the information discussed below. The Board considered not only the specific information presented in connection with the Meeting but also the knowledge gained over time through interaction with the Advisor about various topics. The Board meets regularly and, at each of its meetings, covers an extensive agenda of topics and materials and considers factors that are relevant to its annual consideration of the renewal of the T. Rowe Price funds’ advisory contracts, including performance and the services and support provided to the funds and their shareholders.
Services Provided by the Advisor
The Board considered the nature, quality, and extent of the services provided to the fund by the Advisor. These services included, but were not limited to, directing the fund’s investments in accordance with its investment program and the overall management of the fund’s portfolio, as well as a variety of related activities such as financial, investment operations, and administrative services; compliance; maintaining the fund’s records and registrations; and shareholder communications. The Board also reviewed the background and experience of the Advisor’s senior management team and investment personnel involved in the management of the fund, as well as the Advisor’s compliance record. The Board concluded that it was satisfied with the nature, quality, and extent of the services provided by the Advisor.
Investment Performance of the Fund
The Board took into account discussions with the Advisor and reports that it receives throughout the year relating to fund performance. In connection with the Meeting, the Board reviewed the fund’s net annualized total returns for the one-, two-, three-, four-, and five-year periods as of September 30, 2019, and compared these returns with the performance of a peer group of funds with similar investment programs and a wide variety of other previously agreed-upon comparable performance measures and market data, including those supplied by Broadridge, which is an independent provider of mutual fund data.
On the basis of this evaluation and the Board’s ongoing review of investment results, and factoring in the relative market conditions during certain of the performance periods, the Board concluded that the fund’s performance was satisfactory.
Costs, Benefits, Profits, and Economies of Scale
The Board reviewed detailed information regarding the revenues received by the Advisor under the Advisory Contract and other benefits that the Advisor (and its affiliates) may have realized from its relationship with the fund, including any research received under “soft dollar” agreements and commission-sharing arrangements with broker-dealers. The Board considered that the Advisor may have received some benefit from soft-dollar arrangements pursuant to which research is received from broker-dealers that execute the fund’s portfolio transactions. However, the Board also considered that, effective January 2020, the Advisor began bearing the cost of research services for all client accounts that it advises, including the T. Rowe Price funds. The Board received information on the estimated costs incurred and profits realized by the Advisor from managing the T. Rowe Price funds. The Board also reviewed estimates of the profits realized from managing the fund in particular, and the Board concluded that the Advisor’s profits were reasonable in light of the services provided to the fund.
The Board also considered whether the fund benefits under the fee levels set forth in the Advisory Contract from any economies of scale realized by the Advisor. Under the Advisory Contract, the fund pays a fee to the Advisor for investment management services composed of two components—a group fee rate based on the combined average net assets of most of the T. Rowe Price funds (including the fund) that declines at certain asset levels and an individual fund fee rate based on the fund’s average daily net assets—and the fund pays its own expenses of operations (subject to expense limitations agreed to by the Advisor with respect to the Advisor Class and I Class). At the Meeting, the Board approved an additional 0.005% breakpoint to the group fee schedule, effective May 1, 2020. With the new breakpoint, the group fee rate will decline to 0.260% when the combined average net assets of the applicable T. Rowe Price funds exceed $845 billion. The Board concluded that the advisory fee structure for the fund continued to provide for a reasonable sharing of benefits from any economies of scale with the fund’s investors.
Fees and Expenses
The Board was provided with information regarding industry trends in management fees and expenses. Among other things, the Board reviewed data for peer groups that were compiled by Broadridge, which compared: (i) contractual management fees, total expenses, actual management fees, and nonmanagement expenses of the Investor Class of the fund with a group of competitor funds selected by Broadridge (Investor Class Expense Group); (ii) total expenses and actual management fees of the Advisor Class of the fund with a group of competitor funds selected by Broadridge (Advisor Class Expense Group); and (iii) total expenses, actual management fees, and nonmanagement expenses of the Investor Class of the fund with a broader set of funds within the Lipper investment classification (Expense Universe). The Board considered the fund’s contractual management fee rate, actual management fee rate (which reflects the management fees actually received from the fund by the Advisor after any applicable waivers, reductions, or reimbursements), operating expenses, and total expenses (which reflect the net total expense ratio of the fund after any waivers, reductions, or reimbursements) in comparison with the information for the Broadridge peer groups. Broadridge generally constructed the peer groups by seeking the most comparable funds based on similar investment classifications and objectives, expense structure, asset size, and operating components and attributes and ranked funds into quintiles, with the first quintile representing the funds with the lowest relative expenses and the fifth quintile representing the funds with the highest relative expenses. The information provided to the Board indicated that the fund’s contractual management fee ranked in the second quintile (Investor Class Expense Group); the fund’s actual management fee rate ranked in the second quintile (Investor Class Expense Group and Expense Universe) and first quintile (Advisor Class Expense Group); and the fund’s total expenses ranked in the second quintile (Investor Class Expense Group), second and third quintiles (Expense Universe), and first quintile (Advisor Class Expense Group).
The Board also reviewed the fee schedules for other investment portfolios with similar mandates that are advised or subadvised by the Advisor and its affiliates, including separately managed accounts for institutional and individual investors; subadvised funds; and other sponsored investment portfolios, including collective investment trusts and pooled vehicles organized and offered to investors outside the United States. Management provided the Board with information about the Advisor’s responsibilities and services provided to subadvisory and other institutional account clients, including information about how the requirements and economics of the institutional business are fundamentally different from those of the mutual fund business. The Board considered information showing that the Advisor’s mutual fund business is generally more complex from a business and compliance perspective than its institutional account business and considered various relevant factors, such as the broader scope of operations and oversight, more extensive shareholder communication infrastructure, greater asset flows, heightened business risks, and differences in applicable laws and regulations associated with the Advisor’s proprietary mutual fund business. In assessing the reasonableness of the fund’s management fee rate, the Board considered the differences in the nature of the services required for the Advisor to manage its mutual fund business versus managing a discrete pool of assets as a subadvisor to another institution’s mutual fund or for an institutional account and that the Advisor generally performs significant additional services and assumes greater risk in managing the fund and other T. Rowe Price funds than it does for institutional account clients.
On the basis of the information provided and the factors considered, the Board concluded that the fees paid by the fund under the Advisory Contract are reasonable.
Approval of the Advisory Contract
As noted, the Board approved the continuation of the Advisory Contract. No single factor was considered in isolation or to be determinative to the decision. Rather, the Board concluded, in light of a weighting and balancing of all factors considered, that it was in the best interests of the fund and its shareholders for the Board to approve the continuation of the Advisory Contract (including the fees to be charged for services thereunder).
LIQUIDITY RISK MANAGEMENT PROGRAM
In accordance with Rule 22e-4 (Liquidity Rule) under the Investment Company Act of 1940, as amended, the fund has established a liquidity risk management program (Liquidity Program) reasonably designed to assess and manage the fund’s liquidity risk, which generally represents the risk that the fund would not be able to meet redemption requests without significant dilution of remaining investors’ interests in the fund. The fund’s Board of Directors (Board) has appointed the fund’s investment advisor, T. Rowe Price Associates, Inc. (Price Associates), as the administrator of the Liquidity Program. As administrator, Price Associates is responsible for overseeing the day-to-day operations of the Liquidity Program and, among other things, is responsible for assessing, managing, and reviewing with the Board at least annually the liquidity risk of each T. Rowe Price fund. Price Associates has delegated oversight of the Liquidity Program to a Liquidity Risk Committee (LRC), which is a cross-functional committee composed of personnel from multiple departments within Price Associates.
The Liquidity Program’s principal objectives include supporting the T. Rowe Price funds’ compliance with limits on investments in illiquid assets and mitigating the risk that the fund will be unable to timely meet its redemption obligations. The Liquidity Program also includes a number of elements that support the management and assessment of liquidity risk, including an annual assessment of factors that influence the fund’s liquidity and the periodic classification and reclassification of a fund’s investments into categories that reflect the LRC’s assessment of their relative liquidity under current market conditions. Under the Liquidity Program, every investment held by the fund is classified at least monthly into one of four liquidity categories based on estimations of the investment’s ability to be sold during designated time frames in current market conditions without significantly changing the investment’s market value.
As required by the Liquidity Rule, at a meeting held on May 4, 2020, the Board was presented with an annual assessment prepared by the LRC, on behalf of Price Associates, that addressed the operation of the Liquidity Program and assessed its adequacy and effectiveness of implementation, including any material changes to the Liquidity Program and the determination of each fund’s Highly Liquid Investment Minimum (HLIM). The annual assessment included consideration of the following factors, as applicable: the fund’s investment strategy and liquidity of portfolio investments during normal and reasonably foreseeable stressed conditions, including whether the investment strategy is appropriate for an open-end fund, the extent to which the strategy involves a relatively concentrated portfolio or large positions in particular issuers, and the use of borrowings for investment purposes and derivatives; short-term and long-term cash flow projections covering both normal and reasonably foreseeable stressed conditions; and holdings of cash and cash equivalents, as well as available borrowing arrangements.
For the fund and other T. Rowe Price funds, the annual assessment incorporated a report related to a fund’s holdings, shareholder and portfolio concentration, any borrowings during the period, cash flow projections, and other relevant data for the period of June 1, 2019, through March 31, 2020. The report described the methodology for classifying a fund’s investments (including derivative transactions) into one of four liquidity categories, as well as the percentage of a fund’s investments assigned to each category. It also explained the methodology for establishing a fund’s HLIM and noted that the LRC reviews the HLIM assigned to each fund no less frequently than annually.
Certain provisions of the Liquidity Program initially became effective on December 1, 2018, and the full Liquidity Program was formally approved by the Board in April 2019. During the period covered by the annual assessment, the LRC has concluded, and reported to the Board, that the Liquidity Program since its implementation has operated adequately and effectively and is reasonably designed to assess and manage the fund’s liquidity risk.
ABOUT THE FUND’S DIRECTORS AND OFFICERS
Your fund is overseen by a Board of Directors (Board) that meets regularly to review a wide variety of matters affecting or potentially affecting the fund, including performance, investment programs, compliance matters, advisory fees and expenses, service providers, and business and regulatory affairs. The Board elects the fund’s officers, who are listed in the final table. At least 75% of the Board’s members are considered to be independent, i.e., not “interested persons” as defined in Section 2(a)(19) of the 1940 Act, of the Boards of T. Rowe Price Associates, Inc. (T. Rowe Price), and its affiliates; “inside” or “interested” directors are employees or officers of T. Rowe Price. The business address of each director and officer is 100 East Pratt Street, Baltimore, Maryland 21202. The Statement of Additional Information includes additional information about the fund directors and is available without charge by calling a T. Rowe Price representative at 1-800-638-5660.
| INDEPENDENT DIRECTORS(a) |
| |
Name
(Year of Birth)
Year Elected
[Number of T. Rowe Price
Portfolios Overseen] | | Principal Occupation(s) and Directorships of Public Companies and Other Investment Companies During the Past Five Years |
| | | |
Teresa Bryce Bazemore
(1959)
2018
[185] | | President, Radian Guaranty (2008 to 2017); Chief Executive Officer, Bazemore Consulting LLC (2018 to present); Director, Chimera Investment Corporation (2017 to present); Director, Federal Home Loan Bank of Pittsburgh (2017 to February 2019) |
| | | |
Ronald J. Daniels
(1959)
2018
[185] | | President, The Johns Hopkins University(b) and Professor, Political Science Department, The Johns Hopkins University (2009 to present); Director, Lyndhurst Holdings (2015 to present); Director, BridgeBio Pharma, Inc. (2020 to present) |
| | | |
Bruce W. Duncan
(1951)
2013
[185] | | Chief Executive Officer and Director (January 2009 to December 2016), Chairman of the Board (January 2016 to present), and President (January 2009 to September 2016), First Industrial Realty Trust, an owner and operator of industrial properties; Chairman of the Board (2005 to September 2016) and Director (1999 to September 2016), Starwood Hotels & Resorts, a hotel and leisure company; Member, Investment Company Institute Board of Governors (2017 to December 2019); Member, Independent Directors Council Governing Board (2017 to December 2019); Senior Advisor, KKR (November 2018 to present); Director, Boston Properties (May 2016 to present); Director, Marriott International, Inc. (September 2016 to present) |
| | | |
Robert J. Gerrard, Jr.
(1952)
2013
[185] | | Advisory Board Member, Pipeline Crisis/Winning Strategies, a collaborative working to improve opportunities for young African Americans (1997 to January 2016); Chairman of the Board, all funds (July 2018 to present) |
| | | |
Paul F. McBride
(1956)
2013
[185] | | Advisory Board Member, Vizzia Technologies (2015 to present); Board Member, Dunbar Armored (2012 to 2018) |
| | | |
Cecilia E. Rouse, Ph.D.
(1963)
2013
[185] | | Dean, Woodrow Wilson School (2012 to present); Professor and Researcher, Princeton University (1992 to present); Director, MDRC, a nonprofit education and social policy research organization (2011 to present); Member, National Academy of Education (2010 to present); Research Associate of Labor Studies Program at the National Bureau of Economic Research (2011 to 2015); Board Member, National Bureau of Economic Research (2011 to present); Chair of Committee on the Status of Minority Groups in the Economic Profession of the American Economic Association (2012 to 2018); Vice President (2015 to 2016) and Board Member (2018 to present), American Economic Association |
| | | |
John G. Schreiber
(1946)
2011
[185] | | Owner/President, Centaur Capital Partners, Inc., a real estate investment company (1991 to present); Cofounder, Partner, and Cochairman of the Investment Committee, Blackstone Real Estate Advisors, L.P. (1992 to 2015); Director, Blackstone Mortgage Trust, a real estate finance company (2012 to 2016); Director and Chairman of the Board, Brixmor Property Group, Inc. (2013 to present); Director, Hilton Worldwide (2007 to present); Director, Hudson Pacific Properties (2014 to 2016); Director, Invitation Homes (2014 to 2017); Director, JMB Realty Corporation (1980 to present) |
| | | |
| (a)All information about the independent directors was current as of December 31, 2019, unless otherwise indicated, except for the number of portfolios overseen, which is current as of the date of this report. |
| (b)William J. Stromberg, president and chief executive officer of T. Rowe Price Group, Inc., the parent company of the Price Funds’ investment advisor, has served on the Board of Trustees of Johns Hopkins University since 2014. |
| INSIDE DIRECTORS(a) |
| |
Name
(Year of Birth)
Year Elected
[Number of T. Rowe Price
Portfolios Overseen] | | Principal Occupation(s) and Directorships of Public Companies and Other Investment Companies During the Past Five Years |
| | | |
David Oestreicher
(1967)
2018
[185] | | Chief Legal Officer, Vice President, and Secretary, T. Rowe Price Group, Inc.; Director, Vice President, and Secretary, T. Rowe Price Investment Services, Inc., T. Rowe Price Retirement Plan Services, Inc., T. Rowe Price Services, Inc., and T. Rowe Price Trust Company; Vice President and Secretary, T. Rowe Price, T. Rowe Price Hong Kong (Price Hong Kong), and T. Rowe Price International; Vice President, T. Rowe Price Japan (Price Japan) and T. Rowe Price Singapore (Price Singapore); Principal Executive Officer and Executive Vice President, all funds |
| | | |
Robert W. Sharps, CFA, CPA
(1971)
2019
[185] | | Director and Vice President, T. Rowe Price; Vice President, T. Rowe Price Group, Inc., and T. Rowe Price Trust Company |
| | | |
| (a)All information about the inside directors was current as of December 31, 2019, unless otherwise indicated, except for the number of portfolios overseen, which is current as of the date of this report. |
| OFFICERS |
| |
Name (Year of Birth)
Position Held With Floating Rate Fund | | Principal Occupation(s) |
| | | |
Jason A. Bauer (1979)
Vice President | | Vice President, T. Rowe Price and T. Rowe Price Group, Inc. |
| | | |
Darrell N. Braman (1963)
Vice President and Secretary | | Vice President, Price Hong Kong, Price Singapore, T. Rowe Price, T. Rowe Price Group, Inc., T. Rowe Price International, T. Rowe Price Investment Services, Inc., and T. Rowe Price Services, Inc. |
| | | |
Brian E. Burns (1960)
Vice President | | Vice President, T. Rowe Price, T. Rowe Price Group, Inc., and T. Rowe Price Trust Company |
| | | |
Michael F. Connelly, CFA (1977)
Vice President | | Vice President, T. Rowe Price and T. Rowe Price Group, Inc. |
| | | |
Alan S. Dupski, CPA (1982)
Principal Financial Officer, Vice President,
and Treasurer | | Vice President, T. Rowe Price and T. Rowe Price Group, Inc.; formerly, Assistant Chief Accountant, Division of Investment Management, U.S. Securities and Exchange Commission (to 2015) |
| | | |
Stephen M. Finamore, CFA (1976)
Vice President | | Vice President, T. Rowe Price and T. Rowe Price Group, Inc. |
| | | |
Justin T. Gerbereux, CFA (1975)
Vice President | | Vice President, T. Rowe Price, T. Rowe Price Group, Inc., and T. Rowe Price Trust Company |
| | | |
John R. Gilner (1961)
Chief Compliance Officer | | Chief Compliance Officer and Vice President, T. Rowe Price; Vice President, T. Rowe Price Group, Inc., and T. Rowe Price Investment Services, Inc. |
| | | |
David R. Giroux, CFA (1975)
Vice President | | Vice President, T. Rowe Price, T. Rowe Price Group, Inc., and T. Rowe Price Trust Company |
| | | |
Gary J. Greb (1961)
Vice President | | Vice President, T. Rowe Price, T. Rowe Price International, and T. Rowe Price Trust Company |
| | | |
Paul J. Krug, CPA (1964)
Vice President | | Vice President, T. Rowe Price, T. Rowe Price Group, Inc., and T. Rowe Price Trust Company |
| | | |
Paul M. Massaro, CFA (1975)
President | | Vice President, T. Rowe Price, T. Rowe Price Group, Inc., and T. Rowe Price Trust Company |
| | | |
Michael J. McGonigle (1966)
Vice President | | Vice President, T. Rowe Price and T. Rowe Price Group, Inc. |
| | | |
Shannon H. Rauser (1987)
Assistant Secretary | | Assistant Vice President, T. Rowe Price |
| | | |
Brian A. Rubin, CPA (1974)
Vice President | | Vice President, T. Rowe Price, T. Rowe Price Group, Inc., and T. Rowe Price Trust Company |
| | | |
Michael J. Trivino (1981)
Vice President | | Vice President, T. Rowe Price and T. Rowe Price Group, Inc. |
| | | |
Mark J. Vaselkiv (1958)
Vice President | | Vice President, T. Rowe Price, T. Rowe Price Group, Inc., and T. Rowe Price Trust Company |
| | | |
Megan Warren (1968)
Vice President | | Vice President, T. Rowe Price, T. Rowe Price Group, Inc., T. Rowe Price Retirement Plan Services, Inc., T. Rowe Price Services, Inc., and T. Rowe Price Trust Company; formerly, Executive Director, JPMorgan Chase (to 2017) |
| | | |
Rebecca Willey (1987)
Assistant Vice President | | Assistant Vice President, T. Rowe Price |
Unless otherwise noted, officers have been employees of T. Rowe Price or T. Rowe Price International for at least 5 years.
Item 1. (b) Notice pursuant to Rule 30e-3.
Not applicable.
Item 2. Code of Ethics.
The registrant has adopted a code of ethics, as defined in Item 2 of Form N-CSR, applicable to its principal executive officer, principal financial officer, principal accounting officer or controller, or persons performing similar functions. A copy of this code of ethics is filed as an exhibit to this Form N-CSR. No substantive amendments were approved or waivers were granted to this code of ethics during the period covered by this report.
Item 3. Audit Committee Financial Expert.
The registrant’s Board of Directors/Trustees has determined that Mr. Bruce W. Duncan qualifies as an audit committee financial expert, as defined in Item 3 of Form N-CSR. Mr. Duncan is considered independent for purposes of Item 3 of Form N-CSR.
Item 4. Principal Accountant Fees and Services.
(a) – (d) Aggregate fees billed for the last two fiscal years for professional services rendered to, or on behalf of, the registrant by the registrant’s principal accountant were as follows:
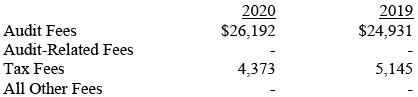
Audit fees include amounts related to the audit of the registrant’s annual financial statements and services normally provided by the accountant in connection with statutory and regulatory filings. Audit-related fees include amounts reasonably related to the performance of the audit of the registrant’s financial statements and specifically include the issuance of a report on internal controls and, if applicable, agreed-upon procedures related to fund acquisitions. Tax fees include amounts related to services for tax compliance, tax planning, and tax advice. The nature of these services specifically includes the review of distribution calculations and the preparation of Federal, state, and excise tax returns. All other fees include the registrant’s pro-rata share of amounts for agreed-upon procedures in conjunction with service contract approvals by the registrant’s Board of Directors/Trustees.
(e)(1) The registrant’s audit committee has adopted a policy whereby audit and non-audit services performed by the registrant’s principal accountant for the registrant, its investment adviser, and any entity controlling, controlled by, or under common control with the investment adviser that provides ongoing services to the registrant require pre-approval in advance at regularly scheduled audit committee meetings. If such a service is required between regularly scheduled audit committee meetings, pre-approval may be authorized by one audit committee member with ratification at the next scheduled audit committee meeting. Waiver of pre-approval for audit or non-audit services requiring fees of a de minimis amount is not permitted.
(2) No services included in (b) – (d) above were approved pursuant to paragraph (c)(7)(i)(C) of Rule 2-01 of Regulation S-X.
(f) Less than 50 percent of the hours expended on the principal accountant’s engagement to audit the registrant’s financial statements for the most recent fiscal year were attributed to work performed by persons other than the principal accountant’s full-time, permanent employees.
(g) The aggregate fees billed for the most recent fiscal year and the preceding fiscal year by the registrant’s principal accountant for non-audit services rendered to the registrant, its investment adviser, and any entity controlling, controlled by, or under common control with the investment adviser that provides ongoing services to the registrant were $3,671,000 and $2,684,000, respectively.
(h) All non-audit services rendered in (g) above were pre-approved by the registrant’s audit committee. Accordingly, these services were considered by the registrant’s audit committee in maintaining the principal accountant’s independence.
Item 5. Audit Committee of Listed Registrants.
Not applicable.
Item 6. Investments.
(a) Not applicable. The complete schedule of investments is included in Item 1 of this Form N-CSR.
(b) Not applicable.
Item 7. Disclosure of Proxy Voting Policies and Procedures for Closed-End Management Investment Companies.
Not applicable.
Item 8. Portfolio Managers of Closed-End Management Investment Companies.
Not applicable.
Item 9. Purchases of Equity Securities by Closed-End Management Investment Company and Affiliated Purchasers.
Not applicable.
Item 10. Submission of Matters to a Vote of Security Holders.
There has been no change to the procedures by which shareholders may recommend nominees to the registrant's board of directors.
Item 11. Controls and Procedures.
(a) The registrant’s principal executive officer and principal financial officer have evaluated the registrant’s disclosure controls and procedures within 90 days of this filing and have concluded that the registrant’s disclosure controls and procedures were effective, as of that date, in ensuring that information required to be disclosed by the registrant in this Form N-CSR was recorded, processed, summarized, and reported timely.
(b) The registrant’s principal executive officer and principal financial officer are aware of no change in the registrant’s internal control over financial reporting that occurred during the period covered by this report that has materially affected, or is reasonably likely to materially affect, the registrant’s internal control over financial reporting.
Item 12. Disclosure of Securities Lending Activities for Closed-End Management Investment Companies.
Not applicable.
Item 13. Exhibits.
(a)(1) The registrant’s code of ethics pursuant to Item 2 of Form N-CSR is attached.
(2) Separate certifications by the registrant's principal executive officer and principal financial officer, pursuant to Section 302 of the Sarbanes-Oxley Act of 2002 and required by Rule 30a-2(a) under the Investment Company Act of 1940, are attached.
(3) Written solicitation to repurchase securities issued by closed-end companies: not applicable.
(b) A certification by the registrant’s principal executive officer and principal financial officer, pursuant to Section 906 of the Sarbanes-Oxley Act of 2002 and required by Rule 30a-2(b) under the Investment Company Act of 1940, is attached.
SIGNATURES
Pursuant to the requirements of the Securities Exchange Act of 1934 and the Investment Company Act of 1940, the registrant has duly caused this report to be signed on its behalf by the undersigned, thereunto duly authorized.
T. Rowe Price Floating Rate Fund, Inc.
| By | | /s/ David Oestreicher |
| | | David Oestreicher |
| | | Principal Executive Officer |
| |
| Date | | July 17, 2020 | | | | |
Pursuant to the requirements of the Securities Exchange Act of 1934 and the Investment Company Act of 1940, this report has been signed below by the following persons on behalf of the registrant and in the capacities and on the dates indicated.
| By | | /s/ David Oestreicher |
| | | David Oestreicher |
| | | Principal Executive Officer |
| |
| Date | | July 17, 2020 | | | | |
| |
| |
| By | | /s/ Alan S. Dupski |
| | | Alan S. Dupski |
| | | Principal Financial Officer |
| |
| Date | | July 17, 2020 | | | | |