UNITED STATES
SECURITIES AND EXCHANGE COMMISSION
Washington, D.C. 20549
FORM N-CSR
CERTIFIED SHAREHOLDER REPORT OF REGISTERED
MANAGEMENT INVESTMENT COMPANIES
Investment Company Act File Number: 811-22557
| T. Rowe Price Floating Rate Fund, Inc. |
|
| (Exact name of registrant as specified in charter) |
| |
| 100 East Pratt Street, Baltimore, MD 21202 |
|
| (Address of principal executive offices) |
| |
| David Oestreicher |
| 100 East Pratt Street, Baltimore, MD 21202 |
|
| (Name and address of agent for service) |
Registrant’s telephone number, including area code: (410) 345-2000
Date of fiscal year end: May 31
Date of reporting period: May 31, 2022
Item 1. Reports to Shareholders
(a) Report pursuant to Rule 30e-1.
| Floating Rate Fund | May 31, 2022 |
| PRFRX | Investor Class |
| PAFRX | Advisor Class |
| TFAIX | I Class |
| TRIZX | Z Class |
| T. ROWE PRICE Floating Rate Fund |
|
HIGHLIGHTS
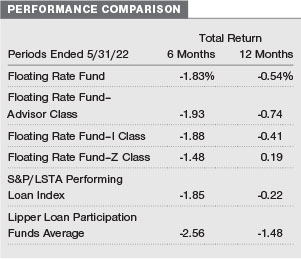
| ■ | The Floating Rate Fund underperformed the benchmark S&P/LSTA Performing Loan Index but outperformed the Lipper peer group average for the 12 months ended May 31, 2022. |
| | |
| ■ | The portfolio’s energy sector positioning as well as avoiding troubled credits made meaningful contributions to relative performance. |
| | |
| ■ | We became slightly more defensive in our credit quality positioning and increased the portfolio’s exposure to the financials and health care segments. |
| | |
| ■ | Issuer earnings have rebounded sharply from 2020 lows, broadly enabling significant balance sheet delevering and free cash flow generation. However, we have developed a more balanced view of risks within a more challenging economic environment. |

Log in to your account at troweprice.com for more information.
*Certain mutual fund accounts that are assessed an annual account service fee can also save money by switching to e-delivery.
Market Commentary
Dear Shareholder
Global stock markets produced mostly negative returns during your fund’s fiscal year, the 12-month period ended May 31, 2022, while rising bond yields weighed on returns for fixed income investors. Positive sentiment surrounding the recovering economy and corporate earnings growth in the first half of the period gave way to fears about new coronavirus variants, rising interest rates, soaring inflation, and geopolitical turmoil in the second half.
Nearly all major global and regional equity benchmarks receded during the period. Value shares outperformed growth stocks as equity investors turned risk averse and rising rates put downward pressure on growth stock valuations. Sector performance diverged widely, with communication services and consumer discretionary companies suffering amid the value rotation. Meanwhile, energy stocks registered exceptional returns as oil prices jumped in response to Russia’s invasion of Ukraine and the ensuing commodity supply crunch.
Financial markets entered the period on an upbeat note as an improving labor market and renewed stimulus efforts were reflected in higher consumer spending. A robust increase in corporate earnings growth also drove markets for much of 2021. However, earnings tailwinds showed signs of fading heading into 2022, as certain high-profile companies issued weaker-than-expected earnings reports or financial projections.
In November 2021, the emergence of the omicron variant of the coronavirus prompted worries about the economic outlook and the potential that a resurgence in cases could lead to further supply chain disruptions. While omicron variant trends and restrictions eased in most regions early in 2022, China continued to pursue a “zero COVID” policy, resulting in large-scale lockdowns and industrial production disruptions.
In February 2022, markets were caught further by surprise when Russia launched a large-scale military offensive into Ukraine. The strong sanctions on Russia that followed raised concerns about supply chains already stressed by the coronavirus. In March, the White House announced that the U.S. was cutting off all oil imports from Russia. As a result, oil prices surged to their highest level in over a decade.
Concerns about inflation intensified over much of the period, driven in part by events in Ukraine and China. Along with supply chain problems, the impact of the fiscal and monetary stimulus enacted during the pandemic and the release of pent-up demand for travel, recreation, and other services also pushed prices higher. In the U.S., consumer prices rose 8.2% in April versus the year before, near multi-decade highs, driven by accelerating energy and food prices. In March, the U.S. Federal Reserve approved its first interest rate hike in more than three years and signaled an accelerating pace of rate increases ahead to combat inflation. In addition, the Fed ended its purchases of Treasuries and agency mortgage-backed securities during the period and announced plans to begin reducing its balance sheet.
Bond indexes were broadly negative as yields rose across the U.S. Treasury yield curve amid surging inflation and expectations of aggressive monetary tightening. (Bond yields and prices move in opposite directions.) Investment-grade corporate bonds fared particularly poorly, experiencing significant losses as concerns over a potential slowdown in economic growth took hold.
The challenges global markets face are complex and could drive market volatility as we enter the second half of the year. Our investment teams will be closely monitoring the Fed’s actions as the central bank attempts to use interest rate hikes to tame inflation without stifling economic growth. Meanwhile, we remain focused on the ongoing geopolitical and humanitarian crisis in Ukraine, which continues to disrupt supply chains, increase inflationary pressures, and dampen consumer confidence.
During challenging times like these, I am heartened by our firm’s long-term focus and time-tested investment approach. I also recognize that market volatility and sector rotation historically have presented attractive opportunities for active investors. I remain confident in the ability of our global research organization to uncover compelling investment ideas that can help deliver strong long-term risk-adjusted performance as market conditions normalize.
Thank you for your continued confidence in T. Rowe Price.
Sincerely,

Robert Sharps
CEO and President
Management’s Discussion of Fund Performance
INVESTMENT OBJECTIVE
The fund seeks high current income and, secondarily, capital appreciation.
FUND COMMENTARY
How did the fund perform in the past 12 months?
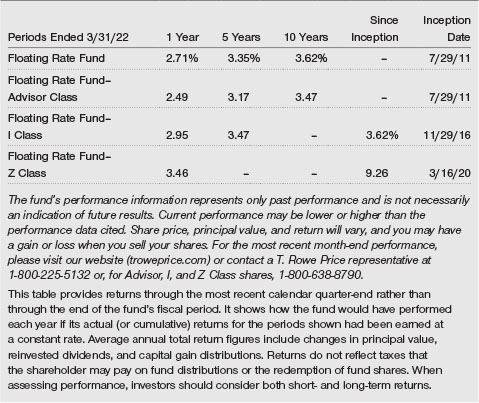
The Floating Rate Fund returned -0.54% in the 12 months ended May 31, 2022, lagging the benchmark S&P/LSTA Performing Loan Index but outperforming the Lipper peer group average. (Results for the fund’s Advisor, I, and Z Class shares varied slightly, reflecting their different fee structures, asset flows, and other factors. Past performance cannot guarantee future results.)
What factors influenced the fund’s performance?
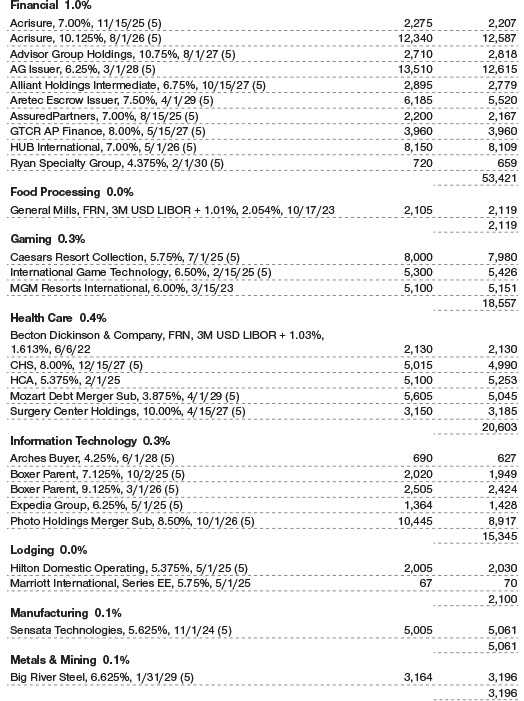
The portfolio’s energy sector positioning was a top contributor to relative returns. We maintained an overweight to this high-performing industry throughout the past year as many issuers within the sector achieved economies of scale and reduced leverage as oil and natural gas prices soared from a rebound in global demand and tight supplies. Midstream natural gas processors in the Permian Basin, EagleClaw and Caprock (sister companies with the same management team), strongly rebounded after enduring performance challenges during the coronavirus pandemic. Last fall, the companies announced a merger with midstream player Altus, and the deal was completed earlier this year. Strong fundamental conditions, steady credit improvement, and positive event risk due to the merger and acquisition transaction—which created a public company with a better credit profile—drove the strong performance of the EagleClaw/Caprock complex over the past year. (Please refer to the portfolio of investments for a complete list of holdings and the amount each represents in the portfolio.)
Our investment in midstream energy infrastructure corporation Targa Resources also added value. Targa’s growth strategy is focused on the best-in-class Permian Basin, where its natural gas and natural gas liquid gathering and processing assets are well integrated with its Gulf Coast downstream assets. During the height of the pandemic, Targa took decisive actions that stabilized its liquidity and credit profile, which positioned the company well for the recovery.
Avoiding troubled credits was another significant driver of relative performance. For example, we maintained a sizable underweight relative to the benchmark in Envision Healthcare, a health care company that provides physician services and operates ambulatory surgery centers. The company was already challenged prior to the pandemic as insurers cracked down on the use of out-of-network insurance rates. The pandemic worsened matters as emergency room and elective procedure volumes declined dramatically. At times the company seemed poised for improvement, but we eliminated our holdings prior to a balance sheet restructuring that we believe significantly jeopardized the value of the loan.
Similarly, not having exposure to Cineworld Group, the world’s largest cinema operator, was beneficial. Loan prices traded significantly lower and have continued to struggle as the company attempts to dig out from the impact of theater closures during the pandemic along with a narrower box office window for movies and an ill-timed acquisition attempt ahead of the pandemic.
The portfolio’s overweight to Shutterfly—an online retailer of personalized products including cards, stationary, calendars, and photo books—was a drag on relative results. The company’s consumer product segment performed well during the pandemic as hobbies such as scrapbooking and creating photo books gained popularity, which offset the weakness in its class picture business. However, the shift toward more experiential and travel-related spending as coronavirus infections subsided weighed on the company’s core business, and school picture volumes have not yet rebounded to pre-pandemic levels. Nevertheless, after a series of conversations with the company’s management team, we believe that this segment of Shutterfly’s business will continue to recover.
Our overweight positions in EG Group, which owns and operates gas stations and convenience stores across Europe, the U.S., and Australia, and Vibrantz Technologies, a specialty chemicals and materials company, also detracted. EG Group’s strategy of investing capital to expand convenience store offerings was slowed during the pandemic, and that company now faces headwinds from higher gasoline prices that could reduce volumes. Vibrantz Technologies has underperformed as its operations have been hampered by higher input costs due to raw materials inflation.

How is the fund positioned?
Over the last 12 months, we became slightly more defensive in our credit quality positioning. Specifically, we increased the portfolio’s allocation to the BB rating tier while trimming exposure to CCC rated loans.
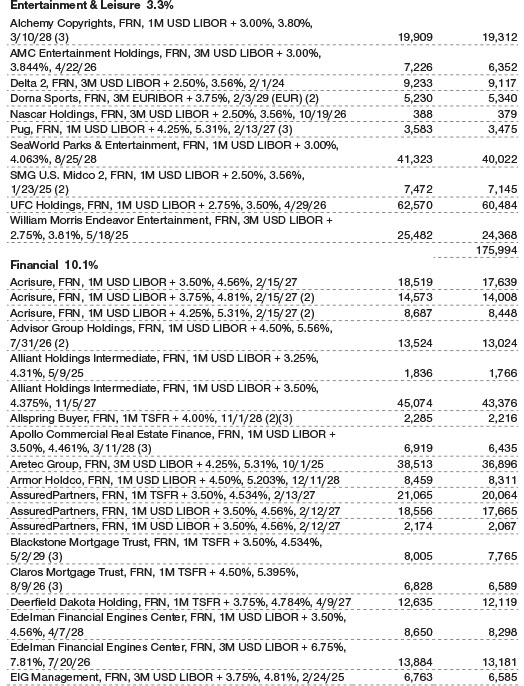
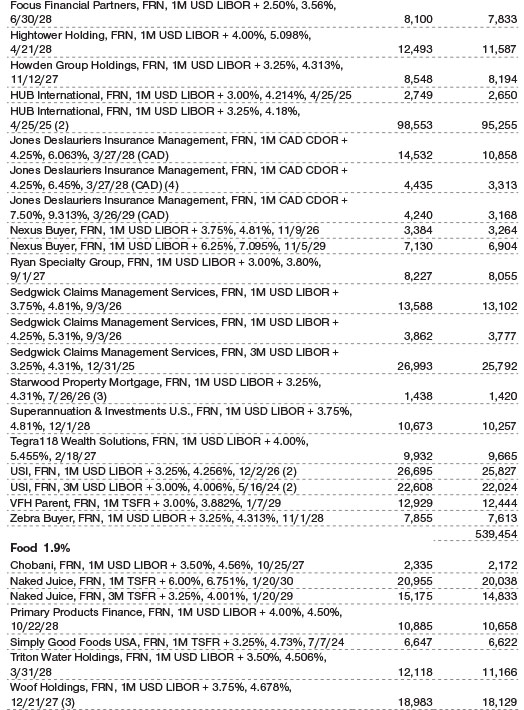
From an industry standpoint, we meaningfully increased the portfolio’s financials sector exposure through additions to holdings in the insurance broker space, such as high-conviction issuers HUB International, Acrisure, Alliant, and Assured Partners. Insurance brokers continued to benefit from a hard pricing environment that led to strong organic growth. Furthermore, recent market volatility allowed us to purchase shorter-dated loans within this segment at meaningful discounts to par. We believe these loans will be refinanced at par well in advance of their maturity dates, allowing us to capture the discounts over a relatively short time frame.
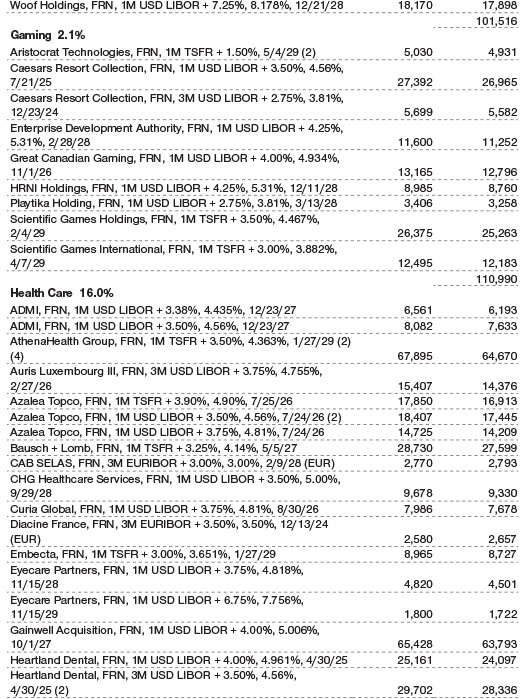
We also enhanced the portfolio’s allocation to health care—generally considered a defensive segment—by roughly 300 basis points (100 basis points equals 1.00%). Our participation in a transaction to finance the leveraged buyout of health care supplies distributor Medline Industries by a consortium of private equity firms was an important component of this positioning shift. We have a favorable view on the steadiness and scale of Medline’s business and believe there is potential for margin improvement over time as the company distributes to a higher degree its vertically integrated private-label products.
As the economy began to emerge from the global health crisis, we endeavored to benefit from the changing behaviors among U.S. consumers. The restrictions and lockdowns over the last two years increased pent-up demand and appear to have made consumers more willing to spend on experiences and travel. We believe people will be traveling in greater numbers this summer and have reflected this in the portfolio by maintaining meaningful positions in American Airlines and United Airlines.
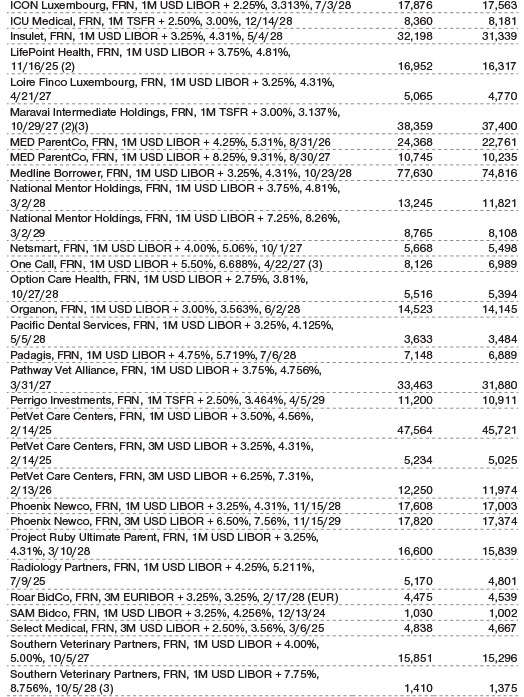
Another aspect of the shift in consumer behavior that we have tried to capitalize on is the significant increase in pet adoptions during the pandemic, which we believe will drive ongoing spending on pet care—including veterinary hospital visits—over the long term. One of the ways we expressed this view was by augmenting the portfolio’s investment in PetVet Care Centers, which operates specialty and general veterinary hospitals in the U.S. Over the past year, we increased our holdings by purchasing the company’s newest issues of first- and second-lien loans.
Although the portfolio is underweight in information technology—one of the largest loan market segments—relative to the benchmark, we remain constructive on the industry and have meaningful positions in Epicor Software, an enterprise resource planning solutions company, and broker management systems software company Applied Systems. We believe their software solutions are well entrenched in customer operations and that revenue will hold up relatively well in an environment with slower economic growth.
We reduced the portfolio’s holdings of issuers in the consumer products and retail segments amid changing spending habits as pandemic-related restrictions were eased. Our research showed that many of these companies may have had somewhat inflated earnings during the health crisis, which could begin to tail off as consumers increasingly show a preference for spending on experiences and travel.
What is portfolio management’s outlook?
Over the last 12 months, below investment-grade issuers have experienced a strong credit quality upgrade cycle. Issuer earnings have rebounded sharply from 2020 lows, broadly enabling significant balance sheet delevering and free cash flow generation. Default rates have reached historic lows, and we continue to have a muted default outlook for the remainder of the year. From a macro level, consumer savings are still robust. However, we developed a more balanced view of risks due to the more challenging economic environment as the Federal Reserve Bank tightens financial policy to combat inflation with the potential costs of slower growth and higher unemployment.
We have begun to see the reversal of the coordinated rate cuts by major central banks that provided a powerful backstop for economies during the coronavirus pandemic. With inflation at a 40-year high, the Fed and other central banks have signaled their resolve to achieve price stability. Meanwhile, external events such as the Russia/Ukraine conflict and supply chain disruptions are exacerbating inflationary pressure and complicating central banks’ efforts to engineer a soft economic landing.
The Fed is expected to continue announcing rate hikes over the next several months. Against this backdrop, the floating rate feature of loans, which resets coupons higher as rates increase, is an important consideration as it buffers the asset class against the impact of a rising rate environment, making it typically less vulnerable to price declines than other fixed income segments.
The views expressed reflect the opinions of T. Rowe Price as of the date of this report and are subject to change based on changes in market, economic, or other conditions. These views are not intended to be a forecast of future events and are no guarantee of future results.
RISKS OF INVESTING IN FLOATING RATE LOAN FUNDS
Floating rate loans are subject to credit risk, the chance that any fund holding could have its credit rating downgraded or that an issuer will default (fail to make timely payments of interest or principal). Loans also face liquidity risk, the chance that the fund may not be able to sell loans or securities at desired prices, potentially reducing the fund’s income level and share price. Like bond funds, this fund is exposed to interest rate risk, but credit and liquidity risks may often be more impactful.
The loans in which the fund invests are often referred to as “leveraged loans.” In many cases, leveraged loans are issued in connection with recapitalizations, acquisitions, leveraged buyouts, and refinancings. Companies issuing leveraged loans typically have a below investment-grade credit rating or may not be rated by a major credit rating agency. Leveraged-loan funds could have greater price declines than funds that invest primarily in high-quality bonds, so the securities are usually considered speculative investments.
BENCHMARK INFORMATION
Note: Portions of the mutual fund information contained in this report were supplied by Lipper, a Refinitiv Company, subject to the following: Copyright 2022 © Refinitiv. All rights reserved. Any copying, republication, or redistribution of Lipper content is expressly prohibited without the prior written consent of Lipper. Lipper shall not be liable for any errors or delays in the content, or for any actions taken in reliance thereon.
Note: The S&P/LSTA Performing Loan Index is a product of S&P Dow Jones Indices LLC, a division of S&P Global, or its affiliates (“SPDJI”) and has been licensed for use by T. Rowe Price. Standard & Poor’s® and S&P® are registered trademarks of Standard & Poor’s Financial Services LLC, a division of S&P Global (“S&P”); Dow Jones® is a registered trademark of Dow Jones Trademark Holdings LLC (“Dow Jones”); T. Rowe Price is not sponsored, endorsed, sold or promoted by SPDJI, Dow Jones, S&P, or their respective affiliates, and none of such parties make any representation regarding the advisability of investing in such product(s) nor do they have any liability for any errors, omissions, or interruptions of the S&P/LSTA Performing Loan Index.

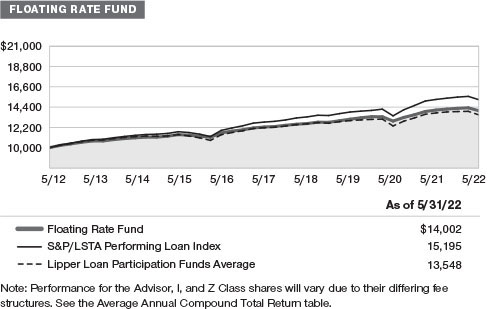
GROWTH OF $10,000
This chart shows the value of a hypothetical $10,000 investment in the fund over the past 10 fiscal year periods or since inception (for funds lacking 10-year records). The result is compared with benchmarks, which include a broad-based market index and may also include a peer group average or index. Market indexes do not include expenses, which are deducted from fund returns as well as mutual fund averages and indexes.
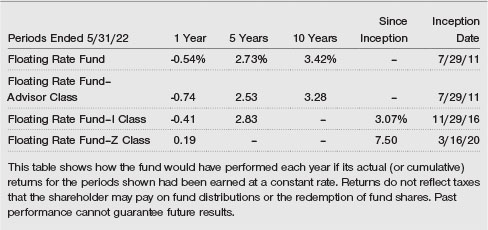
AVERAGE ANNUAL COMPOUND TOTAL RETURN
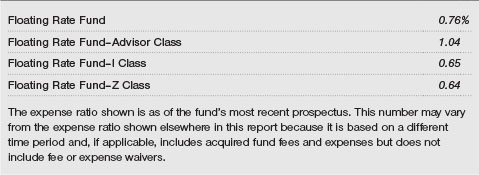
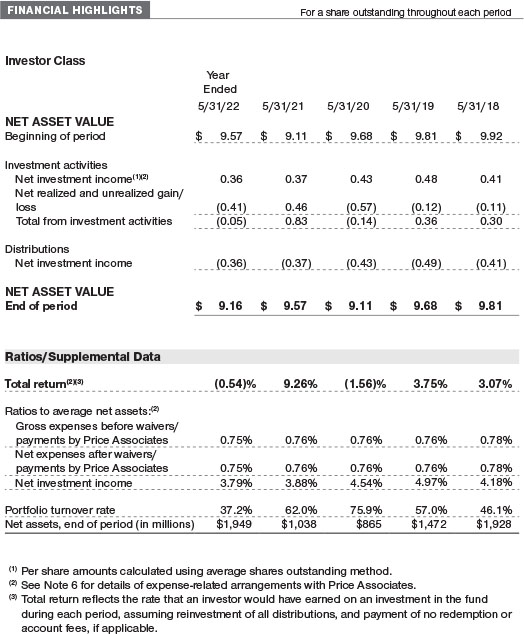
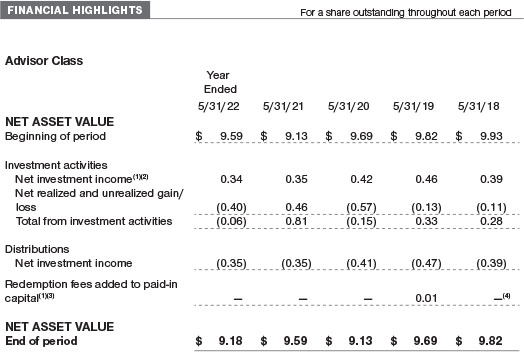
EXPENSE RATIO
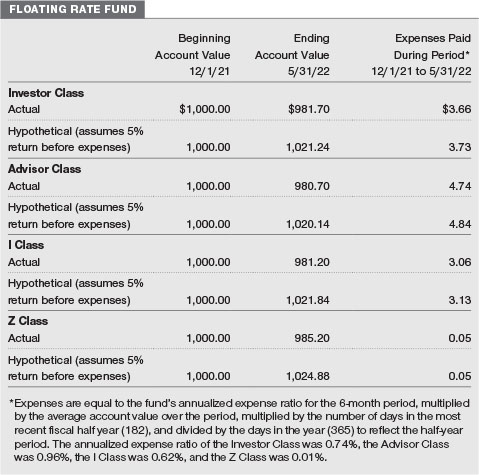
FUND EXPENSE EXAMPLE
As a mutual fund shareholder, you may incur two types of costs: (1) transaction costs, such as redemption fees or sales loads, and (2) ongoing costs, including management fees, distribution and service (12b-1) fees, and other fund expenses. The following example is intended to help you understand your ongoing costs (in dollars) of investing in the fund and to compare these costs with the ongoing costs of investing in other mutual funds. The example is based on an investment of $1,000 invested at the beginning of the most recent six-month period and held for the entire period.
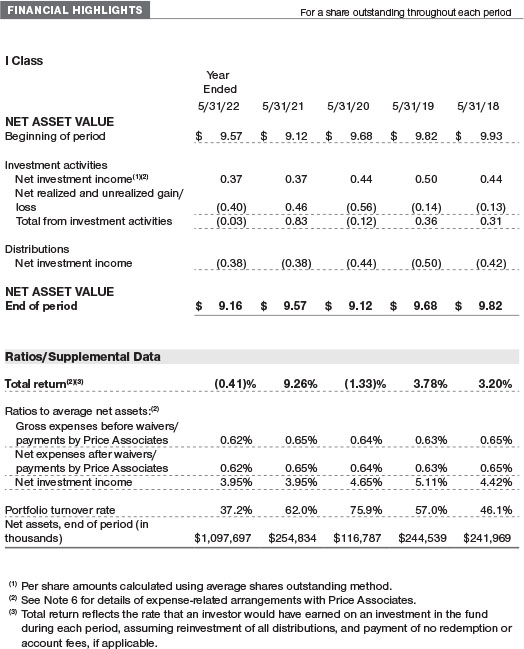
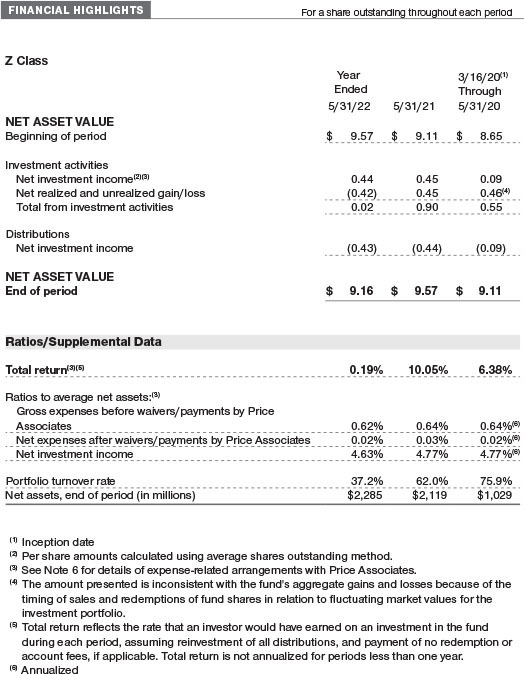
Please note that the fund has four share classes: The original share class (Investor Class) charges no distribution and service (12b-1) fee, Advisor Class shares are offered only through unaffiliated brokers and other financial intermediaries and charge a 0.25% 12b-1 fee, I Class shares are available to institutionally oriented clients and impose no 12b-1 or administrative fee payment, and Z Class shares are offered only to funds advised by T. Rowe Price and other advisory clients of T. Rowe Price or its affiliates that are subject to a contractual fee for investment management services and impose no 12b-1 fee or administrative fee payment. Each share class is presented separately in the table.
Actual Expenses
The first line of the following table (Actual) provides information about actual account values and expenses based on the fund’s actual returns. You may use the information on this line, together with your account balance, to estimate the expenses that you paid over the period. Simply divide your account value by $1,000 (for example, an $8,600 account value divided by $1,000 = 8.6), then multiply the result by the number on the first line under the heading “Expenses Paid During Period” to estimate the expenses you paid on your account during this period.
Hypothetical Example for Comparison Purposes
The information on the second line of the table (Hypothetical) is based on hypothetical account values and expenses derived from the fund’s actual expense ratio and an assumed 5% per year rate of return before expenses (not the fund’s actual return). You may compare the ongoing costs of investing in the fund with other funds by contrasting this 5% hypothetical example and the 5% hypothetical examples that appear in the shareholder reports of the other funds. The hypothetical account values and expenses may not be used to estimate the actual ending account balance or expenses you paid for the period.
Note: T. Rowe Price charges an annual account service fee of $20, generally for accounts with less than $10,000. The fee is waived for any investor whose T. Rowe Price mutual fund accounts total $50,000 or more; accounts electing to receive electronic delivery of account statements, transaction confirmations, prospectuses, and shareholder reports; or accounts of an investor who is a T. Rowe Price Personal Services or Enhanced Personal Services client (enrollment in these programs generally requires T. Rowe Price assets of at least $250,000). This fee is not included in the accompanying table. If you are subject to the fee, keep it in mind when you are estimating the ongoing expenses of investing in the fund and when comparing the expenses of this fund with other funds.
You should also be aware that the expenses shown in the table highlight only your ongoing costs and do not reflect any transaction costs, such as redemption fees or sales loads. Therefore, the second line of the table is useful in comparing ongoing costs only and will not help you determine the relative total costs of owning different funds. To the extent a fund charges transaction costs, however, the total cost of owning that fund is higher.
QUARTER-END RETURNS
The accompanying notes are an integral part of these financial statements.

The accompanying notes are an integral part of these financial statements.
The accompanying notes are an integral part of these financial statements.
The accompanying notes are an integral part of these financial statements.
May 31, 2022


The accompanying notes are an integral part of these financial statements.
May 31, 2022
The accompanying notes are an integral part of these financial statements.
The accompanying notes are an integral part of these financial statements.

The accompanying notes are an integral part of these financial statements.
| NOTES TO FINANCIAL STATEMENTS |
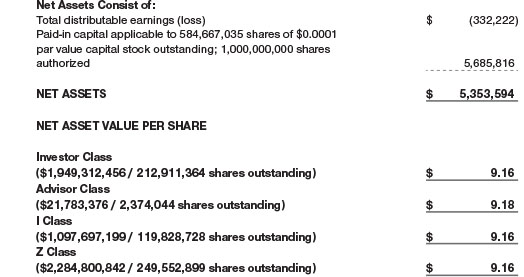
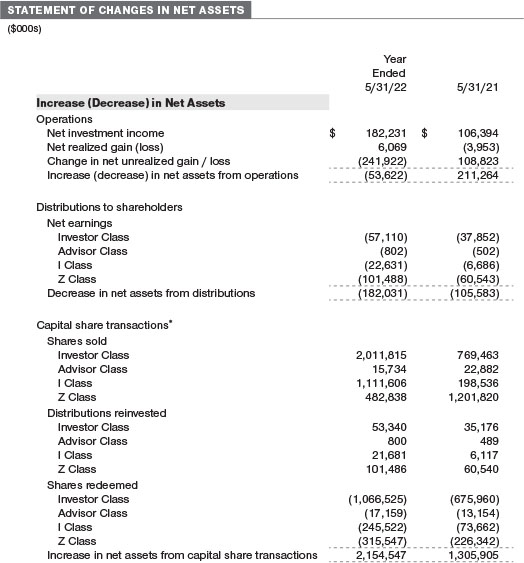
T. Rowe Price Floating Rate Fund, Inc. (the fund) is registered under the Investment Company Act of 1940 (the 1940 Act) as a diversified, open-end management investment company. The fund seeks high current income and, secondarily, capital appreciation. The fund has four classes of shares: the Floating Rate Fund (Investor Class), the Floating Rate Fund–Advisor Class (Advisor Class), the Floating Rate Fund–I Class (I Class) and the Floating Rate Fund–Z Class (Z Class). Advisor Class shares are sold only through various brokers and other financial intermediaries. I Class shares require a $500,000 initial investment minimum, although the minimum generally is waived or reduced for financial intermediaries, eligible retirement plans, and certain other accounts. Prior to November 15, 2021, the initial investment minimum was $1 million and was generally waived for financial intermediaries, eligible retirement plans, and other certain accounts. As a result of the reduction in the I Class minimum, certain assets transferred from the Investor Class to the I Class. This transfer of shares from Investor Class to I Class is reflected in the Statement of Changes in Net Assets within the Capital shares transactions as Shares redeemed and Shares sold, respectively. The Z Class is only available to funds advised by T. Rowe Price Associates, Inc. and its affiliates and other clients that are subject to a contractual fee for investment management services. The Advisor Class operates under a Board-approved Rule 12b-1 plan pursuant to which the class compensates financial intermediaries for distribution, shareholder servicing, and/or certain administrative services; the Investor, I and Z Classes do not pay Rule 12b-1 fees. Each class has exclusive voting rights on matters related solely to that class; separate voting rights on matters that relate to all classes; and, in all other respects, the same rights and obligations as the other classes.
NOTE 1 - SIGNIFICANT ACCOUNTING POLICIES
Basis of Preparation The fund is an investment company and follows accounting and reporting guidance in the Financial Accounting Standards Board (FASB) Accounting Standards Codification Topic 946 (ASC 946). The accompanying financial statements were prepared in accordance with accounting principles generally accepted in the United States of America (GAAP), including, but not limited to, ASC 946. GAAP requires the use of estimates made by management. Management believes that estimates and valuations are appropriate; however, actual results may differ from those estimates, and the valuations reflected in the accompanying financial statements may differ from the value ultimately realized upon sale or maturity.
Investment Transactions, Investment Income, and Distributions Investment transactions are accounted for on the trade date basis. Income and expenses are recorded on the accrual basis. Realized gains and losses are reported on the identified cost basis. Premiums and discounts on debt securities are amortized for financial reporting purposes. Income tax-related interest and penalties, if incurred, are recorded as income tax expense. Dividends received from mutual fund investments are reflected as dividend income; capital gain distributions are reflected as realized gain/loss. Dividend income and capital gain distributions are recorded on the ex-dividend date. Non-cash dividends, if any, are recorded at the fair market value of the asset received. Distributions to shareholders are recorded on the ex-dividend date. Income distributions are declared by each class daily and paid monthly. A capital gain distribution may also be declared and paid by the fund annually.
Currency Translation Assets, including investments, and liabilities denominated in foreign currencies are translated into U.S. dollar values each day at the prevailing exchange rate, using the mean of the bid and asked prices of such currencies against U.S. dollars as provided by an outside pricing service. Purchases and sales of securities, income, and expenses are translated into U.S. dollars at the prevailing exchange rate on the respective date of such transaction. The effect of changes in foreign currency exchange rates on realized and unrealized security gains and losses is not bifurcated from the portion attributable to changes in market prices.
Class Accounting Shareholder servicing, prospectus, and shareholder report expenses incurred by each class are charged directly to the class to which they relate. Expenses common to all classes and investment income are allocated to the classes based upon the relative daily net assets of each class’s settled shares; realized and unrealized gains and losses are allocated based upon the relative daily net assets of each class’s outstanding shares. The Advisor Class pays Rule 12b-1 fees, in an amount not exceeding 0.25% of the class’s average daily net assets.
Capital Transactions Each investor’s interest in the net assets of the fund is represented by fund shares. The fund’s net asset value (NAV) per share is computed at the close of the New York Stock Exchange (NYSE), normally 4 p.m. ET, each day the NYSE is open for business. However, the NAV per share may be calculated at a time other than the normal close of the NYSE if trading on the NYSE is restricted, if the NYSE closes earlier, or as may be permitted by the SEC. Purchases and redemptions of fund shares are transacted at the next-computed NAV per share, after receipt of the transaction order by T. Rowe Price Associates, Inc., or its agents.
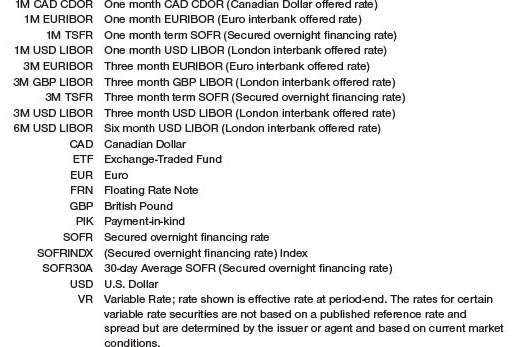
New Accounting Guidance In March 2020, the FASB issued Accounting Standards Update (ASU), ASU 2020–04, Reference Rate Reform (Topic 848) – Facilitation of the Effects of Reference Rate Reform on Financial Reporting, which provides optional, temporary relief with respect to the financial reporting of contracts subject to certain types of modifications due to the planned discontinuation of the London Interbank Offered Rate (LIBOR) and other interbank-offered based reference rates as of the end of 2021. In March 2021, the administrator for LIBOR announced the extension of the publication of a majority of the USD LIBOR settings to June 30, 2023. Management expects that the adoption of the guidance will not have a material impact on the fund’s financial statements.
Indemnification In the normal course of business, the fund may provide indemnification in connection with its officers and directors, service providers, and/or private company investments. The fund’s maximum exposure under these arrangements is unknown; however, the risk of material loss is currently considered to be remote.
NOTE 2 - VALUATION
Fair Value The fund’s financial instruments are valued at the close of the NYSE and are reported at fair value, which GAAP defines as the price that would be received to sell an asset or paid to transfer a liability in an orderly transaction between market participants at the measurement date. The T. Rowe Price Valuation Committee (the Valuation Committee) is an internal committee that has been delegated certain responsibilities by the fund’s Board of Directors (the Board) to ensure that financial instruments are appropriately priced at fair value in accordance with GAAP and the 1940 Act. Subject to oversight by the Board, the Valuation Committee develops and oversees pricing-related policies and procedures and approves all fair value determinations. Specifically, the Valuation Committee establishes policies and procedures used in valuing financial instruments, including those which cannot be valued in accordance with normal procedures or using pricing vendors; determines pricing techniques, sources, and persons eligible to effect fair value pricing actions; evaluates the services and performance of the pricing vendors; oversees the pricing process to ensure policies and procedures are being followed; and provides guidance on internal controls and valuation-related matters. The Valuation Committee provides periodic reporting to the Board on valuation matters.
Various valuation techniques and inputs are used to determine the fair value of financial instruments. GAAP establishes the following fair value hierarchy that categorizes the inputs used to measure fair value:
Level 1 – quoted prices (unadjusted) in active markets for identical financial instruments that the fund can access at the reporting date
Level 2 – inputs other than Level 1 quoted prices that are observable, either directly or indirectly (including, but not limited to, quoted prices for similar financial instruments in active markets, quoted prices for identical or similar financial instruments in inactive markets, interest rates and yield curves, implied volatilities, and credit spreads)
Level 3 – unobservable inputs (including the fund’s own assumptions in determining fair value)
Observable inputs are developed using market data, such as publicly available information about actual events or transactions, and reflect the assumptions that market participants would use to price the financial instrument. Unobservable inputs are those for which market data are not available and are developed using the best information available about the assumptions that market participants would use to price the financial instrument. GAAP requires valuation techniques to maximize the use of relevant observable inputs and minimize the use of unobservable inputs. When multiple inputs are used to derive fair value, the financial instrument is assigned to the level within the fair value hierarchy based on the lowest-level input that is significant to the fair value of the financial instrument. Input levels are not necessarily an indication of the risk or liquidity associated with financial instruments at that level but rather the degree of judgment used in determining those values.
Valuation Techniques Debt securities generally are traded in the over-the-counter (OTC) market and are valued at prices furnished by independent pricing services or by broker dealers who make markets in such securities. When valuing securities, the independent pricing services consider the yield or price of bonds of comparable quality, coupon, maturity, and type, as well as prices quoted by dealers who make markets in such securities.
Equity securities, including exchange-traded funds, listed or regularly traded on a securities exchange or in the over-the-counter (OTC) market are valued at the last quoted sale price or, for certain markets, the official closing price at the time the valuations are made. OTC Bulletin Board securities are valued at the mean of the closing bid and asked prices. A security that is listed or traded on more than one exchange is valued at the quotation on the exchange determined to be the primary market for such security. Listed securities not traded on a particular day are valued at the mean of the closing bid and asked prices for domestic securities.
Investments in mutual funds are valued at the mutual fund’s closing NAV per share on the day of valuation. Forward currency exchange contracts are valued using the prevailing forward exchange rate. Swaps are valued at prices furnished by an independent pricing service or independent swap dealers. Assets and liabilities other than financial instruments, including short-term receivables and payables, are carried at cost, or estimated realizable value, if less, which approximates fair value.
Investments for which market quotations or market-based valuations are not readily available or deemed unreliable are valued at fair value as determined in good faith by the Valuation Committee, in accordance with fair valuation policies and procedures. The objective of any fair value pricing determination is to arrive at a price that could reasonably be expected from a current sale. Financial instruments fair valued by the Valuation Committee are primarily private placements, restricted securities, warrants, rights, and other securities that are not publicly traded. Factors used in determining fair value vary by type of investment and may include market or investment specific considerations. The Valuation Committee typically will afford greatest weight to actual prices in arm’s length transactions, to the extent they represent orderly transactions between market participants, transaction information can be reliably obtained, and prices are deemed representative of fair value. However, the Valuation Committee may also consider other valuation methods such as market-based valuation multiples; a discount or premium from market value of a similar, freely traded security of the same issuer; discounted cash flows; yield to maturity; or some combination. Fair value determinations are reviewed on a regular basis and updated as information becomes available, including actual purchase and sale transactions of the investment. Because any fair value determination involves a significant amount of judgment, there is a degree of subjectivity inherent in such pricing decisions, and fair value prices determined by the Valuation Committee could differ from those of other market participants.
Valuation Inputs The following table summarizes the fund’s financial instruments, based on the inputs used to determine their fair values on May 31, 2022 (for further detail by category, please refer to the accompanying Portfolio of Investments):

Following is a reconciliation of the fund’s Level 3 holdings for the year ended May 31, 2022. Gain (loss) reflects both realized and change in unrealized gain/loss on Level 3 holdings during the period, if any, and is included on the accompanying Statement of Operations. The change in unrealized gain/loss on Level 3 instruments held at May 31, 2022, totaled $(9,312,000) for the year ended May 31, 2022. During the year, transfers into Level 3 resulted from a lack of observable market data for the security and transfers out of Level 3 were because observable market data became available for the security.
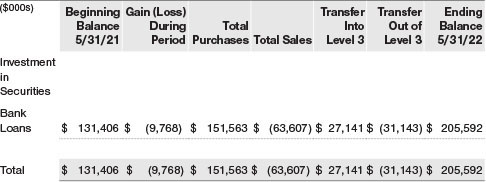
The fund’s Level 3 investments have been valued using unadjusted inputs that have not been internally developed by the fund, including third-party transactions and indicative broker quotations. As a result, there were no unobservable inputs that have been internally developed by the fund in determining the fair value of investments as of May 31, 2022.
NOTE 3 - DERIVATIVE INSTRUMENTS
During the year ended May 31, 2022, the fund invested in derivative instruments. As defined by GAAP, a derivative is a financial instrument whose value is derived from an underlying security price, foreign exchange rate, interest rate, index of prices or rates, or other variable; it requires little or no initial investment and permits or requires net settlement. The fund invests in derivatives only if the expected risks and rewards are consistent with its investment objectives, policies, and overall risk profile, as described in its prospectus and Statement of Additional Information. The fund may use derivatives for a variety of purposes and may use them to establish both long and short positions within the fund’s portfolio. Potential uses include to hedge against declines in principal value, increase yield, invest in an asset with greater efficiency and at a lower cost than is possible through direct investment, to enhance return, or to adjust portfolio duration and credit exposure. The risks associated with the use of derivatives are different from, and potentially much greater than, the risks associated with investing directly in the instruments on which the derivatives are based. The fund at all times maintains sufficient cash reserves, liquid assets, or other SEC-permitted asset types to cover its settlement obligations under open derivative contracts.
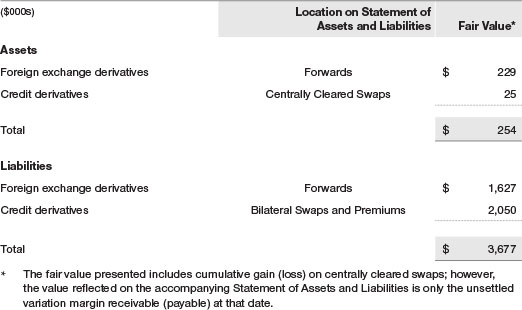
The fund values its derivatives at fair value and recognizes changes in fair value currently in its results of operations. Accordingly, the fund does not follow hedge accounting, even for derivatives employed as economic hedges. Generally, the fund accounts for its derivatives on a gross basis. It does not offset the fair value of derivative liabilities against the fair value of derivative assets on its financial statements, nor does it offset the fair value of derivative instruments against the right to reclaim or obligation to return collateral. The following table summarizes the fair value of the fund’s derivative instruments held as of May 31, 2022, and the related location on the accompanying Statement of Assets and Liabilities, presented by primary underlying risk exposure:
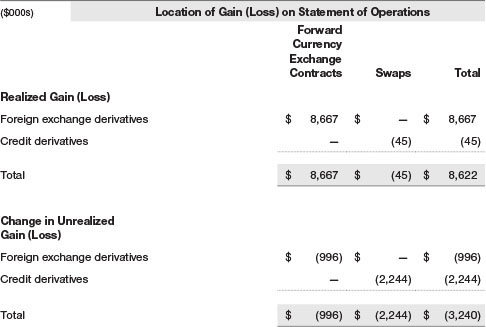
Additionally, the amount of gains and losses on derivative instruments recognized in fund earnings during the year ended May 31, 2022, and the related location on the accompanying Statement of Operations is summarized in the following table by primary underlying risk exposure:
Counterparty Risk and Collateral The fund invests in derivatives in various markets, which expose it to differing levels of counterparty risk. Counterparty risk on exchange-traded and centrally cleared derivative contracts, such as futures, exchange-traded options, and centrally cleared swaps, is minimal because the clearinghouse provides protection against counterparty defaults. For futures and centrally cleared swaps, the fund is required to deposit collateral in an amount specified by the clearinghouse and the clearing firm (margin requirement), and the margin requirement must be maintained over the life of the contract. Each clearinghouse and clearing firm, in its sole discretion, may adjust the margin requirements applicable to the fund.
Derivatives, such as bilateral swaps, forward currency exchange contracts, and OTC options, that are transacted and settle directly with a counterparty (bilateral derivatives) may expose the fund to greater counterparty risk. To mitigate this risk, the fund has entered into master netting arrangements (MNAs) with certain counterparties that permit net settlement under specified conditions and, for certain counterparties, also require the exchange of collateral to cover mark-to-market exposure. MNAs may be in the form of International Swaps and Derivatives Association master agreements (ISDAs) or foreign exchange letter agreements (FX letters).
MNAs provide the ability to offset amounts the fund owes a counterparty against amounts the counterparty owes the fund (net settlement). Both ISDAs and FX letters generally allow termination of transactions and net settlement upon the occurrence of contractually specified events, such as failure to pay or bankruptcy. In addition, ISDAs specify other events, the occurrence of which would allow one of the parties to terminate. For example, a downgrade in credit rating of a counterparty below a specified rating would allow the fund to terminate, while a decline in the fund’s net assets of more than a specified percentage would allow the counterparty to terminate. Upon termination, all transactions with that counterparty would be liquidated and a net termination amount settled. ISDAs typically include collateral agreements whereas FX letters do not. Collateral requirements are determined daily based on the net aggregate unrealized gain or loss on all bilateral derivatives with a counterparty, subject to minimum transfer amounts that typically range from $100,000 to $250,000. Any additional collateral required due to changes in security values is typically transferred the next business day.
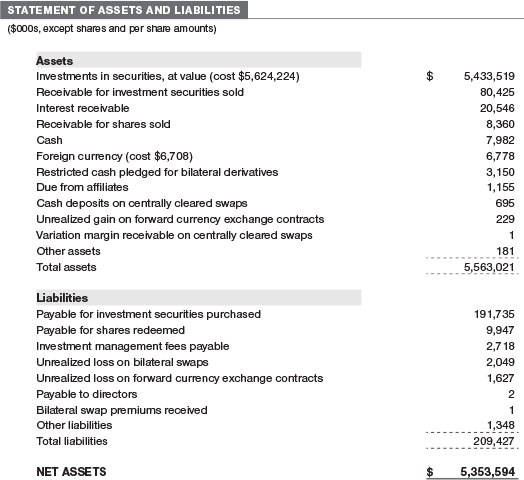
Collateral may be in the form of cash or debt securities issued by the U.S. government or related agencies, although other securities may be used depending on the terms outlined in the applicable MNA. Cash posted by the fund is reflected as cash deposits in the accompanying financial statements and generally is restricted from withdrawal by the fund; securities posted by the fund are so noted in the accompanying Portfolio of Investments; both remain in the fund’s assets. Collateral pledged by counterparties is not included in the fund’s assets because the fund does not obtain effective control over those assets. For bilateral derivatives, collateral posted or received by the fund is held in a segregated account at the fund’s custodian. While typically not sold in the same manner as equity or fixed income securities, exchange-traded or centrally cleared derivatives may be closed out only on the exchange or clearinghouse where the contracts were cleared, and OTC and bilateral derivatives may be unwound with counterparties or transactions assigned to other counterparties to allow the fund to exit the transaction. This ability is subject to the liquidity of underlying positions. As of May 31, 2022, cash of $3,150,000 had been pledged or posted by the fund to counterparties for bilateral derivatives. As of May 31, 2022, collateral pledged by counterparties to the fund for bilateral derivatives consisted of $280,000 cash. As of May 31, 2022, cash of $695,000 had been posted by the fund for exchange-traded and/or centrally cleared derivatives.
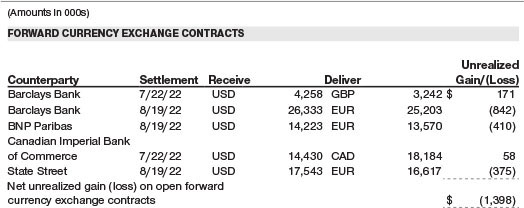
Forward Currency Exchange Contracts The fund is subject to foreign currency exchange rate risk in the normal course of pursuing its investment objectives. It uses forward currency exchange contracts (forwards) primarily to protect its non-U.S. dollar-denominated securities from adverse currency movements and to increase exposure to a particular foreign currency, to shift the fund’s foreign currency exposure from one country to another, or to enhance the fund’s return. A forward involves an obligation to purchase or sell a fixed amount of a specific currency on a future date at a price set at the time of the contract. Although certain forwards may be settled by exchanging only the net gain or loss on the contract, most forwards are settled with the exchange of the underlying currencies in accordance with the specified terms. Forwards are valued at the unrealized gain or loss on the contract, which reflects the net amount the fund either is entitled to receive or obligated to deliver, as measured by the difference between the forward exchange rates at the date of entry into the contract and the forward rates at the reporting date. Appreciated forwards are reflected as assets and depreciated forwards are reflected as liabilities on the accompanying Statement of Assets and Liabilities. Risks related to the use of forwards include the possible failure of counterparties to meet the terms of the agreements; that anticipated currency movements will not occur, thereby reducing the fund’s total return; and the potential for losses in excess of the fund’s initial investment. During the year ended May 31, 2022, the volume of the fund’s activity in forwards, based on underlying notional amounts, was generally between 0% and 2% of net assets.
Swaps The fund is subject to credit risk in the normal course of pursuing its investment objectives and uses swap contracts to help manage such risk. The fund may use swaps in an effort to manage both long and short exposure to changes in interest rates, inflation rates, and credit quality; to adjust overall exposure to certain markets; to enhance total return or protect the value of portfolio securities; to serve as a cash management tool; or to adjust portfolio duration and credit exposure. Swap agreements can be settled either directly with the counterparty (bilateral swap) or through a central clearinghouse (centrally cleared swap). Fluctuations in the fair value of a contract are reflected in unrealized gain or loss and are reclassified to realized gain or loss upon contract termination or cash settlement. Net periodic receipts or payments required by a contract increase or decrease, respectively, the value of the contract until the contractual payment date, at which time such amounts are reclassified from unrealized to realized gain or loss. For bilateral swaps, cash payments are made or received by the fund on a periodic basis in accordance with contract terms; unrealized gain on contracts and premiums paid are reflected as assets and unrealized loss on contracts and premiums received are reflected as liabilities on the accompanying Statement of Assets and Liabilities. For bilateral swaps, premiums paid or received are amortized over the life of the swap and are recognized as realized gain or loss in the Statement of Operations. For centrally cleared swaps, payments are made or received by the fund each day to settle the daily fluctuation in the value of the contract (variation margin). Accordingly, the value of a centrally cleared swap included in net assets is the unsettled variation margin; net variation margin receivable is reflected as an asset and net variation margin payable is reflected as a liability on the accompanying Statement of Assets and Liabilities.
Credit default swaps are agreements where one party (the protection buyer) agrees to make periodic payments to another party (the protection seller) in exchange for protection against specified credit events, such as certain defaults and bankruptcies related to an underlying credit instrument, or issuer or index of such instruments. Upon occurrence of a specified credit event, the protection seller is required to pay the buyer the difference between the notional amount of the swap and the value of the underlying credit, either in the form of a net cash settlement or by paying the gross notional amount and accepting delivery of the relevant underlying credit. For credit default swaps where the underlying credit is an index, a specified credit event may affect all or individual underlying securities included in the index and will be settled based upon the relative weighting of the affected underlying security(ies) within the index. Generally, the payment risk for the seller of protection is inversely related to the current market price or credit rating of the underlying credit or the market value of the contract relative to the notional amount, which are indicators of the markets’ valuation of credit quality. As of May 31, 2022, the notional amount of protection sold by the fund totaled $900,000 (0.0% of net assets), which reflects the maximum potential amount the fund could be required to pay under such contracts. Risks related to the use of credit default swaps include the possible inability of the fund to accurately assess the current and future creditworthiness of underlying issuers, the possible failure of a counterparty to perform in accordance with the terms of the swap agreements, potential government regulation that could adversely affect the fund’s swap investments, and potential losses in excess of the fund’s initial investment.
Total return swaps are agreements in which one party makes payments based on a set rate, either fixed or variable, while the other party makes payments based on the return of an underlying asset (reference asset), such as an index, equity security, fixed income security or commodity-based exchange-traded fund, which includes both the income it generates and any change in its value. Risks related to the use of total return swaps include the potential for unfavorable changes in the reference asset, the possible failure of a counterparty to perform in accordance with the terms of the swap agreements, potential government regulation that could adversely affect the fund’s swap investments, and potential losses in excess of the fund’s initial investment.
During the year ended May 31, 2022, the volume of the fund’s activity in swaps, based on underlying notional amounts, was generally between 0% and 2% of net assets.
NOTE 4 - OTHER INVESTMENT TRANSACTIONS
Consistent with its investment objective, the fund engages in the following practices to manage exposure to certain risks and/or to enhance performance. The investment objective, policies, program, and risk factors of the fund are described more fully in the fund’s prospectus and Statement of Additional Information.
Noninvestment-Grade Debt The fund invests, either directly or through its investment in other T. Rowe Price funds, in noninvestment-grade debt, including “high yield” or “junk” bonds or leveraged loans. Noninvestment-grade debt issuers are more likely to suffer an adverse change in financial condition that would result in the inability to meet a financial obligation. The noninvestment-grade debt market may experience sudden and sharp price swings due to a variety of factors that may decrease the ability of issuers to make principal and interest payments and adversely affect the liquidity or value, or both, of such securities. Accordingly, securities issued by such companies carry a higher risk of default and should be considered speculative.
Restricted Securities The fund invests in securities that are subject to legal or contractual restrictions on resale. Prompt sale of such securities at an acceptable price may be difficult and may involve substantial delays and additional costs.
Bank Loans The fund invests in bank loans, which represent an interest in amounts owed by a borrower to a syndicate of lenders. Bank loans are generally noninvestment grade and often involve borrowers whose financial condition is highly leveraged. Bank loans may be in the form of either assignments or participations. A loan assignment transfers all legal, beneficial, and economic rights to the buyer, and transfer typically requires consent of both the borrower and agent. In contrast, a loan participation generally entitles the buyer to receive the cash flows from principal, interest, and any fee payments on a portion of a loan; however, the seller continues to hold legal title to that portion of the loan. As a result, the buyer of a loan participation generally has no direct recourse against the borrower and is exposed to credit risk of both the borrower and seller of the participation. Bank loans often have extended settlement periods, generally may be repaid at any time at the option of the borrower, and may require additional principal to be funded at the borrowers’ discretion at a later date (e.g. unfunded commitments and revolving debt instruments). Until settlement, the fund maintains liquid assets sufficient to settle its unfunded loan commitments. The fund reflects both the funded portion of a bank loan as well as its unfunded commitment in the Portfolio of Investments. However, if a credit agreement provides no initial funding of a tranche, and funding of the full commitment at a future date(s) is at the borrower’s discretion and considered uncertain, a loan is reflected in the Portfolio of Investments only if, and only to the extent that, the fund has actually settled a funding commitment.
LIBOR Transition The fund may invest in instruments that are tied to reference rates, including LIBOR. Over the course of the last several years, global regulators have indicated an intent to phase out the use of LIBOR and similar interbank offered rates (IBOR). While publication for most LIBOR currencies and lesser-used USD LIBOR settings ceased immediately after December 31, 2021, remaining USD LIBOR settings will continue to be published until June 30, 2023. There remains uncertainty regarding the future utilization of LIBOR and the nature of any replacement rate. Any potential effects of the transition away from LIBOR on the fund, or on certain instruments in which the fund invests, cannot yet be determined. The transition process may result in, among other things, an increase in volatility or illiquidity of markets for instruments that currently rely on LIBOR, a reduction in the value of certain instruments held by the fund, or a reduction in the effectiveness of related fund transactions such as hedges. Any such effects could have an adverse impact on the fund’s performance.
Other Purchases and sales of portfolio securities other than short-term securities aggregated $3,478,002,000 and $1,534,013,000, respectively, for the year ended May 31, 2022.
NOTE 5 - FEDERAL INCOME TAXES
Generally, no provision for federal income taxes is required since the fund intends to continue to qualify as a regulated investment company under Subchapter M of the Internal Revenue Code and distribute to shareholders all of its taxable income and gains. Distributions determined in accordance with federal income tax regulations may differ in amount or character from net investment income and realized gains for financial reporting purposes.
The fund files U.S. federal, state, and local tax returns as required. The fund’s tax returns are subject to examination by the relevant tax authorities until expiration of the applicable statute of limitations, which is generally three years after the filing of the tax return but which can be extended to six years in certain circumstances. Tax returns for open years have incorporated no uncertain tax positions that require a provision for income taxes.
Capital accounts within the financial reporting records are adjusted for permanent book/tax differences to reflect tax character but are not adjusted for temporary differences. The permanent book/tax adjustments, if any, have no impact on results of operations or net assets.
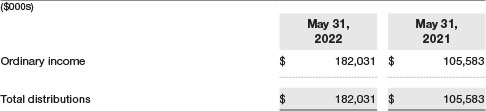
The tax character of distributions paid for the periods presented was as follows:
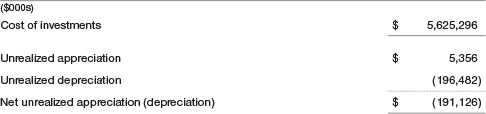
At May 31, 2022, the tax-basis cost of investments (including derivatives, if any) and gross unrealized appreciation and depreciation were as follows:
At May 31, 2022, the tax-basis components of accumulated net earnings (loss) were as follows:
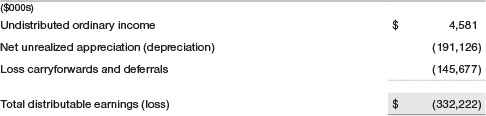
Temporary differences between book-basis and tax-basis components of total distributable earnings (loss) arise when certain items of income, gain, or loss are recognized in different periods for financial statement purposes versus for tax purposes; these differences will reverse in a subsequent reporting period. The temporary differences relate primarily to the deferral of losses from certain derivative contracts and wash sales. The loss carryforwards and deferrals primarily relate to capital loss carryforwards and straddle deferrals. Capital loss carryforwards are available indefinitely to offset future realized capital gains.
NOTE 6 - RELATED PARTY TRANSACTIONS
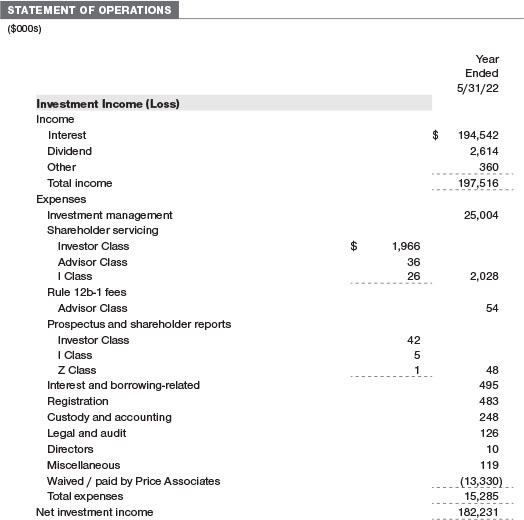
The fund is managed by T. Rowe Price Associates, Inc. (Price Associates), a wholly owned subsidiary of T. Rowe Price Group, Inc. (Price Group). The investment management agreement between the fund and Price Associates provides for an annual investment management fee, which is computed daily and paid monthly. The fee consists of an individual fund fee, equal to 0.30% of the fund’s average daily net assets, and a group fee. The group fee rate is calculated based on the combined net assets of certain mutual funds sponsored by Price Associates (the group) applied to a graduated fee schedule, with rates ranging from 0.48% for the first $1 billion of assets to 0.260% for assets in excess of $845 billion. The fund’s group fee is determined by applying the group fee rate to the fund’s average daily net assets. The fee is computed daily and paid monthly. At May 31, 2022, the effective annual group fee rate was 0.29%.
The Advisor Class is subject to a contractual expense limitation through the expense limitation date indicated in the table below. During the limitation period, Price Associates is required to waive its management fee or pay any expenses (excluding interest; expenses related to borrowings, taxes, and brokerage; and other non-recurring expenses permitted by the investment management agreement) that would otherwise cause the class’s ratio of annualized total expenses to average net assets (net expense ratio) to exceed its expense limitation. The class is required to repay Price Associates for expenses previously waived/paid to the extent the class’s net assets grow or expenses decline sufficiently to allow repayment without causing the class’s net expense ratio (after the repayment is taken into account) to exceed the lesser of: (1) the expense limitation in place at the time such amounts were waived; or (2) the class’s current expense limitation. However, no repayment will be made more than three years after the date of a payment or waiver.
The I Class is also subject to an operating expense limitation (I Class Limit) pursuant to which Price Associates is contractually required to pay all operating expenses of the I Class, excluding management fees; interest; expenses related to borrowings, taxes, and brokerage; and other non-recurring expenses permitted by the investment management agreement, to the extent such operating expenses, on an annualized basis, exceed the I Class Limit. This agreement will continue through the expense limitation date indicated in the table below, and may be renewed, revised, or revoked only with approval of the fund’s Board. The I Class is required to repay Price Associates for expenses previously paid to the extent the class’s net assets grow or expenses decline sufficiently to allow repayment without causing the class’s operating expenses (after the repayment is taken into account) to exceed the lesser of: (1) the I Class Limit in place at the time such amounts were paid; or (2) the current I Class Limit. However, no repayment will be made more than three years after the date of a payment or waiver.
The Z Class is also subject to a contractual expense limitation agreement whereby Price Associates has agreed to waive and/or bear all of the Z Class’ expenses (excluding interest; expenses related to borrowings, taxes, and brokerage; and nonrecurring expenses) in their entirety. This fee waiver and/or expense reimbursement arrangement is expected to remain in place indefinitely, and the agreement may only be amended or terminated with approval by the fund’s Board. Expenses of the fund waived/paid by the manager are not subject to later repayment by the fund.
Pursuant to these agreements, expenses were waived/paid by and/or repaid to Price Associates during the year ended May 31, 2022 as indicated in the table below. Including these amounts, expenses previously waived/paid by Price Associates in the amount of $36,000 remain subject to repayment by the fund at May 31, 2022. Any repayment of expenses previously waived/paid by Price Associates during the period would be included in the net investment income and expense ratios presented on the accompanying Financial Highlights.

In addition, the fund has entered into service agreements with Price Associates and two wholly owned subsidiaries of Price Associates, each an affiliate of the fund (collectively, Price). Price Associates provides certain accounting and administrative services to the fund. T. Rowe Price Services, Inc. provides shareholder and administrative services in its capacity as the fund’s transfer and dividend-disbursing agent. T. Rowe Price Retirement Plan Services, Inc. provides subaccounting and recordkeeping services for certain retirement accounts invested in the Investor Class and Advisor Class. For the year ended May 31, 2022, expenses incurred pursuant to these service agreements were $97,000 for Price Associates; $277,000 for T. Rowe Price Services, Inc.; and $5,000 for T. Rowe Price Retirement Plan Services, Inc. All amounts due to and due from Price, exclusive of investment management fees payable, are presented net on the accompanying Statement of Assets and Liabilities.
Mutual funds, trusts, and other accounts managed by Price Associates or its affiliates (collectively, Price Funds and accounts) may invest in the fund. No Price fund or account may invest for the purpose of exercising management or control over the fund. At May 31, 2022, approximately 100% of the Z Class’s outstanding shares were held by Price Funds and accounts.
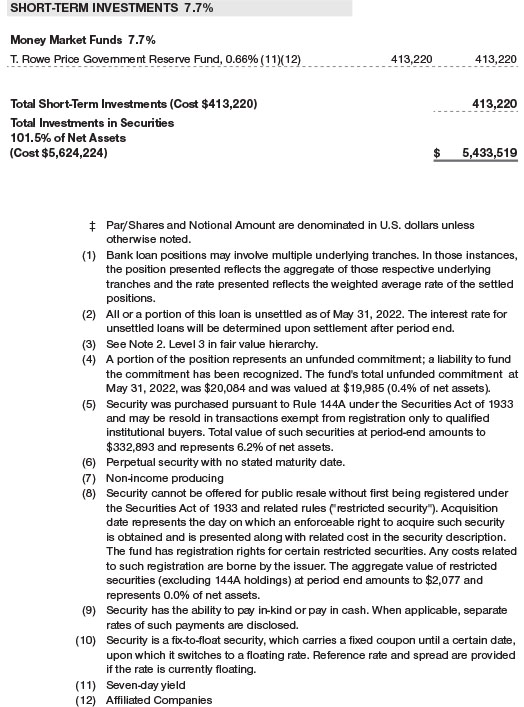
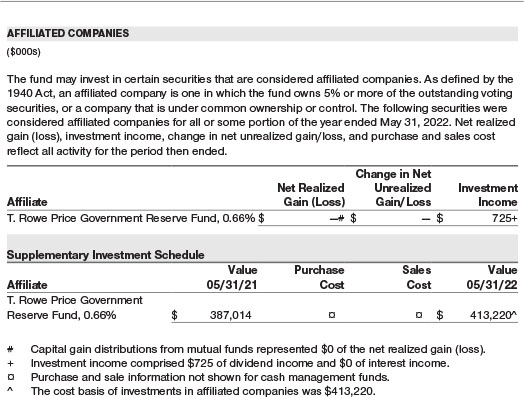
The fund may invest its cash reserves in certain open-end management investment companies managed by Price Associates and considered affiliates of the fund: the T. Rowe Price Government Reserve Fund or the T. Rowe Price Treasury Reserve Fund, organized as money market funds, or the T. Rowe Price Short-Term Fund, a short-term bond fund (collectively, the Price Reserve Funds). The Price Reserve Funds are offered as short-term investment options to mutual funds, trusts, and other accounts managed by Price Associates or its affiliates and are not available for direct purchase by members of the public. Cash collateral from securities lending, if any, is invested in the T. Rowe Price Government Reserve Fund; prior to December 13, 2021, the cash collateral from securities lending was invested in the T. Rowe Price Short-Term Fund. The Price Reserve Funds pay no investment management fees.
As of May 31, 2022, T. Rowe Price Group, Inc., or its wholly owned subsidiaries, owned 6,800,305 shares of the I Class, representing 6% of the I Class’s net assets.
The fund may participate in securities purchase and sale transactions with other funds or accounts advised by Price Associates (cross trades), in accordance with procedures adopted by the fund’s Board and Securities and Exchange Commission rules, which require, among other things, that such purchase and sale cross trades be effected at the independent current market price of the security. During the year ended May 31, 2022, the fund had no purchases or sales cross trades with other funds or accounts advised by Price Associates.
NOTE 7 - BORROWING
The fund, together with certain other U.S. registered funds (the U.S. borrowers) and foreign investment funds managed by Price Associates or an affiliate (collectively, the participating funds), is party to a $1 billion, 364-day, syndicated credit facility (the facility). Excluding commitments designated for the foreign investment funds, the fund can borrow up to an aggregate commitment amount of $850 million on a first-come, first-served basis. The facility provides a source of liquidity to the participating funds for temporary and emergency purposes. Interest is charged to the U.S. borrowers at a rate equal to 1.00% plus the Federal Funds Rate. The participating funds are charged administrative fees and an annual commitment fee of 0.15% of the average daily undrawn commitment. All fees allocated to the U.S. borrowers are based on the portion of the aggregate commitment available to them and on each U.S. borrower’s relative net assets. Such allocated fees are reflected as either miscellaneous or interest and borrowing related expense in the Statement of Operations. Loans are generally unsecured; however, the fund must collateralize any borrowings under the facility on an equivalent basis if it has other collateralized borrowings. At May 31, 2022, the fund had no borrowings outstanding under the facility, and the undrawn amount of the facility for the U.S. borrowers was $850,000,000.
NOTE 8 - OTHER MATTERS
Unpredictable events such as environmental or natural disasters, war, terrorism, pandemics, outbreaks of infectious diseases, and similar public health threats may significantly affect the economy and the markets and issuers in which a fund invests. Certain events may cause instability across global markets, including reduced liquidity and disruptions in trading markets, while some events may affect certain geographic regions, countries, sectors, and industries more significantly than others, and exacerbate other pre-existing political, social, and economic risks. Since 2020, a novel strain of coronavirus (COVID-19) has resulted in disruptions to global business activity and caused significant volatility and declines in global financial markets. In February 2022, Russian forces entered Ukraine and commenced an armed conflict. Economic sanctions have since been imposed on Russia and certain of its citizens, including the exclusion of Russia from the SWIFT global payments network. As a result, Russian-related stocks and debt have since suffered significant declines in value. The duration of the coronavirus outbreak and the Russian-Ukraine conflict, and their effects on the financial markets, cannot be determined with certainty. The fund’s performance could be negatively impacted if the value of a portfolio holding were harmed by these and such other events. Management is actively monitoring these events.
REPORT OF INDEPENDENT REGISTERED PUBLIC ACCOUNTING FIRM
To the Board of Directors and Shareholders of
T. Rowe Price Floating Rate Fund, Inc.
Opinion on the Financial Statements
We have audited the accompanying statement of assets and liabilities, including the portfolio of investments, of T. Rowe Price Floating Rate Fund, Inc. (the “Fund”) as of May 31, 2022, the related statement of operations for the year ended May 31, 2022, the statement of changes in net assets for each of the two years in the period ended May 31, 2022, including the related notes, and the financial highlights for each of the periods indicated therein (collectively referred to as the “financial statements”). In our opinion, the financial statements present fairly, in all material respects, the financial position of the Fund as of May 31, 2022, the results of its operations for the year then ended, the changes in its net assets for each of the two years in the period ended May 31, 2022 and the financial highlights for each of the periods indicated therein, in conformity with accounting principles generally accepted in the United States of America.
Basis for Opinion
These financial statements are the responsibility of the Fund’s management. Our responsibility is to express an opinion on the Fund’s financial statements based on our audits. We are a public accounting firm registered with the Public Company Accounting Oversight Board (United States) (PCAOB) and are required to be independent with respect to the Fund in accordance with the U.S. federal securities laws and the applicable rules and regulations of the Securities and Exchange Commission and the PCAOB.
We conducted our audits of these financial statements in accordance with the standards of the PCAOB. Those standards require that we plan and perform the audit to obtain reasonable assurance about whether the financial statements are free of material misstatement, whether due to error or fraud.
Our audits included performing procedures to assess the risks of material misstatement of the financial statements, whether due to error or fraud, and performing procedures that respond to those risks. Such procedures included examining, on a test basis, evidence regarding the amounts and disclosures in the financial statements. Our audits also included evaluating the accounting principles used and significant estimates made by management, as well as evaluating the overall presentation of the financial statements. Our procedures included confirmation of securities owned as of May 31, 2022 by correspondence with the custodians, transfer agent and brokers; when replies were not received from brokers, we performed other auditing procedures. We believe that our audits provide a reasonable basis for our opinion.
PricewaterhouseCoopers LLP
Baltimore, Maryland
July 20, 2022
We have served as the auditor of one or more investment companies in the T. Rowe Price group of investment companies since 1973.
TAX INFORMATION (UNAUDITED) FOR THE TAX YEAR ENDED 5/31/22
We are providing this information as required by the Internal Revenue Code. The amounts shown may differ from those elsewhere in this report because of differences between tax and financial reporting requirements.
For taxable non-corporate shareholders, $1,215,000 of the fund’s income represents qualified dividend income subject to a long-term capital gains tax rate of not greater than 20%.
For corporate shareholders, $1,215,000 of the fund’s income qualifies for the dividends-received deduction.
For shareholders subject to interest expense deduction limitation under Section 163(j), $168,338,000 of the fund’s income qualifies as a Section 163(j) interest dividend and can be treated as interest income for purposes of Section 163(j), subject to holding period requirements and other limitations.
INFORMATION ON PROXY VOTING POLICIES, PROCEDURES, AND RECORDS
A description of the policies and procedures used by T. Rowe Price funds to determine how to vote proxies relating to portfolio securities is available in each fund’s Statement of Additional Information. You may request this document by calling 1-800-225-5132 or by accessing the SEC’s website, sec.gov.
The description of our proxy voting policies and procedures is also available on our corporate website. To access it, please visit the following Web page:
https://www.troweprice.com/corporate/us/en/utility/policies.html
Scroll down to the section near the bottom of the page that says, “Proxy Voting Guidelines.” Click on the links in the shaded box.
Each fund’s most recent annual proxy voting record is available on our website and through the SEC’s website. To access it through T. Rowe Price, visit the website location shown above, and scroll down to the section near the bottom of the page that says, “Proxy Voting Records.” Click on the Proxy Voting Records link in the shaded box.
HOW TO OBTAIN QUARTERLY PORTFOLIO HOLDINGS
The fund files a complete schedule of portfolio holdings with the Securities and Exchange Commission (SEC) for the first and third quarters of each fiscal year as an exhibit to its reports on Form N-PORT. The fund’s reports on Form N-PORT are available electronically on the SEC’s website (sec.gov). In addition, most T. Rowe Price funds disclose their first and third fiscal quarter-end holdings on troweprice.com.
APPROVAL OF INVESTMENT MANAGEMENT AGREEMENT
Each year, the fund’s Board of Directors (Board) considers the continuation of the investment management agreement (Advisory Contract) between the fund and its investment adviser, T. Rowe Price Associates, Inc. (Adviser). In that regard, at a meeting held on March 7–8, 2022 (Meeting), the Board, including all of the fund’s independent directors, approved the continuation of the fund’s Advisory Contract. At the Meeting, the Board considered the factors and reached the conclusions described below relating to the selection of the Adviser and the approval of the Advisory Contract. The independent directors were assisted in their evaluation of the Advisory Contract by independent legal counsel from whom they received separate legal advice and with whom they met separately.
In providing information to the Board, the Adviser was guided by a detailed set of requests for information submitted by independent legal counsel on behalf of the independent directors. In considering and approving the Advisory Contract, the Board considered the information it believed was relevant, including, but not limited to, the information discussed below. The Board considered not only the specific information presented in connection with the Meeting but also the knowledge gained over time through interaction with the Adviser about various topics. The Board meets regularly and, at each of its meetings, covers an extensive agenda of topics and materials and considers factors that are relevant to its annual consideration of the renewal of the T. Rowe Price funds’ advisory contracts, including performance and the services and support provided to the funds and their shareholders.
Services Provided by the Adviser
The Board considered the nature, quality, and extent of the services provided to the fund by the Adviser. These services included, but were not limited to, directing the fund’s investments in accordance with its investment program and the overall management of the fund’s portfolio, as well as a variety of related activities such as financial, investment operations, and administrative services; compliance; maintaining the fund’s records and registrations; and shareholder communications. The Board also reviewed the background and experience of the Adviser’s senior management team and investment personnel involved in the management of the fund, as well as the Adviser’s compliance record. The Board concluded that it was satisfied with the nature, quality, and extent of the services provided by the Adviser.
Investment Performance of the Fund
The Board took into account discussions with the Adviser and reports that it receives throughout the year relating to fund performance. In connection with the Meeting, the Board reviewed the fund’s total returns for various periods through December 31, 2021, and compared these returns with the performance of a peer group of funds with similar investment programs and a wide variety of other previously agreed-upon comparable performance measures and market data, including relative performance information as of September 30, 2021, supplied by Broadridge, which is an independent provider of mutual fund data.
On the basis of this evaluation and the Board’s ongoing review of investment results, and factoring in the relative market conditions during certain of the performance periods, the Board concluded that the fund’s performance was satisfactory.
Costs, Benefits, Profits, and Economies of Scale
The Board reviewed detailed information regarding the revenues received by the Adviser under the Advisory Contract and other direct and indirect benefits that the Adviser (and its affiliates) may have realized from its relationship with the fund. In considering soft-dollar arrangements pursuant to which research may be received from broker-dealers that execute the fund’s portfolio transactions, the Board noted that the Adviser bears the cost of research services for all client accounts that it advises, including the T. Rowe Price funds. The Board received information on the estimated costs incurred and profits realized by the Adviser from managing the T. Rowe Price funds. The Board also reviewed estimates of the profits realized from managing the fund in particular, and the Board concluded that the Adviser’s profits were reasonable in light of the services provided to the fund.
The Board also considered whether the fund benefits under the fee levels set forth in the Advisory Contract or otherwise from any economies of scale realized by the Adviser. Under the Advisory Contract, the fund pays a fee to the Adviser for investment management services composed of two components—a group fee rate based on the combined average net assets of most of the T. Rowe Price funds (including the fund) that declines at certain asset levels and an individual fund fee rate based on the fund’s average daily net assets—and the fund pays its own expenses of operations. The Board concluded that the advisory fee structure for the fund continued to provide for a reasonable sharing of benefits from any economies of scale with the fund’s investors.
Fees and Expenses
The Board was provided with information regarding industry trends in management fees and expenses. Among other things, the Board reviewed data for peer groups that were compiled by Broadridge, which compared: (i) contractual management fees, actual management fees, nonmanagement expenses, and total expenses of the Investor Class of the fund with a group of competitor funds selected by Broadridge (Investor Class Expense Group); (ii) actual management fees and total expenses of the Advisor Class of the fund with a group of competitor funds selected by Broadridge (Advisor Class Expense Group); and (iii) actual management fees, nonmanagement expenses, and total expenses of the Investor Class of the fund with a broader set of funds within the Lipper investment classification (Expense Universe). The Board considered the fund’s contractual management fee rate, actual management fee rate (which reflects the management fees actually received from the fund by the Adviser after any applicable waivers, reductions, or reimbursements), operating expenses, and total expenses (which reflect the net total expense ratio of the fund after any waivers, reductions, or reimbursements) in comparison with the information for the Broadridge peer groups. Broadridge generally constructed the peer groups by seeking the most comparable funds based on similar investment classifications and objectives, expense structure, asset size, and operating components and attributes and ranked funds into quintiles, with the first quintile representing the funds with the lowest relative expenses and the fifth quintile representing the funds with the highest relative expenses. The information provided to the Board indicated that the fund’s contractual management fee ranked in the second quintile (Investor Class Expense Group), the fund’s actual management fee rate ranked in the third quintile (Investor Class Expense Group and Expense Universe) and first quintile (Advisor Class Expense Group), and the fund’s total expenses ranked in the second quintile (Investor Class Expense Group and Expense Universe) and first quintile (Advisor Class Expense Group).
The Board also reviewed the fee schedules for other investment portfolios with similar mandates that are advised or subadvised by the Adviser and its affiliates, including separately managed accounts for institutional and individual investors; subadvised funds; and other sponsored investment portfolios, including collective investment trusts and pooled vehicles organized and offered to investors outside the United States. Management provided the Board with information about the Adviser’s responsibilities and services provided to subadvisory and other institutional account clients, including information about how the requirements and economics of the institutional business are fundamentally different from those of the proprietary mutual fund business. The Board considered information showing that the Adviser’s mutual fund business is generally more complex from a business and compliance perspective than its institutional account business and considered various relevant factors, such as the broader scope of operations and oversight, more extensive shareholder communication infrastructure, greater asset flows, heightened business risks, and differences in applicable laws and regulations associated with the Adviser’s proprietary mutual fund business. In assessing the reasonableness of the fund’s management fee rate, the Board considered the differences in the nature of the services required for the Adviser to manage its mutual fund business versus managing a discrete pool of assets as a subadviser to another institution’s mutual fund or for an institutional account and that the Adviser generally performs significant additional services and assumes greater risk in managing the fund and other T. Rowe Price funds than it does for institutional account clients, including subadvised funds.
On the basis of the information provided and the factors considered, the Board concluded that the fees paid by the fund under the Advisory Contract are reasonable.
Approval of the Advisory Contract
As noted, the Board approved the continuation of the Advisory Contract. No single factor was considered in isolation or to be determinative to the decision. Rather, the Board concluded, in light of a weighting and balancing of all factors considered, that it was in the best interests of the fund and its shareholders for the Board to approve the continuation of the Advisory Contract (including the fees to be charged for services thereunder).
ABOUT THE FUND’S DIRECTORS AND OFFICERS
Your fund is overseen by a Board of Directors (Board) that meets regularly to review a wide variety of matters affecting or potentially affecting the fund, including performance, investment programs, compliance matters, advisory fees and expenses, service providers, and business and regulatory affairs. The Board elects the fund’s officers, who are listed in the final table. The directors who are also employees or officers of T. Rowe Price are considered to be interested directors because of their relationships with T. Rowe Price and its affiliates. The business address of each director and officer is 100 East Pratt Street, Baltimore, Maryland 21202. The Statement of Additional Information includes additional information about the fund directors and is available without charge by calling a T. Rowe Price representative at 1-800-638-5660.
INDEPENDENT DIRECTORS(a)
Name
(Year of Birth)
Year Elected
[Number of T. Rowe Price
Portfolios Overseen] | | Principal Occupation(s) and Directorships of Public Companies and
Other Investment Companies During the Past Five Years |
| | | |
Teresa Bryce Bazemore
(1959)
2018
[204] | | President and Chief Executive Officer, Federal Home Loan Bank of San Francisco (2021 to present); President, Radian Guaranty (2008 to 2017); Chief Executive Officer, Bazemore Consulting LLC (2018 to 2021); Director, Chimera Investment Corporation (2017 to 2021); Director, First Industrial Realty Trust (2020 to present); Director, Federal Home Loan Bank of Pittsburgh (2017 to 2019) |
| | | |
Ronald J. Daniels(b)
(1959)
2018
[0] | | President, The Johns Hopkins University and Professor, Political Science Department, The Johns Hopkins University (2009 to present); Director, Lyndhurst Holdings (2015 to present); Director, BridgeBio Pharma, Inc. (2020 to present) |
| | | |
Bruce W. Duncan
(1951)
2013
[204] | | President, Chief Executive Officer, and Director, CyrusOne, Inc. (2020 to 2021); Chief Executive Officer and Director (2009 to 2016), Chair of the Board (2016 to 2020), and President (2009 to 2016), First Industrial Realty Trust, owner and operator of industrial properties; Chair of the Board (2005 to 2016) and Director (1999 to 2016), Starwood Hotels & Resorts, a hotel and leisure company; Member, Investment Company Institute Board of Governors (2017 to 2019); Member, Independent Directors Council Governing Board (2017 to 2019); Senior Advisor, KKR (2018 to present); Director, Boston Properties (2016 to present); Director, Marriott International, Inc. (2016 to 2020) |
| | | |
Robert J. Gerrard, Jr.
(1952)
2013
[204] | | Advisory Board Member, Pipeline Crisis/Winning Strategies, a collaborative working to improve opportunities for young African Americans (1997 to 2016); Chair of the Board, all funds (July 2018 to present) |
| | | |
Paul F. McBride
(1956)
2013
[204] | | Advisory Board Member, Vizzia Technologies (2015 to present); Board Member, Dunbar Armored (2012 to 2018) |
| | | |
Kellye L. Walker(c)
(1966)
2021
[204] | | Executive Vice President and Chief Legal Officer, Eastman Chemical Company (April 2020 to present); Executive Vice President and Chief Legal Officer, Huntington Ingalls Industries, Inc. (NYSE: HIl) (January 2015 to March 2020); Director, Lincoln Electric Company (October 2020 to present) |
| | | |
| (a)All information about the independent directors was current as of December 31, 2021, unless otherwise indicated, except for the number of portfolios overseen, which is current as of the date of this report. |
| (b)Effective April 27, 2022, Mr. Daniels resigned from his role as an independent director of the Price Funds. |
| (c)Effective November 8, 2021, Ms. Walker was appointed as an independent director of the Price Funds. |
INTERESTED DIRECTORS(a)
Name
(Year of Birth)
Year Elected
[Number of T. Rowe Price
Portfolios Overseen] | | Principal Occupation(s) and Directorships of Public Companies and
Other Investment Companies During the Past Five Years |
| | | |
David Oestreicher
(1967)
2018
[204] | | Director, Vice President, and Secretary, T. Rowe Price, T. Rowe Price Investment Services, Inc., T. Rowe Price Retirement Plan Services, Inc., and T. Rowe Price Services, Inc.; Director and Secretary, T. Rowe Price Investment Management, Inc. (Price Investment Management); Vice President and Secretary, T. Rowe Price International (Price International); Vice President, T. Rowe Price Hong Kong (Price Hong Kong), T. Rowe Price Japan (Price Japan), and T. Rowe Price Singapore (Price Singapore); General Counsel, Vice President, and Secretary, T. Rowe Price Group, Inc.; Chair of the Board, Chief Executive Officer, President, and Secretary, T. Rowe Price Trust Company; Principal Executive Officer and Executive Vice President, all funds |
| | | |
Robert W. Sharps, CFA, CPA
(1971)
2019
[0] | | Director and Vice President, T. Rowe Price; Director, Price Investment Management; Chief Executive Officer and President, T. Rowe Price Group, Inc.; Vice President, T. Rowe Price Trust Company |
| | | |
Eric L. Veiel, CFA
(1972)
2022
[204] | | Director and Vice President, T. Rowe Price; Vice President, T. Rowe Price Group, Inc., and T. Rowe Price Trust Company |
| | | |
| (a)All information about the interested directors was current as of January 1, 2022, unless otherwise indicated, except for the number of portfolios overseen, which is current as of the date of this report. |
OFFICERS
Name (Year of Birth)
Position Held With Floating Rate Fund | | Principal Occupation(s) |
| | | |
Jason A. Bauer (1979)
Vice President | | Vice President, T. Rowe Price and T. Rowe Price Group, Inc. |
| | | |
Armando (Dino) Capasso (1974)
Chief Compliance Officer | | Chief Compliance Officer and Vice President, T. Rowe Price and Price Investment Management; Vice President, T. Rowe Price Group, Inc.; formerly, Chief Compliance Officer, PGIM Investments LLC and AST Investment Services, Inc. (ASTIS) (to 2022); Chief Compliance Officer, PGIM Retail Funds complex and Prudential Insurance Funds (to 2022); Vice President and Deputy Chief Compliance Officer, PGIM Investments LLC and ASTIS (to 2019); Senior Vice President and Senior Counsel, Pacific Investment Management Company LLC (to 2017) |
| | | |
Michael F. Connelly, CFA (1977)
Vice President | | Vice President, T. Rowe Price and T. Rowe Price Group, Inc. |
| | | |
Alan S. Dupski, CPA (1982)
Principal Financial Officer, Vice President, and Treasurer | | Vice President, Price Investment Management, T. Rowe Price, T. Rowe Price Group, Inc., and T. Rowe Price Trust Company |
| | | |
Stephen M. Finamore, CFA (1976)
Vice President | | Vice President, T. Rowe Price and T. Rowe Price Group, Inc. |
| | | |
Justin T. Gerbereux, CFA (1975)
Vice President | | Vice President, T. Rowe Price, T. Rowe Price Group, Inc., and T. Rowe Price Trust Company |
| | | |
Gary J. Greb (1961)
Vice President | | Vice President, Price Investment Management, T. Rowe Price, Price International, and T. Rowe Price Trust Company |
| | | |
Cheryl Hampton (1969)
Vice President | | Vice President, T. Rowe Price |
| | | |
Benjamin Kersse (1989)
Vice President | | Vice President, T. Rowe Price |
| | | |
Paul J. Krug, CPA (1964)
Vice President | | Vice President, T. Rowe Price, T. Rowe Price Group, Inc., and T. Rowe Price Trust Company |
| | | |
Paul M. Massaro, CFA (1975)
President | | Vice President, T. Rowe Price, T. Rowe Price Group, Inc., and T. Rowe Price Trust Company |
| | | |
Michael J. McGonigle (1966)
Vice President | | Vice President, T. Rowe Price and T. Rowe Price Group, Inc. |
| | | |
Fran M. Pollack-Matz (1961)
Vice President and Secretary | | Vice President, T. Rowe Price, T. Rowe Price Group, Inc., T. Rowe Price Investment Services, Inc., and T. Rowe Price Services, Inc. |
| | | |
Shannon H. Rauser (1987)
Assistant Secretary | | Assistant Vice President, T. Rowe Price |
| | | |
Brian A. Rubin, CPA (1974)
Vice President | | Vice President, T. Rowe Price, T. Rowe Price Group, Inc., and T. Rowe Price Trust Company |
| | | |
Michael J. Trivino (1981)
Vice President | | Vice President, T. Rowe Price and T. Rowe Price Group, Inc. |
| | | |
Megan Warren (1968)
Vice President | | OFAC Sanctions Compliance Officer and Vice President, Price Investment Management; Vice President, T. Rowe Price, T. Rowe Price Group, Inc., T. Rowe Price Retirement Plan Services, Inc., T. Rowe Price Services, Inc., and T. Rowe Price Trust Company |
| | | |
Rebecca Willey (1987)
Vice President | | Vice President, T. Rowe Price |
| | | |
| Unless otherwise noted, officers have been employees of T. Rowe Price or Price International for at least 5 years. |
Item 1. (b) Notice pursuant to Rule 30e-3.
Not applicable.
Item 2. Code of Ethics.
The registrant has adopted a code of ethics, as defined in Item 2 of Form N-CSR, applicable to its principal executive officer, principal financial officer, principal accounting officer or controller, or persons performing similar functions. A copy of this code of ethics is filed as an exhibit to this Form N-CSR. No substantive amendments were approved or waivers were granted to this code of ethics during the period covered by this report.
Item 3. Audit Committee Financial Expert.
The registrant’s Board of Directors has determined that Ms. Teresa Bryce Bazemore qualifies as an audit committee financial expert, as defined in Item 3 of Form N-CSR. Ms. Bazemore is considered independent for purposes of Item 3 of Form N-CSR.
Item 4. Principal Accountant Fees and Services.
(a) – (d) Aggregate fees billed for the last two fiscal years for professional services rendered to, or on behalf of, the registrant by the registrant’s principal accountant were as follows:

Audit fees include amounts related to the audit of the registrant’s annual financial statements and services normally provided by the accountant in connection with statutory and regulatory filings. Audit-related fees include amounts reasonably related to the performance of the audit of the registrant’s financial statements and specifically include the issuance of a report on internal controls and, if applicable, agreed-upon procedures related to fund acquisitions. Tax fees include amounts related to services for tax compliance, tax planning, and tax advice. The nature of these services specifically includes the review of distribution calculations and the preparation of Federal, state, and excise tax returns. All other fees include the registrant’s pro-rata share of amounts for agreed-upon procedures in conjunction with service contract approvals by the registrant’s Board of Directors/Trustees.
(e)(1) The registrant’s audit committee has adopted a policy whereby audit and non-audit services performed by the registrant’s principal accountant for the registrant, its investment adviser, and any entity controlling, controlled by, or under common control with the investment adviser that provides ongoing services to the registrant require pre-approval in advance at regularly scheduled audit committee meetings. If such a service is required between regularly scheduled audit committee meetings, pre-approval may be authorized by one audit committee member with ratification at the next scheduled audit committee meeting. Waiver of pre-approval for audit or non-audit services requiring fees of a de minimis amount is not permitted.
(2) No services included in (b) – (d) above were approved pursuant to paragraph (c)(7)(i)(C) of Rule 2-01 of Regulation S-X.
(f) Less than 50 percent of the hours expended on the principal accountant’s engagement to audit the registrant’s financial statements for the most recent fiscal year were attributed to work performed by persons other than the principal accountant’s full-time, permanent employees.
(g) The aggregate fees billed for the most recent fiscal year and the preceding fiscal year by the registrant’s principal accountant for non-audit services rendered to the registrant, its investment adviser, and any entity controlling, controlled by, or under common control with the investment adviser that provides ongoing services to the registrant were $2,959,000 and $3,481,000, respectively.
(h) All non-audit services rendered in (g) above were pre-approved by the registrant’s audit committee. Accordingly, these services were considered by the registrant’s audit committee in maintaining the principal accountant’s independence.
Item 5. Audit Committee of Listed Registrants.
Not applicable.
Item 6. Investments.
(a) Not applicable. The complete schedule of investments is included in Item 1 of this Form N-CSR.
(b) Not applicable.
Item 7. Disclosure of Proxy Voting Policies and Procedures for Closed-End Management Investment Companies.
Not applicable.
Item 8. Portfolio Managers of Closed-End Management Investment Companies.
Not applicable.
Item 9. Purchases of Equity Securities by Closed-End Management Investment Company and Affiliated Purchasers.
Not applicable.
Item 10. Submission of Matters to a Vote of Security Holders.
There has been no change to the procedures by which shareholders may recommend nominees to the registrant’s board of directors.
Item 11. Controls and Procedures.
(a) The registrant’s principal executive officer and principal financial officer have evaluated the registrant’s disclosure controls and procedures within 90 days of this filing and have concluded that the registrant’s disclosure controls and procedures were effective, as of that date, in ensuring that information required to be disclosed by the registrant in this Form N-CSR was recorded, processed, summarized, and reported timely.
(b) The registrant’s principal executive officer and principal financial officer are aware of no change in the registrant’s internal control over financial reporting that occurred during the period covered by this report that has materially affected, or is reasonably likely to materially affect, the registrant’s internal control over financial reporting.
Item 12. Disclosure of Securities Lending Activities for Closed-End Management Investment Companies.
Not applicable.
Item 13. Exhibits.
(a)(1) The registrant’s code of ethics pursuant to Item 2 of Form N-CSR is attached.
(2) Separate certifications by the registrant's principal executive officer and principal financial officer, pursuant to Section 302 of the Sarbanes-Oxley Act of 2002 and required by Rule 30a-2(a) under the Investment Company Act of 1940, are attached.
(3) Written solicitation to repurchase securities issued by closed-end companies: not applicable.
(b) A certification by the registrant’s principal executive officer and principal financial officer, pursuant to Section 906 of the Sarbanes-Oxley Act of 2002 and required by Rule 30a-2(b) under the Investment Company Act of 1940, is attached.
SIGNATURES
Pursuant to the requirements of the Securities Exchange Act of 1934 and the Investment Company Act of 1940, the registrant has duly caused this report to be signed on its behalf by the undersigned, thereunto duly authorized.
T. Rowe Price Floating Rate Fund, Inc.
| By | | /s/ David Oestreicher |
| | | David Oestreicher |
| | | Principal Executive Officer |
| |
| Date | | July 20, 2022 | | | | |
Pursuant to the requirements of the Securities Exchange Act of 1934 and the Investment Company Act of 1940, this report has been signed below by the following persons on behalf of the registrant and in the capacities and on the dates indicated.
| By | | /s/ David Oestreicher |
| | | David Oestreicher |
| | | Principal Executive Officer |
| |
| Date | | July 20, 2022 | | | | |
| |
| |
| By | | /s/ Alan S. Dupski |
| | | Alan S. Dupski |
| | | Principal Financial Officer |
| |
| Date | | July 20, 2022 | | | | |