UNITED STATES
SECURITIES AND EXCHANGE COMMISSION
Washington, D.C. 20549
FORM N-CSR
CERTIFIED SHAREHOLDER REPORT OF REGISTERED
MANAGEMENT INVESTMENT COMPANIES
Investment Company Act file number | 811-22563 |
|
Mairs & Power Funds Trust |
(Exact name of registrant as specified in charter) |
|
332 Minnesota Street, Suite W1520, St. Paul, MN | | 55101 |
(Address of principal executive offices) | | (Zip code) |
|
Andrea C. Stimmel, Chief Compliance Officer & Treasurer, 332 Minnesota Street, Suite W1520, St. Paul, MN 55101 |
(Name and address of agent for service) |
|
Registrant’s telephone number, including area code: | 651-222-8478 | |
|
Date of fiscal year end: | December 31, 2012 | |
|
Date of reporting period: | December 31, 2012 | |
| | | | | | | | |
Item 1. Reports to Stockholders.

Investing for the long-term
ANNUAL REPORT
DECEMBER 31, 2012
- GROWTH FUND (MPGFX)
est. 1958
- BALANCED FUND (MAPOX)
est. 1961
- SMALL CAP FUND (MSCFX)
est. 2011
Mairs & Power W1520 First National Bank Building, 332 Minnesota Street, St. Paul, Minnesota 55101 www.mairsandpower.com
MAIRS & POWER FUNDS MARKET COMMENTARY (unaudited)
February 14, 2013
Fourth Quarter Results
Reflecting such uncertainties as the Presidential Election, the "Fiscal Cliff" and related tax changes, European financial problems, Middle East turmoil and the growth outlook for China, the overall U.S. stock market was relatively flat during the fourth quarter with the Standard & Poor's 500 showing a slight negative return of -0.38%. Other indexes such as the Dow Jones Industrial Average and the broader Russell 3000 Index showed similar respective returns of -1.74% and 0.25%.
Recently reported real Gross Domestic Product numbers for the fourth quarter showed a disappointing preliminary reading of -0.1%. Even though the slightly negative figure resulted primarily from lower government spending (mainly defense) and some inventory liquidation, growth in the more important areas of the economy such as consumer and business spending were less than most forecasters had been looking for. While some improvement seems to be taking place in recent employment figures, the basic underlying unemployment rate remains basically unchanged at just under 8%. Although at a reduced rate, corporate profits are believed to have increased during the quarter in response to continuing cost reduction programs as well as an ever increasing contribution from foreign operations.
As a consequence of efforts to improve the rate of domestic economic growth and reduce unemployment, the Federal Reserve continues to implement a very stimulative monetary policy aimed at keeping short-term interest rates at historically low levels. Longer term interest rates have similarly come under downward pressure as a result of successive quantitative easing programs using Federal Reserve credit to make open market purchases of outstanding bonds.
Future Outlook
Despite the many negatives continuing to face the economy such as higher taxes, uncertain health care costs and greater regulation, some modest level of overall economic growth in the area of 2% still seems achievable. This forecast results from a number of positive factors including the likelihood of a continuing low level of interest rates, some improvement in the employment picture, a further recovery in housing from very depressed levels and rising export demand from faster growing emerging markets such as China. Corporate profits also seem likely to show continuing growth in response to continuing productivity gains and a rising contribution from foreign operations.
Recent Federal Reserve policy statements suggest a low interest rate policy will continue over the foreseeable future unless unemployment shows a noticeable improvement and/or inflation becomes a more serious issue. Any pronounced weakening of the U. S. Dollar in foreign exchange markets could also cause the Fed to reverse course because of the potential impact on inflation.
Assuming a stable interest rate environment and some increase in corporate earnings, the outlook for the stock prices remains favorable. Although stock prices have continued to move up, valuation levels remain reasonable considering the historically low level of interest rates as well as a continuing higher than normal equity risk premium. Finally, market liquidity does not appear to be an issue with money continuing to move out of lower yielding fixed income investments and into stocks. Corporations are also under increasing pressure to use balance sheet liquidity to fund stock buyback programs and/or increase dividends.
Dow Jones Industrial Average is a price-weighted average of 30 significant stocks traded on the New York Stock Exchange and the NASDAQ. It is not possible to invest directly in an index.
Russell 3000 Index measures the performance of the largest 3,000 U.S. companies representing approximately 98% of the investable U.S. equity market. It is not possible to invest directly in an index.
1
MAIRS & POWER GROWTH FUND (unaudited)
To Our Shareholders: February 14, 2013
The relatively strong performance enjoyed by the Growth Fund during the first three quarters of the year continued during the final period. Thanks to the outstanding gains shown by a number of individual issues, the Fund produced a return of 3.00% compared to a slightly negative return of -0.38% for the benchmark Standard & Poor's 500 Stock Index and -1.74% for the Dow Jones Industrial Average (DJIA). The Fund's performance also compared favorably against the peer group Lipper Multi-Cap Core Funds Index which had a return of 1.70%. Performance benefited from over- weightings in health care and several industrial categories as well as below average representation in such poor performing sectors as energy, consumer staples, technology and utilities. Among individual holdings Badger Meter (+30.28%), Cray (+25.59%), Daktronics (+16.40%), H. B. Fuller (+13.49%) and Valspar (+11.23%) did best while Western Union (-25.30%), St. Jude Medical (-14.22%), Intel (-9.04%), General Electric (-7.57%) and US Bancorp (-6.88%) fared the worst.
For the full year, the Fund showed a particularly strong performance both on an absolute basis as well as relative to its benchmark and its peers. The full year return of +21.91% compared to lesser returns of 16.00% for the benchmark S&P 500 and 10.24% for the DJIA. The peer group Lipper Multi-Cap Core Funds Index also had a lesser return of 16.15%. Like the fourth quarter, full year results benefited significantly from having virtually no representation in energy and utilities, the two worst performing sectors of the market. Conversely, the Fund was well represented in some of the better performing sectors such as consumer cyclical, financial and health care. While several smaller holdings like Badger Meter, Cray and SurModics did well for the full year, it was some of the larger holdings such as Valspar (+60.12%), H. B. Fuller (+50.67%), Pentair (+47.64%), Toro (+41.71%) and Baxter Int'l (+34.72%) that carried the day.
William B. Frels
President and Lead Manager
Mark L. Henneman
Vice President and Co-Manager
All investments have risks. The Growth Fund is designed for long-term investors. Equity investments are subject to market fluctuations, and the Fund's share price can fall because of weakness in the broad market, a particular industry, or specific holdings. Investments in small and midcap companies generally are more volatile. International investing risks include among others political, social or economic instability, difficulty in predicting international trade patterns, taxation and foreign trading practices, and greater fluctuations in price than United States corporations.
Dow Jones Industrial Average is a price-weighted average of 30 significant stocks traded on the New York Stock Exchange and the NASDAQ. It is not possible to invest directly in an index.
Lipper Multi-Cap Core Funds Index is an unmanaged index considered representative of multi-cap core funds tracked by Lipper. It is not possible to invest directly in an index.
2
Mairs & Power Growth Fund
PERFORMANCE INFORMATION (unaudited) December 31, 2012
Ten years of investment performance (through December 31, 2012)
This chart illustrates the performance of a hypothetical $10,000 investment made in the Fund 10 years ago.
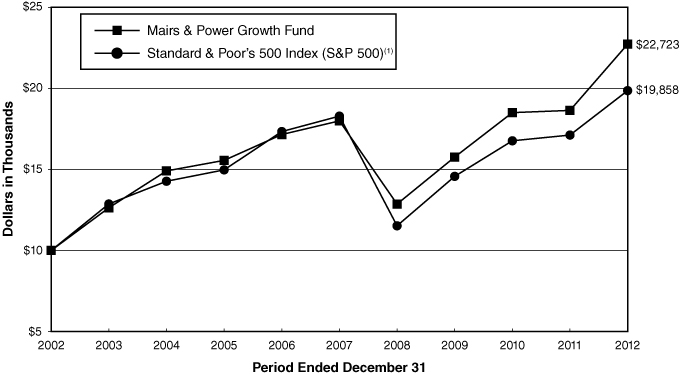
Average annual total returns for periods ended December 31, 2012
| | | 1 year | | 5 years | | 10 years | | 20 years | |
Mairs & Power Growth Fund | | | 21.91 | % | | | 4.78 | % | | | 8.55 | % | | | 11.94 | % | |
S&P 500(1) | | | 16.00 | % | | | 1.66 | % | | | 7.10 | % | | | 8.22 | % | |
Performance data quoted represents past performance and does not guarantee future results. All performance information shown includes the reinvestment of dividend and capital gain distributions, but does not reflect the deduction of taxes that a shareholder would pay on Fund distributions or the redemption of Fund shares. The investment return and principal value of an investment will fluctuate so that an investor's shares, when redeemed, may be worth more or less than their original cost. Current performance of the Fund may be lower or higher than the performance quoted. For the most recent month-end performance figures, visit the Fund's website at www.mairsandpower.com or call Shareholder Services at (800) 304-7404.
(1) The S&P 500 is an unmanaged index of 500 common stocks that is generally considered representative of the U.S. stock market. It is not possible to invest directly in an index.
3
Mairs & Power Growth Fund
FUND INFORMATION (unaudited) December 31, 2012
Portfolio Managers
William B. Frels, lead manager since 2004
Co-manager since 1999
University of Wisconsin, BBA Finance 1962
Mark L. Henneman, co-manager since 2006
University of Minnesota, MBA Finance 1990
General Information
Fund Symbol | | | MPGFX | | |
Net Asset Value (NAV) Per Share | | $ | 83.95 | | |
Expense Ratio | | | 0.70 | % | |
Portfolio Turnover Rate | | | 1.58 | % | |
Sales Charge | | | None1 | | |
Fund Inception Year | | | 1958 | | |
Portfolio Composition

Top Ten Portfolio Holdings
(Percent of Total Net Assets) 2
Valspar Corp. | | | 5.5 | % | |
3M Co. | | | 4.5 | | |
Pentair Ltd. | | | 4.3 | | |
Target Corp. | | | 4.1 | | |
Toro Co. | | | 4.1 | | |
Ecolab, Inc. | | | 4.1 | | |
H.B. Fuller Co. | | | 4.0 | | |
Honeywell International Inc. | | | 3.9 | | |
Graco, Inc. | | | 3.9 | | |
Medtronic, Inc. | | | 3.8 | | |
Portfolio Diversification
(Percent of Total Net Assets)
Common Stocks 96.1% | |
Health Care | | | 16.9 | % | |
Basic Industries | | | 16.4 | | |
Capital Goods | | | 16.0 | | |
Technology | | | 11.9 | | |
Financial | | | 10.8 | | |
Consumer Cyclical | | | 9.2 | | |
Diversified | | | 6.9 | | |
Consumer Staple | | | 5.1 | | |
Transportation | | | 1.8 | | |
Energy | | | 1.1 | | |
Short-term Investments 3.9%3 | | | 3.9 | | |
| | | | 100.0 | % | |
1 Although the Fund is no-load, investment management fees and other expenses still apply.
2 All holdings in the portfolio are subject to change without notice and may or may not represent current or future portfolio composition. The mention of specific securities is not intended as a recommendation or offer for a particular security, nor is it intended to be a solicitation for the purchase or sale of any security.
3 Represents short-term investments and other assets and liabilities (net).
4
Mairs & Power Growth Fund
SCHEDULE OF INVESTMENTS December 31, 2012
Shares | | Security Description | | Fair Value | |
| | | COMMON STOCKS 96.1% | |
| | | BASIC INDUSTRIES 16.4% | |
| | 2,185,000 | | | Bemis Co., Inc. | | $ | 73,110,100 | | |
| | 1,415,153 | | | Ecolab, Inc. | | | 101,749,501 | | |
| | 2,850,000 | | | H.B. Fuller Co. (a) | | | 99,237,000 | | |
| | 2,190,000 | | | Valspar Corp. | | | 136,656,000 | | |
| | | | 410,752,601 | | |
| | | CAPITAL GOODS 16.0% | |
| | 332,000 | | | Badger Meter, Inc. | | | 15,740,120 | | |
| | 2,620,000 | | | Donaldson Co., Inc. | | | 86,040,800 | | |
| | 690,000 | | | Fastenal Co. | | | 32,216,100 | | |
| | 1,870,000 | | | Graco, Inc. | | | 96,286,300 | | |
| | 1,200,000 | | | MTS Systems Corp. (a) | | | 61,116,000 | | |
| | 2,190,000 | | | Pentair Ltd. (c) | | | 107,638,500 | | |
| | | | 399,037,820 | | |
| | | CONSUMER CYCLICAL 9.2% | |
| | 510,000 | | | G&K Services, Inc., Class A | | | 17,416,500 | | |
| | 1,750,000 | | | Target Corp. | | | 103,547,500 | | |
| | 2,400,000 | | | Toro Co. | | | 103,152,000 | | |
| | 130,000 | | | The Walt Disney Company | | | 6,472,700 | | |
| | | | 230,588,700 | | |
| | | CONSUMER STAPLE 5.1% | |
| | 1,450,000 | | | General Mills, Inc. | | | 58,594,500 | | |
| | 2,230,000 | | | Hormel Foods Corp. | | | 69,598,300 | | |
| | | | 128,192,800 | | |
| | | DIVERSIFIED 6.9% | |
| | 1,220,000 | | | 3M Co. | | | 113,277,000 | | |
| | 2,770,000 | | | General Electric Co. | | | 58,142,300 | | |
| | | | 171,419,300 | | |
| | | ENERGY 1.1% | |
| | 380,000 | | | Schlumberger, Ltd. (c) | | | 26,330,200 | | |
| | | FINANCIAL 10.8% | |
| | 900,000 | | | Associated Banc-Corp. | | | 11,808,000 | | |
| | 1,150,000 | | | Principal Financial Group | | | 32,798,000 | | |
| | 3,110,000 | | | TCF Financial Corp. | | | 37,786,500 | | |
| | 300,000 | | | The Travelers Cos., Inc. | | | 21,546,000 | | |
| | 2,910,000 | | | U.S. Bancorp | | | 92,945,400 | | |
5
Mairs & Power Growth Fund
SCHEDULE OF INVESTMENTS (continued) December 31, 2012
Shares | | Security Description | | Fair Value | |
| | | COMMON STOCKS (continued) | |
| | | FINANCIAL (continued) | |
| | 1,920,000 | | | Wells Fargo & Co. | | $ | 65,625,600 | | |
| | 590,000 | | | Western Union Co. | | | 8,029,900 | | |
| | | | 270,539,400 | | |
| | | HEALTH CARE 16.9% | |
| | 1,030,000 | | | Baxter International Inc. | | | 68,659,800 | | |
| | 1,110,000 | | | Johnson & Johnson | | | 77,811,000 | | |
| | 2,310,000 | | | Medtronic, Inc. | | | 94,756,200 | | |
| | 1,120,000 | | | Patterson Cos., Inc. | | | 38,337,600 | | |
| | 1,550,000 | | | Pfizer Inc. | | | 38,874,000 | | |
| | 1,310,000 | | | St. Jude Medical, Inc. | | | 47,343,400 | | |
| | 628,800 | | | SurModics, Inc. (b) | | | 14,059,968 | | |
| | 200,500 | | | Techne Corp. | | | 13,702,170 | | |
| | 430,000 | | | Zimmer Holdings, Inc. | | | 28,663,800 | | |
| | | | 422,207,938 | | |
| | | TECHNOLOGY 11.9% | |
| | 2,060,000 | | | Corning Inc. | | | 25,997,200 | | |
| | 892,500 | | | Cray Inc. (b) | | | 14,235,375 | | |
| | 1,779,300 | | | Daktronics, Inc. | | | 19,696,851 | | |
| | 1,775,000 | | | Emerson Electric Co. | | | 94,004,000 | | |
| | 170,000 | | | Fiserv, Inc. (b) | | | 13,435,100 | | |
| | 1,550,000 | | | Honeywell International Inc. | | | 98,378,500 | | |
| | 780,000 | | | Intel Corp. | | | 16,091,400 | | |
| | 270,500 | | | NVE Corporation (a) (b) | | | 15,010,045 | | |
| | | | 296,848,471 | | |
| | | TRANSPORTATION 1.8% | |
| | 330,000 | | | C.H. Robinson Worldwide, Inc. | | | 20,862,600 | | |
| | 330,000 | | | United Parcel Service, Inc., Class B | | | 24,330,900 | | |
| | | | 45,193,500 | | |
| | | | TOTAL COMMON STOCKS
(cost $1,409,778,152) | | $ | 2,401,110,730 | | |
6
Mairs & Power Growth Fund
SCHEDULE OF INVESTMENTS (continued) December 31, 2012
Shares | | Security Description | | Fair Value | |
| | | SHORT-TERM INVESTMENTS 3.6% | |
| 90,344,373 | | | First American Prime Obligations Fund, Class Z, 0.04% (d)
(cost $90,344,373) | | $ | 90,344,373 | | |
| | TOTAL INVESTMENTS 99.7%
(cost $1,500,122,525) | | $ | 2,491,455,103 | | |
| | | OTHER ASSETS AND LIABILITIES (NET) 0.3% | | | 6,751,452 | | |
| | | TOTAL NET ASSETS 100.0% | | $ | 2,498,206,555 | | |
(a) Affiliated company (Note 5).
(b) Non-income producing.
(c) Foreign security denominated in U.S. dollars. As of December 31, 2012, these securities represented $133,968,700 or 5.4% of total net assets.
(d) The rate quoted is the annualized seven-day effective yield as of December 31, 2012.
See accompanying Notes to Financial Statements.
7
MAIRS & POWER BALANCED FUND (unaudited)
To Our Shareholders: February 14, 2013
The Balanced Fund finished up the year with another relatively strong performance in the fourth quarter. The Fund produced an investment return of 2.36% compared to a lesser, slightly negative benchmark composite (60% S&P 500 Stock Index and 40% Barclays Gov't/Credit Bond Index) return of -0.07%. Breaking the composite down, the S&P 500 showed a negative return of -0.38% while the Barclays Gov't/Credit Index had a positive return of 0.37%. The peer group Lipper Balanced Funds Index came through with a return of 1.22%. The Fund benefited from an above average representation in the better performing financial, health care and industrial sectors on the equity side of the portfolio while also having a lower representation in the poorer performing sectors, such as consumer staples, technology and utilities. The best individual performers included Bank of America (+31.37%), H. B. Fuller (+13.49%), Valspar (+11.23%), Ecolab (+10.94%) and Murphy Oil (+10.91%) while the poorest performers included Sturm, Ruger (-8.26%), IBM (-7.66%), General Electric (-7.57%), U. S. Bancorp (-6.88%) and Target (-6.77%). A high percentage of corporate bonds helped performance on the fixed income side of the portfolio with yield spreads continuing to narrow.
For the full year, the Fund came through with a relatively strong return of 17.34% which compared quite favorably to an 11.58% return for its benchmark composite index. The Fund also showed a strong comparison with a peer group Lipper Balanced Funds Index which came in with a lower 11.94% return. Like the fourth quarter, the Fund benefited from above average weightings in the better performing industry sectors and below average exposure to the poorer performing sectors. Turning to individual holdings, Bank of America (+108.6%), Valspar (+60.12%), Ingersoll-Rand (+57.40%), H. B. Fuller (+50.67%) and Pentair (+47.64%) did the best while SUPERVALU (-69.58%), Bristol-Myers Squibb (-7.52%), Xcel Energy (-3.36%), Corning (-2.77%) and BP PLC (-2.57%) fared the worst.
William B. Frels
President and Lead Manager
Ronald L. Kaliebe
Vice President and Co-Manager
All investments have risks. The Balanced Fund is designed for long-term investors. Equity investments are subject to market fluctuations, and the Fund's share price can fall because of weakness in the broad market, a particular industry, or specific holdings. Investments in small and midcap companies generally are more volatile. International investing risks include among others political, social or economic instability, difficulty in predicting international trade patterns, taxation and foreign trading practices, and greater fluctuations in price than United States corporations. The Fund is subject to yield and share price variances with changes in interest rates and market conditions. Investors should note that if interest rates rise significantly from current levels, bond total returns will decline and may even turn negative in the short-term. There is also a chance that some of the Fund's holdings may have their credit rating downgraded or may default.
Lipper Balanced Funds Index is an unmanaged index considered representative of balanced funds tracked by Lipper. It is not possible to invest directly in an index.
8
Mairs & Power Balanced Fund
PERFORMANCE INFORMATION (unaudited) December 31, 2012
Ten years of investment performance (through December 31, 2012)
This chart illustrates the performance of a hypothetical $10,000 investment made in the Fund 10 years ago.
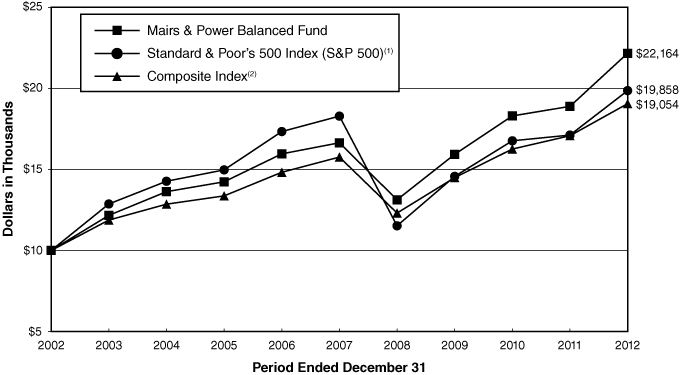
Average annual total returns for periods ended December 31, 2012
| | | 1 year | | 5 years | | 10 years | | 20 years | |
Mairs & Power Balanced Fund | | | 17.34 | % | | | 5.90 | % | | | 8.28 | % | | | 9.44 | % | |
S&P 500(1) | | | 16.00 | % | | | 1.66 | % | | | 7.10 | % | | | 8.22 | % | |
Composite Index(2) | | | 11.58 | % | | | 3.87 | % | | | 6.66 | % | | | 7.82 | % | |
Performance data quoted represents past performance and does not guarantee future results. All performance information shown includes the reinvestment of dividend and capital gain distributions, but does not reflect the deduction of taxes that a shareholder would pay on Fund distributions or the redemption of Fund shares. The investment return and principal value of an investment will fluctuate so that an investor's shares, when redeemed, may be worth more or less than their original cost. Current performance of the Fund may be lower or higher than the performance quoted. For the most recent month-end performance figures, visit the Fund's website at www.mairsandpower.com or call Shareholder Services at (800) 304-7404.
(1) The S&P 500 is an unmanaged index of 500 common stocks that is generally considered representative of the U.S. stock market. It is not possible to invest directly in an index.
(2) The Composite Index reflects an unmanaged portfolio of 60% of the S&P 500 and 40% of the Barclays Capital Government/Credit Bond Index, which is composed of high-quality, investment-grade U.S. government and corporate fixed income securities with maturities greater than one year.
9
Mairs & Power Balanced Fund
FUND INFORMATION (unaudited) December 31, 2012
Portfolio Managers
William B. Frels, lead manager since 1992
University of Wisconsin, BBA Finance 1962
Ronald L. Kaliebe, co-manager since 2006
University of Wisconsin-Madison
MBA Finance 1980
General Information
Fund Symbol | | | MAPOX | | |
Net Asset Value (NAV) Per Share | | $ | 70.83 | | |
Expense Ratio | | | 0.74 | % | |
Portfolio Turnover Rate | | | 5.46 | % | |
Sales Charge | | | None1 | | |
Fund Inception Year | | | 1961 | | |
Portfolio Composition

Top Ten Common Stock Holdings
(Percent of Total Net Assets) 2
Valspar Corp. | | | 2.5 | % | |
3M Co. | | | 2.5 | | |
Emerson Electric Co. | | | 2.4 | | |
Schlumberger, Ltd. | | | 2.3 | | |
United Parcel Service, Inc., Class B | | | 2.0 | | |
Baxter International Inc. | | | 2.0 | | |
Honeywell International Inc. | | | 2.0 | | |
H.B. Fuller Co. | | | 1.9 | | |
Wells Fargo & Co. | | | 1.9 | | |
Pentair Ltd. | | | 1.9 | | |
Portfolio Diversification
(Percent of Total Net Assets)
Fixed Income Securities 32.1% | |
Corporate Bonds | | | 27.4 | % | |
Asset Backed Securities | | | 2.8 | | |
Federal Agency Obligations | | | 1.2 | | |
Preferred Securities | | | 0.7 | | |
Common Stocks 55.0% | |
Financial | | | 8.5 | | |
Health Care | | | 7.6 | | |
Technology | | | 5.8 | | |
Consumer Cyclical | | | 5.7 | | |
Basic Industries | | | 5.7 | | |
Energy | | | 5.5 | | |
Capital Goods | | | 5.3 | | |
Diversified | | | 3.9 | | |
Consumer Staple | | | 3.5 | | |
Transportation | | | 2.0 | | |
Utilities | | | 1.5 | | |
Preferred Stocks 0.1% | | | 0.1 | | |
Short-term Investments 12.8%3 | | | 12.8 | | |
| | | | 100.0 | % | |
1 Although the Fund is no-load, investment management fees and other expenses still apply.
2 All holdings in the portfolio are subject to change without notice and may or may not represent current or future portfolio composition. The mention of specific securities is not intended as a recommendation or offer for a particular security, nor is it intended to be a solicitation for the purchase or sale of any security.
3 Represents short-term investments and other assets and liabilities (net).
10
Mairs & Power Balanced Fund
SCHEDULE OF INVESTMENTS December 31, 2012
Par Value | | Security Description | | Fair Value | |
| | | FIXED INCOME SECURITIES 32.1% | |
| | | FEDERAL AGENCY OBLIGATIONS 1.2% | |
$ | 500,000 | | | Federal Home Loan Banks | | | 4.740 | % | | 01/07/26 | | $ | 500,317 | | |
| | 500,000 | | | Federal Farm Credit Bank | | | 4.700 | % | | 01/04/27 | | | 500,127 | | |
| | 500,000 | | | Federal National Mortgage Association | | | 4.000 | % | | 04/09/32 | | | 503,654 | | |
| | 1,000,000 | | | Federal Home Loan Banks | | | 3.180 | % | | 12/06/32 | | | 993,652 | | |
| | 1,000,000 | | | Federal Home Loan Banks (h) | | | 3.250 | % | | 01/18/33 | | | 1,001,718 | | |
| | | | 3,499,468 | | |
| | | CORPORATE BONDS 27.4% | |
| | | CONSUMER CYCLICAL 0.7% | |
| | 500,000 | | | Best Buy Co., Inc. (a) | | | 7.250 | % | | 07/15/13 | | | 506,250 | | |
| | 500,000 | | | Gannett Co., Inc. | | | 6.375 | % | | 09/01/15 | | | 550,000 | | |
| | 500,000 | | | Deluxe Corp. | | | 7.000 | % | | 03/15/19 | | | 528,750 | | |
| | 500,000 | | | Best Buy Co., Inc. | | | 5.500 | % | | 03/15/21 | | | 423,750 | | |
| | | | 2,008,750 | | |
| | | FINANCIAL 17.0% | |
| | 453,000 | | | City National Corp. | | | 5.125 | % | | 02/15/13 | | | 455,268 | | |
| | 250,000 | | | Goldman Sachs Group, Inc. (b) | | | 8.000 | % | | 03/01/13 | | | 252,528 | | |
| | 500,000 | | | Metropolitan Life Global Funds I (b) | | | 5.125 | % | | 04/10/13 | | | 506,261 | | |
| | 500,000 | | | Fifth Third Bancorp | | | 6.250 | % | | 05/01/13 | | | 509,494 | | |
| | 500,000 | | | Genworth Life Financial Inc. (b) | | | 5.875 | % | | 05/03/13 | | | 507,610 | | |
| | 500,000 | | | Protective Life Corp. | | | 4.300 | % | | 06/01/13 | | | 507,296 | | |
| | 250,000 | | | Allstate Corp. | | | 7.500 | % | | 06/15/13 | | | 257,874 | | |
| | 500,000 | | | SLM Corporation | | | 5.000 | % | | 10/01/13 | | | 511,875 | | |
| | 485,000 | | | Jefferson-Pilot Corp. | | | 4.750 | % | | 01/30/14 | | | 502,695 | | |
| | 415,000 | | | Liberty Mutual Group Inc. (b) | | | 5.750 | % | | 03/15/14 | | | 434,610 | | |
| | 500,000 | | | GATX Corp. | | | 8.750 | % | | 05/15/14 | | | 550,203 | | |
| | 500,000 | | | Genworth Life Financial Inc. | | | 5.750 | % | | 06/15/14 | | | 525,548 | | |
| | 500,000 | | | Citigroup Inc. | | | 5.000 | % | | 09/15/14 | | | 526,044 | | |
| | 500,000 | | | Regions Financial Corp. | | | 7.750 | % | | 11/10/14 | | | 554,400 | | |
| | 500,000 | | | SLM Corporation | | | 5.050 | % | | 11/14/14 | | | 524,829 | | |
| | 500,000 | | | General Motors Acceptance Corp. | | | 6.750 | % | | 12/01/14 | | | 539,864 | | |
| | 500,000 | | | Principal Life Global (b) | | | 5.050 | % | | 03/15/15 | | | 544,944 | | |
| | 500,000 | | | Marshall & Ilsley Corp. | | | 4.850 | % | | 06/16/15 | | | 537,663 | | |
| | 500,000 | | | TCF National Bank | | | 5.500 | % | | 02/01/16 | | | 529,508 | | |
| | 500,000 | | | Key Bank National Association | | | 5.450 | % | | 03/03/16 | | | 558,936 | | |
| | 500,000 | | | Symetra Financial Corp. (b) | | | 6.125 | % | | 04/01/16 | | | 541,234 | | |
| | 250,000 | | | Security Benefit Life Insurance (b) | | | 8.750 | % | | 05/15/16 | | | 262,125 | | |
| | 500,000 | | | Merrill Lynch & Co., Inc. | | | 6.050 | % | | 05/16/16 | | | 550,428 | | |
| | 500,000 | | | Torchmark Corp. | | | 6.375 | % | | 06/15/16 | | | 559,183 | | |
11
Mairs & Power Balanced Fund
SCHEDULE OF INVESTMENTS (continued) December 31, 2012
Par Value | | Security Description | | Fair Value | |
| | | FIXED INCOME SECURITIES (continued) | |
| | | CORPORATE BONDS (continued) | |
| | | FINANCIAL (continued) | |
$ | 500,000 | | | Western Union Co. | | | 5.930 | % | | 10/01/16 | | $ | 549,337 | | |
| | 500,000 | | | National City Bank | | | 5.250 | % | | 12/15/16 | | | 568,226 | | |
| | 500,000 | | | Marshall & Ilsley Corp. | | | 5.000 | % | | 01/17/17 | | | 553,287 | | |
| | 500,000 | | | Citigroup Inc. | | | 5.500 | % | | 02/15/17 | | | 554,267 | | |
| | 500,000 | | | Ford Motor Credit Co. | | | 3.875 | % | | 03/20/17 | | | 497,269 | | |
| | 500,000 | | | White Mountain Group, Ltd. (b) (c) | | | 6.375 | % | | 03/20/17 | | | 546,080 | | |
| | 250,000 | | | Merrill Lynch & Co., Inc. | | | 5.700 | % | | 05/02/17 | | | 274,375 | | |
| | 500,000 | | | Royal Bank of Scotland Group, PLC (c) | | | 4.250 | % | | 07/15/17 | | | 507,745 | | |
| | 500,000 | | | Ford Motor Credit Co. | | | 3.000 | % | | 08/20/17 | | | 498,701 | | |
| | 500,000 | | | Comerica Incorporated | | | 5.200 | % | | 08/22/17 | | | 578,996 | | |
| | 500,000 | | | Bank of America Corp. | | | 6.000 | % | | 09/01/17 | | | 585,508 | | |
| | 500,000 | | | American Express Company | | | 6.000 | % | | 09/13/17 | | | 603,479 | | |
| | 250,000 | | | General Motors Acceptance Corp. | | | 7.250 | % | | 09/15/17 | | | 248,317 | | |
| | 500,000 | | | Bear Stearns Co., Inc. | | | 6.400 | % | | 10/02/17 | | | 600,499 | | |
| | 500,000 | | | The Hartford Financial Services Group Inc. | | | 4.000 | % | | 10/15/17 | | | 546,201 | | |
| | 500,000 | | | Prudential Financial Inc. | | | 6.000 | % | | 12/01/17 | | | 599,941 | | |
| | 500,000 | | | Barclays Bank, PLC (b) (c) | | | 6.050 | % | | 12/04/17 | | | 553,194 | | |
| | 1,000,000 | | | Morgan Stanley | | | 5.950 | % | | 12/28/17 | | | 1,132,404 | | |
| | 500,000 | | | Goldman Sachs Group, Inc. | | | 5.950 | % | | 01/18/18 | | | 581,846 | | |
| | 500,000 | | | Wachovia Corp. | | | 5.750 | % | | 02/01/18 | | | 599,021 | | |
| | 500,000 | | | United Health Group, Inc. | | | 6.000 | % | | 02/15/18 | | | 608,593 | | |
| | 250,000 | | | Lincoln National Corp. | | | 7.000 | % | | 03/15/18 | | | 303,628 | | |
| | 500,000 | | | SunTrust Banks, Inc. | | | 7.250 | % | | 03/15/18 | | | 611,938 | | |
| | 500,000 | | | Morgan Stanley | | | 6.625 | % | | 04/01/18 | | | 589,287 | | |
| | 1,000,000 | | | Jefferies Group, Inc. | | | 5.125 | % | | 04/13/18 | | | 1,050,000 | | |
| | 500,000 | | | Merrill Lynch & Co., Inc. | | | 6.875 | % | | 04/25/18 | | | 602,727 | | |
| | 500,000 | | | Provident Cos. | | | 7.000 | % | | 07/15/18 | | | 593,804 | | |
| | 500,000 | | | MetLife Inc. | | | 6.817 | % | | 08/15/18 | | | 629,886 | | |
| | 500,000 | | | Associated Banc-Corp | | | 9.250 | % | | 10/15/18 | | | 527,476 | | |
| | 500,000 | | | The Hartford Financial Services Group Inc. | | | 6.000 | % | | 01/15/19 | | | 582,334 | | |
| | 500,000 | | | Royal Bank of Scotland Group, PLC (c) | | | 5.250 | % | | 02/15/19 | | | 532,542 | | |
| | 500,000 | | | BB&T Corp. | | | 6.850 | % | | 04/30/19 | | | 636,699 | | |
| | 250,000 | | | Berkley (WR) Corp. | | | 6.150 | % | | 08/15/19 | | | 284,921 | | |
| | 500,000 | | | Prospect Capital Corp. | | | 5.950 | % | | 09/15/19 | | | 488,712 | | |
| | 500,000 | | | Protective Life Corp. | | | 7.375 | % | | 10/15/19 | | | 607,764 | | |
| | 500,000 | | | Prospect Capital Corp. | | | 5.125 | % | | 11/15/19 | | | 494,183 | | |
| | 1,629,000 | | | Zions Bancorp | | | 4.150 | % | | 11/15/19 | | | 1,625,854 | | |
| | 500,000 | | | Credit Suisse (c) | | | 5.400 | % | | 01/14/20 | | | 562,195 | | |
12
Mairs & Power Balanced Fund
SCHEDULE OF INVESTMENTS (continued) December 31, 2012
Par Value | | Security Description | | Fair Value | |
| | | FIXED INCOME SECURITIES (continued) | |
| | | CORPORATE BONDS (continued) | |
| | | FINANCIAL (continued) | |
$ | 500,000 | | | Morgan Stanley | | | 5.500 | % | | 01/26/20 | | $ | 560,896 | | |
| | 500,000 | | | The Hartford Financial Services Group Inc. | | | 5.500 | % | | 03/30/20 | | | 580,937 | | |
| | 450,000 | | | Compass Bancshares, Inc. | | | 5.500 | % | | 04/01/20 | | | 446,094 | | |
| | 537,000 | | | Manufacturers & Traders Trust Co. (a) | | | 5.585 | % | | 12/28/20 | | | 533,928 | | |
| | 500,000 | | | Wells Fargo & Co. (a) | | | 2.000 | % | | 01/31/21 | | | 490,137 | | |
| | 1,000,000 | | | Nationwide Financial Services (b) | | | 5.375 | % | | 03/25/21 | | | 1,066,910 | | |
| | 500,000 | | | Markel Corporation | | | 5.350 | % | | 06/01/21 | | | 546,446 | | |
| | 500,000 | | | Goldman Sachs Group, Inc. | | | 5.250 | % | | 07/27/21 | | | 569,988 | | |
| | 500,000 | | | Genworth Life Financial Inc. | | | 7.625 | % | | 09/24/21 | | | 551,784 | | |
| | 500,000 | | | AFLAC, Inc. | | | 4.000 | % | | 02/15/22 | | | 539,362 | | |
| | 500,000 | | | GATX Corp. | | | 4.750 | % | | 06/15/22 | | | 524,201 | | |
| | 1,000,000 | | | Block Financial LLC | | | 5.500 | % | | 11/01/22 | | | 1,028,858 | | |
| | 500,000 | | | CNA Financial Corp. | | | 7.250 | % | | 11/15/23 | | | 632,127 | | |
| | 500,000 | | | Pacific Life Insurance Co. (b) | | | 7.900 | % | | 12/30/23 | | | 624,081 | | |
| | 250,000 | | | Liberty Mutual Insurance Co. (b) | | | 8.500 | % | | 05/15/25 | | | 327,342 | | |
| | 500,000 | | | Barclays Bank, PLC (a) (c) | | | 4.000 | % | | 06/20/25 | | | 491,163 | | |
| | 500,000 | | | Citigroup Inc. | | | 5.200 | % | | 01/25/27 | | | 506,251 | | |
| | 250,000 | | | Provident Cos. | | | 7.250 | % | | 03/15/28 | | | 293,963 | | |
| | 500,000 | | | Farmers Exchange Capital (b) | | | 7.050 | % | | 07/15/28 | | | 614,452 | | |
| | 500,000 | | | Bank of America Corp. (a) | | | 5.500 | % | | 03/29/30 | | | 517,383 | | |
| | 500,000 | | | Goldman Sachs Group, Inc. | | | 4.250 | % | | 11/15/30 | | | 491,097 | | |
| | 500,000 | | | General Electric Cap Corp. | | | 4.000 | % | | 09/17/32 | | | 504,176 | | |
| | 500,000 | | | Goldman Sachs Group, Inc. | | | 4.300 | % | | 12/15/32 | | | 485,533 | | |
| | 1,000,000 | | | Western Union Co. | | | 6.200 | % | | 11/17/36 | | | 1,011,895 | | |
| | 500,000 | | | Barclays Bank, PLC (a) (c) | | | 4.000 | % | | 10/09/37 | | | 485,041 | | |
| | | | 48,685,701 | | |
| | | INDUSTRIAL 8.2% | |
| | 500,000 | | | Cargill, Inc. (b) | | | 5.200 | % | | 01/22/13 | | | 501,291 | | |
| | 500,000 | | | Transocean Ltd. (c) | | | 5.250 | % | | 03/15/13 | | | 504,391 | | |
| | 250,000 | | | Willamette Industries | | | 7.125 | % | | 07/22/13 | | | 254,479 | | |
| | 500,000 | | | Ingersoll-Rand Co., Ltd. (c) | | | 6.000 | % | | 08/15/13 | | | 516,714 | | |
| | 250,000 | | | Maytag Corp. | | | 5.000 | % | | 05/15/15 | | | 262,203 | | |
| | 340,000 | | | Johnson Controls, Inc. | | | 5.500 | % | | 01/15/16 | | | 383,790 | | |
| | 500,000 | | | International Paper Co. | | | 5.250 | % | | 04/01/16 | | | 555,099 | | |
| | 500,000 | | | SUPERVALU Inc. | | | 8.000 | % | | 05/01/16 | | | 476,250 | | |
| | 500,000 | | | Anadarko Petroleum Corp. | | | 5.950 | % | | 09/15/16 | | | 575,566 | | |
| | 500,000 | | | Valspar Corp. | | | 6.050 | % | | 05/01/17 | | | 574,220 | | |
13
Mairs & Power Balanced Fund
SCHEDULE OF INVESTMENTS (continued) December 31, 2012
Par Value | | Security Description | | Fair Value | |
| | | FIXED INCOME SECURITIES (continued) | |
| | | CORPORATE BONDS (continued) | |
| | | INDUSTRIAL (continued) | |
$ | 500,000 | | | Broadridge Financial Solutions, Inc. | | | 6.125 | % | | 06/01/17 | | $ | 562,500 | | |
| | 525,000 | | | Cargill, Inc. (b) | | | 6.000 | % | | 11/27/17 | | | 631,626 | | |
| | 500,000 | | | Cliffs Natural Resources, Inc. | | | 3.950 | % | | 01/15/18 | | | 503,241 | | |
| | 250,000 | | | ServiceMaster Co. | | | 7.100 | % | | 03/01/18 | | | 237,500 | | |
| | 1,000,000 | | | Avon Products, Inc. | | | 4.200 | % | | 07/15/18 | | | 1,018,980 | | |
| | 250,000 | | | ConocoPhillips | | | 6.650 | % | | 07/15/18 | | | 317,114 | | |
| | 350,000 | | | PPG Industries | | | 7.400 | % | | 08/15/19 | | | 430,539 | | |
| | 500,000 | | | MASCO Corp. | | | 7.125 | % | | 03/15/20 | | | 581,715 | | |
| | 500,000 | | | Safeway, Inc. | | | 3.950 | % | | 08/15/20 | | | 500,113 | | |
| | 500,000 | | | Cliffs Natural Resources, Inc. | | | 4.800 | % | | 10/01/20 | | | 496,901 | | |
| | 1,000,000 | | | Cliffs Natural Resources, Inc. | | | 4.875 | % | | 04/01/21 | | | 993,163 | | |
| | 500,000 | | | Pentair Ltd. (b) (c) | | | 5.000 | % | | 05/15/21 | | | 564,803 | | |
| | 500,000 | | | Carpenter Technology | | | 5.200 | % | | 07/15/21 | | | 521,677 | | |
| | 500,000 | | | Safeway, Inc. | | | 4.750 | % | | 12/01/21 | | | 515,147 | | |
| | 500,000 | | | Idex Corporation | | | 4.200 | % | | 12/15/21 | | | 522,399 | | |
| | 500,000 | | | MASCO Corp. | | | 5.950 | % | | 03/15/22 | | | 554,246 | | |
| | 500,000 | | | URS Corp. (b) | | | 5.000 | % | | 04/01/22 | | | 514,734 | | |
| | 1,000,000 | | | Murphy Oil Corp. | | | 4.000 | % | | 06/01/22 | | | 1,007,954 | | |
| | 500,000 | | | Whirlpool Corporation | | | 4.700 | % | | 06/01/22 | | | 531,403 | | |
| | 500,000 | | | Penske Truck Leasing Co., L.P. / PTL Finance Corp. (b) | | | 4.875 | % | | 07/11/22 | | | 516,500 | | |
| | 1,000,000 | | | Hewlett-Packard Company | | | 4.050 | % | | 09/15/22 | | | 980,601 | | |
| | 500,000 | | | Wyeth | | | 6.450 | % | | 02/01/24 | | | 678,708 | | |
| | 865,000 | | | Union Carbide Corp. | | | 7.500 | % | | 06/01/25 | | | 1,077,192 | | |
| | 500,000 | | | Toro Co. | | | 7.800 | % | | 06/15/27 | | | 591,709 | | |
| | 1,949,000 | | | Land O'Lakes Capital Trust I (b) | | | 7.450 | % | | 03/15/28 | | | 1,900,275 | | |
| | 500,000 | | | Global Marine | | | 7.000 | % | | 06/01/28 | | | 559,245 | | |
| | 1,000,000 | | | Pitney Bowes | | | 5.250 | % | | 01/15/37 | | | 1,020,125 | | |
| | 500,000 | | | Murphy Oil Corp. | | | 5.125 | % | | 12/01/42 | | | 486,625 | | |
| | | | 23,420,738 | | |
| | | UTILITIES 1.5% | |
| | 500,000 | | | CenterPoint Energy, Inc. | | | 5.950 | % | | 01/15/14 | | | 524,857 | | |
| | 500,000 | | | Commonwealth Edison Co. | | | 6.150 | % | | 09/15/17 | | | 606,232 | | |
| | 250,000 | | | Vectren Utility Holdings, Inc. | | | 5.750 | % | | 08/01/18 | | | 282,241 | | |
| | 250,000 | | | South Jersey Gas Co. | | | 7.125 | % | | 10/22/18 | | | 314,146 | | |
| | 250,000 | | | United Utilities PLC (c) | | | 5.375 | % | | 02/01/19 | | | 276,957 | | |
| | 500,000 | | | Chesapeake Energy | | | 6.775 | % | | 03/15/19 | | | 500,625 | | |
| | 250,000 | | | Verizon Communications, Inc. | | | 6.350 | % | | 04/01/19 | | | 315,946 | | |
14
Mairs & Power Balanced Fund
SCHEDULE OF INVESTMENTS (continued) December 31, 2012
Par Value | | Security Description | | Fair Value | |
| | | FIXED INCOME SECURITIES (continued) | |
| | | CORPORATE BONDS (continued) | |
| | | UTILITIES (continued) | |
$ | 500,000 | | | CenturyLink, Inc. | | | 6.150 | % | | 09/15/19 | | $ | 548,861 | | |
| | 500,000 | | | U S West Capital Funding Inc. | | | 6.875 | % | | 07/15/28 | | | 509,609 | | |
| | 500,000 | | | Entergy Gulf States, Inc. | | | 6.180 | % | | 03/01/35 | | | 500,036 | | |
| | | | 4,379,510 | | |
| | | TOTAL CORPORATE BONDS | | | 78,494,699 | | |
| | | ASSET BACKED SECURITIES 2.8% | |
| | 67,939 | | | GATX Corp. | | | 7.500 | % | | 02/28/15 | | | 71,676 | | |
| | 500,000 | | | American Airlines, Inc. (b) (d) | | | 7.500 | % | | 03/15/16 | | | 538,750 | | |
| | 500,000 | | | Delta Air Lines 2010-2 Class B Pass Thru Trust (b) | | | 6.750 | % | | 05/23/17 | | | 515,000 | | |
| | 428,719 | | | Continental Airlines 2009-1 Class A Pass Through Trust | | | 9.000 | % | | 01/08/18 | | | 494,098 | | |
| | 447,373 | | | American Airlines Pass Through Trust 2011-1 Pass
Through Cert (b) | | | 7.000 | % | | 07/31/19 | | | 460,795 | | |
| | 368,800 | | | Continental Airlines 1999-1 Class B Pass Through Trust | | | 6.795 | % | | 02/02/20 | | | 384,474 | | |
| | 887,872 | | | Continental Airlines 2010-1 Class B Pass Through Trust | | | 6.000 | % | | 07/12/20 | | | 908,959 | | |
| | 432,622 | | | Delta Airlines 2011-1 Pass Thru Cert | | | 5.300 | % | | 10/15/20 | | | 473,721 | | |
| | 898,707 | | | America West Airlines, Inc. | | | 8.057 | % | | 01/02/22 | | | 963,863 | | |
| | 947,275 | | | American Airlines 2011-1 Pass Through Trust | | | 5.250 | % | | 07/31/22 | | | 982,798 | | |
| | 210,229 | | | Continental Airlines 2007-1 Class A Pass Through Trust | | | 5.983 | % | | 10/19/23 | | | 234,405 | | |
| | 403,720 | | | Southwest Airlines Co. | | | 6.150 | % | | 02/01/24 | | | 468,315 | | |
| | 921,227 | | | US Airways 2010-1 Class A Pass Through Cert | | | 6.250 | % | | 10/22/24 | | | 990,319 | | |
| | 471,744 | | | US Airways 2011-1A PTT Equipment Trust Certificate | | | 7.125 | % | | 04/22/25 | | | 528,353 | | |
| | | | 8,015,526 | | |
| | | PREFERRED SECURITIES 0.7% | |
| | 20,000 | | | Pitney Bowes (f) | | | 5.250 | % | | 11/27/22 | | | 505,000 | | |
| | 20,000 | | | Stifel Financial (f) | | | 5.375 | % | | 12/31/22 | | | 507,500 | | |
| | 10,000 | | | Raymond James Financial Inc. | | | 6.900 | % | | 03/15/42 | | | 272,700 | | |
| | 20,000 | | | Protective Life Corp. | | | 6.000 | % | | 09/01/42 | | | 512,400 | | |
| | 10,000 | | | Nextera Energy Capital | | | 5.700 | % | | 03/01/72 | | | 260,700 | | |
| | | | 2,058,300 | | |
| | TOTAL FIXED INCOME SECURITIES
(cost $84,601,442) | | $ | 92,067,993 | | |
15
Mairs & Power Balanced Fund
SCHEDULE OF INVESTMENTS (continued) December 31, 2012
Shares | | Security Description | | Fair Value | |
| | | COMMON STOCKS 55.0% | |
| | | BASIC INDUSTRIES 5.7% | |
| | 81,000 | | | Bemis Co., Inc. | | $ | 2,710,260 | | |
| | 14,000 | | | Ecolab, Inc. | | | 1,006,600 | | |
| | 154,000 | | | H.B. Fuller Co. | | | 5,362,280 | | |
| | 115,000 | | | Valspar Corp. | | | 7,176,000 | | |
| | | | 16,255,140 | | |
| | | CAPITAL GOODS 5.3% | |
| | 80,000 | | | Graco, Inc. | | | 4,119,200 | | |
| | 23,000 | | | Ingersoll-Rand Co., Ltd. (c) | | | 1,103,080 | | |
| | 91,000 | | | MTS Systems Corp. | | | 4,634,630 | | |
| | 108,000 | | | Pentair Ltd. (c) | | | 5,308,200 | | |
| | | | 15,165,110 | | |
| | | CONSUMER CYCLICAL 5.7% | |
| | 155,000 | | | Deluxe Corp. | | | 4,997,200 | | |
| | 15,000 | | | Genuine Parts Co. | | | 953,700 | | |
| | 74,000 | | | Home Depot, Inc. | | | 4,576,900 | | |
| | 30,000 | | | Sturm, Ruger & Co., Inc. | | | 1,362,000 | | |
| | 47,000 | | | Target Corp. | | | 2,780,990 | | |
| | 40,000 | | | Toro Co. | | | 1,719,200 | | |
| | | | 16,389,990 | | |
| | | CONSUMER STAPLE 3.5% | |
| | 73,000 | | | General Mills, Inc. | | | 2,949,930 | | |
| | 15,000 | | | The Hershey Co. | | | 1,083,300 | | |
| | 120,000 | | | Hormel Foods Corp. | | | 3,745,200 | | |
| | 26,000 | | | Kimberly-Clark Corp. | | | 2,195,180 | | |
| | 50,000 | | | SUPERVALU Inc. | | | 123,500 | | |
| | | | 10,097,110 | | |
| | | DIVERSIFIED 3.9% | |
| | 77,000 | | | 3M Co. | | | 7,149,450 | | |
| | 195,000 | | | General Electric Co. | | | 4,093,050 | | |
| | | | 11,242,500 | | |
| | | ENERGY 5.5% | |
| | 38,000 | | | BP p.l.c. ADR (c) (e) | | | 1,582,320 | | |
| | 50,000 | | | ConocoPhillips | | | 2,899,500 | | |
| | 37,000 | | | Exxon Mobil Corp. | | | 3,202,350 | | |
| | 27,000 | | | Murphy Oil Corp. | | | 1,607,850 | �� | |
| | 95,000 | | | Schlumberger, Ltd. (c) | | | 6,582,550 | | |
| | | | 15,874,570 | | |
16
Mairs & Power Balanced Fund
SCHEDULE OF INVESTMENTS (continued) December 31, 2012
Shares | | Security Description | | Fair Value | |
| | | COMMON STOCKS (continued) | |
| | | FINANCIAL 8.5% | |
| | 26,000 | | | American Express Co. | | $ | 1,494,480 | | |
| | 87,000 | | | Associated Banc-Corp. | | | 1,141,440 | | |
| | 59,000 | | | Bank of America Corp. | | | 684,400 | | |
| | 83,000 | | | JPMorgan Chase & Co. | | | 3,649,510 | | |
| | 20,000 | | | Lincoln National Corp. | | | 518,000 | | |
| | 157,000 | | | Principal Financial Group | | | 4,477,640 | | |
| | 118,000 | | | TCF Financial Corp. | | | 1,433,700 | | |
| | 35,000 | | | The Travelers Cos., Inc. | | | 2,513,700 | | |
| | 98,000 | | | U.S. Bancorp | | | 3,130,120 | | |
| | 156,000 | | | Wells Fargo & Co. | | | 5,332,080 | | |
| | | | 24,375,070 | | |
| | | HEALTH CARE 7.6% | |
| | 21,000 | | | Abbott Laboratories | | | 1,375,500 | | |
| | 85,000 | | | Baxter International Inc. | | | 5,666,100 | | |
| | 51,000 | | | Bristol-Myers Squibb Co. | | | 1,662,090 | | |
| | 60,000 | | | Eli Lilly & Co. | | | 2,959,200 | | |
| | 46,000 | | | Johnson & Johnson | | | 3,224,600 | | |
| | 82,000 | | | Medtronic, Inc. | | | 3,363,640 | | |
| | 142,000 | | | Pfizer Inc. | | | 3,561,360 | | |
| | | | 21,812,490 | | |
| | | TECHNOLOGY 5.8% | |
| | 156,000 | | | Corning Inc. | | | 1,968,720 | | |
| | 128,000 | | | Emerson Electric Co. | | | 6,778,880 | | |
| | 89,000 | | | Honeywell International Inc. | | | 5,648,830 | | |
| | 12,000 | | | International Business Machines Corp. | | | 2,298,600 | | |
| | | | 16,695,030 | | |
| | | TRANSPORTATION 2.0% | |
| | 79,000 | | | United Parcel Service, Inc., Class B | | | 5,824,670 | | |
| | | UTILITIES 1.5% | |
| | 50,000 | | | ALLETE, Inc. | | | 2,049,000 | | |
| | 53,000 | | | MDU Resources Group, Inc. | | | 1,125,720 | | |
| | 40,000 | | | Xcel Energy Inc. | | | 1,068,400 | | |
| | | | 4,243,120 | | |
| | | | TOTAL COMMON STOCKS
(cost $98,981,944) | | $ | 157,974,800 | | |
17
Mairs & Power Balanced Fund
SCHEDULE OF INVESTMENTS (continued) December 31, 2012
Shares | | Security Description | | Fair Value | |
| | | PREFERRED STOCKS 0.1% | |
| | | UTILITIES 0.1% | |
| | 10,000 | | | SCE Trust I | | $ | 258,000 | | |
| | | | TOTAL PREFERRED STOCKS
(cost $250,000) | | $ | 258,000 | | |
| | | SHORT-TERM INVESTMENTS 12.6% | |
| | 14,000,000 | | | Dreyfus Cash Management, 0.06% (g) | | | 14,000,000 | | |
| | 14,000,000 | | | First American Prime Obligations Fund, Class Z, 0.04% (g) | | | 14,000,000 | | |
| | 8,058,268 | | | INVESCO STIC Prime Portfolio Institutional Class, 0.09% (g) | | | 8,058,268 | | |
| | | | TOTAL SHORT-TERM INVESTMENTS
(cost $36,058,268) | | $ | 36,058,268 | | |
| | | | TOTAL INVESTMENTS 99.8%
(cost $219,891,654) | | $ | 286,359,061 | | |
| | | | | OTHER ASSETS AND LIABILITIES (NET) 0.2% | | | 550,622 | | |
| | | | | TOTAL NET ASSETS 100.0% | | $ | 286,909,683 | | |
(a) Step Bonds – Securities for which the coupon rate of interest will adjust on specified future date(s). The rate disclosed represents the coupon rate in effect as of December 31, 2012.
(b) Securities exempt from registration under Rule 144A of the Securities Act of 1933. These securities may be resold in transactions exempt from registration, normally to qualified institutional buyers. These securities have been determined to be liquid under guidelines established by the Fund's Board of Trustees. As of December 31, 2012, these securities represented $12,925,145 or 4.5% of total net assets.
(c) Foreign security denominated in U.S. dollars. As of December 31, 2012, these securities represented $20,116,975 or 7.0% of total net assets.
(d) Non-income producing – Issue is in default.
(e) American Depositary Receipt.
(f) Non-income producing.
(g) The rate quoted is the annualized seven-day effective yield as of December 31, 2012.
(h) When-issued security. As of December 31, 2012, these securities represented $1,001,718 or 0.3% of total net assets.
See accompanying Notes to Financial Statements.
18
MAIRS & POWER SMALL CAP FUND (unaudited)
To Our Shareholders: February 14, 2013
The relatively strong performance enjoyed by the Small Cap Fund during the first three quarters of the year continued during the final period. The Fund produced a return of 3.39% compared to a return of 2.22% for the benchmark Standard & Poor's 600 Index in the fourth quarter. The Fund's performance also compared favorably with the Lipper Small Cap Core Funds Index which had a return of 3.11%. Performance relative to the S&P 600 benefited from significant over weights in the market-leading industrial and basic materials sectors. A slightly underweight position in the underperforming healthcare sector also helped fourth quarter relative performance. Among individual holdings Badger Meter (+30.28%), Cray (+25.59%), Apogee Enterprises (+22.17%), Titan Machinery (+21.79%) and Proto Labs (+16.56%) did best while Cabela's (-23.65%), Buffalo Wild Wings (-15.07%) and VASCO Data Security (-13.01%) fared the worst.
For the full year, the Fund showed a particularly strong performance both on an absolute basis as well as relative to its benchmark and peers. The full year return of +30.60% compared to a return of 16.33% for the benchmark S&P 600. The peer group Lipper Small Cap Core Funds Index also had a lesser return of 15.94%. Like the fourth quarter, full year relative performance benefitted from significant over weights in the industrial and basic materials sectors. However, relative full year performance was held back slightly by an underweight position in the strong performing consumer discretionary sector. Among individual holdings, Cray (+146.52%), Apogee Enterprises (+95.51%), Cabela's (+64.24%), Badger Meter (+61.09%), and Valspar (+60.12%) did the best. LKQ Corporation (-29.85%), Superior Energy Services (-27.14%) and Advent Software (-12.23%) fared the worst.
Andrew R. Adams
Vice President and Lead Manager
Past performance is no guarantee of future results.
The Fund's investment objectives, risks, charges and expenses must be considered carefully before investing. The summary prospectus or full prospectus contains this and other important information about the Fund, and they may be obtained by calling Shareholder Services at (800) 304-7404, or visiting www.mairsandpower.com. Read the summary prospectus or full prospectus carefully before investing.
All investments have risks. The Small Cap Fund is designed for long-term investors. Equity investments are subject to market fluctuations, the Fund's share price can fall because of weakness in the broad market, a particular industry, or specific holdings. Investments in small and midcap companies generally are more volatile. International investing risks include among others political, social or economic instability, difficulty in predicting international trade patterns, taxation and foreign trading practices, and greater fluctuations in price than United States corporations. The Fund may invest in initial public offerings by small cap companies, which can involve greater risks than investments in companies which are already publicly traded.
Lipper Small Cap Core Funds Index is an unmanaged index considered representative of small-cap core funds tracked by Lipper.
19
Mairs & Power Small Cap Fund
PERFORMANCE INFORMATION (unaudited) December 31, 2012
Investment performance since commencement of operations (through December 31, 2012)
This chart illustrates the performance of a hypothetical $10,000 investment made in the Fund since commencement of operations.
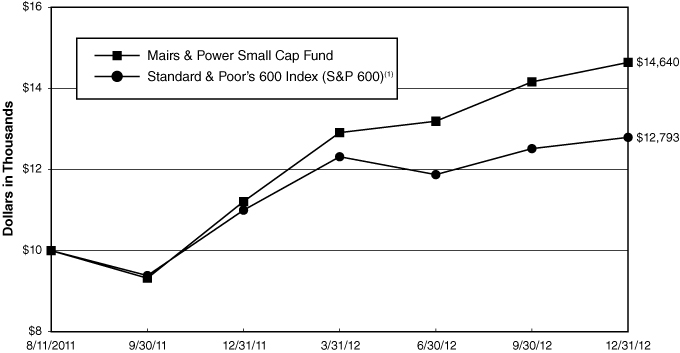
Average annual total returns for periods ended December 31, 2012
| | | 3 Month(2) | | 6 Month(2) | | 1 Year | | Since Inception(3) | |
Mairs & Power Small Cap Fund | | | 3.39 | % | | | 10.99 | % | | | 30.60 | % | | | 31.58 | % | |
S&P Small Cap 600(1) | | | 2.22 | % | | | 7.73 | % | | | 16.33 | % | | | 19.40 | % | |
Performance data quoted represents past performance and does not guarantee future results. All performance information shown includes the reinvestment of dividend and capital gain distributions, but does not reflect the deduction of taxes that a shareholder would pay on Fund distributions or the redemption of Fund shares. The investment return and principal value of an investment will fluctuate so that an investor's shares, when redeemed, may be worth more or less than their original cost. Current performance of the Fund may be lower or higher than the performance quoted. For the most recent month-end performance figures, visit the Fund's website at www.mairsandpower.com or call Shareholder Services at (800) 304-7404.
(1) The S&P Small Cap 600 is an index of small company stocks managed by Standard and Poor's that covers a broad range of small cap stocks in the United States. The index is weighted according to market capitalization and covers about 3-4% of the total market for equities in the United States. It is not possible to invest directly in an index.
(2) Periods less than one year are not annualized.
(3) Since inception performance is as of August 11, 2011, which is the offering date of the Small Cap Fund.
20
Mairs & Power Small Cap Fund
FUND INFORMATION (unaudited) December 31, 2012
Portfolio Managers
Andrew R. Adams, lead manager since 2011
University of Wisconsin-Madison, BBA Finance and Mathematics 1994
University of Wisconsin-Madison, MS Finance 1997
General Information
Fund Symbol | | | MSCFX | | |
Net Asset Value (NAV) Per Share | | $ | 14.49 | | |
Expense Ratio | | | 1.25 | %1 | |
Portfolio Turnover Rate | | | 6.93 | % | |
Sales Charge | | | None2 | | |
Fund Inception Year | | | 2011 | | |
Portfolio Composition

Top Ten Portfolio Holdings
(Percent of Total Net Assets) 3
MDU Resources Group, Inc. | | | 3.5 | % | |
Associated Banc-Corp. | | | 3.4 | | |
ALLETE, Inc. | | | 3.3 | | |
NVE Corporation | | | 3.0 | | |
Hub Group, Inc. | | | 2.9 | | |
Deluxe Corp. | | | 2.9 | | |
Bemis Co., Inc. | | | 2.9 | | |
Snap-on Incorporated | | | 2.7 | | |
Hawkins, Inc. | | | 2.5 | | |
Cray Inc. | | | 2.5 | | |
Portfolio Diversification
(Percent of Total Net Assets)
Common Stocks 96.4% | |
Capital Goods | | | 16.8 | % | |
Financial | | | 14.7 | | |
Consumer Cyclical | | | 13.3 | | |
Technology | | | 12.3 | | |
Basic Industries | | | 12.0 | | |
Health Care | | | 7.2 | | |
Utilities | | | 6.8 | | |
Energy | | | 6.4 | | |
Transportation | | | 4.4 | | |
Consumer Staple | | | 2.5 | | |
Short-term Investments 3.6%4 | | | 3.6 | | |
| | | | 100.0 | % | |
1 The Fund's investment adviser has agreed to waive its investment management and fund administration fees and reimburse expenses to the extent necessary to prevent total annual fund operating expenses (excluding interest, taxes, brokerage, commissions, other investment-related costs and extraordinary expenses, such as litigation and other expenses not incurred in the ordinary course of the Fund's business) from exceeding 1.25% through December 31, 2014. The adviser cannot terminate this arrangement before that date without the agreement of the Fund's Board of Trustees. In the Fund's prospectus dated April 30, 2012, the Fund's gross expense ratio was 7.98%.
2 Although the Fund is no-load, investment management fees and other expenses still apply.
3 All holdings in the portfolio are subject to change without notice and may or may not represent current or future portfolio composition. The mention of specific securities is not intended as a recommendation or offer for a particular security, nor is it intended to be a solicitation for the purchase or sale of any security.
4 Represents short-term investments and other assets and liabilities (net).
21
Mairs & Power Small Cap Fund
SCHEDULE OF INVESTMENTS December 31, 2012
Shares | | Security Description | | Fair Value | |
| | | COMMON STOCKS 96.4% | |
| | | BASIC INDUSTRIES 12.0% | |
| | 39,900 | | | Apogee Enterprises, Inc. | | $ | 956,403 | | |
| | 35,900 | | | Bemis Co., Inc. | | | 1,201,214 | | |
| | 27,300 | | | Hawkins, Inc. | | | 1,054,872 | | |
| | 40,500 | | | Titan Machinery, Inc. (a) | | | 1,000,350 | | |
| | 12,400 | | | Valspar Corp. | | | 773,760 | | |
| | | | 4,986,599 | | |
| | | CAPITAL GOODS 16.8% | |
| | 21,000 | | | Badger Meter, Inc. | | | 995,610 | | |
| | 12,200 | | | Chart Industries, Inc. (a) | | | 813,374 | | |
| | 14,900 | | | Graco, Inc. | | | 767,201 | | |
| | 54,313 | | | MOCON, Inc. | | | 781,564 | | |
| | 19,900 | | | MTS Systems Corp. | | | 1,013,507 | | |
| | 32,000 | | | Oshkosh Corporation (a) | | | 948,800 | | |
| | 11,800 | | | Pentair Ltd. (b) | | | 579,970 | | |
| | 14,000 | | | Snap-on Incorporated | | | 1,105,860 | | |
| | | | 7,005,886 | | |
| | | CONSUMER CYCLICAL 13.3% | |
| | 13,800 | | | Buffalo Wild Wings, Inc. (a) | | | 1,004,916 | | |
| | 23,900 | | | Cabela's Inc. (a) | | | 997,825 | | |
| | 37,800 | | | Deluxe Corp. | | | 1,218,672 | | |
| | 18,000 | | | G&K Services, Inc., Class A | | | 614,700 | | |
| | 32,400 | | | LKQ Corporation (a) | | | 683,640 | | |
| | 23,400 | | | Toro Co. | | | 1,005,732 | | |
| | | | 5,525,485 | | |
| | | CONSUMER STAPLE 2.5% | |
| | 19,500 | | | Casey's General Stores, Inc. | | | 1,035,450 | | |
| | | ENERGY 6.4% | |
| | 93,900 | | | Kodiak Oil & Gas Corp. (a) (b) | | | 831,015 | | |
| | 30,900 | | | Oasis Petroleum Inc. (a) | | | 982,620 | | |
| | 41,800 | | | Superior Energy Services, Inc. (a) | | | 866,096 | | |
| | | | 2,679,731 | | |
| | | FINANCIAL 14.7% | |
| | 109,100 | | | Associated Banc-Corp. | | | 1,431,392 | | |
| | 30,600 | | | Associated Estates Realty Corporation | | | 493,272 | | |
| | 235,233 | | | Bank Mutual Corporation | | | 1,011,502 | | |
| | 66,800 | | | PrivateBancorp, Inc. | | | 1,023,376 | | |
| | 66,400 | | | TCF Financial Corp. | | | 806,760 | | |
22
Mairs & Power Small Cap Fund
SCHEDULE OF INVESTMENTS (continued) December 31, 2012
Shares | | Security Description | | Fair Value | |
| | | COMMON STOCKS (continued) | |
| | | FINANCIAL (continued) | |
| | 10,800 | | | Waddell & Reed Financial, Inc. | | $ | 376,056 | | |
| | 26,600 | | | Wintrust Financial Corporation | | | 976,220 | | |
| | | | 6,118,578 | | |
| | | HEALTH CARE 7.2% | |
| | 16,000 | | | Landauer, Inc. | | | 979,360 | | |
| | 28,700 | | | Patterson Cos., Inc. | | | 982,401 | | |
| | 15,200 | | | Techne Corp. | | | 1,038,768 | | |
| | | | 3,000,529 | | |
| | | TECHNOLOGY 12.3% | |
| | 20,700 | | | Advent Software, Inc. (a) | | | 442,566 | | |
| | 65,300 | | | Cray Inc. (a) | | | 1,041,535 | | |
| | 43,600 | | | Daktronics, Inc. | | | 482,652 | | |
| | 22,500 | | | NVE Corporation (a) | | | 1,248,525 | | |
| | 19,700 | | | Proto Labs, Inc. (a) | | | 776,574 | | |
| | 5,600 | | | SPS Commerce, Inc. (a) | | | 208,712 | | |
| | 110,400 | | | VASCO Data Security International, Inc. (a) | | | 900,864 | | |
| | | | 5,101,428 | | |
| | | TRANSPORTATION 4.4% | |
| | 34,100 | | | Echo Global Logistics, Inc. (a) | | | 612,777 | | |
| | 36,300 | | | Hub Group, Inc. (a) | | | 1,219,680 | | |
| | | | 1,832,457 | | |
| | | UTILITIES 6.8% | |
| | 33,900 | | | ALLETE, Inc. | | | 1,389,222 | | |
| | 67,900 | | | MDU Resources Group, Inc. | | | 1,442,196 | | |
| | | | 2,831,418 | | |
| | | | TOTAL COMMON STOCKS
(cost $35,935,146) | | $ | 40,117,561 | | |
| | | SHORT-TERM INVESTMENTS 3.9% | |
| 1,641,427 | | | First American Prime Obligations Fund, Class Z, 0.04% (c)
(cost $1,641,427) | | $ | 1,641,427 | | |
| | | | TOTAL INVESTMENTS 100.3%
(cost $37,576,573) | | $ | 41,758,988 | | |
| | | | | OTHER ASSETS AND LIABILITIES (NET) (0.3)% | | | (115,121 | ) | |
| | | | | TOTAL NET ASSETS 100.0% | | $ | 41,643,867 | | |
23
Mairs & Power Small Cap Fund
SCHEDULE OF INVESTMENTS (continued) December 31, 2012
(a) Non-income producing.
(b) Foreign security denominated in U.S. dollars. As of December 31, 2012, these securities represented $1,410,985 or 3.4% of total net assets.
(c) The rate quoted is the annualized seven-day effective yield as of December 31, 2012.
See accompanying Notes to Financial Statements.
24
STATEMENTS OF ASSETS AND LIABILITIES December 31, 2012
| | | Mairs & Power
Growth Fund | | Mairs & Power
Balanced Fund | | Mairs & Power
Small Cap Fund | |
ASSETS | |
| Investments, at fair value (Note 1): | |
Unaffiliated securities * | | $ | 2,316,092,058 | | | $ | 286,359,061 | | | $ | 41,758,988 | | |
| Affiliated securities (Note 5) * | | | 175,363,045 | | | | - | | | | - | | |
| | | | 2,491,455,103 | | | | 286,359,061 | | | | 41,758,988 | | |
Receivable for Fund shares sold | | | 7,912,897 | | | | 838,076 | | | | 1,007,254 | | |
Dividends and interest receivable | | | 2,025,871 | | | | 1,340,833 | | | | 7,936 | | |
Prepaid expenses and other assets | | | 122,432 | | | | 28,316 | | | | 17,490 | | |
| | | | 2,501,516,303 | | | | 288,566,286 | | | | 42,791,668 | | |
LIABILITIES | |
Payable for Fund shares redeemed | | | 1,475,787 | | | | 174,553 | | | | 28,041 | | |
Payable for securities purchased | | | - | | | | 1,255,633 | | | | 1,038,229 | | |
| Accrued investment management fees (Note 2) | | | 1,247,557 | | | | 139,996 | | | | 37,624 | | |
| Accrued Fund administration fees (Note 2) | | | 120,211 | | | | 7,474 | | | | 2,293 | | |
Accrued audit expense | | | 21,060 | | | | 14,430 | | | | 10,400 | | |
Accrued transfer agent fees | | | 273,693 | | | | 20,943 | | | | 9,184 | | |
Accrued expenses and other liabilities | | | 171,440 | | | | 43,574 | | | | 22,030 | | |
| | | | 3,309,748 | | | | 1,656,603 | | | | 1,147,801 | | |
NET ASSETS | | $ | 2,498,206,555 | | | $ | 286,909,683 | | | $ | 41,643,867 | | |
NET ASSETS CONSIST OF | |
Portfolio capital | | $ | 1,507,561,503 | | | $ | 220,413,785 | | | $ | 37,462,458 | | |
Undistributed net investment income | | | 21,490 | | | | 14,720 | | | | 153 | | |
Undistributed net realized gain (loss)
on investments | | | (709,016 | ) | | | 13,771 | | | | (1,159 | ) | |
Net unrealized appreciation on investments | | | 991,332,578 | | | | 66,467,407 | | | | 4,182,415 | | |
TOTAL NET ASSETS | | $ | 2,498,206,555 | | | $ | 286,909,683 | | | $ | 41,643,867 | | |
Fund shares, par value | | $ | 0.01 | | | $ | 0.01 | | | $ | 0.01 | | |
Authorized | | | unlimited | | | | unlimited | | | | unlimited | | |
Fund shares issued and outstanding | | | 29,759,069 | | | | 4,050,711 | | | | 2,874,017 | | |
Net asset value per share | | $ | 83.95 | | | $ | 70.83 | | | $ | 14.49 | | |
* Cost of investments: | |
Cost of unaffiliated securities | | $ | 1,431,097,172 | | | $ | 219,891,654 | | | $ | 37,576,573 | | |
| Cost of affiliated securities (Note 5) | | | 69,025,353 | | | | - | | | | - | | |
| | | $ | 1,500,122,525 | | | $ | 219,891,654 | | | $ | 37,576,573 | | |
See accompanying Notes to Financial Statements.
25
STATEMENTS OF OPERATIONS Year Ended December 31, 2012
| | | Mairs & Power
Growth Fund | | Mairs & Power
Balanced Fund | | Mairs & Power
Small Cap Fund | |
INVESTMENT INCOME | |
Income: | |
Dividends from unaffiliated securities | | $ | 51,892,257 | | | $ | 3,847,017 | | | $ | 289,446 | | |
| Dividends from affiliated securities (Note 5) | | | 2,268,750 | | | | - | | | | - | | |
Interest | | | 32,563 | | | | 4,471,844 | | | | 525 | | |
TOTAL INCOME | | | 54,193,570 | | | | 8,318,861 | | | | 289,971 | | |
Expenses: | |
| Investment management fees (Note 2) | | | 13,605,025 | | | | 1,358,208 | | | | 164,489 | | |
| Fund administration fees (Note 2) | | | 407,386 | | | | 31,813 | | | | 14,363 | | |
Fund accounting | | | 252,232 | | | | 82,417 | | | | 34,029 | | |
| Trustees' compensation (Note 2) | | | 167,525 | | | | 14,153 | | | | 5,663 | | |
Transfer agent fees | | | 987,223 | | | | 77,424 | | | | 26,851 | | |
Custodian fees | | | 149,976 | | | | 16,703 | | | | 8,439 | | |
Legal and audit fees | | | 105,995 | | | | 40,325 | | | | 29,049 | | |
Printing and mailing fees | | | 113,097 | | | | 4,055 | | | | 6,524 | | |
Other expenses | | | 159,044 | | | | 46,676 | | | | 27,409 | | |
Total expenses before expense reimbursement | | | 15,947,503 | | | | 1,671,774 | | | | 316,816 | | |
| Expense reimbursement (Note 2) | | | - | | | | - | | | | (88,358 | ) | |
TOTAL EXPENSES | | | 15,947,503 | | | | 1,671,774 | | | | 228,458 | | |
NET INVESTMENT INCOME | | | 38,246,067 | | | | 6,647,087 | | | | 61,513 | | |
| REALIZED AND UNREALIZED GAIN (LOSS) (Note 4) | |
Net realized gain on investments: | |
Unaffiliated issuers | | | 14,591,275 | | | | 387,619 | | | | 344,220 | | |
| Affiliated issuers (Note 5) | | | 11,342,823 | | | | - | | | | - | | |
| | | | 25,934,098 | | | | 387,619 | | | | 344,220 | | |
Change in net unrealized appreciation
on investments | | | 372,252,224 | | | | 28,004,807 | | | | 3,706,050 | | |
NET GAIN ON INVESTMENTS | | | 398,186,322 | | | | 28,392,426 | | | | 4,050,270 | | |
NET INCREASE IN NET ASSETS FROM
OPERATIONS | | $ | 436,432,389 | | | $ | 35,039,513 | | | $ | 4,111,783 | | |
See accompanying Notes to Financial Statements.
26
Mairs & Power Growth Fund
STATEMENTS OF CHANGES IN NET ASSETS
| | | Year Ended December 31, | |
| | | 2012 | | 2011 | |
OPERATIONS | |
Net investment income | | $ | 38,246,067 | | | $ | 28,277,094 | | |
Net realized gain (loss) on investments sold | | | 25,934,098 | | | | 25,608,835 | | |
Net change in unrealized appreciation (depreciation) of investments | | | 372,252,224 | | | | (40,724,935 | ) | |
NET INCREASE IN NET ASSETS FROM OPERATIONS | | | 436,432,389 | | | | 13,160,994 | | |
DISTRIBUTIONS TO SHAREHOLDERS FROM | |
Net investment income | | | (38,600,956 | ) | | | (27,830,878 | ) | |
Net realized gain on investments sold | | | (26,121,613 | ) | | | (25,685,385 | ) | |
TOTAL DISTRIBUTIONS TO SHAREHOLDERS | | | (64,722,569 | ) | | | (53,516,263 | ) | |
CAPITAL TRANSACTIONS | |
Proceeds from shares sold | | | 338,838,247 | | | | 125,601,510 | | |
Reinvestment of distributions from net investment income and net realized gains | | | 60,107,781 | | | | 49,290,789 | | |
Cost of shares redeemed | | | (247,576,772 | ) | | | (200,118,859 | ) | |
INCREASE (DECREASE) IN NET ASSETS FROM CAPITAL
TRANSACTIONS | | | 151,369,256 | | | | (25,226,560 | ) | |
TOTAL INCREASE (DECREASE) IN NET ASSETS | | | 523,079,076 | | | | (65,581,829 | ) | |
NET ASSETS | |
Beginning of year | | | 1,975,127,479 | | | | 2,040,709,308 | | |
End of year (including undistributed net investment income of $21,490
and $376,379, respectively) | | $ | 2,498,206,555 | | | $ | 1,975,127,479 | | |
FUND SHARE TRANSACTIONS | |
Shares sold | | | 4,197,159 | | | | 1,725,807 | | |
Shares issued for reinvested distributions | | | 743,887 | | | | 683,471 | | |
Shares redeemed | | | (3,089,010 | ) | | | (2,783,784 | ) | |
NET INCREASE (DECREASE) IN FUND SHARES | | | 1,852,036 | | | | (374,506 | ) | |
See accompanying Notes to Financial Statements.
27
Mairs & Power Balanced Fund
STATEMENTS OF CHANGES IN NET ASSETS
| | | Year Ended December 31, | |
| | | 2012 | | 2011 | |
OPERATIONS | |
Net investment income | | $ | 6,647,087 | | | $ | 5,405,111 | | |
Net realized gain (loss) on investments sold | | | 387,619 | | | | 42,134 | | |
Net change in unrealized appreciation (depreciation) of investments | | | 28,004,807 | | | | (67,943 | ) | |
NET INCREASE IN NET ASSETS FROM OPERATIONS | | | 35,039,513 | | | | 5,379,302 | | |
DISTRIBUTIONS TO SHAREHOLDERS FROM | |
Net investment income | | | (6,712,826 | ) | | | (5,337,209 | ) | |
Net realized gain on investments sold | | | (368,142 | ) | | | (40,883 | ) | |
TOTAL DISTRIBUTIONS TO SHAREHOLDERS | | | (7,080,968 | ) | | | (5,378,092 | ) | |
CAPITAL TRANSACTIONS | |
Proceeds from shares sold | | | 91,053,226 | | | | 34,487,598 | | |
Reinvestment of distributions from net investment income and net realized gains | | | 6,580,843 | | | | 4,720,666 | | |
Cost of shares redeemed | | | (25,343,196 | ) | | | (21,948,951 | ) | |
INCREASE (DECREASE) IN NET ASSETS FROM CAPITAL
TRANSACTIONS | | | 72,290,873 | | | | 17,259,313 | | |
TOTAL INCREASE (DECREASE) IN NET ASSETS | | | 100,249,418 | | | | 17,260,523 | | |
NET ASSETS | |
Beginning of year | | | 186,660,265 | | | | 169,399,742 | | |
End of year (including undistributed net investment income of $14,720
and $68,341, respectively) | | $ | 286,909,683 | | | $ | 186,660,265 | | |
FUND SHARE TRANSACTIONS | |
Shares sold | | | 1,322,413 | | | | 545,647 | | |
Shares issued for reinvested distributions | | | 95,833 | | | | 75,765 | | |
Shares redeemed | | | (370,691 | ) | | | (349,979 | ) | |
NET INCREASE (DECREASE) IN FUND SHARES | | | 1,047,555 | | | | 271,433 | | |
See accompanying Notes to Financial Statements.
28
Mairs & Power Small Cap Fund
STATEMENTS OF CHANGES IN NET ASSETS
| | | Year Ended
December 31,
2012 | | Period Ended
December 31,
2011* | |
OPERATIONS | |
Net investment income | | $ | 61,513 | | | $ | 4,454 | | |
Net realized gain (loss) on investments sold | | | 344,220 | | | | (1,981 | ) | |
Net change in unrealized appreciation (depreciation) of investments | | | 3,706,050 | | | | 476,365 | | |
NET INCREASE IN NET ASSETS FROM OPERATIONS | | | 4,111,783 | | | | 478,838 | | |
DISTRIBUTIONS TO SHAREHOLDERS FROM | |
Net investment income | | | (61,142 | ) | | | - | | |
Net realized gain on investments sold | | | (348,235 | ) | | | - | | |
TOTAL DISTRIBUTIONS TO SHAREHOLDERS | | | (409,377 | ) | | | - | | |
CAPITAL TRANSACTIONS | |
Proceeds from shares sold | | | 34,480,633 | | | | 4,615,501 | | |
Reinvestment of distributions from net investment income and net realized gains | | | 378,100 | | | | - | | |
Cost of shares redeemed | | | (2,111,174 | ) | | | (437 | ) | |
INCREASE (DECREASE) IN NET ASSETS FROM CAPITAL
TRANSACTIONS | | | 32,747,559 | | | | 4,615,064 | | |
TOTAL INCREASE (DECREASE) IN NET ASSETS | | | 36,449,965 | | | | 5,093,902 | | |
NET ASSETS | |
Beginning of period | | | 5,193,902 | | | | 100,000 | | |
End of period (including undistributed net investment income of $153
and $4,214, respectively) | | $ | 41,643,867 | | | $ | 5,193,902 | | |
FUND SHARE TRANSACTIONS | |
Shares sold | | | 2,537,189 | | | | 453,446 | | |
Shares issued for reinvested distributions | | | 26,589 | | | | - | | |
Shares redeemed | | | (153,167 | ) | | | (40 | ) | |
NET INCREASE (DECREASE) IN FUND SHARES | | | 2,410,611 | | | | 453,406 | | |
* Period from August 11, 2011 (commencement of operations) through December 31, 2011.
See accompanying Notes to Financial Statements.
29
NOTES TO FINANCIAL STATEMENTS December 31, 2012
Note 1 – Organization and Significant Accounting Policies
Mairs & Power Funds Trust (the Trust), a Delaware statutory trust, was formed on May 10, 2011. The Trust is a no-load, diversified, open-end management investment company registered under the Investment Company Act of 1940, as amended (the 1940 Act). Mairs & Power Growth Fund (the Growth Fund), Mairs & Power Balanced Fund (the Balanced Fund), and Mairs & Power Small Cap Fund (the Small Cap Fund) (individually a Fund and collectively the Funds) are series within the Trust. Effective August 11, 2011, the Small Cap Fund was added as a new series to the Trust. Effective December 31, 2011, the Growth Fund and Balanced Fund were added as new series to the Trust following the reorganization of Mairs and Power Growth Fund, Inc. and Mairs and Power Balanced Fund, Inc. into the Trust. The objective of the Growth Fund is to provide shareholders with a diversified portfolio of common stocks, which have the potential for above-average, long-term appreciation. The objectives of the Balanced Fund are to provide shareholders with regular current income, the potential for capital appreciation and a moderate level of risk by investing in a diversified portfolio including bonds, preferred stocks, common stocks, and other securities convertible into common stock. The objective of the Small Cap Fund is to seek above-average, long-term appreciation.
Significant accounting policies of the Funds are as follows:
Security Valuations
Security valuations for the Funds' investments are furnished by independent pricing services that have been approved by the Trust's Board of Trustees (the Board). Investments in listed equity securities are valued at the last quoted sale price on the securities exchange or at the NASDAQ Official Closing Price if readily available for such securities on each business day. Other equity securities traded in the over-the-counter market and listed equity securities for which no sale was reported on that date are stated at the last quoted bid price. Debt obligations exceeding 60 days to maturity are valued by an independent pricing service. The pricing service may employ methodologies that utilize actual market transactions, broker-dealer supplied valuations, or other formula-driven valuation techniques. These techniques generally consider overall market conditions and such factors as yields or prices of bonds of comparable quality, type of issue, coupon, maturity and ratings. Debt obligations with 60 days or less remaining until maturity may be valued at their amortized cost, which approximates fair value.
Securities for which prices are not available from an independent pricing service, but where an active market exists, are valued using market quotations obtained from one or more dealers that make markets in the securities or from a widely used quotation system. When market quotations are not readily available, or when the last quoted sale price is not considered representative of the value of the security if it were to be sold on that day, the security will be valued at fair value as determined in good faith by the Fair Value Committee appointed by the Board, pursuant to procedures approved by the Board. Factors that may be considered in determining the fair value of a security are fundamental analytical data relating to the security, the nature and duration of any restrictions on the disposition of the security, and the forces influencing the market in which the security is purchased or sold. As of December 31, 2012, no securities in the Funds were valued using this method.
Fair Valuation Measurements
The Trust has adopted authoritative fair valuation accounting standards, which establish a definition of fair value and set out a hierarchy for measuring fair value. These standards require additional disclosures about the various inputs and valuation techniques used to develop the measurements of fair value and changes in valuation techniques and related inputs during the period. These inputs are summarized in the three broad levels listed below:
• Level 1 – Quoted prices in active markets for identical securities.
• Level 2 – Other significant observable inputs (including quoted prices for similar securities, interest rates, prepayment speeds, credit risk, etc.).
30
NOTES TO FINANCIAL STATEMENTS (continued) December 31, 2012
Note 1 – Organization and Significant Accounting Policies (continued)
• Level 3 – Significant unobservable inputs (including the Funds' own assumptions in determining the fair value of investments).
The inputs or methodologies used for valuing securities are not necessarily an indication of the risk associated with investing in those securities. The following is a summary of the inputs used to value the net assets of each Fund as of December 31, 2012:
| | | Growth Fund | | Balanced Fund | | Small Cap Fund | |
Level 1* | | $ | 2,491,455,103 | | | $ | 196,349,368 | | | $ | 41,758,988 | | |
Level 2** | | | - | | | | 90,009,693 | | | | - | | |
Level 3 | | | - | | | | - | | | | - | | |
Total | | $ | 2,491,455,103 | | | $ | 286,359,061 | | | $ | 41,758,988 | | |
* All Level 1 investments are equity securities (common stocks and preferred stocks and securities) and short-term investments.
** All Level 2 investments are fixed income securities, excluding preferred securities.
For detail of securities by major industry classification for the Funds, please refer to the Schedules of Investments.
The Funds had no transfers amongst levels during the period and did not hold any Level 3 investments at either December 31, 2012 or December 31, 2011; therefore, a roll forward of Level 3 investments is not required.
On May 12, 2011, the Financial Accounting Standards Board (FASB) issued an Accounting Standard Update (ASU) No. 2011-04 modifying FASB Accounting Standards Codification (ASC) Topic 820, Fair Value Measurements and Disclosures. At the same time, the International Accounting Standards Board (IASB) issued International Financial Reporting Standard (IFRS) 13, Fair Value Measurement. The objective by the FASB and IASB is convergence of their guidance on fair value measurements and disclosures. Specifically, the ASU requires reporting entities to disclose i) the amounts of any transfers between Level 1 and Level 2 and the reasons for the transfers, and ii) for Level 3 fair value measurements, a) quantitative information about significant unobservable inputs used, b) a description of the valuation processes used by the reporting entity and c) a narrative description of the sensitivity of the fair value measurement to changes in unobservable inputs if a change in those inputs might result in a significantly higher or lower fair value measurement. The effective date of the ASU is for interim and annual periods beginning after December 15, 2011. Management evaluated the implications of this guidance and concluded the ASU has no impact on the Funds.
Security Transactions and Investment Income
Security transactions are recorded on the date on which securities are purchased or sold. Dividend income and corporate action transactions are recorded on the ex-dividend date, and interest income is recorded on an accrual basis. Realized gains and losses are reported on an identified cost basis.
Income Taxes
Each Fund is a "regulated investment company" as defined in Subtitle A, Chapter 1, Subchapter M of the Internal Revenue Code, as amended (the Code). No provisions have been made for federal income taxes as it is the intention of each Fund to comply with the provisions of the Code applicable to regulated investment companies and to make distributions of income and realized gains sufficient to relieve it from all or substantially all excise and income taxes.
As of December 31, 2012, the Trust did not have any tax positions that did not meet the "more-likely-than-not" threshold of being sustained by the applicable tax authority. Generally, tax authorities can examine all tax returns filed for the last three years or, for the Small Cap Fund, all tax returns filed since commencement of operations.
31
NOTES TO FINANCIAL STATEMENTS (continued) December 31, 2012
Note 1 – Organization and Significant Accounting Policies (continued)
The Regulated Investment Company Modernization Act of 2010 (the Act) changed various technical rules governing the tax treatment of regulated investment companies. Under the Act, the Funds will be permitted to carry forward capital losses incurred. In addition, capital loss carryforwards will retain their character as either short-term or long-term capital losses rather than being considered all short-term as permitted under previous regulation. Management evaluated the implications of this guidance and concluded the Act has no impact on the Funds. As of December 31, 2012, the Growth Fund, Balanced Fund and Small Cap Fund did not have any post-enactment capital loss carryforwards.
Basis of Presentation
The preparation of financial statements in conformity with U.S. generally accepted accounting principles (GAAP) requires management to make estimates and assumptions that affect the reported amount of net assets and liabilities and disclosure of contingent assets and liabilities at the date of the financial statements and the reported results of operations during the reporting period. Actual results could differ from those estimates.
In preparing these financial statements, the Funds have evaluated events and transactions for potential recognition or disclosure through the date the financial statements were available to be issued. This evaluation did not result in any subsequent events that necessitated recognition or disclosures.
Note 2 – Related-Party Transactions
Common expenses incurred by the Trust are allocated among the Funds based on a ratio predetermined by the Board. Fund specific expenses are charged directly to the Fund that incurred the expense.
Investment Management and Fund Administration Fees
Mairs & Power, Inc. (the Adviser) provides investment management services to the Funds under a written agreement (the Management Agreement) approved by the Board. Pursuant to the Management Agreement, the Adviser is paid a monthly fee on average daily net assets at the following annual rates:
| | | Growth Fund | | Balanced Fund | | Small Cap Fund* | |
Up to $2.5 Billion | | | 0.60 | % | | | 0.60 | % | | | 0.90 | % | |
Over $2.5 Billion | | | 0.50 | % | | | 0.60 | % | | | 0.90 | % | |
The Adviser provides fund administration services to the Funds under a written fund administration servicing agreement approved by the Board. The fund administration fee paid to the Adviser is computed at an annual rate of 0.00281% of average daily net assets. Fund administration fees incurred for the year ended December 31, 2012 and fund administration fees payable to the Adviser as of December 31, 2012 were as follows:
| | | Growth Fund | | Balanced Fund | | Small Cap Fund* | |
Fund administration fees incurred | | $ | 63,717 | | | $ | 6,361 | | | $ | 514 | | |
Fund administration fees payable | | | 5,843 | | | | 656 | | | | 90 | | |
Pursuant to a sub-administration agreement between the Funds and U.S. Bancorp Fund Services, LLC (USBFS), the Funds are charged a sub-administration fee paid to USBFS. Sub-administration fees from USBFS incurred for the year ended December 31, 2012 and sub-administration fees payable to USBFS as of December 31, 2012 were as follows:
| | | Growth Fund | | Balanced Fund | | Small Cap Fund* | |
Sub-administration fees incurred | | $ | 343,669 | | | $ | 25,452 | | | $ | 13,849 | | |
Sub-administration fees payable | | | 114,368 | | | | 6,818 | | | | 2,203 | | |
* The Adviser has agreed to waive the Small Cap Fund's investment management and fund administration fees and reimburse expenses to the extent necessary to prevent total annual fund operating expenses (excluding interest, taxes, brokerage commissions, other investment-related costs and other extraordinary expenses, such as
32
NOTES TO FINANCIAL STATEMENTS (continued) December 31, 2012
Note 2 – Related-Party Transactions (continued)
litigation and other expenses not incurred in the ordinary course of the Small Cap Fund's business) from exceeding 1.25% of daily net assets through December 31, 2014. The Adviser cannot terminate this arrangement before that date without the agreement of the Board.
Trustees' Compensation
Trustees' compensation is paid to individuals who are disinterested trustees. No compensation is paid to the owners of the Adviser, including principal officers who are not trustees of the Funds and William B. Frels and Jon A. Theobald, who are interested trustees and officers of the Trust.
Note 3 – Indemnifications
In the normal course of business, the Trust enters into contracts that contain general indemnifications to other parties. The Trust's maximum exposure under these contracts is unknown as this would involve future claims that may be made against the Trust that have not yet occurred. The Trust expects the risk of loss to be remote.
Note 4 – Distributions Paid, Distributable Earnings and Investment Transactions
Net investment income and net realized capital gains (losses) may differ for financial reporting and tax purposes because of temporary or permanent book/tax differences. To the extent these differences are permanent, reclassifications are made to the appropriate equity accounts in the period that the difference arises.
In addition, GAAP requires that certain components of net assets relating to permanent differences be reclassified between financial and tax reporting. These reclassifications have no effect on net assets or net asset value per share. On the Statement of Assets and Liabilities, the following reclassifications were made for the year ended December 31, 2012:
| | Undistributed
Net Investment
Income (Loss) | | Undistributed
Net Realized
Gain (Loss) | | Paid in Capital | |
Balanced Fund | | $ | 12,118 | | | $ | (12,118 | ) | | $ | - | | |
Small Cap Fund | | | (4,432 | ) | | | 4,597 | | | | (165 | ) | |
Distributions to shareholders are determined in accordance with income tax regulations that may differ from GAAP, and due to the timing of the distributions, the fiscal year in which the amounts are distributed may differ from the year that the income or realized gains (losses) were recorded by each Fund.
The tax character of distributions paid during the years ended December 31, 2012 and December 31, 2011 were as follows:
Year ended December 31, 2012 | |
Distributions paid from: | | Growth Fund | | Balanced Fund | | Small Cap Fund | |
Ordinary income | | $ | 38,600,956 | | | $ | 6,722,264 | | | $ | 291,357 | | |
Long-term capital gains | | | 26,121,613 | | | | 358,704 | | | | 118,020 | | |
Total distributions paid | | $ | 64,722,569 | | | $ | 7,080,968 | | | $ | 409,377 | | |
Year ended December 31, 2011 | |
Distributions paid from: | | Growth Fund | | Balanced Fund | | Small Cap Fund | |
Ordinary income | | $ | 27,997,862 | | | $ | 5,338,028 | | | $ | - | | |
Long-term capital gains | | | 25,518,401 | | | | 40,064 | | | | - | | |
Total distributions paid | | $ | 53,516,263 | | | $ | 5,378,092 | | | $ | - | | |
33
NOTES TO FINANCIAL STATEMENTS (continued) December 31, 2012
Note 4 – Distributions Paid, Distributable Earnings and Investment Transactions (continued)
At December 31, 2012, the components of accumulated earnings (losses) on a tax basis were as follows:
| | Growth Fund | | Balanced Fund | | Small Cap Fund | |
Cost of investments | | $ | 1,500,832,789 | | | $ | 219,876,934 | | | $ | 37,577,732 | | |
Gross unrealized appreciation | | $ | 1,095,798,501 | | | $ | 71,856,315 | | | $ | 4,728,780 | | |
Gross unrealized depreciation | | | (105,176,187 | ) | | | (5,374,188 | ) | | | (547,524 | ) | |
Net unrealized appreciation | | $ | 990,622,314 | | | $ | 66,482,127 | | | $ | 4,181,256 | | |
Undistributed ordinary income | | $ | 21,490 | | | $ | - | | | $ | 153 | | |
Undistributed long-term capital gains | | | 1,248 | | | | 13,771 | | | | - | | |
Total distributable earnings | | $ | 22,738 | | | $ | 13,771 | | | $ | 153 | | |
Other accumulated earnings | | | - | | | | - | | | | - | | |
Total accumulated earnings | | $ | 990,645,052 | | | $ | 66,495,898 | | | $ | 4,181,409 | | |
The difference between book-basis and tax-basis unrealized appreciation is attributable primarily to the tax deferral of losses on wash sales and the tax cost basis adjustment due to receipt of return of capital distributions from certain investments.
Purchases and sales of investment securities, excluding government securities, short-term securities and temporary cash investments, during the year ended December 31, 2012 were as follows:
| | | Purchases | | Sales | |
Growth Fund | | $ | 98,293,233 | | | $ | 34,936,811 | | |
Balanced Fund | | | 50,667,258 | | | | 7,701,210 | | |
Small Cap Fund | | | 32,594,152 | | | | 1,256,027 | | |
Purchases and sales of government securities during the year ended December 31, 2012 were as follows:
| | | Purchases | | Sales | |
Growth Fund | | $ | - | | | $ | - | | |
Balanced Fund | | | 2,499,149 | | | | 4,000,000 | | |
Small Cap Fund | | | - | | | | - | | |
Note 5 – Transactions With Affiliated Companies
The Growth Fund owned 5% or more of the voting securities of the following companies during the year ended December 31, 2012. As a result, these companies are deemed to be affiliates of the Growth Fund as defined by the 1940 Act. Transactions during the period in these securities of affiliated companies were as follows:
Growth Fund
| | | Share Activity | | | | | |
Security Name | | Balance
12/31/11 | | Purchases | | Sales | | Balance
12/31/12 | | Dividend
Income | | Fair Value at
12/31/12 | |
H.B. Fuller Co. | | | 2,980,000 | | | | - | | | | 130,000 | | | | 2,850,000 | | | $ | 948,750 | | | $ | 99,237,000 | | |
MEDTOX Scientific, Inc. | | | 522,500 | | | | - | | | | 522,500 | | | | - | | | | - | | | | - | | |
MTS Systems Corp. | | | 1,200,000 | | | | - | | | | - | | | | 1,200,000 | | | | 1,320,000 | | | | 61,116,000 | | |
NVE Corporation | | | 143,900 | | | | 126,600 | | | | - | | | | 270,500 | | | | - | | | | 15,010,045 | | |
| | | | | | | | | | | $ | 2,268,750 | | | $ | 175,363,045 | | |
34
Mairs & Power Growth Fund
FINANCIAL HIGHLIGHTS
SELECTED DATA AND RATIOS
(for a share outstanding throughout each year)
| | | Year Ended December 31, | |
| | | 2012 | | 2011 | | 2010 | | 2009 | | 2008 | |
Per Share | |
Net asset value, beginning of year | | $ | 70.78 | | | $ | 72.16 | | | $ | 63.12 | | | $ | 52.51 | | | $ | 76.30 | | |
Income from investment operations: | |
Net investment income | | | 1.33 | | | | 1.01 | | | | 0.86 | | | | 0.89 | | | | 1.22 | | |
Net realized and unrealized gain (loss) | | | 14.08 | | | | (0.45 | ) | | | 10.01 | | | | 10.85 | | | | (22.93 | ) | |
Total from investment operations | | | 15.41 | | | | 0.56 | | | | 10.87 | | | | 11.74 | | | | (21.71 | ) | |
Distributions to shareholders from: | |
Net investment income | | | (1.34 | ) | | | (1.00 | ) | | | (0.86 | ) | | | (0.89 | ) | | | (1.22 | ) | |
Net realized gains on investments sold | | | (0.90 | ) | | | (0.94 | ) | | | (0.97 | ) | | | (0.24 | ) | | | (0.86 | ) | |
Contribution from Adviser | | | - | | | | - | | | | (0.04 | )(1) | | | - | | | | - | | |
Total distributions | | | (2.24 | ) | | | (1.94 | ) | | | (1.87 | ) | | | (1.13 | ) | | | (2.08 | ) | |
Contribution from Adviser | | | - | | | | - | | | | 0.04 | (1) | | | - | | | | - | | |
Net asset value, end of year | | $ | 83.95 | | | $ | 70.78 | | | $ | 72.16 | | | $ | 63.12 | | | $ | 52.51 | | |
Total investment return | | | 21.91 | % | | | 0.74 | % | | | 17.40 | %(2) | | | 22.52 | % | | | -28.51 | % | |
Net assets, end of year, in thousands | | $ | 2,498,207 | | | $ | 1,975,127 | | | $ | 2,040,709 | | | $ | 1,935,317 | | | $ | 1,681,717 | | |
Ratios/supplemental data: | |
Ratio of expenses to average net assets | | | 0.70 | % | | | 0.72 | % | | | 0.71 | % | | | 0.71 | % | | | 0.70 | % | |
Ratio of net investment income to average net assets | | | 1.69 | | | | 1.40 | | | | 1.26 | | | | 1.61 | | | | 1.75 | | |
Portfolio turnover rate | | | 1.58 | | | | 2.78 | | | | 1.81 | | | | 3.21 | | | | 2.42 | | |
(1) The Fund received two contributions from the Adviser related to prospect services and other expenses paid by the Fund from 1980 to 2009, which were in violation of the Investment Company Act of 1940. The contribution amounts, including imputed interest, were $1,192,736 or $0.04 per share based upon shares outstanding on May 21, 2010, and $8,271 or $0.0003 per share based on shares outstanding as of September 24, 2010.
(2) For the year ended December 31, 2010, 0.08% of the Fund's total return was a result of contributions as described in footnote 1 above. Excluding the contributions, total investment return would have been 17.32%.
See accompanying Notes to Financial Statements.
35
Mairs & Power Balanced Fund
FINANCIAL HIGHLIGHTS
SELECTED DATA AND RATIOS
(for a share outstanding throughout each year)
| | | Year Ended December 31, | |
| | | 2012 | | 2011 | | 2010 | | 2009 | | 2008 | |
Per Share | |
Net asset value, beginning of year | | $ | 62.15 | | | $ | 62.01 | | | $ | 55.76 | | | $ | 47.80 | | | $ | 63.19 | | |
Income from investment operations: | |
Net investment income | | | 1.89 | | | | 1.85 | | | | 1.81 | | | | 1.88 | | | | 1.98 | | |
Net realized and unrealized gain (loss) | | | 8.79 | | | | 0.13 | | | | 6.29 | | | | 8.08 | | | | (15.12 | ) | |
Total from investment operations | | | 10.68 | | | | 1.98 | | | | 8.10 | | | | 9.96 | | | | (13.14 | ) | |
Distributions to shareholders from: | |
Net investment income | | | (1.91 | ) | | | (1.83 | ) | | | (1.81 | ) | | | (1.86 | ) | | | (1.98 | ) | |
Net realized gains on investments sold | | | (0.09 | ) | | | (0.01 | ) | | | (0.04 | ) | | | (0.11 | ) | | | (0.27 | ) | |
Contribution from Adviser | | | - | | | | - | | | | (0.06 | )(1) | | | - | | | | - | | |
Return of capital | | | - | | | | - | | | | (0.00 | )(2) | | | (0.03 | ) | | | - | | |
Total distributions | | | (2.00 | ) | | | (1.84 | ) | | | (1.91 | ) | | | (2.00 | ) | | | (2.25 | ) | |
Contribution from Adviser | | | - | | | | - | | | | 0.06 | (1) | | | - | | | | - | | |
Net asset value, end of year | | $ | 70.83 | | | $ | 62.15 | | | $ | 62.01 | | | $ | 55.76 | | | $ | 47.80 | | |
Total investment return | | | 17.34 | % | | | 3.23 | % | | | 14.87 | %(3) | | | 21.35 | % | | | -21.12 | % | |
Net assets, end of year, in thousands | | $ | 286,910 | | | $ | 186,660 | | | $ | 169,400 | | | $ | 136,404 | | | $ | 107,989 | | |
Ratios/supplemental data: | |
Ratio of expenses to average net assets | | | 0.74 | % | | | 0.79 | % | | | 0.81 | % | | | 0.83 | % | | | 0.80 | % | |
Ratio of net investment income to average net assets | | | 2.94 | | | | 2.99 | | | | 3.13 | | | | 3.73 | | | | 3.45 | | |
Portfolio turnover rate | | | 5.46 | | | | 9.12 | | | | 5.93 | | | | 18.92 | | | | 17.31 | | |
(1) The Fund received two contributions from the Adviser related to prospect services and other expenses paid by the Fund from 1980 to 2009, which were in violation of the Investment Company Act of 1940. The contribution amounts, including imputed interest, were $161,030 or $0.06 per share based upon shares outstanding on May 21, 2010, and $5,841 or $0.002 per share based on shares outstanding as of September 24, 2010.
(2) Return of capital in 2010 is $0.003 per share.
(3) For the year ended December 31, 2010, 0.11% of the Fund's total return was a result of contributions as described in footnote 1 above. Excluding the contributions, total investment return would have been 14.76%.
See accompanying Notes to Financial Statements.
36
Mairs & Power Small Cap Fund
FINANCIAL HIGHLIGHTS
SELECTED DATA AND RATIOS
(for a share outstanding throughout each period)
| | | Year Ended
December 31, 2012 | | August 11, 2011 *
Through
December 31, 2011 (1) | |
Per Share | |
Net asset value, beginning of period | | $ | 11.21 | | | $ | 10.00 | | |
Income from investment operations: | |
Net investment income | | | 0.01 | | | | 0.01 | | |
Net realized and unrealized gain (loss) | | | 3.42 | | | | 1.20 | | |
Total from investment operations | | | 3.43 | | | | 1.21 | | |
Distributions to shareholders from: | |
Net investment income | | | (0.02 | ) | | | - | | |
Net realized gains on investments sold | | | (0.13 | ) | | | - | | |
Total distributions | | | (0.15 | ) | | | - | | |
Net asset value, end of period | | $ | 14.49 | | | $ | 11.21 | | |
Total investment return | | | 30.60 | % | | | 12.10 | % | |
Net assets, end of period, in thousands | | $ | 41,644 | | | $ | 5,194 | | |
Ratios/supplemental data: | |
Ratio of expenses to average net assets: | |
Before expense reimbursement | | | 1.73 | % | | | 7.98 | % | |
After expense reimbursement | | | 1.25 | % | | | 1.25 | % | |
Ratio of net investment income to average net assets: | |
Before expense reimbursement | | | (0.14 | )% | | | (6.41 | )% | |
After expense reimbursement | | | 0.34 | % | | | 0.32 | % | |
Portfolio turnover rate | | | 6.93 | % | | | 4.52 | % | |
* Commencement of operations.
(1) For the period ended December 31, 2011, all ratios have been annualized except total investment return and portfolio turnover.
See accompanying Notes to Financial Statements.
37
REPORT OF INDEPENDENT REGISTERED PUBLIC ACCOUNTING FIRM
The Board of Trustees and Shareholders of Mairs and Power Funds Trust
We have audited the accompanying statements of assets and liabilities, including the schedules of investments, of Mairs and Power Funds Trust (the Trust) (comprising, respectively, Mairs and Power Balanced Fund, Mairs and Power Growth Fund, and Mairs and Power Small Cap Fund), as of December 31, 2012, and the related statements of operations for the year then ended, the statements of changes in net assets for the periods indicated therein, and the financial highlights for the periods indicated therein. These financial statements and financial highlights are the responsibility of the Trust's management. Our responsibility is to express an opinion on these financial statements and financial highlights based on our audits.
We conducted our audits in accordance with the standards of the Public Company Accounting Oversight Board (United States). Those standards require that we plan and perform the audit to obtain reasonable assurance about whether the financial statements and financial highlights are free of material misstatement. We were not engaged to perform an audit of the Trust's internal control over financial reporting. Our audits included consideration of internal control over financial reporting as a basis for designing audit procedures that are appropriate in the circumstances, but not for the purpose of expressing an opinion on the effectiveness of the Trust's internal control over financial reporting. Accordingly, we express no such opinion. An audit also includes examining, on a test basis, evidence supporting the amounts and disclosures in the financial statements and financial highlights, assessing the accounting principles used and significant estimates made by management, and evaluating the overall financial statement presentation. Our procedures included confirmation of securities owned as of December 31, 2012, by correspondence with the custodian and brokers. We believe that our audits provide a reasonable basis for our opinion.
In our opinion, the financial statements and financial highlights referred to above present fairly, in all material respects, the financial position of each of the respective funds constituting Mairs and Power Funds Trust at December 31, 2012, the results of their operations for the year then ended, the changes in their net assets for the periods indicated therein, and the financial highlights for the periods indicated therein, in conformity with U.S. generally accepted accounting principles.

Minneapolis, Minnesota
February 27, 2013
38
FUND EXPENSES (unaudited)
As a shareholder of the Funds, you incur ongoing expenses for the operation of the Funds (e.g., asset-based charges, such as investment management fees). The Funds are "no-load" mutual funds. As a result, shareholders pay no commissions, fees, or expenses associated with sales representatives or sales charges.
This example is intended to help you understand your ongoing costs (in dollars) of investing in the Funds and to compare these costs with the ongoing costs of investing in other mutual funds. The table below reports the Funds' expenses during the period July 1, 2012 through December 31, 2012 and includes the costs associated with a $1,000 investment.
Actual Expenses
The first line in the tables below may be used to estimate the actual expenses you paid over the reporting period. You can do this by dividing your account value by $1,000 and multiplying the result by the expense shown in the table below. For example, if your account value is $8,600, divided by $1,000 = $8.60. Multiply the result by the number in the first line under the heading entitled "Expenses Paid During Period." By doing this you can estimate the expenses you paid on your account during this period.
Hypothetical Example
The second line of the tables below provides information about hypothetical account values and hypothetical expenses based on the Funds' actual expenses and assumed returns of 5% per year before expenses, which are not the Funds' actual returns. The results may be used to provide you with a basis for comparing the ongoing costs of investing in the Funds with the ongoing costs of investing in other funds. To do so, compare these 5% hypothetical examples with the 5% hypothetical examples that appear in the shareholder reports of other funds. Please note that these hypothetical examples may not be used to estimate the actual ending account balances or expenses you paid during the period and will not help you determine the relative total costs of owning different funds.
Mairs & Power Growth Fund
| | | Beginning Account
Value 07/01/2012 | | Ending Account
Value 12/31/2012 | | Expenses Paid
During Period * | |
Actual return | | $ | 1,000.00 | | | $ | 1,092.30 | | | $ | 3.68 | | |
Hypothetical assumed 5% return | | $ | 1,000.00 | | | $ | 1,021.62 | | | $ | 3.56 | | |
* The Fund's expenses are equal to the Fund's annualized expense ratio for the most recent six-month period of 0.70%, multiplied by the average account value over the Fund's second fiscal half-year, multiplied by the number of days in the Fund's second fiscal half-year (184 days), divided by 366 days.
Mairs & Power Balanced Fund
| | | Beginning Account
Value 07/01/2012 | | Ending Account
Value 12/31/2012 | | Expenses Paid
During Period * | |
Actual return | | $ | 1,000.00 | | | $ | 1,081.50 | | | $ | 3.82 | | |
Hypothetical assumed 5% return | | $ | 1,000.00 | | | $ | 1,021.47 | | | $ | 3.71 | | |
* The Fund's expenses are equal to the Fund's annualized expense ratio for the most recent six-month period of 0.73%, multiplied by the average account value over the Fund's second fiscal half-year, multiplied by the number of days in the Fund's second fiscal half-year (184 days), divided by 366 days.
39
FUND EXPENSES (unaudited) (continued)
Mairs & Power Small Cap Fund
| | | Beginning Account
Value 07/01/2012 | | Ending Account
Value 12/31/2012 | | Expenses Paid
During Period * | |
Actual return | | $ | 1,000.00 | | | $ | 1,109.90 | | | $ | 6.63 | | |
Hypothetical assumed 5% return | | $ | 1,000.00 | | | $ | 1,018.85 | | | $ | 6.34 | | |
* The Fund's expenses are equal to the Fund's annualized expense ratio for the most recent six-month period of 1.25%, multiplied by the average account value over the Fund's second fiscal half-year, multiplied by the number of days in the Fund's second fiscal half-year (184 days), divided by 366 days.
40
Proxy Voting Policies and Procedures that the Trust uses to determine how to vote proxies relating to portfolio securities are available (i) without charge, upon request, by calling Shareholder Services at (800) 304-7404 and requesting a copy of the Statement of Additional Information (SAI) and (ii) on the Securities and Exchange Commission's (SEC's) website at www.sec.gov (access Form N-1A).
Information on how the Trust voted proxies relating to portfolio securities during the most recent 12-month period ended June 30 is available at www.mairsandpower.com and on the SEC's website at www.sec.gov.
DISCLOSURE OF PORTFOLIO HOLDINGS (unaudited)
The Trust files a complete schedule of portfolio holdings on Form N-Q for the first and third quarter-ends and on Form N-CSR for the second and fourth quarter-ends with the SEC. The Trust's Forms N-Q and N-CSR are available on the SEC's website at www.sec.gov. Forms N-Q and N-CSR may also be reviewed and copied at the SEC's Public Reference Room in Washington, D.C. Information on the operation of the Public Reference Room may be obtained by calling (800) SEC-0330.
The schedule of portfolio holdings is also printed in the Trust's semi-annual and annual reports to shareholders, which is available without charge by calling Shareholder Services at (800) 304-7404 or by visiting www.mairsandpower.com.
A complete copy of the Trust's portfolio holdings will also be available on or about 15 days following each quarter-end on the Funds' website at www.mairsandpower.com.
HOUSEHOLDING (unaudited)
In an effort to decrease costs, the Trust intends to reduce the number of duplicate Summary Prospectuses and Annual and Semi-Annual Reports you receive by sending only one copy of each to those addresses shared by two or more accounts and to shareholders reasonably believed to be from the same family or household. Once implemented, if you would like to discontinue householding for your accounts, please call Shareholder Services at (800) 304-7404 to request individual copies of these documents. Once notification to stop householding is received, the Trust will begin sending individual copies thirty days after receiving your request. This policy does not apply to account statements.
OTHER INFORMATION
This report is submitted for the general information of the shareholders of the Funds. It is not authorized for distribution to prospective investors unless accompanied or preceded by an effective prospectus. An investor should consider the Funds' investment objectives, risks and expenses carefully before investing or sending money. This and other important information can be found in the Funds' prospectus. To obtain a prospectus, please call Shareholder Services at (800) 304-7404 or visit the Funds' website at www.mairsandpower.com. Please read the prospectus carefully before investing.
This report includes forward-looking statements such as economic predictions and portfolio manager opinions. The statements are subject to change at any time based on market and other conditions. No predictions, forecasts, outlooks, expectations or beliefs are guaranteed.
41
Our Promise to You
As a shareholder of the Mairs & Power Mutual Funds (Funds), you share both personal and financial information with us. Your privacy is important to us, and we are dedicated to safeguarding your personal and financial information.
Information Provided by Shareholders
In the normal course of doing business, we typically obtain the following non-public personal information about our shareholders:
• Personal information regarding our shareholders' identity such as name, address and social security number;
• Information regarding fund transactions effected by us; and
• Shareholder financial information such as net-worth, assets, income, bank account information and account balances.
How We Manage and Protect Your Personal Information
We do not sell information about current or former shareholders to third parties, nor is it our practice to disclose such information to third parties unless requested or permitted to do so by a shareholder or shareholder representative or, if necessary, in order to process a transaction, service an account or as permitted by law. Additionally, we may share information with outside companies that perform administrative services for us. However, our arrangements with these service providers require them to treat your information as confidential.
In order to protect your personal information, we maintain physical, electronic and procedural safeguards to protect your personal information. Our Privacy Policy restricts the use of shareholder information and requires that it be held in strict confidence.
Shareholder Notifications
We are required by law to annually provide a notice describing our privacy policy. In addition, we will inform you promptly if there are changes to our policy. Please contact us at 1-800-304-7404 with questions about this notice.
42
TRUSTEES AND OFFICERS (unaudited) December 31, 2012
Information pertaining to the Trustees and Officers of the Trust is set forth below. The Statement of Additional Information includes additional information about the Trust's Trustees and is available without charge, upon request, by calling Shareholder Services at (800) 304-7404.
Name (Year of birth)
and Address1 | | Position(s)
Held with the
Trust and
Length of
Time Served2 | | Principal Occupation(s)
During Past Five Years | | Number of
Portfolios
in Fund
Complex
Overseen by
Trustee | | Other
Directorships
Held by Trustees
During Past
Five Years | |
INTERESTED PRINCIPAL OFFICERS WHO ARE TRUSTEES | |
William B. Frels (1939) | | President and Trustee since 1992 | | • Chairman of the Board of the Investment Adviser (2007 to present).
• Chief Executive Officer of the Investment Adviser (2007 to 2012). | | | 3 | | | Director, Mairs and Power Growth Fund, Inc. (1992 to 2011), Director, Mairs and Power Balanced Fund, Inc. (1992 to 2011) | |
Jon A. Theobald (1945) | | Secretary since 2003; Chief Compliance Officer from 2004 to 2012; Trustee since December 2012 | | • Chief Executive Officer of the Investment Adviser (2012 to present).
• President of the Investment Adviser (2007 to present).
• Chief Operating Officer of the Investment Adviser (2007 to 2012).
• Chief Compliance Officer of the Investment Adviser (2004 to 2012). | | | 3 | | | None | |
INTERESTED PRINCIPAL OFFICERS WHO ARE NOT TRUSTEES | |
Mark L. Henneman (1961) | | Vice President since 2009 | | • Executive Vice President of the Investment Adviser (2012 to present).
• Vice President of the Investment Adviser (2004 to 2012). | | | N/A | | | N/A | |
Ronald L. Kaliebe (1952) | | Vice President since 2009 | | • Vice President of the Investment Adviser (2001 to present). | | | N/A | | | N/A | |
Andrew R. Adams (1972) | | Vice President since 2011 | | • Vice President of the Investment Adviser (2006 to present). | | | N/A | | | N/A | |
Andrea C. Stimmel (1967) | | Treasurer since 2011; Chief Compliance Officer since 2012 | | • Director of Operations and Treasurer of the Investment Adviser (2008 to present).
• Chief Compliance Officer of the Investment Adviser (2012 to present).
• Accounting Manager of the Investment Adviser (2004 to 2008). | | | N/A | | | N/A | |
43
TRUSTEES AND OFFICERS (unaudited) (continued) December 31, 2012
Name (Year of birth)
and Address1 | | Position(s)
Held with the
Trust and
Length of
Time Served2 | | Principal Occupation(s)
During Past Five Years | | Number of
Portfolios
in Fund
Complex
Overseen by
Trustee | | Other
Directorships
Held by Trustees
During Past
Five Years | |
DISINTERESTED TRUSTEES | |
Norbert J. Conzemius (1941) | | Board Chair since February 2006; Trustee since 2000 | | • Retired Chief Executive Officer, Road Rescue Incorporated. | | | 3 | | | Director, Mairs and Power Growth Fund, Inc. (2000 to 2011), Director, Mairs and Power Balanced Fund, Inc. (2000 to 2011) | |
Mary Schmid
Daugherty (1958) | | Trustee since December 2010; Audit Committee Chair since December 2012 | | • Associate Professor, Department of Finance, University of St. Thomas (1987 to present). | | | 3 | | | Director, Mairs and Power Growth Fund, Inc. (2010 to 2011), Director, Mairs and Power Balanced Fund, Inc. (2010 to 2011) | |
Bert J. McKasy (1942) | | Trustee since September 2006 | | • Attorney, Lindquist & Vennum, P.L.L.P. (1994 to present). | | | 3 | | | Director, Mairs and Power Growth Fund, Inc. (2006 to 2011), Director, Mairs and Power Balanced Fund, Inc. (2006 to 2011) | |
1 Unless otherwise indicated, the mailing address of each officer and trustee is: W1520 First National Bank Building, 332 Minnesota Street, Saint Paul, MN 55101-1363.
2 Mr. Frels, Mr. Conzemius, Dr. Daugherty, and Mr. McKasy served as directors of Mairs and Power Growth Fund, Inc. and Mairs and Power Balanced Fund, Inc. (together, the "Predecessor Funds") prior to the reorganization of the Predecessor Funds into newly formed series of the Trust effective December 31, 2011. Positions listed in this column for trustees and officers prior to 2012 refer to their positions with the Predecessor Funds. Mr. Frels served as President of Mairs and Power Balanced Fund, Inc. from 1992-2011 and President of Mairs and Power Growth Fund, Inc. from 2004-2011. Each Trustee serves until his resignation or mandatory retirement age. Each officer is elected annually and serves until his successor has been duly elected and qualified.
44
This page is intentionally left blank.
MAIRS & POWER FUNDS TRUST
Mairs & Power Growth Fund, established 1958
Mairs & Power Balanced Fund, established 1961
Mairs & Power Small Cap Fund, established 2011
A No-Load Funds Trust
For Shareholder Services
Call (800) 304-7404
Or write to:
(via Regular Mail)
c/o U.S. Bancorp Fund Services, LLC
615 East Michigan Street
P. O. Box 701
Milwaukee, WI 53201-0701 | | (via Overnight or Express Mail)
c/o U.S. Bancorp Fund Services, LLC
3rd Floor
615 East Michigan Street
Milwaukee, WI 53202-0701 | |
For Fund literature and information, visit the Trust's website at:
www.mairsandpower.com
Investment Manager
Mairs & Power, Inc.
W1520 First National Bank Building
332 Minnesota Street
Saint Paul, MN 55101
Custodian
U.S. Bank, N.A.
Custody Operations
1555 North River Center Drive, Suite 302
Milwaukee, WI 53212
Distributor
ALPS Distributors, Inc.
1290 Broadway, Suite 1100
Denver, CO 80203
Mairs and Power, Inc.
c/o U.S. Bancorp Fund Services, LLC
3rd Floor
615 East Michigan Street
Milwaukee, WI 53202-0701
Item 2. Code of Ethics.
The registrant adopted its Code of Ethics for Principal Executive Officer and Principal Financial Officer on May 17, 2012. The Code of Ethics is attached as exhibit 12(a)(1) to this form.
Item 3. Audit Committee Financial Expert.
The registrant’s Board of Trustees has determined that Dr. Mary Schmid Daugherty, a member of the registrant’s Audit Committee, is an “audit committee financial expert” as defined in Item 3 of Form N-CSR. Dr. Daugherty is “independent” under the standards set forth in Item 3 of Form N-CSR.
Item 4. Principal Accountant Fees and Services.
Year Ended
December 31, | | (a)
Audit Fees | | (b)
Audit-
Related Fees | | (c)
Tax Fees | | (d)
All Other
Fees | |
| | | | | | | | | |
2011 | | $ | 25,000 | | None | | $ | 4,850 | | $ | 6,700 | |
2012 | | $ | 91,780 | | None | | $ | 19,350 | | $ | 2,500 | |
| (a) | Audit fees include amounts related to the audit of registrant’s annual financial statements and services normally provided by the accountant in connection with statutory and regulatory filings. |
| | |
| (c) | Tax fees include amounts related to tax advice and tax return preparation, compliance and reviews. |
| | |
| (d) | Tax consulting fee includes fees and expenses related to allowable tax consulting services. |
| | |
| (e)(1) | The registrant’s Audit Committee approves the engagement of the accountant before the accountant is engaged by the registrant and approved all audit and non audit services provided to the registrant. |
| | |
| (e)(2) | None of such services described in columns (b) through (d) were subject to a waiver of the pre-approval requirement pursuant to paragraph (c)(7)(i)(c) of Rule 2-01 of Regulation S-X. |
| | |
| (f) | Not applicable |
| | |
| (g) | The aggregate fees for non-audit services rendered by the registrant’s accountant to the registrant were $4,850 for the fiscal year ended December 31, 2011 and $19,350 for the fiscal year ended December 31, 2012. The aggregate fees for non-audit services rendered by the registrant’s accountant to the registrant’s investment adviser were $18,200 for the fiscal year ended December 31, 2011 and $19,850 for the fiscal year ended December 31, 2012. |
| | |
| (h) | The registrant’s Audit Committee has considered whether the provision of non-audit services by the registrant’s accountant to the registrant’s investment adviser is |
| | compatible with maintaining the accountant’s independence. |
Item 5. Audit Committee of Listed Registrants.
Not applicable to registrants who are not listed issuers (as defined in Rule 10A-3 under the Securities Exchange Act of 1934).
Item 6. Investments.
(a) Schedule of Investments is included as part of the report to shareholders filed under Item 1 of this Form
(b) Not Applicable.
Item 7. Disclosure of Proxy Voting Policies and Procedures for Closed-End Management Investment Companies.
Not applicable to open-end investment companies.
Item 8. Portfolio Managers of Closed-End Management Investment Companies.
Not applicable to open-end investment companies.
Item 9. Purchases of Equity Securities by Closed-End Management Investment Company and Affiliated Purchasers.
Not applicable to open-end investment companies.
Item 10. Submission of Matters to a Vote of Security Holders.
There has been no material change to the procedures by which shareholders may recommend nominees to the registrant’s board of directors.
Item 11. Controls and Procedures.
(a) The registrant’s principal executive officer and principal financial officer have evaluated the registrant’s disclosure controls and procedures as of a date within 90 days of the filing of this report and have concluded that the registrant’s disclosure controls and procedures were effective, as of that date, in ensuring that information required to be disclosed by the registrant in this Form N-CSR was recorded, processed, summarized and reported within the time period specified by the SEC’s rules and forms.
(b) There were no changes in the Registrant’s internal control over financial reporting (as defined in Rule 30a-3(d) under the Act) that occurred during the second fiscal quarter of the period covered by this report that has materially affected, or is reasonably likely to materially affect, the Registrant’s internal control over financial reporting.
Item 12. Exhibits.
(a) (1) Code of Ethics
Mairs and Power Funds Trust Code of Ethics for Principal Executive Officer and Principal Financial Officer.
Attached as exhibit 12(a)(1) to this form.
(2) Certifications required by Rule 30a-2(a) under the Investment Company Act of 1940.
Attached as exhibits 12(a)(2).1 and 12(a)(2).2 to this form.
(3) Any written solicitation to purchase securities under Rule 23c-1 under the Act sent or given during the period covered by the report by or on behalf of the registrant to 10 or more persons. Not applicable to open-end investment companies.
(b) Certifications pursuant to Section 906 of the Sarbanes-Oxley Act of 2002.
Attached as exhibit 12(b) to this form.
SIGNATURES
Pursuant to the requirements of the Securities Exchange Act of 1934 and the Investment Company Act of 1940, the registrant has duly caused this report to be signed on its behalf by the undersigned, thereunto duly authorized.
(Registrant) | Mairs and Power Funds Trust | | | | |
| | | | |
By (Signature and Title)* | /s/ William B. Frels | | | | |
| William B. Frels, President | | | | |
| Principal Executive Officer | | | | |
| | | | |
Date | 3/8/2013 | | | | |
| | | | | | | |
Pursuant to the requirements of the Securities Exchange Act of 1934 and the Investment Company Act of 1940, this report has been signed below by the following persons on behalf of the registrant and in the capacities and on the dates indicated.
By (Signature and Title)* | /s/ William B. Frels | | | | |
| William B. Frels, President | | | | |
| Principal Executive Officer | | | | |
| | | | |
Date | 3/8/2013 | | | | |
| | | | |
| | | | |
By (Signature and Title)* | /s/ Andrea C. Stimmel | | | | |
| Andrea C. Stimmel, Treasurer | | | | |
| Principal Financial Officer | | | | |
| | | | |
Date | 3/8/2013 | | | | |
| | | | | | |
* Print the name and title of each signing officer under his or her signature.