UNITED STATES
SECURITIES AND EXCHANGE COMMISSION
Washington, D.C. 20549
FORM N-CSR
CERTIFIED SHAREHOLDER REPORT OF REGISTERED
MANAGEMENT INVESTMENT COMPANIES
Investment Company Act file number | 811-22563 |
|
Mairs & Power Funds Trust |
(Exact name of registrant as specified in charter) |
|
332 Minnesota Street, Suite W1520, St. Paul, MN | | 55101 |
(Address of principal executive offices) | | (Zip code) |
|
Andrea C. Stimmel, Chief Compliance Officer & Treasurer, 332 Minnesota Street, Suite W1520, St. Paul, MN 55101 |
(Name and address of agent for service) |
|
Registrant’s telephone number, including area code: | 651-222-8478 | |
|
Date of fiscal year end: | December 31, 2014 | |
|
Date of reporting period: | December 31, 2014 | |
| | | | | | | | |
Item 1. Reports to Stockholders.

Investing for the long-term
ANNUAL REPORT
DECEMBER 31, 2014
- GROWTH FUND (MPGFX)
est. 1958
- BALANCED FUND (MAPOX)
est. 1961
- SMALL CAP FUND (MSCFX)
est. 2011
Mairs & Power W1520 First National Bank Building, 332 Minnesota Street, St. Paul, Minnesota 55101 www.mairsandpower.com
MAIRS & POWER FUNDS MARKET COMMENTARY (unaudited)
December 31, 2014
Investors could be forgiven if they looked back on 2014 as a year of mixed signals. Concerns about slowing growth in China, a possible recession across Europe and increasing tensions with Russia over their aggressive moves against Ukraine all contributed to market uncertainty. On the other hand, earnings continued to exceed expectations and the rapid decline in energy prices put a tailwind behind the U.S. economy, rewarding investors with the sixth year in a row of positive returns and the longest run since the bull market of the 1990s.
With crude oil down more than 40 percent for 2014 (and continuing to fall in the first weeks of the New Year), we believe this will be the biggest driver of the U.S. markets and economy over the next several quarters. GDP growth in the third quarter was revised upward to a healthy five percent annual rate, even before the stimulus of lower gas prices had fully kicked in, revealing continued momentum to the domestic economy as we enter 2015.
Such a rapid shift in the price of oil is, by definition, disruptive, creating winners and losers. As investors, we see both risks and opportunities as a result. A Goldman Sachs report recently estimated that the $1-plus drop in gasoline prices since last year will cut $125 billion from consumers' fuel bills over the coming twelve months. Assuming low gas prices hold for the next several quarters, we see a healthy economic stimulus benefitting consumer-facing companies such as retailers, restaurants and entertainment. We also see industrial manufacturers and transportation benefiting from lower raw material and fuel costs.
Investment opportunities are created at times like this for those willing to "go against the flow" and at Mairs & Power we attempt to see opportunities where others may not. For example, one of our portfolio holdings, Wisconsin-based flexible package manufacturer Bemis Company, announced that a veteran within the company would succeed its retiring CEO last summer. We began talking to the new management early on and heard the new CEO articulate a clear understanding of the company's opportunities and challenges as well as a good formula for success. In addition, we believe the company stands to benefit from falling oil prices. Ethylene prices, a key part of their raw material costs, have not yet responded, so the company can look forward to lower costs in the future. We feel the price advantage of flexible packaging relative to rigid packaging will accelerate the long-term shift away from cans and bottles to the more robust packaging that Bemis manufactures. As a result, we substantially increased our already established position. Once the rest of the market recognized what we had seen, the stock responded with a nearly 20% rise in the fourth quarter.
Future Outlook
We expect interest rates to begin rising sometime in 2015 which will have several effects that bear watching. We do not believe that a slight increase in rates would, by itself, end the current cycle. However, the advantage stocks have enjoyed over fixed income securities in the current low interest rate environment will be lessened as rates rise and investors find more places that offer yield.
The rate of growth for both revenue and earnings among small and large companies continues to be impressive. Furthermore, we believe that low energy prices will continue to benefit the U.S. economy over the next several quarters. When we look at the U.S. economy, we see no significant weaknesses. With the current cycle entering its seventh year and price to earnings ratios above their historic averages, we can expect positive, but muted equity returns for this year.
Gross Domestic Product (GDP) The monetary value of all the finished goods and services produced within a country's borders in a specific time period, though GDP is usually calculated on an annual basis.
Price to Earnings (P/E) Ratio is a common tool for comparing the prices of different common stocks and is calculated by dividing the current market price of a stock by the earnings per share. The P/E ratio is not a measure of future performance or growth.
1
MAIRS & POWER GROWTH FUND (unaudited)
To Our Shareholders: December 31, 2014
While the Growth Fund underperformed relative to its benchmarks for the full year, it finished on a strong note, outpacing those benchmarks in the fourth quarter. The Fund, for the quarter, was up 6.33% compared with 4.93% for the benchmark S&P 500 Total Return (TR) Index and 5.20% for the Dow Jones Industrial Average TR Index. For the full year, the Fund was up 8.12% compared with 13.69% for the S&P 500 TR Index and 10.04% for the Dow Jones Industrial Average TR Index.
The relative underperformance of small cap stocks compared with the large cap S&P 500 was one factor causing the Growth Fund, with a blend of small and large cap stocks, to lag its large cap benchmarks for the full year. The Fund's underweight position in energy related stocks – the worst performing sector in both periods – benefited fund performance for the quarter and the year. Overweight positions in the industrials and materials sectors were negative factors in Fund performance for the year.
The rapid decline in global oil prices in 2014 was a major factor in the Fund's performance for both the fourth quarter and full year. Declining raw material and fuel costs benefitted industrial manufacturers such as 3M Company, which hit an all-time high in December and was a top performing stock for the quarter. Similarly, the drop in gasoline prices funded increased consumer discretionary spending, benefitting companies such as Target Corp. which also hit an all-time high in December and was a top performer for both the quarter and the year. On the other hand, the oil-field service company Schlumberger, was among the poorest performers for the fourth quarter and full year 2014, declining to valuation levels not seen in more than a decade.
The Fund, consistent with its investment discipline, selectively trimmed positions and took profits in those stocks which we considered somewhat overvalued while adding to positions where current valuations do not fully represent a stock's long-term value.
MAIRS & POWER GROWTH FUND (MPGFX)
Top Performers
| Fourth Quarter (9/30/14 – 12/31/14) | | Year To Date (12/31/13 – 12/31/14) | |
CRAY INC. | | | 31.40 | % | | CORNING INC. | | | 28.68 | % | |
TARGET CORP. | | | 21.11 | % | | C.H. ROBINSON | | | |
BEMIS CO., INC. | | | 18.91 | % | | WORLDWIDE, INC. | | | 28.37 | % | |
MEDTRONIC, INC. | | | 16.55 | % | | MEDTRONIC, INC. | | | 25.81 | % | |
3M CO. | | | 15.98 | % | | VALSPAR CORP. | | | 21.31 | % | |
| | | | TARGET CORP. | | | 19.98 | % | |
Weak Performers
| Fourth Quarter (9/30/14 – 12/31/14) | | Year To Date (12/31/13 – 12/31/14) | |
SCHLUMBERGER, LTD. | | | -16.01 | % | | PENTAIR LTD. | | | -14.48 | % | |
ECOLAB, INC. | | | -8.98 | % | | H.B. FULLER CO. | | | -14.43 | % | |
ROCHE HOLDINGS LTD | | | -8.11 | % | | EMERSON ELECTRIC CO. | | | -12.04 | % | |
DONALDSON CO., INC | | | -4.92 | % | | DONALDSON CO., INC. | | | -11.11 | % | |
JOHNSON & JOHNSON | | | -1.90 | % | | SCHLUMBERGER, LTD. | | | -5.22 | % | |
Past performance is no guarantee of future results.
At regularly scheduled meetings in December, the Mairs and Power, Inc. Board of Directors and the Mairs & Power Funds Trust (Trust) Board of Trustees approved a number of changes to the company's executive ranks and to the officers and trustees of the Trust. Among the changes, Andrew Adams joins lead manager Mark Henneman as co-manager of the Growth Fund, effective January 1, 2015 and Mr. Henneman has been appointed
2
MAIRS & POWER GROWTH FUND (unaudited) (continued)
President of the Trust, effective December 31. These executive changes culminate a long-term succession plan which began several years ago in anticipation of William Frels' mandatory retirement on December 31, 2014 as co-manager of the Growth and Balanced Funds and Trustee and President of the Trust. The Mairs & Power Mutual Funds employ a deliberate and disciplined succession planning process to ensure consistency in the investment philosophy over time. Press releases detailing all the changes are available on the Mairs & Power website.
Shareholder Meeting Update
The Board of Trustees of the Trust has determined to hold a special meeting of shareholders on April 10, 2015. Two proposals will be presented to shareholders for approval. First, shareholders of the Trust will be asked to elect six nominees to serve as Trustees of the Trust, including the four incumbent Trustees. In addition, the Board of Trustees has nominated James D. Alt and Patrick A. Thiele to serve as Independent Trustees of the Trust, subject to approval by shareholders of the Trust at the special meeting to be held on April 10, 2015. Second, shareholders of the Balanced Fund will be asked to approve a revised investment objective for this Fund. Prior to the meeting, shareholders entitled to vote at the special meeting will receive proxy materials discussing these proposals in greater detail.
Mark L. Henneman
Lead Manager William B. Frels
Co-Manager | | Andrew R. Adams
Co-Manager – Effective January 1, 2015 | |
The Fund's investment objective, risks, charges and expenses must be considered carefully before investing. The summary prospectus or full prospectus contains this and other important information about the Fund, and they may be obtained by calling Shareholder Services at (800) 304-7404 or visiting www.mairsandpower.com. Read the summary prospectus or full prospectus carefully before investing.
All holdings in the portfolio are subject to change without notice and may or may not represent current or future portfolio composition. The mention of specific securities is not intended as a recommendation or an offer of a particular security, nor is it intended to be a solicitation for the purchase or sale of any security.
All investments have risks. The Growth Fund is designed for long-term investors. Equity investments are subject to market fluctuations, and the Fund's share price can fall because of weakness in the broad market, a particular industry, or specific holdings. Investments in small and midcap companies generally are more volatile. International investing risks include among others political, social or economic instability, difficulty in predicting international trade patterns, taxation and foreign trading practices, and greater fluctuations in price than United States corporations.
Diversification does not guarantee profit or protect against loss.
The S&P 500 Total Return Index is an unmanaged index of 500 common stocks which assumes reinvestment of dividends and is generally considered representative of the United States stock market. It is not possible to invest directly in an index.
Dow Jones Industrial Average Total Return Index is a price-weighted average of 30 significant stocks which assumes reinvestment of dividends traded on the New York Stock Exchange and the Nasdaq. It is not possible to invest directly in an index.
3
Mairs & Power Growth Fund
PERFORMANCE INFORMATION (unaudited) December 31, 2014
Ten years of investment performance (through December 31, 2014)
This chart illustrates the performance of a hypothetical $10,000 investment made in the Fund 10 years ago.
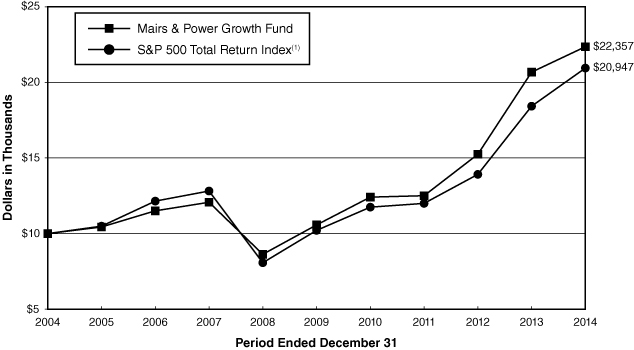
Average annual total returns for periods ended December 31, 2014 _
| | | 1 year | | 5 years | | 10 years | | 20 years | |
Mairs & Power Growth Fund | | | 8.12 | % | | | 16.16 | % | | | 8.38 | % | | | 13.10 | % | |
S&P 500 Total Return Index(1) | | | 13.69 | % | | | 15.45 | % | | | 7.67 | % | | | 9.85 | % | |
Performance data quoted represents past performance and does not guarantee future results. All performance information shown includes the reinvestment of dividend and capital gain distributions, but does not reflect the deduction of taxes that a shareholder would pay on Fund distributions or the redemption of Fund shares. The investment return and principal value of an investment will fluctuate so that an investor's shares, when redeemed, may be worth more or less than their original cost. Current performance of the Fund may be lower or higher than the performance quoted. For the most recent month-end performance figures, visit the Fund's website at www.mairsandpower.com or call Shareholder Services at (800) 304-7404.
(1) The S&P 500 Total Return Index is an unmanaged index of 500 common stocks which assumes reinvestment of dividends and is generally considered representative of the U.S. stock market. It is not possible to invest directly in an index.
4
Mairs & Power Growth Fund
FUND INFORMATION (unaudited) December 31, 2014
Portfolio Managers
Mark L. Henneman, lead manager since July 1, 2013, co-manager from January 1, 2006 through June 30, 2013
University of Minnesota, MBA Finance 1990
William B. Frels, co-manager from 1999-2004, and from July 1, 2013, lead manager from 2004-July 1, 2013
University of Wisconsin-Madison, BBA Finance 1962 Retired December 31, 2014
Andrew R. Adams, co-manager since January 1, 2015,
University of Wisconsin-Madison, BBA Finance and Mathematics 1994, MS Finance 1997
General Information
Fund Symbol | | | MPGFX | | |
Net Asset Value (NAV) Per Share | | $ | 116.20 | | |
Expense Ratio | | | 0.65 | % | |
Portfolio Turnover Rate | | | 6.42 | % | |
Sales Charge | | | None1 | | |
Fund Inception Year | | | 1958 | | |
Portfolio Composition
Top Ten Portfolio Holdings
(Percent of Total Net Assets) 2
US Bancorp | | | 4.2 | % | |
Ecolab Inc | | | 4.0 | | |
Valspar Corp/The | | | 3.9 | | |
| 3M Co | | | 3.9 | | |
Honeywell International Inc | | | 3.6 | | |
Target Corp | | | 3.5 | | |
Medtronic Inc | | | 3.5 | | |
Bemis Co Inc | | | 3.3 | | |
Toro Co/The | | | 3.2 | | |
Emerson Electric Co | | | 3.1 | | |
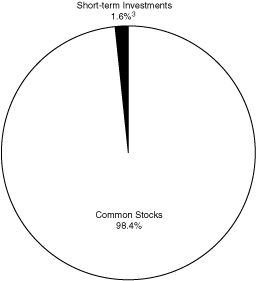
Portfolio Diversification
(Percent of Total Net Assets)
Common Stocks 98.4% | |
Industrials | | | 31.3 | % | |
Health Care | | | 17.7 | | |
Materials | | | 13.8 | | |
Information Technology | | | 11.4 | | |
Financials | | | 10.3 | | |
Consumer Staples | | | 5.2 | | |
Consumer Discretionary | | | 4.9 | | |
Energy | | | 3.1 | | |
Utilities | | | 0.7 | | |
Short-term Investments 1.6%3 | | | 1.6 | | |
| | | | 100.0 | % | |
1 Although the Fund is no-load, investment management fees and other expenses still apply.
2 All holdings in the portfolio are subject to change without notice and may or may not represent current or future portfolio composition. The mention of specific securities is not intended as a recommendation or offer for a particular security, nor is it intended to be a solicitation for the purchase or sale of any security.
3 Represents short-term investments and other assets and liabilities (net).
The Global Industry Classification Standard (GICS®) was developed by and/or is the exclusive property of MSCI, Inc. and Standard & Poor's Financial Services LLC ("S&P"). GICS is a service mark of MSCI and S&P and has been licensed for use by Mairs and Power, Inc.
5
Mairs & Power Growth Fund
SCHEDULE OF INVESTMENTS December 31, 2014
Shares | | Security Description | | Fair Value | |
| | | COMMON STOCKS 98.4% | |
| | | CONSUMER DISCRETIONARY 4.9% | |
| | 2,000,000 | | | Target Corp | | $ | 151,820,000 | | |
| | 640,000 | | | Walt Disney Co/The | | | 60,281,600 | | |
| | | | 212,101,600 | | |
| | | CONSUMER STAPLES 5.2% | |
| | 2,020,000 | | | General Mills Inc | | | 107,726,600 | | |
| | 2,230,000 | | | Hormel Foods Corp | | | 116,183,000 | | |
| | | | 223,909,600 | | |
| | | ENERGY 3.1% | |
| | 1,530,000 | | | Schlumberger Ltd (a) | | | 130,677,300 | | |
| | | FINANCIALS 10.3% | |
| | 1,910,000 | | | Associated Banc-Corp | | | 35,583,300 | | |
| | 1,730,000 | | | Principal Financial Group Inc | | | 89,856,200 | | |
| | 1,360,000 | | | TCF Financial Corp | | | 21,610,400 | | |
| | 300,000 | | | Travelers Cos Inc/The | | | 31,755,000 | | |
| | 4,000,000 | | | US Bancorp | | | 179,800,000 | | |
| | 1,550,000 | | | Wells Fargo & Co | | | 84,971,000 | | |
| | | | 443,575,900 | | |
| | | HEALTH CARE 17.7% | |
| | 1,450,000 | | | Baxter International Inc | | | 106,270,500 | | |
| | 870,613 | | | Bio-Techne Corp | | | 80,444,641 | | |
| | 1,200,000 | | | Johnson & Johnson | | | 125,484,000 | | |
| | 2,080,000 | | | Medtronic Inc | | | 150,176,000 | | |
| | 950,000 | | | Patterson Cos Inc | | | 45,695,000 | | |
| | 1,500,000 | | | Pfizer Inc | | | 46,725,000 | | |
| | 1,760,000 | | | Roche Holding AG ADR (e) | | | 59,822,400 | | |
| | 1,580,000 | | | St Jude Medical Inc | | | 102,747,400 | | |
| | 370,300 | | | Zimmer Holdings Inc | | | 41,999,426 | | |
| | | | 759,364,367 | | |
| | | INDUSTRIALS 31.3% | |
| | 1,030,000 | | | 3M Co | | | 169,249,600 | | |
| | 1,400,000 | | | CH Robinson Worldwide Inc | | | 104,846,000 | | |
| | 283,853 | | | Deluxe Corp | | | 17,669,849 | | |
| | 3,390,000 | | | Donaldson Co Inc | | | 130,955,700 | | |
| | 2,160,000 | | | Emerson Electric Co | | | 133,336,800 | | |
| | 1,450,000 | | | Fastenal Co | | | 68,962,000 | | |
| | 422,192 | | | G&K Services Inc, Class A | | | 29,912,303 | | |
| | 540,000 | | | Generac Holdings Inc (b) | | | 25,250,400 | | |
6
Mairs & Power Growth Fund
SCHEDULE OF INVESTMENTS (continued) December 31, 2014
Shares | | Security Description | | Fair Value | |
| | | COMMON STOCKS (continued) | |
| | | INDUSTRIALS (continued) | |
| | 3,040,000 | | | General Electric Co | | $ | 76,820,800 | | |
| | 1,450,000 | | | Graco Inc | | | 116,261,000 | | |
| | 1,550,000 | | | Honeywell International Inc | | | 154,876,000 | | |
| | 1,660,000 | | | Pentair PLC (a) | | | 110,257,200 | | |
| | 2,126,149 | | | Toro Co/The | | | 135,669,568 | | |
| | 640,000 | | | United Parcel Service Inc, Class B | | | 71,148,800 | | |
| | | | 1,345,216,020 | | |
| | | INFORMATION TECHNOLOGY 11.4% | |
| | 784,299 | | | Badger Meter Inc (d) | | | 46,548,146 | | |
| | 1,910,000 | | | Corning Inc | | | 43,796,300 | | |
| | 1,715,152 | | | Cray Inc (b) | | | 59,138,441 | | |
| | 1,190,000 | | | Fiserv Inc (b) | | | 84,454,300 | | |
| | 1,071,025 | | | MTS Systems Corp (d) | | | 80,359,006 | | |
| | 486,185 | | | NVE Corp (b) (d) | | | 34,417,036 | | |
| | 940,000 | | | QUALCOMM Inc | | | 69,870,200 | | |
| | 3,910,000 | | | Western Union Co/The | | | 70,028,100 | | |
| | | | 488,611,529 | | |
| | | MATERIALS 13.8% | |
| | 3,170,000 | | | Bemis Co Inc | | | 143,315,700 | | |
| | 1,639,999 | | | Ecolab Inc | | | 171,412,695 | | |
| | 2,481,600 | | | HB Fuller Co | | | 110,505,648 | | |
| | 1,960,000 | | | Valspar Corp/The | | | 169,500,800 | | |
| | | | 594,734,843 | | |
| | | UTILITIES 0.7% | |
| | 1,329,400 | | | MDU Resources Group Inc | | | 31,240,900 | | |
| | | | | TOTAL COMMON STOCKS
(cost $2,167,772,405) | | $ | 4,229,432,059
| | |
| | | SHORT-TERM INVESTMENTS 1.5% | |
| 63,500,785
| | | First American Prime Obligations Fund, Class Z, 0.02% (c)
(cost $63,500,785) | | $ | 63,500,785
| | |
| | | | | TOTAL INVESTMENTS 99.9%
(cost $2,231,273,190) | | $ | 4,292,932,844
| | |
| | | | | OTHER ASSETS AND LIABILITIES (NET) 0.1% | | | 4,542,447 | | |
| | | | | TOTAL NET ASSETS 100.0% | | $ | 4,297,475,291 | | |
7
Mairs & Power Growth Fund
SCHEDULE OF INVESTMENTS (continued) December 31, 2014
(a) Foreign security denominated in U.S. dollars. As of December 31, 2014, these securities represented $240,934,500 or 5.6% of total net assets.
(b) Non-income producing.
(c) The rate quoted is the annualized seven-day effective yield as of December 31, 2014.
(d) Affiliated company.
(e) American Depositary Receipt.
The Global Industry Classification Standard (GICS®) was developed by and/or is the exclusive property of MSCI, Inc. and Standard & Poor's Financial Services LLC ("S&P"). GICS is a service mark of MSCI and S&P and has been licensed for use by Mairs and Power, Inc.
See accompanying Notes to Financial Statements.
8
MAIRS & POWER BALANCED FUND (unaudited)
To Our Shareholders: December 31, 2014
The Balanced Fund performance was ahead of its benchmark composite (60% S&P 500 Total Return (TR) Index and 40% Barclays Government/Credit Bond Index) for the quarter while it underperformed for the full year. The Fund was up 3.80% and 8.04% for the quarter and full year, respectively, while the benchmark composite rose 3.68% and 10.63% in each period.
The relative underperformance of small, mid and medium cap stocks compared with the large cap stocks of the S&P 500 was one factor that caused the Balanced Fund, with a blend of small, mid, medium and large cap stocks, to lag the benchmark for the full year. The rapid decline in global oil prices in 2014 was a major factor in the Fund's performance for both the fourth quarter and full year. The Fund's overweight position in energy related stocks – the worst performing sector in both periods – was a negative factor in Fund performance for the quarter and the year. An overweight position in industrials and underweight position in the information technology sector were also negative factors in Fund performance for the year.
The market became convinced that the merger of Medtronic and Covidien would go through and Medtronic was among the top performers for both the quarter and the year. Declining raw material and fuel costs benefitted industrial manufacturers such as 3M Company, which hit an all-time high in December and was a top performing stock for the quarter. Similarly, the drop in gasoline prices funded increased consumer discretionary spending, benefitting companies such as Target Corp. which also hit an all-time high in December and was also a top performer for the quarter. On the other hand, energy-related stocks such as Schlumberger and Exxon were among the poorest performers in the Fund for the fourth quarter and full year 2014, declining to valuation levels not seen in more than a decade.
MAIRS & POWER BALANCED FUND (MAPOX)
Top Performers
| Fourth Quarter (9/30/14 – 12/31/14) | | Year To Date (12/31/13 – 12/31/14) | |
TARGET CORP. | | | 21.11 | % | | ELI LILLY & CO. | | | 35.27 | % | |
MEDTRONIC, INC. | | | 16.55 | % | | CORNING INC. | | | 28.68 | % | |
| 3M COMPANY | | | 15.98 | % | | C.H. ROBINSON | | | | | |
UNITED PARCEL SERVICE, INC., | | | | | | WORLDWIDE, INC. | | | 28.37 | % | |
CLASS B | | | 13.10 | % | | HOME DEPOT, INC. | | | 27.48 | % | |
DELUXE CORP. | | | 12.85 | % | | MEDTRONIC, INC. | | | 25.81 | % | |
Weak Performers
| Fourth Quarter (9/30/14 – 12/31/14) | | Year To Date (12/31/13 – 12/31/14) | |
SCHLUMBERGER, LTD. | | | -16.01 | % | | PENTAIR LTD. | | | -14.48 | % | |
MDU RESOURCES GROUP, INC. | | | -15.50 | % | | EMERSON ELECTRIC CO. | | | -12.04 | % | |
INTERNATIONAL BUSINESS | | | | | | GENERAL ELECTRIC CO. | | | -9.85 | % | |
MACHINES CORP. | | | -15.48 | % | | EXXON MOBIL CORP. | | | -8.65 | % | |
CONOCOPHILLIPS | | | -9.75 | % | | SCHLUMBERGER, LTD. | | | -5.22 | % | |
EXXON MOBIL CORP. | | | -1.70 | % | | | | | |
Past performance is no guarantee of future results.
While the Fund did not hold any U.S. Treasuries, a very strong performing sector of bonds for the year, it did have exposure to agencies and corporate bonds. As a result of the longer duration of high quality agencies and corporate contributions the portfolio had positive returns in 2014. The Fund is currently very selective on the
9
MAIRS & POWER BALANCED FUND (unaudited) (continued)
fixed income side, viewing the market as fully priced and is looking to add positions on the equity side where current valuations do not fully represent a stock's long-term value.
At regularly scheduled meetings in December, the Mairs and Power, Inc. Board of Directors and the Mairs & Power Funds Trust (Trust) Board of Trustees approved a number of changes to the company's executive ranks and to the officers and trustees of the Trust. Among the changes, Kevin Earley joins lead manager Ronald Kaliebe as co-manager of the Balanced Fund, effective January 1, 2015. Mark Henneman was also appointed President of the Trust, effective December 31, 2014. These executive changes culminate a long-term succession plan which began several years ago in anticipation of William Frels' mandatory retirement on December 31, 2014 as co-manager of the Growth and Balanced Funds and Trustee and President of the Trust. The Mairs & Power Mutual Funds employ a deliberate and disciplined succession planning process to ensure consistency in the investment philosophy over time. Press releases detailing all the changes are available on the Mairs & Power website.
Shareholder Meeting Update
The Board of Trustees of the Trust has determined to hold a special meeting of shareholders on April 10, 2015. Two proposals will be presented to shareholders for approval. First, shareholders of the Trust will be asked to elect six nominees to serve as Trustees of the Trust, including the four incumbent Trustees. In addition, the Board of Trustees has nominated James D. Alt and Patrick A. Thiele to serve as Independent Trustees of the Trust, subject to approval by shareholders of the Trust at the special meeting to be held on April 10, 2015. Second, shareholders of the Balanced Fund will be asked to approve a revised investment objective for this Fund. Prior to the meeting, shareholders entitled to vote at the special meeting will receive proxy materials discussing these proposals in greater detail.
Ronald L. Kaliebe
Lead Manager | | William B. Frels
Co-Manager | | Kevin V. Earley
Co-Manager – Effective January 1, 2015 | |
The Fund's investment objective, risks, charges and expenses must be considered carefully before investing. The summary prospectus or full prospectus contains this and other important information about the Fund, and they may be obtained by calling Shareholder Services at (800) 304-7404 or visiting www.mairsandpower.com. Read the summary prospectus or full prospectus carefully before investing.
All holdings in the portfolio are subject to change without notice and may or may not represent current or future portfolio composition. The mention of specific securities is not intended as a recommendation or an offer of a particular security, nor is it intended to be a solicitation for the purchase or sale of any security.
All investments have risks. The Balanced Fund is designed for long-term investors. Equity investments are subject to market fluctuations, and the Fund's share price can fall because of weakness in the broad market, a particular industry, or specific holdings. Investments in small and midcap companies generally are more volatile. International investing risks include among others political, social or economic instability, difficulty in predicting international trade patterns, taxation and foreign trading practices, and greater fluctuations in price than United States corporations.
Diversification does not guarantee profit or protect against loss.
Barclays Government/Credit Bond Index is composed of high-quality, investment-grade United States government and corporate fixed income securities with maturities greater than one year. It is not possible to invest directly in an index.
The S&P 500 Total Return Index is an unmanaged index of 500 common stocks which assumes reinvestment of dividends and is generally considered representative of the United States stock market. It is not possible to invest directly in an index.
10
Mairs & Power Balanced Fund
PERFORMANCE INFORMATION (unaudited) December 31, 2014
Ten years of investment performance (through December 31, 2014)
This chart illustrates the performance of a hypothetical $10,000 investment made in the Fund 10 years ago.
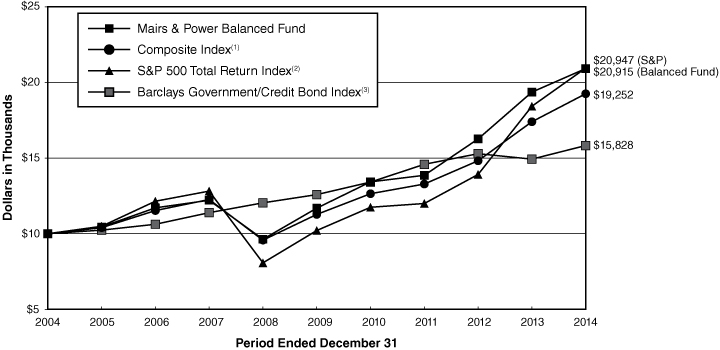
Average annual total returns for periods ended December 31, 2014
| | | 1 year | | 5 years | | 10 years | | 20 years | |
Mairs & Power Balanced Fund | | | 8.04 | % | | | 12.34 | % | | | 7.66 | % | | | 10.37 | % | |
Composite Index(1) | | | 10.63 | % | | | 11.30 | % | | | 6.77 | % | | | 8.72 | % | |
S&P 500 Total Return Index(2) | | | 13.69 | % | | | 15.45 | % | | | 7.67 | % | | | 9.85 | % | |
Barclays Government/
Credit Bond Index(3) | | | 6.01 | % | | | 4.69 | % | | | 4.70 | % | | | 6.24 | % | |
Performance data quoted represents past performance and does not guarantee future results. All performance information shown includes the reinvestment of dividend and capital gain distributions, but does not reflect the deduction of taxes that a shareholder would pay on Fund distributions or the redemption of Fund shares. The investment return and principal value of an investment will fluctuate so that an investor's shares, when redeemed, may be worth more or less than their original cost. Current performance of the Fund may be lower or higher than the performance quoted. For the most recent month-end performance figures, visit the Fund's website at www.mairsandpower.com or call Shareholder Services at (800) 304-7404.
(1) The Composite Index reflects an unmanaged portfolio comprised of 60% of the S&P 500 Index and 40% of the Barclays Government/Credit Bond Index. It is not possible to invest directly in an index.
(2) The S&P 500 Total Return Index is an unmanaged index of 500 common stocks which assumes reinvestment of dividends that is generally considered representative of the U.S. stock market. It is not possible to invest directly in an index.
(3) The Barclays Government/Credit Bond Index is composed of high-quality, investment-grade United States government and corporate fixed income securities with maturities greater than one year. It is not possible to invest directly in an index.
11
Mairs & Power Balanced Fund
FUND INFORMATION (unaudited) December 31, 2014
Portfolio Managers
Ronald L. Kaliebe, lead manager since July 1, 2013,
co-manager from January 1, 2006 through June 30, 2013
University of Wisconsin-Madison, MBA Finance 1980
William B. Frels, co-manager since July 1, 2013, lead manager from 1992 – July 1, 2013
University of Wisconsin-Madison, BBA Finance 1962 Retired December 31, 2014
Kevin V. Earley, co-manager since January 1, 2015,
University of Minnesota, MBA Finance 1990
General Information
Fund Symbol | | MAPOX | |
Net Asset Value (NAV) Per Share | | $ | 86.79 | | |
Expense Ratio | | | 0.72 | % | |
Portfolio Turnover Rate | | | 4.53 | % | |
Sales Charge | | | None1 | | |
Fund Inception Year | | | 1961 | | |
Portfolio Composition
Top Ten Common Stock Holdings
(Percent of Total Net Assets) 2
United Parcel Service Inc, Class B | | | 3.0 | % | |
Medtronic Inc | | | 2.5 | | |
Exxon Mobil Corp | | | 2.5 | | |
Target Corp | | | 2.4 | | |
Emerson Electric Co | | | 2.2 | | |
Deluxe Corp | | | 2.2 | | |
US Bancorp | | | 2.1 | | |
| 3M Co | | | 2.0 | | |
Schlumberger Ltd | | | 1.9 | | |
Principal Financial Group Inc | | | 1.8 | | |
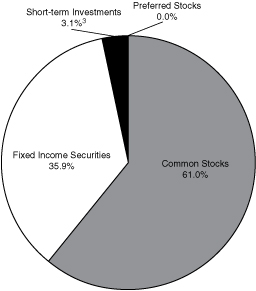
Portfolio Diversification
(Percent of Total Net Assets)
Fixed Income Securities 35.9% | |
Corporate Bonds | | | 28.1 | % | |
Federal Agency Obligations | | | 5.5 | | |
Asset Backed Securities | | | 1.2 | | |
Preferred Securities | | | 1.1 | | |
Common Stocks 61.0% | |
Industrials | | | 16.1 | | |
Health Care | | | 10.7 | | |
Financials | | | 8.7 | | |
Energy | | | 6.7 | | |
Information Technology | | | 5.3 | | |
Materials | | | 4.7 | | |
Consumer Discretionary | | | 3.7 | | |
Consumer Staples | | | 2.8 | | |
Utilities | | | 2.3 | | |
Preferred Stocks 0.0% | | | 0.0 | | |
Short-term Investments 3.1%3 | | | 3.1 | | |
| | | | 100.0 | % | |
1 Although the Fund is no-load, investment management fees and other expenses still apply.
2 All holdings in the portfolio are subject to change without notice and may or may not represent current or future portfolio composition. The mention of specific securities is not intended as a recommendation or offer for a particular security, nor is it intended to be a solicitation for the purchase or sale of any security.
3 Represents short-term investments and other assets and liabilities (net).
The Global Industry Classification Standard (GICS®) was developed by and/or is the exclusive property of MSCI, Inc. and Standard & Poor's Financial Services LLC ("S&P"). GICS is a service mark of MSCI and S&P and has been licensed for use by Mairs and Power, Inc.
12
Mairs & Power Balanced Fund
SCHEDULE OF INVESTMENTS December 31, 2014
Par Value | | Security Description | | Fair Value | |
| | | FIXED INCOME SECURITIES 35.9% | |
| | | FEDERAL AGENCY OBLIGATIONS 5.5% | |
$ | 1,000,000 | | | Federal National Mortgage Association | | | 3.250 | % | | 03/27/28 | | $ | 994,062 | | |
| | 875,000 | | | Federal Farm Credit Banks | | | 3.450 | % | | 06/05/28 | | | 875,209 | | |
| | 1,000,000 | | | Federal Farm Credit Banks | | | 3.700 | % | | 06/20/28 | | | 1,000,284 | | |
| | 1,000,000 | | | Federal Farm Credit Banks | | | 3.500 | % | | 06/23/28 | | | 994,778 | | |
| | 2,000,000 | | | Federal Farm Credit Banks | | | 3.600 | % | | 12/04/28 | | | 1,990,640 | | |
| | 400,000 | | | Federal Home Loan Banks | | | 3.740 | % | | 09/04/29 | | | 400,933 | | |
| | 500,000 | | | Federal Home Loan Banks | | | 3.480 | % | | 10/29/29 | | | 501,424 | | |
| | 1,000,000 | | | Federal Home Loan Banks | | | 3.620 | % | | 11/21/29 | | | 1,001,905 | | |
| | 500,000 | | | Federal Home Loan Banks | | | 3.625 | % | | 11/26/29 | | | 502,161 | | |
| | 3,000,000 | | | Federal Farm Credit Banks | | | 3.680 | % | | 12/03/29 | | | 3,000,777 | | |
| | 1,400,000 | | | Federal Home Loan Banks | | | 3.650 | % | | 12/19/29 | | | 1,391,246 | | |
| | 1,000,000 | | | Federal Farm Credit Banks | | | 3.590 | % | | 12/24/29 | | | 999,561 | | |
| | 1,084,000 | | | Federal Farm Credit Banks | | | 3.200 | % | | 04/24/30 | | | 1,069,864 | | |
| | 750,000 | | | Federal National Mortgage Association | | | 3.750 | % | | 03/22/32 | | | 745,558 | | |
| | 1,000,000 | | | Federal Home Loan Banks | | | 3.300 | % | | 05/07/32 | | | 986,531 | | |
| | 1,000,000 | | | Federal National Mortgage Association | | | 3.500 | % | | 09/10/32 | | | 993,358 | | |
| | 500,000 | | | Federal National Mortgage Association | | | 3.400 | % | | 09/27/32 | | | 492,539 | | |
| | 1,000,000 | | | Federal Home Loan Banks | | | 3.180 | % | | 12/06/32 | | | 955,577 | | |
| | 1,000,000 | | | Federal Home Loan Banks | | | 3.300 | % | | 01/18/33 | | | 984,558 | | |
| | 1,000,000 | | | Federal Home Loan Banks | | | 3.250 | % | | 01/18/33 | | | 961,908 | | |
| | 3,000,000 | | | Federal Farm Credit Banks | | | 3.480 | % | | 02/07/33 | | | 2,968,653 | | |
| | 1,000,000 | | | Federal Home Loan Banks | | | 3.230 | % | | 02/07/33 | | | 947,422 | | |
| | 2,000,000 | | | Federal Home Loan Banks | | | 3.500 | % | | 02/22/33 | | | 1,984,784 | | |
| | 1,000,000 | | | Federal Farm Credit Banks | | | 3.500 | % | | 02/28/33 | | | 994,588 | | |
| | 1,500,000 | | | Federal National Mortgage Association | | | 3.500 | % | | 03/07/33 | | | 1,477,667 | | |
| | 500,000 | | | Federal National Mortgage Association | | | 3.250 | % | | 04/29/33 | | | 492,823 | | |
| | 1,000,000 | | | Federal Home Loan Banks | | | 3.300 | % | | 05/09/33 | | | 959,463 | | |
| | 500,000 | | | Federal National Mortgage Association | | | 3.430 | % | | 05/27/33 | | | 489,485 | | |
| | 500,000 | | | Federal Home Loan Banks | | | 3.730 | % | | 07/01/33 | | | 500,131 | | |
| | 500,000 | | | Federal Home Loan Banks | | | 4.700 | % | | 07/25/33 | | | 524,974 | | |
| | 840,000 | | | Federal Farm Credit Banks | | | 3.125 | % | | 12/05/33 | | | 838,708 | | |
| | 1,000,000 | | | Federal Farm Credit Banks | | | 4.375 | % | | 02/21/34 | | | 1,046,104 | | |
| | 1,250,000 | | | Federal Home Loan Banks | | | 4.050 | % | | 07/14/34 | | | 1,261,077 | | |
| | 2,500,000 | | | Federal Home Loan Banks | | | 4.000 | % | | 08/04/34 | | | 2,504,490 | | |
| | 1,000,000 | | | Federal Farm Credit Banks | | | 3.980 | % | | 08/14/34 | | | 1,006,465 | | |
| | 1,000,000 | | | Federal Home Loan Banks | | | 3.840 | % | | 12/26/34 | | | 997,280 | | |
| | | | 39,836,987 | | |
13
Mairs & Power Balanced Fund
SCHEDULE OF INVESTMENTS (continued) December 31, 2014
Par Value | | Security Description | | Fair Value | |
| | | FIXED INCOME SECURITIES (continued) | |
| | | CORPORATE BONDS 28.1% | |
| | | CONSUMER DISCRETIONARY 2.8% | |
$ | 250,000 | | | Maytag Corp | | | 5.000 | % | | 05/15/15 | | $ | 253,440 | | |
| | 500,000 | | | Gannett Co Inc | | | 6.375 | % | | 09/01/15 | | | 515,000 | | |
| | 340,000 | | | Johnson Controls Inc | | | 5.500 | % | | 01/15/16 | | | 356,057 | | |
| | 250,000 | | | ServiceMaster Co LLC/The | | | 7.100 | % | | 03/01/18 | | | 255,000 | | |
| | 500,000 | | | Best Buy Co Inc | | | 5.000 | % | | 08/01/18 | | | 517,188 | | |
| | 1,000,000 | | | Ford Motor Credit Co LLC | | | 3.000 | % | | 12/20/18 | | | 1,009,083 | | |
| | 500,000 | | | Ford Motor Credit Co LLC | | | 3.450 | % | | 08/20/20 | | | 494,541 | | |
| | 1,000,000 | | | Time Warner Cable Inc | | | 4.125 | % | | 02/15/21 | | | 1,070,190 | | |
| | 1,000,000 | | | Best Buy Co Inc | | | 5.500 | % | | 03/15/21 | | | 1,040,000 | | |
| | 1,500,000 | | | Time Warner Cable Inc | | | 4.000 | % | | 09/01/21 | | | 1,596,438 | | |
| | 555,000 | | | Kohl's Corp | | | 4.000 | % | | 11/01/21 | | | 576,316 | | |
| | 500,000 | | | Whirlpool Corp | | | 4.700 | % | | 06/01/22 | | | 548,077 | | |
| | 1,750,000 | | | Newell Rubbermaid Inc | | | 4.000 | % | | 06/15/22 | | | 1,813,821 | | |
| | 1,000,000 | | | Block Financial LLC | | | 5.500 | % | | 11/01/22 | | | 1,098,709 | | |
| | 318,000 | | | Darden Restaurants Inc | | | 3.350 | % | | 11/01/22 | | | 294,424 | | |
| | 1,000,000 | | | Staples Inc | | | 4.375 | % | | 01/12/23 | | | 1,002,726 | | |
| | 2,000,000 | | | Kohl's Corp | | | 3.250 | % | | 02/01/23 | | | 1,947,372 | | |
| | 1,000,000 | | | Wyndham Worldwide Corp | | | 3.900 | % | | 03/01/23 | | | 986,636 | | |
| | 500,000 | | | Hyatt Hotels Corp | | | 3.375 | % | | 07/15/23 | | | 490,273 | | |
| | 1,000,000 | | | Ford Motor Credit Co LLC | | | 4.000 | % | | 04/20/24 | | | 993,523 | | |
| | 1,000,000 | | | Metropolitan Opera Association Inc | | | 4.349 | % | | 10/01/32 | | | 1,062,637 | | |
| | 2,000,000 | | | Comcast Corp | | | 4.250 | % | | 01/15/33 | | | 2,117,854 | | |
| | | | 20,039,305 | | |
| | | CONSUMER STAPLES 1.2% | |
| | 222,000 | | | SUPERVALU Inc | | | 8.000 | % | | 05/01/16 | | | 238,650 | | |
| | 525,000 | | | Cargill Inc (e) | | | 6.000 | % | | 11/27/17 | | | 586,676 | | |
| | 1,000,000 | | | Avon Products Inc | | | 4.200 | % | | 07/15/18 | | | 915,000 | | |
| | 1,000,000 | | | Safeway Inc | | | 3.950 | % | | 08/15/20 | | | 1,010,955 | | |
| | 500,000 | | | Safeway Inc | | | 4.750 | % | | 12/01/21 | | | 506,248 | | |
| | 1,274,000 | | | Avon Products Inc (d) | | | 5.000 | % | | 03/15/23 | | | 1,137,045 | | |
| | 2,949,000 | | | Land O'Lakes Capital Trust I (e) | | | 7.450 | % | | 03/15/28 | | | 3,052,215 | | |
| | 500,000 | | | Altria Group Inc | | | 4.250 | % | | 08/09/42 | | | 479,155 | | |
| | 1,000,000 | | | Cargill Inc (e) | | | 4.100 | % | | 11/01/42 | | | 1,010,668 | | |
| | | | 8,936,612 | | |
| | | ENERGY 2.1% | |
| | 500,000 | | | Anadarko Petroleum Corp | | | 5.950 | % | | 09/15/16 | | | 534,690 | | |
| | 250,000 | | | ConocoPhillips | | | 6.650 | % | | 07/15/18 | | | 288,687 | | |
14
Mairs & Power Balanced Fund
SCHEDULE OF INVESTMENTS (continued) December 31, 2014
Par Value | | Security Description | | Fair Value | |
| | | FIXED INCOME SECURITIES (continued) | |
| | | CORPORATE BONDS (continued) | |
| | | ENERGY (continued) | |
$ | 1,500,000 | | | Murphy Oil Corp | | | 4.000 | % | | 06/01/22 | | $ | 1,378,881 | | |
| | 500,000 | | | Western Gas Partners LP | | | 4.000 | % | | 07/01/22 | | | 506,801 | | |
| | 3,000,000 | | | Transocean Inc (a) | | | 3.800 | % | | 10/15/22 | | | 2,430,975 | | |
| | 1,000,000 | | | Murphy Oil Corp | | | 3.700 | % | | 12/01/22 | | | 897,513 | | |
| | 1,500,000 | | | Sunoco Logistics Partners Operations LP | | | 3.450 | % | | 01/15/23 | | | 1,438,466 | | |
| | 3,000,000 | | | Williams Cos Inc/The | | | 3.700 | % | | 01/15/23 | | | 2,694,258 | | |
| | 1,945,000 | | | Boardwalk Pipelines LP | | | 3.375 | % | | 02/01/23 | | | 1,771,837 | | |
| | 575,000 | | | DCP Midstream Operating LP | | | 3.875 | % | | 03/15/23 | | | 550,238 | | |
| | 1,000,000 | | | Diamond Offshore Drilling Inc | | | 3.450 | % | | 11/01/23 | | | 928,091 | | |
| | 500,000 | | | Kinder Morgan Energy Partners LP | | | 4.250 | % | | 09/01/24 | | | 501,005 | | |
| | 500,000 | | | Global Marine Inc | | | 7.000 | % | | 06/01/28 | | | 450,117 | | |
| | 500,000 | | | Murphy Oil Corp | | | 5.125 | % | | 12/01/42 | | | 425,226 | | |
| | 500,000 | | | Apache Corp | | | 4.250 | % | | 01/15/44 | | | 436,968 | | |
| | | | 15,233,753 | | |
| | | FINANCIALS 10.0% | |
| | 500,000 | | | Principal Life Global Funding I (e) | | | 5.050 | % | | 03/15/15 | | | 504,458 | | |
| | 500,000 | | | M&I Marshall & Ilsley Bank | | | 4.850 | % | | 06/16/15 | | | 509,032 | | |
| | 500,000 | | | TCF National Bank | | | 5.500 | % | | 02/01/16 | | | 508,706 | | |
| | 500,000 | | | KeyBank NA/Cleveland OH | | | 5.450 | % | | 03/03/16 | | | 525,412 | | |
| | 500,000 | | | Symetra Financial Corp (e) | | | 6.125 | % | | 04/01/16 | | | 524,566 | | |
| | 250,000 | | | Security Benefit Life Insurance Co (e) | | | 8.750 | % | | 05/15/16 | | | 267,167 | | |
| | 500,000 | | | Bank of America Corp | | | 6.050 | % | | 05/16/16 | | | 529,463 | | |
| | 500,000 | | | Torchmark Corp | | | 6.375 | % | | 06/15/16 | | | 536,507 | | |
| | 500,000 | | | National City Bank/Cleveland OH | | | 5.250 | % | | 12/15/16 | | | 536,956 | | |
| | 500,000 | | | M&I Marshall & Ilsley Bank | | | 5.000 | % | | 01/17/17 | | | 530,640 | | |
| | 500,000 | | | Citigroup Inc | | | 5.500 | % | | 02/15/17 | | | 537,492 | | |
| | 500,000 | | | Sirius International Group Ltd (a) (e) | | | 6.375 | % | | 03/20/17 | | | 549,132 | | |
| | 250,000 | | | Bank of America Corp | | | 5.700 | % | | 05/02/17 | | | 270,251 | | |
| | 500,000 | | | Royal Bank of Scotland Group PLC (a) | | | 4.250 | % | | 07/15/17 | | | 519,258 | | |
| | 500,000 | | | Comerica Bank | | | 5.200 | % | | 08/22/17 | | | 543,450 | | |
| | 500,000 | | | Bank of America Corp | | | 6.000 | % | | 09/01/17 | | | 551,326 | | |
| | 500,000 | | | American Express Bank FSB | | | 6.000 | % | | 09/13/17 | | | 557,381 | | |
| | 500,000 | | | Bear Stearns Cos LLC/The | | | 6.400 | % | | 10/02/17 | | | 559,955 | | |
| | 500,000 | | | Hartford Financial Services Group Inc/The | | | 4.000 | % | | 10/15/17 | | | 531,613 | | |
| | 500,000 | | | Prudential Financial Inc | | | 6.000 | % | | 12/01/17 | | | 559,714 | | |
| | 500,000 | | | Barclays Bank PLC (a) (e) | | | 6.050 | % | | 12/04/17 | | | 549,956 | | |
| | 1,000,000 | | | Morgan Stanley | | | 5.950 | % | | 12/28/17 | | | 1,111,151 | | |
15
Mairs & Power Balanced Fund
SCHEDULE OF INVESTMENTS (continued) December 31, 2014
Par Value | | Security Description | | Fair Value | |
| | | FIXED INCOME SECURITIES (continued) | |
| | | CORPORATE BONDS (continued) | |
| | | FINANCIALS (continued) | |
$ | 500,000 | | | Goldman Sachs Group Inc/The | | | 5.950 | % | | 01/18/18 | | $ | 555,484 | | |
| | 500,000 | | | Wachovia Corp | | | 5.750 | % | | 02/01/18 | | | 559,890 | | |
| | 250,000 | | | Lincoln National Corp | | | 7.000 | % | | 03/15/18 | | | 285,469 | | |
| | 500,000 | | | SunTrust Bank/Atlanta GA | | | 7.250 | % | | 03/15/18 | | | 578,527 | | |
| | 500,000 | | | Morgan Stanley | | | 6.625 | % | | 04/01/18 | | | 569,518 | | |
| | 1,000,000 | | | Jefferies Group LLC | | | 5.125 | % | | 04/13/18 | | | 1,054,608 | | |
| | 500,000 | | | Bank of America Corp | | | 6.875 | % | | 04/25/18 | | | 574,290 | | |
| | 500,000 | | | Provident Cos Inc | | | 7.000 | % | | 07/15/18 | | | 571,472 | | |
| | 500,000 | | | MetLife Inc | | | 6.817 | % | | 08/15/18 | | | 581,760 | | |
| | 500,000 | | | Hartford Financial Services Group Inc/The | | | 6.000 | % | | 01/15/19 | | | 567,052 | | |
| | 500,000 | | | Royal Bank of Scotland Group PLC (a) | | | 5.250 | % | | 02/15/19 | | | 533,535 | | |
| | 500,000 | | | BB&T Corp | | | 6.850 | % | | 04/30/19 | | | 593,156 | | |
| | 250,000 | | | WR Berkley Corp | | | 6.150 | % | | 08/15/19 | | | 282,164 | | |
| | 500,000 | | | Prospect Capital Corp | | | 5.950 | % | | 09/15/19 | | | 494,155 | | |
| | 500,000 | | | Protective Life Corp | | | 7.375 | % | | 10/15/19 | | | 601,698 | | |
| | 500,000 | | | Prospect Capital Corp | | | 5.125 | % | | 11/15/19 | | | 500,217 | | |
| | 500,000 | | | Credit Suisse/New York NY (a) | | | 5.400 | % | | 01/14/20 | | | 559,143 | | |
| | 500,000 | | | Prospect Capital Corp | | | 4.000 | % | | 01/15/20 | | | 490,394 | | |
| | 500,000 | | | Morgan Stanley | | | 5.500 | % | | 01/26/20 | | | 562,565 | | |
| | 500,000 | | | Hartford Financial Services Group Inc/The | | | 5.500 | % | | 03/30/20 | | | 565,044 | | |
| | 450,000 | | | Compass Bank | | | 5.500 | % | | 04/01/20 | | | 489,655 | | |
| | 537,000 | | | Manufacturers & Traders Trust Co (d) | | | 5.585 | % | | 12/28/20 | | | 557,218 | | |
| | 500,000 | | | Wells Fargo & Co (d) | | | 2.000 | % | | 01/31/21 | | | 493,628 | | |
| | 1,000,000 | | | Nationwide Financial Services Inc (e) | | | 5.375 | % | | 03/25/21 | | | 1,125,102 | | |
| | 500,000 | | | Markel Corp | | | 5.350 | % | | 06/01/21 | | | 561,042 | | |
| | 500,000 | | | Goldman Sachs Group Inc/The | | | 5.250 | % | | 07/27/21 | | | 564,331 | | |
| | 500,000 | | | Genworth Holdings Inc | | | 7.625 | % | | 09/24/21 | | | 488,896 | | |
| | 500,000 | | | Aflac Inc | | | 4.000 | % | | 02/15/22 | | | 530,667 | | |
| | 2,000,000 | | | OneBeacon US Holdings Inc | | | 4.600 | % | | 11/09/22 | | | 2,080,152 | | |
| | 1,000,000 | | | Standard Chartered PLC (a) (e) | | | 3.950 | % | | 01/11/23 | | | 965,039 | | |
| | 500,000 | | | Wells Fargo & Co | | | 3.450 | % | | 02/13/23 | | | 506,747 | | |
| | 2,500,000 | | | Assurant Inc | | | 4.000 | % | | 03/15/23 | | | 2,566,287 | | |
| | 1,000,000 | | | Markel Corp | | | 3.625 | % | | 03/30/23 | | | 1,005,712 | | |
| | 1,500,000 | | | Citigroup Inc | | | 3.500 | % | | 05/15/23 | | | 1,460,235 | | |
| | 500,000 | | | Morgan Stanley | | | 4.100 | % | | 05/22/23 | | | 506,219 | | |
| | 2,000,000 | | | Liberty Mutual Group Inc (e) | | | 4.250 | % | | 06/15/23 | | | 2,060,958 | | |
| | 500,000 | | | Ameriprise Financial Inc | | | 4.000 | % | | 10/15/23 | | | 529,632 | | |
| | 500,000 | | | CNA Financial Corp | | | 7.250 | % | | 11/15/23 | | | 623,458 | | |
16
Mairs & Power Balanced Fund
SCHEDULE OF INVESTMENTS (continued) December 31, 2014
Par Value | | Security Description | | Fair Value | |
| | | FIXED INCOME SECURITIES (continued) | |
| | | CORPORATE BONDS (continued) | |
| | | FINANCIALS (continued) | |
$ | 500,000 | | | Pacific Life Insurance Co (e) | | | 7.900 | % | | 12/30/23 | | $ | 656,012 | | |
| | 1,000,000 | | | Moody's Corp | | | 4.875 | % | | 02/15/24 | | | 1,100,773 | | |
| | 1,000,000 | | | NASDAQ OMX Group Inc/The | | | 4.250 | % | | 06/01/24 | | | 1,024,881 | | |
| | 500,000 | | | Wintrust Financial Corp | | | 5.000 | % | | 06/13/24 | | | 526,010 | | |
| | 250,000 | | | Assured Guaranty US Holdings Inc | | | 5.000 | % | | 07/01/24 | | | 263,735 | | |
| | 500,000 | | | Symetra Financial Corp | | | 4.250 | % | | 07/15/24 | | | 509,664 | | |
| | 1,000,000 | | | Stifel Financial Corp | | | 4.250 | % | | 07/18/24 | | | 1,005,926 | | |
| | 1,000,000 | | | Citigroup Inc | | | 4.000 | % | | 08/05/24 | | | 1,004,021 | | |
| | 1,500,000 | | | Synchrony Financial | | | 4.250 | % | | 08/15/24 | | | 1,539,194 | | |
| | 1,800,000 | | | Brown & Brown Inc | | | 4.200 | % | | 09/15/24 | | | 1,820,448 | | |
| | 2,000,000 | | | Old Republic International Corp | | | 4.875 | % | | 10/01/24 | | | 2,087,750 | | |
| | 2,000,000 | | | TIAA Asset Management Finance Co LLC (e) | | | 4.125 | % | | 11/01/24 | | | 2,048,832 | | |
| | 1,000,000 | | | Associated Banc-Corp | | | 4.250 | % | | 01/15/25 | | | 1,002,762 | | |
| | 250,000 | | | Liberty Mutual Insurance Co (e) | | | 8.500 | % | | 05/15/25 | | | 317,660 | | |
| | 1,000,000 | | | Wells Fargo & Co | | | 4.100 | % | | 06/03/26 | | | 1,022,057 | | |
| | 500,000 | | | Morgan Stanley | | | 4.350 | % | | 09/08/26 | | | 502,988 | | |
| | 1,000,000 | | | National Rural Utilities Cooperative Finance Corp | | | 3.000 | % | | 11/15/26 | | | 977,131 | | |
| | 1,000,000 | | | JPMorgan Chase & Co | | | 4.125 | % | | 12/15/26 | | | 1,001,010 | | |
| | 500,000 | | | Citigroup Inc | | | 5.200 | % | | 01/25/27 | | | 495,842 | | |
| | 250,000 | | | Provident Cos Inc | | | 7.250 | % | | 03/15/28 | | | 317,170 | | |
| | 1,000,000 | | | JPMorgan Chase & Co. (d) | | | 3.000 | % | | 03/21/28 | | | 931,899 | | |
| | 1,000,000 | | | JPMorgan Chase & Co (d) | | | 3.000 | % | | 03/22/28 | | | 939,146 | | |
| | 1,000,000 | | | Royal Bank of Canada (a) | | | 3.000 | % | | 05/10/28 | | | 911,079 | | |
| | 500,000 | | | Farmers Exchange Capital (e) | | | 7.050 | % | | 07/15/28 | | | 619,237 | | |
| | 500,000 | | | Goldman Sachs Group Inc/The (d) | | | 4.000 | % | | 07/30/28 | | | 492,781 | | |
| | 500,000 | | | Goldman Sachs Group Inc/The | | | 4.250 | % | | 11/15/30 | | | 486,095 | | |
| | 500,000 | | | Goldman Sachs Group Inc/The | | | 4.000 | % | | 02/15/31 | | | 506,965 | | |
| | 500,000 | | | Goldman Sachs Group Inc/The | | | 4.300 | % | | 12/15/32 | | | 491,624 | | |
| | 1,000,000 | | | JPMorgan Chase & Co (d) | | | 3.250 | % | | 01/31/33 | | | 939,237 | | |
| | 649,000 | | | Lloyds Bank PLC (a) (d) | | | 3.400 | % | | 01/31/33 | | | 616,301 | | |
| | 250,000 | | | Citigroup Inc (d) | | | 4.000 | % | | 06/27/34 | | | 243,137 | | |
| | 538,000 | | | Bank of America Corp | | | 4.000 | % | | 08/15/34 | | | 551,775 | | |
| | 1,000,000 | | | Prudential Financial Inc | | | 4.050 | % | | 11/15/34 | | | 999,228 | | |
| | 500,000 | | | Barclays Bank PLC (a) (d) | | | 4.000 | % | | 10/09/37 | | | 487,494 | | |
| | 1,000,000 | | | Berkshire Hathaway Finance Corp | | | 4.400 | % | | 05/15/42 | | | 1,075,587 | | |
| | 500,000 | | | MetLife Inc | | | 4.125 | % | | 08/13/42 | | | 500,758 | | |
| | 500,000 | | | Swiss Re Treasury US Corp (e) | | | 4.250 | % | | 12/06/42 | | | 518,097 | | |
| | 500,000 | | | Pacific LifeCorp (e) | | | 5.125 | % | | 01/30/43 | | | 549,890 | | |
17
Mairs & Power Balanced Fund
SCHEDULE OF INVESTMENTS (continued) December 31, 2014
Par Value | | Security Description | | Fair Value | |
| | | FIXED INCOME SECURITIES (continued) | |
| | | CORPORATE BONDS (continued) | |
| | | FINANCIALS (continued) | |
$ | 500,000 | | | Berkshire Hathaway Finance Corp | | | 4.300 | % | | 05/15/43 | | $ | 530,064 | | |
| | 500,000 | | | Principal Financial Group Inc | | | 4.350 | % | | 05/15/43 | | | 508,541 | | |
| | | | 72,131,506 | | |
| | | HEALTH CARE 0.8% | |
| | 500,000 | | | UnitedHealth Group Inc | | | 6.000 | % | | 02/15/18 | | | 562,826 | | |
| | 1,000,000 | | | Quest Diagnostics Inc | | | 4.700 | % | | 04/01/21 | | | 1,082,744 | | |
| | 1,000,000 | | | Laboratory Corp of America Holdings | | | 3.750 | % | | 08/23/22 | | | 1,023,081 | | |
| | 1,000,000 | | | Laboratory Corp of America Holdings | | | 4.000 | % | | 11/01/23 | | | 1,025,635 | | |
| | 1,000,000 | | | Mylan Inc/PA | | | 4.200 | % | | 11/29/23 | | | 1,036,430 | | |
| | 500,000 | | | Wyeth LLC | | | 6.450 | % | | 02/01/24 | | | 627,306 | | |
| | | | 5,358,022 | | |
| | | INDUSTRIALS 3.1% | |
| | 500,000 | | | Deluxe Corp | | | 7.000 | % | | 03/15/19 | | | 521,875 | | |
| | 500,000 | | | Masco Corp | | | 7.125 | % | | 03/15/20 | | | 577,500 | | |
| | 500,000 | | | Pentair Finance SA (a) | | | 5.000 | % | | 05/15/21 | | | 556,175 | | |
| | 500,000 | | | IDEX Corp | | | 4.200 | % | | 12/15/21 | | | 522,172 | | |
| | 500,000 | | | Masco Corp | | | 5.950 | % | | 03/15/22 | | | 555,000 | | |
| | 500,000 | | | GATX Corp | | | 4.750 | % | | 06/15/22 | | | 549,823 | | |
| | 500,000 | | | Penske Truck Leasing Co Lp/PTL Finance Corp (e) | | | 4.875 | % | | 07/11/22 | | | 538,610 | | |
| | 1,000,000 | | | ADT Corp/The | | | 3.500 | % | | 07/15/22 | | | 852,500 | | |
| | 225,000 | | | Pentair Finance SA (a) | | | 3.150 | % | | 09/15/22 | | | 221,007 | | |
| | 2,000,000 | | | Dun & Bradstreet Corp/The | | | 4.375 | % | | 12/01/22 | | | 2,045,878 | | |
| | 1,000,000 | | | GATX Corp | | | 3.900 | % | | 03/30/23 | | | 1,039,073 | | |
| | 500,000 | | | ADT Corp/The | | | 4.125 | % | | 06/15/23 | | | 452,500 | | |
| | 500,000 | | | Ingersoll-Rand Global Holding Co Ltd (a) | | | 4.250 | % | | 06/15/23 | | | 527,051 | | |
| | 1,000,000 | | | Flowserve Corp | | | 4.000 | % | | 11/15/23 | | | 1,032,943 | | |
| | 2,126,000 | | | Air Lease Corp | | | 4.850 | % | | 02/01/24 | | | 2,120,685 | | |
| | 500,000 | | | Pitney Bowes Inc | | | 4.625 | % | | 03/15/24 | | | 511,807 | | |
| | 500,000 | | | Toro Co/The | | | 7.800 | % | | 06/15/27 | | | 647,934 | | |
| | 500,000 | | | General Electric Capital Corp | | | 3.500 | % | | 05/15/32 | | | 490,170 | | |
| | 200,000 | | | General Electric Capital Corp | | | 4.000 | % | | 08/17/32 | | | 199,356 | | |
| | 1,375,000 | | | General Electric Capital Corp | | | 4.000 | % | | 09/17/32 | | | 1,377,120 | | |
| | 3,000,000 | | | Eaton Corp | | | 4.000 | % | | 11/02/32 | | | 3,051,477 | | |
| | 2,000,000 | | | General Electric Capital Corp | | | 4.000 | % | | 02/14/33 | | | 1,978,158 | | |
| | 1,000,000 | | | Pitney Bowes Inc | | | 5.250 | % | | 01/15/37 | | | 1,071,275 | | |
| | 590,000 | | | Eaton Corp | | | 4.150 | % | | 11/02/42 | | | 585,583 | | |
| | 500,000 | | | Lockheed Martin Corp | | | 4.070 | % | | 12/15/42 | | | 504,537 | | |
| | | | 22,530,209 | | |
18
Mairs & Power Balanced Fund
SCHEDULE OF INVESTMENTS (continued) December 31, 2014
Par Value | | Security Description | | Fair Value | |
| | | FIXED INCOME SECURITIES (continued) | |
| | | CORPORATE BONDS (continued) | |
| | | INFORMATION TECHNOLOGY 3.7% | |
$ | 500,000 | | | Western Union Co/The | | | 5.930 | % | | 10/01/16 | | $ | 536,843 | | |
| | 500,000 | | | Broadridge Financial Solutions Inc | | | 6.125 | % | | 06/01/17 | | | 543,216 | | |
| | 500,000 | | | Dell Inc | | | 5.875 | % | | 06/15/19 | | | 530,000 | | |
| | 500,000 | | | Broadridge Financial Solutions Inc | | | 3.950 | % | | 09/01/20 | | | 519,713 | | |
| | 500,000 | | | Hewlett-Packard Co | | | 3.750 | % | | 12/01/20 | | | 517,231 | | |
| | 500,000 | | | Dell Inc | | | 4.625 | % | | 04/01/21 | | | 481,875 | | |
| | 750,000 | | | Hewlett-Packard Co | | | 4.300 | % | | 06/01/21 | | | 789,679 | | |
| | 500,000 | | | Motorola Solutions Inc | | | 3.750 | % | | 05/15/22 | | | 507,257 | | |
| | 2,000,000 | | | Symantec Corp | | | 3.950 | % | | 06/15/22 | | | 2,012,638 | | |
| | 1,000,000 | | | Computer Sciences Corp | | | 4.450 | % | | 09/15/22 | | | 1,022,913 | | |
| | 1,000,000 | | | Hewlett-Packard Co | | | 4.050 | % | | 09/15/22 | | | 1,015,903 | | |
| | 2,025,000 | | | Fiserv Inc | | | 3.500 | % | | 10/01/22 | | | 2,045,104 | | |
| | 1,000,000 | | | Autodesk Inc | | | 3.600 | % | | 12/15/22 | | | 988,825 | | |
| | 2,500,000 | | | Arrow Electronics Inc | | | 4.500 | % | | 03/01/23 | | | 2,584,165 | | |
| | 1,500,000 | | | Motorola Solutions Inc | | | 3.500 | % | | 03/01/23 | | | 1,476,525 | | |
| | 2,000,000 | | | Fidelity National Information Services Inc | | | 3.500 | % | | 04/15/23 | | | 1,988,006 | | |
| | 2,352,000 | | | Total System Services Inc | | | 3.750 | % | | 06/01/23 | | | 2,304,751 | | |
| | 1,000,000 | | | Altera Corp | | | 4.100 | % | | 11/15/23 | | | 1,035,000 | | |
| | 500,000 | | | Motorola Solutions Inc | | | 4.000 | % | | 09/01/24 | | | 503,011 | | |
| | 4,000,000 | | | Intel Corp | | | 4.000 | % | | 12/15/32 | | | 4,089,908 | | |
| | 1,500,000 | | | Western Union Co/The | | | 6.200 | % | | 11/17/36 | | | 1,538,805 | | |
| | | | 27,031,368 | | |
| | | MATERIALS 2.8% | |
| | 500,000 | | | International Paper Co | | | 5.250 | % | | 04/01/16 | | | 525,344 | | |
| | 500,000 | | | Valspar Corp/The | | | 6.050 | % | | 05/01/17 | | | 546,310 | | |
| | 500,000 | | | Cliffs Natural Resources Inc (d) | | | 4.950 | % | | 01/15/18 | | | 325,000 | | |
| | 500,000 | | | Cliffs Natural Resources Inc | | | 4.800 | % | | 10/01/20 | | | 270,000 | | |
| | 1,000,000 | | | Cliffs Natural Resources Inc | | | 4.875 | % | | 04/01/21 | | | 537,500 | | |
| | 500,000 | | | Carpenter Technology Corp | | | 5.200 | % | | 07/15/21 | | | 531,064 | | |
| | 500,000 | | | Freeport-McMoRan Inc | | | 4.000 | % | | 11/14/21 | | | 495,401 | | |
| | 175,000 | | | Mosaic Co/The | | | 3.750 | % | | 11/15/21 | | | 182,140 | | |
| | 1,000,000 | | | Freeport-McMoRan Inc | | | 3.550 | % | | 03/01/22 | | | 945,111 | | |
| | 1,500,000 | | | Newmont Mining Corp | | | 3.500 | % | | 03/15/22 | | | 1,409,621 | | |
| | 500,000 | | | Barrick Gold Corp (a) | | | 3.850 | % | | 04/01/22 | | | 481,171 | | |
| | 1,000,000 | | | Domtar Corp | | | 4.400 | % | | 04/01/22 | | | 1,026,376 | | |
| | 2,000,000 | | | RPM International Inc | | | 3.450 | % | | 11/15/22 | | | 1,969,618 | | |
| | 500,000 | | | Carpenter Technology Corp | | | 4.450 | % | | 03/01/23 | | | 509,211 | | |
19
Mairs & Power Balanced Fund
SCHEDULE OF INVESTMENTS (continued) December 31, 2014
Par Value | | Security Description | | Fair Value | |
| | | FIXED INCOME SECURITIES (continued) | |
| | | CORPORATE BONDS (continued) | |
| | | MATERIALS (continued) | |
$ | 500,000 | | | Freeport-McMoRan Inc | | | 3.875 | % | | 03/15/23 | | $ | 471,418 | | |
| | 1,000,000 | | | Reliance Steel & Aluminum Co | | | 4.500 | % | | 04/15/23 | | | 980,056 | | |
| | 1,750,000 | | | Barrick Gold Corp (a) | | | 4.100 | % | | 05/01/23 | | | 1,703,096 | | |
| | 2,000,000 | | | Nucor Corp | | | 4.000 | % | | 08/01/23 | | | 2,094,646 | | |
| | 1,000,000 | | | Mosaic Co/The | | | 4.250 | % | | 11/15/23 | | | 1,055,195 | | |
| | 865,000 | | | Union Carbide Corp | | | 7.500 | % | | 06/01/25 | | | 1,119,618 | | |
| | 1,250,000 | | | Dow Chemical Co/The | | | 4.250 | % | | 10/01/34 | | | 1,227,683 | | |
| | 1,000,000 | | | Alcoa Inc | | | 5.950 | % | | 02/01/37 | | | 1,021,557 | | |
| | 1,000,000 | | | Newmont Mining Corp | | | 4.875 | % | | 03/15/42 | | | 870,987 | | |
| | | | 20,298,123 | | |
| | | TELECOMMUNICATION SERVICES 0.4% | |
| | 250,000 | | | Verizon Communications Inc | | | 6.350 | % | | 04/01/19 | | | 289,691 | | |
| | 500,000 | | | CenturyLink Inc | | | 6.150 | % | | 09/15/19 | | | 540,000 | | |
| | 500,000 | | | Qwest Capital Funding Inc | | | 6.875 | % | | 07/15/28 | | | 500,000 | | |
| | 550,000 | | | Qwest Corp | | | 6.875 | % | | 09/15/33 | | | 551,686 | | |
| | 1,000,000 | | | Verizon Communications Inc | | | 4.400 | % | | 11/01/34 | | | 993,981 | | |
| | | | 2,875,358 | | |
| | | UTILITIES 1.2% | |
| | 500,000 | | | Commonwealth Edison Co | | | 6.150 | % | | 09/15/17 | | | 560,906 | | |
| | 250,000 | | | Vectren Utility Holdings Inc | | | 5.750 | % | | 08/01/18 | | | 275,486 | | |
| | 250,000 | | | South Jersey Gas Co | | | 7.125 | % | | 10/22/18 | | | 286,802 | | |
| | 250,000 | | | United Utilities PLC (a) | | | 5.375 | % | | 02/01/19 | | | 271,933 | | |
| | 2,000,000 | | | PPL Energy Supply LLC | | | 4.600 | % | | 12/15/21 | | | 1,814,830 | | |
| | 2,170,000 | | | ONEOK Inc | | | 4.250 | % | | 02/01/22 | | | 1,986,099 | | |
| | 785,000 | | | SCANA Corp | | | 4.125 | % | | 02/01/22 | | | 813,789 | | |
| | 1,000,000 | | | Exelon Generation Co LLC | | | 4.250 | % | | 06/15/22 | | | 1,039,180 | | |
| | 900,000 | | | National Fuel Gas Co | | | 3.750 | % | | 03/01/23 | | | 910,297 | | |
| | 500,000 | | | Entergy Gulf States Inc | | | 6.180 | % | | 03/01/35 | | | 500,083 | | |
| | | | 8,459,405 | | |
| | | TOTAL CORPORATE BONDS | | | 202,893,661 | | |
| | | ASSET BACKED SECURITIES 1.2% | |
| | 256 | | | General American Transportation Corp 1996-1
Pass-Through Trust | | | 7.500 | % | | 02/28/15 | | | 257 | | |
| | 500,000 | | | Delta Air Lines 2010-2 Class B Pass Through Trust (e) | | | 6.750 | % | | 05/23/17 | | | 521,250 | | |
| | 373,180 | | | Continental Airlines 2009-1 Pass Through Trust | | | 9.000 | % | | 01/08/18 | | | 409,099 | | |
20
Mairs & Power Balanced Fund
SCHEDULE OF INVESTMENTS (continued) December 31, 2014
Par Value | | Security Description | | Fair Value | |
| | | FIXED INCOME SECURITIES (continued) | |
| | | ASSET BACKED SECURITIES (continued) | |
$ | 371,306 | | | American Airlines 2011-1 Class B Pass Through Trust (e) | | | 7.000 | % | | 07/31/19 | | $ | 397,297 | | |
| | 179,608 | | | Continental Airlines 1999-1 Class B Pass Through Trust | | | 6.795 | % | | 02/02/20 | | | 186,343 | | |
| | 601,443 | | | Continental Airlines 2010-1 Class B Pass Through Trust | | | 6.000 | % | | 07/12/20 | | | 627,756 | | |
| | 340,393 | | | Delta Air Lines 2011-1 Class A Pass Through Trust | | | 5.300 | % | | 10/15/20 | | | 371,028 | | |
| | 639,732 | | | America West Airlines 2000-1 Pass Through Trust | | | 8.057 | % | | 01/02/22 | | | 730,497 | | |
| | 767,046 | | | American Airlines 2011-1 Class A Pass Through Trust | | | 5.250 | % | | 07/31/22 | | | 822,657 | | |
| | 194,015 | | | Continental Airlines 2007-1 Class A Pass Through Trust | | | 5.983 | % | | 10/19/23 | | | 211,244 | | |
| | 367,018 | | | Southwest Airlines Co 2007-1 Pass Through Trust | | | 6.150 | % | | 02/01/24 | | | 422,071 | | |
| | 789,525 | | | US Airways 2010-1 Class A Pass Through Trust | | | 6.250 | % | | 10/22/24 | | | 889,203 | | |
| | 407,551 | | | US Airways 2011-1 Class A Pass Through Trust | | | 7.125 | % | | 04/22/25 | | | 471,993 | | |
| | 582,250 | | | Continental Airlines 2012-2 Class A Pass Through Trust | | | 4.000 | % | | 04/29/26 | | | 591,741 | | |
| | 1,000,000 | | | United Airlines 2013-1 Class A Pass Through Trust | | | 4.300 | % | | 02/15/27 | | | 1,033,800 | | |
| | 970,880 | | | US Airways 2013-1 Class A Pass Through Trust | | | 3.950 | % | | 05/15/27 | | | 991,560 | | |
| | | | 8,677,796 | | |
| | | PREFERRED SECURITIES 1.1% | |
| | 105,000 | | | Affiliated Managers Group Inc | | | 5.250 | % | | 10/15/22 | | | 2,716,350 | | |
| | 20,000 | | | Pitney Bowes Inc | | | 5.250 | % | | 11/27/22 | | | 522,000 | | |
| | 23,000 | | | Stifel Financial Corp | | | 5.375 | % | | 12/31/22 | | | 589,260 | | |
| | 10,000 | | | Raymond James Financial Inc | | | 6.900 | % | | 03/15/42 | | | 272,900 | | |
| | 20,000 | | | Protective Life Corp | | | 6.000 | % | | 09/01/42 | | | 506,800 | | |
| | 20,000 | | | Selective Insurance Group Inc | | | 5.875 | % | | 02/09/43 | | | 500,000 | | |
| | 40,000 | | | WR Berkley Corp | | | 5.625 | % | | 04/30/53 | | | 950,400 | | |
| | 20,000 | | | Verizon Communications Inc | | | 5.900 | % | | 02/15/54 | | | 523,600 | | |
| | 20,000 | | | American Financial Group Inc/OH | | | 6.250 | % | | 09/30/54 | | | 502,400 | | |
| | 20,000 | | | Qwest Corp | | | 6.875 | % | | 10/01/54 | | | 512,800 | | |
| | 10,000 | | | NextEra Energy Capital Holdings Inc | | | 5.700 | % | | 03/01/72 | | | 246,400 | | |
| | | | 7,842,910 | | |
| | TOTAL FIXED INCOME SECURITIES
(cost $253,864,132) | | $ | 259,251,354 | | |
21
Mairs & Power Balanced Fund
SCHEDULE OF INVESTMENTS (continued) December 31, 2014
Shares | | Security Description | | Fair Value | |
| | | COMMON STOCKS 61.0% | |
| | | CONSUMER DISCRETIONARY 3.7% | |
| | 13,000 | | | Genuine Parts Co | | | | | | $ | 1,385,410 | | |
| | 74,000 | | | Home Depot Inc/The | | | | | | | 7,767,780 | | |
| | 13,000 | | | Sturm Ruger & Co Inc | | | | | | | 450,190 | | |
| | 229,500 | | | Target Corp | | | | | | | 17,421,345 | | |
| | | | 27,024,725 | | |
| | | CONSUMER STAPLES 2.8% | |
| | 89,000 | | | General Mills Inc | | | | | | | 4,746,370 | | |
| | 61,500 | | | Hershey Co/The | | | | | | | 6,391,695 | | |
| | 120,000 | | | Hormel Foods Corp | | | | | | | 6,252,000 | | |
| | 26,000 | | | Kimberly-Clark Corp | | | | | | | 3,004,040 | | |
| | | | 20,394,105 | | |
| | | ENERGY 6.7% | |
| | 63,000 | | | BP PLC ADR (f) | | | | | | | 2,401,560 | | |
| | 170,000 | | | ConocoPhillips | | | | | | | 11,740,200 | | |
| | 194,000 | | | Exxon Mobil Corp | | | | | | | 17,935,300 | | |
| | 50,000 | | | Murphy Oil Corp | | | | | | | 2,526,000 | | |
| | 159,000 | | | Schlumberger Ltd (a) | | | | | | | 13,580,190 | | |
| | | | 48,183,250 | | |
| | | FINANCIALS 8.7% | |
| | 26,000 | | | American Express Co | | | | | | | 2,419,040 | | |
| | 404,000 | | | Associated Banc-Corp | | | | | | | 7,526,520 | | |
| | 59,000 | | | Bank of America Corp | | | | | | | 1,055,510 | | |
| | 139,000 | | | JPMorgan Chase & Co | | | | | | | 8,698,620 | | |
| | 20,000 | | | Lincoln National Corp | | | | | | | 1,153,400 | | |
| | 244,000 | | | Principal Financial Group Inc | | | | | | | 12,673,360 | | |
| | 118,000 | | | TCF Financial Corp | | | | | | | 1,875,020 | | |
| | 35,000 | | | Travelers Cos Inc/The | | | | | | | 3,704,750 | | |
| | 343,000 | | | US Bancorp | | | | | | | 15,417,850 | | |
| | 156,000 | | | Wells Fargo & Co | | | | | | | 8,551,920 | | |
| | | | 63,075,990 | | |
| | | HEALTH CARE 10.7% | |
| | 148,500 | | | Abbott Laboratories | | | | | | | 6,685,470 | | |
| | 84,000 | | | AbbVie Inc | | | | | | | 5,496,960 | | |
| | 131,000 | | | Baxter International Inc | | | | | | | 9,600,990 | | |
| | 74,500 | | | Bristol-Myers Squibb Co | | | | | | | 4,397,735 | | |
| | 74,000 | | | Eli Lilly & Co | | | | | | | 5,105,260 | | |
| | 3,250 | | | Halyard Health Inc (b) | | | | | | | 147,778 | | |
| | 94,000 | | | Johnson & Johnson | | | | | | | 9,829,580 | | |
22
Mairs & Power Balanced Fund
SCHEDULE OF INVESTMENTS (continued) December 31, 2014
Shares | | Security Description | | Fair Value | |
| | | COMMON STOCKS 61.0% | |
| | | HEALTH CARE (continued) | |
| | 252,500 | | | Medtronic Inc | | | | | | $ | 18,230,500 | | |
| | 292,000 | | | Pfizer Inc | | | | | | | 9,095,800 | | |
| | 256,000 | | | Roche Holding AG ADR (f) | | | | | | | 8,701,440 | | |
| | | | 77,291,513 | | |
| | | INDUSTRIALS 16.1% | |
| | 86,000 | | | 3M Co | | | | | | | 14,131,520 | | |
| | 115,000 | | | CH Robinson Worldwide Inc | | | | | | | 8,612,350 | | |
| | 251,000 | | | Deluxe Corp | | | | | | | 15,624,750 | | |
| | 256,000 | | | Emerson Electric Co | | | | | | | 15,802,880 | | |
| | 420,000 | | | General Electric Co | | | | | | | 10,613,400 | | |
| | 87,000 | | | Graco Inc | | | | | | | 6,975,660 | | |
| | 102,000 | | | Honeywell International Inc | | | | | | | 10,191,840 | | |
| | 23,000 | | | Ingersoll-Rand PLC (a) | | | | | | | 1,457,970 | | |
| | 128,000 | | | Pentair PLC (a) | | | | | | | 8,501,760 | | |
| | 40,000 | | | Toro Co/The | | | | | | | 2,552,400 | | |
| | 195,100 | | | United Parcel Service Inc, Class B | | | | | | | 21,689,267 | | |
| | | | 116,153,797 | | |
| | | INFORMATION TECHNOLOGY 5.3% | |
| | 420,000 | | | Corning Inc | | | | | | | 9,630,600 | | |
| | 70,000 | | | International Business Machines Corp | | | | | | | 11,230,800 | | |
| | 94,000 | | | MTS Systems Corp | | | | | | | 7,052,820 | | |
| | 601,000 | | | Western Union Co/The | | | | | | | 10,763,910 | | |
| | | | 38,678,130 | | |
| | | MATERIALS 4.7% | |
| | 136,000 | | | Bemis Co Inc | | | | | | | 6,148,560 | | |
| | 94,000 | | | Ecolab Inc | | | | | | | 9,824,880 | | |
| | 156,000 | | | HB Fuller Co | | | | | | | 6,946,680 | | |
| | 124,000 | | | Valspar Corp/The | | | | | | | 10,723,520 | | |
| | | | 33,643,640 | | |
| | | UTILITIES 2.3% | |
| | 88,000 | | | ALLETE Inc | | | | | | | 4,852,320 | | |
| | 236,000 | | | MDU Resources Group Inc | | | | | | | 5,546,000 | | |
| | 173,000 | | | Xcel Energy Inc | | | | | | | 6,214,160 | | |
| | | | 16,612,480 | | |
| | | TOTAL COMMON STOCKS
(cost $282,475,440) | | $ | 441,057,630
| | |
23
Mairs & Power Balanced Fund
SCHEDULE OF INVESTMENTS (continued) December 31, 2014
Shares | | Security Description | | Fair Value | |
| | | PREFERRED STOCKS 0.0% | |
| | | UTILITIES 0.0% | |
| | 10,000 | | | SCE Trust I | | | | | | $ | 245,000 | | |
| | | TOTAL PREFERRED STOCKS
(cost $250,000) | | $ | 245,000
| | |
| | | SHORT-TERM INVESTMENTS 2.3% | |
| 16,644,933
| | | First American Prime Obligations Fund, Class Z, 0.02% (c)
(cost $16,644,933) | |
| |
| | $ | 16,644,933
| | |
| | | TOTAL INVESTMENTS 99.2%
(cost $553,234,505) | |
| |
| | $ | 717,198,917
| | |
| | | OTHER ASSETS AND LIABILITIES (NET) 0.8% | | | | | | | | | | | 5,664,535 | | |
| | | TOTAL NET ASSETS 100.0% | | | | | | | | | | $ | 722,863,452 | | |
(a) Foreign security denominated in U.S. dollars. As of December 31, 2014, these securities represented $35,422,265 or 4.9% of total net assets.
(b) Non-income producing.
(c) The rate quoted is the annualized seven-day effective yield as of December 31, 2014.
(d) Step Bonds – Securities for which the coupon rate of interest will adjust on specified future date(s). The rate disclosed represents the coupon rate in effect as of December 31, 2014.
(e) Securities exempt from registration under Rule 144A of the Securities Act of 1933. These securities may be resold in transactions exempt from registration, normally to qualified institutional buyers. These securities have been determined to be liquid under guidelines established by the Fund's Board of Trustees. As of December 31, 2014, these securities represented $17,362,822 or 2.4% of total net assets.
(f) American Depositary Receipt.
The Global Industry Classification Standard (GICS®) was developed by and/or is the exclusive property of MSCI, Inc. and Standard & Poor's Financial Services LLC ("S&P"). GICS is a service mark of MSCI and S&P and has been licensed for use by Mairs and Power, Inc.
See accompanying Notes to Financial Statements.
24
MAIRS & POWER SMALL CAP FUND (unaudited)
To Our Shareholders: December 31, 2014
While the Small Cap Fund underperformed relative to its benchmarks in the fourth quarter, the Fund continued to outpace its index and peer group for the full year, finishing 2014 up 6.73% while the S&P SmallCap 600 Total Return (TR) Index was up 5.76% and the peer group as measured by the Lipper Small-Cap Core Funds Index was up 4.09%. For the fourth quarter, the Small Cap Fund was up 6.78%, while the S&P SmallCap 600 TR Index was up 9.85% and the Lipper Small-Cap Core Funds Index was up 7.68%.
Sector allocation had little impact on relative performance both year-to-date and for the fourth quarter. Although the Fund was underweight in stocks categorized in the energy sector, the precipitous drop in energy prices had a significantly negative impact on relative Fund performance in the fourth quarter. Portfolio holdings Chart Industries (an industrial stock) and MDU Resources (a utility), while not categorized in the energy sector, still have businesses that are sensitive to energy prices and their stocks were down significantly in the fourth quarter. For the full year, energy and industrial sector weightings had the biggest impacts on relative performance. Holding an underweight position in the energy sector – the worst performing sector by far for the year – helped the Fund's full year relative performance. Conversely, an overweight position in the industrial sector, which modestly underperformed the index for the year, negatively impacted relative performance.
Vasco Data Security (password authentication hardware and software) led Fund performance for both the quarter and the year. While the company derives most of its revenue outside the U.S., headlines of data breaches at major U.S. corporations are driving consumer demand for better protection of their private information, and Vasco's data security products are helping the company penetrate the U.S. market.
Gentherm (heating and cooling technology primarily utilized in automobile seats) was also a top performer for the year, though the stock was among the lowest performers in the fourth quarter as some of its business is tied to energy efficiency. Longer term, the company still appears well positioned regardless of what happens with oil prices.
Oasis Petroleum (oil exploration and production) was the worst performing stock for the year. While the company was able to earn phenomenal returns on wells drilled in North Dakota's Bakken at $100+/barrel oil prices, the economics significantly degrade when oil is less than $50 a barrel.
MAIRS & POWER SMALL CAP FUND (MSCFX)
Top Performers
| Fourth Quarter (9/30/14 – 12/31/14) | | Year To Date (12/31/13 – 12/31/14) | |
VASCO DATA SECURITY INT'L, INC. | | | 50.21 | % | | VASCO DATA SECURITY INT'L, INC. | | | 264.94 | % | |
BUFFALO WILD WINGS, INC. | | | 34.34 | % | | GENTHERM, INC. | | | 36.59 | % | |
CRAY INC. | | | 31.40 | % | | CASEY'S GENERAL STORES, INC. | | | 28.57 | % | |
G&K SERVICES, INC | | | 27.93 | % | | CRAY INC. | | | 25.56 | % | |
ALLETE, INC. | | | 24.22 | % | | NVE CORPORATION | | | 21.47 | % | |
Weak Performers
| Fourth Quarter (9/30/14 – 12/31/14) | | Year To Date (12/31/13 – 12/31/14) | |
OASIS PETROLEUM INC. | | | -60.44 | % | | OASIS PETROLEUM INC. | | | -64.79 | % | |
NORTHERN OIL AND GAS, INC. | | | -60.27 | % | | CHART INDUSTRIES, INC. | | | -64.24 | % | |
CHART INDUSTRIES, INC. | | | -44.05 | % | | NORTHERN OIL AND GAS, INC. | | | -62.51 | % | |
MDU RESOURCES GROUP, INC. | | | -15.50 | % | | WADDELL & REED FINANCIAL, INC. | | | -23.50 | % | |
GENTHERM, INC. | | | -13.28 | % | | MDU RESOURCES GROUP, INC. | | | -23.08 | % | |
Past performance is no guarantee of future results.
25
MAIRS & POWER SMALL CAP FUND (unaudited) (continued)
In the fourth quarter the Fund was particularly active, selling completely out of three stocks (TCF Financial, Kodiak Oil and Gas and Landauer) while adding four new stocks (Cardinal Financial, Physicians Realty Trust, Cardiovascular Systems and Donaldson). Cardinal, based in Mclean, Virginia, is a regional bank serving primarily the Washington D.C. area, one of the financially strongest in the country. Physicians Realty Trust is a healthcare real estate investment trust (REIT) which owns properties leased to physicians, hospitals and healthcare delivery systems. The Milwaukee-based firm's stock carries a dividend yield over 5%. Minneapolis-based Donaldson is a long time Mairs and Power holding, familiar to the firm but new to the Small Cap Fund. The manufacturer of filtration systems and replacement parts in a variety of industries was affected by recent weakness in off-highway vehicle (and Donaldson filters) sales creating an attractive opportunity for the Small Cap Fund to initiate a position in the stock.
At regularly scheduled meetings in December, the Mairs and Power, Inc. Board of Directors and the Mairs & Power Funds Trust (Trust) Board of Trustees approved a number of changes to the company's executive ranks and to the officers and trustees of the Trust. Among the changes, Allen Steinkopf joins lead manager Andrew Adams as co-manager of the Small Cap Fund, effective January 1, 2015. Mark Henneman was also appointed President of the Trust, effective December 31, 2014. These executive changes culminate a long-term succession plan which began several years ago in anticipation of William Frels' mandatory retirement on December 31, 2014 as Trustee and President of the Trust. The Mairs & Power Mutual Funds employ a deliberate and disciplined succession planning process to ensure consistency in the investment philosophy over time. Press releases detailing all the changes are available on the Mairs & Power website.
Shareholder Meeting Update
The Board of Trustees of the Trust has determined to hold a special meeting of shareholders on April 10, 2015. Two proposals will be presented to shareholders for approval. First, shareholders of the Trust will be asked to elect six nominees to serve as Trustees of the Trust, including the four incumbent Trustees. In addition, the Board of Trustees has nominated James D. Alt and Patrick A. Thiele to serve as Independent Trustees of the Trust, subject to approval by shareholders of the Trust at the special meeting to be held on April 10, 2015. Second, shareholders of the Balanced Fund will be asked to approve a revised investment objective for this Fund. Prior to the meeting, shareholders entitled to vote at the special meeting will receive proxy materials discussing these proposals in greater detail.
Andrew R. Adams
Lead Manager | | Allen D. Steinkopf
Co-Manager – Effective January 1, 2015 | |
The Fund's investment objective, risks, charges and expenses must be considered carefully before investing. The summary prospectus or full prospectus contains this and other important information about the Fund, and they may be obtained by calling Shareholder Services at (800) 304-7404 or visiting www.mairsandpower.com. Read the summary prospectus or full prospectus carefully before investing.
All holdings in the portfolio are subject to change without notice and may or may not represent current or future portfolio composition. The mention of specific securities is not intended as a recommendation or an offer of a particular security, nor is it intended to be a solicitation for the purchase or sale of any security.
All investments have risks. The Small Cap Fund is designed for long-term investors. Equity investments are subject to market fluctuations, and the Fund's share price can fall because of weakness in the broad market, a particular industry, or specific holdings. Investments in small and midcap companies generally are more volatile. International investing risks include among others political, social or economic instability, difficulty in predicting international trade patterns, taxation and foreign trading practices, and greater fluctuations in price than United States corporations. The Fund may invest in initial public offerings by small cap companies, which can involve greater risk than investments in companies that are already publicly traded.
26
MAIRS & POWER SMALL CAP FUND (unaudited) (continued)
Diversification does not guarantee profit or protect against loss.
Lipper Small Cap Core Funds Index is an unmanaged index considered representative of small-cap core funds tracked by Lipper. It is not possible to invest directly in an index.
The S&P SmallCap 600 Total Return Index is an index of small company stocks which assumes reinvestment of dividends and covers a broad range of small cap stocks in the United States. The index is weighted according to market capitalization and covers about 3-4% of the total market for equities in the United States. It is not possible to invest directly in an index.
27
Mairs & Power Small Cap Fund
PERFORMANCE INFORMATION (unaudited) December 31, 2014
Investment performance since commencement of operations (through December 31, 2014)
This chart illustrates the performance of a hypothetical $10,000 investment made in the Fund since commencement of operations.
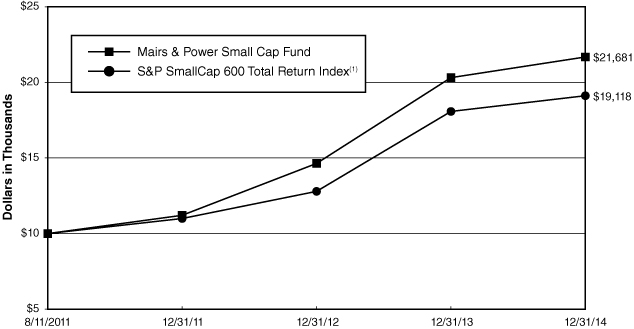
Average annual total returns for periods ended December 31, 2014
| | 1 Year | | 3 Year | | Since Inception(2) | |
Mairs & Power Small Cap Fund | | | 6.73 | % | | | 24.59 | % | | | 25.65 | % | |
S&P SmallCap 600 Total Return Index(1) | | | 5.76 | % | | | 20.24 | % | | | 21.07 | % | |
Performance data quoted represents past performance and does not guarantee future results. All performance information shown includes the reinvestment of dividend and capital gain distributions, but does not reflect the deduction of taxes that a shareholder would pay on Fund distributions or the redemption of Fund shares. The investment return and principal value of an investment will fluctuate so that an investor's shares, when redeemed, may be worth more or less than their original cost. Current performance of the Fund may be lower or higher than the performance quoted. For the most recent month-end performance figures, visit the Fund's website at www.mairsandpower.com or call Shareholder Services at (800) 304-7404.
(1) The S&P Small Cap 600 Total Return Index is an index of small company stocks managed by Standard & Poor's that covers a broad range of small cap stocks in the United States. The index is weighted according to market capitalization and covers about 3-4% of the total market for equities in the United States. It is not possible to invest directly in an index.
(2) Since inception performance is as of August 11, 2011, which is the offering date of the Small Cap Fund.
28
Mairs & Power Small Cap Fund
FUND INFORMATION (unaudited) December 31, 2014
Portfolio Managers
Andrew R. Adams, lead manager since 2011
University of Wisconsin-Madison, BBA Finance and Mathematics 1994, MS Finance 1997
Allen D. Steinkopf, co-manager since January 1, 2015,
University of Minnesota, MBA Finance 1986
General Information
Fund Symbol | | MSCFX | |
Net Asset Value (NAV) Per Share | | $ | 20.67 | | |
Expense Ratio | | | 1.07 | % | |
Portfolio Turnover Rate | | | 15.85 | % | |
Sales Charge | | | None1 | | |
Fund Inception Year | | | 2011 | | |
Portfolio Composition
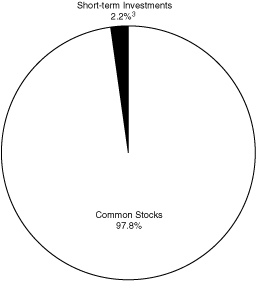
Top Ten Portfolio Holdings
(Percent of Total Net Assets) 2
Cray Inc | | | 3.6 | % | |
Badger Meter Inc | | | 3.6 | | |
Deluxe Corp | | | 3.5 | | |
Generac Holdings Inc | | | 3.3 | | |
Gentherm Inc | | | 3.1 | | |
United Fire Group Inc | | | 3.1 | | |
Apogee Enterprises Inc | | | 3.1 | | |
PrivateBancorp Inc | | | 3.1 | | |
Wintrust Financial Corp | | | 3.0 | | |
Agree Realty Corp | | | 3.0 | | |
Portfolio Diversification
(Percent of Total Net Assets)
Common Stocks 97.8% | |
Industrials | | | 29.0 | % | |
Information Technology | | | 19.0 | | |
Financials | | | 18.7 | | |
Health Care | | | 8.7 | | |
Materials | | | 7.5 | | |
Consumer Discretionary | | | 6.5 | | |
Utilities | | | 4.9 | | |
Consumer Staples | | | 2.2 | | |
Energy | | | 1.3 | | |
Short-term Investments 2.2%3 | | | 2.2 | | |
| | | | 100.0 | % | |
1 Although the Fund is no-load, investment management fees and other expenses still apply.
2 All holdings in the portfolio are subject to change without notice and may or may not represent current or future portfolio composition. The mention of specific securities is not intended as a recommendation or offer for a particular security, nor is it intended to be a solicitation for the purchase or sale of any security.
3 Represents short-term investments and other assets and liabilities (net).
The Global Industry Classification Standard (GICS®) was developed by and/or is the exclusive property of MSCI, Inc. and Standard & Poor's Financial Services LLC ("S&P"). GICS is a service mark of MSCI and S&P and has been licensed for use by Mairs and Power, Inc.
29
Mairs & Power Small Cap Fund
SCHEDULE OF INVESTMENTS December 31, 2014
Shares | | Security Description | | Fair Value | |
| | | COMMON STOCKS 97.8% | |
| | | CONSUMER DISCRETIONARY 6.5% | |
| | 21,500 | | | Buffalo Wild Wings Inc (a) | | $ | 3,878,170 | | |
| | 32,100 | | | Cabela's Inc (a) | | | 1,691,991 | | |
| | 137,485 | | | Gentherm Inc (a) | | | 5,034,701 | | |
| | | | 10,604,862 | | |
| | | CONSUMER STAPLES 2.2% | |
| | 38,900 | | | Casey's General Stores Inc | | | 3,513,448 | | |
| | | ENERGY 1.3% | |
| | 250,900 | | | Northern Oil and Gas Inc (a) | | | 1,417,585 | | |
| | 41,600 | | | Oasis Petroleum Inc (a) | | | 688,064 | | |
| | | | 2,105,649 | | |
| | | FINANCIALS 18.7% | |
| | 155,400 | | | Agree Realty Corp | | | 4,831,386 | | |
| | 210,800 | | | Associated Banc-Corp | | | 3,927,204 | | |
| | 288,613 | | | Bank Mutual Corp | | | 1,979,885 | | |
| | 113,616 | | | Cardinal Financial Corp | | | 2,253,005 | | |
| | 102,100 | | | Physicians Realty Trust | | | 1,694,860 | | |
| | 148,650 | | | PrivateBancorp Inc | | | 4,964,910 | | |
| | 167,064 | | | United Fire Group Inc | | | 4,966,813 | | |
| | 17,900 | | | Waddell & Reed Financial Inc, Class A | | | 891,778 | | |
| | 103,600 | | | Wintrust Financial Corp | | | 4,844,336 | | |
| | | | 30,354,177 | | |
| | | HEALTH CARE 8.7% | |
| | 51,500 | | | Bio-Techne Corp | | | 4,758,600 | | |
| | 111,842 | | | Cardiovascular Systems Inc (a) | | | 3,364,207 | | |
| | 35,300 | | | Patterson Cos Inc | | | 1,697,930 | | |
| | 156,073 | | | Vascular Solutions Inc (a) | | | 4,238,943 | | |
| | | | 14,059,680 | | |
| | | INDUSTRIALS 29.0% | |
| | 117,200 | | | Apogee Enterprises Inc | | | 4,965,764 | | |
| | 22,200 | | | Chart Industries Inc (a) | | | 759,240 | | |
| | 91,100 | | | Deluxe Corp | | | 5,670,975 | | |
| | 102,700 | | | Donaldson Co Inc | | | 3,967,301 | | |
| | 64,639 | | | G&K Services Inc, Class A | | | 4,579,673 | | |
| | 114,900 | | | Generac Holdings Inc (a) | | | 5,372,724 | | |
| | 39,200 | | | Graco Inc | | | 3,143,056 | | |
| | 71,500 | | | Hub Group Inc, Class A (a) | | | 2,722,720 | | |
| | 129,900 | | | Manitowoc Co Inc/The | | | 2,870,790 | | |
| | 85,800 | | | Oshkosh Corp | | | 4,174,170 | | |
| | 48,200 | | | Proto Labs Inc (a) | | | 3,237,112 | | |
| | 24,000 | | | Snap-on Inc | | | 3,281,760 | | |
| | 37,600 | | | Toro Co/The | | | 2,399,256 | | |
| | | | 47,144,541 | | |
30
Mairs & Power Small Cap Fund
SCHEDULE OF INVESTMENTS (continued) December 31, 2014
Shares | | Security Description | | Fair Value | |
| | | COMMON STOCKS (continued) | |
| | | INFORMATION TECHNOLOGY 19.0% | |
| | 79,700 | | | Advent Software Inc | | $ | 2,442,008 | | |
| | 97,099 | | | Badger Meter Inc | | | 5,762,826 | | |
| | 167,400 | | | Cray Inc (a) | | | 5,771,952 | | |
| | 152,874 | | | MOCON Inc | | | 2,727,272 | | |
| | 47,200 | | | MTS Systems Corp | | | 3,541,416 | | |
| | 58,434 | | | NVE Corp (a) | | | 4,136,543 | | |
| | 51,900 | | | SPS Commerce Inc (a) | | | 2,939,097 | | |
| | 122,916 | | | VASCO Data Security International Inc (a) | | | 3,467,460 | | |
| | | | 30,788,574 | | |
| | | MATERIALS 7.5% | |
| | 94,900 | | | Bemis Co Inc | | | 4,290,429 | | |
| | 98,500 | | | Hawkins Inc | | | 4,268,005 | | |
| | 41,600 | | | Valspar Corp/The | | | 3,597,568 | | |
| | | | 12,156,002 | | |
| | | UTILITIES 4.9% | |
| | 68,700 | | | ALLETE Inc | | | 3,788,118 | | |
| | 179,100 | | | MDU Resources Group Inc | | | 4,208,850 | | |
| | | | 7,996,968 | | |
| | | | | TOTAL COMMON STOCKS
(cost $126,069,895) | | $ | 158,723,901
| | |
| | | SHORT-TERM INVESTMENTS 2.1% | |
| 3,399,990
| | | First American Prime Obligations Fund, Class Z, 0.02% (b)
(cost $3,399,990) | | $ | 3,399,990
| | |
| | | | | TOTAL INVESTMENTS 99.9%
(cost $129,469,885) | | $ | 162,123,891
| | |
| | | | | OTHER ASSETS AND LIABILITIES (NET) 0.1% | | | 106,382 | | |
| | | | | TOTAL NET ASSETS 100.0% | | $ | 162,230,273 | | |
(a) Non-income producing.
(b) The rate quoted is the annualized seven-day effective yield as of December 31, 2014.
The Global Industry Classification Standard (GICS®) was developed by and/or is the exclusive property of MSCI, Inc. and Standard & Poor's Financial Services LLC ("S&P"). GICS is a service mark of MSCI and S&P and has been licensed for use by Mairs and Power, Inc.
See accompanying Notes to Financial Statements.
31
STATEMENTS OF ASSETS AND LIABILITIES December 31, 2014
| | | Mairs & Power
Growth Fund | | Mairs & Power
Balanced Fund | | Mairs & Power
Small Cap Fund | |
ASSETS | |
| Investments, at fair value (Note 1): | |
Unaffiliated securities * | | $ | 4,131,608,656 | | | $ | 717,198,917 | | | $ | 162,123,891 | | |
| Affiliated securities (Note 5) * | | | 161,324,188 | | | | - | | | | - | | |
| | | | 4,292,932,844 | | | | 717,198,917 | | | | 162,123,891 | | |
Cash | | | - | | | | 5,750 | | | | - | | |
Receivable for Fund shares sold | | | 3,510,124 | | | | 5,014,126 | | | | 727,130 | | |
Receivable for securities sold | | | 3,423,567 | | | | - | | | | - | | |
Dividends and interest receivable | | | 6,595,034 | | | | 3,315,837 | | | | 121,458 | | |
Prepaid expenses and other assets | | | 143,043 | | | | 41,225 | | | | 15,787 | | |
| | | | 4,306,604,612 | | | | 725,575,855 | | | | 162,988,266 | | |
LIABILITIES | |
Payable for Fund shares redeemed | | | 4,067,342 | | | | 1,073,109 | | | | 215,401 | | |
Payable for securities purchased | | | 2,503,492 | | | | 1,145,328 | | | | 380,228 | | |
| Accrued investment management fees (Note 2) | | | 2,033,440 | | | | 363,414 | | | | 119,764 | | |
| Accrued Fund administration fees (Note 2) | | | 113,790 | | | | 17,550 | | | | 2,818 | | |
Accrued legal and audit expense | | | 15,119 | | | | 18,791 | | | | 9,133 | | |
Accrued transfer agent fees | | | 200,499 | | | | 30,838 | | | | 9,363 | | |
Accrued expenses and other liabilities | | | 195,639 | | | | 63,373 | | | | 21,286 | | |
| | | | 9,129,321 | | | | 2,712,403 | | | | 757,993 | | |
NET ASSETS | | $ | 4,297,475,291 | | | $ | 722,863,452 | | | $ | 162,230,273 | | |
NET ASSETS CONSIST OF | |
Portfolio capital | | $ | 2,235,796,602 | | | $ | 558,875,525 | | | $ | 130,675,574 | | |
Undistributed net investment income | | | 205,029 | | | | 23,149 | | | | 433 | | |
Accumulated net realized gain (loss)
on investments | | | (185,994 | ) | | | 366 | | | | (1,099,740 | ) | |
Net unrealized appreciation on investments | | | 2,061,659,654 | | | | 163,964,412 | | | | 32,654,006 | | |
TOTAL NET ASSETS | | $ | 4,297,475,291 | | | $ | 722,863,452 | | | $ | 162,230,273 | | |
Fund shares, par value | | $ | 0.01 | | | $ | 0.01 | | | $ | 0.01 | | |
Authorized | | | unlimited | | | | unlimited | | | | unlimited | | |
Fund shares issued and outstanding | | | 36,982,504 | | | | 8,329,227 | | | | 7,849,315 | | |
Net asset value per share | | $ | 116.20 | | | $ | 86.79 | | | $ | 20.67 | | |
* Cost of investments | |
Cost of unaffiliated securities | | $ | 2,153,971,777 | | | $ | 553,234,505 | | | $ | 129,469,885 | | |
| Cost of affiliated securities (Note 5) | | | 77,301,413 | | | | - | | | | - | | |
| | | $ | 2,231,273,190 | | | $ | 553,234,505 | | | $ | 129,469,885 | | |
See accompanying Notes to Financial Statements.
32
STATEMENTS OF OPERATIONS Year Ended December 31, 2014
| | | Mairs & Power
Growth Fund | | Mairs & Power
Balanced Fund | | Mairs & Power
Small Cap Fund | |
INVESTMENT INCOME | |
Income: | |
Dividends from unaffiliated securities * | | $ | 80,778,754 | | | $ | 9,665,772 | | | $ | 2,023,516 | | |
| Dividends from affiliated securities (Note 5) | | | 1,933,704 | | | | - | | | | - | | |
Interest income | | | 12,736 | | | | 10,242,372 | | | | 479 | | |
TOTAL INCOME | | | 82,725,194 | | | | 19,908,144 | | | | 2,023,995 | | |
Expenses: | |
| Investment management fees (Note 2) | | | 23,157,484 | | | | 3,835,583 | | | | 1,218,302 | | |
| Fund administration fees (Note 2) | | | 738,643 | | | | 93,047 | | | | 18,500 | | |
Fund accounting | | | 438,309 | | | | 141,708 | | | | 42,871 | | |
| Trustees' compensation (Note 2) | | | 150,567 | | | | 23,028 | | | | 3,543 | | |
Transfer agent fees | | | 1,466,491 | | | | 250,120 | | | | 71,747 | | |
Custodian fees | | | 248,335 | | | | 45,048 | | | | 7,825 | | |
Legal and audit fees | | | 90,768 | | | | 77,203 | | | | 28,153 | | |
Printing and mailing fees | | | 210,486 | | | | 58,348 | | | | 13,463 | | |
Other expenses | | | 194,815 | | | | 80,367 | | | | 43,727 | | |
TOTAL EXPENSES | | | 26,695,898 | | | | 4,604,452 | | | | 1,448,131 | | |
NET INVESTMENT INCOME | | | 56,029,296 | | | | 15,303,692 | | | | 575,864 | | |
| REALIZED AND UNREALIZED GAIN (Note 4) | |
Net realized gain on investments | |
Unaffiliated issuers | | | 80,557,296 | | | | 725,618 | | | | 2,028,819 | | |
| Affiliated issuers (Note 5) | | | 5,226,731 | | | | - | | | | - | | |
| | | | 85,784,027 | | | | 725,618 | | | | 2,028,819 | | |
Change in net unrealized appreciation
on investments | | | 186,205,036 | | | | 33,547,192 | | | | 6,724,120 | | |
NET GAIN ON INVESTMENTS | | | 271,989,063 | | | | 34,272,810 | | | | 8,752,939 | | |
NET INCREASE IN NET ASSETS FROM
OPERATIONS | | $ | 328,018,359 | | | $ | 49,576,502 | | | $ | 9,328,803 | | |
* Net of foreign taxes withheld of: | | $ | 292,771 | | | $ | - | | | $ | - | | |
See accompanying Notes to Financial Statements.
33
Mairs & Power Growth Fund
STATEMENTS OF CHANGES IN NET ASSETS
| | | Year Ended December 31, | |
| | | 2014 | | 2013 | |
OPERATIONS | |
Net investment income | | $ | 56,029,296 | | | $ | 41,502,430 | | |
Net realized gain on investments sold | | | 85,784,027 | | | | 51,243,031 | | |
Net change in unrealized appreciation of investments | | | 186,205,036 | | | | 884,122,040 | | |
NET INCREASE IN NET ASSETS FROM OPERATIONS | | | 328,018,359 | | | | 976,867,501 | | |
DISTRIBUTIONS TO SHAREHOLDERS FROM | |
Net investment income | | | (55,824,267 | ) | | | (41,528,667 | ) | |
Net realized gain on investments sold | | | (86,125,609 | ) | | | (50,373,680 | ) | |
TOTAL DISTRIBUTIONS TO SHAREHOLDERS | | | (141,949,876 | ) | | | (91,902,347 | ) | |
CAPITAL TRANSACTIONS | |
Proceeds from shares sold | | | 544,753,954 | | | | 948,848,009 | | |
Reinvestment of distributions from net investment income and
net realized gains | | | 133,193,951 | | | | 86,459,055 | | |
Cost of shares redeemed | | | (531,070,805 | ) | | | (453,949,065 | ) | |
INCREASE IN NET ASSETS FROM CAPITAL
TRANSACTIONS | | | 146,877,100 | | | | 581,357,999 | | |
TOTAL INCREASE IN NET ASSETS | | | 332,945,583 | | | | 1,466,323,153 | | |
NET ASSETS | |
Beginning of year | | | 3,964,529,708 | | | | 2,498,206,555 | | |
End of year (including undistributed net investment income
of $205,029 and $0, respectively) | | $ | 4,297,475,291 | | | $ | 3,964,529,708 | | |
FUND SHARE TRANSACTIONS | |
Shares sold | | | 4,860,694 | | | | 9,744,654 | | |
Shares issued for reinvested distributions | | | 1,139,114 | | | | 805,337 | | |
Shares redeemed | | | (4,704,753 | ) | | | (4,621,611 | ) | |
NET INCREASE IN FUND SHARES | | | 1,295,055 | | | | 5,928,380 | | |
See accompanying Notes to Financial Statements.
34
Mairs & Power Balanced Fund
STATEMENTS OF CHANGES IN NET ASSETS
| | | Year Ended December 31, | |
| | | 2014 | | 2013 | |
OPERATIONS | |
Net investment income | | $ | 15,303,692 | | | $ | 11,248,578 | | |
Net realized gain on investments sold | | | 725,618 | | | | 705,596 | | |
Net change in unrealized appreciation of investments | | | 33,547,192 | | | | 63,949,813 | | |
NET INCREASE IN NET ASSETS FROM OPERATIONS | | | 49,576,502 | | | | 75,903,987 | | |
DISTRIBUTIONS TO SHAREHOLDERS FROM | |
Net investment income | | | (15,372,720 | ) | | | (11,171,121 | ) | |
Net realized gain on investments sold | | | (725,533 | ) | | | (719,086 | ) | |
TOTAL DISTRIBUTIONS TO SHAREHOLDERS | | | (16,098,253 | ) | | | (11,890,207 | ) | |
CAPITAL TRANSACTIONS | |
Proceeds from shares sold | | | 209,088,383 | | | | 298,382,916 | | |
Reinvestment of distributions from net investment income and
net realized gains | | | 15,406,907 | | | | 11,327,201 | | |
Cost of shares redeemed | | | (99,425,514 | ) | | | (96,318,153 | ) | |
INCREASE IN NET ASSETS FROM CAPITAL
TRANSACTIONS | | | 125,069,776 | | | | 213,391,964 | | |
TOTAL INCREASE IN NET ASSETS | | | 158,548,025 | | | | 277,405,744 | | |
NET ASSETS | |
Beginning of year | | | 564,315,427 | | | | 286,909,683 | | |
End of year (including undistributed net investment income of $23,149
and $92,177, respectively) | | $ | 722,863,452 | | | $ | 564,315,427 | | |
FUND SHARE TRANSACTIONS | |
Shares sold | | | 2,474,800 | | | | 3,897,106 | | |
Shares issued for reinvested distributions | | | 180,250 | | | | 144,196 | | |
Shares redeemed | | | (1,181,522 | ) | | | (1,236,314 | ) | |
NET INCREASE IN FUND SHARES | | | 1,473,528 | | | | 2,804,988 | | |
See accompanying Notes to Financial Statements.
35
Mairs & Power Small Cap Fund
STATEMENTS OF CHANGES IN NET ASSETS
| | | Year Ended December 31, | |
| | | 2014 | | 2013 | |
OPERATIONS | |
Net investment income | | $ | 575,864 | | | $ | 288,710 | | |
Net realized gain on investments sold | | | 2,028,819 | | | | 1,197,210 | | |
Net change in unrealized appreciation of investments | | | 6,724,120 | | | | 21,747,471 | | |
NET INCREASE IN NET ASSETS FROM OPERATIONS | | | 9,328,803 | | | | 23,233,391 | | |
DISTRIBUTIONS TO SHAREHOLDERS FROM | |
Net investment income | | | (569,257 | ) | | | (302,949 | ) | |
Net realized gain on investments sold | | | (2,834,620 | ) | | | (1,482,078 | ) | |
TOTAL DISTRIBUTIONS TO SHAREHOLDERS | | | (3,403,877 | ) | | | (1,785,027 | ) | |
CAPITAL TRANSACTIONS | |
Proceeds from shares sold | | | 60,699,525 | | | | 83,330,634 | | |
Reinvestment of distributions from net investment income and
net realized gains | | | 3,281,967 | | | | 1,737,734 | | |
Cost of shares redeemed* | | | (19,162,440 | ) | | | (36,674,304 | ) | |
INCREASE IN NET ASSETS FROM CAPITAL
TRANSACTIONS | | | 44,819,052 | | | | 48,394,064 | | |
TOTAL INCREASE IN NET ASSETS | | | 50,743,978 | | | | 69,842,428 | | |
NET ASSETS | |
Beginning of year | | | 111,486,295 | | | | 41,643,867 | | |
End of year (including undistributed net investment income of $433
and $0, respectively) | | $ | 162,230,273 | | | $ | 111,486,295 | | |
FUND SHARE TRANSACTIONS | |
Shares sold | | | 3,008,547 | | | | 4,907,583 | | |
Shares issued for reinvested distributions | | | 157,787 | | | | 88,208 | | |
Shares redeemed | | | (953,045 | ) | | | (2,233,782 | ) | |
NET INCREASE IN FUND SHARES | | | 2,213,289 | | | | 2,762,009 | | |
| * Net of redemption fees of: | | $ | 24,735 | | | $ | 2,150 | | |
See accompanying Notes to Financial Statements.
36
NOTES TO FINANCIAL STATEMENTS December 31, 2014
Note 1 – Organization and Significant Accounting Policies
The Mairs & Power Funds Trust (the Trust) is a no-load, diversified, open-end management investment company registered under the Investment Company Act of 1940, as amended (the 1940 Act). Mairs & Power Growth Fund (the Growth Fund), Mairs & Power Balanced Fund (the Balanced Fund), and Mairs & Power Small Cap Fund (the Small Cap Fund) (individually a Fund and collectively the Funds) are series within the Trust. The objective of the Growth Fund is to provide shareholders with a diversified portfolio of common stocks, which have the potential for above-average, long-term appreciation. The objectives of the Balanced Fund are to provide shareholders with regular current income, the potential for capital appreciation and a moderate level of risk by investing in a diversified portfolio including bonds, preferred stocks, common stocks, and other securities convertible into common stock. The objective of the Fund is also to provide a current income yield of at least 25% greater than that of the S&P 500 Total Return Index. The objective of the Small Cap Fund is to seek above-average, long-term appreciation. Each Fund is an investment company and accordingly follows the investment company accounting and reporting guidance of the Financial Accounting Standards Board (FASB) Accounting Standard Codification Topic 946 "Financial Services – Investment Companies."
Significant accounting policies of the Funds are as follows:
Security Valuations
Security valuations for the Funds' investments are furnished by independent pricing services that have been approved by the Trust's Board of Trustees (the Board). Investments in listed equity securities are valued at the last quoted sale price on the securities exchange on which such securities are principally traded or at the NASDAQ Official Closing Price if readily available for such securities on each business day. Other equity securities traded in the over-the-counter market and listed equity securities for which no sale was reported on that date are valued at the last quoted bid price. Debt obligations exceeding 60 days to maturity are valued using prices furnished by an independent pricing service. The pricing services may employ methodologies that utilize actual market transactions, broker-dealer supplied valuations, or other formula-driven valuation techniques. These techniques generally consider overall market conditions and such factors as yields or prices of bonds of comparable quality, type of issue, coupon, maturity and ratings. Debt obligations with 60 days or less remaining until maturity may be valued using prices furnished by an independent pricing service or at their amortized cost, which approximates market.
Securities for which prices are not available from an independent pricing service, but where an active market exists, are valued using market quotations obtained from two or more dealers that make markets in the securities. When market quotations are not readily available, or when the last quoted sale price is not considered representative of the value of the security if it were to be sold on that day, the security will be valued at fair value as determined in good faith by the Fair Value Committee appointed by the Board, pursuant to procedures approved by the Board.
Factors that may be considered in determining the fair value of a security are fundamental analytical data relating to the security, the nature and duration of any restrictions on the disposition of the security, and the forces influencing the market in which the security is purchased or sold. As of December 31, 2014, no securities in the Funds were valued using this method.
Fair Valuation Measurements
The Trust has adopted authoritative fair valuation accounting standards, which establish a definition of fair value and set out a hierarchy for measuring fair value. These standards require additional disclosures about the various inputs and valuation techniques used to develop the measurements of fair value and changes in valuation techniques and related inputs during the period. These inputs are summarized in the three broad levels listed below:
• Level 1 – Quoted prices in active markets for identical securities.
• Level 2 – Other significant observable inputs (including quoted prices for similar securities, interest rates, prepayment speeds, credit risk, etc.).
• Level 3 – Significant unobservable inputs (including the Funds' own assumptions in determining the fair value of investments).
37
NOTES TO FINANCIAL STATEMENTS (continued) December 31, 2014
Note 1 – Organization and Significant Accounting Policies (continued)
The inputs or methodologies used for valuing securities are not necessarily an indication of the risk associated with investing in those securities. The following is a summary of the inputs used to value the net assets of each Fund as of December 31, 2014:
| | | Growth Fund | | Balanced Fund | | Small Cap Fund | |
Level 1* | | $ | 4,292,932,844 | | | $ | 465,790,473 | | | $ | 162,123,891 | | |
Level 2** | | | - | | | | 251,408,444 | | | | - | | |
Level 3 | | | - | | | | - | | | | - | | |
Total | | $ | 4,292,932,844 | | | $ | 717,198,917 | | | $ | 162,123,891 | | |
* All Level 1 investments are equity securities (common stocks, preferred stocks and preferred securities) and short-term investments.
** All Level 2 investments are fixed income securities, excluding preferred securities.
For detail of securities by major sector classification for the Funds, please refer to the Schedules of Investments.
The Funds had no transfers amongst levels during the period and did not hold any Level 3 investments at either December 31, 2014 or December 31, 2013.
Security Transactions and Investment Income
Security transactions are recorded on the date on which securities are purchased or sold. Dividend income and corporate action transactions are recorded on the ex-dividend date. Interest income, including the accretion of discounts and amortization of premiums, is recorded on an accrual basis. Premiums and discounts are amortized using the effective interest method. Realized gains and losses are reported on an identified cost basis.
Income Taxes
Each Fund is a "regulated investment company" as defined in Subtitle A, Chapter 1, Subchapter M of the Internal Revenue Code, as amended (the Code). No provisions have been made for federal income taxes as it is the intention of each Fund to comply with the provisions of the Code applicable to regulated investment companies and to make distributions of income and realized gains sufficient to relieve it from all or substantially all excise and income taxes.
As of December 31, 2014, the Trust did not have any tax positions that did not meet the "more-likely-than-not" threshold of being sustained by the applicable tax authority. Generally, tax authorities can examine all tax returns filed for the last three years.
As of December 31, 2014, the Funds did not have any post-enactment capital loss carryforwards. The Small Cap Fund has a year end of October 31 for capital gains. At December 31, 2014, the Small Cap Fund deferred, on a tax basis, post-October losses of $1,036,472.
Basis of Presentation
The preparation of financial statements in conformity with U.S. generally accepted accounting principles (GAAP) requires management to make estimates and assumptions that affect the reported amount of net assets and liabilities and disclosure of contingent assets and liabilities at the date of the financial statements and the reported results of operations during the reporting period. Actual results could differ from those estimates.
In preparing these financial statements, the Funds have evaluated events and transactions for potential recognition or disclosure through the date the financial statements were available to be issued.
38
NOTES TO FINANCIAL STATEMENTS (continued) December 31, 2014
Note 2 – Related-Party Transactions
Common expenses incurred by the Trust are allocated among the Funds based on their relative assets. Fund specific expenses are charged directly to the Fund that incurred the expense.
Investment Management and Fund Administration Fees
The Adviser provides investment management services to the Funds under a written agreement (the Management Agreement) approved by the Board. Pursuant to the Management Agreement, the Adviser is paid a monthly fee on average daily net assets at the following annual rates:
| | | Growth Fund | | Balanced Fund | | Small Cap Fund* | |
Up to $2.5 Billion | | | 0.60 | % | | | 0.60 | % | | | 0.90 | % | |
Over $2.5 Billion | | | 0.50 | % | | | 0.60 | % | | | 0.90 | % | |
The Adviser provides fund administration services to the Funds under a written fund administration servicing agreement approved by the Board. The fund administration fee paid to the Adviser is computed at an annual rate of 0.00281% of average daily net assets. Fund administration fees incurred for the year ended December 31, 2014 and fund administration fees payable to the Adviser as of December 31, 2014 were as follows:
| | | Growth Fund | | Balanced Fund | | Small Cap Fund | |
Fund administration fees incurred | | $ | 116,095 | | | $ | 17,964 | | | $ | 3,804 | | |
Fund administration fees payable | | | 10,235 | | | | 1,702 | | | | 374 | | |
Pursuant to a sub-administration agreement between the Funds and U.S. Bancorp Fund Services, LLC (USBFS), the Funds are charged a sub-administration fee paid to USBFS. Sub-administration fees from USBFS incurred for the year ended December 31, 2014 and sub-administration fees payable to USBFS as of December 31, 2014 were as follows:
| | | Growth Fund | | Balanced Fund | | Small Cap Fund | |
Sub-administration fees paid | | $ | 622,548 | | | $ | 75,083 | | | $ | 14,696 | | |
Sub-administration fees payable | | | 103,555 | | | | 15,848 | | | | 2,444 | | |
* The Adviser has agreed to waive the Small Cap Fund's investment management and fund administration fees and reimburse expenses to the extent necessary to prevent total annual fund operating expenses (excluding interest, taxes, brokerage commissions, acquired fund fees and expenses (which are indirect fees and expenses that funds incur from investing in the shares of other mutual funds, such as money market funds), other investment-related costs and other extraordinary expenses, such as litigation and other expenses not incurred in the ordinary course of the Small Cap Fund's business) from exceeding 1.25% of daily net assets through April 30, 2015. The Adviser cannot terminate this arrangement before that date without the agreement of the Board.
Trustees' Compensation
The Funds pay compensation to the disinterested Trustees of the Trust. The Funds do not pay remuneration to officers or to Trustees who are officers, directors or employees of the Adviser.
Note 3 – Indemnifications
In the normal course of business, the Trust enters into contracts that contain general indemnifications to other parties. The Trust's maximum exposure under these contracts is unknown as this would involve future claims that may be made against the Trust that have not yet occurred. The Trust expects the risk of loss to be remote.
39
NOTES TO FINANCIAL STATEMENTS (continued) December 31, 2014
Note 4 – Distributions Paid, Distributable Earnings and Investment Transactions
Net investment income and net realized capital gains (losses) may differ for financial reporting and tax purposes because of temporary or permanent book/tax differences. In addition, GAAP requires that certain components of net assets relating to permanent differences be reclassified between financial and tax reporting. These reclassifications have no effect on net assets or net asset value per share. On the Statement of Assets and Liabilities, the following reclassifications were made for the year ended December 31, 2014:
| | | Undistributed
Net Investment
Income | | Undistributed
Net Realized
Gain (Loss) | |
Small Cap Fund | | $ | (6,174 | ) | | $ | 6,174 | | |
Distributions to shareholders are determined in accordance with income tax regulations that may differ from GAAP, and due to the timing of the distributions, the fiscal year in which the amounts are distributed may differ from the year that the income or realized gains (losses) were recorded by each Fund.
The tax character of distributions paid during the years ended December 31, 2014 and December 31, 2013, were as follows:
Year ended December 31, 2014 | |
Distributions paid from: | | Growth Fund | | Balanced Fund | | Small Cap Fund | |
Ordinary income | | $ | 55,824,267 | | | $ | 15,401,379 | | | $ | 569,257 | | |
Long-term capital gains | | | 86,125,609 | | | | 696,874 | | | | 2,834,620 | | |
Total distributions paid | | $ | 141,949,876 | | | $ | 16,098,253 | | | $ | 3,403,877 | | |
Year ended December 31, 2013 | |
Distributions paid from: | | Growth Fund | | Balanced Fund | | Small Cap Fund | |
Ordinary income | | $ | 41,523,920 | | | $ | 11,171,731 | | | $ | 287,673 | | |
Long-term capital gains | | | 50,378,427 | | | | 718,476 | | | | 1,497,354 | | |
Total distributions paid | | $ | 91,902,347 | | | $ | 11,890,207 | | | $ | 1,785,027 | | |
Ordinary income distributions include net short-term capital gains. The Funds designate the long-term capital gains presented above as capital gains dividends under the Internal Revenue Code.
40
NOTES TO FINANCIAL STATEMENTS (continued) December 31, 2014
Note 4 – Distributions Paid, Distributable Earnings and Investment Transactions (continued)
At December 31, 2014, the components of accumulated earnings (losses) on a tax basis were as follows:
| | Growth Fund | | Balanced Fund | | Small Cap Fund | |
Cost of investments | | $ | 2,232,065,087 | | | $ | 553,234,505 | | | $ | 129,533,153 | | |
Gross unrealized appreciation | | $ | 2,100,312,918 | | | $ | 173,607,417 | | | $ | 37,249,153 | | |
Gross unrealized depreciation | | | (39,445,161 | ) | | | (9,643,005 | ) | | | (4,658,415 | ) | |
Net unrealized appreciation | | $ | 2,060,867,757 | | | $ | 163,964,412 | | | $ | 32,590,738 | | |
Undistributed ordinary income | | $ | 205,029 | | | $ | 23,222 | | | $ | 433 | | |
Undistributed long-term capital gains | | | 605,903 | | | | 293 | | | | - | | |
Total distributable earnings | | $ | 810,932 | | | $ | 23,515 | | | $ | 433 | | |
Other accumulated earnings | | | - | | | | - | | | | (1,036,472 | ) | |
Total accumulated earnings | | $ | 2,061,678,689 | | | $ | 163,987,927 | | | $ | 31,554,699 | | |
The difference between book basis and tax basis unrealized appreciation is attributable primarily to the tax deferrals of losses on wash sales and the tax cost basis adjustment due to receipt of return of capital distributions from certain investments.
Purchases and sales of investment securities, excluding government securities, short-term securities and temporary cash investments, during the year ended December 31, 2014 were as follows:
| | | Purchases | | Sales | |
Growth Fund | | $ | 355,854,786 | | | $ | 260,329,258 | | |
Balanced Fund | | | 126,162,785 | | | | 13,438,544 | | |
Small Cap Fund | | | 62,314,540 | | | | 21,106,703 | | |
Purchases and sales of government securities during the year ended December 31, 2014 were as follows:
| | | Purchases | | Sales | |
Growth Fund | | $ | - | | | $ | - | | |
Balanced Fund | | | 27,446,933 | | | | 14,361,250 | | |
Small Cap Fund | | | - | | | | - | | |
Note 5 – Transactions With Affiliated Companies
The Growth Fund owned 5% or more of the voting securities of the following companies during the year ended December 31, 2014. As a result, these companies are deemed to be affiliates of the Growth Fund as defined by the Investment Company Act of 1940. Transactions during the period in these securities of affiliated companies were as follows:
Growth Fund
| | | Share Activity | | | | | |
Security Name | | Balance
12/31/13 | | Purchases | | Sales | | Balance
12/31/14 | | Dividend
Income | | Fair Value at
12/31/14 | |
Badger Meter Inc | | | 429,500 | | | | 354,799 | | | | - | | | | 784,299 | | | $ | 555,286 | | | $ | 46,548,146 | | |
MTS Systems Corp | | | 1,200,000 | | | | - | | | | 128,975 | | | | 1,071,025 | | | | 1,378,418 | | | | 80,359,006 | | |
NVE Corp | | | 486,185 | | | | - | | | | - | | | | 486,185 | | | | - | | | | 34,417,036 | | |
| | | | | | | | | | | $ | 1,933,704 | | | $ | 161,324,188 | | |
41
Mairs & Power Growth Fund
FINANCIAL HIGHLIGHTS
SELECTED DATA AND RATIOS
(for a share outstanding throughout each year)
| | | Year Ended December 31, | |
| | | 2014 | | 2013 | | 2012 | | 2011 | | 2010 | |
Per Share | |
Net asset value, beginning of year | | $ | 111.09 | | | $ | 83.95 | | | $ | 70.78 | | | $ | 72.16 | | | $ | 63.12 | | |
Income from investment operations: | |
Net investment income | | | 1.54 | | | | 1.23 | | | | 1.33 | | | | 1.01 | | | | 0.86 | | |
Net realized and unrealized gain (loss) | | | 7.48 | | | | 28.58 | | | | 14.08 | | | | (0.45 | ) | | | 10.01 | | |
Total from investment operations | | | 9.02 | | | | 29.81 | | | | 15.41 | | | | 0.56 | | | | 10.87 | | |
Distributions to shareholders from: | |
Net investment income | | | (1.53 | ) | | | (1.23 | ) | | | (1.34 | ) | | | (1.00 | ) | | | (0.86 | ) | |
Net realized gains on investments sold | | | (2.38 | ) | | | (1.44 | ) | | | (0.90 | ) | | | (0.94 | ) | | | (0.97 | ) | |
Contribution from Adviser | | | - | | | | - | | | | - | | | | - | | | | (0.04 | )(1) | |
Total distributions | | | (3.91 | ) | | | (2.67 | ) | | | (2.24 | ) | | | (1.94 | ) | | | (1.87 | ) | |
Contribution from Adviser | | | - | | | | - | | | | - | | | | - | | | | 0.04 | (1) | |
Net asset value, end of year | | $ | 116.20 | | | $ | 111.09 | | | $ | 83.95 | | | $ | 70.78 | | | $ | 72.16 | | |
Total investment return | | | 8.12 | % | | | 35.64 | % | | | 21.91 | % | | | 0.74 | % | | | 17.40 | %(2) | |
Net assets, end of year, in thousands | | $ | 4,297,475 | | | $ | 3,964,530 | | | $ | 2,498,207 | | | $ | 1,975,127 | | | $ | 2,040,709 | | |
Ratios/supplemental data: | |
Ratio of expenses to average net assets | | | 0.65 | % | | | 0.67 | % | | | 0.70 | % | | | 0.72 | % | | | 0.71 | % | |
Ratio of net investment income to average net assets | | | 1.36 | | | | 1.27 | | | | 1.69 | | | | 1.40 | | | | 1.26 | | |
Portfolio turnover rate | | | 6.42 | | | | 3.79 | | | | 1.58 | | | | 2.78 | | | | 1.81 | | |
(1) The Fund received two contributions from the Adviser related to prospect services and other expenses paid by the Fund from 1980-2009, which were in violation of the Investment Company Act of 1940. The contribution amounts, including imputed interest, were $1,192,736, or $0.04 per share based upon shares outstanding on May 21, 2010 and $8,271 or $0.0003 per share based on shares outstanding as of September 24, 2010.
(2) For the year ended December 31, 2010, 0.08% of the Fund's total return was a result of contributions as described in footnote 1 above. Excluding the contributions, total investment return would have been 17.32%.
See accompanying Notes to Financial Statements.
42
Mairs & Power Balanced Fund
FINANCIAL HIGHLIGHTS
SELECTED DATA AND RATIOS
(for a share outstanding throughout each year)
| | | Year Ended December 31, | |
| | | 2014 | | 2013 | | 2012 | | 2011 | | 2010 | |
Per Share | |
Net asset value, beginning of year | | $ | 82.31 | | | $ | 70.83 | | | $ | 62.15 | | | $ | 62.01 | | | $ | 55.76 | | |
Income from investment operations: | |
Net investment income | | | 1.98 | | | | 1.79 | | | | 1.89 | | | | 1.85 | | | | 1.81 | | |
Net realized and unrealized gain (loss) | | | 4.59 | | | | 11.58 | | | | 8.79 | | | | 0.13 | | | | 6.29 | | |
Total from investment operations | | | 6.57 | | | | 13.37 | | | | 10.68 | | | | 1.98 | | | | 8.10 | | |
Distributions to shareholders from: | |
Net investment income | | | (2.00 | ) | | | (1.78 | ) | | | (1.91 | ) | | | (1.83 | ) | | | (1.81 | ) | |
Net realized gains on investments sold | | | (0.09 | ) | | | (0.11 | ) | | | (0.09 | ) | | | (0.01 | ) | | | (0.04 | ) | |
Contribution from Adviser | | | - | | | | - | | | | - | | | | - | | | | (0.06 | )(1) | |
Return of capital | | | - | | | | - | | | | - | | | | - | | | | (0.00 | )(2) | |
Total distributions | | | (2.09 | ) | | | (1.89 | ) | | | (2.00 | ) | | | (1.84 | ) | | | (1.91 | ) | |
Contribution from Adviser | | | - | | | | - | | | | - | | | | - | | | | 0.06 | (1) | |
Net asset value, end of year | | $ | 86.79 | | | $ | 82.31 | | | $ | 70.83 | | | $ | 62.15 | | | $ | 62.01 | | |
Total investment return | | | 8.04 | % | | | 19.02 | % | | | 17.34 | % | | | 3.23 | % | | | 14.87 | %(3) | |
Net assets, end of year, in thousands | | $ | 722,863 | | | $ | 564,315 | | | $ | 286,910 | | | $ | 186,660 | | | $ | 169,400 | | |
Ratios/supplemental data: | |
Ratio of expenses to average net assets | | | 0.72 | % | | | 0.72 | % | | | 0.74 | % | | | 0.79 | % | | | 0.81 | % | |
Ratio of net investment income to average net assets | | | 2.39 | | | | 2.43 | | | | 2.94 | | | | 2.99 | | | | 3.13 | | |
Portfolio turnover rate | | | 4.53 | | | | 3.02 | | | | 5.46 | | | | 9.12 | | | | 5.93 | | |
(1) The Fund received two contributions from the Adviser related to prospect services and other expenses paid by the Fund from 1980-2009, which were in violation of the Investment Company Act of 1940. The contribution amounts, including imputed interest, were $161,030 or $0.06 per share based upon shares outstanding on May 21, 2010 and $5,841 or $0.002 per share based on shares outstanding as of September 24, 2010.
(2) Amount per share is less than $0.005.
(3) For the year ended December 31, 2010, 0.11% of the Fund's total return was a result of contributions as described in footnote 1 above. Excluding the contributions, total investment return would have been 14.76%.
See accompanying Notes to Financial Statements.
43
Mairs & Power Small Cap Fund
FINANCIAL HIGHLIGHTS
SELECTED DATA AND RATIOS
(for a share outstanding throughout each period)
| | | | | August 11, 2011 * | |
| | | Year Ended December 31, | | Through | |
| | | 2014 | | 2013 | | 2012 | | December 31, 2011 (1) | |
Per Share | |
Net asset value, beginning of period | | $ | 19.78 | | | $ | 14.49 | | | $ | 11.21 | | | $ | 10.00 | | |
Income from investment operations: | |
Net investment income | | | 0.08 | | | | 0.06 | | | | 0.01 | | | | 0.01 | | |
Net realized and unrealized gain (loss) | | | 1.25 | | | | 5.56 | | | | 3.42 | | | | 1.20 | | |
Total from investment operations | | | 1.33 | | | | 5.62 | | | | 3.43 | | | | 1.21 | | |
Distributions to shareholders from: | |
Net investment income | | | (0.07 | ) | | | (0.06 | ) | | | (0.02 | ) | | | - | | |
Net realized gains on investments sold | | | (0.37 | ) | | | (0.27 | ) | | | (0.13 | ) | | | - | | |
Redemption fees | | | (0.00 | )(2) | | | (0.00 | )(2) | | | - | | | | - | | |
Total distributions | | | (0.44 | ) | | | (0.33 | ) | | | (0.15 | ) | | | - | | |
Net asset value, end of period | | $ | 20.67 | | | $ | 19.78 | | | $ | 14.49 | | | $ | 11.21 | | |
Total investment return | | | 6.73 | % | | | 38.75 | % | | | 30.60 | % | | | 12.10 | % | |
Net assets, end of period, in thousands | | $ | 162,230 | | | $ | 111,486 | | | $ | 41,644 | | | $ | 5,194 | | |
Ratios/supplemental data: | |
Ratio of expenses to average net assets | |
Before expense reimbursement | | | 1.07 | % | | | 1.17 | % | | | 1.73 | % | | | 7.98 | % | |
After expense reimbursement | | | 1.07 | | | | 1.17 | | | | 1.25 | | | | 1.25 | | |
Ratio of net investment income to average net assets | |
Before expense reimbursement | | | 0.43 | % | | | 0.37 | % | | | (0.14 | )% | | | (6.41 | )% | |
After expense reimbursement | | | 0.43 | | | | 0.37 | | | | 0.34 | | | | 0.32 | | |
Portfolio turnover rate | | | 15.85 | | | | 34.91 | | | | 6.93 | | | | 4.52 | | |
* Commencement of operations.
(1) For the period ended December 31, 2011, all ratios have been annualized except total investment return and portfolio turnover.
(2) Amount per share is less than $0.005.
See accompanying Notes to Financial Statements.
44
REPORT OF INDEPENDENT REGISTERED PUBLIC ACCOUNTING FIRM
The Board of Trustees and Shareholders of Mairs & Power Funds Trust
We have audited the accompanying statements of assets and liabilities, including the schedules of investments, of Mairs & Power Funds Trust (the Trust) (comprising, respectively, Mairs & Power Balanced Fund, Mairs & Power Growth Fund, and Mairs & Power Small Cap Fund), as of December 31, 2014, and the related statements of operations for the year then ended, the statements of changes in net assets for each of the two years in the period then ended, and the financial highlights for each of the periods indicated therein. These financial statements and financial highlights are the responsibility of the Trust's management. Our responsibility is to express an opinion on these financial statements and financial highlights based on our audits.
We conducted our audits in accordance with the standards of the Public Company Accounting Oversight Board (United States). Those standards require that we plan and perform the audit to obtain reasonable assurance about whether the financial statements and financial highlights are free of material misstatement. We were not engaged to perform an audit of the Trust's internal control over financial reporting. Our audits included consideration of internal control over financial reporting as a basis for designing audit procedures that are appropriate in the circumstances, but not for the purpose of expressing an opinion on the effectiveness of the Trust's internal control over financial reporting. Accordingly, we express no such opinion. An audit also includes examining, on a test basis, evidence supporting the amounts and disclosures in the financial statements and financial highlights, assessing the accounting principles used and significant estimates made by management, and evaluating the overall financial statement presentation. Our procedures included confirmation of securities owned as of December 31, 2014, by correspondence with the custodian and brokers or by other appropriate auditing procedures where replies from brokers were not received. We believe that our audits provide a reasonable basis for our opinion.
In our opinion, the financial statements and financial highlights referred to above present fairly, in all material respects, the financial position of each of the respective funds constituting the Mairs & Power Funds Trust at December 31, 2014, the results of their operations for the year then ended, the changes in their net assets for each of the two years in the period then ended, and the financial highlights for each of the periods indicated therein, in conformity with U.S. generally accepted accounting principles.

Minneapolis, Minnesota
February 18, 2015
45
FUND EXPENSES (unaudited)
As a shareholder of the Funds, you incur two types of costs: (1) transaction costs including redemption fees and (2) ongoing expenses for the operation of the Funds (e.g., asset-based charges, such as investment management fees). The Funds are "no-load" mutual funds. As a result, shareholders pay no commissions, fees, or expenses associated with sales representatives or sales charges.
This example is intended to help you understand your ongoing costs (in dollars) of investing in the Funds and to compare these costs with the ongoing costs of investing in other mutual funds. The table below reports the Funds' expenses during the period July 1, 2014 through December 31, 2014 and includes the costs associated with a $1,000 investment.
Actual Expenses
The first line in the tables below may be used to estimate the actual expenses you paid over the reporting period. You can do this by dividing your account value by $1,000 and multiplying the result by the expense shown in the table below. For example, if your account value is $8,600, divided by $1,000 = $8.60. Multiply the result by the number in the first line under the heading entitled "Expenses Paid During Period." By doing this you can estimate the expenses you paid on your account during this period.
Hypothetical Example
The second line of the tables below provides information about hypothetical account values and hypothetical expenses based on the Funds' actual expenses and assumed returns of 5% per year before expenses, which are not the Funds' actual returns. The results may be used to provide you with a basis for comparing the ongoing costs of investing in the Funds with the ongoing costs of investing in other funds. To do so, compare these 5% hypothetical examples with the 5% hypothetical examples that appear in the shareholder reports of other funds. Please note that these hypothetical examples highlight ongoing costs only. They may not be used to estimate the actual ending account balances or expenses you paid during the period and will not help you determine the relative total costs of owning different funds.
Mairs & Power Growth Fund
| | | Beginning Account
Value 07/01/2014 | | Ending Account
Value 12/31/2014 | | Expenses Paid
During Period * | |
Actual return | | $ | 1,000.00 | | | $ | 1,081.20 | | | $ | 3.36 | | |
Hypothetical assumed 5% return | | $ | 1,000.00 | | | $ | 1,021.98 | | | $ | 3.26 | | |
* The Fund's expenses are equal to the Fund's annualized expense ratio for the most recent six-month period of 0.64%, multiplied by the average account value over the Fund's second fiscal half-year, multiplied by the number of days in the Fund's second fiscal half-year (184 days), divided by 365 days.
Mairs & Power Balanced Fund
| | | Beginning Account
Value 07/01/2014 | | Ending Account
Value 12/31/2014 | | Expenses Paid
During Period * | |
Actual return | | $ | 1,000.00 | | | $ | 1,080.40 | | | $ | 3.72 | | |
Hypothetical assumed 5% return | | $ | 1,000.00 | | | $ | 1,021.63 | | | $ | 3.62 | | |
* The Fund's expenses are equal to the Fund's annualized expense ratio for the most recent six-month period of 0.71%, multiplied by the average account value over the Fund's second fiscal half-year, multiplied by the number of days in the Fund's second fiscal half-year (184 days), divided by 365 days.
46
FUND EXPENSES (unaudited) (continued)
Mairs & Power Small Cap Fund
| | | Beginning Account
Value 07/01/2014 | | Ending Account
Value 12/31/2014 | | Expenses Paid
During Period * | |
Actual return | | $ | 1,000.00 | | | $ | 1,067.30 | | | $ | 5.52 | | |
Hypothetical assumed 5% return | | $ | 1,000.00 | | | $ | 1,019.86 | | | $ | 5.40 | | |
* The Fund's expenses are equal to the Fund's annualized expense ratio for the most recent six-month period of 1.06%, multiplied by the average account value over the Fund's second fiscal half-year, multiplied by the number of days in the Fund's second fiscal half-year (184 days), divided by 365 days.
47
Proxy Voting Policies and Procedures that the Trust uses to determine how to vote proxies relating to portfolio securities are available (i) without charge, upon request, by calling Shareholder Services at (800) 304-7404 and requesting a copy of the Statement of Additional Information (SAI) and (ii) on the Securities and Exchange Commission's (SEC's) website at www.sec.gov (access Form N-1A).
Information on how the Trust voted proxies relating to portfolio securities during the most recent 12-month period ended June 30 is available at www.mairsandpower.com and on the SEC's website at www.sec.gov.
DISCLOSURE OF PORTFOLIO HOLDINGS (unaudited)
The Trust files a complete schedule of portfolio holdings on Form N-Q for the first and third quarter-ends and on Form N-CSR for the second and fourth quarter-ends with the SEC. The Trust's Forms N-Q and N-CSR are available on the SEC's website at www.sec.gov. Forms N-Q and N-CSR may also be reviewed and copied at the SEC's Public Reference Room in Washington, D.C. Information on the operation of the Public Reference Room may be obtained by calling (800) SEC-0330.
The schedule of portfolio holdings is also printed in the Trust's semi-annual and annual reports to shareholders, which are available without charge by calling Shareholder Services at (800) 304-7404 or by visiting www.mairsandpower.com.
A complete copy of the Trust's portfolio holdings will also be available on or about 15 days following each quarter-end on the Fund's website at www.mairsandpower.com.
HOUSEHOLDING (unaudited)
In an effort to decrease costs, the Trust intends to reduce the number of duplicate Summary Prospectuses and Annual and Semi-Annual Reports you receive by sending only one copy of each to those addresses shared by two or more accounts and to shareholders reasonably believed to be from the same family or household. Once implemented, if you would like to discontinue householding for your accounts, please call Shareholder Services at (800) 304-7404 to request individual copies of these documents. Once notification to stop householding is received, the Trust will begin sending individual copies thirty days after receiving your request. This policy does not apply to account statements.
48
Our Promise to You
As a shareholder of the Mairs & Power Mutual Funds (Funds), you share both personal and financial information with us. Your privacy is important to us, and we are dedicated to safeguarding your personal and financial information.
Information Provided by Shareholders
In the normal course of doing business, we typically obtain the following non-public personal information about our shareholders:
• Personal information regarding our shareholders' identity such as name, address and social security number;
• Information regarding fund transactions effected by us; and
• Shareholder financial information such as net-worth, assets, income, bank account information and account balances.
How We Manage and Protect Your Personal Information
We do not sell information about current or former shareholders to third parties, nor is it our practice to disclose such information to third parties unless requested or permitted to do so by a shareholder or shareholder representative or, if necessary, in order to process a transaction, service an account or as permitted by law. Additionally, we may share information with outside companies that perform administrative services for us. However, our arrangements with these service providers require them to treat your information as confidential.
In order to protect your personal information, we maintain physical, electronic and procedural safeguards to protect your personal information. Our Privacy Policy restricts the use of shareholder information and requires that it be held in strict confidence.
Shareholder Notifications
We are required by law to annually provide a notice describing our privacy policy. In addition, we will inform you promptly if there are changes to our policy. Please contact us at (800) 304-7404 with questions about this notice.
OTHER INFORMATION
This report is submitted for the general information of the shareholders of the Funds. It is not authorized for distribution to prospective investors unless accompanied or preceded by an effective prospectus. An investor should consider the Funds' investment objectives, risks and expenses carefully before investing or sending money. This and other important information can be found in the Funds' summary prospectuses and full prospectus. To obtain a prospectus, please call Shareholder Services at (800) 304-7404 or vist the Funds' website at www.mairsandpower.com. Please read the prospectus carefully before investing.
This report includes forward-looking statements such as economic predictions and portfolio manager opinions. The statements are subject to change at any time based on market and other conditions. No predictions, forecasts, outlooks, expectations or beliefs are guaranteed.
49
TRUSTEES AND OFFICERS (unaudited) December 31, 2014
Information pertaining to the Trustees and Officers of the Trust is set forth below. The Statement of Additional Information includes additional information about the Trust's Trustees and is available without charge, upon request, by calling Shareholder Services at (800) 304-7404.
Name (Year of Birth)
and Address1 | | Position(s)
Held with the
Trust and
Length of
Time Served2 | | Principal Occupation(s)
During Past Five Years | | Number of
Portfolios
in Fund
Complex
Overseen by
Trustee | | Other
Directorships Held
by Trustee During
Past Five Years2 | |
PRINCIPAL OFFICER WHO IS AN INTERESTED TRUSTEE | |
Jon A. Theobald (1945) | | Secretary since 2003; Chief Compliance Officer from 2004 to 2012; Trustee since December 2012 | | • Chairman of the Board of the Investment Adviser (January 2015 to present).
• Chief Executive Officer of the Investment Adviser (2012 to present).
• President of the Investment Adviser (2007 to 2014).
• Chief Operating Officer of the Investment Adviser (2007 to 2012).
• Chief Compliance Officer of the Investment Adviser (2004 to 2012). | | | 3 | | | None | |
PRINCIPAL OFFICERS WHO ARE NOT TRUSTEES | |
Mark L. Henneman (1961) | | Vice President from 2009 to 2014; President since December 31, 2014 | | • President of the Investment Adviser (January 2015 to present).
• Chief Investment Officer of the Investment Adviser (January 2015 to present).
• Executive Vice President of the Investment Adviser (2012 to 2014).
• Vice President of the Investment Adviser (2004 to 2012). | | | N/A | | | N/A | |
Ronald L. Kaliebe (1952) | | Vice President since 2009 | | • Senior Vice President of the Investment Adviser (January 2015 to present).
• Director of Fixed Income of the Investment Adviser (January 2015 to present).
• Vice President of the Investment Adviser (2001 to 2014). | | | N/A | | | N/A | |
Andrew R. Adams (1972) | | Vice President since 2011 | | • Vice President of the Investment Adviser (2006 to present). | | | N/A | | | N/A | |
Andrea C. Stimmel (1967) | | Treasurer since 2011; Chief Compliance Officer since 2012 | | • Director of Operations and Treasurer of the Investment Adviser (2008 to present).
• Chief Compliance Officer of the Investment Adviser (2012 to present). | | | N/A | | | N/A | |
50
TRUSTEES AND OFFICERS (unaudited) (continued) December 31, 2014
Name (Year of Birth)
and Address1 | | Position(s)
Held with the
Trust and
Length of
Time Served2 | | Principal Occupation(s)
During Past Five Years | | Number of
Portfolios
in Fund
Complex
Overseen by
Trustee | | Other
Directorships Held
by Trustee During
Past Five Years2 | |
DISINTERESTED TRUSTEES | |
Norbert J. Conzemius (1941) | | Trustee since 2000; Board Chair from February 2006 to December 2014; Nominating Committee Chair since 2006 | | • Retired Chief Executive Officer, Road Rescue Incorporated. | | | 3 | | | Director, Mairs & Power Growth Fund, Inc. (2000 to 2011), Director, Mairs & Power Balanced Fund, Inc. (2000 to 2011) | |
Mary Schmid Daugherty (1958) | | Trustee since December 2010; Audit Committee Chair since December 2012 | | • Associate Professor, Department of Finance, University of St. Thomas (1987 to present). | | | 3 | | | Director, Mairs & Power Growth Fund, Inc. (2010 to 2011), Director, Mairs & Power Balanced Fund, Inc. (2010 to 2011) | |
Bert J. McKasy (1942) | | Trustee since September 2006; Board Chair since December 2014 | | • Attorney, Lindquist & Vennum, P.L.L.P. (1994 to present). | | | 3 | | | Director, Mairs & Power Growth Fund, Inc. (2006 to 2011), Director, Mairs & Power Balanced Fund, Inc. (2006 to 2011) | |
1 Unless otherwise indicated, the mailing address of each officer and trustee is: W1520 First National Bank Building, 332 Minnesota Street, Saint Paul, MN 55101-1363.
2 Mr. Conzemius, Dr. Daugherty and Mr. McKasy served as directors of Mairs & Power Growth Fund, Inc. and Mairs & Power Balanced Fund, Inc. (together, the "Predecessor Funds") prior to the reorganization of the Predecessor Funds into newly formed series of the Trust effective December 31, 2011. Positions listed in these columns for trustees and officers prior to 2012 refer to their positions with the Predecessor Funds. Each trustee serves until his or her resignation or mandatory retirement age. Each officer is elected annually and serves until his successor has been duly elected and qualified.
51
This page is intentionally left blank.
This page is intentionally left blank.
MAIRS & POWER FUNDS TRUST
Mairs & Power Growth Fund, established 1958
Mairs & Power Balanced Fund, established 1961
Mairs & Power Small Cap Fund, established 2011
A No-Load Funds Trust
For Shareholder Services
Call (800) 304-7404
Or write to:
(via Regular Mail)
c/o U.S. Bancorp Fund Services, LLC
615 East Michigan Street
P. O. Box 701
Milwaukee, WI 53201-0701 | | (via Overnight or Express Mail)
c/o U.S. Bancorp Fund Services, LLC
3rd Floor
615 East Michigan Street
Milwaukee, WI 53202-0701 | |
For Fund literature and information, visit the Trust's website at:
www.mairsandpower.com
Investment Manager
Mairs and Power, Inc.
W1520 First National Bank Building
332 Minnesota Street
Saint Paul, MN 55101
Custodian
U.S. Bank, N.A.
Custody Operations
1555 North River Center Drive, Suite 302
Milwaukee, WI 53212
Distributor
ALPS Distributors, Inc.
1290 Broadway, Suite 1100
Denver, CO 80203
Mairs and Power, Inc.
c/o U.S. Bancorp Fund Services, LLC
3rd Floor
615 East Michigan Street
Milwaukee, WI 53202-0701
Item 2. Code of Ethics.
The registrant adopted its Code of Ethics for Principal Executive Officer and Principal Financial Officer on May 17, 2012. The Code of Ethics is attached as exhibit 12(a)(1) to this form.
Item 3. Audit Committee Financial Expert.
The registrant’s Board of Trustees has determined that Dr. Mary Schmid Daugherty, a member of the registrant’s Audit Committee, is an “audit committee financial expert” as defined in Item 3 of Form N-CSR. Dr. Daugherty is “independent” under the standards set forth in Item 3 of Form N-CSR.
Item 4. Principal Accountant Fees and Services.
Year Ended
December 31, | | (a)
Audit Fees | | (b)
Audit-
Related Fees | | (c)
Tax Fees | | (d)
All Other
Fees | |
| | | | | | | | | |
2013 | | $ | 95,450 | | None | | $ | 20,100 | | None | |
2014 | | $ | 98,400 | | None | | $ | 20,700 | | None | |
(a) | Audit fees include amounts related to the audit of registrant’s annual financial statements and services normally provided by the accountant in connection with statutory and regulatory filings. |
| |
(c) | Tax fees include amounts related to tax advice and tax return preparation, compliance and reviews. |
| |
(d) | Tax consulting fee includes fees and expenses related to allowable tax consulting services. |
| |
(e)(1) | The registrant’s Audit Committee approves the engagement of the accountant before the accountant is engaged by the registrant and approved all audit and non-audit services provided to the registrant. |
| |
(e)(2) | None of such services described in columns (b) through (d) were subject to a waiver of the pre-approval requirement pursuant to paragraph (c)(7)(i)(c) of Rule 2-01 of Regulation S-X. |
| |
(f) | Not applicable |
| |
(g) | The aggregate fees for non-audit services rendered by the registrant’s accountant to the registrant were $20,100 for the fiscal year ended December 31, 2013 and $20,700 for the fiscal year ended December 31, 2014. The aggregate fees for non-audit services rendered by the registrant’s accountant to the registrant’s investment adviser were $20,350 for the fiscal year ended December 31, 2013 and $24,600 for the fiscal year ended December 31, 2014. |
| |
(h) | The registrant’s Audit Committee has considered whether the provision of non-audit services by the registrant’s accountant to the registrant’s investment adviser is compatible with maintaining the accountant’s independence. |
Item 5. Audit Committee of Listed Registrants.
Not applicable to registrants who are not listed issuers (as defined in Rule 10A-3 under the Securities Exchange Act of 1934).
Item 6. Investments.
(a) Schedule of Investments is included as part of the report to shareholders filed under Item 1 of this Form
(b) Not Applicable.
Item 7. Disclosure of Proxy Voting Policies and Procedures for Closed-End Management Investment Companies.
Not applicable to open-end investment companies.
Item 8. Portfolio Managers of Closed-End Management Investment Companies.
Not applicable to open-end investment companies.
Item 9. Purchases of Equity Securities by Closed-End Management Investment Company and Affiliated Purchasers.
Not applicable to open-end investment companies.
Item 10. Submission of Matters to a Vote of Security Holders.
There has been no material change to the procedures by which shareholders may recommend nominees to the registrant’s board of directors.
Item 11. Controls and Procedures.
(a) The registrant’s principal executive officer and principal financial officer have evaluated the registrant’s disclosure controls and procedures as of a date within 90 days of the filing of this report and have concluded that the registrant’s disclosure controls and procedures were effective, as of that date, in ensuring that information required to be disclosed by the registrant in this Form N-CSR was recorded, processed, summarized and reported within the time period specified by the SEC’s rules and forms.
(b) There were no changes in the Registrant’s internal control over financial reporting (as defined in Rule 30a-3(d) under the Act) that occurred during the second fiscal quarter of the period covered by this report that has materially affected, or is reasonably likely to materially affect, the Registrant’s internal control over financial reporting.
Item 12. Exhibits.
(a) (1) Code of Ethics
Mairs & Power Funds Trust Code of Ethics for Principal Executive Officer and Principal Financial Officer.
Incorporated by reference to previous Form N-CSR filing, filed February 28, 2014.
(2) Certifications required by Rule 30a-2(a) under the Investment Company Act of 1940.
Attached as exhibits 12(a)(2).1 and 12(a)(2).2 to this form.
(3) Any written solicitation to purchase securities under Rule 23c-1 under the Act sent or given during the period covered by the report by or on behalf of the registrant to 10 or more persons. Not applicable to open-end investment companies.
(b) Certifications pursuant to Section 906 of the Sarbanes-Oxley Act of 2002.
Attached as exhibit 12(b) to this form.
SIGNATURES
Pursuant to the requirements of the Securities Exchange Act of 1934 and the Investment Company Act of 1940, the registrant has duly caused this report to be signed on its behalf by the undersigned, thereunto duly authorized.
| (Registrant) | Mairs & Power Funds Trust | |
| | | |
| By (Signature and Title)* | | /s/ Mark L. Henneman | |
| | Mark L. Henneman, President | |
| | Principal Executive Officer | |
| | |
| Date | 2/27/15 | | |
| | | | | | | |
Pursuant to the requirements of the Securities Exchange Act of 1934 and the Investment Company Act of 1940, this report has been signed below by the following persons on behalf of the registrant and in the capacities and on the dates indicated.
| By (Signature and Title)* | | /s/ Mark L. Henneman | |
| | Mark L. Henneman, President | |
| | Principal Executive Officer | |
| | |
| Date | 2/27/15 | | |
| | |
| By (Signature and Title)* | | /s/ Andrea C. Stimmel | |
| | Andrea C. Stimmel, Treasurer | |
| | Principal Financial Officer | |
| | |
| Date | 2/27/15 | | |
| | | | | | |
* Print the name and title of each signing officer under his or her signature.