UNITED STATES
SECURITIES AND EXCHANGE COMMISSION
Washington, D.C. 20549
FORM N-CSR
CERTIFIED SHAREHOLDER REPORT OF REGISTERED
MANAGEMENT INVESTMENT COMPANIES
Investment Company Act file number | 811-22563 |
|
Mairs & Power Funds Trust |
(Exact name of registrant as specified in charter) |
|
332 Minnesota Street, Suite W1520, St. Paul, MN | | 55101 |
(Address of principal executive offices) | | (Zip code) |
|
Andrea C. Stimmel, Chief Compliance Officer & Treasurer, 332 Minnesota Street, Suite
W1520, St. Paul, MN 55101 |
(Name and address of agent for service) |
|
Registrant’s telephone number, including area code: | 651-222-8478 | |
|
Date of fiscal year end: | December 31, 2015 | |
|
Date of reporting period: | December 31, 2015 | |
| | | | | | | | |
Item 1. Reports to Stockholders.

Investing for the long-term
ANNUAL REPORT
DECEMBER 31, 2015
- GROWTH FUND (MPGFX)
est. 1958
- BALANCED FUND (MAPOX)
est. 1961
- SMALL CAP FUND (MSCFX)
est. 2011
Mairs & Power W1520 First National Bank Building, 332 Minnesota Street, St. Paul, Minnesota 55101 www.mairsandpower.com
MAIRS & POWER FUNDS MARKET COMMENTARY (unaudited)
December 31, 2015
Investors facing growing uncertainty in the sixth year of a bull market finally saw the long anticipated correction in the third quarter, with a ten-plus percentage point drop unfolding in one tumultuous week in late August. Though the market recovered in the fourth quarter, the last day of trading for the year pushed both the Dow and S&P 500 into slightly negative territory before dividends, the first down market since 2008. (The indices' total returns were positive, including dividends).
In 2015, oil prices fell to their lowest level in more than a decade, the dollar continued to strengthen against other currencies, Europe remained weak and economic growth in China slowed. These factors resulted in persistent underperformance in the Industrial, Energy and Materials sectors. The collapse in oil prices led to a sell off in high yield energy debt, putting fixed income markets on edge. Even in the face of this pressure, the U.S. economy continued its steady improvement with GDP growth inching above two percent. Nominal unemployment fell to near pre-recession levels, buoying consumer confidence and spending which drove solid performance in the Consumer Discretionary and Consumer Staples sectors as well as the Information Technology and Telecom sectors. We exited 2015 with signs of a modest recovery in Europe, unprecedented negative interest rates in several industrialized countries and continuing concerns about the impact of slowing growth in China on the global economy. Late in the year, the U.S. Federal Reserve (Fed) increased rates for the first time in a decade, reversing a six year run of near zero interest rates.
Outlook
The New Year has started off badly for the stock market. While the Fed communicated the likelihood of a series of rate increases in 2016, that doesn't seem quite as likely now given concerns over global economic conditions. The U.S. markets have reflected this uncertainty early this year.
The dividend yield is back above the yield on 10 year treasuries, favoring income stocks as an attractive asset class. Small cap stocks are trading in line with large caps on an earnings basis, essentially erasing the historical premium that faster growing small caps typically have enjoyed. This positions them to potentially perform well relative to large caps as they regain that premium. In another historical perspective, Industrials start working when things look most grim for the sector and well ahead of any evidence of improvement. We don't pretend to know when that turn will happen but in our opinion, we do know that investors get paid for being patient.
2015 was a year of two markets engaged in a tug-of-war, where consumer-facing companies did well while energy, commodities and export-oriented manufacturing companies struggled. The big question for U.S. investors in 2016 is: Who wins this tug-of-war? Will the pressure felt by the industrial sectors overwhelm the economy and push us into a slowdown or will strong job growth, low interest rates and persistently low oil prices buoy consumer confidence and spending, extending the current cycle? We remain positive, viewing the latter as more likely, with potential upside if some of the current headwinds begin to abate.
The S&P 500 Total Return (TR) Index (S&P 500) is an unmanaged index of 500 common stocks that is generally considered representative of the United States stock market. It tracks both the capital gains of a group of stocks over time, and assumes that any cash distributions, such as dividends, are reinvested back into the index. It is not possible to invest directly in an index.
Dow Jones Industrial Average TR Index (Dow) is a price-weighted average of 30 significant stocks traded on the New York Stock Exchange and the Nasdaq. It is not possible to invest directly in an index.
Dividend Yield is a ratio that shows how much a company pays out in dividends each year relative to its share price.
Gross Domestic Product (GDP) is the monetary value of all the finished goods and services produced within a country's borders in a specific time period, though GDP is usually calculated on an annual basis.
1
MAIRS & POWER GROWTH FUND (unaudited)
To Our Shareholders: December 31, 2015
The Mairs & Power Growth Fund gained 6.14% in the fourth quarter, and finished down 3.07% for the year compared with the benchmark S&P 500 Total Return (TR) which gained 7.04% for the quarter and 1.38% for the year, and the Dow Jones Industrial Average (DJIA) TR which gained 7.70% for the quarter and 0.21% for the year.
Our multi-cap approach proved a major factor affecting the Growth Fund's relative performance in 2015 as mid cap and small cap stocks lagged large cap stocks. Because both the DJIA and S&P 500 indices are made up exclusively of large cap stocks, our comparative performance lagged these large cap benchmarks. As patient investors, we remain comfortable with our multi-cap approach which includes a long-term bet on smaller companies that we expect to grow faster than larger companies.
A top contributor to Fund performance in both the fourth quarter and full year was Hormel (HRL) which gained 24.91% and 51.79% respectively. The Fund's relative performance also benefited from an overweight positon in the Health Care sector, which performed well in both the fourth quarter and the full year. In addition, relative performance benefited from an underweight position in the Energy sector which remained under pressure throughout the year.
Stratasys (SSYS) and Qualcomm (QCOM) were among bottom contributors to performance in both the quarter and the year. Stratasys is well positioned in the additive manufacturing space, but that market is currently under pressure as manufacturers are holding back expansion. Qualcomm lost a major customer and has had to negotiate lower prices to Chinese manufacturers. An overweight position and the under performance of certain stocks in the struggling Industrial sector detracted from the Fund's relative performance for the year. In addition, an extremely narrow group of large cap information technology stocks that we do not hold, Amazon (AMZN), Alphabet (GOOGL) and Microsoft (MSFT), dominated performance in 2015 in the Information Technology and Consumer Discretionary sectors as well as the broader market.
MAIRS & POWER GROWTH FUND (MPGFX)
Top Performers
Fourth Quarter (9/30/15 – 12/31/15) | | Year To Date (12/31/14 – 12/31/15) | |
CRAY INC. | | | 63.81 | % | | HORMEL FOODS CORP. | | | 51.79 | % | |
HORMEL FOODS CORP. | | | 24.91 | % | | FISERV, INC. | | | 28.87 | % | |
GENERAL ELECTRIC CO. | | | 23.51 | % | | GENERAL ELECTRIC CO. | | | 23.27 | % | |
VALSPAR CORP. | | | 15.40 | % | | TORO CO. | | | 14.51 | % | |
MEDTRONIC, INC. | | | 14.91 | % | | ECOLAB, INC. | | | 9.43 | % | |
Weak Performers
Fourth Quarter (9/30/15 – 12/31/15) | | Year To Date (12/31/14 – 12/31/15) | |
CH ROBINSON WORLD WIDE, INC. | | | -8.50 | % | | QUALCOMM INC. | | | -32.75 | % | |
TARGET CORP. | | | -7.69 | % | | DONALDSON CO., INC. | | | -25.81 | % | |
PRINCIPAL FINANCIAL GROUP | | | -4.99 | % | | PENTAIR LTD. | | | -25.43 | % | |
PENTAIR LTD. | | | -2.96 | % | | EMERSON ELECTRIC CO. | | | -22.52 | % | |
ST. JUDE MEDICAL, INC. | | | -2.09 | % | | SCHLUMBERGER, LTD. | | | -18.34 | % | |
Past performance is no guarantee of future results.
With the S&P 500 price-to-earnings ratio above its long-term average, margins trending down and an expectation for only moderate sales and earnings growth in 2016, the market is not cheap. The equity market is currently being led by a narrow group of stocks showing strong revenue growth. This market has given us the
3
MAIRS & POWER GROWTH FUND (unaudited) (continued)
opportunity to build long-term positions in very good companies at attractive valuations. As some investors pay too much for short-term performance, we are trimming selectively in stocks such as Hormel, Toro (TTC) and Fiserv (FISV). At the same time we are adding to positions in quality names, especially in the beaten down Industrial sector. One such stock we have added is Proto Labs (PRLB) which we feel is well positioned in direct digital manufacturing.
One of our portfolio companies, Fastenal (FAST), will likely be an early indicator of improving conditions in the Industrial sector. Fastenal competes in the highly fragmented industrial distribution market, serving customers in manufacturing and non-residential construction industries. Because of weakness in manufacturing, the stock declined 14% in 2015. The company is not standing flat-footed, however. Fastenal continues to invest in its business in order to strengthen its durable competitive advantage, and we like that. With more than 2,600 stores (four times as many as the next largest competitor), the company enjoys broad market coverage as it takes share from smaller regional players. Fastenal's product breadth, market penetration and in-house distribution capabilities provide both cost and pricing leverage, delivering above industry average margins. In addition, with more than 54,000 on-site industrial vending machines and plans to aggressively add to this network in 2016, Fastenal is able to grow incremental revenue while building "sticky" customer relationships. Earnings have grown 22% and the dividend 23% annually over the last five years. While not classically cheap, the stock is nevertheless very inexpensive relative to intrinsic value, providing an opportunity to add selectively to our position. When the sector begins to recover, we believe that Fastenal's strength and our patience will reward investors.
Mark L. Henneman
Lead Manager | | Andrew R. Adams
Co-Manager | |
The Fund's investment objective, risks, charges and expenses must be considered carefully before investing. The summary prospectus or full prospectus contains this and other important information about the Fund, and they may be obtained by calling Shareholder Services at (800) 304-7404 or visiting www.mairsandpower.com. Read the summary prospectus or full prospectus carefully before investing.
All holdings in the portfolio are subject to change without notice and may or may not represent current or future portfolio composition. The mention of specific securities is not intended as a recommendation or an offer of a particular security, nor is it intended to be a solicitation for the purchase or sale of any security.
All investments have risks. The Growth Fund is designed for long-term investors. Equity investments are subject to market fluctuations, and the Fund's share price can fall because of weakness in the broad market, a particular industry, or specific holdings. Investments in small and midcap companies generally are more volatile. International investing risks include among others political, social or economic instability, difficulty in predicting international trade patterns, taxation and foreign trading practices, and greater fluctuations in price than United States corporations.
Diversification does not guarantee profit or protect against loss.
The S&P 500 Total Return (TR) Index is an unmanaged index of 500 common stocks that is generally considered representative of the United States stock market. It tracks both the capital gains of a group of stocks over time, and assumes that any cash distributions, such as dividends, are reinvested back into the index. It is not possible to invest directly in an index.
Dow Jones Industrial Average TR Index is a price-weighted average of 30 significant stocks traded on the New York Stock Exchange and the Nasdaq. It is not possible to invest directly in an index.
P/E (price per earnings) Ratio is the ratio of a company's share price to its per-share earnings.
4
Mairs & Power Growth Fund
PERFORMANCE INFORMATION (unaudited) December 31, 2015
Ten years of investment performance (through December 31, 2015)
This chart illustrates the performance of a hypothetical $10,000 investment made in the Fund 10 years ago.
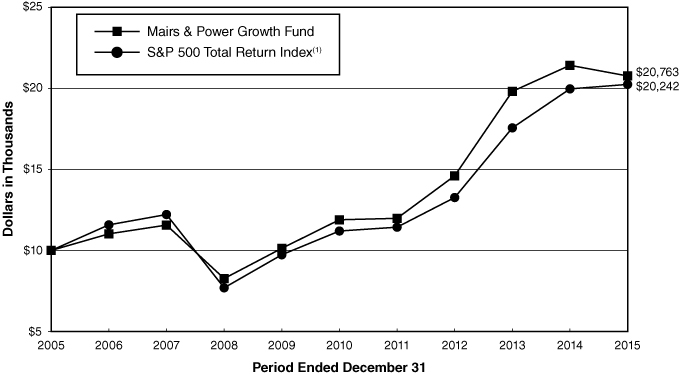
Average annual total returns for periods ended December 31, 2015
| | | 1 year | | 5 years | | 10 years | | 20 years | |
Mairs & Power Growth Fund | | | -3.07 | % | | | 11.79 | % | | | 7.58 | % | | | 10.69 | % | |
S&P 500 Total Return Index(1) | | | 1.38 | % | | | 12.57 | % | | | 7.31 | % | | | 8.19 | % | |
Performance data quoted represents past performance and does not guarantee future results. All performance information shown includes the reinvestment of dividend and capital gain distributions, but does not reflect the deduction of taxes that a shareholder would pay on Fund distributions or the redemption of Fund shares. The investment return and principal value of an investment will fluctuate so that an investor's shares, when redeemed, may be worth more or less than their original cost. Current performance of the Fund may be lower or higher than the performance quoted. For the most recent month-end performance figures, visit the Fund's website at www.mairsandpower.com or call Shareholder Services at (800) 304-7404.
(1) The S&P 500 Total Return Index is an unmanaged index of 500 common stocks which assumes reinvestment of dividends that is generally considered representative of the U.S. stock market. It is not possible to invest directly in an index.
5
Mairs & Power Growth Fund
FUND INFORMATION (unaudited) December 31, 2015
Portfolio Managers
Mark L. Henneman, lead manager since July 1, 2013, co-manager from January 1, 2006 through June 30, 2013
University of Minnesota, MBA Finance 1990
Andrew R. Adams, co-manager since January 1, 2015, University of Wisconsin-Madison, MS Finance 1997
General Information
Fund Symbol | | | MPGFX | | |
Net Asset Value (NAV) Per Share | | $ | 104.44 | | |
Expense Ratio | | | 0.65 | % | |
Portfolio Turnover Rate | | | 9.64 | % | |
Sales Charge | | | None1 | | |
Fund Inception Year | | | 1958 | | |
Portfolio Composition

Top Ten Portfolio Holdings
(Percent of Total Net Assets)2
Ecolab Inc | | | 4.7 | % | |
US Bancorp/MN | | | 4.5 | | |
| 3M Co | | | 3.9 | | |
Medtronic PLC | | | 3.8 | | |
Valspar Corp/The | | | 3.8 | | |
Honeywell International Inc | | | 3.8 | | |
Bemis Co Inc | | | 3.5 | | |
Johnson & Johnson | | | 3.5 | | |
Graco Inc | | | 3.4 | | |
General Mills Inc | | | 3.1 | | |
Portfolio Diversification
(Percent of Total Net Assets)
Common Stocks 98.6% | |
Industrials | | | 29.2 | % | |
Health Care | | | 20.2 | | |
Materials | | | 14.4 | | |
Financials | | | 11.3 | | |
Information Technology | | | 10.7 | | |
Consumer Staples | | | 5.6 | | |
Consumer Discretionary | | | 4.1 | | |
Energy | | | 2.6 | | |
Utilities | | | 0.5 | | |
Short-term Investments 1.4%3 | | | 1.4 | | |
| | | | 100.0 | % | |
1 Although the Fund is no-load, investment management fees and other expenses still apply.
2 All holdings in the portfolio are subject to change without notice and may or may not represent current or future portfolio composition. The mention of specific securities is not intended as a recommendation or offer for a particular security, nor is it intended to be a solicitation for the purchase or sale of any security.
3 Represents short-term investments and other assets and liabilities (net).
The Global Industry Classification Standard (GICS®) was developed by and/or is the exclusive property of MSCI, Inc. and Standard & Poor's Financial Services LLC ("S&P"). GICS is a service mark of MSCI, Inc. and S&P and has been licensed for use by Mairs & Power, Inc. (the "Adviser").
6
Mairs & Power Growth Fund
SCHEDULE OF INVESTMENTS December 31, 2015
Shares | | Security Description | | Fair Value | |
| | | COMMON STOCKS 98.6% | |
| | | CONSUMER DISCRETIONARY 4.1% | |
| | 1,430,000 | | | Target Corp | | $ | 103,832,300 | | |
| | 510,000 | | | Walt Disney Co/The | | | 53,590,800 | | |
| | | | 157,423,100 | | |
| | | CONSUMER STAPLES 5.6% | |
| | 2,060,000 | | | General Mills Inc | | | 118,779,600 | | |
| | 1,220,000 | | | Hormel Foods Corp | | | 96,477,600 | | |
| | | | 215,257,200 | | |
| | | ENERGY 2.6% | |
| | 1,450,000 | | | Schlumberger Ltd (a) | | | 101,137,500 | | |
| | | FINANCIALS 11.3% | |
| | 520,000 | | | American Express Co | | | 36,166,000 | | |
| | 1,910,000 | | | Associated Banc-Corp | | | 35,812,500 | | |
| | 1,730,000 | | | Principal Financial Group Inc | | | 77,815,400 | | |
| | 280,000 | | | Travelers Cos Inc/The | | | 31,600,800 | | |
| | 4,020,000 | | | US Bancorp/MN | | | 171,533,400 | | |
| | 1,530,000 | | | Wells Fargo & Co | | | 83,170,800 | | |
| | | | 436,098,900 | | |
| | | HEALTH CARE 20.2% | |
| | 980,000 | | | Baxalta Inc | | | 38,249,400 | | |
| | 1,420,000 | | | Baxter International Inc | | | 54,173,000 | | |
| | 851,450 | | | Bio-Techne Corp | | | 76,630,500 | | |
| | 1,290,000 | | | Johnson & Johnson | | | 132,508,800 | | |
| | 1,900,000 | | | Medtronic PLC (f) | | | 146,148,000 | | |
| | 790,000 | | | Patterson Cos Inc | | | 35,715,900 | | |
| | 2,360,000 | | | Pfizer Inc | | | 76,180,800 | | |
| | 1,760,000 | | | Roche Holding AG ADR (e) | | | 60,667,200 | | |
| | 1,610,000 | | | St Jude Medical Inc | | | 99,449,700 | | |
| | 530,000 | | | Zimmer Holdings Inc | | | 54,372,700 | | |
| | | | 774,096,000 | | |
| | | INDUSTRIALS 29.2% | |
| | 990,000 | | | 3M Co | | | 149,133,600 | | |
| | 1,340,000 | | | CH Robinson Worldwide Inc | | | 83,106,800 | | |
| | 283,853 | | | Deluxe Corp | | | 15,481,343 | | |
| | 3,530,000 | | | Donaldson Co Inc | | | 101,169,800 | | |
| | 1,610,000 | | | Emerson Electric Co | | | 77,006,300 | | |
| | 1,450,000 | | | Fastenal Co | | | 59,189,000 | | |
| | 280,000 | | | G&K Services Inc, Class A | | | 17,612,000 | | |
7
Mairs & Power Growth Fund
SCHEDULE OF INVESTMENTS (continued) December 31, 2015
Shares | | Security Description | | Fair Value | |
| | | COMMON STOCKS (continued) | |
| | | INDUSTRIALS (continued) | |
| | 540,000 | | | Generac Holdings Inc (b) | | $ | 16,075,800 | | |
| | 2,170,000 | | | General Electric Co | | | 67,595,500 | | |
| | 1,800,000 | | | Graco Inc | | | 129,726,000 | | |
| | 1,390,000 | | | Honeywell International Inc | | | 143,962,300 | | |
| | 1,660,000 | | | Pentair PLC (a) | | | 82,219,800 | | |
| | 150,000 | | | Proto Labs Inc (b) | | | 9,553,500 | | |
| | 1,510,000 | | | Toro Co/The | | | 110,335,700 | | |
| | 600,000 | | | United Parcel Service Inc, Class B | | | 57,738,000 | | |
| | | | 1,119,905,443 | | |
| | | INFORMATION TECHNOLOGY 10.7% | |
| | 712,227 | | | Badger Meter Inc | | | 41,729,380 | | |
| | 1,700,000 | | | Corning Inc | | | 31,076,000 | | |
| | 1,710,000 | | | Cray Inc (b) | | | 55,489,500 | | |
| | 830,000 | | | Fiserv Inc (b) | | | 75,911,800 | | |
| | 982,849 | | | MTS Systems Corp (d) | | | 62,322,455 | | |
| | 348,891 | | | NVE Corp (d) | | | 19,600,696 | | |
| | 940,000 | | | QUALCOMM Inc | | | 46,985,900 | | |
| | 980,000 | | | Stratasys Ltd (a) (b) | | | 23,010,400 | | |
| | 2,970,000 | | | Western Union Co/The | | | 53,192,700 | | |
| | | | 409,318,831 | | |
| | | MATERIALS 14.4% | |
| | 3,020,000 | | | Bemis Co Inc | | | 134,963,800 | | |
| | 1,589,999 | | | Ecolab Inc | | | 181,864,086 | | |
| | 2,481,600 | | | HB Fuller Co | | | 90,503,952 | | |
| | 1,760,000 | | | Valspar Corp/The | | | 145,992,000 | | |
| | | | 553,323,838 | | |
| | | UTILITIES 0.5% | |
| | 1,010,000 | | | MDU Resources Group Inc | | | 18,503,200 | | |
| | | | | TOTAL COMMON STOCKS
(cost $2,162,928,416) | | $ | 3,785,064,012
| | |
| | | SHORT-TERM INVESTMENTS 1.0% | |
| 37,628,649
| | | First American Prime Obligations Fund, Class Z, 0.21% (c)
(cost $37,628,649) | | $ | 37,628,649
| | |
8
Mairs & Power Growth Fund
SCHEDULE OF INVESTMENTS (continued) December 31, 2015
Shares | | Security Description | | Fair Value | |
| | | TOTAL INVESTMENTS 99.6%
(cost $2,200,557,065) | | $ | 3,822,692,661
| | |
| | | OTHER ASSETS AND LIABILITIES (NET) 0.4% | | | 14,571,602 | | |
| | | TOTAL NET ASSETS 100.0% | | $ | 3,837,264,263 | | |
(a) Foreign security denominated in U.S. dollars. As of December 31, 2015, these securities represented $206,367,700 or 5.4% of total net assets.
(b) Non-income producing.
(c) The rate quoted is the annualized seven-day effective yield as of December 31, 2015.
(d) Affiliated company at December 31, 2015.
(e) American Depositary Receipt.
(f) Issuer headquartered overseas but considered domestic. In determining whether a security is foreign or domestic, Mairs & Power, Inc. (the Adviser) will generally look at the location of the headquarters of the issuer. However, if the issuer is believed by the Adviser to be headquartered in a jurisdiction primarily for tax purposes, the Adviser will consider the following additional factors: 1) the location of the primary exchange trading its securities; 2) where it derives the majority of its revenues, or 3) where it earns the majority of its profits.
The Global Industry Classification Standard (GICS®) was developed by and/or is the exclusive property of MSCI, Inc. and Standard & Poor's Financial Services LLC ("S&P"). GICS is a service mark of MSCI, Inc. and S&P and has been licensed for use by the Adviser.
See accompanying Notes to Financial Statements.
9
MAIRS & POWER BALANCED FUND (unaudited)
To Our Shareholders: December 31, 2015
The Balanced Fund gained 3.25% in the quarter and declined 2.54% for the year compared with its benchmark Composite Index (60% S&P 500 Total Return (TR) Index and 40% Barclays Government/Credit Bond Index), which gained 3.94% and 1.13% for the three month and full year periods, respectively.
Major positive factors on equity performance for the year included an overweight position in the Health Care sector and performance of certain stocks in the Consumer Staples sector. Negative factors included an underweight position and under performance of certain stocks in the Information Technology sector as well as overweight positions in the Energy and Industrials sectors which detracted from performance.
Top performers for both the fourth quarter and full year included Hormel (HRL), up 24.91% and 51.79%, General Electric (GE), up 23.51% and 23.27% and Home Depot (HD) up 14.51% and 25.99%, respectively. United Parcel Services (UPS) was among the bottom performers in both periods, declining 2.49% and 13.44%, respectively.
MAIRS & POWER BALANCED FUND (MAPOX)
Top Performers
Fourth Quarter (9/30/15 – 12/31/15) | | Year To Date (12/31/14 – 12/31/15) | |
HORMEL FOODS CORP | | | 24.91 | % | | HORMEL FOODS CORP | | | 51.79 | % | |
BAXALTA INC. | | | 23.87 | % | | HOME DEPOT, INC. | | | 25.99 | % | |
GENERAL ELECTRIC CO. | | | 23.51 | % | | GENERAL ELECTRIC CO. | | | 23.27 | % | |
VALSPAR CORP. | | | 15.40 | % | | ELI LILLY & CO. | | | 22.13 | % | |
MEDTRONIC, INC. | | | 14.91 | % | | MEDTRONIC, INC. | | | 6.54 | % | |
Weak Performers
Fourth Quarter (9/30/15 – 12/31/15) | | Year To Date (12/31/14 – 12/31/15) | |
CH ROBINSON WORLD WIDE, INC. | | | -8.50 | % | | CONOCOPHILLIPS | | | -32.39 | % | |
TARGET CORP. | | | -7.69 | % | | EMERSON ELECTRIC CO. | | | -22.52 | % | |
PRINCIPAL FINANCIAL GROUP | | | -4.99 | % | | SCHLUMBERGER, LTD | | | -18.34 | % | |
UNITED PARCEL SERVICES, | | | | EXXON MOBIL CORP. | | | -15.68 | % | |
INC., CLASS B | | | -2.49 | % | | UNITED PARCEL SERVICES, INC., | | | |
DELUXE CORP. | | | -2.15 | % | | CLASS B | | | -13.44 | % | |
Past performance is no guarantee of future results.
Home Depot is one of our portfolio companies that illustrates the importance of a company's management focus and strategic vision. In an environment buoyed by an improving housing market and rising consumer confidence, Home Depot has gained share from its primary competitor, Lowes, while also benefitting from the ongoing struggles at Sears. In addition, it has benefited from continued industry consolidation as smaller regional players have retrenched or folded following the housing market crash in 2008 – 09. Management has not simply taken these share gains and sat back. The company has invested in building what it describes as an interconnected retail operation between suppliers, stores and customers which will link the customers' in-store and on-line shopping experiences. Operational improvements, including a "lights out" warehousing and distribution capability and enhancements to its in-store customer experience, are designed to drive cost efficiencies while tightening customer relationships.
While Home Depot is an example of a stock we expect to hold for the long-term, over the past year we have eliminated nine smaller positions where we did not see similar evidence of a stable or improving durable
10
MAIRS & POWER BALANCED FUND (unaudited) (continued)
competitive advantage. It is fair to say we are concentrating the portfolio in stocks where we have greater confidence over the long-term.
On the fixed income side of the Fund, the big news was the U.S. Federal Reserve's (Fed) action late in the year, finally raising short-term interest rates for the first time in a decade. While we did get a 25 basis point (0.25%) hike in rates, we remain skeptical that the central bank will repeat that action more than once or twice in the coming year, as had been suggested earlier by Fed officials. Both investment grade and high yield corporate bonds performed poorly in 2015, posting losses for the year. High yield bonds in particular were under pressure because of that market's heavy exposure to issuers in the stressed energy sector. The market adjusted, widening spreads as we saw ratings downgrades. We expect this to continue as the ratings agencies have signaled their intentions to remain aggressive.
Ronald L. Kaliebe
Lead Manager | | Kevin V. Earley
Co-Manager | |
The Fund's investment objective, risks, charges and expenses must be considered carefully before investing. The summary prospectus or full prospectus contains this and other important information about the Fund, and they may be obtained by calling Shareholder Services at (800) 304-7404 or visiting www.mairsandpower.com. Read the summary prospectus or full prospectus carefully before investing.
All holdings in the portfolio are subject to change without notice and may or may not represent current or future portfolio composition. The mention of specific securities is not intended as a recommendation or an offer of a particular security, nor is it intended to be a solicitation for the purchase or sale of any security.
All investments have risks. The Balanced Fund is designed for long-term investors. Equity investments are subject to market fluctuations, and the Fund's share price can fall because of weakness in the broad market, a particular industry, or specific holdings. Investments in small and midcap companies generally are more volatile. International investing risks include among others political, social or economic instability, difficulty in predicting international trade patterns, taxation and foreign trading practices, and greater fluctuations in price than United States corporations. The Fund is subject to yield and share price variances with changes in interest rates and market conditions. Investors should note that if interest rates rise significantly from current levels, bond total returns will decline and may even turn negative in the short-term. There is also a chance that some of the Fund's holdings may have their credit rating downgraded or may default.
Diversification does not guarantee profit or protect against loss.
Barclays Government/Credit Bond Index is composed of high-quality, investment-grade United States government and corporate fixed income securities with maturities greater than one year. It is not possible to invest directly in an index.
The S&P 500 Total Return (TR) Index is an unmanaged index of 500 common stocks that is generally considered representative of the United States stock market. It tracks both the capital gains of a group of stocks over time, and assumes that any cash distributions, such as dividends, are reinvested back into the index. It is not possible to invest directly in an index.
11
Mairs & Power Balanced Fund
PERFORMANCE INFORMATION (unaudited) December 31, 2015
Ten years of investment performance (through December 31, 2015)
This chart illustrates the performance of a hypothetical $10,000 investment made in the Fund 10 years ago.
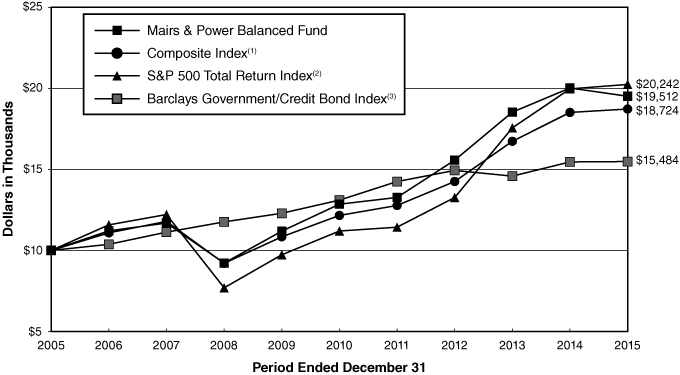
Average annual total returns for periods ended December 31, 2015
| | | 1 year | | 5 years | | 10 years | | 20 years | |
Mairs & Power Balanced Fund | | | -2.54 | % | | | 8.71 | % | | | 6.91 | % | | | 8.79 | % | |
Composite Index(1) | | | 1.13 | % | | | 9.02 | % | | | 6.47 | % | | | 7.36 | % | |
S&P 500 Total Return Index(2) | | | 1.38 | % | | | 12.57 | % | | | 7.31 | % | | | 8.19 | % | |
Barclays Government/
Credit Bond Index(3) | | | 0.15 | % | | | 3.39 | % | | | 4.47 | % | | | 5.32 | % | |
Performance data quoted represents past performance and does not guarantee future results. All performance information shown includes the reinvestment of dividend and capital gain distributions, but does not reflect the deduction of taxes that a shareholder would pay on Fund distributions or the redemption of Fund shares. The investment return and principal value of an investment will fluctuate so that an investor's shares, when redeemed, may be worth more or less than their original cost. Current performance of the Fund may be lower or higher than the performance quoted. For the most recent month-end performance figures, visit the Fund's website at www.mairsandpower.com or call Shareholder Services at (800) 304-7404.
(1) The Composite Index reflects an unmanaged portfolio comprised of 60% of the S&P 500 Index and 40% of the Barclays Government/Credit Bond Index. It is not possible to invest directly in an index.
(2) The S&P 500 Total Return Index is an unmanaged index of 500 common stocks which assumes reinvestment of dividends that is generally considered representative of the U.S. stock market. It is not possible to invest directly in an index.
(3) The Barclays Government/Credit Bond Index is composed of high-quality, investment-grade United States government and corporate fixed income securities with maturities greater than one year. It is not possible to invest directly in an index.
12
Mairs & Power Balanced Fund
FUND INFORMATION (unaudited) December 31, 2015
Portfolio Managers
Ronald L. Kaliebe, lead manager since July 1, 2013, co-manager from January 1, 2006 through
June 30, 2013
University of Wisconsin-Madison, MBA Finance 1980
Kevin V. Earley, co-manager since January 1, 2015, University of Minnesota, MBA Finance 1990
General Information
Fund Symbol | | MAPOX | |
Net Asset Value (NAV) Per Share | | $ | 81.16 | | |
Expense Ratio | | | 0.73 | % | |
Portfolio Turnover Rate | | | 14.05 | % | |
Sales Charge | | | None1 | | |
Fund Inception Year | | | 1961 | | |
Portfolio Composition
Top Ten Common Stock Holdings
(Percent of Total Net Assets)2
United Parcel Service Inc, Class B | | | 2.9 | % | |
Medtronic PLC | | | 2.9 | | |
US Bancorp/MN | | | 2.9 | | |
Johnson & Johnson | | | 2.5 | | |
Exxon Mobil Corp | | | 2.3 | | |
Ecolab Inc | | | 2.1 | | |
Valspar Corp/The | | | 2.1 | | |
| 3M Co | | | 2.1 | | |
Honeywell International Inc | | | 2.0 | | |
Pfizer Inc | | | 1.9 | | |
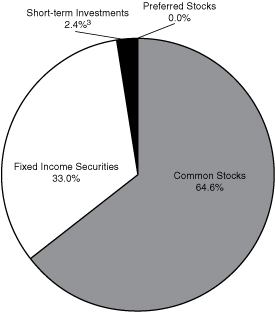
Portfolio Diversification
(Percent of Total Net Assets)
Fixed Income Securities 33.0% | |
Corporate Bonds | | | 27.7 | % | |
Federal Agency Obligations | | | 2.5 | | |
Asset Backed Securities | | | 2.1 | | |
Preferred Securities | | | 0.7 | | |
Common Stocks 64.6% | |
Industrials | | | 15.6 | % | |
Health Care | | | 13.5 | | |
Financials | | | 9.6 | | |
Energy | | | 6.2 | | |
Materials | | | 6.0 | | |
Information Technology | | | 5.5 | | |
Consumer Staples | | | 3.5 | | |
Consumer Discretionary | | | 2.9 | | |
Utilities | | | 1.8 | | |
Preferred Stocks 0.0% | | | 0.0 | % | |
Short-term Investments 2.4%3 | | | 2.4 | % | |
| | | | 100.0 | % | |
1 Although the Fund is no-load, investment management fees and other expenses still apply.
2 All holdings in the portfolio are subject to change without notice and may or may not represent current or future portfolio composition. The mention of specific securities is not intended as a recommendation or offer for a particular security, nor is it intended to be a solicitation for the purchase or sale of any security.
3 Represents short-term investments and other assets and liabilities (net).
The Global Industry Classification Standard (GICS®) was developed by and/or is the exclusive property of MSCI, Inc. and Standard & Poor's Financial Services LLC ("S&P"). GICS is a service mark of MSCI, Inc. and S&P and has been licensed for use by Mairs & Power, Inc.
13
Mairs & Power Balanced Fund
SCHEDULE OF INVESTMENTS December 31, 2015
Par Value | | Security Description | | Fair Value | |
| | | FIXED INCOME SECURITIES 33.0% | |
| | | FEDERAL AGENCY OBLIGATIONS 2.5% | |
$ | 500,000 | | | Federal Home Loan Banks | | | 3.480 | % | | 10/29/29 | | $ | 500,035 | | |
| | 500,000 | | | Federal Home Loan Banks | | | 3.625 | % | | 11/26/29 | | | 500,041 | | |
| | 1,400,000 | | | Federal Home Loan Banks | | | 3.650 | % | | 12/19/29 | | | 1,400,098 | | |
| | 1,000,000 | | | Federal Farm Credit Banks | | | 3.590 | % | | 12/24/29 | | | 1,000,013 | | |
| | 1,000,000 | | | Federal National Mortgage Association | | | 3.400 | % | | 02/27/30 | | | 1,000,451 | | |
| | 1,000,000 | | | Federal Farm Credit Banks | | | 3.440 | % | | 03/28/31 | | | 960,992 | | |
| | 2,000,000 | | | Federal National Mortgage Association | | | 3.500 | % | | 09/10/32 | | | 1,984,624 | | |
| | 2,000,000 | | | Federal Farm Credit Banks | | | 3.480 | % | | 02/07/33 | | | 1,932,312 | | |
| | 1,982,000 | | | Federal National Mortgage Association | | | 3.500 | % | | 03/07/33 | | | 1,917,099 | | |
| | 1,000,000 | | | Federal Home Loan Banks | | | 3.840 | % | | 12/26/34 | | | 981,489 | | |
| | 3,000,000 | | | Federal Home Loan Banks | | | 3.620 | % | | 02/12/35 | | | 2,888,202 | | |
| | 2,000,000 | | | Federal Home Loan Banks | | | 3.600 | % | | 03/16/35 | | | 1,914,982 | | |
| | | | 16,980,338 | | |
| | | CORPORATE BONDS 27.7% | |
| | | CONSUMER DISCRETIONARY 2.9% | |
| | 340,000 | | | Johnson Controls Inc | | | 5.500 | % | | 01/15/16 | | | 340,369 | | |
| | 250,000 | | | ServiceMaster Co LLC/The | | | 7.100 | % | | 03/01/18 | | | 248,750 | | |
| | 500,000 | | | Best Buy Co Inc | | | 5.000 | % | | 08/01/18 | | | 519,250 | | |
| | 1,000,000 | | | Ford Motor Credit Co LLC | | | 3.000 | % | | 12/20/18 | | | 1,000,585 | | |
| | 500,000 | | | Ford Motor Credit Co LLC | | | 3.450 | % | | 08/20/20 | | | 492,378 | | |
| | 1,000,000 | | | Time Warner Cable Inc | | | 4.125 | % | | 02/15/21 | | | 1,021,076 | | |
| | 1,000,000 | | | Best Buy Co Inc | | | 5.500 | % | | 03/15/21 | | | 1,035,000 | | |
| | 1,500,000 | | | Time Warner Cable Inc | | | 4.000 | % | | 09/01/21 | | | 1,514,596 | | |
| | 555,000 | | | Kohl's Corp | | | 4.000 | % | | 11/01/21 | | | 569,658 | | |
| | 500,000 | | | Whirlpool Corp | | | 4.700 | % | | 06/01/22 | | | 531,884 | | |
| | 1,750,000 | | | Newell Rubbermaid Inc | | | 4.000 | % | | 06/15/22 | | | 1,679,554 | | |
| | 1,000,000 | | | Block Financial LLC | | | 5.500 | % | | 11/01/22 | | | 1,055,884 | | |
| | 1,000,000 | | | Staples Inc | | | 4.375 | % | | 01/12/23 | | | 955,661 | | |
| | 2,000,000 | | | Kohl's Corp | | | 3.250 | % | | 02/01/23 | | | 1,900,950 | | |
| | 1,000,000 | | | Wyndham Worldwide Corp | | | 3.900 | % | | 03/01/23 | | | 972,982 | | |
| | 500,000 | | | Hyatt Hotels Corp | | | 3.375 | % | | 07/15/23 | | | 474,768 | | |
| | 1,000,000 | | | Ford Motor Credit Co LLC | | | 4.000 | % | | 04/20/24 | | | 980,252 | | |
| | 1,000,000 | | | Coach Inc | | | 4.250 | % | | 04/01/25 | | | 950,188 | | |
| | 1,000,000 | | | Metropolitan Opera Association Inc | | | 4.349 | % | | 10/01/32 | | | 1,026,159 | | |
| | 2,000,000 | | | Comcast Corp | | | 4.250 | % | | 01/15/33 | | | 1,965,250 | | |
| | | | 19,235,194 | | |
14
Mairs & Power Balanced Fund
SCHEDULE OF INVESTMENTS (continued) December 31, 2015
Par Value | | Security Description | | Fair Value | |
| | | FIXED INCOME SECURITIES (continued) | |
| | | CORPORATE BONDS (continued) | |
| | | CONSUMER STAPLES 0.6% | |
$ | 222,000 | | | SUPERVALU Inc | | | 8.000 | % | | 05/01/16 | | $ | 226,595 | | |
| | 525,000 | | | Cargill Inc (d) | | | 6.000 | % | | 11/27/17 | | | 563,608 | | |
| | 1,949,000 | | | Land O'Lakes Capital Trust I (d) | | | 7.450 | % | | 03/15/28 | | | 2,065,940 | | |
| | 500,000 | | | Altria Group Inc | | | 4.250 | % | | 08/09/42 | | | 458,770 | | |
| | 1,000,000 | | | Cargill Inc (d) | | | 4.100 | % | | 11/01/42 | | | 911,778 | | |
| | | | 4,226,691 | | |
| | | ENERGY 1.8% | |
| | 500,000 | | | Anadarko Petroleum Corp | | | 5.950 | % | | 09/15/16 | | | 513,778 | | |
| | 250,000 | | | ConocoPhillips | | | 6.650 | % | | 07/15/18 | | | 276,403 | | |
| | 1,500,000 | | | Murphy Oil Corp | | | 4.000 | % | | 06/01/22 | | | 1,137,235 | | |
| | 500,000 | | | Western Gas Partners LP | | | 4.000 | % | | 07/01/22 | | | 442,258 | | |
| | 655,000 | | | FMC Technologies Inc | | | 3.450 | % | | 10/01/22 | | | 574,051 | | |
| | 1,500,000 | | | Transocean Inc (a) (c) | | | 4.300 | % | | 10/15/22 | | | 795,000 | | |
| | 1,000,000 | | | Murphy Oil Corp | | | 3.700 | % | | 12/01/22 | | | 765,020 | | |
| | 1,500,000 | | | Sunoco Logistics Partners Operations LP | | | 3.450 | % | | 01/15/23 | | | 1,266,060 | | |
| | 3,000,000 | | | Williams Cos Inc/The | | | 3.700 | % | | 01/15/23 | | | 2,072,292 | | |
| | 1,945,000 | | | Boardwalk Pipelines LP | | | 3.375 | % | | 02/01/23 | | | 1,563,903 | | |
| | 575,000 | | | DCP Midstream Operating LP | | | 3.875 | % | | 03/15/23 | | | 434,029 | | |
| | 1,000,000 | | | Diamond Offshore Drilling Inc | | | 3.450 | % | | 11/01/23 | | | 826,208 | | |
| | 500,000 | | | Kinder Morgan Energy Partners LP | | | 4.250 | % | | 09/01/24 | | | 425,318 | | |
| | 500,000 | | | Murphy Oil Corp | | | 5.125 | % | | 12/01/42 | | | 307,640 | | |
| | 500,000 | | | Apache Corp | | | 4.250 | % | | 01/15/44 | | | 391,425 | | |
| | | | 11,790,620 | | |
| | | FINANCIALS 10.7% | |
| | 500,000 | | | TCF National Bank | | | 5.500 | % | | 02/01/16 | | | 501,489 | | |
| | 500,000 | | | KeyBank NA/Cleveland OH | | | 5.450 | % | | 03/03/16 | | | 503,408 | | |
| | 500,000 | | | Symetra Financial Corp (d) | | | 6.125 | % | | 04/01/16 | | | 505,153 | | |
| | 250,000 | | | Security Benefit Life Insurance Co (d) | | | 8.750 | % | | 05/15/16 | | | 255,737 | | |
| | 500,000 | | | Bank of America Corp | | | 6.050 | % | | 05/16/16 | | | 508,246 | | |
| | 500,000 | | | Torchmark Corp | | | 6.375 | % | | 06/15/16 | | | 510,407 | | |
| | 500,000 | | | National City Bank/Cleveland OH | | | 5.250 | % | | 12/15/16 | | | 517,576 | | |
| | 500,000 | | | M&I Marshall & Ilsley Bank | | | 5.000 | % | | 01/17/17 | | | 515,383 | | |
| | 500,000 | | | Citigroup Inc | | | 5.500 | % | | 02/15/17 | | | 516,728 | | |
| | 500,000 | | | Sirius International Group Ltd (a) (d) | | | 6.375 | % | | 03/20/17 | | | 510,757 | | |
| | 250,000 | | | Bank of America Corp | | | 5.700 | % | | 05/02/17 | | | 260,719 | | |
| | 500,000 | | | Royal Bank of Scotland Group PLC (a) | | | 4.250 | % | | 07/15/17 | | | 512,633 | | |
| | 500,000 | | | Comerica Bank | | | 5.200 | % | | 08/22/17 | | | 524,540 | | |
| | 500,000 | | | Bank of America Corp | | | 6.000 | % | | 09/01/17 | | | 532,105 | | |
15
Mairs & Power Balanced Fund
SCHEDULE OF INVESTMENTS (continued) December 31, 2015
Par Value | | Security Description | | Fair Value | |
| | | FIXED INCOME SECURITIES (continued) | |
| | | CORPORATE BONDS (continued) | |
| | | FINANCIALS (continued) | |
$ | 500,000 | | | American Express Bank FSB | | | 6.000 | % | | 09/13/17 | | $ | 535,570 | | |
| | 500,000 | | | Bear Stearns Cos LLC/The | | | 6.400 | % | | 10/02/17 | | | 538,463 | | |
| | 500,000 | | | Prudential Financial Inc | | | 6.000 | % | | 12/01/17 | | | 536,911 | | |
| | 500,000 | | | Barclays Bank PLC (a) (d) | | | 6.050 | % | | 12/04/17 | | | 533,333 | | |
| | 1,000,000 | | | Morgan Stanley | | | 5.950 | % | | 12/28/17 | | | 1,075,327 | | |
| | 500,000 | | | Goldman Sachs Group Inc/The | | | 5.950 | % | | 01/18/18 | | | 538,488 | | |
| | 500,000 | | | Wachovia Corp | | | 5.750 | % | | 02/01/18 | | | 540,045 | | |
| | 250,000 | | | Lincoln National Corp | | | 7.000 | % | | 03/15/18 | | | 274,052 | | |
| | 500,000 | | | SunTrust Bank/Atlanta GA | | | 7.250 | % | | 03/15/18 | | | 552,808 | | |
| | 500,000 | | | Morgan Stanley | | | 6.625 | % | | 04/01/18 | | | 548,265 | | |
| | 1,000,000 | | | Jefferies Group LLC | | | 5.125 | % | | 04/13/18 | | | 1,040,073 | | |
| | 500,000 | | | Bank of America Corp | | | 6.875 | % | | 04/25/18 | | | 551,629 | | |
| | 500,000 | | | Provident Cos Inc | | | 7.000 | % | | 07/15/18 | | | 553,263 | | |
| | 500,000 | | | MetLife Inc | | | 6.817 | % | | 08/15/18 | | | 563,071 | | |
| | 500,000 | | | Hartford Financial Services Group Inc/The | | | 6.000 | % | | 01/15/19 | | | 549,886 | | |
| | 500,000 | | | Royal Bank of Scotland Group PLC (a) | | | 5.250 | % | | 02/15/19 | | | 533,515 | | |
| | 500,000 | | | BB&T Corp | | | 6.850 | % | | 04/30/19 | | | 569,916 | | |
| | 250,000 | | | WR Berkley Corp | | | 6.150 | % | | 08/15/19 | | | 277,903 | | |
| | 500,000 | | | Protective Life Corp | | | 7.375 | % | | 10/15/19 | | | 578,397 | | |
| | 500,000 | | | Prospect Capital Corp | | | 5.125 | % | | 11/15/19 | | | 480,752 | | |
| | 500,000 | | | Credit Suisse/New York NY (a) | | | 5.400 | % | | 01/14/20 | | | 547,456 | | |
| | 500,000 | | | Prospect Capital Corp | | | 4.000 | % | | 01/15/20 | | | 473,361 | | |
| | 500,000 | | | Morgan Stanley | | | 5.500 | % | | 01/26/20 | | | 550,456 | | |
| | 500,000 | | | Hartford Financial Services Group Inc/The | | | 5.500 | % | | 03/30/20 | | | 553,496 | | |
| | 450,000 | | | Compass Bank | | | 5.500 | % | | 04/01/20 | | | 479,397 | | |
| | 537,000 | | | Manufacturers & Traders Trust Co (c) | | | 5.585 | % | | 12/28/20 | | | 536,359 | | |
| | 1,000,000 | | | Nationwide Financial Services Inc (d) | | | 5.375 | % | | 03/25/21 | | | 1,094,752 | | |
| | 500,000 | | | Markel Corp | | | 5.350 | % | | 06/01/21 | | | 549,092 | | |
| | 500,000 | | | Goldman Sachs Group Inc/The | | | 5.250 | % | | 07/27/21 | | | 552,810 | | |
| | 500,000 | | | Genworth Holdings Inc | | | 7.625 | % | | 09/24/21 | | | 415,225 | | |
| | 500,000 | | | Aflac Inc | | | 4.000 | % | | 02/15/22 | | | 528,347 | | |
| | 2,000,000 | | | OneBeacon US Holdings Inc | | | 4.600 | % | | 11/09/22 | | | 2,010,208 | | |
| | 1,000,000 | | | Standard Chartered PLC (a) (d) | | | 3.950 | % | | 01/11/23 | | | 961,998 | | |
| | 500,000 | | | Wells Fargo & Co | | | 3.450 | % | | 02/13/23 | | | 501,178 | | |
| | 2,500,000 | | | Assurant Inc | | | 4.000 | % | | 03/15/23 | | | 2,500,500 | | |
| | 1,000,000 | | | Markel Corp | | | 3.625 | % | | 03/30/23 | | | 986,112 | | |
| | 1,500,000 | | | Citigroup Inc | | | 3.500 | % | | 05/15/23 | | | 1,474,825 | | |
| | 500,000 | | | Morgan Stanley | | | 4.100 | % | | 05/22/23 | | | 505,101 | | |
16
Mairs & Power Balanced Fund
SCHEDULE OF INVESTMENTS (continued) December 31, 2015
Par Value | | Security Description | | Fair Value | |
| | | FIXED INCOME SECURITIES (continued) | |
| | | CORPORATE BONDS (continued) | |
| | | FINANCIALS (continued) | |
$ | 2,000,000 | | | Liberty Mutual Group Inc (d) | | | 4.250 | % | | 06/15/23 | | $ | 2,032,136 | | |
| | 500,000 | | | Ameriprise Financial Inc | | | 4.000 | % | | 10/15/23 | | | 519,405 | | |
| | 500,000 | | | CNA Financial Corp | | | 7.250 | % | | 11/15/23 | | | 590,963 | | |
| | 500,000 | | | Pacific Life Insurance Co (d) | | | 7.900 | % | | 12/30/23 | | | 617,118 | | |
| | 1,000,000 | | | Moody's Corp | | | 4.875 | % | | 02/15/24 | | | 1,064,078 | | |
| | 1,000,000 | | | NASDAQ OMX Group Inc/The | | | 4.250 | % | | 06/01/24 | | | 1,008,534 | | |
| | 500,000 | | | Wintrust Financial Corp | | | 5.000 | % | | 06/13/24 | | | 498,144 | | |
| | 250,000 | | | Assured Guaranty US Holdings Inc | | | 5.000 | % | | 07/01/24 | | | 259,724 | | |
| | 500,000 | | | Symetra Financial Corp | | | 4.250 | % | | 07/15/24 | | | 503,944 | | |
| | 1,000,000 | | | Stifel Financial Corp | | | 4.250 | % | | 07/18/24 | | | 993,546 | | |
| | 1,000,000 | | | Citigroup Inc | | | 4.000 | % | | 08/05/24 | | | 990,386 | | |
| | 1,500,000 | | | Synchrony Financial | | | 4.250 | % | | 08/15/24 | | | 1,479,693 | | |
| | 1,800,000 | | | Brown & Brown Inc | | | 4.200 | % | | 09/15/24 | | | 1,777,419 | | |
| | 2,000,000 | | | Old Republic International Corp | | | 4.875 | % | | 10/01/24 | | | 2,049,530 | | |
| | 2,000,000 | | | TIAA Asset Management Finance Co LLC (d) | | | 4.125 | % | | 11/01/24 | | | 2,006,794 | | |
| | 1,000,000 | | | Associated Banc-Corp | | | 4.250 | % | | 01/15/25 | | | 1,000,612 | | |
| | 2,000,000 | | | Kemper Corp | | | 4.350 | % | | 02/15/25 | | | 1,986,744 | | |
| | 1,050,000 | | | TCF National Bank | | | 4.600 | % | | 02/27/25 | | | 1,025,257 | | |
| | 250,000 | | | Liberty Mutual Insurance Co (d) | | | 8.500 | % | | 05/15/25 | | | 310,546 | | |
| | 1,000,000 | | | Wells Fargo & Co | | | 4.100 | % | | 06/03/26 | | | 1,009,394 | | |
| | 500,000 | | | Morgan Stanley | | | 4.350 | % | | 09/08/26 | | | 501,635 | | |
| | 1,000,000 | | | National Rural Utilities Cooperative Finance Corp | | | 3.000 | % | | 11/15/26 | | | 943,021 | | |
| | 1,000,000 | | | Citigroup Inc | | | 4.300 | % | | 11/20/26 | | | 995,064 | | |
| | 1,000,000 | | | JPMorgan Chase & Co | | | 4.125 | % | | 12/15/26 | | | 997,243 | | |
| | 250,000 | | | Provident Cos Inc | | | 7.250 | % | | 03/15/28 | | | 290,753 | | |
| | 1,000,000 | | | JPMorgan Chase & Co (c) | | | 3.000 | % | | 03/21/28 | | | 932,385 | | |
| | 1,000,000 | | | JPMorgan Chase & Co (c) | | | 3.000 | % | | 03/22/28 | | | 971,633 | | |
| | 1,000,000 | | | Royal Bank of Canada (a) | | | 3.000 | % | | 05/10/28 | | | 884,897 | | |
| | 500,000 | | | Farmers Exchange Capital (d) | | | 7.050 | % | | 07/15/28 | | | 598,158 | | |
| | 500,000 | | | Goldman Sachs Group Inc/The | | | 4.250 | % | | 11/15/30 | | | 496,236 | | |
| | 500,000 | | | Goldman Sachs Group Inc/The | | | 4.000 | % | | 02/15/31 | | | 480,261 | | |
| | 500,000 | | | Goldman Sachs Group Inc/The | | | 4.300 | % | | 12/15/32 | | | 488,750 | | |
| | 1,000,000 | | | JPMorgan Chase & Co (c) | | | 3.250 | % | | 01/31/33 | | | 953,634 | | |
| | 649,000 | | | Lloyds Bank PLC (a) (c) | | | 3.400 | % | | 01/31/33 | | | 594,958 | | |
| | 250,000 | | | Citigroup Inc (c) | | | 4.000 | % | | 06/27/34 | | | 240,239 | | |
| | 538,000 | | | Bank of America Corp | | | 4.000 | % | | 08/15/34 | | | 517,367 | | |
| | 1,000,000 | | | Prudential Financial Inc | | | 4.050 | % | | 11/15/34 | | | 977,668 | | |
| | 1,000,000 | | | Goldman Sachs Group Inc/The | | | 4.000 | % | | 01/30/35 | | | 1,000,308 | | |
17
Mairs & Power Balanced Fund
SCHEDULE OF INVESTMENTS (continued) December 31, 2015
Par Value | | Security Description | | Fair Value | |
| | | FIXED INCOME SECURITIES (continued) | |
| | | CORPORATE BONDS (continued) | |
| | | FINANCIALS (continued) | |
$ | 500,000 | | | Barclays Bank PLC (a) (c) | | | 4.000 | % | | 10/09/37 | | $ | 487,530 | | |
| | 1,000,000 | | | Berkshire Hathaway Finance Corp | | | 4.400 | % | | 05/15/42 | | | 990,123 | | |
| | 500,000 | | | MetLife Inc | | | 4.125 | % | | 08/13/42 | | | 474,523 | | |
| | 500,000 | | | Swiss Re Treasury US Corp (d) | | | 4.250 | % | | 12/06/42 | | | 472,286 | | |
| | 500,000 | | | Pacific LifeCorp (d) | | | 5.125 | % | | 01/30/43 | | | 509,428 | | |
| | 500,000 | | | Berkshire Hathaway Finance Corp | | | 4.300 | % | | 05/15/43 | | | 490,337 | | |
| | 500,000 | | | Principal Financial Group Inc | | | 4.350 | % | | 05/15/43 | | | 467,888 | | |
| | | | 71,747,513 | | |
| | | HEALTH CARE 0.8% | |
| | 500,000 | | | UnitedHealth Group Inc | | | 6.000 | % | | 02/15/18 | | | 543,806 | | |
| | 1,000,000 | | | Quest Diagnostics Inc | | | 4.700 | % | | 04/01/21 | | | 1,058,982 | | |
| | 1,000,000 | | | Laboratory Corp of America Holdings | | | 3.750 | % | | 08/23/22 | | | 1,006,465 | | |
| | 1,000,000 | | | Laboratory Corp of America Holdings | | | 4.000 | % | | 11/01/23 | | | 1,010,075 | | |
| | 1,000,000 | | | Mylan Inc/PA | | | 4.200 | % | | 11/29/23 | | | 991,612 | | |
| | 500,000 | | | Wyeth LLC | | | 6.450 | % | | 02/01/24 | | | 611,607 | | |
| | | | 5,222,547 | | |
| | | INDUSTRIALS 3.1% | |
| | 500,000 | | | Masco Corp | | | 7.125 | % | | 03/15/20 | | | 577,500 | | |
| | 500,000 | | | Pentair Finance SA (a) | | | 5.000 | % | | 05/15/21 | | | 521,265 | | |
| | 500,000 | | | IDEX Corp | | | 4.200 | % | | 12/15/21 | | | 517,808 | | |
| | 500,000 | | | Masco Corp | | | 5.950 | % | | 03/15/22 | | | 540,000 | | |
| | 500,000 | | | GATX Corp | | | 4.750 | % | | 06/15/22 | | | 524,721 | | |
| | 500,000 | | | Penske Truck Leasing Co Lp / PTL Finance Corp (d) | | | 4.875 | % | | 07/11/22 | | | 520,047 | | |
| | 1,000,000 | | | ADT Corp/The | | | 3.500 | % | | 07/15/22 | | | 895,000 | | |
| | 818,000 | | | Pentair Finance SA (a) | | | 3.150 | % | | 09/15/22 | | | 769,520 | | |
| | 2,000,000 | | | Dun & Bradstreet Corp/The | | | 4.375 | % | | 12/01/22 | | | 1,957,716 | | |
| | 1,000,000 | | | GATX Corp | | | 3.900 | % | | 03/30/23 | | | 991,902 | | |
| | 500,000 | | | ADT Corp/The | | | 4.125 | % | | 06/15/23 | | | 467,500 | | |
| | 500,000 | | | Ingersoll-Rand Global Holding Co Ltd (a) | | | 4.250 | % | | 06/15/23 | | | 514,925 | | |
| | 1,000,000 | | | Flowserve Corp | | | 4.000 | % | | 11/15/23 | | | 988,485 | | |
| | 2,126,000 | | | Air Lease Corp | | | 4.850 | % | | 02/01/24 | | | 2,088,795 | | |
| | 500,000 | | | Pitney Bowes Inc | | | 4.625 | % | | 03/15/24 | | | 489,849 | | |
| | 500,000 | | | Toro Co/The | | | 7.800 | % | | 06/15/27 | | | 631,435 | | |
| | 500,000 | | | General Electric Capital Corp | | | 3.500 | % | | 05/15/32 | | | 481,382 | | |
| | 3,000,000 | | | Eaton Corp | | | 4.000 | % | | 11/02/32 | | | 2,859,165 | | |
| | 2,000,000 | | | General Electric Capital Corp | | | 4.000 | % | | 02/14/33 | | | 2,004,680 | | |
| | 1,000,000 | | | Pitney Bowes Inc | | | 5.250 | % | | 01/15/37 | | | 1,009,901 | | |
18
Mairs & Power Balanced Fund
SCHEDULE OF INVESTMENTS (continued) December 31, 2015
Par Value | | Security Description | | Fair Value | |
| | | FIXED INCOME SECURITIES (continued) | |
| | | CORPORATE BONDS (continued) | |
| | | INDUSTRIALS (continued) | |
$ | 590,000 | | | Eaton Corp | | | 4.150 | % | | 11/02/42 | | $ | 544,054 | | |
| | 500,000 | | | Lockheed Martin Corp | | | 4.070 | % | | 12/15/42 | | | 462,710 | | |
| | | | 20,358,360 | | |
| | | INFORMATION TECHNOLOGY 3.9% | |
| | 500,000 | | | Western Union Co/The | | | 5.930 | % | | 10/01/16 | | | 515,877 | | |
| | 500,000 | | | Broadridge Financial Solutions Inc | | | 6.125 | % | | 06/01/17 | | | 527,933 | | |
| | 500,000 | | | Dell Inc | | | 5.875 | % | | 06/15/19 | | | 514,630 | | |
| | 500,000 | | | Broadridge Financial Solutions Inc | | | 3.950 | % | | 09/01/20 | | | 518,227 | | |
| | 81,000 | | | Hewlett-Packard Co | | | 3.750 | % | | 12/01/20 | | | 80,371 | | |
| | 500,000 | | | Dell Inc | | | 4.625 | % | | 04/01/21 | | | 485,000 | | |
| | 750,000 | | | Hewlett-Packard Co | | | 4.300 | % | | 06/01/21 | | | 742,709 | | |
| | 500,000 | | | Motorola Solutions Inc | | | 3.750 | % | | 05/15/22 | | | 458,086 | | |
| | 2,000,000 | | | Symantec Corp | | | 3.950 | % | | 06/15/22 | | | 1,976,704 | | |
| | 1,000,000 | | | Computer Sciences Corp | | | 4.450 | % | | 09/15/22 | | | 1,025,765 | | |
| | 1,000,000 | | | Hewlett-Packard Co | | | 4.050 | % | | 09/15/22 | | | 952,541 | | |
| | 2,025,000 | | | Fiserv Inc | | | 3.500 | % | | 10/01/22 | | | 2,020,831 | | |
| | 1,000,000 | | | Autodesk Inc | | | 3.600 | % | | 12/15/22 | | | 971,381 | | |
| | 2,500,000 | | | Arrow Electronics Inc | | | 4.500 | % | | 03/01/23 | | | 2,525,712 | | |
| | 1,500,000 | | | Motorola Solutions Inc | | | 3.500 | % | | 03/01/23 | | | 1,315,866 | | |
| | 2,000,000 | | | Fidelity National Information Services Inc | | | 3.500 | % | | 04/15/23 | | | 1,909,620 | | |
| | 2,352,000 | | | Total System Services Inc | | | 3.750 | % | | 06/01/23 | | | 2,281,932 | | |
| | 1,000,000 | | | Altera Corp | | | 4.100 | % | | 11/15/23 | | | 1,041,325 | | |
| | 500,000 | | | Motorola Solutions Inc | | | 4.000 | % | | 09/01/24 | | | 433,908 | | |
| | 500,000 | | | Arrow Electronics Inc | | | 4.000 | % | | 04/01/25 | | | 480,318 | | |
| | 4,000,000 | | | Intel Corp | | | 4.000 | % | | 12/15/32 | | | 3,981,104 | | |
| | 1,500,000 | | | Western Union Co/The | | | 6.200 | % | | 11/17/36 | | | 1,458,380 | | |
| | | | 26,218,220 | | |
| | | MATERIALS 2.7% | |
| | 500,000 | | | International Paper Co | | | 5.250 | % | | 04/01/16 | | | 504,624 | | |
| | 500,000 | | | Valspar Corp/The | | | 6.050 | % | | 05/01/17 | | | 525,944 | | |
| | 500,000 | | | Carpenter Technology Corp | | | 5.200 | % | | 07/15/21 | | | 502,808 | | |
| | 500,000 | | | Freeport-McMoRan Inc | | | 4.000 | % | | 11/14/21 | | | 300,000 | | |
| | 175,000 | | | Mosaic Co/The | | | 3.750 | % | | 11/15/21 | | | 175,469 | | |
| | 1,000,000 | | | Freeport-McMoRan Inc | | | 3.550 | % | | 03/01/22 | | | 580,000 | | |
| | 1,500,000 | | | Newmont Mining Corp | | | 3.500 | % | | 03/15/22 | | | 1,336,961 | | |
| | 500,000 | | | Barrick Gold Corp (a) | | | 3.850 | % | | 04/01/22 | | | 438,632 | | |
| | 1,000,000 | | | Domtar Corp | | | 4.400 | % | | 04/01/22 | | | 1,016,828 | | |
19
Mairs & Power Balanced Fund
SCHEDULE OF INVESTMENTS (continued) December 31, 2015
Par Value | | Security Description | | Fair Value | |
| | | FIXED INCOME SECURITIES (continued) | |
| | | CORPORATE BONDS (continued) | |
| | | MATERIALS (continued) | |
$ | 2,000,000 | | | RPM International Inc | | | 3.450 | % | | 11/15/22 | | $ | 1,917,598 | | |
| | 500,000 | | | Carpenter Technology Corp | | | 4.450 | % | | 03/01/23 | | | 480,379 | | |
| | 500,000 | | | Freeport-McMoRan Inc | | | 3.875 | % | | 03/15/23 | | | 285,000 | | |
| | 2,059,000 | | | Reliance Steel & Aluminum Co | | | 4.500 | % | | 04/15/23 | | | 1,916,639 | | |
| | 1,750,000 | | | Barrick Gold Corp (a) | | | 4.100 | % | | 05/01/23 | | | 1,501,255 | | |
| | 2,000,000 | | | Nucor Corp | | | 4.000 | % | | 08/01/23 | | | 1,939,178 | | |
| | 1,000,000 | | | Mosaic Co/The | | | 4.250 | % | | 11/15/23 | | | 990,425 | | |
| | 865,000 | | | Union Carbide Corp | | | 7.500 | % | | 06/01/25 | | | 1,028,760 | | |
| | 1,250,000 | | | Dow Chemical Co/The | | | 4.250 | % | | 10/01/34 | | | 1,128,149 | | |
| | 1,000,000 | | | Alcoa Inc | | | 5.950 | % | | 02/01/37 | | | 805,000 | | |
| | 1,000,000 | | | Newmont Mining Corp | | | 4.875 | % | | 03/15/42 | | | 714,559 | | |
| | | | 18,088,208 | | |
| | | TELECOMMUNICATION SERVICES 0.4% | |
| | 250,000 | | | Verizon Communications Inc | | | 6.350 | % | | 04/01/19 | | | 281,259 | | |
| | 500,000 | | | CenturyLink Inc | | | 6.150 | % | | 09/15/19 | | | 510,000 | | |
| | 500,000 | | | Qwest Capital Funding Inc | | | 6.875 | % | | 07/15/28 | | | 390,000 | | |
| | 468,000 | | | Qwest Corp | | | 6.875 | % | | 09/15/33 | | | 449,091 | | |
| | 1,000,000 | | | Verizon Communications Inc | | | 4.400 | % | | 11/01/34 | | | 922,629 | | |
| | | | 2,552,979 | | |
| | | UTILITIES 0.8% | |
| | 500,000 | | | Commonwealth Edison Co | | | 6.150 | % | | 09/15/17 | | | 536,797 | | |
| | 250,000 | | | Vectren Utility Holdings Inc | | | 5.750 | % | | 08/01/18 | | | 268,827 | | |
| | 250,000 | | | South Jersey Gas Co | | | 7.125 | % | | 10/22/18 | | | 277,265 | | |
| | 250,000 | | | United Utilities PLC (a) | | | 5.375 | % | | 02/01/19 | | | 268,245 | | |
| | 1,170,000 | | | ONEOK Inc | | | 4.250 | % | | 02/01/22 | | | 842,400 | | |
| | 785,000 | | | SCANA Corp | | | 4.125 | % | | 02/01/22 | | | 769,055 | | |
| | 1,000,000 | | | Exelon Generation Co LLC | | | 4.250 | % | | 06/15/22 | | | 1,013,195 | | |
| | 900,000 | | | National Fuel Gas Co | | | 3.750 | % | | 03/01/23 | | | 833,556 | | |
| | 500,000 | | | Entergy Gulf States Inc | | | 6.180 | % | | 03/01/35 | | | 499,876 | | |
| | | | 5,309,216 | | |
| | | TOTAL CORPORATE BONDS | | | 184,749,548 | | |
| | | ASSET BACKED SECURITIES 2.1% | |
| | 341,420 | | | Continental Airlines 2009-1 Pass Through Trust | | | 9.000 | % | | 01/08/18 | | | 352,175 | | |
| | 335,640 | | | American Airlines 2011-1 Class B Pass Through Trust (d) | | | 7.000 | % | | 07/31/19 | | | 352,422 | | |
| | 106,772 | | | Continental Airlines 1999-1 Class B Pass Through Trust | | | 6.795 | % | | 02/02/20 | | | 111,576 | | |
20
Mairs & Power Balanced Fund
SCHEDULE OF INVESTMENTS (continued) December 31, 2015
Par Value | | Security Description | | Fair Value | |
| | | FIXED INCOME SECURITIES (continued) | |
| | | ASSET BACKED SECURITIES (continued) | |
$ | 479,453 | | | Continental Airlines 2010-1 Class B Pass Through Trust | | | 6.000 | % | | 07/12/20 | | $ | 498,631 | | |
| | 299,402 | | | Delta Air Lines 2011-1 Class A Pass Through Trust | | | 5.300 | % | | 10/15/20 | | | 317,366 | | |
| | 527,466 | | | America West Airlines 2000-1 Pass Through Trust | | | 8.057 | % | | 01/02/22 | | | 592,081 | | |
| | 679,846 | | | American Airlines 2011-1 Class A Pass Through Trust | | | 5.250 | % | | 07/31/22 | | | 720,637 | | |
| | 185,740 | | | Continental Airlines 2007-1 Class A Pass Through Trust | | | 5.983 | % | | 10/19/23 | | | 205,113 | | |
| | 349,470 | | | Southwest Airlines Co 2007-1 Pass Through Trust | | | 6.150 | % | | 02/01/24 | | | 391,407 | | |
| | 1,000,000 | | | United Airlines 2015-1 Class A Pass Through Trust | | | 3.700 | % | | 06/01/24 | | | 997,500 | | |
| | 723,675 | | | US Airways 2010-1 Class A Pass Through Trust | | | 6.250 | % | | 10/22/24 | | | 810,516 | | |
| | 959,077 | | | American Airlines 2015-1 Class B Pass Through Trust | | | 3.700 | % | | 11/01/24 | | | 937,497 | | |
| | 1,500,000 | | | Delta Air Lines 2015-1 Class B Pass Through Trust | | | 4.250 | % | | 01/30/25 | | | 1,511,250 | | |
| | 377,199 | | | US Airways 2011-1 Class A Pass Through Trust | | | 7.125 | % | | 04/22/25 | | | 433,779 | | |
| | 1,603,752 | | | Hawaiian Airlines 2013-1 Class A Pass Through Certificates | | | 3.900 | % | | 01/15/26 | | | 1,563,658 | | |
| | 551,637 | | | Continental Airlines 2012-2 Class A Pass Through Trust | | | 4.000 | % | | 04/29/26 | | | 565,428 | | |
| | 951,987 | | | United Airlines 2013-1 Class A Pass Through Trust | | | 4.300 | % | | 02/15/27 | | | 985,306 | | |
| | 904,619 | | | US Airways 2013-1 Class A Pass Through Trust | | | 3.950 | % | | 05/15/27 | | | 911,404 | | |
| | 941,824 | | | American Airlines 2014-1 Class A Pass Through Trust | | | 3.700 | % | | 04/01/28 | | | 942,390 | | |
| | 500,000 | | | American Airlines 2015-2 Class A Pass Through Trust | | | 4.000 | % | | 03/22/29 | | | 498,750 | | |
| | | | 13,698,886 | | |
| | | PREFERRED SECURITIES 0.7% | |
| | 23,000 | | | Stifel Financial Corp | | | 5.375 | % | | 12/31/22 | | | 578,910 | | |
| | 10,000 | | | Raymond James Financial Inc | | | 6.900 | % | | 03/15/42 | | | 266,600 | | |
| | 20,000 | | | Protective Life Corp | | | 6.000 | % | | 09/01/42 | | | 518,000 | | |
| | 20,000 | | | Selective Insurance Group Inc | | | 5.875 | % | | 02/09/43 | | | 519,800 | | |
| | 40,000 | | | WR Berkley Corp | | | 5.625 | % | | 04/30/53 | | | 1,016,800 | | |
| | 20,000 | | | Verizon Communications Inc | | | 5.900 | % | | 02/15/54 | | | 552,400 | | |
| | 20,000 | | | American Financial Group Inc/OH | | | 6.250 | % | | 09/30/54 | | | 521,000 | | |
| | 20,000 | | | Qwest Corp | | | 6.875 | % | | 10/01/54 | | | 515,000 | | |
| | 10,000 | | | NextEra Energy Capital Holdings Inc | | | 5.700 | % | | 03/01/72 | | | 256,000 | | |
| | | | 4,744,510 | | |
| | TOTAL FIXED INCOME SECURITIES
(cost $223,658,760) | | $ | 220,173,282 | | |
21
Mairs & Power Balanced Fund
SCHEDULE OF INVESTMENTS (continued) December 31, 2015
Shares | | Security Description | | Fair Value | |
| | | COMMON STOCKS 64.6% | |
| | | CONSUMER DISCRETIONARY 2.9% | |
| | 73,000 | | | Home Depot Inc/The | | $ | 9,654,250 | | |
| | 130,000 | | | Target Corp | | | 9,439,300 | | |
| | | | 19,093,550 | | |
| | | CONSUMER STAPLES 3.5% | |
| | 90,000 | | | General Mills Inc | | | 5,189,400 | | |
| | 64,000 | | | Hershey Co/The | | | 5,713,280 | | |
| | 109,000 | | | Hormel Foods Corp | | | 8,619,720 | | |
| | 31,000 | | | Kimberly-Clark Corp | | | 3,946,300 | | |
| | | | 23,468,700 | | |
| | | ENERGY 6.2% | |
| | 76,000 | | | Chevron Corp | | | 6,836,960 | | |
| | 172,000 | | | ConocoPhillips | | | 8,030,680 | | |
| | 197,000 | | | Exxon Mobil Corp | | | 15,356,150 | | |
| | 165,000 | | | Schlumberger Ltd (a) | | | 11,508,750 | | |
| | | | 41,732,540 | | |
| | | FINANCIALS 9.6% | |
| | 55,000 | | | American Express Co | | | 3,825,250 | | |
| | 404,000 | | | Associated Banc-Corp | | | 7,575,000 | | |
| | 139,000 | | | JPMorgan Chase & Co | | | 9,178,170 | | |
| | 267,000 | | | Principal Financial Group Inc | | | 12,009,660 | | |
| | 35,000 | | | Travelers Cos Inc/The | | | 3,950,100 | | |
| | 448,500 | | | US Bancorp/MN | | | 19,137,495 | | |
| | 156,000 | | | Wells Fargo & Co | | | 8,480,160 | | |
| | | | 64,155,835 | | |
| | | HEALTH CARE 13.5% | |
| | 148,500 | | | Abbott Laboratories | | | 6,669,135 | | |
| | 84,000 | | | AbbVie Inc | | | 4,976,160 | | |
| | 131,000 | | | Baxalta Inc | | | 5,112,930 | | |
| | 131,000 | | | Baxter International Inc | | | 4,997,650 | | |
| | 74,500 | | | Bristol-Myers Squibb Co | | | 5,124,855 | | |
| | 44,000 | | | Eli Lilly & Co | | | 3,707,440 | | |
| | 160,000 | | | Johnson & Johnson | | | 16,435,200 | | |
| | 252,500 | | | Medtronic PLC (f) | | | 19,422,300 | | |
| | 400,000 | | | Pfizer Inc | | | 12,912,000 | | |
| | 305,000 | | | Roche Holding AG ADR (e) | | | 10,513,350 | | |
| | | | 89,871,020 | | |
22
Mairs & Power Balanced Fund
SCHEDULE OF INVESTMENTS (continued) December 31, 2015
Shares | | Security Description | | Fair Value | |
| | | COMMON STOCKS (continued) | |
| | | INDUSTRIALS 15.6% | |
| | 91,000 | | | 3M Co | | $ | 13,708,240 | | |
| | 127,000 | | | CH Robinson Worldwide Inc | | | 7,876,540 | | |
| | 146,500 | | | Deluxe Corp | | | 7,990,110 | | |
| | 256,000 | | | Emerson Electric Co | | | 12,244,480 | | |
| | 412,000 | | | General Electric Co | | | 12,833,800 | | |
| | 91,000 | | | Graco Inc | | | 6,558,370 | | |
| | 129,000 | | | Honeywell International Inc | | | 13,360,530 | | |
| | 138,000 | | | Pentair PLC (a) | | | 6,835,140 | | |
| | 40,000 | | | Toro Co/The | | | 2,922,800 | | |
| | 204,100 | | | United Parcel Service Inc, Class B | | | 19,640,543 | | |
| | | | 103,970,553 | | |
| | | INFORMATION TECHNOLOGY 5.5% | |
| | 420,000 | | | Corning Inc | | | 7,677,600 | | |
| | 60,000 | | | International Business Machines Corp | | | 8,257,200 | | |
| | 88,500 | | | MTS Systems Corp | | | 5,611,785 | | |
| | 89,000 | | | QUALCOMM Inc | | | 4,448,665 | | |
| | 581,000 | | | Western Union Co/The | | | 10,405,710 | | |
| | | | 36,400,960 | | |
| | | MATERIALS 6.0% | |
| | 143,000 | | | Bemis Co Inc | | | 6,390,670 | | |
| | 124,000 | | | Ecolab Inc | | | 14,183,120 | | |
| | 156,000 | | | HB Fuller Co | | | 5,689,320 | | |
| | 169,000 | | | Valspar Corp/The | | | 14,018,550 | | |
| | | | 40,281,660 | | |
| | | UTILITIES 1.8% | |
| | 88,000 | | | ALLETE Inc | | | 4,473,040 | | |
| | 81,000 | | | MDU Resources Group Inc | | | 1,483,920 | | |
| | 173,000 | | | Xcel Energy Inc | | | 6,212,430 | | |
| | | | 12,169,390 | | |
| | | | | TOTAL COMMON STOCKS
(cost $312,386,102) | | $ | 431,144,208
| | |
23
Mairs & Power Balanced Fund
SCHEDULE OF INVESTMENTS (continued) December 31, 2015
Shares | | Security Description | | Fair Value | |
| | | PREFERRED STOCKS 0.0% (g) | |
| | | UTILITIES 0.0% (g) | |
| | 10,000 | | | SCE Trust I | | | | | | | | | | $ | 253,100 | | |
| | TOTAL PREFERRED STOCKS
(cost $250,000) | | $ | 253,100 | | |
| | | SHORT-TERM INVESTMENTS 1.8% | |
| | 12,019,982 | | | First American Prime Obligations Fund, Class Z, 0.21% (b) | | | |
(cost $12,019,982) | | $ | 12,019,982 | | |
| | | TOTAL INVESTMENTS 99.4%
(cost $548,314,844) | | |
| | | | | | | $ | 663,590,572
| | |
| | | OTHER ASSETS AND LIABILITIES (NET) 0.6% | | | | | | | | | | | 4,089,689 | | |
| | | TOTAL NET ASSETS 100.0% | | | | | | | | | | $ | 667,680,261 | | |
(a) Foreign security denominated in U.S. dollars. As of December 31, 2015, these securities represented $28,719,809 or 4.3% of total net assets.
(b) The rate quoted is the annualized seven-day effective yield as of December 31, 2015.
(c) Step bonds – securities for which the interest rate will adjust on specified future date(s). The rate disclosed represents the coupon rate in effect as of December 31, 2015.
(d) Securities exempt from registration under Rule 144A of the Securities Act of 1933. These securities may be resold in transactions exempt from registration, normally to qualified institutional buyers. These securities have been determined to be liquid under guidelines established by the Fund's Board of Trustees. As of December 31, 2015, these securities represented $14,821,991 or 2.2% of total net assets.
(e) American Depositary Receipt.
(f) Issuer headquartered overseas but considered domestic. In determining whether a security is foreign or domestic, the Adviser will generally look at the location of the headquarters of the issuer. However, if the issuer is believed by the Adviser to be headquartered in a jurisdiction primarily for tax purposes, the Adviser will consider the following additional factors: 1) the location of the primary exchange trading its securities; 2) where it derives the majority of its revenues, or 3) where it earns the majority of its profits.
(g) Percentage is less than 0.05%.
The Global Industry Classification Standard (GICS®) was developed by and/or is the exclusive property of MSCI, Inc. and Standard & Poor's Financial Services LLC ("S&P"). GICS is a service mark of MSCI, Inc. and S&P and has been licensed for use by the Adviser.
See accompanying Notes to Financial Statements.
24
MAIRS & POWER SMALL CAP FUND (unaudited)
To Our Shareholders: December 31, 2015
The Mairs & Power Small Cap Fund rallied in the fourth quarter of the year, gaining 4.75%, ahead of both the S&P 600 and the peer group as measured by the Lipper Small-Cap Core Funds Index which were up 3.72% and 2.80%, respectively. For the year the Fund finished down 4.68%, versus the index and peer group which were down 1.97% and 4.23%, respectively.
Overall, allocation played a small role in relative performance for the year. The Fund was underweight in the Energy sector compared to the benchmark S&P 600. With the small cap Energy sector down over 40% in 2015, our underweight posture added to relative performance. Somewhat offsetting this, the Fund carried an overweight position in the Materials sector, which was the second worst performing sector, hurting performance on a relative basis.
Importantly, stock selection was again the primary driver of relative performance for the year. Unfortunately, strong performance from certain stocks in the fourth quarter of the year wasn't quite enough to offset selection related performance earlier in the year.
MAIRS & POWER SMALL CAP FUND (MSCFX)
Top Performers
Fourth Quarter (9/30/15 – 12/31/15) | | Year To Date (12/31/14 – 12/31/15) | |
CRAY INC. | | | 63.81 | % | | CASEY'S GENERAL STORES, INC. | | | 33.36 | % | |
ACTUANT CORP | | | 30.29 | % | | GENTHERM, INC. | | | 29.44 | % | |
CASEY'S GENERAL STORES, INC. | | | 17.03 | % | | UNITED FIRE GROUP | | | 28.86 | % | |
AGREE REALTY CORPORATION | | | 13.87 | % | | VASCULAR SOLUTIONS, INC. | | | 26.62 | % | |
BEMIS CO., INC. | | | 12.94 | % | | PRIVATEBANCORP, INC. | | | 22.81 | % | |
Weak Performers
Fourth Quarter (9/30/15 – 12/31/15) | | Year To Date (12/31/14 – 12/31/15) | |
BUFFALO WILD WINGS, INC. | | | -17.46 | % | | CARDIOVASCULAR SYSTEMS INC. | | | -49.73 | % | |
STRATASYS, INC | | | -11.36 | % | | VASCO DATA SECURITY INT'L, INC. | | | -40.69 | % | |
HUB GROUP, INC. | | | -9.50 | % | | GENERAC HOLDINGS | | | -36.33 | % | |
WINTRUST FINANCIAL | | | | DONALDSON INC. | | | -25.81 | % | |
CORPORATION | | | -9.19 | % | | MDU RESOURCES GROUP, INC. | | | -22.04 | % | |
HAWKINS, INC. | | | -7.09 | % | | | | | |
Past performance is no guarantee of future results.
Cray (CRAY) was a significant outperformer for the Fund in the fourth quarter. For over a year, management has been indicating that IBM's re-positioning within the high performance computing space would create opportunities for Cray to take share. Given significant upside surprises to total revenue the last couple quarters, it appears this scenario is starting to play out. In addition, after a few fits and starts, it appears Cray is gaining traction in the rapidly evolving big data space with a couple of new high performance computer offerings. A strong competitive position, coupled with solid growth prospects and a very reasonable valuation support our large holding in Cray.
We didn't hold Stratasys (SSYS) for the entire year so it doesn't appear in the one-year table of top and bottom contributors. But when examining full year performance, it was clearly the one stock in the portfolio with the greatest negative impact on performance. Stratasys is in the additive manufacturing or 3D printing space. With their systems, companies have the ability to rapidly build prototypes to aid in designing new products or create fixtures to quickly adjust manufacturing lines for new products. While we believe in the long-term
25
MAIRS & POWER SMALL CAP FUND (unaudited) (continued)
opportunity in the additive manufacturing space, the industry is going through an unforeseen period of slower growth caused by a lot of free press and headlines in 2013 and 2014. The excitement over 3D printing spurred a lot of buying of systems (and the stocks of these companies) ahead of end-user capacity needs. After a period of digestion, we believe growth will accelerate as the industry starts to make headway into end-use parts and finished products.
United Fire (UFCS), a property, casualty and life insurance company based in Cedar Falls, Iowa, was a top contributor to performance for the year. Solid execution in building the book value of the company, accompanied by an improving valuation as the stock went from trading at a discount to book value to a slight premium, has driven performance. We like the company's long-term focus on driving value for shareholders, customers and employees.
Gentherm (THRM) also was a top contributor to performance for the year. Gentherm supplies major automobile manufacturers with personal comfort modules for heating and cooling seats, steering wheels and cup holders. Through volume growth led by new platform wins, Gentherm was able to grow top line revenues at double digits while increasing the bottom line in the mid-teens as margin improvement took hold in 2015. This led to a nice increase in the stock price for the year. We believe the outlook remains positive for these products and for Gentherm's business going into 2016.
Two stocks were added to the portfolio in the fourth quarter; Oasis Petroleum (OAS) and Workiva (WK). Oasis is a stock we exited earlier in the energy market downturn and have now just started to revisit as oil prices have dropped even further, providing an opportunity to pick up the stock at depressed levels. Workiva is a software as a service or "cloud-based" software company, based in Ames, Iowa. They are in the business of providing software to public companies to create and audit information contained in regulatory filings.
On a fundamental basis, the outlook for small cap stocks appears fairly positive as the more domestic focus of small companies relative to large has helped insulate their financial performance from a slowing global economy and a strengthening dollar. However, it has not insulated them from what appears to be a flight to safety by investors. This has resulted in a valuation compression across the S&P 600 causing the index to trade nearly in line with the S&P 500 on an earnings basis. As small cap stocks have historically grown faster than larger companies, it has been rare that small cap stocks have not carried a premium valuation to large. With less international headwind and reduced relative valuations, we feel small caps are positioned to perform well.
Andrew R. Adams
Lead Manager | | Allen D. Steinkopf
Co-Manager | |
The Fund's investment objective, risks, charges and expenses must be considered carefully before investing. The summary prospectus or full prospectus contains this and other important information about the Fund, and they may be obtained by calling Shareholder Services at (800) 304-7404 or visiting www.mairsandpower.com. Read the summary prospectus or full prospectus carefully before investing.
All holdings in the portfolio are subject to change without notice and may or may not represent current or future portfolio composition. The mention of specific securities is not intended as a recommendation or an offer of a particular security, nor is it intended to be a solicitation for the purchase or sale of any security.
All investments have risks. The Small Cap Fund is designed for long-term investors. Equity investments are subject to market fluctuations, and the Fund's share price can fall because of weakness in the broad market, a particular industry, or specific holdings. Investments in small and midcap companies generally are more volatile. International investing risks include among others political, social or economic instability, difficulty in predicting international trade patterns, taxation and foreign trading practices, and greater fluctuations in price than United States corporations. The Fund may invest in initial public offerings by small cap companies, which can involve greater risk than investments in companies that are already publicly traded.
26
MAIRS & POWER SMALL CAP FUND (unaudited) (continued)
Diversification does not guarantee profit or protect against loss.
Lipper Small Cap Core Funds Index is an unmanaged index considered representative of small-cap core funds tracked by Lipper. It is not possible to invest directly in an index.
The S&P SmallCap 600 Total Return Index (S&P 600) is an index of small company stocks managed by Standard & Poor's that covers a broad range of small cap stocks in the United States. The index is weighted according to market capitalization and covers about 3-4% of the total market for equities in the United States. It is not possible to invest directly in an index.
The S&P 500 Total Return (TR) Index (S&P 500) is an unmanaged index of 500 common stocks that is generally considered representative of the United States stock market. It tracks both the capital gains of a group of stocks over time, and assumes that any cash distributions, such as dividends, are reinvested back into the index. It is not possible to invest directly in an index.
Book value is the net asset value of a company, calculated by total assets minus intangible assets.
27
Mairs & Power Small Cap Fund
PERFORMANCE INFORMATION (unaudited) December 31, 2015
Investment performance since commencement of operations (through December 31, 2015)
This chart illustrates the performance of a hypothetical $10,000 investment made in the Fund since commencement of operations.
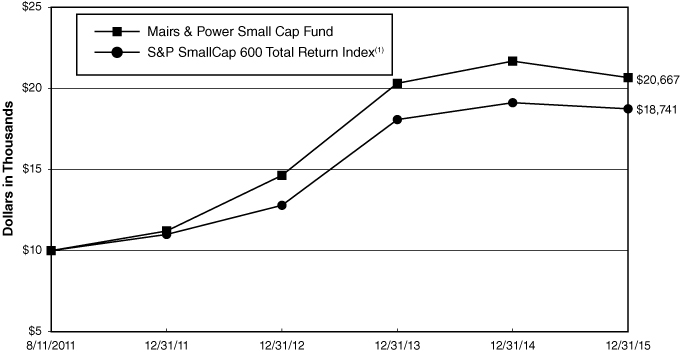
Average annual total returns for periods ended December 31, 2015
| | | 1 Year | | 3 Year | | Since Inception(2) | |
Mairs & Power Small Cap Fund | | | -4.68 | % | | | 12.18 | % | | | 17.99 | % | |
S&P SmallCap 600 Total Return Index(1) | | | -1.97 | % | | | 13.57 | % | | | 15.39 | % | |
Performance data quoted represents past performance and does not guarantee future results. All performance information shown includes the reinvestment of dividend and capital gain distributions, but does not reflect the deduction of taxes that a shareholder would pay on Fund distributions or the redemption of Fund shares. The investment return and principal value of an investment will fluctuate so that an investor's shares, when redeemed, may be worth more or less than their original cost. Current performance of the Fund may be lower or higher than the performance quoted. For the most recent month-end performance figures, visit the Fund's website at www.mairsandpower.com or call Shareholder Services at (800) 304-7404.
(1) The S&P SmallCap 600 Total Return Index is an index of small company stocks managed by Standard & Poor's that covers a broad range of small cap stocks in the United States. The index is weighted according to market capitalization and covers about 3-4% of the total market for equities in the United States. It is not possible to invest directly in an index.
(2) Since inception performance is as of August 11, 2011, which is the offering date of the Small Cap Fund.
28
Mairs & Power Small Cap Fund
FUND INFORMATION (unaudited) December 31, 2015
Portfolio Managers
Andrew R. Adams, lead manager since 2011
University of Wisconsin-Madison, MS Finance 1997
Allen D. Steinkopf, co-manager since January 1, 2015, University of Minnesota, MBA Finance 1986
General Information
Fund Symbol | | MSCFX | |
Net Asset Value (NAV) Per Share | | $ | 19.48 | | |
Expense Ratio | | | 1.06 | % | |
Portfolio Turnover Rate | | | 23.27 | % | |
Sales Charge | | | None1 | | |
Fund Inception Year | | | 2011 | | |
Portfolio Composition
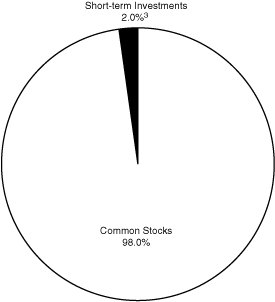
Top Ten Portfolio Holdings
(Percent of Total Net Assets)2
United Fire Group Inc | | | 3.7 | % | |
Agree Realty Corp | | | 3.6 | | |
Oshkosh Corp | | | 3.5 | | |
Physicians Realty Trust | | | 3.5 | | |
Bio-Techne Corp | | | 3.5 | | |
Cray Inc | | | 3.3 | | |
PrivateBancorp Inc | | | 3.3 | | |
Badger Meter Inc | | | 3.2 | | |
Wintrust Financial Corp | | | 3.2 | | |
Bemis Co Inc | | | 3.1 | | |
Portfolio Diversification
(Percent of Total Net Assets)
Common Stocks 98.0% | |
Industrials | | | 28.5 | % | |
Financials | | | 23.7 | | |
Information Technology | | | 17.7 | | |
Materials | | | 7.6 | | |
Health Care | | | 7.3 | | |
Consumer Discretionary | | | 4.7 | | |
Utilities | | | 4.5 | | |
Consumer Staples | | | 2.8 | | |
Energy | | | 1.2 | | |
Short-term Investments 2.0%3 | | | 2.0 | | |
| | | | 100.0 | % | |
1 Although the Fund is no-load, investment management fees and other expenses still apply.
2 All holdings in the portfolio are subject to change without notice and may or may not represent current or future portfolio composition. The mention of specific securities is not intended as a recommendation or offer for a particular security, nor is it intended to be a solicitation for the purchase or sale of any security.
3 Represents short-term investments and other assets and liabilities (net).
The Global Industry Classification Standard (GICS®) was developed by and/or is the exclusive property of MSCI, Inc. and Standard & Poor's Financial Services LLC ("S&P"). GICS is a service mark of MSCI, Inc. and S&P and has been licensed for use by Mairs & Power, Inc.
29
Mairs & Power Small Cap Fund
SCHEDULE OF INVESTMENTS December 31, 2015
Shares | | Security Description | | Fair Value | |
| | | COMMON STOCKS 98.0% | |
| | | CONSUMER DISCRETIONARY 4.7% | |
| | 26,500 | | | Buffalo Wild Wings Inc (b) | | $ | 4,230,725 | | |
| | 104,385 | | | Gentherm Inc (b) | | | 4,947,849 | | |
| | | | 9,178,574 | | |
| | | CONSUMER STAPLES 2.8% | |
| | 45,500 | | | Casey's General Stores Inc | | | 5,480,475 | | |
| | | ENERGY 1.2% | |
| | 238,500 | | | Northern Oil and Gas Inc (b) | | | 920,610 | | |
| | 177,700 | | | Oasis Petroleum Inc (b) | | | 1,309,649 | | |
| | | | 2,230,259 | | |
| | | FINANCIALS 23.7% | |
| | 205,006 | | | Agree Realty Corp | | | 6,968,154 | | |
| | 260,500 | | | Associated Banc-Corp | | | 4,884,375 | | |
| | 278,613 | | | Bank Mutual Corp | | | 2,173,181 | | |
| | 251,216 | | | Cardinal Financial Corp | | | 5,715,164 | | |
| | 397,800 | | | Physicians Realty Trust | | | 6,706,908 | | |
| | 153,950 | | | PrivateBancorp Inc | | | 6,315,029 | | |
| | 185,812 | | | United Fire Group Inc | | | 7,118,458 | | |
| | 126,600 | | | Wintrust Financial Corp | | | 6,142,632 | | |
| | | | 46,023,901 | | |
| | | HEALTH CARE 7.3% | |
| | 74,400 | | | Bio-Techne Corp | | | 6,696,000 | | |
| | 236,753 | | | Cardiovascular Systems Inc (b) | | | 3,579,705 | | |
| | 35,300 | | | Patterson Cos Inc | | | 1,595,913 | | |
| | 68,773 | | | Vascular Solutions Inc (b) | | | 2,365,104 | | |
| | | | 14,236,722 | | |
| | | INDUSTRIALS 28.5% | |
| | 213,200 | | | Actuant Corp | | | 5,108,272 | | |
| | 132,100 | | | Apogee Enterprises Inc | | | 5,747,671 | | |
| | 67,000 | | | Deluxe Corp | | | 3,654,180 | | |
| | 163,200 | | | Donaldson Co Inc | | | 4,677,312 | | |
| | 61,239 | | | G&K Services Inc, Class A | | | 3,851,933 | | |
| | 133,100 | | | Generac Holdings Inc (b) | | | 3,962,387 | | |
| | 75,600 | | | Graco Inc | | | 5,448,492 | | |
| | 129,300 | | | Hub Group Inc, Class A (b) | | | 4,260,435 | | |
| | 173,100 | | | Oshkosh Corp | | | 6,757,824 | | |
| | 55,400 | | | Proto Labs Inc (b) | | | 3,528,426 | | |
| | 226,172 | | | Raven Industries Inc | | | 3,528,283 | | |
30
Mairs & Power Small Cap Fund
SCHEDULE OF INVESTMENTS (continued) December 31, 2015
Shares | | Security Description | | Fair Value | |
| | | COMMON STOCKS (continued) | |
| | | INDUSTRIALS (continued) | |
| | 11,400 | | | Snap-on Inc | | $ | 1,954,302 | | |
| | 37,700 | | | Toro Co/The | | | 2,754,739 | | |
| | | | 55,234,256 | | |
| | | INFORMATION TECHNOLOGY 17.7% | |
| | 105,696 | | | Badger Meter Inc | | | 6,192,729 | | |
| | 199,678 | | | Cray Inc (b) | | | 6,479,551 | | |
| | 176,675 | | | MOCON Inc | | | 2,568,855 | | |
| | 47,200 | | | MTS Systems Corp | | | 2,992,952 | | |
| | 63,634 | | | NVE Corp | | | 3,574,958 | | |
| | 55,500 | | | SPS Commerce Inc (b) | | | 3,896,655 | | |
| | 125,200 | | | Stratasys Ltd (a) (b) | | | 2,939,696 | | |
| | 251,563 | | | VASCO Data Security International Inc (b) | | | 4,208,649 | | |
| | 81,590 | | | Workiva Inc (b) | | | 1,433,536 | | |
| | | | 34,287,581 | | |
| | | MATERIALS 7.6% | |
| | 136,000 | | | Bemis Co Inc | | | 6,077,840 | | |
| | 157,980 | | | Hawkins Inc | | | 5,650,945 | | |
| | 35,000 | | | Valspar Corp/The | | | 2,903,250 | | |
| | | | 14,632,035 | | |
| | | UTILITIES 4.5% | |
| | 57,900 | | | ALLETE Inc | | | 2,943,057 | | |
| | 315,600 | | | MDU Resources Group Inc | | | 5,781,792 | | |
| | | | 8,724,849 | | |
| | | | | TOTAL COMMON STOCKS
(cost $171,880 231) | | $ | 190,028,652
| | |
| | | SHORT-TERM INVESTMENTS 2.0% | |
| 3,797,416
| | | First American Prime Obligations Fund, Class Z, 0.21% (c)
(cost $3,797,416) | | $ | 3,797,416
| | |
| | | | | TOTAL INVESTMENTS 100.0%
(cost $175,456,602) | | $ | 193,826,068
| | |
| | | | | OTHER ASSETS AND LIABILITIES (NET) 0.0% (d) | | | 10,980 | | |
| | | | | TOTAL NET ASSETS 100.0% | | $ | 193,837,048 | | |
(a) Foreign security denominated in U.S. dollars. As of December 31, 2015, these securities represented $2,939,696 or 1.5% of total net assets.
(b) Non-income producing.
(c) The rate quoted is the annualized seven-day effective yield as of December 31, 2015.
(d) Percentage is less than 0.05%.
The Global Industry Classification Standard (GICS®) was developed by and/or is the exclusive property of MSCI, Inc. and Standard & Poor's Financial Services LLC ("S&P"). GICS is a service mark of MSCI, Inc. and S&P and has been licensed for use by the Adviser.
See accompanying Notes to Financial Statements.
31
STATEMENTS OF ASSETS AND LIABILITIES December 31, 2015
| | | Mairs & Power
Growth Fund | | Mairs & Power
Balanced Fund | | Mairs & Power
Small Cap Fund | |
ASSETS | |
| Investments, at fair value (Note 1): | |
Unaffiliated securities * | | $ | 3,740,769,510 | | | $ | 663,590,572 | | | $ | 193,826,068 | | |
| Affiliated securities (Note 5) * | | | 81,923,151 | | | | - | | | | - | | |
| | | | 3,822,692,661 | | | | 663,590,572 | | | | 193,826,068 | | |
Cash | | | - | | | | 166,130 | | | | - | | |
Receivable for Fund shares sold | | | 3,379,437 | | | | 2,293,579 | | | | 690,402 | | |
Receivable for securities sold | | | 9,933,918 | | | | - | | | | 488,667 | | |
Dividends and interest receivable | | | 5,770,028 | | | | 3,131,162 | | | | 166,294 | | |
Prepaid expenses and other assets | | | 151,264 | | | | 41,253 | | | | 20,255 | | |
| | | | 3,841,927,308 | | | | 669,222,696 | | | | 195,191,686 | | |
LIABILITIES | |
Payable for Fund shares redeemed | | | 2,303,241 | | | | 593,649 | | | | 238,317 | | |
Payable for securities purchased | | | - | | | | 310,347 | | | | 921,981 | | |
| Accrued investment management fees (Note 2) | | | 1,842,463 | | | | 332,773 | | | | 146,739 | | |
| Accrued Fund administration fees (Note 2) | | | 111,816 | | | | 19,516 | | | | 4,267 | | |
Accrued audit and tax expense | | | 10,968 | | | | 29,415 | | | | 12,869 | | |
Accrued transfer agent fees | | | 205,258 | | | | 35,997 | | | | 14,969 | | |
Other accrued expenses | | | 189,299 | | | | 220,738 | | | | 15,496 | | |
| | | | 4,663,045 | | | | 1,542,435 | | | | 1,354,638 | | |
NET ASSETS | | $ | 3,837,264,263 | | | $ | 667,680,261 | | | $ | 193,837,048 | | |
NET ASSETS CONSIST OF | |
Portfolio capital | | $ | 2,212,593,583 | | | $ | 552,353,055 | | | $ | 174,261,383 | | |
Undistributed net investment income | | | 311,161 | | | | 51,894 | | | | 51,101 | | |
Undistributed net realized gain (loss)
on investments | | | 2,223,923 | | | | (416 | ) | | | 1,155,098 | | |
Net unrealized appreciation (depreciation)
on investments | | | 1,622,135,596 | | | | 115,275,728 | | | | 18,369,466 | | |
TOTAL NET ASSETS | | $ | 3,837,264,263 | | | $ | 667,680,261 | | | $ | 193,837,048 | | |
Fund shares, par value | | $ | 0.01 | | | $ | 0.01 | | | $ | 0.01 | | |
Authorized | | | unlimited | | | | unlimited | | | | unlimited | | |
Fund shares issued and outstanding | | | 36,739,868 | | | | 8,226,349 | | | | 9,950,199 | | |
Net asset value per share | | $ | 104.44 | | | $ | 81.16 | | | $ | 19.48 | | |
* Cost of investments | |
Cost of unaffiliated securities | | $ | 2,168,105,391 | | | $ | 548,314,844 | | | $ | 175,456,602 | | |
| Cost of affiliated securities (Note 5) | | | 32,451,674 | | | | - | | | | - | | |
| | | $ | 2,200,557,065 | | | $ | 548,314,844 | | | $ | 175,456,602 | | |
See accompanying Notes to Financial Statements.
32
STATEMENTS OF OPERATIONS Year Ended December 31, 2015
| | | Mairs & Power
Growth Fund | | Mairs & Power
Balanced Fund | | Mairs & Power
Small Cap Fund | |
INVESTMENT INCOME | |
Income: | |
Dividends from unaffiliated securities * | | $ | 81,960,521 | | | $ | 11,987,001 | | | $ | 2,864,848 | | |
| Dividends from affiliated securities (Note 5) | | | 4,002,934 | | | | - | | | | - | | |
Interest income | | | 31,682 | | | | 10,956,569 | | | | 1,795 | | |
TOTAL INCOME | | | 85,995,137 | | | | 22,943,570 | | | | 2,866,643 | | |
Expenses: | |
| Investment management fees (Note 2) | | | 23,099,434 | | | | 4,286,748 | | | | 1,732,099 | | |
| Fund administration fees (Note 2) | | | 740,132 | | | | 130,862 | | | | 29,851 | | |
Fund accounting fees | | | 442,058 | | | | 150,570 | | | | 53,171 | | |
| Trustees' fees (Note 2) | | | 213,725 | | | | 36,050 | | | | 7,725 | | |
Transfer agent fees | | | 1,521,425 | | | | 296,991 | | | | 114,525 | | |
Custodian fees | | | 243,299 | | | | 45,187 | | | | 12,968 | | |
Legal and audit fees | | | 148,375 | | | | 72,995 | | | | 33,913 | | |
Printing and mailing fees | | | 310,781 | | | | 93,642 | | | | 26,049 | | |
Other fees | | | 210,173 | | | | 74,978 | | | | 38,201 | | |
TOTAL EXPENSES | | | 26,929,402 | | | | 5,188,023 | | | | 2,048,502 | | |
NET INVESTMENT INCOME | | | 59,065,735 | | | | 17,755,547 | | | | 818,141 | | |
| REALIZED AND UNREALIZED GAIN (LOSS) (Note 4) | |
Net realized gain on investments sold | |
Unaffiliated issuers | | | 244,989,551 | | | | 12,964,451 | | | | 3,703,249 | | |
| Affiliated issuers (Note 5) | | | 7,017,234 | | | | - | | | | - | | |
| | | | 252,006,785 | | | | 12,964,451 | | | | 3,703,249 | | |
Change in net unrealized appreciation
(depreciation) on investments | | | (439,524,058 | ) | | | (48,688,684 | ) | | | (14,284,540 | ) | |
NET GAIN (LOSS) ON INVESTMENTS | | | (187,517,273 | ) | | | (35,724,233 | ) | | | (10,581,291 | ) | |
NET INCREASE (DECREASE) IN NET ASSETS
FROM OPERATIONS | | $ | (128,451,538 | ) | | $ | (17,968,686 | ) | | $ | (9,763,150 | ) | |
* Net of foreign taxes withheld of: | | $ | 265,023 | | | $ | 43,518 | | | $ | - | | |
See accompanying Notes to Financial Statements.
33
Mairs & Power Growth Fund
STATEMENTS OF CHANGES IN NET ASSETS
| | | Year Ended December 31, | |
| | | 2015 | | 2014 | |
OPERATIONS | |
Net investment income | | $ | 59,065,735 | | | $ | 56,029,296 | | |
Net realized gain on investments sold | | | 252,006,785 | | | | 85,784,027 | | |
Net change in unrealized appreciation (depreciation) of investments | | | (439,524,058 | ) | | | 186,205,036 | | |
NET INCREASE (DECREASE) IN NET ASSETS FROM OPERATIONS | | | (128,451,538 | ) | | | 328,018,359 | | |
DISTRIBUTIONS TO SHAREHOLDERS FROM | |
Net investment income | | | (58,959,603 | ) | | | (55,824,267 | ) | |
Net realized gain on investments sold | | | (228,500,497 | ) | | | (86,125,609 | ) | |
TOTAL DISTRIBUTIONS TO SHAREHOLDERS | | | (287,460,100 | ) | | | (141,949,876 | ) | |
CAPITAL TRANSACTIONS | |
Proceeds from shares sold | | | 331,027,955 | | | | 544,753,954 | | |
Reinvestment of distributions from net investment income and
net realized gains | | | 270,332,473 | | | | 133,193,951 | | |
Cost of shares redeemed | | | (645,659,818 | ) | | | (531,070,805 | ) | |
INCREASE (DECREASE) IN NET ASSETS FROM CAPITAL
TRANSACTIONS | | | (44,299,390 | ) | | | 146,877,100 | | |
TOTAL INCREASE (DECREASE) IN NET ASSETS | | | (460,211,028 | ) | | | 332,945,583 | | |
NET ASSETS | |
Beginning of year | | | 4,297,475,291 | | | | 3,964,529,708 | | |
End of year (including undistributed net investment income
of $311,161 and $205,029, respectively) | | $ | 3,837,264,263 | | | $ | 4,297,475,291 | | |
FUND SHARE TRANSACTIONS | |
Shares sold | | | 2,892,783 | | | | 4,860,694 | | |
Shares issued for reinvested distributions | | | 2,541,574 | | | | 1,139,114 | | |
Shares redeemed | | | (5,676,993 | ) | | | (4,704,753 | ) | |
NET INCREASE (DECREASE) IN FUND SHARES | | | (242,636 | ) | | | 1,295,055 | | |
See accompanying Notes to Financial Statements.
34
Mairs & Power Balanced Fund
STATEMENTS OF CHANGES IN NET ASSETS
| | | Year Ended December 31, | |
| | | 2015 | | 2014 | |
OPERATIONS | |
Net investment income | | $ | 17,755,547 | | | $ | 15,303,692 | | |
Net realized gain on investments sold | | | 12,964,451 | | | | 725,618 | | |
Net change in unrealized appreciation (depreciation) of investments | | | (48,688,684 | ) | | | 33,547,192 | | |
NET INCREASE (DECREASE) IN NET ASSETS FROM OPERATIONS | | | (17,968,686 | ) | | | 49,576,502 | | |
DISTRIBUTIONS TO SHAREHOLDERS FROM | |
Net investment income | | | (17,726,802 | ) | | | (15,372,720 | ) | |
Net realized gain on investments sold | | | (10,512,671 | ) | | | (725,533 | ) | |
TOTAL DISTRIBUTIONS TO SHAREHOLDERS | | | (28,239,473 | ) | | | (16,098,253 | ) | |
CAPITAL TRANSACTIONS | |
Proceeds from shares sold | | | 129,627,679 | | | | 209,088,383 | | |
Reinvestment of distributions from net investment income and net realized gains | | | 27,208,349 | | | | 15,406,907 | | |
Cost of shares redeemed | | | (165,811,060 | ) | | | (99,425,514 | ) | |
INCREASE (DECREASE) IN NET ASSETS FROM CAPITAL TRANSACTIONS | | | (8,975,032 | ) | | | 125,069,776 | | |
TOTAL INCREASE (DECREASE) IN NET ASSETS | | | (55,183,191 | ) | | | 158,548,025 | | |
NET ASSETS | |
Beginning of year | | | 722,863,452 | | | | 564,315,427 | | |
End of year (including undistributed net investment income
of $51,894 and $23,149, respectively) | | $ | 667,680,261 | | | $ | 722,863,452 | | |
FUND SHARE TRANSACTIONS | |
Shares sold | | | 1,515,184 | | | | 2,474,800 | | |
Shares issued for reinvested distributions | | | 329,306 | | | | 180,250 | | |
Shares redeemed | | | (1,947,368 | ) | | | (1,181,522 | ) | |
NET INCREASE (DECREASE) IN FUND SHARES | | | (102,878 | ) | | | 1,473,528 | | |
See accompanying Notes to Financial Statements.
35
Mairs & Power Small Cap Fund
STATEMENTS OF CHANGES IN NET ASSETS
| | | Year Ended December 31, | |
| | | 2015 | | 2014 | |
OPERATIONS | |
Net investment income | | $ | 818,141 | | | $ | 575,864 | | |
Net realized gain on investments sold | | | 3,703,249 | | | | 2,028,819 | | |
Net change in unrealized appreciation (depreciation) of investments | | | (14,284,540 | ) | | | 6,724,120 | | |
NET INCREASE (DECREASE) IN NET ASSETS FROM OPERATIONS | | | (9,763,150 | ) | | | 9,328,803 | | |
DISTRIBUTIONS TO SHAREHOLDERS FROM | |
Net investment income | | | (775,082 | ) | | | (569,257 | ) | |
Net realized gain on investments sold | | | (1,448,411 | ) | | | (2,834,620 | ) | |
TOTAL DISTRIBUTIONS TO SHAREHOLDERS | | | (2,223,493 | ) | | | (3,403,877 | ) | |
CAPITAL TRANSACTIONS | |
Proceeds from shares sold | | | 73,280,213 | | | | 60,699,525 | | |
Reinvestment of distributions from net investment income and net realized gains | | | 2,142,806 | | | | 3,281,967 | | |
Cost of shares redeemed* | | | (31,829,601 | ) | | | (19,162,440 | ) | |
INCREASE IN NET ASSETS FROM CAPITAL TRANSACTIONS | | | 43,593,418 | | | | 44,819,052 | | |
TOTAL INCREASE IN NET ASSETS | | | 31,606,775 | | | | 50,743,978 | | |
NET ASSETS | |
Beginning of year | | | 162,230,273 | | | | 111,486,295 | | |
End of year (including undistributed net investment income
of $51,101 and $433, respectively) | | $ | 193,837,048 | | | $ | 162,230,273 | | |
FUND SHARE TRANSACTIONS | |
Shares sold | | | 3,559,455 | | | | 3,008,547 | | |
Shares issued for reinvested distributions | | | 108,496 | | | | 157,787 | | |
Shares redeemed | | | (1,567,067 | ) | | | (953,045 | ) | |
NET INCREASE IN FUND SHARES | | | 2,100,884 | | | | 2,213,289 | | |
| * Net of redemption fees of : | | $ | 35,663 | | | $ | 24,735 | | |
See accompanying Notes to Financial Statements.
36
NOTES TO FINANCIAL STATEMENTS December 31, 2015
Note 1 – Organization and Significant Accounting Policies
The Mairs & Power Funds Trust (the Trust) is a no-load, diversified, open-end management investment company registered under the Investment Company Act of 1940, as amended (the 1940 Act). Mairs & Power Growth Fund (the Growth Fund), Mairs & Power Balanced Fund (the Balanced Fund), and Mairs & Power Small Cap Fund (the Small Cap Fund) (individually a Fund and collectively the Funds) are series within the Trust. The objective of the Growth Fund is to provide shareholders with a diversified portfolio of common stocks, which have the potential for above-average, long-term appreciation. The objective of the Balanced Fund is to provide capital growth, current income and preservation of capital. The objective of the Small Cap Fund is to seek above-average, long-term appreciation. Each Fund is an investment company and accordingly follows the investment company accounting and reporting guidance of the Financial Accounting Standards Board (FASB) Accounting Standard Codification Topic 946 "Financial Services – Investment Companies."
Significant accounting policies of the Funds are as follows:
Security Valuations
Security valuations for each Fund's investments are furnished by independent pricing services that have been approved by the Trust's Board of Trustees (the Board). Investments in listed equity securities are valued at the last quoted sale price on the securities exchange on which such securities are principally traded or at the NASDAQ Official Closing Price if readily available for such securities on each business day. Other equity securities traded in the over-the-counter market and listed equity securities for which no sale was reported on that date are valued at the last quoted bid price. Debt obligations exceeding 60 days to maturity are valued at the bid price furnished by an independent pricing service. Debt obligations with 60 days or less remaining until maturity may be valued at the bid price furnished by an independent pricing service and in certain circumstances may be valued at their amortized cost, which approximates fair value. Pricing service prices for debt obligations are based on various evaluative and matrix-based methodologies and models that use market inputs such as market transactions, dealer quotations, benchmark yields and issuer, industry and economic events. These techniques generally consider overall market conditions and such factors as yields or prices of bonds of comparable quality, type of issue, coupon, maturity and ratings.
Securities for which prices are not available from an independent pricing service, but where an active market exists, are valued using market quotations obtained from two or more dealers that make markets in the securities. When market quotations are not readily available, or when the last quoted sale price is not considered representative of the value of the security if it were to be sold on that day, the security will be valued at fair value as determined in good faith by the Fair Value Committee appointed by the Board, pursuant to procedures approved by the Board.
When determining the value of a security, the Fair Value Committee takes into consideration all indications of value that appear relevant under the particular circumstances as well as fundamental analytical data relating to the security, the nature and duration of any restrictions on the disposition of the security, and the forces influencing the market in which the security is purchased or sold in addition to other more specific factors that may be applied on a case-by-case basis. Consequently, the value of the security used by a Fund may differ from a quoted or published price for the same security. Fair value pricing involves subjective judgments and it is possible that the fair value determined for the security is materially different than the value that could be realized upon the sale of that security. As of December 31, 2015, no securities were valued using this method.
Fair Valuation Measurements
The Trust has adopted authoritative fair valuation accounting standards, which establish a definition of fair value and set out a hierarchy for measuring fair value. These standards require additional disclosures about the various inputs and valuation techniques used to develop the measurements of fair value and changes in valuation
37
NOTES TO FINANCIAL STATEMENTS (continued) December 31, 2015
Note 1 – Organization and Significant Accounting Policies (continued)
Fair Valuation Measurements (continued)
techniques and related inputs during the period. These inputs are summarized in the three broad levels listed below:
• Level 1 – Quoted prices in active markets for identical securities.
• Level 2 – Other significant observable inputs (including quoted prices for similar securities, interest rates, prepayment speeds, credit risk, etc.).
• Level 3 – Significant unobservable inputs (including the Funds' own assumptions in determining the fair value of investments).
The inputs or methodologies used for valuing securities are not necessarily an indication of the risk associated with investing in those securities. The following is a summary of the inputs used to value the securities held by each Fund as of December 31, 2015:
| | | Growth Fund | | Balanced Fund | | Small Cap Fund | |
Level 1* | | $ | 3,822,692,661 | | | $ | 448,161,800 | | | $ | 193,826,068 | | |
Level 2** | | | - | | | | 215,428,772 | | | | - | | |
Level 3 | | | - | | | | - | | | | - | | |
Total | | $ | 3,822,692,661 | | | $ | 663,590,572 | | | $ | 193,826,068 | | |
* All Level 1 investments are equity securities (common stocks and preferred securities) and short-term investments.
** All Level 2 investments are fixed income securities, excluding preferred securities.
For detail of securities by major sector classification for the Funds, please refer to the Schedules of Investments.
The Funds had no transfers amongst levels and did not hold any Level 3 investments during the year.
Security Transactions and Investment Income
Security transactions are recorded on the date on which securities are purchased or sold. Dividend income and corporate action transactions are recorded on the ex-dividend date. Interest income, including the accretion of discounts and amortization of premiums, is recorded on an accrual basis. Premiums and discounts are amortized using the effective interest method. Realized gains and losses are reported on an identified cost basis.
Income Taxes
Each Fund is a "regulated investment company" as defined in Subtitle A, Chapter 1, Subchapter M of the Internal Revenue Code of 1986, as amended (the Code). No provisions have been made for federal income taxes as it is the intention of each Fund to comply with the provisions of the Code applicable to regulated investment companies and to make distributions of income and realized gains sufficient to relieve it from all or substantially all excise and income taxes.
As of December 31, 2015, the Trust did not have any tax positions that did not meet the "more-likely-than-not" threshold of being sustained by the applicable tax authority. Generally, tax authorities can examine all tax returns filed for the last three years.
At December 31, 2015, none of the Funds had capital loss carryforwards nor did they have any post-October losses for federal tax purposes.
38
NOTES TO FINANCIAL STATEMENTS (continued) December 31, 2015
Note 1 – Organization and Significant Accounting Policies (continued)
Basis of Presentation
The preparation of financial statements in conformity with U.S. generally accepted accounting principles (GAAP) requires management to make estimates and assumptions that affect the reported amount of net assets and liabilities and disclosure of contingent assets and liabilities at the date of the financial statements and the reported results of operations during the reporting period. Actual results could differ from those estimates.
In preparing these financial statements, the Funds have evaluated events and transactions for potential recognition or disclosure through the date the financial statements were available to be issued. This evaluation did not result in any subsequent events that necessitated recognition or disclosure.
Expense Allocation
Common expenses incurred by the Trust are allocated among the Funds based on their relative assets. Fund specific expenses are charged directly to the Fund that incurred the expense.
Recent Accounting Pronouncement
In August 2014, the FASB issued ASU No. 2014, Disclosure of Uncertainties about an Entity's Ability to Continue as a Going Concern (ASU 2014-15). ASU 2014-15 requires management to evaluate whether there are conditions and events that raise substantial doubt about the entity's ability to continue as a going concern for annual reporting periods. The ASU will result in additional disclosures and will require certain disclosures if it concludes that substantial doubt exists and will require disclosure of plans to alleviate that doubt. It is effective for annual periods ending after December 15, 2016, and for annual periods thereafter, with early adoption permitted. This ASU is not expected to have any impact on the Funds' statements of assets and liabilities or statements of operations.
Note 2 – Related-Party Transactions
Investment Management and Fund Administration Fees
The Adviser provides investment management services to the Funds under a written agreement (the Management Agreement) approved by the Board. Pursuant to the Management Agreement, the Adviser is paid a monthly fee on average daily net assets at the following annual rates:
| | | Growth Fund | | Balanced Fund | | Small Cap Fund | |
Up to $2.5 Billion | | | 0.60 | % | | | 0.60 | % | | | 0.90 | % | |
Over $2.5 Billion | | | 0.50 | % | | | 0.60 | % | | | 0.90 | % | |
The Adviser provides fund administration services to the Funds under a written fund administration servicing agreement approved by the Board. The fund administration fee paid to the Adviser is computed at an annual rate of 0.00281% of average daily net assets. Fund administration fees incurred for the year ended December 31, 2015 and fund administration fees payable to the Adviser as of December 31, 2015 were as follows:
| | | Growth Fund | | Balanced Fund | | Small Cap Fund | |
Fund administration fees incurred | | $ | 115,769 | | | $ | 20,077 | | | $ | 5,408 | | |
Fund administration fees payable | | | 9,357 | | | | 1,613 | | | | 468 | | |
Pursuant to a sub-administration agreement between the Funds and U.S. Bancorp Fund Services, LLC (USBFS), the Funds are charged a sub-administration fee paid to USBFS. Sub-administration fees from USBFS incurred for the year ended December 31, 2015 and sub-administration fees payable to USBFS as of December 31, 2015 were as follows:
| | | Growth Fund | | Balanced Fund | | Small Cap Fund | |
Sub-administration fees paid | | $ | 624,363 | | | $ | 110,785 | | | $ | 24,443 | | |
Sub-administration fees payable | | | 102,459 | | | | 17,903 | | | | 3,799 | | |
39
NOTES TO FINANCIAL STATEMENTS (continued) December 31, 2015
Note 2 – Related-Party Transactions (continued)
Trustees' Fees
The Funds pay compensation to the disinterested Trustees of the Trust. The Funds do not pay remuneration to officers or to Trustees who are officers, directors or employees of the Adviser.
Note 3 – Indemnifications
In the normal course of business, the Trust enters into contracts that contain general indemnifications to other parties. The Trust's maximum exposure under these contracts is unknown as this would involve future claims that may be made against the Trust that have not yet occurred. The Trust expects the risk of loss to be remote.
Note 4 – Distributions Paid, Distributable Earnings and Investment Transactions
Net investment income and net realized capital gains (losses) may differ for financial reporting and tax purposes because of temporary or permanent book/tax differences. In addition, GAAP requires that certain components of net assets relating to permanent differences be reclassified between financial and tax reporting. The permanent differences primarily relate to utilization of earning and profits distributed to shareholders on redemption of shares. These reclassifications have no effect on net assets or net asset value per share. On the statement of assets and liabilities, the following reclassifications were made for the year ended December 31, 2015:
| | | Undistributed
Net Investment
Income | | Undistributed
Net Realized
Gain (Loss) | | Paid in Capital | |
Growth Fund | | $ | - | | | $ | (21,096,371 | ) | | $ | 21,096,371 | | |
Balanced Fund | | | - | | | | (2,452,562 | ) | | | 2,452,562 | | |
Small Cap Fund | | | 7,609 | | | | - | | | | (7,609 | ) | |
Distributions to shareholders are determined in accordance with income tax regulations that may differ from GAAP, and due to the timing of the distributions, the fiscal year in which the amounts are distributed may differ from the year that the income or realized gains (losses) were recorded by each Fund.
The tax character of distributions paid during the years ended December 31, 2015 and December 31, 2014, were as follows:
Year ended December 31, 2015 | |
Distributions paid from: | | Growth Fund | | Balanced Fund | | Small Cap Fund | |
Ordinary income | | $ | 58,959,603 | | | $ | 17,726,802 | | | $ | 775,082 | | |
Long-term capital gains | | | 228,500,497 | | | | 10,512,671 | | | | 1,448,411 | | |
Total distributions paid | | $ | 287,460,100 | | | $ | 28,239,473 | | | $ | 2,223,493 | | |
Year ended December 31, 2014 | |
Distributions paid from: | | Growth Fund | | Balanced Fund | | Small Cap Fund | |
Ordinary income | | $ | 55,824,267 | | | $ | 15,401,379 | | | $ | 569,257 | | |
Long-term capital gains | | | 86,125,609 | | | | 696,874 | | | | 2,834,620 | | |
Total distributions paid | | $ | 141,949,876 | | | $ | 16,098,253 | | | $ | 3,403,877 | | |
Ordinary income distributions include net short-term capital gains. The Funds designate the long-term capital gains presented above as capital gains dividends under the Internal Revenue Code.
40
NOTES TO FINANCIAL STATEMENTS (continued) December 31, 2015
Note 4 – Distributions Paid, Distributable Earnings and Investment Transactions (continued)
At December 31, 2015, the components of accumulated earnings (losses) on a tax basis were as follows:
| | | Growth Fund | | Balanced Fund | | Small Cap Fund | |
Cost of investments | | $ | 2,201,372,074 | | | $ | 548,315,260 | | | $ | 175,662,747 | | |
Gross unrealized appreciation | | $ | 1,726,586,535 | | | $ | 138,348,665 | | | $ | 34,471,597 | | |
Gross unrealized depreciation | | | (105,265,948 | ) | | | (23,073,353 | ) | | | (16,308,276 | ) | |
Net unrealized appreciation | | $ | 1,621,320,587 | | | $ | 115,275,312 | | | $ | 18,163,321 | | |
Undistributed ordinary income | | $ | 311,161 | | | $ | 51,894 | | | $ | 51,101 | | |
Undistributed long-term capital gains | | | 3,038,932 | | | | - | | | | 1,361,243 | | |
Total distributable earnings | | $ | 3,350,093 | | | $ | 51,894 | | | $ | 1,412,344 | | |
Other accumulated earnings | | | - | | | | - | | | | - | | |
Total accumulated earnings | | $ | 1,624,670,680 | | | $ | 115,327,206 | | | $ | 19,575,665 | | |
The difference between book basis and tax basis unrealized appreciation is attributed primarily to the tax deferral of losses on wash sales.
Purchases and sales of investment securities, excluding government securities, short-term securities and temporary cash investments, during the year ended December 31, 2015 were as follows:
| | | Purchases | | Sales | |
Growth Fund | | $ | 388,071,003 | | | $ | 644,906,308 | | |
Balanced Fund | | | 84,310,614 | | | | 75,758,634 | | |
Small Cap Fund | | | 85,498,836 | | | | 43,374,190 | | |
Purchases and sales of government securities during the year ended December 31, 2015 were as follows:
| | | Purchases | | Sales | |
Growth Fund | | $ | - | | | $ | - | | |
Balanced Fund | | | 12,986,011 | | | | 35,168,809 | | |
Small Cap Fund | | | - | | | | - | | |
Note 5 – Transactions With Affiliated Companies
The Growth Fund owned 5% or more of the voting securities of the following companies during the year ended December 31, 2015. As a result, these companies are deemed to be affiliates of the Growth Fund as defined by the 1940 Act. Transactions during the year in these securities of affiliated companies were as follows:
Growth Fund
| | | Share Activity | | | | | |
Security Name | | Balance
12/31/14 | | Purchases | | Sales | | Balance
12/31/15 | | Dividend
Income | | Fair Value at
12/31/15 | |
Badger Meter Inc (1) | | | 784,299 | | | | - | | | | 72,072 | | | | 712,227 | | | $ | 597,339 | | | $ | 41,729,380 | | |
MTS Systems Corp | | | 1,071,025 | | | | - | | | | 88,176 | | | | 982,849 | | | | 1,232,324 | | | | 62,322,455 | | |
NVE Corp | | | 486,185 | | | | - | | | | 137,294 | | | | 348,891 | | | | 2,173,271 | | | | 19,600,696 | | |
| | | | | | | | | | | $ | 4,002,934 | | | $ | 123,652,531 | | |
(1) Issuer was not an affiliate as of December 31, 2015 due to sales during the year. Dividend income is for the period in 2015 that the company was deemed an affiliate.
41
Mairs & Power Growth Fund
FINANCIAL HIGHLIGHTS
SELECTED DATA AND RATIOS
(for a share outstanding throughout each year)
| | | Year Ended December 31, | |
| | | 2015 | | 2014 | | 2013 | | 2012 | | 2011 | |
Per Share | |
Net asset value, beginning of year | | $ | 116.20 | | | $ | 111.09 | | | $ | 83.95 | | | $ | 70.78 | | | $ | 72.16 | | |
Income (loss) from investment operations: | |
Net investment income | | | 1.68 | | | | 1.54 | | | | 1.23 | | | | 1.33 | | | | 1.01 | | |
Net realized and unrealized gain (loss) | | | (5.17 | ) | | | 7.48 | | | | 28.58 | | | | 14.08 | | | | (0.45 | ) | |
Total from investment operations | | | (3.49 | ) | | | 9.02 | | | | 29.81 | | | | 15.41 | | | | 0.56 | | |
Distributions to shareholders from: | |
Net investment income | | | (1.67 | ) | | | (1.53 | ) | | | (1.23 | ) | | | (1.34 | ) | | | (1.00 | ) | |
Net realized gains on investments sold | | | (6.60 | ) | | | (2.38 | ) | | | (1.44 | ) | | | (0.90 | ) | | | (0.94 | ) | |
Total distributions | | | (8.27 | ) | | | (3.91 | ) | | | (2.67 | ) | | | (2.24 | ) | | | (1.94 | ) | |
Net asset value, end of year | | $ | 104.44 | | | $ | 116.20 | | | $ | 111.09 | | | $ | 83.95 | | | $ | 70.78 | | |
Total investment return | | | (3.07 | %) | | | 8.12 | % | | | 35.64 | % | | | 21.91 | % | | | 0.74 | % | |
Net assets, end of year, in thousands | | $ | 3,837,264 | | | $ | 4,297,475 | | | $ | 3,964,530 | | | $ | 2,498,207 | | | $ | 1,975,127 | | |
Ratios/supplemental data: | |
Ratio of expenses to average net assets | | | 0.65 | % | | | 0.65 | % | | | 0.67 | % | | | 0.70 | % | | | 0.72 | % | |
Ratio of net investment income to average net assets | | | 1.43 | | | | 1.36 | | | | 1.27 | | | | 1.69 | | | | 1.40 | | |
Portfolio turnover rate | | | 9.64 | | | | 6.42 | | | | 3.79 | | | | 1.58 | | | | 2.78 | | |
See accompanying Notes to Financial Statements.
42
Mairs & Power Balanced Fund
FINANCIAL HIGHLIGHTS
SELECTED DATA AND RATIOS
(for a share outstanding throughout each year)
| | | Year Ended December 31, | |
| | | 2015 | | 2014 | | 2013 | | 2012 | | 2011 | |
Per Share | |
Net asset value, beginning of year | | $ | 86.79 | | | $ | 82.31 | | | $ | 70.83 | | | $ | 62.15 | | | $ | 62.01 | | |
Income (loss) from investment operations: | |
Net investment income | | | 2.14 | | | | 1.98 | | | | 1.79 | | | | 1.89 | | | | 1.85 | | |
Net realized and unrealized gain (loss) | | | (4.34 | ) | | | 4.59 | | | | 11.58 | | | | 8.79 | | | | 0.13 | | |
Total from investment operations | | | (2.20 | ) | | | 6.57 | | | | 13.37 | | | | 10.68 | | | | 1.98 | | |
Distributions to shareholders from: | |
Net investment income | | | (2.13 | ) | | | (2.00 | ) | | | (1.78 | ) | | | (1.91 | ) | | | (1.83 | ) | |
Net realized gains on investments sold | | | (1.30 | ) | | | (0.09 | ) | | | (0.11 | ) | | | (0.09 | ) | | | (0.01 | ) | |
Total distributions | | | (3.43 | ) | | | (2.09 | ) | | | (1.89 | ) | | | (2.00 | ) | | | (1.84 | ) | |
Net asset value, end of year | | $ | 81.16 | | | $ | 86.79 | | | $ | 82.31 | | | $ | 70.83 | | | $ | 62.15 | | |
Total investment return | | | (2.54 | %) | | | 8.04 | % | | | 19.02 | % | | | 17.34 | % | | | 3.23 | % | |
Net assets, end of year, in thousands | | $ | 667,680 | | | $ | 722,863 | | | $ | 564,315 | | | $ | 286,910 | | | $ | 186,660 | | |
Ratios/supplemental data: | |
Ratio of expenses to average net assets | | | 0.73 | % | | | 0.72 | % | | | 0.72 | % | | | 0.74 | % | | | 0.79 | % | |
Ratio of net investment income to average net assets | | | 2.49 | | | | 2.39 | | | | 2.43 | | | | 2.94 | | | | 2.99 | | |
Portfolio turnover rate | | | 14.05 | | | | 4.53 | | | | 3.02 | | | | 5.46 | | | | 9.12 | | |
See accompanying Notes to Financial Statements.
43
Mairs & Power Small Cap Fund
FINANCIAL HIGHLIGHTS
SELECTED DATA AND RATIOS
(for a share outstanding throughout each period)
| | | | | August 11, 2011 * | |
| | | Year Ended December 31, | | Through | |
| | | 2015 | | 2014 | | 2013 | | 2012 | | December 31, 2011 (1) | |
Per Share | |
Net asset value, beginning of period | | $ | 20.67 | | | $ | 19.78 | | | $ | 14.49 | | | $ | 11.21 | | | $ | 10.00 | | |
Income (loss) from investment operations: | |
Net investment income | | | 0.08 | | | | 0.08 | | | | 0.06 | | | | 0.01 | | | | 0.01 | | |
Net realized and unrealized gain (loss) | | | (1.04 | ) | | | 1.25 | | | | 5.56 | | | | 3.42 | | | | 1.20 | | |
Total from investment operations | | | (0.96 | ) | | | 1.33 | | | | 5.62 | | | | 3.43 | | | | 1.21 | | |
Distributions to shareholders from: | |
Net investment income | | | (0.08 | ) | | | (0.07 | ) | | | (0.06 | ) | | | (0.02 | ) | | | - | | |
Net realized gains on investments sold | | | (0.15 | ) | | | (0.37 | ) | | | (0.27 | ) | | | (0.13 | ) | | | - | | |
Redemption fees (2) | | | (0.00 | )(3) | | | (0.00 | )(3) | | | (0.00 | )(3) | | | - | | | | - | | |
Total distributions | | | (0.23 | ) | | | (0.44 | ) | | | (0.33 | ) | | | (0.15 | ) | | | - | | |
Net asset value, end of period | | $ | 19.48 | | | $ | 20.67 | | | $ | 19.78 | | | $ | 14.49 | | | $ | 11.21 | | |
Total investment return | | | (4.68 | %) | | | 6.73 | % | | | 38.75 | % | | | 30.60 | % | | | 12.10 | % | |
Net assets, end of period, in thousands | | $ | 193,837 | | | $ | 162,230 | | | $ | 111,486 | | | $ | 41,644 | | | $ | 5,194 | | |
Ratios/supplemental data: | |
Ratio of expenses to average net assets | |
Before expense reimbursement (4) | | | 1.06 | % | | | 1.07 | % | | | 1.17 | % | | | 1.73 | % | | | 7.98 | % | |
After expense reimbursement (4) | | | 1.06 | | | | 1.07 | | | | 1.17 | | | | 1.25 | | | | 1.25 | | |
Ratio of net investment income
to average net assets | |
Before expense reimbursement (4) | | | 0.43 | % | | | 0.43 | % | | | 0.37 | % | | | (0.14 | )% | | | (6.41 | )% | |
After expense reimbursement (4) | | | 0.43 | | | | 0.43 | | | | 0.37 | | | | 0.34 | | | | 0.32 | | |
Portfolio turnover rate | | | 23.27 | | | | 15.85 | | | | 34.91 | | | | 6.93 | | | | 4.52 | | |
* Commencement of operations.
(1) For the period ended December 31, 2011, all ratios have been annualized except total investment return and portfolio turnover.
(2) The Fund charges a 1.00% redemption fee on shares held 180 days or less.
(3) Amount per share is less than $0.005.
(4) The Adviser has agreed to waive the Small Cap Fund's investment management and fund administration fees and reimburse expenses to the extent necessary to prevent total annual fund operating expenses (excluding interest, taxes, brokerage commissions, acquired fund fees and expenses (which are indirect fees and expenses that funds incur from investing in the shares of other mutual funds, such as money market funds), other investment-related costs and other extraordinary expenses, such as litigation and other expenses not incurred in the ordinary course of the Small Cap Fund's business) from exceeding 1.25% of daily net assets through April 30, 2015. The arrangement terminated on April 30, 2015.
See accompanying Notes to Financial Statements.
44
REPORT OF INDEPENDENT REGISTERED PUBLIC ACCOUNTING FIRM
The Board of Trustees and Shareholders of Mairs & Power Funds Trust
We have audited the accompanying statements of assets and liabilities, including the schedules of investments, of Mairs & Power Funds Trust (the Trust) (comprising, respectively, Mairs & Power Growth Fund, Mairs & Power Balanced Fund, and Mairs & Power Small Cap Fund), as of December 31, 2015, and the related statements of operations for the year then ended, the statements of changes in net assets for each of the two years in the period then ended, and the financial highlights for each of the periods indicated therein. These financial statements and financial highlights are the responsibility of the Trust's management. Our responsibility is to express an opinion on these financial statements and financial highlights based on our audits.
We conducted our audits in accordance with the standards of the Public Company Accounting Oversight Board (United States). Those standards require that we plan and perform the audit to obtain reasonable assurance about whether the financial statements and financial highlights are free of material misstatement. We were not engaged to perform an audit of the Trust's internal control over financial reporting. Our audits included consideration of internal control over financial reporting as a basis for designing audit procedures that are appropriate in the circumstances, but not for the purpose of expressing an opinion on the effectiveness of the Trust's internal control over financial reporting. Accordingly, we express no such opinion. An audit also includes examining, on a test basis, evidence supporting the amounts and disclosures in the financial statements and financial highlights, assessing the accounting principles used and significant estimates made by management, and evaluating the overall financial statement presentation. Our procedures included confirmation of securities owned as of December 31, 2015, by correspondence with the custodian and brokers or by other appropriate auditing procedures where replies from brokers were not received. We believe that our audits provide a reasonable basis for our opinion.
In our opinion, the financial statements and financial highlights referred to above present fairly, in all material respects, the financial position of each of the respective funds constituting the Mairs & Power Funds Trust at December 31, 2015, the results of their operations for the year then ended, the changes in their net assets for each of the two years in the period then ended, and the financial highlights for each of the periods indicated therein, in conformity with U.S. generally accepted accounting principles.

Minneapolis, Minnesota
February 18, 2016
45
FUND EXPENSES (unaudited)
As a shareholder of the Funds, you incur two types of costs: (1) transaction costs including redemption fees and (2) ongoing expenses for the operation of the Funds (e.g., asset-based charges, such as investment management fees). The Funds are "no-load" mutual funds. As a result, shareholders pay no commissions, fees, or expenses associated with sales representatives or sales charges.
This example is intended to help you understand your ongoing costs (in dollars) of investing in the Funds and to compare these costs with the ongoing costs of investing in other mutual funds. The table below reports the Funds' expenses during the period July 1, 2015 through December 31, 2015 and includes the costs associated with a $1,000 investment.
Actual Expenses
The first line in the tables below may be used to estimate the actual expenses you paid over the reporting period. You can do this by dividing your account value by $1,000 and multiplying the result by the expense shown in the table below. For example, if your account value is $8,600, divided by $1,000 = $8.60. Multiply the result by the number in the first line under the heading entitled "Expenses Paid During Period." By doing this you can estimate the expenses you paid on your account during this period.
Hypothetical Example
The second line of the tables below provides information about hypothetical account values and hypothetical expenses based on the Funds' actual expenses and assumed returns of 5% per year before expenses, which are not the Funds' actual returns. The results may be used to provide you with a basis for comparing the ongoing costs of investing in the Funds with the ongoing costs of investing in other funds. To do so, compare these 5% hypothetical examples with the 5% hypothetical examples that appear in the shareholder reports of other funds. Please note that these hypothetical examples highlight ongoing costs only. They may not be used to estimate the actual ending account balances or expenses you paid during the period and will not help you determine the relative total costs of owning different funds.
Mairs & Power Growth Fund
| | | Beginning Account
Value 07/01/2015 | | Ending Account
Value 12/31/2015 | | Expenses Paid
During Period * | |
Actual return | | $ | 1,000.00 | | | $ | 974.60 | | | $ | 3.28 | | |
Hypothetical assumed 5% return | | $ | 1,000.00 | | | $ | 1,021.88 | | | $ | 3.36 | | |
* The Fund's expenses are equal to the Fund's annualized expense ratio for the most recent six-month period of 0.66%, multiplied by the average account value over the Fund's second fiscal half-year, multiplied by the number of days in the Fund's second fiscal half-year (184 days), divided by 365 days.
Mairs & Power Balanced Fund
| | | Beginning Account
Value 07/01/2015 | | Ending Account
Value 12/31/2015 | | Expenses Paid
During Period * | |
Actual return | | $ | 1,000.00 | | | $ | 982.40 | | | $ | 3.65 | | |
Hypothetical assumed 5% return | | $ | 1,000.00 | | | $ | 1,021.53 | | | $ | 3.72 | | |
* The Fund's expenses are equal to the Fund's annualized expense ratio for the most recent six-month period of 0.73%, multiplied by the average account value over the Fund's second fiscal half-year, multiplied by the number of days in the Fund's second fiscal half-year (184 days), divided by 365 days.
46
FUND EXPENSES (unaudited) (continued)
Mairs & Power Small Cap Fund
| | | Beginning Account
Value 07/01/2015 | | Ending Account
Value 12/31/2015 | | Expenses Paid
During Period * | |
Actual return | | $ | 1,000.00 | | | $ | 940.90 | | | $ | 5.23 | | |
Hypothetical assumed 5% return | | $ | 1,000.00 | | | $ | 1,019.81 | | | $ | 5.45 | | |
* The Fund's expenses are equal to the Fund's annualized expense ratio for the most recent six-month period of 1.07%, multiplied by the average account value over the Fund's second fiscal half-year, multiplied by the number of days in the Fund's second fiscal half-year (184 days), divided by 365 days.
47
Proxy Voting Policies and Procedures that the Trust uses to determine how to vote proxies relating to portfolio securities are available (i) without charge, upon request, by calling Shareholder Services at (800) 304-7404 and requesting a copy of the Statement of Additional Information (SAI) and (ii) on the Securities and Exchange Commission's (SEC's) website at www.sec.gov (access Form N-1A).
Information on how the Trust voted proxies relating to portfolio securities during the most recent 12-month period ended June 30 is available at www.mairsandpower.com and on the SEC's website at www.sec.gov.
DISCLOSURE OF PORTFOLIO HOLDINGS (unaudited)
The Trust files a complete schedule of portfolio holdings on Form N-Q for the first and third quarter-ends and on Form N-CSR for the second and fourth quarter-ends with the SEC. The Trust's Forms N-Q and N-CSR are available on the SEC's website at www.sec.gov. Forms N-Q and N-CSR may also be reviewed and copied at the SEC's Public Reference Room in Washington, D.C. Information on the operation of the Public Reference Room may be obtained by calling (800) SEC-0330.
The schedule of portfolio holdings is also printed in the Trust's semi-annual and annual reports to shareholders, which are available without charge by calling Shareholder Services at (800) 304-7404 or by visiting www.mairsandpower.com.
A complete copy of the Trust's portfolio holdings will also be available on or about 15 days following each quarter-end on the Fund's website at www.mairsandpower.com.
HOUSEHOLDING (unaudited)
In an effort to decrease costs, the Trust intends to reduce the number of duplicate Summary Prospectuses and Annual and Semi-Annual Reports you receive by sending only one copy of each to those addresses shared by two or more accounts and to shareholders reasonably believed to be from the same family or household. Once implemented, if you would like to discontinue householding for your accounts, please call Shareholder Services at (800) 304-7404 to request individual copies of these documents. Once notification to stop householding is received, the Trust will begin sending individual copies thirty days after receiving your request. This policy does not apply to account statements.
48
PRIVACY POLICY NOTICE (unaudited)
Our Promise to You
As a shareholder of the Mairs & Power Mutual Funds (Funds), you share both personal and financial information with us. Your privacy is important to us, and we are dedicated to safeguarding your personal and financial information.
Information Provided by Shareholders
In the normal course of doing business, we typically obtain the following non-public personal information about our shareholders:
• Personal information regarding our shareholders' identity such as name, address and social security number;
• Information regarding fund transactions effected by us; and
• Shareholder financial information such as net-worth, assets, income, bank account information and account balances.
How We Manage and Protect Your Personal Information
We do not sell information about current or former shareholders to third parties, nor is it our practice to disclose such information to third parties unless requested or permitted to do so by a shareholder or shareholder representative or, if necessary, in order to process a transaction, service an account or as permitted by law. Additionally, we may share information with outside companies that perform administrative services for us. However, our arrangements with these service providers require them to treat your information as confidential.
In order to protect your personal information, we maintain physical, electronic and procedural safeguards to protect your personal information. Our Privacy Policy restricts the use of shareholder information and requires that it be held in strict confidence.
Shareholder Notifications
We are required by law to annually provide a notice describing our privacy policy. In addition, we will inform you promptly if there are changes to our policy. Please contact us at (800) 304-7404 with questions about this notice.
OTHER INFORMATION (unaudited)
This report is submitted for the general information of the shareholders of the Funds. It is not authorized for distribution to prospective investors unless accompanied or preceded by an effective prospectus. An investor should consider the Funds' investment objectives, risks and expenses carefully before investing or sending money. This and other important information can be found in the Funds' summary prospectuses and full prospectus. To obtain a prospectus, please call Shareholder Services at (800) 304-7404 or visit the Funds' website at www.mairsandpower.com. Please read the prospectus carefully before investing.
This report includes forward-looking statements such as economic predictions and portfolio manager opinions. The statements are subject to change at any time based on market and other conditions. No predictions, forecasts, outlooks, expectations or beliefs are guaranteed.
49
TRUSTEES AND OFFICERS (unaudited) December 31, 2015
Information pertaining to the Trustees and Officers of the Trust is set forth below. The Statement of Additional Information includes additional information about the Trust's Trustees and is available without charge, upon request, by calling Shareholder Services at (800) 304-7404.
Name (Year of Birth)
and Address1 | | Position(s)
Held with the
Trust and
Length of
Time Served2 | | Principal Occupation(s)
During Past Five Years | | Number of
Portfolios
in Fund
Complex
Overseen by
Trustee | | Other
Directorships Held
by Trustee During
Past Five Years2 | |
INTERESTED PRINCIPAL OFFICER WHO IS A TRUSTEE | |
Jon A. Theobald (1945) | | Secretary since 2003; Chief Compliance Officer from 2004 to 2012; Trustee since December 2012 | | • Chairman of the Board of the Investment Adviser (January 2015 to present).
• Chief Executive Officer of the Investment Adviser (2012 to present).
• President of the Investment Adviser (2007 to 2014).
• Chief Operating Officer of the Investment Adviser (2007 to 2012).
• Chief Compliance Officer of the Investment Adviser (2004 to 2012). | | | 3 | | | None | |
PRINCIPAL OFFICERS WHO ARE NOT TRUSTEES | |
Mark L. Henneman (1961) | | President since December 31, 2014; Vice President from 2009 to 2014 | | • President of the Investment Adviser (January 2015 to present).
• Chief Investment Officer of the Investment Adviser (January 2015 to present).
• Executive Vice President of the Investment Adviser (2012 to 2014).
• Vice President of the Investment Adviser (2004 to 2012). | | | N/A | | | N/A | |
Ronald L. Kaliebe (1952) | | Vice President since 2009 | | • Senior Vice President of the Investment Adviser (January 2015 to present).
• Director of Fixed Income of the Investment Adviser (January 2015 to present).
• Vice President of the Investment Adviser (2001 to 2014). | | | N/A | | | N/A | |
Andrew R. Adams (1972) | | Vice President since 2011 | | • Vice President of the Investment Adviser (2006 to present). | | | N/A | | | N/A | |
Andrea C. Stimmel (1967) | | Treasurer since 2011; Chief Compliance Officer since 2012 | | • Director of Operations and Treasurer of the Investment Adviser (2008 to present).
• Chief Compliance Officer of the Investment Adviser (2012 to present). | | | N/A | | | N/A | |
50
TRUSTEES AND OFFICERS (unaudited) (continued) December 31, 2015
Name (Year of Birth)
and Address1 | | Position(s)
Held with the
Trust and
Length of
Time Served2 | | Principal Occupation(s)
During Past Five Years | | Number of
Portfolios
in Fund
Complex
Overseen by
Trustee | | Other
Directorships Held
by Trustee During
Past Five Years2 | |
DISINTERESTED TRUSTEES | |
Norbert J. Conzemius (1941) | | Trustee since 2000; Board Chair from February 2006 to December 2014; Nominating Committee Chair since 2006 | | • Retired Chief Executive Officer, Road Rescue Incorporated. | | | 3 | | | Director, Mairs & Power Growth Fund, Inc. (2000 to 2011), Director, Mairs & Power Balanced Fund, Inc. (2000 to 2011) | |
Mary Schmid Daugherty (1958) | | Trustee since December 2010; Audit Committee Chair since December 2012 | | • Associate Professor, Department of Finance, University of St. Thomas (1987 to present). | | | 3 | | | Director, Mairs & Power Growth Fund, Inc. (2010 to 2011), Director, Mairs & Power Balanced Fund, Inc. (2010 to 2011) | |
Bert J. McKasy (1942) | | Trustee since September 2006; Board Chair since December 2014 | | • Attorney, Lindquist & Vennum, P.L.L.P. (1994 to present). | | | 3 | | | Director, Mairs & Power Growth Fund, Inc. (2006 to 2011), Director, Mairs & Power Balanced Fund, Inc. (2006 to 2011) | |
James D. Alt (1951) | | Trustee since April 2015 | | • Adjunct Professor, University of Minnesota Law School (2007 to present); Retired Partner, Dorsey & Whitney LLP3 (1984 to 2012). | | | 3 | | | None | |
Patrick A. Thiele (1950) | | Trustee since April 2015 | | • Retired Chief Executive Officer, PartnerRe Ltd. (2000 to 2010). | | | 3 | | | OneBeacon Insurance Group, Ltd. (2014 to present) | |
1 Unless otherwise indicated, the mailing address of each officer and trustee is: W1520 First National Bank Building, 332 Minnesota Street, Saint Paul, MN 55101-1363.
2 Mr. Conzemius, Dr. Schmid Daugherty and Mr. McKasy served as directors of Mairs & Power Growth Fund, Inc. and Mairs & Power Balanced Fund, Inc. (together, the "Predecessor Funds") prior to the reorganization of the Predecessor Funds into newly formed series of the Trust effective December 31, 2011. Positions listed in this column for trustees and officers prior to 2012 refer to their positions with the Predecessor Funds. Each trustee serves until his or her resignation or mandatory retirement age. Each officer is elected annually and serves until his successor has been duly elected and qualified.
3 Dorsey & Whitney LLP previously served as legal counsel to the Trust through December 2012.
51
This page is intentionally left blank.
This page is intentionally left blank.
This page is intentionally left blank.
MAIRS & POWER FUNDS TRUST
Mairs & Power Growth Fund, established 1958
Mairs & Power Balanced Fund, established 1961
Mairs & Power Small Cap Fund, established 2011
A No-Load Funds Trust
For Shareholder Services
Call (800) 304-7404
Or write to:
(via Regular Mail)
c/o U.S. Bancorp Fund Services, LLC
615 East Michigan Street
P. O. Box 701
Milwaukee, WI 53201-0701 | | (via Overnight or Express Mail)
c/o U.S. Bancorp Fund Services, LLC
3rd Floor
615 East Michigan Street
Milwaukee, WI 53202-0701 | |
For Fund literature and information, visit the Trust's website at:
www.mairsandpower.com
Investment Manager
Mairs & Power, Inc.
W1520 First National Bank Building
332 Minnesota Street
Saint Paul, MN 55101
Custodian
U.S. Bank, N.A.
Custody Operations
1555 North River Center Drive, Suite 302
Milwaukee, WI 53212
Distributor
ALPS Distributors, Inc.
1290 Broadway, Suite 1100
Denver, CO 80203
Mairs & Power, Inc.
c/o U.S. Bancorp Fund Services, LLC
3rd Floor
615 East Michigan Street
Milwaukee, WI 53202-0701
Item 2. Code of Ethics.
The registrant adopted its Code of Ethics for Principal Executive Officer and Principal Financial Officer on May 17, 2012. The Code of Ethics is attached as exhibit 12(a)(1) to this form.
Item 3. Audit Committee Financial Expert.
The registrant’s Board of Trustees has determined that Dr. Mary Schmid Daugherty, a member of the registrant’s Audit Committee, is an “audit committee financial expert” as defined in Item 3 of Form N-CSR. Dr. Daugherty is “independent” under the standards set forth in Item 3 of Form N-CSR.
Item 4. Principal Accountant Fees and Services.
Year Ended
December 31, | | (a)
Audit Fees | | (b)
Audit-
Related Fees | | (c)
Tax Fees | | (d)
All Other
Fees | |
| | | | | | | | | |
2014 | | $ | 98,400 | | None | | $ | 20,700 | | None | |
2015 | | $ | 103,400 | | None | | $ | 18,300 | | None | |
(a) | | Audit fees include amounts related to the audit of registrant’s annual financial statements and services normally provided by the accountant in connection with statutory and regulatory filings. |
| | |
(c) | | Tax fees include amounts related to tax advice and tax return preparation, compliance and reviews. |
| | |
(d) | | Tax consulting fee includes fees and expenses related to allowable tax consulting services. |
| | |
(e)(1) | | The registrant’s Audit Committee approves the engagement of the accountant before the accountant is engaged by the registrant and approved all audit and non-audit services provided to the registrant. |
| | |
(e)(2) | | None of such services described in columns (b) through (d) were subject to a waiver of the pre-approval requirement pursuant to paragraph (c)(7)(i)(c) of Rule 2-01 of Regulation S-X. |
| | |
(f) | | Not applicable |
| | |
(g) | | The aggregate fees for non-audit services rendered by the registrant’s accountant to the registrant were $20,700 for the fiscal year ended December 31, 2014 and $18,300 for the fiscal year ended December 31, 2015. The aggregate fees for non-audit services rendered by the registrant’s accountant to the registrant’s investment adviser were $24,600 for the fiscal year ended December 31, 2014 and $24,900 for the fiscal year ended December 31, 2015. |
| | |
(h) | | The registrant’s Audit Committee has considered whether the provision of non-audit services by the registrant’s accountant to the registrant’s investment adviser is compatible with maintaining the accountant’s independence. |
Item 5. Audit Committee of Listed Registrants.
Not applicable to registrants who are not listed issuers (as defined in Rule 10A-3 under the Securities Exchange Act of 1934).
Item 6. Investments.
(a) Schedule of Investments is included as part of the report to shareholders filed under Item 1 of this Form
(b) Not Applicable.
Item 7. Disclosure of Proxy Voting Policies and Procedures for Closed-End Management Investment Companies.
Not applicable to open-end investment companies.
Item 8. Portfolio Managers of Closed-End Management Investment Companies.
Not applicable to open-end investment companies.
Item 9. Purchases of Equity Securities by Closed-End Management Investment Company and Affiliated Purchasers.
Not applicable to open-end investment companies.
Item 10. Submission of Matters to a Vote of Security Holders.
There has been no material change to the procedures by which shareholders may recommend nominees to the registrant’s board of directors.
Item 11. Controls and Procedures.
(a) The registrant’s principal executive officer and principal financial officer have evaluated the registrant’s disclosure controls and procedures as of a date within 90 days of the filing of this report and have concluded that the registrant’s disclosure controls and procedures were effective, as of that date, in ensuring that information required to be disclosed by the registrant in this Form N-CSR was recorded, processed, summarized and reported within the time period specified by the SEC’s rules and forms.
(b) There were no changes in the Registrant’s internal control over financial reporting (as defined in Rule 30a-3(d) under the Act) that occurred during the second fiscal quarter of the period covered by this report that has materially affected, or is reasonably likely to materially affect, the Registrant’s internal control over financial reporting.
Item 12. Exhibits.
(a) (1) Code of Ethics
Mairs & Power Funds Trust Code of Ethics for Principal Executive Officer and Principal Financial Officer.
Incorporated by reference to previous Form N-CSR filing, filed February 28, 2014.
(2) Certifications required by Rule 30a-2(a) under the Investment Company Act of 1940.
Attached as exhibits 12(a)(2).1 and 12(a)(2).2 to this form.
(3) Any written solicitation to purchase securities under Rule 23c-1 under the Act sent or given during the period covered by the report by or on behalf of the registrant to 10 or more persons. Not applicable to open-end investment companies.
(b) Certifications pursuant to Section 906 of the Sarbanes-Oxley Act of 2002.
Attached as exhibit 12(b) to this form.
SIGNATURES
Pursuant to the requirements of the Securities Exchange Act of 1934 and the Investment Company Act of 1940, the registrant has duly caused this report to be signed on its behalf by the undersigned, thereunto duly authorized.
| (Registrant) | Mairs & Power Funds Trust | |
| | | |
| By (Signature and Title)* | | /s/ Mark L. Henneman | |
| | Mark L. Henneman, President | |
| | Principal Executive Officer | |
| | |
| Date | 3/3/16 | | |
| | | | | | | |
Pursuant to the requirements of the Securities Exchange Act of 1934 and the Investment Company Act of 1940, this report has been signed below by the following persons on behalf of the registrant and in the capacities and on the dates indicated.
| By (Signature and Title)* | | /s/ Mark L. Henneman | |
| | Mark L. Henneman, President | |
| | Principal Executive Officer | |
| | |
| Date | 3/3/16 | | |
| | |
| | |
| By (Signature and Title)* | | /s/ Andrea C. Stimmel | |
| | Andrea C. Stimmel, Treasurer | |
| | Principal Financial Officer | |
| | |
| Date | 3/3/16 | | |
| | | | | | |
* Print the name and title of each signing officer under his or her signature.