UNITED STATES
SECURITIES AND EXCHANGE COMMISSION
Washington, D.C. 20549
FORM N-CSR
CERTIFIED SHAREHOLDER REPORT OF REGISTERED
MANAGEMENT INVESTMENT COMPANIES
Investment Company Act file number | 811-22563 |
|
Mairs & Power Funds Trust |
(Exact name of registrant as specified in charter) |
|
332 Minnesota Street, Suite W1520, St. Paul, MN | | 55101 |
(Address of principal executive offices) | | (Zip code) |
|
Andrea C. Stimmel, Treasurer, 332 Minnesota Street, Suite W1520, St. Paul, MN 55101 |
(Name and address of agent for service) |
|
Registrant’s telephone number, including area code: | 651-222-8478 | |
|
Date of fiscal year end: | December 31, 2016 | |
|
Date of reporting period: | December 31, 2016 | |
| | | | | | | | |
Item 1. Reports to Stockholders.

Investing for the long-term
ANNUAL REPORT
DECEMBER 31, 2016
- GROWTH FUND (MPGFX)
est. 1958
- BALANCED FUND (MAPOX)
est. 1961
- SMALL CAP FUND (MSCFX)
est. 2011
Mairs & Power W1520 First National Bank Building, 332 Minnesota Street, St. Paul, Minnesota 55101 www.mairsandpower.com
MAIRS & POWER FUNDS MARKET COMMENTARY (unaudited)
December 31, 2016
The end of the year provides finality, if only in turning the calendar to a new year. For investors, the end of 2016 saw uncertainty replaced by absolute certainty in two important areas – the election and interest rates. With the election of Donald Trump and a Republican Congress, the market expects quick legislative action on a fiscal stimulus package, tax cuts and reduced regulations, all of which could provide a boost to economic growth and corporate profits. As a result, the stock market reacted positively and finished the year strong. In addition, after months of guessing by investors on the timing and magnitude of interest rate moves, at its year-end meeting the Federal Reserve (Fed) confirmed its confidence in the state of the economy and raised the federal funds rate by 0.25% and indicated its intention to bump rates higher in 2017, potentially more than once. Unlike stocks, bond prices reacted negatively post-election in anticipation that a stronger economy would put additional upward pressure on interest rates.
Between Election Day and year end, the S&P 500 hit eight all time highs, reaching 2,271.72 on December 13 and closed the year at 2,238.83, a total return of 11.96% for the year. For the fourth quarter, the S&P 500 Total Return (TR) was 3.82%. The Dow Jones Industrial Average TR was 8.66% for the quarter and 16.50% for the year. Our other key benchmark, the Bloomberg Barclays U.S. Government/Credit Bond Index return was a negative 3.39% for the fourth quarter and a positive 3.05% for the full year.
Leading all sectors, financials gained more than 20% in the fourth quarter as the potential beneficiaries of corporate tax cuts and a rollback of onerous federal government regulations. In addition, rising interest rates should help profits with wider lending margins.
Outlook
We enter 2017 with contradictory signals in the equity markets. As the post-election "Trump Bump" pushed stock valuations up, price-to-earnings multiples climbed above their long-term averages in a rising interest rate environment – an unusual combination. On the positive side, several economic indicators improved in the fourth quarter not only in the U.S. but, surprisingly, in Europe and Japan as well. The U.S. unemployment rate dropped to 4.6%, consumer confidence continued to rise and the Purchasing Managers' Index, which measures the outlook for manufacturing, reached a two year high. It appears that as growth is starting to accelerate globally, the expected stimulus package from the new administration may boost the economy further.
While stronger economic growth and accelerating earnings growth create a tail wind for the market, rising interest rates typically create a head wind. Investors may be disappointed if the new administration struggles to implement its economic policies as it faces the reality of trying to get things done in Washington. The market could be quite unforgiving if growth in the economy and corporate earnings aren't as strong as expected.
These competing positive and cautionary scenarios play out against a backdrop of a re-assertive Federal Reserve. If the economy heats up, the Fed may become even more aggressive in boosting interest rates. While it's important to stay abreast of macro factors, our primary focus remains on what companies are in our investment portfolios and where we see opportunities. As we start the New Year with significant changes on the horizon, we remain confident in our long-term investment approach, which involves continuing to seek out opportunities overlooked by the market and focus on good companies with durable competitive advantages.
S&P 500 TR (Total Return) Index is an unmanaged index of 500 common stocks that is generally considered representative of the U.S. stock market. It tracks both the capital gains of a group of stocks over time and assumes that any cash distributions, such as dividends, are reinvested back into the index. It is not possible to invest directly in an index.
Dow Jones Industrial Average TR Index is a price-weighted average of 30 significant stocks traded on the New York Stock Exchange and the NASDAQ. It is not possible to invest directly in an index.
1
MAIRS & POWER FUNDS MARKET COMMENTARY (unaudited) (continued)
Bloomberg Barclays U.S. Government/Credit Bond Index is a broad-based flagship benchmark that measures the non-securitized component of the U.S. Aggregate Index. It includes investment-grade, U.S. dollar-denominated, fixed-rate Treasuries, government-related and corporate securities. It is not possible to invest directly in an index.
Price to earnings is a ratio of a company's share price to its per-share earnings.
Purchasing Managers' Index (PMI) is an indicator of the economic health of the manufacturing sector. The PMI is based on five major indicators: new orders, inventory levels, production, supplier deliveries and the employment environment.
2
MAIRS & POWER GROWTH FUND (unaudited)
To Our Shareholders: December 31, 2016
The Growth Fund finished the year well ahead of its benchmark index and peer group, gaining 15.38% compared to 11.96% for the S&P 500 Total Return (TR) benchmark and 12.27% for the Lipper Multi Cap Core Funds Index of peers, respectively. For the fourth quarter the Fund gained 2.54%, compared with 3.82% for the S&P 500 Total Return (TR) and 3.81% for the Lipper Index.
Stock selection drove portfolio performance in 2016, with acquisitions, exposure to industrials and our multi-cap approach being the most important factors. The announced purchases of Valspar (VAL) by Sherwin Williams (SHW), St. Jude (STJ) by Abbott Labs (ABT) and G&K Services (GK) by Cintas (CTAS) helped performance early in the year and we are working hard to find replacements for these three very fine companies. Our exposure to industrial stocks, which had lagged significantly in 2014 and 2015, paid off early in the year as the market realized that the sector had become too cheap. Portfolios also benefited from our multi-cap strategy where several small and mid-cap stocks, such as Donaldson (DCI), Toro (TTC), and Badger Meter (BMI), were strong performers.
MAIRS & POWER GROWTH FUND (MPGFX)
Top Performers
| Fourth Quarter (9/30/16 – 12/31/16) | | Year To Date (12/31/15 – 12/31/16) | |
WELLS FARGO & CO. | | | 20.64 | % | | TORO CO. | | | 41.16 | % | |
U.S. BANCORP | | | 15.95 | % | | DONALDSON CO., INC. | | | 34.86 | % | |
TORO CO. | | | 15.63 | % | | H.B. FULLER CO. | | | 20.51 | % | |
DONALDSON CO., INC. | | | 8.90 | % | | ST. JUDE MEDICAL, INC. | | | 17.86 | % | |
GRACO, INC. | | | 8.46 | % | | VALSPAR CORP. | | | 12.95 | % | |
Weak Performers
| Fourth Quarter (9/30/16 – 12/31/16) | | Year To Date (12/31/15 – 12/31/16) | |
ZIMMER BIOMET HOLDINGS | | | -24.45 | % | | CRAY INC. | | | -48.17 | % | |
MEDTRONIC PLC | | | -21.38 | % | | ROCHE HOLDINGS LTD | | | -29.19 | % | |
PENTAIR LTD. | | | -16.54 | % | | HORMEL FOODS CORP. | | | -23.92 | % | |
BEMIS CO., INC. | | | -10.07 | % | | MEDTRONIC PLC | | | -19.36 | % | |
ECOLAB, INC. | | | -7.52 | % | | ECOLAB, INC. | | | -9.48 | % | |
Past performance is no guarantee of future results.
The market rally in the second half of the year, and particularly at year-end following the election, was driven by strong performance in the financial sector based on a rising interest rate environment and expectations that the new administration and Congress will enact more favorable tax and regulatory policies. Financial holdings in the portfolio benefited but the Fund did not fully participate as more defensive health care and consumer stocks in particular were weak. We still like the companies we hold in these overlooked sectors and view the recent weakness as an opportunity to selectively add new names and increase existing positions.
Speaking of the financial sector, U.S. Bank (USB) was a top contributor to performance in both the fourth quarter and the full year (the Fund's 6th top performer year-to-date) and is our largest holding. While valuations among financial stocks, including USB, are at the high end of their trading range, we remain comfortable with our position. The bank is well run and consistently posts lower (better) efficiency ratios and its return on assets and return on equity are leading among its peers. While a large multi-state bank and one of the largest in the U.S., it escapes the most intensive regulatory microscope the very largest banks of over $750 billion in assets operate under. In addition, we believe U.S. Bank is very well positioned under several different economic scenarios. If the expectations for lower corporate taxes, a lighter regulatory touch and a rising and steepening yield curve bear out as the market expects, the bank will benefit. But given its operating strengths and solid management, even if the most optimistic scenario does not pan out we believe the bank will perform well.
3
MAIRS & POWER GROWTH FUND (unaudited) (continued)
Our long-term investment approach allows us to get to know management teams and observe closely how they build on opportunities and face challenges under a variety of conditions. Toro (TTC) is one example. The stock was a top performer in both the quarter and the year. While Toro is currently "priced for perfection," we still like the stock but are using the current rich valuation as an opportunity to lighten up and deploy the profits where we find other opportunities. C.E.O. Mike Hoffman, who retired in 2016, and his executive team have executed extraordinarily well over the years. Another exemplary C.E.O. who also retired this year is Jeff Ettinger at Hormel (HRL), another long-term portfolio holding. Both executives stepped into their respective C.E.O. roles about the same time and deserve credit for building excellent companies, strong management teams and enviable records. Their shareholders have been amply rewarded by their stewardship. Toro under Mike Hoffman's tenure has averaged 14.94% annual return and Hormel under Jeff Ettinger has averaged 17.47%, compared with the S&P 500 which averaged 7.43% over the same period. We wish them both well.
Given the relatively small number of technology companies in our region, it is one sector for which we look at a broader geographic area to find exposure in the sector. One new name we added in the technology sector in 2016 is Alphabet (GOOG), the holding company parent of Google, the leader in on-line search. While the company is headquartered outside of the Upper Midwest where many of our investments are located, it is an example of a stock that fits our investment approach in most other ways. The company enjoys above-average growth, maintains a durable competitive advantage globally and is attractively valued.
We also exited some positions in 2016. When MTS Systems (MTSC) announced the acquisition of sensor maker PCB Group for $580 million, we decided it was time to exit the stock. In addition to our concerns about execution of the current business, we did not believe the strategy behind the acquisition was sound. It added to the company's existing sensor business, where the company does not enjoy a strong competitive advantage, it diluted MTS' durable competitive advantage in its core test business, and added substantial leverage to the balance sheet.
Mark L. Henneman
Lead Manager | | Andrew R. Adams
Co-Manager | |
The Fund's investment objective, risks, charges and expenses must be considered carefully before investing. The summary prospectus or full prospectus contains this and other important information about the Fund and they may be obtained by calling Shareholder Services at (800) 304-7404 or by visiting www.mairsandpower.com. Read the summary prospectus or full prospectus carefully before investing.
All holdings in the portfolio are subject to change without notice and may or may not represent current or future portfolio composition. The mention of specific securities is not intended as a recommendation or an offer of a particular security, nor is it intended to be a solicitation for the purchase or sale of any security.
All investments have risks. The Growth Fund is designed for long-term investors. Equity investments are subject to market fluctuations and the Fund's share price can fall because of weakness in the broad market, a particular industry or specific holdings. Investments in small and midcap companies generally are more volatile. International investing risks include among others political, social or economic instability, difficulty in predicting international trade patterns, taxation and foreign trading practices and greater fluctuations in price than U.S. corporations.
Diversification does not guarantee profit or protect against loss.
S&P 500 Total Return (TR) Index is an unmanaged index of 500 common stocks that is generally considered representative of the U.S. stock market. It tracks both the capital gains of a group of stocks over time and assumes that any cash distributions, such as dividends, are reinvested back into the index. It is not possible to invest directly in an index.
Lipper Multi-Cap Core Funds Index measures the performance of the 30 largest mutual funds that invest in a variety of capitalization ranges, without concentrating 75% or more of their equity assets in any one market capitalization range over an extended period of time, as determined by Lipper, Inc. It is not possible to invest directly in an index.
4
Mairs & Power Growth Fund
PERFORMANCE INFORMATION (unaudited) December 31, 2016
Ten years of investment performance (through December 31, 2016)
This chart illustrates the performance of a hypothetical $10,000 investment made in the Fund 10 years ago.
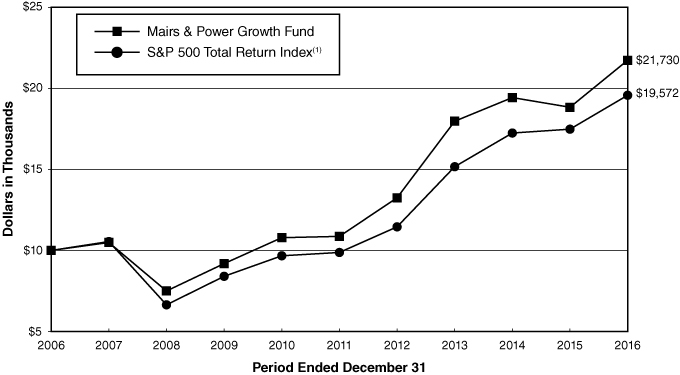
Average annual total returns for periods ended December 31, 2016
| | | 1 year | | 5 years | | 10 years | | 20 years | |
Mairs & Power Growth Fund | | | 15.38 | % | | | 14.86 | % | | | 8.07 | % | | | 10.18 | % | |
S&P 500 Total Return Index(1) | | | 11.96 | % | | | 14.66 | % | | | 6.95 | % | | | 7.68 | % | |
Performance data quoted represents past performance and does not guarantee future results. All performance information shown includes the reinvestment of dividend and capital gain distributions, but does not reflect the deduction of taxes that a shareholder would pay on Fund distributions or the redemption of Fund shares. The investment return and principal value of an investment will fluctuate so that an investor's shares, when redeemed, may be worth more or less than their original cost. Current performance of the Fund may be lower or higher than the performance quoted. For the most recent month-end performance figures, visit the Fund's website at www.mairsandpower.com or call Shareholder Services at (800) 304-7404.
(1) The S&P 500 Total Return Index is an unmanaged index of 500 common stocks that is generally considered representative of the U.S. stock market. It tracks both the capital gains of a group of stocks over time and assumes that any cash distributions, such as dividends, are reinvested back into the index. It is not possible to invest directly in an index.
5
Mairs & Power Growth Fund
FUND INFORMATION (unaudited) December 31, 2016
Portfolio Managers
Mark L. Henneman, lead manager since July 1, 2013, co-manager from January 1, 2006 through June 30, 2013, University of Minnesota, MBA Finance 1990
Andrew R. Adams, co-manager since January 1, 2015, University of Wisconsin-Madison, MS Finance 1997
General Information
Fund Symbol | | | MPGFX | | |
Net Asset Value (NAV) Per Share | | $ | 113.83 | | |
Expense Ratio | | | 0.66 | % | |
Portfolio Turnover Rate | | | 10.99 | % | |
Sales Charge | | | None1 | | |
Fund Inception Year | | | 1958 | | |
Portfolio Composition
Top Ten Portfolio Holdings
(Percent of Total Net Assets)2
US Bancorp/MN | | | 4.9 | % | |
Ecolab Inc | | | 4.3 | | |
St Jude Medical Inc | | | 4.0 | | |
| 3M Co | | | 3.9 | | |
Graco Inc | | | 3.8 | | |
Honeywell International Inc | | | 3.6 | | |
Donaldson Co Inc | | | 3.3 | | |
Johnson & Johnson | | | 3.3 | | |
Bemis Co Inc | | | 3.2 | | |
Medtronic PLC | | | 3.0 | | |
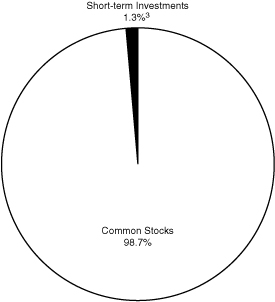
Portfolio Diversification
(Percent of Total Net Assets)
Common Stocks 98.7% | |
Industrials | | | 29.0 | % | |
Health Care | | | 21.8 | | |
Financials | | | 12.7 | | |
Materials | | | 12.3 | | |
Information Technology | | | 9.6 | | |
Consumer Discretionary | | | 5.3 | | |
Consumer Staples | | | 5.2 | | |
Energy | | | 2.8 | | |
Short-term Investments 1.3%3 | | | 1.3 | | |
| | | | 100.0 | % | |
1 Although the Fund is no-load, investment management fees and other expenses still apply.
2 All holdings in the portfolio are subject to change without notice and may or may not represent current or future portfolio composition. The mention of specific securities is not intended as a recommendation or offer for a particular security, nor is it intended to be a solicitation for the purchase or sale of any security.
3 Represents short-term investments and other assets and liabilities (net).
The Global Industry Classification Standard (GICS®) was developed by and/or is the exclusive property of MSCI, Inc. and Standard & Poor's Financial Services LLC ("S&P"). GICS is a service mark of MSCI, Inc. and S&P and has been licensed for use by Mairs & Power, Inc. (the "Adviser").
6
Mairs & Power Growth Fund
SCHEDULE OF INVESTMENTS December 31, 2016
Shares | | Security Description | | Fair Value | |
| | | COMMON STOCKS 98.7% | |
| | | CONSUMER DISCRETIONARY 5.3% | |
| | 270,000 | | | Gentherm Inc (b) | | $ | 9,139,500 | | |
| | 1,420,000 | | | Target Corp | | | 102,566,600 | | |
| | 1,160,000 | | | Walt Disney Co/The | | | 120,895,200 | | |
| | | | 232,601,300 | | |
| | | CONSUMER STAPLES 5.2% | |
| | 2,020,000 | | | General Mills Inc | | | 124,775,400 | | |
| | 3,055,000 | | | Hormel Foods Corp | | | 106,344,550 | | |
| | | | 231,119,950 | | |
| | | ENERGY 2.8% | |
| | 1,450,000 | | | Schlumberger Ltd (a) | | | 121,727,500 | | |
| | | FINANCIALS 12.7% | |
| | 680,000 | | | American Express Co | | | 50,374,400 | | |
| | 1,760,000 | | | Associated Banc-Corp | | | 43,472,000 | | |
| | 790,000 | | | Great Western Bancorp Inc | | | 34,436,100 | | |
| | 1,630,000 | | | Principal Financial Group Inc | | | 94,311,800 | | |
| | 270,000 | | | Travelers Cos Inc/The | | | 33,053,400 | | |
| | 4,155,000 | | | US Bancorp/MN | | | 213,442,350 | | |
| | 1,580,000 | | | Wells Fargo & Co | | | 87,073,800 | | |
| | | | 556,163,850 | | |
| | | HEALTH CARE 21.8% | |
| | 580,000 | | | Abbott Laboratories | | | 22,277,800 | | |
| | 990,000 | | | Baxter International Inc | | | 43,896,600 | | |
| | 890,000 | | | Bio-Techne Corp | | | 91,518,700 | | |
| | 1,260,000 | | | Johnson & Johnson | | | 145,164,600 | | |
| | 1,865,000 | | | Medtronic PLC (e) | | | 132,843,950 | | |
| | 1,305,000 | | | Patterson Cos Inc | | | 53,544,150 | | |
| | 2,760,000 | | | Pfizer Inc | | | 89,644,800 | | |
| | 3,360,000 | | | Roche Holding AG (d) | | | 95,860,800 | | |
| | 2,180,000 | | | St Jude Medical Inc | | | 174,814,200 | | |
| | 245,000 | | | UnitedHealth Group Inc | | | 39,209,800 | | |
| | 685,000 | | | Zimmer Holdings Inc | | | 70,692,000 | | |
| | | | 959,467,400 | | |
| | | INDUSTRIALS 29.0% | |
| | 950,000 | | | 3M Co | | | 169,641,500 | | |
| | 1,335,000 | | | CH Robinson Worldwide Inc | | | 97,802,100 | | |
| | 3,450,000 | | | Donaldson Co Inc | | | 145,176,000 | | |
| | 750,000 | | | Emerson Electric Co | | | 41,812,500 | | |
7
Mairs & Power Growth Fund
SCHEDULE OF INVESTMENTS (continued) December 31, 2016
Shares | | Security Description | | Fair Value | |
| | | COMMON STOCKS (continued) | |
| | | INDUSTRIALS (continued) | |
| | 1,440,000 | | | Fastenal Co | | $ | 67,651,200 | | |
| | 160,000 | | | G&K Services Inc, Class A | | | 15,432,000 | | |
| | 540,000 | | | Generac Holdings Inc (b) | | | 21,999,600 | | |
| | 2,170,000 | | | General Electric Co | | | 68,572,000 | | |
| | 2,010,000 | | | Graco Inc | | | 167,010,900 | | |
| | 1,370,000 | | | Honeywell International Inc | | | 158,714,500 | | |
| | 1,660,000 | | | Pentair PLC (a) | | | 93,076,200 | | |
| | 250,000 | | | Proto Labs Inc (b) | | | 12,837,500 | | |
| | 145,000 | | | Snap-on Inc | | | 24,834,150 | | |
| | 2,190,000 | | | Toro Co/The | | | 122,530,500 | | |
| | 590,000 | | | United Parcel Service Inc, Class B | | | 67,637,600 | | |
| | | | 1,274,728,250 | | |
| | | INFORMATION TECHNOLOGY 9.6% | |
| | 57,000 | | | Alphabet Inc (b) | | | 43,993,740 | | |
| | 1,250,000 | | | Badger Meter Inc | | | 46,187,500 | | |
| | 1,350,000 | | | Corning Inc | | | 32,764,500 | | |
| | 2,070,000 | | | Cray Inc (b) (f) | | | 42,849,000 | | |
| | 780,000 | | | Fiserv Inc (b) | | | 82,898,400 | | |
| | 348,891 | | | NVE Corp (f) | | | 24,921,284 | | |
| | 1,020,000 | | | QUALCOMM Inc | | | 66,504,000 | | |
| | 930,000 | | | Stratasys Ltd (a) (b) | | | 15,382,200 | | |
| | 3,050,000 | | | Western Union Co/The | | | 66,246,000 | | |
| | | | 421,746,624 | | |
| | | MATERIALS 12.3% | |
| | 2,920,000 | | | Bemis Co Inc | | | 139,634,400 | | |
| | 1,609,999 | | | Ecolab Inc | | | 188,724,082 | | |
| | 2,481,600 | | | HB Fuller Co | | | 119,886,096 | | |
| | 890,000 | | | Valspar Corp/The | | | 92,212,900 | | |
| | | | 540,457,478 | | |
| | | | | TOTAL COMMON STOCKS
(cost $2,422,146,824) | | $ | 4,338,012,352
| | |
| | | SHORT-TERM INVESTMENTS 1.0% | |
| 42,271,848
| | | First American Government Obligations Fund, Class Z, 0.42% (c)
(cost $42,271,848) | | $ | 42,271,848
| | |
8
Mairs & Power Growth Fund
SCHEDULE OF INVESTMENTS (continued) December 31, 2016
Shares | | Security Description | | Fair Value | |
| | | TOTAL INVESTMENTS 99.7%
(cost $2,464,418,672) | | $ | 4,380,284,200
| | |
| | | OTHER ASSETS AND LIABILITIES (NET) 0.3% | | | 12,188,390 | | |
| | | TOTAL NET ASSETS 100.0% | | $ | 4,392,472,590 | | |
(a) Foreign security denominated in U.S. dollars. As of December 31, 2016, these securities represented $230,185,900 or 5.2% of total net assets.
(b) Non-income producing.
(c) The rate quoted is the annualized seven-day effective yield as of December 31, 2016.
(d) American Depositary Receipt.
(e) Issuer headquartered overseas but considered domestic. In determining whether a security is foreign or domestic, the Adviser will generally look at the location of the headquarters of the issuer. However, if the issuer is believed by the Adviser to be headquartered in a jurisdiction primarily for tax purposes, the Adviser will consider the following additional factors: 1) the location of the primary exchange trading its securities; 2) where it derives the majority of its revenues, and/or 3) where it earns the majority of its profits.
(f) Affiliated company at December 31, 2016.
The Global Industry Classification Standard (GICS®) was developed by and/or is the exclusive property of MSCI, Inc. and Standard & Poor's Financial Services LLC ("S&P"). GICS is a service mark of MSCI, Inc. and S&P and has been licensed for use by the Adviser.
See accompanying Notes to Financial Statements.
9
MAIRS & POWER BALANCED FUND (unaudited)
To Our Shareholders: December 31, 2016
The Balanced Fund finished the year ahead of its benchmark composite index (60% S&P 500 Total Return Index and 40% Bloomberg Barclays U.S. Government/Credit Bond Index) gaining 11.42% compared to 8.48% for the benchmark. For the fourth quarter, the Fund gained 1.32% compared to 0.93% for the benchmark. Stock selection remains the major driver of the Fund's relative performance year-to-date.
The market rally in the second half of the year, and particularly at year-end following the election, was driven by strong performance in the financial sector based on a rising interest rate environment and expectations that the new administration and Congress will enact more favorable tax and regulatory policies. U.S. Bank (USB) was a top contributor to performance in both the fourth quarter and the full year and is our largest holding. While valuations among financial stocks, including USB, are at the high end of their trading range, we remain comfortable with our position. The bank is well run and consistently posts lower (better) efficiency ratios and its return on assets and return on equity are among the highest among its peers. While a large multi-state bank and one of the largest in the US, it escapes the most intensive regulatory microscope the very largest banks of over $750 billion in assets operate under. In addition, we believe U.S. Bank is very well positioned under several different economic scenarios. If the expectations for lower corporate taxes, a lighter regulatory touch and a rising and steepening yield curve bear out as the market expects, the bank will benefit. But given its operating strengths and solid management, even if the most optimistic scenario does not pan out, we believe the bank will perform well.
MAIRS & POWER BALANCED FUND (MAPOX)
Top Performers
| Fourth Quarter (9/30/16 – 12/31/16) | | Year To Date (12/31/15 – 12/31/16) | |
JPMORGAN CHASE & CO. | | | 25.76 | % | | CORNING INC. | | | 20.81 | % | |
ASSOCIATED BANC-CORP. | | | 22.26 | % | | JPMORGAN CHASE & CO. | | | 18.72 | % | |
WELLS FARGO & CO. | | | 20.64 | % | | PRINCIPAL FINANCIAL GROUP | | | 16.67 | % | |
U.S. BANCORP | | | 15.95 | % | | VALSPAR CORP. | | | 12.95 | % | |
CHEVRON CORP | | | 10.54 | % | | U.S. BANCORP | | | 8.43 | % | |
Weak Performers
| Fourth Quarter (9/30/16 – 12/31/16) | | Year To Date (12/31/15 – 12/31/16) | |
MEDTRONIC PLC | | | -21.38 | % | | BRISTOL-MYERS SQUIBB CO. | | | -27.01 | % | |
PENTAIR LTD. | | | -16.54 | % | | ABBOTT LABORATORIES | | | -26.43 | % | |
ABBOTT LABORATORIES | | | -12.99 | % | | HORMEL FOODS CORP. | | | -23.92 | % | |
HORMEL FOODS CORP. | | | -12.05 | % | | MEDTRONIC PLC | | | -19.36 | % | |
ECOLAB, INC. | | | -7.52 | % | | PFIZER INC. | | | -11.34 | % | |
Past performance is no guarantee of future results.
Our long-term investment approach allows us to get to know management teams and observe closely how they build on opportunities and face challenges under a variety of conditions. Toro (TTC) is one example. The stock was a strong performer in both the quarter and the year. C.E.O. Mike Hoffman, who retired in 2016, and his executive team have executed extraordinarily well over the years. Another exemplary C.E.O who also retired this year is Jeff Ettinger at Hormel (HRL), another long-term portfolio holding. Both executives stepped into their respective C.E.O. roles about the same time and deserve credit for building excellent companies, strong management teams and enviable records. Their shareholders have been amply rewarded by their stewardship. Toro under Mike Hoffman's tenure has averaged 14.94% annual return and Hormel under Jeff Ettinger has averaged 17.47%, compared with the S&P 500 which averaged 7.43% over the same period. We wish them both well.
Given the relatively small number of technology companies in our region, it is one sector for which we look at a broader geographic area to find exposure in the sector. One new name we added in the technology sector in
10
MAIRS & POWER BALANCED FUND (unaudited) (continued)
2016 is Alphabet (GOOG), the holding company parent of Google, the leader in on-line search. While the company is headquartered outside of the Upper Midwest where many of our investments are located, it is an example of a stock that fits our investment approach in most other ways. The company enjoys above-average growth, maintains a durable competitive advantage globally and is attractively valued.
We also exited some positions in 2016. We no longer felt comfortable with the long-term strategy at MTS Systems (MTSC) and MDU Resources (MDU) and sold our positions. In the energy sector, we traded out of ConocoPhillips (COP) into Chevron (CVX), viewing the latter as better managed with a stronger balance sheet.
On the fixed income side of the portfolio, we saw a 25 basis point (0.25%) rate hike from the Fed at year end, as discussed in the Market Recap above. While the rising rates put downward pressure on bond prices, particularly in the fourth quarter, high quality corporate bonds, which make up a substantial portion of the fixed income portfolio, performed reasonably well in this environment. The question on fixed income investors' minds is: "What's next?" While we do expect continued rate hikes from the Fed in 2017, we do not view modest increases from current low levels as a reason to "head for the hills." The more pertinent issue for investors is to watch how the new administration's policies unfold. If President Trump's threats of imposing tariffs spark a trade war, investors will have to become much more sensitive to who owns U.S. Treasury securities and whether those holders are buyers or sellers. With China as the largest holder of Treasuries, this issue will be at the front of fixed income investors' concerns. As we anticipate increased volatility on the fixed income side, we are not going to cash but are taking a defensive posture, remaining on the short end of maturities and looking for securities with a large and defensible payout.
Ronald L. Kaliebe
Lead Manager | | Kevin V. Earley
Co-Manager | |
The Fund's investment objective, risks, charges and expenses must be considered carefully before investing. The summary prospectus or full prospectus contains this and other important information about the Fund and they may be obtained by calling Shareholder Services at (800) 304-7404 or by visiting www.mairsandpower.com. Read the summary prospectus or full prospectus carefully before investing.
All holdings in the portfolio are subject to change without notice and may or may not represent current or future portfolio composition. The mention of specific securities is not intended as a recommendation or an offer of a particular security, nor is it intended to be a solicitation for the purchase or sale of any security.
All investments have risks. The Balanced Fund is designed for long-term investors. Equity investments are subject to market fluctuations and the Fund's share price can fall because of weakness in the broad market, a particular industry or specific holdings. Investments in small and midcap companies generally are more volatile. International investing risks include among others political, social or economic instability, difficulty in predicting international trade patterns, taxation and foreign trading practices, and greater fluctuations in price than U.S. corporations. The Fund is subject to yield and share price variances with changes in interest rates and market conditions. Investors should note that if interest rates rise significantly from current levels, bond total returns will decline and may even turn negative in the short-term. There is also a chance that some of the Fund's holdings may have their credit rating downgraded or may default.
Diversification does not guarantee profit or protect against loss.
Composite Index reflects an unmanaged portfolio of 60% of the S&P 500 TR Index and 40% of the Bloomberg Barclays U.S. Government/Credit Bond Index. It is not possible to invest directly in an index.
Bloomberg Barclays U.S. Government/Credit Bond Index is a broad-based flagship benchmark that measures the non-securitized component of the U.S. Aggregate Index. It includes investment-grade, U.S. dollar-denominated, fixed-rate Treasuries, government-related and corporate securities. It is not possible to invest directly in an index.
S&P 500 Total Return (TR) Index is an unmanaged index of 500 common stocks that is generally considered representative of the U.S. stock market. It tracks both the capital gains of a group of stocks over time and assumes that any cash distributions, such as dividends, are reinvested back into the index. It is not possible to invest directly in an index.
11
Mairs & Power Balanced Fund
PERFORMANCE INFORMATION (unaudited) December 31, 2016
Ten years of investment performance (through December 31, 2016) __________________________
This chart illustrates the performance of a hypothetical $10,000 investment made in the Fund 10 years ago.

Average annual total returns for periods ended December 31, 2016
| | | 1 year | | 5 years | | 10 years | | 20 years | |
Mairs & Power Balanced Fund | | | 11.42 | % | | | 10.38 | % | | | 6.85 | % | | | 8.48 | % | |
Composite Index(1) | | | 8.48 | % | | | 9.72 | % | | | 6.24 | % | | | 7.07 | % | |
S&P 500 Total Return Index(2) | | | 11.96 | % | | | 14.66 | % | | | 6.95 | % | | | 7.68 | % | |
Bloomberg Barclays U.S.
Government/Credit Bond Index(3) | | | 3.05 | % | | | 2.29 | % | | | 4.40 | % | | | 5.32 | % | |
Performance data quoted represents past performance and does not guarantee future results. All performance information shown includes the reinvestment of dividend and capital gain distributions, but does not reflect the deduction of taxes that a shareholder would pay on Fund distributions or the redemption of Fund shares. The investment return and principal value of an investment will fluctuate so that an investor's shares, when redeemed, may be worth more or less than their original cost. Current performance of the Fund may be lower or higher than the performance quoted. For the most recent month-end performance figures, visit the Fund's website at www.mairsandpower.com or call Shareholder Services at (800) 304-7404.
(1) The Composite Index reflects an unmanaged portfolio comprised of 60% of the S&P 500 Total Return Index and 40% of the Bloomberg Barclays U.S. Government/Credit Bond Index. It is not possible to invest directly in an index.
(2) The S&P 500 Total Return Index is an unmanaged index of 500 common stocks that is generally considered representative of the U.S. stock market. It tracks both the capital gains of a group of stocks over time and assumes that any cash distributions, such as dividends, are reinvested back into the index. It is not possible to invest directly in an index.
(3) The Bloomberg Barclays U.S. Government/Credit Bond Index is a broad-based flagship benchmark that measures the non-securitized component of the U.S. Aggregate Index. It includes investment-grade, U.S. dollar-denominated, fixed-rate treasuries, government-related and corporate securities. It is not possible to invest directly in an index.
12
Mairs & Power Balanced Fund
FUND INFORMATION (unaudited) December 31, 2016
Portfolio Managers
Ronald L. Kaliebe, lead manager since July 1, 2013, co-manager from January 1, 2006 through
June 30, 2013, University of Wisconsin-Madison, MBA Finance 1980
Kevin V. Earley, co-manager since January 1, 2015, University of Minnesota, MBA Finance 1990
General Information
Fund Symbol | | MAPOX | |
Net Asset Value (NAV) Per Share | | $ | 87.29 | | |
Expense Ratio | | | 0.72 | % | |
Portfolio Turnover Rate | | | 14.10 | % | |
Sales Charge | | | None1 | | |
Fund Inception Year | | | 1961 | | |
Portfolio Composition
Top Ten Common Stock Holdings
(Percent of Total Net Assets)2
US Bancorp/MN | | | 2.9 | % | |
United Parcel Service Inc, Class B | | | 2.7 | | |
Ecolab Inc | | | 2.5 | | |
Medtronic PLC | | | 2.5 | | |
Honeywell International Inc | | | 2.2 | | |
Johnson & Johnson | | | 2.1 | | |
Exxon Mobil Corp | | | 2.1 | | |
Pfizer Inc | | | 2.0 | | |
Graco Inc | | | 1.9 | | |
| 3M Co | | | 1.9 | | |
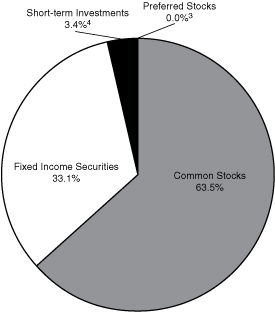
Portfolio Diversification
(Percent of Total Net Assets)
Fixed Income Securities 33.1% | |
Corporate Bonds | | | 29.9 | % | |
Asset Backed Securities | | | 2.6 | | |
Preferred Securities | | | 0.4 | | |
Federal Agency Obligations | | | 0.2 | | |
Common Stocks 63.5% | |
Industrials | | | 14.8 | % | |
Health Care | | | 14.3 | | |
Financials | | | 10.2 | | |
Materials | | | 5.8 | | |
Energy | | | 5.5 | | |
Information Technology | | | 5.5 | | |
Consumer Staples | | | 3.4 | | |
Consumer Discretionary | | | 2.8 | | |
Utilities | | | 1.2 | | |
Preferred Stocks 0.0%3 | | | 0.0 | % | |
Short-term Investments 3.4%4 | | | 3.4 | % | |
| | | | 100.0 | % | |
1 Although the Fund is no-load, investment management fees and other expenses still apply.
2 All holdings in the portfolio are subject to change without notice and may or may not represent current or future portfolio composition. The mention of specific securities is not intended as a recommendation or offer for a particular security, nor is it intended to be a solicitation for the purchase or sale of any security.
3 Percentage is less than 0.05%.
4 Represents short-term investments and other assets and liabilities (net).
The Global Industry Classification Standard (GICS®) was developed by and/or is the exclusive property of MSCI, Inc. and Standard & Poor's Financial Services LLC ("S&P"). GICS is a service mark of MSCI, Inc. and S&P and has been licensed for use by the Adviser.
13
Mairs & Power Balanced Fund
SCHEDULE OF INVESTMENTS December 31, 2016
Par Value | | Security Description | | Fair Value | |
| | | FIXED INCOME SECURITIES 33.1% | |
| | | FEDERAL AGENCY OBLIGATIONS 0.2% | |
$ | 500,000 | | | Federal Farm Credit Banks | | | 3.590 | % | | 12/27/28 | | $ | 500,169 | | |
| | 1,000,000 | | | Federal Home Loan Banks | | | 3.500 | % | | 12/22/31 | | | 995,553 | | |
| | | | 1,495,722 | | |
| | | CORPORATE BONDS 29.9% | |
| | | CONSUMER DISCRETIONARY 3.1% | |
| | 250,000 | | | ServiceMaster Co LLC/The | | | 7.100 | % | | 03/01/18 | | | 260,625 | | |
| | 500,000 | | | Best Buy Co Inc | | | 5.000 | % | | 08/01/18 | | | 522,945 | | |
| | 1,000,000 | | | Ford Motor Credit Co LLC | | | 3.000 | % | | 12/20/18 | | | 1,000,651 | | |
| | 1,000,000 | | | Time Warner Cable Inc | | | 4.125 | % | | 02/15/21 | | | 1,033,842 | | |
| | 1,000,000 | | | Best Buy Co Inc | | | 5.500 | % | | 03/15/21 | | | 1,090,000 | | |
| | 555,000 | | | Kohl's Corp | | | 4.000 | % | | 11/01/21 | | | 582,034 | | |
| | 500,000 | | | Whirlpool Corp | | | 4.700 | % | | 06/01/22 | | | 545,771 | | |
| | 750,000 | | | Newell Rubbermaid Inc | | | 4.000 | % | | 06/15/22 | | | 777,263 | | |
| | 1,000,000 | | | Block Financial LLC | | | 5.500 | % | | 11/01/22 | | | 1,053,488 | | |
| | 1,000,000 | | | Staples Inc | | | 4.375 | % | | 01/12/23 | | | 1,001,888 | | |
| | 2,000,000 | | | Kohl's Corp | | | 3.250 | % | | 02/01/23 | | | 1,977,130 | | |
| | 1,000,000 | | | Wyndham Worldwide Corp | | | 3.900 | % | | 03/01/23 | | | 998,216 | | |
| | 1,975,000 | | | LKQ Corp | | | 4.750 | % | | 05/15/23 | | | 1,965,125 | | |
| | 500,000 | | | Hyatt Hotels Corp | | | 3.375 | % | | 07/15/23 | | | 493,108 | | |
| | 1,000,000 | | | Viacom Inc | | | 4.250 | % | | 09/01/23 | | | 1,000,795 | | |
| | 2,000,000 | | | Viacom Inc | | | 3.875 | % | | 04/01/24 | | | 1,941,044 | | |
| | 1,000,000 | | | Tiffany & Co | | | 3.800 | % | | 10/01/24 | | | 991,101 | | |
| | 2,000,000 | | | Coach Inc | | | 4.250 | % | | 04/01/25 | | | 2,011,108 | | |
| | 1,000,000 | | | Ford Motor Credit Co LLC | | | 4.134 | % | | 08/04/25 | | | 1,001,202 | | |
| | 2,000,000 | | | Priceline Group Inc/The | | | 3.600 | % | | 06/01/26 | | | 1,978,008 | | |
| | 1,000,000 | | | Ford Motor Co | | | 4.346 | % | | 12/08/26 | | | 1,010,498 | | |
| | 1,000,000 | | | Metropolitan Opera Association Inc | | | 4.349 | % | | 10/01/32 | | | 978,027 | | |
| | 2,000,000 | | | Comcast Corp | | | 4.250 | % | | 01/15/33 | | | 2,081,330 | | |
| | | | 26,295,199 | | |
| | | CONSUMER STAPLES 0.9% | |
| | 525,000 | | | Cargill Inc (g) | | | 6.000 | % | | 11/27/17 | | | 546,411 | | |
| | 2,250,000 | | | Land O' Lakes Inc (g) | | | 6.000 | % | | 11/15/22 | | | 2,452,500 | | |
| | 1,000,000 | | | Walgreens Boots Alliance Inc | | | 3.800 | % | | 11/18/24 | | | 1,017,775 | | |
| | 1,949,000 | | | Land O'Lakes Capital Trust I (g) | | | 7.450 | % | | 03/15/28 | | | 2,104,920 | | |
| | 500,000 | | | Altria Group Inc | | | 4.250 | % | | 08/09/42 | | | 492,060 | | |
| | 1,000,000 | | | Cargill Inc (g) | | | 4.100 | % | | 11/01/42 | | | 958,049 | | |
| | | | 7,571,715 | | |
14
Mairs & Power Balanced Fund
SCHEDULE OF INVESTMENTS (continued) December 31, 2016
Par Value | | Security Description | | Fair Value | |
| | | FIXED INCOME SECURITIES (continued) | |
| | | CORPORATE BONDS (continued) | |
| | | ENERGY 1.7% | |
$ | 250,000 | | | ConocoPhillips Co | | | 6.650 | % | | 07/15/18 | | $ | 267,696 | | |
| | 2,000,000 | | | ConocoPhillips Co | | | 4.200 | % | | 03/15/21 | | | 2,124,442 | | |
| | 140,000 | | | Gulf South Pipeline Co LP | | | 4.000 | % | | 06/15/22 | | | 141,817 | | |
| | 500,000 | | | Western Gas Partners LP | | | 4.000 | % | | 07/01/22 | | | 508,158 | | |
| | 1,020,000 | | | FMC Technologies Inc | | | 3.450 | % | | 10/01/22 | | | 1,020,440 | | |
| | 1,500,000 | | | Sunoco Logistics Partners Operations LP | | | 3.450 | % | | 01/15/23 | | | 1,465,314 | | |
| | 575,000 | | | DCP Midstream Operating LP | | | 3.875 | % | | 03/15/23 | | | 553,081 | | |
| | 2,000,000 | | | Halliburton Co | | | 3.500 | % | | 08/01/23 | | | 2,030,822 | | |
| | 1,000,000 | | | Diamond Offshore Drilling Inc | | | 3.450 | % | | 11/01/23 | | | 860,000 | | |
| | 2,300,000 | | | Murphy Oil Corp | | | 6.875 | % | | 08/15/24 | | | 2,449,500 | | |
| | 500,000 | | | Kinder Morgan Energy Partners LP | | | 4.250 | % | | 09/01/24 | | | 510,622 | | |
| | 1,000,000 | | | ConocoPhillips Co | | | 3.350 | % | | 11/15/24 | | | 994,241 | | |
| | 1,000,000 | | | Boardwalk Pipelines LP | | | 4.950 | % | | 12/15/24 | | | 1,026,769 | | |
| | 500,000 | | | Murphy Oil Corp (f) | | | 6.125 | % | | 12/01/42 | | | 468,428 | | |
| | 500,000 | | | Apache Corp | | | 4.250 | % | | 01/15/44 | | | 492,911 | | |
| | | | 14,914,241 | | |
| | | FINANCIALS 12.9% | |
| | 500,000 | | | M&I Marshall & Ilsley Bank | | | 5.000 | % | | 01/17/17 | | | 500,529 | | |
| | 500,000 | | | Citigroup Inc | | | 5.500 | % | | 02/15/17 | | | 502,337 | | |
| | 250,000 | | | Bank of America Corp | | | 5.700 | % | | 05/02/17 | | | 253,407 | | |
| | 500,000 | | | Royal Bank of Scotland Group PLC (a) | | | 4.250 | % | | 07/15/17 | | | 502,256 | | |
| | 500,000 | | | Comerica Bank | | | 5.200 | % | | 08/22/17 | | | 511,231 | | |
| | 500,000 | | | Bank of America Corp | | | 6.000 | % | | 09/01/17 | | | 514,489 | | |
| | 500,000 | | | American Express Bank FSB | | | 6.000 | % | | 09/13/17 | | | 515,457 | | |
| | 500,000 | | | Bear Stearns Cos LLC/The | | | 6.400 | % | | 10/02/17 | | | 517,973 | | |
| | 500,000 | | | Prudential Financial Inc | | | 6.000 | % | | 12/01/17 | | | 519,475 | | |
| | 500,000 | | | Barclays Bank PLC (a) (g) | | | 6.050 | % | | 12/04/17 | | | 516,543 | | |
| | 1,000,000 | | | Morgan Stanley | | | 5.950 | % | | 12/28/17 | | | 1,040,830 | | |
| | 500,000 | | | Goldman Sachs Group Inc/The | | | 5.950 | % | | 01/18/18 | | | 520,871 | | |
| | 500,000 | | | Wachovia Corp | | | 5.750 | % | | 02/01/18 | | | 521,298 | | |
| | 250,000 | | | Lincoln National Corp | | | 7.000 | % | | 03/15/18 | | | 264,089 | | |
| | 500,000 | | | SunTrust Bank/Atlanta GA | | | 7.250 | % | | 03/15/18 | | | 530,378 | | |
| | 500,000 | | | Morgan Stanley | | | 6.625 | % | | 04/01/18 | | | 528,764 | | |
| | 1,000,000 | | | Jefferies Group LLC | | | 5.125 | % | | 04/13/18 | | | 1,033,647 | | |
| | 500,000 | | | Bank of America Corp | | | 6.875 | % | | 04/25/18 | | | 531,455 | | |
| | 500,000 | | | Provident Cos Inc | | | 7.000 | % | | 07/15/18 | | | 537,191 | | |
| | 500,000 | | | MetLife Inc | | | 6.817 | % | | 08/15/18 | | | 539,050 | | |
| | 500,000 | | | Hartford Financial Services Group Inc/The | | | 6.000 | % | | 01/15/19 | | | 538,040 | | |
15
Mairs & Power Balanced Fund
SCHEDULE OF INVESTMENTS (continued) December 31, 2016
Par Value | | Security Description | | Fair Value | |
| | | FIXED INCOME SECURITIES (continued) | |
| | | CORPORATE BONDS (continued) | |
| | | FINANCIALS (continued) | |
$ | 500,000 | | | Royal Bank of Scotland Group PLC (a) | | | 5.250 | % | | 02/15/19 | | $ | 516,885 | | |
| | 500,000 | | | BB&T Corp | | | 6.850 | % | | 04/30/19 | | | 554,157 | | |
| | 250,000 | | | WR Berkley Corp | | | 6.150 | % | | 08/15/19 | | | 272,327 | | |
| | 500,000 | | | Protective Life Corp | | | 7.375 | % | | 10/15/19 | | | 566,313 | | |
| | 500,000 | | | Prospect Capital Corp | | | 5.125 | % | | 11/15/19 | | | 488,784 | | |
| | 500,000 | | | Credit Suisse/New York NY (a) | | | 5.400 | % | | 01/14/20 | | | 536,069 | | |
| | 500,000 | | | Prospect Capital Corp | | | 4.000 | % | | 01/15/20 | | | 477,937 | | |
| | 500,000 | | | Morgan Stanley | | | 5.500 | % | | 01/26/20 | | | 542,066 | | |
| | 500,000 | | | Hartford Financial Services Group Inc/The | | | 5.500 | % | | 03/30/20 | | | 545,964 | | |
| | 450,000 | | | Compass Bank | | | 5.500 | % | | 04/01/20 | | | 471,541 | | |
| | 1,000,000 | | | Barclays PLC (a) | | | 3.250 | % | | 01/12/21 | | | 1,000,974 | | |
| | 2,000,000 | | | American International Group Inc | | | 3.300 | % | | 03/01/21 | | | 2,048,566 | | |
| | 1,000,000 | | | HSBC Holdings PLC (a) | | | 3.400 | % | | 03/08/21 | | | 1,016,879 | | |
| | 1,000,000 | | | Nationwide Financial Services Inc (g) | | | 5.375 | % | | 03/25/21 | | | 1,092,241 | | |
| | 500,000 | | | Markel Corp | | | 5.350 | % | | 06/01/21 | | | 545,767 | | |
| | 1,000,000 | | | Capital One Financial Corp | | | 4.750 | % | | 07/15/21 | | | 1,081,575 | | |
| | 500,000 | | | Goldman Sachs Group Inc/The | | | 5.250 | % | | 07/27/21 | | | 547,995 | | |
| | 500,000 | | | Genworth Holdings Inc | | | 7.625 | % | | 09/24/21 | | | 461,250 | | |
| | 500,000 | | | Aflac Inc | | | 4.000 | % | | 02/15/22 | | | 528,779 | | |
| | 2,000,000 | | | Primerica Inc | | | 4.750 | % | | 07/15/22 | | | 2,142,550 | | |
| | 2,000,000 | | | OneBeacon US Holdings Inc | | | 4.600 | % | | 11/09/22 | | | 1,993,854 | | |
| | 1,000,000 | | | Invesco Finance PLC (a) | | | 3.125 | % | | 11/30/22 | | | 1,007,375 | | |
| | 1,000,000 | | | Standard Chartered PLC (a) (g) | | | 3.950 | % | | 01/11/23 | | | 977,229 | | |
| | 2,000,000 | | | Wells Fargo & Co | | | 3.450 | % | | 02/13/23 | | | 2,007,198 | | |
| | 4,073,000 | | | Assurant Inc | | | 4.000 | % | | 03/15/23 | | | 4,101,662 | | |
| | 1,000,000 | | | Markel Corp | | | 3.625 | % | | 03/30/23 | | | 1,002,643 | | |
| | 1,000,000 | | | General Motors Financial Co Inc | | | 3.700 | % | | 05/09/23 | | | 983,987 | | |
| | 1,500,000 | | | Citigroup Inc | | | 3.500 | % | | 05/15/23 | | | 1,495,158 | | |
| | 500,000 | | | Morgan Stanley | | | 4.100 | % | | 05/22/23 | | | 513,261 | | |
| | 2,000,000 | | | Liberty Mutual Group Inc (g) | | | 4.250 | % | | 06/15/23 | | | 2,093,950 | | |
| | 2,000,000 | | | E*TRADE Financial Corp | | | 4.625 | % | | 09/15/23 | | | 2,040,000 | | |
| | 500,000 | | | Ameriprise Financial Inc | | | 4.000 | % | | 10/15/23 | | | 524,377 | | |
| | 500,000 | | | CNA Financial Corp | | | 7.250 | % | | 11/15/23 | | | 591,066 | | |
| | 500,000 | | | Pacific Life Insurance Co (g) | | | 7.900 | % | | 12/30/23 | | | 594,913 | | |
| | 1,000,000 | | | Moody's Corp | | | 4.875 | % | | 02/15/24 | | | 1,081,089 | | |
| | 1,000,000 | | | NASDAQ OMX Group Inc/The | | | 4.250 | % | | 06/01/24 | | | 1,028,995 | | |
| | 500,000 | | | Wintrust Financial Corp | | | 5.000 | % | | 06/13/24 | | | 494,370 | | |
| | 1,250,000 | | | Assured Guaranty US Holdings Inc | | | 5.000 | % | | 07/01/24 | | | 1,320,147 | | |
16
Mairs & Power Balanced Fund
SCHEDULE OF INVESTMENTS (continued) December 31, 2016
Par Value | | Security Description | | Fair Value | |
| | | FIXED INCOME SECURITIES (continued) | |
| | | CORPORATE BONDS (continued) | |
| | | FINANCIALS (continued) | |
$ | 2,060,000 | | | Legg Mason Inc | | | 3.950 | % | | 07/15/24 | | $ | 2,067,404 | | |
| | 500,000 | | | Symetra Financial Corp | | | 4.250 | % | | 07/15/24 | | | 494,064 | | |
| | 1,500,000 | | | Stifel Financial Corp | | | 4.250 | % | | 07/18/24 | | | 1,489,698 | | |
| | 1,000,000 | | | Citigroup Inc | | | 4.000 | % | | 08/05/24 | | | 1,007,747 | | |
| | 1,500,000 | | | Synchrony Financial | | | 4.250 | % | | 08/15/24 | | | 1,526,922 | | |
| | 1,000,000 | | | Bank of America Corp | | | 4.200 | % | | 08/26/24 | | | 1,018,704 | | |
| | 2,800,000 | | | Brown & Brown Inc | | | 4.200 | % | | 09/15/24 | | | 2,820,675 | | |
| | 2,000,000 | | | Old Republic International Corp | | | 4.875 | % | | 10/01/24 | | | 2,083,810 | | |
| | 1,000,000 | | | TIAA Asset Management Finance Co LLC (g) | | | 4.125 | % | | 11/01/24 | | | 1,010,034 | | |
| | 2,000,000 | | | American Express Co | | | 3.625 | % | | 12/05/24 | | | 2,008,290 | | |
| | 2,000,000 | | | Associated Banc-Corp | | | 4.250 | % | | 01/15/25 | | | 1,982,030 | | |
| | 4,000,000 | | | Kemper Corp | | | 4.350 | % | | 02/15/25 | | | 3,976,696 | | |
| | 1,050,000 | | | TCF National Bank | | | 4.600 | % | | 02/27/25 | | | 1,019,810 | | |
| | 1,000,000 | | | Lincoln National Corp | | | 3.350 | % | | 03/09/25 | | | 996,023 | | |
| | 250,000 | | | Liberty Mutual Insurance Co (g) | | | 8.500 | % | | 05/15/25 | | | 306,656 | | |
| | 3,000,000 | | | American International Group Inc | | | 3.750 | % | | 07/10/25 | | | 3,019,362 | | |
| | 1,000,000 | | | Synchrony Financial | | | 4.500 | % | | 07/23/25 | | | 1,027,166 | | |
| | 1,000,000 | | | Janus Capital Group Inc | | | 4.875 | % | | 08/01/25 | | | 1,030,440 | | |
| | 3,000,000 | | | HSBC Holdings PLC (a) | | | 4.250 | % | | 08/18/25 | | | 3,027,444 | | |
| | 1,000,000 | | | Capital One Financial Corp | | | 4.200 | % | | 10/29/25 | | | 1,003,326 | | |
| | 1,520,000 | | | Legg Mason Inc | | | 4.750 | % | | 03/15/26 | | | 1,573,297 | | |
| | 2,000,000 | | | Hanover Insurance Group Inc/The | | | 4.500 | % | | 04/15/26 | | | 2,009,724 | | |
| | 1,000,000 | | | Wells Fargo & Co | | | 4.100 | % | | 06/03/26 | | | 1,013,189 | | |
| | 2,000,000 | | | Voya Financial Inc | | | 3.650 | % | | 06/15/26 | | | 1,955,550 | | |
| | 2,000,000 | | | MSCI Inc (g) | | | 4.750 | % | | 08/01/26 | | | 1,990,000 | | |
| | 2,000,000 | | | Old Republic International Corp | | | 3.875 | % | | 08/26/26 | | | 1,902,430 | | |
| | 500,000 | | | Morgan Stanley | | | 4.350 | % | | 09/08/26 | | | 512,374 | | |
| | 1,000,000 | | | National Rural Utilities Cooperative Finance Corp | | | 3.000 | % | | 11/15/26 | | | 946,536 | | |
| | 1,000,000 | | | Citigroup Inc | | | 4.300 | % | | 11/20/26 | | | 1,009,128 | | |
| | 1,000,000 | | | JPMorgan Chase & Co | | | 4.125 | % | | 12/15/26 | | | 1,020,656 | | |
| | 250,000 | | | Provident Cos Inc | | | 7.250 | % | | 03/15/28 | | | 295,771 | | |
| | 1,000,000 | | | JPMorgan Chase & Co (f) | | | 3.000 | % | | 03/21/28 | | | 932,366 | | |
| | 1,000,000 | | | Royal Bank of Canada (a) | | | 3.000 | % | | 05/10/28 | | | 859,317 | | |
| | 500,000 | | | Farmers Exchange Capital (g) | | | 7.050 | % | | 07/15/28 | | | 577,725 | | |
| | 500,000 | | | Goldman Sachs Group Inc/The | | | 4.250 | % | | 11/15/30 | | | 482,761 | | |
| | 500,000 | | | Goldman Sachs Group Inc/The | | | 4.000 | % | | 02/15/31 | | | 491,499 | | |
| | 500,000 | | | Goldman Sachs Group Inc/The | | | 4.300 | % | | 12/15/32 | | | 488,100 | | |
| | 1,000,000 | | | JPMorgan Chase & Co (f) | | | 3.250 | % | | 01/31/33 | | | 963,535 | | |
17
Mairs & Power Balanced Fund
SCHEDULE OF INVESTMENTS (continued) December 31, 2016
Par Value | | Security Description | | Fair Value | |
| | | FIXED INCOME SECURITIES (continued) | |
| | | CORPORATE BONDS (continued) | |
| | | FINANCIALS (continued) | |
$ | 649,000 | | | Lloyds Bank PLC (a) (f) | | | 3.400 | % | | 01/31/33 | | $ | 580,015 | | |
| | 250,000 | | | Citigroup Inc (f) | | | 4.000 | % | | 06/27/34 | | | 240,469 | | |
| | 538,000 | | | Bank of America Corp | | | 4.000 | % | | 08/15/34 | | | 512,361 | | |
| | 1,000,000 | | | Prudential Financial Inc | | | 4.050 | % | | 11/15/34 | | | 973,193 | | |
| | 1,000,000 | | | Goldman Sachs Group Inc/The | | | 4.000 | % | | 01/30/35 | | | 969,976 | | |
| | 1,000,000 | | | Berkshire Hathaway Finance Corp | | | 4.400 | % | | 05/15/42 | | | 1,052,754 | | |
| | 500,000 | | | MetLife Inc | | | 4.125 | % | | 08/13/42 | | | 492,083 | | |
| | 500,000 | | | Swiss Re Treasury US Corp (g) | | | 4.250 | % | | 12/06/42 | | | 488,279 | | |
| | 500,000 | | | Pacific LifeCorp (g) | | | 5.125 | % | | 01/30/43 | | | 511,066 | | |
| | 500,000 | | | Berkshire Hathaway Finance Corp | | | 4.300 | % | | 05/15/43 | | | 516,566 | | |
| | 500,000 | | | Principal Financial Group Inc | | | 4.350 | % | | 05/15/43 | | | 494,379 | | |
| | 2,000,000 | | | M&T Bank Corp (f) | | | 5.125 | % | | 12/29/49 | | | 1,935,000 | | |
| | | | 111,435,603 | | |
| | | HEALTH CARE 1.0% | |
| | 500,000 | | | UnitedHealth Group Inc | | | 6.000 | % | | 02/15/18 | | | 524,255 | | |
| | 1,000,000 | | | Quest Diagnostics Inc | | | 4.700 | % | | 04/01/21 | | | 1,073,319 | | |
| | 1,000,000 | | | Laboratory Corp of America Holdings | | | 3.750 | % | | 08/23/22 | | | 1,026,175 | | |
| | 1,000,000 | | | Laboratory Corp of America Holdings | | | 4.000 | % | | 11/01/23 | | | 1,024,543 | | |
| | 1,000,000 | | | Mylan Inc/PA | | | 4.200 | % | | 11/29/23 | | | 1,001,205 | | |
| | 500,000 | | | Wyeth LLC | | | 6.450 | % | | 02/01/24 | | | 608,818 | | |
| | 2,000,000 | | | Actavis Funding SCS (a) | | | 3.800 | % | | 03/15/25 | | | 2,002,356 | | |
| | 1,000,000 | | | Express Scripts Holding Co | | | 4.500 | % | | 02/25/26 | | | 1,029,473 | | |
| | | | 8,290,144 | | |
| | | INDUSTRIALS 2.4% | |
| | 500,000 | | | Masco Corp | | | 7.125 | % | | 03/15/20 | | | 562,500 | | |
| | 150,000 | | | Pentair Finance SA (a) | | | 3.625 | % | | 09/15/20 | | | 152,618 | | |
| | 500,000 | | | Pentair Finance SA (a) | | | 5.000 | % | | 05/15/21 | | | 532,829 | | |
| | 500,000 | | | IDEX Corp | | | 4.200 | % | | 12/15/21 | | | 512,647 | | |
| | 500,000 | | | GATX Corp | | | 4.750 | % | | 06/15/22 | | | 538,138 | | |
| | 500,000 | | | Penske Truck Leasing Co Lp / PTL Finance Corp (g) | | | 4.875 | % | | 07/11/22 | | | 536,556 | | |
| | 2,000,000 | | | Dun & Bradstreet Corp/The | | | 4.375 | % | | 12/01/22 | | | 2,026,536 | | |
| | 2,000,000 | | | Crown Americas LLC / Crown Americas Capital Corp IV | | | 4.500 | % | | 01/15/23 | | | 2,040,000 | | |
| | 1,000,000 | | | GATX Corp | | | 3.900 | % | | 03/30/23 | | | 998,560 | | |
| | 500,000 | | | Ingersoll-Rand Global Holding Co Ltd (a) | | | 4.250 | % | | 06/15/23 | | | 528,819 | | |
| | 1,000,000 | | | Flowserve Corp | | | 4.000 | % | | 11/15/23 | | | 1,012,541 | | |
| | 2,126,000 | | | Air Lease Corp | | | 4.850 | % | | 02/01/24 | | | 2,115,370 | | |
| | 500,000 | | | Pitney Bowes Inc | | | 4.625 | % | | 03/15/24 | | | 492,506 | | |
| | 1,375,000 | | | Oshkosh Corp | | | 5.375 | % | | 03/01/25 | | | 1,402,500 | | |
18
Mairs & Power Balanced Fund
SCHEDULE OF INVESTMENTS (continued) December 31, 2016
Par Value | | Security Description | | Fair Value | |
| | | FIXED INCOME SECURITIES (continued) | |
| | | CORPORATE BONDS (continued) | |
| | | INDUSTRIALS (continued) | |
$ | 500,000 | | | Toro Co/The | | | 7.800 | % | | 06/15/27 | | $ | 607,394 | | |
| | 500,000 | | | General Electric Capital Corp | | | 3.500 | % | | 05/15/32 | | | 476,113 | | |
| | 2,000,000 | | | Eaton Corp | | | 4.000 | % | | 11/02/32 | | | 1,971,672 | | |
| | 2,000,000 | | | General Electric Capital Corp | | | 4.000 | % | | 02/14/33 | | | 1,951,392 | | |
| | 1,000,000 | | | Pitney Bowes Inc | | | 5.250 | % | | 01/15/37 | | | 999,830 | | |
| | 590,000 | | | Eaton Corp | | | 4.150 | % | | 11/02/42 | | | 576,710 | | |
| | 500,000 | | | Lockheed Martin Corp | | | 4.070 | % | | 12/15/42 | | | 493,526 | | |
| | | | 20,528,757 | | |
| | | INFORMATION TECHNOLOGY 3.4% | |
| | 500,000 | | | Broadridge Financial Solutions Inc | | | 6.125 | % | | 06/01/17 | | | 508,700 | | |
| | 500,000 | | | Broadridge Financial Solutions Inc | | | 3.950 | % | | 09/01/20 | | | 524,258 | | |
| | 81,000 | | | Hewlett-Packard Co | | | 3.750 | % | | 12/01/20 | | | 83,866 | | |
| | 750,000 | | | Hewlett-Packard Co | | | 4.300 | % | | 06/01/21 | | | 784,936 | | |
| | 2,000,000 | | | NetApp Inc | | | 3.375 | % | | 06/15/21 | | | 2,031,260 | | |
| | 1,000,000 | | | eBay Inc | | | 3.800 | % | | 03/09/22 | | | 1,033,131 | | |
| | 500,000 | | | Motorola Solutions Inc | | | 3.750 | % | | 05/15/22 | | | 505,384 | | |
| | 2,000,000 | | | Symantec Corp | | | 3.950 | % | | 06/15/22 | | | 1,979,486 | | |
| | 1,000,000 | | | Computer Sciences Corp | | | 4.450 | % | | 09/15/22 | | | 1,035,408 | | |
| | 1,000,000 | | | Hewlett-Packard Co | | | 4.050 | % | | 09/15/22 | | | 1,034,933 | | |
| | 1,025,000 | | | Fiserv Inc | | | 3.500 | % | | 10/01/22 | | | 1,043,863 | | |
| | 3,000,000 | | | Autodesk Inc | | | 3.600 | % | | 12/15/22 | | | 3,006,507 | | |
| | 2,000,000 | | | Fidelity National Information Services Inc | | | 3.500 | % | | 04/15/23 | | | 2,025,466 | | |
| | 1,352,000 | | | Total System Services Inc | | | 3.750 | % | | 06/01/23 | | | 1,342,800 | | |
| | 2,000,000 | | | Diamond 1 Finance Corp / Diamond 2 Finance Corp (g) | | | 5.450 | % | | 06/15/23 | | | 2,121,478 | | |
| | 1,000,000 | | | Altera Corp | | | 4.100 | % | | 11/15/23 | | | 1,075,840 | | |
| | 500,000 | | | Motorola Solutions Inc | | | 4.000 | % | | 09/01/24 | | | 500,583 | | |
| | 2,000,000 | | | Lam Research Corp | | | 3.800 | % | | 03/15/25 | | | 2,002,180 | | |
| | 500,000 | | | Arrow Electronics Inc | | | 4.000 | % | | 04/01/25 | | | 487,160 | | |
| | 1,000,000 | | | Juniper Networks Inc | | | 4.350 | % | | 06/15/25 | | | 1,008,374 | | |
| | 4,000,000 | | | Intel Corp | | | 4.000 | % | | 12/15/32 | | | 4,123,820 | | |
| | 1,500,000 | | | Western Union Co/The | | | 6.200 | % | | 11/17/36 | | | 1,564,211 | | |
| | | | 29,823,644 | | |
| | | MATERIALS 2.6% | |
| | 500,000 | | | Valspar Corp/The | | | 6.050 | % | | 05/01/17 | | | 506,845 | | |
| | 500,000 | | | Carpenter Technology Corp | | | 5.200 | % | | 07/15/21 | | | 504,984 | | |
| | 500,000 | | | Freeport-McMoRan Inc | | | 4.000 | % | | 11/14/21 | | | 487,500 | | |
| | 175,000 | | | Mosaic Co/The | | | 3.750 | % | | 11/15/21 | | | 179,721 | | |
| | 500,000 | | | Barrick Gold Corp (a) | | | 3.850 | % | | 04/01/22 | | | 507,256 | | |
19
Mairs & Power Balanced Fund
SCHEDULE OF INVESTMENTS (continued) December 31, 2016
Par Value | | Security Description | | Fair Value | |
| | | FIXED INCOME SECURITIES (continued) | |
| | | CORPORATE BONDS (continued) | |
| | | MATERIALS (continued) | |
$ | 1,000,000 | | | Domtar Corp | | | 4.400 | % | | 04/01/22 | | $ | 1,028,864 | | |
| | 1,000,000 | | | RPM International Inc | | | 3.450 | % | | 11/15/22 | | | 991,591 | | |
| | 500,000 | | | Carpenter Technology Corp | | | 4.450 | % | | 03/01/23 | | | 478,470 | | |
| | 500,000 | | | Freeport-McMoRan Inc | | | 3.875 | % | | 03/15/23 | | | 458,750 | | |
| | 1,402,000 | | | Reliance Steel & Aluminum Co | | | 4.500 | % | | 04/15/23 | | | 1,410,530 | | |
| | 1,750,000 | | | Barrick Gold Corp (a) | | | 4.100 | % | | 05/01/23 | | | 1,795,222 | | |
| | 2,000,000 | | | Nucor Corp | | | 4.000 | % | | 08/01/23 | | | 2,102,426 | | |
| | 1,000,000 | | | BP Capital Markets PLC (a) | | | 3.994 | % | | 09/26/23 | | | 1,051,115 | | |
| | 2,000,000 | | | Mosaic Co/The | | | 4.250 | % | | 11/15/23 | | | 2,016,682 | | |
| | 1,000,000 | | | Steel Dynamics Inc | | | 5.500 | % | | 10/01/24 | | | 1,060,000 | | |
| | 1,000,000 | | | Freeport-McMoRan Inc | | | 4.550 | % | | 11/14/24 | | | 937,500 | | |
| | 756,000 | | | Eastman Chemical Co | | | 3.800 | % | | 03/15/25 | | | 762,418 | | |
| | 865,000 | | | Union Carbide Corp | | | 7.500 | % | | 06/01/25 | | | 1,041,364 | | |
| | 2,000,000 | | | CF Industries Inc | | | 5.150 | % | | 03/15/34 | | | 1,700,000 | | |
| | 1,250,000 | | | Dow Chemical Co/The | | | 4.250 | % | | 10/01/34 | | | 1,231,949 | | |
| | 1,000,000 | | | Alcoa Inc | | | 5.950 | % | | 02/01/37 | | | 972,750 | | |
| | 1,000,000 | | | Newmont Mining Corp | | | 4.875 | % | | 03/15/42 | | | 938,251 | | |
| | | | 22,164,188 | | |
| | | REAL ESTATE 0.3% | |
| | 1,250,000 | | | CBRE Services Inc | | | 5.000 | % | | 03/15/23 | | | 1,289,487 | | |
| | 1,000,000 | | | CBRE Services Inc | | | 5.250 | % | | 03/15/25 | | | 1,031,160 | | |
| | 350,000 | | | CBRE Services Inc | | | 4.875 | % | | 03/01/26 | | | 348,731 | | |
| | | | 2,669,378 | | |
| | | TELECOMMUNICATION SERVICES 0.6% | |
| | 500,000 | | | CenturyLink Inc | | | 6.150 | % | | 09/15/19 | | | 535,000 | | |
| | 3,000,000 | | | AT&T Inc | | | 3.000 | % | | 06/30/22 | | | 2,944,830 | | |
| | 500,000 | | | Qwest Capital Funding Inc | | | 6.875 | % | | 07/15/28 | | | 453,750 | | |
| | 1,000,000 | | | Verizon Communications Inc | | | 4.400 | % | | 11/01/34 | | | 986,986 | | |
| | | | 4,920,566 | | |
| | | UTILITIES 1.0% | |
| | 500,000 | | | Commonwealth Edison Co | | | 6.150 | % | | 09/15/17 | | | 516,432 | | |
| | 1,000,000 | | | Tampa Electric Co | | | 6.100 | % | | 05/15/18 | | | 1,059,235 | | |
| | 250,000 | | | Vectren Utility Holdings Inc | | | 5.750 | % | | 08/01/18 | | | 261,398 | | |
| | 250,000 | | | South Jersey Gas Co | | | 7.125 | % | | 10/22/18 | | | 267,942 | | |
| | 250,000 | | | United Utilities PLC (a) | | | 5.375 | % | | 02/01/19 | | | 262,006 | | |
| | 1,170,000 | | | ONEOK Inc | | | 4.250 | % | | 02/01/22 | | | 1,175,850 | | |
| | 785,000 | | | SCANA Corp | | | 4.125 | % | | 02/01/22 | | | 793,156 | | |
20
Mairs & Power Balanced Fund
SCHEDULE OF INVESTMENTS (continued) December 31, 2016
Par Value | | Security Description | | Fair Value | |
| | | FIXED INCOME SECURITIES (continued) | |
| | | CORPORATE BONDS (continued) | |
| | | UTILITIES (continued) | |
$ | 1,000,000 | | | Exelon Generation Co LLC | | | 4.250 | % | | 06/15/22 | | $ | 1,035,060 | | |
| | 900,000 | | | National Fuel Gas Co | | | 3.750 | % | | 03/01/23 | | | 877,621 | | |
| | 1,060,000 | | | PSEG Power LLC | | | 4.300 | % | | 11/15/23 | | | 1,095,635 | | |
| | 1,550,000 | | | Dominion Resources Inc/VA | | | 3.625 | % | | 12/01/24 | | | 1,559,698 | | |
| | | | 8,904,033 | | |
| | | TOTAL CORPORATE BONDS | | | 257,517,468 | | |
| | | ASSET BACKED SECURITIES 2.6% | |
| | 220,865 | | | Continental Airlines 1997-4 Class B Pass Through Trust | | | 6.900 | % | | 07/02/18 | | | 220,997 | | |
| | 631,115 | | | Delta Air Lines 2012-1 Class B Pass Through Trust (g) | | | 6.875 | % | | 05/07/19 | | | 676,871 | | |
| | 299,202 | | | American Airlines 2011-1 Class B Pass Through Trust (g) | | | 7.000 | % | | 07/31/19 | | | 309,494 | | |
| | 49,319 | | | Continental Airlines 1999-1 Class B Pass Through Trust | | | 6.795 | % | | 02/02/20 | | | 50,429 | | |
| | 355,586 | | | Continental Airlines 2010-1 Class B Pass Through Trust | | | 6.000 | % | | 07/12/20 | | | 362,485 | | |
| | 260,120 | | | Delta Air Lines 2011-1 Class A Pass Through Trust | | | 5.300 | % | | 10/15/20 | | | 273,932 | | |
| | 407,337 | | | America West Airlines 2000-1 Pass Through Trust | | | 8.057 | % | | 01/02/22 | | | 460,046 | | |
| | 592,962 | | | American Airlines 2011-1 Class A Pass Through Trust | | | 5.250 | % | | 07/31/22 | | | 635,181 | | |
| | 430,429 | | | United Airlines 2014-1 Class B Pass Through Trust | | | 4.750 | % | | 10/11/23 | | | 439,037 | | |
| | 177,295 | | | Continental Airlines 2007-1 Class A Pass Through Trust | | | 5.983 | % | | 10/19/23 | | | 196,585 | | |
| | 332,192 | | | Southwest Airlines Co 2007-1 Pass Through Trust | | | 6.150 | % | | 02/01/24 | | | 366,673 | | |
| | 844,524 | | | Delta Air Lines 2007-1 Class B Pass Through Trust (g) | | | 8.021 | % | | 02/10/24 | | | 970,189 | | |
| | 67,817 | | | United Airlines 2014-2 Class B Pass Through Trust | | | 4.625 | % | | 03/03/24 | | | 69,092 | | |
| | 554,421 | | | American Airlines 2014-1 Class B Pass Through Trust | | | 4.375 | % | | 04/01/24 | | | 554,421 | | |
| | 1,000,000 | | | United Airlines 2015-1 Class A Pass Through Trust | | | 3.700 | % | | 06/01/24 | | | 1,014,400 | | |
| | 657,824 | | | US Airways 2010-1 Class A Pass Through Trust | | | 6.250 | % | | 10/22/24 | | | 730,974 | | |
| | 1,963,640 | | | American Airlines 2015-1 Class B Pass Through Trust | | | 3.700 | % | | 11/01/24 | | | 1,926,724 | | |
| | 1,402,427 | | | Delta Air Lines 2015-1 Class B Pass Through Trust | | | 4.250 | % | | 01/30/25 | | | 1,435,805 | | |
| | 940,513 | | | American Airlines 2015-2 Class B Pass Through Trust | | | 4.400 | % | | 03/22/25 | | | 929,979 | | |
| | 348,010 | | | US Airways 2011-1 Class A Pass Through Trust | | | 7.125 | % | | 04/22/25 | | | 403,483 | | |
| | 3,212,681 | | | American Airlines 2016-1 Class B Pass Through Trust | | | 5.250 | % | | 07/15/25 | | | 3,310,989 | | |
| | 1,321,632 | | | Continental Airlines 2012-2 Class A Pass Through Trust | | | 4.000 | % | | 04/29/26 | | | 1,361,281 | | |
| | 902,156 | | | United Airlines 2013-1 Class A Pass Through Trust | | | 4.300 | % | | 02/15/27 | | | 930,303 | | |
| | 839,070 | | | US Airways 2013-1 Class A Pass Through Trust | | | 3.950 | % | | 05/15/27 | | | 860,046 | | |
| | 2,057,179 | | | Hawaiian Airlines 2013-1 Class A Pass Through Certificates | | | 3.900 | % | | 07/15/27 | | | 2,066,848 | | |
| | 1,367,933 | | | American Airlines 2014-1 Class A Pass Through Trust | | | 3.700 | % | | 04/01/28 | | | 1,374,773 | | |
| | 488,176 | | | American Airlines 2015-2 Class A Pass Through Trust | | | 4.000 | % | | 03/22/29 | | | 498,525 | | |
| | | | 22,429,562 | | |
21
Mairs & Power Balanced Fund
SCHEDULE OF INVESTMENTS (continued) December 31, 2016
Par Value/Shares | | Security Description | | Fair Value | |
| | | FIXED INCOME SECURITIES (continued) | |
| | | PREFERRED SECURITIES 0.4% | |
$ | 20,000 | | | American Financial Group Inc/OH | | | 6.250 | % | | 09/30/54 | | $ | 501,000 | | |
| | 10,000 | | | NextEra Energy Capital Holdings Inc | | | 5.700 | % | | 03/01/72 | | | 242,600 | | |
| | 20,000 | | | Protective Life Corp | | | 6.000 | % | | 09/01/42 | | | 503,800 | | |
| | 20,000 | | | Qwest Corp | | | 6.875 | % | | 10/01/54 | | | 484,000 | | |
| | 10,000 | | | Raymond James Financial Inc | | | 6.900 | % | | 03/15/42 | | | 253,900 | | |
| | 20,000 | | | Selective Insurance Group Inc | | | 5.875 | % | | 02/09/43 | | | 479,400 | | |
| | 20,000 | | | Verizon Communications Inc | | | 5.900 | % | | 02/15/54 | | | 521,800 | | |
| | 40,000 | | | WR Berkley Corp | | | 5.625 | % | | 04/30/53 | | | 904,400 | | |
| | | | 3,890,900 | | |
| | TOTAL FIXED INCOME SECURITIES
(cost $282,320,450) | | $ | 285,333,652 | | |
| | | COMMON STOCKS 63.5% | |
| | | CONSUMER DISCRETIONARY 2.8% | |
| | 72,000 | | | Home Depot Inc/The | | | | | | | | | | $ | 9,653,760 | | |
| | 195,000 | | | Target Corp | | | | | | | | | | | 14,084,850 | | |
| | | | 23,738,610 | | |
| | | CONSUMER STAPLES 3.4% | |
| | 111,000 | | | General Mills Inc | | | | | | | | | | | 6,856,470 | | |
| | 46,000 | | | Hershey Co/The | | | | | | | | | | | 4,757,780 | | |
| | 375,000 | | | Hormel Foods Corp | | | | | | | | | | | 13,053,750 | | |
| | 40,000 | | | Kimberly-Clark Corp | | | | | | | | | | | 4,564,800 | | |
| | | | 29,232,800 | | |
| | | ENERGY 5.5% | |
| | 130,000 | | | Chevron Corp | | | | | | | | | | | 15,301,000 | | |
| | 203,000 | | | Exxon Mobil Corp | | | | | | | | | | | 18,322,780 | | |
| | 166,000 | | | Schlumberger Ltd (a) | | | | | | | | | | | 13,935,700 | | |
| | | | 47,559,480 | | |
| | | FINANCIALS 10.2% | |
| | 78,000 | | | American Express Co | | | | | | | | | | | 5,778,240 | | |
| | 414,000 | | | Associated Banc-Corp | | | | | | | | | | | 10,225,800 | | |
| | 158,000 | | | JPMorgan Chase & Co | | | | | | | | | | | 13,633,820 | | |
| | 271,000 | | | Principal Financial Group Inc | | | | | | | | | | | 15,680,060 | | |
| | 35,000 | | | Travelers Cos Inc/The | | | | | | | | | | | 4,284,700 | | |
| | 485,000 | | | US Bancorp/MN | | | | | | | | | | | 24,914,450 | | |
| | 240,000 | | | Wells Fargo & Co | | | | | | | | | | | 13,226,400 | | |
| | | | 87,743,470 | | |
22
Mairs & Power Balanced Fund
SCHEDULE OF INVESTMENTS (continued) December 31, 2016
Shares | | Security Description | | Fair Value | |
| | | COMMON STOCKS (continued) | |
| | | HEALTH CARE 14.3% | |
| | 355,000 | | | Abbott Laboratories | | $ | 13,635,550 | | |
| | 84,000 | | | AbbVie Inc | | | 5,260,080 | | |
| | 131,000 | | | Baxter International Inc | | | 5,808,540 | | |
| | 123,500 | | | Bristol-Myers Squibb Co | | | 7,217,340 | | |
| | 76,000 | | | Eli Lilly & Co | | | 5,589,800 | | |
| | 160,000 | | | Johnson & Johnson | | | 18,433,600 | | |
| | 302,500 | | | Medtronic PLC (e) | | | 21,547,075 | | |
| | 137,000 | | | Patterson Cos Inc | | | 5,621,110 | | |
| | 523,000 | | | Pfizer Inc | | | 16,987,040 | | |
| | 527,000 | | | Roche Holding AG (d) | | | 15,035,310 | | |
| | 51,000 | | | UnitedHealth Group Inc | | | 8,162,040 | | |
| | | | 123,297,485 | | |
| | | INDUSTRIALS 14.8% | |
| | 91,000 | | | 3M Co | | | 16,249,870 | | |
| | 147,000 | | | CH Robinson Worldwide Inc | | | 10,769,220 | | |
| | 26,000 | | | Deluxe Corp | | | 1,861,860 | | |
| | 246,000 | | | Emerson Electric Co | | | 13,714,500 | | |
| | 435,000 | | | General Electric Co | | | 13,746,000 | | |
| | 197,000 | | | Graco Inc | | | 16,368,730 | | |
| | 167,000 | | | Honeywell International Inc | | | 19,346,950 | | |
| | 138,000 | | | Pentair PLC (a) | | | 7,737,660 | | |
| | 80,000 | | | Toro Co/The | | | 4,476,000 | | |
| | 204,100 | | | United Parcel Service Inc, Class B | | | 23,398,024 | | |
| | | | 127,668,814 | | |
| | | INFORMATION TECHNOLOGY 5.5% | |
| | 7,300 | | | Alphabet Inc (b) | | | 5,634,286 | | |
| | 420,000 | | | Corning Inc | | | 10,193,400 | | |
| | 60,000 | | | International Business Machines Corp | | | 9,959,400 | | |
| | 125,000 | | | QUALCOMM Inc | | | 8,150,000 | | |
| | 637,000 | | | Western Union Co/The | | | 13,835,640 | | |
| | | | 47,772,726 | | |
| | | MATERIALS 5.8% | |
| | 194,000 | | | Bemis Co Inc | | | 9,277,080 | | |
| | 186,000 | | | Ecolab Inc | | | 21,802,920 | | |
| | 156,000 | | | HB Fuller Co | | | 7,536,360 | | |
| | 107,000 | | | Valspar Corp/The | | | 11,086,270 | | |
| | | | 49,702,630 | | |
23
Mairs & Power Balanced Fund
SCHEDULE OF INVESTMENTS (continued) December 31, 2016
Shares | | Security Description | | Fair Value | |
| | | COMMON STOCKS (continued) | |
| | | UTILITIES 1.2% | |
| | 88,000 | | | ALLETE Inc | | $ | 5,648,720 | | |
| | 108,000 | | | Xcel Energy Inc | | | 4,395,600 | | |
| | | | 10,044,320 | | |
| | | | TOTAL COMMON STOCKS
(cost $386,450,756) | | $ | 546,760,335 | | |
| | | PREFERRED STOCKS 0.0% (h) | |
| | | UTILITIES 0.0% (h) | |
| | 10,000 | | | SCE Trust I | | $ | 233,200 | | |
| | | | | TOTAL PREFERRED STOCKS
(cost $250,000) | | $ | 233,200
| | |
| | | SHORT-TERM INVESTMENTS 1.9% | |
| 16,322,390 | | | First American Government Obligations Fund, Class Z, 0.42% (c)
(cost $16,322,390) | | $ | 16,322,390 | | |
| | | | TOTAL INVESTMENTS 98.5%
(cost $685,343,596) | | $ | 848,649,577 | | |
| | | | | OTHER ASSETS AND LIABILITIES (NET) 1.5% | | | 12,775,964 | | |
| | | | | TOTAL NET ASSETS 100.0% | | $ | 861,425,541 | | |
(a) Foreign security denominated in U.S. dollars. As of December 31, 2016, these securities represented $39,046,567 or 4.5% of total net assets.
(b) Non-income producing.
(c) The rate quoted is the annualized seven-day effective yield as of December 31, 2016.
(d) American Depositary Receipt.
(e) Issuer headquartered overseas but considered domestic. In determining whether a security is foreign or domestic, the Adviser will generally look at the location of the headquarters of the issuer. However, if the issuer is believed by the Adviser to be headquartered in a jurisdiction primarily for tax purposes, the Adviser will consider the following additional factors: 1) the location of the primary exchange trading its securities; 2) where it derives the majority of its revenues, and/or 3) where it earns the majority of its profits.
(f) Step Bonds – securities for which the interest rate will adjust on specified future date(s). The rate disclosed represents the interest rate in effect as of December 31, 2016.
(g) Securities exempt from registration under Rule 144A of the Securities Act of 1933, as amended. These securities may be resold in transactions exempt from registration, normally to qualified institutional buyers. These securities have been determined to be liquid under guidelines established by the Fund's Board of Trustees. As of December 31, 2016, these securities represented $20,835,104 or 2.4% of total net assets.
(h) Percentage is less than 0.05%.
The Global Industry Classification Standard (GICS®) was developed by and/or is the exclusive property of MSCI, Inc. and Standard & Poor's Financial Services LLC ("S&P"). GICS is a service mark of MSCI, Inc. and S&P and has been licensed for use by the Adviser.
See accompanying Notes to Financial Statements.
24
MAIRS & POWER SMALL CAP FUND (unaudited)
To Our Shareholders: December 31, 2016
Small cap stocks rallied hard in the fourth quarter with the Mairs & Power Small Cap Fund up 9.27%, the S&P 600 Total Return Index up 11.13% and the Morningstar Small Blend Category up 9.49%. For the year, the Fund finished up 27.27%, outpacing both the index and peer group which were up 26.56% and 20.78% respectively.
Sector allocation played a larger role than typical in relative performance for the year. A relative overweight position in the strongest performing sector, basic materials, helped relative performance, as did an underweight position in the poorest performing sector, healthcare. Stock selection by sector was mostly a positive contributor to relative performance with the notable exception of the technology sector.
This was due, in large part, to our position in Cray Inc. (CRAY). Cray had been highlighted as a huge driver of positive performance at the end of 2015, and we did trim the position significantly on that outperformance. However, the stock was the worst performer in 2016 and also the largest detractor from Fund performance. While the company continues to be very well positioned from a competitive standpoint in high performance computing, that industry has clearly slowed. Customers have pushed out upgrading systems as the pace of processing improvement from chip manufacturers has slowed. We expect customers will eventually make the decision to upgrade systems, and Cray should at least win its fair share of system upgrades, but the slowing pace has hurt the industry and the company's longer term growth trajectory.
MAIRS & POWER SMALL CAP FUND (MSCFX)
TOP PERFORMERS
| Fourth Quarter (9/30/16 – 12/31/16) | | Year To Date (12/31/15 – 12/31/16) | |
GREAT WESTERN BANCORP | | | 19.69 | % | | OSHKOSH CORPORATION | | | 38.94 | % | |
WINTRUST FINANCIAL | | | | RAVEN INDUSTRIES | | | 34.98 | % | |
CORPORATION | | | 19.46 | % | | MDU RESOURCE GROUP, INC. | | | 30.48 | % | |
GLACIER BANCORP INC. | | | 15.90 | % | | HAWKINS, CORP. | | | 24.26 | % | |
ASSOCIATED BANC-CORP | | | 14.95 | % | | WINTRUST FINANCIAL | | | |
CARDINAL FINANCIAL CORP | | | 14.55 | % | | CORPORATION | | | 23.01 | % | |
WEAK PERFORMERS
| Fourth Quarter (9/30/16 – 12/31/16) | | Year To Date (12/31/15 – 12/31/16) | |
STRATASYS, INC. | | | -42.47 | % | | CRAY INC. | | | -62.77 | % | |
CRAY INC. | | | -23.19 | % | | STRATASYS, INC. | | | -56.12 | % | |
PHYSICIANS REALTY TRUST | | | -23.11 | % | | GENTHERM, INC. | | | -55.15 | % | |
BEMIS CO., INC. | | | -17.38 | % | | PROTO LABS, INC. | | | -45.94 | % | |
BIO-TECHNE CORPORATION | | | -17.22 | % | | VASCO DATA SECURITY | | | |
| | | | INTERNATIONAL | | | -44.97 | % | |
Past performance is no guarantee of future results.
A strong performer for the quarter and the biggest contributor to performance for the year was Oshkosh Corporation (OSK). During the year, Oshkosh won an eight-year contract to replace the U.S. military's aging Humvee fleet with a new Joint Light Tactical Vehicle designed and manufactured by Oshkosh Truck. In addition, a slight improvement in the company's aerial lift platform business with the expectation of a better 2017 on stronger construction and infrastructure spend in the U.S. also boosted the stock's performance.
Another strong performer for the year was Wintrust Financial (WTFC), a bank holding company headquartered in Chicago. Along with other bank stocks, Wintrust benefitted from the Trump win following his campaign to lower corporate income taxes, roll back federal regulation and provide an inflation- and GDP-boosting stimulus
25
MAIRS & POWER SMALL CAP FUND (unaudited) (continued)
package that helped significantly increase the yield curve. If all three of these factors play out meaningfully, Wintrust's earnings could see a boost.
On a fundamental basis, the outlook for small cap stocks appears fairly positive. With a greater domestic focus relative to larger companies, the financial performance of small firms is more insulated from an uncertain global economy and a strengthening dollar. Revenues and earnings should both start to improve from what was pretty lackluster growth in 2016. But, with the strong performance of small stocks relative to large after the election, most valuation metrics are near the upper end of their historical ranges. As discussed in the Market Recap above, continued positive market returns depend in large part on the success of the new administration in implementing its economic policies. We anticipate that volatility in the space is likely to increase as the changes in U.S. political philosophy are implemented.
During the year, a decision was made to close the Small Cap Fund to new investors. Implemented in the second half of 2016, the soft close has been working well. The decision to limit new investments into the Mairs & Power Small Cap Fund was made primarily to protect existing shareholders. Small cap stocks are less liquid, trading fewer shares than larger stocks. The lower trading volume limits how much of a stock can be bought or sold without significantly impacting the price of that stock. By limiting the amount of assets we manage, we are better able to trade into and out of stocks as opportunities arise without being significantly disadvantaged by the sheer volume of shares we would need to trade. In the long run, we felt this was the right step to take to protect the interest of our shareholders. For more details regarding the soft close of the Fund please visit www.mairsandpower.com.
Andrew R. Adams
Lead Manager | | Allen D. Steinkopf
Co-Manager | |
The Fund's investment objective, risks, charges and expenses must be considered carefully before investing. The summary prospectus or full prospectus contains this and other important information about the Fund and they may be obtained by calling Shareholder Services at (800) 304-7404 or by visiting www.mairsandpower.com. Read the summary prospectus or full prospectus carefully before investing.
All holdings in the portfolio are subject to change without notice and may or may not represent current or future portfolio composition. The mention of specific securities is not intended as a recommendation or an offer of a particular security, nor is it intended to be a solicitation for the purchase or sale of any security.
All investments have risks. The Small Cap Fund is designed for long-term investors. Equity investments are subject to market fluctuations and the Fund's share price can fall because of weakness in the broad market, a particular industry or specific holdings. Investments in small and midcap companies generally are more volatile. International investing risks include among others political, social or economic instability, difficulty in predicting international trade patterns, taxation and foreign trading practices, and greater fluctuations in price than U.S. corporations. The Fund may invest in initial public offerings by small cap companies, which can involve greater risk than investments in companies that are already publicly traded.
Diversification does not guarantee profit or protect against loss.
S&P 600 Small Cap Total Return (S&P 600) is an index of small company stocks managed by Standard & Poor's that covers a broad range of small cap stocks in the U.S. The index is weighted according to market capitalization and covers about 3-4% of the total market for equities in the U.S. It tracks both the capital gains of a group of stocks over time and assumes that any cash distributions, such as dividends, are reinvested back into the index. It is not possible to invest directly in an index.
Morningstar Small Blend Category, as defined by Morningstar are stocks in the bottom 10% of the capitalization of the U.S. equity market are defined as small cap. The blend style is assigned to portfolios where neither growth nor value characteristics predominate. It is not possible to invest directly in an index.
26
Mairs & Power Small Cap Fund
PERFORMANCE INFORMATION (unaudited) December 31, 2016
Investment performance since commencement of operations (through December 31, 2016)
This chart illustrates the performance of a hypothetical $10,000 investment made in the Fund since commencement of operations.
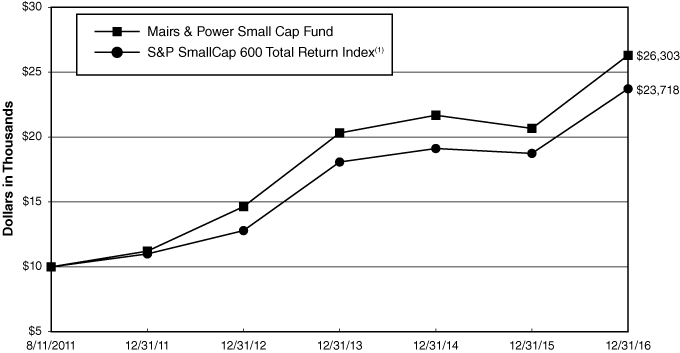
Average annual total returns for periods ended December 31, 2016 _
| | | 1 Year | | 3 Year | | 5 Year | | Since Inception(2) | |
Mairs & Power Small Cap Fund | | | 27.27 | % | | | 8.99 | % | | | 18.60 | % | | | 19.66 | % | |
S&P SmallCap 600 Total Return Index(1) | | | 26.56 | % | | | 9.47 | % | | | 16.62 | % | | | 17.38 | % | |
Performance data quoted represents past performance and does not guarantee future results. All performance information shown includes the reinvestment of dividend and capital gain distributions, but does not reflect the deduction of taxes that a shareholder would pay on Fund distributions or the redemption of Fund shares. The investment return and principal value of an investment will fluctuate so that an investor's shares, when redeemed, may be worth more or less than their original cost. Current performance of the Fund may be lower or higher than the performance quoted. For the most recent month-end performance figures, visit the Fund's website at www.mairsandpower.com or call Shareholder Services at (800) 304-7404.
(1) The S&P Small Cap 600 Total Return Index is an index of small-company stocks managed by Standard & Poor's that covers a broad range of small cap stocks in the U.S. The index is weighted according to market capitalization and covers about 3-4% of the total market for equities in the U.S. It tracks both the capital gains of a group of stocks over time and assumes that any cash distributions, such as dividends, are reinvested back into the index. It is not possible to invest directly in an index.
(2) Since inception performance is as of August 11, 2011, which is the offering date of the Small Cap Fund.
27
Mairs & Power Small Cap Fund
FUND INFORMATION (unaudited) December 31, 2016
Portfolio Managers
Andrew R. Adams, lead manager since 2011,
University of Wisconsin-Madison, MS Finance 1997
Allen D. Steinkopf, co-manager since January 1, 2015, University of Minnesota, MBA Finance 1986
General Information
Fund Symbol | | MSCFX | |
Net Asset Value (NAV) Per Share | | $ | 24.33 | | |
Expense Ratio | | | 1.05 | % | |
Portfolio Turnover Rate | | | 21.26 | % | |
Sales Charge | | | None1 | | |
Fund Inception Year | | | 2011 | | |
Portfolio Composition

Top Ten Portfolio Holdings
(Percent of Total Net Assets)2
Apogee Enterprises Inc | | | 3.5 | % | |
Glacier Bancorp Inc | | | 3.3 | | |
Donaldson Co Inc | | | 3.3 | | |
Wintrust Financial Corp | | | 3.3 | | |
ALLETE Inc | | | 3.3 | | |
Gentherm Inc | | | 3.3 | | |
Bemis Co Inc | | | 3.2 | | |
Oshkosh Corp | | | 3.2 | | |
Great Western Bancorp Inc | | | 2.9 | | |
Badger Meter Inc | | | 2.9 | | |
Portfolio Diversification
(Percent of Total Net Assets)
Common Stocks 98.0% | |
Industrials | | | 28.1 | % | |
Financials | | | 22.9 | | |
Information Technology | | | 10.5 | | |
Health Care | | | 8.5 | | |
Materials | | | 7.7 | | |
Consumer Discretionary | | | 7.2 | | |
Utilities | | | 5.2 | | |
Real Estate | | | 4.5 | | |
Consumer Staples | | | 2.6 | | |
Energy | | | 0.8 | | |
Short-term Investments 2.0%3 | | | 2.0 | | |
| | | | 100.0 | % | |
1 Although the Fund is no-load, investment management fees and other expenses still apply.
2 All holdings in the portfolio are subject to change without notice and may or may not represent current or future portfolio composition. The mention of specific securities is not intended as a recommendation or offer for a particular security, nor is it intended to be a solicitation for the purchase or sale of any security.
3 Represents short-term investments and other assets and liabilities (net).
As of September 30, 2016, the Small Cap Fund is closed to new investors. The close is intended to promote long-term investments in the Fund, thereby contributing to a more stable asset base and the continued efficient management of the Fund.
The Global Industry Classification Standard (GICS®) was developed by and/or is the exclusive property of MSCI, Inc. and Standard & Poor's Financial Services LLC ("S&P"). GICS is a service mark of MSCI, Inc. and S&P and has been licensed for use by the Adviser.
28
Mairs & Power Small Cap Fund
SCHEDULE OF INVESTMENTS December 31, 2016
Shares | | Security Description | | Fair Value | |
| | | COMMON STOCKS 98.0% | |
| | | CONSUMER DISCRETIONARY 7.2% | |
| | 32,500 | | | Buffalo Wild Wings Inc (b) | | $ | 5,018,000 | | |
| | 368,785 | | | Gentherm Inc (b) | | | 12,483,372 | | |
| | 254,323 | | | Marcus Corp/The | | | 8,011,175 | | |
| | 108,000 | | | Tile Shop Holdings Inc (b) | | | 2,111,400 | | |
| | | | 27,623,947 | | |
| | | CONSUMER STAPLES 2.6% | |
| | 84,600 | | | Casey's General Stores Inc | | | 10,057,248 | | |
| | | ENERGY 0.8% | |
| | 210,400 | | | Oasis Petroleum Inc (b) | | | 3,185,456 | | |
| | | FINANCIALS 22.9% | |
| | 423,800 | | | Associated Banc-Corp | | | 10,467,860 | | |
| | 262,613 | | | Bank Mutual Corp | | | 2,481,693 | | |
| | 272,416 | | | Cardinal Financial Corp | | | 8,932,521 | | |
| | 115,000 | | | Cullen/Frost Bankers Inc | | | 10,146,450 | | |
| | 188,148 | | | EMC Insurance Group Inc | | | 5,646,321 | | |
| | 352,700 | | | Glacier Bancorp Inc | | | 12,778,321 | | |
| | 255,800 | | | Great Western Bancorp Inc | | | 11,150,322 | | |
| | 49,200 | | | PrivateBancorp Inc | | | 2,666,148 | | |
| | 217,312 | | | United Fire Group Inc | | | 10,685,231 | | |
| | 173,200 | | | Wintrust Financial Corp | | | 12,569,124 | | |
| | | | 87,523,991 | | |
| | | HEALTH CARE 8.5% | |
| | 98,100 | | | Bio-Techne Corp | | | 10,087,623 | | |
| | 71,815 | | | Cardiovascular Systems Inc (b) | | | 1,738,641 | | |
| | 197,500 | | | Patterson Cos Inc | | | 8,103,425 | | |
| | 283,700 | | | Premier Inc (b) | | | 8,613,132 | | |
| | 69,373 | | | Vascular Solutions Inc (b) | | | 3,891,826 | | |
| | | | 32,434,647 | | |
| | | INDUSTRIALS 28.1% | |
| | 398,600 | | | Actuant Corp | | | 10,343,670 | | |
| | 247,900 | | | Apogee Enterprises Inc | | | 13,277,524 | | |
| | 299,768 | | | Donaldson Co Inc | | | 12,614,238 | | |
| | 26,700 | | | G&K Services Inc, Class A | | | 2,575,215 | | |
| | 177,700 | | | Generac Holdings Inc (b) | | | 7,239,498 | | |
| | 124,600 | | | Graco Inc | | | 10,353,014 | | |
| | 188,100 | | | Hub Group Inc, Class A (b) | | | 8,229,375 | | |
29
Mairs & Power Small Cap Fund
SCHEDULE OF INVESTMENTS (continued) December 31, 2016
Shares | | Security Description | | Fair Value | |
| | | COMMON STOCKS (continued) | |
| | | INDUSTRIALS (continued) | |
| | 186,600 | | | Oshkosh Corp | | $ | 12,056,226 | | |
| | 56,400 | | | Proto Labs Inc (b) | | | 2,896,140 | | |
| | 287,172 | | | Raven Industries Inc | | | 7,236,734 | | |
| | 55,700 | | | Snap-on Inc | | | 9,539,739 | | |
| | 120,700 | | | Tennant Co | | | 8,593,840 | | |
| | 41,600 | | | Toro Co/The | | | 2,327,520 | | |
| | | | 107,282,733 | | |
| | | INFORMATION TECHNOLOGY 10.5% | |
| | 298,710 | | | Badger Meter Inc | | | 11,037,334 | | |
| | 376,320 | | | Cray Inc (b) | | | 7,789,824 | | |
| | 150,000 | | | MOCON Inc | | | 2,925,000 | | |
| | 67,034 | | | NVE Corp | | | 4,788,239 | | |
| | 42,700 | | | SPS Commerce Inc (b) | | | 2,984,303 | | |
| | 173,500 | | | Stratasys Ltd (a) (b) | | | 2,869,690 | | |
| | 296,687 | | | VASCO Data Security International Inc (b) | | | 4,049,778 | | |
| | 254,490 | | | Workiva Inc (b) | | | 3,473,788 | | |
| | | | 39,917,956 | | |
| | | MATERIALS 7.7% | |
| | 253,700 | | | Bemis Co Inc | | | 12,131,934 | | |
| | 155,980 | | | Hawkins Inc | | | 8,415,121 | | |
| | 158,000 | | | HB Fuller Co | | | 7,632,980 | | |
| | 13,500 | | | Valspar Corp/The | | | 1,398,735 | | |
| | | | 29,578,770 | | |
| | | REAL ESTATE 4.5% | |
| | 140,706 | | | Agree Realty Corp | | | 6,479,511 | | |
| | 563,100 | | | Physicians Realty Trust | | | 10,676,376 | | |
| | | | 17,155,887 | | |
| | | UTILITIES 5.2% | |
| | 195,800 | | | ALLETE Inc | | | 12,568,402 | | |
| | 258,800 | | | MDU Resources Group Inc | | | 7,445,676 | | |
| | | | 20,014,078 | | |
| | | | TOTAL COMMON STOCKS
(cost $300,896,197) | | $ | 374,774,713 | | |
| | | SHORT-TERM INVESTMENTS 1.8% | |
| 6,732,472 | | | First American Government Obligations Fund, Class Z, 0.42% (c)
(cost $6,732,472) | | $ | 6,732,472 | | |
30
Mairs & Power Small Cap Fund
SCHEDULE OF INVESTMENTS (continued) December 31, 2016
Shares | | Security Description | | Fair Value | |
| | TOTAL INVESTMENTS 99.8%
(cost $307,628,669) | | $ | 381,507,185 | | |
| | | OTHER ASSETS AND LIABILITIES (NET) 0.2% | | | 935,784 | | |
| | | TOTAL NET ASSETS 100.0% | | $ | 382,442,969 | | |
(a) Foreign security denominated in U.S. dollars. As of December 31, 2016, these securities represented $2,869,690 or 0.8% of total net assets.
(b) Non-income producing.
(c) The rate quoted is the annualized seven-day effective yield as of December 31, 2016.
The Global Industry Classification Standard (GICS®) was developed by and/or is the exclusive property of MSCI, Inc. and Standard & Poor's Financial Services LLC ("S&P"). GICS is a service mark of MSCI, Inc. and S&P and has been licensed for use by the Adviser.
See accompanying Notes to Financial Statements.
31
STATEMENTS OF ASSETS AND LIABILITIES December 31, 2016
| | | Mairs & Power
Growth Fund | | Mairs & Power
Balanced Fund | | Mairs & Power
Small Cap Fund | |
ASSETS | |
| Investments, at fair value (Note 1): | |
Unaffiliated securities * | | $ | 4,312,513,916 | | | $ | 848,649,577 | | | $ | 381,507,185 | | |
| Affiliated securities (Note 5) * | | | 67,770,284 | | | | - | | | | - | | |
| | | | 4,380,284,200 | | | | 848,649,577 | | | | 381,507,185 | | |
Receivable for Fund shares sold | | | 10,051,489 | | | | 7,389,531 | | | | 2,224,313 | | |
Receivable for securities sold | | | 2,742,835 | | | | 2,589,121 | | | | 1,019,277 | | |
Dividends and interest receivable | | | 5,405,427 | | | | 3,873,298 | | | | 129,091 | | |
Prepaid expenses and other assets | | | 172,832 | | | | 56,028 | | | | 25,516 | | |
| | | | 4,398,656,783 | | | | 862,557,555 | | | | 384,905,382 | | |
LIABILITIES | |
Payable for Fund shares redeemed | | | 3,021,094 | | | | 268,995 | | | | 17,181 | | |
Payable for securities purchased | | | 526,201 | | | | 293,113 | | | | 2,087,347 | | |
| Accrued investment management fees (Note 2) | | | 2,044,051 | | | | 416,590 | | | | 282,331 | | |
| Accrued Fund administration fees (Note 2) | | | 143,906 | | | | 25,136 | | | | 5,822 | | |
Accrued audit and tax expense | | | 20,740 | | | | 18,740 | | | | 13,545 | | |
Accrued transfer agent fees | | | 206,191 | | | | 40,042 | | | | 20,695 | | |
Accrued Trustee fees | | | 26,975 | | | | 4,550 | | | | 975 | | |
Other accrued expenses | | | 195,035 | | | | 64,848 | | | | 34,517 | | |
| | | | 6,184,193 | | | | 1,132,014 | | | | 2,462,413 | | |
NET ASSETS | | $ | 4,392,472,590 | | | $ | 861,425,541 | | | $ | 382,442,969 | | |
NET ASSETS CONSIST OF | |
Portfolio capital | | $ | 2,446,799,671 | | | $ | 698,055,141 | | | $ | 305,092,364 | | |
Undistributed net investment income | | | 103,025 | | | | 10,414 | | | | 104,102 | | |
Undistributed net realized gain on investments | | | 29,704,366 | | | | 54,005 | | | | 3,367,987 | | |
Net unrealized appreciation on investments | | | 1,915,865,528 | | | | 163,305,981 | | | | 73,878,516 | | |
TOTAL NET ASSETS | | $ | 4,392,472,590 | | | $ | 861,425,541 | | | $ | 382,442,969 | | |
Fund shares, par value | | $ | 0.01 | | | $ | 0.01 | | | $ | 0.01 | | |
Authorized | | | unlimited | | | | unlimited | | | | unlimited | | |
Fund shares issued and outstanding | | | 38,588,968 | | | | 9,868,239 | | | | 15,718,456 | | |
Net asset value per share | | $ | 113.83 | | | $ | 87.29 | | | $ | 24.33 | | |
* Cost of investments | |
Cost of unaffiliated securities | | $ | 2,405,145,508 | | | $ | 685,343,596 | | | $ | 307,628,669 | | |
| Cost of affiliated securities (Note 5) | | | 59,273,164 | | | | - | | | | - | | |
| | | $ | 2,464,418,672 | | | $ | 685,343,596 | | | $ | 307,628,669 | | |
See accompanying Notes to Financial Statements.
32
STATEMENT OF OPERATIONS Year Ended December 31, 2016
| | | Mairs & Power
Growth Fund | | Mairs & Power
Balanced Fund | | Mairs & Power
Small Cap Fund | |
INVESTMENT INCOME | |
Income: | |
Dividends from unaffiliated securities * | | $ | 84,411,972 | | | $ | 12,577,159 | | | $ | 3,964,614 | | |
| Dividends from affiliated securities (Note 5) | | | 1,632,564 | | | | - | | | | - | | |
Interest income | | | 152,462 | | | | 10,655,740 | | | | 14,666 | | |
TOTAL INCOME | | | 86,196,998 | | | | 23,232,899 | | | | 3,979,280 | | |
Expenses: | |
| Investment management fees (Note 2) | | | 23,215,437 | | | | 4,508,143 | | | | 2,339,137 | | |
| Fund administration fees (Note 2) | | | 884,029 | | | | 154,192 | | | | 35,630 | | |
Fund accounting fees | | | 440,973 | | | | 150,490 | | | | 61,456 | | |
| Trustees' fees (Note 2) | | | 278,050 | | | | 46,900 | | | | 10,050 | | |
Transfer agent fees | | | 1,565,200 | | | | 331,311 | | | | 159,599 | | |
Custodian fees | | | 253,298 | | | | 48,156 | | | | 15,558 | | |
Legal and audit fees | | | 178,016 | | | | 79,257 | | | | 36,463 | | |
Printing and mailing fees | | | 162,743 | | | | 34,821 | | | | 20,013 | | |
Other fees | | | 204,264 | | | | 85,503 | | | | 55,387 | | |
TOTAL EXPENSES | | | 27,182,010 | | | | 5,438,773 | | | | 2,733,293 | | |
NET INVESTMENT INCOME | | | 59,014,988 | | | | 17,794,126 | | | | 1,245,987 | | |
| REALIZED AND UNREALIZED GAIN (LOSS) (Note 4) | |
Net realized gain on investments | |
Unaffiliated issuers | | | 219,160,559 | | | | 11,922,537 | | | | 8,795,727 | | |
| Affiliated issuers (Note 5) | | | 9,381,415 | | | | - | | | | - | | |
| | | | 228,541,974 | | | | 11,922,537 | | | | 8,795,727 | | |
Change in net unrealized appreciation
on investments | | | 293,729,932 | | | | 48,030,253 | | | | 55,509,050 | | |
NET GAIN ON INVESTMENTS | | | 522,271,906 | | | | 59,952,790 | | | | 64,304,777 | | |
NET INCREASE IN NET ASSETS FROM
OPERATIONS | | $ | 581,286,894 | | | $ | 77,746,916 | | | $ | 65,550,764 | | |
| | * Net of foreign taxes withheld of: | | | $ | 268,707 | | | $ | 46,566 | | | $ | - | | |
See accompanying Notes to Financial Statements.
33
Mairs & Power Growth Fund
STATEMENTS OF CHANGES IN NET ASSETS
| | | Year Ended December 31 | |
| | | 2016 | | 2015 | |
OPERATIONS | |
Net investment income | | $ | 59,014,988 | | | $ | 59,065,735 | | |
Net realized gain on investments sold | | | 228,541,974 | | | | 252,006,785 | | |
Net change in unrealized appreciation (depreciation) of investments | | | 293,729,932 | | | | (439,524,058 | ) | |
NET INCREASE (DECREASE) IN NET ASSETS FROM OPERATIONS | | | 581,286,894 | | | | (128,451,538 | ) | |
DISTRIBUTIONS TO SHAREHOLDERS FROM | |
Net investment income | | | (59,223,124 | ) | | | (58,959,603 | ) | |
Net realized gain on investments sold | | | (185,712,022 | ) | | | (228,500,497 | ) | |
TOTAL DISTRIBUTIONS TO SHAREHOLDERS | | | (244,935,146 | ) | | | (287,460,100 | ) | |
CAPITAL TRANSACTIONS | |
Proceeds from shares sold | | | 577,802,660 | | | | 331,027,955 | | |
Reinvestment of distributions from net investment income and net realized gains | | | 230,788,986 | | | | 270,332,473 | | |
Cost of shares redeemed | | | (589,735,067 | ) | | | (645,659,818 | ) | |
INCREASE (DECREASE) IN NET ASSETS FROM CAPITAL TRANSACTIONS | | | 218,856,579 | | | | (44,299,390 | ) | |
TOTAL INCREASE (DECREASE) IN NET ASSETS | | | 555,208,327 | | | | (460,211,028 | ) | |
NET ASSETS | |
Beginning of year | | | 3,837,264,263 | | | | 4,297,475,291 | | |
End of year (including undistributed net investment income
of $103,025 and $311,161, respectively) | | $ | 4,392,472,590 | | | $ | 3,837,264,263 | | |
FUND SHARE TRANSACTIONS | |
Shares sold | | | 5,121,591 | | | | 2,892,783 | | |
Shares issued for reinvested distributions | | | 2,024,148 | | | | 2,541,574 | | |
Shares redeemed | | | (5,296,639 | ) | | | (5,676,993 | ) | |
NET INCREASE (DECREASE) IN FUND SHARES | | | 1,849,100 | | | | (242,636 | ) | |
See accompanying Notes to Financial Statements.
34
Mairs & Power Balanced Fund
STATEMENTS OF CHANGES IN NET ASSETS
| | | Year Ended December 31 | |
| | | 2016 | | 2015 | |
OPERATIONS | |
Net investment income | | $ | 17,794,126 | | | $ | 17,755,547 | | |
Net realized gain on investments sold | | | 11,922,537 | | | | 12,964,451 | | |
Net change in unrealized appreciation (depreciation) of investments | | | 48,030,253 | | | | (48,688,684 | ) | |
NET INCREASE (DECREASE) IN NET ASSETS FROM OPERATIONS | | | 77,746,916 | | | | (17,968,686 | ) | |
DISTRIBUTIONS TO SHAREHOLDERS FROM | |
Net investment income | | | (17,835,606 | ) | | | (17,726,802 | ) | |
Net realized gain on investments sold | | | (10,422,947 | ) | | | (10,512,671 | ) | |
TOTAL DISTRIBUTIONS TO SHAREHOLDERS | | | (28,258,553 | ) | | | (28,239,473 | ) | |
CAPITAL TRANSACTIONS | |
Proceeds from shares sold | | | 246,503,157 | | | | 129,627,679 | | |
Reinvestment of distributions from net investment income and net realized gains | | | 27,374,812 | | | | 27,208,349 | | |
Cost of shares redeemed | | | (129,621,052 | ) | | | (165,811,060 | ) | |
INCREASE (DECREASE) IN NET ASSETS FROM CAPITAL TRANSACTIONS | | | 144,256,917 | | | | (8,975,032 | ) | |
TOTAL INCREASE (DECREASE) IN NET ASSETS | | | 193,745,280 | | | | (55,183,191 | ) | |
NET ASSETS | |
Beginning of year | | | 667,680,261 | | | | 722,863,452 | | |
End of year (including undistributed net investment income
of $10,414 and $51,894, respectively) | | $ | 861,425,541 | | | $ | 667,680,261 | | |
FUND SHARE TRANSACTIONS | |
Shares sold | | | 2,859,341 | | | | 1,515,184 | | |
Shares issued for reinvested distributions | | | 316,060 | | | | 329,306 | | |
Shares redeemed | | | (1,533,511 | ) | | | (1,947,368 | ) | |
NET INCREASE (DECREASE) IN FUND SHARES | | | 1,641,890 | | | | (102,878 | ) | |
See accompanying Notes to Financial Statements.
35
Mairs & Power Small Cap Fund
STATEMENTS OF CHANGES IN NET ASSETS
| | | Year Ended December 31 | |
| | | 2016 | | 2015 | |
OPERATIONS | |
Net investment income | | $ | 1,245,987 | | | $ | 818,141 | | |
Net realized gain on investments sold | | | 8,795,727 | | | | 3,703,249 | | |
Net change in unrealized appreciation (depreciation) of investments | | | 55,509,050 | | | | (14,284,540 | ) | |
NET INCREASE (DECREASE) IN NET ASSETS FROM OPERATIONS | | | 65,550,764 | | | | (9,763,150 | ) | |
DISTRIBUTIONS TO SHAREHOLDERS FROM | |
Net investment income | | | (1,192,986 | ) | | | (775,082 | ) | |
Net realized gain on investments sold | | | (5,933,906 | ) | | | (1,448,411 | ) | |
TOTAL DISTRIBUTIONS TO SHAREHOLDERS | | | (7,126,892 | ) | | | (2,223,493 | ) | |
CAPITAL TRANSACTIONS | |
Proceeds from shares sold | | | 166,097,410 | | | | 73,280,213 | | |
Reinvestment of distributions from net investment income and net realized gains | | | 6,817,946 | | | | 2,142,806 | | |
Cost of shares redeemed* | | | (42,733,307 | ) | | | (31,829,601 | ) | |
INCREASE IN NET ASSETS FROM CAPITAL TRANSACTIONS | | | 130,182,049 | | | | 43,593,418 | | |
TOTAL INCREASE IN NET ASSETS | | | 188,605,921 | | | | 31,606,775 | | |
NET ASSETS | |
Beginning of year | | | 193,837,048 | | | | 162,230,273 | | |
End of year (including undistributed net investment income
of $104,102 and $51,101, respectively) | | $ | 382,442,969 | | | $ | 193,837,048 | | |
FUND SHARE TRANSACTIONS | |
Shares sold | | | 7,497,583 | | | | 3,559,455 | | |
Shares issued for reinvested distributions | | | 279,653 | | | | 108,496 | | |
Shares redeemed | | | (2,008,979 | ) | | | (1,567,067 | ) | |
NET INCREASE IN FUND SHARES | | | 5,768,257 | | | | 2,100,884 | | |
| * Net of redemption fees of: | | $ | 55,910 | | | $ | 35,633 | | |
See accompanying Notes to Financial Statements.
36
NOTES TO FINANCIAL STATEMENTS December 31, 2016
Note 1 – Organization and Significant Accounting Policies
Mairs & Power Funds Trust (the Trust) is a no-load, diversified, open-end management investment company registered under the Investment Company Act of 1940, as amended (the 1940 Act). Mairs & Power Growth Fund (the Growth Fund), Mairs & Power Balanced Fund (the Balanced Fund) and Mairs & Power Small Cap Fund (the Small Cap Fund) (individually a Fund and collectively the Funds) are series within the Trust. Mairs & Power, Inc. (the Adviser) is the investment adviser of each Fund. The objective of the Growth Fund is to provide shareholders with a diversified portfolio of common stocks, which have the potential for above-average, long-term appreciation. The objective of the Balanced Fund is to provide capital growth, current income and preservation of capital. The objective of the Small Cap Fund is to seek above-average, long-term appreciation. Each Fund is an investment company and accordingly follows the investment company accounting and reporting guidance of the Financial Accounting Standards Board (FASB) Accounting Standard Codification Topic 946 "Financial Services – Investment Companies."
Significant accounting policies of the Funds are as follows:
Security Valuations
Security valuations for each Fund's investments are furnished by independent pricing services that have been approved by the Trust's Board of Trustees (the Board). Investments in listed equity securities are valued at the last quoted sale price on the securities exchange on which such securities are principally traded or at the NASDAQ Official Closing Price if readily available for such securities on each business day. Other equity securities traded in the over-the-counter market and listed equity securities for which no sale was reported on that date are valued at the last quoted bid price. Debt obligations exceeding 60 days to maturity are valued at the bid price furnished by an independent pricing service. Debt obligations with 60 days or less remaining until maturity may be valued at the bid price furnished by an independent pricing service and in certain circumstances may be valued at their amortized cost, which approximates fair value. Pricing service prices for debt obligations are based on various evaluative and matrix-based methodologies and models that use market inputs such as market transactions, dealer quotations, benchmark yields and issuer, industry and economic events. These techniques generally consider overall market conditions and such factors as yields or prices of bonds of comparable quality, type of issue, coupon, maturity and ratings.
Securities for which prices are not available from an independent pricing service, but where an active market exists, are valued using market quotations obtained from two or more dealers that make markets in the securities. When market quotations are not readily available, or when the last quoted sale price is not considered representative of the value of the security if it were to be sold on that day, the security will be valued at fair value as determined in good faith by the Fair Value Committee appointed by the Board, pursuant to procedures approved by the Board.
When determining the value of a security, the Fair Value Committee takes into consideration all indications of value that appear relevant under the particular circumstances as well as fundamental analytical data relating to the security, the nature and duration of any restrictions on the disposition of the security, and the forces influencing the market in which the security is purchased or sold in addition to other more specific factors that may be applied on a case-by-case basis. Consequently, the value of the security used by a Fund may differ from a quoted or published price for the same security. Fair value pricing involves subjective judgments and it is possible that the fair value determined for the security is materially different than the value that could be realized upon the sale of that security. As of December 31, 2016, no securities were valued using this method.
Fair Valuation Measurements
The Trust has adopted authoritative fair valuation accounting standards, which establish a definition of fair value and set out a hierarchy for measuring fair value. These standards require additional disclosures about the various
37
NOTES TO FINANCIAL STATEMENTS (continued) December 31, 2016
Note 1 – Organization and Significant Accounting Policies (continued)
Fair Valuation Measurements (continued)
inputs and valuation techniques used to develop the measurements of fair value and changes in valuation techniques and related inputs during the year. These inputs are summarized in the three broad levels listed below:
• Level 1 – Quoted prices in active markets for identical securities.
• Level 2 – Other significant observable inputs (including quoted prices for similar securities, interest rates, prepayment speeds, credit risk, etc.).
• Level 3 – Significant unobservable inputs (including the Funds' own assumptions in determining the fair value of investments).
The inputs or methodologies used for valuing securities are not necessarily an indication of the risk associated with investing in those securities. The following is a summary of the inputs used to value the securities held by each Fund as of December 31, 2016:
| | | Growth Fund | | Balanced Fund | | Small Cap Fund | |
Level 1* | | $ | 4,380,284,200 | | | $ | 567,206,825 | | | $ | 381,507,185 | | |
Level 2** | | | - | | | | 281,442,752 | | | | - | | |
Level 3 | | | - | | | | - | | | | - | | |
Total | | $ | 4,380,284,200 | | | $ | 848,649,577 | | | $ | 381,507,185 | | |
* All Level 1 investments are equity securities (common stocks and preferred securities) and short-term investments.
** All Level 2 investments are fixed income securities, excluding preferred securities.
For detail of securities by major sector classification for the Funds, please refer to the Schedules of Investments.
The Funds had no transfers among levels during the year and did not hold any Level 3 investments during the year ended December 31, 2016.
Security Transactions and Investment Income
Security transactions are recorded on the date on which securities are purchased or sold. Dividend income and corporate action transactions are recorded on the ex-dividend date. Interest income, including the accretion of discounts and amortization of premiums, is recorded on an accrual basis. Premiums and discounts are amortized using the effective interest method. Realized gains and losses are reported on an identified cost basis.
Income Taxes
Each Fund is a "regulated investment company" as defined in Subtitle A, Chapter 1, Subchapter M of the Internal Revenue Code of 1986, as amended (the Code). No provisions have been made for federal income taxes as it is the intention of each Fund to comply with the provisions of the Code applicable to regulated investment companies and to make distributions of income and realized gains sufficient to relieve it from all or substantially all excise and income taxes.
As of December 31, 2016, the Trust did not have any tax positions that did not meet the "more-likely-than-not" threshold of being sustained by the applicable tax authority. Generally, tax authorities can examine all tax returns filed for the last three years.
As of December 31, 2016, none of the Funds had capital loss carryforwards nor did they have any qualified late year losses for federal tax purposes.
38
NOTES TO FINANCIAL STATEMENTS (continued) December 31, 2016
Note 1 – Organization and Significant Accounting Policies (continued)
Basis of Presentation
The preparation of financial statements in conformity with U.S. generally accepted accounting principles (GAAP) requires management to make estimates and assumptions that affect the reported amount of net assets and liabilities and disclosure of contingent assets and liabilities at the date of the financial statements and the reported results of operations during the reporting period. Actual results could differ from those estimates.
In preparing these financial statements, the Funds have evaluated events and transactions for potential recognition or disclosure through the date the financial statements were available to be issued. On August 1, 2016, the Trust submitted a request for a Private Letter Ruling to the Internal Revenue Service (IRS) on behalf of the Growth Fund and Balanced Fund requesting a change to the Funds' excise tax year-end from December 31 to October 31, effective for the fiscal year ended December 31, 2016. The Funds received a favorable ruling on November 18, 2016.
Expense Allocation
Common expenses incurred by the Trust are allocated among the Funds based on their relative net assets. Fund specific expenses are charged directly to the Fund that incurred the expense.
New Accounting Pronouncement
Investment Company Reporting Modernization. Effective October 13, 2016, the U.S. Securities and Exchange Commission (SEC) approved a final rule, Investment Company Reporting Modernization. The SEC adopted new rules and forms as well as amendments to its rules and forms to modernize the reporting and disclosure of information by registered investment companies. The new rules and forms will be effective beginning in 2018. At this time, management is evaluating the implications of these changes on the financial statements.
Note 2 – Related-Party Transactions
Investment Management and Fund Administration Fees
The Adviser provides investment management services to the Funds under a written agreement (the Management Agreement) approved by the Board. Pursuant to the Management Agreement, the Adviser is paid a monthly fee on average daily net assets at the following annual rates:
| | | Growth Fund | | Balanced Fund | | Small Cap Fund | |
Up to $2.5 Billion | | | 0.60 | % | | | 0.60 | % | | | 0.90 | % | |
Over $2.5 Billion | | | 0.50 | % | | | 0.60 | % | | | 0.90 | % | |
The Adviser provides fund administration services to the Funds under a written fund administration servicing agreement approved by the Board. The fund administrator performs general fund management which includes liaison to and oversight of Fund service providers, coordinates Board activities and shareholder meetings and assists in updating and monitoring Fund compliance and financial and tax reporting. The fund administration fee paid to the Adviser is computed at an annual rate of 0.00281% of average daily net assets. Fund administration fees incurred for the year ended December 31, 2016 and fund administration fees payable to the Adviser as of December 31, 2016 were as follows:
| | | Growth Fund | | Balanced Fund | | Small Cap Fund | |
Fund administration fees incurred | | $ | 116,421 | | | $ | 21,113 | | | $ | 7,303 | | |
Fund administration fees payable | | | 10,528 | | | | 2,021 | | | | 900 | | |
Pursuant to a sub-administration agreement between the Funds and U.S. Bancorp Fund Services, LLC (USBFS), the Funds are charged a sub-administration fee paid to USBFS. The sub-administrator prepares performance reporting,
39
NOTES TO FINANCIAL STATEMENTS (continued) December 31, 2016
Note 2 – Related-Party Transactions (continued)
financial reporting, tax reporting, and compliance and regulatory reporting. Sub-administration fees from USBFS incurred for the year ended December 31, 2016 and sub-administration fees payable to USBFS as of December 31, 2016 were as follows:
| | | Growth Fund | | Balanced Fund | | Small Cap Fund | |
Sub-administration fees paid | | $ | 767,608 | | | $ | 133,079 | | | $ | 28,327 | | |
Sub-administration fees payable | | | 133,378 | | | | 23,115 | | | | 4,922 | | |
Trustees' Fees
The Funds pay compensation to the disinterested Trustees of the Trust. The Funds do not pay remuneration to officers or to Trustees who are officers, directors or employees of the Adviser.
Note 3 – Indemnifications
In the normal course of business, the Trust enters into contracts that contain general indemnifications to other parties. The Trust's maximum exposure under these contracts is unknown as this would involve future claims that may be made against the Trust that have not yet occurred. The Trust expects the risk of loss to be remote.
Note 4 – Distributions Paid, Distributable Earnings and Investment Transactions
Net investment income and net realized capital gains (losses) may differ for financial reporting and tax purposes because of temporary or permanent book/tax differences.
In addition, GAAP requires that certain components of net assets relating to permanent differences be reclassified between financial and tax reporting. The permanent differences primarily relate to utilization of earnings and profits distributed to shareholders on redemption of shares. These reclassifications have no effect on net assets or net asset value per share. On the Statement of Assets and Liabilities, the following reclassifications were made for the year ended December 31, 2016:
| | | Undistributed
Net Investment
Income | | Undistributed
Net Realized
Gain (Loss) | | Paid in Capital | |
Growth Fund | | $ | - | | | $ | (15,349,509 | ) | | $ | 15,349,509 | | |
Balanced Fund | | | - | | | | (1,445,169 | ) | | | 1,445,169 | | |
Small Cap Fund | | | - | | | | (648,932 | ) | | | 648,932 | | |
Distributions to shareholders are determined in accordance with income tax regulations that may differ from GAAP, and due to the timing of the distributions, the fiscal year in which the amounts are distributed may differ from the year that the income or realized gains (losses) were recorded by each Fund.
The tax character of distributions paid during the years ended December 31, 2016 and December 31, 2015, were as follows:
Year ended December 31, 2016 | |
Distributions paid from: | | Growth Fund | | Balanced Fund | | Small Cap Fund | |
Ordinary income | | $ | 59,223,124 | | | $ | 17,835,606 | | | $ | 1,192,986 | | |
Long-term capital gains | | | 185,712,022 | | | | 10,422,947 | | | | 5,933,906 | | |
Total distributions paid | | $ | 244,935,146 | | | $ | 28,258,553 | | | $ | 7,126,892 | | |
40
NOTES TO FINANCIAL STATEMENTS (continued) December 31, 2016
Note 4 – Distributions Paid, Distributable Earnings and Investment Transactions (continued)
Year ended December 31, 2015 | |
Distributions paid from: | | Growth Fund | | Balanced Fund | | Small Cap Fund | |
Ordinary income | | $ | 58,959,603 | | | $ | 17,726,802 | | | $ | 775,082 | | |
Long-term capital gains | | | 228,500,497 | | | | 10,512,671 | | | | 1,448,411 | | |
Total distributions paid | | $ | 287,460,100 | | | $ | 28,239,473 | | | $ | 2,223,493 | | |
Ordinary income distributions include net short-term capital gains. The Funds are designating as long-term capital gain dividends, pursuant to Internal Revenue Code Section 852(b)(3), the amount necessary to reduce the earnings and profits of the Funds related to net capital gain to zero. To the extent necessary to fully distribute such capital gain, the Funds also designate earnings and profits distributed to shareholders on the redemption of shares.
At December 31, 2016, the components of accumulated earnings (losses) on a tax basis were as follows:
| | | Growth Fund | | Balanced Fund | | Small Cap Fund | |
Cost of investments | | $ | 2,465,213,288 | | | $ | 685,344,988 | | | $ | 308,256,590 | | |
Gross unrealized appreciation | | $ | 2,000,238,014 | | | $ | 174,864,498 | | | $ | 83,613,352 | | |
Gross unrealized depreciation | | $ | (85,167,102 | ) | | $ | (11,559,909 | ) | | $ | (10,362,757 | ) | |
Net unrealized appreciation | | $ | 1,915,070,912 | | | $ | 163,304,589 | | | $ | 73,250,595 | | |
Undistributed ordinary income | | $ | 103,025 | | | $ | 10,414 | | | $ | 104,102 | | |
Undistributed long-term capital gains | | $ | 30,498,982 | | | $ | 55,397 | | | $ | 3,995,908 | | |
Total distributable earnings | | $ | 30,602,007 | | | $ | 65,811 | | | $ | 4,100,010 | | |
Other accumulated earnings | | | - | | | | - | | | | - | | |
Total accumulated earnings | | $ | 1,945,672,919 | | | $ | 163,370,400 | | | $ | 77,350,605 | | |
The difference between book basis and tax basis unrealized appreciation is attributable primarily to the tax deferral of losses on wash sales.
Purchases and sales of investment securities, excluding government securities, short-term securities and temporary cash investments, during the year ended December 31, 2016 were as follows:
| | | Purchases | | Sales | |
Growth Fund | | $ | 492,661,768 | | | $ | 449,562,605 | | |
Balanced Fund | | | 226,273,732 | | | | 103,095,782 | | |
Small Cap Fund | | | 175,531,995 | | | | 54,904,036 | | |
Purchases and sales of government securities during the year ended December 31, 2016 were as follows:
| | | Purchases | | Sales | |
Growth Fund | | $ | - | | | $ | - | | |
Balanced Fund | | | 3,357,143 | | | | 19,239,143 | | |
Small Cap Fund | | | - | | | | - | | |
41
NOTES TO FINANCIAL STATEMENTS (unaudited) (continued) December 31, 2016
Note 5 – Transactions With Affiliated Companies
The Growth Fund owned 5% or more of the voting securities of the following companies during the year ended December 31, 2016. As a result, these companies are deemed to be affiliates of the Growth Fund as defined by the 1940 Act. Transactions during the year in these securities of affiliated companies were as follows:
Growth Fund
| | | Share Activity | | | | | |
Security Name | | Balance
12/31/15 | | Purchases | | Sales | | Balance
12/31/16 | | Dividend
Income | | Fair Value at
12/31/16 | |
Cray Inc | | | 1,710,000 | | | | 670,000 | | | | 310,000 | | | | 2,070,000 | | | $ | - | | | $ | 42,849,000 | | |
MTS Systems Corp (1) | | | 982,849 | | | | - | | | | 982,849 | | | | - | | | | 237,000 | | | | - | | |
NVE Corp | | | 348,891 | | | | - | | | | - | | | | 348,891 | | | | 1,395,564 | | | | 24,921,284 | | |
| | | | | | | | | | | $ | 1,632,564 | | | $ | 67,770,284 | | |
(1) Issuer was not an affiliate as of December 31, 2016 due to sales during the year. Dividend income is for the period in 2016 that the company was deemed an affiliate.
42
Mairs & Power Growth Fund
FINANCIAL HIGHLIGHTS
SELECTED DATA AND RATIOS
(for a share outstanding throughout each year)
| | | Year Ended December 31, | |
| | | 2016 | | 2015 | | 2014 | | 2013 | | 2012 | |
Per Share | |
Net asset value, beginning of year | | $ | 104.44 | | | $ | 116.20 | | | $ | 111.09 | | | $ | 83.95 | | | $ | 70.78 | | |
Income from investment operations: | |
Net investment income | | | 1.61 | | | | 1.68 | | | | 1.54 | | | | 1.23 | | | | 1.33 | | |
Net realized and unrealized gain (loss) | | | 14.43 | | | | (5.17 | ) | | | 7.48 | | | | 28.58 | | | | 14.08 | | |
Total from investment operations | | | 16.04 | | | | (3.49 | ) | | | 9.02 | | | | 29.81 | | | | 15.41 | | |
Distributions to shareholders from: | |
Net investment income | | | (1.61 | ) | | | (1.67 | ) | | | (1.53 | ) | | | (1.23 | ) | | | (1.34 | ) | |
Net realized gains on investments sold | | | (5.04 | ) | | | (6.60 | ) | | | (2.38 | ) | | | (1.44 | ) | | | (0.90 | ) | |
Total distributions | | | (6.65 | ) | | | (8.27 | ) | | | (3.91 | ) | | | (2.67 | ) | | | (2.24 | ) | |
Net asset value, end of year | | $ | 113.83 | | | $ | 104.44 | | | $ | 116.20 | | | $ | 111.09 | | | $ | 83.95 | | |
Total investment return | | | 15.38 | % | | | (3.07 | )% | | | 8.12 | % | | | 35.64 | % | | | 21.91 | % | |
Net assets, end of year, in thousands | | $ | 4,392,473 | | | $ | 3,837,264 | | | $ | 4,297,475 | | | $ | 3,964,530 | | | $ | 2,498,207 | | |
Ratios/supplemental data: | |
Ratio of expenses to average net assets | | | 0.66 | % | | | 0.65 | % | | | 0.65 | % | | | 0.67 | % | | | 0.70 | % | |
Ratio of net investment income to average net assets | | | 1.42 | | | | 1.43 | | | | 1.36 | | | | 1.27 | | | | 1.69 | | |
Portfolio turnover rate | | | 10.99 | | | | 9.64 | | | | 6.42 | | | | 3.79 | | | | 1.58 | | |
See accompanying Notes to Financial Statements.
43
Mairs & Power Balanced Fund
FINANCIAL HIGHLIGHTS
SELECTED DATA AND RATIOS
(for a share outstanding throughout each year)
| | | Year Ended December 31, | |
| | | 2016 | | 2015 | | 2014 | | 2013 | | 2012 | |
Per Share | |
Net asset value, beginning of year | | $ | 81.16 | | | $ | 86.79 | | | $ | 82.31 | | | $ | 70.83 | | | $ | 62.15 | | |
Income from investment operations: | |
Net investment income | | | 1.99 | | | | 2.14 | | | | 1.98 | | | | 1.79 | | | | 1.89 | | |
Net realized and unrealized gain (loss) | | | 7.21 | | | | (4.34 | ) | | | 4.59 | | | | 11.58 | | | | 8.79 | | |
Total from investment operations | | | 9.20 | | | | (2.20 | ) | | | 6.57 | | | | 13.37 | | | | 10.68 | | |
Distributions to shareholders from: | |
Net investment income | | | (1.99 | ) | | | (2.13 | ) | | | (2.00 | ) | | | (1.78 | ) | | | (1.91 | ) | |
Net realized gains on investments sold | | | (1.08 | ) | | | (1.30 | ) | | | (0.09 | ) | | | (0.11 | ) | | | (0.09 | ) | |
Total distributions | | | (3.07 | ) | | | (3.43 | ) | | | (2.09 | ) | | | (1.89 | ) | | | (2.00 | ) | |
Net asset value, end of year | | $ | 87.29 | | | $ | 81.16 | | | $ | 86.79 | | | $ | 82.31 | | | $ | 70.83 | | |
Total investment return | | | 11.42 | % | | | (2.54 | )% | | | 8.04 | % | | | 19.02 | % | | | 17.34 | % | |
Net assets, end of year, in thousands | | $ | 861,426 | | | $ | 667,680 | | | $ | 722,863 | | | $ | 564,315 | | | $ | 286,910 | | |
Ratios/supplemental data: | |
Ratio of expenses to average net assets | | | 0.72 | % | | | 0.73 | % | | | 0.72 | % | | | 0.72 | % | | | 0.74 | % | |
Ratio of net investment income to average net assets | | | 2.37 | | | | 2.49 | | | | 2.39 | | | | 2.43 | | | | 2.94 | | |
Portfolio turnover rate | | | 14.10 | | | | 14.05 | | | | 4.53 | | | | 3.02 | | | | 5.46 | | |
See accompanying Notes to Financial Statements.
44
Mairs & Power Small Cap Fund
FINANCIAL HIGHLIGHTS
SELECTED DATA AND RATIOS
(for a share outstanding throughout each year)
| | | Year Ended December 31, | |
| | | 2016 | | 2015 | | 2014 | | 2013 | | 2012 | |
Per Share | |
Net asset value, beginning of year | | $ | 19.48 | | | $ | 20.67 | | | $ | 19.78 | | | $ | 14.49 | | | $ | 11.21 | | |
Income from investment operations: | |
Net investment income | | | 0.08 | | | | 0.08 | | | | 0.08 | | | | 0.06 | | | | 0.01 | | |
Net realized and unrealized gain (loss) | | | 5.24 | | | | (1.04 | ) | | | 1.25 | | | | 5.56 | | | | 3.42 | | |
Total from investment operations | | | 5.32 | | | | (0.96 | ) | | | 1.33 | | | | 5.62 | | | | 3.43 | | |
Distributions to shareholders from: | |
Net investment income | | | (0.08 | ) | | | (0.08 | ) | | | (0.07 | ) | | | (0.06 | ) | | | (0.02 | ) | |
Net realized gains on investments sold | | | (0.39 | ) | | | (0.15 | ) | | | (0.37 | ) | | | (0.27 | ) | | | (0.13 | ) | |
Redemption fees (1) | | | (0.00 | )(2) | | | (0.00 | )(2) | | | (0.00 | )(2) | | | (0.00 | )(2) | | | - | | |
Total distributions | | | (0.47 | ) | | | (0.23 | ) | | | (0.44 | ) | | | (0.33 | ) | | | (0.15 | ) | |
Net asset value, end of year | | $ | 24.33 | | | $ | 19.48 | | | $ | 20.67 | | | $ | 19.78 | | | $ | 14.49 | | |
Total investment return | | | 27.27 | % | | | (4.68 | )% | | | 6.73 | % | | | 38.75 | % | | | 30.60 | % | |
Net assets, end of year, in thousands | | $ | 382,443 | | | $ | 193,837 | | | $ | 162,230 | | | $ | 111,486 | | | $ | 41,644 | | |
Ratios/supplemental data: | |
Ratio of expenses to average net assets | |
Before expense reimbursement (3) | | | 1.05 | % | | | 1.06 | % | | | 1.07 | % | | | 1.17 | % | | | 1.73 | % | |
After expense reimbursement (3) | | | 1.05 | | | | 1.06 | | | | 1.07 | | | | 1.17 | | | | 1.25 | | |
Ratio of net investment income to average net assets | |
Before expense reimbursement (3) | | | 0.48 | % | | | 0.43 | % | | | 0.43 | % | | | 0.37 | % | | | (0.14 | )% | |
After expense reimbursement (3) | | | 0.48 | | | | 0.43 | | | | 0.43 | | | | 0.37 | | | | 0.34 | | |
Portfolio turnover rate | | | 21.26 | | | | 23.27 | | | | 15.85 | | | | 34.91 | | | | 6.93 | | |
(1) The Fund charges a 1.00% redemption fee on shares held 180 days or less.
(2) Amount per share is less than $0.005.
(3) The Adviser agreed to waive the Small Cap Fund's investment management and fund administration fees and reimburse expenses to the extent necessary to prevent total annual fund operating expenses (excluding interest, taxes, brokerage commissions, acquired fund fees and expenses (which are indirect fees and expenses that funds incur from investing in the shares of other mutual funds, such as money market funds), other investment-related costs and other extraordinary expenses, such as litigation and other expenses not incurred in the ordinary course of the Small Cap Fund's business) from exceeding 1.25% of daily net assets through April 30, 2015. The arrangement terminated on April 30, 2015.
See accompanying Notes to Financial Statements.
45
REPORT OF INDEPENDENT REGISTERED PUBLIC ACCOUNTING FIRM
The Board of Trustees and Shareholders of
Mairs & Power Funds Trust
We have audited the accompanying statements of assets and liabilities, including the schedules of investments, of Mairs & Power Funds Trust (the Trust) (comprising, respectively, Mairs & Power Growth Fund, Mairs & Power Balanced Fund, and Mairs & Power Small Cap Fund), as of December 31, 2016, and the related statements of operations for the year then ended, the statements of changes in net assets for each of the two years in the period then ended, and the financial highlights for each of the five years in the period then ended. These financial statements and financial highlights are the responsibility of the Trust's management. Our responsibility is to express an opinion on these financial statements and financial highlights based on our audits.
We conducted our audits in accordance with the standards of the Public Company Accounting Oversight Board (United States). Those standards require that we plan and perform the audit to obtain reasonable assurance about whether the financial statements and financial highlights are free of material misstatement. We were not engaged to perform an audit of the Trust's internal control over financial reporting. Our audits included consideration of internal control over financial reporting as a basis for designing audit procedures that are appropriate in the circumstances, but not for the purpose of expressing an opinion on the effectiveness of the Trust's internal control over financial reporting. Accordingly, we express no such opinion. An audit also includes examining, on a test basis, evidence supporting the amounts and disclosures in the financial statements and financial highlights, assessing the accounting principles used and significant estimates made by management, and evaluating the overall financial statement presentation. Our procedures included confirmation of securities owned as of December 31, 2016, by correspondence with the custodian and brokers or by other appropriate auditing procedures where replies from brokers were not received. We believe that our audits provide a reasonable basis for our opinion.
In our opinion, the financial statements and financial highlights referred to above present fairly, in all material respects, the financial position of each of the respective funds constituting the Mairs & Power Funds Trust at December 31, 2016, the results of their operations for the year then ended, the changes in their net assets for each of the two years in the period then ended, and the financial highlights for each of the five years in the period then ended, in conformity with U.S. generally accepted accounting principles.

Minneapolis, Minnesota
February 22, 2017
46
FUND EXPENSES (unaudited)
As a shareholder of the Funds, you incur two types of costs: (1) transaction costs including redemption fees and (2) ongoing expenses for the operation of the Funds (e.g., asset-based charges, such as investment management fees). The Funds are "no-load" mutual funds. As a result, shareholders pay no commissions, fees, or expenses associated with sales representatives or sales charges.
This example is intended to help you understand your ongoing costs (in dollars) of investing in the Funds and to compare these costs with the ongoing costs of investing in other mutual funds. The table below reports the Funds' expenses during the period July 1, 2016 through December 31, 2016 and includes the costs associated with a $1,000 investment.
Actual Expenses
The first line in the tables below may be used to estimate the actual expenses you paid over the reporting period. You can do this by dividing your account value by $1,000 and multiplying the result by the expense shown in the table below. For example, if your account value is $8,600, divided by $1,000 = $8.60. Multiply the result by the number in the first line under the heading entitled "Expenses Paid During Period." By doing this you can estimate the expenses you paid on your account during this period.
Hypothetical Example
The second line of the tables below provides information about hypothetical account values and hypothetical expenses based on the Funds' actual expenses and assumed returns of 5% per year before expenses, which are not the Funds' actual returns. The results may be used to provide you with a basis for comparing the ongoing costs of investing in the Funds with the ongoing costs of investing in other funds. To do so, compare these 5% hypothetical examples with the 5% hypothetical examples that appear in the shareholder reports of other funds. Please note that these hypothetical examples highlight ongoing costs only. They may not be used to estimate the actual ending account balances or expenses you paid during the period and will not help you determine the relative total costs of owning different funds.
Mairs & Power Growth Fund
| | | Beginning Account
Value 07/01/2016 | | Ending Account
Value 12/31/2016 | | Expenses Paid
During Period * | |
Actual return | | $ | 1,000.00 | | | $ | 1,039.10 | | | $ | 3.33 | | |
Hypothetical assumed 5% return | | $ | 1,000.00 | | | $ | 1,021.87 | | | $ | 3.30 | | |
* The Fund's expenses are equal to the Fund's annualized expense ratio for the most recent six-month period of 0.65%, multiplied by the average account value over the Fund's second fiscal half-year, multiplied by the number of days in the Fund's second fiscal half-year (184 days), divided by 366 days.
Mairs & Power Balanced Fund
| | | Beginning Account
Value 07/01/2016 | | Ending Account
Value 12/31/2016 | | Expenses Paid
During Period ** | |
Actual return | | $ | 1,000.00 | | | $ | 1,028.30 | | | $ | 3.67 | | |
Hypothetical assumed 5% return | | $ | 1,000.00 | | | $ | 1,021.52 | | | $ | 3.66 | | |
** The Fund's expenses are equal to the Fund's annualized expense ratio for the most recent six-month period of 0.72%, multiplied by the average account value over the Fund's second fiscal half-year, multiplied by the number of days in the Fund's second fiscal half-year (184 days), divided by 366 days.
47
FUND EXPENSES (unaudited) (continued)
Mairs & Power Small Cap Fund
| | | Beginning Account
Value 07/01/2016 | | Ending Account
Value 12/31/2016 | | Expenses Paid
During Period *** | |
Actual return | | $ | 1,000.00 | | | $ | 1,137.80 | | | $ | 5.59 | | |
Hypothetical assumed 5% return | | $ | 1,000.00 | | | $ | 1,019.91 | | | $ | 5.28 | | |
*** The Fund's expenses are equal to the Fund's annualized expense ratio for the most recent six-month period of 1.04%, multiplied by the average account value over the Fund's second fiscal half-year, multiplied by the number of days in the Fund's second fiscal half-year (184 days), divided by 366 days.
48
Proxy Voting Policies and Procedures that the Trust uses to determine how to vote proxies relating to portfolio securities are available (i) without charge, upon request, by calling Shareholder Services at (800) 304-7404 and requesting a copy of the Statement of Additional Information (SAI) and (ii) on the Securities and Exchange Commission's (SEC's) website at www.sec.gov (access Form N-1A).
Information on how the Trust voted proxies relating to portfolio securities during the most recent 12-month period ended June 30 is available at www.mairsandpower.com and on the SEC's website at www.sec.gov.
DISCLOSURE OF PORTFOLIO HOLDINGS (unaudited)
The Trust files a complete schedule of portfolio holdings on Form N-Q for the first and third quarter-ends and on Form N-CSR for the second and fourth quarter-ends with the SEC. The Trust's Forms N-Q and N-CSR are available on the SEC's website at www.sec.gov. Forms N-Q and N-CSR may also be reviewed and copied at the SEC's Public Reference Room in Washington, D.C. Information on the operation of the Public Reference Room may be obtained by calling (800) SEC-0330.
The schedule of portfolio holdings is also printed in the Trust's semi-annual and annual reports to shareholders, which are available without charge by calling Shareholder Services at (800) 304-7404 or by visiting www.mairsandpower.com.
A complete copy of the Trust's portfolio holdings will also be available on or about 15 days following each quarter-end on the Fund's website at www.mairsandpower.com.
HOUSEHOLDING (unaudited)
In an effort to decrease costs, the Trust intends to reduce the number of duplicate Summary Prospectuses and Annual and Semi-Annual Reports you receive by sending only one copy of each to those addresses shared by two or more accounts and to shareholders reasonably believed to be from the same family or household. Once implemented, if you would like to discontinue householding for your accounts, please call Shareholder Services at (800) 304-7404 to request individual copies of these documents. Once notification to stop householding is received, the Trust will begin sending individual copies thirty days after receiving your request. This policy does not apply to account statements.
49
PRIVACY POLICY NOTICE (unaudited)
Our Promise to You
As a shareholder of the Mairs & Power Mutual Funds (Funds), you share both personal and financial information with us. Your privacy is important to us, and we are dedicated to safeguarding your personal and financial information.
Information Provided by Shareholders
In the normal course of doing business, we typically obtain the following non-public personal information about our shareholders:
• Personal information regarding our shareholders' identity such as name, address and social security number;
• Information regarding fund transactions effected by us; and
• Shareholder financial information such as net-worth, assets, income, bank account information and account balances.
How We Manage and Protect Your Personal Information
We do not sell information about current or former shareholders to third parties, nor is it our practice to disclose such information to third parties unless requested or permitted to do so by a shareholder or shareholder representative or, if necessary, in order to process a transaction, service an account or as permitted by law. Additionally, we may share information with outside companies that perform administrative services for us. However, our arrangements with these service providers require them to treat your information as confidential.
In order to protect your personal information, we maintain physical, electronic and procedural safeguards to protect your personal information. Our Privacy Policy restricts the use of shareholder information and requires that it be held in strict confidence.
Shareholder Notifications
We are required by law to annually provide a notice describing our privacy policy. In addition, we will inform you promptly if there are changes to our policy. Please contact us at (800) 304-7404 with questions about this notice.
OTHER INFORMATION (unaudited)
This report is submitted for the general information of the shareholders of the Funds. It is not authorized for distribution to prospective investors unless accompanied or preceded by an effective prospectus. An investor should consider the Funds' investment objectives, risks and expenses carefully before investing or sending money. This and other important information can be found in the Funds' summary prospectuses and full prospectus. To obtain a prospectus, please call Shareholder Services at (800) 304-7404 or visit the Funds' website at www.mairsandpower.com. Please read the prospectus carefully before investing.
This report includes forward-looking statements such as economic predictions and portfolio manager opinions. The statements are subject to change at any time based on market and other conditions. No predictions, forecasts, outlooks, expectations or beliefs are guaranteed.
50
TRUSTEES AND OFFICERS (unaudited) December 31, 2016
Information pertaining to the Trustees and Officers of the Trust is set forth below. The Statement of Additional Information includes additional information about the Trust's Trustees and is available without charge, upon request, by calling Shareholder Services at (800) 304-7404.
Name (Year of Birth)
and Address1 | | Position(s)
Held with the
Trust and
Length of
Time Served2 | | Principal Occupation(s)
During Past Five Years | | Number of
Portfolios
in Fund
Complex
Overseen by
Trustee | | Other
Directorships Held
by Trustee During
Past Five Years | |
PRINCIPAL OFFICER WHO IS AN INTERESTED TRUSTEE | |
Jon A. Theobald (1945) | | Secretary since 2003; Chief Compliance Officer from 2004 to 2012; Trustee since December 2012 | | • Chairman of the Board of the Investment Adviser (January 2015 to present).
• Chief Executive Officer of the Investment Adviser (2012 to present).
• President of the Investment Adviser (2007 to 2014).
• Chief Operating Officer of the Investment Adviser (2007 to 2012).
• Chief Compliance Officer of the Investment Adviser (2004 to 2012). | | 3 | | None | |
PRINCIPAL OFFICERS WHO ARE NOT TRUSTEES | |
Mark L. Henneman (1961) | | President since December 31, 2014; Vice President from 2009 to 2014 | | • President of the Investment Adviser (January 2015 to present).
• Chief Investment Officer of the Investment Adviser (January 2015 to present).
• Executive Vice President of the Investment Adviser (2012 to 2014).
• Vice President of the Investment Adviser (2004 to 2012). | | N/A | | N/A | |
Ronald L. Kaliebe (1952) | | Vice President since 2009 | | • Senior Vice President of the Investment Adviser (January 2015 to present).
• Director of Fixed Income of the Investment Adviser (January 2015 to present).
• Vice President of the Investment Adviser (2001 to 2014). | | N/A | | N/A | |
Andrew R. Adams (1972) | | Vice President since 2011 | | • Executive Vice President of the Investment Adviser (October 2016 to present).
• Vice President of the Investment Adviser (2006 to October 2016). | | N/A | | N/A | |
Andrea C. Stimmel (1967) | | Treasurer since 2011; Chief Compliance Officer from 2012 to 2016 | | • Director of Operations and Treasurer of the Investment Adviser (2008 to present).
• Chief Compliance Officer of the Investment Adviser (2012 to 2016). | | N/A | | N/A | |
51
TRUSTEES AND OFFICERS (unaudited) (continued) December 31, 2016
Name (Year of Birth)
and Address1 | | Position(s)
Held with the
Trust and
Length of
Time Served2 | | Principal Occupation(s)
During Past Five Years | | Number of
Portfolios
in Fund
Complex
Overseen by
Trustee | | Other
Directorships Held
by Trustee During
Past Five Years | |
PRINCIPAL OFFICERS WHO ARE NOT TRUSTEES (continued) | |
Robert W. Mairs (1969) | | Chief Compliance Officer and Anti-Money Laundering Compliance Officer since 2017; Assistant Chief Compliance Officer from September 2016 to December 2016 | | • Chief Compliance Officer of the Investment Adviser (January 2017 to present).
• Assistant Chief Compliance Officer of the Investment Adviser (September 2016 to December 2016).
• General Counsel of the Investment Adviser (2015 to present).
• Shareholder and Attorney, Gray Plant Mooty (1999 to 2015). | | N/A | | N/A | |
Collyn E. Iblings (1978) | | Assistant Treasurer since September 2016 | | • Assistant Treasurer of the Investment Adviser (September 2016 to present).
• Mutual Fund Administration Services Manager (2015 to present).
• Assistant Vice President, Finance, and Compliance Manager (2014 to present).
• Accounting Manager (2011 to 2014). | | N/A | | N/A | |
DISINTERESTED TRUSTEES | |
Norbert J. Conzemius3 (1941) | | Trustee from 2000 to 2016; Board Chair from February 2006 to December 2014; Nominating and Governance Committee Chair from 2006 to 2016 | | • Retired Chief Executive Officer, Road Rescue Incorporated. | | 3 | | None | |
52
TRUSTEES AND OFFICERS (unaudited) (continued) December 31, 2016
Name (Year of Birth)
and Address1 | | Position(s)
Held with the
Trust and
Length of
Time Served2 | | Principal Occupation(s)
During Past Five Years | | Number of
Portfolios
in Fund
Complex
Overseen by
Trustee | | Other
Directorships Held
by Trustee During
Past Five Years | |
DISINTERESTED TRUSTEES (continued) | |
Mary Schmid Daugherty (1958) | | Trustee since December 2010; Audit Committee Chair since December 2012 | | • Associate Professor, Department of Finance, University of St. Thomas (1987 to present). | | 3 | | None | |
Bert J. McKasy (1942) | | Trustee since September 2006; Board Chair since December 2014 | | • Attorney, Lindquist & Vennum, P.L.L.P. (1994 to present). | | 3 | | None | |
James D. Alt (1951) | | Trustee since April 2015; Nominating and Governance Committee Chair since January 2017 | | • Adjunct Associate Professor, University of Minnesota Law School (2007 to present); Retired Partner, Dorsey & Whitney LLP4 (1984 to 2012). | | 3 | | None | |
Patrick A. Thiele (1950) | | Trustee since April 2015 | | • Retired Chief Executive Officer, PartnerRe Ltd. (2000 to 2010). | | 3 | | Director, OneBeacon Insurance Group, Ltd. (2014 to present); Director, PartnerRE Ltd. (March 2016 to present) | |
1 Unless otherwise indicated, the mailing address of each officer and trustee is: W1520 First National Bank Building, 332 Minnesota Street, Saint Paul, MN 55101-1363.
2 Mr. Conzemius, Dr. Schmid Daugherty and Mr. McKasy served as directors of Mairs & Power Growth Fund, Inc. and Mairs & Power Balanced Fund, Inc. (together, the "Predecessor Funds") prior to the reorganization of the Predecessor Funds into newly formed series of the Trust effective December 31, 2011. Positions listed in this column for trustees and officers prior to 2012 refer to their positions with the Predecessor Funds. Each trustee serves until his or her resignation or mandatory retirement age. Each officer is elected annually and serves until his successor has been duly elected and qualified.
3 Effective December 31, 2016, Mr. Conzemius retired as Trustee of Mairs & Power Funds Trust and Chairman of the Nominating and Governance Committee.
4 Dorsey & Whitney LLP previously served as legal counsel to the Trust through December 2012.
53
MAIRS & POWER FUNDS TRUST
Mairs & Power Growth Fund, established 1958
Mairs & Power Balanced Fund, established 1961
Mairs & Power Small Cap Fund, established 2011
A No-Load Funds Trust
For Shareholder Services
Call (800) 304-7404
Or write to:
(via Regular Mail)
c/o U.S. Bancorp Fund Services, LLC
615 East Michigan Street
P. O. Box 701
Milwaukee, WI 53201-0701 | | (via Overnight or Express Mail)
c/o U.S. Bancorp Fund Services, LLC
3rd Floor
615 East Michigan Street
Milwaukee, WI 53202-0701 | |
For Fund literature and information, visit the Trust's website at:
www.mairsandpower.com
Investment Manager
Mairs & Power, Inc.
W1520 First National Bank Building
332 Minnesota Street
Saint Paul, MN 55101
Custodian
U.S. Bank, N.A.
Custody Operations
1555 North River Center Drive, Suite 302
Milwaukee, WI 53212
Distributor
ALPS Distributors, Inc.
1290 Broadway, Suite 1100
Denver, CO 80203
Mairs & Power, Inc.
c/o U.S. Bancorp Fund Services, LLC
3rd Floor
615 East Michigan Street
Milwaukee, WI 53202-0701
Item 2. Code of Ethics.
The registrant has adopted a Code of Ethics that applies to the registrant’s principal executive officer and principal financial officer. The registrant has not made any substantive amendments to its Code of Ethics during the period covered by this report. The registrant has not granted any waivers from any provisions of the Code of Ethics during the period covered by this report. A copy of the registrant’s Code of Ethics is incorporated by reference. See Item 12(a)(1).
Item 3. Audit Committee Financial Expert.
The registrant’s Board of Trustees has determined that Dr. Mary Schmid Daugherty, a member of the registrant’s Audit Committee, is an “audit committee financial expert” as defined in Item 3 of Form N-CSR. Dr. Daugherty is “independent” under the standards set forth in Item 3 of Form N-CSR.
Item 4. Principal Accountant Fees and Services.
Year Ended
December 31, | | (a)
Audit Fees | | (b)
Audit-
Related Fees | | (c)
Tax Fees | | (d)
All Other
Fees | |
| | | | | | | | | |
2015 | | $ | 103,400 | | None | | $ | 18,300 | | None | |
2016 | | $ | 107,500 | | None | | $ | 19,025 | | None | |
(a) | Audit fees include amounts related to the audit of registrant’s annual financial statements and services normally provided by the accountant in connection with statutory and regulatory filings. |
| |
(c) | Tax fees include amounts related to tax advice and tax return preparation, compliance and reviews. |
| |
(d) | Tax consulting fee includes fees and expenses related to allowable tax consulting services. |
| |
(e)(1) | The registrant’s Audit Committee approves the engagement of the accountant before the accountant is engaged by the registrant and approved all audit and non-audit services provided to the registrant. |
| |
(e)(2) | None of such services described in columns (b) through (d) were subject to a waiver of the pre-approval requirement pursuant to paragraph (c)(7)(i)(c) of Rule 2-01 of Regulation S-X. |
| |
(f) | Not applicable |
| |
(g) | The aggregate fees for non-audit services rendered by the registrant’s accountant to the registrant were $18,300 for the fiscal year ended December 31, 2015 and $52,525 for the fiscal year ended December 31, 2016. The aggregate fees for non-audit services rendered by the registrant’s accountant to the registrant’s investment adviser were $24,900 for the fiscal year ended December 31, 2015 and $22,010 for the fiscal year ended December 31, 2016. |
| |
(h) | The registrant’s Audit Committee has considered whether the provision of non-audit services by the registrant’s accountant to the registrant’s investment adviser is compatible with maintaining the accountant’s independence. |
Item 5. Audit Committee of Listed Registrants.
Not applicable to registrants who are not listed issuers (as defined in Rule 10A-3 under the Securities Exchange Act of 1934).
Item 6. Investments.
(a) Schedule of Investments is included as part of the report to shareholders filed under Item 1 of this Form
(b) Not Applicable.
Item 7. Disclosure of Proxy Voting Policies and Procedures for Closed-End Management Investment Companies.
Not applicable to open-end investment companies.
Item 8. Portfolio Managers of Closed-End Management Investment Companies.
Not applicable to open-end investment companies.
Item 9. Purchases of Equity Securities by Closed-End Management Investment Company and Affiliated Purchasers.
Not applicable to open-end investment companies.
Item 10. Submission of Matters to a Vote of Security Holders.
There has been no material change to the procedures by which shareholders may recommend nominees to the registrant’s board of directors.
Item 11. Controls and Procedures.
(a) The registrant’s principal executive officer and principal financial officer have evaluated the registrant’s disclosure controls and procedures as of a date within 90 days of the filing of this report and have concluded that the registrant’s disclosure controls and procedures were effective, as of that date, in ensuring that information required to be disclosed by the registrant in this Form N-CSR was recorded, processed, summarized and reported within the time period specified by the SEC’s rules and forms.
(b) There were no changes in the Registrant’s internal control over financial reporting (as defined in Rule 30a-3(d) under the Act) that occurred during the second fiscal quarter of the period covered by this report that has materially affected, or is reasonably likely to materially affect, the Registrant’s internal control over financial reporting.
Item 12. Exhibits.
(a) (1) Code of Ethics
Mairs & Power Funds Trust Code of Ethics for Principal Executive Officer and Principal Financial Officer.
Incorporated by reference to previous Form N-CSR filing, filed February 28, 2014.
(2) Certifications required by Rule 30a-2(a) under the Investment Company Act of 1940.
Attached as exhibits 12(a)(2).1 and 12(a)(2).2 to this form.
(3) Any written solicitation to purchase securities under Rule 23c-1 under the Act sent or given during the period covered by the report by or on behalf of the registrant to 10 or more persons. Not applicable to open-end investment companies.
(b) Certifications pursuant to Section 906 of the Sarbanes-Oxley Act of 2002.
Attached as exhibit 12(b) to this form.
SIGNATURES
Pursuant to the requirements of the Securities Exchange Act of 1934 and the Investment Company Act of 1940, the registrant has duly caused this report to be signed on its behalf by the undersigned, thereunto duly authorized.
(Registrant) | Mairs & Power Funds Trust | |
| | |
By (Signature and Title)* | /s/ Mark L. Henneman | |
| Mark L. Henneman, President | |
| Principal Executive Officer | |
| | |
| | |
Date | 3/6/17 | | | |
| | | | | |
Pursuant to the requirements of the Securities Exchange Act of 1934 and the Investment Company Act of 1940, this report has been signed below by the following persons on behalf of the registrant and in the capacities and on the dates indicated.
By (Signature and Title)* | /s/ Mark L. Henneman | |
| Mark L. Henneman, President | |
| Principal Executive Officer | |
| | |
| | |
Date | 3/6/17 | | | |
| | |
| | |
By (Signature and Title)* | /s/ Andrea C. Stimmel | |
| Andrea C. Stimmel, Treasurer | |
| Principal Financial Officer | |
| | |
| | |
Date | 3/6/17 | | | |
* Print the name and title of each signing officer under his or her signature.