UNITED STATES
SECURITIES AND EXCHANGE COMMISSION
Washington, D.C. 20549
FORM N-CSR
CERTIFIED SHAREHOLDER REPORT OF REGISTERED
MANAGEMENT INVESTMENT COMPANIES
Investment Company Act file number | 811-22563 |
|
Mairs & Power Funds Trust |
(Exact name of registrant as specified in charter) |
|
332 Minnesota Street, Suite W1520, St. Paul, MN | | 55101 |
(Address of principal executive offices) | | (Zip code) |
|
Andrea C. Stimmel, Treasurer, 332 Minnesota Street, Suite W1520, St. Paul, MN 55101 |
(Name and address of agent for service) |
|
Registrant’s telephone number, including area code: | 651-222-8478 | |
|
Date of fiscal year end: | December 31, 2019 | |
|
Date of reporting period: | December 31, 2019 | |
| | | | | | | | |
Item 1. Reports to Stockholders.

ANNUAL REPORT
DECEMBER 31, 2019
- GROWTH FUND (MPGFX)
est. 1958
- BALANCED FUND (MAPOX)
est. 1961
- SMALL CAP FUND (MSCFX)
est. 2011
Beginning in February 2021, as permitted by regulations adopted by the U.S. Securities and Exchange Commission, paper copies of the Mairs & Power Funds' shareholder reports will no longer be sent by mail, unless you specifically request paper copies of the reports from the Mairs & Power Funds or from your Financial Intermediary. Instead, the reports will be made available on the Mairs & Power Funds' website, and you will be notified each time a report is posted and provided with a website link to access the report. If you already elected to receive shareholder reports electronically for the Mairs & Power Funds, you will not be affected by this change and you need not take any action.
Mairs & Power Funds Direct Shareholders
You may elect to receive shareholder reports and other communications electronically or in paper from the Mairs & Power Funds by electing one of the following options:
1. Receive Fund Communication by Email: Contact Shareholder Services at (800) 304-7404 or consent through the direct shareholder portal online at www.mairsandpower.com. You may also elect to receive account statements, tax forms and confirmations through this means.
2. Receive Fund Communication by Mail: Contact Shareholder Services at (800) 304-7404.
You may elect to continue receiving paper copies of the shareholder reports and other communications, free of charge, by contacting Shareholder Services at (800) 304-7404.
Mairs & Power Fund Shareholder through a Financial Intermediary (such as broker-dealer or bank)
Contact your Financial Intermediary to make your election. Your election will apply to all Mairs & Power Funds held through your Financial Intermediary.
Mairs & Power W1520 First National Bank Building, 332 Minnesota Street, St. Paul, Minnesota 55101 www.mairsandpower.com
MAIRS & POWER FUNDS MARKET COMMENTARY (unaudited)
December 31, 2019
2019 was a year for the record books! On the heels of the worst December since the Great Depression, U.S. markets started 2019 with the best January performance in three decades and finished at record highs, posting returns that were among the best in the past 50 years.
Looking at its performance over the past three years illustrates the market's incredible ability to predict market fundamentals. In 2017, with the new Trump administration and a Republican controlled Congress enacting large tax cuts, investors anticipated tax-fueled earnings growth driving the market up 22% that year. Sure enough, in 2018 S&P 500 earnings were up 24%, driven by tax cuts and a strong economy. In 2018 however, despite strong earnings growth, the market was down 4% on the expectation that in 2019 companies would face tough comparisons as the tax induced earnings tail wind faded. Sure enough, 2019 earnings were down slightly through the first three quarters. But in 2019, despite no earnings growth, investors drove the market to record highs and one of the strongest finishes in recent memory in anticipation of a return to better growth in 2020.
For the fourth quarter and full year, the S&P 500 Total Return (TR) was 9.07%, and 31.49% respectively, the Dow Jones Industrial (TR) was 6.67% and 25.34%, and the Bloomberg Barclay's U.S. Government/Credit Bond Index was -0.01% and 9.71% respectively.
Future Outlook
The mood among investors is certainly confident, or should we say less worried.
For most of 2019, short term rates exceeded long term rates (an inverted treasury yield curve), creating fears of a recession. But in the fourth quarter, as the yield on longer maturity bonds moved up and the Fed (Federal Reserve) cut short term rates, we saw a return to a more familiar, positively sloped treasury yield curve, reducing investor anxiety. At the same time, several economic indicators began to improve. The Institute for Supply Management's (ISM) Index for the service sector, which represents two-thirds of the U.S. economy, is signaling continued expansion. Measures of consumer confidence remain high, job growth remains strong and confidence among homebuilders recently hit a 20- year high. An easing of trade tensions and fewer tariff barriers as the Phase One deal with China promises, should further support the earnings growth the market is counting on.
Not every sign is positive, however. A measure of large company CEO confidence hit its lowest level since Q1 of 2009, before recovering some recently. A similar survey of small and mid-sized company CEO confidence reported hitting an 8-year low. The ISM Manufacturing Index took an encouraging slight uptick late in the quarter, but remains stuck below 50%, indicating little growth in the manufacturing sector. Total vehicle sales (autos and light trucks) have remained flat since 2015. Valuations such as dividend yield, price-to-cash flow (PCF), and price-to-earnings (PE) remain above historic averages, making stocks overall somewhat expensive and putting a premium on stock selection.
One additional word of caution is in order. Given the strong finish to 2019, the market may be expecting earnings growth for 2020 even higher than the consensus of 8%, making the stock market vulnerable to disappointment or negative economic surprises.
Past Performance is not a guarantee of future results.
1 Source FactSet Research Systems Inc.
Dividend yield is the ratio of a company's annual dividend compared to its share price.
Price-to-earnings is the ratio for valuing a company that measures its current share price relative to its per-share earnings.
Price-to-cash flow ratio is a stock valuation indicator that measures the value of a stock's price to its operating cash flow per share.
1
MAIRS & POWER FUNDS MARKET COMMENTARY (unaudited) (continued)
Inverted Treasury Yield Curve represents a situation in which long-term debt instruments have lower yields than short-term debt instruments of the same credit quality.
ISM Manufacturing Index measures manufacturing output nationwide.
Consumer Confidence Index measures the degree of optimism on the state of the U.S. economy through savings and spending activities.
S&P 500 TR (Total Return) Index is an unmanaged index of 500 common stocks that is generally considered representative of the U.S. stock market. It tracks both the capital gains of a group of stocks over time and assumes that any cash distributions, such as dividends, are reinvested back into the index. It is not possible to invest directly in an index.
Dow Jones Industrial Average TR Index is a price-weighted average of 30 significant stocks traded on the New York Stock Exchange and the NASDAQ. It is not possible to invest directly in an index.
Bloomberg Barclays U.S. Government/Credit Bond Index is a broad-based flagship benchmark that measures the non-securitized component of the U.S. Aggregate Index. It includes investment-grade, U.S. dollar-denominated, fixed-rate Treasuries, government-related and corporate securities. It is not possible to invest directly in an index.
2
MAIRS & POWER GROWTH FUND (unaudited)
To Our Shareholders: December 31, 2019
The Mairs & Power Growth Fund gained 8.65% for the fourth quarter and was up 28.39% for the full year. The S&P 500 Total Return (TR) benchmark was up 9.07% and 31.49% while the Lipper Multi-Cap Core Funds Index was up 8.71% and 29.09% for the fourth quarter and full year respectively.
While the Fund underperformed compared to its benchmark and peers, this is typical in a strong market given our conservative approach. In fact, we only slightly lagged and view 2019 as a good year. Our overweight position in the Health Care sector, which has been under pressure, and our underweight position in Information Technology, which has been the top performing sector, hurt performance on a relative basis. Good stock selection in Health Care, Consumer Discretionary and Materials sectors contributed positively to performance for the full year. For the first time in recent memory value stocks outperformed growth stocks in the second half of the year, a positive sign which benefited the Fund. Conversely, small and midcap stocks underperformed large caps on a relative basis. With the Fund's multi-cap approach, this factor muted performance somewhat.
BioTechne (TECH) was a top contributor to performance for the year. After a period of declines or no growth, the company has posted a consistent 10%-plus growth rate over the past several quarters, and the stock has responded. The new management team has done an exceptional job in transforming the Minneapolis-based bio-tech firm over the last seven years by expanding its addressable market through acquisitions. One recent tuck-in acquisition, Exosome Diagnostics, introduced a new fluid (blood and urine) bioassay test for prostate cancer that they believe will improve diagnostic accuracy before a tissue biopsy is called for. Company management is enthusiastic about extending this diagnostic platform to cover other medical conditions. As we've said before, we believe the company has a long runway ahead of it.
MAIRS & POWER GROWTH FUND (MPGFX)
Top Relative Performers
| Fourth Quarter (9/30/19 – 12/31/19) | | Year To Date (12/31/18 – 12/31/19) | |
UnitedHealth Group Inc | | | 26.73 | % | | Microsoft Corporation | | | 26.08 | % | |
NVIDIA Corporation | | | 26.20 | % | | Fiserv, Inc. | | | 25.85 | % | |
Microsoft Corporate | | | 4.75 | % | | Bio-Techne Corporation | | | 21.18 | % | |
Johnson & Johnson | | | 4.46 | % | | QUALCOMM Inc. | | | 29.18 | % | |
Generac Holdings Inc. | | | 19.33 | % | | Target Corporation | | | 68.67 | % | |
Weak Relative Performers
| Fourth Quarter (9/30/19 – 12/31/19) | | Year To Date (12/31/18 – 12/31/19) | |
Ecolab Inc. | | | -11.37 | % | | 3M Company | | | -35.75 | % | |
C.H. Robinson Worldwide | | | -16.22 | % | | C.H. Robinson Worldwide | | | -36.20 | % | |
CoreSite Realty Corporation | | | -16.04 | % | | Hormel Foods Corporation | | | -23.63 | % | |
Principal Financial Group, Inc. | | | -11.83 | % | | Johnson & Johnson | | | -15.28 | % | |
Core Laboratories NV | | | -27.21 | % | | Pfizer Inc. | | | -38.41 | % | |
Performance shown is relative to the S&P 500 TR Index as of December 31, 2019. Relative return is the difference between the absolute return and the performance of the market, in which the position is held. Relative contribution is used for ranking, which considers average daily weightings for each holding. Past performance does not guarantee future results.
3
MAIRS & POWER GROWTH FUND (unaudited) (continued)
Fiserv (FISV), a long time holding, was another top performer for the year. The Wisconsin-based financial services technology company successfully integrated its recent acquisition of First Data Corp. (FDC), resulting in strong financial performance and a solid move in the stock. This acquisition makes Fiserv a global leader in digital banking solutions, payment card processing, network services and e-commerce solutions for small regional and community banks.
On the flip side, two industrial sector names, 3M Company (MMM) and C.H. Robinson (CHRW), were among the major factors hurting performance for the year. 3M, one of the Fund's largest holdings, has struggled since it lowered its outlook early in the year due to slowing end markets, particularly automotive, China, and in consumer electronics. In addition, investors have expressed concerns about the company's ongoing environmental liabilities.
C.H. Robinson, a leading third-party logistics firm based in the Twin Cities, was hurt by market concerns that larger, better funded companies like Amazon (AMZN) and Uber (UBER), have announced moves into this space. We have been attracted to C.H. Robinson because we see their strategic investments in technology as giving them durable competitive advantages in operating efficiencies and customer retention. C.H. Robinson's asset light business model sets it apart in the space by focusing on technology and not capital spend on trucks, planes and distribution centers. We see the large tech companies as disruptive to traditional asset intense shippers, like UPS, but not C.H. Robinson and its asset light model.
We added a new name to the portfolio, Rockwell Automation (ROK), with a small position due to its leadership position in factory automation. As we have made the rounds of manufacturing companies as part of our research process, we noted that many were making capital investments in automation to help them deal with labor shortages and as a way to increase production with fewer workers. We think increasing automation is a permanent feature of ushering manufacturing companies into the future and Rockwell currently occupies a sweet spot in this space.
As we finish year 11 of the longest bull market in history at all-time highs, we are by some measures in unprecedented territory. Even so, the tools we have relied on in the past to evaluate risk and reward have continued to work and provide us with what we feel are attractive investment opportunities.
Andrew R. Adams
Lead Manager | | Mark L. Henneman
Co-Manager | | Peter J. Johnson
Co-Manager | |
The Fund's investment objective, risks, charges and expenses must be considered carefully before investing. The summary prospectus or full prospectus contains this and other important information about the Fund and they may be obtained by calling Shareholder Services at (800) 304-7404 or by visiting www.mairsandpower.com. Read the summary prospectus or full prospectus carefully before investing.
All holdings in the portfolio are subject to change without notice and may or may not represent current or future portfolio composition. The mention of specific securities is not intended as a recommendation or an offer of a particular security, nor is it intended to be a solicitation for the purchase or sale of any security.
All investments have risks. The Growth Fund is designed for long-term investors. Equity investments are subject to market fluctuations and the Fund's share price can fall because of weakness in the broad market, a particular industry or specific holdings. Investments in small and midcap companies generally are more volatile. International investing risks include among others political, social or economic instability, difficulty in predicting international trade patterns, taxation and foreign trading practices and greater fluctuations in price than U.S. corporations.
This commentary includes forward-looking statements such as economic predictions and portfolio manager opinions. The statements are subject to change at any time based on market and other conditions. No predictions, forecasts, outlooks, expectations or beliefs are guaranteed.
Diversification does not guarantee profit or protect against loss.
4
MAIRS & POWER GROWTH FUND (unaudited) (continued)
S&P 500 TR (Total Return) Index is an unmanaged index of 500 common stocks that is generally considered representative of the U.S. stock market. It tracks both the capital gains of a group of stocks over time and assumes that any cash distributions, such as dividends, are reinvested back into the index. It is not possible to invest directly in an index.
Lipper Multi-Cap Core Funds Index measures the performance of the 30 largest mutual funds that invest in a variety of capitalization ranges, without concentrating 75% or more of their equity assets in any one market capitalization range over an extended period of time, as determined by Lipper, Inc. It is not possible to invest directly in an index.
5
Mairs & Power Growth Fund
PERFORMANCE INFORMATION (unaudited) December 31, 2019
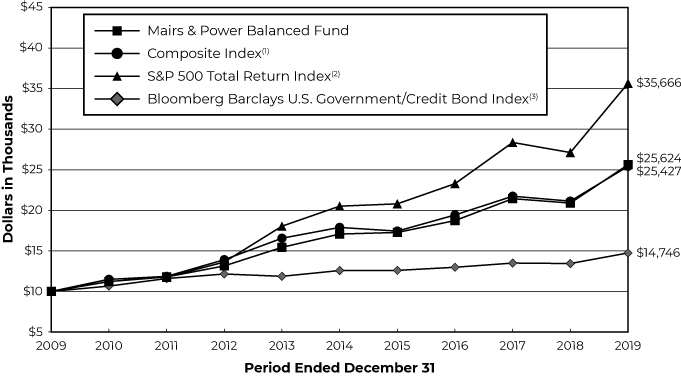
Ten years of investment performance (through December 31, 2019)
This chart illustrates the performance of a hypothetical $10,000 investment made in the Fund 10 years ago.

Average annual total returns for periods ended December 31, 2019
| | | 1 year | | 5 years | | 10 years | | 20 years | |
Mairs & Power Growth Fund | | | 28.39 | % | | | 9.86 | % | | | 12.97 | % | | | 9.89 | % | |
S&P 500 Total Return Index(1) | | | 31.49 | % | | | 11.70 | % | | | 13.56 | % | | | 6.06 | % | |
Performance data quoted represents past performance and does not guarantee future results. All performance information shown includes the reinvestment of dividend and capital gain distributions, but does not reflect the deduction of taxes that a shareholder would pay on Fund distributions or the redemption of Fund shares. The investment return and principal value of an investment will fluctuate so that an investor's shares, when redeemed, may be worth more or less than their original cost. Current performance of the Fund may be lower or higher than the performance quoted. For the most recent month-end performance figures, visit the Fund's website at www.mairsandpower.com or call Shareholder Services at (800) 304-7404. Per the Prospectus dated April 30, 2019, the expense ratio for the Fund is 0.64%.
(1) The S&P 500 Total Return Index is an unmanaged index of 500 common stocks that is generally considered representative of the U.S. stock market. It tracks both the capital gains of a group of stocks over time and assumes that any cash distributions, such as dividends, are reinvested back into the index. It is not possible to invest directly in an index.
6
Mairs & Power Growth Fund
FUND INFORMATION (unaudited) December 31, 2019
Portfolio Managers
Andrew R. Adams, CFA, lead manager since April 1, 2019, co-manager from January 1, 2015 through April 1, 2019, University of Wisconsin-Madison, MS Finance 1997
Peter J. Johnson, CFA, co-manager since April 1, 2019, University of Wisconsin-Madison, MBA 2010
Mark L. Henneman, CFA, co-manager since April 1, 2019 and from January 1, 2006 through July 1, 2013, lead manager from July 1, 2013 to April 1, 2019, University of Minnesota, MBA Finance 1990
General Information
Fund Symbol | | | MPGFX | | |
Net Asset Value (NAV) Per Share | | $ | 127.22 | | |
Expense Ratio | | | 0.65 | % | |
Portfolio Turnover Rate | | | 10.77 | % | |
Sales Charge | | | None1 | | |
Fund Inception Year | | | 1958 | | |
Portfolio Composition
Top Ten Portfolio Holdings
(Percent of Total Net Assets) 2
Alphabet Inc | | | 5.7 | % | |
US Bancorp/MN | | | 5.0 | | |
Medtronic PLC | | | 4.2 | | |
| 3M Co | | | 4.0 | | |
Ecolab Inc | | | 3.9 | | |
Microsoft Corp | | | 3.8 | | |
Johnson & Johnson | | | 3.7 | | |
Walt Disney Co/The | | | 3.4 | | |
UnitedHealth Group Inc | | | 3.3 | | |
Roche Holding AG | | | 3.2 | | |
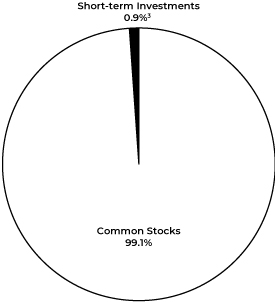
Portfolio Diversification
(Percent of Total Net Assets)
Common Stocks 99.1% | |
Health Care | | | 23.7 | % | |
Industrials | | | 23.5 | | |
Information Technology | | | 15.6 | | |
Financials | | | 13.0 | | |
Communication Services | | | 9.0 | | |
Materials | | | 6.1 | | |
Consumer Staples | | | 4.3 | | |
Real Estate | | | 1.9 | | |
Consumer Discretionary | | | 1.4 | | |
Energy | | | 0.6 | | |
Short-term Investments 0.9%3 | | | 0.9 | | |
| | | | 100.0 | % | |
1 Although the Fund is no-load, investment management fees and other expenses still apply.
2 All holdings in the portfolio are subject to change without notice and may or may not represent current or future portfolio composition. The mention of specific securities is not intended as a recommendation or offer for a particular security, nor is it intended to be a solicitation for the purchase or sale of any security.
3 Represents short-term investments and other assets and liabilities (net).
The Schedule of Investments and portfolio diversification utilize the Global Industry Classification Standard (GICS®) which was developed by and/or is the exclusive property of MSCI, Inc. and Standard & Poor's Financial Services LLC ("S&P"). GICS is a service mark of MSCI, Inc. and S&P and has been licensed for use by Mairs & Power, Inc. (the "Adviser").
7
Mairs & Power Growth Fund
SCHEDULE OF INVESTMENTS December 31, 2019
Shares | | Security Description | | Fair Value | |
| | | COMMON STOCKS 99.1% | |
| | | COMMUNICATION SERVICES 9.0% | |
| | 195,900 | | | Alphabet Inc (a) | | $ | 261,922,218 | | |
| | 1,078,600 | | | Walt Disney Co/The | | | 155,997,918 | | |
| | | | 417,920,136 | | |
| | | CONSUMER DISCRETIONARY 1.4% | |
| | 242,100 | | | Gentherm Inc (a) | | | 10,746,819 | | |
| | 110,000 | | | Home Depot Inc/The | | | 24,021,800 | | |
| | 241,600 | | | Target Corp | | | 30,975,536 | | |
| | | | 65,744,155 | | |
| | | CONSUMER STAPLES 4.3% | |
| | 1,050,000 | | | General Mills Inc | | | 56,238,000 | | |
| | 3,160,000 | | | Hormel Foods Corp | | | 142,547,600 | | |
| | | | 198,785,600 | | |
| | | ENERGY 0.6% | |
| | 695,000 | | | Core Laboratories NV (b) | | | 26,180,650 | | |
| | | FINANCIALS 13.0% | |
| | 770,000 | | | American Express Co | | | 95,857,300 | | |
| | 930,000 | | | Associated Banc-Corp | | | 20,497,200 | | |
| | 841,300 | | | Charles Schwab Corp/The | | | 40,012,228 | | |
| | 1,280,000 | | | Great Western Bancorp Inc | | | 44,467,200 | | |
| | 1,920,000 | | | Principal Financial Group Inc | | | 105,600,000 | | |
| | 3,930,000 | | | US Bancorp/MN | | | 233,009,700 | | |
| | 1,200,000 | | | Wells Fargo & Co | | | 64,560,000 | | |
| | | | 604,003,628 | | |
| | | HEALTH CARE 23.7% | |
| | 805,600 | | | Abbott Laboratories | | | 69,974,416 | | |
| | 225,000 | | | Baxter International Inc | | | 18,814,500 | | |
| | 574,200 | | | Bio-Techne Corp | | | 126,042,642 | | |
| | 505,527 | | | Elanco Animal Health Inc (a) | | | 14,887,770 | | |
| | 349,031 | | | Eli Lilly & Co | | | 45,873,144 | | |
| | 1,170,000 | | | Johnson & Johnson | | | 170,667,900 | | |
| | 1,728,200 | | | Medtronic PLC (e) | | | 196,064,290 | | |
| | 1,460,000 | | | Pfizer Inc | | | 57,202,800 | | |
| | 3,700,000 | | | Roche Holding AG (d) | | | 150,442,000 | | |
| | 526,500 | | | UnitedHealth Group Inc | | | 154,780,470 | | |
| | 620,000 | | | Zimmer Holdings Inc | | | 92,801,600 | | |
| | | | 1,097,551,532 | | |
8
Mairs & Power Growth Fund
SCHEDULE OF INVESTMENTS (continued) December 31, 2019
Shares | | Security Description | | Fair Value | |
| | | COMMON STOCKS (continued) | |
| | | INDUSTRIALS 23.5% | |
| | 1,050,900 | | | 3M Co | | $ | 185,399,778 | | |
| | 1,305,000 | | | CH Robinson Worldwide Inc | | | 102,051,000 | | |
| | 2,365,000 | | | Donaldson Co Inc | | | 136,271,300 | | |
| | 3,220,000 | | | Fastenal Co | | | 118,979,000 | | |
| | 315,000 | | | Generac Holdings Inc (a) | | | 31,685,850 | | |
| | 2,640,000 | | | Graco Inc | | | 137,280,000 | | |
| | 538,300 | | | Honeywell International Inc | | | 95,279,100 | | |
| | 2,231,066 | | | nVent Electric PLC (b) | | | 57,070,668 | | |
| | 235,000 | | | Pentair PLC (b) | | | 10,779,450 | | |
| | 108,000 | | | Proto Labs Inc (a) | | | 10,967,400 | | |
| | 50,000 | | | Rockwell Automation Inc | | | 10,133,500 | | |
| | 889,575 | | | Tennant Co | | | 69,315,684 | | |
| | 1,550,000 | | | Toro Co/The | | | 123,488,500 | | |
| | | | 1,088,701,230 | | |
| | | INFORMATION TECHNOLOGY 15.6% | |
| | 376,500 | | | Badger Meter Inc | | | 24,446,145 | | |
| | 1,390,000 | | | Corning Inc | | | 40,462,900 | | |
| | 812,175 | | | Digi International Inc (a) | | | 14,391,741 | | |
| | 1,005,000 | | | Fiserv Inc (a) | | | 116,208,150 | | |
| | 304,000 | | | Littelfuse Inc | | | 58,155,200 | | |
| | 1,125,000 | | | Microsoft Corp | | | 177,412,500 | | |
| | 302,000 | | | Motorola Solutions Inc | | | 48,664,280 | | |
| | 220,000 | | | NVE Corp | | | 15,708,000 | | |
| | 370,000 | | | NVIDIA Corp | | | 87,061,000 | | |
| | 657,900 | | | QUALCOMM Inc | | | 58,046,517 | | |
| | 451,000 | | | Visa Inc | | | 84,742,900 | | |
| | | | 725,299,333 | | |
| | | MATERIALS 6.1% | |
| | 936,900 | | | Ecolab Inc | | | 180,812,331 | | |
| | 1,670,000 | | | HB Fuller Co | | | 86,121,900 | | |
| | 25,000 | | | Sherwin-Williams Co/The | | | 14,588,500 | | |
| | | | 281,522,731 | | |
| | | REAL ESTATE 1.9% | |
| | 768,266 | | | CoreSite Realty Corp | | | 86,137,984 | | |
| | | | | TOTAL COMMON STOCKS
(cost $2,269,756,201) | | $ | 4,591,846,979
| | |
9
Mairs & Power Growth Fund
SCHEDULE OF INVESTMENTS (continued) December 31, 2019
Shares | | Security Description | | Fair Value | |
| | | SHORT-TERM INVESTMENTS 0.5% | |
| 24,705,689
| | | First American Government Obligations Fund, Class X, 1.51% (c)
(cost $24,705,689) | | $ | 24,705,689
| | |
| | | | | TOTAL INVESTMENTS 99.6%
(cost $2,294,461,890) | | $ | 4,616,552,668
| | |
| | | | | OTHER ASSETS AND LIABILITIES (NET) 0.4% | | | 17,383,932 | | |
| | | | | TOTAL NET ASSETS 100.0% | | $ | 4,633,936,600 | | |
(a) Non-income producing.
(b) Foreign security denominated in U.S. dollars. As of December 31, 2019, these securities represented $94,030,768 or 2.0% of total net assets.
(c) The rate quoted is the annualized seven-day effective yield as of December 31, 2019.
(d) American Depositary Receipt.
(e) Issuer headquartered overseas but considered domestic. In determining whether a security is foreign or domestic, the Adviser will generally look at the location of the headquarters of the issuer. However, if the issuer is believed by the Adviser to be headquartered in a jurisdiction primarily for tax purposes, the Adviser will consider the following additional factors: 1) the location of the primary exchange trading its securities; 2) where it derives the majority of its revenues, and/or 3) where it earns the majority of its profits.
The Global Industry Classification Standard (GICS®) was developed by and/or is the exclusive property of MSCI, Inc. and Standard & Poor's Financial Services LLC ("S&P"). GICS is a service mark of MSCI, Inc. and S&P and has been licensed for use by the Adviser.
See accompanying Notes to Financial Statements.
10
MAIRS & POWER BALANCED FUND (unaudited)
To Our Shareholders: December 31, 2019
The Balanced Fund gained 5.33% for the fourth quarter and 20.32% for the full year compared to its benchmark composite index (60% S&P 500 Total Return Index and 40% Bloomberg Barclay's U.S. Government/Credit Bond Index) which gained 5.38% for the quarter and 22.64% for the full year. Our peer group, the Morningstar Allocation 50%-70% Equity Category was 5.06% for the fourth quarter and 18.89% for the full year.
Our overweight position in the Health Care sector, which has been under pressure, and our underweight position in Information Technology, which has been the top performing sector, hurt performance on a relative basis for the year.
On an individual stock basis, Target Corp. (TGT) was among the top contributors to relative performance for the year as the Minneapolis-based retail giant benefited from moves it has been making over the past two years. The company has remodeled its stores and improved merchandising to drive traffic both to its brick and mortar locations and its on-line store, resulting in improved top and bottom-line performance. The stock reacted accordingly.
Another name contributing to relative performance for the year that deserves mention was Bio-Techne (TECH). After a period of declines or no growth, the company has posted a consistent 10%-plus growth rate over the past several quarters, and the stock has responded. The new management team has done an exceptional job in transforming the Minneapolis-based bio-tech firm over the last seven years by expanding its addressable market through acquisitions. One recent tuck-in acquisition, Exosome Diagnostics, introduced a new fluid (blood and urine) bioassay test for prostate cancer that they believe will improve diagnostic accuracy before a tissue biopsy is called for. Company management is enthusiastic about extending this diagnostic platform to cover other medical conditions. We believe the company has a long runway ahead of it.
MAIRS & POWER BALANCED FUND (MAPOX)
Top Relative Performers
| Fourth Quarter (9/30/19 – 12/31/19) | | Year To Date (12/31/18 – 12/31/19) | |
UnitedHealth Group Inc. | | | 26.73 | % | | Microsoft Corporation | | | 26.08 | % | |
JPMorgan Chase & Co. | | | 10.33 | % | | Target Corporation | | | 68.67 | % | |
Eli Lilly & Co. | | | 9.14 | % | | JPMorgan Chase & Co. | | | 15.78 | % | |
Bristol-Myers Squibb Co. | | | 18.56 | % | | QUALCOMM Inc. | | | 29.18 | % | |
Microsoft Corporation | | | 4.75 | % | | Sherwin-Williams Co. | | | 20.72 | % | |
Weak Relative Performers
| Fourth Quarter (9/30/19 – 12/31/19) | | Year To Date (12/31/18 – 12/31/19) | |
C.H. Robinson Worldwide | | | -16.22 | % | | 3M Company | | | -35.75 | % | |
Ecolab Inc. | | | -11.37 | % | | C.H. Robinson Worldwide | | | -36.20 | % | |
Principal Financial Group, Inc. | | | -11.83 | % | | Pfizer Inc. | | | -38.41 | % | |
United Parcel Service, Inc. Class B | | | -10.62 | % | | Hormel Foods Corporation | | | -23.63 | % | |
Home Depot, Inc. | | | -14.35 | % | | Johnson & Johnson | | | -15.28 | % | |
Performance shown is relative to the S&P 500 TR Index as of December 31, 2019. Relative return is the difference between the absolute return and the performance of the market, in which the position is held. Relative contribution is used for ranking, which considers average daily weightings for each holding. Past performance does not guarantee future results.
11
MAIRS & POWER BALANCED FUND (unaudited) (continued)
On the flip side, two industrial sector names, 3M Company (MMM) and C.H. Robinson (CHRW), were among the major factors hurting performance for the year. 3M, one of the Fund's largest holdings, has struggled since it lowered its outlook early in the year due to slowing end markets, particularly automotive, China, and in consumer electronics. In addition, investors have expressed concerns about the company's ongoing environmental liabilities.
We added several new names to the Fund that also deserve highlighting. We took a small position in Rockwell Automation (ROK) due to its leadership position in factory automation. As we have made the rounds of manufacturing companies as part of our research process, we noted that many were making capital investments in automation to help them deal with labor shortages and as a way to increase production with fewer workers. We think increasing automation is a permanent feature of ushering manufacturing companies into the future and Rockwell currently occupies a sweet spot in this space.
After Sherwin Williams (SHW) acquired Twin Cities-based Valspar a few years ago, we watched them to see how they would capitalize on the move. Having been holders of Valspar and familiar with that company's strengths, we liked what we saw in the newly combined company and took a position earlier in the year. They have posted strong earnings growth and a solid return on invested capital (ROIC) as they have become an even stronger competitor in both residential and industrial coatings markets. They dwarf the nearest competition in retail store counts as they replaced their major rival, PPG Industries, Inc. (PPG), at the home improvement giant Lowe's Company (LOW). Since labor, not paint, is the major cost in any commercial or residential painting job and the customer base is highly fragmented, Sherwin Williams enjoys strong pricing power.
We also added a new name, CoreSite Realty Corporation (COR), to the Fund in the quarter. The Denver-based REIT (real estate investment trust) is an IT outsource provider operating multiple data centers across eight large U.S. metropolitan areas. As the demand for outsourced data center management has continued to show strong growth driven by the rising use of streaming video, adoption of next-generation 5G data networks and the growth of cloud-based computing applications, we feel the company is well positioned. Its strategic locations in major markets and a large and growing customer base, provide a sustainable competitive advantage with historically delivering an attractive growth rate and yield for investors.
We exited two large cap names in the fourth quarter, IBM Corporation (IBM) and Exxon Mobil Corp. (XOM). In both instances, we determined the companies were seeing a deterioration in their respective durable competitive advantage. We did not like IBM's earnings profile going forward and we have been trading out of Exxon throughout the year into Chevron Corp. (CVX) as a more attractive integrated energy company investment.
On the fixed income side of the portfolio, the big market news was the return of a normal treasury yield curve, where longer maturity issues have a higher yield than shorter maturity debt. As the FED reversed course and began to ease short term rates, longer rates remained stable and fixed income securities in general saw a recovery from a difficult 2018. While U.S. government treasuries rose 7% overall, the market for corporate debt was up 14%. Our overweight allocation towards corporate debt helped the fixed income returns in 2019. Looking forward, the FED has indicated it will be "data driven" and move on interest rates only if and when indicators of inflation or unemployment prompt them to act. We anticipate rates will remain around their current levels as the FED sits on the sidelines.
As we finish year 11 of the longest bull market in history at all-time highs, we are by some measures in unprecedented territory. Even so, the tools we have relied on in the past to evaluate risk and reward have continued to work and provide us attractive investment opportunities.
Kevin V. Earley
Lead Manager | | Robert W. Thompson
Co-Manager | |
12
MAIRS & POWER BALANCED FUND (unaudited) (continued)
The Fund's investment objective, risks, charges and expenses must be considered carefully before investing. The summary prospectus or full prospectus contains this and other important information about the Fund and they may be obtained by calling Shareholder Services at (800) 304-7404 or by visiting www.mairsandpower.com. Read the summary prospectus or full prospectus carefully before investing.
All holdings in the portfolio are subject to change without notice and may or may not represent current or future portfolio composition. The mention of specific securities is not intended as a recommendation or an offer of a particular security, nor is it intended to be a solicitation for the purchase or sale of any security.
All investments have risks. The Balanced Fund is designed for long-term investors. Equity investments are subject to market fluctuations and the Fund's share price can fall because of weakness in the broad market, a particular industry or specific holdings. Investments in small and midcap companies generally are more volatile. International investing risks include among others political, social or economic instability, difficulty in predicting international trade patterns, taxation and foreign trading practices, and greater fluctuations in price than U.S. corporations. The Fund is subject to yield and share price variances with changes in interest rates and market conditions. Investors should note that if interest rates rise significantly from current levels, bond total returns will decline and may even turn negative in the short-term. There is also a chance that some of the Fund's holdings may have their credit rating downgraded or may default.
Investments in debt securities typically decrease in value when interest rates rise. This risk is usually greater for longer-term debt securities. Investments in lower rated and non-rated securities present a greater risk of loss to principal and interest than higher rated securities.
This commentary includes forward-looking statements such as economic predictions and portfolio manager opinions. The statements are subject to change at any time based on market and other conditions. No predictions, forecasts, outlooks, expectations or beliefs are guaranteed.
Diversification does not guarantee profit or protect against loss.
Composite Index reflects an unmanaged portfolio of 60% of the S&P 500 TR Index and 40% of the Bloomberg Barclays U.S. Government/Credit Bond Index. It is not possible to invest directly in an index.
Morningstar Moderate Target Risk Index is designed to benchmark target-date and target-risk investment products. Index is based on well-established asset allocation methodology from Ibbotson Associates, a Morningstar company. Index has 60% global equity exposure and 40% global bond exposure. It is not possible to invest directly in an index.
S&P 500 TR (Total Return) Index is an unmanaged index of 500 common stocks that is generally considered representative of the U.S. stock market. It tracks both the capital gains of a group of stocks over time and assumes that any cash distributions, such as dividends, are reinvested back into the index. It is not possible to invest directly in an index.
Bloomberg Barclays U.S. Government/Credit Bond Index is a broad-based flagship benchmark that measures the non-securitized component of the U.S. Aggregate Index. It includes investment-grade, U.S. dollar-denominated, fixed-rate Treasuries, government-related and corporate securities. It is not possible to invest directly in an index.
13
Mairs & Power Balanced Fund
PERFORMANCE INFORMATION (unaudited) December 31, 2019
Ten years of investment performance (through December 31, 2019)
This chart illustrates the performance of a hypothetical $10,000 investment made in the Fund 10 years ago.
Average annual total returns for periods ended December 31, 2019
| | | 1 year | | 5 years | | 10 years | | 20 years | |
Mairs & Power Balanced Fund | | | 20.32 | % | | | 7.28 | % | | | 9.78 | % | | | 7.64 | % | |
Composite Index(1) | | | 22.64 | % | | | 8.45 | % | | | 9.87 | % | | | 6.00 | % | |
S&P 500 Total Return Index(2) | | | 31.49 | % | | | 11.70 | % | | | 13.56 | % | | | 6.06 | % | |
Bloomberg Barclays U.S.
Government/Credit Bond Index(3) | | | 9.71 | % | | | 3.23 | % | | | 3.96 | % | | | 5.14 | % | |
Performance data quoted represents past performance and does not guarantee future results. All performance information shown includes the reinvestment of dividend and capital gain distributions, but does not reflect the deduction of taxes that a shareholder would pay on Fund distributions or the redemption of Fund shares. The investment return and principal value of an investment will fluctuate so that an investor's shares, when redeemed, may be worth more or less than their original cost. Current performance of the Fund may be lower or higher than the performance quoted. For the most recent month-end performance figures, visit the Fund's website at www.mairsandpower.com or call Shareholder Services at (800) 304-7404. Per the Prospectus dated April 30, 2019, the expense ratio for the Fund is 0.72%.
(1) The Composite Index reflects an unmanaged portfolio comprised of 60% of the S&P 500 Total Return Index and 40% of the Bloomberg Barclays U.S. Government/Credit Bond Index. It is not possible to invest directly in an index.
(2) The S&P 500 Total Return Index is an unmanaged index of 500 common stocks that is generally considered representative of the U.S. stock market. It tracks both the capital gains of a group of stocks over time and assumes that any cash distributions, such as dividends, are reinvested back into the index. It is not possible to invest directly in an index.
(3) The Bloomberg Barclays U.S. Government/Credit Bond Index is a broad-based flagship benchmark that measures the non-securitized component of the U.S. Aggregate Index. It includes investment-grade, U.S. dollar-denominated, fixed-rate treasuries, government-related and corporate securities. It is not possible to invest directly in an index.
14
Mairs & Power Balanced Fund
FUND INFORMATION (unaudited) December 31, 2019
Portfolio Managers
Kevin V. Earley, CFA, lead manager since April 1, 2018, co-manager from January 1, 2015 through April 1, 2018, University of Minnesota, MBA Finance 1990
Robert W. Thompson, CFA, co-manager since April 1, 2018, University of Minnesota, MBA Finance 1995
General Information
Fund Symbol | | MAPOX | |
Net Asset Value (NAV) Per Share | | $ | 99.74 | | |
Expense Ratio | | | 0.71 | % | |
Portfolio Turnover Rate | | | 13.60 | % | |
Sales Charge | | | None1 | | |
Fund Inception Year | | | 1961 | | |
Portfolio Composition
Top Ten Common Stock Holdings
(Percent of Total Net Assets) 2
US Bancorp/MN | | | 3.1 | % | |
Alphabet Inc | | | 2.9 | | |
Medtronic PLC | | | 2.6 | | |
| 3M Co | | | 2.4 | | |
Johnson & Johnson | | | 2.3 | | |
Microsoft Corp | | | 2.2 | | |
UnitedHealth Group Inc | | | 2.2 | | |
Ecolab Inc | | | 2.2 | | |
JPMorgan Chase & Co | | | 2.1 | | |
Eli Lilly & Co | | | 2.0 | | |
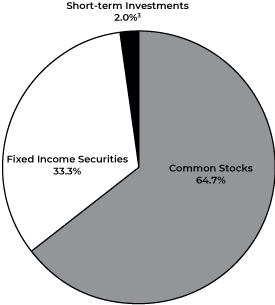
Portfolio Diversification
(Percent of Total Net Assets)
Fixed Income Securities 33.3% | |
Corporate Bonds | | | 28.8 | % | |
Asset Backed Securities | | | 2.8 | | |
U.S. Government Obligations | | | 1.2 | | |
Municipal Bonds | | | 0.5 | | |
Common Stocks 64.7% | |
Health Care | | | 16.2 | | |
Industrials | | | 14.2 | | |
Financials | | | 11.7 | | |
Information Technology | | | 5.6 | | |
Communications Services | | | 4.7 | | |
Materials | | | 4.0 | | |
Consumer Staples | | | 3.8 | | |
Energy | | | 2.2 | | |
Consumer Discretionary | | | 1.8 | | |
Utilities | | | 0.4 | | |
Real Estate | | | 0.1 | | |
Short-term Investments 2.0%3 | | | 2.0 | | |
| | | | 100.0 | % | |
1 Although the Fund is no-load, investment management fees and other expenses still apply.
2 All holdings in the portfolio are subject to change without notice and may or may not represent current or future portfolio composition. The mention of specific securities is not intended as a recommendation or offer for a particular security, nor is it intended to be a solicitation for the purchase or sale of any security.
3 Represents short-term investments and other assets and liabilities (net).
The Schedule of Investments and portfolio diversification utilize the Global Industry Classification Standard (GICS®) which was developed by and/or is the exclusive property of MSCI, Inc. and Standard & Poor's Financial Services LLC ("S&P"). GICS is a service mark of MSCI, Inc. and S&P and has been licensed for use by the Adviser.
15
Mairs & Power Balanced Fund
SCHEDULE OF INVESTMENTS December 31, 2019
Par Value | | Security Description | | Fair Value | |
| | | FIXED INCOME SECURITIES 33.3% | |
| | | CORPORATE BONDS 28.8% | |
| | | COMMUNICATION SERVICES 1.3% | |
$ | 1,000,000 | | | Time Warner Cable Inc | | | 4.125 | % | | 02/15/21 | | $ | 1,016,186 | | |
| | 1,150,000 | | | AT&T Inc | | | 3.800 | % | | 03/01/24 | | | 1,220,562 | | |
| | 2,000,000 | | | Viacom Inc | | | 3.875 | % | | 04/01/24 | | | 2,117,984 | | |
| | 500,000 | | | Interpublic Group of Cos Inc/The | | | 4.200 | % | | 04/15/24 | | | 538,358 | | |
| | 1,000,000 | | | CBS Corp | | | 3.500 | % | | 01/15/25 | | | 1,046,509 | | |
| | 1,688,000 | | | Netflix Inc | | | 5.875 | % | | 11/15/28 | | | 1,871,249 | | |
| | 2,000,000 | | | Comcast Corp | | | 4.250 | % | | 01/15/33 | | | 2,318,164 | | |
| | 1,000,000 | | | Verizon Communications Inc | | | 4.400 | % | | 11/01/34 | | | 1,159,257 | | |
| | 1,000,000 | | | AT&T Inc | | | 4.500 | % | | 05/15/35 | | | 1,114,328 | | |
| | | | 12,402,597 | | |
| | | CONSUMER DISCRETIONARY 2.4% | |
| | 1,000,000 | | | Best Buy Co Inc | | | 5.500 | % | | 03/15/21 | | | 1,032,157 | | |
| | 1,000,000 | | | Harley-Davidson Financial Services Inc (g) | | | 4.050 | % | | 02/04/22 | | | 1,032,471 | | |
| | 1,000,000 | | | eBay Inc | | | 3.800 | % | | 03/09/22 | | | 1,033,790 | | |
| | 500,000 | | | Whirlpool Corp | | | 4.700 | % | | 06/01/22 | | | 529,045 | | |
| | 1,000,000 | | | Block Financial LLC | | | 5.500 | % | | 11/01/22 | | | 1,072,979 | | |
| | 1,000,000 | | | General Motors Financial Co Inc | | | 3.700 | % | | 05/09/23 | | | 1,030,990 | | |
| | 1,000,000 | | | General Motors Financial Co Inc | | | 4.250 | % | | 05/15/23 | | | 1,053,257 | | |
| | 2,702,000 | | | LKQ Corp | | | 4.750 | % | | 05/15/23 | | | 2,744,692 | | |
| | 1,000,000 | | | Advance Auto Parts Inc | | | 4.500 | % | | 12/01/23 | | | 1,071,897 | | |
| | 1,000,000 | | | General Motors Financial Co Inc | | | 3.950 | % | | 04/13/24 | | | 1,045,455 | | |
| | 2,000,000 | | | Coach Inc | | | 4.250 | % | | 04/01/25 | | | 2,117,380 | | |
| | 250,000 | | | General Motors Co | | | 4.000 | % | | 04/01/25 | | | 263,561 | | |
| | 1,000,000 | | | General Motors Financial Co Inc | | | 4.300 | % | | 07/13/25 | | | 1,068,944 | | |
| | 1,064,000 | | | Block Financial LLC | | | 5.250 | % | | 10/01/25 | | | 1,169,207 | | |
| | 2,500,000 | | | Ford Motor Co | | | 4.346 | % | | 12/08/26 | | | 2,583,297 | | |
| | 1,000,000 | | | General Motors Co | | | 4.200 | % | | 10/01/27 | | | 1,045,894 | | |
| | 1,000,000 | | | AutoNation Inc | | | 3.800 | % | | 11/15/27 | | | 1,016,397 | | |
| | 1,000,000 | | | Metropolitan Opera Association Inc | | | 4.349 | % | | 10/01/32 | | | 1,047,883 | | |
| | 750,000 | | | Hasbro Inc | | | 5.100 | % | | 05/15/44 | | | 745,891 | | |
| | | | 22,705,187 | | |
| | | CONSUMER STAPLES 1.3% | |
| | 2,430,000 | | | Land O' Lakes Inc (g) | | | 6.000 | % | | 11/15/22 | | | 2,578,838 | | |
| | 1,000,000 | | | Walgreens Boots Alliance Inc | | | 3.800 | % | | 11/18/24 | | | 1,042,401 | | |
| | 500,000 | | | Land O' Lakes Inc (g) | | | 7.250 | % | | 07/14/27 | | | 477,500 | | |
| | 1,949,000 | | | Land O' Lakes Capital Trust I (g) | | | 7.450 | % | | 03/15/28 | | | 2,187,752 | | |
16
Mairs & Power Balanced Fund
SCHEDULE OF INVESTMENTS (continued) December 31, 2019
Par Value | | Security Description | | Fair Value | |
| | | FIXED INCOME SECURITIES (continued) | |
| | | CORPORATE BONDS (continued) | |
| | | CONSUMER STAPLES (continued) | |
$ | 2,500,000 | | | Land O' Lakes Inc (g) | | | 7.000 | % | | 12/18/28 | | $ | 2,325,000 | | |
| | 1,000,000 | | | Anheuser-Busch Cos LLC / Anheuser-Busch InBev Worldwide Inc | | | 4.700 | % | | 02/01/36 | | | 1,158,754 | | |
| | 1,000,000 | | | Walgreens Boots Alliance Inc | | | 4.800 | % | | 11/18/44 | | | 1,013,385 | | |
| | 1,000,000 | | | Molson Coors Brewing Co | | | 4.200 | % | | 07/15/46 | | | 998,150 | | |
| | | | 11,781,780 | | |
| | | ENERGY 0.9% | |
| | 1,170,000 | | | ONEOK Inc | | | 4.250 | % | | 02/01/22 | | | 1,214,148 | | |
| | 140,000 | | | Gulf South Pipeline Co LP | | | 4.000 | % | | 06/15/22 | | | 144,277 | | |
| | 1,020,000 | | | TechnipFMC PLC (b) | | | 3.450 | % | | 10/01/22 | | | 1,041,986 | | |
| | 1,500,000 | | | Sunoco Logistics Partners Operations LP | | | 3.450 | % | | 01/15/23 | | | 1,525,653 | | |
| | 2,300,000 | | | Murphy Oil Corp | | | 6.875 | % | | 08/15/24 | | | 2,426,500 | | |
| | 500,000 | | | Kinder Morgan Energy Partners LP | | | 4.250 | % | | 09/01/24 | | | 535,534 | | |
| | 1,000,000 | | | Boardwalk Pipelines LP | | | 4.950 | % | | 12/15/24 | | | 1,081,937 | | |
| | 500,000 | | | Murphy Oil Corp (f) | | | 5.625 | % | | 12/01/42 | | | 460,000 | | |
| | | | 8,430,035 | | |
| | | FINANCIALS 12.1% | |
| | 500,000 | | | Credit Suisse/New York NY (b) | | | 5.400 | % | | 01/14/20 | | | 500,469 | | |
| | 500,000 | | | Morgan Stanley | | | 5.500 | % | | 01/26/20 | | | 501,062 | | |
| | 500,000 | | | Hartford Financial Services Group Inc/The | | | 5.500 | % | | 03/30/20 | | | 504,208 | | |
| | 450,000 | | | Compass Bank | | | 5.500 | % | | 04/01/20 | | | 453,636 | | |
| | 1,000,000 | | | HSBC Holdings PLC (b) | | | 3.400 | % | | 03/08/21 | | | 1,015,889 | | |
| | 1,000,000 | | | Nationwide Financial Services Inc (g) | | | 5.375 | % | | 03/25/21 | | | 1,038,726 | | |
| | 1,000,000 | | | Capital One Financial Corp | | | 4.750 | % | | 07/15/21 | | | 1,041,447 | | |
| | 500,000 | | | Goldman Sachs Group Inc/The | | | 5.250 | % | | 07/27/21 | | | 524,710 | | |
| | 3,000,000 | | | Primerica Inc | | | 4.750 | % | | 07/15/22 | | | 3,176,130 | | |
| | 2,833,000 | | | Infinity Property & Casualty Corp | | | 5.000 | % | | 09/19/22 | | | 3,008,274 | | |
| | 2,000,000 | | | OneBeacon US Holdings Inc | | | 4.600 | % | | 11/09/22 | | | 2,109,497 | | |
| | 1,000,000 | | | Standard Chartered PLC (b) (g) | | | 3.950 | % | | 01/11/23 | | | 1,031,073 | | |
| | 500,000 | | | First American Financial Corp | | | 4.300 | % | | 02/01/23 | | | 517,935 | | |
| | 2,000,000 | | | Wells Fargo & Co | | | 3.450 | % | | 02/13/23 | | | 2,071,276 | | |
| | 4,073,000 | | | Assurant Inc | | | 4.000 | % | | 03/15/23 | | | 4,259,813 | | |
| | 1,500,000 | | | Citigroup Inc | | | 3.500 | % | | 05/15/23 | | | 1,561,252 | | |
| | 500,000 | | | Morgan Stanley | | | 4.100 | % | | 05/22/23 | | | 527,980 | | |
| | 3,000,000 | | | Liberty Mutual Group Inc (g) | | | 4.250 | % | | 06/15/23 | | | 3,188,095 | | |
| | 500,000 | | | Assurant Inc | | | 4.200 | % | | 09/27/23 | | | 522,013 | | |
| | 500,000 | | | CNA Financial Corp | | | 7.250 | % | | 11/15/23 | | | 584,684 | | |
17
Mairs & Power Balanced Fund
SCHEDULE OF INVESTMENTS (continued) December 31, 2019
Par Value | | Security Description | | Fair Value | |
| | | FIXED INCOME SECURITIES (continued) | |
| | | CORPORATE BONDS (continued) | |
| | | FINANCIALS (continued) | |
$ | 500,000 | | | Pacific Life Insurance Co (g) | | | 7.900 | % | | 12/30/23 | | $ | 587,110 | | |
| | 1,000,000 | | | Moody's Corp | | | 4.875 | % | | 02/15/24 | | | 1,099,741 | | |
| | 1,000,000 | | | HSBC Holdings PLC (b) | | | 4.250 | % | | 03/14/24 | | | 1,061,148 | | |
| | 1,000,000 | | | NASDAQ OMX Group Inc/The | | | 4.250 | % | | 06/01/24 | | | 1,076,617 | | |
| | 540,000 | | | Wintrust Financial Corp | | | 5.000 | % | | 06/13/24 | | | 566,513 | | |
| | 2,250,000 | | | Assured Guaranty US Holdings Inc | | | 5.000 | % | | 07/01/24 | | | 2,503,090 | | |
| | 3,088,000 | | | Legg Mason Inc | | | 3.950 | % | | 07/15/24 | | | 3,254,881 | | |
| | 1,500,000 | | | Symetra Financial Corp | | | 4.250 | % | | 07/15/24 | | | 1,585,845 | | |
| | 1,500,000 | | | Stifel Financial Corp | | | 4.250 | % | | 07/18/24 | | | 1,597,154 | | |
| | 1,000,000 | | | Citigroup Inc | | | 4.000 | % | | 08/05/24 | | | 1,071,025 | | |
| | 3,000,000 | | | Synchrony Financial | | | 4.250 | % | | 08/15/24 | | | 3,202,045 | | |
| | 1,000,000 | | | Bank of America Corp | | | 4.200 | % | | 08/26/24 | | | 1,073,814 | | |
| | 2,800,000 | | | Brown & Brown Inc | | | 4.200 | % | | 09/15/24 | | | 2,978,727 | | |
| | 2,000,000 | | | Old Republic International Corp | | | 4.875 | % | | 10/01/24 | | | 2,193,361 | | |
| | 2,000,000 | | | TIAA Asset Management Finance Co LLC (g) | | | 4.125 | % | | 11/01/24 | | | 2,173,491 | | |
| | 3,000,000 | | | American Express Co | | | 3.625 | % | | 12/05/24 | | | 3,171,839 | | |
| | 3,500,000 | | | Associated Banc-Corp | | | 4.250 | % | | 01/15/25 | | | 3,700,193 | | |
| | 4,000,000 | | | Kemper Corp | | | 4.350 | % | | 02/15/25 | | | 4,253,899 | | |
| | 1,050,000 | | | TCF National Bank | | | 4.600 | % | | 02/27/25 | | | 1,088,444 | | |
| | 1,000,000 | | | BBVA USA | | | 3.875 | % | | 04/10/25 | | | 1,050,579 | | |
| | 250,000 | | | Liberty Mutual Insurance Co (g) | | | 8.500 | % | | 05/15/25 | | | 311,396 | | |
| | 1,000,000 | | | Prudential Insurance Co of America/The (g) | | | 8.300 | % | | 07/01/25 | | | 1,284,008 | | |
| | 3,000,000 | | | American International Group Inc | | | 3.750 | % | | 07/10/25 | | | 3,211,039 | | |
| | 1,000,000 | | | Synchrony Financial | | | 4.500 | % | | 07/23/25 | | | 1,079,010 | | |
| | 2,000,000 | | | Janus Capital Group Inc (b) | | | 4.875 | % | | 08/01/25 | | | 2,178,741 | | |
| | 3,000,000 | | | HSBC Holdings PLC (b) | | | 4.250 | % | | 08/18/25 | | | 3,208,622 | | |
| | 4,000,000 | | | Capital One Financial Corp | | | 4.200 | % | | 10/29/25 | | | 4,317,939 | | |
| | 1,520,000 | | | Legg Mason Inc | | | 4.750 | % | | 03/15/26 | | | 1,664,045 | | |
| | 2,000,000 | | | Hanover Insurance Group Inc/The | | | 4.500 | % | | 04/15/26 | | | 2,156,803 | | |
| | 1,000,000 | | | Wells Fargo & Co | | | 4.100 | % | | 06/03/26 | | | 1,078,408 | | |
| | 2,000,000 | | | MSCI Inc (g) | | | 4.750 | % | | 08/01/26 | | | 2,095,000 | | |
| | 3,290,000 | | | Old Republic International Corp | | | 3.875 | % | | 08/26/26 | | | 3,468,051 | | |
| | 500,000 | | | Morgan Stanley | | | 4.350 | % | | 09/08/26 | | | 546,942 | | |
| | 500,000 | | | Raymond James Financial Inc | | | 3.625 | % | | 09/15/26 | | | 528,559 | | |
| | 1,000,000 | | | Citigroup Inc | | | 4.300 | % | | 11/20/26 | | | 1,088,950 | | |
| | 1,000,000 | | | JPMorgan Chase & Co | | | 4.125 | % | | 12/15/26 | | | 1,095,543 | | |
| | 4,000,000 | | | Mercury General Corp | | | 4.400 | % | | 03/15/27 | | | 4,205,660 | | |
18
Mairs & Power Balanced Fund
SCHEDULE OF INVESTMENTS (continued) December 31, 2019
Par Value | | Security Description | | Fair Value | |
| | | FIXED INCOME SECURITIES (continued) | |
| | | CORPORATE BONDS (continued) | |
| | | FINANCIALS (continued) | |
$ | 450,000 | | | Athene Holding Ltd (b) | | | 4.125 | % | | 01/12/28 | | $ | 465,952 | | |
| | 250,000 | | | Provident Cos Inc | | | 7.250 | % | | 03/15/28 | | | 309,264 | | |
| | 2,000,000 | | | E*TRADE Financial Corp | | | 4.500 | % | | 06/20/28 | | | 2,175,720 | | |
| | 500,000 | | | Farmers Exchange Capital (g) | | | 7.050 | % | | 07/15/28 | | | 612,182 | | |
| | 1,000,000 | | | Lazard Group LLC | | | 4.375 | % | | 03/11/29 | | | 1,089,936 | | |
| | 500,000 | | | Goldman Sachs Group Inc/The | | | 4.250 | % | | 11/15/30 | | | 532,022 | | |
| | 500,000 | | | Goldman Sachs Group Inc/The | | | 4.000 | % | | 02/15/31 | | | 512,146 | | |
| | 500,000 | | | Goldman Sachs Group Inc/The | | | 4.300 | % | | 12/15/32 | | | 524,168 | | |
| | 538,000 | | | Bank of America Corp | | | 4.000 | % | | 08/15/34 | | | 551,719 | | |
| | 1,000,000 | | | Goldman Sachs Group Inc/The | | | 4.000 | % | | 01/30/35 | | | 978,165 | | |
| | 300,000 | | | Goldman Sachs Group Inc/The (f) | | | 3.750 | % | | 05/31/36 | | | 298,578 | | |
| | 500,000 | | | Swiss Re Treasury US Corp (g) | | | 4.250 | % | | 12/06/42 | | | 577,790 | | |
| | 500,000 | | | Principal Financial Group Inc | | | 4.350 | % | | 05/15/43 | | | 552,297 | | |
| | 2,500,000 | | | M&T Bank Corp (f) | | | 5.125 | % | | 12/29/49 | | | 2,709,375 | | |
| | | | 112,835,715 | | |
| | | HEALTH CARE 1.7% | |
| | 1,000,000 | | | Quest Diagnostics Inc | | | 4.700 | % | | 04/01/21 | | | 1,033,230 | | |
| | 1,000,000 | | | Laboratory Corp of America Holdings | | | 4.000 | % | | 11/01/23 | | | 1,058,446 | | |
| | 2,000,000 | | | Mylan Inc/PA | | | 4.200 | % | | 11/29/23 | | | 2,117,801 | | |
| | 500,000 | | | Wyeth LLC | | | 6.450 | % | | 02/01/24 | | | 586,118 | | |
| | 3,000,000 | | | Actavis Funding SCS (b) | | | 3.800 | % | | 03/15/25 | | | 3,152,723 | | |
| | 1,500,000 | | | Baxalta Inc | | | 4.000 | % | | 06/23/25 | | | 1,616,423 | | |
| | 1,000,000 | | | Bristol-Myers Squibb Co (g) | | | 3.875 | % | | 08/15/25 | | | 1,081,024 | | |
| | 1,000,000 | | | Biogen Inc | | | 4.050 | % | | 09/15/25 | | | 1,087,840 | | |
| | 1,000,000 | | | Cigna Corp (g) | | | 4.500 | % | | 02/25/26 | | | 1,097,381 | | |
| | 1,400,000 | | | CVS Health Corp | | | 4.780 | % | | 03/25/38 | | | 1,591,617 | | |
| | 1,000,000 | | | UnitedHealth Group Inc | | | 3.500 | % | | 08/15/39 | | | 1,050,189 | | |
| | | | 15,472,792 | | |
| | | INDUSTRIALS 2.3% | |
| | 500,000 | | | IDEX Corp | | | 4.200 | % | | 12/15/21 | | | 514,399 | | |
| | 500,000 | | | GATX Corp | | | 4.750 | % | | 06/15/22 | | | 528,469 | | |
| | 500,000 | | | Penske Truck Leasing Co Lp / PTL Finance Corp (g) | | | 4.875 | % | | 07/11/22 | | | 531,845 | | |
| | 1,850,000 | | | MasTec Inc | | | 4.875 | % | | 03/15/23 | | | 1,873,125 | | |
| | 1,000,000 | | | GATX Corp | | | 3.900 | % | | 03/30/23 | | | 1,044,212 | | |
| | 1,000,000 | | | Flowserve Corp | | | 4.000 | % | | 11/15/23 | | | 1,032,674 | | |
| | 2,126,000 | | | Air Lease Corp | | | 4.850 | % | | 02/01/24 | | | 2,128,021 | | |
| | 2,717,000 | | | Oshkosh Corp | | | 5.375 | % | | 03/01/25 | | | 2,801,906 | | |
19
Mairs & Power Balanced Fund
SCHEDULE OF INVESTMENTS (continued) December 31, 2019
Par Value | | Security Description | | Fair Value | |
| | | FIXED INCOME SECURITIES (continued) | |
| | | CORPORATE BONDS (continued) | |
| | | INDUSTRIALS (continued) | |
$ | 2,350,000 | | | Tennant Co | | | 5.625 | % | | 05/01/25 | | $ | 2,455,750 | | |
| | 1,500,000 | | | Hillenbrand Inc | | | 4.500 | % | | 09/15/26 | | | 1,568,965 | | |
| | 500,000 | | | Toro Co/The | | | 7.800 | % | | 06/15/27 | | | 620,783 | | |
| | 500,000 | | | Fluor Corp | | | 4.250 | % | | 09/15/28 | | | 503,527 | | |
| | 2,000,000 | | | Steelcase Inc | | | 5.125 | % | | 01/18/29 | | | 2,262,715 | | |
| | 2,000,000 | | | Eaton Corp | | | 4.000 | % | | 11/02/32 | | | 2,269,120 | | |
| | 1,000,000 | | | FedEx Corp | | | 4.100 | % | | 04/15/43 | | | 980,279 | | |
| | | | 21,115,790 | | |
| | | INFORMATION TECHNOLOGY 4.1% | |
| | 500,000 | | | Broadridge Financial Solutions Inc | | | 3.950 | % | | 09/01/20 | | | 506,311 | | |
| | 81,000 | | | Hewlett-Packard Co | | | 3.750 | % | | 12/01/20 | | | 82,164 | | |
| | 750,000 | | | Hewlett-Packard Co | | | 4.300 | % | | 06/01/21 | | | 772,453 | | |
| | 500,000 | | | Diamond 1 Finance Corp / Diamond 2 Finance Corp (g) | | | 4.420 | % | | 06/15/21 | | | 514,556 | | |
| | 2,000,000 | | | NetApp Inc | | | 3.375 | % | | 06/15/21 | | | 2,033,358 | | |
| | 1,500,000 | | | Symantec Corp | | | 3.950 | % | | 06/15/22 | | | 1,537,936 | | |
| | 500,000 | | | Western Union Co/The | | | 4.250 | % | | 06/09/23 | | | 528,326 | | |
| | 2,000,000 | | | Diamond 1 Finance Corp / Diamond 2 Finance Corp (g) | | | 5.450 | % | | 06/15/23 | | | 2,169,479 | | |
| | 1,000,000 | | | Juniper Networks Inc | | | 4.500 | % | | 03/15/24 | | | 1,082,386 | | |
| | 700,000 | | | DXC Technology Co | | | 4.250 | % | | 04/15/24 | | | 743,613 | | |
| | 500,000 | | | Motorola Solutions Inc | | | 4.000 | % | | 09/01/24 | | | 530,599 | | |
| | 2,000,000 | | | Lam Research Corp | | | 3.800 | % | | 03/15/25 | | | 2,135,425 | | |
| | 1,031,000 | | | Arrow Electronics Inc | | | 4.000 | % | | 04/01/25 | | | 1,087,013 | | |
| | 2,000,000 | | | Autodesk Inc | | | 4.375 | % | | 06/15/25 | | | 2,184,419 | | |
| | 1,000,000 | | | Juniper Networks Inc | | | 4.350 | % | | 06/15/25 | | | 1,076,087 | | |
| | 2,000,000 | | | Hewlett Packard Enterprise Co (f) | | | 4.900 | % | | 10/15/25 | | | 2,223,159 | | |
| �� | 1,500,000 | | | Dell International LLC / EMC Corp (g) | | | 6.020 | % | | 06/15/26 | | | 1,726,800 | | |
| | 1,000,000 | | | DXC Technology Co | | | 4.750 | % | | 04/15/27 | | | 1,077,085 | | |
| | 2,000,000 | | | Motorola Solutions Inc | | | 4.600 | % | | 02/23/28 | | | 2,169,179 | | |
| | 1,500,000 | | | Trimble Inc | | | 4.900 | % | | 06/15/28 | | | 1,638,677 | | |
| | 1,000,000 | | | Fiserv Inc | | | 4.200 | % | | 10/01/28 | | | 1,109,247 | | |
| | 1,500,000 | | | Broadcom Inc (g) | | | 4.750 | % | | 04/15/29 | | | 1,640,224 | | |
| | 1,000,000 | | | Juniper Networks Inc | | | 3.750 | % | | 08/15/29 | | | 1,040,165 | | |
| | 1,000,000 | | | Dell International LLC / EMC Corp (g) | | | 5.300 | % | | 10/01/29 | | | 1,127,589 | | |
| | 3,000,000 | | | Intel Corp | | | 4.000 | % | | 12/15/32 | | | 3,500,093 | | |
| | 2,000,000 | | | Leidos Inc | | | 5.500 | % | | 07/01/33 | | | 2,050,000 | | |
| | 1,500,000 | | | Western Union Co/The | | | 6.200 | % | | 11/17/36 | | | 1,711,068 | | |
| | | | 37,997,411 | | |
20
Mairs & Power Balanced Fund
SCHEDULE OF INVESTMENTS (continued) December 31, 2019
Par Value | | Security Description | | Fair Value | |
| | | FIXED INCOME SECURITIES (continued) | |
| | | CORPORATE BONDS (continued) | |
| | | MATERIALS 1.9% | |
$ | 500,000 | | | Carpenter Technology Corp | | | 5.200 | % | | 07/15/21 | | $ | 512,627 | | |
| | 175,000 | | | Mosaic Co/The | | | 3.750 | % | | 11/15/21 | | | 179,991 | | |
| | 500,000 | | | Barrick Gold Corp (b) | | | 3.850 | % | | 04/01/22 | | | 520,380 | | |
| | 1,000,000 | | | Domtar Corp | | | 4.400 | % | | 04/01/22 | | | 1,035,154 | | |
| | 1,000,000 | | | RPM International Inc | | | 3.450 | % | | 11/15/22 | | | 1,025,322 | | |
| | 2,000,000 | | | Mosaic Co/The | | | 4.250 | % | | 11/15/23 | | | 2,133,649 | | |
| | 1,000,000 | | | Steel Dynamics Inc | | | 5.500 | % | | 10/01/24 | | | 1,030,108 | | |
| | 1,000,000 | | | Freeport-McMoRan Inc | | | 4.550 | % | | 11/14/24 | | | 1,057,080 | | |
| | 756,000 | | | Eastman Chemical Co | | | 3.800 | % | | 03/15/25 | | | 797,566 | | |
| | 865,000 | | | Union Carbide Corp | | | 7.500 | % | | 06/01/25 | | | 1,051,814 | | |
| | 2,000,000 | | | DowDuPont Inc | | | 4.493 | % | | 11/15/25 | | | 2,202,778 | | |
| | 200,000 | | | Worthington Industries Inc | | | 4.550 | % | | 04/15/26 | | | 212,782 | | |
| | 782,000 | | | HB Fuller Co | | | 4.000 | % | | 02/15/27 | | | 774,180 | | |
| | 1,500,000 | | | Cabot Corp | | | 4.000 | % | | 07/01/29 | | | 1,573,373 | | |
| | 1,250,000 | | | Dow Chemical Co/The | | | 4.250 | % | | 10/01/34 | | | 1,367,758 | | |
| | 1,000,000 | | | Alcoa Inc | | | 5.950 | % | | 02/01/37 | | | 1,111,150 | | |
| | 1,000,000 | | | Newmont Mining Corp | | | 4.875 | % | | 03/15/42 | | | 1,170,930 | | |
| | | | 17,756,642 | | |
| | | REAL ESTATE 0.2% | |
| | 1,000,000 | | | CBRE Services Inc | | | 5.250 | % | | 03/15/25 | | | 1,125,475 | | |
| | 350,000 | | | CBRE Services Inc | | | 4.875 | % | | 03/01/26 | | | 390,240 | | |
| | | | 1,515,715 | | |
| | | UTILITIES 0.6% | |
| | 1,065,000 | | | National Fuel Gas Co | | | 3.750 | % | | 03/01/23 | | | 1,099,417 | | |
| | 1,060,000 | | | PSEG Power LLC | | | 4.300 | % | | 11/15/23 | | | 1,121,325 | | |
| | 250,000 | | | Jersey Central Power & Light Co (g) | | | 4.300 | % | | 01/15/26 | | | 272,241 | | |
| | 2,000,000 | | | National Fuel Gas Co | | | 3.950 | % | | 09/15/27 | | | 2,072,502 | | |
| | 1,000,000 | | | National Fuel Gas Co | | | 4.750 | % | | 09/01/28 | | | 1,071,096 | | |
| | | | 5,636,581 | | |
| | | TOTAL CORPORATE BONDS | | | 267,650,245 | | |
| | | ASSET BACKED SECURITIES 2.8% | |
| | 328,664 | | | America West Airlines 2000-1 Pass Through Trust | | | 8.057 | % | | 07/02/20 | | | 335,851 | | |
| | 360,213 | | | American Airlines 2011-1 Class A Pass Through Trust | | | 5.250 | % | | 01/31/21 | | | 368,496 | | |
| | 269,524 | | | Air Canada 2013-1 Class B Pass Through Trust (b) (g) | | | 5.375 | % | | 05/15/21 | | | 276,957 | | |
| | 428,792 | | | Northwest Airlines 2002-1 Class G-2 Pass Through Trust | | | 6.264 | % | | 11/20/21 | | | 440,695 | | |
| | 294,882 | | | United Airlines 2014-1 Class B Pass Through Trust | | | 4.750 | % | | 04/11/22 | | | 303,723 | | |
21
Mairs & Power Balanced Fund
SCHEDULE OF INVESTMENTS (continued) December 31, 2019
Par Value | | Security Description | | Fair Value | |
| | | FIXED INCOME SECURITIES (continued) | |
| | | ASSET BACKED SECURITIES (continued) | |
$ | 152,094 | | | Continental Airlines 2007-1 Class A Pass Through Trust | | | 5.983 | % | | 04/19/22 | | $ | 160,109 | | |
| | 200,939 | | | Southwest Airlines Co 2007-1 Pass Through Trust | | | 6.150 | % | | 08/01/22 | | | 211,250 | | |
| | 492,849 | | | Delta Air Lines 2007-1 Class B Pass Through Trust | | | 8.021 | % | | 08/10/22 | | | 540,045 | | |
| | 46,997 | | | United Airlines 2014-2 Class B Pass Through Trust | | | 4.625 | % | | 09/03/22 | | | 49,168 | | |
| | 376,432 | | | American Airlines 2014-1 Class B Pass Through Trust | | | 4.375 | % | | 10/01/22 | | | 387,900 | | |
| | 1,000,000 | | | United Airlines 2015-1 Class A Pass Through Trust | | | 3.700 | % | | 12/01/22 | | | 1,020,756 | | |
| | 460,272 | | | US Airways 2010-1 Class A Pass Through Trust | | | 6.250 | % | | 04/22/23 | | | 495,099 | | |
| | 1,966,843 | | | American Airlines 2015-1 Class B Pass Through Trust | | | 3.700 | % | | 05/01/23 | | | 1,995,372 | | |
| | 1,100,033 | | | Delta Air Lines 2015-1 Class B Pass Through Trust | | | 4.250 | % | | 07/30/23 | | | 1,142,191 | | |
| | 652,083 | | | American Airlines 2015-2 Class B Pass Through Trust | | | 4.400 | % | | 09/22/23 | | | 673,423 | | |
| | 246,306 | | | US Airways 2011-1 Class A Pass Through Trust | | | 7.125 | % | | 10/22/23 | | | 277,742 | | |
| | 2,782,962 | | | American Airlines 2016-1 Class B Pass Through Trust | | | 5.250 | % | | 01/15/24 | | | 2,933,256 | | |
| | 867,400 | | | Spirit Airlines Pass Through Trust 2015-1B | | | 4.450 | % | | 04/01/24 | | | 893,787 | | |
| | 1,300,901 | | | Continental Airlines 2012-2 Class A Pass Through Trust | | | 4.000 | % | | 10/29/24 | | | 1,365,946 | | |
| | 952,270 | | | American Airlines 2017-1 Class B Pass Through Trust | | | 4.950 | % | | 02/15/25 | | | 997,133 | | |
| | 790,280 | | | United Airlines 2013-1 Class A Pass Through Trust | | | 4.300 | % | | 08/15/25 | | | 845,600 | | |
| | 823,233 | | | American Airlines 2016-3 Class B Pass Through Trust | | | 3.750 | % | | 10/15/25 | | | 831,941 | | |
| | 652,360 | | | US Airways 2013-1 Class A Pass Through Trust | | | 3.950 | % | | 11/15/25 | | | 684,188 | | |
| | 1,743,056 | | | United Airlines 2016-1 Class B Pass Through Trust | | | 3.650 | % | | 01/07/26 | | | 1,761,919 | | |
| | 1,836,059 | | | Hawaiian Airlines 2013-1 Class A Pass Through Certificates | | | 3.900 | % | | 01/15/26 | | | 1,857,511 | | |
| | 642,851 | | | United Airlines 2014-1 Class A Pass Through Trust | | | 4.000 | % | | 04/11/26 | | | 681,551 | | |
| | 537,653 | | | United Airlines 2014-2 Class A Pass Through Trust | | | 3.750 | % | | 09/03/26 | | | 564,840 | | |
| | 1,413,100 | | | American Airlines 2014-1 Class A Pass Through Trust | | | 3.700 | % | | 10/01/26 | | | 1,479,844 | | |
| | 361,543 | | | American Airlines 2015-1 Class A Pass Through Trust | | | 3.375 | % | | 05/01/27 | | | 374,977 | | |
| | 160,173 | | | American Airlines 2015-2 Class AA Pass Through Trust | | | 3.600 | % | | 09/22/27 | | | 168,295 | | |
| | 522,234 | | | American Airlines 2015-2 Class A Pass Through Trust | | | 4.000 | % | | 09/22/27 | | | 550,663 | | |
| | 103,296 | | | Spirit Airlines Pass Through Trust 2015-1A | | | 4.100 | % | | 04/01/28 | | | 106,667 | | |
| | 939,317 | | | British Airways 2018-1 Class A Pass Through Trust (b) (g) | | | 4.125 | % | | 09/20/31 | | | 992,069 | | |
| | | | 25,768,964 | | |
| | | MUNICIPAL BONDS 0.5% | |
| | 1,000,000 | | | Crowley Independent School District | | | 3.010 | % | | 08/01/38 | | | 982,820 | | |
| | 850,000 | | | Worthington Independent School District No 518 | | | 3.300 | % | | 02/01/39 | | | 837,403 | | |
| | 750,000 | | | Allen Independent School District | | | 3.148 | % | | 02/15/39 | | | 751,297 | | |
| | 610,000 | | | Rockwall Independent School District | | | 3.091 | % | | 02/15/39 | | | 616,051 | | |
| | 945,000 | | | City of Minnetonka MN | | | 3.050 | % | | 02/01/40 | | | 933,698 | | |
| | 800,000 | | | Utah Transit Authority | | | 3.443 | % | | 12/15/42 | | | 812,208 | | |
| | | | 4,933,477 | | |
22
Mairs & Power Balanced Fund
SCHEDULE OF INVESTMENTS (continued) December 31, 2019
Par Value | | Security Description | | Fair Value | |
| | | FIXED INCOME SECURITIES (continued) | |
| | | U.S. GOVERNMENT OBLIGATIONS 1.2% | |
$ | 8,000,000 | | | United States Treasury Note/Bond | | | 2.625 | % | | 02/15/29 | | $ | 8,484,375 | | |
| | 2,000,000 | | | United States Treasury Note/Bond | | | 3.000 | % | | 02/15/49 | | | 2,262,188 | | |
| | | | 10,746,563 | | |
| | TOTAL FIXED INCOME SECURITIES
(cost $292,871,596) | | $ | 309,099,249 | | |
| | | COMMON STOCKS 64.7% | |
| | | COMMUNICATION SERVICES 4.7% | |
| | 20,200 | | | Alphabet Inc (a) | | | | | | | | | | $ | 27,007,804 | | |
| | 115,000 | | | Walt Disney Co/The | | | | | | | | | | | 16,632,450 | | |
| | | | 43,640,254 | | |
| | | CONSUMER DISCRETIONARY 1.8% | |
| | 48,000 | | | Home Depot Inc/The | | | | | | | | | | | 10,482,240 | | |
| | 52,000 | | | Target Corp | | | | | | | | | | | 6,666,920 | | |
| | | | 17,149,160 | | |
| | | CONSUMER STAPLES 3.8% | |
| | 141,000 | | | General Mills Inc | | | | | | | | | | | 7,551,960 | | |
| | 53,000 | | | Hershey Co/The | | | | | | | | | | | 7,789,940 | | |
| | 355,000 | | | Hormel Foods Corp | | | | | | | | | | | 16,014,050 | | |
| | 29,000 | | | Kimberly-Clark Corp | | | | | | | | | | | 3,988,950 | | |
| | | | 35,344,900 | | |
| | | ENERGY 2.2% | |
| | 78,000 | | | Chevron Corp | | | | | | | | | | | 9,399,780 | | |
| | 263,000 | | | Schlumberger Ltd (b) | | | | | | | | | | | 10,572,600 | | |
| | | | 19,972,380 | | |
| | | FINANCIALS 11.7% | |
| | 129,000 | | | American Express Co | | | | | | | | | | | 16,059,210 | | |
| | 244,000 | | | Associated Banc-Corp | | | | | | | | | | | 5,377,760 | | |
| | 198,000 | | | Great Western Bancorp Inc | | | | | | | | | | | 6,878,520 | | |
| | 140,000 | | | JPMorgan Chase & Co | | | | | | | | | | | 19,516,000 | | |
| | 310,000 | | | Principal Financial Group Inc | | | | | | | | | | | 17,050,000 | | |
| | 27,000 | | | Travelers Cos Inc/The | | | | | | | | | | | 3,697,650 | | |
| | 482,000 | | | US Bancorp/MN | | | | | | | | | | | 28,577,780 | | |
| | 208,000 | | | Wells Fargo & Co | | | | | | | | | | | 11,190,400 | | |
| | | | 108,347,320 | | |
23
Mairs & Power Balanced Fund
SCHEDULE OF INVESTMENTS (continued) December 31, 2019
Par Value | | Security Description | | Fair Value | |
| | | COMMON STOCKS (continued) | |
| | | HEALTH CARE 16.2% | |
| | 196,000 | | | Abbott Laboratories | | $ | 17,024,560 | | |
| | 57,000 | | | Baxter International Inc | | | 4,766,340 | | |
| | 26,000 | | | Bio-Techne Corp | | | 5,707,260 | | |
| | 98,500 | | | Bristol-Myers Squibb Co | | | 6,322,715 | | |
| | 153,000 | | | Elanco Animal Health Inc (a) | | | 4,505,850 | | |
| | 141,000 | | | Eli Lilly & Co | | | 18,531,630 | | |
| | 149,000 | | | Johnson & Johnson | | | 21,734,630 | | |
| | 210,000 | | | Medtronic PLC (e) | | | 23,824,500 | | |
| | 253,000 | | | Pfizer Inc | | | 9,912,540 | | |
| | 437,000 | | | Roche Holding AG (d) | | | 17,768,420 | | |
| | 70,000 | | | UnitedHealth Group Inc | | | 20,578,600 | | |
| | | | 150,677,045 | | |
| | | INDUSTRIALS 14.2% | |
| | 126,000 | | | 3M Co | | | 22,228,920 | | |
| | 198,000 | | | CH Robinson Worldwide Inc | | | 15,483,600 | | |
| | 219,000 | | | Donaldson Co Inc | | | 12,618,780 | | |
| | 34,000 | | | Emerson Electric Co | | | 2,592,840 | | |
| | 234,000 | | | Fastenal Co | | | 8,646,300 | | |
| | 321,000 | | | Graco Inc | | | 16,692,000 | | |
| | 97,000 | | | Honeywell International Inc | | | 17,169,000 | | |
| | 203,000 | | | nVent Electric PLC (b) | | | 5,192,740 | | |
| | 137,000 | | | Pentair PLC (b) | | | 6,284,190 | | |
| | 11,000 | | | Rockwell Automation Inc | | | 2,229,370 | | |
| | 110,000 | | | Toro Co/The | | | 8,763,700 | | |
| | 118,000 | | | United Parcel Service Inc, Class B | | | 13,813,080 | | |
| | | | 131,714,520 | | |
| | | INFORMATION TECHNOLOGY 5.6% | |
| | 281,000 | | | Corning Inc | | | 8,179,910 | | |
| | 131,000 | | | Microsoft Corp | | | 20,658,700 | | |
| | 54,000 | | | Motorola Solutions Inc | | | 8,701,560 | | |
| | 100,000 | | | QUALCOMM Inc | | | 8,823,000 | | |
| | 30,000 | | | Visa Inc | | | 5,637,000 | | |
| | | | 52,000,170 | | |
| | | MATERIALS 4.0% | |
| | 105,000 | | | Ecolab Inc | | | 20,263,950 | | |
| | 168,000 | | | HB Fuller Co | | | 8,663,760 | | |
| | 14,000 | | | Sherwin-Williams Co/The | | | 8,169,560 | | |
| | | | 37,097,270 | | |
24
Mairs & Power Balanced Fund
SCHEDULE OF INVESTMENTS (continued) December 31, 2019
Par Value | | Security Description | | Fair Value | |
| | | COMMON STOCKS (continued) | |
| | | REAL ESTATE 0.1% | |
| | 13,000 | | | CoreSite Realty Corp | | $ | 1,457,560 | | |
| | | UTILITIES 0.4% | |
| | 65,000 | | | Xcel Energy Inc | | | 4,126,850 | | |
| | | | | TOTAL COMMON STOCKS
(cost $344,393,514) | | $ | 601,527,429
| | |
| | | SHORT-TERM INVESTMENTS 1.5% | |
| | 13,746,910 | | | First American Government Obligations Fund, Class X, 1.51% (c)
(cost $13,746,910) | | $ | 13,746,910
| | |
| | | | | TOTAL INVESTMENTS 99.5%
(cost $651,012,020) | | $ | 924,373,588
| | |
| | | | | OTHER ASSETS AND LIABILITIES (NET) 0.5% | | | 4,454,310 | | |
| | | | | TOTAL NET ASSETS 100.0% | | $ | 928,827,898 | | |
(a) Non-income producing.
(b) Foreign security denominated in U.S. dollars. As of December 31, 2019, these securities represented $37,495,539 or 4.0% of total net assets.
(c) The rate quoted is the annualized seven-day effective yield as of December 31, 2019.
(d) American Depositary Receipt.
(e) Issuer headquartered overseas but considered domestic. In determining whether a security is foreign or domestic, the Adviser will generally look at the location of the headquarters of the issuer. However, if the issuer is believed by the Adviser to be headquartered in a jurisdiction primarily for tax purposes, the Adviser will consider the following additional factors: 1) the location of the primary exchange trading its securities; 2) where it derives the majority of its revenues, and/or 3) where it earns the majority of its profits.
(f) Step Bonds – Securities for which the coupon rate of interest will adjust on specified future date(s). The rate disclosed represents the coupon rate in effect as of December 31, 2019.
(g) Securities exempt from registration under Rule 144A of the Securities Act of 1933. These securities may be resold in transactions exempt from registration, normally to qualified institutional buyers. These securities have been determined to be liquid under the Fund's liquidity risk management program. As of December 31, 2019, these securities represented $32,930,597 or 3.5% of total net assets.
The Global Industry Classification Standard (GICS®) was developed by and/or is the exclusive property of MSCI, Inc. and Standard & Poor's Financial Services LLC ("S&P"). GICS is a service mark of MSCI, Inc. and S&P and has been licensed for use by the Adviser.
See accompanying Notes to Financial Statements.
25
MAIRS & POWER SMALL CAP FUND (unaudited)
To Our Shareholders: December 31, 2019
The Mairs & Power Small Cap Fund posted solid returns for the year as did the overall market. Even though absolute returns were very good, the Fund underperformed both its peer group and index for the fourth quarter and full year. The Fund returned 7.97% compared to 8.21% for the S&P Small Cap 600 Total Return (TR) Index and 8.02% for the Morningstar Small Blend Category of peer funds for the fourth quarter. For the full year, the Fund was up 21.13% versus 22.78% for the index and 23.51% for the peer group of funds.
Stock selection drove relative underperformance for both the quarter and the year. Sector selection had a slightly positive impact on relative performance with the Fund's underweight position in the poorly performing Energy sector along with an overweight position in the Industrial sector as primary contributors. Energy was the worst performing sector in the S&P 600 Index for the year.
The Fund holds a number of companies that posted tremendous stock performance during the year. Generac Holdings (GNRC) was up over 100% as their back-up power generator became must-have products during the year. Record setting hurricanes and widespread blackouts imposed by the California utility Pacific Gas & Electric (PCG) in an attempt to prevent wildfires both drove strong growth in demand that has excited investors. In addition, the company has made some smart acquisitions, tucking in small tech firms to expand beyond its traditional internal combustion engine generators to offer battery powered generators as well. Oshkosh Corp. (OSK) also posted great performance as the stock recovered from a decline in 2018. The Wisconsin-based truck manufacturer had been negatively affected by the China tariffs that were put in place in 2018 but the experienced management team was able, once again, to navigate through the challenges to their business and not really miss a beat.
Underperformance was driven by cyclical pressures at just a few companies we hold. Two of the biggest detractors from performance for the year were Marcus Corp. (MCS) and United Fire Group (UFCS).
MAIRS & POWER SMALL CAP FUND (MSCFX)
Top Relative Performers
| Fourth Quarter (9/30/19 – 12/31/19) | | Year To Date (12/31/18 – 12/31/19) | |
Generac Holdings Inc. | | | 20.19 | % | | Generac Holdings Inc. | | | 79.61 | % | |
Oshkosh Corp. | | | 17.07 | % | | Catalent, Inc. | | | 57.78 | % | |
Premier Inc. Class A | | | 22.77 | % | | Inspire Medical Systems, Inc. | | | 52.86 | % | |
Catalent, Inc. | | | 9.92 | % | | Oshkosh Corp. | | | 33.80 | % | |
Inspire Medical Systems, Inc. | | | 13.40 | % | | Bio-Techne Corp. | | | 29.89 | % | |
Weak Relative Performers
| Fourth Quarter (9/30/19 – 12/31/19) | | Year To Date (12/31/18 – 12/31/19) | |
Apogee Enterprises, Inc. | | | -24.47 | % | | Marcus Corp. | | | -40.88 | % | |
CoreSite Realty Corp. | | | -15.19 | % | | Tile Shop Holdings, Inc. | | | -95.15 | % | |
Marcus Corp. | | | -21.93 | % | | United Fire Group, Inc. | | | -41.66 | % | |
Casey's General Stores, Inc. | | | -9.37 | % | | Carrizo Oil & Gas, Inc. | | | -53.43 | % | |
United Fire Group, Inc. | | | -14.43 | % | | NVE Corp. | | | -36.75 | % | |
Performance shown is relative to the S&P SmallCap 600 TR Index as of December 31, 2019. Relative return is the difference between the absolute return and the performance of the market, in which the position is held. Relative contribution is used for ranking, which considers average daily weightings for each holding.
Marcus, based in Milwaukee, is an entertainment company whose re-imagination of the theater business has really caught on with customers. Stadium seating, on-line ticketing and restaurant style food and beverage
26
MAIRS & POWER SMALL CAP FUND (unaudited) (continued)
offerings have made Marcus a favorite destination for people looking for a night of entertainment. Marcus's stock has pulled back after a great box office year (and stock performance) in 2018. The 2019 slate of movies was not as strong a box office draw. In addition, some investors have expressed concerns that Disney's (DIS) new streaming service, plus their strong pricing power, will hurt theater revenues. We think these concerns are overblown. Theaters will have 180 days to exhibit new titles before Disney streams them. This recognizes the value theaters bring to distributors in monetizing viewer eyeballs. Marcus continues to bring innovation to the theater experience as well as their hotel holdings, starting up the art themed Saint Kates in Milwaukee this year. We continue to hold Marcus.
United Fire Group is a relatively small fire and casualty insurer based in Iowa. While the company has been a steady performer in the insurance industry, they do experience volatility based on both catastrophes and underwriting performance. This year underwriting was tougher for them in the commercial auto space as the number of accidents was higher than expected and the severity (as measured by payout dollars) of the accidents was worse than projected. Many other insurers have also experienced a disappointing underwriting performance and attribute this to an increase in distracted driving along with an increase in the value of the automobiles on the road. United has taken pricing actions that we believe should restore their business to a more normal and healthy profit level but this will take a bit of time to work through. We believe they will be successful in these actions and continue to hold the stock.
In summary, 2019 was a solid year for stocks and for the Fund. We believe a number of the issues impacting our holdings are short-term in nature and will be cycled through fairly quickly. We have stuck with most of our holdings and in many cases added to positions on what we feel have been good opportunities to take advantage of short-term volatility. Only time will tell if our assessments are correct, but as we look to 2020, the one thing we feel strongly about is that there will be volatility in our companies' end markets, and we need strong hands at the wheel of the companies we own. We believe we have that. From a valuation perspective, small cap stocks are trading at a 7% discount to large (S&P 600 vs S&P 500). This is the cheapest small cap stocks have been on that measure in 15-plus years. So, we view this as a very interesting time to be looking at small cap. As always, we will continue to strive to invest in companies that have had strong competitive positions in their industries potentially allowing them to outperform over the long term.
Allen D. Steinkopf
Lead Manager | | Andrew R. Adams
Co-Manager | |
The Fund's investment objective, risks, charges and expenses must be considered carefully before investing. The summary prospectus or full prospectus contains this and other important information about the Fund and they may be obtained by calling Shareholder Services at (800) 304-7404 or by visiting www.mairsandpower.com. Read the summary prospectus or full prospectus carefully before investing.
All holdings in the portfolio are subject to change without notice and may or may not represent current or future portfolio composition. The mention of specific securities is not intended as a recommendation or an offer of a particular security, nor is it intended to be a solicitation for the purchase or sale of any security.
All investments have risks. The Small Cap Fund is designed for long-term investors. Equity investments are subject to market fluctuations and the Fund's share price can fall because of weakness in the broad market, a particular industry or specific holdings. Investments in small and midcap companies generally are more volatile. International investing risks include among others political, social or economic instability, difficulty in predicting international trade patterns, taxation and foreign trading practices, and greater fluctuations in price than U.S. corporations. The Fund may invest in initial public offerings by small cap companies, which can involve greater risk than investments in companies that are already publicly traded.
This commentary includes forward-looking statements such as economic predictions and portfolio manager opinions. The statements are subject to change at any time based on market and other conditions. No predictions, forecasts, outlooks, expectations or beliefs are guaranteed.
Diversification does not guarantee profit or protect against loss.
27
MAIRS & POWER SMALL CAP FUND (unaudited) (continued)
S&P 600 Small Cap Total Return (S&P 600) is an index of small company stocks managed by Standard & Poor's Financial Services LLC that covers a broad range of small cap stocks in the U.S. The index is weighted according to market capitalization and covers about 3-4% of the total market for equities in the U.S. It tracks both the capital gains of a group of stocks over time and assumes that any cash distributions, such as dividends, are reinvested back into the index. It is not possible to invest directly in an index.
Morningstar Small Blend Category, as defined by Morningstar are stocks in the bottom 10% of the capitalization of the U.S. equity market are defined as small cap. The blend style is assigned to portfolios where neither growth nor value characteristics predominate. It is not possible to invest directly in an index.
28
Mairs & Power Small Cap Fund
PERFORMANCE INFORMATION (unaudited) December 31, 2019
Investment performance since commencement of operations (through December 31, 2019)
This chart illustrates the performance of a hypothetical $10,000 investment made in the Fund since commencement of operations.
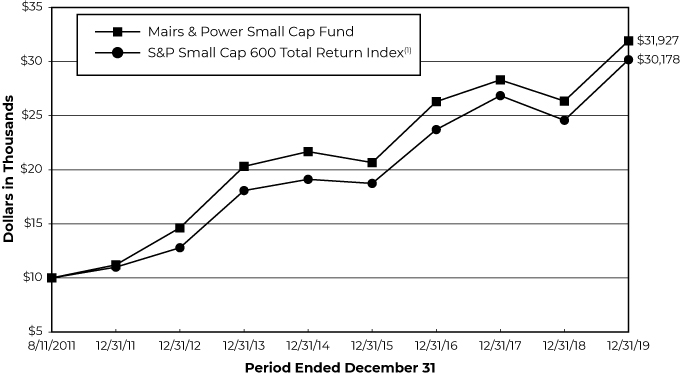
Average annual total returns for periods ended December 31, 2019 _
| | | 1 Year | | 3 Year | | 5 Year | | Since Inception(2) | |
Mairs & Power Small Cap Fund | | | 21.13 | % | | | 6.67 | % | | | 8.05 | % | | | 14.84 | % | |
S&P Small Cap 600 Total Return Index(1) | | | 22.78 | % | | | 8.36 | % | | | 9.56 | % | | | 14.07 | % | |
Performance data quoted represents past performance and does not guarantee future results. All performance information shown includes the reinvestment of dividend and capital gain distributions, but does not reflect the deduction of taxes that a shareholder would pay on Fund distributions or the redemption of Fund shares. The investment return and principal value of an investment will fluctuate so that an investor's shares, when redeemed, may be worth more or less than their original cost. Current performance of the Fund may be lower or higher than the performance quoted. For the most recent month-end performance figures, visit the Fund's website at www.mairsandpower.com or call Shareholder Services at (800) 304-7404. Per the Prospectus dated April 30, 2019, the expense ratio for the Fund is 1.04%.
(1) The S&P Small Cap 600 Total Return Index is an index of small-company stocks managed by Standard & Poor's Financial Services LLC that covers a broad range of small cap stocks in the U.S. The index is weighted according to market capitalization and covers about 3-4% of the total market for equities in the U.S. It tracks both the capital gains of a group of stocks over time and assumes that any cash distributions, such as dividends, are reinvested back into the index. It is not possible to invest directly in an index.
(2) Since inception performance is as of August 11, 2011, which is the offering date of the Small Cap Fund.
29
Mairs & Power Small Cap Fund
FUND INFORMATION (unaudited) December 31, 2019
Portfolio Managers
Allen D. Steinkopf, CFA, lead manager since April 1, 2019, co-manager from January 1, 2015 through April 1, 2019, University of Minnesota, MBA Finance 1986
Andrew R. Adams, CFA, co-manager since April 1, 2019, lead manager from 2011 to April 1, 2019, University of Wisconsin-Madison, MS Finance 1997
General Information
Fund Symbol | | MSCFX | |
Net Asset Value (NAV) Per Share | | $ | 26.41 | | |
Expense Ratio | | | 1.05 | % | |
Portfolio Turnover Rate | | | 15.07 | % | |
Sales Charge | | | None1 | | |
Fund Inception Year | | | 2011 | | |
Portfolio Composition
Top Ten Portfolio Holdings
(Percent of Total Net Assets) 2
Wintrust Financial Corp | | | 3.6 | % | |
Oshkosh Corp | | | 3.5 | | |
Catalent Inc | | | 3.4 | | |
CoreSite Realty Corp | | | 3.4 | | |
Tennant Co | | | 3.4 | | |
Donaldson Co Inc | | | 3.3 | | |
Bio-Techne Corp | | | 3.3 | | |
Associated Banc-Corp | | | 3.2 | | |
Generac Holdings Inc | | | 3.2 | | |
Glacier Bancorp Inc | | | 3.0 | | |
Portfolio Diversification
(Percent of Total Net Assets)
Common Stocks 98.8% | |
Industrials | | | 28.7 | % | |
Financials | | | 19.7 | | |
Health Care | | | 16.0 | | |
Information Technology | | | 12.7 | | |
Real Estate | | | 5.4 | | |
Consumer Staples | | | 3.8 | | |
Utilities | | | 3.7 | | |
Materials | | | 2.5 | | |
Energy | | | 2.4 | | |
Consumer Discretionary | | | 2.0 | | |
Communication Services | | | 1.9 | | |
Short-term Investments 1.2%3 | | | 1.2 | | |
| | | | 100.0 | % | |
1 Although the Fund is no-load, investment management fees and other expenses still apply.
2 All holdings in the portfolio are subject to change without notice and may or may not represent current or future portfolio composition. The mention of specific securities is not intended as a recommendation or offer for a particular security, nor is it intended to be a solicitation for the purchase or sale of any security.
3 Represents short-term investments and other assets and liabilities (net).
The Schedule of Investments and portfolio diversification utilize the Global Industry Classification Standard (GICS®) which was developed by and/or is the exclusive property of MSCI, Inc. and Standard & Poor's Financial Services LLC ("S&P"). GICS is a service mark of MSCI, Inc. and S&P and has been licensed for use by the Adviser.
30
Mairs & Power Small Cap Fund
SCHEDULE OF INVESTMENTS December 31, 2019
Shares | | Security Description | | Fair Value | |
| | | COMMON STOCKS 98.8% | |
| | | COMMUNICATION SERVICES 1.9% | |
| | 254,523 | | | Marcus Corp/The | | $ | 8,086,196 | | |
| | | CONSUMER DISCRETIONARY 2.0% | |
| | 192,480 | | | Gentherm Inc (a) | | | 8,544,187 | | |
| | | CONSUMER STAPLES 3.8% | |
| | 69,300 | | | Casey's General Stores Inc | | | 11,018,007 | | |
| | 116,400 | | | MGP Ingredients Inc | | | 5,639,580 | | |
| | | | 16,657,587 | | |
| | | ENERGY 2.4% | |
| | 1,077,475 | | | Callon Petroleum Co (a) | | | 5,204,204 | | |
| | 60,900 | | | Core Laboratories NV (b) | | | 2,294,103 | | |
| | 922,000 | | | Oasis Petroleum Inc (a) | | | 3,005,720 | | |
| | | | 10,504,027 | | |
| | | FINANCIALS 19.7% | |
| | 639,661 | | | Associated Banc-Corp | | | 14,098,128 | | |
| | 125,700 | | | Cullen/Frost Bankers Inc | | | 12,290,946 | | |
| | 288,200 | | | Glacier Bancorp Inc | | | 13,254,318 | | |
| | 371,100 | | | Great Western Bancorp Inc | | | 12,892,014 | | |
| | 145,778 | | | QCR Holdings Inc | | | 6,393,823 | | |
| | 110,315 | | | United Bankshares Inc/WV | | | 4,264,778 | | |
| | 168,985 | | | United Fire Group Inc | | | 7,389,714 | | |
| | 220,000 | | | Wintrust Financial Corp | | | 15,598,000 | | |
| | | | 86,181,721 | | |
| | | HEALTH CARE 16.0% | |
| | 66,000 | | | Bio-Techne Corp | | | 14,487,660 | | |
| | 218,240 | | | Calyxt Inc (a) | | | 1,529,862 | | |
| | 92,815 | | | Cardiovascular Systems Inc (a) | | | 4,509,881 | | |
| | 267,800 | | | Catalent Inc (a) | | | 15,077,140 | | |
| | 153,800 | | | Inspire Medical Systems Inc (a) | | | 11,413,498 | | |
| | 301,175 | | | IntriCon Corp (a) | | | 5,421,150 | | |
| | 297,500 | | | Patterson Cos Inc | | | 6,092,800 | | |
| | 259,549 | | | Premier Inc (a) | | | 9,831,716 | | |
| | 43,227 | | | SurModics Inc (a) | | | 1,790,895 | | |
| | | | 70,154,602 | | |
| | | INDUSTRIALS 28.7% | |
| | 271,678 | | | AAR Corp | | | 12,252,678 | | |
| | 377,810 | | | Actuant Corp | | | 9,834,394 | | |
31
Mairs & Power Small Cap Fund
SCHEDULE OF INVESTMENTS (continued) December 31, 2019
Shares | | Security Description | | Fair Value | |
| | | COMMON STOCKS (continued) | |
| | | INDUSTRIALS (continued) | |
| | 330,400 | | | Apogee Enterprises Inc | | $ | 10,738,000 | | |
| | 251,868 | | | Donaldson Co Inc | | | 14,512,634 | | |
| | 138,772 | | | Generac Holdings Inc (a) | | | 13,959,076 | | |
| | 184,700 | | | Graco Inc | | | 9,604,400 | | |
| | 231,100 | | | Hub Group Inc, Class A (a) | | | 11,853,119 | | |
| | 163,100 | | | Oshkosh Corp | | | 15,437,415 | | |
| | 46,400 | | | Proto Labs Inc (a) | | | 4,711,920 | | |
| | 230,676 | | | Raven Industries Inc | | | 7,949,095 | | |
| | 189,751 | | | Tennant Co | | | 14,785,398 | | |
| | | | 125,638,129 | | |
| | | INFORMATION TECHNOLOGY 12.7% | |
| | 87,865 | | | Badger Meter Inc | | | 5,705,075 | | |
| | 79,600 | | | Cabot Microelectronics Corp | | | 11,487,872 | | |
| | 289,809 | | | CyberOptics Corp (a) | | | 5,326,689 | | |
| | 362,076 | | | Digi International Inc (a) | | | 6,415,987 | | |
| | 143,500 | | | FireEye Inc (a) | | | 2,372,055 | | |
| | 56,700 | | | Littelfuse Inc | | | 10,846,710 | | |
| | 108,615 | | | NVE Corp | | | 7,755,111 | | |
| | 137,180 | | | Workiva Inc (a) | | | 5,768,419 | | |
| | | | 55,677,918 | | |
| | | MATERIALS 2.5% | |
| | 47,863 | | | Hawkins Inc | | | 2,192,604 | | |
| | 173,500 | | | HB Fuller Co | | | 8,947,395 | | |
| | | | 11,139,999 | | |
| | | REAL ESTATE 5.4% | |
| | 132,700 | | | CoreSite Realty Corp | | | 14,878,324 | | |
| | 449,800 | | | Physicians Realty Trust | | | 8,519,212 | | |
| | | | 23,397,536 | | |
| | | UTILITIES 3.7% | |
| | 150,900 | | | Black Hills Corp | | | 11,851,686 | | |
| | 59,200 | | | NorthWestern Corp | | | 4,242,864 | | |
| | | | 16,094,550 | | |
| | | | TOTAL COMMON STOCKS
(cost $324,858,025) | | $ | 432,076,452 | | |
32
Mairs & Power Small Cap Fund
SCHEDULE OF INVESTMENTS (continued) December 31, 2019
Shares | | Security Description | | Fair Value | |
| | | SHORT-TERM INVESTMENTS 1.2% | |
| | 5,212,088 | | | First American Government Obligations Fund, Class X, 1.51% (c)
(cost $5,212,088) | | $ | 5,212,088
| | |
| | | TOTAL INVESTMENTS 100.0%
(cost $330,064,113) | | $ | 437,288,540
| | |
| | | OTHER ASSETS AND LIABILITIES (NET) 0.0% | | | 11,891 | | |
| | | TOTAL NET ASSETS 100.0% | | $ | 437,300,431 | | |
(a) Non-income producing.
(b) Foreign security denominated in U.S. dollars. As of December 31, 2019, these securities represented $2,294,103 or 0.5% of total net assets.
(c) The rate quoted is the annualized seven-day effective yield as of December 31, 2019.
The Global Industry Classification Standard (GICS®) was developed by and/or is the exclusive property of MSCI, Inc. and Standard & Poor's Financial Services LLC ("S&P"). GICS is a service mark of MSCI, Inc. and S&P and has been licensed for use by the Adviser.
See accompanying Notes to Financial Statements.
33
STATEMENTS OF ASSETS AND LIABILITIES December 31, 2019
| | | Mairs & Power
Growth Fund | | Mairs & Power
Balanced Fund | | Mairs & Power
Small Cap Fund | |
ASSETS | |
| Investments, at fair value (Note 1) *: | | $ | 4,616,552,668 | | | $ | 924,373,588 | | | $ | 437,288,540 | | |
Receivable for Fund shares sold | | | 1,223,914 | | | | 908,591 | | | | 314,495 | | |
Receivable for securities sold | | | 20,865,783 | | | | 229,572 | | | | - | | |
Dividends and interest receivable | | | 5,815,737 | | | | 4,200,859 | | | | 252,122 | | |
Prepaid expenses and other assets | | | 108,819 | | | | 41,018 | | | | 27,325 | | |
| | | | 4,644,566,921 | | | | 929,753,628 | | | | 437,882,482 | | |
LIABILITIES | |
Payable for Fund shares redeemed | | | 5,758,393 | | | | 125,541 | | | | 156,543 | | |
Payable for securities purchased | | | 2,171,996 | | | | 188,001 | | | | - | | |
| Accrued investment management fees (Note 2) | | | 2,138,236 | | | | 452,699 | | | | 325,497 | | |
Accrued Fund administration fees | | | 132,183 | | | | 29,104 | | | | 14,530 | | |
Accrued Fund accounting fees | | | 78,867 | | | | 27,649 | | | | 14,125 | | |
Accrued audit and tax fees | | | 27,224 | | | | 33,449 | | | | 25,558 | | |
Accrued transfer agent fees | | | 215,706 | | | | 43,926 | | | | 31,035 | | |
Other accrued fees | | | 107,716 | | | | 25,361 | | | | 14,763 | | |
| | | | 10,630,321 | | | | 925,730 | | | | 582,051 | | |
NET ASSETS | | $ | 4,633,936,600 | | | $ | 928,827,898 | | | $ | 437,300,431 | | |
NET ASSETS CONSIST OF | |
Paid in capital | | $ | 2,227,139,601 | | | $ | 651,288,590 | | | $ | 330,402,211 | | |
Total distributable earnings | | | 2,406,796,999 | | | | 277,539,308 | | | | 106,898,220 | | |
TOTAL NET ASSETS | | $ | 4,633,936,600 | | | $ | 928,827,898 | | | $ | 437,300,431 | | |
Fund shares, par value | | $ | 0.01 | | | $ | 0.01 | | | $ | 0.01 | | |
Authorized | | | unlimited | | | | unlimited | | | | unlimited | | |
Fund shares issued and outstanding | | | 36,425,218 | | | | 9,312,874 | | | | 16,560,285 | | |
Net asset value per share | | $ | 127.22 | | | $ | 99.74 | | | $ | 26.41 | | |
* Cost of investments | | $ | 2,294,461,890 | | | $ | 651,012,020 | | | $ | 330,064,113 | | |
See accompanying Notes to Financial Statements.
34
STATEMENT OF OPERATIONS Year Ended December 31, 2019
| | | Mairs & Power
Growth Fund | | Mairs & Power
Balanced Fund | | Mairs & Power
Small Cap Fund | |
INVESTMENT INCOME | |
Income: | |
Dividends * | | $ | 84,019,932 | | | $ | 13,208,089 | | | $ | 6,447,068 | | |
Interest income | | | - | | | | 12,680,386 | | | | - | | |
TOTAL INCOME | | | 84,019,932 | | | | 25,888,475 | | | | 6,447,068 | | |
Expenses: | |
| Investment management fees (Note 2) | | | 24,365,358 | | | | 5,294,959 | | | | 3,796,351 | | |
Fund administration fees | | | 780,894 | | | | 171,824 | | | | 86,630 | | |
Fund accounting fees | | | 464,303 | | | | 163,896 | | | | 84,249 | | |
| Trustees' fees (Note 2) | | | 284,920 | | | | 57,606 | | | | 27,474 | | |
Transfer agent fees | | | 1,632,721 | | | | 382,623 | | | | 263,959 | | |
Custodian fees | | | 249,522 | | | | 55,409 | | | | 26,854 | | |
Legal and audit fees | | | 130,234 | | | | 68,605 | | | | 47,763 | | |
Printing and mailing fees | | | 147,734 | | | | 42,007 | | | | 30,717 | | |
Other fees | | | 200,107 | | | | 71,012 | | | | 53,595 | | |
TOTAL EXPENSES | | | 28,255,793 | | | | 6,307,941 | | | | 4,417,592 | | |
NET INVESTMENT INCOME | | | 55,764,139 | | | | 19,580,534 | | | | 2,029,476 | | |
| REALIZED AND UNREALIZED GAIN (Note 4) | |
Net realized gain on investments | | | 345,728,849 | | | | 26,796,877 | | | | 9,301,124 | | |
Change in net unrealized appreciation
on investments | | | 678,657,381 | | | | 115,588,923 | | | | 66,187,132 | | |
NET GAIN ON INVESTMENTS | | | 1,024,386,230 | | | | 142,385,800 | | | | 75,488,256 | | |
NET INCREASE IN NET ASSETS FROM
OPERATIONS | | $ | 1,080,150,369 | | | $ | 161,966,334 | | | $ | 77,517,732 | | |
* Net of foreign taxes withheld of: | | $ | 673,143 | | | $ | 70,440 | | | $ | 4,241 | | |
See accompanying Notes to Financial Statements.
35
Mairs & Power Growth Fund
STATEMENTS OF CHANGES IN NET ASSETS
| | | Year Ended December 31, | |
| | | 2019 | | 2018 | |
OPERATIONS | |
Net investment income | | $ | 55,764,139 | | | $ | 56,973,273 | | |
Net realized gain on investments | | | 345,728,849 | | | | 315,275,990 | | |
Net change in unrealized appreciation (depreciation) of investments | | | 678,657,381 | | | | (546,176,127 | ) | |
NET INCREASE (DECREASE) IN NET ASSETS FROM OPERATIONS | | | 1,080,150,369 | | | | (173,926,864 | ) | |
DISTRIBUTIONS TO SHAREHOLDERS | | | (325,706,532 | ) | | | (323,794,197 | ) | |
CAPITAL TRANSACTIONS | |
Proceeds from shares sold | | | 183,032,904 | | | | 221,318,366 | | |
Reinvestment of distributions | | | 303,147,958 | | | | 302,562,532 | | |
Cost of shares redeemed | | | (545,630,903 | ) | | | (818,373,458 | ) | |
DECREASE IN NET ASSETS FROM CAPITAL TRANSACTIONS | | | (59,450,041 | ) | | | (294,492,560 | ) | |
TOTAL INCREASE (DECREASE) IN NET ASSETS: | | | 694,993,796 | | | | (792,213,621 | ) | |
NET ASSETS | |
Beginning of year | | | 3,938,942,804 | | | | 4,731,156,425 | | |
End of year | | $ | 4,633,936,600 | | | $ | 3,938,942,804 | | |
FUND SHARE TRANSACTIONS | |
Shares sold | | | 1,499,072 | | | | 1,825,034 | | |
Shares issued for reinvested distributions | | | 2,381,520 | | | | 2,851,984 | | |
Shares redeemed | | | (4,459,363 | ) | | | (6,735,245 | ) | |
NET DECREASE IN FUND SHARES | | | (578,771 | ) | | | (2,058,227 | ) | |
See accompanying Notes to Financial Statements.
36
Mairs & Power Balanced Fund
STATEMENTS OF CHANGES IN NET ASSETS
| | | Year Ended December 31, | |
| | | 2019 | | 2018 | |
OPERATIONS | |
Net investment income | | $ | 19,580,534 | | | $ | 19,756,268 | | |
Net realized gain on investments | | | 26,796,877 | | | | 25,152,340 | | |
Net change in unrealized appreciation (depreciation) of investments | | | 115,588,923 | | | | (69,635,982 | ) | |
NET INCREASE (DECREASE) IN NET ASSETS FROM OPERATIONS | | | 161,966,334 | | | | (24,727,374 | ) | |
DISTRIBUTIONS TO SHAREHOLDERS | | | (41,682,895 | ) | | | (42,417,915 | ) | |
CAPITAL TRANSACTIONS | |
Proceeds from shares sold | | | 101,678,402 | | | | 96,199,993 | | |
Reinvestment of distributions | | | 40,446,847 | | | | 41,005,337 | | |
Cost of shares redeemed | | | (141,035,720 | ) | | | (247,393,172 | ) | |
INCREASE (DECREASE) IN NET ASSETS FROM CAPITAL TRANSACTIONS | | | 1,089,529 | | | | (110,187,842 | ) | |
TOTAL INCREASE (DECREASE) IN NET ASSETS: | | | 121,372,968 | | | | (177,333,131 | ) | |
NET ASSETS | |
Beginning of year | | | 807,454,930 | | | | 984,788,061 | | |
End of year | | $ | 928,827,898 | | | $ | 807,454,930 | | |
FUND SHARE TRANSACTIONS | |
Shares sold | | | 1,074,318 | | | | 1,037,774 | | |
Shares issued for reinvested distributions | | | 411,102 | | | | 465,996 | | |
Shares redeemed | | | (1,476,161 | ) | | | (2,675,705 | ) | |
NET INCREASE (DECREASE) IN FUND SHARES | | | 9,259 | | | | (1,171,935 | ) | |
See accompanying Notes to Financial Statements.
37
Mairs & Power Small Cap Fund
STATEMENTS OF CHANGES IN NET ASSETS
| | | Year Ended December 31, | |
| | | 2019 | | 2018 | |
OPERATIONS | |
Net investment income | | $ | 2,029,476 | | | $ | 2,299,497 | | |
Net realized gain on investments | | | 9,301,124 | | | | 17,606,537 | | |
Net change in unrealized appreciation (depreciation) of investments | | | 66,187,132 | | | | (48,410,052 | ) | |
NET INCREASE (DECREASE) IN NET ASSETS FROM OPERATIONS | | | 77,517,732 | | | | (28,504,018 | ) | |
DISTRIBUTIONS TO SHAREHOLDERS | | | (13,263,989 | ) | | | (16,989,022 | ) | |
CAPITAL TRANSACTIONS | |
Proceeds from shares sold | | | 61,554,115 | | | | 70,198,238 | | |
Reinvestment of distributions | | | 12,982,051 | | | | 16,653,266 | | |
Cost of shares redeemed * | | | (68,966,536 | ) | | | (109,388,722 | ) | |
INCREASE (DECREASE) IN NET ASSETS FROM CAPITAL TRANSACTIONS | | | 5,569,630 | | | | (22,537,218 | ) | |
TOTAL INCREASE (DECREASE) IN NET ASSETS: | | | 69,823,373 | | | | (68,030,258 | ) | |
NET ASSETS | |
Beginning of year | | | 367,477,058 | | | | 435,507,316 | | |
End of year | | $ | 437,300,431 | | | $ | 367,477,058 | | |
FUND SHARE TRANSACTIONS | |
Shares sold | | | 2,447,445 | | | | 2,713,382 | | |
Shares issued for reinvested distributions | | | 491,744 | | | | 752,180 | | |
Shares redeemed | | | (2,727,309 | ) | | | (4,320,099 | ) | |
NET INCREASE (DECREASE) IN FUND SHARES | | | 211,880 | | | | (854,537 | ) | |
| * Net of redemption fees of: | | $ | 65,810 | | | $ | 44,669 | | |
See accompanying Notes to Financial Statements.
38
NOTES TO FINANCIAL STATEMENTS December 31, 2019
Note 1 – Organization and Significant Accounting Policies
Mairs & Power Funds Trust (the Trust) is a no-load, diversified, open-end management investment company registered under the Investment Company Act of 1940, as amended (the 1940 Act). Mairs & Power Growth Fund (the Growth Fund), Mairs & Power Balanced Fund (the Balanced Fund) and Mairs & Power Small Cap Fund (the Small Cap Fund) (individually a Fund and collectively the Funds) are series within the Trust. Mairs & Power, Inc. (the Adviser) is the investment adviser of each Fund. The objective of the Growth Fund is to provide shareholders with a diversified portfolio of common stocks, which have the potential for above-average, long-term appreciation. The objective of the Balanced Fund is to provide capital growth, current income and preservation of capital. The objective of the Small Cap Fund is to seek above-average, long-term appreciation. Each Fund is an investment company and accordingly follows the investment company accounting and reporting guidance of the Financial Accounting Standards Board (FASB) Accounting Standard Codification Topic 946 "Financial Services – Investment Companies."
Significant accounting policies of the Funds are as follows:
Security Valuations
Security valuations for each Fund's investments are furnished by independent pricing services that have been approved by the Trust's Board of Trustees (the Board). Investments in listed equity securities are valued at the last quoted sale price on the securities exchange on which such securities are principally traded or at the NASDAQ Official Closing Price if readily available for such securities on each business day. Other equity securities traded in the over-the-counter market and listed equity securities for which no sale was reported on that date are valued at the last quoted bid price. Debt obligations exceeding 60 days to maturity are valued at the bid price furnished by an independent pricing service. Debt obligations with 60 days or less remaining until maturity may be valued at the bid price furnished by an independent pricing service and in certain circumstances may be valued at their amortized cost, which approximates fair value. Pricing service prices for debt obligations are based on various evaluative and matrix-based methodologies and models that use market inputs such as market transactions, dealer quotations, benchmark yields and issuer, industry and economic events. These techniques generally consider overall market conditions and such factors as yields or prices of bonds of comparable quality, type of issue, coupon, maturity and ratings.
Debt securities for which prices are not available from an independent pricing service, but where an active market exists, are valued using market quotations obtained from two or more dealers that make markets in the securities. When market quotations are not readily available, or when the last quoted sale price is not considered representative of the value of the security if it were to be sold on that day, the security will be valued at fair value as determined in good faith by the Fair Value Committee appointed by the Board, pursuant to procedures approved by the Board.
When determining the value of a security, the Fair Value Committee takes into consideration all indications of value that appear relevant under the particular circumstances, as well as fundamental analytical data relating to the security, the nature and duration of any restrictions on the disposition of the security, and the forces influencing the market in which the security is purchased or sold in addition to other more specific factors that may be applied on a case-by-case basis. Consequently, the value of the security used by a Fund may differ from a quoted or published price for the same security. Fair value pricing involves subjective judgments and it is possible that the fair value determined for the security is materially different than the value that could be realized upon the sale of that security. As of December 31, 2019, no securities were valued using this method.
Fair Valuation Measurements
The Trust has adopted authoritative fair valuation accounting standards, which establish a definition of fair value and set out a hierarchy for measuring fair value. These standards require additional disclosures about the various inputs and valuation techniques used to develop the measurements of fair value and changes in valuation techniques and related inputs during the year. These inputs are summarized in the three broad levels listed below:
• Level 1 – Quoted prices in active markets for identical securities.
39
NOTES TO FINANCIAL STATEMENTS (continued) December 31, 2019
Note 1 – Organization and Significant Accounting Policies (continued)
Fair Valuation Measurements (continued)
• Level 2 – Other significant observable inputs (including quoted prices for similar securities, interest rates, prepayment speeds, credit risk, etc.).
• Level 3 – Significant unobservable inputs (including the Funds' own assumptions in determining the fair value of investments).
The inputs or methodologies used for valuing securities are not necessarily an indication of the risk associated with investing in those securities. The following is a summary of the inputs used to value the securities held by each Fund as of December 31, 2019:
| | | Growth Fund | | Balanced Fund | | Small Cap Fund | |
Level 1* | | $ | 4,616,552,668 | | | $ | 615,274,339 | | | $ | 437,288,540 | | |
Level 2** | | | - | | | | 309,099,249 | | | | - | | |
Level 3 | | | - | | | | - | | | | - | | |
Total | | $ | 4,616,552,668 | | | $ | 924,373,588 | | | $ | 437,288,540 | | |
* All Level 1 investments are equity securities (common stocks) and short-term investments.
** All Level 2 investments are fixed income securities.
For detail of securities by major sector classification for the Funds, please refer to the Schedules of Investments.
The Funds did not hold any level 3 investments during the year ended December 31, 2019.
Security Transactions and Investment Income
Security transactions are recorded on the date on which securities are purchased or sold. Dividend income and corporate action transactions are recorded on the ex-dividend date. Interest income, including the accretion of discounts and amortization of premiums, is recorded on an accrual basis. Premiums and discounts are amortized using the effective interest method. Realized gains and losses are reported on an identified cost basis.
Income Taxes
Each Fund is a "regulated investment company" as defined in Subtitle A, Chapter 1, Subchapter M of the Internal Revenue Code of 1986, as amended (the Code). No provisions have been made for federal income taxes as it is the intention of each Fund to comply with the provisions of the Code applicable to regulated investment companies and to make distributions of income and realized gains sufficient to relieve it from all or substantially all excise and income taxes.
As of December 31, 2019, the Trust did not have any tax positions that did not meet the "more-likely-than-not" threshold of being sustained by the applicable tax authority. Generally, tax authorities can examine all tax returns filed for the last three years.
As of December 31, 2019, none of the Funds had capital loss carryforwards nor did they have any qualified late year losses for federal tax purposes.
Basis of Presentation
The preparation of financial statements in conformity with U.S. generally accepted accounting principles (GAAP) requires management to make estimates and assumptions that affect the reported amount of net assets and liabilities and disclosure of contingent assets and liabilities at the date of the financial statements and the reported results of operations during the reporting period. Actual results could differ from those estimates.
40
NOTES TO FINANCIAL STATEMENTS (continued) December 31, 2019
Note 1 – Organization and Significant Accounting Policies (continued)
Basis of Presentation (continued)
In preparing these financial statements, the Funds have evaluated events and transactions for potential recognition or disclosure through the date the financial statements were available to be issued. This evaluation did not result in any subsequent events that necessitated recognition of disclosures.
Expense Allocation
Common expenses incurred by the Trust are allocated among the Funds based on their relative net assets. Fund specific expenses are charged directly to the Fund that incurred the expense.
New Accounting Pronouncement
In March 2017, the Financial Accounting Standards Board issued Accounting Standards Update ("ASU") No. 2017-08 "Premium Amortization on Purchased Callable Debt Securities", which amends the accounting standards to shorten the amortization period for the premium on certain purchased callable debt securities to the earliest call date. The ASU is effective for annual periods ending after December 15, 2018, and interim periods within those years. The Trust has adopted this ASU during the current year.
Note 2 – Related-Party Transactions
Investment Management Fees
The Adviser provides investment management services and various administrative services to the Funds under a written agreement for Investment Counsel Service (the Investment Advisory Agreement) approved by the Board. Pursuant to the Investment Advisory Agreement, the Adviser is paid a monthly fee on average daily net assets at the following annual rates:
| | | Growth Fund | | Balanced Fund | | Small Cap Fund | |
Up to $2.5 Billion | | | 0.60 | % | | | 0.60 | % | | | 0.90 | % | |
Over $2.5 Billion | | | 0.50 | % | | | 0.60 | % | | | 0.90 | % | |
Trustees' Fees
The Funds pay compensation to the disinterested Trustees of the Trust. The Funds do not pay remuneration to officers or to Trustees who are officers, directors or employees of the Adviser or Trustees who are otherwise "interested persons" of the Trust.
Note 3 – Indemnifications
In the normal course of business, the Trust enters into contracts that contain general indemnifications to other parties. The Trust's maximum exposure under these contracts is unknown as this would involve future claims that may be made against the Trust that have not yet occurred. The Trust expects the risk of loss to be remote.
Note 4 – Distributions Paid, Distributable Earnings and Investment Transactions
Net investment income and net realized capital gains (losses) may differ for financial reporting and tax purposes because of temporary or permanent book/tax differences.
In addition, GAAP requires that certain components of net assets relating to permanent difference be reclassified between financial and tax reporting. The permanent differences primarily relate to utilization of earnings and profits distributed to shareholders on redemption of shares and distribution reclasses. These
41
NOTES TO FINANCIAL STATEMENTS (continued) December 31, 2019
Note 4 – Distributions Paid, Distributable Earnings and Investment Transactions (continued)
reclassifications have no effect on nets assets or net asset value per share. On the Statement of Assets and Liabilities, the following reclassifications were made for the year end ended December 31, 2019:
| | Distributable Earnings | | Paid in Capital | |
Growth Fund | | $ | (24,294,269 | ) | | $ | 24,294,269 | | |
Balanced Fund | | | (2,190,017 | ) | | | 2,190,017 | | |
Small Cap Fund | | | (1,362,963 | ) | | | 1,362,963 | | |
Distributions to shareholders are determined in accordance with income tax regulations that may differ from GAAP, and due to the timing of the distributions, the fiscal year in which the amounts are distributed may differ from the year that the income or realized gains (losses) were recorded by each Fund.
The tax character of distributions paid during the years ended December 31, 2019 and December 31, 2018, were as follows:
Year ended December 31, 2019 | |
Distributions paid from: | | Growth Fund | | Balanced Fund | | Small Cap Fund | |
Ordinary income | | $ | 55,405,543 | | | $ | 19,590,959 | | | $ | 1,830,885 | | |
Long-term capital gains | | | 270,300,989 | | | | 22,091,936 | | | | 11,433,104 | | |
Total distributions paid | | $ | 325,706,532 | | | $ | 41,682,895 | | | $ | 13,263,989 | | |
Year ended December 31, 2018 | |
Distributions paid from: | | Growth Fund | | Balanced Fund | | Small Cap Fund | |
Ordinary income | | $ | 56,504,290 | | | $ | 19,786,860 | | | $ | 2,299,497 | | |
Long-term capital gains | | | 267,289,907 | | | | 22,631,055 | | | | 14,689,525 | | |
Total distributions paid | | $ | 323,794,197 | | | $ | 42,417,915 | | | $ | 16,989,022 | | |
Ordinary income distributions include net short-term capital gains. The Funds are designating as long-term capital gain dividends, pursuant to Section 852(b)(3) of the Code, the amount necessary to reduce the earnings and profits of the Funds related to net capital gain to zero. To the extent necessary to fully distribute such capital gain, the Funds also designate earnings and profits distributed to shareholders on the redemption of shares.
At December 31, 2019, the components of accumulated earnings (losses) on a tax basis were as follows:
| | Growth Fund | | Balanced Fund | | Small Cap Fund | |
Cost of investments | | $ | 2,295,253,787 | | | $ | 651,015,496 | | | $ | 330,588,911 | | |
Gross unrealized appreciation | | $ | 2,352,857,589 | | | $ | 279,593,972 | | | $ | 127,515,959 | | |
Gross unrealized depreciation | | | (31,558,708 | ) | | | (6,235,880 | ) | | | (20,816,330 | ) | |
Net unrealized appreciation | | $ | 2,321,298,881 | | | $ | 273,358,092 | | | $ | 106,699,629 | | |
Undistributed ordinary income | | $ | 986,019 | | | $ | 121,273 | | | $ | 198,591 | | |
Undistributed long-term capital gains | | | 84,512,099 | | | | 4,059,943 | | | | - | | |
Total distributable earnings | | $ | 85,498,118 | | | $ | 4,181,216 | | | $ | 198,591 | | |
Other accumulated earnings | | | - | | | | - | | | | - | | |
Total accumulated earnings | | $ | 2,406,796,999 | | | $ | 277,539,308 | | | $ | 106,898,220 | | |
The difference between book basis and tax basis unrealized appreciation is attributable primarily to the tax deferral of losses on wash sales.
42
NOTES TO FINANCIAL STATEMENTS (continued) December 31, 2019
Note 4 – Distributions Paid, Distributable Earnings and Investment Transactions (continued)
Purchases and sales of investment securities, excluding government securities, short-term securities and temporary cash investments, during the year ended December 31, 2019 were as follows:
| | | Purchases | | Sales | |
Growth Fund | | $ | 462,818,828 | | | $ | 776,830,870 | | |
Balanced Fund | | | 101,340,726 | | | | 128,379,169 | | |
Small Cap Fund | | | 62,268,700 | | | | 66,507,880 | | |
Purchases and sales of government securities during the year ended December 31, 2019 were as follows:
| | | Purchases | | Sales | |
Growth Fund | | $ | - | | | $ | - | | |
Balanced Fund | | | 16,047,199 | | | | 7,075,938 | | |
Small Cap Fund | | | - | | | | - | | |
43
Mairs & Power Growth Fund
FINANCIAL HIGHLIGHTS
SELECTED DATA AND RATIOS
(for a share outstanding throughout each year)
| | | Year Ended December 31, | |
| | | 2019 | | 2018 | | 2017 | | 2016 | | 2015 | |
Per Share | |
Net asset value, beginning of year | | $ | 106.45 | | | $ | 121.12 | | | $ | 113.83 | | | $ | 104.44 | | | $ | 116.20 | | |
Income from investment operations: | |
Net investment income | | | 1.59 | | | | 1.61 | | | | 1.60 | | | | 1.61 | | | | 1.68 | | |
Net realized and unrealized gain (loss) | | | 28.59 | | | | (6.96 | ) | | | 17.16 | | | | 14.43 | | | | (5.17 | ) | |
Total from investment operations | | | 30.18 | | | | (5.35 | ) | | | 18.76 | | | | 16.04 | | | | (3.49 | ) | |
Distributions to shareholders from: | |
Net investment income | | | (1.58 | ) | | | (1.59 | ) | | | (1.66 | ) | | | (1.61 | ) | | | (1.67 | ) | |
Net realized gains on investments sold | | | (7.83 | ) | | | (7.73 | ) | | | (9.81 | ) | | | (5.04 | ) | | | (6.60 | ) | |
Total distributions | | | (9.41 | ) | | | (9.32 | ) | | | (11.47 | ) | | | (6.65 | ) | | | (8.27 | ) | |
Net asset value, end of year | | $ | 127.22 | | | $ | 106.45 | | | $ | 121.12 | | | $ | 113.83 | | | $ | 104.44 | | |
Total investment return | | | 28.39 | % | | | (4.34 | )% | | | 16.52 | % | | | 15.38 | % | | | (3.07 | )% | |
Net assets, end of year, in thousands | | $ | 4,633,937 | | | $ | 3,938,943 | | | $ | 4,731,156 | | | $ | 4,392,473 | | | $ | 3,837,264 | | |
Ratios/supplemental data: | |
Ratio of expenses to average net assets | | | 0.65 | % | | | 0.64 | % | | | 0.64 | % | | | 0.66 | % | | | 0.65 | % | |
Ratio of net investment income to average
net assets | | | 1.28 | | | | 1.27 | | | | 1.30 | | | | 1.42 | | | | 1.43 | | |
Portfolio turnover rate | | | 10.77 | | | | 9.25 | | | | 8.84 | | | | 10.99 | | | | 9.64 | | |
See accompanying Notes to Financial Statements.
44
Mairs & Power Balanced Fund
FINANCIAL HIGHLIGHTS
SELECTED DATA AND RATIOS
(for a share outstanding throughout each year)
| | | Year Ended December 31, | |
| | | 2019 | | 2018 | | 2017 | | 2016 | | 2015 | |
Per Share | |
Net asset value, beginning of year | | $ | 86.79 | | | $ | 94.01 | | | $ | 87.29 | | | $ | 81.16 | | | $ | 86.79 | | |
Income from investment operations: | |
Net investment income | | | 2.13 | | | | 2.09 | | | | 2.04 | | | | 1.99 | | | | 2.14 | | |
Net realized and unrealized gain (loss) | | | 15.39 | | | | (4.71 | ) | | | 8.26 | | | | 7.21 | | | | (4.34 | ) | |
Total from investment operations | | | 17.52 | | | | (2.62 | ) | | | 10.30 | | | | 9.20 | | | | (2.20 | ) | |
Distributions to shareholders from: | |
Net investment income | | | (2.12 | ) | | | (2.09 | ) | | | (2.07 | ) | | | (1.99 | ) | | | (2.13 | ) | |
Net realized gains on investments sold | | | (2.45 | ) | | | (2.51 | ) | | | (1.51 | ) | | | (1.08 | ) | | | (1.30 | ) | |
Total distributions | | | (4.57 | ) | | | (4.60 | ) | | | (3.58 | ) | | | (3.07 | ) | | | (3.43 | ) | |
Net asset value, end of year | | $ | 99.74 | | | $ | 86.79 | | | $ | 94.01 | | | $ | 87.29 | | | $ | 81.16 | | |
Total investment return | | | 20.32 | % | | | (2.80 | )% | | | 11.90 | % | | | 11.42 | % | | | (2.54 | )% | |
Net assets, end of year, in thousands | | $ | 928,828 | | | $ | 807,455 | | | $ | 984,788 | | | $ | 861,426 | | | $ | 667,680 | | |
Ratios/supplemental data: | |
Ratio of expenses to average net assets | | | 0.71 | % | | | 0.72 | % | | | 0.71 | % | | | 0.72 | % | | | 0.73 | % | |
Ratio of net investment income to average
net assets | | | 2.22 | | | | 2.20 | | | | 2.24 | | | | 2.37 | | | | 2.49 | | |
Portfolio turnover rate | | | 13.60 | | | | 9.01 | | | | 13.13 | | | | 14.10 | | | | 14.05 | | |
See accompanying Notes to Financial Statements.
45
Mairs & Power Small Cap Fund
FINANCIAL HIGHLIGHTS
SELECTED DATA AND RATIOS
(for a share outstanding throughout each year)
| | | Year Ended December 31, | |
| | | 2019 | | 2018 | | 2017 | | 2016 | | 2015 | |
Per Share | |
Net asset value, beginning of year | | $ | 22.48 | | | $ | 25.32 | | | $ | 24.33 | | | $ | 19.48 | | | $ | 20.67 | | |
Income from investment operations: | |
Net investment income | | | 0.13 | | | | 0.15 | | | | 0.13 | | | | 0.08 | | | | 0.08 | | |
Net realized and unrealized gain (loss) | | | 4.62 | | | | (1.92 | ) | | | 1.73 | | | | 5.24 | | | | (1.04 | ) | |
Total from investment operations | | | 4.75 | | | | (1.77 | ) | | | 1.86 | | | | 5.32 | | | | (0.96 | ) | |
Distributions to shareholders from: | |
Net investment income | | | (0.11 | ) | | | (0.15 | ) | | | (0.13 | ) | | | (0.08 | ) | | | (0.08 | ) | |
Net realized gains on investments sold | | | (0.71 | ) | | | (0.92 | ) | | | (0.74 | ) | | | (0.39 | ) | | | (0.15 | ) | |
Redemption fees (1)(2) | | | 0.00 | | | | 0.00 | | | | 0.00 | | | | 0.00 | | | | 0.00 | | |
Total distributions | | | (0.82 | ) | | | (1.07 | ) | | | (0.87 | ) | | | (0.47 | ) | | | (0.23 | ) | |
Net asset value, end of year | | $ | 26.41 | | | $ | 22.48 | | | $ | 25.32 | | | $ | 24.33 | | | $ | 19.48 | | |
Total investment return | | | 21.13 | % | | | (6.91 | )% | | | 7.64 | % | | | 27.27 | % | | | (4.68 | )% | |
Net assets, end of year, in thousands | | $ | 437,300 | | | $ | 367,477 | | | $ | 435,507 | | | $ | 382,443 | | | $ | 193,837 | | |
Ratios/supplemental data: | |
Ratio of expenses to average net assets | | | 1.05 | % | | | 1.04 | % | | | 1.04 | % | | | 1.05 | % | | | 1.06 | % | |
Ratio of net investment income to average
net assets | | | 0.48 | | | | 0.54 | | | | 0.48 | | | | 0.48 | | | | 0.43 | | |
Portfolio turnover rate | | | 15.07 | | | | 20.40 | | | | 19.27 | | | | 21.26 | | | | 23.27 | | |
(1) The Fund charges a 1.00% redemption fee on shares held 180 days or less.
(2) Amount per share is less than $0.005.
See accompanying Notes to Financial Statements.
46
REPORT OF INDEPENDENT REGISTERED PUBLIC ACCOUNTING FIRM
To the Shareholders and the Board of Trustees of
Mairs & Power Funds Trust
Opinion on the Financial Statements
We have audited the accompanying statements of assets and liabilities of Mairs & Power Funds Trust (the Trust) (comprising Mairs & Power Growth Fund, Mairs & Power Balanced Fund and Mairs & Power Small Cap Fund (collectively referred to as the "Funds")), including the schedules of investments, as of December 31, 2019, and the related statements of operations for the year then ended, the statements of changes in net assets for each of the two years in the period then ended, the financial highlights for each of the five years in the period then ended and the related notes (collectively referred to as the "financial statements"). In our opinion, the financial statements present fairly, in all material respects, the financial position of each of the Funds comprising Mairs & Power Funds Trust at December 31, 2019, the results of their operations for the year then ended, the changes in their net assets for each of the two years in the period then ended and their financial highlights for each of the five years in the period then ended, in conformity with U.S. generally accepted accounting principles.
Basis for Opinion
These financial statements are the responsibility of the Trust's management. Our responsibility is to express an opinion on each of the Funds' financial statements based on our audits. We are a public accounting firm registered with the Public Company Accounting Oversight Board (United States) ("PCAOB") and are required to be independent with respect to the Trust in accordance with the U.S. federal securities laws and the applicable rules and regulations of the Securities and Exchange Commission and the PCAOB.
We conducted our audits in accordance with the standards of the PCAOB. Those standards require that we plan and perform the audit to obtain reasonable assurance about whether the financial statements are free of material misstatement, whether due to error or fraud. The Trust is not required to have, nor were we engaged to perform, an audit of the Trust's internal control over financial reporting. As part of our audits we are required to obtain an understanding of internal control over financial reporting but not for the purpose of expressing an opinion on the effectiveness of the Trust's internal control over financial reporting. Accordingly, we express no such opinion.
Our audits included performing procedures to assess the risks of material misstatement of the financial statements, whether due to error or fraud, and performing procedures that respond to those risks. Such procedures included examining, on a test basis, evidence regarding the amounts and disclosures in the financial statements. Our procedures included confirmation of securities owned as of December 31, 2019, by correspondence with the custodian and brokers. Our audits also included evaluating the accounting principles used and significant estimates made by management, as well as evaluating the overall presentation of the financial statements. We believe that our audits provide a reasonable basis for our opinion.

We have served as the auditor of the Mairs & Power Funds Trust since 1958.
Minneapolis, Minnesota
February 13, 2020
47
FUND EXPENSES (unaudited)
As a shareholder of the Funds, you incur two types of costs: (1) transaction costs including redemption fees and (2) ongoing expenses for the operation of the Funds (e.g., asset-based charges, such as investment management fees). The Funds are "no-load" mutual funds. As a result, shareholders pay no commissions, fees, or expenses associated with sales representatives or sales charges.
This example is intended to help you understand your ongoing costs (in dollars) of investing in the Funds and to compare these costs with the ongoing costs of investing in other mutual funds. The table below reports the Funds' expenses during the period July 1, 2019 through December 31, 2019 and includes the costs associated with a $1,000 investment.
Actual Expenses
The first line in the tables below may be used to estimate the actual expenses you paid over the reporting period. You can do this by dividing your account value by $1,000 and multiplying the result by the expense shown in the table below. For example, if your account value is $8,600, divided by $1,000 = $8.60. Multiply the result by the number in the first line under the heading entitled "Expenses Paid During Period." By doing this you can estimate the expenses you paid on your account during this period.
Hypothetical Example
The second line of the tables below provides information about hypothetical account values and hypothetical expenses based on the Funds' actual expenses and assumed returns of 5% per year before expenses, which are not the Funds' actual returns. The results may be used to provide you with a basis for comparing the ongoing costs of investing in the Funds with the ongoing costs of investing in other funds. To do so, compare these 5% hypothetical examples with the 5% hypothetical examples that appear in the shareholder reports of other funds. Please note that these hypothetical examples highlight ongoing costs only and do not reflect any transactional fees, such as redemption fees. In addition, if these transactional costs were included, your costs would have been higher. These hypothetical expense examples may not be used to estimate the actual ending account balances or expenses you paid during the period and will not help you determine the relative total costs of owning different funds.
Mairs & Power Growth Fund
| | | Beginning Account
Value 07/01/2019 | | Ending Account
Value 12/31/2019 | | Expenses Paid
During Period * | |
Actual return | | $ | 1,000.00 | | | $ | 1,105.20 | | | $ | 3.40 | | |
Hypothetical assumed 5% return | | $ | 1,000.00 | | | $ | 1,021.98 | | | $ | 3.26 | | |
* The Fund's expenses are equal to the Fund's annualized expense ratio for the most recent six-month period of 0.64%, multiplied by the average account value over the Fund's second fiscal half-year, multiplied by the number of days in the Fund's second fiscal half-year (184 days), divided by 365 days.
Mairs & Power Balanced Fund
| | | Beginning Account
Value 07/01/2019 | | Ending Account
Value 12/31/2019 | | Expenses Paid
During Period * | |
Actual return | | $ | 1,000.00 | | | $ | 1,071.30 | | | $ | 3.71 | | |
Hypothetical assumed 5% return | | $ | 1,000.00 | | | $ | 1,021.63 | | | $ | 3.62 | | |
* The Fund's expenses are equal to the Fund's annualized expense ratio for the most recent six-month period of 0.71%, multiplied by the average account value over the Fund's second fiscal half-year, multiplied by the number of days in the Fund's second fiscal half-year (184 days), divided by 365 days.
48
FUND EXPENSES (unaudited) (continued)
Mairs & Power Small Cap Fund
| | | Beginning Account
Value 07/01/2019 | | Ending Account
Value 12/31/2019 | | Expenses Paid
During Period * | |
Actual return | | $ | 1,000.00 | | | $ | 1,044.10 | | | $ | 5.36 | | |
Hypothetical assumed 5% return | | $ | 1,000.00 | | | $ | 1,019.96 | | | $ | 5.30 | | |
* The Fund's expenses are equal to the Fund's annualized expense ratio for the most recent six-month period of 1.04%, multiplied by the average account value over the Fund's second fiscal half-year, multiplied by the number of days in the Fund's second fiscal half-year (184 days), divided by 365 days.
49
PRIVACY POLICY NOTICE (unaudited)
Our Promise to You
As a shareholder of the Mairs & Power Mutual Funds (Funds), you share both personal and financial information with us. Your privacy is important to us, and we are dedicated to safeguarding your personal and financial information.
Information Provided by Shareholders
In the normal course of doing business, we typically obtain the following non-public personal information about our shareholders:
• Personal information regarding our shareholders' identity such as name, address and social security number;
• Information regarding fund transactions effected by us; and
• Shareholder financial information such as net-worth, assets, income, bank account information and account balances.
How We Manage and Protect Your Personal Information
We do not sell information about current or former shareholders to third parties, nor is it our practice to disclose such information to third parties unless requested or permitted to do so by a shareholder or shareholder representative or, if necessary, in order to process a transaction, service an account or as permitted by law. Additionally, we may share information with outside companies that perform administrative services for us. However, our arrangements with these service providers require them to treat your information as confidential.
In order to protect your personal information, we maintain physical, electronic and procedural safeguards to protect your personal information. Our Privacy Policy restricts the use of shareholder information and requires that it be held in strict confidence.
Shareholder Notifications
We provide a notice annually describing our privacy policy. In addition, we will inform you promptly if there are changes to our policy. Please contact us at (800) 304-7404 with questions about this notice.
OTHER INFORMATION (unaudited)
This report is submitted for the general information of the shareholders of the Funds. It is not authorized for distribution to prospective investors unless accompanied or preceded by an effective prospectus. An investor should consider the Funds' investment objectives, risks and expenses carefully before investing or sending money. This and other important information can be found in the Funds' summary prospectuses and full prospectus. To obtain a prospectus, please call Shareholder Services at (800) 304-7404 or visit the Funds' website at www.mairsandpower.com. Please read the prospectus carefully before investing.
This report includes forward-looking statements such as economic predictions and portfolio manager opinions. The statements are subject to change at any time based on market and other conditions. No predictions, forecasts, outlooks, expectations or beliefs are guaranteed.
50
Proxy Voting Policies and Procedures that the Trust uses to determine how to vote proxies relating to portfolio securities are available (i) without charge, upon request, by calling Shareholder Services at (800) 304-7404 and requesting a copy of the Statement of Additional Information (SAI) and (ii) on the Securities and Exchange Commission's (SEC's) website at www.sec.gov (access Form N-1A).
Information on how the Trust voted proxies relating to portfolio securities during the most recent 12-month period ended June 30 is available at www.mairsandpower.com and on the SEC's website at www.sec.gov on Form N-PX.
DISCLOSURE OF PORTFOLIO HOLDINGS (unaudited)
A description of the Funds' policies and procedures with respect to the disclosure of portfolio holdings is available in the SAI and on the Funds' website. A complete list of each Fund's holdings is available on or about 15 days after each quarter-end at www.mairsandpower.com. This list remains available on the website until it is replaced with the following quarter-end list. The portfolio holdings list is also filed in the Funds' annual and semi-annual reports to shareholders filed with the SEC on Form N-CSR and as an exhibit to Form N-PORT following the end of each quarter. Form N-CSR and the public portion of Form N-PORT, when available, may be viewed on the SEC's website at www.sec.gov.
HOUSEHOLDING (unaudited)
In an effort to decrease costs, the Trust intends to reduce the number of duplicate Summary Prospectuses and Annual and Semi-Annual Reports you receive by sending only one copy of each to those addresses shared by two or more accounts and to shareholders reasonably believed to be from the same family or household. Once implemented, if you would like to discontinue householding for your accounts, please call Shareholder Services at (800) 304-7404 to request individual copies of these documents. Once notification to stop householding is received, the Trust will begin sending individual copies thirty days after receiving your request. This policy does not apply to account statements.
eDelivery is available to all direct shareholders. eDelivery provides your tax statements, account statements, trade confirmation statements and shareholder reports online rather than by regular mail. In addition to reducing paper waste, eDelivery may reduce your Fund fees by lowering printing and mailing costs over time. To receive materials electronically, please contact Shareholder Services at (800) 304-7404 or visit www.mairsandpower.com to sign up for eDelivery. If you hold your Fund shares through a Financial Intermediary, please contact your Financial Intermediary regarding electronic delivery options.
51
TRUSTEES AND OFFICERS (unaudited) December 31, 2019
Information pertaining to the Trustees and Officers of the Trust is set forth below. The Statement of Additional Information includes additional information about the Trust's Trustees and is available without charge, upon request, by calling Shareholder Services at (800) 304-7404 or by visiting www.mairsandpower.com.
Name (year of birth)
and address1 | | Position(s)
held with the
Trust and
length of
time served2 | | Principal occupation(s)
during past five years | | Number of
portfolios
in fund
complex
overseen by
Trustee | | Other
directorships
held by trustee
during past
five years | |
INTERESTED TRUSTEES3 | |
Jon A. Theobald (1945) | | Trustee since December 2012; Secretary from 2003 to May 2017; Chief Compliance Officer from 2004 to 2012 | | • Chair Emeritus of the Board of the Investment Adviser (January 2018 to present).
• Consultant to the Investment Adviser (January 2018 to present).
• Chair of the Board of the Investment Adviser (2015 to 2017).
• Chief Executive Officer of the Investment Adviser (2012 to 2017).
• President of the Investment Adviser (2007 to 2014). | | | 3 | | | None | |
Mark L. Henneman (1961) | | Trustee since January 2018; President since December 31, 2014; Vice President from 2009 to 2014 | | • Chair of the Board and Chief Executive Officer of the Investment Adviser (January 2018 to present).
• President of the Investment Adviser (2015 to 2017).
• Chief Investment Officer of the Investment Adviser (2015 to 2017).
• Executive Vice President of the Investment Adviser (2012 to 2014). | | | 3 | | | None | |
INDEPENDENT TRUSTEES | |
Mary Schmid Daugherty (1958) | | Chair of the Board since January 2018; Trustee since December 2010; Audit Committee Chair from December 2012 to December 2017 | | • Associate Professor, Department of Finance, University of St. Thomas (1987 to present). | | | 3 | | | None | |
James D. Alt (1951) | | Nominating and Governance Committee Chair since January 2017; Trustee since April 2015 | | • Retired Adjunct Associate Professor, University of Minnesota Law School (2007 to 2017); Retired Partner, Dorsey & Whitney LLP4 (1984 to 2012). | | | 3 | | | None | |
52
TRUSTEES AND OFFICERS (unaudited) (continued) December 31, 2019
Name (year of birth)
and address1 | | Position(s)
held with the
Trust and
length of
time served2 | | Principal occupation(s)
during past five years | | Number of
portfolios
in fund
complex
overseen by
Trustee | | Other
directorships
held by trustee
during past
five years | |
INDEPENDENT TRUSTEES (continued) | |
Patrick A. Thiele (1950) | | Audit Committee Chair since January 2018; Trustee since April 2015 | | • Retired Chief Executive Officer, PartnerRe Ltd. (a reinsurance company) (2000 to 2010). | | | 3 | | | Director,
PartnerRE Ltd. (March 2016 to December 2018); Director, OneBeacon
Insurance Group, Ltd. (2014 to September 2017). | |
Susan E. Knight (1954) | | Trustee since January 2018 | | • Retired Senior Vice President and Chief Financial Officer, MTS Systems Corporation (a testing and sensor company) (2001 to 2015). | | | 3 | | | Chair, Surmodics, Inc. (medical device and diagnostics company)
(2015 to present); Director, Surmodics, Inc. (2008 to 2015). | |
PRINCIPAL OFFICERS | |
Andrew R. Adams (1972) | | Vice President since 2011 | | • Chief Investment Officer of the Investment Adviser (January 2018 to present).
• Executive Vice President of the Investment Adviser (October 2016 to present).
• Vice President of the Investment Adviser (2006 to October 2016). | | N/A | | N/A | |
Kevin V. Earley (1964) | | Vice President since April 2018 | | • Vice President of the Investment Adviser (2013 to present). | | N/A | | N/A | |
Allen D. Steinkopf (1961) | | Vice President since April 2019 | | • Vice President of the Investment Adviser (2013 to present). | | N/A | | N/A | |
Andrea C. Stimmel (1967) | | Treasurer since 2011; Chief Compliance Officer from 2012 to 2016 | | • Chief Operating Officer of the Investment Adviser (January 2018 to present).
• Treasurer of the Investment Adviser (2008 to present).
• Director of Operations of the Investment Adviser (2008 to 2017).
• Chief Compliance Officer of the Investment Adviser (2012 to 2016). | | N/A | | N/A | |
53
TRUSTEES AND OFFICERS (unaudited) (continued) December 31, 2019
Name (year of birth)
and address1 | | Position(s)
held with the
Trust and
length of
time served2 | | Principal occupation(s)
during past five years | | Number of
portfolios
in fund
complex
overseen by
Trustee | | Other
directorships
held by trustee
during past
five years | |
PRINCIPAL OFFICERS (continued) | |
Robert W. Mairs (1969) | | Secretary since May 2017; Chief Compliance Officer and Anti-Money Laundering Compliance Officer since 2017; Assistant Chief Compliance Officer from September 2016 to December 2016 | | • President and Secretary of the Investment Adviser (January 2018 to present).
• Chief Compliance Officer of the Investment Adviser (January 2017 to present).
• General Counsel of the Investment Adviser (2015 to present).
• Assistant Chief Compliance Officer of the Investment Adviser (September 2016 to December 2016).
• Shareholder and Attorney, Lathrop GPM (1999 to 2015). | | N/A | | N/A | |
1 Unless otherwise indicated, the mailing address of each officer and trustee is: W1520 First National Bank Building, 332 Minnesota Street, Saint Paul, MN 55101-1363.
2 Dr. Daugherty served as a director of Mairs and Power Growth Fund, Inc. and Mairs and Power Balanced Fund, Inc. (together, the "Predecessor Funds") prior to the reorganization of the Predecessor Funds into newly formed series of the Trust effective December 31, 2011. Positions listed in this column for trustees and officers prior to 2012 refer to their positions with the Predecessor Funds. Each trustee serves until his or her resignation or mandatory retirement age. Each officer is elected annually and serves until his successor has been duly elected and qualified.
3 Mr. Theobald and Mr. Henneman are deemed to be "interested persons" of the Trust due to their respective positions with the Adviser.
4 Dorsey & Whitney LLP previously served as legal counsel to the Trust through December 2012.
54
MAIRS & POWER FUNDS TRUST
Mairs & Power Growth Fund, established 1958
Mairs & Power Balanced Fund, established 1961
Mairs & Power Small Cap Fund, established 2011
A No-Load Funds Trust
For Shareholder Services
Call (800) 304-7404
Or write to:
(via Regular Mail)
c/o U.S. Bancorp Fund Services, LLC
615 East Michigan Street
P. O. Box 701
Milwaukee, WI 53201-0701 | | (via Overnight or Express Mail)
c/o U.S. Bancorp Fund Services, LLC
3rd Floor
615 East Michigan Street
Milwaukee, WI 53202-0701 | |
For Fund literature and information, visit the Trust's website at:
www.mairsandpower.com
Investment Manager
Mairs & Power, Inc.
W1520 First National Bank Building
332 Minnesota Street
Saint Paul, MN 55101
Custodian
U.S. Bank, N.A.
Custody Operations
1555 North River Center Drive, Suite 302
Milwaukee, WI 53212
Distributor
ALPS Distributors, Inc.
1290 Broadway, Suite 1100
Denver, CO 80203
Mairs & Power, Inc.
c/o U.S. Bancorp Fund Services, LLC
3rd Floor
615 East Michigan Street
Milwaukee, WI 53202-0701
Item 2. Code of Ethics.
The registrant adopted its Code of Ethics for Principal Executive Officer and Principal Financial Officer on May 17, 2012. The Code of Ethics is attached as exhibit 13(a)(1) to this form.
Item 3. Audit Committee Financial Expert.
The registrant’s Board of Trustees has determined that Dr. Mary Schmid Daugherty, Ms. Susan Knight and Mr. Patrick Thiele, all members of the registrant’s Audit Committee, are “audit committee financial experts” as defined in Item 3 of Form N-CSR. Dr. Daugherty, Ms. Knight and Mr. Thiele are “independent” under the standards set forth in Item 3 of Form N-CSR.
Item 4. Principal Accountant Fees and Services.
Year Ended
December 31, | | (a)
Audit Fees | | (b)
Audit-
Related Fees | | (c)
Tax Fees | | (d)
All Other
Fees | |
| | | | | | | | | |
2018 | | $ | 114,640 | | None | | $ | 20,940 | | None | |
2019 | | $ | 113,200 | | None | | $ | 21,465 | | None | |
(a) | | Audit fees include amounts related to the audit of registrant’s annual financial statements and services normally provided by the accountant in connection with statutory and regulatory filings. |
| | |
(c) | | Tax fees include amounts related to tax advice and tax return preparation, compliance and reviews. |
| | |
(d) | | Tax consulting fee includes fees and expenses related to allowable tax consulting services. |
| | |
(e)(1) | | The registrant’s Audit Committee approves the engagement of the accountant before the accountant is engaged by the registrant and approved all audit and non-audit services provided to the registrant. |
| | |
(e)(2) | | None of such services described in columns (b) through (d) were subject to a waiver of the pre-approval requirement pursuant to paragraph (c)(7)(i)(c) of Rule 2-01 of Regulation S-X. |
| | |
(f) | | Not applicable |
| | |
(g) | | The aggregate fees for non-audit services rendered by the registrant’s accountant to the registrant were $20,940 for the fiscal year ended December 31, 2018 and $21,465 for the fiscal year ended December 31, 2019. The aggregate fees for non-audit services rendered by the registrant’s |
| | accountant to the registrant’s investment adviser were $18,680 for the fiscal year ended December 31, 2018 and $20,645 for the fiscal year ended December 31, 2019. |
| | |
(h) | | The registrant’s Audit Committee has considered whether the provision of non-audit services by the registrant’s accountant to the registrant’s investment adviser is compatible with maintaining the accountant’s independence. |
Item 5. Audit Committee of Listed Registrants.
Not applicable to registrants who are not listed issuers (as defined in Rule 10A-3 under the Securities Exchange Act of 1934).
Item 6. Investments.
(a) Schedule of Investments is included as part of the report to shareholders filed under Item 1 of this Form
(b) Not Applicable.
Item 7. Disclosure of Proxy Voting Policies and Procedures for Closed-End Management Investment Companies.
Not applicable to open-end investment companies.
Item 8. Portfolio Managers of Closed-End Management Investment Companies.
Not applicable to open-end investment companies.
Item 9. Purchases of Equity Securities by Closed-End Management Investment Company and Affiliated Purchasers.
Not applicable to open-end investment companies.
Item 10. Submission of Matters to a Vote of Security Holders.
There has been no material change to the procedures by which shareholders may recommend nominees to the registrant’s board of directors.
Item 11. Controls and Procedures.
(a) The registrant’s principal executive officer and principal financial officer have evaluated the registrant’s disclosure controls and procedures as of a date within 90 days of the filing of this report and have concluded that the registrant’s disclosure controls and procedures were effective, as of that date, in ensuring that information required to be disclosed by the registrant in this Form N-CSR was recorded, processed, summarized and reported within the time period specified by the SEC’s rules and forms.
2
(b) There were no changes in the Registrant’s internal control over financial reporting (as defined in Rule 30a-3(d) under the Act) that occurred during the second fiscal quarter of the period covered by this report that has materially affected, or is reasonably likely to materially affect, the Registrant’s internal control over financial reporting.
Item 12. Disclosure of Securities Lending Activities for Closed-End Management Investment Companies
Not applicable to open-end investment companies.
Item 13. Exhibits.
(a) (1) Code of Ethics
Mairs & Power Funds Trust Code of Ethics for Principal Executive Officer and Principal Financial Officer.
Incorporated by reference to previous Form N-CSR filing, filed August 31, 2018.
(2) Certifications required by Rule 30a-2(a) under the Investment Company Act of 1940.
Attached as exhibit 99.CERT to this form.
(3) Any written solicitation to purchase securities under Rule 23c-1 under the Act sent or given during the period covered by the report by or on behalf of the registrant to 10 or more persons. Not applicable to open-end investment companies.
(b) Certifications pursuant to Section 906 of the Sarbanes-Oxley Act of 2002.
Attached as exhibit 99.906 CERT to this form.
3
SIGNATURES
Pursuant to the requirements of the Securities Exchange Act of 1934 and the Investment Company Act of 1940, the registrant has duly caused this report to be signed on its behalf by the undersigned, thereunto duly authorized.
(Registrant) | Mairs & Power Funds Trust |
|
By (Signature and Title)* | /s/ Mark L. Henneman |
| Mark L. Henneman, President |
| Principal Executive Officer |
| |
Date | 2/21/20 |
| | | |
Pursuant to the requirements of the Securities Exchange Act of 1934 and the Investment Company Act of 1940, this report has been signed below by the following persons on behalf of the registrant and in the capacities and on the dates indicated.
By (Signature and Title)* | /s/ Mark L. Henneman |
| Mark L. Henneman, President |
| Principal Executive Officer |
|
Date | 2/21/20 |
|
By (Signature and Title)* | /s/ Andrea C. Stimmel |
| Andrea C. Stimmel, Treasurer |
| Principal Financial Officer |
| |
Date | 2/21/20 |
| | | |
* Print the name and title of each signing officer under his or her signature.
4