UNITED STATES
SECURITIES AND EXCHANGE COMMISSION
Washington, D.C. 20549
FORM N-CSR
CERTIFIED SHAREHOLDER REPORT OF REGISTERED
MANAGEMENT INVESTMENT COMPANIES
Investment Company Act file number 811-22563
Mairs & Power Funds Trust
(Exact name of registrant as specified in charter)
332 Minnesota Street, Suite W1520, St. Paul, MN 55101
(Address of principal executive offices) (Zip code)
Andrea C. Stimmel, Treasurer, 332 Minnesota Street, Suite W1520, St. Paul, MN 55101
(Name and address of agent for service)
651-222-8478
Registrant's telephone number, including area code
Date of fiscal year end: December 31, 2020
Date of reporting period: December 31, 2020
Item 1. Reports to Stockholders.

ANNUAL REPORT
DECEMBER 31, 2020
- GROWTH FUND (MPGFX)
est. 1958
- BALANCED FUND (MAPOX)
est. 1961
- SMALL CAP FUND (MSCFX)
est. 2011
Beginning in February 2021, as permitted by regulations adopted by the U.S. Securities and Exchange Commission, paper copies of the Mairs & Power Funds' shareholder reports will no longer be sent by mail, unless you specifically request paper copies of the reports from the Mairs & Power Funds or from your Financial Intermediary. Instead, the reports will be made available on the Mairs & Power Funds' website, and you will be notified each time a report is posted and provided with a website link to access the report. If you already elected to receive shareholder reports electronically for the Mairs & Power Funds, you will not be affected by this change and you need not take any action.
Mairs & Power Funds Direct Shareholders
You may elect to receive shareholder reports and other communications electronically or in paper from the Mairs & Power Funds by electing one of the following options:
1. Receive Fund Communication by Email: Contact Shareholder Services at (800) 304-7404 or consent through the direct shareholder portal online at www.mairsandpower.com. You may also elect to receive account statements, tax forms and confirmations through this means.
2. Receive Fund Communication by Mail: Contact Shareholder Services at (800) 304-7404.
You may elect to continue receiving paper copies of the shareholder reports and other communications, free of charge, by contacting Shareholder Services at (800) 304-7404.
Mairs & Power Fund Shareholder through a Financial Intermediary (such as broker-dealer or bank)
Contact your Financial Intermediary to make your election. Your election will apply to all Mairs & Power Funds held through your Financial Intermediary.
Mairs & Power W1520 First National Bank Building, 332 Minnesota Street, St. Paul, Minnesota 55101 www.mairsandpower.com
MAIRS & POWER FUNDS MARKET COMMENTARY (unaudited)
December 31, 2020
To say 2020 was far from normal feels like a significant understatement. The COVID-19 pandemic, the ensuing near-crash of the economy, working remotely, nationwide civil unrest, and a wild election season all made for a difficult year. Thankfully, our economy proved to be remarkably resilient, thanks in large part to unprecedented monetary and fiscal stimulus.
Then there was the market. From its February highs, the market took a breathtaking 34% nosedive, which was matched only by its remarkable rebound. And it just kept climbing from there. The S&P 500 Total Return (TR) Index rose 12.15% for the fourth quarter and was up 18.40% for the year. In the last quarter, the Dow Jones Industrial Average TR Index climbed 10.73% and was up 9.72% for all of 2020. In terms of sectors, the strongest performers were Consumer Discretionary and Technology, while Financial, Real Estate and Energy were the weakest.
In the fixed-income market, the Bloomberg Barclays U.S. Government/Credit Bond Index returned 0.82% and 8.93% for the fourth quarter and for all of 2020, respectively.
Future Outlook
Given the low interest rates, we believe overall equity valuations are reasonable. We anticipate seeing accelerating earnings and dividends growth in 2021 and a significant snapback in profitability over the next couple of years. The investment community's current consensus view is that 2021 earnings will be better than what they were in 2019. Previously, the consensus view was that we would get back to 2019 earnings levels by 2022 at the earliest.
Approval of the COVID-19 vaccines in November gave the market tremendous confidence that life would return back to normal more quickly than anticipated – perhaps as soon as mid-2021. The market also responded strongly and positively to the new economic support and stimulus package that the federal government approved in the fourth quarter.
To be sure, the numbers tell a complex story. The economic indicators that stand out in this regard are job losses and job recoveries. April job losses were 20.5 million; since then, 11 million jobs have been recovered, so we still have a long way to go to get back to pre-pandemic levels. The job numbers released in December and January were less optimistic, but the overall direction has been positive.
For equity investors, 2020 ended up being a surprisingly good year. For us, navigating 2020 was a matter of staying the course, looking for opportunities, and not getting caught up in the drama.
Technology was the market's best performing sector in 2020, up 43.9%. Tech companies have played an essential role in keeping the economy going. During the year, we increased positions in several tech companies, particularly as more and more people work and learn from home. To be sure, most employees will return to the office, and most students will return to classrooms. However, companies have seen the benefits of working remotely, and as such, we expect some of them will continue allowing their employees to work from home in some shape or form indefinitely.
By contrast, Financials had a difficult year, down 1.69% in 2020. We saw signs this fall that commercial banks were beginning to demonstrate improved fundamentals. We continue to believe that many of our stocks within this space will survive the current downturn intact and provide compelling investment opportunities at their current prices. Consequently, we added to our positions in the sector.
Meanwhile, fixed income had another good quarter, and it too experienced a very good year overall. Corporate bond spreads have recovered nearly all of the widening that occurred in March and April. Overall bond yields dropped to near-record lows, which in turn caused solid total returns in the bond market in 2020. It appears that the Federal Reserve will remain supportive of risk assets in 2021.
1
MAIRS & POWER FUNDS MARKET COMMENTARY (unaudited) (continued)
This year, Joe Biden becomes president. He'll have the support of both houses of Congress, which will effectively be under the control of the Democratic party. As a result, 2021 is likely to bring many changes at the federal level. Those changes could include increases in corporate tax rates, new infrastructure projects, and renewed efforts to bolster nationwide health insurance coverage.
Past Performance is not a guarantee of future results.
S&P 500 TR (Total Return) Index is an unmanaged index of 500 common stocks that is generally considered representative of the U.S. stock market. It is not possible to invest directly in an index.
Dow Jones Industrial Average TR Index is a price-weighted average of 30 significant stocks traded on the New York Stock Exchange and the NASDAQ. It is not possible to invest directly in an index.
Bloomberg Barclays U.S. Government/Credit Bond Index is a broad-based flagship benchmark that measures the non-securitized component of the U.S. Aggregate Index. It includes investment-grade, U.S. dollar-denominated, fixed-rate Treasuries, government-related and corporate securities. It is not possible to invest directly in an index.
2
MAIRS & POWER GROWTH FUND (unaudited)
To Our Shareholders: December 31, 2020
The Mairs & Power Growth Fund gained 13.88% in the fourth quarter and was up 16.67% for all of 2020. The S&P 500 Total Return (TR) benchmark was up 12.15% and 18.40% for the same respective periods, while the Lipper Multi Cap Core Funds Index of peers posted gains of 15.69% in the fourth quarter and 21.20% for the entire year.
While we remain stock pickers at heart, the Fund has a number of macro leanings including its heavier weighting in small and mid-cap stocks, as well as a bias toward value investing. Both of these leanings were headwinds to relative performance in 2020 as smaller stocks and value indexes underperformed the S&P 500. In addition, the Fund's emphasis on holding stocks headquartered in the region was a headwind last year. The Piper Sandler Company Minnesota Index was up only 6.83% for all of 2020.
Several of the Fund's long-term sector leanings also detracted from performance in 2020. One headwind was our underweight in Technology, the market's best performing sector last year. We have been reducing our underweight as we see improvement in the competitive position of some of the sector's stocks. Going forward, we expect the Fund's Technology underweight to have less of an impact on relative performance.
Overweights in the Industrial and Healthcare sectors also hurt the Fund's relative performance. We will continue to maintain our relative weights in these sectors, since we believe they offer a number of intriguing opportunities.
While all these macro leanings were headwinds to the Fund in 2020, we are also confident that they will benefit relative performance in the future. In fact, we saw evidence of that in the latter part of the year as positive results from COVID-19 vaccines reversed some of those headwinds. The Fund will always have a Minnesota bias, and it always will be skewed toward value stocks as well as small and mid-cap holdings. Last year, these leanings clouded Fund performance. Over the long term, we believe these headwinds will subside and that the strength of our stock selection will eventually shine through.
MAIRS & POWER GROWTH FUND (MPGFX)
Top Relative Performers
| Fourth Quarter (9/30/20 – 12/31/20) | | Year To Date (12/31/19 – 12/31/20) | |
U.S. Bancorp | | | 18.99 | % | | NVIDIA Corporation | | | 103.90 | % | |
Alphabet Inc. Class C | | | 7.06 | % | | Bio-Techne Corporation | | | 26.99 | % | |
Bio-Techne Corporation | | | 16.17 | % | | Alphabet Inc. Class C | | | 12.63 | % | |
Littelfuse, Inc. | | | 31.75 | % | | Graco Inc. | | | 22.56 | % | |
Graco Inc. | | | 6.10 | % | | Fastenal Company | | | 18.17 | % | |
Weak Relative Performers
| Fourth Quarter (9/30/20 – 12/31/20) | | Year To Date (12/31/19 – 12/31/20) | |
Jamf Holdings Corporation | | | -32.59 | % | | Amazon.com Inc. | | | -16.85 | % | |
C.H. Robinson Worldwide | | | -19.79 | % | | U.S. Bancorp | | | -36.28 | % | |
Hormel Foods Corporation | | | -16.36 | % | | Great Western Bancorp, Inc. | | | -56.80 | % | |
NVIDIA Corporation | | | -15.63 | % | | Core Laboratories NV | | | -65.49 | % | |
Amazon.com Inc. | | | -10.60 | % | | Wells Fargo & Company | | | -60.06 | % | |
Performance shown is relative to the S&P 500 TR Index as of December 31, 2020. Relative return is the difference between the absolute return and the performance of the market, in which the position is held. Relative contribution is used for ranking, which considers average daily weightings for each holding. Past performance does not guarantee future results.
3
MAIRS & POWER GROWTH FUND (unaudited) (continued)
Speaking of that selection: The Fund's two biggest relative contributors in 2020 were Nvidia (NVDA) and Bio-Techne (TECH). Nvidia specializes in graphics cards for computers, and it has benefited from updated chips as well as strong market positions in applications and machine learning. Bio-Techne has prospered because of its multiple roles supporting healthcare R&D. We like to describe this Minnesota-based company as the pick-and-shovel supplier for biotechnology.
On the negative side, one of the Fund's biggest detractor in 2020 was U.S. Bancorp (USB). Like all banks, U.S. Bank was hurt by the difficult interest rate environment and credit cycle concerns. We believe banks are strong enough to survive the current sector doldrums, and they remain some of the market's most attractive opportunities.
Also in the Fund's negative column were two companies that actually were powerful performers in 2020: Amazon (AMZN) and Apple (AAPL), which both were up around 70% for the year. Why do we describe these as "negatives"? In the case of Apple, it's because the Fund has no position in the company. We did acquire AMZN in the fourth quarter. But not owning it till then cost the Fund in performance relative to the S&P 500 TR Index.
We had held off taking a position in Amazon largely due to concerns about the company's slim margins. But in 2020, we saw its core margins nearly double as more consumers shopped online, which in turn led to greater utilization and route density within Amazon's delivery network. In addition, Amazon's advertising business, which represents a small portion of its overall sales, has been growing quickly. Advertising could become a third leg of growth for the company along with e-commerce and Amazon Web Services. In short, Amazon checks all of our boxes – it has a strong management team, great growth prospects, and a strong competitive advantage. And last year, we initiated our position at an intriguing valuation.
A final note: The Mairs & Power Growth Fund says a fond farewell to Mark Henneman, who stepped down as the Fund's co-manager at the beginning of 2021. Mark remains our firm's chairman and CEO. He also serves on our Investment Committee, which will allow us to continue tapping his insights and expertise.
Andrew R. Adams
Lead Manager | | Peter J. Johnson
Co-Manager | |
The Fund's investment objective, risks, charges and expenses must be considered carefully before investing. The summary prospectus or full prospectus contains this and other important information about the Fund and they may be obtained by calling Shareholder Services at (800) 304-7404 or by visiting www.mairsandpower.com. Read the summary prospectus or full prospectus carefully before investing.
All holdings in the portfolio are subject to change without notice and may or may not represent current or future portfolio composition. The mention of specific securities is not intended as a recommendation or an offer of a particular security, nor is it intended to be a solicitation for the purchase or sale of any security.
All investments have risks. The Growth Fund is designed for long-term investors. Equity investments are subject to market fluctuations and the Fund's share price can fall because of weakness in the broad market, a particular industry or specific holdings. Investments in small and midcap companies generally are more volatile. International investing risks include among others political, social or economic instability, difficulty in predicting international trade patterns, taxation and foreign trading practices and greater fluctuations in price than U.S. corporations.
This commentary includes forward-looking statements such as economic predictions and portfolio manager opinions. The statements are subject to change at any time based on market and other conditions. No predictions, forecasts, outlooks, expectations or beliefs are guaranteed.
S&P 500 TR (Total Return) Index is an unmanaged index of 500 common stocks that is generally considered representative of the U.S. stock market. It is not possible to invest directly in an index.
Lipper Multi-Cap Core Funds Index measures performance of the 30 largest mutual funds that invest in a variety of capitalization ranges, without concentrating 75% or more of their equity assets in any one market capitalization range over an extended period of time. It is not possible to invest directly in an index.
Piper Sandler Company Minnesota Index is a price-weighted index designed to measure the performance of the Minnesota economy. It is not possible to invest directly in an index.
4
Mairs & Power Growth Fund
PERFORMANCE INFORMATION (unaudited) December 31, 2020
Ten years of investment performance (through December 31, 2020)
This chart illustrates the performance of a hypothetical $10,000 investment made in the Fund 10 years ago.

Average annual total returns for periods ended December 31, 2020
| | | 1 year | | 5 years | | 10 years | | 20 years | |
Mairs & Power Growth Fund | | | 16.67 | % | | | 14.01 | % | | | 12.89 | % | | | 9.45 | % | |
S&P 500 Total Return Index(1) | | | 18.40 | % | | | 15.22 | % | | | 13.88 | % | | | 7.47 | % | |
Performance data quoted represents past performance and does not guarantee future results. All performance information shown includes the reinvestment of dividend and capital gain distributions, but does not reflect the deduction of taxes that a shareholder would pay on Fund distributions or the redemption of Fund shares. The investment return and principal value of an investment will fluctuate so that an investor's shares, when redeemed, may be worth more or less than their original cost. Current performance of the Fund may be lower or higher than the performance quoted. For the most recent month-end performance figures, visit the Fund's website at www.mairsandpower.com or call Shareholder Services at (800) 304-7404. Per the Prospectus dated April 30, 2020, the expense ratio for the Fund is 0.65%.
(1) The S&P 500 Total Return Index is an unmanaged index of 500 common stocks that is generally considered representative of the U.S. stock market. It tracks both the capital gains of a group of stocks over time and assumes that any cash distributions, such as dividends, are reinvested back into the index. It is not possible to invest directly in an index.
5
Mairs & Power Growth Fund
FUND INFORMATION (unaudited) December 31, 2020
Portfolio Managers
(Effective as of January 1, 2021)
Andrew R. Adams, CFA, lead manager since April 1, 2019, co-manager from January 1, 2015 through April 1, 2019, University of Wisconsin-Madison, MS Finance 1997
Peter J. Johnson, CFA, co-manager since April 1, 2019, University of Wisconsin-Madison, MBA Applied Security Analysis 2010
General Information
Fund Symbol | | | MPGFX | | |
Net Asset Value (NAV) Per Share | | $ | 136.08 | | |
Expense Ratio | | | 0.64 | % | |
Portfolio Turnover Rate | | | 14.52 | % | |
Sales Charge | | | None1 | | |
Fund Inception Year | | | 1958 | | |
Portfolio Composition
Top Ten Portfolio Holdings
(Percent of Total Net Assets) 2
Alphabet Inc | | | 6.6 | % | |
Microsoft Corp | | | 6.5 | | |
US Bancorp/MN | | | 4.5 | | |
Medtronic PLC | | | 4.2 | | |
Ecolab Inc | | | 3.8 | | |
UnitedHealth Group Inc | | | 3.7 | | |
Graco Inc | | | 3.3 | | |
NVIDIA Corp | | | 3.1 | | |
Bio-Techne Corp | | | 3.1 | | |
Toro Co/The | | | 3.1 | | |
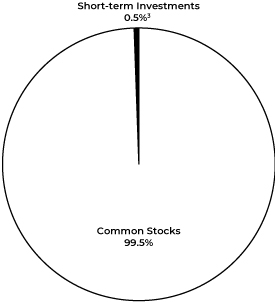
Portfolio Diversification
(Percent of Total Net Assets)
Common Stocks 99.5% | |
Information Technology | | | 23.6 | % | |
Health Care | | | 20.6 | | |
Industrials | | | 18.4 | | |
Financials | | | 10.6 | | |
Communication Services | | | 9.9 | | |
Materials | | | 6.4 | | |
Consumer Discretionary | | | 4.6 | | |
Consumer Staples | | | 2.7 | | |
Real Estate | | | 2.3 | | |
Utilities | | | 0.4 | | |
Short-term Investments 0.5%3 | | | 0.5 | | |
| | | | 100.0 | % | |
1 Although the Fund is no-load, investment management fees and other expenses still apply.
2 All holdings in the portfolio are subject to change without notice and may or may not represent current or future portfolio composition. The mention of specific securities is not intended as a recommendation or offer for a particular security, nor is it intended to be a solicitation for the purchase or sale of any security.
3 Represents short-term investments and other assets and liabilities (net).
The Schedule of Investments and portfolio diversification utilize the Global Industry Classification Standard (GICS®) which was developed by and/or is the exclusive property of MSCI, Inc. and Standard & Poor's Financial Services LLC ("S&P"). GICS is a service mark of MSCI, Inc. and S&P and has been licensed for use by Mairs & Power, Inc. (the "Adviser").
6
Mairs & Power Growth Fund
SCHEDULE OF INVESTMENTS December 31, 2020
Shares | | Security Description | | Fair Value | |
| | | COMMON STOCKS 99.5% | |
| | | COMMUNICATION SERVICES 9.9% | |
| | 620,000 | | | Activision Blizzard Inc | | $ | 57,567,000 | | |
| | 183,700 | | | Alphabet Inc (a) | | | 321,820,356 | | |
| | 565,000 | | | Walt Disney Co/The (a) | | | 102,366,700 | | |
| | | | 481,754,056 | | |
| | | CONSUMER DISCRETIONARY 4.6% | |
| | 37,500 | | | Amazon.com Inc (a) | | | 122,134,875 | | |
| | 242,100 | | | Gentherm Inc (a) | | | 15,789,762 | | |
| | 200,000 | | | Home Depot Inc/The | | | 53,124,000 | | |
| | 180,000 | | | Target Corp | | | 31,775,400 | | |
| | | | 222,824,037 | | |
| | | CONSUMER STAPLES 2.7% | |
| | 2,288,592 | | | Hormel Foods Corp | | | 106,671,273 | | |
| | 315,000 | | | Sysco Corp | | | 23,391,900 | | |
| | | | 130,063,173 | | |
| | | FINANCIALS 10.6% | |
| | 385,000 | | | American Express Co | | | 46,550,350 | | |
| | 841,300 | | | Charles Schwab Corp/The | | | 44,622,552 | | |
| | 1,280,000 | | | Great Western Bancorp Inc | | | 26,752,000 | | |
| | 1,890,000 | | | Principal Financial Group Inc | | | 93,762,900 | | |
| | 4,680,000 | | | US Bancorp/MN | | | 218,041,200 | | |
| | 2,850,000 | | | Wells Fargo & Co | | | 86,013,000 | | |
| | | | 515,742,002 | | |
| | | HEALTH CARE 20.6% | |
| | 515,000 | | | Abbott Laboratories | | | 56,387,350 | | |
| | 225,000 | | | Baxter International Inc | | | 18,054,000 | | |
| | 472,200 | | | Bio-Techne Corp | | | 149,947,110 | | |
| | 505,527 | | | Elanco Animal Health Inc (a) | | | 15,504,513 | | |
| | 255,000 | | | Eli Lilly & Co | | | 43,054,200 | | |
| | 795,000 | | | Johnson & Johnson | | | 125,117,100 | | |
| | 1,730,000 | | | Medtronic PLC (d) | | | 202,652,200 | | |
| | 1,010,000 | | | Pfizer Inc | | | 37,178,100 | | |
| | 3,185,000 | | | Roche Holding AG (c) | | | 139,630,400 | | |
| | 510,000 | | | UnitedHealth Group Inc | | | 178,846,800 | | |
| | 235,000 | | | Zimmer Holdings Inc | | | 36,211,150 | | |
| | | | 1,002,582,923 | | |
7
Mairs & Power Growth Fund
SCHEDULE OF INVESTMENTS (continued) December 31, 2020
Shares | | Security Description | | Fair Value | |
| | | COMMON STOCKS (continued) | |
| | | INDUSTRIALS 18.4% | |
| | 615,000 | | | 3M Co | | $ | 107,495,850 | | |
| | 630,000 | | | CH Robinson Worldwide Inc | | | 59,138,100 | | |
| | 1,750,000 | | | Donaldson Co Inc | | | 97,790,000 | | |
| | 1,830,000 | | | Fastenal Co | | | 89,358,900 | | |
| | 2,245,000 | | | Graco Inc | | | 162,425,750 | | |
| | 225,000 | | | Honeywell International Inc | | | 47,857,500 | | |
| | 2,781,066 | | | nVent Electric PLC (d) | | | 64,771,028 | | |
| | 108,000 | | | Proto Labs Inc (a) | | | 16,567,200 | | |
| | 125,000 | | | Rockwell Automation Inc | | | 31,351,250 | | |
| | 949,966 | | | Tennant Co (e) | | | 66,659,114 | | |
| | 1,570,000 | | | Toro Co/The | | | 148,898,800 | | |
| | | | 892,313,492 | | |
| | | INFORMATION TECHNOLOGY 23.6% | |
| | 960,000 | | | Corning Inc | | | 34,560,000 | | |
| | 1,391,333 | | | Digi International Inc (a) | | | 26,296,194 | | |
| | 1,060,000 | | | Fiserv Inc (a) | | | 120,691,600 | | |
| | 820,000 | | | Jamf Holding Corp (a) | | | 24,534,400 | | |
| | 434,404 | | | Littelfuse Inc | | | 110,625,322 | | |
| | 1,420,000 | | | Microsoft Corp | | | 315,836,400 | | |
| | 520,000 | | | Motorola Solutions Inc | | | 88,431,200 | | |
| | 195,500 | | | NVE Corp | | | 10,983,190 | | |
| | 290,000 | | | NVIDIA Corp | | | 151,438,000 | | |
| | 605,000 | | | QUALCOMM Inc | | | 92,165,700 | | |
| | 675,000 | | | Visa Inc | | | 147,642,750 | | |
| | 266,600 | | | Workiva Inc (a) | | | 24,425,892 | | |
| | | | 1,147,630,648 | | |
| | | MATERIALS 6.4% | |
| | 860,000 | | | Ecolab Inc | | | 186,069,600 | | |
| | 1,710,000 | | | HB Fuller Co | | | 88,714,800 | | |
| | 49,000 | | | Sherwin-Williams Co/The | | | 36,010,590 | | |
| | | | 310,794,990 | | |
| | | REAL ESTATE 2.3% | |
| | 870,000 | | | CoreSite Realty Corp | | | 108,993,600 | | |
| | | UTILITIES 0.4% | |
| | 390,000 | | | Alliant Energy Corp | | | 20,096,700 | | |
| | | | | TOTAL COMMON STOCKS
(cost $2,281,074,069) | | $ | 4,832,795,621
| | |
8
Mairs & Power Growth Fund
SCHEDULE OF INVESTMENTS (continued) December 31, 2020
Shares | | Security Description | | Fair Value | |
| | | SHORT-TERM INVESTMENTS 0.4% | |
| | 20,234,435 | | | First American Government Obligations Fund, Class X, 0.040% (b)
(cost $20,234,435) | | $ | 20,234,435
| | |
| | | | | TOTAL INVESTMENTS 99.9%
(cost $2,301,308,504) | | $ | 4,853,030,056
| | |
| | | OTHER ASSETS AND LIABILITIES (NET) 0.1% | | | 5,159,096 | | |
| | | TOTAL NET ASSETS 100.0% | | $ | 4,858,189,152 | | |
(a) Non-income producing.
(b) The rate quoted is the annualized seven-day effective yield as of December 31, 2020.
(c) American Depositary Receipt.
(d) Issuer headquartered overseas but considered domestic. The Adviser defines foreign issuers as those whose operational leadership or headquarters is located in a foreign country; provided, however, if an issuer is believed by the Adviser to be headquartered in a jurisdiction primarily for tax purposes, the Adviser will consider the following additional factors: 1) the location of the primary exchange trading its securities, 2) where it derives the majority of its revenues, and/or 3) where it earns the majority of its profits.
(e) Affiliated company at December 31, 2020.
See accompanying Notes to Financial Statements.
9
MAIRS & POWER BALANCED FUND (unaudited)
To Our Shareholders: December 31, 2020
The Mairs & Power Balanced Fund gained 10.11% in the fourth quarter and was up 10.44% for all of 2020. The benchmark composite index (60% S&P 500 Total Return Index and 40% Bloomberg Barclays U.S. Government/Credit Bond Index) gained 7.60% for the quarter and 15.30% for the year, while the Morningstar US Fund Allocation peer group rose 10.06% in the fourth quarter and 11.34% for the year.
Over the long term, the Fund has had a number of macro leanings on the equity side of the portfolio, including its allocation to small and mid-cap stocks, as well as a bias toward value investing. Both of these leanings were headwinds to relative performance in 2020 as smaller stocks and value indexes underperformed the broader S&P 500. In addition, the Fund's emphasis on holding stocks headquartered in the region was a headwind last year. The Piper Sandler Company Minnesota Index was up only 6.83% for all of 2020.
Several of the Fund's long-term sector leanings also detracted from performance in 2020. One headwind was our underweight in Technology, the market's best performing sector last year. We have been narrowing our underweight as we see improvement in the competitive position of some of the sector's stocks. Overweights in the Industrial and Healthcare sectors also hurt the Fund's relative performance. We will continue to maintain our relative weights in these sectors since we believe they offer a number of intriguing opportunities.
While all these macro leanings were headwinds to the Fund in 2020, we also are confident that they will benefit relative performance in the future. In fact, we saw evidence of that in the latter part of the year as positive results from COVID-19 vaccines reversed some of those headwinds. The Fund will always have a Minnesota bias, and it always will be skewed toward value stocks as well as small and mid-cap holdings. Last year, these leanings clouded Fund performance. Over the long term, we believe the strength of our stock selection strategy will shine through.
MAIRS & POWER BALANCED FUND (MAPOX)
Top Relative Performers
| Fourth Quarter (9/30/20 – 12/31/20) | | Year To Date (12/31/19 – 12/31/20) | |
U.S. Bancorp | | | 18.99 | % | | Alphabet Inc. Class C | | | 12.63 | % | |
Alphabet Inc. Class C | | | 7.06 | % | | QUALCOMM Inc. | | | 58.60 | % | |
Principal Financial Group, Inc. | | | 12.44 | % | | Graco Inc. | | | 22.56 | % | |
Honeywell International Inc. | | | 17.68 | % | | Toro Company | | | 2.26 | % | |
Graco Inc. | | | 6.10 | % | | Eli Lilly & Company | | | 12.66 | % | |
Weak Relative Performers
| Fourth Quarter (9/30/20 – 12/31/20) | | Year To Date (12/31/19 – 12/31/20) | |
C.H. Robinson Worldwide | | | -19.79 | % | | Schlumberger NV | | | -72.21 | % | |
Hormel Foods Corporation | | | -16.36 | % | | U.S. Bancorp | | | -36.28 | % | |
Microsoft Corporation | | | -6.12 | % | | Great Western Bancorp, Inc. | | | -78.14 | % | |
Home Depot, Inc. | | | -15.97 | % | | Wells Fargo & Company | | | -60.06 | % | |
General Mills, Inc. | | | -15.71 | % | | Microsoft Corporation | | | 24.13 | % | |
Performance shown is relative to the S&P 500 TR Index as of December 31, 2020. Relative return is the difference between the absolute return and the performance of the market, in which the position is held. Relative contribution is used for ranking, which considers average daily weightings for each holding. Past performance does not guarantee future results.
10
MAIRS & POWER BALANCED FUND (unaudited) (continued)
The equity side of the Fund's portfolio underperformed the benchmark for the year. The biggest factor was our underweight allocation toward Technology, which was the market's top performing sector. Our security selection in the sector was also unfavorable: Visa (V) underperformed as the pandemic led to lower global payment volumes, while Fiserv (FISV) underperformed as commercial banks tightened their IT budgets. Not owning large tech companies such as Apple (AAPL) was another factor in sector underperformance. That noted, we did add weight to our Technology holdings throughout 2020.
The Fund's equity performance was also negatively impacted by our overweight allocation in the Financial sector. This was among the market's weakest performing sectors as investors became concerned about an unfavorable interest rate environment and the prospects for rising credit losses. These concerns led to underperformance among bank holdings U.S. Bancorp (USB), JPMorgan Chase (JPM), and Wells Fargo (WFC) as well as credit card issuer American Express (AXP).
The Healthcare sector was a source of positive attribution in 2020 primarily due to favorable security selection. Abbott Labs (ABT) outperformed due to strong demand for its COVID-19 diagnostic tests as well as continued success of its glucose monitoring device for patients with diabetes. Eli Lilly (LLY) performed well during the year due to strong demand for its core diabetes drug products as well as recent favorable trial results for a next-generation diabetes product that also could provide cardiovascular benefits.
The Industrial sector was another source of positive attribution primarily because of our strong security selection. Our best relative performer in the sector was Graco (GGG), which is benefiting from its dominant position in the commercial paint spraying industry during the ongoing residential real estate boom.
In the fourth quarter, the Fund added a new position in Activision (ATVI), one of the largest competitors in the video game industry. We believe that Activision has a durable competitive advantage based on the strength of its highly popular game franchises. Its industry leadership position also gives the company scale advantage in terms of marketing costs, customer care, and, most importantly, new game development. We expect the company to enjoy strong long-term earnings growth due to increasing participation in gaming as well as favorable demographic trends.
The Fund exited three of its holdings during the fourth quarter. Great Western Bank (GWB) and General Mills (GIS) were eliminated due to longer-term concerns about competitive advantage positioning as well as long-term earnings growth rates. We also exited Chevron (CVX) because we believe that the rise of renewable energy sources is likely to be a headwind for the company over the long term.
On the fixed income side of the portfolio, the Fund experienced a second consecutive year of good returns. Although both Treasuries and corporate bonds ended the year with strong results, we would note that there was a lot of volatility along the way. Our long-term allocation to corporate bonds hurt performance in the first half of the year as corporate bond spreads widened due to negative market impacts from COVID-19. But thanks to the aggressive actions by the Federal Reserve (FED), corporate bond spreads have tightened back close to the levels where they began in 2020. Our portfolio rallied back nicely as a result. For the full year, our fixed income performance was in line with the benchmark; credit selection added to relative performance while our slightly short duration stance detracted from relative performance.
Overall, the Fund's fixed income portfolio performed well, and we are very comfortable with our positioning as we head into 2021. The FED has stated that it plans to keep short-term interest rates very low until both inflation and unemployment get closer to its objectives. That said, assuming an effective vaccination program and a strong reopening of the economy by the second half of the year, we would not be surprised to see longer-term interest rates move up a bit in 2021.
Kevin V. Earley
Lead Manager | | Robert W. Thompson
Co-Manager | |
11
MAIRS & POWER BALANCED FUND (unaudited) (continued)
The Fund's investment objective, risks, charges and expenses must be considered carefully before investing. The summary prospectus or full prospectus contains this and other important information about the Fund and they may be obtained by calling Shareholder Services at (800) 304-7404 or by visiting www.mairsandpower.com. Read the summary prospectus or full prospectus carefully before investing.
All holdings in the portfolio are subject to change without notice and may or may not represent current or future portfolio composition. The mention of specific securities is not intended as a recommendation or an offer of a particular security, nor is it intended to be a solicitation for the purchase or sale of any security.
All investments have risks. The Balanced Fund is designed for long-term investors. Equity investments are subject to market fluctuations and the Fund's share price can fall because of weakness in the broad market, a particular industry or specific holdings. Investments in small and midcap companies generally are more volatile. International investing risks include among others political, social or economic instability, difficulty in predicting international trade patterns, taxation and foreign trading practices, and greater fluctuations in price than U.S. corporations. The Fund is subject to yield and share price variances with changes in interest rates and market conditions. Investors should note that if interest rates rise significantly from current levels, bond total returns will decline and may even turn negative in the short-term. There is also a chance that some of the Fund's holdings may have their credit rating downgraded or may default.
Investments in debt securities typically decrease in value when interest rates rise. This risk is usually greater for longer-term debt securities. Investments in lower rated and non-rated securities present a greater risk of loss to principal and interest than higher rated securities.
This commentary includes forward-looking statements such as economic predictions and portfolio manager opinions. The statements are subject to change at any time based on market and other conditions. No predictions, forecasts, outlooks, expectations or beliefs are guaranteed.
Composite Index reflects an unmanaged portfolio of 60% of the S&P 500 TR Index and 40% of the Bloomberg Barclays U.S. Government/Credit Bond Index. It is not possible to invest directly in an index.
Morningstar US Fund Allocation – 50%-70% Equity Category is designed to benchmark target-date and target-risk investment products. Index is based on well-established asset allocation methodology from Ibbotson Associates, a Morningstar company. Index has 60% global equity exposure and 40% global bond exposure. It is not possible to invest directly in an index.
S&P 500 TR (Total Return) Index is an unmanaged index of 500 common stocks that is generally considered representative of the U.S. stock market. It is not possible to invest directly in an index.
Bloomberg Barclays U.S. Government/Credit Bond Index is a broad-based flagship benchmark that measures the non-securitized component of the U.S. Aggregate Index. It includes investment-grade, U.S. dollar-denominated, fixed-rate Treasuries, government-related and corporate securities. It is not possible to invest directly in an index.
Piper Sandler Company Minnesota Index is a price-weighted index designed to measure the performance of the Minnesota economy. It is not possible to invest directly in an index.
12
Mairs & Power Balanced Fund
PERFORMANCE INFORMATION (unaudited) December 31, 2020
Ten years of investment performance (through December 31, 2020)
This chart illustrates the performance of a hypothetical $10,000 investment made in the Fund 10 years ago.

Average annual total returns for periods ended December 31, 2020
| | | 1 year | | 5 years | | 10 years | | 20 years | |
Mairs & Power Balanced Fund | | | 10.44 | % | | | 10.00 | % | | | 9.35 | % | | | 7.35 | % | |
Composite Index(1) | | | 15.30 | % | | | 11.34 | % | | | 10.17 | % | | | 6.81 | % | |
S&P 500 Total Return Index(2) | | | 18.40 | % | | | 15.22 | % | | | 13.88 | % | | | 7.47 | % | |
Bloomberg Barclays U.S.
Government/Credit Bond Index(3) | | | 8.93 | % | | | 4.98 | % | | | 4.19 | % | | | 5.01 | % | |
Performance data quoted represents past performance and does not guarantee future results. All performance information shown includes the reinvestment of dividend and capital gain distributions, but does not reflect the deduction of taxes that a shareholder would pay on Fund distributions or the redemption of Fund shares. The investment return and principal value of an investment will fluctuate so that an investor's shares, when redeemed, may be worth more or less than their original cost. Current performance of the Fund may be lower or higher than the performance quoted. For the most recent month-end performance figures, visit the Fund's website at www.mairsandpower.com or call Shareholder Services at (800) 304-7404. Per the Prospectus dated April 30, 2020, the expense ratio for the Fund is 0.71%.
(1) The Composite Index reflects an unmanaged portfolio comprised of 60% of the S&P 500 Total Return Index and 40% of the Bloomberg Barclays U.S. Government/Credit Bond Index. It is not possible to invest directly in an index.
(2) The S&P 500 Total Return Index is an unmanaged index of 500 common stocks that is generally considered representative of the U.S. stock market. It tracks both the capital gains of a group of stocks over time and assumes that any cash distributions, such as dividends, are reinvested back into the index. It is not possible to invest directly in an index.
(3) The Bloomberg Barclays U.S. Government/Credit Bond Index is a broad-based flagship benchmark that measures the non-securitized component of the U.S. Aggregate Index. It includes investment-grade, U.S. dollar-denominated, fixed-rate Treasuries, government-related and corporate securities. It is not possible to invest directly in an index.
13
Mairs & Power Balanced Fund
FUND INFORMATION (unaudited) December 31, 2020
Portfolio Managers
Kevin V. Earley, CFA, lead manager since April 1, 2018, co-manager from January 1, 2015 through April 1, 2018, University of Minnesota, MBA Finance 1990
Robert W. Thompson, CFA, co-manager since April 1, 2018, University of Minnesota, MBA Finance 1995
General Information
Fund Symbol | | MAPOX | |
Net Asset Value (NAV) Per Share | | $ | 105.23 | | |
Expense Ratio | | | 0.71 | % | |
Portfolio Turnover Rate | | | 15.96 | % | |
Sales Charge | | | None1 | | |
Fund Inception Year | | | 1961 | | |
Portfolio Composition

Top Ten Common Stock Holdings
(Percent of Total Net Assets) 2
Alphabet Inc | | | 4.2 | % | |
Microsoft Corp | | | 3.3 | | |
US Bancorp/MN | | | 3.1 | | |
Medtronic PLC | | | 2.5 | | |
UnitedHealth Group Inc | | | 2.4 | | |
Ecolab Inc | | | 2.3 | | |
Visa Inc | | | 2.2 | | |
Graco Inc | | | 2.1 | | |
Toro Co/The | | | 2.1 | | |
Eli Lilly & Co | | | 2.1 | | |
Portfolio Diversification
(Percent of Total Net Assets)
Fixed Income Securities 31.0% | |
Corporate Bonds | | | 26.2 | % | |
Asset Backed Securities | | | 1.9 | | |
Municipal Bonds | | | 1.7 | | |
U.S. Government Obligations | | | 1.2 | | |
Common Stocks 66.9% | |
Health Care | | | 15.1 | | |
Industrials | | | 13.3 | | |
Information Technology | | | 12.1 | | |
Financials | | | 9.6 | | |
Communications Services | | | 5.8 | | |
Materials | | | 4.9 | | |
Consumer Staples | | | 3.2 | | |
Consumer Discretionary | | | 1.8 | | |
Real Estate | | | 0.6 | | |
Utilities | | | 0.5 | | |
Short-term Investments 2.1%3 | | | 2.1 | | |
| | | | 100.0 | % | |
1 Although the Fund is no-load, investment management fees and other expenses still apply.
2 All holdings in the portfolio are subject to change without notice and may or may not represent current or future portfolio composition. The mention of specific securities is not intended as a recommendation or offer for a particular security, nor is it intended to be a solicitation for the purchase or sale of any security.
3 Represents short-term investments and other assets and liabilities (net).
The Schedule of Investments and portfolio diversification utilize the Global Industry Classification Standard (GICS®) which was developed by and/or is the exclusive property of MSCI, Inc. and Standard & Poor's Financial Services LLC ("S&P"). GICS is a service mark of MSCI, Inc. and S&P and has been licensed for use by the Adviser.
14
Mairs & Power Balanced Fund
SCHEDULE OF INVESTMENTS December 31, 2020
Par Value | | Security Description | | Fair Value | |
| | | FIXED INCOME SECURITIES 31.0% | |
| | | CORPORATE BONDS 26.2% | |
| | | COMMUNICATION SERVICES 0.9% | |
$ | 1,000,000 | | | CBS Corp | | | 3.500 | % | | 01/15/25 | | $ | 1,097,029 | | |
| | 1,688,000 | | | Netflix Inc | | | 5.875 | % | | 11/15/28 | | | 2,023,490 | | |
| | 2,000,000 | | | Comcast Corp | | | 4.250 | % | | 01/15/33 | | | 2,510,124 | | |
| | 1,000,000 | | | Verizon Communications Inc | | | 4.400 | % | | 11/01/34 | | | 1,247,930 | | |
| | 1,000,000 | | | AT&T Inc | | | 4.500 | % | | 05/15/35 | | | 1,213,435 | | |
| | | | 8,092,008 | | |
| | | CONSUMER DISCRETIONARY 3.2% | |
| | 1,000,000 | | | Harley-Davidson Financial Services Inc (g) | | | 4.050 | % | | 02/04/22 | | | 1,034,930 | | |
| | 500,000 | | | Whirlpool Corp | | | 4.700 | % | | 06/01/22 | | | 528,874 | | |
| | 1,000,000 | | | Block Financial LLC | | | 5.500 | % | | 11/01/22 | | | 1,062,794 | | |
| | 1,000,000 | | | General Motors Financial Co Inc | | | 3.700 | % | | 05/09/23 | | | 1,059,915 | | |
| | 1,000,000 | | | General Motors Financial Co Inc | | | 4.250 | % | | 05/15/23 | | | 1,077,771 | | |
| | 1,000,000 | | | General Motors Financial Co Inc | | | 3.950 | % | | 04/13/24 | | | 1,089,212 | | |
| | 2,000,000 | | | Coach Inc | | | 4.250 | % | | 04/01/25 | | | 2,145,665 | | |
| | 250,000 | | | General Motors Co | | | 4.000 | % | | 04/01/25 | | | 276,808 | | |
| | 1,000,000 | | | General Motors Financial Co Inc | | | 4.300 | % | | 07/13/25 | | | 1,121,131 | | |
| | 1,064,000 | | | Block Financial LLC | | | 5.250 | % | | 10/01/25 | | | 1,216,665 | | |
| | 1,500,000 | | | Ford Motor Co | | | 4.346 | % | | 12/08/26 | | | 1,597,500 | | |
| | 1,000,000 | | | Darden Restaurants Inc | | | 3.850 | % | | 05/01/27 | | | 1,096,395 | | |
| | 2,245,000 | | | Lear Corp | | | 3.800 | % | | 09/15/27 | | | 2,518,498 | | |
| | 1,000,000 | | | General Motors Co | | | 4.200 | % | | 10/01/27 | | | 1,133,142 | | |
| | 1,000,000 | | | AutoNation Inc | | | 3.800 | % | | 11/15/27 | | | 1,106,123 | | |
| | 923,000 | | | Whirlpool Corp | | | 4.750 | % | | 02/26/29 | | | 1,125,527 | | |
| | 2,000,000 | | | Hasbro Inc | | | 3.900 | % | | 11/19/29 | | | 2,265,027 | | |
| | 2,000,000 | | | Advance Auto Parts Inc | | | 3.900 | % | | 04/15/30 | | | 2,299,882 | | |
| | 1,000,000 | | | Mohawk Industries Inc | | | 3.625 | % | | 05/15/30 | | | 1,118,161 | | |
| | 1,000,000 | | | Metropolitan Opera Association Inc | | | 4.349 | % | | 10/01/32 | | | 970,310 | | |
| | 500,000 | | | Kohl's Corp | | | 6.875 | % | | 12/15/37 | | | 572,638 | | |
| | 750,000 | | | Hasbro Inc | | | 5.100 | % | | 05/15/44 | | | 857,918 | | |
| | 1,073,000 | | | Kohl's Corp | | | 5.550 | % | | 07/17/45 | | | 1,155,865 | | |
| | | | 28,430,751 | | |
| | | CONSUMER STAPLES 1.4% | |
| | 430,000 | | | Land O' Lakes Inc (g) | | | 6.000 | % | | 11/15/22 | | | 461,523 | | |
| | 2,500,000 | | | Land O' Lakes Inc (h) | | | 7.250 | % | | 04/04/27 | | | 2,443,750 | | |
| | 1,949,000 | | | Land O' Lakes Capital Trust I (g) | | | 7.450 | % | | 03/15/28 | | | 2,214,551 | | |
| | 2,500,000 | | | Land O' Lakes Inc (h) | | | 7.000 | % | | 09/18/28 | | | 2,346,875 | | |
| | 250,000 | | | Smithfield Foods Inc (g) | | | 3.000 | % | | 10/15/30 | | | 264,519 | | |
15
Mairs & Power Balanced Fund
SCHEDULE OF INVESTMENTS (continued) December 31, 2020
Par Value | | Security Description | | Fair Value | |
| | | FIXED INCOME SECURITIES (continued) | |
| | | CORPORATE BONDS (continued) | |
| | | CONSUMER STAPLES (continued) | |
$ | 1,000,000 | | | Walgreens Boots Alliance Inc | | | 4.500 | % | | 11/18/34 | | $ | 1,148,502 | | |
| | 1,000,000 | | | Anheuser-Busch Cos LLC / Anheuser-Busch InBev Worldwide Inc | | | 4.700 | % | | 02/01/36 | | | 1,270,287 | | |
| | 1,000,000 | | | Walgreens Boots Alliance Inc | | | 4.800 | % | | 11/18/44 | | | 1,135,858 | | |
| | 1,000,000 | | | Molson Coors Brewing Co | | | 4.200 | % | | 07/15/46 | | | 1,147,461 | | |
| | | | 12,433,326 | | |
| | | CONSUMER, NON-CYCLICAL 0.1% | |
| | 1,000,000 | | | Wildlife Conservation Society | | | 3.414 | % | | 08/01/50 | | | 1,019,150 | | |
| | | ENERGY 0.5% | |
| | 1,170,000 | | | ONEOK Inc | | | 4.250 | % | | 02/01/22 | | | 1,204,304 | | |
| | 140,000 | | | Gulf South Pipeline Co LP | | | 4.000 | % | | 06/15/22 | | | 144,138 | | |
| | 1,500,000 | | | Sunoco Logistics Partners Operations LP | | | 3.450 | % | | 01/15/23 | | | 1,564,818 | | |
| | 1,000,000 | | | Boardwalk Pipelines LP | | | 4.950 | % | | 12/15/24 | | | 1,116,080 | | |
| | 500,000 | | | Murphy Oil Corp (f) | | | 6.375 | % | | 12/01/42 | | | 440,625 | | |
| | | | 4,469,965 | | |
| | | FINANCIALS 10.7% | |
| | 1,000,000 | | | Nationwide Financial Services Inc (g) | | | 5.375 | % | | 03/25/21 | | | 1,010,864 | | |
| | 1,000,000 | | | Capital One Financial Corp | | | 4.750 | % | | 07/15/21 | | | 1,023,332 | | |
| | 500,000 | | | Goldman Sachs Group Inc/The | | | 5.250 | % | | 07/27/21 | | | 514,040 | | |
| | 3,000,000 | | | Primerica Inc | | | 4.750 | % | | 07/15/22 | | | 3,194,356 | | |
| | 2,833,000 | | | Infinity Property & Casualty Corp | | | 5.000 | % | | 09/19/22 | | | 3,005,291 | | |
| | 2,000,000 | | | OneBeacon US Holdings Inc | | | 4.600 | % | | 11/09/22 | | | 2,128,368 | | |
| | 1,000,000 | | | Standard Chartered PLC (b) (g) | | | 3.950 | % | | 01/11/23 | | | 1,052,066 | | |
| | 500,000 | | | First American Financial Corp | | | 4.300 | % | | 02/01/23 | | | 528,298 | | |
| | 1,473,000 | | | Assurant Inc | | | 4.000 | % | | 03/15/23 | | | 1,570,336 | | |
| | 500,000 | | | Assurant Inc | | | 4.200 | % | | 09/27/23 | | | 546,912 | | |
| | 500,000 | | | CNA Financial Corp | | | 7.250 | % | | 11/15/23 | | | 592,883 | | |
| | 500,000 | | | Pacific Life Insurance Co (g) | | | 7.900 | % | | 12/30/23 | | | 592,580 | | |
| | 1,000,000 | | | Moody's Corp | | | 4.875 | % | | 02/15/24 | | | 1,126,028 | | |
| | 1,000,000 | | | HSBC Holdings PLC (b) | | | 4.250 | % | | 03/14/24 | | | 1,103,343 | | |
| | 540,000 | | | Wintrust Financial Corp | | | 5.000 | % | | 06/13/24 | | | 578,161 | | |
| | 1,250,000 | | | Assured Guaranty US Holdings Inc | | | 5.000 | % | | 07/01/24 | | | 1,429,430 | | |
| | 3,088,000 | | | Legg Mason Inc | | | 3.950 | % | | 07/15/24 | | | 3,422,718 | | |
| | 1,500,000 | | | Symetra Financial Corp | | | 4.250 | % | | 07/15/24 | | | 1,657,695 | | |
| | 1,000,000 | | | Citigroup Inc | | | 4.000 | % | | 08/05/24 | | | 1,112,821 | | |
| | 3,000,000 | | | Synchrony Financial | | | 4.250 | % | | 08/15/24 | | | 3,314,750 | | |
| | 2,000,000 | | | Old Republic International Corp | | | 4.875 | % | | 10/01/24 | | | 2,280,247 | | |
| | 1,627,000 | | | Associated Banc-Corp | | | 4.250 | % | | 01/15/25 | | | 1,762,925 | | |
16
Mairs & Power Balanced Fund
SCHEDULE OF INVESTMENTS (continued) December 31, 2020
Par Value | | Security Description | | Fair Value | |
| | | FIXED INCOME SECURITIES (continued) | |
| | | CORPORATE BONDS (continued) | |
| | | FINANCIALS (continued) | |
$ | 4,000,000 | | | Kemper Corp | | | 4.350 | % | | 02/15/25 | | $ | 4,442,661 | | |
| | 1,050,000 | | | TCF National Bank | | | 4.600 | % | | 02/27/25 | | | 1,145,380 | | |
| | 1,000,000 | | | BBVA USA | | | 3.875 | % | | 04/10/25 | | | 1,121,390 | | |
| | 250,000 | | | Liberty Mutual Insurance Co (g) | | | 8.500 | % | | 05/15/25 | | | 312,822 | | |
| | 1,000,000 | | | Prudential Insurance Co of America/The (g) | | | 8.300 | % | | 07/01/25 | | | 1,296,212 | | |
| | 3,000,000 | | | American International Group Inc | | | 3.750 | % | | 07/10/25 | | | 3,370,485 | | |
| | 1,000,000 | | | Synchrony Financial | | | 4.500 | % | | 07/23/25 | | | 1,124,967 | | |
| | 2,000,000 | | | Janus Capital Group Inc (b) | | | 4.875 | % | | 08/01/25 | | | 2,302,425 | | |
| | 2,000,000 | | | HSBC Holdings PLC (b) | | | 4.250 | % | | 08/18/25 | | | 2,272,345 | | |
| | 4,000,000 | | | Capital One Financial Corp | | | 4.200 | % | | 10/29/25 | | | 4,566,846 | | |
| | 1,520,000 | | | Legg Mason Inc | | | 4.750 | % | | 03/15/26 | | | 1,804,917 | | |
| | 2,000,000 | | | Hanover Insurance Group Inc/The | | | 4.500 | % | | 04/15/26 | | | 2,334,954 | | |
| | 1,000,000 | | | Wells Fargo & Co | | | 4.100 | % | | 06/03/26 | | | 1,146,426 | | |
| | 2,000,000 | | | MSCI Inc (g) | | | 4.750 | % | | 08/01/26 | | | 2,084,980 | | |
| | 3,290,000 | | | Old Republic International Corp | | | 3.875 | % | | 08/26/26 | | | 3,779,053 | | |
| | 500,000 | | | Morgan Stanley | | | 4.350 | % | | 09/08/26 | | | 589,494 | | |
| | 500,000 | | | Raymond James Financial Inc | | | 3.625 | % | | 09/15/26 | | | 573,581 | | |
| | 1,000,000 | | | Citigroup Inc | | | 4.300 | % | | 11/20/26 | | | 1,164,205 | | |
| | 1,000,000 | | | JPMorgan Chase & Co | | | 4.125 | % | | 12/15/26 | | | 1,169,064 | | |
| | 4,000,000 | | | Mercury General Corp | | | 4.400 | % | | 03/15/27 | | | 4,429,368 | | |
| | 450,000 | | | Athene Holding Ltd (b) | | | 4.125 | % | | 01/12/28 | | | 501,477 | | |
| | 250,000 | | | Provident Cos Inc | | | 7.250 | % | | 03/15/28 | | | 318,098 | | |
| | 2,000,000 | | | E*TRADE Financial Corp | | | 4.500 | % | | 06/20/28 | | | 2,404,337 | | |
| | 500,000 | | | Farmers Exchange Capital (g) | | | 7.050 | % | | 07/15/28 | | | 621,817 | | |
| | 1,000,000 | | | Lazard Group LLC | | | 4.375 | % | | 03/11/29 | | | 1,172,640 | | |
| | 2,500,000 | | | Wintrust Financial Corp | | | 4.850 | % | | 06/06/29 | | | 2,713,662 | | |
| | 2,300,000 | | | Assurant Inc | | | 3.700 | % | | 02/22/30 | | | 2,559,257 | | |
| | 500,000 | | | Park National Corp (f) | | | 4.500 | % | | 09/01/30 | | | 505,218 | | |
| | 500,000 | | | Goldman Sachs Group Inc/The | | | 4.250 | % | | 11/15/30 | | | 572,184 | | |
| | 500,000 | | | Goldman Sachs Group Inc/The | | | 4.000 | % | | 02/15/31 | | | 548,366 | | |
| | 500,000 | | | Goldman Sachs Group Inc/The | | | 4.300 | % | | 12/15/32 | | | 552,715 | | |
| | 538,000 | | | Bank of America Corp | | | 4.000 | % | | 08/15/34 | | | 608,697 | | |
| | 3,000,000 | | | Fulton Financial Corp (f) | | | 3.750 | % | | 03/15/35 | | | 3,009,190 | | |
| | 500,000 | | | Swiss Re Treasury US Corp (g) | | | 4.250 | % | | 12/06/42 | | | 629,737 | | |
| | 500,000 | | | Principal Financial Group Inc | | | 4.350 | % | | 05/15/43 | | | 621,653 | | |
| | 2,500,000 | | | M&T Bank Corp (f) (h) | | | 5.125 | % | | 11/01/26 | | | 2,715,625 | | |
| | 20,000 | | | Wells Fargo & Co (h) | | | 4.700 | % | | 12/15/25 | | | 527,600 | | |
| | | 95,161,292 | | |
17
Mairs & Power Balanced Fund
SCHEDULE OF INVESTMENTS (continued) December 31, 2020
Par Value | | Security Description | | Fair Value | |
| | | FIXED INCOME SECURITIES (continued) | |
| | | CORPORATE BONDS (continued) | |
| | | HEALTH CARE 1.0% | |
$ | 500,000 | | | Wyeth LLC | | | 6.450 | % | | 02/01/24 | | $ | 589,087 | | |
| | 3,000,000 | | | AbbVie Inc | | | 3.800 | % | | 03/15/25 | | | 3,345,535 | | |
| | 400,000 | | | Bristol-Myers Squibb Co | | | 3.875 | % | | 08/15/25 | | | 456,317 | | |
| | 1,000,000 | | | Cigna Corp | | | 4.500 | % | | 02/25/26 | | | 1,172,360 | | |
| | 500,000 | | | Zimmer Biomet Holdings Inc | | | 4.250 | % | | 08/15/35 | | | 564,724 | | |
| | 1,400,000 | | | CVS Health Corp | | | 4.780 | % | | 03/25/38 | | | 1,773,773 | | |
| | 1,000,000 | | | UnitedHealth Group Inc | | | 3.500 | % | | 08/15/39 | | | 1,189,622 | | |
| | | | 9,091,418 | | |
| | | INDUSTRIALS 2.5% | |
| | 500,000 | | | IDEX Corp | | | 4.200 | % | | 12/15/21 | | | 512,849 | | |
| | 500,000 | | | GATX Corp | | | 4.750 | % | | 06/15/22 | | | 528,686 | | |
| | 500,000 | | | Penske Truck Leasing Co Lp / PTL Finance Corp (g) | | | 4.875 | % | | 07/11/22 | | | 533,055 | | |
| | 1,000,000 | | | GATX Corp | | | 3.900 | % | | 03/30/23 | | | 1,068,339 | | |
| | 1,000,000 | | | Flowserve Corp | | | 4.000 | % | | 11/15/23 | | | 1,058,637 | | |
| | 2,350,000 | | | Tennant Co | | | 5.625 | % | | 05/01/25 | | | 2,446,937 | | |
| | 1,500,000 | | | Hillenbrand Inc (f) | | | 2.500 | % | | 09/15/26 | | | 1,681,875 | | |
| | 500,000 | | | Toro Co/The | | | 7.800 | % | | 06/15/27 | | | 659,327 | | |
| | 2,000,000 | | | Kennametal Inc | | | 4.625 | % | | 06/15/28 | | | 2,228,131 | | |
| | 3,000,000 | | | Steelcase Inc | | | 5.125 | % | | 01/18/29 | | | 3,483,107 | | |
| | 1,000,000 | | | Oshkosh Corp | | | 3.100 | % | | 03/01/30 | | | 1,090,645 | | |
| | 2,000,000 | | | GATX Corp | | | 4.000 | % | | 06/30/30 | | | 2,363,599 | | |
| | 1,000,000 | | | Flowserve Corp | | | 3.500 | % | | 10/01/30 | | | 1,067,439 | | |
| | 2,000,000 | | | Eaton Corp | | | 4.000 | % | | 11/02/32 | | | 2,442,932 | | |
| | 1,000,000 | | | FedEx Corp | | | 4.100 | % | | 04/15/43 | | | 1,181,980 | | |
| | | | 22,347,538 | | |
| | | INFORMATION TECHNOLOGY 3.3% | |
| | 1,500,000 | | | Diamond 1 Finance Corp / Diamond 2 Finance Corp (g) | | | 5.450 | % | | 06/15/23 | | | 1,659,031 | | |
| | 700,000 | | | DXC Technology Co | | | 4.250 | % | | 04/15/24 | | | 763,768 | | |
| | 1,031,000 | | | Arrow Electronics Inc | | | 4.000 | % | | 04/01/25 | | | 1,134,061 | | |
| | 2,000,000 | | | Hewlett Packard Enterprise Co (f) | | | 4.900 | % | | 10/15/25 | | | 2,339,926 | | |
| | 1,500,000 | | | Dell International LLC / EMC Corp (g) | | | 6.020 | % | | 06/15/26 | | | 1,829,918 | | |
| | 1,000,000 | | | DXC Technology Co | | | 4.750 | % | | 04/15/27 | | | 1,144,820 | | |
| | 2,500,000 | | | Motorola Solutions Inc | | | 4.600 | % | | 02/23/28 | | | 3,016,071 | | |
| | 1,500,000 | | | Trimble Inc | | | 4.900 | % | | 06/15/28 | | | 1,794,880 | | |
| | 1,000,000 | | | Fiserv Inc | | | 4.200 | % | | 10/01/28 | | | 1,192,297 | | |
| | 1,500,000 | | | Broadcom Inc | | | 4.750 | % | | 04/15/29 | | | 1,789,083 | | |
| | 1,000,000 | | | Juniper Networks Inc | | | 3.750 | % | | 08/15/29 | | | 1,152,556 | | |
18
Mairs & Power Balanced Fund
SCHEDULE OF INVESTMENTS (continued) December 31, 2020
Par Value | | Security Description | | Fair Value | |
| | | FIXED INCOME SECURITIES (continued) | |
| | | CORPORATE BONDS (continued) | |
| | | INFORMATION TECHNOLOGY (continued) | |
$ | 1,000,000 | | | Dell International LLC / EMC Corp (g) | | | 5.300 | % | | 10/01/29 | | $ | 1,225,950 | | |
| | 3,000,000 | | | Intel Corp | | | 4.000 | % | | 12/15/32 | | | 3,735,581 | | |
| | 2,000,000 | | | Leidos Inc | | | 5.500 | % | | 07/01/33 | | | 2,451,120 | | |
| | 1,500,000 | | | Western Union Co/The | | | 6.200 | % | | 11/17/36 | | | 1,905,954 | | |
| | 2,000,000 | | | Motorola Solutions Inc | | | 5.500 | % | | 09/01/44 | | | 2,546,928 | | |
| | | | 29,681,944 | | |
| | | MATERIALS 2.0% | |
| | 175,000 | | | Mosaic Co/The | | | 3.750 | % | | 11/15/21 | | | 178,479 | | |
| | 1,000,000 | | | Domtar Corp | | | 4.400 | % | | 04/01/22 | | | 1,028,672 | | |
| | 750,000 | | | RPM International Inc | | | 3.450 | % | | 11/15/22 | | | 779,065 | | |
| | 756,000 | | | Eastman Chemical Co | | | 3.800 | % | | 03/15/25 | | | 840,553 | | |
| | 865,000 | | | Union Carbide Corp | | | 7.500 | % | | 06/01/25 | | | 1,058,185 | | |
| | 2,000,000 | | | DowDuPont Inc | | | 4.493 | % | | 11/15/25 | | | 2,334,700 | | |
| | 200,000 | | | Worthington Industries Inc | | | 4.550 | % | | 04/15/26 | | | 227,609 | | |
| | 1,500,000 | | | Cabot Corp | | | 3.400 | % | | 09/15/26 | | | 1,623,517 | | |
| | 782,000 | | | HB Fuller Co | | | 4.000 | % | | 02/15/27 | | | 815,235 | | |
| | 3,000,000 | | | Cabot Corp | | | 4.000 | % | | 07/01/29 | | | 3,240,376 | | |
| | 1,175,000 | | | Albemarle Wodgina Pty Ltd (b) | | | 3.450 | % | | 11/15/29 | | | 1,250,511 | | |
| | 1,250,000 | | | Dow Chemical Co/The | | | 4.250 | % | | 10/01/34 | | | 1,509,302 | | |
| | 1,000,000 | | | Alcoa Inc | | | 5.950 | % | | 02/01/37 | | | 1,205,000 | | |
| | 1,000,000 | | | Newmont Mining Corp | | | 4.875 | % | | 03/15/42 | | | 1,360,626 | | |
| | 325,000 | | | Albemarle Corp | | | 5.450 | % | | 12/01/44 | | | 389,152 | | |
| | 250,000 | | | Steel Dynamics Inc | | | 3.250 | % | | 10/15/50 | | | 261,106 | | |
| | | | 18,102,088 | | |
| | | REAL ESTATE 0.1% | |
| | 350,000 | | | CBRE Services Inc | | | 4.875 | % | | 03/01/26 | | | 413,529 | | |
| | | UTILITIES 0.5% | |
| | 75,000 | | | National Fuel Gas Co | | | 3.750 | % | | 03/01/23 | | | 78,731 | | |
| | 1,060,000 | | | PSEG Power LLC | | | 4.300 | % | | 11/15/23 | | | 1,156,542 | | |
| | 250,000 | | | Jersey Central Power & Light Co (g) | | | 4.300 | % | | 01/15/26 | | | 279,559 | | |
| | 2,000,000 | | | National Fuel Gas Co | | | 3.950 | % | | 09/15/27 | | | 2,123,853 | | |
| | 1,000,000 | | | National Fuel Gas Co | | | 4.750 | % | | 09/01/28 | | | 1,073,509 | | |
| | | | 4,712,194 | | |
| | | TOTAL CORPORATE BONDS | | | 233,955,203 | | |
19
Mairs & Power Balanced Fund
SCHEDULE OF INVESTMENTS (continued) December 31, 2020
Par Value | | Security Description | | Fair Value | |
| | | FIXED INCOME SECURITIES (continued) | |
| | | ASSET BACKED SECURITIES 1.9% | |
$ | 292,408 | | | American Airlines 2011-1 Class A Pass Through Trust | | | 5.250 | % | | 07/31/22 | | $ | 290,701 | | |
| | 231,111 | | | Air Canada 2013-1 Class B Pass Through Trust (b) (g) | | | 5.375 | % | | 11/15/22 | | | 231,140 | | |
| | 180,477 | | | Northwest Airlines 2002-1 Class G-2 Pass Through Trust | | | 6.264 | % | | 05/20/23 | | | 179,444 | | |
| | 250,214 | | | United Airlines 2014-1 Class B Pass Through Trust | | | 4.750 | % | | 10/11/23 | | | 250,853 | | |
| | 121,912 | | | Continental Airlines 2007-1 Class A Pass Through Trust | | | 5.983 | % | | 10/19/23 | | | 123,081 | | |
| | 139,735 | | | Southwest Airlines Co 2007-1 Pass Through Trust | | | 6.150 | % | | 02/01/24 | | | 145,159 | | |
| | 396,156 | | | Delta Air Lines 2007-1 Class B Pass Through Trust | | | 8.021 | % | | 02/10/24 | | | 396,205 | | |
| | 40,147 | | | United Airlines 2014-2 Class B Pass Through Trust | | | 4.625 | % | | 03/03/24 | | | 40,077 | | |
| | 312,443 | | | American Airlines 2014-1 Class B Pass Through Trust | | | 4.375 | % | | 04/01/24 | | | 253,442 | | |
| | 1,000,000 | | | United Airlines 2015-1 Class A Pass Through Trust | | | 3.700 | % | | 06/01/24 | | | 990,004 | | |
| | 394,422 | | | US Airways 2010-1 Class A Pass Through Trust | | | 6.250 | % | | 10/22/24 | | | 370,961 | | |
| | 999,235 | | | Delta Air Lines 2015-1 Class B Pass Through Trust | | | 4.250 | % | | 01/30/25 | | | 999,414 | | |
| | 579,790 | | | American Airlines 2015-2 Class B Pass Through Trust | | | 4.400 | % | | 03/22/25 | | | 467,993 | | |
| | 215,892 | | | US Airways 2011-1 Class A Pass Through Trust | | | 7.125 | % | | 04/22/25 | | | 196,618 | | |
| | 2,433,355 | | | American Airlines 2016-1 Class B Pass Through Trust | | | 5.250 | % | | 07/15/25 | | | 2,059,084 | | |
| | 770,971 | | | Spirit Airlines Pass Through Trust 2015-1B | | | 4.450 | % | | 10/01/25 | | | 713,994 | | |
| | 1,716,715 | | | Hawaiian Airlines 2013-1 Class A Pass Through Certificates | | | 3.900 | % | | 01/15/26 | | | 1,511,276 | | |
| | 1,209,604 | | | Continental Airlines 2012-2 Class A Pass Through Trust | | | 4.000 | % | | 04/29/26 | | | 1,198,604 | | |
| | 842,765 | | | American Airlines 2017-1 Class B Pass Through Trust | | | 4.950 | % | | 08/15/26 | | | 712,505 | | |
| | 737,945 | | | United Airlines 2013-1 Class A Pass Through Trust | | | 4.300 | % | | 02/15/27 | | | 740,467 | | |
| | 734,849 | | | American Airlines 2016-3 Class B Pass Through Trust | | | 3.750 | % | | 04/15/27 | | | 579,987 | | |
| | 580,580 | | | US Airways 2013-1 Class A Pass Through Trust | | | 3.950 | % | | 05/15/27 | | | 531,553 | | |
| | 596,322 | | | United Airlines 2014-1 Class A Pass Through Trust | | | 4.000 | % | | 10/11/27 | | | 592,913 | | |
| | 499,080 | | | United Airlines 2014-2 Class A Pass Through Trust | | | 3.750 | % | | 03/03/28 | | | 499,061 | | |
| | 1,316,864 | | | American Airlines 2014-1 Class A Pass Through Trust | | | 3.700 | % | | 04/01/28 | | | 1,234,519 | | |
| | 338,027 | | | American Airlines 2015-1 Class A Pass Through Trust | | | 3.375 | % | | 11/01/28 | | | 314,534 | | |
| | 151,077 | | | American Airlines 2015-2 Class AA Pass Through Trust | | | 3.600 | % | | 03/22/29 | | | 148,231 | | |
| | 492,576 | | | American Airlines 2015-2 Class A Pass Through Trust | | | 4.000 | % | | 03/22/29 | | | 455,830 | | |
| | 95,592 | | | Spirit Airlines Pass Through Trust 2015-1A | | | 4.100 | % | | 10/01/29 | | | 90,766 | | |
| | 870,292 | | | British Airways 2018-1 Class A Pass Through Trust (b) (g) | | | 4.125 | % | | 03/20/33 | | | 806,167 | | |
| | | | 17,124,583 | | |
| | | MUNICIPAL BONDS 1.7% | |
| | 650,000 | | | Glendale Community College District/CA | | | 2.113 | % | | 08/01/31 | | | 680,089 | | |
| | 500,000 | | | Socorro Independent School District | | | 2.125 | % | | 08/15/31 | | | 530,050 | | |
| | 920,000 | | | Pierre School District No 32-2 | | | 2.040 | % | | 08/01/33 | | | 928,216 | | |
| | 500,000 | | | Redondo Beach Unified School District | | | 2.040 | % | | 08/01/34 | | | 505,995 | | |
| | 400,000 | | | County of Hennepin MN | | | 4.800 | % | | 12/01/35 | | | 545,940 | | |
20
Mairs & Power Balanced Fund
SCHEDULE OF INVESTMENTS (continued) December 31, 2020
Par Value/Shares | | Security Description | | Fair Value | |
| | | FIXED INCOME SECURITIES (continued) | |
| | | MUNICIPAL BONDS (continued) | |
$ | 500,000 | | | DeKalb Kane & LaSalle Counties Etc Community
College District No 523 Kishwaukee | | | 3.017 | % | | 02/01/36 | | $ | 513,255 | | |
| | 305,000 | | | State of California | | | 4.600 | % | | 04/01/38 | | | 366,720 | | |
| | 1,000,000 | | | Crowley Independent School District | | | 3.010 | % | | 08/01/38 | | | 1,080,420 | | |
| | 500,000 | | | Idaho Bond Bank Authority | | | 2.354 | % | | 09/15/38 | | | 501,270 | | |
| | 850,000 | | | Worthington Independent School District No 518 | | | 3.300 | % | | 02/01/39 | | | 895,492 | | |
| | 610,000 | | | Rockwall Independent School District | | | 3.091 | % | | 02/15/39 | | | 664,314 | | |
| | 750,000 | | | Allen Independent School District | | | 3.148 | % | | 02/15/39 | | | 803,055 | | |
| | 1,000,000 | | | Pierce County School District No 10 Tacoma | | | 2.357 | % | | 12/01/39 | | | 1,036,590 | | |
| | 945,000 | | | City of Minnetonka MN | | | 3.050 | % | | 02/01/40 | | | 955,697 | | |
| | 885,000 | | | Massachusetts Development Finance Agency | | | 2.550 | % | | 05/01/40 | | | 913,754 | | |
| | 505,000 | | | Village of Ashwaubenon WI | | | 2.970 | % | | 06/01/40 | | | 533,527 | | |
| | 750,000 | | | Woodbury County Law Enforcement Center Authority | | | 3.090 | % | | 06/01/40 | | | 757,995 | | |
| | 300,000 | | | Desert Community College District | | | 2.457 | % | | 08/01/40 | | | 301,086 | | |
| | 800,000 | | | Utah Transit Authority | | | 3.443 | % | | 12/15/42 | | | 851,840 | | |
| | 500,000 | | | BAC Capital Trust XIV (f) (h) | | | 4.000 | % | | 02/08/21 | | | 496,875 | | |
| | 600,000 | | | San Diego Community College District | | | 3.336 | % | | 08/01/43 | | | 636,996 | | |
| | 1,000,000 | | | Michigan State University | | | 4.496 | % | | 08/15/48 | | | 1,144,510 | | |
| | | | 15,643,686 | | |
| | | U.S. GOVERNMENT OBLIGATIONS 1.2% | |
| | 7,000,000 | | | United States Treasury Note/Bond | | | 2.625 | % | | 02/15/29 | | | 8,035,781 | | |
| | 2,000,000 | | | United States Treasury Note/Bond | | | 3.000 | % | | 02/15/49 | | | 2,638,125 | | |
| | | | 10,673,906 | | |
| | TOTAL FIXED INCOME SECURITIES
(cost $253,308,772) | | $ | 277,397,378 | | |
| | | COMMON STOCKS 66.9% | |
| | | COMMUNICATION SERVICES 5.8% | |
| | 34,000 | | | Activision Blizzard Inc | | | | | | | | | | $ | 3,156,900 | | |
| | 21,250 | | | Alphabet Inc (a) | | | | | | | | | | | 37,227,450 | | |
| | 65,000 | | | Walt Disney Co/The (a) | | | | | | | | | | | 11,776,700 | | |
| | | | 52,161,050 | | |
| | | CONSUMER DISCRETIONARY 1.8% | |
| | 38,000 | | | Home Depot Inc/The | | | | | | | | | | | 10,093,560 | | |
| | 36,000 | | | Target Corp | | | | | | | | | | | 6,355,080 | | |
| | | | 16,448,640 | | |
21
Mairs & Power Balanced Fund
SCHEDULE OF INVESTMENTS (continued) December 31, 2020
Shares | | Security Description | | Fair Value | |
| | | COMMON STOCKS (continued) | |
| | | CONSUMER STAPLES 3.2% | |
| | 53,000 | | | Hershey Co/The | | $ | 8,073,490 | | |
| | 269,000 | | | Hormel Foods Corp | | | 12,538,090 | | |
| | 111,000 | | | Sysco Corp | | | 8,242,860 | | |
| | | | 28,854,440 | | |
| | | FINANCIALS 9.6% | |
| | 133,000 | | | American Express Co | | | 16,081,030 | | |
| | 140,000 | | | JPMorgan Chase & Co | | | 17,789,800 | | |
| | 317,000 | | | Principal Financial Group Inc | | | 15,726,370 | | |
| | 591,000 | | | US Bancorp/MN | | | 27,534,690 | | |
| | 286,000 | | | Wells Fargo & Co | | | 8,631,480 | | |
| | | | 85,763,370 | | |
| | | HEALTH CARE 15.1% | |
| | 143,000 | | | Abbott Laboratories | | | 15,657,070 | | |
| | 62,000 | | | Baxter International Inc | | | 4,974,880 | | |
| | 29,000 | | | Bio-Techne Corp | | | 9,208,950 | | |
| | 215,000 | | | Elanco Animal Health Inc (a) | | | 6,594,050 | | |
| | 109,000 | | | Eli Lilly & Co | | | 18,403,560 | | |
| | 100,000 | | | Johnson & Johnson | | | 15,738,000 | | |
| | 192,000 | | | Medtronic PLC (e) | | | 22,490,880 | | |
| | 141,000 | | | Pfizer Inc | | | 5,190,210 | | |
| | 352,000 | | | Roche Holding AG (d) | | | 15,431,680 | | |
| | 60,000 | | | UnitedHealth Group Inc | | | 21,040,800 | | |
| | | | 134,730,080 | | |
| | | INDUSTRIALS 13.3% | |
| | 77,000 | | | 3M Co | | | 13,458,830 | | |
| | 81,000 | | | CH Robinson Worldwide Inc | | | 7,603,470 | | |
| | 197,000 | | | Donaldson Co Inc | | | 11,008,360 | | |
| | 234,000 | | | Fastenal Co | | | 11,426,220 | | |
| | 260,000 | | | Graco Inc | | | 18,811,000 | | |
| | 59,000 | | | Honeywell International Inc | | | 12,549,300 | | |
| | 225,000 | | | nVent Electric PLC (e) | | | 5,240,250 | | |
| | 24,000 | | | Rockwell Automation Inc | | | 6,019,440 | | |
| | 110,000 | | | Tennant Co | | | 7,718,700 | | |
| | 195,000 | | | Toro Co/The | | | 18,493,800 | | |
| | 42,000 | | | United Parcel Service Inc, Class B | | | 7,072,800 | | |
| | | | 119,402,170 | | |
22
Mairs & Power Balanced Fund
SCHEDULE OF INVESTMENTS (continued) December 31, 2020
Shares | | Security Description | | Fair Value | |
| | | COMMON STOCKS (continued) | |
| | | INFORMATION TECHNOLOGY 12.1% | |
| | 166,000 | | | Corning Inc | | $ | 5,976,000 | | |
| | 123,000 | | | Fiserv Inc (a) | | | 14,004,780 | | |
| | 35,000 | | | Littelfuse Inc | | | 8,913,100 | | |
| | 131,000 | | | Microsoft Corp | | | 29,137,020 | | |
| | 71,000 | | | Motorola Solutions Inc | | | 12,074,260 | | |
| | 100,000 | | | QUALCOMM Inc | | | 15,234,000 | | |
| | 18,000 | | | Texas Instruments Inc | | | 2,954,340 | | |
| | 90,000 | | | Visa Inc | | | 19,685,700 | | |
| | | | 107,979,200 | | |
| | | MATERIALS 4.9% | |
| | 95,000 | | | Ecolab Inc | | | 20,554,200 | | |
| | 188,000 | | | HB Fuller Co | | | 9,753,440 | | |
| | 18,000 | | | Sherwin-Williams Co/The | | | 13,228,380 | | |
| | | | 43,536,020 | | |
| | | REAL ESTATE 0.6% | |
| | 43,000 | | | CoreSite Realty Corp | | | 5,387,040 | | |
| | | UTILITIES 0.5% | |
| | 65,000 | | | Xcel Energy Inc | | | 4,333,550 | | |
| | | | | TOTAL COMMON STOCKS
(cost $314,853,458) | | $ | 598,595,560
| | |
| | | SHORT-TERM INVESTMENTS 1.7% | |
| | 15,378,696 | | | First American Government Obligations Fund, Class X, 0.040% (c)
(cost $15,378,696) | | $ | 15,378,696
| | |
| | | | | TOTAL INVESTMENTS 99.6%
(cost $583,540,926) | | $ | 891,371,634
| | |
| | | | | OTHER ASSETS AND LIABILITIES (NET) 0.4% | | | 3,881,078 | | |
| | | | | TOTAL NET ASSETS 100.0% | | $ | 895,252,712 | | |
(a) Non-income producing.
(b) Foreign security denominated in U.S. dollars. As of December 31, 2020, these securities represented $9,519,474 or 1.1% of total net assets.
(c) The rate quoted is the annualized seven-day effective yield as of December 31, 2020.
(d) American Depositary Receipt.
(e) Issuer headquartered overseas but considered domestic. The Adviser defines foreign issuers as those whose operational leadership or headquarters is located in a foreign country; provided, however, if an issuer is believed by the Adviser to be headquartered in a jurisdiction primarily for tax purposes, the Adviser will consider the following additional factors: 1) the location of the primary exchange trading its securities, 2) where it derives the majority of its revenues, and/or 3) where it earns the majority of its profits.
23
Mairs & Power Balanced Fund
SCHEDULE OF INVESTMENTS (continued) December 31, 2020
(f) Step Bonds – Securities for which the coupon rate of interest will adjust on specified future date(s). The rate disclosed represents the coupon rate in effect as of December 31, 2020.
(g) Securities exempt from registration under Rule 144A of the Securities Act of 1933. These securities may be resold in transactions exempt from registration, normally to qualified institutional buyers. These securities have been determined to be liquid under the Fund's Liquidity Risk Management Program. As of December 31, 2020, these securities represented $18,141,421 or 2.0% of total net assets.
(h) Perpetual maturity; date shown, if applicable, represents next contractual call date.
See accompanying Notes to Financial Statements.
24
MAIRS & POWER SMALL CAP FUND (unaudited)
To Our Shareholders: December 31, 2020
In the fourth quarter, the Mairs & Power Small Cap Fund gained 27.06%, the benchmark S&P Small Cap 600 Total Return (TR) Index was up 31.31%, and the Fund's peer group of small cap funds as measured by the Morningstar U.S. Fund Small Blend category jumped 28.01%. In 2020, the Fund gained 8.78%, the S&P Small Cap 600 TR index was up 11.29%, and the Morningstar peer group rose 10.66%.
In 2020, the Fund underperformed the S&P 600 by about 2.50%. But the year's story could be described as a tale of two markets. During the downturn, our stock selection provided the portfolio with strong returns, outperforming its benchmark. But during the fourth quarter's strong snapback, the Fund trailed that earlier performance by 4.25%.
This has been the positioning of the Fund for a long time as we find it hard to find companies with strong barriers to entry here. That said, we believe Sleep Number is an exception to that notion. We have been watching and following Sleep Number (SNBR) for a number of years and in the spring sell off we finally got our opportunity to invest at a good value in this company. It has paid off as Sleep Number is up 200% since we purchased it. Although our underweight was a headwind, the performance of Sleep Number and Gentherm (THRM) (up 46% in 2020), were examples of good stock selection for the sector and the Fund.
Many of the Fund's stronger performers were in Healthcare, notably Catalent (CTLT), Bio-Techne (TECH), and Inspire Medical (INSP). Inspire, which focuses on treatments for obstructive sleep apnea, was up 153% in 2020. Our positions in all three companies were trimmed during the year because of valuations, but they remain some of the largest positions in the Fund. And while the Real Estate sector was down 10% in 2020, our holding CoreSite (COR) was positive for the year. This real estate investment trust is leveraged to cloud computing, an industry that continues to be strong, in large part because of the remote workforce's technology needs.
MAIRS & POWER SMALL CAP FUND (MSCFX)
Top Relative Performers
Fourth Quarter (9/30/20 – 12/31/20) | | Year To Date (12/31/19 – 12/31/20) | |
Wintrust Financial Corporation | | 22.02% | | Catalent, Inc. | | | 73.56 | % | |
Inspire Medical Systems, Inc. | | 14.44% | | Inspire Medical Systems, Inc. | | | 142.17 | % | |
Workiva, Inc. Class A | | 33.00% | | Workiva, Inc. Class A | | | 106.60 | % | |
AAR Corporation | | 61.35% | | Bio-Techne Corporation | | | 34.10 | % | |
Littelfuse, Inc. | | 12.59% | | Sleep Number Corporation | | | 201.16 | % | |
Weak Relative Performers
Fourth Quarter (9/30/20 – 12/31/20) | | Year To Date (12/31/19 – 12/31/20) | |
Hyliion Holdings Corp. Class A | | -98.24% | | Great Western Bancorp, Inc. | | | -49.69 | % | |
CyberOptics Corporation | | -60.05% | | Marcus Corporation | | | -68.59 | % | |
Jamf Holdings Corporation | | -51.76% | | United Fire Group, Inc. | | | -51.53 | % | |
Calyxt, Inc. | | -54.44% | | AAR Corporation | | | -30.51 | % | |
Badger Meter, Inc. | | -4.92% | | Callon Petroleum Company | | | -99.94 | % | |
Performance shown is relative to the S&P SmallCap 600 TR Index as of December 31, 2020. Relative return is the difference between the absolute return and the performance of the market, in which the position is held. Relative contribution is used for ranking, which considers average daily weightings for each holding.
25
MAIRS & POWER SMALL CAP FUND (unaudited) (continued)
On the negative side, we'll cite Marcus Corp. (MCS). The movie theater chain was down 57% for the year. The chief reason for this decline was, of course, the pandemic. Though Marcus regained slightly in the fall snapback, we believe a strong recovery is still waiting in the wings. We're confident that this recovery is coming, and we have added a little to our holding, though that addition did hurt Fund performance during 2020.
The Industrial sector also was a weak area for the Fund. For instance, AAR Corp. (AIR), which supplies aftermarket products and services to aviation companies worldwide, was down 20% in 2020. Meanwhile, the Industrial sector was up nearly 11% for the year. The airline industry was under tremendous pressure in 2020, and though the clouds have lifted a little, it has yet to really take off. AAR has been aggressive in cutting costs, which should position it well once the economy opens up and air travel returns. Anticipating a recovery, we have added to our position in the company.
During the fourth quarter, the Fund exited Badger Meter (BMI), whose flow measurement products are used by water utilities, municipalities, and a number of industries. Though the company's business remains strong, we determined that its valuation was exceedingly high, and so we sold our holding.
One final note: This year, we welcome Chris Strom as a Fund co-manager. Chris joined Mairs & Power in 2017, and he has served as an Assistant Vice President and Equity Analyst for the past two years. His Durable Competitive Advantages studies have long provided us with a deep understanding of the companies we follow and the challenges they face. Chris's insights will be of incalculable value as the Fund pursues new opportunities going forward.
Allen D. Steinkopf
Lead Manager | | Andrew R. Adams
Co-Manager | | Chris D. Strom
Co-Manager | |
The Fund's investment objective, risks, charges and expenses must be considered carefully before investing. The summary prospectus or full prospectus contains this and other important information about the Fund and they may be obtained by calling Shareholder Services at (800) 304-7404 or by visiting www.mairsandpower.com. Read the summary prospectus or full prospectus carefully before investing.
All holdings in the portfolio are subject to change without notice and may or may not represent current or future portfolio composition. The mention of specific securities is not intended as a recommendation or an offer of a particular security, nor is it intended to be a solicitation for the purchase or sale of any security.
All investments have risks. The Small Cap Fund is designed for long-term investors. Equity investments are subject to market fluctuations and the Fund's share price can fall because of weakness in the broad market, a particular industry or specific holdings. Investments in small and midcap companies generally are more volatile. International investing risks include among others political, social or economic instability, difficulty in predicting international trade patterns, taxation and foreign trading practices, and greater fluctuations in price than U.S. corporations. The Fund may invest in initial public offerings by small cap companies, which can involve greater risk than investments in companies that are already publicly traded.
This commentary includes forward-looking statements such as economic predictions and portfolio manager opinions. The statements are subject to change at any time based on market and other conditions. No predictions, forecasts, outlooks, expectations or beliefs are guaranteed.
S&P 600 Small Cap Total Return (S&P 600) is an index of small company stocks managed by Standard & Poor's Financial Services LLC that covers a broad range of small cap stocks in the U.S. The index is weighted according to market capitalization and covers about 3-4% of the total market for equities in the U.S. It tracks both the capital gains of a group of stocks over time and assumes that any cash distributions, such as dividends, are reinvested back into the index. It is not possible to invest directly in an index.
Morningstar Small Blend Category, as defined by Morningstar are stocks in the bottom 10% of the capitalization of the U.S. equity market are defined as small cap. The blend style is assigned to portfolios where neither growth nor value characteristics predominate. It is not possible to invest directly in an index.
Russell 2000 TR Index is a small-cap stock market index of the smallest 2,000 stocks in the Russell 3000 Index.
26
Mairs & Power Small Cap Fund
PERFORMANCE INFORMATION (unaudited) December 31, 2020
Investment performance since commencement of operations (through December 31, 2020)
This chart illustrates the performance of a hypothetical $10,000 investment made in the Fund since commencement of operations.
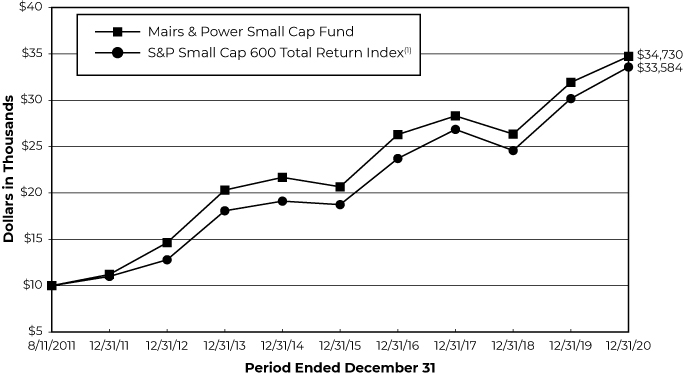
Average annual total returns for periods ended December 31, 2020
| | | 1 Year | | 3 Year | | 5 Year | | Since Inception(2) | |
Mairs & Power Small Cap Fund | | | 8.78 | % | | | 7.05 | % | | | 10.94 | % | | | 14.18 | % | |
S&P Small Cap 600 Total Return Index(1) | | | 11.29 | % | | | 7.74 | % | | | 12.37 | % | | | 13.77 | % | |
Performance data quoted represents past performance and does not guarantee future results. All performance information shown includes the reinvestment of dividend and capital gain distributions, but does not reflect the deduction of taxes that a shareholder would pay on Fund distributions or the redemption of Fund shares. The investment return and principal value of an investment will fluctuate so that an investor's shares, when redeemed, may be worth more or less than their original cost. Current performance of the Fund may be lower or higher than the performance quoted. For the most recent month-end performance figures, visit the Fund's website at www.mairsandpower.com or call Shareholder Services at (800) 304-7404. Per the Prospectus dated April 30, 2020, the expense ratio is 1.05%.
(1) The S&P Small Cap 600 Total Return Index is an index of small-company stocks managed by Standard & Poor's Financial Services LLC that covers a broad range of small cap stocks in the U.S. The index is weighted according to market capitalization and covers about 3-4% of the total market for equities in the U.S. It tracks both the capital gains of a group of stocks over time and assumes that any cash distributions, such as dividends, are reinvested back into the index. It is not possible to invest directly in an index.
(2) Since inception performance is as of August 11, 2011, which is the offering date of the Small Cap Fund.
27
Mairs & Power Small Cap Fund
FUND INFORMATION (unaudited) December 31, 2020
Portfolio Managers
(Effective as of January 1, 2021)
Allen D. Steinkopf, CFA, lead manager since April 1, 2019, co-manager from January 1, 2015 through April 1, 2019, University of Minnesota, MBA Finance 1986
Andrew R. Adams, CFA, co-manager since April 1, 2019, lead manager from 2011 to April 1, 2019, University of Wisconsin-Madison, MS Finance 1997
Christopher D. Strom, CFA, co-manager since January 1, 2021, University of Wisconsin-Madison, MBA Applied Security Analysis 2010
General Information
Fund Symbol | | MSCFX | |
Net Asset Value (NAV) Per Share | | $ | 28.15 | | |
Expense Ratio | | | 1.04 | % | |
Portfolio Turnover Rate | | | 16.39 | % | |
Sales Charge | | | None1 | | |
Fund Inception Year | | | 2011 | | |
Portfolio Composition

Top Ten Portfolio Holdings
(Percent of Total Net Assets) 2
Wintrust Financial Corp | | | 4.3 | % | |
Inspire Medical Systems Inc | | | 4.2 | | |
Littelfuse Inc | | | 3.9 | | |
CMC Materials Inc | | | 3.6 | | |
Cullen/Frost Bankers Inc | | | 3.6 | | |
Catalent Inc | | | 3.6 | | |
Glacier Bancorp Inc | | | 3.5 | | |
Oshkosh Corp | | | 3.4 | | |
Tennant Co | | | 3.3 | | |
Gentherm Inc | | | 3.2 | | |
Portfolio Diversification
(Percent of Total Net Assets)
Common Stocks 99.0% | |
Industrials | | | 22.8 | % | |
Information Technology | | | 18.3 | | |
Financials | | | 17.9 | | |
Health Care | | | 16.3 | | |
Consumer Discretionary | | | 5.5 | | |
Real Estate | | | 5.2 | | |
Utilities | | | 5.0 | | |
Consumer Staples | | | 3.7 | | |
Materials | | | 2.5 | | |
Communication Services | | | 1.3 | | |
Energy | | | 0.5 | | |
Short-term Investments 1.0%3 | | | 1.0 | | |
| | | | 100.0 | % | |
1 Although the Fund is no-load, investment management fees and other expenses still apply.
2 All holdings in the portfolio are subject to change without notice and may or may not represent current or future portfolio composition. The mention of specific securities is not intended as a recommendation or offer for a particular security, nor is it intended to be a solicitation for the purchase or sale of any security.
3 Represents short-term investments and other assets and liabilities (net).
The Schedule of Investments and portfolio diversification utilize the Global Industry Classification Standard (GICS®) which was developed by and/or is the exclusive property of MSCI, Inc. and Standard & Poor's Financial Services LLC ("S&P"). GICS is a service mark of MSCI, Inc. and S&P and has been licensed for use by the Adviser.
28
Mairs & Power Small Cap Fund
SCHEDULE OF INVESTMENTS December 31, 2020
Shares | | Security Description | | Fair Value | |
| | | COMMON STOCKS 99.0% | |
| | | COMMUNICATION SERVICES 1.3% | |
| | 364,423 | | | Marcus Corp/The | | $ | 4,912,422 | | |
| | | CONSUMER DISCRETIONARY 5.5% | |
| | 178,080 | | | Gentherm Inc (a) | | | 11,614,377 | | |
| | 99,545 | | | Sleep Number Corp (a) | | | 8,148,754 | | |
| | | | 19,763,131 | | |
| | | CONSUMER STAPLES 3.7% | |
| | 51,700 | | | Casey's General Stores Inc | | | 9,234,654 | | |
| | 89,600 | | | MGP Ingredients Inc | | | 4,216,576 | | |
| | | | 13,451,230 | | |
| | | ENERGY 0.5% | |
| | 64,100 | | | Core Laboratories NV (b) | | | 1,699,291 | | |
| | | FINANCIALS 17.9% | |
| | 445,061 | | | Associated Banc-Corp | | | 7,588,290 | | |
| | 148,500 | | | Cullen/Frost Bankers Inc | | | 12,953,655 | | |
| | 274,400 | | | Glacier Bancorp Inc | | | 12,625,144 | | |
| | 349,900 | | | Great Western Bancorp Inc | | | 7,312,910 | | |
| | 145,778 | | | QCR Holdings Inc | | | 5,771,351 | | |
| | 114,987 | | | United Fire Group Inc | | | 2,886,174 | | |
| | 254,000 | | | Wintrust Financial Corp | | | 15,516,860 | | |
| | | | 64,654,384 | | |
| | | HEALTH CARE 16.3% | |
| | 31,900 | | | Bio-Techne Corp | | | 10,129,845 | | |
| | 218,240 | | | Calyxt Inc (a) | | | 920,973 | | |
| | 128,615 | | | Cardiovascular Systems Inc (a) | | | 5,628,192 | | |
| | 123,700 | | | Catalent Inc (a) | | | 12,873,459 | | |
| | 80,100 | | | Inspire Medical Systems Inc (a) | | | 15,066,009 | | |
| | 376,342 | | | IntriCon Corp (a) | | | 6,811,790 | | |
| | 192,000 | | | Patterson Cos Inc | | | 5,688,960 | | |
| | 43,227 | | | SurModics Inc (a) | | | 1,881,239 | | |
| | | | 59,000,467 | | |
| | | INDUSTRIALS 22.8% | |
| | 292,178 | | | AAR Corp | | | 10,582,687 | | |
| | 43,800 | | | Apogee Enterprises Inc | | | 1,387,584 | | |
| | 123,104 | | | Donaldson Co Inc | | | 6,879,051 | | |
| | 335,410 | | | Enerpac Tool Group Corp | | | 7,583,620 | | |
29
Mairs & Power Small Cap Fund
SCHEDULE OF INVESTMENTS (continued) December 31, 2020
Shares | | Security Description | | Fair Value | |
| | | COMMON STOCKS (continued) | |
| | | INDUSTRIALS (continued) | |
| | 19,772 | | | Generac Holdings Inc (a) | | $ | 4,496,351 | | |
| | 67,600 | | | Graco Inc | | | 4,890,860 | | |
| | 91,800 | | | Hub Group Inc, Class A (a) | | | 5,232,600 | | |
| | 99,700 | | | Hyliion Holdings Corp (a) | | | 1,643,056 | | |
| | 327,100 | | | nVent Electric PLC (d) | | | 7,618,159 | | |
| | 142,100 | | | Oshkosh Corp | | | 12,230,547 | | |
| | 23,100 | | | Proto Labs Inc (a) | | | 3,543,540 | | |
| | 130,986 | | | Raven Industries Inc | | | 4,334,327 | | |
| | 169,251 | | | Tennant Co | | | 11,876,343 | | |
| | | | 82,298,725 | | |
| | | INFORMATION TECHNOLOGY 18.3% | |
| | 86,700 | | | CMC Materials Inc | | | 13,117,710 | | |
| | 123,578 | | | CyberOptics Corp (a) | | | 2,803,985 | | |
| | 458,829 | | | Digi International Inc (a) | | | 8,671,868 | | |
| | 47,200 | | | Envestnet Inc (a) | | | 3,884,088 | | |
| | 111,150 | | | Jamf Holding Corp (a) | | | 3,325,608 | | |
| | 54,900 | | | Littelfuse Inc | | | 13,980,834 | | |
| | 80,798 | | | NVE Corp | | | 4,539,232 | | |
| | 58,400 | | | Plexus Corp (a) | | | 4,567,464 | | |
| | 123,580 | | | Workiva Inc (a) | | | 11,322,399 | | |
| | | | 66,213,188 | | |
| | | MATERIALS 2.5% | |
| | 173,900 | | | HB Fuller Co | | | 9,021,932 | | |
| | | REAL ESTATE 5.2% | |
| | 72,928 | | | CoreSite Realty Corp | | | 9,136,420 | | |
| | 542,300 | | | Physicians Realty Trust | | | 9,652,940 | | |
| | | | 18,789,360 | | |
| | | UTILITIES 5.0% | |
| | 168,600 | | | Black Hills Corp | | | 10,360,470 | | |
| | 135,200 | | | NorthWestern Corp | | | 7,883,512 | | |
| | | | 18,243,982 | | |
| | | | | TOTAL COMMON STOCKS
(cost $248,269,957) | | $ | 358,048,112
| | |
30
Mairs & Power Small Cap Fund
SCHEDULE OF INVESTMENTS (continued) December 31, 2020
Shares | | Security Description | | Fair Value | |
| | | SHORT-TERM INVESTMENTS 1.0% | |
| | 3,644,123 | | | First American Government Obligations Fund, Class X, 0.040% (c)
(cost $3,644,123) | | $ | 3,644,123
| | |
| | | | | TOTAL INVESTMENTS 100.0%
(cost $251,914,080) | | $ | 361,692,235
| | |
| | | OTHER ASSETS AND LIABILITIES (NET) 0.0% (e) | | | (97,826 | ) | |
| | | TOTAL NET ASSETS 100.0% | | $ | 361,594,409 | | |
(a) Non-income producing.
(b) Foreign security denominated in U.S. dollars. As of December 31, 2020, these securities represented $1,699,291 or 0.5% of total net assets.
(c) The rate quoted is the annualized seven-day effective yield as of December 31, 2020.
(d) Issuer headquartered overseas but considered domestic. The Adviser defines foreign issuers as those whose operational leadership or headquarters is located in a foreign country; provided, however, if an issuer is believed by the Adviser to be headquartered in a jurisdiction primarily for tax purposes, the Adviser will consider the following additional factors: 1) the location of the primary exchange trading its securities, 2) where it derives the majority of its revenues, and/or 3) where it earns the majority of its profits.
(e) Does not round to 0.1% or (0.1%).
See accompanying Notes to Financial Statements.
31
STATEMENTS OF ASSETS AND LIABILITIES December 31, 2020
| | | Mairs & Power
Growth Fund | | Mairs & Power
Balanced Fund | | Mairs & Power
Small Cap Fund | |
ASSETS | |
| Investments, at fair value (Note 1) *: | |
Unaffiliated securities * | | $ | 4,786,370,942 | | | $ | 891,371,634 | | | $ | 361,692,235 | | |
| Affiliated securities (Note 5) * | | | 66,659,114 | | | | - | | | | - | | |
| | | | 4,853,030,056 | | | | 891,371,634 | | | | 361,692,235 | | |
Receivable for Fund shares sold | | | 1,205,267 | | | | 1,288,159 | | | | 615,516 | | |
Receivable for securities sold | | | 3,503,595 | | | | - | | | | - | | |
Dividends and interest receivable | | | 5,717,694 | | | | 3,635,369 | | | | 135,779 | | |
Prepaid expenses and other assets | | | 108,623 | | | | 41,312 | | | | 24,016 | | |
| | | | 4,863,565,235 | | | | 896,336,474 | | | | 362,467,546 | | |
LIABILITIES | |
Payable for Fund shares redeemed | | | 2,439,676 | | | | 460,696 | | | | 189,704 | | |
Payable for securities purchased | | | - | | | | - | | | | 319,337 | | |
| Accrued investment management fees (Note 2) | | | 2,210,714 | | | | 434,787 | | | | 265,570 | | |
Accrued Fund administration fees | | | 157,229 | | | | 33,313 | | | | 14,350 | | |
Accrued audit and tax fees | | | 30,802 | | | | 37,027 | | | | 29,136 | | |
Accrued transfer agent fees | | | 329,117 | | | | 48,637 | | | | 28,298 | | |
Other accrued fees | | | 208,545 | | | | 69,302 | | | | 26,742 | | |
| | | | 5,376,083 | | | | 1,083,762 | | | | 873,137 | | |
NET ASSETS | | $ | 4,858,189,152 | | | $ | 895,252,712 | | | $ | 361,594,409 | | |
NET ASSETS CONSIST OF | |
Paid in capital | | $ | 2,200,405,357 | | | $ | 581,735,146 | | | $ | 250,640,962 | | |
Total distributable earnings | | | 2,657,783,795 | | | | 313,517,566 | | | | 110,953,447 | | |
TOTAL NET ASSETS | | $ | 4,858,189,152 | | | $ | 895,252,712 | | | $ | 361,594,409 | | |
Fund shares, par value | | $ | 0.01 | | | $ | 0.01 | | | $ | 0.01 | | |
Authorized | | | unlimited | | | | unlimited | | | | unlimited | | |
Fund shares issued and outstanding | | | 35,701,258 | | | | 8,507,821 | | | | 12,845,195 | | |
Net asset value per share | | $ | 136.08 | | | $ | 105.23 | | | $ | 28.15 | | |
* Cost of investments | |
Cost of unaffiliated securities | | $ | 2,236,924,747 | | | $ | 583,540,926 | | | $ | 251,914,080 | | |
| Cost of affiliated securities (Note 5) | | | 64,383,757 | | | | - | | | | - | | |
| | | $ | 2,301,308,504 | | | $ | 583,540,926 | | | $ | 251,914,080 | | |
See accompanying Notes to Financial Statements.
32
STATEMENT OF OPERATIONS Year Ended December 31, 2020
| | | Mairs & Power
Growth Fund | | Mairs & Power
Balanced Fund | | Mairs & Power
Small Cap Fund | |
INVESTMENT INCOME | |
Income: | |
Dividends from unaffiliated securities * | | $ | 75,685,478 | | | $ | 11,577,193 | | | $ | 5,483,040 | | |
| Dividends from affiliated securities (Note 5) | | | 834,582 | | | | - | | | | - | | |
Interest income | | | - | | | | 11,455,497 | | | | - | | |
TOTAL INCOME | | | 76,520,060 | | | | 23,032,690 | | | | 5,483,040 | | |
Expenses: | |
| Investment management fees (Note 2) | | | 24,245,435 | | | | 5,082,843 | | | | 3,038,879 | | |
Fund administration fees | | | 649,684 | | | | 140,001 | | | | 62,613 | | |
Fund accounting fees | | | 414,689 | | | | 118,819 | | | | 40,222 | | |
| Trustees' fees (Note 2) | | | 289,041 | | | | 57,592 | | | | 23,366 | | |
Transfer agent fees | | | 1,570,230 | | | | 338,297 | | | | 203,560 | | |
Custodian fees | | | 222,531 | | | | 46,628 | | | | 19,914 | | |
Legal and audit fees | | | 145,494 | | | | 69,539 | | | | 45,311 | | |
Printing and mailing fees | | | 158,134 | | | | 53,866 | | | | 32,229 | | |
Other fees | | | 195,178 | | | | 81,732 | | | | 55,755 | | |
TOTAL EXPENSES | | | 27,890,416 | | | | 5,989,317 | | | | 3,521,849 | | |
NET INVESTMENT INCOME | | | 48,629,644 | | | | 17,043,373 | | | | 1,961,191 | | |
| REALIZED AND UNREALIZED GAIN (Note 4) | |
Net realized gain on investments
Unaffiliated issuers | | | 406,112,761 | | | | 26,545,433 | | | | 8,340,291 | | |
Change in net unrealized appreciation
on investments | |
Unaffiliated issuers | | | 236,417,128 | | | | 34,469,140 | | | | 2,553,728 | | |
| Affiliated issuers (Note 5) | | | (6,786,354 | ) | | | - | | | | - | | |
| | | 229,630,774 | | | | 34,469,140 | | | | 2,533,728 | | |
NET GAIN ON INVESTMENTS | | | 635,743,535 | | | | 61,014,573 | | | | 10,894,019 | | |
NET INCREASE IN NET ASSETS FROM
OPERATIONS | | $ | 684,373,179 | | | $ | 78,057,946 | | | $ | 12,855,210 | | |
* Net of foreign taxes withheld of: | | $ | 611,044 | | | $ | 74,506 | | | $ | 2,927 | | |
See accompanying Notes to Financial Statements.
33
Mairs & Power Growth Fund
STATEMENTS OF CHANGES IN NET ASSETS
| | | Year Ended
December 31,
2020 | | Year Ended
December 31,
2019 | |
OPERATIONS | |
Net investment income | | $ | 48,629,644 | | | $ | 55,764,139 | | |
Net realized gain on investments sold | | | 406,112,761 | | | | 345,728,849 | | |
Net change in unrealized appreciation of investments | | | 229,630,774 | | | | 678,657,381 | | |
NET INCREASE IN NET ASSETS FROM OPERATIONS | | | 684,373,179 | | | | 1,080,150,369 | | |
DISTRIBUTIONS TO SHAREHOLDERS | | | (401,023,020 | ) | | | (325,706,532 | ) | |
CAPITAL TRANSACTIONS | |
Proceeds from shares sold | | | 170,263,440 | | | | 183,032,904 | | |
Reinvestment of distributions from net investment income and net
realized gains | | | 373,284,465 | | | | 303,147,958 | | |
Cost of shares redeemed | | | (602,645,512 | ) | | | (545,630,903 | ) | |
DECREASE IN NET ASSETS FROM CAPITAL TRANSACTIONS | | | (59,097,607 | ) | | | (59,450,041 | ) | |
TOTAL INCREASE IN NET ASSETS: | | | 224,252,552 | | | | 694,993,796 | | |
NET ASSETS | |
Beginning of year | | | 4,633,936,600 | | | | 3,938,942,804 | | |
End of year | | $ | 4,858,189,152 | | | $ | 4,633,936,600 | | |
FUND SHARE TRANSACTIONS | |
Shares sold | | | 1,391,414 | | | | 1,499,072 | | |
Shares issued for reinvested distributions | | | 2,807,457 | | | | 2,381,520 | | |
Shares redeemed | | | (4,922,831 | ) | | | (4,459,363 | ) | |
NET DECREASE IN FUND SHARES | | | (723,960 | ) | | | (578,771 | ) | |
See accompanying Notes to Financial Statements.
34
Mairs & Power Balanced Fund
STATEMENTS OF CHANGES IN NET ASSETS
| | | Year Ended
December 31,
2020 | | Year Ended
December 31,
2019 | |
OPERATIONS | |
Net investment income | | $ | 17,043,373 | | | $ | 19,580,534 | | |
Net realized gain on investments sold | | | 26,545,433 | | | | 26,796,877 | | |
Net change in unrealized appreciation of investments | | | 34,469,140 | | | | 115,588,923 | | |
NET INCREASE IN NET ASSETS FROM OPERATIONS | | | 78,057,946 | | | | 161,966,334 | | |
DISTRIBUTIONS TO SHAREHOLDERS | | | (38,812,015 | ) | | | (41,682,895 | ) | |
CAPITAL TRANSACTIONS | |
Proceeds from shares sold | | | 67,159,381 | | | | 101,678,402 | | |
Reinvestment of distributions from net investment income and net
realized gains | | | 37,653,266 | | | | 40,446,847 | | |
Cost of shares redeemed | | | (177,633,764 | ) | | | (141,035,720 | ) | |
INCREASE (DECREASE) IN NET ASSETS FROM CAPITAL TRANSACTIONS | | | (72,821,117 | ) | | | 1,089,529 | | |
TOTAL INCREASE (DECREASE) IN NET ASSETS: | | | (33,575,186 | ) | | | 121,372,968 | | |
NET ASSETS | |
Beginning of year | | | 928,827,898 | | | | 807,454,930 | | |
End of year | | $ | 895,252,712 | | | $ | 928,827,898 | | |
FUND SHARE TRANSACTIONS | |
Shares sold | | | 696,951 | | | | 1,074,318 | | |
Shares issued for reinvested distributions | | | 379,070 | | | | 411,102 | | |
Shares redeemed | | | (1,881,074 | ) | | | (1,476,161 | ) | |
NET INCREASE (DECREASE) IN FUND SHARES | | | (805,053 | ) | | | 9,259 | | |
See accompanying Notes to Financial Statements.
35
Mairs & Power Small Cap Fund
STATEMENTS OF CHANGES IN NET ASSETS
| | | Year Ended
December 31,
2020 | | Year Ended
December 31,
2019 | |
OPERATIONS | |
Net investment income | | $ | 1,961,191 | | | $ | 2,029,476 | | |
Net realized gain on investments sold | | | 8,340,291 | | | | 9,301,124 | | |
Net change in unrealized appreciation of investments | | | 2,553,728 | | | | 66,187,132 | | |
NET INCREASE IN NET ASSETS FROM OPERATIONS | | | 12,855,210 | | | | 77,517,732 | | |
DISTRIBUTIONS TO SHAREHOLDERS | | | (7,291,591 | ) | | | (13,263,989 | ) | |
CAPITAL TRANSACTIONS | |
Proceeds from shares sold | | | 45,059,769 | | | | 61,554,115 | | |
Reinvestment of distributions from net investment income and net
realized gains | | | 7,080,355 | | | | 12,982,051 | | |
Cost of shares redeemed * | | | (133,409,765 | ) | | | (68,966,536 | ) | |
INCREASE (DECREASE) IN NET ASSETS FROM CAPITAL TRANSACTIONS | | | (81,269,641 | ) | | | 5,569,630 | | |
TOTAL INCREASE (DECREASE) IN NET ASSETS: | | | (75,706,022 | ) | | | 69,823,373 | | |
NET ASSETS | |
Beginning of year | | | 437,300,431 | | | | 367,477,058 | | |
End of year | | $ | 361,594,409 | | | $ | 437,300,431 | | |
FUND SHARE TRANSACTIONS | |
Shares sold | | | 1,972,812 | | | | 2,447,445 | | |
Shares issued for reinvested distributions | | | 252,870 | | | | 491,744 | | |
Shares redeemed | | | (5,940,772 | ) | | | (2,727,309 | ) | |
NET INCREASE (DECREASE) IN FUND SHARES | | | (3,715,090 | ) | | | 211,880 | | |
| * Net of redemption fees of: | | $ | 20,023 | | | $ | 65,810 | | |
See accompanying Notes to Financial Statements.
36
NOTES TO FINANCIAL STATEMENTS December 31, 2020
Note 1 – Organization and Significant Accounting Policies
Mairs & Power Funds Trust (the Trust) is a no-load, diversified, open-end management investment company registered under the Investment Company Act of 1940, as amended (the 1940 Act). Mairs & Power Growth Fund (the Growth Fund), Mairs & Power Balanced Fund (the Balanced Fund) and Mairs & Power Small Cap Fund (the Small Cap Fund) (individually a Fund and collectively the Funds) are series within the Trust. Mairs & Power, Inc. (the Adviser) is the investment adviser of each Fund. The objective of the Growth Fund is to provide shareholders with a diversified portfolio of common stocks, which have the potential for above-average, long-term appreciation. The objective of the Balanced Fund is to provide capital growth, current income and preservation of capital. The objective of the Small Cap Fund is to seek above-average, long-term appreciation. Each Fund is an investment company and accordingly follows the investment company accounting and reporting guidance of the Financial Accounting Standards Board (FASB) Accounting Standard Codification Topic 946 "Financial Services – Investment Companies."
Significant accounting policies of the Funds are as follows:
Security Valuations
Security valuations for each Fund's investments are furnished by independent pricing services that have been approved by the Trust's Board of Trustees (the Board). Investments in listed equity securities are valued at the last quoted sale price on the securities exchange on which such securities are principally traded or at the NASDAQ Official Closing Price if readily available for such securities on each business day. Other equity securities traded in the over-the-counter market and listed equity securities for which no sale was reported on that date are valued at the last quoted bid price. Debt obligations exceeding 60 days to maturity are valued at the bid price furnished by an independent pricing service. Debt obligations with 60 days or less remaining until maturity may be valued at the bid price furnished by an independent pricing service and in certain circumstances may be valued at their amortized cost, which approximates fair value. Pricing service prices for debt obligations are based on various evaluative and matrix-based methodologies and models that use market inputs such as market transactions, dealer quotations, benchmark yields and issuer, industry and economic events. These techniques generally consider overall market conditions and such factors as yields or prices of bonds of comparable quality, type of issue, coupon, maturity and ratings.
Debt securities for which prices are not available from an independent pricing service, but where an active market exists, are valued using market quotations obtained from two or more dealers that make markets in the securities. When market quotations are not readily available, or when the last quoted sale price is not considered representative of the value of the security if it were to be sold on that day, the security will be valued at fair value as determined in good faith by the Fair Value Committee appointed by the Board, pursuant to procedures approved by the Board.
When determining the value of a security, the Fair Value Committee takes into consideration all indications of value that appear relevant under the particular circumstances, as well as fundamental analytical data relating to the security, the nature and duration of any restrictions on the disposition of the security, and the forces influencing the market in which the security is purchased or sold in addition to other more specific factors that may be applied on a case-by-case basis. Consequently, the value of the security used by a Fund may differ from a quoted or published price for the same security. Fair value pricing involves subjective judgments and it is possible that the fair value determined for the security is materially different than the value that could be realized upon the sale of that security. As of December 31, 2020, no securities were valued using this method.
Fair Valuation Measurements
The Trust has adopted authoritative fair valuation accounting standards, which establish a definition of fair value and set out a hierarchy for measuring fair value. These standards require additional disclosures about the various inputs and valuation techniques used to develop the measurements of fair value and changes in valuation techniques and related inputs during the period. These inputs are summarized in the three broad levels listed below:
• Level 1 – Quoted prices in active markets for identical securities.
37
NOTES TO FINANCIAL STATEMENTS (continued) December 31, 2020
Note 1 – Organization and Significant Accounting Policies (continued)
Fair Valuation Measurements (continued)
• Level 2 – Other significant observable inputs (including quoted prices for similar securities, interest rates, prepayment speeds, credit risk, etc.).
• Level 3 – Significant unobservable inputs (including the Funds' own assumptions in determining the fair value of investments).
The inputs or methodologies used for valuing securities are not necessarily an indication of the risk associated with investing in those securities. The following is a summary of the inputs used to value the securities held by each Fund as of December 31, 2020:
| | | Growth Fund | | Balanced Fund | | Small Cap Fund | |
Level 1* | | $ | 4,853,030,056 | | | $ | 614,501,856 | | | $ | 361,692,235 | | |
Level 2** | | | - | | | | 276,869,778 | | | | - | | |
Level 3 | | | - | | | | - | | | | - | | |
Total | | $ | 4,853,030,056 | | | $ | 891,371,634 | | | $ | 361,692,235 | | |
* All Level 1 investments are equity securities (common stocks and preferred stocks) and short-term investments.
** All Level 2 investments are fixed income securities.
For detail of securities by major sector classification for the Funds, please refer to the Schedules of Investments.
The Funds did not hold any Level 3 investments during the year ended December 31, 2020.
Security Transactions and Investment Income
Security transactions are recorded on the date on which securities are purchased or sold. Dividend income and corporate action transactions are recorded on the ex-dividend date. Interest income, including the accretion of discounts and amortization of premiums, is recorded on an accrual basis. Premiums and discounts are amortized using the effective interest method. Realized gains and losses are reported on an identified cost basis.
Income Taxes
Each Fund is a "regulated investment company" as defined in Subtitle A, Chapter 1, Subchapter M of the Internal Revenue Code of 1986, as amended (the Code). No provisions have been made for federal income taxes as it is the intention of each Fund to comply with the provisions of the Code applicable to regulated investment companies and to make distributions of income and realized gains sufficient to relieve it from all or substantially all excise and income taxes.
As of December 31, 2020, the Trust did not have any tax positions that did not meet the "more-likely-than-not" threshold of being sustained by the applicable tax authority. Generally, tax authorities can examine all tax returns filed for the last three years.
As of December 31, 2020, none of the Funds had capital loss carryforwards nor did they have any qualified later year losses for federal tax purposes.
Basis of Presentation
The preparation of financial statements in conformity with U.S. generally accepted accounting principles (GAAP) requires management to make estimates and assumptions that affect the reported amount of net assets and liabilities and disclosure of contingent assets and liabilities at the date of the financial statements and the reported results of operations during the reporting period. Actual results could differ from those estimates.
38
NOTES TO FINANCIAL STATEMENTS (continued) December 31, 2020
Note 1 – Organization and Significant Accounting Policies (continued)
Expense Allocation
Common expenses incurred by the Trust are allocated among the Funds based on their relative net assets. Fund specific expenses are charged directly to the Fund that incurred the expense.
Note 2 – Related-Party Transactions
Investment Management Fees
The Adviser provides investment management services and various administrative services to the Funds under a written agreement for Investment Counsel Service (the Investment Advisory Agreement) approved by the Board. Pursuant to the Investment Advisory Agreement, the Adviser is paid a monthly fee on average daily net assets at the following annual rates:
| | | Growth Fund | | Balanced Fund | | Small Cap Fund | |
Up to $2.5 Billion | | | 0.60 | % | | | 0.60 | % | | | 0.90 | % | |
Over $2.5 Billion | | | 0.50 | % | | | 0.60 | % | | | 0.90 | % | |
Trustees' Fees
The Funds pay compensation to the disinterested Trustees of the Trust. The Funds do not pay remuneration to officers or to Trustees who are officers, directors or employees of the Adviser or Trustees who are otherwise "interested persons" of the Trust.
Note 3 – Indemnifications
In the normal course of business, the Trust enters into contracts that contain general indemnifications to other parties. The Trust's maximum exposure under these contracts is unknown as this would involve future claims that may be made against the Trust that have not yet occurred. The Trust expects the risk of loss to be remote.
Note 4 – Distributions Paid, Distributable Earnings and Investment Transactions
Net investment income and net realized capital gains (losses) may differ for financial reporting and tax purposes because of temporary or permanent book/tax differences.
In addition, GAAP requires that certain components of net assets relating to permanent difference be reclassified between financial and tax reporting. The permanent differences primarily relate to utilization of earnings and profits distributed to shareholders on redemption of shares and distribution reclasses. These reclassifications have no effect on net assets or net asset value per share. On the Statement of Assets and Liabilities, the following reclassifications were made for the year end ended December 31, 2020:
| | | Total Distributable
Earnings | | Paid in Capital | |
Growth Fund | | $ | (32,363,363 | ) | | $ | 32,363,363 | | |
Balanced Fund | | | (3,267,673 | ) | | | 3,267,673 | | |
Small Cap Fund | | | (1,508,392 | ) | | | 1,508,392 | | |
Distributions to shareholders are determined in accordance with income tax regulations that may differ from GAAP, and due to the timing of the distributions, the fiscal year in which the amounts are distributed may differ from the year that the income or realized gains (losses) were recorded by each Fund.
39
NOTES TO FINANCIAL STATEMENTS (continued) December 31, 2020
Note 4 – Distributions Paid, Distributable Earnings and Investment Transactions (continued)
The tax character of distributions paid during the years ended December 31, 2020 and December 31, 2019, were as follows:
Year ended December 31, 2020 | |
Distributions paid from: | | Growth Fund | | Balanced Fund | | Small Cap Fund | |
Ordinary income | | $ | 49,410,948 | | | $ | 17,164,646 | | | $ | 2,134,910 | | |
Long-term capital gains | | | 351,612,072 | | | | 21,647,369 | | | | 5,156,681 | | |
Total distributions paid | | $ | 401,023,020 | | | $ | 38,812,015 | | | $ | 7,291,591 | | |
Year ended December 31, 2019 | |
Distributions paid from: | | Growth Fund | | Balanced Fund | | Small Cap Fund | |
Ordinary income | | $ | 55,405,543 | | | $ | 19,590,959 | | | $ | 1,830,885 | | |
Long-term capital gains | | | 270,300,989 | | | | 22,091,936 | | | | 11,433,104 | | |
Total distributions paid | | $ | 325,706,532 | | | $ | 41,682,895 | | | $ | 13,263,989 | | |
Ordinary income distributions include net short-term capital gains. The Funds are designating as long-term capital gain dividends, pursuant to Section 852(b)(3) of the Code, the amount necessary to reduce the earnings and profits of the Funds related to net capital gain to zero. To the extent necessary to fully distribute such capital gain, the Funds also designate earnings and profits distributed to shareholders on the redemption of shares.
At December 31, 2020, the components of accumulated earnings (losses) on a tax basis were as follows:
Growth Fund | | Balanced Fund | | Small Cap Fund | |
Cost of investments | | $ | 2,302,100,401 | | | $ | 583,544,016 | | | $ | 252,759,054 | | |
Gross unrealized appreciation | | $ | 2,580,765,194 | | | $ | 311,543,425 | | | $ | 124,447,760 | | |
Gross unrealized depreciation | | | (29,835,539 | ) | | | (3,715,807 | ) | | | (15,514,579 | ) | |
Net unrealized appreciation | | $ | 2,550,929,655 | | | $ | 307,827,618 | | | $ | 108,933,181 | | |
Undistributed ordinary income | | $ | 204,715 | | | $ | - | | | $ | 24,872 | | |
Undistributed long-term capital gains | | | 106,649,425 | | | | 5,689,948 | | | | 1,995,394 | | |
Total distributable earnings | | $ | 106,854,140 | | | $ | 5,689,948 | | | $ | 2,020,266 | | |
Other accumulated earnings | | | - | | | | - | | | | - | | |
Total accumulated earnings | | $ | 2,657,783,795 | | | $ | 313,517,566 | | | $ | 110,953,447 | | |
The difference between book basis and tax basis unrealized appreciation is attributable primarily to the tax deferral of losses on wash sales.
Purchases and sales of investment securities, excluding government securities, short-term securities and temporary cash investments, during the year ended December 31, 2020 were as follows:
| | | Purchases | | Sales | |
Growth Fund | | $ | 625,414,829 | | | $ | 1,018,575,737 | | |
Balanced Fund | | | 132,353,741 | | | | 226,305,827 | | |
Small Cap Fund | | | 55,062,252 | | | | 139,617,004 | | |
Purchases and sales of government securities during the year ended December 31, 2020 were as follows:
| | | Purchases | | Sales | |
Growth Fund | | $ | - | | | $ | - | | |
Balanced Fund | | | - | | | | 1,143,125 | | |
Small Cap Fund | | | - | | | | - | | |
40
NOTES TO FINANCIAL STATEMENTS (continued) December 31, 2020
Note 5 – Transactions With Affiliated Companies
The Growth Fund owned 5% or more of the voting securities of the following company during the year ended December 31, 2020. As a result, this company is deemed an affiliate of the Growth Fund as defined by the 1940 Act. Transactions during the period in this security were as follows:
Growth Fund
Security
Name | | Share
Balance
12/31/20 | | Fair Value
at 12/31/19 | | Purchases | | Sales | | Realized
Gain
(Loss)(1) | | Change in
Unrealized
Appreciation | | Fair Value at
12/31/20 | | Dividend
Income(1) | |
Tennant Co | | | 949,966 | | | $ | 69,315,684 | | | $ | 4,129,784 | | | $ | - | | | $ | - | | | $ | (6,786,354 | ) | | $ | 66,659,114 | | | $ | 834,582 | | |
(1) Dividend income and realized gain amounts are reported for the period in which the security was deemed an affiliate.
Note 6 – Impacts of COVID-19
The global outbreak of COVID-19 has disrupted financial markets and the prolonged economic impact is uncertain. The performance of the Funds' investments depends on future developments, including the duration and spread of the outbreak. Events related to COVID-19 may result in further global economic disruption and market volatility which in turn may impact the value of each of the Fund's investments.
Note 7 – Subsequent Events
In preparing these financial statements, the Funds have evaluated events and transactions for potential recognition or disclosure through the date the financial statements were available to be issued. Effective as of January 11, 2021, Foreside Fund Services, LLC will replace ALPS Distributors, Inc. as the principal underwriter and distributor to the Funds. There were no other subsequent events.
41
Mairs & Power Growth Fund
FINANCIAL HIGHLIGHTS
SELECTED DATA AND RATIOS
(for a share outstanding throughout each year)
| | | Year Ended December 31, | |
| | | 2020 | | 2019 | | 2018 | | 2017 | | 2016 | |
Per Share | |
Net asset value, beginning of year | | $ | 127.22 | | | $ | 106.45 | | | $ | 121.12 | | | $ | 113.83 | | | $ | 104.44 | | |
Income from investment operations: | |
Net investment income | | | 1.48 | | | | 1.59 | | | | 1.61 | | | | 1.60 | | | | 1.61 | | |
Net realized and unrealized gain (loss) | | | 19.37 | | | | 28.59 | | | | (6.96 | ) | | | 17.16 | | | | 14.43 | | |
Total from investment operations | | | 20.85 | | | | 30.18 | | | | (5.35 | ) | | | 18.76 | | | | 16.04 | | |
Distributions to shareholders from: | |
Net investment income | | | (1.45 | ) | | | (1.58 | ) | | | (1.59 | ) | | | (1.66 | ) | | | (1.61 | ) | |
Net realized gains on investments sold | | | (10.54 | ) | | | (7.83 | ) | | | (7.73 | ) | | | (9.81 | ) | | | (5.04 | ) | |
Total distributions | | | (11.99 | ) | | | (9.41 | ) | | | (9.32 | ) | | | (11.47 | ) | | | (6.65 | ) | |
Net asset value, end of year | | $ | 136.08 | | | $ | 127.22 | | | $ | 106.45 | | | $ | 121.12 | | | $ | 113.83 | | |
Total investment return (loss) | | | 16.67 | % | | | 28.39 | % | | | (4.34 | )% | | | 16.52 | % | | | 15.38 | % | |
Net assets, end of year, in thousands | | $ | 4,858,189 | | | $ | 4,633,937 | | | $ | 3,938,943 | | | $ | 4,731,156 | | | $ | 4,392,473 | | |
Ratios/supplemental data: | |
Ratio of expenses to average net assets | | | 0.64 | % | | | 0.65 | % | | | 0.64 | % | | | 0.64 | % | | | 0.66 | % | |
Ratio of net investment income to average
net assets | | | 1.15 | | | | 1.28 | | | | 1.27 | | | | 1.30 | | | | 1.42 | | |
Portfolio turnover rate | | | 14.52 | | | | 10.77 | | | | 9.25 | | | | 8.84 | | | | 10.99 | | |
See accompanying Notes to Financial Statements.
42
Mairs & Power Balanced Fund
FINANCIAL HIGHLIGHTS
SELECTED DATA AND RATIOS
(for a share outstanding throughout each year)
| | | Year Ended December 31, | |
| | | 2020 | | 2019 | | 2018 | | 2017 | | 2016 | |
Per Share | |
Net asset value, beginning of year | | $ | 99.74 | | | $ | 86.79 | | | $ | 94.01 | | | $ | 87.29 | | | $ | 81.16 | | |
Income from investment operations: | |
Net investment income | | | 1.98 | | | | 2.13 | | | | 2.09 | | | | 2.04 | | | | 1.99 | | |
Net realized and unrealized gain (loss) | | | 8.10 | | | | 15.39 | | | | (4.71 | ) | | | 8.26 | | | | 7.21 | | |
Total from investment operations | | | 10.08 | | | | 17.52 | | | | (2.62 | ) | | | 10.30 | | | | 9.20 | | |
Distributions to shareholders from: | |
Net investment income | | | (1.99 | ) | | | (2.12 | ) | | | (2.09 | ) | | | (2.07 | ) | | | (1.99 | ) | |
Net realized gains on investments sold | | | (2.60 | ) | | | (2.45 | ) | | | (2.51 | ) | | | (1.51 | ) | | | (1.08 | ) | |
Total distributions | | | (4.59 | ) | | | (4.57 | ) | | | (4.60 | ) | | | (3.58 | ) | | | (3.07 | ) | |
Net asset value, end of year | | $ | 105.23 | | | $ | 99.74 | | | $ | 86.79 | | | $ | 94.01 | | | $ | 87.29 | | |
Total investment return (loss) | | | 10.44 | % | | | 20.32 | % | | | (2.80 | )% | | | 11.90 | % | | | 11.42 | % | |
Net assets, end of year, in thousands | | $ | 895,253 | | | $ | 928,828 | | | $ | 807,455 | | | $ | 984,788 | | | $ | 861,426 | | |
Ratios/supplemental data: | |
Ratio of expenses to average net assets | | | 0.71 | % | | | 0.71 | % | | | 0.72 | % | | | 0.71 | % | | | 0.72 | % | |
Ratio of net investment income to average
net assets | | | 2.02 | | | | 2.22 | | | | 2.20 | | | | 2.24 | | | | 2.37 | | |
Portfolio turnover rate | | | 15.96 | | | | 13.60 | | | | 9.01 | | | | 13.13 | | | | 14.10 | | |
See accompanying Notes to Financial Statements.
43
Mairs & Power Small Cap Fund
FINANCIAL HIGHLIGHTS
SELECTED DATA AND RATIOS
(for a share outstanding throughout each year)
| | | Year Ended December 31, | |
| | | 2020 | | 2019 | | 2018 | | 2017 | | 2016 | |
Per Share | |
Net asset value, beginning of year | | $ | 26.41 | | | $ | 22.48 | | | $ | 25.32 | | | $ | 24.33 | | | $ | 19.48 | | |
Income from investment operations: | |
Net investment income | | | 0.19 | | | | 0.13 | | | | 0.15 | | | | 0.13 | | | | 0.08 | | |
Net realized and unrealized gain (loss) | | | 2.13 | | | | 4.62 | | | | (1.92 | ) | | | 1.73 | | | | 5.24 | | |
Total from investment operations | | | 2.32 | | | | 4.75 | | | | (1.77 | ) | | | 1.86 | | | | 5.32 | | |
Distributions to shareholders from: | |
Net investment income | | | (0.17 | ) | | | (0.11 | ) | | | (0.15 | ) | | | (0.13 | ) | | | (0.08 | ) | |
Net realized gains on investments sold | | | (0.41 | ) | | | (0.71 | ) | | | (0.92 | ) | | | (0.74 | ) | | | (0.39 | ) | |
Redemption fees (1)(2) | | | 0.00 | | | | 0.00 | | | | 0.00 | | | | 0.00 | | | | 0.00 | | |
Total distributions | | | (0.58 | ) | | | (0.82 | ) | | | (1.07 | ) | | | (0.87 | ) | | | (0.47 | ) | |
Net asset value, end of year | | $ | 28.15 | | | $ | 26.41 | | | $ | 22.48 | | | $ | 25.32 | | | $ | 24.33 | | |
Total investment return (loss) | | | 8.78 | % | | | 21.13 | % | | | (6.91 | )% | | | 7.64 | % | | | 27.27 | % | |
Net assets, end of year, in thousands | | $ | 361,594 | | | $ | 437,300 | | | $ | 367,477 | | | $ | 435,507 | | | $ | 382,443 | | |
Ratios/supplemental data: | |
Ratio of expenses to average net assets | | | 1.04 | % | | | 1.05 | % | | | 1.04 | % | | | 1.04 | % | | | 1.05 | % | |
Ratio of net investment income to average
net assets | | | 0.69 | | | | 0.48 | | | | 0.54 | | | | 0.48 | | | | 0.48 | | |
Portfolio turnover rate | | | 16.39 | | | | 15.07 | | | | 20.40 | | | | 19.27 | | | | 21.26 | | |
(1) The Fund charges a 1.00% redemption fee on shares held 180 days or less.
(2) Amount per share is less than $0.005.
See accompanying Notes to Financial Statements.
44
REPORT OF INDEPENDENT REGISTERED PUBLIC ACCOUNTING FIRM
To the Shareholders and the Board of Trustees of
Mairs & Power Funds Trust
Opinion on the Financial Statements
We have audited the accompanying statements of assets and liabilities of Mairs & Power Funds Trust (the Trust) (comprising Mairs & Power Growth Fund, Mairs & Power Balanced Fund and Mairs & Power Small Cap Fund (collectively referred to as the "Funds")), including the schedules of investments, as of December 31, 2020, and the related statements of operations for the year then ended, the statements of changes in net assets for each of the two years in the period then ended, the financial highlights for each of the five years in the period then ended and the related notes (collectively referred to as the "financial statements"). In our opinion, the financial statements present fairly, in all material respects, the financial position of each of the Funds comprising Mairs & Power Funds Trust at December 31, 2020, the results of their operations for the year then ended, the changes in their net assets for each of the two years in the period then ended and their financial highlights for each of the five years in the period then ended, in conformity with U.S. generally accepted accounting principles.
Basis for Opinion
These financial statements are the responsibility of the Trust's management. Our responsibility is to express an opinion on each of the Funds' financial statements based on our audits. We are a public accounting firm registered with the Public Company Accounting Oversight Board (United States) ("PCAOB") and are required to be independent with respect to the Trust in accordance with the U.S. federal securities laws and the applicable rules and regulations of the Securities and Exchange Commission and the PCAOB.
We conducted our audits in accordance with the standards of the PCAOB. Those standards require that we plan and perform the audit to obtain reasonable assurance about whether the financial statements are free of material misstatement, whether due to error or fraud. The Trust is not required to have, nor were we engaged to perform, an audit of the Trust's internal control over financial reporting. As part of our audits we are required to obtain an understanding of internal control over financial reporting but not for the purpose of expressing an opinion on the effectiveness of the Trust's internal control over financial reporting. Accordingly, we express no such opinion.
Our audits included performing procedures to assess the risks of material misstatement of the financial statements, whether due to error or fraud, and performing procedures that respond to those risks. Such procedures included examining, on a test basis, evidence regarding the amounts and disclosures in the financial statements. Our procedures included confirmation of securities owned as of December 31, 2020, by correspondence with the custodian and brokers. Our audits also included evaluating the accounting principles used and significant estimates made by management, as well as evaluating the overall presentation of the financial statements. We believe that our audits provide a reasonable basis for our opinion.

We have served as the auditor of the Mairs & Power Funds Trust since 1958.
Minneapolis, Minnesota
February 16, 2021
45
FUND EXPENSES (unaudited)
As a shareholder of the Funds, you incur two types of costs: (1) transaction costs including redemption fees and (2) ongoing expenses for the operation of the Funds (e.g., asset-based charges, such as investment management fees). The Funds are "no-load" mutual funds. As a result, shareholders pay no commissions, fees, or expenses associated with sales representatives or sales charges.
This example is intended to help you understand your ongoing costs (in dollars) of investing in the Funds and to compare these costs with the ongoing costs of investing in other mutual funds. The table below reports the Funds' expenses during the period July 1, 2020 through December 31, 2020 and includes the costs associated with a $1,000 investment.
Actual Expenses
The first line in the tables below provides information about the actual account values and actual expenses. You may use this information in this line, together with the amount you invested to estimate the expenses you paid over the reporting period. You can do this by dividing your account value by $1,000 and multiplying the result by the expense shown in the table below. For example, if your account value is $8,600, divided by $1,000 = $8.60. Multiply the result by the number in the first line under the heading entitled "Expenses Paid During Period." By doing this you can estimate the expenses you paid on your account during this period.
Hypothetical Example
The second line of the tables below provides information about hypothetical account values and hypothetical expenses based on the Funds' actual expenses and assumed returns of 5% per year before expenses, which are not the Funds' actual returns. The results may be used to provide you with a basis for comparing the ongoing costs of investing in the Funds with the ongoing costs of investing in other funds. To do so, compare these 5% hypothetical examples with the 5% hypothetical examples that appear in the shareholder reports of other funds. Please note that these hypothetical examples highlight ongoing costs only and do not reflect any transactional fees, such as redemption fees. In addition, if these transactional fees were included, your costs would have been higher. These hypothetical expense examples may not be used to estimate the actual ending account balances or expenses you paid during the period and will not help you determine the relative total costs of owning different funds.
Mairs & Power Growth Fund
| | | Beginning Account
Value 07/01/2020 | | Ending Account
Value 12/31/2020 | | Expenses Paid
During Period * | |
Actual return | | $ | 1,000.00 | | | $ | 1,224.80 | | | $ | 3.52 | | |
Hypothetical assumed 5% return | | $ | 1,000.00 | | | $ | 1,021.97 | | | $ | 3.20 | | |
* The Fund's expenses are equal to the Fund's annualized expense ratio for the most recent six-month period of 0.63%, multiplied by the average account value over the Fund's second fiscal half-year, multiplied by the number of days in the Fund's second fiscal half-year (184 days), divided by 366 days.
Mairs & Power Balanced Fund
| | | Beginning Account
Value 07/01/2020 | | Ending Account
Value 12/31/2020 | | Expenses Paid
During Period * | |
Actual return | | $ | 1,000.00 | | | $ | 1,162.00 | | | $ | 3.80 | | |
Hypothetical assumed 5% return | | $ | 1,000.00 | | | $ | 1,021.62 | | | $ | 3.56 | | |
* The Fund's expenses are equal to the Fund's annualized expense ratio for the most recent six-month period of 0.70%, multiplied by the average account value over the Fund's second fiscal half-year, multiplied by the number of days in the Fund's second fiscal half-year (184 days), divided by 366 days.
46
FUND EXPENSES (unaudited) (continued)
Mairs & Power Small Cap Fund
| | | Beginning Account
Value 07/01/2020 | | Ending Account
Value 12/31/2020 | | Expenses Paid
During Period * | |
Actual return | | $ | 1,000.00 | | | $ | 1,290.00 | | | $ | 5.93 | | |
Hypothetical assumed 5% return | | $ | 1,000.00 | | | $ | 1,019.96 | | | $ | 5.23 | | |
* The Fund's expenses are equal to the Fund's annualized expense ratio for the most recent six-month period of 1.03%, multiplied by the average account value over the Fund's second fiscal half-year, multiplied by the number of days in the Fund's second fiscal half-year (184 days), divided by 366 days.
47
PRIVACY POLICY NOTICE (unaudited)
Our Promise to You
As a shareholder or potential shareholder of the Mairs & Power Mutual Funds (Funds), you share both personal and financial information with us. Your privacy is important to us, and we are dedicated to maintaining safeguards reasonably designed to protect client data from unauthorized access.
What Information We Collect
In the normal course of doing business, we typically obtain the following non-public personal information about you:
• Personal information regarding our shareholders' identity such as name, address, social security number and Internet Protocol Address (IP Address);
• Information regarding securities transactions effected by us or our affiliates; and
• Financial information such as net worth, assets, income, employment data, bank account information and account balances.
How We Manage Your Personal Information
We do not share the information collected about our shareholders or former shareholders with any third parties, except as required or permitted by law or for the purpose of servicing shareholder needs. This means we may disclose the information collected to companies who help maintain and service your account. For example, we may share information with a transfer agent or clearing broker to process your securities transactions and update your accounts or to an external service provider so that your account statements can be printed and mailed. These companies are only permitted to use this information for the services for which we hired them and are not permitted to use or share this information for any other purpose. We will share information with affiliates if the information is required to provide a product or service you requested. Additionally, we may share information with our affiliates about you or your accounts in order to make you aware of services and products that we think may be of interest or value to you. Marketing from our affiliates may also include invitations to events sponsored by such affiliates. Our affiliates include Mairs & Power, Inc., the Funds' investment adviser. We may also disclose nonpublic personal information to government agencies and regulatory organizations when permitted or required by law.
How We Protect Your Personal Information
In order to protect your personal information, we maintain physical, electronic and procedural safeguards that are reasonably designed to comply with federal standards to maintain the confidentiality of nonpublic personal information.
How to Contact Us
You may limit our affiliates from marketing their products or services based on personal information that the Funds collect and share with affiliates. Your choice to limit marketing offers from our affiliates will apply until you request a change to your choice. Your choice to limit marketing offers from our affiliates will not affect your ability to receive marketing materials directly from us. If you have already made a choice to limit marketing offers from our affiliates, you do not need to act again. To limit marketing offers, please contact us at the telephone number listed below.
You can correct, update, or confirm your personal information and limit marketing offers from our affiliates by calling 1-800-304-7404.
48
OTHER INFORMATION (unaudited)
This report is submitted for the general information of the shareholders of the Funds. It is not authorized for distribution to prospective investors unless accompanied or preceded by an effective prospectus. An investor should consider the Funds' investment objectives, risks and expenses carefully before investing or sending money. This and other important information can be found in the Funds' summary prospectuses and full prospectus. To obtain a prospectus, please call Shareholder Services at (800) 304-7404 or visit the Funds' website at www.mairsandpower.com. Please read the prospectus carefully before investing. This report includes forward-looking statements such as economic predictions and portfolio manager opinions. The statements are subject to change at any time based on market and other conditions. No predictions, forecasts, outlooks, expectations or beliefs are guaranteed.
49
Proxy Voting Policies and Procedures that the Trust uses to determine how to vote proxies relating to portfolio securities are available (i) without charge, upon request, by calling Shareholder Services at (800) 304-7404 and requesting a copy of the Statement of Additional Information (SAI) and (ii) on the Securities and Exchange Commission's (SEC's) website at www.sec.gov (access Form N-1A).
Information on how the Funds voted proxies relating to portfolio securities during the most recent 12-month period ended June 30 is available at www.mairsandpower.com and on the SEC's website at www.sec.gov on Form N-PX.
DISCLOSURE OF PORTFOLIO HOLDINGS (unaudited)
A description of the Funds' policies and procedures with respect to the disclosure of portfolio holdings is available in the SAI and on the Funds' website. A complete list of each Fund's holdings is available on or about 15 days after each quarter-end at www.mairsandpower.com. This list remains available on the website until it is replaced with the following quarter-end list. The portfolio holdings list is also filed in the Funds' annual and semi-annual reports to shareholders filed with the SEC on Form N-CSR and as an exhibit to Form N-PORT following the end of each quarter. Form N-CSR and the public portion of Form N-PORT, when available, may be viewed on the SEC's website at www.sec.gov.
HOUSEHOLDING (unaudited)
In an effort to decrease costs, the Trust intends to reduce the number of duplicate Summary Prospectuses and Annual and Semi-Annual Reports you receive by sending only one copy of each to those addresses shared by two or more accounts and to shareholders reasonably believed to be from the same family or household. Once implemented, if you would like to discontinue householding for your accounts, please call Shareholder Services at (800) 304-7404 to request individual copies of these documents. Once notification to stop householding is received, the Trust will begin sending individual copies thirty days after receiving your request. This policy does not apply to account statements.
eDelivery is available to all direct shareholders. eDelivery provides your tax statements, account statements, trade confirmation statements and shareholder reports online rather than by regular mail. In addition to reducing paper waste, eDelivery may reduce your Fund fees by lowering printing and mailing costs over time. To receive materials electronically, please contact Shareholder Services at (800) 304-7404 or visit www.mairsandpower.com to sign up for eDelivery. If you hold your Fund shares through a Financial Intermediary, please contact your Financial Intermediary regarding electronic delivery options.
50
TRUSTEES AND OFFICERS (unaudited) December 31, 2020
Information pertaining to the Trustees and Officers of the Trust set forth below is as of January 1, 2021. The Statement of Additional Information includes additional information about the Trust's Trustees and is available without charge, upon request, by calling Shareholder Services at (800) 304-7404 or by visiting www.mairsandpower.com.
Name (year of birth)
and address1 | | Position(s)
held with the
Trust and
length of
time served2 | | Principal occupation(s)
during past five years | | Number of
portfolios
in fund
complex
overseen by
Trustee | | Other
directorships
held by trustee
during past
five years | |
INTERESTED TRUSTEE3 | |
Mark L. Henneman (1961) | | Trustee since January 2018; President since December 31, 2014; Vice President from 2009 to 2014 | | • Chair of the Board and Chief Executive Officer of the Investment Adviser (January 2018 to present).
• President of the Investment Adviser (2015 to 2017).
• Chief Investment Officer of the Investment Adviser (2015 to 2017).
• Executive Vice President of the Investment Adviser (2012 to 2014). | | | 3 | | | None | |
INDEPENDENT TRUSTEES | |
Mary Schmid Daugherty (1958) | | Chair of the Board since January 2018; Trustee since December 2010; Audit Committee Chair from December 2012 to December 2017 | | • Senior Fellow in Applied Finance, Department of Finance, University of St. Thomas (1987 to present). | | | 3 | | | None | |
James D. Alt (1951) | | Nominating and Governance Committee Chair since January 2017; Trustee since April 2015 | | • Retired Adjunct Associate Professor, University of Minnesota Law School (2007 to 2017); Retired Partner, Dorsey & Whitney LLP4 (1984 to 2012). | | | 3 | | | None | |
51
TRUSTEES AND OFFICERS (unaudited) (continued) December 31, 2020
Name (year of birth)
and address1 | | Position(s)
held with the
Trust and
length of
time served2 | | Principal occupation(s)
during past five years | | Number of
portfolios
in fund
complex
overseen by
Trustee | | Other
directorships
held by trustee
during past
five years | |
INDEPENDENT TRUSTEES (continued) | |
Patrick A. Thiele (1950) | | Audit Committee Chair since January 2018; Trustee since April 2015 | | • Retired Chief Executive Officer, PartnerRe Ltd. (a reinsurance company) (2000 to 2010). | | | 3 | | | Director,
PartnerRE Ltd. (March 2016 to December 2018); Director, OneBeacon
Insurance Group, Ltd. (2014 to September 2017). | |
Susan E. Knight (1954) | | Trustee since January 2018 | | • Retired Senior Vice President and Chief Financial Officer, MTS Systems Corporation (a testing and sensor company) (2001 to 2015). | | | 3 | | | Chair,
Surmodics, Inc. (medical device and diagnostics company)
(2015 to present); Director,
Surmodics, Inc. (2008 to 2015). | |
PRINCIPAL OFFICERS | |
Andrew R. Adams (1972) | | Vice President since 2011 | | • Chief Investment Officer of the Investment Adviser (January 2018 to present).
• Executive Vice President of the Investment Adviser (October 2016 to present).
• Vice President of the Investment Adviser (2006 to October 2016). | | | N/A | | | N/A | |
Kevin V. Earley (1964) | | Vice President since April 2018 | | • Vice President of the Investment Adviser (2013 to present). | | | N/A | | | N/A | |
Allen D. Steinkopf (1961) | | Vice President since April 2019 | | • Vice President of the Investment Adviser (2013 to present). | | | N/A | | | N/A | |
52
TRUSTEES AND OFFICERS (unaudited) (continued) December 31, 2020
Name (year of birth)
and address1 | | Position(s)
held with the
Trust and
length of
time served2 | | Principal occupation(s)
during past five years | | Number of
portfolios
in fund
complex
overseen by
Trustee | | Other
directorships
held by trustee
during past
five years | |
PRINCIPAL OFFICERS (continued) | |
Andrea C. Stimmel (1967) | | Treasurer since 2011; Chief Compliance Officer from 2012 to 2016 | | • Chief Operating Officer of the Investment Adviser (January 2018 to present).
• Treasurer of the Investment Adviser (2008 to present).
• Director of Operations of the Investment Adviser (2008 to 2017).
• Chief Compliance Officer of the Investment Adviser (2012 to 2016). | | N/A | | N/A | |
Robert W. Mairs (1969) | | Secretary since May 2017; Chief Compliance Officer and Anti-Money Laundering Compliance Officer since 2017; Assistant Chief Compliance Officer from September 2016 to December 2016 | | • President and Secretary of the Investment Adviser (January 2018 to present).
• Chief Compliance Officer of the Investment Adviser (January 2017 to present).
• General Counsel of the Investment Adviser (2015 to present).
• Assistant Chief Compliance Officer of the Investment Adviser (September 2016 to December 2016).
• Shareholder and Attorney, Lathrop GPM (1999 to 2015). | | N/A | | N/A | |
1 Unless otherwise indicated, the mailing address of each officer and trustee is: W1520 First National Bank Building, 332 Minnesota Street, Saint Paul, MN 55101-1363.
2 Dr. Daugherty served as a director of Mairs and Power Growth Fund, Inc. and Mairs and Power Balanced Fund, Inc. (together, the "Predecessor Funds") prior to the reorganization of the Predecessor Funds into newly formed series of the Trust effective December 31, 2011. Positions listed in this column for trustees and officers prior to 2012 refer to their positions with the Predecessor Funds. Each trustee serves until his or her resignation or mandatory retirement age. Each officer is elected annually and serves until his successor has been duly elected and qualified.
3 Mr. Henneman is deemed to be an "interested person" of the Trust due to his positions with the Investment Adviser.
4 Dorsey & Whitney LLP previously served as legal counsel to the Trust through December 2012.
Jon A. Theobald retired from the Mairs & Power Board of Trustees due to reaching the mandatory retirement age, effective December 31, 2020.
53
MAIRS & POWER FUNDS TRUST
Mairs & Power Growth Fund, established 1958
Mairs & Power Balanced Fund, established 1961
Mairs & Power Small Cap Fund, established 2011
A No-Load Funds Trust
For Shareholder Services
Call (800) 304-7404
Or write to:
(via Regular Mail)
c/o U.S. Bancorp Fund Services, LLC
615 East Michigan Street
P. O. Box 701
Milwaukee, WI 53201-0701 | | (via Overnight or Express Mail)
c/o U.S. Bancorp Fund Services, LLC
3rd Floor
615 East Michigan Street
Milwaukee, WI 53202-0701 | |
For Fund literature and information, visit the Trust's website at:
www.mairsandpower.com
Investment Manager
Mairs & Power, Inc.
W1520 First National Bank Building
332 Minnesota Street
Saint Paul, MN 55101
Custodian
U.S. Bank, N.A.
Custody Operations
1555 North River Center Drive, Suite 302
Milwaukee, WI 53212
Distributor
Foreside Fund Services, LLC
Three Canal Plaza, Suite 100
Portland, ME 04101
Mairs & Power, Inc.
c/o U.S. Bancorp Fund Services, LLC
3rd Floor
615 East Michigan Street
Milwaukee, WI 53202-0701
Item 2. Code of Ethics.
The registrant adopted its Code of Ethics for Principal Executive Officer and Principal Financial Officer on May 17, 2012. The Code of Ethics is attached as exhibit 13(a)(1) to this form.
Item 3. Audit Committee Financial Expert.
The registrant’s Board of Trustees has determined that Dr. Mary Schmid Daugherty, Ms. Susan Knight and Mr. Patrick Thiele, all members of the registrant’s Audit Committee, are “audit committee financial experts” as defined in Item 3 of Form N-CSR. Dr. Daugherty, Ms. Knight and Mr. Thiele are “independent” under the standards set forth in Item 3 of Form N-CSR.
Item 4. Principal Accountant Fees and Services.
Year Ended
December 31, | | (a)
Audit Fees | | | (b)
Audit-
Related Fees | | (c)
Tax Fees | | | (d)
All Other
Fees |
| 2019 | | $ | 113,200 | | | None | | $ | 21,465 | | | None |
| 2020 | | $ | 113,200 | | | None | | $ | 21,465 | | | None |
| (a) | Audit fees include amounts related to the audit of registrant’s annual financial statements and services normally provided by the accountant in connection with statutory and regulatory filings. |
| | |
| (c) | Tax fees include amounts related to tax advice and tax return preparation, compliance and reviews. |
| | |
| (d) | Tax consulting fee includes fees and expenses related to allowable tax consulting services. |
| | |
| (e)(1) | The registrant’s Audit Committee approves the engagement of the accountant before the accountant is engaged by the registrant and approved all audit and non-audit services provided to the registrant. |
| | |
| (e)(2) | None of such services described in columns (b) through (d) were subject to a waiver of the pre-approval requirement pursuant to paragraph (c)(7)(i)(c) of Rule 2-01 of Regulation S-X. |
| | |
| (f) | Not applicable |
| (g) | The aggregate fees for non-audit services rendered by the registrant’s accountant to the registrant were $21,465 for the fiscal year ended December 31, 2019 and $21,465 for the fiscal year ended December 31, 2020. The aggregate fees for non-audit services rendered by the registrant’s accountant to the registrant’s investment adviser were $20,645 for the fiscal year ended December 31, 2019. and $20,645 for the fiscal year ended December 31, 2020. |
| | |
| (h) | The registrant’s Audit Committee has considered whether the provision of non-audit services by the registrant’s accountant to the registrant’s investment adviser is compatible with maintaining the accountant’s independence. |
Item 5. Audit Committee of Listed Registrants.
Not applicable to registrants who are not listed issuers (as defined in Rule 10A-3 under the Securities Exchange Act of 1934).
Item 6. Investments.
| (a) | Schedule of Investments is included as part of the report to shareholders filed under Item 1 of this Form |
Item 7. Disclosure of Proxy Voting Policies and Procedures for Closed-End Management Investment Companies.
Not applicable to open-end investment companies.
Item 8. Portfolio Managers of Closed-End Management Investment Companies.
Not applicable to open-end investment companies.
Item 9. Purchases of Equity Securities by Closed-End Management Investment Company and Affiliated Purchasers.
Not applicable to open-end investment companies.
Item 10. Submission of Matters to a Vote of Security Holders.
There has been no material change to the procedures by which shareholders may recommend nominees to the registrant’s board of directors.
Item 11. Controls and Procedures.
| (a) | The registrant’s principal executive officer and principal financial officer have evaluated the registrant’s disclosure controls and procedures as of a date within 90 days of the filing of this report and have concluded that the registrant’s disclosure controls and procedures were effective, as of that date, in ensuring that information required to be disclosed by the registrant in this Form N-CSR was recorded, processed, summarized and reported within the time period specified by the SEC’s rules and forms. |
| (b) | There were no changes in the Registrant's internal control over financial reporting (as defined in Rule 30a-3(d) under the Act) that occurred during the second fiscal quarter of the period covered by this report that has materially affected, or is reasonably likely to materially affect, the Registrant's internal control over financial reporting. |
Item 12. Disclosure of Securities Lending Activities for Closed-End Management Investment Companies
Not applicable to open-end investment companies.
Item 13. Exhibits.
Mairs & Power Funds Trust Code of Ethics for Principal Executive Officer and Principal Financial Officer.
Incorporated by reference to previous Form N-CSR filing, filed August 31, 2018.
(2) Certifications required by Rule 30a-2(a) under the Investment Company Act of 1940.
Attached as exhibit 99.CERT to this form.
(3) Any written solicitation to purchase securities under Rule 23c-1 under the Act sent or given during the period covered by the report by or on behalf of the registrant to 10 or more persons. Not applicable to open-end investment companies.
(b) Certifications pursuant to Section 906 of the Sarbanes-Oxley Act of 2002.
Attached as exhibit 99.906 CERT to this form.
SIGNATURES
Pursuant to the requirements of the Securities Exchange Act of 1934 and the Investment Company Act of 1940, the registrant has duly caused this report to be signed on its behalf by the undersigned, thereunto duly authorized.
| (Registrant) | Mairs & Power Funds Trust | |
| | |
| By (Signature and Title)* | /s/ Mark L. Henneman | |
| | Mark L. Henneman, President | |
| | Principal Executive Officer | |
| | | |
| Date | February 24, 2021 | |
Pursuant to the requirements of the Securities Exchange Act of 1934 and the Investment Company Act of 1940, this report has been signed below by the following persons on behalf of the registrant and in the capacities and on the dates indicated.
| By (Signature and Title)* | /s/ Mark L. Henneman | |
| | Mark L. Henneman, President | |
| | Principal Executive Officer | |
| | |
| Date | February 24, 2021 | |
| | |
| By (Signature and Title)* | /s/ Andrea C. Stimmel | |
| | Andrea C. Stimmel, Treasurer | |
| | Principal Financial Officer | |
| | | |
| Date | February 24, 2021 | |
* Print the name and title of each signing officer under his or her signature.