UNITED STATES
SECURITIES AND EXCHANGE COMMISSION
Washington, D.C. 20549
FORM N-CSR
CERTIFIED SHAREHOLDER REPORT OF REGISTERED
MANAGEMENT INVESTMENT COMPANIES
Investment Company Act file number 811-22563
Mairs & Power Funds Trust
(Exact name of registrant as specified in charter)
332 Minnesota Street, Suite W1520, St. Paul, MN 55101
(Address of principal executive offices) (Zip code)
Elizabeth M. VanHeel, Assistant Treasurer, 332 Minnesota Street, Suite W1520, St. Paul, MN 55101
(Name and address of agent for service)
651-222-8478
Registrant's telephone number, including area code
Date of fiscal year end: December 31, 2021
Date of reporting period: December 31, 2021
Item 1. Reports to Stockholders.
(a)

ANNUAL REPORT
DECEMBER 31, 2021
- GROWTH FUND (MPGFX)
est. 1958
- BALANCED FUND (MAPOX)
est. 1961
- SMALL CAP FUND (MSCFX)
est. 2011
MAIRS & POWER FUNDS MARKET COMMENTARY (unaudited)
December 31, 2021
The story of 2021 could be boiled down to a single word: resilience. Though the market experienced a few minor pullbacks during the year, it always rebounded quickly. The market's performance reflected the durability of the overall economy, which remained remarkably strong despite supply shortages, hiring challenges, and COVID variants.
One key driver of the market's resilience was corporate earnings, which have been astounding. In 2019, the S&P 500 earnings hit $163 per share. Then, the Pandemic hit and the S&P 500 earnings dropped 15% to $138 in 2020. We had initially hoped that earnings might return to pre-COVID levels by 2022 but thanks to massive fiscal and monetary stimulus, earnings are expected to finish 2021 at $207, 27% above their 2019 peak.
There's a perception that only Tech stocks drove the market in 2021; however, we saw strength in Healthcare, Financials, Materials, Industrials, and Communications as well. In short, the market broadened out in 2021.
Given that breadth and those astonishing earnings numbers, it may not be surprising that the S&P 500 posted 70 record highs in 2021. For the fourth quarter and for all of 2021, the S&P 500 Total Return (TR) was up 11.03% and 28.71% respectively, the Dow Jones Industrial Average TR Index gained 7.87% and 20.95%, respectively, and the Bloomberg U.S. Government/Credit Bond Index returns were 0.18% and -1.75%, respectively.
Future Outlook
Most indicators of economic activity remain at levels that point to continued economic growth. For instance, December's readings of the Institute of Supply Management (ISM) indices for manufacturing and services were both very strong at 61.1 and 69.1, respectively. Any number over 50 indicates growth.
The labor market has also provided evidence of the economy's durability. In December, the unemployment rate dropped from 4.2% to 3.9%, close to the 50-year low of 3.5%. Not coincidentally, the U.S. Labor Department also reported that hourly wages in December rose 4.7% from the year before. Though rising wages are helping fuel inflation, we believe that these increases are long overdue. Business owners and shareholders have done extremely well over the past few decades. Now, we may be seeing workers benefiting more from economic growth.
Higher household incomes also fuel spending, boosting growth further. Helped by rising wages, consumer demand has remained strong for cars, appliances, and other durable goods. According to Mastercard's SpendingPulse report, U.S. holiday season sales in 2021 rose 8.5% over the same period in 2020.
But consumers and investors remain fearful of continued inflation. In November, consumer prices increased at an annual rate of 6.8%, the highest jump in nearly four decades. With inflation running well above its target, the Federal Reserve (Fed) has indicated that it will dial back monetary stimulus more quickly than previously expected. In December, the Fed announced an end to quantitative easing early in 2022, and the central bank suggested that we could see as many as three interest rate hikes this year. With the Fed no longer adding fuel to the economic fire, earnings growth will be more important in 2022 to keep the market moving higher.
The federal government has also been a major source of economic stimulus during the "pandemic boom." However, we're starting to see pushback in Washington from members of both parties relating to the infrastructure bill and other large spending programs. This suggests that the economy will need to stand more on its own in 2022 with less government support. We believe that the economy will continue to demonstrate resilience and rise to this challenge. We also believe the market will remain the strongest asset class for investors, and the only one that will keep pace with inflation. The market may cool down in 2022 after an extraordinary year, but the economic evidence leads to us to expect its performance to stay steady and strong.
1
MAIRS & POWER FUNDS MARKET COMMENTARY (unaudited) (continued)
Past Performance is not a guarantee of future results.
S&P 500 Total Return (TR) Index is an unmanaged index of 500 common stocks that is generally considered representative of the U.S. stock market. It is not possible to invest directly in an index.
Dow Jones Industrial Average TR Index is a price-weighted average of 30 significant stocks traded on the New York Stock Exchange and the NASDAQ. It is not possible to invest directly in an index.
Bloomberg U.S. Government/Credit Bond Index is a broad-based flagship benchmark that measures the non-securitized component of the U.S. Aggregate Index. It includes investment-grade, U.S. dollar-denominated, fixed-rate Treasuries, and government-related and corporate securities. It is not possible to invest directly in an index.
Institute for Supply Management (ISM) Manufacturing Index monitors employment, production, inventories, new orders and supplier deliveries and is based on surveys of more than 300 manufacturing firms by the ISM.
2
MAIRS & POWER GROWTH FUND (unaudited)
To Our Shareholders: December 31, 2021
In the fourth quarter, the Mairs & Power Growth Fund gained 10.77%, compared to 11.03% for the S&P 500 and 9.45% for its peer group as measured by the Morningstar Large Blend category. For the year, the Fund slightly outperformed the S&P 500 in 2021, with the Fund gaining 29.27% and the S&P 500 up 28.71%. The Fund also performed well relative to the Morningstar peer group, which was up 25.36% for the year.
Most of our longer term macro bets continued to be headwinds in 2021, especially the fourth quarter. These bets include an underweight in Technology and overweight in Industrials and in small and mid-cap stocks. But our stock selection more than offset those headwinds, and the Fund came out ahead of its benchmarks.
Earlier in the year, it appeared as though our overweight of smaller caps relative to the S&P 500 would finally benefit relative performance. But after a strong first quarter, these stocks began to lag, and they ended the year about 4% behind the S&P mid-cap index, which we use as a representative measure of smaller capitalization stocks. Valuations for small and mid-cap stocks continue to look very attractive, and we added a number of smaller companies to the portfolio during the year, including Inspire Medical (INSP), Polaris (PII), and Sleep Number (SNBR).
MAIRS & POWER GROWTH FUND CONTRIBUTORS
Year-to-Date 12/31/2020 – 12/31/2021
| Top Contributors | | Bottom Contributors | |
NVIDIA Corporation | | | 125.29 | % | | Activision Blizzard, Inc. | | | -28.35 | % | |
Alphabet Inc. Class C | | | 65.17 | % | | Salesforce.com, Inc. | | | -16.10 | % | |
Bio-Techne Corporation | | | 62.92 | % | | Medtronic Plc. | | | -11.69 | % | |
H.B. Fuller Company | | | 56.13 | % | | Fiserv, Inc. | | | -8.84 | % | |
UnitedHealth Group Inc. | | | 43.19 | % | | Pfizer Inc. | | | 32.06 | %* | |
* Pfizer was a bottom contributor due to a significant underweight relative to the benchmark and selling out of the position while the stock continued to have strong performance.
Top and bottom contributors are securities that were selected based on their relative contribution compared to the S&P 500 TR Index as of December 31, 2021. Relative contribution considers average daily weightings for each security and whether the security was added or eliminated from the Fund during period. The performance number shown is total return of the security for the period. Total return is amount of value an investor earns from a security over a specific period and when distributions are reinvested. Past performance does not guarantee future results.
Over the last several years, we have reduced our underweight of Technology relative to the S&P 500. With that sector outperforming the broader index by over 5% in 2021, this shift lessened the negative impact to the Fund. Our Technology stock selection also has been quite strong, with portfolio names significantly outperforming index stocks in the sector. Nvidia (NVDA), up 125% for the year, was one of the largest contributors to the Fund's relative performance. A provider of graphical processor units (GPUs) for the computer industry, Nvidia has experienced strong demand in its traditional markets as well as from data centers looking to add artificial intelligence capabilities.
Another headwind was our lack of exposure to the Energy sector. With the global economy's reopening, Energy was the S&P 500's top performing sector in 2021. We continue to be happy with our decision to not invest in Energy companies, since we see significant risks in their traditional business models.
Within the Consumer Discretionary sector, the Fund is underweight relative to the S&P 500, which helped relative performance for the year. Unfortunately, our stocks in that sector underperformed. Both Polaris (PII) and Sleep Number (SNBR), which we added to the portfolio in 2021, have lagged since our purchase. Still, we
3
MAIRS & POWER GROWTH FUND (unaudited) (continued)
believe the gains these companies have made during the pandemic are more durable than the Street expects, and we have continued to add to our initial positions.
Industrials underperformed the S&P 500 in 2021, and our stock selection underperformed the sector. Toro (TTC) and Graco (GGG) both hurt relative performance, but we believe these companies will recover when the cycle turns their way. Conversely, we chose to exit Proto Labs (PRLB), another Industrial stock that hurt relative performance, because its business strategy hasn't worked out as we'd hoped. 3M (MMM) also detracted from performance, and we've significantly reduced our position in the company. The current management team has struggled to perpetuate 3M's storied culture of innovation, and it also faces long-term environmental liability issues.
While our overweight position in Healthcare was a slight headwind, our stock selection was good, with Bio-Techne (TECH) and UnitedHealth Group (UNH) having particularly strong years in spite of a somewhat chaotic environment. Though we've trimmed our positions in both, we retain confidence in their durable competitive advantages.
The largest contributor to the Fund's relative performance in 2021 was Google parent company Alphabet (GOOG). With ad spend continuing to shift online and the company increasing advertising space on its YouTube platform, Alphabet's revenue grew substantially in 2021, and its stock was up 65% for the year. We continue to hold a significant position in the company, though we expect its growth to slow in 2022.
In the fourth quarter, the Fund added two positions:
One was Entegris (ENTG), which in December acquired CMC Materials, a company we've long held in the Mairs & Power Small Cap Fund. Both companies supply the semiconductor industry with high-end consumables like filters and slurries, which are extremely important in the production of today's higher-density chips. While Entegris is headquartered on the East Coast, we've had good access to its management team, and we believe the company is making smart investments for the future.
Our other acquisition in the quarter was Salesforce (CRM), the undisputed king of customer relationship management software. Salesforce provides a one-stop shop for customers to monitor the entire lifecycle of their customers, from sales leads to customer service and support. As a leading SaaS (software-as-a-service) provider, the company should continue to benefit as more and more businesses shift operations to the cloud. Salesforce is a company we've been following for several years. Though it has long demonstrated a durable competitive advantage in its space, we couldn't get comfortable with its valuation. In the last few months, with interest rates bouncing up slightly, the prices of many SaaS companies were hit with losses, and Salesforce's valuation became much more appealing.
Overall, we're happy with the Fund's 2021 performance. We evaluate every company we hold based on its competitive position and its relative pricing power to customers and suppliers. Looking ahead to 2022, we expect inflation to be a positive for our companies. It may take them some time to be able to pass on price increases, but they should be well positioned in the long term to do so.
One final note: You should have received by mail a proxy statement and a ballot from Mairs & Power asking you to vote on a proposed reorganization of the Growth Fund. This reorganization would transition the Fund into a series of Trust for Professional Managers (TPM). We expect that reorganizing into TPM would decrease the Fund's expenses while allowing it greater access to legal, research, and operational resources. There would be no changes to the Fund's investment objectives, principal investment strategies, principal risks, or portfolio management team. The boards of Mairs & Power and TPM have both unanimously approved this reorganization. We encourage you to also vote in favor of this reorganization, which will benefit you, the Fund shareholder.
Andrew R. Adams
Lead Manager | | Peter J. Johnson
Co-Manager | |
4
MAIRS & POWER GROWTH FUND (unaudited) (continued)
The Fund's investment objective, risks, charges and expenses must be considered carefully before investing. The summary prospectus or full prospectus contains this and other important information about the Fund and they may be obtained by calling Shareholder Services at (800) 304-7404 or by visiting www.mairsandpower.com. Read the summary prospectus or full prospectus carefully before investing.
All holdings in the portfolio are subject to change without notice and may or may not represent current or future portfolio composition. The mention of specific securities is not intended as a recommendation or an offer of a particular security, nor is it intended to be a solicitation for the purchase or sale of any security.
All investments have risks. The Growth Fund is designed for long-term investors. Equity investments are subject to market fluctuations and the Fund's share price can fall because of weakness in the broad market, a particular industry or specific holdings. Investments in small and midcap companies generally are more volatile. International investing risks include among others political, social or economic instability, difficulty in predicting international trade patterns, taxation and foreign trading practices and greater fluctuations in price than U.S. corporations.
This commentary includes forward-looking statements such as economic predictions and portfolio manager opinions. The statements are subject to change at any time based on market and other conditions. No predictions, forecasts, outlooks, expectations or beliefs are guaranteed.
S&P 500 Total Return (TR) Index is an unmanaged index of 500 common stocks that is generally considered representative of the U.S. stock market. It is not possible to invest directly in an index.
Morningstar Large-Blend Category is fairly representative of the overall U.S. stock market in size, growth rates, and price. Stocks in the top 70% of the capitalization of the U.S equity market are defined as large-cap. The blend style is assigned to portfolios where neither growth nor value characteristics predominate. These portfolios tend to invest across the spectrum of U.S. industries, and owing to their broad exposure, the portfolios' returns are often similar to those of the S&P 500 Index.
5
Mairs & Power Growth Fund
PERFORMANCE INFORMATION (unaudited) December 31, 2021
Ten years of investment performance (through December 31, 2021)
This chart illustrates the performance of a hypothetical $10,000 investment made in the Fund 10 years ago.
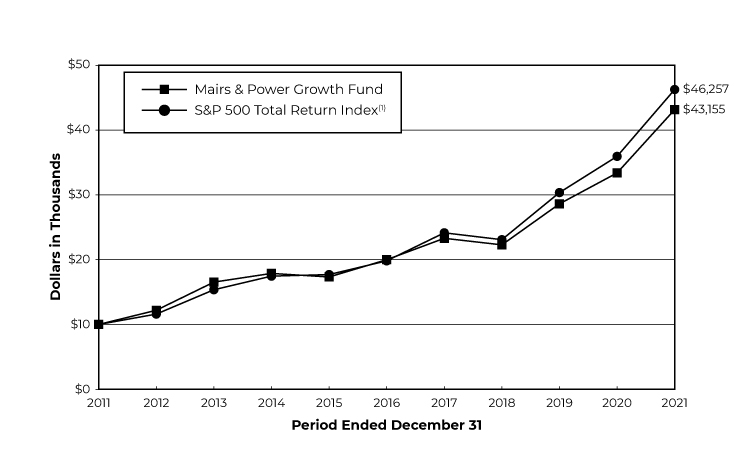
Average annual total returns for periods ended December 31, 2021
| | | 1 year | | 5 years | | 10 years | | 20 years | |
Mairs & Power Growth Fund | | | 29.27 | % | | | 16.63 | % | | | 15.75 | % | | | 10.52 | % | |
S&P 500 Total Return Index(1) | | | 28.71 | % | | | 18.47 | % | | | 16.55 | % | | | 9.52 | % | |
Performance data quoted represents past performance and does not guarantee future results. All performance information shown includes the reinvestment of dividend and capital gain distributions, but does not reflect the deduction of taxes that a shareholder would pay on Fund distributions or the redemption of Fund shares. The investment return and principal value of an investment will fluctuate so that an investor's shares, when redeemed, may be worth more or less than their original cost. Current performance of the Fund may be lower or higher than the performance quoted. For the most recent month-end performance figures, visit the Fund's website at www.mairsandpower.com or call Shareholder Services at (800) 304-7404. Per the Prospectus dated April 30, 2021, the expense ratio for the Fund is 0.64%.
(1) The S&P 500 Total Return Index is an unmanaged index of 500 common stocks that is generally considered representative of the U.S. stock market. It tracks both the capital gains of a group of stocks over time and assumes that any cash distributions, such as dividends, are reinvested back into the index. It is not possible to invest directly in an index.
6
Mairs & Power Growth Fund
FUND INFORMATION (unaudited) December 31, 2021
Portfolio Managers
Andrew R. Adams, CFA, lead manager since April 1, 2019, co-manager from January 1, 2015 through April 1, 2019, University of Wisconsin-Madison, MS Finance 1997
Peter J. Johnson, CFA, co-manager since April 1, 2019, University of Wisconsin-Madison, MBA Applied Security Analysis 2010
General Information
Fund Symbol | | | MPGFX | | |
Net Asset Value (NAV) Per Share | | $ | 162.55 | | |
Expense Ratio | | | 0.61 | % | |
Portfolio Turnover Rate | | | 13.17 | % | |
Sales Charge | | | None1 | | |
Fund Inception Year | | | 1958 | | |
Portfolio Composition
Top Ten Portfolio Holdings
(Percent of Total Net Assets)2
Microsoft Corp | | | 7.9 | % | |
Alphabet Inc | | | 6.8 | | |
Amazon.com Inc(a) | | | 5.2 | | |
UnitedHealth Group Inc | | | 5.1 | | |
Ecolab Inc | | | 4.1 | | |
NVIDIA Corp | | | 3.8 | | |
US Bancorp/MN | | | 3.8 | | |
Bio-Techne Corp | | | 3.1 | | |
Graco Inc | | | 3.0 | | |
Roche Holding AG(b) | | | 2.8 | | |
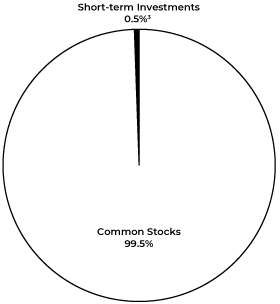
Portfolio Diversification
(Percent of Total Net Assets)
Common Stocks 99.5% | |
Information Technology | | | 26.6 | % | |
Health Care | | | 19.1 | | |
Industrials | | | 15.6 | | |
Communication Services | | | 9.0 | | |
Materials | | | 8.4 | | |
Consumer Discretionary | | | 8.3 | | |
Financials | | | 8.3 | | |
Consumer Staples | | | 3.7 | | |
Utilities | | | 0.5 | | |
Real Estate | | | 0.0 | | |
Short-term Investments 0.5%3 | | | 0.5 | | |
| | | | 100.0 | % | |
1 Although the Fund is no-load, investment management fees and other expenses still apply.
2 All holdings in the portfolio are subject to change without notice and may or may not represent current or future portfolio composition. The mention of specific securities is not intended as a recommendation or offer for a particular security, nor is it intended to be a solicitation for the purchase or sale of any security.
3 Represents short-term investments and other assets and liabilities (net).
The Schedule of Investments and portfolio diversification utilize the Global Industry Classification Standard (GICS®) which was developed by and/or is the exclusive property of MSCI, Inc. and Standard & Poor's Financial Services LLC ("S&P"). GICS is a service mark of MSCI, Inc. and S&P and has been licensed for use by Mairs & Power, Inc. (the "Adviser").
7
Mairs & Power Growth Fund
SCHEDULE OF INVESTMENTS December 31, 2021
Shares | | Security Description | | Fair Value | |
| | | COMMON STOCKS 99.5% | |
| | | COMMUNICATION SERVICES 9.0% | |
| | 762,000 | | | Activision Blizzard Inc | | $ | 50,695,860 | | |
| | 139,500 | | | Alphabet Inc (a) | | | 403,655,805 | | |
| | 510,000 | | | Walt Disney Co/The (a) | | | 78,993,900 | | |
| | | | 533,345,565 | | |
| | | CONSUMER DISCRETIONARY 8.3% | |
| | 93,300 | | | Amazon.com Inc (a) | | | 311,093,922 | | |
| | 167,100 | | | Gentherm Inc (a) | | | 14,520,990 | | |
| | 190,000 | | | Home Depot Inc/The | | | 78,851,900 | | |
| | 256,000 | | | Polaris Inc | | | 28,136,960 | | |
| | 272,000 | | | Sleep Number Corp (a) | | | 20,835,200 | | |
| | 180,000 | | | Target Corp | | | 41,659,200 | | |
| | | | 495,098,172 | | |
| | | CONSUMER STAPLES 3.7% | |
| | 2,758,592 | | | Hormel Foods Corp | | | 134,646,875 | | |
| | 1,050,000 | | | Sysco Corp | | | 82,477,500 | | |
| | | | 217,124,375 | | |
| | | FINANCIALS 8.3% | |
| | 1,410,300 | | | Charles Schwab Corp/The | | | 118,606,230 | | |
| | 730,000 | | | Principal Financial Group Inc | | | 52,800,900 | | |
| | 3,975,000 | | | US Bancorp/MN | | | 223,275,750 | | |
| | 2,064,000 | | | Wells Fargo & Co | | | 99,030,720 | | |
| | | | 493,713,600 | | |
| | | HEALTH CARE 19.1% | |
| | 515,000 | | | Abbott Laboratories | | | 72,481,100 | | |
| | 195,000 | | | Baxter International Inc | | | 16,738,800 | | |
| | 355,700 | | | Bio-Techne Corp | | | 184,017,838 | | |
| | 255,000 | | | Eli Lilly & Co | | | 70,436,100 | | |
| | 96,000 | | | Inspire Medical Systems Inc (a) | | | 22,085,760 | | |
| | 775,000 | | | Johnson & Johnson | | | 132,579,250 | | |
| | 1,610,000 | | | Medtronic PLC (d) | | | 166,554,500 | | |
| | 3,225,000 | | | Roche Holding AG (c) | | | 166,700,250 | | |
| | 610,000 | | | UnitedHealth Group Inc | | | 306,305,400 | | |
| | | | 1,137,898,998 | | |
| | | INDUSTRIALS 15.6% | |
| | 312,000 | | | 3M Co | | | 55,420,560 | | |
| | 660,000 | | | CH Robinson Worldwide Inc | | | 71,035,800 | | |
| | 1,670,000 | | | Donaldson Co Inc | | | 98,964,200 | | |
| | 1,810,000 | | | Fastenal Co | | | 115,948,600 | | |
| | 2,245,000 | | | Graco Inc | | | 180,991,900 | | |
| | 225,000 | | | Honeywell International Inc | | | 46,914,750 | | |
8
Mairs & Power Growth Fund
SCHEDULE OF INVESTMENTS (continued) December 31, 2021
Shares | | Security Description | | Fair Value | |
| | | COMMON STOCKS (continued) | |
| | | INDUSTRIALS (continued) | |
| | 2,176,066 | | | nVent Electric PLC (d) | | $ | 82,690,508 | | |
| | 125,000 | | | Rockwell Automation Inc | | | 43,606,250 | | |
| | 949,966 | | | Tennant Co (e) | | | 76,985,245 | | |
| | 1,557,000 | | | Toro Co/The | | | 155,559,870 | | |
| | | | 928,117,683 | | |
| | | INFORMATION TECHNOLOGY 26.6% | |
| | 960,000 | | | Corning Inc | | | 35,740,800 | | |
| | 1,391,333 | | | Digi International Inc (a) | | | 34,185,052 | | |
| | 208,000 | | | Entegris Inc | | | 28,824,640 | | |
| | 1,160,000 | | | Fiserv Inc (a) | | | 120,396,400 | | |
| | 918,000 | | | Jamf Holding Corp (a) | | | 34,893,180 | | |
| | 471,404 | | | Littelfuse Inc | | | 148,341,411 | | |
| | 1,392,000 | | | Microsoft Corp | | | 468,157,440 | | |
| | 484,000 | | | Motorola Solutions Inc | | | 131,502,800 | | |
| | 778,000 | | | NVIDIA Corp | | | 228,817,580 | | |
| | 675,000 | | | QUALCOMM Inc | | | 123,437,250 | | |
| | 177,000 | | | salesforce.com Inc (a) | | | 44,981,010 | | |
| | 675,000 | | | Visa Inc | | | 146,279,250 | | |
| | 279,600 | | | Workiva Inc (a) | | | 36,485,004 | | |
| | | | 1,582,041,817 | | |
| | | MATERIALS 8.4% | |
| | 1,039,000 | | | Ecolab Inc | | | 243,739,010 | | |
| | 1,505,000 | | | HB Fuller Co | | | 121,905,000 | | |
| | 388,000 | | | Sherwin-Williams Co/The | | | 136,638,080 | | |
| | | | 502,282,090 | | |
| | | UTILITIES 0.5% | |
| | 500,000 | | | Alliant Energy Corp | | | 30,735,000 | | |
| | | | TOTAL COMMON STOCKS
(cost $2,475,109,382) | | $ | 5,920,357,300 | | |
| | | SHORT-TERM INVESTMENTS 0.5% | |
| 29,143,494 | | | First American Government Obligations Fund, Class X, 0.026% (b)
(cost $29,143,494) | | $ | 29,143,494 | | |
| | | | TOTAL INVESTMENTS 100.0%
(cost $2,504,252,876) | | $ | 5,949,500,794 | | |
| | | | | OTHER ASSETS AND LIABILITIES (NET) 0.0% | | | 660,466 | | |
| | | | | TOTAL NET ASSETS 100.0% | | $ | 5,950,161,260 | | |
9
Mairs & Power Growth Fund
SCHEDULE OF INVESTMENTS (continued) December 31, 2021
(a) Non-income producing.
(b) The rate quoted is the annualized seven-day effective yield as of December 31, 2021.
(c) American Depositary Receipt.
(d) Issuer headquartered overseas but considered domestic. The Adviser defines foreign issuers as those whose operational leadership or headquarters is located in a foreign country; provided, however, if an issuer is believed by the Adviser to be headquartered in a jurisdiction primarily for tax purposes, the Adviser will consider the following additional factors: 1) the location of the primary exchange trading its securities; 2) where it derives the majority of its revenues; and/or 3) where it earns the majority of its profits.
(e) Affiliated company at December 31, 2021.
The Global Industry Classification Standard (GICS®) was developed by and/or is the exclusive property of MSCI, Inc. and Standard & Poor's Financial Services LLC ("S&P"). GICS is a service mark of MSCI, Inc. and S&P and has been licensed for use by the Adviser.
See accompanying Notes to Financial Statements.
10
MAIRS & POWER BALANCED FUND (unaudited)
To Our Shareholders: December 31, 2021
The Mairs & Power Balanced Fund finished the fourth quarter up 6.91%, gaining 18.30% for all of 2021. The Fund's benchmark composite index (60% S&P 500 Total Return (TR) Index and 40% Bloomberg Government/Credit Bond Index) gained 6.64% in the quarter and 15.76% for the year, while the Morningstar US Fund Allocation 50%-70% Equity category rose 4.72% in the fourth quarter and 13.91% in 2021.
The Fund's asset allocation position aided performance meaningfully in 2021. We were overweight equities in a period where stocks handily outperformed bonds. We sold stocks into this strength throughout the year but remained overweight equities at year's end.
Our long-term equity investment strategy seeks to identify companies with durable competitive advantages, buy them at attractive valuations, and hold them for long-run returns. While this process remains focused on bottom-up security selection, it has produced certain macro leanings which have impacted performance from time to time. The most significant of these leanings is an underweight allocation toward Technology stocks and an overweight allocation toward value stocks. These two biases provided a tailwind in the first half of the year and a headwind in the second half.
While our equity allocation provided a particularly strong benefit to performance, our equity positions underperformed their asset class benchmark. The most significant factor was our performance in the Technology sector. Although we have added weight to our Technology holdings in recent years, our continued underweight stance in one of the market's best-performing sectors was a headwind. Our allocation to Motorola Solutions (MSI) helped meaningfully, while Fiserv (FISV), Visa (V), and Corning (GLW) lagged the sector. Fiserv faced pressure over concerns about emerging fintech companies eating away at its future market share and profitability. Visa continues to lag partly because international travel is recovering more slowly than originally anticipated but also due to the market's competitive concerns revolving around stablecoins and fintechs. We continue to be judicious in our addition to Technology, preferring companies with compounding business models which have substantial customer stickiness and pricing power.
MAIRS & POWER BALANCED FUND CONTRIBUTORS
Year-to-Date 12/31/2020 – 12/31/2021
| Top Contributors | | Bottom Contributors | |
Alphabet Inc. Class C | | | 65.17 | % | | Activision Blizzard, Inc. | | | -28.35 | % | |
Eli Lilly & Company | | | 63.60 | % | | Salesforce.com, Inc. | | | -16.13 | % | |
Motorola Solutions, Inc. | | | 59.77 | % | | Medtronic Plc | | | -11.69 | % | |
UnitedHealth Group Inc. | | | 43.19 | % | | Fiserv, Inc. | | | -8.84 | % | |
U.S. Bancorp | | | 20.56 | % | | Microsoft Corp. | | | 51.21 | * | |
* Microsoft was a bottom contributor due to an underweight relative to the benchmark, while the stock continued to have strong performance.
Top and bottom contributors are securities that were selected based on their relative contribution compared to the S&P 500 TR Index as of December 31, 2021. Relative contribution considers average daily weightings for each security and whether the security was added or eliminated from the Fund during period. The performance number shown is total return of the security for the period. Total return is amount of value an investor earns from a security over a specific period and when distributions are reinvested. Past performance does not guarantee future results
Our preference for Industrial companies in the Upper Midwest has led to a long-term sector overweight in the Fund. We are still encouraged by the region's strong economy – unemployment rates are below the national average, and new companies appear to be forming with renewed vigor. But 2021 brought with it substantial supply chain constraints, wage pressures, and a slower-than-expected industrial recovery which led to
11
MAIRS & POWER BALANCED FUND (unaudited) (continued)
unfavorable attribution from the sector. In particular, Honeywell (HON) lagged as worldwide end-market demand remained sluggish, while 3M (MMM) slumped due to an absence of impactful innovation under its current management team as well as concerns over environmental liabilities.
The Fund's lack of Energy holdings also hurt its 2021 performance. But we've concluded that the traditional firms in this sector cannot build sustainable durable competitive advantages. We are exploring alternatives to fossil fuels for investing in the energy of tomorrow, but we haven't yet found any companies with a durable competitive advantage at a reasonable price.
The Fund's Communications sector performance was lifted by Alphabet (GOOGL), the portfolio's largest holding and its best performer in 2021. With ad spend continuing to shift online and the company's increase in advertising space on its YouTube platform, Alphabet's revenue grew substantially in 2021 and the stock price followed, gaining 65%. Sector performance was weighed down by Activision (ATVI), which is facing a reckoning over an unfavorable workplace culture, and Disney (DIS), where slowing growth in its streaming service helped dampen its stock's performance.
Financials continued to be supported by the Fed's announcement portending short-term interest rate increases in 2022. The sector had significant outperformance during the first quarter of 2021 as rates increased, and it will likely benefit from further rate increases this year. Our preference for quality companies that perform well throughout the cycle – JPMorgan Chase (JPM) and U.S. Bank (USB) are the Fund's two largest Financial holdings – led to a slight sector underperformance during the year. But the Fund's overweight allocation in the sector aided performance.
During the second quarter, we added a position to ADP (ADP), a company we believe is undervalued. Its strong management team has shored up its competitive positioning in the payroll processing and human resource management space. With payrolls increasing and ADP paying one-fifth of all U.S. workers, the company has potential volume growth as the economy recovers post-COVID.
In the fourth quarter, we added a small position in Salesforce (CRM), buying into weakness as we believe the company has substantial growth potential with a well-established and profitable base. Salesforce makes cloud-based software for customer relationship management. The company's focus on the front-end salesforce and growing businesses helps position it well from a pricing standpoint, and most customers are heavily built into its system, suggesting strong staying power.
Lastly, the Fund ended its sole exposure to Real Estate in the fourth quarter when CoreSite (COR) was purchased by American Tower (AMT), another communications infrastructure REIT. That deal yielded a strong valuation going into the end of 2021.
The Fund's fixed income portfolio experienced renewed strength in 2021, handily outperforming its benchmark after roughly matching the index the year before. Much of this performance came during the first quarter, when interest rates retraced much of their pandemic lows set in 2020. Since the Fund has a lower duration than the index, the rate increases marginally helped relative performance. With credit spreads tight at the start of 2021, selective credit choices were the primary cause of our outperformance, while our overall corporate overweight helped to the extent that the Fund earned a higher spread over the course of the year. In a year where fixed income indices generally delivered negative returns, we were pleased to post a healthy, positive return.
Going forward, the Fund's shorter duration relative to the benchmark index could, in our opinion, aid performance in a rising rate environment. The Fund is exposed more heavily to credit, and U.S. companies are in their best financial shape in decades. We continue to find opportunities as we invest consistently and defensively for the long term, relying on credit underwriting while taking advantage of relative valuation between areas of fixed income.
One final note: You should have received by mail a proxy statement and a ballot from Mairs & Power asking you to vote on a proposed reorganization of the Balanced Fund. This reorganization would transition the Fund into
12
MAIRS & POWER BALANCED FUND (unaudited) (continued)
a series of Trust for Professional Managers (TPM). We expect that reorganizing into TPM would decrease the Fund's expenses while allowing it greater access to legal, research, and operational resources. There would be no changes to the Fund's investment objectives, principal investment strategies, principal risks, or portfolio management team. The boards of Mairs & Power and TPM have both unanimously approved this reorganization. We encourage you to also vote in favor of this reorganization, which will benefit you, the Fund shareholder.
Kevin V. Earley
Lead Manager | | Robert W. Thompson
Co-Manager | |
The Fund's investment objective, risks, charges and expenses must be considered carefully before investing. The summary prospectus or full prospectus contains this and other important information about the Fund and they may be obtained by calling Shareholder Services at (800) 304-7404 or by visiting www.mairsandpower.com. Read the summary prospectus or full prospectus carefully before investing.
All holdings in the portfolio are subject to change without notice and may or may not represent current or future portfolio composition. The mention of specific securities is not intended as a recommendation or an offer of a particular security, nor is it intended to be a solicitation for the purchase or sale of any security.
All investments have risks. The Balanced Fund is designed for long-term investors. Equity investments are subject to market fluctuations and the Fund's share price can fall because of weakness in the broad market, a particular industry or specific holdings. Investments in small and midcap companies generally are more volatile. International investing risks include among others political, social or economic instability, difficulty in predicting international trade patterns, taxation and foreign trading practices, and greater fluctuations in price than U.S. corporations. The Fund is subject to yield and share price variances with changes in interest rates and market conditions. Investors should note that if interest rates rise significantly from current levels, bond total returns will decline and may even turn negative in the short-term. There is also a chance that some of the Fund's holdings may have their credit rating downgraded or may default.
Investments in debt securities typically decrease in value when interest rates rise. This risk is usually greater for longer-term debt securities. Investments in lower rated and non-rated securities present a greater risk of loss to principal and interest than higher rated securities.
This commentary includes forward-looking statements such as economic predictions and portfolio manager opinions. The statements are subject to change at any time based on market and other conditions. No predictions, forecasts, outlooks, expectations or beliefs are guaranteed.
Composite Index reflects an unmanaged portfolio of 60% of the S&P 500 TR Index and 40% of the Bloomberg Barclays U.S. Government/Credit Bond Index. It is not possible to invest directly in an index.
Morningstar US Fund Allocation – 50%-70% Equity Category is designed to benchmark target-date and target-risk investment products. The category is based on well-established asset allocation methodology from Ibbotson Associates, a Morningstar company, and has 60% global equity exposure and 40% global bond exposure.
S&P 500 Total Return (TR) Index is an unmanaged index of 500 common stocks that is generally considered representative of the U.S. stock market. It is not possible to invest directly in an index.
Bloomberg U.S. Government/Credit Bond Index is a broad-based flagship benchmark that measures the non-securitized component of the U.S. Aggregate Index. It includes investment-grade, U.S. dollar-denominated, fixed-rate Treasuries, government-related and corporate securities. It is not possible to invest directly in an index.
13
Mairs & Power Balanced Fund
PERFORMANCE INFORMATION (unaudited) December 31, 2021
Ten years of investment performance (through December 31, 2021)
This chart illustrates the performance of a hypothetical $10,000 investment made in the Fund 10 years ago.
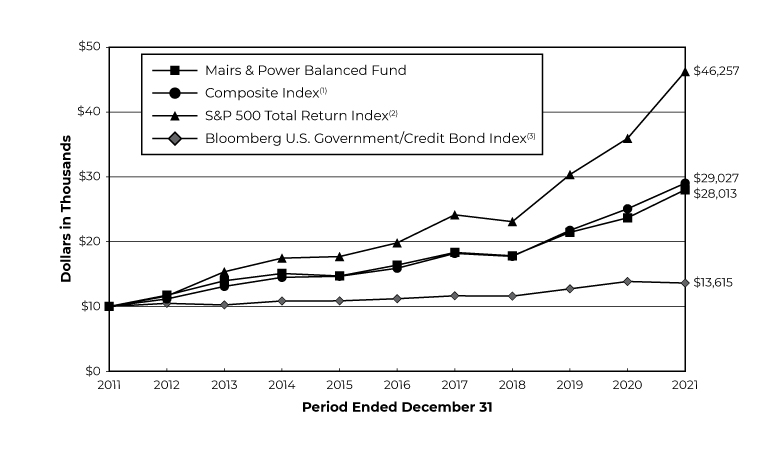
Average annual total returns for periods ended December 31, 2021
| | | 1 year | | 5 years | | 10 years | | 20 years | |
Mairs & Power Balanced Fund | | | 18.30 | % | | | 11.32 | % | | | 10.85 | % | | | 8.33 | % | |
Composite Index(1) | | | 15.76 | % | | | 12.79 | % | | | 11.24 | % | | | 7.79 | % | |
S&P 500 Total Return Index(2) | | | 28.71 | % | | | 18.47 | % | | | 16.55 | % | | | 9.52 | % | |
Bloomberg U.S. Government/Credit
Bond Index(3) | | | -1.75 | % | | | 3.99 | % | | | 3.13 | % | | | 4.49 | % | |
Performance data quoted represents past performance and does not guarantee future results. All performance information shown includes the reinvestment of dividend and capital gain distributions, but does not reflect the deduction of taxes that a shareholder would pay on Fund distributions or the redemption of Fund shares. The investment return and principal value of an investment will fluctuate so that an investor's shares, when redeemed, may be worth more or less than their original cost. Current performance of the Fund may be lower or higher than the performance quoted. For the most recent month-end performance figures, visit the Fund's website at www.mairsandpower.com or call Shareholder Services at (800) 304-7404. Per the Prospectus dated April 30, 2021, the expense ratio for the Fund is 0.71%.
(1) The Composite Index reflects an unmanaged portfolio comprised of 60% of the S&P 500 Total Return Index and 40% of the Bloomberg U.S. Government/Credit Bond Index. It is not possible to invest directly in an index.
(2) The S&P 500 Total Return Index is an unmanaged index of 500 common stocks that is generally considered representative of the U.S. stock market. It tracks both the capital gains of a group of stocks over time and assumes that any cash distributions, such as dividends, are reinvested back into the index. It is not possible to invest directly in an index.
(3) The Bloomberg U.S. Government/Credit Bond Index is a broad-based flagship benchmark that measures the non-securitized component of the U.S. Aggregate Index. It includes investment-grade, U.S. dollar-denominated, fixed-rate Treasuries, and government-related and corporate securities. It is not possible to invest directly in an index.
14
Mairs & Power Balanced Fund
FUND INFORMATION (unaudited) December 31, 2021
Portfolio Managers
Kevin V. Earley, CFA, lead manager since April 1, 2018, co-manager from January 1, 2015 through April 1, 2018, University of Minnesota, MBA Finance 1990
Robert W. Thompson, CFA, co-manager since April 1, 2018, University of Minnesota, MBA Finance 1995
General Information
Fund Symbol | | | MAPOX | | |
Net Asset Value (NAV) Per Share | | $ | 116.89 | | |
Expense Ratio | | | 0.69 | % | |
Portfolio Turnover Rate | | | 13.00 | % | |
Sales Charge | | | None1 | | |
Fund Inception Year | | | 1961 | | |
Portfolio Composition
Top Ten Common Stock Holdings
(Percent of Total Net Assets)2
Alphabet Inc | | | 4.6 | % | |
Microsoft Corp | | | 4.1 | | |
UnitedHealth Group Inc | | | 3.1 | | |
Ecolab Inc | | | 2.6 | | |
Abbott Laboratories | | | 2.5 | | |
Eli Lilly & Co | | | 2.5 | | |
US Bancorp/MN | | | 2.4 | | |
QUALCOMM Inc | | | 2.0 | | |
Medtronic PLC | | | 1.9 | | |
JPMorgan Chase & Co | | | 1.9 | | |
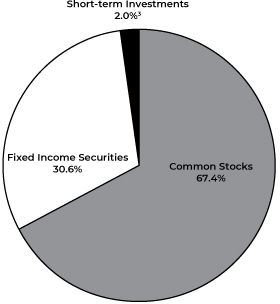
Portfolio Diversification
(Percent of Total Net Assets)
Fixed Income Securities 30.6% | |
Corporate Bonds | | | 25.7 | % | |
U.S. Government Obligations | | | 1.8 | | |
Municipal Bonds | | | 1.6 | | |
Asset Backed Securities | | | 1.5 | | |
Common Stocks 67.4% | |
Health Care | | | 16.3 | | |
Information Technology | | | 14.5 | | |
Industrials | | | 10.9 | | |
Financials | | | 7.2 | | |
Communications Services | | | 5.9 | | |
Materials | | | 5.5 | | |
Consumer Staples | | | 4.0 | | |
Consumer Discretionary | | | 2.4 | | |
Utilities | | | 0.7 | | |
Short-term Investments 2.0%3 | | | 2.0 | | |
| | | | 100.0 | % | |
1 Although the Fund is no-load, investment management fees and other expenses still apply.
2 All holdings in the portfolio are subject to change without notice and may or may not represent current or future portfolio composition. The mention of specific securities is not intended as a recommendation or offer for a particular security, nor is it intended to be a solicitation for the purchase or sale of any security.
3 Represents short-term investments and other assets and liabilities (net).
The Schedule of Investments and portfolio diversification utilize the Global Industry Classification Standard (GICS®) which was developed by and/or is the exclusive property of MSCI, Inc. and Standard & Poor's Financial Services LLC ("S&P"). GICS is a service mark of MSCI, Inc. and S&P and has been licensed for use by the Adviser.
15
Mairs & Power Balanced Fund
SCHEDULE OF INVESTMENTS December 31, 2021
Par Value | | Security Description | | Fair Value | |
| | | FIXED INCOME SECURITIES 30.6% | |
| | | CORPORATE BONDS 25.7% | |
| | | COMMUNICATION SERVICES 1.0% | |
$ | 1,000,000 | | | CBS Corp | | | 3.500 | % | | 01/15/25 | | $ | 1,055,069 | | |
| | 1,688,000 | | | Netflix Inc | | | 5.875 | % | | 11/15/28 | | | 2,029,820 | | |
| | 2,000,000 | | | Comcast Corp | | | 4.250 | % | | 01/15/33 | | | 2,343,753 | | |
| | 1,000,000 | | | Verizon Communications Inc | | | 4.400 | % | | 11/01/34 | | | 1,166,354 | | |
| | 3,000,000 | | | AT&T Inc | | | 4.500 | % | | 05/15/35 | | | 3,470,367 | | |
| | | | 10,065,363 | | |
| | | CONSUMER DISCRETIONARY 3.1% | |
| | 1,000,000 | | | Harley-Davidson Financial Services Inc (g) | | | 4.050 | % | | 02/04/22 | | | 1,002,757 | | |
| | 500,000 | | | Whirlpool Corp | | | 4.700 | % | | 06/01/22 | | | 507,572 | | |
| | 1,000,000 | | | Block Financial LLC | | | 5.500 | % | | 11/01/22 | | | 1,014,160 | | |
| | 1,000,000 | | | General Motors Financial Co Inc | | | 3.700 | % | | 05/09/23 | | | 1,029,887 | | |
| | 1,000,000 | | | General Motors Financial Co Inc | | | 4.250 | % | | 05/15/23 | | | 1,040,774 | | |
| | 1,000,000 | | | General Motors Financial Co Inc | | | 3.950 | % | | 04/13/24 | | | 1,052,404 | | |
| | 250,000 | | | General Motors Co | | | 4.000 | % | | 04/01/25 | | | 267,496 | | |
| | 1,000,000 | | | General Motors Financial Co Inc | | | 4.300 | % | | 07/13/25 | | | 1,078,353 | | |
| | 1,064,000 | | | Block Financial LLC | | | 5.250 | % | | 10/01/25 | | | 1,179,372 | | |
| | 1,500,000 | | | Ford Motor Co | | | 4.346 | % | | 12/08/26 | | | 1,636,125 | | |
| | 1,000,000 | | | Darden Restaurants Inc | | | 3.850 | % | | 05/01/27 | | | 1,083,182 | | |
| | 2,245,000 | | | Lear Corp | | | 3.800 | % | | 09/15/27 | | | 2,448,722 | | |
| | 1,000,000 | | | General Motors Co | | | 4.200 | % | | 10/01/27 | | | 1,095,040 | | |
| | 1,000,000 | | | AutoNation Inc | | | 3.800 | % | | 11/15/27 | | | 1,065,460 | | |
| | 923,000 | | | Whirlpool Corp | | | 4.750 | % | | 02/26/29 | | | 1,066,361 | | |
| | 2,000,000 | | | Hasbro Inc | | | 3.900 | % | | 11/19/29 | | | 2,207,091 | | |
| | 2,000,000 | | | Advance Auto Parts Inc | | | 3.900 | % | | 04/15/30 | | | 2,183,433 | | |
| | 1,000,000 | | | Mohawk Industries Inc | | | 3.625 | % | | 05/15/30 | | | 1,072,787 | | |
| | 2,000,000 | | | Block Financial LLC | | | 3.875 | % | | 08/15/30 | | | 2,141,944 | | |
| | 1,000,000 | | | Kohl's Corp | | | 3.375 | % | | 05/01/31 | | | 1,019,517 | | |
| | 1,750,000 | | | Ford Motor Credit Co LLC | | | 3.625 | % | | 06/17/31 | | | 1,836,774 | | |
| | 500,000 | | | Tapestry Inc | | | 3.050 | % | | 03/15/32 | | | 503,529 | | |
| | 500,000 | | | Kohl's Corp | | | 6.875 | % | | 12/15/37 | | | 646,741 | | |
| | 1,000,000 | | | Ford Motor Co | | | 4.750 | % | | 01/15/43 | | | 1,103,750 | | |
| | 750,000 | | | Hasbro Inc | | | 5.100 | % | | 05/15/44 | | | 936,102 | | |
| | 1,073,000 | | | Kohl's Corp | | | 5.550 | % | | 07/17/45 | | | 1,254,622 | | |
| | | | 31,473,955 | | |
| | | CONSUMER STAPLES 1.3% | |
| | 430,000 | | | Land O' Lakes Inc (g) | | | 6.000 | % | | 11/15/22 | | | 443,146 | | |
| | 2,500,000 | | | Land O' Lakes Inc (h) | | | 7.250 | % | | 07/14/27 | | | 2,693,750 | | |
| | 1,949,000 | | | Land O' Lakes Capital Trust I (g) | | | 7.450 | % | | 03/15/28 | | | 2,255,753 | | |
| | 2,500,000 | | | Land O' Lakes Inc (h) | | | 7.000 | % | | 12/18/28 | | | 2,662,500 | | |
| | 250,000 | | | Smithfield Foods Inc (g) | | | 3.000 | % | | 10/15/30 | | | 249,239 | | |
16
Mairs & Power Balanced Fund
SCHEDULE OF INVESTMENTS (continued) December 31, 2021
Par Value | | Security Description | | Fair Value | |
| | | FIXED INCOME SECURITIES (continued) | |
| | | CORPORATE BONDS (continued) | |
| | | CONSUMER STAPLES (continued) | |
$ | 1,000,000 | | | Walgreens Boots Alliance Inc | | | 4.500 | % | | 11/18/34 | | $ | 1,149,180 | | |
| | 1,000,000 | | | Anheuser-Busch Cos LLC / Anheuser-Busch InBev
Worldwide Inc | | | 4.700 | % | | 02/01/36 | | | 1,208,539 | | |
| | 1,000,000 | | | Walgreens Boots Alliance Inc | | | 4.800 | % | | 11/18/44 | | | 1,206,022 | | |
| | 1,000,000 | | | Molson Coors Brewing Co | | | 4.200 | % | | 07/15/46 | | | 1,111,998 | | |
| | | | 12,980,127 | | |
| | | CONSUMER, NON-CYCLICAL 0.1% | |
| | 1,000,000 | | | Wildlife Conservation Society | | | 3.414 | % | | 08/01/50 | | | 995,350 | | |
| | | ENERGY 0.4% | |
| | 140,000 | | | Gulf South Pipeline Co LP | | | 4.000 | % | | 06/15/22 | | | 140,931 | | |
| | 1,500,000 | | | Sunoco Logistics Partners Operations LP | | | 3.450 | % | | 01/15/23 | | | 1,527,307 | | |
| | 1,000,000 | | | Boardwalk Pipelines LP | | | 4.950 | % | | 12/15/24 | | | 1,083,900 | | |
| | 1,200,000 | | | Kinder Morgan Inc | | | 5.300 | % | | 12/01/34 | | | 1,445,951 | | |
| | 500,000 | | | Murphy Oil Corp | | | 6.375 | % | | 12/01/42 | | | 500,000 | | |
| | | | 4,698,089 | | |
| | | FINANCIALS 9.9% | |
| | 2,833,000 | | | Infinity Property & Casualty Corp | | | 5.000 | % | | 09/19/22 | | | 2,909,096 | | |
| | 2,000,000 | | | OneBeacon US Holdings Inc | | | 4.600 | % | | 11/09/22 | | | 2,056,008 | | |
| | 1,000,000 | | | Standard Chartered PLC (b) (g) | | | 3.950 | % | | 01/11/23 | | | 1,024,632 | | |
| | 500,000 | | | First American Financial Corp | | | 4.300 | % | | 02/01/23 | | | 515,188 | | |
| | 500,000 | | | Assurant Inc | | | 4.200 | % | | 09/27/23 | | | 525,138 | | |
| | 500,000 | | | CNA Financial Corp | | | 7.250 | % | | 11/15/23 | | | 554,750 | | |
| | 500,000 | | | Pacific Life Insurance Co (g) | | | 7.900 | % | | 12/30/23 | | | 564,193 | | |
| | 1,000,000 | | | Moody's Corp | | | 4.875 | % | | 02/15/24 | | | 1,068,552 | | |
| | 1,000,000 | | | HSBC Holdings PLC (b) | | | 4.250 | % | | 03/14/24 | | | 1,056,099 | | |
| | 540,000 | | | Wintrust Financial Corp | | | 5.000 | % | | 06/13/24 | | | 569,838 | | |
| | 824,000 | | | Assured Guaranty US Holdings Inc | | | 5.000 | % | | 07/01/24 | | | 892,088 | | |
| | 3,088,000 | | | Legg Mason Inc | | | 3.950 | % | | 07/15/24 | | | 3,283,372 | | |
| | 1,500,000 | | | Symetra Financial Corp | | | 4.250 | % | | 07/15/24 | | | 1,592,657 | | |
| | 1,000,000 | | | Citigroup Inc | | | 4.000 | % | | 08/05/24 | | | 1,065,625 | | |
| | 3,000,000 | | | Synchrony Financial | | | 4.250 | % | | 08/15/24 | | | 3,177,971 | | |
| | 2,000,000 | | | Old Republic International Corp | | | 4.875 | % | | 10/01/24 | | | 2,178,494 | | |
| | 1,627,000 | | | Associated Banc-Corp | | | 4.250 | % | | 01/15/25 | | | 1,723,592 | | |
| | 4,000,000 | | | Kemper Corp | | | 4.350 | % | | 02/15/25 | | | 4,270,205 | | |
| | 1,050,000 | | | TCF National Bank | | | 4.600 | % | | 02/27/25 | | | 1,126,868 | | |
| | 1,000,000 | | | BBVA USA | | | 3.875 | % | | 04/10/25 | | | 1,073,565 | | |
| | 250,000 | | | Liberty Mutual Insurance Co (g) | | | 8.500 | % | | 05/15/25 | | | 301,145 | | |
| | 1,000,000 | | | Prudential Insurance Co of America/The (g) | | | 8.300 | % | | 07/01/25 | | | 1,210,544 | | |
17
Mairs & Power Balanced Fund
SCHEDULE OF INVESTMENTS (continued) December 31, 2021
Par Value | | Security Description | | Fair Value | |
| | | FIXED INCOME SECURITIES (continued) | |
| | | CORPORATE BONDS (continued) | |
| | | FINANCIALS (continued) | |
$ | 3,000,000 | | | American International Group Inc | | | 3.750 | % | | 07/10/25 | | $ | 3,211,364 | | |
| | 1,000,000 | | | Synchrony Financial | | | 4.500 | % | | 07/23/25 | | | 1,080,891 | | |
| | 2,000,000 | | | Janus Capital Group Inc (b) | | | 4.875 | % | | 08/01/25 | | | 2,192,576 | | |
| | 2,000,000 | | | HSBC Holdings PLC (b) | | | 4.250 | % | | 08/18/25 | | | 2,151,314 | | |
| | 4,000,000 | | | Capital One Financial Corp | | | 4.200 | % | | 10/29/25 | | | 4,350,886 | | |
| | 20,000 | | | Wells Fargo & Co (h) | | | 4.700 | % | | 12/15/25 | | | 516,000 | | |
| | 1,520,000 | | | Legg Mason Inc | | | 4.750 | % | | 03/15/26 | | | 1,703,901 | | |
| | 2,000,000 | | | Hanover Insurance Group Inc/The | | | 4.500 | % | | 04/15/26 | | | 2,193,438 | | |
| | 1,000,000 | | | Wells Fargo & Co | | | 4.100 | % | | 06/03/26 | | | 1,090,469 | | |
| | 3,290,000 | | | Old Republic International Corp | | | 3.875 | % | | 08/26/26 | | | 3,564,118 | | |
| | 500,000 | | | Morgan Stanley | | | 4.350 | % | | 09/08/26 | | | 552,335 | | |
| | 1,000,000 | | | Citigroup Inc | | | 4.300 | % | | 11/20/26 | | | 1,107,022 | | |
| | 1,000,000 | | | JPMorgan Chase & Co | | | 4.125 | % | | 12/15/26 | | | 1,103,592 | | |
| | 4,000,000 | | | PNC Financial Services Group Inc/The (f) (h) | | | 3.400 | % | | 12/15/26 | | | 3,936,960 | | |
| | 4,000,000 | | | Mercury General Corp | | | 4.400 | % | | 03/15/27 | | | 4,411,974 | | |
| | 450,000 | | | Athene Holding Ltd (b) | | | 4.125 | % | | 01/12/28 | | | 492,520 | | |
| | 250,000 | | | Provident Cos Inc | | | 7.250 | % | | 03/15/28 | | | 314,502 | | |
| | 2,000,000 | | | E*TRADE Financial Corp | | | 4.500 | % | | 06/20/28 | | | 2,251,719 | | |
| | 500,000 | | | Farmers Exchange Capital (g) | | | 7.050 | % | | 07/15/28 | | | 614,615 | | |
| | 1,000,000 | | | Lazard Group LLC | | | 4.375 | % | | 03/11/29 | | | 1,128,693 | | |
| | 2,500,000 | | | Wintrust Financial Corp | | | 4.850 | % | | 06/06/29 | | | 2,707,979 | | |
| | 2,300,000 | | | Assurant Inc | | | 3.700 | % | | 02/22/30 | | | 2,441,512 | | |
| | 500,000 | | | Park National Corp (f) | | | 4.500 | % | | 09/01/30 | | | 507,913 | | |
| | 500,000 | | | Goldman Sachs Group Inc/The | | | 4.250 | % | | 11/15/30 | | | 538,625 | | |
| | 500,000 | | | Goldman Sachs Group Inc/The | | | 4.000 | % | | 02/15/31 | | | 517,778 | | |
| | 2,000,000 | | | Synchrony Financial | | | 2.875 | % | | 10/28/31 | | | 1,998,160 | | |
| | 2,000,000 | | | Goldman Sachs Group Inc/The (f) | | | 2.650 | % | | 10/21/32 | | | 2,014,895 | | |
| | 500,000 | | | Goldman Sachs Group Inc/The | | | 4.300 | % | | 12/15/32 | | | 532,306 | | |
| | 538,000 | | | Bank of America Corp | | | 4.000 | % | | 08/15/34 | | | 583,739 | | |
| | 3,000,000 | | | Fulton Financial Corp (f) | | | 3.750 | % | | 03/15/35 | | | 3,031,628 | | |
| | 500,000 | | | Swiss Re Treasury US Corp (g) | | | 4.250 | % | | 12/06/42 | | | 614,340 | | |
| | 500,000 | | | Principal Financial Group Inc | | | 4.350 | % | | 05/15/43 | | | 604,935 | | |
| | 2,500,000 | | | M&T Bank Corp (f) (h) | | | 5.125 | % | | 12/29/49 | | | 2,678,128 | | |
| | 1,000,000 | | | SVB Financial Group (f) (h) | | | 4.100 | % | | 08/15/69 | | | 989,000 | | |
| | 3,000,000 | | | JPMorgan Chase & Co (f) (h) | | | 3.650 | % | | 12/01/69 | | | 2,992,500 | | |
| | 2,000,000 | | | Bank of New York Mellon Corp/The (f) (h) | | | 3.750 | % | | 06/20/70 | | | 2,007,140 | | |
| | 6,000,000 | | | Charles Schwab Corp (f ) (h) | | | 4.000 | % | | 03/01/31 | | | 6,060,000 | | |
| | | | 101,529,087 | | |
18
Mairs & Power Balanced Fund
SCHEDULE OF INVESTMENTS (continued) December 31, 2021
Par Value | | Security Description | | Fair Value | |
| | | FIXED INCOME SECURITIES (continued) | |
| | | CORPORATE BONDS (continued) | |
| | | HEALTH CARE 0.8% | |
$ | 500,000 | | | Wyeth LLC | | | 6.450 | % | | 02/01/24 | | $ | 554,246 | | |
| | 3,000,000 | | | AbbVie Inc | | | 3.800 | % | | 03/15/25 | | | 3,194,607 | | |
| | 189,000 | | | Bristol-Myers Squibb Co | | | 3.875 | % | | 08/15/25 | | | 204,595 | | |
| | 1,000,000 | | | Cigna Corp | | | 4.500 | % | | 02/25/26 | | | 1,105,628 | | |
| | 500,000 | | | Zimmer Biomet Holdings Inc | | | 4.250 | % | | 08/15/35 | | | 558,004 | | |
| | 1,400,000 | | | CVS Health Corp | | | 4.780 | % | | 03/25/38 | | | 1,711,064 | | |
| | 1,000,000 | | | UnitedHealth Group Inc | | | 3.500 | % | | 08/15/39 | | | 1,111,669 | | |
| | | | 8,439,813 | | |
| | | INDUSTRIALS 2.5% | |
| | 500,000 | | | GATX Corp | | | 4.750 | % | | 06/15/22 | | | 509,374 | | |
| | 500,000 | | | Penske Truck Leasing Co Lp / PTL Finance Corp (g) | | | 4.875 | % | | 07/11/22 | | | 510,856 | | |
| | 1,000,000 | | | GATX Corp | | | 3.900 | % | | 03/30/23 | | | 1,034,881 | | |
| | 1,500,000 | | | Hillenbrand Inc | | | 5.000 | % | | 09/15/26 | | | 1,672,500 | | |
| | 500,000 | | | Toro Co/The | | | 7.800 | % | | 06/15/27 | | | 633,570 | | |
| | 2,000,000 | | | Kennametal Inc | | | 4.625 | % | | 06/15/28 | | | 2,230,399 | | |
| | 3,000,000 | | | Steelcase Inc | | | 5.125 | % | | 01/18/29 | | | 3,392,904 | | |
| | 1,000,000 | | | Oshkosh Corp | | | 3.100 | % | | 03/01/30 | | | 1,039,930 | | |
| | 2,000,000 | | | GATX Corp | | | 4.000 | % | | 06/30/30 | | | 2,228,679 | | |
| | 1,000,000 | | | Flowserve Corp | | | 3.500 | % | | 10/01/30 | | | 1,034,134 | | |
| | 3,000,000 | | | Hillenbrand Inc | | | 3.750 | % | | 03/01/31 | | | 3,007,500 | | |
| | 3,000,000 | | | United Rentals North America Inc | | | 3.750 | % | | 01/15/32 | | | 3,021,008 | | |
| | 2,000,000 | | | Eaton Corp | | | 4.000 | % | | 11/02/32 | | | 2,300,866 | | |
| | 1,400,000 | | | Leidos Holdings Inc | | | 5.950 | % | | 12/01/40 | | | 1,708,936 | | |
| | 1,000,000 | | | FedEx Corp | | | 4.100 | % | | 04/15/43 | | | 1,123,475 | | |
| | | | 25,449,012 | | |
| | | INFORMATION TECHNOLOGY 3.9% | |
| | 696,000 | | | Dell International LLC / EMC Corp. | | | 5.450 | % | | 06/15/23 | | | 734,262 | | |
| | 1,031,000 | | | Arrow Electronics Inc | | | 4.000 | % | | 04/01/25 | | | 1,099,630 | | |
| | 2,000,000 | | | Hewlett Packard Enterprise Co | | | 4.900 | % | | 10/15/25 | | | 2,219,191 | | |
| | 1,500,000 | | | Dell International LLC / EMC Corp. | | | 6.020 | % | | 06/15/26 | | | 1,734,637 | | |
| | 2,500,000 | | | Motorola Solutions Inc | | | 4.600 | % | | 02/23/28 | | | 2,824,598 | | |
| | 1,500,000 | | | Trimble Inc | | | 4.900 | % | | 06/15/28 | | | 1,707,248 | | |
| | 1,000,000 | | | Fiserv Inc | | | 4.200 | % | | 10/01/28 | | | 1,121,911 | | |
| | 1,500,000 | | | Broadcom Inc | | | 4.750 | % | | 04/15/29 | | | 1,708,876 | | |
| | 1,000,000 | | | Juniper Networks Inc | | | 3.750 | % | | 08/15/29 | | | 1,082,390 | | |
| | 1,000,000 | | | Dell International LLC / EMC Corp. | | | 5.300 | % | | 10/01/29 | | | 1,173,212 | | |
| | 1,000,000 | | | Citrix Systems Inc | | | 3.300 | % | | 03/01/30 | | | 1,015,431 | | |
| | 2,000,000 | | | Avnet Inc | | | 3.000 | % | | 05/15/31 | | | 1,976,561 | | |
| | 1,000,000 | | | HP Inc (g) | | | 2.650 | % | | 06/17/31 | | | 986,981 | | |
| | 1,000,000 | | | Autodesk Inc | | | 2.400 | % | | 12/15/31 | | | 998,292 | | |
| | 2,000,000 | | | Broadcom Inc | | | 4.300 | % | | 11/15/32 | | | 2,250,229 | | |
19
Mairs & Power Balanced Fund
SCHEDULE OF INVESTMENTS (continued) December 31, 2021
Par Value | | Security Description | | Fair Value | |
| | | FIXED INCOME SECURITIES (continued) | |
| | | CORPORATE BONDS (continued) | |
| | | INFORMATION TECHNOLOGY (continued) | |
$ | 3,000,000 | | | Intel Corp | | | 4.000 | % | | 12/15/32 | | $ | 3,521,919 | | |
| | 2,000,000 | | | Leidos Inc | | | 5.500 | % | | 07/01/33 | | | 2,412,640 | | |
| | 1,000,000 | | | Broadcom Inc (g) | | | 3.469 | % | | 04/15/34 | | | 1,047,364 | | |
| | 1,500,000 | | | Western Union Co/The | | | 6.200 | % | | 11/17/36 | | | 1,853,760 | | |
| | 3,000,000 | | | Oracle Corp | | | 3.600 | % | | 04/01/40 | | | 3,020,440 | | |
| | 1,000,000 | | | Dell, Inc. | | | 5.400 | % | | 09/10/40 | | | 1,131,250 | | |
| | 1,000,000 | | | Analog Devices Inc | | | 2.800 | % | | 10/01/41 | | | 1,014,414 | | |
| | 570,000 | | | Discovery Communications LLC | | | 4.950 | % | | 05/15/42 | | | 674,209 | | |
| | 2,000,000 | | | Motorola Solutions Inc | | | 5.500 | % | | 09/01/44 | | | 2,610,659 | | |
| | | | 39,920,104 | | |
| | | MATERIALS 2.0% | |
| | 750,000 | | | RPM International Inc | | | 3.450 | % | | 11/15/22 | | | 761,835 | | |
| | 756,000 | | | Eastman Chemical Co | | | 3.800 | % | | 03/15/25 | | | 807,625 | | |
| | 865,000 | | | Union Carbide Corp | | | 7.500 | % | | 06/01/25 | | | 1,018,155 | | |
| | 2,000,000 | | | DowDuPont Inc | | | 4.493 | % | | 11/15/25 | | | 2,210,906 | | |
| | 200,000 | | | Worthington Industries Inc | | | 4.550 | % | | 04/15/26 | | | 219,128 | | |
| | 1,500,000 | | | Cabot Corp | | | 3.400 | % | | 09/15/26 | | | 1,572,616 | | |
| | 782,000 | | | HB Fuller Co | | | 4.000 | % | | 02/15/27 | | | 822,038 | | |
| | 3,200,000 | | | HB Fuller Co | | | 4.250 | % | | 10/15/28 | | | 3,296,000 | | |
| | 4,000,000 | | | Cabot Corp | | | 4.000 | % | | 07/01/29 | | | 4,367,491 | | |
| | 1,175,000 | | | Albemarle Wodgina Pty Ltd (b) | | | 3.450 | % | | 11/15/29 | | | 1,218,887 | | |
| | 1,250,000 | | | Dow Chemical Co/The | | | 4.250 | % | | 10/01/34 | | | 1,444,750 | | |
| | 1,000,000 | | | Alcoa Inc | | | 5.950 | % | | 02/01/37 | | | 1,182,500 | | |
| | 1,000,000 | | | Newmont Mining Corp | | | 4.875 | % | | 03/15/42 | | | 1,255,810 | | |
| | 325,000 | | | Albemarle Corp | | | 5.450 | % | | 12/01/44 | | | 423,974 | | |
| | 250,000 | | | Steel Dynamics Inc | | | 3.250 | % | | 10/15/50 | | | 252,914 | | |
| | | | 20,854,629 | | |
| | | REAL ESTATE 0.0% | |
| | 350,000 | | | CBRE Services Inc | | | 4.875 | % | | 03/01/26 | | | 391,357 | | |
| | | UTILITIES 0.7% | |
| | 75,000 | | | National Fuel Gas Co | | | 3.750 | % | | 03/01/23 | | | 76,656 | | |
| | 250,000 | | | Jersey Central Power & Light Co (g) | | | 4.300 | % | | 01/15/26 | | | 271,234 | | |
| | 2,000,000 | | | National Fuel Gas Co | | | 3.950 | % | | 09/15/27 | | | 2,123,228 | | |
| | 500,000 | | | Toledo Edison Co (g) | | | 2.650 | % | | 05/01/28 | | | 507,114 | | |
| | 1,000,000 | | | National Fuel Gas Co | | | 4.750 | % | | 09/01/28 | | | 1,103,956 | | |
| | 1,165,000 | | | Duke Energy Progress LLC | | | 5.700 | % | | 04/01/35 | | | 1,517,712 | | |
| | 1,021,000 | | | Northern Natural Gas Co (g) | | | 4.100 | % | | 09/15/42 | | | 1,169,698 | | |
| | | | 6,769,598 | | |
| | | TOTAL CORPORATE BONDS | | | 263,566,484 | | |
20
Mairs & Power Balanced Fund
SCHEDULE OF INVESTMENTS (continued) December 31, 2021
Par Value | | Security Description | | Fair Value | |
| | | FIXED INCOME SECURITIES (continued) | |
| | | MUNICIPAL BONDS 1.6% | |
$ | 650,000 | | | Glendale Community College District/CA | | | 2.113 | % | | 08/01/31 | | $ | 642,334 | | |
| | 500,000 | | | Socorro Independent School District | | | 2.125 | % | | 08/15/31 | | | 506,165 | | |
| | 920,000 | | | Pierre School District No 32-2 | | | 2.040 | % | | 08/01/33 | | | 899,178 | | |
| | 500,000 | | | Redondo Beach Unified School District | | | 2.040 | % | | 08/01/34 | | | 490,662 | | |
| | 400,000 | | | County of Hennepin MN | | | 4.800 | % | | 12/01/35 | | | 514,747 | | |
| | 500,000 | | | DeKalb Kane & LaSalle Counties Etc Community
College District No 523 Kishwaukee | | | 3.017 | % | | 02/01/36 | | | 516,746 | | |
| | 305,000 | | | State of California | | | 4.600 | % | | 04/01/38 | | | 351,101 | | |
| | 1,000,000 | | | Crowley Independent School District | | | 3.010 | % | | 08/01/38 | | | 1,026,500 | | |
| | 500,000 | | | Idaho Bond Bank Authority | | | 2.354 | % | | 09/15/38 | | | 496,148 | | |
| | 850,000 | | | Worthington Independent School District No 518 | | | 3.300 | % | | 02/01/39 | | | 893,298 | | |
| | 610,000 | | | Rockwall Independent School District | | | 3.091 | % | | 02/15/39 | | | 635,865 | | |
| | 750,000 | | | Allen Independent School District | | | 3.148 | % | | 02/15/39 | | | 780,591 | | |
| | 1,000,000 | | | Pierce County School District No 10 Tacoma | | | 2.357 | % | | 12/01/39 | | | 978,903 | | |
| | 945,000 | | | City of Minnetonka MN | | | 3.050 | % | | 02/01/40 | | | 990,677 | | |
| | 885,000 | | | Massachusetts Development Finance Agency | | | 2.550 | % | | 05/01/40 | | | 865,237 | | |
| | 750,000 | | | Woodbury County Law Enforcement Center Authority | | | 3.090 | % | | 06/01/40 | | | 771,459 | | |
| | 505,000 | | | Village of Ashwaubenon WI | | | 2.970 | % | | 06/01/40 | | | 528,673 | | |
| | 300,000 | | | Desert Community College District | | | 2.457 | % | | 08/01/40 | | | 282,488 | | |
| | 800,000 | | | Utah Transit Authority | | | 3.443 | % | | 12/15/42 | | | 834,050 | | |
| | 500,000 | | | BAC Capital Trust XIV (f) (h) | | | 4.000 | % | | 03/15/43 | | | 497,732 | | |
| | 600,000 | | | San Diego Community College District | | | 3.336 | % | | 08/01/43 | | | 622,167 | | |
| | 1,000,000 | | | Borough of Naugatuck CT | | | 3.090 | % | | 09/15/46 | | | 1,012,820 | | |
| | 1,000,000 | | | Michigan State University | | | 4.496 | % | | 08/15/48 | | | 1,147,868 | | |
| | | | 16,285,409 | | |
| | | ASSET BACKED SECURITIES 1.5% | |
| | 205,854 | | | United Airlines 2014-1 Class B Pass Through Trust | | | 4.750 | % | | 10/11/23 | | | 207,651 | | |
| | 35,298 | | | Continental Airlines 2007-1 Class A Pass Through Trust | | | 5.983 | % | | 10/19/23 | | | 35,573 | | |
| | 72,512 | | | Southwest Airlines Co 2007-1 Pass Through Trust | | | 6.150 | % | | 02/01/24 | | | 73,633 | | |
| | 33,351 | | | United Airlines 2014-2 Class B Pass Through Trust | | | 4.625 | % | | 03/03/24 | | | 33,725 | | |
| | 261,444 | | | American Airlines 2014-1 Class B Pass Through Trust | | | 4.375 | % | | 04/01/24 | | | 260,043 | | |
| | 1,000,000 | | | United Airlines 2015-1 Class A Pass Through Trust | | | 3.700 | % | | 06/01/24 | | | 1,013,583 | | |
| | 328,571 | | | US Airways 2010-1 Class A Pass Through Trust | | | 6.250 | % | | 10/22/24 | | | 334,904 | | |
| | 898,436 | | | Delta Air Lines 2015-1 Class B Pass Through Trust | | | 4.250 | % | | 01/30/25 | | | 924,472 | | |
| | 537,996 | | | American Airlines 2015-2 Class B Pass Through Trust | | | 4.400 | % | | 03/22/25 | | | 528,929 | | |
| | 187,223 | | | US Airways 2011-1 Class A Pass Through Trust | | | 7.125 | % | | 04/22/25 | | | 196,234 | | |
| | 2,067,570 | | | American Airlines 2016-1 Class B Pass Through Trust | | | 5.250 | % | | 07/15/25 | | | 2,047,137 | | |
| | 674,542 | | | Spirit Airlines Pass Through Trust 2015-1B | | | 4.450 | % | | 10/01/25 | | | 682,253 | | |
| | 1,568,262 | | | Hawaiian Airlines 2013-1 Class A Pass Through Certificates | | | 3.900 | % | | 01/15/26 | | | 1,533,656 | | |
21
Mairs & Power Balanced Fund
SCHEDULE OF INVESTMENTS (continued) December 31, 2021
Par Value/Shares | | Security Description | | Fair Value | |
| | | FIXED INCOME SECURITIES (continued) | |
| | | ASSET BACKED SECURITIES (continued) | |
$ | 1,118,220 | | | Continental Airlines 2012-2 Class A Pass Through Trust | | | 4.000 | % | | 04/29/26 | | $ | 1,154,273 | | |
| | 733,260 | | | American Airlines 2017-1 Class B Pass Through Trust | | | 4.950 | % | | 08/15/26 | | | 728,508 | | |
| | 685,607 | | | United Airlines 2013-1 Class A Pass Through Trust | | | 4.300 | % | | 02/15/27 | | | 715,590 | | |
| | 646,466 | | | American Airlines 2016-3 Class B Pass Through Trust | | | 3.750 | % | | 04/15/27 | | | 609,538 | | |
| | 509,611 | | | US Airways 2013-1 Class A Pass Through Trust | | | 3.950 | % | | 05/15/27 | | | 511,847 | | |
| | 549,989 | | | United Airlines 2014-1 Class A Pass Through Trust | | | 4.000 | % | | 10/11/27 | | | 570,876 | | |
| | 460,694 | | | United Airlines 2014-2 Class A Pass Through Trust | | | 3.750 | % | | 03/03/28 | | | 479,640 | | |
| | 1,216,336 | | | American Airlines 2014-1 Class A Pass Through Trust | | | 3.700 | % | | 04/01/28 | | | 1,232,885 | | |
| | 314,513 | | | American Airlines 2015-1 Class A Pass Through Trust | | | 3.375 | % | | 11/01/28 | | | 311,370 | | |
| | 141,980 | | | American Airlines 2015-2 Class AA Pass Through Trust | | | 3.600 | % | | 03/22/29 | | | 144,882 | | |
| | 462,916 | | | American Airlines 2015-2 Class A Pass Through Trust | | | 4.000 | % | | 03/22/29 | | | 439,239 | | |
| | 89,074 | | | Spirit Airlines Pass Through Trust 2015-1A | | | 4.100 | % | | 10/01/29 | | | 90,996 | | |
| | 798,376 | | | British Airways 2018-1 Class A Pass Through Trust (b) (g) | | | 4.125 | % | | 03/20/33 | | | 803,719 | | |
| | | | 15,665,156 | | |
| | | U.S. GOVERNMENT OBLIGATIONS 1.8% | |
| | 1,000,000 | | | United States Treasury Note/Bond | | | 0.250 | % | | 03/15/24 | | | 988,203 | | |
| | 3,000,000 | | | United States Treasury Note/Bond | | | 0.750 | % | | 03/31/26 | | | 2,944,570 | | |
| | 1,000,000 | | | United States Treasury Note/Bond | | | 0.750 | % | | 04/30/26 | | | 980,703 | | |
| | 1,000,000 | | | United States Treasury Note/Bond | | | 1.125 | % | | 10/31/26 | | | 993,985 | | |
| | 1,000,000 | | | United States Treasury Note/Bond | | | 1.250 | % | | 06/30/28 | | | 990,586 | | |
| | 1,000,000 | | | United States Treasury Note/Bond | | | 1.000 | % | | 07/31/28 | | | 974,375 | | |
| | 7,000,000 | | | United States Treasury Note/Bond | | | 2.625 | % | | 02/15/29 | | | 7,573,945 | | |
| | 2,000,000 | | | United States Treasury Note/Bond | | | 3.000 | % | | 02/15/49 | | | 2,468,828 | | |
| | | | 17,915,195 | | |
| | TOTAL FIXED INCOME SECURITIES
(cost $295,719,891) | | $ | 313,432,244 | | |
| | | COMMON STOCKS 67.4% | |
| | | COMMUNICATION SERVICES 5.9% | |
| | 72,000 | | | Activision Blizzard Inc | | | | | | | | | | $ | 4,790,160 | | |
| | 16,250 | | | Alphabet Inc (a) | | | | | | | | | | | 47,020,837 | | |
| | 53,000 | | | Walt Disney Co/The (a) | | | | | | | | | | | 8,209,170 | | |
| | | | 60,020,167 | | |
| | | CONSUMER DISCRETIONARY 2.4% | |
| | 42,000 | | | Home Depot Inc/The | | | | | | | | | | | 17,430,420 | | |
| | 32,000 | | | Target Corp | | | | | | | | | | | 7,406,080 | | |
| | | | 24,836,500 | | |
22
Mairs & Power Balanced Fund
SCHEDULE OF INVESTMENTS (continued) December 31, 2021
Shares | | Security Description | | Fair Value | |
| | | COMMON STOCKS (continued) | |
| | | CONSUMER STAPLES 4.0% | |
| | 63,000 | | | Hershey Co/The | | $ | 12,188,610 | | |
| | 369,000 | | | Hormel Foods Corp | | | 18,010,890 | | |
| | 135,000 | | | Sysco Corp | | | 10,604,250 | | |
| | | | 40,803,750 | | |
| | | FINANCIALS 7.2% | |
| | 64,000 | | | American Express Co | | | 10,470,400 | | |
| | 125,000 | | | JPMorgan Chase & Co | | | 19,793,750 | | |
| | 78,000 | | | Principal Financial Group Inc | | | 5,641,740 | | |
| | 436,000 | | | US Bancorp/MN | | | 24,490,120 | | |
| | 274,000 | | | Wells Fargo & Co | | | 13,146,520 | | |
| | | | 73,542,530 | | |
| | | HEALTH CARE 16.3% | |
| | 185,000 | | | Abbott Laboratories | | | 26,036,900 | | |
| | 62,000 | | | Baxter International Inc | | | 5,322,080 | | |
| | 19,000 | | | Bio-Techne Corp | | | 9,829,460 | | |
| | 215,000 | | | Elanco Animal Health Inc (a) | | | 6,101,700 | | |
| | 94,000 | | | Eli Lilly & Co | | | 25,964,680 | | |
| | 100,000 | | | Johnson & Johnson | | | 17,107,000 | | |
| | 192,000 | | | Medtronic PLC (e) | | | 19,862,400 | | |
| | 111,000 | | | Pfizer Inc | | | 6,554,550 | | |
| | 352,000 | | | Roche Holding AG (d) | | | 18,194,880 | | |
| | 63,000 | | | UnitedHealth Group Inc | | | 31,634,820 | | |
| | | | 166,608,470 | | |
| | | INDUSTRIALS 10.9% | |
| | 37,000 | | | 3M Co | | | 6,572,310 | | |
| | 96,000 | | | CH Robinson Worldwide Inc | | | 10,332,480 | | |
| | 197,000 | | | Donaldson Co Inc | | | 11,674,220 | | |
| | 185,000 | | | Fastenal Co | | | 11,851,100 | | |
| | 217,000 | | | Graco Inc | | | 17,494,540 | | |
| | 23,000 | | | Honeywell International Inc | | | 4,795,730 | | |
| | 195,000 | | | nVent Electric PLC (e) | | | 7,410,000 | | |
| | 15,000 | | | Rockwell Automation Inc | | | 5,232,750 | | |
| | 110,000 | | | Tennant Co | | | 8,914,400 | | |
| | 191,000 | | | Toro Co/The | | | 19,082,810 | | |
| | 40,000 | | | United Parcel Service Inc, Class B | | | 8,573,600 | | |
| | | | 111,933,940 | | |
| | | INFORMATION TECHNOLOGY 14.5% | |
| | 12,000 | | | Automatic Data Processing Inc | | | 2,958,960 | | |
| | 166,000 | | | Corning Inc | | | 6,180,180 | | |
| | 130,000 | | | Fiserv Inc (a) | | | 13,492,700 | | |
| | 35,000 | | | Littelfuse Inc | | | 11,013,800 | | |
23
Mairs & Power Balanced Fund
SCHEDULE OF INVESTMENTS (continued) December 31, 2021
Shares | | Security Description | | Fair Value | |
| | | COMMON STOCKS (continued) | |
| | | INFORMATION TECHNOLOGY (continued) | |
| | 125,000 | | | Microsoft Corp | | $ | 42,040,000 | | |
| | 71,000 | | | Motorola Solutions Inc | | | 19,290,700 | | |
| | 112,000 | | | QUALCOMM Inc | | | 20,481,440 | | |
| | 14,000 | | | salesforce.com Inc (a) | | | 3,557,820 | | |
| | 54,000 | | | Texas Instruments Inc | | | 10,177,380 | | |
| | 90,000 | | | Visa Inc | | | 19,503,900 | | |
| | | | 148,696,880 | | |
| | | MATERIALS 5.5% | |
| | 112,000 | | | Ecolab Inc | | | 26,274,080 | | |
| | 160,000 | | | HB Fuller Co | | | 12,960,000 | | |
| | 49,000 | | | Sherwin-Williams Co/The | | | 17,255,840 | | |
| | | | 56,489,920 | | |
| | | UTILITIES 0.7% | |
| | 104,000 | | | Xcel Energy Inc | | | 7,040,800 | | |
| | | | TOTAL COMMON STOCKS
(cost $308,912,689) | | $ | 689,972,957 | | |
| | | SHORT-TERM INVESTMENTS 1.8% | |
| 17,966,639 | | | First American Government Obligations Fund, Class X, 0.026% (c)
(cost $17,966,639) | | $ | 17,966,639 | | |
| | | | TOTAL INVESTMENTS 99.8%
(cost $622,599,219) | | $ | 1,021,371,840 | | |
| | | | | OTHER ASSETS AND LIABILITIES (NET) 0.2% | | | 1,579,327 | | |
| | | | | TOTAL NET ASSETS 100.0% | | $ | 1,022,951,167 | | |
(a) Non-income producing.
(b) Foreign security denominated in U.S. dollars. As of December 31, 2021, these securities represented $8,939,747 or 0.9% of total net assets.
(c) The rate quoted is the annualized seven-day effective yield as of December 31, 2021.
(d) American Depositary Receipt.
(e) Issuer headquartered overseas but considered domestic. The Adviser defines foreign issuers as those whose operational leadership or headquarters is located in a foreign country; provided, however, if an issuer is believed by the Adviser to be headquartered in a jurisdiction primarily for tax purposes, the Adviser will consider the following additional factors: 1) the location of the primary exchange trading its securities; 2) where it derives the majority of its revenues; and/or 3) where it earns the majority of its profits.
(f) Step Bonds – Securities for which the coupon rate of interest will adjust on specified future date(s). The rate disclosed represents the coupon rate in effect as of December 31, 2021.
24
Mairs & Power Balanced Fund
SCHEDULE OF INVESTMENTS (continued) December 31, 2021
(g) Securities exempt from registration under Rule 144A of the Securities Act of 1933. These securities may be resold in transactions exempt from registration, normally to qualified institutional buyers. These securities have been determined to be liquid under the Fund's liquidity risk management program. As of December 31, 2021, these securities represented $13,577,330 or 1.3% of total net assets.
(h) Perpetual maturity, date shown, if applicable, represents next contractual call date.
The Global Industry Classification Standard (GICS®) was developed by and/or is the exclusive property of MSCI, Inc. and Standard & Poor's Financial Services LLC ("S&P"). GICS is a service mark of MSCI, Inc. and S&P and has been licensed for use by the Adviser.
See accompanying Notes to Financial Statements.
25
MAIRS & POWER SMALL CAP FUND (unaudited)
To Our Shareholders: December 31, 2021
In the fourth quarter, the Mairs & Power Small Cap Fund was up 7.03%, while its benchmark, the S&P Small Cap 600 Total Return (TR) Index, rose 5.64% and its peer group, the Morningstar U.S. Fund Small Blend category, was up 5.44% for the quarter. For the year, the Fund gained 26.00% in 2021, just slightly behind the S&P 600, which was up 26.82% for the year, but ahead of its Morningstar peer group, which was up 23.83%. The fourth quarter capped off a strong year for small cap stocks. Stock selection was the main driver of Fund outperformance in the quarter, and it was also the chief reason why we kept close to the benchmark for the year.
Case in point: We saw our selection of CMC Materials (CCMP) pay off handsomely in December when it agreed to be acquired by Entegris (ENTG) for $6.5 billion, a deal that represented a 38% premium for shareholders. CMC has a strong core business supplying materials in the semiconductor manufacturing process called slurries. The Fund's position had grown over time as the company has struggled with an acquisition it made in 2018, leaving the stock at a very good value. The Fund was patiently waiting for these issues to be corrected but Entegris saw the value and brought forward a quicker resolution. The acquisition provided a good outcome for CCMP shareholders, and we expect CMC will be better run as part of the Entegris portfolio.
The Fund also benefited from its overweight to Financials. Attractive valuations for banks, along with strong execution and the prospect of higher interest rates, drove much of this sector's performance in 2021. Our stock selection was also strong – Wintrust (WTFC), and Cullen/Frost (CFR) were two Financial holdings that performed particularly well last year.
Bio-Techne (TECH) was another bright spot for the Fund in 2021. This Healthcare company manufactures consumables such as proteins and reagents, as well as other products that are used by researchers in academia, pharma, and biotech. It is well positioned as pharmaceutical companies shift more towards the production of biologic drugs. TECH was up 63% in 2021, an especially remarkable performance considering that the Healthcare sector as a whole rose only 6% last year.
MAIRS & POWER SMALL CAP FUND CONTRIBUTORS
Year-to-Date 12/31/2020 – 12/31/2021
| Top Contributors | | Bottom Contributors | |
nVent Electric Plc. | | | 63.16 | % | | Proto Labs, Inc. | | | -66.53 | % | |
Bio-Techne Corporation | | | 62.92 | % | | Hyliion Hldings Corp. Class A | | | -62.38 | % | |
Wintrust Financial Corporation | | | 48.67 | % | | Cardiovascular Systems, Inc. | | | -57.08 | % | |
Cullen/Frost Bankers, Inc. | | | 44.53 | % | | Cambium Networks Corp. | | | -48.46 | % | |
Workiva Inc. Class A | | | 42.43 | % | | Polaris Inc. | | | -14.16 | % | |
Top and bottom contributors are securities that were selected based on their relative contribution compared to the S&P 600 TR Index as of December 31, 2021. Relative contribution considers average daily weightings for each security and whether the security was added or eliminated from the Fund during period. The performance number shown is total return of the security for the period. Total return is amount of value an investor earns from a security over a specific period and when distributions are reinvested. Past performance does not guarantee future results.
On the other hand, another Healthcare holding, Cardiovascular Systems (CSII), was one of the Fund's biggest laggards. This is a medical device company whose orbital atherectomy technology is used to treat patients with coronary and vascular conditions. A new competitor has gained significant traction in the market, which
26
MAIRS & POWER SMALL CAP FUND (unaudited) (continued)
could hurt Cardiovascular Systems' growth prospects. We believe that the company still has a big market opportunity, and its technology appears to be the best treatment option for severe cases. But it has underperformed for the last year and a half, and we are looking for the company to improve its sales per procedure.
Another detractor to Fund performance in 2021 was Cambium Networks (CMBM), an Illinois-based provider of wireless broadband networking infrastructure (antennas, receivers, routers, switches) used by Internet service providers. It focuses primarily on rural markets, and it should benefit from the 5G network upgrade and increased government funding for rural broadband. Cambium has been hurt by supply chain snarls, which have impacted its product availability and could take a year to normalize. But strong demand should allow the company to survive and thrive.
The Fund added two new positions in the fourth quarter: One is CVRx (CVRX), a Minneapolis-based Healthcare company. Its Barostim neuromodulation device is used to help treat patients suffering from cardiovascular disease, particularly those with heart failure. CVRx has a $2.9 billion addressable market, one that could develop into an even larger opportunity for the Company.
The other is Alerus (ALRS), a North Dakota-based Financial company that has been expanding in the Twin Cities market. About 40% of its business is tied to traditional banking, and it also has strong fee-based franchises across wealth management and mortgage banking. In December, Alerus acquired Arizona-based Metro Phoenix Bank, which increases the Company's base in the fastest-growing metropolitan area in the U.S.
With the Fund coming off a strong fourth quarter, we believe that the small cap market is beginning to demonstrate some resilience of its own. Because they don't have the purchasing power of larger companies, small cap companies have been hit particularly hard by supply chain problems. But we're seeing some improvement in this situation, which is one of the chief reasons why we believe the growth outlook for small caps over the next couple of years is slightly ahead of the broader market. Compared to large and midsize caps, small caps' valuations remain low, a situation that offers the Fund attractive buying opportunities.
Our efforts to identify the best of those opportunities will be bolstered by Mike Marzolf, who joined Mairs & Power as vice president, investment manager, and effective January 1, 2022, co-manager of the Small Cap Fund. Mike is a seasoned professional with 35 years of experience in financial services. With the addition of his expertise in research, investment, and portfolio management across all industry sectors, the Fund's team is stronger and deeper than ever.
One final note: You should have received by mail a proxy statement and a ballot from Mairs & Power asking you to vote on a proposed reorganization of the Small Cap Fund. This reorganization would transition the Fund into a series of Trust for Professional Managers (TPM). We expect that reorganizing into TPM would decrease the Fund's expenses while allowing it greater access to legal, research, and operational resources. There would be no changes to the Fund's investment objectives, principal investment strategies, principal risks, or portfolio management team. The boards of Mairs & Power and TPM have both unanimously approved this reorganization. We encourage you to also vote in favor of this reorganization, which will benefit you, the Fund shareholder.
Andrew R. Adams
Lead Manager | | Allen D. Steinkopf
Co-Manager | | Chris D. Strom
Co-Manager | |
27
MAIRS & POWER SMALL CAP FUND (unaudited) (continued)
The Fund's investment objective, risks, charges and expenses must be considered carefully before investing. The summary prospectus or full prospectus contains this and other important information about the Fund and they may be obtained by calling Shareholder Services at (800) 304-7404 or by visiting www.mairsandpower.com. Read the summary prospectus or full prospectus carefully before investing.
All holdings in the portfolio are subject to change without notice and may or may not represent current or future portfolio composition. The mention of specific securities is not intended as a recommendation or an offer of a particular security, nor is it intended to be a solicitation for the purchase or sale of any security.
All investments have risks. The Small Cap Fund is designed for long-term investors. Equity investments are subject to market fluctuations and the Fund's share price can fall because of weakness in the broad market, a particular industry or specific holdings. Investments in small and midcap companies generally are more volatile. International investing risks include among others political, social or economic instability, difficulty in predicting international trade patterns, taxation and foreign trading practices, and greater fluctuations in price than U.S. corporations. The Fund may invest in initial public offerings by small cap companies, which can involve greater risk than investments in companies that are already publicly traded.
This commentary includes forward-looking statements such as economic predictions and portfolio manager opinions. The statements are subject to change at any time based on market and other conditions. No predictions, forecasts, outlooks, expectations or beliefs are guaranteed.
S&P 600 Small Cap Total Return (S&P 600) is an index of small company stocks managed by Standard & Poor's Financial Services LLC that covers a broad range of small cap stocks in the U.S. The index is weighted according to market capitalization and covers about 3-4% of the total market for equities in the U.S. It tracks both the capital gains of a group of stocks over time and assumes that any cash distributions, such as dividends, are reinvested back into the index. It is not possible to invest directly in an index.
Morningstar Small Blend Category, as defined by Morningstar are funds that invest in stocks in the bottom 10% of the capitalization of the U.S. equity market which are defined as small cap. The blend style is assigned to funds where neither growth nor value characteristics predominate.
Russell 2000 TR Index is a small-cap stock market index of the smallest 2,000 stocks in the Russell 3000 Index. It is not possible to invest directly in an index.
28
Mairs & Power Small Cap Fund
PERFORMANCE INFORMATION (unaudited) December 31, 2021
Investment performance since commencement of operations (through December 31, 2021)
This chart illustrates the performance of a hypothetical $10,000 investment made in the Fund since commencement of operations.

Average annual total returns for periods ended December 31, 2021
| | | 1 Year | | 3 Year | | 5 Year | | 10 Year | | Since Inception(2) | |
Mairs & Power Small Cap Fund | | | 26.00 | % | | | 18.41 | % | | | 10.72 | % | | | 14.59 | % | | | 15.27 | % | |
S&P Small Cap 600 Total Return Index(1) | | | 26.82 | % | | | 20.11 | % | | | 12.42 | % | | | 14.50 | % | | | 14.97 | % | |
Performance data quoted represents past performance and does not guarantee future results. All performance information shown includes the reinvestment of dividend and capital gain distributions, but does not reflect the deduction of taxes that a shareholder would pay on Fund distributions or the redemption of Fund shares. The investment return and principal value of an investment will fluctuate so that an investor's shares, when redeemed, may be worth more or less than their original cost. Current performance of the Fund may be lower or higher than the performance quoted. For the most recent month-end performance figures, visit the Fund's website at www.mairsandpower.com or call Shareholder Services at (800) 304-7404. Per the Prospectus dated April 30, 2021, as supplemented to date, the expense ratio for the Fund is 0.94%.
(1) The S&P Small Cap 600 Total Return Index is an index of small-company stocks managed by Standard & Poor's Financial Services LLC that covers a broad range of small cap stocks in the U.S. The index is weighted according to market capitalization and covers about 3-4% of the total market for equities in the U.S. It tracks both the capital gains of a group of stocks over time and assumes that any cash distributions, such as dividends, are reinvested back into the index. It is not possible to invest directly in an index.
(2) Since inception performance is as of August 11, 2011, which is the offering date of the Small Cap Fund.
29
Mairs & Power Small Cap Fund
FUND INFORMATION (unaudited) December 31, 2021
Portfolio Managers
Andrew R. Adams, CFA, lead manager since August 20, 2021, co-manager from April 1, 2019 to August 20, 2021, lead manager from 2011 to April 1, 2019, University of Wisconsin-Madison, MS Finance 1997
Allen D. Steinkopf, CFA, co-manager since August 20, 2021, lead manager from April 1, 2019 to August 20, 2021, co-manager from January 1, 2015 through April 1, 2019, University of Minnesota, MBA Finance 1986
Christopher D. Strom, CFA, co-manager since January 1, 2021, University of Wisconsin-Madison, MBA Applied Security Analysis 2010
General Information
Fund Symbol | | | MSCFX | | |
Net Asset Value (NAV) Per Share | | $ | 32.69 | | |
Expense Ratio | | | 0.95 | % | |
Portfolio Turnover Rate | | | 21.45 | % | |
Sales Charge | | | None1 | | |
Fund Inception Year | | | 2011 | | |
Portfolio Composition
Top Ten Portfolio Holdings
(Percent of Total Net Assets)2
CMC Materials Inc | | | 4.4 | % | |
Littelfuse Inc | | | 4.2 | | |
Oshkosh Corp | | | 4.1 | | |
Wintrust Financial Corp | | | 4.0 | | |
Inspire Medical Systems Inc | | | 3.6 | | |
HB Fuller Co | | | 3.6 | | |
Glacier Bancorp Inc | | | 3.5 | | |
Tennant Co | | | 3.5 | | |
Cullen/Frost Bankers Inc | | | 3.4 | | |
AAR Corp | | | 3.4 | | |
Portfolio Diversification
(Percent of Total Net Assets)
Common Stocks 100.1% | |
Industrials | | | 24.7 | % | |
Information Technology | | | 22.4 | | |
Financials | | | 17.0 | | |
Health Care | | | 13.2 | | |
Consumer Discretionary | | | 6.3 | | |
Consumer Staples | | | 4.6 | | |
Utilities | | | 3.7 | | |
Materials | | | 3.6 | | |
Communication Services | | | 2.3 | | |
Real Estate | | | 2.3 | | |
Short-term Investments (0.1)%3 | | | (0.1 | ) | |
| | | | 100.0 | % | |
1 Although the Fund is no-load, investment management fees and other expenses still apply.
2 All holdings in the portfolio are subject to change without notice and may or may not represent current or future portfolio composition. The mention of specific securities is not intended as a recommendation or offer for a particular security, nor is it intended to be a solicitation for the purchase or sale of any security.
3 Represents short-term investments and other assets and liabilities (net).
The Schedule of Investments and portfolio diversification utilize the Global Industry Classification Standard (GICS®) which was developed by and/or is the exclusive property of MSCI, Inc. and Standard & Poor's Financial Services LLC ("S&P"). GICS is a service mark of MSCI, Inc. and S&P and has been licensed for use by the Adviser.
30
Mairs & Power Small Cap Fund
SCHEDULE OF INVESTMENTS December 31, 2021
Shares | | Security Description | | Fair Value | |
| | | COMMON STOCKS 100.1% | |
| | | COMMUNICATION SERVICES 2.3% | |
| | 553,623 | | | Marcus Corp/The (a) | | $ | 9,887,707 | | |
| | | CONSUMER DISCRETIONARY 6.3% | |
| | 139,380 | | | Gentherm Inc (a) | | | 12,112,122 | | |
| | 54,400 | | | Polaris Inc | | | 5,979,104 | | |
| | 112,245 | | | Sleep Number Corp (a) | | | 8,597,967 | | |
| | | | 26,689,193 | | |
| | | CONSUMER STAPLES 4.6% | |
| | 68,900 | | | Casey's General Stores Inc | | | 13,597,415 | | |
| | 71,600 | | | MGP Ingredients Inc | | | 6,085,284 | | |
| | | | 19,682,699 | | |
| | | FINANCIALS 17.0% | |
| | 57,300 | | | Alerus Financial Corp | | | 1,677,744 | | |
| | 309,261 | | | Associated Banc-Corp | | | 6,986,206 | | |
| | 116,700 | | | Cullen/Frost Bankers Inc | | | 14,712,369 | | |
| | 264,500 | | | Glacier Bancorp Inc | | | 14,997,150 | | |
| | 249,800 | | | Great Western Bancorp Inc | | | 8,483,208 | | |
| | 154,078 | | | QCR Holdings Inc | | | 8,628,368 | | |
| | 188,200 | | | Wintrust Financial Corp | | | 17,092,324 | | |
| | | | 72,577,369 | | |
| | | HEALTH CARE 13.2% | |
| | 24,900 | | | Bio-Techne Corp | | | 12,881,766 | | |
| | 161,715 | | | Cardiovascular Systems Inc (a) | | | 3,037,008 | | |
| | 110,700 | | | Catalent Inc (a) | | | 14,172,921 | | |
| | 80,645 | | | CVRx Inc (a) | | | 986,288 | | |
| | 67,600 | | | Inspire Medical Systems Inc (a) | | | 15,552,056 | | |
| | 427,063 | | | IntriCon Corp (a) | | | 6,905,609 | | |
| | 59,127 | | | SurModics Inc (a) | | | 2,846,965 | | |
| | | | 56,382,613 | | |
| | | INDUSTRIALS 24.7% | |
| | 375,878 | | | AAR Corp (a) | | | 14,670,518 | | |
| | 191,500 | | | AZEK Co Inc/The (a) | | | 8,854,960 | | |
| | 120,404 | | | Donaldson Co Inc | | | 7,135,141 | | |
| | 348,210 | | | Enerpac Tool Group Corp | | | 7,061,699 | | |
| | 13,872 | | | Generac Holdings Inc (a) | | | 4,881,834 | | |
| | 61,000 | | | Graco Inc | | | 4,917,820 | | |
| | 106,000 | | | Hub Group Inc, Class A (a) | | | 8,929,440 | | |
| | 170,300 | | | Hyliion Holdings Corp (a) | | | 1,055,860 | | |
| | 352,700 | | | nVent Electric PLC (d) | | | 13,402,600 | | |
31
Mairs & Power Small Cap Fund
SCHEDULE OF INVESTMENTS (continued) December 31, 2021
Shares | | Security Description | | Fair Value | |
| | | COMMON STOCKS 100.1% | |
| | | INDUSTRIALS (continued) | |
| | 155,000 | | | Oshkosh Corp | | $ | 17,470,050 | | |
| | 43,200 | | | Proto Labs Inc (a) | | | 2,218,320 | | |
| | 183,051 | | | Tennant Co | | | 14,834,453 | | |
| | | | 105,432,695 | | |
| | | INFORMATION TECHNOLOGY 22.4% | |
| | 131,567 | | | Cambium Networks Corp (a) (b) | | | 3,372,062 | | |
| | 98,800 | | | CMC Materials Inc | | | 18,938,972 | | |
| | 74,678 | | | CyberOptics Corp (a) | | | 3,472,527 | | |
| | 383,029 | | | Digi International Inc (a) | | | 9,411,023 | | |
| | 96,400 | | | Envestnet Inc (a) | | | 7,648,376 | | |
| | 348,350 | | | Jamf Holding Corp (a) | | | 13,240,783 | | |
| | 56,800 | | | Littelfuse Inc | | | 17,873,824 | | |
| | 98,600 | | | Plexus Corp (a) | | | 9,454,754 | | |
| | 136,790 | | | SkyWater Technology Inc (a) | | | 2,218,734 | | |
| | 76,780 | | | Workiva Inc (a) | | | 10,019,022 | | |
| | | | 95,650,077 | | |
| | | MATERIALS 3.6% | |
| | 191,300 | | | HB Fuller Co | | | 15,495,300 | | |
| | | REAL ESTATE 2.3% | |
| | 528,900 | | | Physicians Realty Trust | | | 9,959,187 | | |
| | | UTILITIES 3.7% | |
| | 121,700 | | | Black Hills Corp | | | 8,588,369 | | |
| | 127,300 | | | NorthWestern Corp | | | 7,276,468 | | |
| | | | 15,864,837 | | |
| | | | TOTAL COMMON STOCKS
(cost $268,412,167) | | $ | 427,621,677 | | |
| | | SHORT-TERM INVESTMENTS 0.1% | |
| 369,202 | | | First American Government Obligations Fund, Class X, 0.026% (c)
(cost $369,202) | | $ | 369,202 | | |
| | | | TOTAL INVESTMENTS 100.2%
(cost $268,781,369) | | $ | 427,990,879 | | |
| | | | | OTHER ASSETS AND LIABILITIES (NET) (0.2)% | | | (734,265 | ) | |
| | | | | TOTAL NET ASSETS 100.0% | | $ | 427,256,614 | | |
(a) Non-income producing.
32
Mairs & Power Small Cap Fund
SCHEDULE OF INVESTMENTS (continued) December 31, 2021
(b) Foreign security denominated in U.S. dollars. As of December 31, 2021, these securities represented $3,372,062 or 0.8% of total net assets.
(c) The rate quoted is the annualized seven-day effective yield as of December 31, 2021.
(d) Issuer headquartered overseas but considered domestic. The Adviser defines foreign issuers as those whose operational leadership or headquarters is located in a foreign country; provided, however, if an issuer is believed by the Adviser to be headquartered in a jurisdiction primarily for tax purposes, the Adviser will consider the following additional factors: 1) the location of the primary exchange trading its securities; 2) where it derives the majority of its revenues; and/or 3) where it earns the majority of its profits.
The Global Industry Classification Standard (GICS®) was developed by and/or is the exclusive property of MSCI, Inc. and Standard & Poor's Financial Services LLC ("S&P"). GICS is a service mark of MSCI, Inc. and S&P and has been licensed for use by the Adviser.
See accompanying Notes to Financial Statements.
33
STATEMENTS OF ASSETS AND LIABILITIES December 31, 2021
| | | Mairs & Power
Growth Fund | | Mairs & Power
Balanced Fund | | Mairs & Power
Small Cap Fund | |
ASSETS | |
| Investments, at fair value (Note 1) *: | |
Unaffiliated securities * | | $ | 5,872,515,549 | | | $ | 1,021,371,840 | | | $ | 427,990,879 | | |
| Affiliated securities (Note 5) * | | | 76,985,245 | | | | - | | | | - | | |
| | | | 5,949,500,794 | | | | 1,021,371,840 | | | | 427,990,879 | | |
Receivable for Fund shares sold | | | 1,478,669 | | | | 1,093,494 | | | | 751,752 | | |
Receivable for securities sold | | | - | | | | 701,255 | | | | 610,494 | | |
Dividends and interest receivable | | | 5,975,867 | | | | 3,852,846 | | | | 65,071 | | |
Prepaid expenses and other assets | | | 77,563 | | | | 28,791 | | | | 19,964 | | |
| | | | 5,957,032,893 | | | | 1,027,048,226 | | | | 429,438,160 | | |
LIABILITIES | |
Payable for Fund shares redeemed | | | 3,224,972 | | | | 3,108,978 | | | | 1,793,601 | | |
Payable for securities purchased | | | - | | | | 255,416 | | | | - | | |
| Accrued investment management fees (Note 2) | | | 2,644,488 | | | | 500,636 | | | | 279,804 | | |
Accrued Fund administration fees | | | 261,882 | | | | 50,924 | | | | 23,339 | | |
Accrued audit and tax fees | | | 27,774 | | | | 37,567 | | | | 25,000 | | |
Accrued transfer agent fees | | | 336,572 | | | | 65,252 | | | | 36,205 | | |
Due to Custodian | | | 169,150 | | | | 23,704 | | | | 5,896 | | |
Other accrued fees | | | 206,795 | | | | 54,582 | | | | 17,701 | | |
| | | | 6,871,633 | | | | 4,097,059 | | | | 2,181,546 | | |
NET ASSETS | | $ | 5,950,161,260 | | | $ | 1,022,951,167 | | | $ | 427,256,614 | | |
NET ASSETS CONSIST OF | |
Portfolio capital | | $ | 2,377,800,440 | | | $ | 612,801,686 | | | $ | 260,099,997 | | |
Total distributable earnings | | | 3,572,360,820 | | | | 410,149,481 | | | | 167,156,617 | | |
TOTAL NET ASSETS | | $ | 5,950,161,260 | | | $ | 1,022,951,167 | | | $ | 427,256,614 | | |
Fund shares, par value | | $ | 0.01 | | | $ | 0.01 | | | $ | 0.01 | | |
Authorized | | | unlimited | | | | unlimited | | | | unlimited | | |
Fund shares issued and outstanding | | | 36,604,964 | | | | 8,751,341 | | | | 13,069,886 | | |
Net asset value per share | | $ | 162.55 | | | $ | 116.89 | | | $ | 32.69 | | |
* Cost of investments | |
Cost of unaffiliated securities | | $ | 2,439,869,119 | | | $ | 622,599,219 | | | $ | 268,781,369 | | |
| Cost of affiliated securities (Note 5) | | | 64,383,757 | | | | - | | | | - | | |
| | | $ | 2,504,252,876 | | | $ | 622,599,219 | | | $ | 268,781,369 | | |
See accompanying Notes to Financial Statements.
34
STATEMENT OF OPERATIONS Year Ended December 31, 2021
| | | Mairs & Power
Growth Fund | | Mairs & Power
Balanced Fund | | Mairs & Power
Small Cap Fund | |
INVESTMENT INCOME | |
Income: | |
Dividends from unaffiliated securities * | | $ | 62,925,527 | | | $ | 9,688,892 | | | $ | 4,051,144 | | |
| Dividends from affiliated securities (Note 5) | | | 892,968 | | | | - | | | | - | | |
Interest income | | | - | | | | 11,166,175 | | | | - | | |
TOTAL INCOME | | | 63,818,495 | | | | 20,855,067 | | | | 4,051,144 | | |
Expenses: | |
| Investment management fees (Note 2) | | | 29,931,085 | | | | 5,848,143 | | | | 3,500,392 | | |
Fund administration fees | | | 769,253 | | | | 150,084 | | | | 70,051 | | |
Fund accounting fees | | | 501,326 | | | | 121,537 | | | | 39,482 | | |
| Trustees' fees (Note 2) | | | 294,351 | | | | 53,077 | | | | 22,572 | | |
Transfer agent fees | | | 1,423,311 | | | | 307,961 | | | | 174,965 | | |
Custodian fees | | | 279,713 | | | | 51,378 | | | | 23,474 | | |
Legal and audit fees | | | 161,740 | | | | 72,756 | | | | 47,511 | | |
Printing and mailing fees | | | 106,500 | | | | 13,984 | | | | 16,982 | | |
Other fees | | | 199,918 | | | | 70,889 | | | | 52,650 | | |
TOTAL EXPENSES | | | 33,667,197 | | | | 6,689,809 | | | | 3,948,079 | | |
NET INVESTMENT INCOME | | | 30,151,298 | | | | 14,165,258 | | | | 103,065 | | |
| REALIZED AND UNREALIZED GAIN (Note 4) | |
Net realized gain on investments | |
Unaffiliated issuers | | | 464,820,115 | | | | 56,802,196 | | | | 42,489,046 | | |
| Affiliated issuers (Note 5) | | | - | | | | - | | | | - | | |
| | | 464,820,115 | | | | 56,802,196 | | | | 42,489,046 | | |
Change in net unrealized appreciation
on investments | |
Unaffiliated issuers | | | 883,200,236 | | | | 90,941,913 | | | | 49,431,355 | | |
| Affiliated issuers (Note 5) | | | 10,326,130 | | | | - | | | | - | | |
| | | 893,526,366 | | | | 90,941,913 | | | | 49,431,355 | | |
NET GAIN ON INVESTMENTS | | | 1,358,346,481 | | | | 147,744,109 | | | | 91,920,401 | | |
NET INCREASE IN NET ASSETS FROM
OPERATIONS | | $ | 1,388,497,779 | | | $ | 161,909,367 | | | $ | 92,023,466 | | |
* Net of foreign taxes withheld of: | | $ | 638,197 | | | $ | 64,445 | | | $ | 68 | | |
See accompanying Notes to Financial Statements.
35
Mairs & Power Growth Fund
STATEMENTS OF CHANGES IN NET ASSETS
| | | Year Ended
December 31,
2021 | | Year Ended
December 31,
2020 | |
OPERATIONS | |
Net investment income | | $ | 30,151,298 | | | $ | 48,629,644 | | |
Net realized gain on investments sold | | | 464,820,115 | | | | 406,112,761 | | |
Net change in unrealized appreciation of investments | | | 893,526,366 | | | | 229,630,774 | | |
NET INCREASE IN NET ASSETS FROM OPERATIONS | | | 1,388,497,779 | | | | 684,373,179 | | |
DISTRIBUTIONS TO SHAREHOLDERS | | | (453,637,206 | ) | | | (401,023,020 | ) | |
CAPITAL TRANSACTIONS | |
Proceeds from shares sold | | | 198,856,879 | | | | 170,263,440 | | |
Reinvestment of distributions from net investment income and net
realized gains | | | 421,862,552 | | | | 373,284,465 | | |
Cost of shares redeemed | | | (463,607,896 | ) | | | (602,645,512 | ) | |
INCREASE (DECREASE) IN NET ASSETS FROM CAPITAL
TRANSACTIONS | | | 157,111,535 | | | | (59,097,607 | ) | |
TOTAL INCREASE IN NET ASSETS: | | | 1,091,972,108 | | | | 224,252,552 | | |
NET ASSETS | |
Beginning of year | | | 4,858,189,152 | | | | 4,633,936,600 | | |
End of year | | $ | 5,950,161,260 | | | $ | 4,858,189,152 | | |
FUND SHARE TRANSACTIONS | |
Shares sold | | | 1,275,694 | | | | 1,391,414 | | |
Shares issued for reinvested distributions | | | 2,616,009 | | | | 2,807,457 | | |
Shares redeemed | | | (2,987,997 | ) | | | (4,922,831 | ) | |
NET INCREASE (DECREASE) IN FUND SHARES | | | 903,706 | | | | (723,960 | ) | |
See accompanying Notes to Financial Statements.
36
Mairs & Power Balanced Fund
STATEMENTS OF CHANGES IN NET ASSETS
| | | Year Ended
December 31,
2021 | | Year Ended
December 31,
2020 | |
OPERATIONS | |
Net investment income | | $ | 14,165,258 | | | $ | 17,043,373 | | |
Net realized gain on investments sold | | | 56,802,196 | | | | 26,545,433 | | |
Net change in unrealized appreciation of investments | | | 90,941,913 | | | | 34,469,140 | | |
NET INCREASE IN NET ASSETS FROM OPERATIONS | | | 161,909,367 | | | | 78,057,946 | | |
DISTRIBUTIONS TO SHAREHOLDERS | | | (62,569,410 | ) | | | (38,812,015 | ) | |
CAPITAL TRANSACTIONS | |
Proceeds from shares sold | | | 70,367,342 | | | | 67,159,381 | | |
Reinvestment of distributions from net investment income and net
realized gains | | | 60,674,913 | | | | 37,653,266 | | |
Cost of shares redeemed | | | (102,683,757 | ) | | | (177,633,764 | ) | |
INCREASE (DECREASE) IN NET ASSETS FROM CAPITAL
TRANSACTIONS | | | 28,358,498 | | | | (72,821,117 | ) | |
TOTAL INCREASE (DECREASE) IN NET ASSETS: | | | 127,698,455 | | | | (33,575,186 | ) | |
NET ASSETS | |
Beginning of year | | | 895,252,712 | | | | 928,827,898 | | |
End of year | | $ | 1,022,951,167 | | | $ | 895,252,712 | | |
FUND SHARE TRANSACTIONS | |
Shares sold | | | 613,763 | | | | 696,951 | | |
Shares issued for reinvested distributions | | | 524,235 | | | | 379,070 | | |
Shares redeemed | | | (894,478 | ) | | | (1,881,074 | ) | |
NET INCREASE (DECREASE) IN FUND SHARES | | | 243,520 | | | | (805,053 | ) | |
See accompanying Notes to Financial Statements.
37
Mairs & Power Small Cap Fund
STATEMENTS OF CHANGES IN NET ASSETS
| | | Year Ended
December 31,
2021 | | Year Ended
December 31,
2020 | |
OPERATIONS | |
Net investment income | | $ | 103,065 | | | $ | 1,961,191 | | |
Net realized gain on investments sold | | | 42,489,046 | | | | 8,340,291 | | |
Net change in unrealized appreciation of investments | | | 49,431,355 | | | | 2,553,728 | | |
NET INCREASE IN NET ASSETS FROM OPERATIONS | | | 92,023,466 | | | | 12,855,210 | | |
DISTRIBUTIONS TO SHAREHOLDERS | | | (33,571,862 | ) | | | (7,291,591 | ) | |
CAPITAL TRANSACTIONS | |
Proceeds from shares sold | | | 37,409,155 | | | | 45,059,769 | | |
Reinvestment of distributions from net investment income and net
realized gains | | | 32,598,477 | | | | 7,080,355 | | |
Cost of shares redeemed * | | | (62,797,031 | ) | | | (133,409,765 | ) | |
INCREASE (DECREASE) IN NET ASSETS FROM CAPITAL
TRANSACTIONS | | | 7,210,601 | | | | (81,269,641 | ) | |
TOTAL INCREASE (DECREASE) IN NET ASSETS: | | | 65,662,205 | | | | (75,706,022 | ) | |
NET ASSETS | |
Beginning of year | | | 361,594,409 | | | | 437,300,431 | | |
End of year | | $ | 427,256,614 | | | $ | 361,594,409 | | |
FUND SHARE TRANSACTIONS | |
Shares sold | | | 1,133,844 | | | | 1,972,812 | | |
Shares issued for reinvested distributions | | | 1,018,384 | | | | 252,870 | | |
Shares redeemed | | | (1,927,537 | ) | | | (5,940,772 | ) | |
NET INCREASE (DECREASE) IN FUND SHARES | | | 224,691 | | | | (3,715,090 | ) | |
| * Net of redemption fees of: | | $ | 12,734 | | | $ | 20,023 | | |
See accompanying Notes to Financial Statements.
38
NOTES TO FINANCIAL STATEMENTS December 31, 2021
Note 1 – Organization and Significant Accounting Policies
Mairs & Power Funds Trust (the Trust) is a no-load, diversified, open-end management investment company registered under the Investment Company Act of 1940, as amended (the 1940 Act). Mairs & Power Growth Fund (the Growth Fund), Mairs & Power Balanced Fund (the Balanced Fund) and Mairs & Power Small Cap Fund (the Small Cap Fund) (individually a Fund and collectively the Funds) are series within the Trust. Mairs & Power, Inc. (the Adviser) is the investment adviser of each Fund. The objective of the Growth Fund is to provide shareholders with a diversified portfolio of common stocks, which have the potential for above-average, long-term appreciation. The objective of the Balanced Fund is to provide capital growth, current income and preservation of capital. The objective of the Small Cap Fund is to seek above-average, long-term appreciation. Each Fund is an investment company and accordingly follows the investment company accounting and reporting guidance of the Financial Accounting Standards Board (FASB) Accounting Standard Codification Topic 946 "Financial Services – Investment Companies."
Significant accounting policies of the Funds are as follows:
Security Valuations
Security valuations for each Fund's investments are furnished by independent pricing services that have been approved by the Trust's Board of Trustees (the Board). Investments in listed equity securities are valued at the last quoted sale price on the securities exchange on which such securities are principally traded or at the NASDAQ Official Closing Price if readily available for such securities on each business day. Other equity securities traded in the over-the-counter market and listed equity securities for which no sale was reported on that date are valued at the last quoted bid price. Shares of underlying mutual funds are valued at their respective Net Asset Value (NAV). Debt obligations exceeding 60 days to maturity are valued at the bid price furnished by an independent pricing service. Debt obligations with 60 days or less remaining until maturity may be valued at the bid price furnished by an independent pricing service and in certain circumstances may be valued at their amortized cost, which approximates fair value. Pricing service prices for debt obligations are based on various evaluative and matrix-based methodologies and models that use market inputs such as market transactions, dealer quotations, benchmark yields and issuer, industry and economic events. These techniques generally consider overall market conditions and such factors as yields or prices of bonds of comparable quality, type of issue, coupon, maturity and ratings.
Debt securities for which prices are not available from an independent pricing service, but where an active market exists, are valued using market quotations obtained from two or more dealers that make markets in the securities. When market quotations are not readily available, or when the last quoted sale price is not considered representative of the value of the security if it were to be sold on that day, the security will be valued at fair value as determined in good faith by the Fair Value Committee appointed by the Board, pursuant to procedures approved by the Board.
When determining the value of a security, the Fair Value Committee takes into consideration all indications of value that appear relevant under the particular circumstances, as well as fundamental analytical data relating to the security, the nature and duration of any restrictions on the disposition of the security, and the forces influencing the market in which the security is purchased or sold in addition to other more specific factors that may be applied on a case-by-case basis. Consequently, the value of the security used by a Fund may differ from a quoted or published price for the same security. Fair value pricing involves subjective judgments and it is possible that the fair value determined for the security is materially different than the value that could be realized upon the sale of that security. As of December 31, 2021, no securities were valued using this method.
Fair Valuation Measurements
The Trust has adopted authoritative fair valuation accounting standards, which establish a definition of fair value and set out a hierarchy for measuring fair value. These standards require additional disclosures about the various inputs and valuation techniques used to develop the measurements of fair value and changes in valuation techniques and related inputs during the period. These inputs are summarized in the three broad levels listed below:
• Level 1 – Quoted prices in active markets for identical securities.
39
NOTES TO FINANCIAL STATEMENTS (continued) December 31, 2021
Note 1 – Organization and Significant Accounting Policies (continued)
Fair Valuation Measurements (continued)
• Level 2 – Other significant observable inputs (including quoted prices for similar securities, interest rates, prepayment speeds, credit risk, etc.).
• Level 3 – Significant unobservable inputs (including the Funds' own assumptions in determining the fair value of investments).
The inputs or methodologies used for valuing securities are not necessarily an indication of the risk associated with investing in those securities. The following is a summary of the inputs used to value the securities held by each Fund as of December 31, 2021:
| | | Growth Fund | | Balanced Fund | | Small Cap Fund | |
Level 1* | | $ | 5,949,500,794 | | | $ | 707,939,596 | | | $ | 427,990,879 | | |
Level 2** | | | - | | | | 313,432,244 | | | | - | | |
Level 3 | | | - | | | | - | | | | - | | |
Total | | $ | 5,949,500,794 | | | $ | 1,021,371,840 | | | $ | 427,990,879 | | |
* All Level 1 investments are equity securities (common stocks and preferred stocks) and short-term investments.
** All Level 2 investments are fixed income securities.
For detail of securities by major sector classification for the Funds, please refer to the Schedules of Investments.
The Funds did not hold any Level 3 investments during the year ended December 31, 2021.
Security Transactions and Investment Income
Security transactions are recorded on the date on which securities are purchased or sold. Dividend income and corporate action transactions are recorded on the ex-dividend date. Interest income, including the accretion of discounts and amortization of premiums, is recorded on an accrual basis. Premiums and discounts are amortized using the effective interest method. Realized gains and losses are reported on an identified cost basis.
Income Taxes
Each Fund is a "regulated investment company" as defined in Subtitle A, Chapter 1, Subchapter M of the Internal Revenue Code of 1986, as amended (the Code). No provisions have been made for federal income taxes as it is the intention of each Fund to comply with the provisions of the Code applicable to regulated investment companies and to make distributions of income and realized gains sufficient to relieve it from all or substantially all excise and income taxes.
As of December 31, 2021, the Trust did not have any tax positions that did not meet the "more-likely-than-not" threshold of being sustained by the applicable tax authority. Generally, tax authorities can examine all tax returns filed for the last three years.
As of December 31, 2021, none of the Funds had capital loss carryforwards nor did they have any qualified late year losses for federal tax purposes.
Basis of Presentation
The preparation of financial statements in conformity with U.S. generally accepted accounting principles (GAAP) requires management to make estimates and assumptions that affect the reported amount of net assets and liabilities and disclosure of contingent assets and liabilities at the date of the financial statements and the reported results of operations during the reporting period. Actual results could differ from those estimates.
Expense Allocation
Common expenses incurred by the Trust are allocated among the Funds based on their relative net assets. Fund specific expenses are charged directly to the Fund that incurred the expense.
40
NOTES TO FINANCIAL STATEMENTS (continued) December 31, 2021
Note 1 – Organization and Significant Accounting Policies (continued)
New Accounting Pronouncements and Regulatory Updates
In October 2020, the SEC adopted new Rule 12d1-4 under the 1940 Act and other regulatory changes which are expected to be effective on or about January 19, 2022. Those changes are intended to streamline and enhance the regulatory framework for investments by one fund into another fund or "fund-of-funds arrangements". The Funds do not invest in other funds in excess of limits under the 1940 Act. Management assessed the potential impact of the new rule on the Fund's financial statements and determined no impact.
In October 2020, the SEC adopted new regulations governing the use of derivatives by registered investment companies ("Rule 18f-4"). The Funds will be required to implement and comply with Rule 18f-4 by August 19, 2022 if the Funds invest in derivatives or engage in other transactions subject to Rule 18f-4. Once implemented, Rule 18f-4 will impose limits on the amount of derivatives a fund can enter into, eliminate the asset segregation framework currently used by funds to comply with Section 18 of the 1940 Act, treat derivatives as senior securities and require funds whose use of derivatives is more than a limited specified exposure amount to establish and maintain a comprehensive derivatives risk management program and appoint a derivatives risk manager. Management is currently evaluating the impact, if any, of complying with the new rule.
In December 2020, the SEC adopted a new rule providing a framework for fund valuation practices ("Rule 2a-5"). Rule 2a-5 establishes requirements for determining fair value in good faith for purposes of the 1940 Act. Rule 2a-5 will permit fund boards to designate certain parties to perform fair value determinations, subject to board oversight and certain other conditions. Rule 2a-5 also defines when market quotations are "readily available" for purposes of the 1940 Act and the threshold for determining whether a fund must fair value a security. In connection with Rule 2a-5, the SEC also adopted related recordkeeping requirements and is rescinding previously issued guidance, including with respect to the role of a board in determining fair value and the accounting and auditing of fund investments. The Funds will be required to comply with the rules by September 8, 2022. Management is currently evaluating the impact of complying with Rule 2a-5.
Note 2 – Related-Party Transactions
Investment Management Fees
The Adviser provides investment management services and various administrative services to the Funds under a written agreement for Investment Counsel Service (the Investment Advisory Agreement) approved by the Board. Pursuant to the Investment Advisory Agreement, the Adviser is paid a monthly fee on average daily net assets at the following annual rates:
| | | Growth Fund | | Balanced Fund | | Small Cap Fund(1) | |
Up to $2.5 Billion | | | 0.60 | % | | | 0.60 | % | | | 0.80 | % | |
Over $2.5 Billion | | | 0.50 | % | | | 0.60 | % | | | 0.80 | % | |
(1) Effective June 1, 2021, the investment management fee was reduced from 0.90% to 0.80%.
Trustees' Fees
The Funds pay compensation to the disinterested Trustees of the Trust. The Funds do not pay remuneration to officers or to Trustees who are officers, directors or employees of the Adviser or Trustees who are otherwise "interested persons" of the Trust.
Note 3 – Indemnifications
In the normal course of business, the Trust enters into contracts that contain general indemnifications to other parties. The Trust's maximum exposure under these contracts is unknown as this would involve future claims that may be made against the Trust that have not yet occurred. The Trust expects the risk of loss to be remote.
41
NOTES TO FINANCIAL STATEMENTS (continued) December 31, 2021
Note 4 – Distributions Paid, Distributable Earnings and Investment Transactions
Net investment income and net realized capital gains (losses) may differ for financial reporting and tax purposes because of temporary or permanent book/tax differences.
In addition, GAAP requires that certain components of net assets relating to permanent difference be reclassified between financial and tax reporting. The permanent differences primarily relate to utilization of earnings and profits distributed to shareholders on redemption of shares and distribution reclasses. These reclassifications have no effect on net assets or net asset value per share. On the Statement of Assets and Liabilities, the following reclassifications were made for the year end ended December 31, 2021:
| | | Total Distributable
Earnings | | Paid in Capital | |
Growth Fund | | $ | (20,283,548 | ) | | $ | 20,283,548 | | |
Balanced Fund | | | (2,708,042 | ) | | | 2,708,042 | | |
Small Cap Fund | | | (2,248,434 | ) | | | 2,248,434 | | |
Distributions to shareholders are determined in accordance with income tax regulations that may differ from GAAP, and due to the timing of the distributions, the fiscal year in which the amounts are distributed may differ from the year that the income or realized gains (losses) were recorded by each Fund.
The tax character of distributions paid during the years ended December 31, 2021 and December 31, 2020, were as follows:
Year ended December 31, 2021 | |
Distributions paid from: | | Growth Fund | | Balanced Fund | | Small Cap Fund | |
Ordinary income | | $ | 30,356,013 | | | $ | 14,165,258 | | | $ | 1,311,178 | | |
Long-term capital gains | | | 423,281,193 | | | | 48,404,152 | | | | 32,260,684 | | |
Total distributions paid | | $ | 453,637,206 | | | $ | 62,569,410 | | | $ | 33,571,862 | | |
Year ended December 31, 2020 | |
Distributions paid from: | | Growth Fund | | Balanced Fund | | Small Cap Fund | |
Ordinary income | | $ | 49,410,948 | | | $ | 17,164,646 | | | $ | 2,134,910 | | |
Long-term capital gains | | | 351,612,072 | | | | 21,647,369 | | | | 5,156,681 | | |
Total distributions paid | | $ | 401,023,020 | | | $ | 38,812,015 | | | $ | 7,291,591 | | |
Ordinary income distributions include net short-term capital gains. The Funds are designating as long-term capital gain dividends, pursuant to Section 852(b)(3) of the Code, the amount necessary to reduce the earnings and profits of the Funds related to net capital gain to zero. To the extent necessary to fully distribute such capital gain, the Funds also designate earnings and profits distributed to shareholders on the redemption of shares.
At December 31, 2021, the components of accumulated earnings (losses) on a tax basis were as follows:
| | | Growth Fund | | Balanced Fund | | Small Cap Fund | |
Cost of investments | | $ | 2,504,252,876 | | | $ | 622,601,497 | | | $ | 269,496,053 | | |
Gross unrealized appreciation | | $ | 3,469,235,825 | | | $ | 402,489,460 | | | $ | 172,449,095 | | |
Gross unrealized depreciation | | | (23,987,907 | ) | | | (3,719,117 | ) | | | (13,954,269 | ) | |
Net unrealized appreciation | | $ | 3,445,247,918 | | | $ | 398,770,343 | | | $ | 158,494,826 | | |
Undistributed ordinary income | | $ | - | | | $ | - | | | $ | - | | |
Undistributed long-term capital gains | | | 127,112,902 | | | | 11,379,138 | | | | 8,661,791 | | |
Total distributable earnings | | $ | 127,112,902 | | | $ | 11,379,138 | | | $ | 8,661,791 | | |
Other accumulated earnings | | | - | | | | - | | | | - | | |
Total accumulated earnings | | $ | 3,572,360,820 | | | $ | 410,149,481 | | | $ | 167,156,617 | | |
42
NOTES TO FINANCIAL STATEMENTS (continued) December 31, 2021
Note 4 – Distributions Paid, Distributable Earnings and Investment Transactions (continued)
The difference between book basis and tax basis unrealized appreciation is attributable primarily to the tax deferral of losses on wash sales.
Purchases and sales of investment securities, excluding government securities, short-term securities and temporary cash investments, during the year ended December 31, 2021 were as follows:
| | | Purchases | | Sales | |
Growth Fund | | $ | 711,635,249 | | | $ | 978,941,835 | | |
Balanced Fund | | | 115,610,281 | | | | 143,213,560 | | |
Small Cap Fund | | | 87,655,366 | | | | 109,459,688 | | |
Purchases and sales of government securities during the year ended December 31, 2021 were as follows:
| | | Purchases | | Sales | |
Growth Fund | | $ | - | | | $ | - | | |
Balanced Fund | | | 7,978,319 | | | | - | | |
Small Cap Fund | | | - | | | | - | | |
Note 5 – Transactions With Affiliated Companies
The Growth Fund owned 5% or more of the voting securities of the following company during the year ended December 31, 2021. As a result, this company is deemed an affiliate of the Growth Fund as defined by the 1940 Act. Transactions during the period in this security were as follows:
Growth Fund
Security
Name | | Share
Balance
12/31/21 | | Fair
Value at
12/31/20 | | Purchases | | Sales | | Realized
Gain
(Loss)(1) | | Change in
Unrealized
Appreciation | | Fair
Value at
12/31/21 | | Dividend
Income(1) | |
Tennant Co | | | 949,966 | | | $ | 66,659,114 | | | $ | - | | | $ | - | | | $ | - | | | $ | 10,326,131 | | | $ | 76,985,245 | | | $ | 892,968 | | |
(1) Dividend income and realized gain amounts are reported for the period in which the security was deemed an affiliate.
Note 6 – Impacts of COVID-19
The global outbreak of COVID-19 has disrupted financial markets and the prolonged economic impact is uncertain. The performance of the Funds' investments depends on future developments, including the duration and spread of the outbreak. Events related to COVID-19 may result in further global economic disruption and market volatility which in turn may impact the value of each of the Fund's investments.
Note 7 – Subsequent Events
In preparing these financial statements, the Funds have evaluated events and transactions for potential recognition or disclosure through the date the financial statements were available to be issued. On December 16, 2021, the Board of Trustees of the Trust approved the reorganizations of the Mairs & Power Growth Fund, the Mairs & Power Balanced Fund and the Mairs & Power Small Cap Fund, each a series of the Trust, into the Mairs & Power Growth Fund, the Mairs & Power Balanced Fund and the Mairs & Power Small Cap Fund (each an "Acquiring Fund" and collectively the "Acquiring Funds"), respectively, each a newly created corresponding series of Trust for Professional Managers, an unaffiliated registered investment company. Each Acquiring Fund will have the same investment objective and principal investment strategies and limitations as that of the corresponding Fund. The Adviser will continue to act as investment adviser to the Acquiring Funds. The Board of Trustees approved the reorganizations upon the recommendation of the Adviser. The reorganizations are subject to the approval of the shareholders of each Fund at a special meeting of shareholders to be held in 2022. Shareholders of the Funds will receive a proxy statement with additional information about the shareholder meeting and the proposed reorganizations. Please read the proxy materials carefully, as they will contain a more detailed description of the proposed reorganizations. If shareholders approve the reorganizations, the closing of the reorganizations is expected to occur in April 2022.
43
NOTES TO FINANCIAL STATEMENTS (continued) December 31, 2021
Note 7 – Subsequent Events (continued)
Effective January 1, 2022, as part of a transition plan established by the Adviser, Michael C. Marzolf has been named Co-Manager of the Small Cap Fund. Andrew R. Adams, Lead Portfolio Manager, Allen D. Steinkopf, Co-Manager, and Christopher D. Strom, Co-Manager, will continue to manage the Small Cap Fund with Mr. Marzolf.
Effective February 7, 2022, The Board of Trustees of the Trust elected Elizabeth M. VanHeel as Assistant Treasurer of the Trust.
There were no other subsequent events.
44
Mairs & Power Growth Fund
FINANCIAL HIGHLIGHTS
SELECTED DATA AND RATIOS
(for a share outstanding throughout each year)
| | | Year Ended December 31, | |
| | | 2021 | | 2020 | | 2019 | | 2018 | | 2017 | |
Per Share | |
Net asset value, beginning of year | | $ | 136.08 | | | $ | 127.22 | | | $ | 106.45 | | | $ | 121.12 | | | $ | 113.83 | | |
Income from investment operations: | |
Net investment income | | | 0.87 | | | | 1.48 | | | | 1.59 | | | | 1.61 | | | | 1.60 | | |
Net realized and unrealized gain (loss) | | | 38.82 | | | | 19.37 | | | | 28.59 | | | | (6.96 | ) | | | 17.16 | | |
Total from investment operations | | | 39.69 | | | | 20.85 | | | | 30.18 | | | | (5.35 | ) | | | 18.76 | | |
Distributions to shareholders from: | |
Net investment income | | | (0.91 | ) | | | (1.45 | ) | | | (1.58 | ) | | | (1.59 | ) | | | (1.66 | ) | |
Net realized gains on investments sold | | | (12.31 | ) | | | (10.54 | ) | | | (7.83 | ) | | | (7.73 | ) | | | (9.81 | ) | |
Total distributions | | | (13.22 | ) | | | (11.99 | ) | | | (9.41 | ) | | | (9.32 | ) | | | (11.47 | ) | |
Net asset value, end of year | | $ | 162.55 | | | $ | 136.08 | | | $ | 127.22 | | | $ | 106.45 | | | $ | 121.12 | | |
Total investment return (loss) | | | 29.27 | % | | | 16.67 | % | | | 28.39 | % | | | (4.34 | )% | | | 16.52 | % | |
Net assets, end of year, in thousands | | $ | 5,950,161 | | | $ | 4,858,189 | | | $ | 4,633,937 | | | $ | 3,938,943 | | | $ | 4,731,156 | | |
Ratios/supplemental data: | |
Ratio of expenses to average net assets | | | 0.61 | % | | | 0.64 | % | | | 0.65 | % | | | 0.64 | % | | | 0.64 | % | |
Ratio of net investment income to average
net assets | | | 0.55 | | | | 1.12 | (1) | | | 1.28 | | | | 1.27 | | | | 1.30 | | |
Portfolio turnover rate | | | 13.17 | | | | 14.52 | | | | 10.77 | | | | 9.25 | | | | 8.84 | | |
(1) Ratio revised subsequent to the completion of the annual report dated December 31, 2020 to include immaterial reclass adjustments related to the Fund's holding of real estate investment trusts.
See accompanying Notes to Financial Statements.
45
Mairs & Power Balanced Fund
FINANCIAL HIGHLIGHTS
SELECTED DATA AND RATIOS
(for a share outstanding throughout each year)
| | | Year Ended December 31, | |
| | | 2021 | | 2020 | | 2019 | | 2018 | | 2017 | |
Per Share | |
Net asset value, beginning of year | | $ | 105.23 | | | $ | 99.74 | | | $ | 86.79 | | | $ | 94.01 | | | $ | 87.29 | | |
Income from investment operations: | |
Net investment income | | | 1.68 | | | | 1.98 | | | | 2.13 | | | | 2.09 | | | | 2.04 | | |
Net realized and unrealized gain (loss) | | | 17.42 | | | | 8.10 | | | | 15.39 | | | | (4.71 | ) | | | 8.26 | | |
Total from investment operations | | | 19.10 | | | | 10.08 | | | | 17.52 | | | | (2.62 | ) | | | 10.30 | | |
Distributions to shareholders from: | |
Net investment income | | | (1.68 | ) | | | (1.99 | ) | | | (2.12 | ) | | | (2.09 | ) | | | (2.07 | ) | |
Net realized gains on investments sold | | | (5.76 | ) | | | (2.60 | ) | | | (2.45 | ) | | | (2.51 | ) | | | (1.51 | ) | |
Total distributions | | | (7.44 | ) | | | (4.59 | ) | | | (4.57 | ) | | | (4.60 | ) | | | (3.58 | ) | |
Net asset value, end of year | | $ | 116.89 | | | $ | 105.23 | | | $ | 99.74 | | | $ | 86.79 | | | $ | 94.01 | | |
Total investment return (loss) | | | 18.30 | % | | | 10.44 | % | | | 20.32 | % | | | (2.80 | )% | | | 11.90 | % | |
Net assets, end of year, in thousands | | $ | 1,022,951 | | | $ | 895,253 | | | $ | 928,828 | | | $ | 807,455 | | | $ | 984,788 | | |
Ratios/supplemental data: | |
Ratio of expenses to average net assets | | | 0.69 | % | | | 0.71 | % | | | 0.71 | % | | | 0.72 | % | | | 0.71 | % | |
Ratio of net investment income to average
net assets | | | 1.45 | | | | 2.01 | (1) | | | 2.22 | | | | 2.20 | | | | 2.24 | | |
Portfolio turnover rate | | | 13.00 | | | | 15.96 | | | | 13.60 | | | | 9.01 | | | | 13.13 | | |
(1) Ratio revised subsequent to the completion of the annual report dated December 31, 2020 to include immaterial reclass adjustments related to the Fund's holding of real estate investment trusts.
See accompanying Notes to Financial Statements.
46
Mairs & Power Small Cap Fund
FINANCIAL HIGHLIGHTS
SELECTED DATA AND RATIOS
(for a share outstanding throughout each year)
| | | Year Ended December 31, | |
| | | 2021 | | 2020 | | 2019 | | 2018 | | 2017 | |
Per Share | |
Net asset value, beginning of year | | $ | 28.15 | | | $ | 26.41 | | | $ | 22.48 | | | $ | 25.32 | | | $ | 24.33 | | |
Income from investment operations: | |
Net investment income | | | 0.01 | | | | 0.19 | | | | 0.13 | | | | 0.15 | | | | 0.13 | | |
Net realized and unrealized gain (loss) | | | 7.25 | | | | 2.13 | | | | 4.62 | | | | (1.92 | ) | | | 1.73 | | |
Total from investment operations | | | 7.26 | | | | 2.32 | | | | 4.75 | | | | (1.77 | ) | | | 1.86 | | |
Distributions to shareholders from: | |
Net investment income | | | (0.01 | ) | | | (0.17 | ) | | | (0.11 | ) | | | (0.15 | ) | | | (0.13 | ) | |
Net realized gains on investments sold | | | (2.71 | ) | | | (0.41 | ) | | | (0.71 | ) | | | (0.92 | ) | | | (0.74 | ) | |
Redemption fees (1)(2) | | | 0.00 | | | | 0.00 | | | | 0.00 | | | | 0.00 | | | | 0.00 | | |
Total distributions | | | (2.72 | ) | | | (0.58 | ) | | | (0.82 | ) | | | (1.07 | ) | | | (0.87 | ) | |
Net asset value, end of year | | $ | 32.69 | | | $ | 28.15 | | | $ | 26.41 | | | $ | 22.48 | | | $ | 25.32 | | |
Total investment return (loss) | | | 26.00 | % | | | 8.78 | % | | | 21.13 | % | | | (6.91 | )% | | | 7.64 | % | |
Net assets, end of year, in thousands | | $ | 427,257 | | | $ | 361,594 | | | $ | 437,300 | | | $ | 367,477 | | | $ | 435,507 | | |
Ratios/supplemental data: | |
Ratio of expenses to average net assets | | | 0.95 | % | | | 1.04 | % | | | 1.05 | % | | | 1.04 | % | | | 1.04 | % | |
Ratio of net investment income to average
net assets | | | 0.02 | | | | 0.58 | | | | 0.48 | | | | 0.54 | | | | 0.48 | | |
Portfolio turnover rate | | | 21.45 | | | | 16.39 | | | | 15.07 | | | | 20.40 | | | | 19.27 | | |
(1) The Fund charges a 1.00% redemption fee on shares held 180 days or less.
(2) Amount per share is less than $0.005.
See accompanying Notes to Financial Statements.
47
REPORT OF INDEPENDENT REGISTERED PUBLIC ACCOUNTING FIRM
To the Shareholders and the Board of Trustees of
Mairs & Power Funds Trust
Opinion on the Financial Statements
We have audited the accompanying statements of assets and liabilities of Mairs & Power Funds Trust (the Trust) (comprising Mairs & Power Growth Fund, Mairs & Power Balanced Fund and Mairs & Power Small Cap Fund (collectively referred to as the "Funds")), including the schedules of investments, as of December 31, 2021, and the related statements of operations for the year then ended, the statements of changes in net assets for each of the two years in the period then ended, the financial highlights for each of the five years in the period then ended and the related notes (collectively referred to as the "financial statements"). In our opinion, the financial statements present fairly, in all material respects, the financial position of each of the Funds comprising Mairs & Power Funds Trust at December 31, 2021, the results of their operations for the year then ended, the changes in their net assets for each of the two years in the period then ended and their financial highlights for each of the five years in the period then ended, in conformity with U.S. generally accepted accounting principles.
Basis for Opinion
These financial statements are the responsibility of the Trust's management. Our responsibility is to express an opinion on each of the Funds' financial statements based on our audits. We are a public accounting firm registered with the Public Company Accounting Oversight Board (United States) ("PCAOB") and are required to be independent with respect to the Trust in accordance with the U.S. federal securities laws and the applicable rules and regulations of the Securities and Exchange Commission and the PCAOB.
We conducted our audits in accordance with the standards of the PCAOB. Those standards require that we plan and perform the audit to obtain reasonable assurance about whether the financial statements are free of material misstatement, whether due to error or fraud. The Trust is not required to have, nor were we engaged to perform, an audit of the Trust's internal control over financial reporting. As part of our audits we are required to obtain an understanding of internal control over financial reporting but not for the purpose of expressing an opinion on the effectiveness of the Trust's internal control over financial reporting. Accordingly, we express no such opinion.
Our audits included performing procedures to assess the risks of material misstatement of the financial statements, whether due to error or fraud, and performing procedures that respond to those risks. Such procedures included examining, on a test basis, evidence regarding the amounts and disclosures in the financial statements. Our procedures included confirmation of securities owned as of December 31, 2021, by correspondence with the custodian and brokers. Our audits also included evaluating the accounting principles used and significant estimates made by management, as well as evaluating the overall presentation of the financial statements. We believe that our audits provide a reasonable basis for our opinion.

We have served as the auditor of the Mairs & Power Funds Trust since 1958.
Minneapolis, Minnesota
February 18, 2022
48
FUND EXPENSES (unaudited)
As a shareholder of the Funds, you incur two types of costs: (1) transaction costs, including redemption fees and (2) ongoing expenses for the operation of the Funds (e.g., asset-based charges, such as investment management fees). The Funds are "no-load" mutual funds. As a result, shareholders pay no commissions, fees, or expenses associated with sales representatives or sales charges.
This example is intended to help you understand your ongoing costs (in dollars) of investing in the Funds and to compare these costs with the ongoing costs of investing in other mutual funds. The table below reports the Funds' expenses during the period July 1, 2021 through December 31, 2021 and includes the costs associated with a $1,000 investment.
Actual Expenses
The first line in the tables below provides information about the actual account values and actual expenses. You may use this information in this line, together with the amount you invested to estimate the expenses you paid over the reporting period. You can do this by dividing your account value by $1,000 and multiplying the result by the expense shown in the table below. For example, if your account value is $8,600, divided by $1,000 = $8.60. Multiply the result by the number in the first line under the heading entitled "Expenses Paid During Period." By doing this you can estimate the expenses you paid on your account during this period.
Hypothetical Example
The second line of the tables below provides information about hypothetical account values and hypothetical expenses based on the Funds' actual expenses and assumed returns of 5% per year before expenses, which are not the Funds' actual returns. The results may be used to provide you with a basis for comparing the ongoing costs of investing in the Funds with the ongoing costs of investing in other funds. To do so, compare these 5% hypothetical examples with the 5% hypothetical examples that appear in the shareholder reports of other funds. Please note that these hypothetical examples highlight ongoing costs only and do not reflect any transactional fees, such as redemption fees. In addition, if these transactional fees were included, your costs would have been higher. These hypothetical expense examples may not be used to estimate the actual ending account balances or expenses you paid during the period and will not help you determine the relative total costs of owning different funds.
Mairs & Power Growth Fund
| | | Beginning Account
Value 07/01/2021 | | Ending Account
Value 12/31/2021 | | Expenses Paid
During Period * | |
Actual return | | $ | 1,000.00 | | | $ | 1,107.40 | | | $ | 3.40 | | |
Hypothetical assumed 5% return | | $ | 1,000.00 | | | $ | 1,021.98 | | | $ | 3.26 | | |
* The Fund's expenses are equal to the Fund's annualized expense ratio for the most recent six-month period of 0.64%, multiplied by the average account value over the Fund's second fiscal half-year, multiplied by the number of days in the Fund's second fiscal half-year (184 days), divided by 365 days.
Mairs & Power Balanced Fund
| | | Beginning Account
Value 07/01/2021 | | Ending Account
Value 12/31/2021 | | Expenses Paid
During Period * | |
Actual return | | $ | 1,000.00 | | | $ | 1,065.00 | | | $ | 3.70 | | |
Hypothetical assumed 5% return | | $ | 1,000.00 | | | $ | 1,021.63 | | | $ | 3.62 | | |
* The Fund's expenses are equal to the Fund's annualized expense ratio for the most recent six-month period of 0.71%, multiplied by the average account value over the Fund's second fiscal half-year, multiplied by the number of days in the Fund's second fiscal half-year (184 days), divided by 365 days.
49
FUND EXPENSES (unaudited) (continued)
Mairs & Power Small Cap Fund
| | | Beginning Account
Value 07/01/2021 | | Ending Account
Value 12/31/2021 | | Expenses Paid
During Period * | |
Actual return | | $ | 1,000.00 | | | $ | 1,057.50 | | | $ | 4.77 | | |
Hypothetical assumed 5% return | | $ | 1,000.00 | | | $ | 1,020.57 | | | $ | 4.69 | | |
* The Fund's expenses are equal to the Fund's annualized expense ratio for the most recent six-month period of 0.92%, multiplied by the average account value over the Fund's second fiscal half-year, multiplied by the number of days in the Fund's second fiscal half-year (184 days), divided by 365 days.
50
PRIVACY POLICY NOTICE (unaudited)
Our Promise to You
As a shareholder or potential shareholder of the Mairs & Power Mutual Funds (Funds), you share both personal and financial information with us. Your privacy is important to us, and we are dedicated to maintaining safeguards reasonable designed to protect client data from unauthorized access.
What Information We Collect
In the normal course of doing business, we typically obtain the following non-public personal information about you:
• Personal information regarding our shareholders' identity such as name, address, social security number and Internet Protocol Address (IP Address);
• Information regarding securities transactions effected by us or our affiliates; and
• Financial information such as net-worth, assets, income, employment data, bank account information and account balances.
How We Manage Your Personal Information
We do not share the information collected about our shareholders or former shareholders with any third parties, except as required or permitted by law or for the purpose of servicing shareholder needs. This means we may disclose the information collected to companies who help maintain and service your account. For example, we may share information with a transfer agent or clearing broker to process your securities transactions and update your accounts or to an external service provider so that your account statements can be printed and mailed. These companies are only permitted to use this information for the services for which we hired them and are not permitted to use or share this information for any other purpose. We will share information with affiliates if the information is required to provide a product or service you requested. Additionally, we may share information with our affiliates about you or your accounts in order to make you aware of services and products that we think may be of interest or value to you. Marketing from our affiliates may also include invitations to events sponsored by such affiliates. Our affiliates include Mairs & Power, Inc., the Funds' investment adviser. We may also disclose nonpublic personal information to government agencies and regulatory organizations when permitted or required by law.
How We Protect Your Personal Information
In order to protect your personal information, we maintain physical, electronic and procedural safeguards that are reasonably designed to comply with federal standards to maintain the confidentiality of nonpublic personal information.
How to Contact Us
You may limit our affiliates from marketing their products or services based on personal information that the Funds collect and share with affiliates. Your choice to limit marketing offers from our affiliates will apply until you request a change to your choice. Your choice to limit marketing offers from our affiliates will not affect your ability to receive marketing materials directly from us. If you have already made a choice to limit marketing offers from our affiliates, you do not need to act again. To limit marketing offers, please contact us at the telephone number listed below.
You can correct, update, or confirm your personal information and limit marketing offers from our affiliates by calling 1-800-304-7404.
51
OTHER INFORMATION (unaudited)
This report is submitted for the general information of the shareholders of the Funds. It is not authorized for distribution to prospective investors unless accompanied or preceded by an effective prospectus. An investor should consider the Funds' investment objectives, risks and expenses carefully before investing or sending money. This and other important information can be found in the Funds' summary prospectuses and full prospectus. To obtain a prospectus, please call Shareholder Services at (800) 304-7404 or visit the Funds' website at www.mairsandpower.com. Please read the prospectus carefully before investing. This report includes forward-looking statements such as economic predictions and portfolio manager opinions. The statements are subject to change at any time based on market and other conditions. No predictions, forecasts, outlooks, expectations or beliefs are guaranteed.
52
Proxy Voting Policies and Procedures that the Trust uses to determine how to vote proxies relating to portfolio securities are available (i) without charge, upon request, by calling Shareholder Services at (800) 304-7404 and requesting a copy of the Statement of Additional Information (SAI) and (ii) on the Securities and Exchange Commission's (SEC's) website at www.sec.gov (access Form N-1A).
Information on how the Funds voted proxies relating to portfolio securities during the most recent 12-month period ended June 30 is available at www.mairsandpower.com and on the SEC's website at www.sec.gov on Form N-PX.
DISCLOSURE OF PORTFOLIO HOLDINGS (unaudited)
A description of the Funds' policies and procedures with respect to the disclosure of portfolio holdings is available in the SAI and on the Funds' website. A complete list of each Fund's holdings is available on or about 15 days after each quarter-end at www.mairsandpower.com. This list remains available on the website until it is replaced with the following quarter-end list. The portfolio holdings list is also filed in the Funds' annual and semi-annual reports to shareholders filed with the SEC on Form N-CSR and as an exhibit to Form N-PORT following the end of each quarter. Form N-CSR and the public portion of Form N-PORT, when available, may be viewed on the SEC's website at www.sec.gov.
HOUSEHOLDING (unaudited)
In an effort to decrease costs, the Trust intends to reduce the number of duplicate Summary Prospectuses and Annual and Semi-Annual Reports you receive by sending only one copy of each to those addresses shared by two or more accounts and to shareholders reasonably believed to be from the same family or household. Once implemented, if you would like to discontinue householding for your accounts, please call Shareholder Services at (800) 304-7404 to request individual copies of these documents. Once notification to stop householding is received, the Trust will begin sending individual copies thirty days after receiving your request. This policy does not apply to account statements.
eDelivery is available to all direct shareholders. eDelivery provides your tax statements, account statements, trade confirmation statements and shareholder reports online rather than by regular mail. In addition to reducing paper waste, eDelivery may reduce your Fund fees by lowering printing and mailing costs over time. To receive materials electronically, please contact Shareholder Services at (800) 304-7404 or visit www.mairsandpower.com to sign up for eDelivery. If you hold your Fund shares through a Financial Intermediary, please contact your Financial Intermediary regarding electronic delivery options.
53
TRUSTEES AND OFFICERS (unaudited) December 31, 2021
Information pertaining to the Trustees and Officers of the Trust is set forth below. The Statement of Additional Information includes additional information about the Trust's Trustees and is available without charge, upon request, by calling Shareholder Services at (800) 304-7404 or by visiting www.mairsandpower.com.
Name (year of birth)
and address1 | | Position(s)
held with the
Trust and
length of
time served2 | | Principal occupation(s)
during past five years | | Number of
portfolios
in fund
complex
overseen by
Trustee | | Other
directorships
held by trustee
during past
five years | |
INTERESTED TRUSTEE3 | |
Mark L. Henneman (1961) | | Trustee since January 2018; President since December 31, 2014; Vice President from 2009 to 2014 | | • Chair of the Board and Chief Executive Officer of the Investment Adviser (January 2018 to present).
• President of the Investment Adviser (2015 to 2017).
• Chief Investment Officer of the Investment Adviser (2015 to 2017).
• Executive Vice President of the Investment Adviser (2012 to 2014). | | | 3 | | | None | |
INDEPENDENT TRUSTEES | |
Mary Schmid Daugherty (1958) | | Chair of the Board since January 2018; Trustee since December 2010; Audit Committee Chair from December 2012 to December 2017 | | • Senior Fellow in Applied Finance, Department of Finance, University of St. Thomas (1987 to present). | | | 3 | | | None | |
James D. Alt (1951) | | Nominating and Governance Committee Chair since January 2017; Trustee since April 2015 | | • Retired Adjunct Associate Professor, University of Minnesota Law School (2007 to 2017); Retired Partner, Dorsey & Whitney LLP4 (1984 to 2012). | | | 3 | | | None | |
54
TRUSTEES AND OFFICERS (unaudited) (continued) December 31, 2021
Name (year of birth)
and address1 | | Position(s)
held with the
Trust and
length of
time served2 | | Principal occupation(s)
during past five years | | Number of
portfolios
in fund
complex
overseen by
Trustee | | Other
directorships
held by trustee
during past
five years | |
INDEPENDENT TRUSTEES (continued) | |
Patrick A. Thiele (1950) | | Audit Committee Chair since January 2018; Trustee since April 2015 | | • Retired Chief Executive Officer, PartnerRe Ltd. (a reinsurance company) (2000 to 2010). | | | 3 | | | Director,
PartnerRE Ltd. (March 2016 to December 2018); Director, OneBeacon
Insurance Group, Ltd. (2014 to September 2017). | |
Susan E. Knight (1954) | | Trustee since January 2018 | | • Retired Senior Vice President and Chief Financial Officer, MTS Systems Corporation (a testing and sensor company) (2001 to 2015). | | | 3 | | | Chair,
Surmodics, Inc. (medical device and diagnostics company)
(2015 to present); Director,
Surmodics, Inc. (2008 to present). | |
PRINCIPAL OFFICERS | |
Andrew R. Adams (1972) | | Vice President since 2011 | | • Chief Investment Officer of the Investment Adviser (January 2018 to present).
• Executive Vice President of the Investment Adviser (October 2016 to present).
• Vice President of the Investment Adviser (2006 to October 2016). | | | N/A | | | N/A | |
Kevin V. Earley (1964) | | Vice President since April 2018 | | • Vice President of the Investment Adviser (2013 to present). | | | N/A | | | N/A | |
Allen D. Steinkopf (1961) | | Vice President since April 2019 | | • Vice President of the Investment Adviser (2013 to present). | | | N/A | | | N/A | |
55
TRUSTEES AND OFFICERS (unaudited) (continued) December 31, 2021
Name (year of birth)
and address1 | | Position(s)
held with the
Trust and
length of
time served2 | | Principal occupation(s)
during past five years | | Number of
portfolios
in fund
complex
overseen by
Trustee | | Other
directorships
held by trustee
during past
five years | |
PRINCIPAL OFFICERS (continued) | |
Andrea C. Stimmel (1967) | | Treasurer since 2011; Chief Compliance Officer from 2012 to 2016 | | • Chief Operating Officer of the Investment Adviser (January 2018 to present).
• Treasurer of the Investment Adviser (2008 to present).
• Director of Operations of the Investment Adviser (2008 to 2017).
• Chief Compliance Officer of the Investment Adviser (2012 to 2016). | | | N/A | | | N/A | |
Robert W. Mairs (1969) | | Secretary since May 2017; Chief Compliance Officer and Anti-Money Laundering Compliance Officer since 2017; Assistant Chief Compliance Officer from September 2016 to December 2016 | | • President and Secretary of the Investment Adviser (January 2018 to present).
• Chief Compliance Officer of the Investment Adviser (January 2017 to present).
• General Counsel of the Investment Adviser (2015 to present).
• Assistant Chief Compliance Officer of the Investment Adviser (September 2016 to December 2016).
• Shareholder and Attorney, Lathrop GPM (1999 to 2015). | | | N/A | | | N/A | |
1 Unless otherwise indicated, the mailing address of each officer and trustee is: W1520 First National Bank Building, 332 Minnesota Street, Saint Paul, MN 55101-1363.
2 Dr. Daugherty served as a director of Mairs and Power Growth Fund, Inc. and Mairs and Power Balanced Fund, Inc. (together, the "Predecessor Funds") prior to the reorganization of the Predecessor Funds into newly formed series of the Trust effective December 31, 2011. Positions listed in this column for trustees and officers prior to 2012 refer to their positions with the Predecessor Funds. Each trustee serves until his or her resignation or mandatory retirement age. Each officer is elected annually and serves until his successor has been duly elected and qualified.
3 Mr. Henneman is deemed to be an "interested person" of the Trust due to his positions with the Adviser.
4 Dorsey & Whitney LLP previously served as legal counsel to the Trust through December 2012.
56
MAIRS & POWER FUNDS TRUST
Mairs & Power Growth Fund, established 1958
Mairs & Power Balanced Fund, established 1961
Mairs & Power Small Cap Fund, established 2011
A No-Load Funds Trust
For Shareholder Services
Call (800) 304-7404
Or write to:
(via Regular Mail)
c/o U.S. Bancorp Fund Services, LLC
615 East Michigan Street
P. O. Box 701
Milwaukee, WI 53201-0701 | | (via Overnight or Express Mail)
c/o U.S. Bancorp Fund Services, LLC
3rd Floor
615 East Michigan Street
Milwaukee, WI 53202-0701 | |
For Fund literature and information, visit the Trust's website at:
www.mairsandpower.com
Investment Manager
Mairs & Power, Inc.
W1520 First National Bank Building
332 Minnesota Street
Saint Paul, MN 55101
Custodian
U.S. Bank, N.A.
Custody Operations
1555 North River Center Drive, Suite 302
Milwaukee, WI 53212
Distributor
Foreside Fund Services, LLC
Three Canal Plaza, Suite 100
Portland, ME 04101
Mairs & Power, Inc.
c/o U.S. Bancorp Fund Services, LLC
3rd Floor
615 East Michigan Street
Milwaukee, WI 53202-0701
Item 2. Code of Ethics.
The registrant has adopted a Code of Ethics that applies to the registrant’s principal executive officer and principal financial officer. The registrant has not made any substantive amendments to its Code of Ethics during the period covered by this report. The registrant has not granted any waivers from any provisions of the Code of Ethics during the period covered by this report. A copy of the registrant’s Code of Ethics is incorporated by reference. See Item 13(a)(1).
Item 3. Audit Committee Financial Expert.
The registrant’s Board of Trustees has determined that Dr. Mary Schmid Daugherty, Ms. Susan Knight and Mr. Patrick Thiele, all members of the registrant’s Audit Committee, are “audit committee financial experts” as defined in Item 3 of Form N-CSR. Dr. Daugherty, Ms. Knight and Mr. Thiele are “independent” under the standards set forth in Item 3 of Form N-CSR.
Item 4. Principal Accountant Fees and Services.
Year Ended
December 31, | | | (a)
Audit Fees | | | (b)
Audit-
Related Fees | | (c)
Tax Fees | | | (d)
All Other
Fees |
| 2020 | | | $ | 113,200 | | | None | | $ | 21,465 | | | None |
| 2021 | | | $ | 118,860 | | | None | | $ | 22,535 | | | None |
| | (a) | Audit fees include amounts related to the audit of registrant’s annual financial statements and services normally provided by the accountant in connection with statutory and regulatory filings. |
| | | |
| | (c) | Tax fees include amounts related to tax advice and tax return preparation, compliance and reviews. |
| | | |
| | (d) | Tax consulting fee includes fees and expenses related to allowable tax consulting services. |
| | | |
| | (e)(1) | The registrant’s Audit Committee approves the engagement of the accountant before the accountant is engaged by the registrant and approved all audit and non-audit services provided to the registrant. |
| | | |
| | (e)(2) | None of such services described in columns (b) through (d) were subject to a waiver of the pre-approval requirement pursuant to paragraph (c)(7)(i)(c) of Rule 2-01 of Regulation S-X. |
| | | |
| | (f) | Not applicable |
| | | |
| | (g) | The aggregate fees for non-audit services rendered by the registrant’s accountant to the registrant were $21,465 for the fiscal year ended December 31, 2020 and $22,535 for the fiscal year ended December 31, 2021. The aggregate fees for non-audit services rendered by the registrant’s accountant to the registrant’s investment adviser were $23,145 for the fiscal year ended December 31, 2020. and $24,300 for the fiscal year ended December 31, 2021. |
| | (h) | The registrant’s Audit Committee has considered whether the provision of non-audit services by the registrant’s accountant to the registrant’s investment adviser is compatible with maintaining the accountant’s independence. |
Item 5. Audit Committee of Listed Registrants.
Not applicable to registrants who are not listed issuers (as defined in Rule 10A-3 under the Securities Exchange Act of 1934).
Item 6. Investments.
| (a) | Schedule of Investments is included as part of the report to shareholders filed under Item 1 of this Form |
Item 7. Disclosure of Proxy Voting Policies and Procedures for Closed-End Management Investment Companies.
Not applicable to open-end investment companies.
Item 8. Portfolio Managers of Closed-End Management Investment Companies.
Not applicable to open-end investment companies.
Item 9. Purchases of Equity Securities by Closed-End Management Investment Company and Affiliated Purchasers.
Not applicable to open-end investment companies.
Item 10. Submission of Matters to a Vote of Security Holders.
There has been no material change to the procedures by which shareholders may recommend nominees to the registrant’s board of directors.
Item 11. Controls and Procedures.
| (a) | The registrant’s principal executive officer and principal financial officer have evaluated the registrant’s disclosure controls and procedures as of a date within 90 days of the filing of this report and have concluded that the registrant’s disclosure controls and procedures were effective, as of that date, in ensuring that information required to be disclosed by the registrant in this Form N-CSR was recorded, processed, summarized and reported within the time period specified by the SEC’s rules and forms. |
| (b) | There were no changes in the Registrant's internal control over financial reporting (as defined in Rule 30a-3(d) under the Act) that occurred during the second fiscal quarter of the period covered by this report that has materially affected, or is reasonably likely to materially affect, the Registrant's internal control over financial reporting. |
Item 12. Disclosure of Securities Lending Activities for Closed-End Management Investment Companies
Not applicable to open-end investment companies.
Item 13. Exhibits.
Mairs & Power Funds Trust Code of Ethics for Principal Executive Officer and Principal Financial Officer.
Incorporated by reference to previous Form N-CSR filing, filed August 31, 2018.
Attached as exhibit 99.CERT to this form.
| (3) | Any written solicitation to purchase securities under Rule 23c-1 under the Act sent or given during the period covered by the report by or on behalf of the registrant to 10 or more persons. Not applicable to open-end investment companies. |
Attached as exhibit 99.906 CERT to this form.
SIGNATURES
Pursuant to the requirements of the Securities Exchange Act of 1934 and the Investment Company Act of 1940, the registrant has duly caused this report to be signed on its behalf by the undersigned, thereunto duly authorized.
| | (Registrant) | Mairs & Power Funds Trust | |
| | By (Signature and Title)* | /s/ Mark L. Henneman | |
| | | Mark L. Henneman, President | |
| | | Principal Executive Officer | |
Pursuant to the requirements of the Securities Exchange Act of 1934 and the Investment Company Act of 1940, this report has been signed below by the following persons on behalf of the registrant and in the capacities and on the dates indicated.
| | By (Signature and Title)* | /s/ Mark L. Henneman | |
| | | Mark L. Henneman, President | |
| | | Principal Executive Officer | |
| | By (Signature and Title)* | /s/ Elizabeth M. VanHeel | |
| | | Elizabeth M. VanHeel | |
| | | Acting Principal Financial Officer | |
* Print the name and title of each signing officer under his or her signature.