UNITED STATES
SECURITIES AND EXCHANGE COMMISSION
Washington, D.C. 20549
FORM N-CSR
CERTIFIED SHAREHOLDER REPORT
OF REGISTERED MANAGEMENT INVESTMENT COMPANIES
Investment Company Act file number 811-22649
iShares U.S. ETF Trust
(Exact name of registrant as specified in charter)
c/o: State Street Bank and Trust Company
100 Summer Street, 4th Floor, Boston, MA 02110
(Address of principal executive offices) (Zip code)
The Corporation Trust Company
1209 Orange Street, Wilmington, DE 19801
(Name and address of agent for service)
Registrant’s telephone number, including area code: (415) 670-2000
Date of fiscal year end: July 31, 2020
Date of reporting period: July 31, 2020
Item 1. Reports to Stockholders.
Copies of the annual reports transmitted to shareholders pursuant to Rule 30e-1 under the Investment Company Act of 1940 are attached.
 | JULY 31, 2020 |
| 2020 Annual Report | ||
iShares U.S. ETF Trust
| · | iShares Evolved U.S. Consumer Staples ETF | IECS | Cboe BZX |
| · | iShares Evolved U.S. Discretionary Spending ETF | IEDI | Cboe BZX |
| · | iShares Evolved U.S. Financials ETF | IEFN | Cboe BZX |
| · | iShares Evolved U.S. Healthcare Staples ETF | IEHS | Cboe BZX |
| · | iShares Evolved U.S. Innovative Healthcare ETF | IEIH | Cboe BZX |
| · | iShares Evolved U.S. Media and Entertainment ETF | IEME | Cboe BZX |
| · | iShares Evolved U.S. Technology ETF | IETC | Cboe BZX |
Beginning on January 1, 2021, as permitted by regulations adopted by the Securities and Exchange Commission, paper copies of each Fund’s shareholder reports will no longer be sent by mail, unless you specifically request paper copies of the reports from your financial intermediary, such as a broker-dealer or bank. Instead, the reports will be made available on a website, and you will be notified by mail each time a report is posted and provided with a website link to access the report.
You may elect to receive all future reports in paper free of charge. If you hold accounts through a financial intermediary, you can follow the instructions included with this disclosure, if applicable, or contact your financial intermediary to request that you continue to receive paper copies of your shareholder reports. Please note that not all financial intermediaries may offer this service. Your election to receive reports in paper will apply to all funds held with your financial intermediary.
If you already elected to receive shareholder reports electronically, you will not be affected by this change and you need not take any action. You may elect to receive electronic delivery of shareholder reports and other communications by contacting your financial intermediary. Please note that not all financial intermediaries may offer this service.
Dear Shareholder,
The last 12 months have been a time of sudden change in global financial markets, as a long period of growth and positive returns was interrupted in early 2020 by the emergence and spread of the coronavirus. For the first half of the reporting period, U.S. equities and bonds both delivered impressive returns, despite fears and doubts about the economy that were ultimately laid to rest with unprecedented monetary stimulus and a sluggish yet resolute performance from the U.S. economy. But as the threat from the coronavirus (or “COVID-19”) became more apparent throughout February and March 2020, countries around the world took economically disruptive countermeasures, causing a global recession and a sharp fall in equity prices. While markets have since recovered most of these losses as countries around the world adapt to life with the virus, lingering uncertainty about the depth and duration of the pandemic and an uptick in global infection rates tempered optimism late in the reporting period.
Returns for most securities were robust for the first half of the reporting period, as investors began to realize that the U.S. economy was maintaining the modest yet steady growth that had characterized this economic cycle. However, once stay-at-home orders and closures of non-essential businesses became widespread, many workers were laid off and unemployment claims spiked. The subsequent rapid decline in equity prices was followed by a slow recovery, and some economic indicators began to improve. U.S. large-capitalization stocks, which are often considered more resilient than smaller companies during market turbulence, advanced significantly. International equities from developed economies ended the 12-month reporting period with negative performance, while emerging market stocks posted a positive return.
The performance of different types of fixed-income securities diverged substantially due to a reduced investor appetite for risk. Treasuries benefited from the risk-off environment, and posted healthy returns, as the 10-year U.S. Treasury yield (which is inversely related to bond prices) fell to an all-time low. Investment-grade corporate bonds also delivered solid returns, while high-yield corporate returns were more modest due to credit concerns.
The U.S. Federal Reserve (the “Fed”) reduced interest rates three times in 2019, to support slowing economic growth. After the coronavirus outbreak, the Fed instituted two emergency rate cuts, pushing short-term interest rates close to zero. To stabilize credit markets, the Fed also implemented a new bond-buying program, as did several other central banks around the world, including the European Central Bank and the Bank of Japan.
Looking ahead, while coronavirus-related disruptions have clearly hindered worldwide economic growth, we believe that the global expansion is likely to continue once the outbreak subsides. Several risks remain, however, including a potential resurgence of the coronavirus amid loosened restrictions, policy fatigue among governments already deep into deficit spending, and structural damage to the financial system from lengthy economic interruptions.
Overall, we favor a moderately positive stance toward risk, and in particular toward credit given the extraordinary central bank measures taken in recent months. This support extends beyond investment-grade corporates and into high-yield, leading to attractive opportunities throughout the credit market. We believe that both U.S. Treasuries and sustainable investments can help provide portfolio resilience, and the disruption created by the coronavirus appears to be accelerating the shift toward sustainable investments. We remain neutral on equities overall while favoring European stocks, which are poised for cyclical upside as re-openings continue.
In this environment, our view is that investors need to think globally, extend their scope across a broad array of asset classes, and be nimble as market conditions change. We encourage you to talk with your financial advisor and visit blackrock.com for further insight about investing in today’s markets.
Sincerely,

Rob Kapito
BlackRock, Inc.

Rob Kapito
BlackRock, Inc.
| Total Returns as of July 31, 2020 | ||||
| 6-Month | 12-Month | |||
U.S. large cap equities | 2.42% | 11.96% | ||
U.S. small cap equities | (7.61) | (4.59) | ||
International equities | (7.34) | (1.67) | ||
Emerging market equities | 3.08 | 6.55 | ||
3-month Treasury bills | 0.48 | 1.46 | ||
U.S. Treasury securities | 9.92 | 15.55 | ||
U.S. investment grade bonds | 5.69 | 10.12 | ||
Tax-exempt municipal bonds | 1.75 | 4.89 | ||
U.S. high yield bonds | 0.62 | 4.07 | ||
| Past performance is no guarantee of future results. Index performance is shown for illustrative purposes only. You cannot invest directly in an index. | ||||
| 2 | THIS PAGEISNOT PARTOF YOUR FUND REPORT |
| Page | ||||
| 2 | ||||
| 4 | ||||
| 5 | ||||
| 19 | ||||
| 19 | ||||
| 20 | ||||
Financial Statements: | ||||
| 44 | ||||
| 46 | ||||
| 48 | ||||
| 52 | ||||
| 59 | ||||
| 67 | ||||
| 68 | ||||
| 69 | ||||
| 71 | ||||
| 74 | ||||
| 76 | ||||
| 77 | ||||
| 3 |
iShares U.S. ETF Trust
Domestic Market Overview
The coronavirus pandemic and the resulting economic disruptions led to high volatility in the 12 months ended July 31, 2020 (“reporting period”), as investors tried to assess the economic impact. A steep decline in stocks, beginning in late February 2020, was followed by a steady recovery, leading to a return of 10.93% for the Russell 3000® Index, a broad measure of U.S. equity market performance. Large capitalization stocks performed particularly well, with the S&P 500® Index returning 11.96% for the reporting period.
The first half of the reporting period was characterized by a steadily improving economy and a strong job market. The U.S. set a record for the most consecutive months of both economic growth and job growth, as the unemployment rate declined to its lowest level in 50 years. Equity markets were further buoyed by a tentative trade agreement between the U.S. and China in December 2019.
However, the economic expansion was abruptly interrupted in February 2020, as the coronavirus began to spread globally, and the U.S. economy declined into a deep recession. As the U.S. and other countries began to limit travel and economic activity, in an attempt to reduce the transmission of the coronavirus, equity markets sank, and stocks in the U.S. posted their steepest declines since the 2008 financial crisis.
Following the issuance of stay-at-home orders and other restrictions on public gatherings and nonessential work, whole portions of the U.S. economy shut down. Businesses associated with travel and leisure were particularly affected, as air traffic declined, and conferences and events were postponed. Unemployment increased dramatically as record jobless claims brought the unemployment rate up to 14.7% in April 2020, the highest rate since the Great Depression.
In response to the crisis, the federal government enacted several rounds of stimulus spending, including the U.S. $1.8 trillion CARES Act. The stimulus was designed to stabilize affected industries, make loans to small businesses, and provide direct cash payments to individuals. In April 2020, an additional U.S. $484 billion in aid for small businesses and hospitals was added, and in July 2020 congress began negotiating another round of stimulus as the impact of the coronavirus continued to disrupt the economy.
The U.S. Federal Reserve Bank (“Fed”), which had already lowered interest rates three times in 2019 to boost a slowing economy, also responded to the crisis with unprecedented monetary policy measures. In March 2020, the Fed enacted two emergency interest rate reductions to restore confidence in markets, bringing short-term interest rates down to a range of 0.00% – 0.25%. The Fed further acted to stabilize credit markets by purchasing U.S. Treasuries, corporate and municipal bonds, and securities backed by mortgages and auto loans.
The combination of support from government stimulus, Fed intervention, and optimism surrounding development of a coronavirus vaccine led to a significant recovery in stock prices beginning in late March 2020. Despite a substantial economic contraction of 9.5% in the second quarter of 2020, a record setting quarterly decline, investors were encouraged by signs of improving economic conditions in May and June 2020 as unemployment declined and consumer spending increased. While corporate earnings were significantly down overall in the second quarter of 2020, investors anticipated that further economic progress and new developments in treating the virus would lead to higher future earnings growth. By the end of the reporting period, many stock prices were near their pre-coronavirus highs.
| 4 | 2020ISHARES ANNUAL REPORTTO SHAREHOLDERS |
Investment Objective
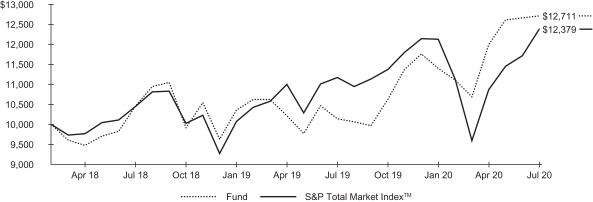
The iShares Evolved U.S. Consumer Staples ETF (the “Fund”) seeks to provide access to U.S. companies with consumer staples exposure, as classified using a proprietary classification system. The Fund is an actively managed exchange-traded fund that does not seek to replicate the performance of a specified index.
Performance
| Average Annual Total Returns | Cumulative Total Returns | |||||||||||||||||||
| 1 Year | Since Inception | 1 Year | Since Inception | |||||||||||||||||
Fund NAV | 4.56 | % | 8.86 | % | 4.56 | % | 22.24 | % | ||||||||||||
Fund Market | 4.45 | 8.84 | 4.45 | 22.19 | ||||||||||||||||
S&P Total Market IndexTM | 10.80 | 9.47 | 10.80 | 23.79 | ||||||||||||||||
GROWTH OF $10,000 INVESTMENT
(SINCE INCEPTION AT NET ASSET VALUE)
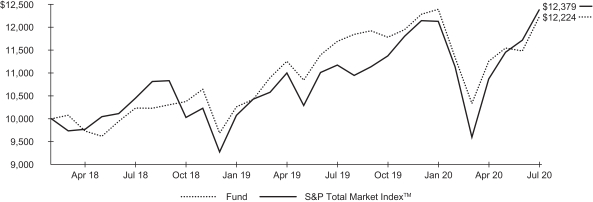
The inception date of the Fund was 3/21/18. The first day of secondary market trading was 3/23/18.
The S&P Total Market IndexTM is an unmanaged index designed to track the broad equity market, including large-, mid-, small-, and micro-cap stocks.
Past performance is no guarantee of future results. Performance results do not reflect the deduction of taxes that a shareholder would pay on fund distributions or on the redemption or sale of fund shares. See “About Fund Performance” on page 19 for more information.
Expense Example
| Actual | Hypothetical 5% Return | |||||||||||||||||||||||||||||
| | Beginning Account Value (02/01/20) | | | Ending Account Value (07/31/20) | | | Expenses Paid During the Period | (a) | | Beginning Account Value (02/01/20) | | | Ending Account Value (07/31/20) | | | Expenses Paid During the Period | (a) | | Annualized Expense Ratio | | ||||||||||
| $ | 1,000.00 | $ | 986.50 | $ | 0.94 | $ | 1,000.00 | $ | 1,023.90 | $ | 0.96 | 0.19 | % | |||||||||||||||||
| (a) | Expenses are calculated using the Fund’s annualized expense ratio (as disclosed in the table), multiplied by the average account value for the period, multiplied by the number of days in the period (182 days) and divided by the number of days in the year (366 days). See “Shareholder Expenses” on page 19 for more information. |
FUND SUMMARY | 5 |
| Fund Summary as of July 31, 2020 (continued) | iShares® Evolved U.S. Consumer Staples ETF |
Portfolio Management Commentary
U.S. consumer staples stocks advanced during the reporting period, as companies benefited from continued demand and low exposure to international supply chains that were disrupted during the coronavirus pandemic. Consumers shifted away from in-person restaurant visits and toward eating at home in response to the coronavirus, strengthening some consumer staples companies while weakening others. Lower interest rates also increased the appeal of consumer staples stocks, which often pay substantial dividends.
Demand rose for some consumer staples used in the home during the pandemic. Food companies, which includes General Mills and other makers of consumer food products, contributed substantially to the Fund’s return. Demand for packaged foods like Cheerios increased considerably during the coronavirus pandemic, as consumers built reserves in anticipation of further disruptions. Makers of household products, such as Procter & Gamble, also benefited from changing purchasing patterns during the pandemic. Coronavirus-related concerns drove demand for household cleaning supplies, including Mr. Clean, as consumers became more conscious about keeping surfaces disinfected. However, the shift of work from offices to homes also transferred demand for commercial bathroom tissue to consumer bathroom tissue brands, such as Charmin. Beverage and soft drink company stocks, including PepsiCo and Monster Beverage, advanced during the reporting period. Drink makers created new outlets for direct online sales, even as the closing of restaurants reduced beverage revenue.
On the downside, restaurants detracted from the Fund’s return. Many restaurant stocks, such as Starbucks, declined significantly due to coronavirus-related restrictions. Earnings decreased considerably amid substantially lower same-store sales, as numerous restaurant locations closed temporarily or limited operations to drive-through and takeout.
The Fund’s evolved investment process looks beyond the traditional sector definitions by applying machine learning and natural language processing to group individual companies with related business activity. During the reporting period, the evolved process identified several consumer staples companies with similar businesses that have traditionally been categorized in other sectors. For instance, the Fund held positions in Chipotle Mexican Grill, Yum China Holdings, and Wingstop, which are generally classified as companies in the consumer discretionary sector. These particular stocks contributed to performance, partly due to effective takeout offerings, despite the overall decline in restaurant visits during the pandemic.
Portfolio Information
ALLOCATION BY SECTOR
| Sector | | Percent of Total Investments | (a) | |
Beverages | 29.0 | % | ||
Food | 25.4 | |||
Retail | 11.8 | |||
Cosmetics & Personal Care | 11.3 | |||
Agriculture | 10.8 | |||
Household Products & Wares | 3.0 | |||
Packaging & Containers | 2.8 | |||
Pharmaceuticals | 2.5 | |||
Real Estate Investment Trusts | 1.4 | |||
Chemicals | 1.1 | |||
Other (each representing less than 1%) | 0.9 |
TEN LARGEST HOLDINGS
| Security | | Percent of Total Investments | (a) | |
Coca-Cola Co. (The) | 11.0 | % | ||
PepsiCo Inc. | 10.7 | |||
Procter & Gamble Co. (The) | 8.6 | |||
Mondelez International Inc., Class A | 4.6 | |||
Philip Morris International Inc. | 4.6 | |||
McDonald’s Corp. | 4.4 | |||
Altria Group Inc. | 4.1 | |||
Starbucks Corp. | 3.8 | |||
General Mills Inc. | 3.6 | |||
Monster Beverage Corp. | 2.8 |
| (a) | Excludes money market funds. |
| 6 | 2020ISHARES ANNUAL REPORTTO SHAREHOLDERS |
| Fund Summary as of July 31, 2020 | iShares® Evolved U.S. Discretionary Spending ETF |
Investment Objective
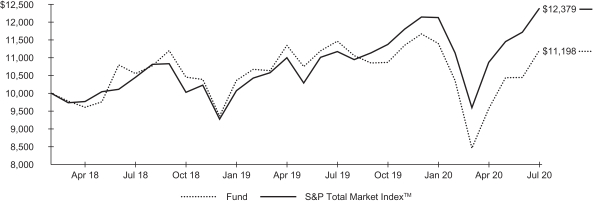
The iShares Evolved U.S. Discretionary Spending ETF (the “Fund”) seeks to provide access to U.S. companies with discretionary spending exposure, as classified using a proprietary classification system. The Fund is an actively managed exchange-traded fund that does not seek to replicate the performance of a specified index.
Performance
| Average Annual Total Returns | Cumulative Total Returns | |||||||||||||||||||
| 1 Year | Since Inception | 1 Year | Since Inception | |||||||||||||||||
Fund NAV | 18.11 | % | 16.15 | % | 18.11 | % | 42.47 | % | ||||||||||||
Fund Market | 18.04 | 16.13 | 18.04 | 42.42 | ||||||||||||||||
S&P Total Market IndexTM | 10.80 | 9.47 | 10.80 | 23.79 | ||||||||||||||||
GROWTH OF $10,000 INVESTMENT
(SINCE INCEPTION AT NET ASSET VALUE)
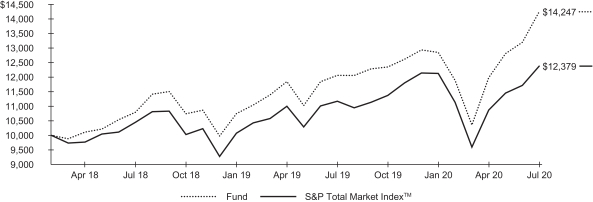
The inception date of the Fund was 3/21/18. The first day of secondary market trading was 3/23/18.
The S&P Total Market IndexTM is an unmanaged index designed to track the broad equity market, including large-, mid-, small-, and micro-cap stocks.
Past performance is no guarantee of future results. Performance results do not reflect the deduction of taxes that a shareholder would pay on fund distributions or on the redemption or sale of fund shares. See “About Fund Performance” on page 19 for more information.
Expense Example
| Actual | Hypothetical 5% Return | |||||||||||||||||||||||||||||
| | Beginning Account Value (02/01/20) | | | Ending Account Value (07/31/20) | | | Expenses Paid During the Period | (a) | | Beginning Account Value (02/01/20) | | | Ending Account Value (07/31/20) | | | Expenses Paid During the Period | (a) | | Annualized Expense Ratio | | ||||||||||
| $ | 1,000.00 | $ | 1,108.80 | $ | 0.94 | $ | 1,000.00 | $ | 1,024.00 | $ | 0.91 | 0.18 | % | |||||||||||||||||
| (a) | Expenses are calculated using the Fund’s annualized expense ratio (as disclosed in the table), multiplied by the average account value for the period, multiplied by the number of days in the period (182 days) and divided by the number of days in the year (366 days). See “Shareholder Expenses” on page 19 for more information. |
FUND SUMMARY | 7 |
| Fund Summary as of July 31, 2020 (continued) | iShares® Evolved U.S. Discretionary Spending ETF |
Portfolio Management Commentary
Stocks related to U.S. discretionary spending advanced strongly for the reporting period, as coronavirus-related restrictions reinforced the shift toward online buying across industries. However, the mix of goods consumers purchased online changed considerably due to the recession and the pandemic.
E-commerce retailers, such as Amazon.com, advanced significantly during the reporting period. The temporary closure of many brick-and-mortar retailers and shortages of some goods accelerated the preexisting shift toward e-commerce, with consumers increasingly buying essential goods online. The Amazon Marketplace, which allows other companies and individuals to sell goods on Amazon.com for a fee, was a driver of growth, as small businesses tapped into e-commerce during the pandemic. Amazon’s large customer base and wide selection of products made it the default choice for many new online buyers of items like bathroom tissue, but traditional retailers with a strong e-commerce platform, such as Target Corporation, also increased their online sales.
The shift toward increased use of technology as more people stayed at home benefited consumer technology companies as well, most notably Apple. Demand for wearable technology like the Apple Watch, which has many health applications, continued to expand. Apple’s revenue from services, such as the App Store and Apple Pay, also rose as consumers increased in-app purchases and stores expanded contactless payment support during the pandemic.
As consumers stayed home, they also spent money on home goods. Home improvement retail stocks, such as Home Depot and Lowe’s Companies, advanced meaningfully amid increased consumer demand for materials for do-it-yourself projects. Superstores like Walmart benefited from higher demand for essential goods, as well as home improvement supplies.
The Fund’s evolved investment process looks beyond the traditional sector definitions by applying machine learning and natural language processing to group individual companies with related business activity. During the reporting period, the evolved process identified several discretionary spending companies with similar businesses that have traditionally been categorized in other sectors. For instance, the Fund held positions in Apple, PayPal Holdings, and Square, which are generally classified as companies in the information technology sector. These stocks posted substantial gains as customers turned to contactless payments to avoid exposure to the coronavirus.
Portfolio Information
ALLOCATION BY SECTOR
| Sector | | Percent of Total Investments | (a) | |
Retail | 50.1 | % | ||
Internet | 23.8 | |||
Computers | 6.0 | |||
Apparel | 5.8 | |||
Cosmetics & Personal Care | 3.9 | |||
Commercial Services | 2.0 | |||
Lodging | 1.8 | |||
Food | 1.5 | |||
Distribution & Wholesale | 1.0 | |||
Other (each representing less than 1%) | 4.1 |
TEN LARGEST HOLDINGS
| Security | | Percent of Total Investments | (a) | |
Amazon.com Inc. | 20.0 | % | ||
Home Depot Inc. (The) | 8.2 | |||
Walmart Inc. | 6.1 | |||
Apple Inc. | 6.0 | |||
Costco Wholesale Corp. | 4.8 | |||
Nike Inc., Class B | 3.5 | |||
Lowe’s Companies Inc. | 3.1 | |||
McDonald’s Corp. | 3.1 | |||
Procter & Gamble Co. (The) | 2.9 | |||
TJX Companies Inc. (The) | 2.4 |
| (a) | Excludes money market funds. |
| 8 | 2020ISHARES ANNUAL REPORTTO SHAREHOLDERS |
| Fund Summary as of July 31, 2020 | iShares® Evolved U.S. Financials ETF |
Investment Objective
The iShares Evolved U.S. Financials ETF (the “Fund”) seeks to provide access to U.S. companies with financials exposure, as classified using a proprietary classification system. The Fund is an actively managed exchange-traded fund that does not seek to replicate the performance of a specified index.
Performance
| Average Annual Total Returns | Cumulative Total Returns | |||||||||||||||||||
| 1 Year | Since Inception | 1 Year | Since Inception | |||||||||||||||||
Fund NAV | (15.10 | )% | (5.83 | )% | (15.10 | )% | (13.23 | )% | ||||||||||||
Fund Market | (15.06 | ) | (5.81 | ) | (15.06 | ) | (13.19 | ) | ||||||||||||
S&P Total Market IndexTM | 10.80 | 9.47 | 10.80 | 23.79 | ||||||||||||||||
GROWTH OF $10,000 INVESTMENT
(SINCE INCEPTION AT NET ASSET VALUE)
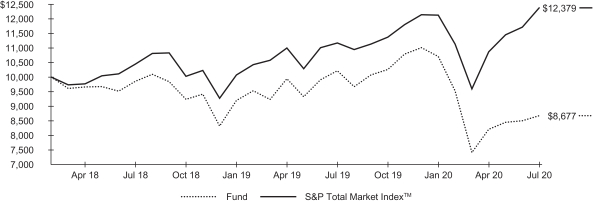
The inception date of the Fund was 3/21/18. The first day of secondary market trading was 3/23/18.
The S&P Total Market IndexTM is an unmanaged index designed to track the broad equity market, including large-, mid-, small-, and micro-cap stocks.
Past performance is no guarantee of future results. Performance results do not reflect the deduction of taxes that a shareholder would pay on fund distributions or on the redemption or sale of fund shares. See “About Fund Performance” on page 19 for more information.
Expense Example
| Actual | Hypothetical 5% Return | |||||||||||||||||||||||||||||
| | Beginning Account Value (02/01/20) | | | Ending Account Value (07/31/20) | | | Expenses Paid During the Period | (a) | | Beginning Account Value (02/01/20) | | | Ending Account Value (07/31/20) | | | Expenses Paid During the Period | (a) | | Annualized Expense Ratio | | ||||||||||
| $ | 1,000.00 | $ | 810.20 | $ | 0.86 | $ | 1,000.00 | $ | 1,023.90 | $ | 0.96 | 0.19 | % | |||||||||||||||||
| (a) | Expenses are calculated using the Fund’s annualized expense ratio (as disclosed in the table), multiplied by the average account value for the period, multiplied by the number of days in the period (182 days) and divided by the number of days in the year (366 days). See “Shareholder Expenses” on page 19 for more information. |
FUND SUMMARY | 9 |
| Fund Summary as of July 31, 2020 (continued) | iShares® Evolved U.S. Financials ETF |
Portfolio Management Commentary
Financials stocks declined sharply for the reporting period. Although financials stocks advanced steadily in 2019 amid solid economic growth and a favorable regulatory environment, the economic disruption precipitated by the coronavirus pandemic led to sharp declines among financials stocks. The Fed’s stimulus, which reduced interest rates to historically low levels, further pressured the profitability of many financials companies.
Banks detracted the most from the Fund’s performance, as lower asset prices led to reduced management fees, and declining consumer spending prompted concerns that credit demand would weaken. For example, Wells Fargo, a large diversified bank, declined significantly amid sharply higher loan loss provisions in anticipation of more defaults. The bank’s dividend reduction and lingering effects of earlier scandals also contributed to declines. Similarly, Citigroup declined due to an increase in bad loans and expectations of further defaults amid higher unemployment and rising bankruptcies. Smaller regional banks like Truist Financial also detracted amid expectations of higher loan defaults.
Insurance companies were also notable detractors, led by life insurance companies, such as Prudential Financial, which declined amid expectations of policy losses from pandemic-related deaths and lower income as bond yields declined. An increase in coronavirus-related workers compensation and travel claims weighed on large insurance companies operating in multiple segments, such as AIG. Revenues also declined due to lower premiums and investment losses. Consumer finance companies weakened as consumer credit card spending declined amid the pandemic. For example, lower entertainment and travel spending, both of which declined sharply amid pandemic-related travel restrictions, weighed heavily on American Express.
The Fund’s evolved investment process looks beyond the traditional sector definitions by applying machine learning and natural language processing to group individual companies with related business activity. During the reporting period, the evolved process identified several financials companies with similar businesses that have traditionally been categorized in other sectors. For example, the process identified several managed healthcare companies, including UnitedHealth, which benefited amid lower payments for medical care during the pandemic. Mastercard, an electronic payment processor in the software and services industry, benefited from expectations of continued growth in digital payments, especially in emerging markets.
Portfolio Information
ALLOCATION BY SECTOR
| Sector | | Percent of Total Investments | (a) | |
Banks | 39.9 | % | ||
Insurance | 26.5 | |||
Diversified Financial Services | 14.1 | |||
Commercial Services | 6.0 | |||
Health Care — Services | 3.9 | |||
Software | 3.6 | |||
Savings & Loans | 1.2 | |||
Other (each representing less than 1%) | 4.8 |
TEN LARGEST HOLDINGS
| Security | | Percent of Total Investments | (a) | |
Bank of America Corp. | 4.5 | % | ||
JPMorgan Chase & Co. | 4.3 | |||
Wells Fargo & Co. | 4.1 | |||
Citigroup Inc. | 3.4 | |||
Berkshire Hathaway Inc., Class B | 2.8 | |||
Goldman Sachs Group Inc. (The) | 2.5 | |||
Truist Financial Corp. | 2.3 | |||
U.S. Bancorp. | 2.3 | |||
Progressive Corp. (The) | 2.2 | |||
Morgan Stanley | 2.2 |
| (a) | Excludes money market funds. |
| 10 | 2020ISHARES ANNUAL REPORTTO SHAREHOLDERS |
| Fund Summary as of July 31, 2020 | iShares® Evolved U.S. Healthcare Staples ETF |
Investment Objective
The iShares Evolved U.S. Healthcare Staples ETF (the “Fund”) seeks to provide access to U.S. companies with healthcare staples exposure, as classified using a proprietary classification system. The Fund is an actively managed exchange-traded fund that does not seek to replicate the performance of a specified index.
Performance
| Average Annual Total Returns | Cumulative Total Returns | |||||||||||||||||||
| 1 Year | Since Inception | 1 Year | Since Inception | |||||||||||||||||
Fund NAV | 15.04 | % | 14.81 | % | 15.04 | % | 38.61 | % | ||||||||||||
Fund Market | 15.07 | 14.82 | 15.07 | 38.65 | ||||||||||||||||
S&P Total Market IndexTM | 10.80 | 9.47 | 10.80 | 23.79 | ||||||||||||||||
GROWTH OF $10,000 INVESTMENT
(SINCE INCEPTION AT NET ASSET VALUE)
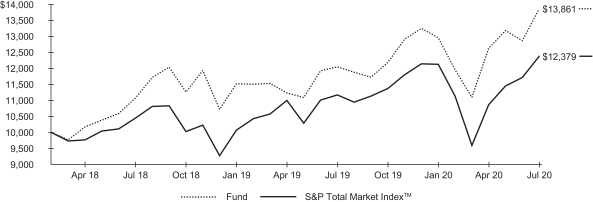
The inception date of the Fund was 3/21/18. The first day of secondary market trading was 3/23/18.
The S&P Total Market IndexTM is an unmanaged index designed to track the broad equity market, including large-, mid-, small-, and micro-cap stocks.
Past performance is no guarantee of future results. Performance results do not reflect the deduction of taxes that a shareholder would pay on fund distributions or on the redemption or sale of fund shares. See “About Fund Performance” on page 19 for more information.
Expense Example
| Actual | Hypothetical 5% Return | |||||||||||||||||||||||||||||
| | Beginning Account Value (02/01/20) | | | Ending Account Value (07/31/20) | | | Expenses Paid During the Period | (a) | | Beginning Account Value (02/01/20) | | | Ending Account Value (07/31/20) | | | Expenses Paid During the Period | (a) | | Annualized Expense Ratio | | ||||||||||
| $ | 1,000.00 | $ | 1,069.70 | $ | 0.93 | $ | 1,000.00 | $ | 1,024.00 | $ | 0.91 | 0.18 | % | |||||||||||||||||
| (a) | Expenses are calculated using the Fund’s annualized expense ratio (as disclosed in the table), multiplied by the average account value for the period, multiplied by the number of days in the period (182 days) and divided by the number of days in the year (366 days). See “Shareholder Expenses” on page 19 for more information. |
FUND SUMMARY | 11 |
| Fund Summary as of July 31, 2020 (continued) | iShares® Evolved U.S. Healthcare Staples ETF |
Portfolio Management Commentary
U.S. healthcare staples stocks advanced strongly during the reporting period, rebounding after a sharp coronavirus-related market decline to end the reporting period with significant gains amid investor optimism about coronavirus treatments and vaccines and higher demand for testing and laboratory equipment. Healthcare equipment stocks contributed the most to the Fund’s return, bolstered by medical device innovations to treat chronic diseases. For example, Abbott Laboratories advanced due to strong sales and new devices for continuous blood-glucose monitoring that can work together with an insulin pump for managing diabetes. Strong demand for the company’s COVID-19 infection and antibody tests, which offered relatively fast delivery of test results, also drove gains. Similarly, the need for remote consultations with diabetic patients, who generally experience worse outcomes from contracting the coronavirus, drove strong sales of DexCom’s smart blood sugar monitor, which transmits the patient’s data to physicians.
Danaher Corporation benefited from strong sales of its rapid COVID-19 test, which eliminates the lag time of laboratory analysis, enabling higher testing levels and quicker responses to outbreaks. Emergency U.S. Food and Drug Administration approval of the company’s test that identifies coronavirus antibodies also supported Danaher’s gains.
Managed healthcare companies, such as UnitedHealth Group, posted strong earnings growth as consumers delayed medical care during the pandemic, which also postponed treatment payments. The life sciences tools and services industry was a modest contributor, largely due to Thermo Fisher Scientific, as lower demand for some scientific instruments amid coronavirus disruptions was more than offset by rising sales of equipment used for developing coronavirus vaccines and treatments.
The Fund’s evolved investment process looks beyond traditional sector definitions by applying machine learning and natural language processing to group individual companies with related business activities. More specifically, the evolved investment process identified several companies with healthcare-related businesses in the healthcare real estate investment trusts industry. Senior care facilities like Ventas and Welltower generally declined due to lower occupancy rates and higher health and safety expenses after the coronavirus outbreak, which detracted from the Fund’s performance for the reporting period. However, Medical Properties Trust, a company that leases properties to hospitals, was more resilient and contributed marginally to performance, as occupancy rates remained high during the pandemic.
Portfolio Information
ALLOCATION BY SECTOR
| Sector | | Percent of Total Investments | (a) | |
Health Care — Products | 47.6 | % | ||
Health Care — Services | 25.7 | |||
Pharmaceuticals | 17.2 | |||
Biotechnology | 4.1 | |||
Real Estate Investment Trusts | 1.3 | |||
Electronics | 1.3 | |||
Other (each representing less than 1%) | 2.8 |
TEN LARGEST HOLDINGS
| Security | | Percent of Total Investments | (a) | |
UnitedHealth Group Inc. | 11.0 | % | ||
Abbott Laboratories | 8.5 | |||
Medtronic PLC | 6.0 | |||
Johnson & Johnson | 5.0 | |||
Thermo Fisher Scientific Inc. | 4.4 | |||
Danaher Corp. | 3.9 | |||
Intuitive Surgical Inc. | 3.6 | |||
Becton Dickinson and Co. | 3.3 | |||
Stryker Corp. | 3.0 | |||
CVS Health Corp. | 2.6 |
| (a) | Excludes money market funds. |
| 12 | 2020ISHARES ANNUAL REPORTTO SHAREHOLDERS |
| Fund Summary as of July 31, 2020 | iShares® Evolved U.S. Innovative Healthcare ETF |
Investment Objective
The iShares Evolved U.S. Innovative Healthcare ETF (the “Fund”) seeks to provide access to U.S. companies with innovative healthcare exposure, as classified using a proprietary classification system. The Fund is an actively managed exchange-traded fund that does not seek to replicate the performance of a specified index.
Performance
| Average Annual Total Returns | Cumulative Total Returns | |||||||||||||||||||
| 1 Year | Since Inception | 1 Year | Since Inception | |||||||||||||||||
Fund NAV | 25.31 | % | 10.68 | % | 25.31 | % | 27.11 | % | ||||||||||||
Fund Market | 25.26 | 10.68 | 25.26 | 27.11 | ||||||||||||||||
S&P Total Market IndexTM | 10.80 | 9.47 | 10.80 | 23.79 | ||||||||||||||||
GROWTH OF $10,000 INVESTMENT
(SINCE INCEPTION AT NET ASSET VALUE)
The inception date of the Fund was 3/21/18. The first day of secondary market trading was 3/23/18.
The S&P Total Market IndexTM is an unmanaged index designed to track the broad equity market, including large-, mid-, small-, and micro-cap stocks.
Past performance is no guarantee of future results. Performance results do not reflect the deduction of taxes that a shareholder would pay on fund distributions or on the redemption or sale of fund shares. See “About Fund Performance” on page 19 for more information.
Expense Example
| Actual | Hypothetical 5% Return | |||||||||||||||||||||||||||||
| | Beginning Account Value (02/01/20) | | | Ending Account Value (07/31/20) | | | Expenses Paid During the Period | (a) | | Beginning Account Value (02/01/20) | | | Ending Account Value (07/31/20) | | | Expenses Paid During the Period | (a) | | Annualized Expense Ratio | | ||||||||||
| $ | 1,000.00 | $ | 1,115.10 | $ | 0.95 | $ | 1,000.00 | $ | 1,024.00 | $ | 0.91 | 0.18 | % | |||||||||||||||||
| (a) | Expenses are calculated using the Fund’s annualized expense ratio (as disclosed in the table), multiplied by the average account value for the period, multiplied by the number of days in the period (182 days) and divided by the number of days in the year (366 days). See “Shareholder Expenses” on page 19 for more information. |
FUND SUMMARY | 13 |
| Fund Summary as of July 31, 2020 | iShares® Evolved U.S. Innovative Healthcare ETF |
Portfolio Management Commentary
U.S. innovative healthcare stocks advanced strongly despite disruption created by the coronavirus pandemic. During the first half of the reporting period, the Fund advanced steadily amid ongoing innovations in gene-based therapies, a favorable regulatory environment, clinical successes, and merger and acquisition activity. Following the emergence of the coronavirus, innovative healthcare stocks initially declined along with broad global markets but rebounded to post strong gains for the reporting period.
Biotechnology companies focusing on treatment and vaccines for the coronavirus were principal drivers of the Fund’s return. For example, Regeneron advanced sharply after announcing its intent to make an antibody therapy for treating and preventing the coronavirus. The drug uses genetic material to generate antibodies that provoke an immune response by blocking the spiky proteins that infect human cells. AbbVie’s announcement of a plan to develop a coronavirus treatment, along with continued diversification via acquisitions and development partnerships, bolstered the industry.
Biotechnology companies producing treatments for chronic conditions that increase the likelihood of severe coronavirus illness also performed well. Companies such as Vertex Pharmaceuticals raised earnings forecasts amid strong sales of its treatment for cystic fibrosis, a genetic lung disease.
Pharmaceuticals companies contributed modestly, driven by optimism about using existing medications for treating coronavirus complications. For example, Eli Lilly began a study to look at the use of its rheumatoid arthritis drug to reduce inflammation caused by COVID-19. Industry consolidation, such as Bristol Myers Squibb’s acquisition of Celgene, which resulted in a stronger pipeline, was also beneficial.
The Fund’s evolved investment process looks beyond traditional sector definitions by applying machine learning and natural language processing to group individual companies with related business activity. As of the end of the reporting period, the Fund’s portfolio consisted primarily of biotechnology and pharmaceuticals companies that emphasize innovation, but also included companies in diverse industries such as medical equipment. For example, DexCom, which makes smart blood-glucose monitors, posted strong sales during the pandemic, as physicians sought tools for remote consultations with diabetic patients, who are at higher risk for complications from the coronavirus.
Portfolio Information
ALLOCATION BY SECTOR
| Sector | | Percent of Total Investments | (a) | |
Pharmaceuticals | 48.0 | % | ||
Biotechnology | 47.1 | |||
Health Care — Products | 3.3 | |||
Health Care — Services | 1.4 | |||
Other (each representing less than 1%) | 0.2 |
TEN LARGEST HOLDINGS
| Security | | Percent of Total Investments | (a) | |
Johnson & Johnson | 8.8 | % | ||
Merck & Co. Inc. | 6.2 | |||
Pfizer Inc. | 5.5 | |||
AbbVie Inc. | 5.0 | |||
Amgen Inc. | 4.9 | |||
Vertex Pharmaceuticals Inc. | 4.7 | |||
Eli Lilly & Co. | 4.7 | |||
Regeneron Pharmaceuticals Inc. | 4.7 | |||
Bristol-Myers Squibb Co. | 4.5 | |||
Gilead Sciences Inc. | 4.1 |
| (a) | Excludes money market funds. |
| 14 | 2020ISHARES ANNUAL REPORTTO SHAREHOLDERS |
| Fund Summary as of July 31, 2020 | iShares® Evolved U.S. Media and Entertainment ETF |
Investment Objective
The iShares Evolved U.S. Media and Entertainment ETF (the “Fund”) seeks to provide access to U.S. companies with media and entertainment exposure, as classified using a proprietary classification system. The Fund is an actively managed exchange-traded fund that does not seek to replicate the performance of a specified index.
Performance
| Average Annual Total Returns | Cumulative Total Returns | |||||||||||||||||||
| 1 Year | Since Inception | 1 Year | Since Inception | |||||||||||||||||
Fund NAV | (2.33 | )% | 4.90 | % | (2.33 | )% | 11.98 | % | ||||||||||||
Fund Market | (2.33 | ) | 4.92 | (2.33 | ) | 12.02 | ||||||||||||||
S&P Total Market IndexTM | 10.80 | 9.47 | 10.80 | 23.79 | ||||||||||||||||
GROWTH OF $10,000 INVESTMENT
(SINCE INCEPTION AT NET ASSET VALUE)
The inception date of the Fund was 3/21/18. The first day of secondary market trading was 3/23/18.
The S&P Total Market IndexTM is an unmanaged index designed to track the broad equity market, including large-, mid-, small-, and micro-cap stocks.
Past performance is no guarantee of future results. Performance results do not reflect the deduction of taxes that a shareholder would pay on fund distributions or on the redemption or sale of fund shares. See “About Fund Performance” on page 19 for more information.
Expense Example
| Actual | Hypothetical 5% Return | |||||||||||||||||||||||||||||
| | Beginning Account Value (02/01/20) | | | Ending Account Value (07/31/20) | | | Expenses Paid During the Period | (a) | | Beginning Account Value (02/01/20) | | | Ending Account Value (07/31/20) | | | Expenses Paid During the Period | (a) | | Annualized Expense Ratio | | ||||||||||
| $ | 1,000.00 | $ | 982.20 | $ | 0.94 | $ | 1,000.00 | $ | 1,023.90 | $ | 0.96 | 0.19 | % | |||||||||||||||||
| (a) | Expenses are calculated using the Fund’s annualized expense ratio (as disclosed in the table), multiplied by the average account value for the period, multiplied by the number of days in the period (182 days) and divided by the number of days in the year (366 days). See “Shareholder Expenses” on page 19 for more information. |
FUND SUMMARY | 15 |
| Fund Summary as of July 31, 2020 (continued) | iShares® Evolved U.S. Media and Entertainment ETF |
Portfolio Management Commentary
U.S. media and entertainment stocks declined modestly for the reporting period, as the coronavirus pandemic changed the landscape of the industry. Pandemic-related restrictions forced entertainment venues to close, sharply reducing media companies’ revenue. Partially offsetting these losses, home entertainment sales rose as consumers stayed home.
Broadcasting stocks drove detraction from the Fund’s performance amid pandemic-related disruptions, especially canceled entertainment productions. The mass media company ViacomCBS declined as new movie productions and releases were postponed and movie theaters closed, accelerating pre-existing weakness in movie theatre admissions. The canceled NCAA basketball tournament and consumers dropping their cable television subscriptions also weighed on revenue. Fox Corporation, whose revenue is dependent on local broadcast stations, also detracted amid declining advertising revenues.
Entertainment conglomerate Walt Disney was a significant detractor from the Fund’s return. Closed theme parks and resorts, cruise line suspensions, and disrupted studio operations drove sharply lower revenue. Additionally, delayed major league sports seasons constrained Disney’s ESPN revenues. However, these losses were partially offset by growth in the company’s new streaming service, Disney Plus.
On the upside, home digital entertainment contributed to the Fund’s performance due to an increase in online games played during pandemic-related restrictions. Activision Blizzard advanced amid strong demand for its newly released game, Warzone, Call of Duty. Video game maker ElectronicArts also advanced due to the popularity of several of its franchises, including Star Wars, and strong live-services revenue.
Internet service providers were also significant contributors, as consumers increased internet use during stay-at-home restrictions. Charter Communications, for example, advanced due to increased broadband internet subscriptions.
The Fund’s evolved investment process looks beyond the traditional sector definitions by applying machine learning and natural language processing to group individual companies with related business activity. During the reporting period, the evolved process identified several media and entertainment companies with similar businesses that have traditionally been categorized in other sectors. For example, Hasbro, a toy and game manufacturer in the consumer discretionary sector, which detracted from the Fund’s performance, expanded its presence into digital media, adding properties such as Peppa Pig to its portfolio. Hasbro’s stock declined amid investor concerns that disruptions to Chinese manufacturing would affect supply chains for its products.
Portfolio Information
ALLOCATION BY SECTOR
| Sector | | Percent of Total Investments | (a) | |
Media | 57.6 | % | ||
Internet | 16.6 | |||
Software | 13.7 | |||
Entertainment | 3.8 | |||
Toys, Games & Hobbies | 2.7 | |||
Telecommunications | 1.3 | |||
Commercial Services | 1.2 | |||
Retail | 1.1 | |||
Other (each representing less than 1%) | 2.0 |
TEN LARGEST HOLDINGS
| Security | | Percent of Total Investments | (a) | |
ViacomCBS Inc., Class B | 5.7 | % | ||
Comcast Corp., Class A | 5.2 | |||
Charter Communications Inc., Class A | 5.1 | |||
Walt Disney Co. (The) | 4.8 | |||
Electronic Arts Inc. | 4.8 | |||
Activision Blizzard Inc. | 4.6 | |||
Netflix Inc. | 4.5 | |||
Liberty Broadband Corp., Class C | 4.2 | |||
Roku Inc. | 3.5 | |||
Fox Corp., Class A | 3.4 |
| (a) | Excludes money market funds. |
| 16 | 2020ISHARES ANNUAL REPORTTO SHAREHOLDERS |
| Fund Summary as of July 31, 2020 | iShares® Evolved U.S. Technology ETF |
Investment Objective
The iShares Evolved U.S. Technology ETF (the “Fund”) seeks to provide access to U.S. companies with technology exposure, as classified using a proprietary classification system. The Fund is an actively managed exchange-traded fund that does not seek to replicate the performance of a specified index.
Performance
| Average Annual Total Returns | Cumulative Total Returns | |||||||||||||||||||
| 1 Year | Since Inception | 1 Year | Since Inception | |||||||||||||||||
Fund NAV | 37.15 | % | 24.41 | % | 37.15 | % | 67.59 | % | ||||||||||||
Fund Market | 37.10 | 24.46 | 37.10 | 67.75 | ||||||||||||||||
S&P Total Market IndexTM | 10.80 | 9.47 | 10.80 | 23.79 | ||||||||||||||||
GROWTH OF $10,000 INVESTMENT
(SINCE INCEPTION AT NET ASSET VALUE)
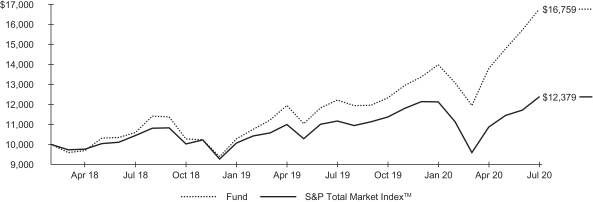
The inception date of the Fund was 3/21/18. The first day of secondary market trading was 3/23/18.
The S&P Total Market IndexTM is an unmanaged index designed to track the broad equity market, including large-, mid-, small-, and micro-cap stocks.
Certain sectors and markets performed exceptionally well based on market conditions during the one-year period. Achieving such exceptional returns involves the risk of volatility and investors should not expect that such exceptional returns will be repeated.
Past performance is no guarantee of future results. Performance results do not reflect the deduction of taxes that a shareholder would pay on fund distributions or on the redemption or sale of fund shares. See “About Fund Performance” on page 19 for more information.
Expense Example
| Actual | Hypothetical 5% Return | |||||||||||||||||||||||||||||
| | Beginning Account Value (02/01/20) | | | Ending Account Value (07/31/20) | | | Expenses Paid During the Period | (a) | | Beginning Account Value (02/01/20) | | | Ending Account Value (07/31/20) | | | Expenses Paid During the Period | (a) | | Annualized Expense Ratio | | ||||||||||
| $ | 1,000.00 | $ | 1,000.00 | $ | 0.90 | $ | 1,000.00 | $ | 1,024.00 | $ | 0.91 | 0.18 | % | |||||||||||||||||
| (a) | Expenses are calculated using the Fund’s annualized expense ratio (as disclosed in the table), multiplied by the average account value for the period, multiplied by the number of days in the period (182 days) and divided by the number of days in the year (366 days). See “Shareholder Expenses” on page 19 for more information. |
FUND SUMMARY | 17 |
| Fund Summary as of July 31, 2020 (continued) | iShares® Evolved U.S. Technology ETF |
Portfolio Management Commentary
U.S. technology stocks advanced robustly during the reporting period, as the coronavirus pandemic accelerated technological trends. Software sales and subscriptions rose, as companies adopted solutions for remote work and online shopping increased during stay-at-home restrictions. Telecommuting drove higher personal computer sales and strong demand growth for chips used in 5G wireless technology and cloud data centers.
The software industry contributed the most to the Fund’s return, as companies adopted new computing technologies for remote work. Microsoft drove contribution among software stocks, advancing due to sharply rising demand for products and services that supported remote computing amid the rise in telecommuting due to stay-at-home directives. Sales of Microsoft’s intelligent cloud computing platform, Azure, and video conferencing solutions rose sharply. Revenue from the company’s Xbox console also climbed higher due to increased video game sales and subscriptions. Hardware technology companies benefited performance as well. Apple gained amid strong sales growth of iPhones, iPads, and Mac computers, as people increased purchases of consumer electronics that help them remain connected to others while practicing social distancing. More time spent at home fueled an increase in app purchases by consumers, which further drove the company’s revenue growth.
Semiconductors stocks were also notable contributors, supported by escalating demand for chips used for 5G wireless technology, artificial intelligence-driven data centers, and personal computers. Nvidia, for example, benefited from consumers upgrading their computing equipment and video game consoles during stay-at-home orders.
The Fund’s evolved investment process looks beyond the traditional sector definitions by applying machine learning and natural language processing to group individual companies with related business activity. During the reporting period, the evolved process identified several technology companies with similar businesses that have traditionally been categorized in other sectors. For example, the Fund held a position in Amazon.com, traditionally classified as a retail stock. The company benefited from increased online shopping as consumers avoided physical stores during stay-at-home restrictions. Amazon also gained amid growth in demand for its cloud services and higher Prime membership subscriptions, particularly for grocery delivery. The Fund also held a position in Google’s parent company Alphabet, traditionally categorized as a communications services stock, which advanced amid growth in cloud computing.
Portfolio Information
ALLOCATION BY SECTOR
| Sector | | Percent of Total Investments | (a) | |
Software | 32.6 | % | ||
Internet | 26.4 | |||
Computers | 16.5 | |||
Semiconductors | 9.2 | |||
Diversified Financial Services | 5.1 | |||
Commercial Services | 4.8 | |||
Telecommunications | 2.4 | |||
Other (each representing less than 1%) | 3.0 |
TEN LARGEST HOLDINGS
| Security | | Percent of Total Investments | (a) | |
Microsoft Corp. | 16.6 | % | ||
Apple Inc. | 12.3 | |||
Amazon.com Inc. | 8.6 | |||
Facebook Inc., Class A | 5.5 | |||
Alphabet Inc., Class A | 4.1 | |||
Alphabet Inc., Class C | 3.9 | |||
NVIDIA Corp. | 2.6 | |||
Visa Inc., Class A | 2.4 | |||
Adobe Inc. | 2.1 | |||
Cisco Systems Inc. | 1.9 |
| (a) | Excludes money market funds. |
| 18 | 2020ISHARES ANNUAL REPORTTO SHAREHOLDERS |
Past performance is no guarantee of future results. Financial markets have experienced extreme volatility and trading in many instruments has been disrupted. These circumstances may continue for an extended period of time and may continue to affect adversely the value and liquidity of the fund’s investments. As a result, current performance may be lower or higher than the performance data quoted. Performance data current to the most recent month-end is available at iShares.com. Performance results assume reinvestment of all dividends and capital gain distributions and do not reflect the deduction of taxes that a shareholder would pay on fund distributions or on the redemption or sale of fund shares. The investment return and principal value of shares will vary with changes in market conditions. Shares may be worth more or less than their original cost when they are redeemed or sold in the market. Performance for certain funds may reflect a waiver of a portion of investment advisory fees. Without such a waiver, performance would have been lower.
Net asset value or “NAV” is the value of one share of a fund as calculated in accordance with the standard formula for valuing mutual fund shares. The price used to calculate market return (“Market Price”) is determined by using the midpoint between the highest bid and the lowest ask on the primary stock exchange on which shares of a fund are listed for trading, as of the time that such fund’s NAV is calculated. Since shares of a fund may not trade in the secondary market until after the fund’s inception, for the period from inception to the first day of secondary market trading in shares of the fund, the NAV of the fund is used as a proxy for the Market Price to calculate market returns. Market and NAV returns assume that dividends and capital gain distributions have been reinvested at Market Price and NAV, respectively.
An index is a statistical composite that tracks a specified financial market or sector. Unlike a fund, an index does not actually hold a portfolio of securities and therefore does not incur the expenses incurred by a fund. These expenses negatively impact fund performance. Also, market returns do not include brokerage commissions that may be payable on secondary market transactions. If brokerage commissions were included, market returns would be lower.
As a shareholder of your Fund, you incur two types of costs: (1) transaction costs, including brokerage commissions on purchases and sales of fund shares and (2) ongoing costs, including management fees and other fund expenses. The expense example, which is based on an investment of $1,000 invested at the beginning of the period (or from the commencement of operations if less than 6 months) and held through the end of the period, is intended to help you understand your ongoing costs (in dollars and cents) of investing in your Fund and to compare these costs with the ongoing costs of investing in other funds.
Actual Expenses — The table provides information about actual account values and actual expenses. Annualized expense ratios reflect contractual and voluntary fee waivers, if any. To estimate the expenses that you paid on your account over the period, simply divide your account value by $1,000 (for example, an $8,600 account value divided by $1,000 = 8.6), then multiply the result by the number under the heading entitled “Expenses Paid During the Period.”
Hypothetical Example for Comparison Purposes — The table also provides information about hypothetical account values and hypothetical expenses based on your Fund’s actual expense ratio and an assumed rate of return of 5% per year before expenses. You may use this information to compare the ongoing costs of investing in your Fund and other funds. To do so, compare this 5% hypothetical example with the 5% hypothetical examples that appear in the shareholder reports of the other funds.
Please note that the expenses shown in the table are meant to highlight your ongoing costs only and do not reflect any transactional costs, such as brokerage commissions paid on purchases and sales of fund shares. Therefore, the hypothetical examples are useful in comparing ongoing costs only and will not help you determine the relative total costs of owning different funds. In addition, if these transactional costs were included, your costs would have been higher.
ABOUT FUND PERFORMANCE / SHAREHOLDER EXPENSES | 19 |
July 31, 2020 | iShares® Evolved U.S. Consumer Staples ETF (Percentages shown are based on Net Assets) |
| Security | Shares | Value | ||||||
Common Stocks | ||||||||
| Advertising — 0.0% | ||||||||
Omnicom Group Inc. | 60 | $ | 3,224 | |||||
|
| |||||||
| Agriculture — 10.7% | ||||||||
Altria Group Inc. | 9,737 | 400,678 | ||||||
Archer-Daniels-Midland Co. | 3,372 | 144,423 | ||||||
Bunge Ltd. | 750 | 32,580 | ||||||
Darling Ingredients Inc.(a) | 609 | 17,009 | ||||||
Fresh Del Monte Produce Inc. | 118 | 2,664 | ||||||
Philip Morris International Inc. | 5,813 | 446,497 | ||||||
Universal Corp./VA | 147 | 6,197 | ||||||
Vector Group Ltd. | 263 | 2,320 | ||||||
|
| |||||||
| 1,052,368 | ||||||||
| Beverages — 28.8% | ||||||||
Boston Beer Co. Inc. (The), Class A, NVS(a) | 42 | 34,038 | ||||||
Brown-Forman Corp., Class A | 261 | 16,506 | ||||||
Brown-Forman Corp., Class B, NVS | 1,839 | 127,516 | ||||||
Coca-Cola Co. (The) | 22,739 | 1,074,190 | ||||||
Coca-Cola Consolidated Inc. | 36 | 8,264 | ||||||
Constellation Brands Inc., Class A | 726 | 129,373 | ||||||
Keurig Dr Pepper Inc. | 2,788 | 85,285 | ||||||
MGP Ingredients Inc. | 77 | 2,793 | ||||||
Molson Coors Beverage Co., Class B | 1,050 | 39,396 | ||||||
Monster Beverage Corp.(a) | 3,447 | 270,521 | ||||||
National Beverage Corp.(a) | 105 | 6,736 | ||||||
PepsiCo Inc. | 7,580 | 1,043,463 | ||||||
|
| |||||||
| 2,838,081 | ||||||||
| Chemicals — 1.0% | ||||||||
Balchem Corp. | 114 | 11,430 | ||||||
Ecolab Inc. | 116 | 21,701 | ||||||
International Flavors & Fragrances Inc. | 489 | 61,590 | ||||||
Sensient Technologies Corp. | 168 | 8,771 | ||||||
|
| |||||||
| 103,492 | ||||||||
| Commercial Services — 0.1% | ||||||||
Medifast Inc. | 41 | 6,853 | ||||||
WW International Inc.(a)(b) | 126 | 3,248 | ||||||
|
| |||||||
| 10,101 | ||||||||
| Computers — 0.0% | ||||||||
ExlService Holdings Inc.(a) | 69 | 4,420 | ||||||
|
| |||||||
| Cosmetics & Personal Care — 11.2% | ||||||||
Colgate-Palmolive Co. | 3,277 | 252,984 | ||||||
Coty Inc., Class A | 587 | 2,178 | ||||||
Edgewell Personal Care Co.(a) | 150 | 4,483 | ||||||
Estee Lauder Companies Inc. (The), Class A | 1 | 198 | ||||||
Procter & Gamble Co. (The) | 6,424 | 842,315 | ||||||
|
| |||||||
| 1,102,158 | ||||||||
| Distribution & Wholesale — 0.0% | ||||||||
Core-Mark Holding Co. Inc. | 161 | 4,270 | ||||||
|
| |||||||
| Diversified Financial Services — 0.0% | ||||||||
CME Group Inc. | 1 | 166 | ||||||
Jefferies Financial Group Inc. | 2 | 33 | ||||||
|
| |||||||
| 199 | ||||||||
| Electric — 0.0% | ||||||||
Entergy Corp. | 31 | 3,259 | ||||||
|
| |||||||
| Electrical Components & Equipment — 0.1% | ||||||||
Energizer Holdings Inc. | 168 | 8,422 | ||||||
|
| |||||||
| Security | Shares | Value | ||||||
| Food — 25.2% | ||||||||
B&G Foods Inc. | 539 | $ | 15,582 | |||||
BellRing Brands Inc., Class A(a) | 194 | 3,855 | ||||||
Beyond Meat Inc.(a) | 272 | 34,245 | ||||||
Calavo Growers Inc. | 77 | 4,448 | ||||||
Cal-Maine Foods Inc.(a) | 140 | 6,152 | ||||||
Campbell Soup Co. | 1,557 | 77,181 | ||||||
Conagra Brands Inc. | 3,800 | 142,310 | ||||||
Flowers Foods Inc. | 833 | 18,951 | ||||||
General Mills Inc. | 5,577 | 352,857 | ||||||
Hain Celestial Group Inc. (The)(a)(b) | 728 | 24,737 | ||||||
Hershey Co. (The) | 1,280 | 186,125 | ||||||
Hormel Foods Corp. | 1,707 | 86,818 | ||||||
Hostess Brands Inc.(a) | 455 | 5,769 | ||||||
Ingredion Inc. | 399 | 34,514 | ||||||
J&J Snack Foods Corp. | 91 | 11,205 | ||||||
JM Smucker Co. (The) | 929 | 101,586 | ||||||
John B Sanfilippo & Son Inc. | 63 | 5,555 | ||||||
Kellogg Co. | 2,308 | 159,229 | ||||||
Kraft Heinz Co. (The) | 4,756 | 163,511 | ||||||
Lamb Weston Holdings Inc. | 938 | 56,355 | ||||||
Lancaster Colony Corp. | 119 | 18,872 | ||||||
McCormick & Co. Inc./MD, NVS(b) | 697 | 135,845 | ||||||
Mondelez International Inc., Class A | 8,054 | 446,916 | ||||||
Performance Food Group Co.(a) | 427 | 11,965 | ||||||
Pilgrim’s Pride Corp.(a) | 210 | 3,224 | ||||||
Post Holdings Inc.(a) | 574 | 50,937 | ||||||
Sanderson Farms Inc. | 84 | 9,366 | ||||||
Seaboard Corp. | 1 | 2,703 | ||||||
Simply Good Foods Co. (The)(a) | 502 | 12,068 | ||||||
Sprouts Farmers Market Inc.(a) | 315 | 8,310 | ||||||
Sysco Corp. | 2,492 | 131,702 | ||||||
Tootsie Roll Industries Inc. | 102 | 3,233 | ||||||
TreeHouse Foods Inc.(a) | 448 | 19,631 | ||||||
Tyson Foods Inc., Class A | 1,909 | 117,308 | ||||||
U.S. Foods Holding Corp.(a) | 833 | 16,910 | ||||||
United Natural Foods Inc.(a) | 154 | 3,057 | ||||||
|
| |||||||
| 2,483,032 | ||||||||
| Holding Companies – Diversified — 0.1% | ||||||||
Cannae Holdings Inc.(a) | 208 | 7,837 | ||||||
|
| |||||||
| Household Products & Wares — 3.0% | ||||||||
ACCO Brands Corp. | 2 | 13 | ||||||
Central Garden & Pet Co., Class A, NVS(a) | 91 | 3,153 | ||||||
Church & Dwight Co. Inc. | 803 | 77,353 | ||||||
Clorox Co. (The) | 395 | 93,421 | ||||||
Helen of Troy Ltd.(a) | 55 | 10,354 | ||||||
Kimberly-Clark Corp. | 720 | 109,469 | ||||||
|
| |||||||
| 293,763 | ||||||||
| Housewares — 0.2% | ||||||||
Scotts Miracle-Gro Co. (The) | 98 | 15,540 | ||||||
Tupperware Brands Corp. | 112 | 1,728 | ||||||
|
| |||||||
| 17,268 | ||||||||
| Machinery — 0.2% | ||||||||
AGCO Corp. | 161 | 10,566 | ||||||
Middleby Corp. (The)(a) | 119 | 9,884 | ||||||
Welbilt Inc.(a) | 247 | 1,502 | ||||||
|
| |||||||
| 21,952 | ||||||||
| Manufacturing — 0.1% | ||||||||
AptarGroup Inc. | 63 | 7,257 | ||||||
| 20 | 2020ISHARES ANNUAL REPORTTO SHAREHOLDERS |
Schedule of Investments July 31, 2020 | iShares® Evolved U.S. Consumer Staples ETF (Percentages shown are based on Net Assets) |
| Security | Shares | Value | ||||||
| Manufacturing (continued) | ||||||||
John Bean Technologies Corp. | 84 | $ | 7,876 | |||||
|
| |||||||
| 15,133 | ||||||||
| Packaging & Containers — 2.8% | ||||||||
Amcor PLC(a) | 720 | 7,416 | ||||||
Ball Corp. | 1,665 | 122,594 | ||||||
Berry Global Group Inc.(a) | 433 | 21,646 | ||||||
Crown Holdings Inc.(a) | 638 | 45,668 | ||||||
Graphic Packaging Holding Co. | 1,553 | 21,649 | ||||||
O-I Glass Inc. | 546 | 5,700 | ||||||
Packaging Corp. of America | 135 | 12,976 | ||||||
Sealed Air Corp. | 301 | 10,740 | ||||||
Silgan Holdings Inc. | 259 | 9,907 | ||||||
Sonoco Products Co. | 294 | 15,211 | ||||||
|
| |||||||
| 273,507 | ||||||||
| Pharmaceuticals — 2.5% | ||||||||
Elanco Animal Health Inc.(a) | 1,027 | 24,268 | ||||||
Herbalife Nutrition Ltd.(a) | 321 | 16,448 | ||||||
Neogen Corp.(a) | 189 | 14,509 | ||||||
Perrigo Co. PLC | 92 | 4,878 | ||||||
Prestige Consumer Healthcare Inc.(a) | 154 | 5,727 | ||||||
Zoetis Inc. | 1,163 | 176,404 | ||||||
|
| |||||||
| 242,234 | ||||||||
| Real Estate Investment Trusts — 1.4% | ||||||||
Americold Realty Trust | 589 | 23,766 | ||||||
Equinix Inc. | 142 | 111,538 | ||||||
|
| |||||||
| 135,304 | ||||||||
| Retail — 11.7% | ||||||||
BJ’s Restaurants Inc. | 43 | 863 | ||||||
Casey’s General Stores Inc. | 77 | 12,258 | ||||||
Cheesecake Factory Inc. (The) | 98 | 2,352 | ||||||
Chipotle Mexican Grill Inc.(a) | 112 | 129,378 | ||||||
Cracker Barrel Old Country Store Inc. | 35 | 3,866 | ||||||
Darden Restaurants Inc. | 176 | 13,358 | ||||||
Dunkin’ Brands Group Inc. | 317 | 21,787 | ||||||
Freshpet Inc.(a) | 184 | 17,673 | ||||||
Jack in the Box Inc. | 63 | 5,173 | ||||||
| Security | Shares | Value | ||||||
| Retail (continued) | ||||||||
McDonald’s Corp. | 2,204 | $ | 428,193 | |||||
Shake Shack Inc., Class A(a) | 71 | 3,447 | ||||||
Starbucks Corp. | 4,829 | 369,563 | ||||||
Walmart Inc. | 27 | 3,494 | ||||||
Wendy’s Co. (The) | 497 | 11,521 | ||||||
Wingstop Inc. | 63 | 9,844 | ||||||
Yum China Holdings Inc. | 840 | 43,042 | ||||||
Yum! Brands Inc. | 861 | 78,394 | ||||||
|
| |||||||
| 1,154,206 | ||||||||
| Toys, Games & Hobbies — 0.1% | ||||||||
Mattel Inc.(a) | 821 | 9,121 | ||||||
|
| |||||||
Total Common Stocks — 99.2% | 9,783,351 | |||||||
|
| |||||||
Short-Term Investments |
| |||||||
| Money Market Funds — 2.3% | ||||||||
BlackRock Cash Funds: Institutional, | ||||||||
0.40%(c)(d)(e) | 162,278 | 162,457 | ||||||
BlackRock Cash Funds: Treasury, | ||||||||
0.12%(c)(d) | 66,000 | 66,000 | ||||||
|
| |||||||
| 228,457 | ||||||||
|
| |||||||
Total Short-Term Investments — 2.3% | 228,457 | |||||||
|
| |||||||
Total Investments in Securities — 101.5% | 10,011,808 | |||||||
Other Assets, Less Liabilities — (1.5)% | (152,457 | ) | ||||||
|
| |||||||
Net Assets — 100.0% | $ | 9,859,351 | ||||||
|
| |||||||
| (a) | Non-income producing security. |
| (b) | All or a portion of this security is on loan. |
| (c) | Affiliate of the Fund. |
| (d) | Annualized 7-day yield as of period-end. |
| (e) | All or a portion of this security was purchased with cash collateral received from loaned securities. |
Affiliates
Investments in issuers considered to be affiliate(s) of the Fund during the year ended July 31, 2020, for purposes of Section 2(a)(3) of the Investment Company Act of 1940, as amended, were as follows:
| Affiliated Issuer | Value at 07/31/19 | Purchases at Cost | Proceeds from Sales | Net Realized Gain (Loss) | Change in Unrealized Appreciation (Depreciation) | Value at 07/31/20 | Shares Held at 07/31/20 | Income | Capital Gain Distributions from Underlying Funds | |||||||||||||||||||||||||||
BlackRock Cash Funds: Institutional, | $ | 28,021 | $ | 134,338 | (a) | $ | — | $ | (47 | ) | $ | 145 | $ | 162,457 | 162,278 | $ | 1,314 | (b) | $ | — | ||||||||||||||||
BlackRock Cash Funds: Treasury, | 19,000 | 47,000 | (a) | — | — | — | 66,000 | 66,000 | 557 | — | ||||||||||||||||||||||||||
|
|
|
|
|
|
|
|
|
| |||||||||||||||||||||||||||
| $ | (47 | ) | $ | 145 | $ | 228,457 | $ | 1,871 | $ | — | ||||||||||||||||||||||||||
|
|
|
|
|
|
|
|
|
| |||||||||||||||||||||||||||
| (a) | Represents net amount purchased (sold). |
| (b) | All or a portion represents securities lending income earned from the reinvestment of cash collateral from loaned securities, net of fees and collateral investment expenses, and other payments to and from borrowers of securities. |
SCHEDULE OF INVESTMENTS | 21 |
Schedule of Investments July 31, 2020 | iShares® Evolved U.S. Consumer Staples ETF |
Fair Value Measurements
Various inputs are used in determining the fair value of financial instruments. For description of the input levels and information about the Fund’s policy regarding valuation of financial instruments, refer to the Notes to Financial Statements.
The following table summarizes the value of the Fund’s investments according to the fair value hierarchy as of July 31, 2020. The breakdown of the Fund’s investments into major categories is disclosed in the Schedule of Investments above.
| Level 1 | Level 2 | Level 3 | Total | |||||||||||||
Investments | ||||||||||||||||
Assets | ||||||||||||||||
Common Stocks | $ | 9,783,351 | $ | — | $ | — | $ | 9,783,351 | ||||||||
Money Market Funds | 228,457 | — | — | 228,457 | ||||||||||||
|
|
|
|
|
|
|
| |||||||||
| $ | 10,011,808 | $ | — | $ | — | $ | 10,011,808 | |||||||||
|
|
|
|
|
|
|
| |||||||||
See notes to financial statements.
| 22 | 2020ISHARES ANNUAL REPORTTO SHAREHOLDERS |
Schedule of Investments July 31, 2020 | iShares® Evolved U.S. Discretionary Spending ETF (Percentages shown are based on Net Assets) |
| Security | Shares | Value | ||||||
Common Stocks |
| |||||||
| Advertising — 0.1% | ||||||||
Interpublic Group of Companies Inc. (The) | 377 | $ | 6,805 | |||||
|
| |||||||
| Airlines — 0.1% | ||||||||
Alaska Air Group Inc. | 182 | 6,268 | ||||||
JetBlue Airways Corp.(a) | 483 | 4,994 | ||||||
|
| |||||||
| 11,262 | ||||||||
| Apparel — 5.7% | ||||||||
Capri Holdings Ltd.(a) | 582 | 8,718 | ||||||
Carter’s Inc. | 245 | 19,286 | ||||||
Columbia Sportswear Co. | 126 | 9,556 | ||||||
Crocs Inc.(a) | 238 | 8,554 | ||||||
Deckers Outdoor Corp.(a) | 131 | 27,412 | ||||||
Hanesbrands Inc. | 1,288 | 18,199 | ||||||
Nike Inc., Class B | 4,259 | 415,721 | ||||||
Oxford Industries Inc. | 84 | 3,607 | ||||||
PVH Corp. | 357 | 17,372 | ||||||
Ralph Lauren Corp. | 211 | 15,044 | ||||||
Skechers U.S.A. Inc., Class A(a) | 588 | 17,217 | ||||||
Steven Madden Ltd. | 390 | 8,260 | ||||||
Tapestry Inc. | 1,295 | 17,301 | ||||||
Under Armour Inc., Class A(a) | 707 | 7,438 | ||||||
Under Armour Inc., Class C, NVS(a) | 721 | 6,842 | ||||||
VF Corp. | 1,366 | 82,452 | ||||||
Wolverine World Wide Inc. | 217 | 5,217 | ||||||
|
| |||||||
| 688,196 | ||||||||
| Beverages — 0.1% | ||||||||
Constellation Brands Inc., Class A | 46 | 8,197 | ||||||
|
| |||||||
| Building Materials — 0.2% | ||||||||
American Woodmark Corp.(a) | 28 | 2,257 | ||||||
Masco Corp. | 286 | 16,348 | ||||||
|
| |||||||
| 18,605 | ||||||||
| Chemicals — 0.0% | ||||||||
Valvoline Inc. | 294 | 6,033 | ||||||
|
| |||||||
| Commercial Services — 2.0% | ||||||||
Aaron’s Inc. | 252 | 13,148 | ||||||
Avis Budget Group Inc.(a) | 119 | 3,082 | ||||||
Bright Horizons Family Solutions Inc.(a) | 35 | 3,753 | ||||||
Brink’s Co. (The) | 63 | 2,794 | ||||||
Cintas Corp. | 126 | 38,036 | ||||||
Euronet Worldwide Inc.(a) | 70 | 6,730 | ||||||
FleetCor Technologies Inc.(a) | 24 | 6,206 | ||||||
Grand Canyon Education Inc.(a) | 63 | 5,591 | ||||||
H&R Block Inc. | 392 | 5,684 | ||||||
ManpowerGroup Inc. | 105 | 7,223 | ||||||
Monro Inc.(b) | 119 | 6,700 | ||||||
PayPal Holdings Inc.(a) | 422 | 82,741 | ||||||
Rent-A-Center Inc./TX | 202 | 5,842 | ||||||
Rollins Inc. | 210 | 11,004 | ||||||
ServiceMaster Global Holdings Inc.(a) | 238 | 9,732 | ||||||
Square Inc., Class A(a) | 200 | 25,970 | ||||||
WW International Inc.(a)(b) | 63 | 1,624 | ||||||
|
| |||||||
| 235,860 | ||||||||
| Computers — 6.0% | ||||||||
Apple Inc. | 1,684 | 715,767 | ||||||
|
| |||||||
| Cosmetics & Personal Care — 3.9% | ||||||||
Coty Inc., Class A | 359 | 1,332 | ||||||
| Security | Shares | Value | ||||||
| Cosmetics & Personal Care (continued) | ||||||||
Estee Lauder Companies Inc. (The), Class A | 626 | $ | 123,660 | |||||
Inter Parfums Inc. | 54 | 2,208 | ||||||
Procter & Gamble Co. (The) | 2,622 | 343,797 | ||||||
|
| |||||||
| 470,997 | ||||||||
| Distribution & Wholesale — 1.0% | ||||||||
Core-Mark Holding Co. Inc. | 103 | 2,731 | ||||||
Fastenal Co. | 654 | 30,764 | ||||||
G-III Apparel Group Ltd.(a) | 203 | 2,008 | ||||||
HD Supply Holdings Inc.(a) | 217 | 7,617 | ||||||
LKQ Corp.(a) | 357 | 10,064 | ||||||
Pool Corp. | 77 | 24,386 | ||||||
SiteOne Landscape Supply Inc.(a) | 63 | 8,066 | ||||||
WW Grainger Inc. | 84 | 28,688 | ||||||
|
| |||||||
| 114,324 | ||||||||
| Diversified Financial Services — 0.7% | ||||||||
Alliance Data Systems Corp. | 63 | 2,795 | ||||||
LendingTree Inc.(a) | 7 | 2,424 | ||||||
Mastercard Inc., Class A | 29 | 8,947 | ||||||
Visa Inc., Class A | 369 | 70,258 | ||||||
|
| |||||||
| 84,424 | ||||||||
| Entertainment — 0.5% | ||||||||
Churchill Downs Inc. | 69 | 9,558 | ||||||
Cinemark Holdings Inc. | 224 | 2,650 | ||||||
Live Nation Entertainment Inc.(a) | 315 | 14,745 | ||||||
Madison Square Garden Sports Corp.(a) | 35 | 5,379 | ||||||
Marriott Vacations Worldwide Corp. | 62 | 5,249 | ||||||
Penn National Gaming Inc.(a) | 43 | 1,455 | ||||||
Red Rock Resorts Inc., Class A | 203 | 2,225 | ||||||
Scientific Games Corp./DE, Class A(a) | 77 | 1,353 | ||||||
SeaWorld Entertainment Inc.(a) | 153 | 2,214 | ||||||
Six Flags Entertainment Corp. | 119 | 2,069 | ||||||
Vail Resorts Inc. | 91 | 17,475 | ||||||
|
| |||||||
| 64,372 | ||||||||
| Food — 1.5% | ||||||||
Beyond Meat Inc.(a) | 59 | 7,428 | ||||||
Flowers Foods Inc. | 315 | 7,166 | ||||||
Grocery Outlet Holding Corp.(a) | 257 | 11,305 | ||||||
Kroger Co. (The) | 3,095 | 107,675 | ||||||
Performance Food Group Co.(a) | 224 | 6,277 | ||||||
Sprouts Farmers Market Inc.(a) | 441 | 11,634 | ||||||
Sysco Corp. | 489 | 25,844 | ||||||
U.S. Foods Holding Corp.(a) | 378 | 7,673 | ||||||
|
| |||||||
| 185,002 | ||||||||
| Food Service — 0.1% | ||||||||
Aramark | 560 | 11,827 | ||||||
|
| |||||||
| Holding Companies – Diversified — 0.0% | ||||||||
Cannae Holdings Inc.(a) | 105 | 3,956 | ||||||
|
| |||||||
| Home Builders — 0.1% | ||||||||
Taylor Morrison Home Corp.(a) | 140 | 3,283 | ||||||
Toll Brothers Inc. | 182 | 6,952 | ||||||
|
| |||||||
| 10,235 | ||||||||
| Home Furnishings — 0.1% | ||||||||
Sleep Number Corp.(a) | 82 | 3,813 | ||||||
Tempur Sealy International Inc.(a) | 119 | 9,633 | ||||||
|
| |||||||
| 13,446 | ||||||||
| Household Products & Wares — 0.3% | ||||||||
Helen of Troy Ltd.(a) | 36 | 6,777 | ||||||
SCHEDULE OF INVESTMENTS | 23 |
Schedule of Investments (continued) July 31, 2020 | iShares® Evolved U.S. Discretionary Spending ETF (Percentages shown are based on Net Assets) |
| Security | Shares | Value | ||||||
| Household Products & Wares (continued) | ||||||||
Kimberly-Clark Corp. | 182 | $ | 27,671 | |||||
Spectrum Brands Holdings Inc. | 28 | 1,517 | ||||||
|
| |||||||
| 35,965 | ||||||||
| Housewares — 0.2% | ||||||||
Newell Brands Inc. | 663 | 10,873 | ||||||
Scotts Miracle-Gro Co. (The) | 56 | 8,880 | ||||||
Tupperware Brands Corp. | 77 | 1,188 | ||||||
|
| |||||||
| 20,941 | ||||||||
| Internet — 23.7% | ||||||||
Amazon.com Inc.(a) | 754 | 2,386,170 | ||||||
Booking Holdings Inc.(a) | 71 | 118,011 | ||||||
Cars.com Inc.(a) | 105 | 853 | ||||||
Chewy Inc., Class A(a) | 107 | 5,616 | ||||||
eBay Inc. | 862 | 47,651 | ||||||
Etsy Inc.(a) | 203 | 24,031 | ||||||
Expedia Group Inc. | 167 | 13,529 | ||||||
Groupon Inc.(a) | 42 | 645 | ||||||
Grubhub Inc.(a) | 154 | 11,125 | ||||||
MercadoLibre Inc.(a) | 85 | 95,593 | ||||||
Pinterest Inc., Class A(a) | 650 | 22,289 | ||||||
Stamps.com Inc.(a) | 21 | 5,466 | ||||||
Stitch Fix Inc., Class A(a) | 96 | 2,126 | ||||||
TripAdvisor Inc. | 175 | 3,540 | ||||||
Uber Technologies Inc.(a) | 1,455 | 44,028 | ||||||
Wayfair Inc., Class A(a) | 218 | 58,008 | ||||||
|
| |||||||
| 2,838,681 | ||||||||
| Leisure Time — 0.5% | ||||||||
Carnival Corp. | 915 | 12,700 | ||||||
Norwegian Cruise Line Holdings Ltd.(a) | 365 | 4,979 | ||||||
Planet Fitness Inc., Class A(a) | 364 | 19,001 | ||||||
Polaris Inc. | 49 | 5,078 | ||||||
Royal Caribbean Cruises Ltd. | 274 | 13,346 | ||||||
|
| |||||||
| 55,104 | ||||||||
| Lodging — 1.8% | ||||||||
Boyd Gaming Corp. | 145 | 3,432 | ||||||
Choice Hotels International Inc. | 112 | 9,413 | ||||||
Extended Stay America Inc. | 301 | 3,434 | ||||||
Hilton Grand Vacations Inc.(a) | 147 | 2,984 | ||||||
Hilton Worldwide Holdings Inc. | 775 | 58,164 | ||||||
Hyatt Hotels Corp., Class A | 112 | 5,376 | ||||||
Las Vegas Sands Corp. | 793 | 34,607 | ||||||
Marriott International Inc./MD, Class A | 542 | 45,433 | ||||||
MGM Resorts International | 1,001 | 16,106 | ||||||
Wyndham Destinations Inc. | 287 | 7,634 | ||||||
Wyndham Hotels & Resorts Inc. | 335 | 14,794 | ||||||
Wynn Resorts Ltd. | 175 | 12,675 | ||||||
|
| |||||||
| 214,052 | ||||||||
| Office Furnishings — 0.0% | ||||||||
Herman Miller Inc. | 84 | 1,968 | ||||||
|
| |||||||
| Oil & Gas — 0.1% | ||||||||
Murphy USA Inc.(a) | 84 | 11,123 | ||||||
|
| |||||||
| Pharmaceuticals — 0.1% | ||||||||
Herbalife Nutrition Ltd.(a) | 166 | 8,506 | ||||||
|
| |||||||
| Real Estate — 0.0% | ||||||||
RE/MAX Holdings Inc., Class A | 49 | 1,586 | ||||||
|
| |||||||
| Security | Shares | Value | ||||||
| Real Estate Investment Trusts — 0.2% | ||||||||
Apple Hospitality REIT Inc. | 294 | $ | 2,593 | |||||
Host Hotels & Resorts Inc. | 931 | 10,036 | ||||||
Macerich Co. (The)(b) | 191 | 1,457 | ||||||
Park Hotels & Resorts Inc. | 210 | 1,737 | ||||||
Ruth’s Hospitality Group Inc. | 126 | 844 | ||||||
Ryman Hospitality Properties Inc. | 56 | 1,793 | ||||||
Tailored Brands Inc. | 245 | 74 | ||||||
Taubman Centers Inc. | 126 | 4,879 | ||||||
|
| |||||||
| 23,413 | ||||||||
| Retail — 49.9% | ||||||||
Abercrombie & Fitch Co., Class A | 363 | 3,496 | ||||||
Advance Auto Parts Inc. | 252 | 37,835 | ||||||
American Eagle Outfitters Inc. | 819 | 8,190 | ||||||
Ascena Retail Group Inc.(a) | 45 | 32 | ||||||
At Home Group Inc.(a) | 204 | 2,534 | ||||||
AutoNation Inc.(a) | 147 | 7,547 | ||||||
AutoZone Inc.(a) | 77 | 92,971 | ||||||
Beacon Roofing Supply Inc.(a) | 84 | 2,617 | ||||||
Bed Bath & Beyond Inc. | 599 | 6,481 | ||||||
Best Buy Co. Inc. | 743 | 73,995 | ||||||
Big Lots Inc. | 217 | 8,537 | ||||||
BJ’s Restaurants Inc. | 63 | 1,264 | ||||||
BJ’s Wholesale Club Holdings Inc.(a) | 491 | 19,665 | ||||||
Bloomin’ Brands Inc. | 336 | 3,871 | ||||||
Boot Barn Holdings Inc.(a) | 151 | 2,923 | ||||||
Brinker International Inc. | 167 | 4,491 | ||||||
Buckle Inc. (The) | 133 | 2,132 | ||||||
Burlington Stores Inc.(a) | 318 | 59,784 | ||||||
Caleres Inc. | 175 | 1,104 | ||||||
CarMax Inc.(a) | 476 | 46,158 | ||||||
Carvana Co.(a) | 123 | 19,059 | ||||||
Casey’s General Stores Inc. | 147 | 23,401 | ||||||
Cheesecake Factory Inc. (The) | 147 | 3,528 | ||||||
Chipotle Mexican Grill Inc.(a) | 71 | 82,016 | ||||||
Costco Wholesale Corp. | 1,773 | 577,165 | ||||||
Cracker Barrel Old Country Store Inc. | 98 | 10,826 | ||||||
Darden Restaurants Inc. | 469 | 35,597 | ||||||
Dave & Buster’s Entertainment Inc. | 148 | 1,826 | ||||||
Denny’s Corp.(a) | 252 | 2,239 | ||||||
Designer Brands Inc. , Class A | 336 | 1,986 | ||||||
Dick’s Sporting Goods Inc. | 302 | 13,777 | ||||||
Dine Brands Global Inc. | 70 | 3,180 | ||||||
Dollar General Corp. | 1,092 | 207,917 | ||||||
Dollar Tree Inc.(a) | 1,119 | 104,459 | ||||||
Domino’s Pizza Inc. | 145 | 56,058 | ||||||
Dunkin’ Brands Group Inc. | 175 | 12,028 | ||||||
FirstCash Inc. | 133 | 7,666 | ||||||
Five Below Inc.(a) | 273 | 29,732 | ||||||
Floor & Decor Holdings Inc., Class A(a) | 245 | 16,145 | ||||||
Foot Locker Inc. | 448 | 13,167 | ||||||
Gap Inc. (The) | 1,463 | 19,560 | ||||||
Genesco Inc.(a) | 98 | 1,524 | ||||||
Genuine Parts Co. | 217 | 19,563 | ||||||
Home Depot Inc. (The) | 3,702 | 982,844 | ||||||
Jack in the Box Inc. | 79 | 6,487 | ||||||
Kohl’s Corp. | 799 | 15,213 | ||||||
L Brands Inc. | 1,230 | 30,024 | ||||||
La-Z-Boy Inc. | 126 | 3,586 | ||||||
Lithia Motors Inc., Class A | 49 | 11,228 | ||||||
Lowe’s Companies Inc. | 2,518 | 374,955 | ||||||
| 24 | 2020ISHARES ANNUAL REPORTTO SHAREHOLDERS |
Schedule of Investments (continued) July 31, 2020 | iShares® Evolved U.S. Discretionary Spending ETF (Percentages shown are based on Net Assets) |
| Security | Shares | Value | ||||||
| Retail (continued) | ||||||||
Lululemon Athletica Inc.(a) | 545 | $ | 177,447 | |||||
Macy’s Inc. | 1,817 | 11,011 | ||||||
McDonald’s Corp. | 1,880 | 365,246 | ||||||
MSC Industrial Direct Co. Inc., Class A | 70 | 4,621 | ||||||
National Vision Holdings Inc.(a) | 175 | 5,598 | ||||||
Nordstrom Inc. | 547 | 7,488 | ||||||
Ollie’s Bargain Outlet Holdings Inc.(a) | 285 | 29,953 | ||||||
O’Reilly Automotive Inc.(a) | 289 | 137,963 | ||||||
Papa John’s International Inc. | 82 | 7,763 | ||||||
PriceSmart Inc. | 98 | 6,406 | ||||||
Qurate Retail Inc. Series A(a) | 370 | 4,037 | ||||||
RH(a) | 79 | 22,707 | ||||||
Ross Stores Inc. | 1,694 | 151,901 | ||||||
Sally Beauty Holdings Inc.(a) | 567 | 6,583 | ||||||
Shake Shack Inc., Class A(a) | 84 | 4,078 | ||||||
Signet Jewelers Ltd. | 251 | 2,696 | ||||||
Starbucks Corp. | 2,579 | 197,371 | ||||||
Target Corp. | 2,204 | 277,440 | ||||||
Texas Roadhouse Inc. | 252 | 14,160 | ||||||
Tiffany & Co. | 416 | 52,150 | ||||||
TJX Companies Inc. (The) | 5,384 | 279,914 | ||||||
Tractor Supply Co. | 482 | 68,801 | ||||||
Ulta Beauty Inc.(a) | 269 | 51,914 | ||||||
Urban Outfitters Inc.(a) | 350 | 5,789 | ||||||
Walgreens Boots Alliance Inc. | 1,807 | 73,563 | ||||||
Walmart Inc. | 5,624 | 727,746 | ||||||
Wendy’s Co. (The) | 595 | 13,792 | ||||||
Williams-Sonoma Inc. | 355 | 30,928 | ||||||
Wingstop Inc. | 84 | 13,125 | ||||||
Yum China Holdings Inc. | 1,102 | 56,466 | ||||||
Yum! Brands Inc. | 1,035 | 94,237 | ||||||
|
| |||||||
| 5,975,277 | ||||||||
| Software — 0.1% | ||||||||
Intuit Inc. | 35 | 10,723 | ||||||
Take-Two Interactive Software Inc.(a) | 33 | 5,413 | ||||||
|
| |||||||
| 16,136 | ||||||||
| Security | Shares | Value | ||||||
| Textiles — 0.0% | ||||||||
UniFirst Corp./MA | 28 | $ | 5,221 | |||||
|
| |||||||
| Toys, Games & Hobbies — 0.2% | ||||||||
Hasbro Inc. | 168 | 12,224 | ||||||
Mattel Inc.(a) | 530 | 5,888 | ||||||
|
| |||||||
| 18,112 | ||||||||
| Transportation — 0.4% | ||||||||
FedEx Corp. | 294 | 49,510 | ||||||
|
| |||||||
Total Common Stocks — 99.6% |
| 11,924,903 | ||||||
|
| |||||||
Short-Term Investments |
| |||||||
| Money Market Funds — 0.4% | ||||||||
BlackRock Cash Funds: Institutional, | ||||||||
0.40%(c)(d)(e) | 4,967 | 4,972 | ||||||
BlackRock Cash Funds: Treasury, | ||||||||
0.12%(c)(d) | 45,000 | 45,000 | ||||||
|
| |||||||
| 49,972 | ||||||||
|
| |||||||
Total Short-Term Investments — 0.4% |
| 49,972 | ||||||
|
| |||||||
Total Investments in Securities — 100.0% |
| 11,974,875 | ||||||
Other Assets, Less Liabilities — 0.0% |
| 5,661 | ||||||
|
| |||||||
Net Assets — 100.0% |
| $ | 11,980,536 | |||||
|
| |||||||
| (a) | Non-income producing security. |
| (b) | All or a portion of this security is on loan. |
| (c) | Affiliate of the Fund. |
| (d) | Annualized 7-day yield as of period-end. |
| (e) | All or a portion of this security was purchased with cash collateral received from loaned securities. |
Affiliates
Investments in issuers considered to be affiliate(s) of the Fund during the year ended July 31, 2020, for purposes of Section 2(a)(3) of the Investment Company Act of 1940, as amended, were as follows:
| Affiliated Issuer | Value at 07/31/19 | Purchases at Cost | Proceeds from Sales | Net Realized Gain (Loss) | Change in Unrealized Appreciation (Depreciation) | Value at 07/31/20 | Shares Held at 07/31/20 | Income | Capital Gain Distributions from Underlying Funds | |||||||||||||||||||||||||||
BlackRock Cash Funds: Institutional, | $ | 27,828 | $ | — | $ | (23,160 | )(a) | $ | 298 | $ | 6 | $ | 4,972 | 4,967 | $ | 991 | (b) | $ | — | |||||||||||||||||
BlackRock Cash Funds: Treasury, | 29,000 | 16,000 | (a) | — | — | — | 45,000 | 45,000 | 932 | — | ||||||||||||||||||||||||||
|
|
|
|
|
|
|
|
|
| |||||||||||||||||||||||||||
| $ | 298 | $ | 6 | $ | 49,972 | $ | 1,923 | $ | — | |||||||||||||||||||||||||||
|
|
|
|
|
|
|
|
|
| |||||||||||||||||||||||||||
| (a) | Represents net amount purchased (sold). |
| (b) | All or a portion represents securities lending income earned from the reinvestment of cash collateral from loaned securities, net of fees and collateral investment expenses, and other payments to and from borrowers of securities. |
Fair Value Measurements
Various inputs are used in determining the fair value of financial instruments. For description of the input levels and information about the Fund’s policy regarding valuation of financial instruments, refer to the Notes to Financial Statements.
SCHEDULE OF INVESTMENTS | 25 |
Schedule of Investments (continued) July 31, 2020 | iShares® Evolved U.S. Discretionary Spending ETF |
Fair Value Measurements (continued)
The following table summarizes the value of the Fund’s investments according to the fair value hierarchy as of July 31, 2020. The breakdown of the Fund’s investments into major categories is disclosed in the Schedule of Investments above.
| Level 1 | Level 2 | Level 3 | Total | |||||||||||||
Investments | ||||||||||||||||
Assets | ||||||||||||||||
Common Stocks | $ | 11,924,903 | $ | — | $ | — | $ | 11,924,903 | ||||||||
Money Market Funds | 49,972 | — | — | 49,972 | ||||||||||||
|
|
|
|
|
|
|
| |||||||||
| $ | 11,974,875 | $ | — | $ | — | $ | 11,974,875 | |||||||||
|
|
|
|
|
|
|
| |||||||||
See notes to financial statements.
| 26 | 2020ISHARES ANNUAL REPORTTO SHAREHOLDERS |
Schedule of Investments July 31, 2020 | iShares® Evolved U.S. Financials ETF (Percentages shown are based on Net Assets) |
| Security | Shares | Value | ||||||
Common Stocks |
| |||||||
| Banks — 39.5% | ||||||||
Ameris Bancorp. | 64 | $ | 1,477 | |||||
Associated Banc-Corp. | 347 | 4,456 | ||||||
Atlantic Union Bankshares Corp. | 140 | 3,160 | ||||||
BancFirst Corp. | 46 | 2,004 | ||||||
Bank of America Corp. | 7,440 | 185,107 | ||||||
Bank of Hawaii Corp. | 94 | 5,323 | ||||||
Bank of New York Mellon Corp. (The) | 1,222 | 43,809 | ||||||
Bank OZK | 226 | 5,435 | ||||||
BankUnited Inc. | 216 | 4,350 | ||||||
Banner Corp. | 52 | 1,842 | ||||||
BOK Financial Corp. | 53 | 2,952 | ||||||
Bryn Mawr Bank Corp. | 63 | 1,641 | ||||||
Cathay General Bancorp. | 180 | 4,352 | ||||||
CIT Group Inc. | 167 | 3,168 | ||||||
Citigroup Inc. | 2,773 | 138,678 | ||||||
Citizens Financial Group Inc. | 830 | 20,592 | ||||||
City Holding Co. | 40 | 2,498 | ||||||
Columbia Banking System Inc. | 153 | 4,426 | ||||||
Comerica Inc. | 264 | 10,169 | ||||||
Commerce Bancshares Inc. | 193 | 11,051 | ||||||
Community Bank System Inc. | 114 | 6,410 | ||||||
ConnectOne Bancorp. Inc. | 76 | 1,048 | ||||||
Cullen/Frost Bankers Inc. | 118 | 8,503 | ||||||
CVB Financial Corp. | 243 | 4,391 | ||||||
Eagle Bancorp. Inc. | 67 | 2,015 | ||||||
East West Bancorp. Inc. | 288 | 9,982 | ||||||
Enterprise Financial Services Corp. | 58 | 1,686 | ||||||
Fifth Third Bancorp. | 1,330 | 26,414 | ||||||
First BanCorp./Puerto Rico | 384 | 2,089 | ||||||
First Bancorp./Southern Pines NC | 71 | 1,467 | ||||||
First Busey Corp. | 112 | 1,915 | ||||||
First Citizens BancShares Inc./NC, Class A | 12 | 5,111 | ||||||
First Commonwealth Financial Corp. | 268 | 2,109 | ||||||
First Financial Bancorp. | 210 | 2,922 | ||||||
First Financial Bankshares Inc. | 284 | 8,497 | ||||||
First Hawaiian Inc. | 261 | 4,536 | ||||||
First Horizon National Corp. | 1,165 | 10,800 | ||||||
First Interstate BancSystem Inc., Class A | 83 | 2,416 | ||||||
First Midwest Bancorp. Inc. | 230 | 2,791 | ||||||
Flagstar Bancorp. Inc. | 62 | 1,946 | ||||||
FNB Corp. | 695 | 5,150 | ||||||
Fulton Financial Corp. | 382 | 3,705 | ||||||
Glacier Bancorp. Inc. | 172 | 6,073 | ||||||
Goldman Sachs Group Inc. (The) | 522 | 103,335 | ||||||
Great Western Bancorp. Inc. | 127 | 1,651 | ||||||
Hancock Whitney Corp. | 169 | 3,221 | ||||||
Hanmi Financial Corp. | 78 | 720 | ||||||
Heartland Financial USA Inc. | 71 | 2,218 | ||||||
Heritage Financial Corp./WA | 75 | 1,419 | ||||||
Hilltop Holdings Inc. | 160 | 3,115 | ||||||
Home BancShares Inc./AR | 318 | 5,193 | ||||||
Hope Bancorp Inc. | 282 | 2,377 | ||||||
Huntington Bancshares Inc./OH | 1,901 | 17,622 | ||||||
Independent Bank Corp. | 58 | 3,742 | ||||||
Independent Bank Group Inc. | 43 | 1,889 | ||||||
International Bancshares Corp. | 134 | 4,076 | ||||||
JPMorgan Chase & Co. | 1,820 | 175,885 | ||||||
KeyCorp. | 1,838 | 22,074 | ||||||
| Security | Shares | Value | ||||||
| Banks (continued) | ||||||||
Lakeland Bancorp. Inc. | 132 | $ | 1,344 | |||||
Lakeland Financial Corp. | 67 | 2,965 | ||||||
M&T Bank Corp. | 137 | 14,515 | ||||||
Meta Financial Group Inc. | 57 | 1,064 | ||||||
Morgan Stanley | 1,803 | 88,131 | ||||||
National Bank Holdings Corp., Class A | 71 | 1,972 | ||||||
NBT Bancorp. Inc. | 113 | 3,366 | ||||||
Northern Trust Corp. | 350 | 27,423 | ||||||
OFG Bancorp | 94 | 1,230 | ||||||
Old National Bancorp./IN | 329 | 4,603 | ||||||
PacWest Bancorp. | 229 | 4,185 | ||||||
Park National Corp. | 33 | 2,830 | ||||||
Pinnacle Financial Partners Inc. | 147 | 5,824 | ||||||
Popular Inc. | 173 | 6,420 | ||||||
Prosperity Bancshares Inc. | 173 | 9,612 | ||||||
Regions Financial Corp. | 1,846 | 20,048 | ||||||
Renasant Corp. | 114 | 2,648 | ||||||
S&T Bancorp. Inc. | 84 | 1,806 | ||||||
Sandy Spring Bancorp. Inc. | 78 | 1,803 | ||||||
Seacoast Banking Corp. of Florida(a) | 99 | 1,869 | ||||||
ServisFirst Bancshares Inc. | 94 | 3,440 | ||||||
Simmons First National Corp., Class A | 177 | 2,936 | ||||||
South State Corp. | 133 | 6,339 | ||||||
Southside Bancshares Inc. | 85 | 2,355 | ||||||
State Street Corp. | 597 | 38,083 | ||||||
SVB Financial Group(a) | 95 | 21,306 | ||||||
Synovus Financial Corp. | 297 | 5,985 | ||||||
TCF Financial Corp. | 279 | 7,670 | ||||||
Texas Capital Bancshares Inc.(a) | 54 | 1,794 | ||||||
Tompkins Financial Corp. | 38 | 2,452 | ||||||
Truist Financial Corp. | 2,509 | 93,987 | ||||||
Trustmark Corp. | 72 | 1,622 | ||||||
U.S. Bancorp. | 2,492 | 91,805 | ||||||
UMB Financial Corp. | 94 | 4,681 | ||||||
Umpqua Holdings Corp. | 398 | 4,318 | ||||||
United Community Banks Inc./GA | 128 | 2,295 | ||||||
Valley National Bancorp. | 594 | 4,437 | ||||||
Veritex Holdings Inc. | 64 | 1,070 | ||||||
Webster Financial Corp. | 186 | 5,072 | ||||||
Wells Fargo & Co. | 6,861 | 166,448 | ||||||
WesBanco Inc. | 103 | 2,043 | ||||||
Westamerica Bancorp. | 61 | 3,682 | ||||||
Western Alliance Bancorp. | 152 | 5,464 | ||||||
Wintrust Financial Corp. | 116 | 4,965 | ||||||
Zions Bancorp. N.A. | 357 | 11,592 | ||||||
|
| |||||||
| 1,626,502 | ||||||||
| Commercial Services — 5.9% | ||||||||
Automatic Data Processing Inc. | 211 | 28,044 | ||||||
Avalara Inc.(a) | 26 | 3,496 | ||||||
CoreLogic Inc. | 64 | 4,362 | ||||||
Equifax Inc. | 78 | 12,680 | ||||||
Euronet Worldwide Inc.(a) | 25 | 2,404 | ||||||
EVERTEC Inc. | 66 | 2,049 | ||||||
FleetCor Technologies Inc.(a) | 42 | 10,860 | ||||||
FTI Consulting Inc.(a) | 21 | 2,508 | ||||||
Global Payments Inc. | 165 | 29,373 | ||||||
Grand Canyon Education Inc.(a) | 23 | 2,041 | ||||||
Green Dot Corp., Class A(a) | 57 | 2,889 | ||||||
HealthEquity Inc.(a) | 37 | 1,908 | ||||||
Insperity Inc. | 29 | 1,939 | ||||||
SCHEDULE OF INVESTMENTS | 27 |
Schedule of Investments (continued) July 31, 2020 | iShares® Evolved U.S. Financials ETF (Percentages shown are based on Net Assets) |
| Security | Shares | Value | ||||||
| Commercial Services (continued) | ||||||||
MarketAxess Holdings Inc. | 29 | $ | 14,984 | |||||
Moody’s Corp. | 135 | 37,975 | ||||||
Morningstar Inc. | 17 | 2,857 | ||||||
S&P Global Inc. | 140 | 49,035 | ||||||
Service Corp. International | 111 | 4,813 | ||||||
Verisk Analytics Inc. | 127 | 23,966 | ||||||
WEX Inc.(a) | 37 | 5,860 | ||||||
|
| |||||||
| 244,043 | ||||||||
| Computers — 0.1% | ||||||||
Genpact Ltd. | 66 | 2,628 | ||||||
|
| |||||||
| Diversified Financial Services — 14.0% | ||||||||
Affiliated Managers Group Inc.(b) | 61 | 4,196 | ||||||
Alliance Data Systems Corp. | 30 | 1,331 | ||||||
Ally Financial Inc. | 601 | 12,080 | ||||||
American Express Co. | 809 | 75,496 | ||||||
Ameriprise Financial Inc. | 187 | 28,729 | ||||||
Ares Management Corp., Class A | 76 | 3,035 | ||||||
Artisan Partners Asset Management Inc., Class A | 70 | 2,536 | ||||||
BGC Partners Inc., Class A | 217 | 601 | ||||||
Boston Private Financial Holdings Inc. | 128 | 753 | ||||||
Capital One Financial Corp. | 723 | 46,127 | ||||||
Cboe Global Markets Inc. | 101 | 8,858 | ||||||
Charles Schwab Corp. (The) | 1,668 | 55,294 | ||||||
CME Group Inc. | 224 | 37,224 | ||||||
Cohen & Steers Inc. | 36 | 2,167 | ||||||
Credit Acceptance Corp.(a) | 16 | 7,487 | ||||||
Discover Financial Services | 392 | 19,377 | ||||||
Eaton Vance Corp., NVS | 167 | 6,035 | ||||||
Evercore Inc., Class A | 38 | 2,101 | ||||||
Federated Investors Inc., Class B | 132 | 3,480 | ||||||
Franklin Resources Inc. | 372 | 7,831 | ||||||
Hamilton Lane Inc., Class A | 24 | 1,734 | ||||||
Houlihan Lokey Inc. | 40 | 2,192 | ||||||
Interactive Brokers Group Inc., Class A | 71 | 3,522 | ||||||
Intercontinental Exchange Inc. | 438 | 42,390 | ||||||
Invesco Ltd. | 336 | 3,373 | ||||||
Janus Henderson Group PLC | 264 | 5,515 | ||||||
Jefferies Financial Group Inc. | 307 | 4,973 | ||||||
KKR & Co. Inc. | 539 | 19,064 | ||||||
Legg Mason Inc. | 126 | 6,299 | ||||||
LendingTree Inc.(a)(b) | 5 | 1,731 | ||||||
LPL Financial Holdings Inc. | 104 | 8,218 | ||||||
Mastercard Inc., Class A | 80 | 24,682 | ||||||
Moelis & Co., Class A | 41 | 1,221 | ||||||
Nasdaq Inc. | 105 | 13,788 | ||||||
Navient Corp. | 271 | 2,157 | ||||||
OneMain Holdings Inc. | 116 | 3,329 | ||||||
Raymond James Financial Inc. | 207 | 14,382 | ||||||
Santander Consumer USA Holdings Inc.(b) | 110 | 2,020 | ||||||
SEI Investments Co. | 153 | 8,007 | ||||||
SLM Corp. | 711 | 4,814 | ||||||
Stifel Financial Corp. | 123 | 5,963 | ||||||
Synchrony Financial | 753 | 16,664 | ||||||
T Rowe Price Group Inc. | 271 | 37,425 | ||||||
Tradeweb Markets Inc., Class A | 54 | 2,920 | ||||||
Virtu Financial Inc., Class A | 101 | 2,505 | ||||||
Visa Inc., Class A | 23 | 4,379 | ||||||
Waddell & Reed Financial Inc., Class A | 137 | 1,999 | ||||||
| Security | Shares | Value | ||||||
| Diversified Financial Services (continued) | ||||||||
Western Union Co. (The) | 288 | $ | 6,993 | |||||
|
| |||||||
| 576,997 | ||||||||
| Electric — 0.1% | ||||||||
Hawaiian Electric Industries Inc. | 139 | 5,040 | ||||||
|
| |||||||
| Engineering & Construction — 0.1% | ||||||||
frontdoor Inc.(a) | 55 | 2,310 | ||||||
|
| |||||||
| Forest Products & Paper — 0.1% | ||||||||
International Paper Co. | 156 | 5,427 | ||||||
|
| |||||||
| Health Care – Services — 3.8% | ||||||||
Anthem Inc. | 133 | 36,416 | ||||||
Centene Corp.(a) | 109 | 7,112 | ||||||
Cigna Corp.(a) | 275 | 47,490 | ||||||
Humana Inc. | 5 | 1,962 | ||||||
Molina Healthcare Inc.(a) | 42 | 7,757 | ||||||
UnitedHealth Group Inc. | 189 | 57,226 | ||||||
|
| |||||||
| 157,963 | ||||||||
| Home Builders — 0.3% | ||||||||
NVR Inc.(a) | 3 | 11,790 | ||||||
|
| |||||||
| Household Products & Wares — 0.0% | ||||||||
Spectrum Brands Holdings Inc. | 8 | 433 | ||||||
|
| |||||||
| Insurance — 26.2% | ||||||||
Aflac Inc. | 1,181 | 42,008 | ||||||
Alleghany Corp. | 26 | 13,580 | ||||||
Allstate Corp. (The) | 516 | 48,705 | ||||||
American Financial Group Inc./OH | 139 | 8,447 | ||||||
American International Group Inc. | 1,525 | 49,013 | ||||||
American National Group Inc. | 22 | 1,620 | ||||||
Aon PLC, Class A | 173 | 35,503 | ||||||
Arch Capital Group Ltd.(a) | 563 | 17,312 | ||||||
Argo Group International Holdings Ltd. | 56 | 1,877 | ||||||
Arthur J Gallagher & Co. | 250 | 26,872 | ||||||
Assurant Inc. | 74 | 7,953 | ||||||
Assured Guaranty Ltd. | 85 | 1,856 | ||||||
Athene Holding Ltd., Class A(a)(b) | 340 | 10,965 | ||||||
Axis Capital Holdings Ltd. | 134 | 5,376 | ||||||
Berkshire Hathaway Inc., Class B(a) | 586 | 114,727 | ||||||
Brighthouse Financial Inc.(a) | 154 | 4,364 | ||||||
Brown & Brown Inc. | 331 | 15,051 | ||||||
Cincinnati Financial Corp. | 296 | 23,067 | ||||||
CNA Financial Corp. | 66 | 2,198 | ||||||
CNO Financial Group Inc. | 209 | 3,156 | ||||||
eHealth Inc.(a) | 16 | 1,106 | ||||||
Employers Holdings Inc. | 56 | 1,821 | ||||||
Enstar Group Ltd.(a) | 19 | 3,191 | ||||||
Equitable Holdings Inc. | 602 | 12,317 | ||||||
Erie Indemnity Co., Class A, NVS | 27 | 5,673 | ||||||
Essent Group Ltd. | 131 | 4,694 | ||||||
Everest Re Group Ltd. | 71 | 15,534 | ||||||
Fidelity National Financial Inc. | 416 | 13,462 | ||||||
First American Financial Corp. | 190 | 9,692 | ||||||
Genworth Financial Inc., Class A(a) | 1,014 | 2,069 | ||||||
Globe Life Inc. | 198 | 15,761 | ||||||
Hanover Insurance Group Inc. (The) | 81 | 8,252 | ||||||
Hartford Financial Services Group Inc. (The) | 637 | 26,958 | ||||||
Horace Mann Educators Corp. | 85 | 3,194 | ||||||
James River Group Holdings Ltd. | 48 | 2,223 | ||||||
| 28 | 2020ISHARES ANNUAL REPORTTO SHAREHOLDERS |
Schedule of Investments (continued) July 31, 2020 | iShares® Evolved U.S. Financials ETF (Percentages shown are based on Net Assets) |
| Security | Shares | Value | ||||||
| Insurance (continued) | ||||||||
Kemper Corp. | 121 | $ | 9,501 | |||||
Kinsale Capital Group Inc. | 39 | 7,601 | ||||||
Lincoln National Corp. | 371 | 13,827 | ||||||
Loews Corp. | 240 | 8,738 | ||||||
Markel Corp.(a) | 19 | 19,846 | ||||||
Marsh & McLennan Companies Inc. | 586 | 68,328 | ||||||
Mercury General Corp. | 60 | 2,575 | ||||||
MetLife Inc. | 1,308 | 49,508 | ||||||
MGIC Investment Corp. | 653 | 5,400 | ||||||
National General Holdings Corp. | 118 | 4,011 | ||||||
NMI Holdings Inc., Class A(a) | 139 | 2,157 | ||||||
Old Republic International Corp. | 379 | 6,091 | ||||||
Palomar Holdings Inc.(a) | 39 | 3,562 | ||||||
Primerica Inc. | 56 | 6,701 | ||||||
Principal Financial Group Inc. | 503 | 21,342 | ||||||
ProAssurance Corp. | 105 | 1,544 | ||||||
Progressive Corp. (The) | 981 | 88,624 | ||||||
Prudential Financial Inc. | 723 | 45,817 | ||||||
Radian Group Inc. | 321 | 4,789 | ||||||
RenaissanceRe Holdings Ltd. | 75 | 13,528 | ||||||
RLI Corp. | 90 | 7,932 | ||||||
Safety Insurance Group Inc. | 33 | 2,497 | ||||||
Selective Insurance Group Inc. | 112 | 6,086 | ||||||
Travelers Companies Inc. (The) | 454 | 51,947 | ||||||
Universal Insurance Holdings Inc. | 64 | 1,121 | ||||||
Unum Group | 394 | 6,789 | ||||||
Voya Financial Inc. | 255 | 12,597 | ||||||
White Mountains Insurance Group Ltd. | 6 | 5,281 | ||||||
Willis Towers Watson PLC | 116 | 24,361 | ||||||
WR Berkley Corp. | 283 | 17,475 | ||||||
|
| |||||||
| 1,079,173 | ||||||||
| Internet — 0.8% | ||||||||
E*TRADE Financial Corp. | 370 | 18,785 | ||||||
Lyft Inc., Class A(a) | 159 | 4,647 | ||||||
TD Ameritrade Holding Corp. | 275 | 9,870 | ||||||
|
| |||||||
| 33,302 | ||||||||
| Machinery — 0.9% | ||||||||
Caterpillar Inc. | 257 | 34,150 | ||||||
Vertiv Holdings Co.(a) | 196 | 2,842 | ||||||
|
| |||||||
| 36,992 | ||||||||
| Media — 0.1% | ||||||||
FactSet Research Systems Inc. | 16 | 5,541 | ||||||
|
| |||||||
| Pharmaceuticals — 0.8% | ||||||||
CVS Health Corp. | 491 | 30,904 | ||||||
|
| |||||||
| Private Equity — 0.7% | ||||||||
Blackstone Group Inc. (The), Class A | 499 | 26,587 | ||||||
|
| |||||||
| Real Estate Investment Trusts — 0.7% | ||||||||
AGNC Investment Corp. | 213 | 2,897 | ||||||
Annaly Capital Management Inc. | 930 | 6,891 | ||||||
MFA Financial Inc. | 382 | 1,005 | ||||||
New Residential Investment Corp. | 268 | 2,125 | ||||||
Two Harbors Investment Corp. | 150 | 814 | ||||||
Weyerhaeuser Co. | 492 | 13,683 | ||||||
|
| |||||||
| 27,415 | ||||||||
| Security | Shares | Value | ||||||
| Retail — 0.1% | ||||||||
FirstCash Inc. | 30 | $ | 1,729 | |||||
|
| |||||||
| Savings & Loans — 1.2% | ||||||||
Axos Financial Inc.(a) | 95 | 2,129 | ||||||
Berkshire Hills Bancorp. Inc. | 75 | 747 | ||||||
Brookline Bancorp. Inc. | 175 | 1,679 | ||||||
Capitol Federal Financial Inc. | 292 | 2,818 | ||||||
Investors Bancorp. Inc. | 501 | 4,068 | ||||||
Meridian Bancorp. Inc. | 113 | 1,289 | ||||||
New York Community Bancorp. Inc. | 937 | 9,867 | ||||||
Northwest Bancshares Inc. | 224 | 2,206 | ||||||
OceanFirst Financial Corp. | 97 | 1,486 | ||||||
Pacific Premier Bancorp. Inc. | 95 | 1,996 | ||||||
People’s United Financial Inc. | 759 | 8,190 | ||||||
Provident Financial Services Inc. | 140 | 1,911 | ||||||
Sterling Bancorp./DE | 450 | 5,062 | ||||||
Washington Federal Inc. | 174 | 4,061 | ||||||
WSFS Financial Corp. | 118 | 3,367 | ||||||
|
| |||||||
| 50,876 | ||||||||
| Semiconductors — 0.2% | ||||||||
Intel Corp. | 155 | 7,398 | ||||||
|
| |||||||
| Software — 3.5% | ||||||||
Black Knight Inc.(a) | 48 | 3,596 | ||||||
Broadridge Financial Solutions Inc. | 90 | 12,091 | ||||||
Fidelity National Information Services Inc. | 456 | 66,717 | ||||||
Fiserv Inc.(a) | 277 | 27,642 | ||||||
Jack Henry & Associates Inc. | 11 | 1,961 | ||||||
MSCI Inc. | 44 | 16,543 | ||||||
Paychex Inc. | 155 | 11,148 | ||||||
SS&C Technologies Holdings Inc. | 91 | 5,232 | ||||||
|
| |||||||
| 144,930 | ||||||||
|
| |||||||
Total Common Stocks — 99.1% |
| 4,077,980 | ||||||
|
| |||||||
Short-Term Investments |
| |||||||
Money Market Funds — 0.9% |
| |||||||
BlackRock Cash Funds: Institutional, | ||||||||
0.40%(c)(d)(e) | 8,494 | 8,503 | ||||||
BlackRock Cash Funds: Treasury, | ||||||||
0.12%(c)(d) | 30,000 | 30,000 | ||||||
|
| |||||||
| 38,503 | ||||||||
|
| |||||||
Total Short-Term Investments — 0.9% |
| 38,503 | ||||||
|
| |||||||
Total Investments in Securities — 100.0% |
| 4,116,483 | ||||||
Other Assets, Less Liabilities — (0.0)% |
| (1,586 | ) | |||||
|
| |||||||
Net Assets — 100.0% |
| $ | 4,114,897 | |||||
|
| |||||||
| (a) | Non-income producing security. |
| (b) | All or a portion of this security is on loan. |
| (c) | Affiliate of the Fund. |
| (d) | Annualized 7-day yield as of period-end. |
| (e) | All or a portion of this security was purchased with cash collateral received from loaned securities. |
SCHEDULE OF INVESTMENTS | 29 |
Schedule of Investments (continued) July 31, 2020 | iShares® Evolved U.S. Financials ETF |
Affiliates
Investments in issuers considered to be affiliate(s) of the Fund during the year ended July 31, 2020, for purposes of Section 2(a)(3) of the Investment Company Act of 1940, as amended, were as follows:
| Affiliated Issuer | Value at 07/31/19 | Purchases at Cost | Proceeds from Sales | Net Realized Gain (Loss) | Change in Unrealized Appreciation (Depreciation) | Value at 07/31/20 | Shares Held at 07/31/20 | Income | Capital Gain Distributions from Underlying Funds | |||||||||||||||||||||||||||
BlackRock Cash Funds: Institutional, | $ | 1,490 | $ | 6,953 | (a) | $ | — | $ | 61 | $ | (1 | ) | $ | 8,503 | 8,494 | $ | 91 | (b) | $ | — | ||||||||||||||||
BlackRock Cash Funds: Treasury, | 24,000 | 6,000 | (a) | — | — | — | 30,000 | 30,000 | 331 | — | ||||||||||||||||||||||||||
|
|
|
|
|
|
|
|
|
| |||||||||||||||||||||||||||
| $ | 61 | $ | (1 | ) | $ | 38,503 | $ | 422 | $ | — | ||||||||||||||||||||||||||
|
|
|
|
|
|
|
|
|
| |||||||||||||||||||||||||||
| (a) | Represents net amount purchased (sold). |
| (b) | All or a portion represents securities lending income earned from the reinvestment of cash collateral from loaned securities, net of fees and collateral investment expenses, and other payments to and from borrowers of securities. |
Fair Value Measurements
Various inputs are used in determining the fair value of financial instruments. For description of the input levels and information about the Fund’s policy regarding valuation of financial instruments, refer to the Notes to Financial Statements.
The following table summarizes the value of the Fund’s investments according to the fair value hierarchy as of July 31, 2020. The breakdown of the Fund’s investments into major categories is disclosed in the Schedule of Investments above.
| Level 1 | Level 2 | Level 3 | Total | |||||||||||||
Investments | ||||||||||||||||
Assets | ||||||||||||||||
Common Stocks | $ | 4,077,980 | $ | — | $ | — | $ | 4,077,980 | ||||||||
Money Market Funds | 38,503 | — | — | 38,503 | ||||||||||||
|
|
|
|
|
|
|
| |||||||||
| $ | 4,116,483 | $ | — | $ | — | $ | 4,116,483 | |||||||||
|
|
|
|
|
|
|
| |||||||||
See notes to financial statements.
| 30 | 2020ISHARES ANNUAL REPORTTO SHAREHOLDERS |
Schedule of Investments July 31, 2020 | iShares® Evolved U.S. Healthcare Staples ETF (Percentages shown are based on Net Assets) |
| Security | Shares | Value | ||||||
Common Stocks |
| |||||||
| Biotechnology — 4.0% | ||||||||
Amgen Inc. | 216 | $ | 52,849 | |||||
Bio-Rad Laboratories Inc., Class A(a) | 97 | 50,914 | ||||||
Exact Sciences Corp.(a) | 748 | 70,873 | ||||||
Guardant Health Inc.(a) | 244 | 20,784 | ||||||
Illumina Inc.(a)(b) | 910 | 347,766 | ||||||
Livongo Health Inc.(a) | 197 | 25,068 | ||||||
Myriad Genetics Inc.(a) | 414 | 4,997 | ||||||
NeoGenomics Inc.(a) | 540 | 20,644 | ||||||
Veracyte Inc.(a) | 315 | 11,236 | ||||||
|
| |||||||
| 605,131 | ||||||||
| Commercial Services — 0.5% | ||||||||
Adtalem Global Education Inc.(a) | 179 | 6,147 | ||||||
AMN Healthcare Services Inc.(a) | 297 | 16,317 | ||||||
Bright Horizons Family Solutions Inc.(a) | 144 | 15,443 | ||||||
Grand Canyon Education Inc.(a) | 137 | 12,157 | ||||||
HMS Holdings Corp.(a) | 585 | 19,013 | ||||||
Laureate Education Inc., Class A(a) | 306 | 3,880 | ||||||
Strategic Education Inc. | 45 | 5,679 | ||||||
|
| |||||||
| 78,636 | ||||||||
| Computers — 0.3% | ||||||||
Leidos Holdings Inc. | 188 | 17,890 | ||||||
Maximus Inc. | 269 | 19,963 | ||||||
|
| |||||||
| 37,853 | ||||||||
| Electrical Components & Equipment — 0.1% | ||||||||
Novanta Inc.(a) | 161 | 16,692 | ||||||
|
| |||||||
| Electronics — 1.2% | ||||||||
Agilent Technologies Inc. | 1,002 | 96,523 | ||||||
OSI Systems Inc.(a) | 81 | 5,748 | ||||||
PerkinElmer Inc. | 425 | 50,537 | ||||||
Waters Corp.(a) | 163 | 34,743 | ||||||
|
| |||||||
| 187,551 | ||||||||
| Environmental Control — 0.0% | ||||||||
Stericycle Inc.(a) | 125 | 7,554 | ||||||
|
| |||||||
| Food Service — 0.1% | ||||||||
Healthcare Services Group Inc. | 323 | 8,459 | ||||||
|
| |||||||
| Health Care – Products — 47.4% | ||||||||
10X Genomics Inc., Class A(a) | 118 | 11,608 | ||||||
Abbott Laboratories | 12,649 | 1,272,995 | ||||||
ABIOMED Inc.(a) | 279 | 83,683 | ||||||
Adaptive Biotechnologies Corp.(a) | 152 | 5,673 | ||||||
Align Technology Inc.(a) | 206 | 60,527 | ||||||
AngioDynamics Inc.(a) | 216 | 1,784 | ||||||
AtriCure Inc.(a) | 216 | 8,815 | ||||||
Atrion Corp. | 9 | 5,581 | ||||||
Avanos Medical Inc.(a) | 180 | 5,521 | ||||||
Avantor Inc.(a) | 674 | 14,882 | ||||||
Axogen Inc.(a) | 99 | 1,126 | ||||||
Baxter International Inc. | 1,692 | 146,155 | ||||||
Bio-Techne Corp. | 126 | 34,670 | ||||||
BioTelemetry Inc.(a) | 207 | 8,810 | ||||||
Boston Scientific Corp.(a) | 9,944 | 383,540 | ||||||
Bruker Corp. | 342 | 15,260 | ||||||
Cardiovascular Systems Inc.(a) | 189 | 5,761 | ||||||
CareDx Inc.(a) | 245 | 8,171 | ||||||
Cooper Companies Inc. (The) | 297 | 84,030 | ||||||
| Security | Shares | Value | ||||||
| Health Care – Products (continued) | ||||||||
CryoLife Inc.(a)(b) | 216 | $ | 4,192 | |||||
Cutera Inc.(a) | 63 | 896 | ||||||
Danaher Corp. | 2,847 | 580,219 | ||||||
Dentsply Sirona Inc. | 755 | 33,673 | ||||||
Edwards Lifesciences Corp.(a) | 4,347 | 340,848 | ||||||
GenMark Diagnostics Inc.(a) | 414 | 7,394 | ||||||
Glaukos Corp.(a) | 126 | 5,506 | ||||||
Globus Medical Inc., Class A(a) | 531 | 25,584 | ||||||
Haemonetics Corp.(a) | 216 | 18,934 | ||||||
Henry Schein Inc.(a) | 713 | 49,004 | ||||||
Hill-Rom Holdings Inc. | 326 | 31,694 | ||||||
Hologic Inc.(a) | 1,396 | 97,413 | ||||||
ICU Medical Inc.(a) | 90 | 16,536 | ||||||
IDEXX Laboratories Inc.(a) | 357 | 141,997 | ||||||
Inogen Inc.(a) | 117 | 3,592 | ||||||
Inspire Medical Systems Inc.(a) | 110 | 10,930 | ||||||
Insulet Corp.(a) | 404 | 82,157 | ||||||
Integer Holdings Corp.(a) | 135 | 8,879 | ||||||
Integra LifeSciences Holdings Corp.(a) | 378 | 18,049 | ||||||
Intersect ENT Inc.(a) | 99 | 1,702 | ||||||
Intuitive Surgical Inc.(a) | 788 | 540,127 | ||||||
iRhythm Technologies Inc.(a) | 168 | 20,913 | ||||||
LeMaitre Vascular Inc.(b) | 99 | 2,904 | ||||||
LivaNova PLC(a) | 325 | 15,125 | ||||||
Luminex Corp. | 207 | 7,535 | ||||||
Masimo Corp.(a) | 333 | 73,300 | ||||||
Medtronic PLC | 9,253 | 892,729 | ||||||
Merit Medical Systems Inc.(a) | 306 | 13,684 | ||||||
Natera Inc.(a) | 388 | 18,632 | ||||||
Natus Medical Inc.(a) | 189 | 3,512 | ||||||
Nevro Corp.(a) | 144 | 19,146 | ||||||
Novocure Ltd.(a) | 225 | 17,053 | ||||||
NuVasive Inc.(a) | 324 | 18,513 | ||||||
OraSure Technologies Inc.(a) | 351 | 6,371 | ||||||
Orthofix Medical Inc.(a) | 107 | 3,286 | ||||||
Patterson Companies Inc. | 362 | 9,615 | ||||||
Penumbra Inc.(a) | 189 | 41,941 | ||||||
Quidel Corp.(a) | 180 | 50,845 | ||||||
ResMed Inc. | 890 | 180,234 | ||||||
Shockwave Medical Inc.(a) | 136 | 6,707 | ||||||
Silk Road Medical Inc.(a) | 161 | 7,480 | ||||||
STAAR Surgical Co.(a) | 242 | 14,082 | ||||||
Steris PLC | 224 | 35,757 | ||||||
Stryker Corp. | 2,279 | 440,531 | ||||||
Tactile Systems Technology Inc.(a) | 119 | 4,877 | ||||||
Tandem Diabetes Care Inc.(a) | 308 | 32,174 | ||||||
Teleflex Inc. | 295 | 110,064 | ||||||
Thermo Fisher Scientific Inc. | 1,575 | 651,971 | ||||||
Varex Imaging Corp.(a) | 153 | 2,399 | ||||||
Varian Medical Systems Inc.(a) | 414 | 59,086 | ||||||
Wright Medical Group NV(a)(b) | 522 | 15,670 | ||||||
Zimmer Biomet Holdings Inc. | 1,149 | 154,954 | ||||||
|
| |||||||
| 7,109,008 | ||||||||
| Health Care – Services — 25.6% | ||||||||
Acadia Healthcare Co. Inc.(a) | 576 | 17,171 | ||||||
Addus HomeCare Corp.(a) | 74 | 7,134 | ||||||
Amedisys Inc.(a) | 244 | 57,135 | ||||||
Anthem Inc. | 1,304 | 357,035 | ||||||
Centene Corp.(a) | 3,247 | 211,867 | ||||||
Charles River Laboratories International Inc.(a) | 81 | 16,118 | ||||||
SCHEDULE OF INVESTMENTS | 31 |
Schedule of Investments (continued) July 31, 2020 | iShares® Evolved U.S. Healthcare Staples ETF (Percentages shown are based on Net Assets) |
| Security | Shares | Value | ||||||
| Health Care – Services (continued) | ||||||||
Chemed Corp. | 64 | $ | 31,500 | |||||
Cigna Corp.(a) | 1,540 | 265,943 | ||||||
DaVita Inc.(a) | 540 | 47,191 | ||||||
Encompass Health Corp. | 735 | 50,039 | ||||||
Ensign Group Inc. (The) | 230 | 10,578 | ||||||
Envista Holdings Corp.(a) | 510 | 11,154 | ||||||
HCA Healthcare Inc. | 1,821 | 230,611 | ||||||
Humana Inc. | 808 | 317,100 | ||||||
Invitae Corp.(a) | 442 | 12,906 | ||||||
IQVIA Holdings Inc.(a) | 595 | 94,242 | ||||||
Laboratory Corp. of America Holdings(a) | 542 | 104,563 | ||||||
LHC Group Inc.(a) | 190 | 37,071 | ||||||
Magellan Health Inc.(a) | 108 | 8,010 | ||||||
MEDNAX Inc.(a) | 605 | 12,088 | ||||||
Medpace Holdings Inc.(a) | 65 | 7,758 | ||||||
Molina Healthcare Inc.(a) | 140 | 25,858 | ||||||
National HealthCare Corp. | 72 | 4,271 | ||||||
Quest Diagnostics Inc. | 768 | 97,590 | ||||||
Select Medical Holdings Corp.(a) | 792 | 15,080 | ||||||
Syneos Health Inc.(a) | 108 | 6,738 | ||||||
Teladoc Health Inc.(a) | 288 | 68,437 | ||||||
Tenet Healthcare Corp.(a)(b) | 657 | 17,371 | ||||||
U.S. Physical Therapy Inc. | 108 | 8,970 | ||||||
UnitedHealth Group Inc. | 5,396 | 1,633,801 | ||||||
Universal Health Services Inc., Class B | 505 | 55,499 | ||||||
|
| |||||||
| 3,840,829 | ||||||||
| Household Products & Wares — 0.3% | ||||||||
Church & Dwight Co. Inc. | 511 | 49,225 | ||||||
|
| |||||||
| Pharmaceuticals — 17.1% | ||||||||
AbbVie Inc. | 1,528 | 145,022 | ||||||
AmerisourceBergen Corp. | 664 | 66,526 | ||||||
Bausch Health Companies Inc.(a)(b) | 162 | 2,960 | ||||||
Becton Dickinson and Co. | 1,737 | 488,687 | ||||||
Cardinal Health Inc. | 1,500 | 81,930 | ||||||
CVS Health Corp. | 6,100 | 383,934 | ||||||
DexCom Inc.(a) | 537 | 233,885 | ||||||
Eli Lilly & Co. | 309 | 46,440 | ||||||
Johnson & Johnson | 5,089 | 741,773 | ||||||
McKesson Corp. | 704 | 105,713 | ||||||
Neogen Corp.(a) | 81 | 6,218 | ||||||
Perrigo Co. PLC | 132 | 6,999 | ||||||
Pfizer Inc. | 5,287 | 203,444 | ||||||
PRA Health Sciences Inc.(a) | 126 | 13,426 | ||||||
Premier Inc., Class A(a) | 423 | 14,792 | ||||||
Zoetis Inc. | 154 | 23,359 | ||||||
|
| |||||||
| 2,565,108 | ||||||||
| Security | Shares | Value | ||||||
| Real Estate Investment Trusts — 1.3% | ||||||||
Healthpeak Properties Inc. | 1,016 | $ | 27,727 | |||||
Medical Properties Trust Inc. | 2,079 | 41,850 | ||||||
National Health Investors Inc. | 180 | 11,160 | ||||||
Omega Healthcare Investors Inc. | 466 | 15,089 | ||||||
Physicians Realty Trust | 738 | 13,314 | ||||||
Sabra Health Care REIT Inc. | 720 | 10,613 | ||||||
Ventas Inc. | 862 | 33,066 | ||||||
Welltower Inc. | 809 | 43,330 | ||||||
|
| |||||||
| 196,149 | ||||||||
| Retail — 0.6% | ||||||||
National Vision Holdings Inc.(a) | 172 | 5,502 | ||||||
Walgreens Boots Alliance Inc. | 1,928 | 78,489 | ||||||
|
| |||||||
| 83,991 | ||||||||
| Software — 0.9% | ||||||||
Allscripts Healthcare Solutions Inc.(a) | 817 | 7,353 | ||||||
Cerner Corp. | 1,459 | 101,328 | ||||||
Change Healthcare Inc.(a) | 887 | 10,342 | ||||||
Omnicell Inc.(a) | 179 | 12,582 | ||||||
Tabula Rasa HealthCare Inc.(a)(b) | 90 | 5,058 | ||||||
|
| |||||||
| 136,663 | ||||||||
|
| |||||||
Total Common Stocks — 99.4% |
| 14,922,849 | ||||||
|
| |||||||
Short-Term Investments |
| |||||||
| Money Market Funds — 2.0% | ||||||||
BlackRock Cash Funds: Institutional, | ||||||||
0.40%(c)(d)(e) | 227,802 | 228,052 | ||||||
BlackRock Cash Funds: Treasury, | ||||||||
0.12%(c)(d) | 66,000 | 66,000 | ||||||
|
| |||||||
| 294,052 | ||||||||
|
| |||||||
Total Short-Term Investments — 2.0% |
| 294,052 | ||||||
|
| |||||||
Total Investments in Securities — 101.4% |
| 15,216,901 | ||||||
Other Assets, Less Liabilities — (1.4)% |
| (210,249 | ) | |||||
|
| |||||||
Net Assets — 100.0% |
| $ | 15,006,652 | |||||
|
| |||||||
| (a) | Non-income producing security. |
| (b) | All or a portion of this security is on loan. |
| (c) | Affiliate of the Fund. |
| (d) | Annualized 7-day yield as of period-end. |
| (e) | All or a portion of this security was purchased with cash collateral received from loaned securities. |
| 32 | 2020ISHARES ANNUAL REPORTTO SHAREHOLDERS |
Schedule of Investments (continued) July 31, 2020 | iShares® Evolved U.S. Healthcare Staples ETF |
Affiliates
Investments in issuers considered to be affiliate(s) of the Fund during the year ended July 31, 2020, for purposes of Section 2(a)(3) of the Investment Company Act of 1940, as amended, were as follows:
| Affiliated Issuer | Value at 07/31/19 | Purchases at Cost | Proceeds from Sales | Net Realized Gain (Loss) | Change in Unrealized Appreciation (Depreciation) | Value at 07/31/20 | Shares Held at 07/31/20 | Income | Capital Gain Distributions from Underlying Funds | |||||||||||||||||||||||||||
BlackRock Cash Funds: Institutional, | $ | 250,070 | $ | — | $ | (22,329 | )(a) | $ | 310 | $ | 1 | $ | 228,052 | 227,802 | $ | 1,094 | (b) | $ | — | |||||||||||||||||
BlackRock Cash Funds: Treasury, | 50,000 | 16,000 | (a) | — | — | — | 66,000 | 66,000 | 715 | — | ||||||||||||||||||||||||||
|
|
|
|
|
|
|
|
|
| |||||||||||||||||||||||||||
| $ | 310 | $ | 1 | $ | 294,052 | $ | 1,809 | $ | — | |||||||||||||||||||||||||||
|
|
|
|
|
|
|
|
|
| |||||||||||||||||||||||||||
| (a) | Represents net amount purchased (sold). |
| (b) | All or a portion represents securities lending income earned from the reinvestment of cash collateral from loaned securities, net of fees and collateral investment expenses, and other payments to and from borrowers of securities. |
Fair Value Measurements
Various inputs are used in determining the fair value of financial instruments. For description of the input levels and information about the Fund’s policy regarding valuation of financial instruments, refer to the Notes to Financial Statements.
The following table summarizes the value of the Fund’s investments according to the fair value hierarchy as of July 31, 2020. The breakdown of the Fund’s investments into major categories is disclosed in the Schedule of Investments above.
| Level 1 | Level 2 | Level 3 | Total | |||||||||||||
Investments | ||||||||||||||||
Assets | ||||||||||||||||
Common Stocks | $ | 14,922,849 | $ | — | $ | — | $ | 14,922,849 | ||||||||
Money Market Funds | 294,052 | — | — | 294,052 | ||||||||||||
|
|
|
|
|
|
|
| |||||||||
| $ | 15,216,901 | $ | — | $ | — | $ | 15,216,901 | |||||||||
|
|
|
|
|
|
|
| |||||||||
See notes to financial statements.
SCHEDULE OF INVESTMENTS | 33 |
Schedule of Investments July 31, 2020 | iShares® Evolved U.S. Innovative Healthcare ETF (Percentages shown are based on Net Assets) |
| Security | Shares | Value | ||||||
Common Stocks |
| |||||||
| Biotechnology — 46.8% | ||||||||
Abeona Therapeutics Inc.(a) | 476 | $ | 1,357 | |||||
ACADIA Pharmaceuticals Inc.(a) | 1,932 | 80,313 | ||||||
Acceleron Pharma Inc.(a) | 924 | 91,633 | ||||||
Achillion Pharmaceuticals Inc.(b)(c) | 624 | 287 | ||||||
Acorda Therapeutics Inc.(a) | 714 | 449 | ||||||
Aduro Biotech Inc.(a) | 644 | 1,816 | ||||||
Adverum Biotechnologies Inc.(a) | 1,063 | 17,827 | ||||||
Agenus Inc.(a) | 1,218 | 3,703 | ||||||
Albireo Pharma Inc.(a) | 289 | 8,167 | ||||||
Alder Biopharmaceuticals Inc.(b) | 312 | 275 | ||||||
Alexion Pharmaceuticals Inc.(a) | 3,288 | 336,987 | ||||||
Allakos Inc.(a) | 475 | 35,658 | ||||||
Allogene Therapeutics Inc.(a) | 1,220 | 44,737 | ||||||
Alnylam Pharmaceuticals Inc.(a) | 2,216 | 323,004 | ||||||
AMAG Pharmaceuticals Inc.(a) | 448 | 4,281 | ||||||
Amgen Inc. | 4,150 | 1,015,381 | ||||||
Amicus Therapeutics Inc.(a) | 5,105 | 73,767 | ||||||
AnaptysBio Inc.(a) | 238 | 4,274 | ||||||
ANI Pharmaceuticals Inc.(a) | 98 | 2,902 | ||||||
Apellis Pharmaceuticals Inc.(a) | 1,180 | 30,550 | ||||||
Applied Therapeutics Inc.(a) | 247 | 6,373 | ||||||
Aprea Therapeutics Inc.(a) | 296 | 8,119 | ||||||
Arcus Biosciences Inc.(a) | 999 | 19,660 | ||||||
Ardelyx Inc.(a) | 1,203 | 6,797 | ||||||
Arena Pharmaceuticals Inc.(a) | 1,109 | 68,082 | ||||||
Arrowhead Pharmaceuticals Inc.(a) | 1,846 | 79,507 | ||||||
Assembly Biosciences Inc.(a) | 308 | 6,838 | ||||||
Atara Biotherapeutics Inc.(a) | 1,360 | 16,850 | ||||||
Athersys Inc.(a) | 3,446 | 8,822 | ||||||
Avrobio Inc.(a) | 421 | 7,136 | ||||||
BioCryst Pharmaceuticals Inc.(a)(c) | 3,270 | 13,309 | ||||||
Biogen Inc.(a) | 2,699 | 741,388 | ||||||
Biohaven Pharmaceutical Holding Co. Ltd.(a)(c) | 502 | 32,148 | ||||||
BioMarin Pharmaceutical Inc.(a) | 3,422 | 409,990 | ||||||
Bio-Rad Laboratories Inc., Class A(a) | 28 | 14,697 | ||||||
Bluebird Bio Inc.(a) | 1,395 | 84,677 | ||||||
Blueprint Medicines Corp.(a) | 993 | 72,668 | ||||||
Bridgebio Pharma Inc.(a) | 1,358 | 38,214 | ||||||
Calithera Biosciences Inc.(a) | 1,534 | 7,210 | ||||||
Cara Therapeutics Inc.(a)(c) | 504 | 8,286 | ||||||
Celldex Therapeutics Inc.(a) | 44 | 453 | ||||||
ChemoCentryx Inc.(a) | 727 | 38,320 | ||||||
Constellation Pharmaceuticals Inc.(a) | 391 | 10,514 | ||||||
Cortexyme Inc.(a) | 247 | 9,843 | ||||||
Crinetics Pharmaceuticals Inc.(a) | 482 | 6,690 | ||||||
Cue Biopharma Inc.(a) | 576 | 10,892 | ||||||
Cymabay Therapeutics Inc.(a) | 1,119 | 3,972 | ||||||
CytomX Therapeutics Inc.(a) | 546 | 3,827 | ||||||
Deciphera Pharmaceuticals Inc.(a) | 785 | 36,400 | ||||||
Denali Therapeutics Inc.(a) | 1,517 | 35,528 | ||||||
Dicerna Pharmaceuticals Inc.(a) | 964 | 20,726 | ||||||
Dynavax Technologies Corp.(a) | 896 | 7,267 | ||||||
Editas Medicine Inc.(a) | 1,059 | 31,092 | ||||||
Emergent BioSolutions Inc.(a) | 712 | 79,203 | ||||||
Epizyme Inc.(a) | 1,329 | 18,393 | ||||||
Esperion Therapeutics Inc.(a)(c) | 434 | 16,331 | ||||||
Exact Sciences Corp.(a) | 828 | 78,453 | ||||||
Exelixis Inc.(a) | 5,317 | 122,770 | ||||||
| Security | Shares | Value | ||||||
| Biotechnology (continued) | ||||||||
Fate Therapeutics Inc.(a) | 1,193 | $ | 37,305 | |||||
FibroGen Inc.(a) | 1,288 | 52,125 | ||||||
Five Prime Therapeutics Inc.(a) | 630 | 3,717 | ||||||
Frequency Therapeutics Inc.(a) | 466 | 9,851 | ||||||
Geron Corp.(a) | 1,722 | 2,738 | ||||||
Gilead Sciences Inc. | 12,177 | 846,667 | ||||||
GlycoMimetics Inc.(a) | 645 | 2,541 | ||||||
Gossamer Bio Inc.(a) | 896 | 10,680 | ||||||
Guardant Health Inc.(a) | 557 | 47,445 | ||||||
Halozyme Therapeutics Inc.(a) | 2,228 | 60,579 | ||||||
Homology Medicines Inc.(a) | 597 | 7,851 | ||||||
ImmunoGen Inc.(a) | 2,658 | 10,924 | ||||||
Immunomedics Inc.(a) | 4,059 | 171,412 | ||||||
Incyte Corp.(a) | 1,398 | 138,067 | ||||||
Innoviva Inc.(a) | 826 | 11,188 | ||||||
Inovio Pharmaceuticals Inc.(a)(c) | 3,224 | 62,675 | ||||||
Insmed Inc.(a) | 1,887 | 49,288 | ||||||
Intercept Pharmaceuticals Inc.(a) | 475 | 21,679 | ||||||
Ionis Pharmaceuticals Inc.(a) | 2,321 | 133,597 | ||||||
Iovance Biotherapeutics Inc.(a) | 2,609 | 75,844 | ||||||
Karuna Therapeutics Inc.(a) | 293 | 23,967 | ||||||
Karyopharm Therapeutics Inc.(a) | 1,312 | 21,058 | ||||||
Kiniksa Pharmaceuticals Ltd., Class A(a) | 388 | 7,574 | ||||||
Kodiak Sciences Inc.(a) | 476 | 22,053 | ||||||
Krystal Biotech Inc.(a) | 194 | 8,010 | ||||||
Lexicon Pharmaceuticals Inc.(a)(c) | 742 | 1,439 | ||||||
Ligand Pharmaceuticals Inc.(a) | 294 | 34,451 | ||||||
MacroGenics Inc.(a) | 939 | 23,851 | ||||||
MEI Pharma Inc.(a) | 2,348 | 6,516 | ||||||
Mersana Therapeutics Inc.(a) | 1,396 | 27,753 | ||||||
Mirati Therapeutics Inc.(a) | 706 | 85,645 | ||||||
Moderna Inc.(a) | 5,458 | 404,438 | ||||||
Molecular Templates Inc.(a) | 633 | 6,944 | ||||||
Myriad Genetics Inc.(a) | 490 | 5,914 | ||||||
Nektar Therapeutics(a) | 3,318 | 73,527 | ||||||
NextCure Inc.(a) | 236 | 2,105 | ||||||
Novavax Inc.(a) | 1,059 | 151,543 | ||||||
Omeros Corp.(a) | 658 | 8,442 | ||||||
Pieris Pharmaceuticals Inc.(a) | 896 | 2,303 | ||||||
Precigen Inc.(a) | 616 | 2,593 | ||||||
Prothena Corp. PLC(a) | 614 | 7,515 | ||||||
Provention Bio Inc.(a) | 708 | 7,356 | ||||||
PTC Therapeutics Inc.(a) | 910 | 42,160 | ||||||
Puma Biotechnology Inc.(a) | 546 | 5,629 | ||||||
Radius Health Inc.(a) | 700 | 8,785 | ||||||
Regeneron Pharmaceuticals Inc.(a) | 1,540 | 973,388 | ||||||
REGENXBIO Inc.(a) | 476 | 15,756 | ||||||
Replimune Group Inc.(a) | 411 | 8,208 | ||||||
Retrophin Inc.(a) | 658 | 13,081 | ||||||
Rigel Pharmaceuticals Inc.(a) | 2,506 | 5,764 | ||||||
Rocket Pharmaceuticals Inc.(a)(c) | 365 | 8,588 | ||||||
Rubius Therapeutics Inc.(a) | 573 | 2,813 | ||||||
Sage Therapeutics Inc.(a) | 1,022 | 46,573 | ||||||
Sangamo Therapeutics Inc.(a) | 2,212 | 23,956 | ||||||
Scholar Rock Holding Corp.(a) | 460 | 5,193 | ||||||
Seattle Genetics Inc.(a) | 2,178 | 362,136 | ||||||
Solid Biosciences Inc.(a) | 225 | 592 | ||||||
Sorrento Therapeutics Inc.(a)(c) | 3,598 | 32,094 | ||||||
Stoke Therapeutics Inc.(a) | 282 | 7,104 | ||||||
Syndax Pharmaceuticals Inc.(a) | 673 | 9,496 | ||||||
| 34 | 2020ISHARES ANNUAL REPORTTO SHAREHOLDERS |
Schedule of Investments (continued) July 31, 2020 | iShares® Evolved U.S. Innovative Healthcare ETF (Percentages shown are based on Net Assets) |
| Security | Shares | Value | ||||||
| Biotechnology (continued) | ||||||||
Theravance Biopharma Inc.(a) | 684 | $ | 13,283 | |||||
Translate Bio Inc.(a) | 771 | 11,712 | ||||||
Turning Point Therapeutics Inc.(a) | 617 | 36,545 | ||||||
Ultragenyx Pharmaceutical Inc.(a) | 1,076 | 84,100 | ||||||
United Therapeutics Corp.(a) | 658 | 73,347 | ||||||
Vericel Corp.(a) | 335 | 5,524 | ||||||
Vertex Pharmaceuticals Inc.(a) | 3,603 | 980,016 | ||||||
Viking Therapeutics Inc.(a) | 908 | 6,374 | ||||||
Vir Biotechnology Inc.(a) | 933 | 44,560 | ||||||
WaVe Life Sciences Ltd.(a) | 294 | 2,581 | ||||||
Xencor Inc.(a) | 840 | 25,276 | ||||||
Y-mAbs Therapeutics Inc.(a) | 406 | 14,263 | ||||||
ZIOPHARM Oncology Inc.(a) | 2,128 | 6,320 | ||||||
|
| |||||||
| 9,825,200 | ||||||||
| Chemicals — 0.0% | ||||||||
Codexis Inc.(a) | 631 | 7,465 | ||||||
|
| |||||||
| Electrical Components & Equipment — 0.2% | ||||||||
Universal Display Corp.(c) | 196 | 34,192 | ||||||
|
| |||||||
| Health Care – Products — 3.2% | ||||||||
10X Genomics Inc., Class A(a) | 326 | 32,069 | ||||||
Abbott Laboratories | 296 | 29,789 | ||||||
Adaptive Biotechnologies Corp.(a) | 878 | 32,767 | ||||||
Axogen Inc.(a) | 196 | 2,229 | ||||||
Baxter International Inc. | 1,427 | 123,264 | ||||||
CareDx Inc.(a) | 240 | 8,004 | ||||||
Cerus Corp.(a) | 2,110 | 15,044 | ||||||
Cooper Companies Inc. (The) | 121 | 34,235 | ||||||
Glaukos Corp.(a) | 364 | 15,907 | ||||||
Haemonetics Corp.(a) | 182 | 15,954 | ||||||
ICU Medical Inc.(a) | 70 | 12,861 | ||||||
IDEXX Laboratories Inc.(a) | 48 | 19,092 | ||||||
Inspire Medical Systems Inc.(a) | 158 | 15,699 | ||||||
Insulet Corp.(a) | 111 | 22,573 | ||||||
Integra LifeSciences Holdings Corp.(a) | 238 | 11,365 | ||||||
Intersect ENT Inc.(a) | 252 | 4,332 | ||||||
Intuitive Surgical Inc.(a) | 30 | 20,563 | ||||||
Lantheus Holdings Inc.(a) | 726 | 9,786 | ||||||
NanoString Technologies Inc.(a) | 248 | 8,955 | ||||||
Natera Inc.(a) | 266 | 12,773 | ||||||
Nevro Corp.(a) | 196 | 26,060 | ||||||
Novocure Ltd.(a) | 935 | 70,864 | ||||||
Penumbra Inc.(a) | 71 | 15,756 | ||||||
Repligen Corp.(a) | 408 | 61,571 | ||||||
ResMed Inc. | 222 | 44,957 | ||||||
Wright Medical Group NV(a) | 432 | 12,969 | ||||||
|
| |||||||
| 679,438 | ||||||||
| Health Care – Services — 1.4% | ||||||||
Catalent Inc.(a) | 1,004 | 87,689 | ||||||
Charles River Laboratories International Inc.(a) | 295 | 58,702 | ||||||
IQVIA Holdings Inc.(a) | 578 | 91,549 | ||||||
Medpace Holdings Inc.(a) | 139 | 16,590 | ||||||
OPKO Health Inc.(a) | 3,206 | 16,511 | ||||||
Syneos Health Inc.(a) | 392 | 24,457 | ||||||
|
| |||||||
| 295,498 | ||||||||
| Pharmaceuticals — 47.7% | ||||||||
AbbVie Inc. | 11,038 | 1,047,617 | ||||||
Aclaris Therapeutics Inc.(a) | 476 | 1,023 | ||||||
Adamas Pharmaceuticals Inc.(a) | 322 | 799 | ||||||
| Security | Shares | Value | ||||||
| Pharmaceuticals (continued) | ||||||||
Aeglea BioTherapeutics Inc.(a) | 911 | $ | 6,240 | |||||
Aerie Pharmaceuticals Inc.(a) | 630 | 7,283 | ||||||
Agios Pharmaceuticals Inc.(a) | 1,132 | 51,302 | ||||||
Aimmune Therapeutics Inc.(a) | 672 | 8,877 | ||||||
Akcea Therapeutics Inc.(a) | 182 | 1,973 | ||||||
Akebia Therapeutics Inc.(a) | 2,870 | 32,058 | ||||||
Alector Inc.(a) | 1,122 | 17,582 | ||||||
Alkermes PLC(a) | 2,353 | 42,378 | ||||||
AmerisourceBergen Corp. | 274 | 27,452 | ||||||
Amneal Pharmaceuticals Inc.(a) | 1,877 | 8,127 | ||||||
Amphastar Pharmaceuticals Inc.(a) | 462 | 9,249 | ||||||
Anika Therapeutics Inc.(a) | 140 | 5,096 | ||||||
Antares Pharma Inc.(a) | 2,072 | 5,408 | ||||||
Arvinas Inc.(a) | 362 | 11,403 | ||||||
Athenex Inc.(a)(c) | 1,135 | 12,042 | ||||||
Axsome Therapeutics Inc.(a) | 548 | 39,089 | ||||||
Bausch Health Companies Inc.(a)(c) | 3,108 | 56,783 | ||||||
Bioxcel Therapeutics Inc.(a) | 230 | 10,433 | ||||||
Bristol-Myers Squibb Co. | 16,052 | 941,610 | ||||||
Catalyst Pharmaceuticals Inc.(a) | 1,051 | 4,519 | ||||||
Clovis Oncology Inc.(a) | 812 | 4,701 | ||||||
Coherus Biosciences Inc.(a) | 1,077 | 18,944 | ||||||
Collegium Pharmaceutical Inc.(a) | 378 | 5,965 | ||||||
Concert Pharmaceuticals Inc.(a)(c) | 336 | 3,115 | ||||||
Corbus Pharmaceuticals Holdings Inc.(a) | 784 | 4,916 | ||||||
Corcept Therapeutics Inc.(a) | 1,540 | 23,023 | ||||||
Cyclerion Therapeutics Inc.(a) | 210 | 802 | ||||||
Cytokinetics Inc.(a) | 756 | 16,345 | ||||||
DexCom Inc.(a) | 277 | 120,645 | ||||||
Eagle Pharmaceuticals Inc./DE(a) | 196 | 9,092 | ||||||
Eidos Therapeutics Inc.(a) | 235 | 9,424 | ||||||
Elanco Animal Health Inc.(a) | 2,895 | 68,409 | ||||||
Eli Lilly & Co. | 6,480 | 973,879 | ||||||
Enanta Pharmaceuticals Inc.(a) | 238 | 10,912 | ||||||
Endo International PLC(a) | 2,199 | 7,653 | ||||||
Flexion Therapeutics Inc.(a)(c) | 546 | 7,409 | ||||||
G1 Therapeutics Inc.(a) | 308 | 4,518 | ||||||
Global Blood Therapeutics Inc.(a)(c) | 1,051 | 70,921 | ||||||
Heron Therapeutics Inc.(a)(c) | 1,148 | 18,701 | ||||||
Horizon Therapeutics PLC(a) | 3,224 | 197,277 | ||||||
Intellia Therapeutics Inc.(a)(c) | 874 | 15,566 | ||||||
Intra-Cellular Therapies Inc.(a) | 1,112 | 22,045 | ||||||
Ironwood Pharmaceuticals Inc.(a) | 2,100 | 19,257 | ||||||
Jazz Pharmaceuticals PLC(a) | 942 | 101,972 | ||||||
Johnson & Johnson | 12,558 | 1,830,454 | ||||||
Jounce Therapeutics Inc.(a) | 252 | 1,154 | ||||||
Kadmon Holdings Inc.(a) | 3,120 | 11,419 | ||||||
Kala Pharmaceuticals Inc.(a) | 858 | 7,508 | ||||||
Kura Oncology Inc.(a) | 1,017 | 16,719 | ||||||
La Jolla Pharmaceutical Co.(a)(c) | 322 | 1,282 | ||||||
Lannett Co. Inc.(a)(c) | 406 | 2,416 | ||||||
Madrigal Pharmaceuticals Inc.(a) | 138 | 14,160 | ||||||
Mallinckrodt PLC(a)(c) | 614 | 1,369 | ||||||
MediciNova Inc.(a) | 574 | 3,570 | ||||||
Merck & Co. Inc. | 16,078 | 1,290,099 | ||||||
Momenta Pharmaceuticals Inc.(a) | 1,905 | 56,178 | ||||||
Mylan NV(a)(c) | 5,446 | 87,735 | ||||||
MyoKardia Inc.(a) | 941 | 84,812 | ||||||
Neurocrine Biosciences Inc.(a) | 1,760 | 211,834 | ||||||
Ocular Therapeutix Inc.(a) | 1,139 | 8,930 | ||||||
SCHEDULE OF INVESTMENTS | 35 |
Schedule of Investments (continued) July 31, 2020 | iShares® Evolved U.S. Innovative Healthcare ETF (Percentages shown are based on Net Assets) |
| Security | Shares | Value | ||||||
| Pharmaceuticals (continued) | ||||||||
Odonate Therapeutics Inc.(a) | 224 | $ | 8,147 | |||||
Pacira BioSciences Inc.(a) | 532 | 27,989 | ||||||
Paratek Pharmaceuticals Inc.(a) | 434 | 1,897 | ||||||
Perrigo Co. PLC | 1,102 | 58,428 | ||||||
Pfizer Inc. | 29,665 | 1,141,509 | ||||||
PRA Health Sciences Inc.(a) | 406 | 43,263 | ||||||
Prestige Consumer Healthcare Inc.(a) | 224 | 8,331 | ||||||
Principia Biopharma Inc.(a) | 509 | 42,552 | ||||||
Progenics Pharmaceuticals Inc.(b)(c) | 1,001 | — | ||||||
Protagonist Therapeutics Inc.(a) | 644 | 10,130 | ||||||
Reata Pharmaceuticals Inc., Class A(a)(c) | 435 | 64,250 | ||||||
Relmada Therapeutics Inc.(a)(c) | 224 | 8,147 | ||||||
Revance Therapeutics Inc.(a) | 1,097 | 25,758 | ||||||
Rhythm Pharmaceuticals Inc.(a) | 614 | 11,801 | ||||||
Sarepta Therapeutics Inc.(a) | 1,353 | 207,713 | ||||||
Spectrum Pharmaceuticals Inc.(a) | 1,638 | 4,898 | ||||||
Supernus Pharmaceuticals Inc.(a) | 770 | 17,144 | ||||||
Synergy Pharmaceuticals Inc.(a)(c) | 1,136 | 7 | ||||||
Syros Pharmaceuticals Inc.(a) | 809 | 7,677 | ||||||
TG Therapeutics Inc.(a) | 2,212 | 43,311 | ||||||
TherapeuticsMD Inc.(a)(c) | 2,240 | 4,144 | ||||||
Tricida Inc.(a) | 448 | 5,994 | ||||||
UroGen Pharma Ltd.(a) | 225 | 4,970 | ||||||
Vanda Pharmaceuticals Inc.(a) | 784 | 7,903 | ||||||
Voyager Therapeutics Inc.(a) | 448 | 4,959 | ||||||
Zoetis Inc. | 3,475 | 527,088 | ||||||
Zogenix Inc.(a) | 1,008 | 23,980 | ||||||
|
| |||||||
| 10,025,463 | ||||||||
| Telecommunications — 0.0% | ||||||||
InterDigital Inc. | 126 | 7,562 | ||||||
|
| |||||||
Total Common Stocks — 99.3% |
| 20,874,818 | ||||||
|
| |||||||
Rights |
| |||||||
| Pharmaceuticals — 0.1% | ||||||||
Bristol-Myers Squibb Co. (Expires 3/31/2021)(a)(c) | 2,353 | 8,471 | ||||||
|
| |||||||
Total Rights — 0.1% |
| 8,471 | ||||||
|
| |||||||
Short-Term Investments |
| |||||||
| Money Market Funds — 2.5% | ||||||||
BlackRock Cash Funds: Institutional, | ||||||||
0.40%(d)(e)(f) | 431,550 | 432,025 | ||||||
BlackRock Cash Funds: Treasury, | ||||||||
0.12%(d)(e) | 102,000 | 102,000 | ||||||
|
| |||||||
| 534,025 | ||||||||
|
| |||||||
Total Short-Term Investments — 2.5% |
| 534,025 | ||||||
|
| |||||||
Total Investments in Securities — 101.9% |
| 21,417,314 | ||||||
Other Assets, Less Liabilities — (1.9)% |
| (396,308 | ) | |||||
|
| |||||||
Net Assets — 100.0% |
| $ | 21,021,006 | |||||
|
| |||||||
| (a) | Non-income producing security. |
| (b) | Security is valued using significant unobservable inputs and is classified as Level 3 in the fair value hierarchy. |
| (c) | All or a portion of this security is on loan. |
| (d) | Affiliate of the Fund. |
| (e) | Annualized 7-day yield as of period-end. |
| (f) | All or a portion of this security was purchased with cash collateral received from loaned securities. |
| 36 | 2020ISHARES ANNUAL REPORTTO SHAREHOLDERS |
Schedule of Investments (continued) July 31, 2020 | iShares® Evolved U.S. Innovative Healthcare ETF |
Affiliates
Investments in issuers considered to be affiliate(s) of the Fund during the year ended July 31, 2020, for purposes of Section 2(a)(3) of the Investment Company Act of 1940, as amended, were as follows:
| Affiliated Issuer | Value at 07/31/19 | Purchases at Cost | Proceeds from Sales | Net Realized Gain (Loss) | Change in Unrealized Appreciation (Depreciation) | Value at 07/31/20 | Shares Held at 07/31/20 | Income | Capital Gain Distributions from Underlying Funds | |||||||||||||||||||||||||||
BlackRock Cash Funds: Institutional, | $ | 187,261 | $ | 244,685 | (a) | $ | — | $ | (27 | ) | $ | 106 | $ | 432,025 | 431,550 | $ | 3,585 | (b) | $ | — | ||||||||||||||||
BlackRock Cash Funds: Treasury, | 73,000 | 29,000 | (a) | — | — | — | 102,000 | 102,000 | 1,004 | — | ||||||||||||||||||||||||||
|
|
|
|
|
|
|
|
|
| |||||||||||||||||||||||||||
| $ | (27 | ) | $ | 106 | $ | 534,025 | $ | 4,589 | $ | — | ||||||||||||||||||||||||||
|
|
|
|
|
|
|
|
|
| |||||||||||||||||||||||||||
| (a) | Represents net amount purchased (sold). |
| (b) | All or a portion represents securities lending income earned from the reinvestment of cash collateral from loaned securities, net of fees and collateral investment expenses, and other payments to and from borrowers of securities. |
Fair Value Measurements
Various inputs are used in determining the fair value of financial instruments. For description of the input levels and information about the Fund’s policy regarding valuation of financial instruments, refer to the Notes to Financial Statements.
The following table summarizes the value of the Fund’s investments according to the fair value hierarchy as of July 31, 2020. The breakdown of the Fund’s investments into major categories is disclosed in the Schedule of Investments above.
| Level 1 | Level 2 | Level 3 | Total | |||||||||||||
Investments | ||||||||||||||||
Assets | ||||||||||||||||
Common Stocks | $ | 20,874,256 | $ | — | $ | 562 | $ | 20,874,818 | ||||||||
Rights | 8,471 | — | — | 8,471 | ||||||||||||
Money Market Funds | 534,025 | — | — | 534,025 | ||||||||||||
|
|
|
|
|
|
|
| |||||||||
| $ | 21,416,752 | $ | — | $ | 562 | $ | 21,417,314 | |||||||||
|
|
|
|
|
|
|
| |||||||||
See notes to financial statements.
SCHEDULE OF INVESTMENTS | 37 |
Schedule of Investments July 31, 2020 | iShares® Evolved U.S. Media and Entertainment ETF (Percentages shown are based on Net Assets) |
| Security | Shares | Value | ||||||
Common Stocks |
| |||||||
| Advertising — 0.1% | ||||||||
Clear Channel Outdoor Holdings Inc.(a) | 3,072 | $ | 2,815 | |||||
National CineMedia Inc. | 1,687 | 4,167 | ||||||
|
| |||||||
| 6,982 | ||||||||
| Commercial Services — 1.2% | ||||||||
Graham Holdings Co., Class B | 84 | 33,463 | ||||||
Nielsen Holdings PLC | 5,333 | 76,955 | ||||||
Viad Corp. | 112 | 1,620 | ||||||
|
| |||||||
| 112,038 | ||||||||
| Entertainment — 3.8% | ||||||||
AMC Entertainment Holdings Inc., Class A(b) | 770 | 3,111 | ||||||
Caesars Entertainment Inc.(a) | 370 | 11,488 | ||||||
Churchill Downs Inc. | 301 | 41,695 | ||||||
Cinemark Holdings Inc. | 2,177 | 25,754 | ||||||
IMAX Corp.(a) | 1,344 | 15,174 | ||||||
Lions Gate Entertainment Corp., Class A(a) | 2,821 | 21,609 | ||||||
Lions Gate Entertainment Corp., Class B, NVS(a) | 5,317 | 37,804 | ||||||
Live Nation Entertainment Inc.(a) | 1,898 | 88,845 | ||||||
Madison Square Garden Sports Corp.(a) | 336 | 51,640 | ||||||
Penn National Gaming Inc.(a) | 224 | 7,582 | ||||||
Reading International Inc., Class A, NVS(a)(b) | 315 | 1,373 | ||||||
Scientific Games Corp./DE, Class A(a) | 567 | 9,962 | ||||||
SeaWorld Entertainment Inc.(a) | 833 | 12,054 | ||||||
Six Flags Entertainment Corp. | 1,309 | 22,763 | ||||||
|
| |||||||
| 350,854 | ||||||||
| Home Furnishings — 0.7% | ||||||||
Dolby Laboratories Inc., Class A | 987 | 68,695 | ||||||
|
| |||||||
| Internet — 16.4% | ||||||||
Alphabet Inc., Class A(a) | 57 | 84,813 | ||||||
Alphabet Inc., Class C, NVS(a) | 58 | 86,012 | ||||||
IAC/InterActiveCorp.(a) | 993 | 131,493 | ||||||
Match Group Inc(a)(b) | 2,143 | 220,086 | ||||||
Netflix Inc.(a) | 837 | 409,193 | ||||||
Roku Inc.(a) | 2,062 | 319,383 | ||||||
Twitter Inc.(a) | 7,281 | 265,028 | ||||||
|
| |||||||
| 1,516,008 | ||||||||
| Leisure Time — 0.1% | ||||||||
Carnival Corp. | 330 | 4,580 | ||||||
Liberty TripAdvisor Holdings Inc., Class A(a) | 610 | 1,513 | ||||||
|
| |||||||
| 6,093 | ||||||||
| Lodging — 0.2% | ||||||||
Las Vegas Sands Corp. | 343 | 14,969 | ||||||
Marcus Corp. (The) | 210 | 2,900 | ||||||
|
| |||||||
| 17,869 | ||||||||
| Media — 57.1% | ||||||||
Altice USA Inc., Class A(a) | 7,401 | 199,753 | ||||||
AMC Networks Inc., Class A(a) | 1,512 | 34,928 | ||||||
Cable One Inc.(b) | 114 | 207,772 | ||||||
Central European Media Enterprises Ltd., Class A(a) | 2,767 | 11,013 | ||||||
Charter Communications Inc., Class A(a)(b) | 796 | 461,680 | ||||||
Comcast Corp., Class A | 11,178 | 478,418 | ||||||
Discovery Inc., Class A(a) | 5,669 | 119,616 | ||||||
Discovery Inc., Class C, NVS(a) | 12,597 | 238,713 | ||||||
DISH Network Corp., Class A(a) | 6,264 | 201,137 | ||||||
Entercom Communications Corp., Class A | 4,634 | 6,488 | ||||||
Entravision Communications Corp., Class A | 1,062 | 1,402 | ||||||
EW Scripps Co. (The), Class A, NVS | 2,886 | 32,843 | ||||||
| Security | Shares | Value | ||||||
| Media (continued) | ||||||||
Fox Corp., Class A, NVS | 11,887 | $ | 306,328 | |||||
Fox Corp., Class B(a) | 7,812 | 201,315 | ||||||
Gannett Co. Inc. | 1,518 | 2,247 | ||||||
Gray Television Inc.(a) | 4,016 | 57,589 | ||||||
Hemisphere Media Group Inc.(a) | 721 | 6,345 | ||||||
Iheartmedia Inc., Class A(a) | 813 | 6,797 | ||||||
John Wiley & Sons Inc., Class A | 356 | 12,043 | ||||||
Liberty Broadband Corp., Class A(a) | 536 | 72,365 | ||||||
Liberty Broadband Corp., Class C, NVS(a) | 2,799 | 384,219 | ||||||
Liberty Global PLC, Class A(a) | 2,177 | 50,953 | ||||||
Liberty Global PLC, Class C, NVS(a) | 6,608 | 150,398 | ||||||
Liberty Latin America Ltd., Class A(a) | 271 | 2,786 | ||||||
Liberty Latin America Ltd., Class C, NVS(a) | 1,279 | 13,084 | ||||||
Liberty Media Corp.-Liberty SiriusXM, Class A(a) | 504 | 17,534 | ||||||
Liberty Media Corp.-Liberty SiriusXM, Class C, NVS(a) | 578 | 20,224 | ||||||
Madison Square Garden Entertainment Corp.(a) | 100 | 7,086 | ||||||
Meredith Corp. | 1,330 | 19,099 | ||||||
MSG Networks Inc., Class A(a) | 1,841 | 17,545 | ||||||
New York Times Co. (The), Class A | 3,696 | 170,533 | ||||||
News Corp., Class A, NVS | 9,687 | 123,219 | ||||||
News Corp., Class B | 3,024 | 38,586 | ||||||
Nexstar Media Group Inc., Class A | 2,132 | 186,870 | ||||||
Saga Communications Inc., Class A | 189 | 4,419 | ||||||
Scholastic Corp., NVS | 378 | 9,045 | ||||||
Sinclair Broadcast Group Inc., Class A | 2,540 | 52,324 | ||||||
Sirius XM Holdings Inc. | 26,405 | 155,261 | ||||||
TEGNA Inc. | 10,295 | 121,275 | ||||||
ViacomCBS Inc., Class A | 230 | 6,380 | ||||||
ViacomCBS Inc., Class B, NVS | 20,011 | 521,686 | ||||||
Walt Disney Co. (The) | 3,765 | 440,279 | ||||||
World Wrestling Entertainment Inc., Class A | 1,906 | 88,839 | ||||||
|
| |||||||
| 5,260,436 | ||||||||
| Real Estate Investment Trusts — 0.8% | ||||||||
Lamar Advertising Co., Class A | 805 | 52,913 | ||||||
Ryman Hospitality Properties Inc. | 562 | 17,995 | ||||||
|
| |||||||
| 70,908 | ||||||||
| Retail — 1.1% | ||||||||
Qurate Retail Inc. Series A(a) | 9,461 | 103,220 | ||||||
|
| |||||||
| Software — 13.6% | ||||||||
Activision Blizzard Inc. | 5,054 | 417,612 | ||||||
Daily Journal Corp.(a) | 14 | 3,976 | ||||||
Electronic Arts Inc.(a)(b) | 3,108 | 440,155 | ||||||
Glu Mobile Inc.(a) | 1,407 | 13,282 | ||||||
Take-Two Interactive Software Inc.(a) | 1,667 | 273,421 | ||||||
Xperi Holding Corp. | 1,041 | 19,196 | ||||||
Zynga Inc., Class A(a) | 8,731 | 85,826 | ||||||
|
| |||||||
| 1,253,468 | ||||||||
| Telecommunications — 1.3% | ||||||||
AT&T Inc. | 1,378 | 40,761 | ||||||
GCI Liberty Inc., Class A(a) | 630 | 49,386 | ||||||
Harmonic Inc.(a) | 812 | 4,531 | ||||||
Shenandoah Telecommunications Co. | 527 | 26,492 | ||||||
|
| |||||||
| 121,170 | ||||||||
| Toys, Games & Hobbies — 2.7% | ||||||||
Hasbro Inc. | 2,868 | 208,676 | ||||||
| 38 | 2020ISHARES ANNUAL REPORTTO SHAREHOLDERS |
Schedule of Investments (continued) July 31, 2020 | iShares® Evolved U.S. Media and Entertainment ETF (Percentages shown are based on Net Assets) |
| Security | Shares | Value | ||||||
| Toys, Games & Hobbies (continued) | ||||||||
Mattel Inc.(a) | 3,200 | $ | 35,552 | |||||
|
| |||||||
| 244,228 | ||||||||
|
| |||||||
Total Common Stocks — 99.1% |
| 9,131,969 | ||||||
|
| |||||||
Short-Term Investments | ||||||||
| Money Market Funds — 6.3% | ||||||||
BlackRock Cash Funds: Institutional, | ||||||||
0.40%(c)(d)(e) | 507,245 | 507,804 | ||||||
BlackRock Cash Funds: Treasury, | ||||||||
0.12%(c)(d) | 78,000 | 78,000 | ||||||
|
| |||||||
| 585,804 | ||||||||
|
| |||||||
Total Short-Term Investments — 6.3% |
| 585,804 | ||||||
|
| |||||||
Total Investments in Securities — 105.4% |
| 9,717,773 | ||||||
Other Assets, Less Liabilities — (5.4)% |
| (499,282 | ) | |||||
|
| |||||||
Net Assets — 100.0% |
| $ | 9,218,491 | |||||
|
| |||||||
| (a) | Non-income producing security. |
| (b) | All or a portion of this security is on loan. |
| (c) | Affiliate of the Fund. |
| (d) | Annualized 7-day yield as of period-end. |
| (e) | All or a portion of this security was purchased with cash collateral received from loaned securities. |
Affiliates
Investments in issuers considered to be affiliate(s) of the Fund during the year ended July 31, 2020, for purposes of Section 2(a)(3) of the Investment Company Act of 1940, as amended, were as follows:
| Affiliated Issuer | Value at 07/31/19 | Purchases at Cost | Proceeds from Sales | Net Realized Gain (Loss) | Change in Unrealized Appreciation (Depreciation) | Value at 07/31/20 | Shares Held at 07/31/20 | Income | Capital Gain Distributions from Underlying Funds | |||||||||||||||||||||||||||
BlackRock Cash Funds: Institutional, | $ | 87,140 | $ | 420,614 | (a) | $ | — | $ | 94 | $ | (44 | ) | $ | 507,804 | 507,245 | $ | 2,229 | (b) | $ | — | ||||||||||||||||
BlackRock Cash Funds: Treasury, | 51,000 | 27,000 | (a) | — | — | — | 78,000 | 78,000 | 703 | — | ||||||||||||||||||||||||||
|
|
|
|
|
|
|
|
|
| |||||||||||||||||||||||||||
| $ | 94 | $ | (44 | ) | $ | 585,804 | $ | 2,932 | $ | — | ||||||||||||||||||||||||||
|
|
|
|
|
|
|
|
|
| |||||||||||||||||||||||||||
| (a) | Represents net amount purchased (sold). |
| (b) | All or a portion represents securities lending income earned from the reinvestment of cash collateral from loaned securities, net of fees and collateral investment expenses, and other payments to and from borrowers of securities. |
Fair Value Measurements
Various inputs are used in determining the fair value of financial instruments. For description of the input levels and information about the Fund’s policy regarding valuation of financial instruments, refer to the Notes to Financial Statements.
The following table summarizes the value of the Fund’s investments according to the fair value hierarchy as of July 31, 2020. The breakdown of the Fund’s investments into major categories is disclosed in the Schedule of Investments above.
| Level 1 | Level 2 | Level 3 | Total | |||||||||||||
Investments | ||||||||||||||||
Assets | ||||||||||||||||
Common Stocks | $ | 9,131,969 | $ | — | $ | — | $ | 9,131,969 | ||||||||
Money Market Funds | 585,804 | — | — | 585,804 | ||||||||||||
|
|
|
|
|
|
|
| |||||||||
| $ | 9,717,773 | $ | — | $ | — | $ | 9,717,773 | |||||||||
|
|
|
|
|
|
|
| |||||||||
See notes to financial statements.
SCHEDULE OF INVESTMENTS | 39 |
Schedule of Investments July 31, 2020 | iShares® Evolved U.S. Technology ETF (Percentages shown are based on Net Assets) |
| Security | Shares | Value | ||||||
Common Stocks |
| |||||||
| Advertising — 0.3% | ||||||||
Interpublic Group of Companies Inc. (The) | 2,296 | $ | 41,443 | |||||
Omnicom Group Inc. | 1,131 | 60,768 | ||||||
Trade Desk Inc. (The), Class A(a) | 315 | 142,166 | ||||||
|
| |||||||
| 244,377 | ||||||||
| Aerospace & Defense — 0.0% | ||||||||
L3Harris Technologies Inc. | 229 | 38,548 | ||||||
|
| |||||||
| Banks — 0.2% | ||||||||
JPMorgan Chase & Co. | 1,415 | 136,746 | ||||||
|
| |||||||
| Biotechnology — 0.0% | ||||||||
Incyte Corp.(a) | 401 | 39,603 | ||||||
|
| |||||||
| Commercial Services — 4.7% | ||||||||
2U Inc.(a)(b) | 273 | 12,857 | ||||||
Automatic Data Processing Inc. | 2,454 | 326,161 | ||||||
Avalara Inc.(a) | 508 | 68,301 | ||||||
Booz Allen Hamilton Holding Corp. | 511 | 41,779 | ||||||
Chegg Inc.(a) | 1,050 | 85,019 | ||||||
CoreLogic Inc. | 351 | 23,924 | ||||||
CoStar Group Inc.(a) | 156 | 132,563 | ||||||
Equifax Inc. | 546 | 88,758 | ||||||
FleetCor Technologies Inc.(a) | 390 | 100,842 | ||||||
Gartner Inc.(a) | 624 | 77,775 | ||||||
Global Payments Inc. | 1,284 | 228,578 | ||||||
IHS Markit Ltd. | 1,756 | 141,762 | ||||||
Korn Ferry | 312 | 8,767 | ||||||
LiveRamp Holdings Inc.(a) | 52 | 2,370 | ||||||
MarketAxess Holdings Inc. | 117 | 60,454 | ||||||
Moody’s Corp. | 507 | 142,619 | ||||||
Nielsen Holdings PLC | 1,324 | 19,105 | ||||||
Paylocity Holding Corp.(a) | 385 | 51,282 | ||||||
PayPal Holdings Inc.(a) | 6,635 | 1,300,924 | ||||||
Robert Half International Inc. | 429 | 21,823 | ||||||
S&P Global Inc. | 936 | 327,834 | ||||||
Sabre Corp. | 1,209 | 9,140 | ||||||
Square Inc., Class A(a) | 2,105 | 273,334 | ||||||
TransUnion | 936 | 83,838 | ||||||
Verisk Analytics Inc. | 585 | 110,395 | ||||||
WEX Inc.(a) | 156 | 24,706 | ||||||
|
| |||||||
| 3,764,910 | ||||||||
| Computers — 16.5% | ||||||||
Accenture PLC, Class A | 3,979 | 894,400 | ||||||
Apple Inc. | 22,743 | 9,666,685 | ||||||
CACI International Inc., Class A(a) | 117 | 24,315 | ||||||
Cognizant Technology Solutions Corp., Class A | 3,747 | 255,995 | ||||||
Crowdstrike Holdings Inc., Class A(a) | 1,989 | 225,155 | ||||||
Dell Technologies Inc., Class C(a) | 1,560 | 93,335 | ||||||
DXC Technology Co. | 2,184 | 39,115 | ||||||
EPAM Systems Inc.(a) | 312 | 90,505 | ||||||
Fortinet Inc.(a) | 1,248 | 172,598 | ||||||
Genpact Ltd. | 897 | 35,719 | ||||||
Hewlett Packard Enterprise Co. | 9,830 | 97,022 | ||||||
HP Inc. | 6,429 | 113,022 | ||||||
International Business Machines Corp. | 7,287 | 895,864 | ||||||
Lumentum Holdings Inc.(a) | 234 | 21,722 | ||||||
NCR Corp.(a) | 624 | 11,500 | ||||||
NetApp Inc. | 2,108 | 93,384 | ||||||
Pure Storage Inc., Class A(a) | 858 | 15,324 | ||||||
| Security | Shares | Value | ||||||
| Computers (continued) | ||||||||
Qualys Inc.(a) | 312 | $ | 38,526 | |||||
Rapid7 Inc.(a) | 511 | 30,440 | ||||||
Seagate Technology PLC | 1,404 | 63,489 | ||||||
Western Digital Corp. | 1,872 | 80,683 | ||||||
Zscaler Inc.(a) | 742 | 96,349 | ||||||
|
| |||||||
| 13,055,147 | ||||||||
| Distribution & Wholesale — 0.1% | ||||||||
Copart Inc.(a) | 468 | 43,641 | ||||||
KAR Auction Services Inc. | 351 | 5,311 | ||||||
|
| |||||||
| 48,952 | ||||||||
| Diversified Financial Services — 5.1% | ||||||||
Cboe Global Markets Inc. | 390 | 34,203 | ||||||
CME Group Inc. | 1,326 | 220,355 | ||||||
Discover Financial Services | 312 | 15,422 | ||||||
Interactive Brokers Group Inc., Class A | 234 | 11,606 | ||||||
Intercontinental Exchange Inc. | 2,262 | 218,916 | ||||||
Invesco Ltd. | 860 | 8,634 | ||||||
Mastercard Inc., Class A | 4,871 | 1,502,850 | ||||||
Nasdaq Inc. | 429 | 56,332 | ||||||
SEI Investments Co. | 468 | 24,491 | ||||||
Visa Inc., Class A | 9,980 | 1,900,192 | ||||||
Western Union Co. (The) | 1,521 | 36,930 | ||||||
|
| |||||||
| 4,029,931 | ||||||||
| Electronics — 0.4% | ||||||||
Agilent Technologies Inc. | 622 | 59,917 | ||||||
Allegion PLC | 239 | 23,771 | ||||||
Coherent Inc.(a) | 78 | 10,829 | ||||||
Garmin Ltd. | 352 | 34,704 | ||||||
Keysight Technologies Inc.(a) | 819 | 81,810 | ||||||
National Instruments Corp. | 741 | 26,306 | ||||||
Roper Technologies Inc. | 116 | 50,164 | ||||||
SYNNEX Corp. | 156 | 19,459 | ||||||
Trimble Inc.(a) | 1,014 | 45,133 | ||||||
|
| |||||||
| 352,093 | ||||||||
| Energy – Alternate Sources — 0.1% | ||||||||
Enphase Energy Inc.(a) | 788 | 47,564 | ||||||
|
| |||||||
| Health Care – Products — 0.1% | ||||||||
Align Technology Inc.(a) | 244 | 71,692 | ||||||
|
| |||||||
| Health Care – Services — 0.2% | ||||||||
IQVIA Holdings Inc.(a) | 429 | 67,950 | ||||||
Teladoc Health Inc.(a) | 356 | 84,596 | ||||||
|
| |||||||
| 152,546 | ||||||||
| Insurance — 0.4% | ||||||||
Aon PLC, Class A | 595 | 122,106 | ||||||
Marsh & McLennan Companies Inc. | 1,053 | 122,780 | ||||||
Willis Towers Watson PLC | 346 | 72,663 | ||||||
|
| |||||||
| 317,549 | ||||||||
| Internet — 26.2% | ||||||||
Alphabet Inc., Class A(a) | 2,151 | 3,200,580 | ||||||
Alphabet Inc., Class C, NVS(a) | 2,071 | 3,071,210 | ||||||
Amazon.com Inc.(a) | 2,145 | 6,788,239 | ||||||
Anaplan Inc.(a) | 1,048 | 47,590 | ||||||
Booking Holdings Inc.(a) | 160 | 265,941 | ||||||
CDW Corp./DE | 858 | 99,743 | ||||||
eBay Inc. | 4,677 | 258,545 | ||||||
Etsy Inc.(a) | 389 | 46,050 | ||||||
Expedia Group Inc. | 507 | 41,072 | ||||||
| 40 | 2020ISHARES ANNUAL REPORTTO SHAREHOLDERS |
Schedule of Investments (continued) July 31, 2020 | iShares® Evolved U.S. Technology ETF (Percentages shown are based on Net Assets) |
| Security | Shares | Value | ||||||
| Internet (continued) | ||||||||
F5 Networks Inc.(a) | 507 | $ | 68,901 | |||||
Facebook Inc., Class A(a) | 17,002 | 4,312,897 | ||||||
FireEye Inc.(a) | 1,209 | 18,256 | ||||||
GoDaddy Inc., Class A(a) | 897 | 63,041 | ||||||
Grubhub Inc.(a) | 351 | 25,356 | ||||||
IAC/InterActiveCorp.(a) | 351 | 46,479 | ||||||
Match Group Inc(a) | 1,198 | 123,035 | ||||||
MercadoLibre Inc.(a) | 234 | 263,161 | ||||||
Netflix Inc.(a) | 1,136 | 555,368 | ||||||
NortonLifeLock Inc. | 3,859 | 82,776 | ||||||
Okta Inc.(a) | 1,091 | 241,089 | ||||||
Palo Alto Networks Inc.(a) | 780 | 199,618 | ||||||
Pinterest Inc., Class A(a) | 822 | 28,186 | ||||||
Proofpoint Inc.(a) | 429 | 49,622 | ||||||
Q2 Holdings Inc.(a) | 388 | 36,491 | ||||||
Roku Inc.(a) | 586 | 90,766 | ||||||
Snap Inc., Class A, NVS(a)(b) | 6,634 | 148,734 | ||||||
TD Ameritrade Holding Corp. | 819 | 29,394 | ||||||
Twitter Inc.(a) | 4,486 | 163,290 | ||||||
Uber Technologies Inc.(a) | 6,656 | 201,411 | ||||||
VeriSign Inc.(a) | 698 | 147,753 | ||||||
Zendesk Inc.(a) | 663 | 60,432 | ||||||
Zillow Group Inc., Class C, NVS(a) | 546 | 37,341 | ||||||
|
| |||||||
| 20,812,367 | ||||||||
| Leisure Time — 0.1% | ||||||||
Peloton Interactive Inc., Class A(a) | 1,219 | 83,160 | ||||||
|
| |||||||
| Machinery — 0.1% | ||||||||
Cognex Corp. | 780 | 52,158 | ||||||
Rockwell Automation Inc. | 156 | 34,030 | ||||||
|
| |||||||
| 86,188 | ||||||||
| Media — 0.1% | ||||||||
FactSet Research Systems Inc. | 195 | 67,528 | ||||||
|
| |||||||
| Office & Business Equipment — 0.1% | ||||||||
Zebra Technologies Corp., Class A(a) | 312 | 87,594 | ||||||
|
| |||||||
| Pharmaceuticals — 0.1% | ||||||||
Zoetis Inc. | 311 | 47,172 | ||||||
|
| |||||||
| Private Equity — 0.1% | ||||||||
Blackstone Group Inc. (The), Class A | 1,326 | 70,649 | ||||||
|
| |||||||
| Real Estate — 0.1% | ||||||||
CBRE Group Inc., Class A(a) | 814 | 35,661 | ||||||
Jones Lang LaSalle Inc. | 156 | 15,430 | ||||||
|
| |||||||
| 51,091 | ||||||||
| Real Estate Investment Trusts — 0.3% | ||||||||
Digital Realty Trust Inc. | 738 | 118,478 | ||||||
Equinix Inc. | 160 | 125,677 | ||||||
Iron Mountain Inc. | 1,053 | 29,684 | ||||||
|
| |||||||
| 273,839 | ||||||||
| Retail — 0.1% | ||||||||
Best Buy Co. Inc. | 546 | 54,376 | ||||||
|
| |||||||
| Semiconductors — 9.1% | ||||||||
Advanced Micro Devices Inc.(a) | 7,451 | 576,931 | ||||||
Analog Devices Inc. | 1,443 | 165,729 | ||||||
Applied Materials Inc. | 3,363 | 216,342 | ||||||
Broadcom Inc. | 1,984 | 628,432 | ||||||
Inphi Corp.(a) | 385 | 50,304 | ||||||
| Security | Shares | Value | ||||||
| Semiconductors (continued) | ||||||||
Intel Corp. | 17,797 | $ | 849,451 | |||||
KLA Corp. | 663 | 132,487 | ||||||
Lam Research Corp. | 554 | 208,947 | ||||||
Marvell Technology Group Ltd. | 4,761 | 173,634 | ||||||
Maxim Integrated Products Inc. | 1,599 | 108,876 | ||||||
Microchip Technology Inc. | 1,248 | 126,959 | ||||||
Micron Technology Inc.(a) | 5,975 | 299,079 | ||||||
Monolithic Power Systems Inc. | 234 | 62,012 | ||||||
NVIDIA Corp. | 4,800 | 2,038,032 | ||||||
ON Semiconductor Corp.(a) | 2,105 | 43,363 | ||||||
Qorvo Inc.(a) | 588 | 75,352 | ||||||
Qualcomm Inc. | 5,413 | 571,667 | ||||||
Silicon Laboratories Inc.(a) | 273 | 27,439 | ||||||
Skyworks Solutions Inc. | 863 | 125,635 | ||||||
Teradyne Inc. | 892 | 79,352 | ||||||
Texas Instruments Inc. | 3,985 | 508,287 | ||||||
Xilinx Inc. | 1,638 | 175,839 | ||||||
|
| |||||||
| 7,244,149 | ||||||||
| Software — 32.4% | ||||||||
ACI Worldwide Inc.(a) | 780 | 20,896 | ||||||
Activision Blizzard Inc. | 2,769 | 228,802 | ||||||
Adobe Inc.(a) | 3,747 | 1,664,867 | ||||||
Akamai Technologies Inc.(a) | 1,170 | 131,555 | ||||||
Alteryx Inc., Class A(a) | 586 | 102,837 | ||||||
ANSYS Inc.(a) | 546 | 169,588 | ||||||
Aspen Technology Inc.(a) | 390 | 37,931 | ||||||
Autodesk Inc.(a) | 1,635 | 386,563 | ||||||
Black Knight Inc.(a) | 546 | 40,906 | ||||||
Blackbaud Inc. | 351 | 21,952 | ||||||
Blackline Inc.(a) | 624 | 55,480 | ||||||
Box Inc., Class A(a) | 1,053 | 18,901 | ||||||
Broadridge Financial Solutions Inc. | 546 | 73,350 | ||||||
Cadence Design Systems Inc.(a) | 1,911 | 208,777 | ||||||
CDK Global Inc. | 741 | 33,686 | ||||||
Ceridian HCM Holding Inc.(a) | 1,091 | 85,414 | ||||||
Cerner Corp. | 1,131 | 78,548 | ||||||
Citrix Systems Inc. | 1,092 | 155,894 | ||||||
Cloudera Inc.(a) | 897 | 10,109 | ||||||
CommVault Systems Inc.(a) | 351 | 15,472 | ||||||
Cornerstone OnDemand Inc.(a) | 468 | 16,619 | ||||||
Coupa Software Inc.(a) | 624 | 191,225 | ||||||
Datadog Inc., Class A(a) | 1,957 | 183,684 | ||||||
DocuSign Inc.(a) | 1,523 | 330,232 | ||||||
Dropbox Inc., Class A(a) | 2,337 | 53,167 | ||||||
Dynatrace Inc.(a) | 1,763 | 73,746 | ||||||
Elastic NV(a) | 507 | 48,768 | ||||||
Electronic Arts Inc.(a) | 1,443 | 204,358 | ||||||
Everbridge Inc.(a) | 352 | 50,266 | ||||||
Fair Isaac Corp.(a) | 195 | 85,642 | ||||||
Fidelity National Information Services Inc. | 2,849 | 416,837 | ||||||
Fiserv Inc.(a) | 3,381 | 337,390 | ||||||
Five9 Inc.(a) | 583 | 70,438 | ||||||
Guidewire Software Inc.(a) | 507 | 59,654 | ||||||
HubSpot Inc.(a) | 273 | 64,049 | ||||||
Intuit Inc. | 1,560 | 477,937 | ||||||
j2 Global Inc.(a) | 273 | 15,485 | ||||||
Jack Henry & Associates Inc. | 468 | 83,444 | ||||||
Manhattan Associates Inc.(a) | 507 | 48,566 | ||||||
Microsoft Corp. | 63,684 | 13,055,857 | ||||||
MongoDB Inc.(a)(b) | 388 | 88,883 | ||||||
SCHEDULE OF INVESTMENTS | 41 |
Schedule of Investments (continued) July 31, 2020 | iShares® Evolved U.S. Technology ETF (Percentages shown are based on Net Assets) |
| Security | Shares | Value | ||||||
| Software (continued) | ||||||||
MSCI Inc. | 468 | $ | 175,959 | |||||
New Relic Inc.(a) | 351 | 24,889 | ||||||
Nuance Communications Inc.(a) | 594 | 16,246 | ||||||
Nutanix Inc., Class A(a) | 1,753 | 38,899 | ||||||
Oracle Corp. | 19,000 | 1,053,550 | ||||||
Paychex Inc. | 1,792 | 128,881 | ||||||
Paycom Software Inc.(a) | 351 | 99,814 | ||||||
Pegasystems Inc. | 312 | 36,470 | ||||||
PTC Inc.(a) | 936 | 80,084 | ||||||
RealPage Inc.(a) | 351 | 22,116 | ||||||
RingCentral Inc., Class A(a) | 429 | 124,526 | ||||||
salesforce.com Inc.(a) | 7,748 | 1,509,698 | ||||||
ServiceNow Inc.(a) | 1,642 | 721,166 | ||||||
Slack Technologies Inc., Class A(a)(b) | 4,991 | 147,484 | ||||||
Smartsheet Inc., Class A(a) | 1,174 | 56,047 | ||||||
Splunk Inc.(a) | 1,448 | 303,819 | ||||||
SS&C Technologies Holdings Inc. | 1,014 | 58,305 | ||||||
Synopsys Inc.(a) | 1,092 | 217,548 | ||||||
Take-Two Interactive Software Inc.(a) | 469 | 76,925 | ||||||
Twilio Inc., Class A(a) | 1,089 | 302,110 | ||||||
Tyler Technologies Inc.(a) | 234 | 83,596 | ||||||
Veeva Systems Inc., Class A(a) | 1,042 | 275,682 | ||||||
Verint Systems Inc.(a) | 468 | 21,009 | ||||||
VMware Inc., Class A(a) | 624 | 87,491 | ||||||
Workday Inc., Class A(a) | 1,484 | 268,485 | ||||||
Zoom Video Communications Inc., Class A(a) | 869 | 220,648 | ||||||
Zynga Inc., Class A(a) | 4,251 | 41,787 | ||||||
|
| |||||||
| 25,691,009 | ||||||||
| Telecommunications — 2.4% | ||||||||
Arista Networks Inc.(a) | 468 | 121,572 | ||||||
Ciena Corp.(a) | 936 | 55,701 | ||||||
Cisco Systems Inc. | 32,455 | 1,528,631 | ||||||
CommScope Holding Co. Inc.(a) | 624 | 5,791 | ||||||
Juniper Networks Inc. | 2,769 | 70,277 | ||||||
| Security | Shares | Value | ||||||
| Telecommunications (continued) | ||||||||
LogMeIn Inc. | 390 | $ | 33,466 | |||||
Motorola Solutions Inc. | 624 | 87,235 | ||||||
|
| |||||||
| 1,902,673 | ||||||||
| Transportation — 0.1% | ||||||||
Expeditors International of Washington Inc. | 507 | 42,847 | ||||||
FedEx Corp. | 355 | 59,782 | ||||||
|
| |||||||
| 102,629 | ||||||||
|
| |||||||
Total Common Stocks — 99.4% |
| 78,874,082 | ||||||
|
| |||||||
Short-Term Investments |
| |||||||
| Money Market Funds — 0.7% | ||||||||
BlackRock Cash Funds: Institutional, | ||||||||
0.40%(c)(d)(e) | 77,963 | 78,048 | ||||||
BlackRock Cash Funds: Treasury, | ||||||||
0.12%(c)(d) | 480,000 | 480,000 | ||||||
|
| |||||||
| 558,048 | ||||||||
|
| |||||||
Total Short-Term Investments — 0.7% | 558,048 | |||||||
|
| |||||||
Total Investments in Securities — 100.1% | 79,432,130 | |||||||
Other Assets, Less Liabilities — (0.1)% | (76,711 | ) | ||||||
|
| |||||||
Net Assets — 100.0% | $ | 79,355,419 | ||||||
|
| |||||||
| (a) | Non-income producing security. |
| (b) | All or a portion of this security is on loan. |
| (c) | Affiliate of the Fund. |
| (d) | Annualized 7-day yield as of period-end. |
| (e) | All or a portion of this security was purchased with cash collateral received from loaned securities. |
Affiliates
Investments in issuers considered to be affiliate(s) of the Fund during the year ended July 31, 2020, for purposes of Section 2(a)(3) of the Investment Company Act of 1940, as amended, were as follows:
| Affiliated Issuer | Value at 07/31/19 | Purchases at Cost | Proceeds from Sales | Net Realized Gain (Loss) | Change in Unrealized Appreciation (Depreciation) | Value at 07/31/20 | Shares Held at 07/31/20 | Income | Capital Gain Distributions from Underlying Funds | |||||||||||||||||||||||||||
BlackRock Cash Funds: Institutional, | $ | 149,637 | $ | — | $ | (71,496 | )(a) | $ | (218 | ) | $ | 125 | $ | 78,048 | 77,963 | $ | 2,638 | (b) | $ | — | ||||||||||||||||
BlackRock Cash Funds: Treasury, | 188,000 | 292,000 | (a) | — | — | — | 480,000 | 480,000 | 1,630 | — | ||||||||||||||||||||||||||
|
|
|
|
|
|
|
|
|
| |||||||||||||||||||||||||||
| $ | (218 | ) | $ | 125 | $ | 558,048 | $ | 4,268 | $ | — | ||||||||||||||||||||||||||
|
|
|
|
|
|
|
|
|
| |||||||||||||||||||||||||||
| (a) | Represents net amount purchased (sold). |
| (b) | All or a portion represents securities lending income earned from the reinvestment of cash collateral from loaned securities, net of fees and collateral investment expenses, and other payments to and from borrowers of securities. |
Fair Value Measurements
Various inputs are used in determining the fair value of financial instruments. For description of the input levels and information about the Fund’s policy regarding valuation of financial instruments, refer to the Notes to Financial Statements.
| 42 | 2020ISHARES ANNUAL REPORTTO SHAREHOLDERS |
Schedule of Investments (continued) July 31, 2020 | iShares® Evolved U.S. Technology ETF |
Fair Value Measurements (continued)
The following table summarizes the value of the Fund’s investments according to the fair value hierarchy as of July 31, 2020. The breakdown of the Fund’s investments into major categories is disclosed in the Schedule of Investments above.
| Level 1 | Level 2 | Level 3 | Total | |||||||||||||
Investments | ||||||||||||||||
Assets | ||||||||||||||||
Common Stocks | $ | 78,874,082 | $ | — | $ | — | $ | 78,874,082 | ||||||||
Money Market Funds | 558,048 | — | — | 558,048 | ||||||||||||
|
|
|
|
|
|
|
| |||||||||
| $ | 79,432,130 | $ | — | $ | — | $ | 79,432,130 | |||||||||
|
|
|
|
|
|
|
| |||||||||
See notes to financial statements.
SCHEDULE OF INVESTMENTS | 43 |
��
Statements of Assets and Liabilities
July 31, 2020
| iShares Evolved U.S. Consumer Staples ETF | iShares Evolved U.S. Discretionary Spending ETF | iShares Evolved U.S. Financials ETF | iShares Evolved U.S. Healthcare Staples ETF | |||||||||||||
ASSETS | ||||||||||||||||
Investments in securities, at value (including securities on loan)(a): | ||||||||||||||||
Unaffiliated(b) | $ | 9,783,351 | $ | 11,924,903 | $ | 4,077,980 | $ | 14,922,849 | ||||||||
Affiliated(c) | 228,457 | 49,972 | 38,503 | 294,052 | ||||||||||||
Cash | 114 | 6,680 | 2,308 | 7,545 | ||||||||||||
Receivables: | ||||||||||||||||
Securities lending income — Affiliated | 60 | 95 | 4 | 106 | ||||||||||||
Dividends | 11,187 | 5,282 | 5,230 | 12,041 | ||||||||||||
|
|
|
|
|
|
|
| |||||||||
Total assets | 10,023,169 | 11,986,932 | 4,124,025 | 15,236,593 | ||||||||||||
|
|
|
|
|
|
|
| |||||||||
LIABILITIES | ||||||||||||||||
Collateral on securities loaned, at value | 162,361 | 4,632 | 8,508 | 227,733 | ||||||||||||
Payables: | ||||||||||||||||
Investment advisory fees | 1,457 | 1,764 | 620 | 2,208 | ||||||||||||
|
|
|
|
|
|
|
| |||||||||
Total liabilities | 163,818 | 6,396 | 9,128 | 229,941 | ||||||||||||
|
|
|
|
|
|
|
| |||||||||
NET ASSETS | $ | 9,859,351 | $ | 11,980,536 | $ | 4,114,897 | $ | 15,006,652 | ||||||||
|
|
|
|
|
|
|
| |||||||||
NET ASSETS CONSIST OF: | ||||||||||||||||
Paid-in capital | $ | 9,064,293 | $ | 10,447,563 | $ | 4,938,160 | $ | 12,757,940 | ||||||||
Accumulated earnings (loss) | 795,058 | 1,532,973 | (823,263 | ) | 2,248,712 | |||||||||||
|
|
|
|
|
|
|
| |||||||||
NET ASSETS | $ | 9,859,351 | $ | 11,980,536 | $ | 4,114,897 | $ | 15,006,652 | ||||||||
|
|
|
|
|
|
|
| |||||||||
Shares outstanding | 350,000 | 350,000 | 200,000 | 450,000 | ||||||||||||
|
|
|
|
|
|
|
| |||||||||
Net asset value | $ | 28.17 | $ | 34.23 | $ | 20.57 | $ | 33.35 | ||||||||
|
|
|
|
|
|
|
| |||||||||
Shares authorized | Unlimited | Unlimited | Unlimited | Unlimited | ||||||||||||
|
|
|
|
|
|
|
| |||||||||
Par value | None | None | None | None | ||||||||||||
|
|
|
|
|
|
|
| |||||||||
(a) Securities loaned, at value | $ | 159,833 | $ | 4,382 | $ | 8,416 | $ | 222,347 | ||||||||
(b) Investments, at cost — Unaffiliated | $ | 8,963,850 | $ | 10,336,966 | $ | 4,879,934 | $ | 12,675,936 | ||||||||
(c) Investments, at cost — Affiliated | $ | 228,312 | $ | 49,963 | $ | 38,504 | $ | 294,045 | ||||||||
See notes to financial statements.
| 44 | 2020ISHARES ANNUAL REPORTTO SHAREHOLDERS |
Statements of Assets and Liabilities (continued)
July 31, 2020
| iShares Evolved U.S. Innovative Healthcare ETF | iShares Evolved U.S. Media and Entertainment ETF | iShares Evolved U.S. Technology ETF | ||||||||||
ASSETS | ||||||||||||
Investments in securities, at value (including securities on loan)(a): | ||||||||||||
Unaffiliated(b) | $ | 20,883,289 | $ | 9,131,969 | $ | 78,874,082 | ||||||
Affiliated(c) | 534,025 | 585,804 | 558,048 | |||||||||
Cash | 6,949 | 6,690 | 984 | |||||||||
Receivables: | ||||||||||||
Securities lending income — Affiliated | 851 | 307 | 156 | |||||||||
Dividends | 30,835 | 2,800 | 11,156 | |||||||||
|
|
|
|
|
| |||||||
Total assets | 21,455,949 | 9,727,570 | 79,444,426 | |||||||||
|
|
|
|
|
| |||||||
LIABILITIES | ||||||||||||
Collateral on securities loaned, at value | 431,884 | 507,715 | 78,125 | |||||||||
Payables: | ||||||||||||
Investment advisory fees | 3,059 | 1,364 | 10,882 | |||||||||
|
|
|
|
|
| |||||||
Total liabilities | 434,943 | 509,079 | 89,007 | |||||||||
|
|
|
|
|
| |||||||
NET ASSETS | $ | 21,021,006 | $ | 9,218,491 | $ | 79,355,419 | ||||||
|
|
|
|
|
| |||||||
NET ASSETS CONSIST OF: | ||||||||||||
Paid-in capital | $ | 19,317,037 | $ | 8,725,668 | $ | 64,832,783 | ||||||
Accumulated earnings | 1,703,969 | 492,823 | 14,522,636 | |||||||||
|
|
|
|
|
| |||||||
NET ASSETS | $ | 21,021,006 | $ | 9,218,491 | $ | 79,355,419 | ||||||
|
|
|
|
|
| |||||||
Shares outstanding | 700,000 | 350,000 | 1,950,000 | |||||||||
|
|
|
|
|
| |||||||
Net asset value | $ | 30.03 | $ | 26.34 | $ | 40.70 | ||||||
|
|
|
|
|
| |||||||
Shares authorized | Unlimited | Unlimited | Unlimited | |||||||||
|
|
|
|
|
| |||||||
Par value | None | None | None | |||||||||
|
|
|
|
|
| |||||||
(a) Securities loaned, at value | $ | 402,847 | $ | 506,387 | $ | 77,410 | ||||||
(b) Investments, at cost — Unaffiliated | $ | 19,321,202 | $ | 8,650,260 | $ | 64,338,184 | ||||||
(c) Investments, at cost — Affiliated | $ | 533,875 | $ | 585,838 | $ | 557,914 | ||||||
See notes to financial statements.
FINANCIAL STATEMENTS | 45 |
Year Ended July 31, 2020
| iShares Evolved U.S. Consumer Staples ETF | iShares Evolved U.S. Discretionary Spending ETF | iShares Evolved U.S. Financials ETF | iShares Evolved U.S. Healthcare Staples ETF | |||||||||||||
INVESTMENT INCOME | ||||||||||||||||
Dividends — Unaffiliated | $ | 229,434 | $ | 134,799 | $ | 120,986 | $ | 126,694 | ||||||||
Dividends — Affiliated | 557 | 932 | 331 | 715 | ||||||||||||
Securities lending income — Affiliated — net | 1,314 | 991 | 91 | 1,094 | ||||||||||||
Foreign taxes withheld | — | — | (36 | ) | — | |||||||||||
|
|
|
|
|
|
|
| |||||||||
Total investment income | 231,305 | 136,722 | 121,372 | 128,503 | ||||||||||||
|
|
|
|
|
|
|
| |||||||||
EXPENSES | ||||||||||||||||
Investment advisory fees | 15,050 | 18,298 | 8,234 | 19,178 | ||||||||||||
Miscellaneous | 264 | — | 264 | 264 | ||||||||||||
|
|
|
|
|
|
|
| |||||||||
Total expenses | 15,314 | 18,298 | 8,498 | 19,442 | ||||||||||||
|
|
|
|
|
|
|
| |||||||||
Net investment income | 215,991 | 118,424 | 112,874 | 109,061 | ||||||||||||
|
|
|
|
|
|
|
| |||||||||
REALIZED AND UNREALIZED GAIN (LOSS) | ||||||||||||||||
Net realized gain (loss) from: | ||||||||||||||||
Investments — Unaffiliated | (50,963 | ) | (27,830 | ) | 13,348 | (12,014 | ) | |||||||||
Investments — Affiliated | (47 | ) | 298 | 61 | 310 | |||||||||||
In-kind redemptions — Unaffiliated | — | 1,012,528 | — | 205,296 | ||||||||||||
|
|
|
|
|
|
|
| |||||||||
Net realized gain (loss) | (51,010 | ) | 984,996 | 13,409 | 193,592 | |||||||||||
|
|
|
|
|
|
|
| |||||||||
Net change in unrealized appreciation (depreciation) on: | ||||||||||||||||
Investments — Unaffiliated | 392,573 | 673,477 | (870,281 | ) | 1,465,763 | |||||||||||
Investments — Affiliated | 145 | 6 | (1 | ) | 1 | |||||||||||
|
|
|
|
|
|
|
| |||||||||
Net change in unrealized appreciation (depreciation) | 392,718 | 673,483 | (870,282 | ) | 1,465,764 | |||||||||||
|
|
|
|
|
|
|
| |||||||||
Net realized and unrealized gain (loss) | 341,708 | 1,658,479 | (856,873 | ) | 1,659,356 | |||||||||||
|
|
|
|
|
|
|
| |||||||||
NET INCREASE (DECREASE) IN NET ASSETS RESULTING FROM OPERATIONS | $ | 557,699 | $ | 1,776,903 | $ | (743,999 | ) | $ | 1,768,417 | |||||||
|
|
|
|
|
|
|
| |||||||||
See notes to financial statements.
| 46 | 2020ISHARES ANNUAL REPORTTO SHAREHOLDERS |
Statements of Operations (continued)
Year Ended July 31, 2020
| iShares Evolved U.S. Innovative Healthcare ETF | iShares Evolved U.S. Media and Entertainment ETF | iShares Evolved U.S. Technology ETF | ||||||||||
INVESTMENT INCOME | ||||||||||||
Dividends — Unaffiliated | $ | 144,885 | $ | 61,425 | $ | 261,742 | ||||||
Dividends — Affiliated | 1,004 | 703 | 1,630 | |||||||||
Securities lending income — Affiliated — net | 3,585 | 2,229 | 2,638 | |||||||||
|
|
|
|
|
| |||||||
Total investment income | 149,474 | 64,357 | 266,010 | |||||||||
|
|
|
|
|
| |||||||
EXPENSES | ||||||||||||
Investment advisory fees | 15,780 | 11,888 | 53,157 | |||||||||
Miscellaneous | — | 264 | 264 | |||||||||
|
|
|
|
|
| |||||||
Total expenses | 15,780 | 12,152 | 53,421 | |||||||||
|
|
|
|
|
| |||||||
Net investment income | 133,694 | 52,205 | 212,589 | |||||||||
|
|
|
|
|
| |||||||
REALIZED AND UNREALIZED GAIN (LOSS) | ||||||||||||
Net realized gain (loss) from: | ||||||||||||
Investments — Unaffiliated | 124,588 | 9,382 | (30,145 | ) | ||||||||
Investments — Affiliated | (27 | ) | 94 | (218 | ) | |||||||
In-kind redemptions — Unaffiliated | — | 210,212 | — | |||||||||
|
|
|
|
|
| |||||||
Net realized gain (loss) | 124,561 | 219,688 | (30,363 | ) | ||||||||
|
|
|
|
|
| |||||||
Net change in unrealized appreciation (depreciation) on: | ||||||||||||
Investments — Unaffiliated | 1,615,384 | (45,153 | ) | 13,159,894 | ||||||||
Investments — Affiliated | 106 | (44 | ) | 125 | ||||||||
|
|
|
|
|
| |||||||
Net change in unrealized appreciation (depreciation) | 1,615,490 | (45,197 | ) | 13,160,019 | ||||||||
|
|
|
|
|
| |||||||
Net realized and unrealized gain | 1,740,051 | 174,491 | 13,129,656 | |||||||||
|
|
|
|
|
| |||||||
NET INCREASE IN NET ASSETS RESULTING FROM OPERATIONS | $ | 1,873,745 | $ | 226,696 | $ | 13,342,245 | ||||||
|
|
|
|
|
| |||||||
See notes to financial statements.
FINANCIAL STATEMENTS | 47 |
Statements of Changes in Net Assets
| iShares Evolved U.S. Consumer Staples ETF | iShares Evolved U.S. Discretionary Spending ETF | |||||||||||||||||||
| Year Ended 07/31/20 | Year Ended 07/31/19 | Year Ended 07/31/20 | Year Ended 07/31/19 | |||||||||||||||||
INCREASE (DECREASE) IN NET ASSETS | ||||||||||||||||||||
OPERATIONS | ||||||||||||||||||||
Net investment income | $ | 215,991 | $ | 98,934 | $ | 118,424 | $ | 78,181 | ||||||||||||
Net realized gain (loss) | (51,010 | ) | 8,811 | 984,996 | 33,880 | |||||||||||||||
Net change in unrealized appreciation (depreciation) | 392,718 | 409,474 | 673,483 | 506,932 | ||||||||||||||||
|
|
|
|
|
|
|
| |||||||||||||
Net increase in net assets resulting from operations | 557,699 | 517,219 | 1,776,903 | 618,993 | ||||||||||||||||
|
|
|
|
|
|
|
| |||||||||||||
DISTRIBUTIONS TO SHAREHOLDERS(a) | ||||||||||||||||||||
Decrease in net assets resulting from distributions to shareholders | (191,747 | ) | (135,321 | ) | (168,954 | ) | (92,875 | ) | ||||||||||||
|
|
|
|
|
|
|
| |||||||||||||
CAPITAL SHARE TRANSACTIONS | ||||||||||||||||||||
Net increase in net assets derived from capital share transactions | 5,356,261 | — | 4,477,589 | — | ||||||||||||||||
|
|
|
|
|
|
|
| |||||||||||||
NET ASSETS | ||||||||||||||||||||
Total increase in net assets | 5,722,213 | 381,898 | 6,085,538 | 526,118 | ||||||||||||||||
Beginning of period | 4,137,138 | 3,755,240 | 5,894,998 | 5,368,880 | ||||||||||||||||
|
|
|
|
|
|
|
| |||||||||||||
End of period | $ | 9,859,351 | $ | 4,137,138 | $ | 11,980,536 | $ | 5,894,998 | ||||||||||||
|
|
|
|
|
|
|
| |||||||||||||
| (a) | Distributions for annual periods determined in accordance with U.S. federal income tax regulations. |
See notes to financial statements.
| 48 | 2020ISHARES ANNUAL REPORTTO SHAREHOLDERS |
Statements of Changes in Net Assets (continued)
| iShares Evolved U.S. Financials ETF | iShares Evolved U.S. Healthcare Staples ETF | |||||||||||||||||||
| Year Ended 07/31/20 | Year Ended 07/31/19 | Year Ended 07/31/20 | Year Ended 07/31/19 | |||||||||||||||||
INCREASE (DECREASE) IN NET ASSETS | ||||||||||||||||||||
OPERATIONS | ||||||||||||||||||||
Net investment income | $ | 112,874 | $ | 100,542 | $ | 109,061 | $ | 52,022 | ||||||||||||
Net realized gain (loss) | 13,409 | (20,809 | ) | 193,592 | 210,303 | |||||||||||||||
Net change in unrealized appreciation (depreciation) | (870,282 | ) | 72,632 | 1,465,764 | 251,235 | |||||||||||||||
|
|
|
|
|
|
|
| |||||||||||||
Net increase (decrease) in net assets resulting from operations | (743,999 | ) | 152,365 | 1,768,417 | 513,560 | |||||||||||||||
|
|
|
|
|
|
|
| |||||||||||||
DISTRIBUTIONS TO SHAREHOLDERS(a) | ||||||||||||||||||||
Decrease in net assets resulting from distributions to shareholders | (112,279 | ) | (100,143 | ) | (158,642 | ) | (80,138 | ) | ||||||||||||
|
|
|
|
|
|
|
| |||||||||||||
CAPITAL SHARE TRANSACTIONS | ||||||||||||||||||||
Net increase in net assets derived from capital share transactions | — | — | 6,032,352 | 1,435,729 | ||||||||||||||||
|
|
|
|
|
|
|
| |||||||||||||
NET ASSETS | ||||||||||||||||||||
Total increase (decrease) in net assets | (856,278 | ) | 52,222 | 7,642,127 | 1,869,151 | |||||||||||||||
Beginning of period | 4,971,175 | 4,918,953 | 7,364,525 | 5,495,374 | ||||||||||||||||
|
|
|
|
|
|
|
| |||||||||||||
End of period | $ | 4,114,897 | $ | 4,971,175 | $ | 15,006,652 | $ | 7,364,525 | ||||||||||||
|
|
|
|
|
|
|
| |||||||||||||
| (a) | Distributions for annual periods determined in accordance with U.S. federal income tax regulations. |
See notes to financial statements.
FINANCIAL STATEMENTS | 49 |
Statements of Changes in Net Assets (continued)
| iShares Evolved U.S. Innovative Healthcare ETF | iShares Evolved U.S. Media and Entertainment ETF | |||||||||||||||||||
| Year Ended 07/31/20 | Year Ended 07/31/19 | Year Ended 07/31/20 | Year Ended 07/31/19 | |||||||||||||||||
INCREASE (DECREASE) IN NET ASSETS | ||||||||||||||||||||
OPERATIONS | ||||||||||||||||||||
Net investment income | $ | 133,694 | $ | 73,830 | $ | 52,205 | $ | 54,799 | ||||||||||||
Net realized gain | 124,561 | 78,944 | 219,688 | 208,253 | ||||||||||||||||
Net change in unrealized appreciation (depreciation) | 1,615,490 | (309,456 | ) | (45,197 | ) | 249,943 | ||||||||||||||
|
|
|
|
|
|
|
| |||||||||||||
Net increase (decrease) in net assets resulting from operations | 1,873,745 | (156,682 | ) | 226,696 | 512,995 | |||||||||||||||
|
|
|
|
|
|
|
| |||||||||||||
DISTRIBUTIONS TO SHAREHOLDERS(a) | ||||||||||||||||||||
Decrease in net assets resulting from distributions to shareholders | (200,327 | ) | (100,052 | ) | (251,996 | ) | (81,138 | ) | ||||||||||||
|
|
|
|
|
|
|
| |||||||||||||
CAPITAL SHARE TRANSACTIONS | ||||||||||||||||||||
Net increase in net assets derived from capital share transactions | 14,398,781 | — | 2,187,965 | 1,347,171 | ||||||||||||||||
|
|
|
|
|
|
|
| |||||||||||||
NET ASSETS | ||||||||||||||||||||
Total increase (decrease) in net assets | 16,072,199 | (256,734 | ) | 2,162,665 | 1,779,028 | |||||||||||||||
Beginning of period | 4,948,807 | 5,205,541 | 7,055,826 | 5,276,798 | ||||||||||||||||
|
|
|
|
|
|
|
| |||||||||||||
End of period | $ | 21,021,006 | $ | 4,948,807 | $ | 9,218,491 | $ | 7,055,826 | ||||||||||||
|
|
|
|
|
|
|
| |||||||||||||
| (a) | Distributions for annual periods determined in accordance with U.S. federal income tax regulations. |
See notes to financial statements.
| 50 | 2020ISHARES ANNUAL REPORTTO SHAREHOLDERS |
Statements of Changes in Net Assets (continued)
| iShares Evolved U.S. Technology ETF | ||||||||
| Year Ended 07/31/20 | Year Ended 07/31/19 | |||||||
INCREASE (DECREASE) IN NET ASSETS | ||||||||
OPERATIONS | ||||||||
Net investment income | $ | 212,589 | $ | 56,561 | ||||
Net realized gain (loss) | (30,363 | ) | 40,935 | |||||
Net change in unrealized appreciation (depreciation) | 13,160,019 | 1,019,560 | ||||||
|
|
|
| |||||
Net increase in net assets resulting from operations | 13,342,245 | 1,117,056 | ||||||
|
|
|
| |||||
DISTRIBUTIONS TO SHAREHOLDERS(a) | ||||||||
Decrease in net assets resulting from distributions to shareholders | (220,597 | ) | (74,296 | ) | ||||
|
|
|
| |||||
CAPITAL SHARE TRANSACTIONS | ||||||||
Net increase in net assets derived from capital share transactions | 49,763,348 | 10,161,391 | ||||||
|
|
|
| |||||
NET ASSETS | ||||||||
Total increase in net assets | 62,884,996 | 11,204,151 | ||||||
Beginning of period | 16,470,423 | 5,266,272 | ||||||
|
|
|
| |||||
End of period | $ | 79,355,419 | $ | 16,470,423 | ||||
|
|
|
| |||||
| (a) | Distributions for annual periods determined in accordance with U.S. federal income tax regulations. |
See notes to financial statements.
FINANCIAL STATEMENTS | 51 |
(For a share outstanding throughout each period)
| iShares Evolved U.S. Consumer Staples ETF | ||||||||||||
| | Year Ended 07/31/20 | | Year Ended 07/31/19 | | Period From 03/21/18 to 07/31/18 | (a)
| ||||||
Net asset value, beginning of period | $ | 27.58 | $ | 25.03 | $ | 24.62 | ||||||
|
|
|
|
|
| |||||||
Net investment income(b) | 0.70 | 0.66 | 0.31 | (c) | ||||||||
Net realized and unrealized gain(d) | 0.51 | 2.80 | 0.26 | |||||||||
|
|
|
|
|
| |||||||
Net increase from investment operations | 1.21 | 3.46 | 0.57 | |||||||||
|
|
|
|
|
| |||||||
Distributions(e) | ||||||||||||
From net investment income | (0.62 | ) | (0.85 | ) | (0.16 | ) | ||||||
From net realized gain | — | (0.06 | ) | — | ||||||||
|
|
|
|
|
| |||||||
Total distributions | (0.62 | ) | (0.91 | ) | (0.16 | ) | ||||||
|
|
|
|
|
| |||||||
Net asset value, end of period | $ | 28.17 | $ | 27.58 | $ | 25.03 | ||||||
|
|
|
|
|
| |||||||
Total Return | ||||||||||||
Based on net asset value | 4.56 | % | 14.23 | % | 2.34 | %(f) | ||||||
|
|
|
|
|
| |||||||
Ratios to Average Net Assets | ||||||||||||
Total expenses | 0.18 | % | 0.18 | % | 0.18 | %(g) | ||||||
|
|
|
|
|
| |||||||
Net investment income | 2.58 | % | 2.59 | % | 3.58 | %(c)(g) | ||||||
|
|
|
|
|
| |||||||
Supplemental Data | ||||||||||||
Net assets, end of period (000) | $ | 9,859 | $ | 4,137 | $ | 3,755 | ||||||
|
|
|
|
|
| |||||||
Portfolio turnover rate(h) | 13 | % | 9 | % | 0 | %(f) | ||||||
|
|
|
|
|
| |||||||
| (a) | Commencement of operations. |
| (b) | Based on average shares outstanding. |
| (c) | Includes a special distribution from Dr Pepper Snapple Group Inc. Excluding such special distribution, the net investment income would have been $0.21 per share and 2.39% of average net assets. |
| (d) | The amounts reported for a share outstanding may not accord with the change in aggregate gains and losses in securities for the fiscal period due to the timing of capital share transactions in relation to the fluctuating market values of the Fund’s underlying securities. |
| (e) | Distributions for annual periods determined in accordance with U.S. federal income tax regulations. |
| (f) | Not annualized. |
| (g) | Annualized. |
| (h) | Portfolio turnover rate excludes in-kind transactions. |
See notes to financial statements.
| 52 | 2020ISHARES ANNUAL REPORTTO SHAREHOLDERS |
Financial Highlights (continued)
(For a share outstanding throughout each period)
| iShares Evolved U.S. Discretionary Spending ETF | ||||||||||||
| | Year Ended 07/31/20 | | Year Ended 07/31/19 | | Period From 03/21/18 to 07/31/18 | (a)
| ||||||
Net asset value, beginning of period | $ | 29.47 | $ | 26.84 | $ | 24.95 | ||||||
|
|
|
|
|
| |||||||
Net investment income(b) | 0.35 | 0.39 | 0.12 | |||||||||
Net realized and unrealized gain(c) | 4.90 | 2.70 | 1.86 | |||||||||
|
|
|
|
|
| |||||||
Net increase from investment operations | 5.25 | 3.09 | 1.98 | |||||||||
|
|
|
|
|
| |||||||
Distributions(d) | ||||||||||||
From net investment income | (0.33 | ) | (0.41 | ) | (0.09 | ) | ||||||
From net realized gain | (0.16 | ) | (0.05 | ) | — | |||||||
|
|
|
|
|
| |||||||
Total distributions | (0.49 | ) | (0.46 | ) | (0.09 | ) | ||||||
|
|
|
|
|
| |||||||
Net asset value, end of period | $ | 34.23 | $ | 29.47 | $ | 26.84 | ||||||
|
|
|
|
|
| |||||||
Total Return | ||||||||||||
Based on net asset value | 18.11 | % | 11.73 | % | 7.96 | %(e) | ||||||
|
|
|
|
|
| |||||||
Ratios to Average Net Assets | ||||||||||||
Total expenses | 0.18 | % | 0.18 | % | 0.18 | %(f) | ||||||
|
|
|
|
|
| |||||||
Net investment income | 1.16 | % | 1.42 | % | 1.25 | %(f) | ||||||
|
|
|
|
|
| |||||||
Supplemental Data | ||||||||||||
Net assets, end of period (000) | $ | 11,981 | $ | 5,895 | $ | 5,369 | ||||||
|
|
|
|
|
| |||||||
Portfolio turnover rate(g) | 10 | % | 11 | % | 0 | %(e) | ||||||
|
|
|
|
|
| |||||||
| (a) | Commencement of operations. |
| (b) | Based on average shares outstanding. |
| (c) | The amounts reported for a share outstanding may not accord with the change in aggregate gains and losses in securities for the fiscal period due to the timing of capital share transactions in relation to the fluctuating market values of the Fund’s underlying securities. |
| (d) | Distributions for annual periods determined in accordance with U.S. federal income tax regulations. |
| (e) | Not annualized. |
| (f) | Annualized. |
| (g) | Portfolio turnover rate excludes in-kind transactions. |
See notes to financial statements.
FINANCIAL HIGHLIGHTS | 53 |
Financial Highlights (continued)
(For a share outstanding throughout each period)
| iShares Evolved U.S. Financials ETF | ||||||||||||
| | Year Ended 07/31/20 | | Year Ended 07/31/19 | | Period From 03/21/18 to 07/31/18 | (a)
| ||||||
Net asset value, beginning of period | $ | 24.86 | $ | 24.59 | $ | 24.98 | ||||||
|
|
|
|
|
| |||||||
Net investment income(b) | 0.56 | 0.50 | 0.15 | |||||||||
Net realized and unrealized gain (loss)(c) | (4.29 | ) | 0.27 | (0.43 | ) | |||||||
|
|
|
|
|
| |||||||
Net increase (decrease) from investment operations | (3.73 | ) | 0.77 | (0.28 | ) | |||||||
|
|
|
|
|
| |||||||
Distributions(d) | ||||||||||||
From net investment income | (0.56 | ) | (0.50 | ) | (0.11 | ) | ||||||
|
|
|
|
|
| |||||||
Total distributions | (0.56 | ) | (0.50 | ) | (0.11 | ) | ||||||
|
|
|
|
|
| |||||||
Net asset value, end of period | $ | 20.57 | $ | 24.86 | $ | 24.59 | ||||||
|
|
|
|
|
| |||||||
Total Return | ||||||||||||
Based on net asset value | (15.10 | )% | 3.35 | % | (1.11 | )%(e)(f) | ||||||
|
|
|
|
|
| |||||||
Ratios to Average Net Assets | ||||||||||||
Total expenses | 0.19 | % | 0.18 | % | 0.18 | %(g) | ||||||
|
|
|
|
|
| |||||||
Net investment income | 2.47 | % | 2.15 | % | 1.65 | %(g) | ||||||
|
|
|
|
|
| |||||||
Supplemental Data | ||||||||||||
Net assets, end of period (000) | $ | 4,115 | $ | 4,971 | $ | 4,919 | ||||||
|
|
|
|
|
| |||||||
Portfolio turnover rate(h) | 8 | % | 10 | % | 13 | %(e) | ||||||
|
|
|
|
|
| |||||||
| (a) | Commencement of operations. |
| (b) | Based on average shares outstanding. |
| (c) | The amounts reported for a share outstanding may not accord with the change in aggregate gains and losses in securities for the fiscal period due to the timing of capital share transactions in relation to the fluctuating market values of the Fund’s underlying securities. |
| (d) | Distributions for annual periods determined in accordance with U.S. federal income tax regulations. |
| (e) | Not annualized. |
| (f) | Includes payment received from an affiliate, which impacted the Fund’s total return. Excluding the payment from an affiliate, the Fund’s total return would have been -1.40%. |
| (g) | Annualized. |
| (h) | Portfolio turnover rate excludes in-kind transactions. |
See notes to financial statements.
| 54 | 2020ISHARES ANNUAL REPORTTO SHAREHOLDERS |
Financial Highlights (continued)
(For a share outstanding throughout each period)
| iShares Evolved U.S. Healthcare Staples ETF | ||||||||||||
| | Year Ended 07/31/20 | | Year Ended 07/31/19 | | Period From 03/21/18 to 07/31/18 | (a)
| ||||||
Net asset value, beginning of period | $ | 29.46 | $ | 27.48 | $ | 24.86 | ||||||
|
|
|
|
|
| |||||||
Net investment income(b) | 0.31 | 0.27 | 0.08 | |||||||||
Net realized and unrealized gain(c) | 4.07 | 2.11 | 2.60 | |||||||||
|
|
|
|
|
| |||||||
Net increase from investment operations | 4.38 | 2.38 | 2.68 | |||||||||
|
|
|
|
|
| |||||||
Distributions(d) | ||||||||||||
From net investment income | (0.25 | ) | (0.28 | ) | (0.06 | ) | ||||||
From net realized gain | (0.24 | ) | (0.12 | ) | — | |||||||
|
|
|
|
|
| |||||||
Total distributions | (0.49 | ) | (0.40 | ) | (0.06 | ) | ||||||
|
|
|
|
|
| |||||||
Net asset value, end of period | $ | 33.35 | $ | 29.46 | $ | 27.48 | ||||||
|
|
|
|
|
| |||||||
Total Return | ||||||||||||
Based on net asset value | 15.04 | % | 8.77 | % | 10.77 | %(e) | ||||||
|
|
|
|
|
| |||||||
Ratios to Average Net Assets | ||||||||||||
Total expenses | 0.18 | % | 0.18 | % | 0.18 | %(f) | ||||||
|
|
|
|
|
| |||||||
Net investment income | 1.02 | % | 0.95 | % | 0.87 | %(f) | ||||||
|
|
|
|
|
| |||||||
Supplemental Data | ||||||||||||
Net assets, end of period (000) | $ | 15,007 | $ | 7,365 | $ | 5,495 | ||||||
|
|
|
|
|
| |||||||
Portfolio turnover rate(g) | 12 | % | 12 | % | 0 | %(e) | ||||||
|
|
|
|
|
| |||||||
| (a) | Commencement of operations. |
| (b) | Based on average shares outstanding. |
| (c) | The amounts reported for a share outstanding may not accord with the change in aggregate gains and losses in securities for the fiscal period due to the timing of capital share transactions in relation to the fluctuating market values of the Fund’s underlying securities. |
| (d) | Distributions for annual periods determined in accordance with U.S. federal income tax regulations. |
| (e) | Not annualized. |
| (f) | Annualized. |
| (g) | Portfolio turnover rate excludes in-kind transactions. |
See notes to financial statements.
FINANCIAL HIGHLIGHTS | 55 |
Financial Highlights (continued)
(For a share outstanding throughout each period)
| iShares Evolved U.S. Innovative Healthcare ETF | ||||||||||||
| | Year Ended 07/31/20 | | Year Ended 07/31/19 | | Period From 03/21/18 to 07/31/18 | (a)
| ||||||
Net asset value, beginning of period | $ | 24.74 | $ | 26.03 | $ | 24.97 | ||||||
|
|
|
|
|
| |||||||
Net investment income(b) | 0.43 | 0.37 | 0.11 | |||||||||
Net realized and unrealized gain (loss)(c) | 5.72 | (1.15 | ) | 1.04 | ||||||||
|
|
|
|
|
| |||||||
Net increase (decrease) from investment operations | 6.15 | (0.78 | ) | 1.15 | ||||||||
|
|
|
|
|
| |||||||
Distributions(d) | ||||||||||||
From net investment income | (0.38 | ) | (0.36 | ) | (0.09 | ) | ||||||
From net realized gain | (0.48 | ) | (0.15 | ) | — | |||||||
|
|
|
|
|
| |||||||
Total distributions | (0.86 | ) | (0.51 | ) | (0.09 | ) | ||||||
|
|
|
|
|
| |||||||
Net asset value, end of period | $ | 30.03 | $ | 24.74 | $ | 26.03 | ||||||
|
|
|
|
|
| |||||||
Total Return | ||||||||||||
Based on net asset value | 25.31 | % | (3.04 | )% | 4.62 | %(e) | ||||||
|
|
|
|
|
| |||||||
Ratios to Average Net Assets | ||||||||||||
Total expenses | 0.18 | % | 0.18 | % | 0.18 | %(f) | ||||||
|
|
|
|
|
| |||||||
Net investment income | 1.53 | % | 1.45 | % | 1.25 | %(f) | ||||||
|
|
|
|
|
| |||||||
Supplemental Data | ||||||||||||
Net assets, end of period (000) | $ | 21,021 | $ | 4,949 | $ | 5,206 | ||||||
|
|
|
|
|
| |||||||
Portfolio turnover rate(g) | 24 | % | 8 | % | 3 | %(e) | ||||||
|
|
|
|
|
| |||||||
| (a) | Commencement of operations. |
| (b) | Based on average shares outstanding. |
| (c) | The amounts reported for a share outstanding may not accord with the change in aggregate gains and losses in securities for the fiscal period due to the timing of capital share transactions in relation to the fluctuating market values of the Fund’s underlying securities. |
| (d) | Distributions for annual periods determined in accordance with U.S. federal income tax regulations. |
| (e) | Not annualized. |
| (f) | Annualized. |
| (g) | Portfolio turnover rate excludes in-kind transactions. |
See notes to financial statements.
| 56 | 2020ISHARES ANNUAL REPORTTO SHAREHOLDERS |
Financial Highlights (continued)
(For a share outstanding throughout each period)
| iShares Evolved U.S. Media and Entertainment ETF | ||||||||||||
| | Year Ended 07/31/20 | | | Year Ended 07/31/19 | | | Period From 03/21/18 to 07/31/18 | (a)
| ||||
Net asset value, beginning of period | $ | 28.22 | $ | 26.38 | $ | 25.05 | ||||||
|
|
|
|
|
| |||||||
Net investment income(b) | 0.20 | 0.26 | 0.10 | |||||||||
Net realized and unrealized gain (loss)(c) | (0.86 | ) | 1.97 | 1.29 | ||||||||
|
|
|
|
|
| |||||||
Net increase (decrease) from investment operations | (0.66 | ) | 2.23 | 1.39 | ||||||||
|
|
|
|
|
| |||||||
Distributions(d) | ||||||||||||
From net investment income | (0.21 | ) | (0.26 | ) | (0.06 | ) | ||||||
From net realized gain | (1.01 | ) | (0.13 | ) | — | |||||||
|
|
|
|
|
| |||||||
Total distributions | (1.22 | ) | (0.39 | ) | (0.06 | ) | ||||||
|
|
|
|
|
| |||||||
Net asset value, end of period | $ | 26.34 | $ | 28.22 | $ | 26.38 | ||||||
|
|
|
|
|
| |||||||
Total Return | ||||||||||||
Based on net asset value | (2.33 | )% | 8.64 | % | 5.54 | %(e) | ||||||
|
|
|
|
|
| |||||||
Ratios to Average Net Assets | ||||||||||||
Total expenses | 0.18 | % | 0.18 | % | 0.18 | %(f) | ||||||
|
|
|
|
|
| |||||||
Net investment income | 0.79 | % | 0.99 | % | 1.04 | %(f) | ||||||
|
|
|
|
|
| |||||||
Supplemental Data | ||||||||||||
Net assets, end of period (000) | $ | 9,218 | $ | 7,056 | $ | 5,277 | ||||||
|
|
|
|
|
| |||||||
Portfolio turnover rate(g) | 16 | % | 10 | % | 0 | %(e) | ||||||
|
|
|
|
|
| |||||||
| (a) | Commencement of operations. |
| (b) | Based on average shares outstanding. |
| (c) | The amounts reported for a share outstanding may not accord with the change in aggregate gains and losses in securities for the fiscal period due to the timing of capital share transactions in relation to the fluctuating market values of the Fund’s underlying securities. |
| (d) | Distributions for annual periods determined in accordance with U.S. federal income tax regulations. |
| (e) | Not annualized. |
| (f) | Annualized. |
| (g) | Portfolio turnover rate excludes in-kind transactions. |
See notes to financial statements.
FINANCIAL HIGHLIGHTS | 57 |
Financial Highlights (continued)
(For a share outstanding throughout each period)
| iShares Evolved U.S. Technology ETF | ||||||||||||
| | Year Ended 07/31/20 | | Year Ended 07/31/19 | | Period From 03/21/18 to 07/31/18 | (a)
| ||||||
Net asset value, beginning of period | $ | 29.95 | $ | 26.33 | $ | 24.89 | ||||||
|
|
|
|
|
| |||||||
Net investment income(b) | 0.24 | 0.23 | 0.06 | |||||||||
Net realized and unrealized gain(c) | 10.80 | 3.73 | 1.43 | |||||||||
|
|
|
|
|
| |||||||
Net increase from investment operations | 11.04 | 3.96 | 1.49 | |||||||||
|
|
|
|
|
| |||||||
Distributions(d) | ||||||||||||
From net investment income | (0.24 | ) | (0.27 | ) | (0.05 | ) | ||||||
From net realized gain | (0.05 | ) | (0.07 | ) | — | |||||||
|
|
|
|
|
| |||||||
Total distributions | (0.29 | ) | (0.34 | ) | (0.05 | ) | ||||||
|
|
|
|
|
| |||||||
Net asset value, end of period | $ | 40.70 | $ | 29.95 | $ | 26.33 | ||||||
|
|
|
|
|
| |||||||
Total Return | ||||||||||||
Based on net asset value | 37.15 | % | 15.27 | % | 6.00 | %(e) | ||||||
|
|
|
|
|
| |||||||
Ratios to Average Net Assets | ||||||||||||
Total expenses | 0.18 | % | 0.18 | % | 0.18 | %(f) | ||||||
|
|
|
|
|
| |||||||
Net investment income | 0.72 | % | 0.85 | % | 0.70 | %(f) | ||||||
|
|
|
|
|
| |||||||
Supplemental Data | ||||||||||||
Net assets, end of period (000) | $ | 79,355 | $ | 16,470 | $ | 5,266 | ||||||
|
|
|
|
|
| |||||||
Portfolio turnover rate(g) | 5 | % | 7 | % | 0 | %(e) | ||||||
|
|
|
|
|
| |||||||
| (a) | Commencement of operations. |
| (b) | Based on average shares outstanding. |
| (c) | The amounts reported for a share outstanding may not accord with the change in aggregate gains and losses in securities for the fiscal period due to the timing of capital share transactions in relation to the fluctuating market values of the Fund’s underlying securities. |
| (d) | Distributions for annual periods determined in accordance with U.S. federal income tax regulations. |
| (e) | Not annualized. |
| (f) | Annualized. |
| (g) | Portfolio turnover rate excludes in-kind transactions. |
See notes to financial statements.
| 58 | 2020ISHARES ANNUAL REPORTTO SHAREHOLDERS |
| 1. | ORGANIZATION |
iShares U.S. ETF Trust (the “Trust”) is registered under the Investment Company Act of 1940, as amended (the “1940 Act”), as an open-end management investment company. The Trust is organized as a Delaware statutory trust and is authorized to have multiple series or portfolios.
These financial statements relate only to the following funds (each, a “Fund,” and collectively, the “Funds”):
| iShares ETF | Diversification Classification | |||
Evolved U.S. Consumer Staples | Non-diversified | |||
Evolved U.S. Discretionary Spending | Non-diversified | |||
Evolved U.S. Financials | Non-diversified | |||
Evolved U.S. Healthcare Staples | Non-diversified | |||
Evolved U.S. Innovative Healthcare | Non-diversified | |||
Evolved U.S. Media and Entertainment | Non-diversified | |||
Evolved U.S. Technology | Non-diversified | |||
| 2. | SIGNIFICANT ACCOUNTING POLICIES |
The following significant accounting policies are consistently followed by each Fund in the preparation of its financial statements in conformity with accounting principles generally accepted in the United States of America (“U.S. GAAP”). The preparation of financial statements in conformity with U.S. GAAP requires management to make certain estimates and assumptions that affect the reported amounts of assets and liabilities and disclosures of contingent assets and liabilities at the date of the financial statements and the reported amounts of increases and decreases in net assets from operations during the reporting period. Actual results could differ from those estimates. Each Fund is considered an investment company under U.S. GAAP and follows the accounting and reporting guidance applicable to investment companies.
Investment Transactions and Income Recognition: Investment transactions are accounted for on trade date. Realized gains and losses on investment transactions are determined using the specific identification method. Dividend income and capital gain distributions, if any, are recognized on the ex-dividend date, net of any foreign taxes withheld at source. Any taxes withheld that are reclaimable from foreign tax authorities are reflected in tax reclaims receivable. Distributions received by the Funds may include a return of capital that is estimated by management. Such amounts are recorded as a reduction of the cost of investments or reclassified to capital gains. Upon notification from issuers, some of the dividend income received from a real estate investment trust may be re-designated as a return of capital or capital gain. Non-cash dividends, if any, are recognized on the ex-dividend date and recorded as non-cash dividend income at fair value. Interest income is accrued daily.
Foreign Taxes: The Funds may be subject to foreign taxes (a portion of which may be reclaimable) on income, stock dividends, capital gains on investments, or certain foreign currency transactions. All foreign taxes are recorded in accordance with the applicable foreign tax regulations and rates that exist in the foreign jurisdictions in which each Fund invests. These foreign taxes, if any, are paid by each Fund and are reflected in its statement of operations as follows: foreign taxes withheld at source are presented as a reduction of income, foreign taxes on securities lending income are presented as a reduction of securities lending income, foreign taxes on stock dividends are presented as “other foreign taxes”, and foreign taxes on capital gains from sales of investments and foreign taxes on foreign currency transactions are included in their respective net realized gain (loss) categories. Foreign taxes payable or deferred as of July 31, 2020, if any, are disclosed in the statement of assets and liabilities.
In-kind Redemptions: For financial reporting purposes, in-kind redemptions are treated as sales of securities resulting in realized capital gains or losses to the Funds. Because such gains or losses are not taxable to the Funds and are not distributed to existing Fund shareholders, the gains or losses are reclassified from accumulated net realized gain (loss) to paid-in capital at the end of the Funds’ tax year. These reclassifications have no effect on net assets or net asset value (“NAV”) per share.
Distributions: Dividends and distributions paid by each Fund are recorded on the ex-dividend dates. Distributions are determined on a tax basis and may differ from net investment income and net realized capital gains for financial reporting purposes. Dividends and distributions are paid in U.S. dollars and cannot be automatically reinvested in additional shares of the Funds.
Indemnifications: In the normal course of business, each Fund enters into contracts that contain a variety of representations that provide general indemnification. The Funds’ maximum exposure under these arrangements is unknown because it involves future potential claims against the Funds, which cannot be predicted with any certainty.
| 3. | INVESTMENT VALUATION AND FAIR VALUE MEASUREMENTS |
Investment Valuation Policies: Each Fund’s investments are valued at fair value (also referred to as “market value” within the financial statements) each day that the Fund’s listing exchange is open and, for financial reporting purposes, as of the report date should the reporting period end on a day that the Fund’s listing exchange is not open. U.S. GAAP defines fair value as the price a fund would receive to sell an asset or pay to transfer a liability in an orderly transaction between market participants at the measurement date. A fund determines the fair value of its financial instruments using various independent dealers or pricing services under policies approved by the Board of Trustees of the Trust (the “Board”). If a security’s market price is not readily available or does not otherwise accurately represent the fair value of the security, the security will be valued in accordance with a policy approved by the Board as reflecting fair value. The BlackRock Global Valuation Methodologies Committee (the “Global Valuation Committee”) is the committee formed by management to develop global pricing policies and procedures and to oversee the pricing function for all financial instruments.
NOTESTO FINANCIAL STATEMENTS | 59 |
Notes to Financial Statements (continued)
Fair Value Inputs and Methodologies: The following methods and inputs are used to establish the fair value of each Fund’s assets and liabilities:
| • | Equity investments traded on a recognized securities exchange are valued at that day’s last traded price or official closing price, as applicable, on the exchange where the stock is primarily traded. Equity investments traded on a recognized exchange for which there were no sales on that day are valued at the last traded price. |
| • | Investments in open-end U.S. mutual funds (including money market funds) are valued at that day’s published NAV. |
If events (e.g., a company announcement, market volatility or a natural disaster) occur that are expected to materially affect the value of an investment, or in the event that application of these methods of valuation results in a price for an investment that is deemed not to be representative of the market value of such investment, or if a price is not available, the investment will be valued by the Global Valuation Committee, in accordance with policies approved by the Board as reflecting fair value (“Fair Valued Investments”). The fair valuation approaches that may be used by the Global Valuation Committee include market approach, income approach and the cost approach. Valuation techniques used under these approaches take into consideration inputs that include but are not limited to (i) attributes specific to the investment; (ii) the principal market for the investment; (iii) the customary participants in the principal market for the investment; (iv) data assumptions by market participants for the investment, if reasonably available; (v) quoted prices for similar investments in active markets; and (vi) other inputs, such as future cash flows, interest rates, yield curves, volatilities, prepayment speeds, loss severities, credit risks and/or default rates.
When determining the price for Fair Valued Investments, the Global Valuation Committee, or its delegate, seeks to determine the price that each Fund might reasonably expect to receive or pay from the current sale or purchase of that asset or liability in an arm’s-length transaction. Fair value determinations shall be based upon all available factors that the Global Valuation Committee, or its delegate, deems relevant and consistent with the principles of fair value measurement.
Fair Value Hierarchy: Various inputs are used in determining the fair value of financial instruments. These inputs to valuation techniques are categorized into a fair value hierarchy consisting of three broad levels for financial reporting purposes as follows:
| • | Level 1 — Unadjusted price quotations in active markets for identical assets or liabilities; |
| • | Level 2 — Inputs other than quoted prices included within Level 1 that are observable for the asset or liability either directly or indirectly, including, but not limited to, quoted prices for similar assets or liabilities in markets that are active, quoted prices for identical or similar assets or liabilities in markets that are not considered to be active, inputs other than quoted prices that are observable for the asset or liability (such as interest rates, yield curves, volatilities, prepayment speeds, loss severities, credit risks and default rates) or other market-corroborated inputs; and |
| • | Level 3 — Unobservable inputs based on the best information available in the circumstances, to the extent observable inputs are not available, (including the Global Valuation Committee’s assumptions used in determining the fair value of financial instruments). |
The hierarchy gives the highest priority to unadjusted quoted prices in active markets for identical assets or liabilities (Level 1 measurements) and the lowest priority to unobservable inputs (Level 3 measurements). Accordingly, the degree of judgement exercised in determining fair value is greatest for instruments categorized in Level 3. The inputs used to measure fair value may fall into different levels of the fair value hierarchy. In such cases, for disclosure purposes, the fair value hierarchy classification is determined based on the lowest level input that is significant to the fair value measurement in its entirety. The fair value hierarchy for each Fund’s investments is included in its schedule of investments. The categorization of a value determined for financial instruments is based on the pricing transparency of the financial instruments and is not necessarily an indication of the risks associated with investing in those securities.
| 4. | SECURITIES AND OTHER INVESTMENTS |
Securities Lending: Each Fund may lend its securities to approved borrowers, such as brokers, dealers and other financial institutions. The borrower pledges and maintains with the Fund collateral consisting of cash, an irrevocable letter of credit issued by an approved bank, or securities issued or guaranteed by the U.S. government. The initial collateral received by each Fund is required to have a value of at least 102% of the current market value of the loaned securities for securities traded on U.S. exchanges and a value of at least 105% for all other securities. The collateral is maintained thereafter at a value equal to at least 100% of the current value of the securities on loan. The market value of the loaned securities is determined at the close of each business day of the Fund and any additional required collateral is delivered to the Fund or excess collateral is returned by the Fund, on the next business day. During the term of the loan, each Fund is entitled to all distributions made on or in respect of the loaned securities but does not receive interest income on securities received as collateral. Loans of securities are terminable at any time and the borrower, after notice, is required to return borrowed securities within the standard time period for settlement of securities transactions.
As of July 31, 2020, any securities on loan were collateralized by cash and/or U.S. government obligations. Cash collateral received was invested in money market funds managed by BlackRock Fund Advisors (“BFA”), the Funds’ investment adviser, or its affiliates and is disclosed in the schedules of investments. Any non-cash collateral received cannot be sold, re-invested or pledged by the Fund, except in the event of borrower default. The securities on loan for each Fund, if any, are also disclosed in its schedule of investments. The market value of any securities on loan as of July 31, 2020 and the value of the related cash collateral are disclosed in the statements of assets and liabilities.
Securities lending transactions are entered into by a fund under Master Securities Lending Agreements (each, an “MSLA”) which provide the right, in the event of default (including bankruptcy or insolvency) for the non-defaulting party to liquidate the collateral and calculate a net exposure to the defaulting party or request additional collateral. In the event that a borrower defaults, the fund, as lender, would offset the market value of the collateral received against the market value of the securities loaned. The value of the collateral is typically greater than the market value of the securities loaned, leaving the lender with a net amount payable to the defaulting party. However, bankruptcy or insolvency laws of a particular jurisdiction may impose restrictions on or prohibitions against such a right of offset in the event of an MSLA counterparty’s bankruptcy or insolvency. Under the MSLA, absent an event of default, the borrower can resell or re-pledge the loaned securities, and the fund can reinvest cash collateral received in connection with loaned securities.
The following table is a summary of the securities lending agreements by counterparty which are subject to offset under an MSLA as of July 31, 2020:
| 60 | 2020ISHARES ANNUAL REPORTTO SHAREHOLDERS |
Notes to Financial Statements (continued)
| iShares ETF and Counterparty | Market Value of Securities on Loan | Cash Collateral Received(a) | Non-Cash Collateral Received | Net Amount | ||||||||||||
Evolved U.S. Consumer Staples | ||||||||||||||||
Citigroup Global Markets Inc. | $ | 23,988 | $ | 23,988 | $ | — | $ | — | ||||||||
UBS AG | 135,845 | 135,845 | — | — | ||||||||||||
|
|
|
|
|
|
|
| |||||||||
| $ | 159,833 | $ | 159,833 | $ | — | $ | — | |||||||||
|
|
|
|
|
|
|
| |||||||||
Evolved U.S. Discretionary Spending | ||||||||||||||||
Citigroup Global Markets Inc. | $ | 1,392 | $ | 1,392 | $ | — | $ | — | ||||||||
Morgan Stanley & Co. LLC | 2,990 | 2,990 | — | — | ||||||||||||
|
|
|
|
|
|
|
| |||||||||
| $ | 4,382 | $ | 4,382 | $ | — | $ | — | |||||||||
|
|
|
|
|
|
|
| |||||||||
Evolved U.S. Financials | ||||||||||||||||
Citigroup Global Markets Inc. | $ | 5,309 | $ | 5,287 | $ | — | $ | (22 | )(b) | |||||||
Morgan Stanley & Co. LLC | 1,376 | 1,376 | — | — | ||||||||||||
UBS AG | 1,731 | 1,731 | — | — | ||||||||||||
|
|
|
|
|
|
|
| |||||||||
| $ | 8,416 | $ | 8,394 | $ | — | $ | (22 | ) | ||||||||
|
|
|
|
|
|
|
| |||||||||
Evolved U.S. Healthcare Staples | ||||||||||||||||
Barclays Capital Inc. | $ | 23,474 | $ | 23,474 | $ | — | $ | — | ||||||||
Credit Suisse Securities (USA) LLC | 191,080 | 191,080 | — | — | ||||||||||||
Nomura Securities International Inc. | 1,827 | 1,827 | — | — | ||||||||||||
RBC Capital Markets LLC | 1,133 | 1,133 | — | — | ||||||||||||
SG Americas Securities LLC | 2,252 | 2,252 | — | — | ||||||||||||
UBS AG | 2,581 | 2,581 | — | — | ||||||||||||
|
|
|
|
|
|
|
| |||||||||
| $ | 222,347 | $ | 222,347 | $ | — | $ | — | |||||||||
|
|
|
|
|
|
|
| |||||||||
Evolved U.S. Innovative Healthcare | ||||||||||||||||
Barclays Capital Inc. | $ | 21,826 | $ | 21,826 | $ | — | $ | — | ||||||||
Citadel Clearing LLC | 2,243 | 2,243 | — | — | ||||||||||||
Citigroup Global Markets Inc. | 26,245 | 26,245 | — | — | ||||||||||||
Credit Suisse Securities (USA) LLC | 276 | 276 | — | — | ||||||||||||
HSBC Bank PLC | 582 | 582 | — | — | ||||||||||||
Morgan Stanley & Co. LLC | 164,094 | 164,094 | — | — | ||||||||||||
RBC Capital Markets LLC | 51,850 | 51,850 | — | — | ||||||||||||
SG Americas Securities LLC | 8,471 | 8,471 | — | — | ||||||||||||
UBS AG | 127,260 | 127,260 | — | — | ||||||||||||
|
|
|
|
|
|
|
| |||||||||
| $ | 402,847 | $ | 402,847 | $ | — | $ | — | |||||||||
|
|
|
|
|
|
|
| |||||||||
Evolved U.S. Media and Entertainment | ||||||||||||||||
Citigroup Global Markets Inc. | $ | 292,744 | $ | 291,298 | $ | — | $ | (1,446 | )(b) | |||||||
Credit Suisse Securities (USA) LLC | 632 | 632 | — | — | ||||||||||||
Morgan Stanley & Co. LLC | 3,111 | 3,111 | — | — | ||||||||||||
RBC Capital Markets LLC | 143,780 | 143,780 | — | — | ||||||||||||
SG Americas Securities LLC | 66,120 | 65,533 | — | (587 | )(b) | |||||||||||
|
|
|
|
|
|
|
| |||||||||
| $ | 506,387 | $ | 504,354 | $ | — | $ | (2,033 | ) | ||||||||
|
|
|
|
|
|
|
| |||||||||
Evolved U.S. Technology | ||||||||||||||||
Morgan Stanley & Co. LLC | $ | 67,805 | $ | 67,805 | $ | — | $ | — | ||||||||
UBS AG | 9,605 | 9,140 | — | (465 | )(b) | |||||||||||
|
|
|
|
|
|
|
| |||||||||
| $ | 77,410 | $ | 76,945 | $ | — | $ | (465 | ) | ||||||||
|
|
|
|
|
|
|
| |||||||||
| (a) | Collateral received in excess of the market value of securities on loan is not presented in this table. The total cash collateral received by each Fund is disclosed in the Fund’s statement of assets and liabilities. |
| (b) | Additional collateral is delivered to the Fund on the next business day in accordance with the MSLA. The net amount would be subject to the borrower default indemnity in the event of default by a counterparty. |
The risks of securities lending include the risk that the borrower may not provide additional collateral when required or may not return the securities when due. To mitigate these risks, each Fund benefits from a borrower default indemnity provided by BlackRock, Inc. (“BlackRock”). BlackRock’s indemnity allows for full replacement of the securities loaned to the extent the collateral received does not cover the value of the securities loaned in the event of borrower default. Each Fund could incur a loss if the value of an investment purchased with cash collateral falls below the market value of the loaned securities or if the value of an investment purchased with cash collateral falls below the value of the original cash collateral received. Such losses are borne entirely by each Fund.
NOTESTO FINANCIAL STATEMENTS | 61 |
Notes to Financial Statements (continued)
| 5. | INVESTMENT ADVISORY AGREEMENT AND OTHER TRANSACTIONS WITH AFFILIATES |
Investment Advisory Fees: Pursuant to an Investment Advisory Agreement with the Trust, BFA manages the investment of each Fund’s assets. BFA is a California corporation indirectly owned by BlackRock. Under the Investment Advisory Agreement, BFA is responsible for substantially all expenses of the Funds, except (i) interest and taxes; (ii) brokerage commissions and other expenses connected with the execution of portfolio transactions; (iii) distribution fees; (iv) the advisory fee payable to BFA; and (v) litigation expenses and any extraordinary expenses (in each case as determined by a majority of the independent trustees).
For its investment advisory services to each Fund, BFA is entitled to an annual investment advisory fee, accrued daily and paid monthly by the Funds, based on the average daily net assets of each Fund as follows:
| iShares ETF | Investment Advisory Fee | |||
Evolved U.S. Consumer Staples | 0.18 | % | ||
Evolved U.S. Discretionary Spending | 0.18 | |||
Evolved U.S. Financials | 0.18 | |||
Evolved U.S. Healthcare Staples | 0.18 | |||
Evolved U.S. Innovative Healthcare | 0.18 | |||
Evolved U.S. Media and Entertainment | 0.18 | |||
Evolved U.S. Technology | 0.18 | |||
Distributor: BlackRock Investments, LLC, an affiliate of BFA, is the distributor for each Fund. Pursuant to the distribution agreement, BFA is responsible for any fees or expenses for distribution services provided to the Funds.
Securities Lending: The U.S. Securities and Exchange Commission (the “SEC”) has issued an exemptive order which permits BlackRock Institutional Trust Company, N.A. (“BTC”), an affiliate of BFA, to serve as securities lending agent for the Funds, subject to applicable conditions. As securities lending agent, BTC bears all operational costs directly related to securities lending. Each Fund is responsible for fees in connection with the investment of cash collateral received for securities on loan in a money market fund managed by BFA, or its affiliates, however, BTC has agreed to reduce the amount of securities lending income it receives in order to effectively limit the collateral investment fees each Fund bears to an annual rate of 0.04% (the “collateral investment fees”). Securities lending income is equal to the total of income earned from the reinvestment of cash collateral (excluding collateral investment fees), net of fees and other payments to and from borrowers of securities. Each Fund retains a portion of securities lending income and remits the remaining portion to BTC as compensation for its services as securities lending agent.
Pursuant to the current securities lending agreement, each Fund retains 75% of securities lending income (which excludes collateral investment fees) and the amount retained can never be less than 70% of the total of securities lending income plus the collateral investment fees.
In addition, commencing the business day following the date that the aggregate securities lending income plus the collateral investment fees generated across all 1940 Act iShares exchange-traded funds (the “iShares ETF Complex”) in that calendar year exceeds a specified threshold, each Fund, pursuant to the securities lending agreement, will retain for the remainder of that calendar year 80% of securities lending income (which excludes collateral investment fees), and the amount retained can never be less than 70% of the total of securities lending income plus the collateral investment fees.
Prior to January 1, 2020, each Fund retained 73.5% of securities lending income (which excludes collateral investment fees) and the amount retained was not less than 70% of the total of securities lending income plus the collateral investment fees. In addition, commencing the business day following the date that the aggregate securities lending income plus the collateral investment fees generated across the iShares ETF Complex in a calendar year exceeded a specified threshold, each Fund, pursuant to the securities lending agreement, retained for the remainder of that calendar year 80% of securities lending income (which excludes collateral investment fees), and the amount retained could never be less than 70% of the total of securities lending income plus the collateral investment fees.
The share of securities lending income earned by each Fund is shown as securities lending income — affiliated — net in its statement of operations. For the year ended July 31, 2020, the Funds paid BTC the following amounts for securities lending agent services:
| iShares ETF | Fees Paid to BTC | |||
Evolved U.S. Consumer Staples | $ | 500 | ||
Evolved U.S. Discretionary Spending | 385 | |||
Evolved U.S. Financials | 36 | |||
Evolved U.S. Healthcare Staples | 430 | |||
Evolved U.S. Innovative Healthcare | 1,333 | |||
Evolved U.S. Media and Entertainment | 876 | |||
Evolved U.S. Technology | 1,025 | |||
Officers and Trustees: Certain officers and/or trustees of the Trust are officers and/or trustees of BlackRock or its affiliates.
Each Fund may invest its positive cash balances in certain money market funds managed by BFA or an affiliate. The income earned on these temporary cash investments is shown as dividends — affiliated in the statement of operations.
| 62 | 2020ISHARES ANNUAL REPORTTO SHAREHOLDERS |
Notes to Financial Statements (continued)
| 6. | PURCHASES AND SALES |
For the year ended July 31, 2020, purchases and sales of investments, excluding in-kind transactions and short-term investments, were as follows:
| iShares ETF | Purchases | Sales | ||||||
Evolved U.S. Consumer Staples | $ | 1,060,092 | $ | 1,045,583 | ||||
Evolved U.S. Discretionary Spending | 998,780 | 986,101 | ||||||
Evolved U.S. Financials | 370,545 | 375,619 | ||||||
Evolved U.S. Healthcare Staples | 1,282,746 | 1,305,420 | ||||||
Evolved U.S. Innovative Healthcare | 2,490,973 | 2,183,485 | ||||||
Evolved U.S. Media and Entertainment | 1,042,916 | 1,255,018 | ||||||
Evolved U.S. Technology | 1,676,865 | 1,615,546 | ||||||
For the year ended July 31, 2020, in-kind transactions were as follows:
| iShares ETF | In-kind Purchases | In-kind Sales | ||||||
Evolved U.S. Consumer Staples | $ | 5,314,611 | $ | — | ||||
Evolved U.S. Discretionary Spending | 8,658,761 | 4,266,377 | ||||||
Evolved U.S. Healthcare Staples | 7,260,926 | 1,282,244 | ||||||
Evolved U.S. Innovative Healthcare | 13,965,286 | — | ||||||
Evolved U.S. Media and Entertainment | 3,518,079 | 1,350,786 | ||||||
Evolved U.S. Technology | 49,424,512 | — | ||||||
| 7. | INCOME TAX INFORMATION |
Each Fund is treated as an entity separate from the Trust’s other funds for federal income tax purposes. It is the policy of each Fund to qualify as a regulated investment company by complying with the provisions applicable to regulated investment companies, as defined under Subchapter M of the Internal Revenue Code of 1986, as amended, and to annually distribute substantially all of its ordinary income and any net capital gains (taking into account any capital loss carryforwards) sufficient to relieve it from all, or substantially all, federal income and excise taxes. Accordingly, no provision for federal income taxes is required.
Management has analyzed tax laws and regulations and their application to the Funds as of July 31, 2020, inclusive of the open tax return years, and does not believe that there are any uncertain tax positions that require recognition of a tax liability in the Funds’ financial statements.
U.S. GAAP requires that certain components of net assets be adjusted to reflect permanent differences between financial and tax reporting. These reclassifications have no effect on net assets or NAV per share. As of July 31, 2020, the following permanent differences attributable to realized gains (losses) from in-kind redemptions, were reclassified to the following accounts:
| iShares ETF | Paid-in Capital | Accumulated Earnings (Loss) | ||||||
Evolved U.S. Consumer Staples | $ | 4,246 | $ | (4,246 | ) | |||
Evolved U.S. Discretionary Spending | 1,012,528 | (1,012,528 | ) | |||||
Evolved U.S. Healthcare Staples | 205,117 | (205,117 | ) | |||||
Evolved U.S. Media and Entertainment | 210,589 | (210,589 | ) | |||||
The tax character of distributions paid was as follows:
| iShares ETF | Year Ended 07/31/20 | Year Ended 07/31/19 | ||||||
Evolved U.S. Consumer Staples | ||||||||
Ordinary income | $ | 191,747 | $ | 135,321 | ||||
|
|
|
| |||||
Evolved U.S. Discretionary Spending | ||||||||
Ordinary income | $ | 128,050 | $ | 92,875 | ||||
Long-term capital gains | 40,904 | — | ||||||
|
|
|
| |||||
| $ | 168,954 | $ | 92,875 | |||||
|
|
|
| |||||
Evolved U.S. Financials | ||||||||
Ordinary income | $ | 112,279 | $ | 100,143 | ||||
|
|
|
| |||||
Evolved U.S. Healthcare Staples | ||||||||
Ordinary income | $ | 157,162 | $ | 80,138 | ||||
Long-term capital gains | 1,480 | — | ||||||
|
|
|
| |||||
| $ | 158,642 | $ | 80,138 | |||||
|
|
|
| |||||
NOTESTO FINANCIAL STATEMENTS | 63 |
Notes to Financial Statements (continued)
| iShares ETF | Year Ended 07/31/20 | Year Ended 07/31/19 | ||||||
Evolved U.S. Innovative Healthcare | ||||||||
Ordinary income | $ | 132,150 | $ | 100,052 | ||||
Long-term capital gains | 68,177 | — | ||||||
|
|
|
| |||||
| $ | 200,327 | $ | 100,052 | |||||
|
|
|
| |||||
Evolved U.S. Media and Entertainment | ||||||||
Ordinary income | $ | 235,056 | $ | 81,138 | ||||
Long-term capital gains | 16,940 | — | ||||||
|
|
|
| |||||
| $ | 251,996 | $ | 81,138 | |||||
|
|
|
| |||||
Evolved U.S. Technology | ||||||||
Ordinary income | $ | 207,812 | $ | 74,296 | ||||
Long-term capital gains | 12,785 | — | ||||||
|
|
|
| |||||
| $ | 220,597 | $ | 74,296 | |||||
|
|
|
| |||||
As of July 31, 2020, the tax components of accumulated net earnings (losses) were as follows:
| iShares ETF | | Undistributed Ordinary Income | | | Undistributed Long-Term Capital Gains | | | Non-expiring Capital Loss Carryforwards | (a) | | Net Unrealized Gains (Losses) | (b) | | Qualified Late-Year Losses | | Total | ||||||||
Evolved U.S. Consumer Staples | $ | 37,003 | $ | — | $ | (58,398 | ) | $ | 816,453 | $ | — | $ | 795,058 | |||||||||||
Evolved U.S. Discretionary Spending | 3,814 | — | — | 1,587,923 | (58,764 | ) | 1,532,973 | |||||||||||||||||
Evolved U.S. Financials | 11,503 | — | (25,476 | ) | (809,290 | ) | — | (823,263 | ) | |||||||||||||||
Evolved U.S. Healthcare Staples | 23,521 | — | (20,446 | ) | 2,245,637 | — | 2,248,712 | |||||||||||||||||
Evolved U.S. Innovative Healthcare | 62,321 | 108,453 | — | 1,533,195 | — | 1,703,969 | ||||||||||||||||||
Evolved U.S. Media and Entertainment | 11,173 | — | — | 481,650 | — | 492,823 | ||||||||||||||||||
Evolved U.S. Technology | 20,496 | — | (32,554 | ) | 14,534,694 | — | 14,522,636 |
| (a) | Amounts available to offset future realized capital gains. |
| (b) | The difference between book-basis and tax-basis unrealized gains (losses) was attributable primarily to the tax deferral of losses on wash sales and the characterization of corporate actions. |
For the year ended July 31, 2020, the iShares Evolved U.S. Financials ETF utilized $18,865 of its capital loss carryforwards.
As of July 31, 2020, gross unrealized appreciation and depreciation based on cost of investments (including short positions and derivatives, if any) for U.S. federal income tax purposes were as follows:
| iShares ETF | Tax Cost | Gross Unrealized Appreciation | Gross Unrealized Depreciation | Net Unrealized Appreciation (Depreciation) | ||||||||||||
Evolved U.S. Consumer Staples | $ | 9,195,355 | $ | 1,121,163 | $ | (304,710 | ) | $ | 816,453 | |||||||
Evolved U.S. Discretionary Spending | 10,386,952 | 2,506,114 | (918,191 | ) | 1,587,923 | |||||||||||
Evolved U.S. Financials | 4,925,773 | 311,315 | (1,120,605 | ) | (809,290 | ) | ||||||||||
Evolved U.S. Healthcare Staples | 12,971,264 | 2,437,132 | (191,495 | ) | 2,245,637 | |||||||||||
Evolved U.S. Innovative Healthcare | 19,884,119 | 2,196,145 | (662,950 | ) | 1,533,195 | |||||||||||
Evolved U.S. Media and Entertainment | 9,236,123 | 1,307,589 | (825,939 | ) | 481,650 | |||||||||||
Evolved U.S. Technology | 64,897,436 | 15,068,749 | (534,055 | ) | 14,534,694 | |||||||||||
| 8. | PRINCIPAL RISKS |
In the normal course of business, each Fund invests in securities or other instruments and may enter into certain transactions, and such activities subject the Fund to various risks, including, among others, fluctuations in the market (market risk) or failure of an issuer to meet all of its obligations. The value of securities or other instruments may also be affected by various factors, including, without limitation: (i) the general economy; (ii) the overall market as well as local, regional or global political and/or social instability; (iii) regulation, taxation or international tax treaties between various countries; or (iv) currency, interest rate or price fluctuations. Each Fund’s prospectus provides details of the risks to which the Fund is subject.
Market Risk: Market risk arises mainly from uncertainty about future values of financial instruments influenced by price, currency and interest rate movements. It represents the potential loss a fund may suffer through holding market positions in the face of market movements. A fund is exposed to market risk by its investment in equity, fixed income and/or financial derivative instruments or by its investment in underlying funds. The fair value of securities held by a fund may decline due to general market conditions, economic trends or events that are not specifically related to the issuers of the securities including local, regional or global political, social or economic instability or to factors that affect a particular industry or group of industries. Local, regional or global events such as war, acts of terrorism, the spread of infectious illness or other public
| 64 | 2020ISHARES ANNUAL REPORTTO SHAREHOLDERS |
Notes to Financial Statements (continued)
health issues, recessions, or other events could have a significant impact on the Funds and their investments. The extent of a fund’s exposure to market risk is the market value of the investments held as shown in the fund’s schedule of investments.
An outbreak of respiratory disease caused by a novel coronavirus has developed into a global pandemic and has resulted in closing borders, quarantines, disruptions to supply chains and customer activity, as well as general concern and uncertainty. The impact of this pandemic, and other global health crises that may arise in the future, could affect the economies of many nations, individual companies and the market in general in ways that cannot necessarily be foreseen at the present time. This pandemic may result in substantial market volatility and may adversely impact the prices and liquidity of a fund’s investments. The duration of this pandemic and its effects cannot be determined with certainty.
Credit Risk: Credit risk is the risk that an issuer or guarantor of debt instruments or the counterparty to a financial transaction, including derivatives contracts, repurchase agreements or loans of portfolio securities, is unable or unwilling to make timely interest and/or principal payments or to otherwise honor its obligations. BFA and its affiliates manage counterparty credit risk by entering into transactions only with counterparties that they believe have the financial resources to honor their obligations and by monitoring the financial stability of those counterparties. Financial assets, which potentially expose a fund to issuer and counterparty credit risks, consist principally of financial instruments and receivables due from counterparties. The extent of a fund’s exposure to credit and counterparty risks with respect to those financial assets is approximated by their value recorded in its statement of assets and liabilities.
Concentration Risk: A diversified portfolio, where this is appropriate and consistent with a fund’s objectives, minimizes the risk that a price change of a particular investment will have a material impact on the NAV of a fund. The investment concentrations within each Fund’s portfolio are disclosed in its schedule of investments.
When a fund concentrates its investments in securities within a single or limited number of market sectors, it assumes the risk that economic, regulatory, political and social conditions affecting such sectors may have a significant impact on the fund and could affect the income from, or the value or liquidity of, the fund’s portfolio.
LIBOR Transition Risk: The United Kingdom’s Financial Conduct Authority announced a phase out of the London Interbank Offered Rate (“LIBOR”) by the end of 2021, and it is expected that LIBOR will cease to be published after that time. The Funds may be exposed to financial instruments tied to LIBOR to determine payment obligations, financing terms, hedging strategies or investment value. The transition process away from LIBOR might lead to increased volatility and illiquidity in markets for, and reduce the effectiveness of new hedges placed against, instruments whose terms currently include LIBOR. The ultimate effect of the LIBOR transition process on the Funds is uncertain.
| 9. | CAPITAL SHARE TRANSACTIONS |
Capital shares are issued and redeemed by each Fund only in aggregations of a specified number of shares or multiples thereof (“Creation Units”) at NAV. Except when aggregated in Creation Units, shares of each Fund are not redeemable.
Transactions in capital shares were as follows:
| Year Ended 07/31/20 | Year Ended 07/31/19 | |||||||||||||||
| iShares ETF | Shares | Amount | Shares | Amount | ||||||||||||
Evolved U.S. Consumer Staples | ||||||||||||||||
Shares sold | 200,000 | $ | 5,356,261 | — | $ | — | ||||||||||
|
|
|
|
|
|
|
| |||||||||
Evolved U.S. Discretionary Spending | ||||||||||||||||
Shares sold | 300,000 | $ | 8,824,906 | — | $ | — | ||||||||||
Shares redeemed | (150,000 | ) | (4,347,317 | ) | — | — | ||||||||||
|
|
|
|
|
|
|
| |||||||||
Net increase | 150,000 | $ | 4,477,589 | — | $ | — | ||||||||||
|
|
|
|
|
|
|
| |||||||||
Evolved U.S. Healthcare Staples | ||||||||||||||||
Shares sold | 250,000 | $ | 7,330,427 | 100,000 | $ | 2,773,961 | ||||||||||
Shares redeemed | (50,000 | ) | (1,298,075 | ) | (50,000 | ) | (1,338,232 | ) | ||||||||
|
|
|
|
|
|
|
| |||||||||
Net increase | 200,000 | $ | 6,032,352 | 50,000 | $ | 1,435,729 | ||||||||||
|
|
|
|
|
|
|
| |||||||||
Evolved U.S. Innovative Healthcare | ||||||||||||||||
Shares sold | 500,000 | $ | 14,398,781 | — | $ | — | ||||||||||
|
|
|
|
|
|
|
| |||||||||
Evolved U.S. Media and Entertainment | ||||||||||||||||
Shares sold | 150,000 | $ | 3,548,987 | 50,000 | $ | 1,347,171 | ||||||||||
Shares redeemed | (50,000 | ) | (1,361,022 | ) | — | — | ||||||||||
|
|
|
|
|
|
|
| |||||||||
Net increase | 100,000 | $ | 2,187,965 | 50,000 | $ | 1,347,171 | ||||||||||
|
|
|
|
|
|
|
| |||||||||
Evolved U.S. Technology | ||||||||||||||||
Shares sold | 1,400,000 | $ | 49,763,348 | 350,000 | $ | 10,161,391 | ||||||||||
|
|
|
|
|
|
|
| |||||||||
The consideration for the purchase of Creation Units of a fund in the Trust generally consists of the in-kind deposit of a designated portfolio of securities and a specified amount of cash. Certain funds in the Trust may be offered in Creation Units solely or partially for cash in U.S. dollars. Investors purchasing and redeeming Creation Units may pay a purchase transaction fee and a redemption transaction fee directly to State Street Bank and Trust Company, the Trust’s administrator, to offset transfer and other
NOTESTO FINANCIAL STATEMENTS | 65 |
Notes to Financial Statements (continued)
transaction costs associated with the issuance and redemption of Creation Units, including Creation Units for cash. Investors transacting in Creation Units for cash may also pay an additional variable charge to compensate the relevant fund for certain transaction costs (i.e., stamp taxes, taxes on currency or other financial transactions, and brokerage costs) and market impact expenses relating to investing in portfolio securities. Such variable charges, if any, are included in shares sold in the table above.
From time to time, settlement of securities related to in-kind contributions or in-kind redemptions may be delayed. In such cases, securities related to in-kind transactions are reflected as a receivable or a payable in the statement of assets and liabilities.
| 10. | LEGAL PROCEEDINGS |
On June 16, 2016, investors in certain iShares funds (iShares Core S&P Small-Cap ETF, iShares Russell 1000 Growth ETF, iShares Core S&P 500 ETF, iShares Russell Mid-Cap Growth ETF, iShares Russell Mid-Cap ETF, iShares Russell Mid-Cap Value ETF, iShares Select Dividend ETF, iShares Morningstar Mid-Cap ETF, iShares Morningstar Large-Cap ETF, iShares U.S. Aerospace & Defense ETF and iShares Preferred and Income Securities ETF) filed a class action lawsuit against iShares Trust, BlackRock, Inc. and certain of its advisory affiliates, and certain directors/trustees and officers of the Funds (collectively, “Defendants”) in California State Court. The lawsuit alleges the Defendants violated federal securities laws by failing to adequately disclose in the prospectuses issued by the funds noted above the risks of using stop-loss orders in the event of a ‘flash crash’, such as the one that occurred on May 6, 2010. On September 18, 2017, the court issued a Statement of Decision holding that the Plaintiffs lack standing to assert their claims. On October 11, 2017, the court entered final judgment dismissing all of the Plaintiffs’ claims with prejudice. In an opinion dated January 23, 2020, the California Court of Appeal affirmed the dismissal of Plaintiffs’ claims. On March 3, 2020, plaintiffs filed a petition for review by the California Supreme Court. On May 27, 2020, the California Supreme Court denied Plaintiff’s petition for review. The case is now closed.
| 11. | SUBSEQUENT EVENTS |
Management has evaluated the impact of all subsequent events on the Funds through the date the financial statements were available to be issued and has determined that there were no subsequent events requiring adjustment or additional disclosure in the financial statements.
| 66 | 2020ISHARES ANNUAL REPORTTO SHAREHOLDERS |
Report of Independent Registered Public Accounting Firm
To the Board of Trustees of iShares U.S. ETF Trust and
Shareholders of iShares Evolved U.S. Consumer Staples ETF,
iShares Evolved U.S. Discretionary Spending ETF, iShares Evolved U.S. Financials ETF,
iShares Evolved U.S. Healthcare Staples ETF, iShares Evolved U.S. Innovative Healthcare ETF,
iShares Evolved U.S. Media and Entertainment ETF and iShares Evolved U.S. Technology ETF
Opinions on the Financial Statements
We have audited the accompanying statements of assets and liabilities, including the schedules of investments, of iShares Evolved U.S. Consumer Staples ETF, iShares Evolved U.S. Discretionary Spending ETF, iShares Evolved U.S. Financials ETF, iShares Evolved U.S. Healthcare Staples ETF, iShares Evolved U.S. Innovative Healthcare ETF, iShares Evolved U.S. Media and Entertainment ETF and iShares Evolved U.S. Technology ETF (seven of the funds constituting iShares U.S. ETF Trust, hereafter collectively referred to as the “Funds”) as of July 31, 2020, the related statements of operations for the year ended July 31, 2020, the statements of changes in net assets for each of the two years in the period ended July 31, 2020, including the related notes, and the financial highlights for each of the periods indicated therein (collectively referred to as the “financial statements”). In our opinion, the financial statements present fairly, in all material respects, the financial position of each of the Funds as of July 31, 2020, the results of each of their operations for the year then ended, the changes in each of their net assets for each of the two years in the period ended July 31, 2020 and each of the financial highlights for each of the periods indicated therein in conformity with accounting principles generally accepted in the United States of America.
Basis for Opinions
These financial statements are the responsibility of the Funds’ management. Our responsibility is to express an opinion on the Funds’ financial statements based on our audits. We are a public accounting firm registered with the Public Company Accounting Oversight Board (United States) (PCAOB) and are required to be independent with respect to the Funds in accordance with the U.S. federal securities laws and the applicable rules and regulations of the Securities and Exchange Commission and the PCAOB.
We conducted our audits of these financial statements in accordance with the standards of the PCAOB. Those standards require that we plan and perform the audit to obtain reasonable assurance about whether the financial statements are free of material misstatement, whether due to error or fraud.
Our audits included performing procedures to assess the risks of material misstatement of the financial statements, whether due to error or fraud, and performing procedures that respond to those risks. Such procedures included examining, on a test basis, evidence regarding the amounts and disclosures in the financial statements. Our audits also included evaluating the accounting principles used and significant estimates made by management, as well as evaluating the overall presentation of the financial statements. Our procedures included confirmation of securities owned as of July 31, 2020 by correspondence with the custodian, transfer agent and brokers. We believe that our audits provide a reasonable basis for our opinions.
/s/PricewaterhouseCoopers LLP
Philadelphia, Pennsylvania
September 21, 2020
We have served as the auditor of one or more BlackRock investment companies since 2000.
REPORTOF INDEPENDENT REGISTERED PUBLIC ACCOUNTING FIRM | 67 |
For corporate shareholders, the percentage of ordinary income distributions paid during the fiscal year ended July 31, 2020 that qualified for the dividends-received deduction were as follows:
| iShares ETF | Dividends-Received Deduction | |||
Evolved U.S. Consumer Staples | 100.00 | % | ||
Evolved U.S. Discretionary Spending | 100.00 | % | ||
Evolved U.S. Financials | 100.00 | % | ||
Evolved U.S. Healthcare Staples | 91.69 | % | ||
Evolved U.S. Innovative Healthcare | 88.98 | % | ||
Evolved U.S. Media and Entertainment | 95.47 | % | ||
Evolved U.S. Technology | 100.00 | % | ||
The following maximum amounts are hereby designated as qualified dividend income for individuals for the fiscal year ended July 31, 2020:
| iShares ETF | Qualified Dividend Income | |||
Evolved U.S. Consumer Staples | $ | 227,394 | ||
Evolved U.S. Discretionary Spending | 132,922 | |||
Evolved U.S. Financials | 121,879 | |||
Evolved U.S. Healthcare Staples | 117,877 | |||
Evolved U.S. Innovative Healthcare | 144,460 | |||
Evolved U.S. Media and Entertainment | 59,140 | |||
Evolved U.S. Technology | 258,484 | |||
The following maximum amounts are hereby designated as qualified business income for individuals for the fiscal year ended July 31, 2020:
| iShares ETF | Qualified Business Income | |||
Evolved U.S. Consumer Staples | $ | 212 | ||
Evolved U.S. Financials | 546 | |||
Evolved U.S. Healthcare Staples | 1,995 | |||
Evolved U.S. Media and Entertainment | 683 | |||
Evolved U.S. Technology | 625 | |||
The following distribution amounts are hereby designated for the fiscal year ended July 31, 2020:
| iShares ETF | Short-Term Capital Gain Dividends | 20% Rate Long-Term Capital Gain Dividends | ||||||
Evolved U.S. Discretionary Spending | $ | 13,440 | $ | 40,904 | ||||
Evolved U.S. Healthcare Staples | 71,622 | 1,480 | ||||||
Evolved U.S. Innovative Healthcare | 28,381 | 68,177 | ||||||
Evolved U.S. Media and Entertainment | 184,756 | 16,940 | ||||||
Evolved U.S. Technology | 15,719 | 12,785 | ||||||
| 68 | 2020ISHARES ANNUAL REPORTTO SHAREHOLDERS |
Board Review and Approval of Investment Advisory Contract
iShares Evolved U.S. Consumer Staples ETF, iShares Evolved U.S. Discretionary Spending ETF, iShares Evolved U.S. Financials ETF, iShares Evolved U.S. Healthcare Staples ETF, iShares Evolved U.S. Innovative Healthcare ETF, iShares Evolved U.S. Media And Entertainment ETF, iShares Evolved U.S. Technology ETF (each the “Fund”)
Under Section 15(c) of the Investment Company Act of 1940 (the “1940 Act”), the Trust’s Board of Trustees (the “Board”), including a majority of Board Members who are not “interested persons” of the Trust (as that term is defined in the 1940Act) (the “Independent Board Members), is required annually to consider and approve the Investment Advisory Contract between the Trust and BFA (the “Advisory Contract”) whereby the Board and its committees (composed solely of Independent Board Members) assess BlackRock’s services to the Fund, including investment management; fund accounting; administrative and shareholder services; oversight of the Fund’s service providers; risk management and oversight; legal and compliance services; and ability to meet applicable legal and regulatory requirements. The Independent Board Members requested, and BFA provided, such information as the Independent Board Members, with advice from independent counsel, deemed reasonably necessary to evaluate the Advisory Contract. At meetings on April 17, 2020 and May 19, 2020, a committee composed of all of the Independent Board Members (the “15(c) Committee”), with independent counsel, met with management and reviewed and discussed information provided in response to initial requests of the 15(c) Committee and/or its independent counsel, and requested certain additional information, which management agreed to provide. At a meeting held on June 8-10, 2020, the Board, including the Independent Board Members, reviewed the additional information provided by management in response to these requests.
After extensive discussions and deliberations, the Board, including all of the Independent Board Members, approved the continuance of the Advisory Contract for the Fund, based on a review of qualitative and quantitative information provided by BFA and their cumulative experience as Board Members. The Board noted its satisfaction with the extent and quality of information provided and its frequent interactions with management, as well as the detailed responses and other information provided by BFA. The Independent Board Members were advised by their independent counsel throughout the process, including about the legal standards applicable to their review. In approving the continuance of the Advisory Contract for the Fund, the Board, including the Independent Board Members, considered various factors, including: (i) the expenses and performance of the Fund; (ii) the nature, extent and quality of the services provided by BFA; (iii) the costs of services provided to the Fund and profits realized by BFA and its affiliates; (iv) potential economies of scale and the sharing of related benefits; (v) the fees and services provided for other comparable funds/accounts managed by BFA and its affiliates; and (vi) other benefits to BFA and/or its affiliates. The material factors, none of which was controlling, and conclusions that formed the basis for the Board, including the Independent Board Members, to approve the continuance of the Advisory Contract are discussed below.
Expenses and Performance of the Fund: The Board reviewed statistical information prepared by Broadridge Financial Solutions Inc. (“Broadridge”), an independent provider of investment company data, regarding the expense ratio components, including gross and net total expenses, fees and expenses of another fund in which the Fund invests (if applicable), and waivers/reimbursements (if applicable) of the Fund in comparison with the same information for other ETFs (including, where applicable, funds sponsored by an “at cost” service provider), objectively selected by Broadridge as comprising the Fund’s applicable peer group pursuant to Broadridge’s proprietary ETF methodology (the “Peer Group”). The Board was provided with a detailed description of the proprietary ETF methodology used by Broadridge to determine the Fund’s Peer Group. The Board noted that, due to the limitations in providing comparable funds in the Peer Group, the statistical information provided in Broadridge’s report may or may not provide meaningful direct comparisons to the Fund in all instances. The Board also noted that overall fund expenses (net of waivers and reimbursements) for the Fund were lower than the median of the overall fund expenses (net of waivers and reimbursements ) of the funds in its Peer Group, excluding iShares funds.
The Board noted that the Fund is an actively managed ETF that does not seek to track the performance of a specified index and that the management team for the Fund manages the Fund’s portfolio in accordance with its investment objective. The Board further noted that, during the year, the Board received periodic reports on the Fund’s short- and longer-term performance in comparison with its reference benchmark. Such periodic comparative performance information, including additional detailed information as requested by the Board, was also considered. The Board noted that the Fund generally performed in line with expectations relative to the Fund’s peer group (where applicable) and reference benchmark.
Based on this review, the other factors considered at the meeting, and their general knowledge of ETF pricing, the Board concluded that the investment advisory fee rate and expense level and the historical performance of the Fund supported the Board’s approval of the continuance of the Advisory Contract for the coming year.
Nature, Extent and Quality of Services Provided: Based on management’s representations, including information about recent and proposed enhancements to the iShares business, including with respect to capital markets support and analysis, technology, portfolio management, product design and quality, compliance and risk management, global public policy and other services, the Board expected that there would be no diminution in the scope of services required of or provided by BFA under the Advisory Contract for the coming year as compared with the scope of services provided by BFA during prior years. In reviewing the scope of these services, the Board considered BFA’s investment philosophy and experience, noting that BFA and its affiliates have committed significant resources over time, including during the past year, to support the iShares funds and their shareholders and have made significant investments into the iShares business. The Board also considered BFA’s compliance program and its compliance record with respect to the Fund. In that regard, the Board noted that BFA reports to the Board about portfolio management and compliance matters on a periodic basis in connection with regularly scheduled meetings of the Board, and on other occasions as necessary and appropriate, and has provided information and made relevant officers and other employees of BFA (and its affiliates) available as needed to provide further assistance with these matters. The Board also reviewed the background and experience of the persons responsible for the day-to-day management of the Fund, as well as the resources available to them in managing the Fund. In addition to the above considerations, the Board reviewed and considered detailed presentations regarding BFA’s investment performance, investment and risk management processes and strategies, which were provided at the June 8-10, 2020 meeting and throughout the year.
Based on review of this information, and the performance information discussed above, the Board concluded that the nature, extent and quality of services provided to the Fund under the Advisory Contract supported the Board’s approval of the continuance of the Advisory Contract for the coming year.
Costs of Services Provided to the Fund and Profits Realized by BFA and its Affiliates: The Board reviewed information about the estimated profitability to BlackRock in managing the Fund, based on the fees payable to BFA and its affiliates (including fees under the Advisory Contract), and other sources of revenue and expense to BFA and its affiliates from the Fund’s operations for the last calendar year. The Board reviewed BlackRock’s methodology for calculating estimated profitability of the iShares
BOARD REVIEWAND APPROVALOF INVESTMENT ADVISORY CONTRACT | 69 |
Board Review and Approval of Investment Advisory Contract (continued)
funds, noting that the 15(c) Committee and the Board had focused on the methodology and profitability presentation. The Board recognized that profitability may be affected by numerous factors including, among other things, fee waivers by BFA, the types of funds managed, expense allocations and business mix. The Board thus recognized that calculating and comparing profitability at individual fund levels is challenging. The Board discussed with management the sources of direct and ancillary revenue, including the revenues to BTC, a BlackRock affiliate, from securities lending by the Fund. The Board also discussed BFA’s estimated profit margin as reflected in the Fund’s profitability analysis and reviewed information regarding potential economies of scale (as discussed below).
Based on this review, the Board concluded that the profits realized by BFA and its affiliates under the Advisory Contract and from other relationships between the Fund and BFA and/or its affiliates, if any, were within a reasonable range in light of the factors and other information considered.
Economies of Scale: The Board reviewed information and considered the extent to which economies of scale might be realized as the assets of the Fund increase, noting that the issue of potential economies of scale had been focused on by the 15(c) Committee and the Board during their meetings and addressed by management. The 15(c) Committee and the Board received information regarding BlackRock’s historical estimated profitability, including BFA’s and its affiliates’ estimated costs in providing services. The estimated cost information distinguished, among other things, between fixed and variable costs, and showed how the level and nature of fixed and variable costs may impact the existence or size of scale benefits, with the Board recognizing that potential economies of scale are difficult to measure. The 15(c) Committee and the Board reviewed information provided by BFA regarding the sharing of scale benefits with the iShares funds through various means, including, as applicable, through relatively low fee rates established at inception, breakpoints, waivers, or other fee reductions, as well as through additional investment in the iShares business and the provision of improved or additional infrastructure and services to the iShares funds and their shareholders. The Board noted that the Advisory Contract for the Fund did not provide for breakpoints in the Fund’s investment advisory fee rate as the assets of the Fund increase. However, the Board would continue to assess the appropriateness of adding breakpoints in the future.
The Board concluded that this review of potential economies of scale and the sharing of related benefits, as well as the other factors considered at the meeting, supported the Board’s approval of the continuance of the Advisory Contract for the coming year.
Fees and Services Provided for Other Comparable Funds/Accounts Managed by BFA and its Affiliates: The Board considered information regarding the investment advisory/management fee rates for other funds/accounts in the U.S. for which BFA (or its affiliates) provides investment advisory/management services, including open-end funds registered under the 1940 Act (including sub-advised funds), collective trust funds, and institutional separate accounts (collectively, the “Other Accounts”). The Board acknowledged BFA’s representation that the iShares funds are fundamentally different investment vehicles from the Other Accounts. The Board noted that BFA and its affiliates do not manage Other Accounts with a similar investment strategy or investment mandate as the Fund. The Board further noted that BFA provided the Board with detailed information regarding how the Other Accounts generally differ from the Fund, including in terms of the types of services and generally more extensive services provided to the Fund, as well as other significant differences. In that regard, the Board considered that the pricing of services to institutional clients is typically based on a number of factors beyond the nature and extent of the specific services to be provided and often depends on the overall relationship between the client and its affiliates and the adviser and its affiliates. In addition, the Board considered the relative complexity and inherent risks and challenges of managing and providing other services to the Fund, as a publicly traded investment vehicle, as compared to the Other Accounts, particularly those that are institutional clients, in light of differing regulatory requirements and client-imposed mandates. The Board also acknowledged management’s assertion that, for certain iShares funds, and for client segmentation purposes, BlackRock has launched an iShares fund that may provide a similar investment exposure at a lower investment advisory fee rate. The Board also considered the “all-inclusive” nature of the Fund’s advisory fee structure, and the Fund’s expenses borne by BFA under this arrangement. The Board noted that the investment advisory fee rate under the Advisory Contract for the Fund was generally higher than the investment advisory/management fee rates for certain of the Other Accounts (particularly institutional clients) and concluded that the differences appeared to be consistent with the factors discussed.
Other Benefits to BFA and/or its Affiliates: The Board reviewed other benefits or ancillary revenue received by BFA and/or its affiliates in connection with the services provided to the Fund by BFA, both direct and indirect, such as payment of revenue to BTC, the Fund’s securities lending agent, for loaning portfolio securities (which was included in the profit margins reviewed by the Board pursuant to BFA’s estimated profitability methodology), payment of advisory fees or other fees to BFA (or its affiliates) in connection with any investments by the Fund in other funds for which BFA (or its affiliates) provides investment advisory services or other services and BlackRock’s profile in the investment community. The Board also noted the revenue received by BFA and/or its affiliates pursuant to an agreement that permits a service provider to use certain portions of BlackRock’s technology platform to service accounts managed by BFA and/or its affiliates, including the iShares funds. The Board noted that BFA generally does not use soft dollars or consider the value of research or other services that may be provided to BFA (including its affiliates) in selecting brokers for portfolio transactions for the Fund. The Board further noted that any portfolio transactions on behalf of the Fund placed through a BFA affiliate or purchased from an underwriting syndicate in which a BFA affiliate participates (including associated commissions) are reported to the Board pursuant to Rule 17e-1 or Rule 10f-3, as applicable, under the 1940 Act. The Board concluded that any such ancillary benefits would not be disadvantageous to the Fund and thus would not alter the Board’s conclusion with respect to the appropriateness of approving the continuance of the Advisory Contract for the coming year.
Conclusion: Based on a review of the factors described above, as well as such other factors as deemed appropriate by the Board, the Board, including all of the Independent Board Members, determined that the Fund’s investment advisory fee rate under the Advisory Contract does not constitute a fee that is so disproportionately large as to bear no reasonable relationship to the services rendered and that could not have been the product of arm’s-length bargaining, and concluded to approve the continuance of the Advisory Contract for the coming year.
| 70 | 2020ISHARES ANNUAL REPORTTO SHAREHOLDERS |
Supplemental Information (unaudited)
Section 19(a) Notices
The amounts and sources of distributions reported are estimates and are being provided pursuant to regulatory requirements and are not being provided for tax reporting purposes. The actual amounts and sources for tax reporting purposes will depend upon each fund’s investment experience during the year and may be subject to changes based on tax regulations. Shareholders will receive a Form 1099-DIV each calendar year that will inform them how to report these distributions for federal income tax purposes.
| Total Cumulative Distributions for the Fiscal Year | % Breakdown of the Total Cumulative Distributions for the Fiscal Year | |||||||||||||||||||||||||||||||
| iShares ETF | Net Investment Income | Net Realized Capital Gains | Return of Capital | Total Per Share | Net Investment Income | Net Realized Capital Gains | Return of Capital | Total Per Share | ||||||||||||||||||||||||
Evolved U.S. Consumer Staples(a) | $ | 0.617865 | $ | — | $ | 0.002296 | $ | 0.620161 | 100 | % | — | % | 0 | %(b) | 100 | % | ||||||||||||||||
Evolved U.S. Discretionary Spending(a) | 0.334038 | 0.155269 | 0.000181 | 0.489488 | 68 | 32 | 0 | (b) | 100 | |||||||||||||||||||||||
Evolved U.S. Financials(a) | 0.560778 | — | 0.000619 | 0.561397 | 100 | — | 0 | (b) | 100 | |||||||||||||||||||||||
Evolved U.S. Healthcare Staples(a) | 0.243532 | 0.243674 | 0.000430 | 0.487636 | 50 | 50 | 0 | (b) | 100 | |||||||||||||||||||||||
Evolved U.S. Innovative Healthcare | 0.376877 | 0.482790 | — | 0.859667 | 44 | 56 | — | 100 | ||||||||||||||||||||||||
Evolved U.S. Media and Entertainment(a) | 0.214483 | 1.005765 | 0.000460 | 1.220708 | 18 | 82 | 0 | (b) | 100 | |||||||||||||||||||||||
Evolved U.S. Technology(a) | 0.234635 | 0.051826 | 0.000026 | 0.286487 | 82 | 18 | 0 | (b) | 100 | |||||||||||||||||||||||
| (a) | The Fund estimates that it has distributed more than its net investment income and net realized capital gains; therefore, a portion of the distribution may be a return of capital. A return of capital may occur, for example, when some or all of the shareholder’s investment in the Fund is returned to the shareholder. A return of capital does not necessarily reflect the Fund’s investment performance and should not be confused with “yield” or “income”. When distributions exceed total return performance, the difference will incrementally reduce the Fund’s net asset value per share. |
| (b) | Rounds to less than 1%. |
Premium/Discount Information
The Premium/Discount Information section is intended to present information about the differences between the daily market price on secondary markets for shares of a fund and that fund’s NAV. NAV is the price at which a fund issues and redeems shares. It is calculated in accordance with the standard formula for valuing mutual fund shares. The “Market Price” of a fund generally is determined using the midpoint between the highest bid and the lowest ask on the primary securities exchange on which shares of such fund are listed for trading, as of the time that the fund’s NAV is calculated. A fund’s Market Price may be at, above or below its NAV. The NAV of a fund will fluctuate with changes in the value of its portfolio holdings. The Market Price of a fund will fluctuate in accordance with changes in its NAV, as well as market supply and demand.
Premiums or discounts are the differences (expressed as a percentage) between the NAV and Market Price of a fund on a given day, generally at the time the NAV is calculated. A premium is the amount that a fund is trading above the reported NAV, expressed as a percentage of the NAV. A discount is the amount that a fund is trading below the reported NAV, expressed as a percentage of the NAV.
Premium/discount information for the Funds covering the most recently completed calendar year and the most recently completed calendar quarters since that year (or since the Fund began trading, if shorter) is publicly accessible, free of charge, at iShares.com.
The following information shows the frequency of distributions of premiums and discounts for the Funds for the immediately preceding five calendar years (or from the date a Fund began trading on the secondary market, if less than five years) through the date of the most recent calendar quarter-end. Each line in each table shows the number of trading days in which the Fund traded within the premium/discount range indicated. Premium/discount ranges with no trading days are omitted. The number of trading days in each premium/discount range is also shown as a percentage of the total number of trading days in the period covered by each table. All data presented here represents past performance, which cannot be used to predict future results.
iShares Evolved U.S. Consumer Staples ETF
Period Covered: March 23, 2018 through June 30, 2020
| Premium/Discount Range | Number of Days | Percentage of Total Days | ||||||
Greater than 1.0% and Less than 1.5% | 1 | 0.17 | % | |||||
Greater than 0.0% and Less than 0.5% | 436 | 76.23 | ||||||
At NAV | 37 | 6.47 | ||||||
Less than 0.0% and Greater than –0.5% | 98 | 17.13 | ||||||
|
|
|
| |||||
| 572 | 100.00 | % | ||||||
|
|
|
| |||||
SUPPLEMENTAL INFORMATION | 71 |
Supplemental Information (unaudited) (continued)
iShares Evolved U.S. Discretionary Spending ETF
Period Covered: March 23, 2018 through June 30, 2020
| Premium/Discount Range | Number of Days | Percentage of Total Days | ||||||
Greater than 0.5% and Less than 1.0% | 1 | 0.17 | % | |||||
Greater than 0.0% and Less than 0.5% | 319 | 55.78 | ||||||
At NAV | 31 | 5.42 | ||||||
Less than 0.0% and Greater than –0.5% | 220 | 38.46 | ||||||
Less than –1.0% and Greater than –1.5% | 1 | 0.17 | ||||||
|
|
|
| |||||
| 572 | 100.00 | % | ||||||
|
|
|
| |||||
iShares Evolved U.S. Financials ETF
Period Covered: March 23, 2018 through June 30, 2020
| Premium/Discount Range | Number of Days | Percentage of Total Days | ||||||
Greater than 2.0% and Less than 2.5% | 1 | 0.17 | % | |||||
Greater than 0.0% and Less than 0.5% | 382 | 66.79 | ||||||
At NAV | 52 | 9.09 | ||||||
Less than 0.0% and Greater than –0.5% | 137 | 23.95 | ||||||
|
|
|
| |||||
| 572 | 100.00 | % | ||||||
|
|
|
| |||||
iShares Evolved U.S. Healthcare Staples ETF
Period Covered: March 23, 2018 through June 30, 2020
| Premium/Discount Range | Number of Days | Percentage of Total Days | ||||||
Greater than 2.5% and Less than 3.0% | 1 | 0.17 | % | |||||
Greater than 2.0% and Less than 2.5% | 1 | 0.17 | ||||||
Greater than 0.0% and Less than 0.5% | 327 | 57.18 | ||||||
At NAV | 41 | 7.17 | ||||||
Less than 0.0% and Greater than –0.5% | 202 | 35.31 | ||||||
|
|
|
| |||||
| 572 | 100.00 | % | ||||||
|
|
|
| |||||
iShares Evolved U.S. Innovative Healthcare ETF
Period Covered: March 23, 2018 through June 30, 2020
| Premium/Discount Range | Number of Days | Percentage of Total Days | ||||||
Greater than 0.0% and Less than 0.5% | 342 | 59.79 | % | |||||
At NAV | 62 | 10.84 | ||||||
Less than 0.0% and Greater than –0.5% | 168 | 29.37 | ||||||
|
|
|
| |||||
| 572 | 100.00 | % | ||||||
|
|
|
| |||||
iShares Evolved U.S. Media and Entertainment ETF
Period Covered: March 23, 2018 through June 30, 2020
| Premium/Discount Range | Number of Days | Percentage of Total Days | ||||||
Greater than 0.0% and Less than 0.5% | 316 | 55.25 | % | |||||
At NAV | 61 | 10.66 | ||||||
Less than 0.0% and Greater than –0.5% | 195 | 34.09 | ||||||
|
|
|
| |||||
| 572 | 100.00 | % | ||||||
|
|
|
| |||||
| 72 | 2020ISHARES ANNUAL REPORTTO SHAREHOLDERS |
Supplemental Information (unaudited) (continued)
iShares Evolved U.S. Technology ETF
Period Covered: March 23, 2018 through June 30, 2020
| Premium/Discount Range | Number of Days | Percentage of Total Days | ||||||
Greater than 1.0% and Less than 1.5% | 1 | 0.17 | % | |||||
Greater than 0.5% and Less than 1.0% | 1 | 0.17 | ||||||
Greater than 0.0% and Less than 0.5% | 485 | 84.80 | ||||||
At NAV | 22 | 3.85 | ||||||
Less than 0.0% and Greater than –0.5% | 63 | 11.01 | ||||||
|
|
|
| |||||
| 572 | 100.00 | % | ||||||
|
|
|
| |||||
SUPPLEMENTAL INFORMATION | 73 |
Trustee and Officer Information
The Board of Trustees has responsibility for the overall management and operations of the Funds, including general supervision of the duties performed by BFA and other service providers. Each Trustee serves until he or she resigns, is removed, dies, retires or becomes incapacitated. The President, Chief Compliance Officer, Treasurer and Secretary shall each hold office until their successors are chosen and qualify, and all other officers shall hold office until he or she resigns or is removed. Trustees who are not “interested persons” (as defined in the 1940 Act) of the Trust are referred to as independent trustees (“Independent Trustees”).
The registered investment companies advised by BFA or its affiliates (the “BlackRock-advised Funds”) are organized into one complex of open-end equity, multi-asset, index and money market funds (the “BlackRock Multi-Asset Complex”), one complex of closed-end funds and open-end non-index fixed-income funds (the “BlackRock Fixed-Income Complex”) and one complex of ETFs (“Exchange-Traded Fund Complex”) (each, a “BlackRock Fund Complex”). Each Fund is included in the BlackRock Fund Complex referred to as the Exchange-Traded Fund Complex. Each Trustee also serves as a Director of iShares, Inc. and a Trustee of iShares Trust, and, as a result, oversees all of the funds within the Exchange-Traded Fund Complex, which consists of 374 funds as of July 31, 2020. With the exception of Robert S. Kapito, Salim Ramji and Charles Park, the address of each Trustee and officer is c/o BlackRock, Inc., 400 Howard Street, San Francisco, CA 94105. The address of Mr. Kapito, Mr. Ramji and Mr. Park is c/o BlackRock, Inc., Park Avenue Plaza, 55 East 52nd Street, New York, NY 10055. The Board has designated Cecilia H. Herbert as its Independent Board Chair. Additional information about the Funds’ Trustees and officers may be found in the Funds’ combined Statement of Additional Information, which is available without charge, upon request, by calling toll-free 1-800-iShares (1-800-474-2737).
| Interested Trustees | ||||||
| Name (Age) | Position(s) | Principal Occupation(s) During the Past 5 Years | Other Directorships Held by Trustee | |||
| Robert S. Kapito(a) (63) | Trustee (since 2011). | President, BlackRock, Inc. (since 2006); Vice Chairman of BlackRock, Inc. and Head of BlackRock’s Portfolio Management Group (since its formation in 1998) and BlackRock, Inc.’s predecessor entities (since 1988); Trustee, University of Pennsylvania (since 2009); President of Board of Directors, Hope & Heroes Children’s Cancer Fund (since 2002). | Director of BlackRock, Inc. (since 2006); Director of iShares, Inc. (since 2009); Trustee of iShares Trust (since 2009). | |||
| Salim Ramji(b) (50) | Trustee (since 2019). | Senior Managing Director, BlackRock, Inc. (since 2014); Global Head of BlackRock’s ETF and Index Investments Business (since 2019); Head of BlackRock’s U.S. Wealth Advisory Business (2015-2019); Global Head of Corporate Strategy, BlackRock, Inc. (2014-2015); Senior Partner, McKinsey & Company (2010-2014). | Director of iShares, Inc. (since 2019); Trustee of iShares Trust (since 2019). | |||
(a) Robert S. Kapito is deemed to be an “interested person” (as defined in the 1940 Act) of the Trust due to his affiliations with BlackRock, Inc. and its affiliates. (b) Salim Ramji is deemed to be an “interested person” (as defined in the 1940 Act) of the Trust due to his affiliations with BlackRock, Inc. and its affiliates. | ||||||
| Independent Trustees | ||||||
| Name (Age) | Position(s) | Principal Occupation(s) During the Past 5 Years | Other Directorships Held by Trustee | |||
| Cecilia H. Herbert (71) | Trustee (since 2011); Independent Board Chair (since 2016). | Chair of the Finance Committee (since 2019) and Trustee and Member of the Finance, Audit and Quality Committees of Stanford Health Care (since 2016); Trustee of WNET, New York’s public media company (since 2011) and Member of the Audit Committee (since 2018) and Investment Committee (since 2011); Chair (1994-2005) and Member (since 1992) of the Investment Committee, Archdiocese of San Francisco; Trustee of Forward Funds (14 portfolios) (2009-2018); Trustee of Salient MF Trust (4 portfolios) (2015-2018); Director (1998-2013) and President (2007-2011) of the Board of Directors, Catholic Charities CYO; Trustee (2002-2011) and Chair of the Finance and Investment Committee (2006-2010) of the Thacher School. | Director of iShares, Inc. (since 2005); Trustee of iShares Trust (since 2005); Independent Board Chair of iShares, Inc. and iShares Trust (since 2016); Trustee of Thrivent Church Loan and Income Fund (since 2019). | |||
| Jane D. Carlin (64) | Trustee (since 2015); Risk Committee Chair (since 2016). | Consultant (since 2012); Member of the Audit Committee (2012-2018), Chair of the Nominating and Governance Committee (2017-2018) and Director of PHH Corporation (mortgage solutions) (2012-2018); Managing Director and Global Head of Financial Holding Company Governance & Assurance and the Global Head of Operational Risk Management of Morgan Stanley (2006-2012). | Director of iShares, Inc. (since 2015); Trustee of iShares Trust (since 2015); Member of the Audit Committee (since 2016) and Director of The Hanover Insurance Group, Inc. (since (2016). | |||
| Richard L. Fagnani (65) | Trustee (since 2017); Audit Committee Chair (since 2019). | Partner, KPMG LLP (2002-2016). | Director of iShares, Inc. (since 2017); Trustee of iShares Trust (since 2017). | |||
| 74 | 2020ISHARES ANNUAL REPORTTO SHAREHOLDERS |
Trustee and Officer Information (continued)
| Independent Trustees (continued) | ||||||
| Name (Age) | Position(s) | Principal Occupation(s) During the Past 5 Years | Other Directorships Held by Trustee | |||
| John E. Kerrigan (65) | Trustee (since 2011); Nominating and Governance and Equity Plus Committee Chairs (since 2019). | Chief Investment Officer, Santa Clara University (since 2002). | Director of iShares, Inc. (since 2005); Trustee of iShares Trust (since 2005). | |||
| Drew E. Lawton (61) | Trustee (since 2017); 15(c) Committee Chair (since 2017). | Senior Managing Director of New York Life Insurance Company (2010-2015). | Director of iShares, Inc. (since 2017); Trustee of iShares Trust (since 2017). | |||
| John E. Martinez (59) | Trustee (since 2011); Securities Lending Committee Chair (since 2019). | Director of Real Estate Equity Exchange, Inc. (since 2005); Director of Cloudera Foundation (since 2017); and Director of Reading Partners (2012-2016). | Director of iShares, Inc. (since 2003); Trustee of iShares Trust (since 2003). | |||
| Madhav V. Rajan (55) | Trustee (since 2011); Fixed Income Plus Committee Chair (since 2019). | Dean, and George Pratt Shultz Professor of Accounting, University of Chicago Booth School of Business (since 2017); Robert K. Jaedicke Professor of Accounting, Stanford University Graduate School of Business (2001-2017); Professor of Law (by courtesy), Stanford Law School (2005-2017); Senior Associate Dean for Academic Affairs and Head of MBA Program, Stanford University Graduate School of Business (2010-2016). | Director of iShares, Inc. (since 2011); Trustee of iShares Trust (since 2011). | |||
| Officers | ||||
| Name (Age) | Position(s) | Principal Occupation(s) During the Past 5 Years | ||
| Armando Senra (49) | President (since 2019). | Managing Director, BlackRock, Inc. (since 2007); Head of U.S., Canada and Latam iShares, BlackRock, Inc. (since 2019); Head of Latin America Region, BlackRock, Inc. (2006-2019); Managing Director, Bank of America Merrill Lynch (1994-2006). | ||
| Trent Walker (46) | Treasurer and Chief Financial Officer (since 2020). | Managing Director, BlackRock, Inc. (since September 2019); Executive Vice President of PIMCO (2016-2019); Senior Vice President of PIMCO (2008-2015); Treasurer (2013-2019) and Assistant Treasurer (2007-2017) of PIMCO Funds, PIMCO Variable Insurance Trust, PIMCO ETF Trust, PIMCO Equity Series, PIMCO Equity Series VIT, PIMCO Managed Accounts Trust, 2 PIMCO-sponsored interval funds and 21 PIMCO-sponsored closed-end funds. | ||
| Charles Park (52) | Chief Compliance Officer (since 2011). | Chief Compliance Officer of BlackRock Advisors, LLC and the BlackRock-advised Funds in the BlackRock Multi-Asset Complex and the BlackRock Fixed-Income Complex (since 2014); Chief Compliance Officer of BFA (since 2006). | ||
| Deepa Damre (45) | Secretary (since 2019). | Managing Director, BlackRock, Inc. (since 2014); Director, BlackRock, Inc. (2009-2013). | ||
| Scott Radell (51) | Executive Vice President (since 2012). | Managing Director, BlackRock, Inc. (since 2009); Head of Portfolio Solutions, BlackRock, Inc. (since 2009). | ||
| Alan Mason (59) | Executive Vice President (since 2016). | Managing Director, BlackRock, Inc. (since 2009). | ||
| Marybeth Leithead (57) | Executive Vice President (since 2019). | Managing Director, BlackRock, Inc. (since 2017); Chief Operating Officer of Americas iShares (since 2017); Portfolio Manager, Municipal Institutional & Wealth Management (2009-2016). | ||
TRUSTEEAND OFFICER INFORMATION | 75 |
Electronic Delivery
Shareholders can sign up for email notifications announcing that the shareholder report or prospectus has been posted on the iShares website at iShares.com. Once you have enrolled, you will no longer receive prospectuses and shareholder reports in the mail.
To enroll in electronic delivery:
| • | Go to icsdelivery.com. |
| • | If your brokerage firm is not listed, electronic delivery may not be available. Please contact your broker-dealer or financial advisor. |
Householding
Householding is an option available to certain fund investors. Householding is a method of delivery, based on the preference of the individual investor, in which a single copy of certain shareholder documents can be delivered to investors who share the same address, even if their accounts are registered under different names. Please contact your broker-dealer if you are interested in enrolling in householding and receiving a single copy of prospectuses and other shareholder documents, or if you are currently enrolled in householding and wish to change your householding status.
Availability of Quarterly Schedule of Investments
The iShares Funds file their complete schedule of portfolio holdings with the SEC for the first and third quarters of each fiscal year as an exhibit to its reports on Form N-PORT, and for reporting periods ended prior to March 31, 2019, filed such information on Form N-Q. The iShares Funds’ Forms N-Q are available on the SEC’s website at sec.gov. The iShares Funds also disclose their complete schedule of portfolio holdings on a daily basis on the iShares website at iShares.com.
Availability of Proxy Voting Policies and Proxy Voting Records
A description of the policies and procedures that the iShares Funds use to determine how to vote proxies relating to portfolio securities and information about how the iShares Funds voted proxies relating to portfolio securities during the most recent twelve-month period ending June 30 is available without charge, upon request (1) by calling toll-free 1-800-474-2737; (2) on the iShares website at iShares.com; and (3) on the SEC website at sec.gov.
| 76 | 2020ISHARES ANNUAL REPORTTO SHAREHOLDERS |
Glossary of Terms Used in this Report
| Portfolio Abbreviations — Equity | ||
| NVS | Non-Voting Shares | |
GLOSSARYOF TERMS USEDINTHIS REPORT | 77 |
Want to know more?
iShares.com | 1-800-474-2737
This report is intended for the Funds’ shareholders. It may not be distributed to prospective investors unless it is preceded or accompanied by the current prospectus.
Investing involves risk, including possible loss of principal.
The iShares Funds are distributed by BlackRock Investments, LLC (together with its affiliates, “BlackRock”).
©2020 BlackRock, Inc. All rights reserved. iSHARES and BLACKROCK are registered trademarks of BlackRock, Inc. or its subsidiaries. All other marks are the property of their respective owners.
iS-AR-715-0720
|  |
The registrant has adopted a code of ethics, as of the end of the period covered by this report, applicable to the registrant’s principal executive officer, principal financial officer, principal accounting officer or controller, or persons performing similar functions. During the period covered by this report, the code of ethics was amended to clarify an inconsistency in to whom persons covered by the code should report suspected violations of the code. The amendment clarifies that such reporting should be made to BlackRock’s General Counsel, and retains the alternative option of anonymous reporting following “whistleblower” policies. Other non-material changes were also made in connection with this amendment. During the period covered by this report, there have been no waivers granted under the code of ethics. The registrant undertakes to provide a copy of the code of ethics to any person upon request, without charge, by calling 1-800-474-2737.
Item 3. Audit Committee Financial Expert.
The registrant’s Board of Trustees has determined that the registrant has more than one audit committee financial expert, as that term is defined under Item 3(b) and 3(c), serving on its audit committee. The audit committee financial experts serving on the registrant’s audit committee are Richard L. Fagnani, John E. Kerrigan, and Madhav V. Rajan, all of whom are independent, as that term is defined under Item 3(a)(2).
Item 4. Principal Accountant Fees and Services.
The principal accountant fees disclosed in items 4(a), 4(b), 4(c), 4(d) and 4(g) are for the seven series of the registrant for which the fiscal year-end is July 31, 2020 (the “Funds”), and whose annual financial statements are reported in Item 1.
| (a) | Audit Fees – The aggregate fees billed for each of the last two fiscal years for professional services rendered by the principal accountant for the audit of the Funds’ annual financial statements or services that are normally provided by the accountant in connection with statutory and regulatory filings or engagements for those fiscal years were $88,900 for the fiscal year ended July 31, 2019 and $88,900 for the fiscal year ended July 31, 2020. |
| (b) | Audit-Related Fees – There were no fees billed for the fiscal years ended July 31, 2019 and July 31, 2020 for assurance and related services by the principal accountant that were reasonably related to the performance of the audit of the Fund’s financial statements and are not reported under (a) of this Item. |
| (c) | Tax Fees – The aggregate fees billed in each of the last two fiscal years for professional services rendered by the principal accountant for tax compliance, tax advice and tax planning for the Funds were $26,467 for the fiscal year ended July 31, 2019 and $26,467 for the fiscal year ended July 31, 2020. These services related to the review of the Funds’ tax returns and excise tax calculations. |
| (d) | All Other Fees – There were no other fees billed in each of the fiscal years ended July 31, 2019 and July 31, 2020 for products and services provided by the principal accountant, other than the services reported in (a) through (c) of this Item. |
| (e) | (1) The registrant’s audit committee charter, as amended, provides that the audit committee is responsible for the approval, prior to appointment, of the engagement of the principal accountant to annually audit and provide their opinion on the registrant’s financial statements. The audit committee must also approve, prior to appointment, the engagement of the principal accountant to provide non-audit services to the registrant or to any entity controlling, controlled by or under common control with the registrant’s investment adviser (“Adviser Affiliate”) that provides ongoing services to the registrant, if the engagement relates directly to the operations and financial reporting of the registrant. |
(2) There were no services described in (b) through (d) above that were approved by the audit committee pursuant to paragraph (c)(7)(i)(C) of Rule 2-01 of Regulation S-X. |
| (f) | None of the hours expended on the principal accountant’s engagement to audit the Funds’ financial statements for the fiscal year ended July 31, 2020 were attributable to work performed by persons other than the principal accountant’s full-time, permanent employees. |
| (g) | The aggregate non-audit fees billed by the registrant’s principal accountant for services rendered to the Funds, and rendered to the registrant’s investment adviser, and any Adviser Affiliate that provides ongoing services to the registrant for the last two fiscal years were $26,467 for the fiscal year ended July 31, 2019 and $26,467 for the fiscal year ended July 31, 2020. |
| (h) | The registrant’s audit committee has considered whether the provision of non-audit services rendered to the registrant’s investment adviser and any Adviser Affiliate that provides ongoing services to the registrant that were not pre-approved pursuant to paragraph (c)(7)(ii) of Rule 2-01 of Regulation S-X, if any, is compatible with maintaining the principal accountant’s independence, and has determined that the provision of these services, if any, does not compromise the principal accountant’s independence. |
Item 5. Audit Committee of Listed Registrants
(a) The registrant is a listed issuer as defined in Rule 10A-3 under the Exchange Act of 1934 and has a separately-designated standing audit committee established in accordance with Section 3(a)(58)(A) of the Exchange Act of 1934. The registrant’s audit committee members are Richard L. Fagnani, John E. Kerrigan, and Madhav V. Rajan.
(b) Not applicable.
Item 6. Investments.
(a) Schedules of investments are included as part of the reports to shareholders filed under Item 1 of this Form.
(b) Not applicable.
Item 7. Disclosure of Proxy Voting Policies and Procedures for Closed-End Management Investment Companies.
Not applicable to the registrant.
Item 8. Portfolio Managers of Closed-End Management Investment Companies.
Not applicable to the registrant.
Item 9. Purchases of Equity Securities by Closed-End Management Investment Company and Affiliated Purchasers.
Not applicable to the registrant.
Item 10. Submission of Matters to a Vote of Security Holders.
There were no material changes to the procedures by which shareholders may recommend nominees to the registrant’s Board of Trustees.
Item 11. Controls and Procedures.
(a) The President (the registrant’s Principal Executive Officer) and Treasurer and Chief Financial Officer (the registrant’s Principal Financial Officer) have concluded that the registrant’s disclosure controls and procedures (as defined in Rule 30a-3(c) under the Investment Company Act of 1940) are effective as of a date within 90 days of the filing date of this report, based on their evaluation of these controls and procedures required by Rule 30a-3(b) under the Investment Company Act of 1940 and Rules 13a-15(b) or 15d-15(b) under the Exchange Act of 1934.
(b) There were no changes in the registrant’s internal control over financial reporting (as defined in Rule 30a-3(d) under the Investment Company Act of 1940) that occurred during the period covered by this report that have materially affected, or are reasonably likely to materially affect, the registrant’s internal control over financial reporting.
Item 12. Disclosure of Securities Lending Activities for Closed-End Management Investment Companies.
Not applicable to the registrant.
| Item 13. | Exhibits. |
(a) (1) Code of Ethics is not filed as an exhibit; please refer to Item 2.
(a) (2) Section 302 Certifications are attached.
(a) (3) Not applicable.
(a) (4) Not applicable.
(b) Section 906 Certifications are attached.
SIGNATURES
Pursuant to the requirements of the Securities Exchange Act of 1934 and the Investment Company Act of 1940, the registrant has duly caused this report to be signed on its behalf by the undersigned, thereunto duly authorized.
| iShares U.S. ETF Trust | ||
| By: /s/ Armando Senra | ||
| Armando Senra, President (Principal Executive Officer) | ||
Date: October 5, 2020 | ||
Pursuant to the requirements of the Securities Exchange Act of 1934 and the Investment Company Act of 1940, this report has been signed below by the following persons on behalf of the registrant and in the capacities and on the dates indicated.
By: /s/ Armando Senra
Armando Senra, President (Principal Executive Officer)
Date: October 5, 2020
By: /s/ Trent Walker
Trent Walker, Treasurer and Chief Financial Officer (Principal Financial Officer)
Date: October 5, 2020