UNITED STATES
SECURITIES AND EXCHANGE COMMISSION
WASHINGTON, D.C. 20549
CERTIFIED SHAREHOLDER REPORT OF REGISTERED
MANAGEMENT INVESTMENT COMPANIES
| Investment Company Act file number: | 811-02474 |
| | |
Midas Perpetual Portfolio, Inc.
(Exact name of registrant as specified in charter)
11 Hanover Square, New York, NY 10005
(Address of principal executive offices) (Zipcode)
John F. Ramírez, Esq.
11 Hanover Square
New York, NY 10005
(Name and address of agent for service)
Registrant's telephone number, including area code: 1-212-480-6432
Date of fiscal year end: 12/31
Date of reporting period: 1/1/12 - 6/30/12
Form N-CSRS is to be used by management investment companies to file reports with the Commission not later than 10 days after the transmission to stockholders of any report that is required to be transmitted to stockholders under Rule 30e-1 under the Investment Company Act of 1940 (17 CFR 270.30e-1). The Commission may use the information provided on Form N-CSRS in its regulatory, disclosure review, inspection, and policy making roles.
A registrant is required to disclose the information specified by Form N-CSRS and the Commission will make this information public. A registrant is not required to respond to the collection of information contained in Form N-CSRS unless the Form displays a current valid Office of Management and Budget ("OMB") control number. Please direct comments concerning the accuracy of the information collection burden estimate and any suggestions for reducing the burden to Secretary, Securities and Exchange Commission, 450 Fifth Street, NW, Washington, DC 20549-0609. The OMB has reviewed this collection of information under clearance requirements of 44 U.S.C. sec. 3507.
Item 1. Report to Stockholders.

| We believe that a quality investing |
| approach can provide an important |
| advantage in volatile markets. |
| |
| We also believe that personal |
| investment planning can be successful |
| by following three simple rules. |
| |
Follow a regular monthly |
| investment plan. |
| |
Manage your investment |
| risk by diversifying among |
| the three Midas Funds. |
| |
Commit to a long term |
| investing approach. |
| MIDAS Fund | MIDAS Magic | MIDAS Perpetual Portfolio |
(Ticker: MIDSX) | (Ticker: MISEX) | (Ticker: MPERX) |
| Seeks capital appreciation and protection against inflation and, secondarily, current income through investments primarily in precious metals and natural resource companies and gold, silver, and platinum bullion. | Seeks capital appreciation by investing in any security type in any industry sector and in domestic and foreign companies of any size. | Seeks to preserve and increase the purchasing power value of its shares over the long term by investing in gold, silver, Swiss franc assets, hard asset securities, and large capitalization growth stocks. |
June 30 | 2012 SEMI-ANNUAL REPORT |
| | CONTENTS | |
| LETTER TO OUR SHAREHOLDERS | |
| | PORTFOLIO COMMENTARY | |
| Midas Fund | 1 |
| | Midas Magic | 2 |
| | Midas Perpetual Portfolio | 3 |
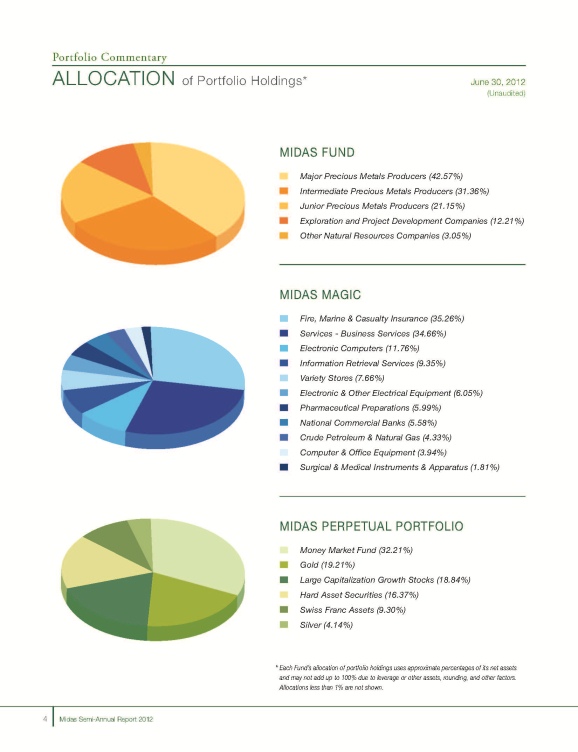
| | Allocation of Portfolio Holdings | 4 |
| | About Your Fund’s Expenses | 5 |
| FINANCIAL STATEMENTS | |
| | Schedule of Portfolio Investments | |
| | Midas Fund | 6 |
| | Midas Magic | 8 |
| | Midas Perpetual Portfolio | 10 |
| | Statements of Assets and Liabilities | 13 |
| | Statements of Operations | 14 |
| | Statements of Changes in Net Assets | 15 |
| | Statements of Cash Flows | 16 |
| | Notes to Financial Statements | 17 |
| | Financial Highlights | 26 |
| SUPPLEMENTAL INFORMATION | |
| | Board Approval of Agreements | 28 |
| | Additional Information | 31 |
| OPENING YOUR ACCOUNT | |
| | New Account Application Instructions | 32 |
| | New Account Application | 33 |
To Our Shareholders
Will the United States plunge off a “fiscal cliff?” The “fiscal cliff” is what Federal Reserve Board Chairman Ben Bernanke has called the concurrence of fiscal events after the 2012 elections, specifically the expiration of the Bush era and payroll tax cuts, the federal spending cuts mandated by the “sequester,” and hitting the debt ceiling. Should these events occur, taxes will increase and government spending will decline. The net effect will be a recession, according to many economists.
Should the fiscal cliff cause investors to be fearful? Warren Buffett, one of the world’s great investors, mentioned “fear” six times in explaining investor interest in gold in his letter to shareholders of Berkshire Hathaway published this year, as compared to zero mentions of “fear” last year. More importantly, however, in the year before last, he wrote “We’ve put a lot of money to work during the chaos of the last two years. It’s been an ideal period for investors: A climate of fear is their best friend.”
Economic uncertainty, market volatility, and the future should concern investors. But, with a long term plan investors can get started today to seek important future financial goals, such as paying for college tuition or retirement.
Sound Long Term Planning
At Midas, we believe that sound planning has three components: regular investing, diversification, and a long term view.
With regard to regular investing, Midas offers an excellent and convenient service - the Midas Bank Transfer Plan. With this Plan, you decide today to invest a certain amount each month in the future for as long as you like and Midas will transfer the money from your bank account for investment in your designated Midas account. Investing the same amount regularly, can reduce anxiety over investing in a rising or falling market or buying all of your shares at market highs. Although this strategy cannot assure a profit or protect against loss in a declining market, it can result in a lower average cost for your purchases. Of course, you should consider your ability to continue your purchases through periods of low price levels before undertaking such a strategy.
To help our investors achieve diversification, Midas offers three funds with differing investment objectives and policies. Midas Fund seeks primarily capital appreciation and protection against inflation and, secondarily, current income through investments primarily in precious metals and natural resource companies and gold, silver, and platinum bullion. Midas Perpetual Portfolio seeks to preserve and increase the purchasing power value of its shares with a target asset allocation strategy that includes gold and silver, Swiss franc assets, hard asset securities, and large cap growth stocks. Midas Magic seeks capital appreciation by investing in any security type in any industry and in companies of any size.
A long term view, instead of a reacting to every new economic development, can be strengthened by the Midas quality approach to investing, and using tax advantaged retirement accounts such as the Midas Traditional, Roth, SEP, and SIMPLE IRA. Forms for all of these accounts may be found at www.MidasFunds.com.
Announcement
I am sad to announce that my father, Bassett S. Winmill, a Midas founder and member of the Midas Investment Policy Committee, died on May 15, 2012 at the age of 82. Bassett had seen many periods of investor fear, as well as complacency, over his long career as an investing professional and so I think he would have been amused by the recent quip: “We have nothing to fear but the lack of fear itself.” As one who had been through many stock market panics, and subsequent recoveries, he well knew that fear can be an investor’s best friend, but only if the investor is prepared to discover opportunities during the fearful period with a long term, quality approach.
To learn more about the Midas philosophy of quality investing for the long term, please call us at 1-800-400-MIDAS (6432), or visit www.MidasFunds.com. Thank you for investing with Midas!
Sincerely,
Thomas B. Winmill
President
MIDAS Fund
We are pleased to welcome our new shareholders attracted to Midas Fund by its policy of investing primarily in securities of companies principally involved in mining, processing, distributing or otherwise dealing in gold, silver, platinum, or other natural resources, and its attractive suite of shareholder services.
Market Review
In the first half of 2012, gold prices based on the London p.m. fix fluctuated between $1,531 and $1,781 per ounce, ending the period at $1,598. In view of the stresses confronting the global economy, gold was expected to perform well but instead its average price of $1,649 in the period was about 2.6% less than in the second half of 2011. So what happened to gold’s role as a safe haven and as an “alternative currency?” We believe the answer may be that gold was treated in the period as a simple commodity, and commodities had a dismal showing in the first six months of 2012. For example, silver (with its large industrial commodity use) declined nearly 2%, aluminum and nickel dropped over 8% and 11%, respectively, and crude oil fell more than 15%. At the same time, metals and mining company shares suffered a searing bear market, with the NYSE ARCA Gold BUGS Index down over 18% in the six month ending June 30, 2012.
Strategies Focusing on Quality
In this market environment, Midas Fund re-emphasized quality gold mining companies with cash flow producing assets and growth. As the economic and market malaise intensified, the Fund sold off shares of companies developing projects and likely in need of additional capital, inasmuch as financial markets are effectively closed to such miners except at typically very expensive terms. Notwithstanding the Fund’s efforts, however, the returns of the Fund were negatively impacted by its holding of companies whose financial and production performance fell short of market expectations, as well as those subject to dramatically heightened political risk, leaving the Fund with a negative total return of (34.17)% in the period. The Fund’s strategy in the second half of the year will be to increase its investments in primarily gold producing mining companies as markets recover emphasizing larger companies with operations generating strong cash flow, expanding growth profiles, less perceived political risk, and/or other special features.
Outlook for Gold With Growth
Deflationary pressures, a slowing economy, and other economic factors may result in most commodities languishing for the indefinite future. Likewise, slowing industrial growth, difficult credit conditions, and higher oil prices may result in an economic environment with a “stagflationary” feel, meaning a combination of high unemployment (stagnation) while prices rise (inflation). With respect to gold, however, it might be recalled that in 2011, the gold price fell 19% from its high and U.S. Treasuries rallied on the second Greek bailout crisis, but then gold rose about 15% in the first three months of 2012. Currently, major gold mining companies appear to offer great value on a historical basis, not unlike during the depths of the 2008 market crash, in terms of price to cash flow, price to net asset value, and similar measures. By seeking quality investments with growth potential, we seek to address the risks and volatility inherent in the sector yet position Midas Fund and its shareholders to benefit from potentially rebounding financial markets and precious metals prices.
TOP10 HOLDINGS |
| | As of June 30, 2012 |
| 1 | Goldcorp Inc. |
| 2 | Newmont Mining Corp. |
| 3 | Eldorado Gold Corp. Ltd. |
| 4 | AngloGold Ashanti Ltd. ADR |
| 5 | Alamos Gold Inc. |
| 6 | Avocet Mining PLC |
| 7 | Randgold Resources Ltd. ADR |
| 8 | Kinross Gold Corp. |
| 9 | IAMGOLD Corp. |
| 10 | Newcrest Mining, Ltd. |
| Top Ten Holdings comprise approximately 68% of total assets. |
MIDAS Magic
We are pleased to submit this 2012 Semi-Annual Report for the Fund and to update shareholders on the Fund’s strategy of investing in any security type and in any industry sector, in domestic or foreign companies, and in companies of any size to seek its investment objective. We note that the Fund also may invest defensively, as well as employ speculative investment techniques such as borrowing money for investment purposes, a practice known as leveraging.
Economic and Market Report
According to the U.S. Federal Reserve, midway through the 2012 year economic activity in the United States was expanding at a somewhat more modest pace than earlier in the year. U.S. real gross domestic product increased at an annual rate of 1.5% in the second quarter of 2012, as compared to a 2% rate in the first quarter. Likewise, improvements in labor market conditions slowed since the beginning of the year, and the unemployment rate remained elevated at 8.2%. Consumer price inflation rates declined steadily in the first half, from approximately 2.9% in January to a 1.7% rate in June, primarily reflecting reductions in the prices of crude oil and gasoline.
Investment Strategy and Returns
In view of these mildly declining economic conditions, the Fund’s strategy was to invest in quality companies with unique combinations of strength in operations, products, and finances with growth or value characteristics. The Fund maintained a disciplined but aggressively leveraged investment posture, and concentrated its portfolio in large capitalization companies with attractive valuations. At June 30, 2012, the Fund’s portfolio consisted of 12 securities, and the top ten holdings comprised approximately 98% of total assets, including some of the largest and best known U.S. companies with global operations in finance, technology, insurance, and banking. At June 30, 2012, the Fund’s investment portfolio totaled approximately $15.6 million, reflecting the use of $3.2 million of leverage on net assets of $12.4 million. These holdings and allocations are subject to change at any time.
Over the first half of 2012, the Fund’s total return was 9.63%, including the reinvestment of dividends, compared to the S&P 500 Index return of 9.49%. Our current view of financial markets suggests that the Fund may benefit during the remainder of 2012 from its flexible portfolio approach, investing opportunistically, and employing aggressive and speculative investment techniques as deemed appropriate.
|
| | As of June 30, 2012 |
| 1 | Berkshire Hathaway, Inc. Class B |
| 2 | MasterCard, Inc. |
| 3 | Apple Inc. |
| 4 | Google Inc. |
| 5 | Costco Wholesale Corp. |
| 6 | General Electric Company |
| 7 | Johnson & Johnson |
| 8 | JPMorgan Chase & Co. |
| 9 | Canadian Natural Resources Ltd. |
| 10 | International Business Machines Corporation |
| Top Ten Holdings comprise approximately 98% of total assets. |
Fund Portfolio Management Changes
The Investment Policy Committee has assumed the portfolio management of the Fund from Bassett Winmill, who passed away on May 15, 2012. Midas Management Corporation, the Fund’s Investment Manager, welcomes Mark C. Winmill to the Investment Policy Committee as Chief Investment Strategist. Continuing members of the Committee are Thomas Winmill, Chairman,
John F. Ramirez, Director of Fixed Income, and Irene Kawczynski, Vice President-Trading.
Contact Us for Information and Services
Midas Magic’s solid approach to quality companies makes it an attractive vehicle for a program of long term investing. For retirement, medical, and tuition financial planning goals, consider the Midas Traditional, Roth, SEP, or SIMPLE IRA, the Midas Health Savings Account, as well as the Midas Education Savings Account. Forms for all of these tax advantaged plans may be found at www.MidasFunds.com.
Portfolio Commentary
MIDAS Perpetual Portfolio
We are delighted to welcome our new shareholders who have invested in Midas Perpetual Portfolio directly or through one of the many brokerage firms making the Fund available to its customers. In these times particularly, it is gratifying indeed to see such a welcoming response to Midas Perpetual Portfolio’s objective of preserving and increasing the purchasing power value of its shares over the long term. It is also a pleasure to submit this 2012 Semi-Annual Report for the Fund.
Economic Report and Fund Strategies
The pace of growth in the world economy is generally slowing. Real U.S. gross domestic product (GDP) – the output of goods and services produced by labor and property located in the country – increased at an annual rate of 1.5% in the quarter ending June 30, 2012, according to the U.S. Bureau of Economic Analysis. GDP growth was volatile in China, the world’s second biggest economy, as reported by its National Bureau of Statistics, dropping to a 1.8% rate in the three months ending June 30, 2012. For only the second time in six quarters, Japan, the world third largest economy, saw its GDP grow, and in first quarter of 2012 reported a positive 1.2% rate. The Euro area is also showing slightly improving growth, with GDP unchanged in the first quarter, versus a negative rate of 0.3% in the fourth quarter of 2011, according to estimates released by Eurostat, the statistical office of the European Union.
In view of this changing global environment, effective April 30, 2012, Midas Perpetual Portfolio shifted its core asset allocation strategy to preserve and increase the value of its overall portfolio by eliminating the “Dollar Asset” target allocation, and reallocating to other targets, as follows.
| Investment Category | Target Percentage |
| Former | Current |
| Gold | 20% | 20% |
| Silver | 5% | 10% |
| Swiss Franc Assets | 10% | 20% |
| Hard Asset Securities | 15% | 25% |
| Large Capitalization Growth Stocks | 15% | 25% |
| Dollar Assets | 35% | 0% |
| Total | 100% | 100% |
Pending investment, or for purposes of taking temporary defensive positions, the Fund may hold money market instruments and similar investments without limit. Also, from time to time, the Fund may use leverage to increase its investment in large capitalization growth stocks.
|
| | As of June 30, 2012 |
| 1 | SSgA Money Market Fund |
| 2 | SPDR Gold Trust |
| 3 | Switzerland Government, 2.5% Notes, due 3/12/16 |
| 4 | iShares Silver Trust |
| 5 | Switzerland Government, 2.25% Notes, due 7/6/20 |
| 6 | Comcast Corp. |
| 7 | Apple Inc. |
| 8 | Companhia de Bebidas das Americas - AMBEV |
| 9 | China Mobile Ltd. |
| 10 | Microsoft Corp. |
| Top Ten Holdings comprise approximately 72% of total assets. |
Accordingly, during the first half of the 2012 year, the Fund invested in gold and silver (through ETFs and mining shares), Swiss franc denominated bonds of the federal government of Switzerland, shares of real estate and natural resource companies, large capitalization growth stocks, and U.S. money market funds. Over the first half of 2012, the Fund’s total return was 1.64%, including the reinvestment of dividends, compared to the S&P 500 Index return of 9.49%.
Ideal for Regular Investing
Importantly, the investment strategy of Midas Perpetual Portfolio acknowledges a broad range of economic possibilities and investing outlooks, and seeks to incorporate investments appropriate for each of them. Investors who wish to invest all or a portion of their capital regularly over the years ahead, whatever the state of the economy, should consider investing in the Fund.
ABOUT Your Fund’s Expenses (Unaudited)
Fund shareholders may incur two types of costs: (1) transaction costs, including redemption or small account fees; and (2) ongoing costs, including management fees, distribution and service 12b-1 fees, and other fund expenses. This example is intended to help you understand your ongoing costs (in dollars) of investing in your Fund and to compare these costs with the ongoing cost of investing in other mutual funds. The example is based on an investment of $1,000 made at the beginning of the period and held for the entire period from January 1, 2012 to June 30, 2012.
Actual Expenses
The table provides information about actual account values and actual expenses for each Fund. You may use the information, together with the amount you invested, to estimate the expenses that you paid over the period. First, identify the Fund you own. Then simply divide your account value by $1,000 (for example, an $8,600 account value divided by $1,000 = 8.6), then multiply the result by the number under the heading “Expenses Paid During Period” to estimate the expenses you paid on your account during this period. The Fund may charge you a $20 annual small balance account fee if the value of those shares is less than $500. We will redeem shares automatically in one of your accounts to pay the $20 fee. In determining your total eligible investment amount, we will include your investments in all personal accounts registered under your Social Security number. Personal accounts include individual accounts, joint accounts, UGMA/UTMA accounts, personal trusts, Coverdell Education Savings Accounts, and IRAs (including traditional, Roth, Rollover, SEP, and SIMPLE-IRAs), and certain other retirement accounts.
Hypothetical Example for Comparison Purposes
The table also provides information about hypothetical account values and hypothetical expenses based on the actual expense ratio of each Fund and an assumed rate of return of 5% per year before expenses, which is not the actual return of a Fund. The hypothetical account values and expenses may not be used to estimate the actual ending account balance or expenses you paid for the period. You may use this information to compare the ongoing costs of investing in your Fund and other funds. To do so, compare this 5% hypothetical example with the 5% hypothetical examples that appear in the shareholder reports of the other funds.
| EXPENSE ANALYSIS TABLE | | | | | |
| | Beginning Account Value | Ending Account Value | Expenses Paid During Period | Annualized |
| | January 1, 2012 | June 30, 2012 | January 1, 2012-June 30, 2012(a) | Expense Ratio |
| Midas Fund | | | | | | | |
| Actual | $ | 1,000.00 | $ | 658.26 | $ | 10.43 | 2.53% |
Hypothetical (b) | $ | 1,000.00 | $ | 1,012.28 | $ | 12.66 | 2.53% |
| Midas Magic | | | | | | | |
| Actual | $ | 1,000.00 | $ | 1,096.25 | $ | 20.33 | 3.90% |
Hypothetical (b) | $ | 1,000.00 | $ | 1,005.47 | $ | 19.45 | 3.90% |
| Midas Perpetual Portfolio | | | | | | | |
| Actual | $ | 1,000.00 | $ | 1,016.39 | $ | 10.23 | 2.04% |
Hypothetical (b) | $ | 1,000.00 | $ | 1,014.72 | $ | 10.22 | 2.04% |
| (a) Expenses are equal to the Fund’s annualized expense ratio multiplied by the average account value over the period, multiplied by 182, the number of days in the most recent fiscal half year, divided by 366, to reflect the one half year period. |
| (b) Assumes 5% total return before expenses. |
| MIDAS Fund | Schedule of Portfolio Investments – June 30, 2012 |
| | (Unaudited) |
| Common Stocks (110.34%) | | | | | | |
| Shares | | | | Cost | | | Value | |
| | | | | | | |
| Major Precious Metals Producers (42.57%) | | | | | | |
| | 100,000 | | AngloGold Ashanti Ltd. ADR | | $ | 4,479,422 | | | $ | 3,434,000 | |
| | 150,000 | | Goldcorp Inc. | | | 7,434,015 | | | | 5,637,000 | |
| | 319,369 | | Kinross Gold Corp. | | | 6,409,617 | | | | 2,602,857 | |
| | 100,761 | | Newcrest Mining Ltd. | | | 2,220,698 | | | | 2,335,281 | |
| | 100,000 | | Newmont Mining Corp. | | | 5,940,870 | | | | 4,851,000 | |
| | | | | | | 26,484,622 | | | | 18,860,138 | |
| | | | | | | | | |
| Intermediate Precious Metals Producers (31.36%) | | | | | | | | |
| | 205,143 | | African Barrick Gold plc | | | 1,805,952 | | | | 1,245,846 | |
| | 275,400 | | Centerra Gold Inc. | | | 2,833,774 | | | | 1,923,437 | |
| | 325,000 | | Eldorado Gold Corp. Ltd. | | | 5,655,700 | | | | 4,004,000 | |
| | 200,000 | | IAMGOLD Corp. | | | 3,671,460 | | | | 2,360,000 | |
| | 30,000 | | Randgold Resources Ltd. ADR | | | 2,403,978 | | | | 2,700,300 | |
| | 300,000 | | Silvercorp Metals, Inc. | | | 1,941,192 | | | | 1,659,000 | |
| | | | | | | 18,312,056 | | | | 13,892,583 | |
| | | | | | | | | |
| Junior Precious Metals Producers (21.15%) | | | | | | | | |
| | 200,000 | | Alamos Gold Inc. | | | 2,506,500 | | | | 3,119,329 | |
| | 135,000 | | Aurizon Mines Ltd. (a) | | | 797,837 | | | | 608,850 | |
| | 2,100,000 | | Avocet Mining PLC | | | 3,548,756 | | | | 2,966,027 | |
| | 600,000 | | CGA Mining Ltd. (a) | | | 895,814 | | | | 1,088,822 | |
| | 1,145,001 | | Resolute Mining Ltd. (a) | | | 1,438,257 | | | | 1,584,476 | |
| | | | | | | 9,187,164 | | | | 9,367,504 | |
| | | | | | | | | |
| Exploration and Project Development Companies (12.21%) | | | | | | | | |
| | 250,000 | | Corvus Gold Inc. (a) | | | 290,236 | | | | 225,612 | |
| | 85,000 | | Detour Gold Corp. (a) | | | 1,266,311 | | | | 1,710,089 | |
| | 500,000 | | Geomark Exploration Ltd. (a) | | | 174,406 | | | | 348,227 | |
| | 188,495 | | Ivanplats Ltd. (a) (b) | | | 0 | | | | 113,097 | |
| | 500,000 | | Northern Dynasty Minerals Ltd. (a) | | | 6,315,718 | | | | 1,170,000 | |
| | 1,500,000 | | Platinum Group Metals Ltd. (a) | | | 3,159,430 | | | | 1,320,000 | |
| | 1,000,000 | | Romarco Minerals Inc. (a) | | | 1,998,208 | | | | 519,888 | |
| | | | | | | 13,204,309 | | | | 5,406,913 | |
See notes to financial statements.
| Common Stocks (110.34%) | | | | | | |
| Shares | | | | Cost | | | Value | |
Other Natural Resources Companies (3.05%) | | | | | | |
| | 175,000 | | HudBay Minerals Inc. | | $ | 2,861,250 | | | $ | 1,349,250 | |
Total common stocks (d) | | | 70,049,401 | | | | 48,876,388 | |
Warrants (0.13%) (a) | | | | | | | | |
| Units | | | | | | | | | | |
| | 142,900 | | Kinross Gold Corp., expiring 9/03/13 | | | 577,052 | | | | 53,967 | |
| | 7,150 | | Kinross Gold Corp., expiring 9/17/14 (c) | | | - | | | | 2,805 | |
| Total warrants | | | | | 577,052 | | | | 56,772 | |
Money Market Fund (0%) | | | | | | | | |
| | 635 | | SSgA Money Market Fund, 7 day annualized yield 0.01% | | | 635 | | | | 635 | |
Securities held as Collateral on Loaned Securities (0%) | | | | | | | | |
| | 693 | | State Street Navigator Securities Lending Prime Portfolio | | | 693 | | | | 693 | |
| Total investments (110.47%) | | $ | 70,627,781 | | | | 48,934,488 | |
| Liabilities in excess of cash and other assets (-10.47%) | | | | | | | (4,636,722 | ) |
| Net assets (100.00%) | | | | | | $ | 44,297,766 | |
| | | | | | | | | | | | |
| (a) Non-income producing. | | | | | | | | |
| (b) Illiquid and/or restricted security that has been fair valued. | | | | | | | | |
| (c) All or a portion of this security was on loan. | | | | | | | | |
| (d) All or a portion of these securities have been segregated as collateral pursuant to the bank credit facility. | | | | | | | | |
| ADR means “American Depositary Receipt.” | | | | | | | | |
See notes to financial statements.
| MIDAS Magic | Schedule of Portfolio Investments – June 30, 2012 |
| | (Unaudited) |
| Common Stocks (126.39%) | | | | | | |
| Shares | | | | Cost | | | Value | |
Computer & Office Equipment (3.94%) | | | | | | |
| | 2,500 | | International Business Machines Corporation | | $ | 511,591 | | | $ | 488,950 | |
Crude Petroleum & Natural Gas (4.33%) | | | | | | | | |
| | 20,000 | | Canadian Natural Resources Ltd. | | | 522,599 | | | | 537,000 | |
Electronic Computers (11.76%) | | | | | | | | |
| | 2,500 | | Apple Inc. | | | 477,375 | | | | 1,460,000 | |
Electronic & Other Electrical Equipment (6.05%) | | | | | | | | |
| | 36,000 | | General Electric Company | | | 435,510 | | | | 750,240 | |
Fire, Marine & Casualty Insurance (35.26%) | | | | | | | | |
| | 52,500 | | Berkshire Hathaway, Inc. Class B (a) | | | 1,744,890 | | | | 4,374,825 | |
Information Retrieval Services (9.35%) | | | | | | | | |
| | 2,000 | | Google, Inc. (a) | | | 758,730 | | | | 1,160,140 | |
National Commercial Banks (5.58%) | | | | | | | | |
| | 19,400 | | JP Morgan Chase & Co. | | | 691,858 | | | | 693,162 | |
Pharmaceutical Preparations (5.99%) | | | | | | | | |
| | 11,000 | | Johnson & Johnson | | | 669,169 | | | | 743,160 | |
Services - Business Services (34.66%) | | | | | | | | |
| | 10,000 | | MasterCard, Inc. | | | 937,175 | | | | 4,301,100 | |
Surgical & Medical Instruments & Apparatus (1.81%) | | | | | | | | |
| | 3,000 | | Becton, Dickinson and Company | | | 210,947 | | | | 224,250 | |
See notes to financial statements.
| Common Stocks (126.39%) | | | | | | |
| Shares | | | | Cost | | | Value | |
Variety Stores (7.66%) | | | | | | |
| | 10,000 | | Costco Wholesale Corp. | | $ | 692,696 | | | $ | 950,000 | |
Total common stocks (b) | | | 7,652,540 | | | | 15,682,827 | |
Money Market Fund (0.01%) | | | | | | | | |
| | 1,690 | | SSgA Money Market Fund, 7 day annualized yield 0.01% | | | 1,690 | | | | 1,690 | |
| Total investments (126.40%) | | $ | 7,654,230 | | | | 15,684,517 | |
| Liabilities in excess of cash and other assets (-26.40%) | | | | | | | (3,276,135 | ) |
| Net assets (100.00%) | | | | | | $ | 12,408,382 | |
| | | | | | | | | | | | |
| (a) Non-income producing. | | | | | | | | |
| (b) All or a portion of these securities have been segregated as collateral pursuant to the bank credit facility. | | | | | | | | |
| | | | | | | | | | | | |
See notes to financial statements.
Financial Statements
| MIDAS Perpetual Portfolio | Schedule of Portfolio Investments – June 30, 2012 |
| | (Unaudited) |
| Shares | | | | Cost | | | Value | |
| Gold (19.21%) | | | | | | |
| | 3,700 | | Newmont Mining Corp. | | $ | 224,766 | | | $ | 179,487 | |
| | 18,471 | | SPDR Gold Trust (a) | | | 1,821,139 | | | | 2,866,515 | |
| | | | | | | 2,045,905 | | | | 3,046,002 | |
| Silver (4.14%) | | | | | | | | | | |
| | 24,643 | | iShares Silver Trust (a) | | | 302,396 | | | | 656,736 | |
Swiss Franc Assets (9.30%) (b) | | | | | | | | |
| | 907,000 | | Switzerland Government 2.50% Notes, due 3/12/16 | | | 948,151 | | | | 1,051,767 | |
| | 350,000 | | Switzerland Government 2.25% Notes, due 7/06/20 | | | 477,899 | | | | 422,197 | |
| | | | | | | 1,426,050 | | | | 1,473,964 | |
Hard Asset Securities (16.37%) | | | | | | | | |
| Agricultural Chemicals (1.16%) | | | | | | | | |
| | 2,678 | | Syngenta AG | | | 170,440 | | | | 183,282 | |
Crude Petroleum & Natural Gas (3.84%) | | | | | | | | |
| | 750 | | CNOOC Limited | | | 145,128 | | | | 150,938 | |
| | 2,717 | | Contango Oil & Gas Company (a) | | | 157,155 | | | | 160,846 | |
| | 1,600 | | EOG Resources, Inc. | | | 151,590 | | | | 144,176 | |
| | 1,182 | | PetroChina Company Limited | | | 141,065 | | | | 152,644 | |
| | | | | | | 594,938 | | | | 608,604 | |
| Metal Mining (4.37%) | | | | | | | | |
| | 11,000 | | Anglo American PLC ADR | | | 205,452 | | | | 181,830 | |
| | 1,800 | | BHP Billiton Ltd. | | | 147,390 | | | | 117,540 | |
| | 10,000 | | First Quantum Minerals Ltd. | | | 215,450 | | | | 176,566 | |
| | 2,249 | | Rio Tinto Ltd. | | | 159,432 | | | | 107,525 | |
| | 5,500 | | Vale S.A. | | | 147,761 | | | | 109,175 | |
| | | | | | | 875,485 | | | | 692,636 | |
| Mining & Quarrying of Nonmetallic Minerals (0.95%) | | | | | | | | |
| | 2,694 | | Sociedad Quimica Y Minera De Chile S.A. | | | 154,921 | | | | 149,975 | |
Miscellaneous Metal Ores (0.54%) | | | | | | | | |
| | 3,898 | | Cameco Corp. | | | 155,237 | | | | 85,561 | |
See notes to financial statements.
Financial Statements
| MIDAS Perpetual Portfolio | Schedule of Portfolio Investments – June 30, 2012 |
| | (Unaudited) continued |
| Shares | | | | Cost | | | Value | |
Petroleum Refining (1.12%) | | | | | | |
| | 2,079 | | Exxon Mobil Corp. | | $ | 161,883 | | | $ | 177,900 | |
Railroads, Line - Haul Operating (1.12%) | | | | | | | | |
| | 2,100 | | Canadian National Railway Company | | | 150,279 | | | | 177,198 | |
Real Estate Investment Trusts (2.43%) | | | | | | | | |
| | 3,330 | | Health Care REIT, Inc. | | | 141,090 | | | | 194,139 | |
| | 2,825 | | PS Business Parks, Inc. | | | 165,852 | | | | 191,309 | |
| | | | | | | 306,942 | | | | 385,448 | |
Steel Works, Blast Furnaces & Rolling Mills (0.84%) | | | | | | | | |
| | 3,519 | | Nucor Corp. | | | 160,522 | | | | 133,370 | |
| Total hard asset securities | | | 2,730,647 | | | | 2,593,974 | |
Large Capitalization Growth Stocks (18.84%) | | | | | | | | |
| Beverages (1.62%) | | | | | | | | |
| | 6,692 | | Companhia De Bebidas Das Americas-AMBEV | | | 196,126 | | | | 256,504 | |
Cable and Other Pay Television Services (2.22%) | | | | | | | | |
| | 11,000 | | Comcast Corp. | | | 221,855 | | | | 351,670 | |
Cigarettes (1.32%) | | | | | | | | |
| | 2,400 | | Philip Morris International Inc. | | | 163,238 | | | | 209,424 | |
Communications Equipment (1.02%) | | | | | | | | |
| | 9,422 | | Cisco Systems, Inc. | | | 172,573 | | | | 161,776 | |
Electronic Computers (2.67%) | | | | | | | | |
| | 575 | | Apple Inc. | | | 214,352 | | | | 335,800 | |
| | 4,331 | | Hewlett-Packard Company | | | 181,161 | | | | 87,096 | |
| | | | | | | 395,513 | | | | 422,896 | |
Hospital and Medical Service Plans (1.29%) | | | | | | | | |
| | 3,500 | | UnitedHealth Group Inc. | | | 157,271 | | | | 204,750 | |
See notes to financial statements.
Financial Statements
| MIDAS Perpetual Portfolio | Schedule of Portfolio Investments – June 30, 2012 |
| | (Unaudited) continued |
| Shares | | | | Cost | | | Value | |
Life Insurance (0.79%) | | | | | | |
| | 3,180 | | China Life Insurance Company Ltd. ADR | | $ | 191,727 | | | $ | 125,578 | |
National Commercial Banks (1.30%) | | | | | | | | |
| | 6,140 | | Wells Fargo & Company | | | 196,956 | | | | 205,322 | |
Pharmaceutical Preparations (1.06%) | | | | | | | | |
| | 3,000 | | Novartis AG | | | 167,147 | | | | 167,700 | |
Services-Prepackaged Software (2.47%) | | | | | | | | |
| | 6,994 | | Microsoft Corp. | | | 181,291 | | | | 213,946 | |
| | 6,000 | | Oracle Corp. | | | 165,038 | | | | 178,200 | |
| | | | | | | 346,329 | | | | 392,146 | |
State Commercial Banks (1.72%) | | | | | | | | |
| | 9,672 | | Banco Bradesco S.A. | | | 196,953 | | | | 143,823 | |
| | 9,300 | | Itau Unibanco Holding S.A. | | | 160,941 | | | | 129,456 | |
| | | | | | | 357,894 | | | | 273,279 | |
Telephone Communications (1.36%) | | | | | | | | |
| | 3,935 | | China Mobile Ltd. ADR | | | 199,078 | | | | 215,126 | |
| Total large capitalization growth stocks | | | 2,765,707 | | | | 2,986,171 | |
Money Market Fund (32.21%) | | | | | | | | |
| Money Market Fund (32.21%) | | | | | | | | |
| | 5,106,747 | | SSgA Money Market Fund, 7 day annualized yield 0.01% | | $ | 5,106,747 | | | $ | 5,106,747 | |
Total investments (100.07%) | | $ | 14,377,452 | | | | 15,863,594 | |
| Liabilities in excess of other assets (-0.07%) | | | | | | | (10,414 | ) |
| Net assets (100.00%) | | | | | | $ | 15,853,180 | |
| | | | | | | | | | | | |
| (a) Non-income producing. | | | | | | | | |
| (b) Principal amount denominated in Swiss Francs. | | | | | | | | |
| ADR means “American Depositary Receipt.” | | | | | | | | |
See notes to financial statements.
STATEMENTS of Assets and Liabilities
| | | MIDAS | | | MIDAS | | | MIDAS | |
| June 30, 2012 (Unaudited) | | Fund | | | Magic | | | Perpetual Portfolio | |
| | | | | | | | | | |
| Assets | | | | | | | | | |
| Investments, at cost | | $ | 70,626,781 | | | $ | 7,654,230 | | | $ | 14,377,452 | |
| | | | | | | | | | | | | |
| Investments, at value (including $272, $ -, and | | | | | | | | | | | | |
| $ - for securities loaned, respectively) | | $ | 48,934,488 | | | $ | 15,684,517 | | | $ | 15,863,594 | |
| Cash | | | 4,997 | | | | 2,809 | | | | - | |
| Receivables | | | | | | | | | | | | |
| Securities sold | | | 885,952 | | | | - | | | | - | |
| Dividends | | | 23,753 | | | | 7,871 | | | | 15,434 | |
| Fund shares sold | | | 18,188 | | | | - | | | | 1,095 | |
| Interest | | | - | | | | - | | | | 10,078 | |
| Foreign withholding taxes reclaimed | | | - | | | | - | | | | 30,268 | |
| Other assets | | | 29,749 | | | | 6,667 | | | | 6,562 | |
| | | | | | | | | | | | | |
| Total assets | | | 49,897,127 | | | | 15,701,864 | | | | 15,927,031 | |
| | | | | | | | | | | | | |
| Liabilities | | | | | | | | | | | | |
| Bank credit facility borrowing | | | 5,281,057 | | | | 3,211,291 | | | | - | |
| Payables | | | | | | | | | | | | |
| Accrued expenses | | | 225,556 | | | | 61,329 | | | | 62,028 | |
| Investment management fees | | | 36,486 | | | | 8,691 | | | | - | |
| Fund shares redeemed | | | 28,995 | | | | 1,162 | | | | 6,200 | |
| Administrative services | | | 15,620 | | | | 817 | | | | 2,347 | |
| Distribution fees | | | 10,954 | | | | 10,192 | | | | 3,276 | |
| Collateral on securities loaned, at value | | | 693 | | | | - | | | | - | |
| | | | | | | | | | | | | |
| Total liabilities | | | 5,599,361 | | | | 3,293,482 | | | | 73,851 | |
| | | | | | | | | | | | | |
| Net assets | | $ | 44,297,766 | | | $ | 12,408,382 | | | $ | 15,853,180 | |
| | | | | | | | | | | | | |
| Shares outstanding, $0.01 par value | | | 18,837,880 | | | | 707,409 | | | | 12,753,286 | |
| | | | | | | | | | | | | |
| Net asset value, offering, and redemption price per share | | $ | 2.35 | | | $ | 17.54 | | | $ | 1.24 | |
| | | | | | | | | | | | | |
| Net assets consist of | | | | | | | | | | | | |
| Paid in capital | | $ | 92,241,944 | | | $ | 7,553,455 | | | $ | 14,405,893 | |
| Accumulated undistributed net investment loss | | | (3,060,185 | ) | | | (186,410 | ) | | | (39,000 | ) |
| Accumulated net realized gain (loss) | | | (23,191,740 | ) | | | (2,988,959 | ) | | | 1,233 | |
| Net unrealized appreciation (depreciation) on investments | | | | | | | | | | | | |
| and foreign currencies | | | (21,692,253 | ) | | | 8,030,296 | | | | 1,485,054 | |
| | | $ | 44,297,766 | | | $ | 12,408,382 | | | $ | 15,853,180 | |
See notes to financial statements.
| For the Six Months Ended June 30, 2012 (Unaudited) | | MIDAS Fund | | | MIDAS Magic | | | MIDAS Perpetual Portfolio | |
| | | | | | | | | | |
| Investment income | | | | | | | | | |
| Dividends | | $ | 563,025 | | | $ | 57,959 | | | $ | 78,345 | |
| Income from securities loaned | | | 13,803 | | | | 447 | | | | 2,175 | |
| Foreign tax withholding | | | (58,101 | ) | | | (624 | ) | | | (2,326 | ) |
| Interest | | | - | | | | - | | | | 8,437 | |
| | | | | | | | | | | | | |
| Total investment income | | | 518,727 | | | | 57,782 | | | | 86,631 | |
| | | | | | | | | | | | | |
| Expenses | | | | | | | | | | | | |
| Investment management | | | 321,189 | | | | 60,631 | | | | 40,563 | |
| Transfer agent | | | 152,900 | | | | 30,475 | | | | 24,710 | |
| Distribution | | | 80,297 | | | | 62,189 | | | | 20,282 | |
| Administrative services | | | 49,010 | | | | 9,320 | | | | 11,780 | |
| Interest and fees on bank credit facility | | | 41,568 | | | | 14,134 | | | | - | |
| Shareholder communications | | | 40,100 | | | | 9,080 | | | | 8,370 | |
| Legal | | | 27,300 | | | | 13,200 | | | | 14,200 | |
| Bookkeeping and pricing | | | 23,860 | | | | 11,180 | | | | 12,350 | |
| Directors | | | 21,580 | | | | 6,276 | | | | 5,551 | |
| Registration | | | 20,022 | | | | 15,470 | | | | 15,700 | |
| Insurance | | | 14,196 | | | | - | | | | 2,730 | |
| Auditing | | | 13,650 | | | | 10,920 | | | | 9,810 | |
| Other | | | 7,914 | | | | 1,317 | | | | 145 | |
| | | | | | | | | | | | | |
| Total expenses | | | 813,586 | | | | 244,192 | | | | 166,191 | |
| Less contractual investment management fee waiver | | | - | | | | - | | | | (40,563 | ) |
| | | | | | | | | | | | | |
| Net expenses | | | 813,586 | | | | 244,192 | | | | 125,628 | |
| | | | | | | | | | | | | |
| Net investment loss | | | (294,859 | ) | | | (186,410 | ) | | | (38,997 | ) |
| | | | | | | | | | | | | |
| Realized and Unrealized Gain (Loss) | | | | | | | | | | | | |
| Net realized gain (loss) on | | | | | | | | | | | | |
| Investments | | | (9,192,626 | ) | | | 129,611 | | | | - | |
| Foreign currencies | | | (39,336 | ) | | | 298 | | | | 1,233 | |
| Unrealized appreciation (depreciation) on | | | | | | | | | | | | |
| Investments | | | (13,832,433 | ) | | | 1,200,688 | | | | 338,455 | |
| Translation of assets and liabilities in foreign currencies | | | 17 | | | | (25 | ) | | | (1,106 | ) |
| | | | | | | | | | | | | |
| Net realized and unrealized gain (loss) | | | (23,064,378 | ) | | | 1,330,572 | | | | 338,582 | |
| | | | | | | | | | | | | |
| Net increase (decrease) in net assets resulting | | | | | | | | | | | | |
| from operations | | $ | (23,359,237 | ) | | $ | 1,144,162 | | | $ | 299,585 | |
See notes to financial statements.
Financial Statements
STATEMENTS of Change in Net Assets (Unaudited)
| | | MIDAS Fund | | MIDAS Magic | | MIDAS Perpetual Portfolio | |
| | |
| | | Six Months | | | Year | | | Six Months | | | Year | | | Six Months | | | Year | |
| | | Ended | | | Ended | | | Ended | | | Ended | | | Ended | | | Ended | |
| | | 6/30/12 | | | 12/31/11 | | | 6/30/12 | | | 12/31/11 | | | 6/30/12 | | | 12/31/11 | |
| Operations | | | | | | | | | | | | | | | | | | |
| Net investment loss | | $ | (294,859 | ) | | $ | (1,342,382 | ) | | $ | (186,410 | ) | | $ | (358,058 | ) | | $ | (38,997 | ) | | $ | (75,631 | ) |
| Net realized gain (loss) | | | (9,231,962 | ) | | | 697,583 | | | | 129,909 | | | | (552,803 | ) | | | 1,233 | | | | 959,113 | |
| Unrealized appreciation (depreciation) | | | (13,832,416 | ) | | | (43,849,709 | ) | | | 1,200,663 | | | | 1,922,015 | | | | 337,349 | | | | (869,672 | ) |
| | | | | | | | | | | | | | | | | | | | | | | | | |
| Net increase (decrease) in net assets | | | | | | | | | | | | | | | | | | | | | | | | |
| resulting from operations | | | (23,359,237 | ) | | | (44,494,508 | ) | | | 1,144,162 | | | | 1,011,154 | | | | 299,585 | | | | 13,810 | |
| | | | | | | | | | | | | | | | | | | | | | | | | |
| Distributions to shareholders | | | | | | | | | | | | | | | | | | | | | | | | |
| Ordinary income | | | - | | | | (1,287,150 | ) | | | - | | | | - | | | | - | | | | (102,869 | ) |
| Net realized gains | | | - | | | | - | | | | - | | | | - | | | | - | | | | (942,091 | ) |
| | | | | | | | | | | | | | | | | | | | | | | | | |
| Total distributions | | | - | | | | (1,287,150 | ) | | | - | | | | - | | | | - | | | | (1,044,960 | ) |
| | | | | | | | | | | | | | | | | | | | | | | | | |
| Capital share transactions | | | | | | | | | | | | | | | | | | | | | | | | |
| Change in net assets resulting from | | | | | | | | | | | | | | | | | | | | | | | | |
capital share transactions (a) | | | (5,326,198 | ) | | | (20,897,338 | ) | | | (504,763 | ) | | | (1,483,279 | ) | | | 93,951 | | | | 5,863,978 | |
| Redemption fees | | | 10,324 | | | | 8,190 | | | | 995 | | | | 530 | | | | 970 | | | | 6,335 | |
| | | | | | | | | | | | | | | | | | | | | | | | | |
| Increase (decrease) in net assets resulting | | | | | | | | | | | | | | | | | | | | | | | | |
| from capital share transactions | | | (5,315,874 | ) | | | (20,889,148 | ) | | | (503,768 | ) | | | (1,482,749 | ) | | | 94,921 | | | | 5,870,313 | |
| | | | | | | | | | | | | | | | | | | | | | | | | |
| Total change in net assets | | | (28,675,111 | ) | | | (66,670,806 | ) | | | 640,394 | | | | (471,595 | ) | | | 394,506 | | | | 4,839,163 | |
| | | | | | | | | | | | | | | | | | | | | | | | | |
| Net assets | | | | | | | | | | | | | | | | | | | | | | | | |
| Beginning of period | | | 72,972,877 | | | | 139,643,683 | | | | 11,767,988 | | | | 12,239,583 | | | | 15,458,674 | | | | 10,619,511 | |
| | | | | | | | | | | | | | | | | | | | | | | | | |
End of period (b) | | $ | 44,297,766 | | | $ | 72,972,877 | | | $ | 12,408,382 | | | $ | 11,767,988 | | | $ | 15,853,180 | | | $ | 15,458,674 | |
| | | | | | | | | | | | | | | | | | | | | | | | | |
(a) Capital share transactions were as follows: | | | | | | | | | | | | | | | | | | | | | | | | |
| Value | | | | | | | | | | | | | | | | | | | | | | | | |
| Shares sold | | $ | 3,430,744 | | | $ | 15,210,763 | | | $ | 470,479 | | | $ | 869,429 | | | $ | 2,118,336 | | | $ | 17,781,674 | |
| Shares issued in reinvestment of distributions | | | - | | | | 1,187,301 | | | | - | | | | - | | | | - | | | | 1,008,096 | |
| Shares redeemed | | | (8,756,942 | ) | | | (37,295,402 | ) | | | (975,242 | ) | | | (2,352,708 | ) | | | (2,024,385 | ) | | | (12,925,792 | ) |
| | | | | | | | | | | | | | | | | | | | | | | | | |
| Net increase (decrease) | | $ | (5,326,198 | ) | | $ | (20,897,338 | ) | | $ | (504,763 | ) | | $ | (1,483,279 | ) | | $ | 93,951 | | | $ | 5,863,978 | |
| | | | | | | | | | | | | | | | | | | | | | | | | |
| Number | | | | | | | | | | | | | | | | | | | | | | | | |
| Shares sold | | | 1,095,300 | | | | 3,132,591 | | | | 28,426 | | | | 57,906 | | | | 1,659,532 | | | | 13,518,556 | |
| Shares issued in reinvestment of distributions | | | - | | | | 264,432 | | | | - | | | | - | | | | - | | | | 818,253 | |
| Shares redeemed | | | (2,692,522 | ) | | | (7,666,918 | ) | | | (56,312 | ) | | | (153,274 | ) | | | (1,606,566 | ) | | | (9,828,051 | ) |
| | | | | | | | | | | | | | | | | | | | | | | | | |
| Net increase (decrease) | | | (1,597,222 | ) | | | (4,269,895 | ) | | | (27,886 | ) | | | (95,368 | ) | | | 52,966 | | | | 4,508,758 | |
| | | | | | | | | | | | | | | | | | | | | | | | | |
(b) End of period net assets include | | | | | | | | | | | | | | | | | | | | | | | | |
| undistributed net investment income (loss) | | $ | (3,060,185 | ) | | $ | (2,765,326 | ) | | $ | (186,410 | ) | | $ | - | | | $ | (39,000 | ) | | $ | (3 | ) |
See notes to financial statements.
| | | MIDAS Fund | | MIDAS Magic | | MIDAS Perpetual Portfolio | |
| For the Six Months Ended June 30, 2012 (Unaudited) | |
| | | | | | | | | | |
| Cash flows from operating activities | | | | | | | | | |
| Net (decrease) increase in net assets resulting from operations | | $ | (23,359,237 | ) | | $ | 1,144,162 | | | $ | 299,585 | |
| Adjustments to reconcile change in net assets resulting from | | | | | | | | | | | | |
| operations to net cash provided by (used in) operating activities: | | | | | | | | | | | | |
| Proceeds from sales of long term investments | | | 7,470,599 | | | | 545,792 | | | | - | |
| Purchase of long term investments | | | (2,506,500 | ) | | | (511,590 | ) | | | - | |
| Unrealized depreciation (appreciation) of investments | | | | | | | | | | | | |
| and foreign currencies | | | 13,832,449 | | | | (1,200,714 | ) | | | (340,227 | ) |
| Net realized loss (gain) on sales of investments and | | | | | | | | | | | | |
| foreign currencies | | | 9,231,962 | | | | (129,909 | ) | | | (1,233 | ) |
| Net purchases of short term investments | | | (39,970 | ) | | | (1,391 | ) | | | (96,783 | ) |
| Amortization of premium of investment securities | | | - | | | | - | | | | 8,283 | |
| Decrease in collateral for securities loaned | | | 9,735,507 | | | | 3,382,643 | | | | 3,160,643 | |
| Decrease (increase) in dividends receivable | | | 3,741 | | | | (223 | ) | | | (5,137 | ) |
| Increase in receivable for investments sold | | | (873,511 | ) | | | - | | | | - | |
| Decrease in securities lending income receivable | | | 3,604 | | | | 287 | | | | 795 | |
| Decrease in interest receivable | | | - | | | | - | | | | 4,532 | |
| Decrease in foreign withholding taxes reclaimed | | | - | | | | - | | | | 9,012 | |
| Decrease other assets | | | 14,196 | | | | - | | | | 2,730 | |
| Decrease in payable upon return of securities loaned | | | (9,735,507 | ) | | | (3,382,643 | ) | | | (3,160,643 | ) |
| Increase (decrease) in accrued expenses | | | 12,096 | | | | (5,525 | ) | | | 4,802 | |
| Decrease in investment management fees payable | | | (25,681 | ) | | | (424 | ) | | | - | |
| (Decrease) increase in distribution fees payable | | | (6,421 | ) | | | 282 | | | | (15 | ) |
| Decrease in administrative services payable | | | (5,407 | ) | | | (846 | ) | | | (1,564 | ) |
| Net cash provided by (used in) operating activities | | | 3,751,920 | | | | (160,099 | ) | | | (115,220 | ) |
| | | | | | | | | | | | | |
| Cash flows from financing activities | | | | | | | | | | | | |
| Net shares (redeemed) sold | | | (5,319,581 | ) | | | (505,498 | ) | | | 115,220 | |
| Bank credit facility borrowing | | | 1,572,658 | | | | 668,406 | | | | - | |
| | | | | | | | | | | | | |
| Net cash (used in) provided by financing activities | | | (3,746,923 | ) | | | 162,908 | | | | 115,220 | |
| | | | | | | | | | | | | |
| Net change in cash | | | 4,997 | | | | 2,809 | | | | - | |
| | | | | | | | | | | | | |
| Cash | | | | | | | | | | | | |
| Beginning of period | | | - | | | | - | | | | - | |
| | | | | | | | | | | | | |
| End of period | | $ | 4,997 | | | $ | 2,809 | | | $ | - | |
| | | | | | | | | | | | | |
| Supplemental disclosure of cash flow information | | | | | | | | | | | | |
| Cash paid for interest and fees on bank credit facility | | $ | 46,588 | | | $ | 16,977 | | | $ | - | |
See notes to financial statements.
NOTES to Financial Statements | June 30, 2012 (Unaudited) |
1 ORGANIZATION AND SIGNIFICANT ACCOUNTING POLICIES The Midas Funds are Maryland corporations registered under the Investment Company Act of 1940, as amended (the “Act”), as open end management investment companies. The investment objectives of Midas Fund are primarily capital appreciation and protection against inflation and, secondarily, current income, and it invests primarily in precious metals and natural resource companies and bullion. The investment objective of Midas Magic (formerly Midas Special Fund) is capital appreciation, which it seeks by investing aggressively in any security type in any industry sector and in domestic and foreign companies of any size. The investment objective of Midas Perpetual Portfolio (formerly Midas Dollar Reserves) is to preserve and increase the purchasing power value of its shares over the long term with a policy of investing a fixed target percentage of its total assets in gold, silver, Swiss franc assets, hard asset securities, and large capitalization growth stocks. On December 29, 2008, the Fund changed its name to Midas Perpetual Portfolio, ceased operating as a money market fund, and began operating as a fluctuating net asset value fund pursuant to its current investment objective and policies. The Funds retain Midas Management Corporation as their Investment Manager.
On May 15, 2012, Bassett S. Winmill, who owned 100% of the voting stock (“voting stock”) of Winmill & Co. Incorporated (“Winco”), the parent company of the Investment Manager, passed away. In connection with his death, Mr. Winmill’s ownership interest in the voting stock, among other assets, was transferred (the “Transfer”) to a trust, the Winmill Family Trust (the “Trust”). The Winmill Family Trust owns all of the voting stock of Winco. Pursuant to the trust agreement governing the Trust (“Trust Agreement”) Thomas B. Winmill and Mark C. Winmill, Bassett Winmill’s sons, were designated individual trustees of the Trust with sole authority to vote the voting stock on behalf of the Trust.
The Transfer has been treated as constituting a “change in control” of the Investment Manager under the Act and thus resulted in the assignment and termination of the prior management agreements between the Investment Manager and the Funds (the “Prior Management Agreements”). To avoid interruption of management services to the Funds, at an in-person meeting held on May 25, 2012, the Boards, including a majority of the Directors of the Funds who are not interested persons (as defined under the Act) of the Funds or the Investment Manager or its affiliates (the “Independent Directors”), approved interim investment management agreements for each Fund with the Investment Manager (the “Interim Management Agreements”). The Investment Manager is currently managing each Fund pursuant to the Interim Management Agreements which, pursuant to the rules under the Act, allow the Investment Manager to continue performing investment management services for each Fund for a maximum of 150 days following termination of the Prior Management Agreements. The Interim Management Agreements are identical to the Prior Management Agreements, except with respect to certain provisions required by law regarding effectiveness, duration, and termination. The Funds pay the same fees under the Interim Management Agreements as they paid under the Prior Management Agreements. The Act requires that advisory agreements, other than certain interim agreements, be approved by a vote of a majority of the outstanding shares of a fund. To satisfy this requirement, the Boards are now soliciting shareholder approval of new management agreements (“New Management Agreements”) prior to the expiration of the 150-day duration of the Interim Management Agreements on October 12, 2012.
Midas Fund and Midas Perpetual Portfolio each has authorized capital of one billion shares of common stock, par value $0.01 per share. Midas Magic has authorized capital of 500 million shares of common stock, par value $0.01. Each Fund offers only one class of shares. Each Fund’s shareholders are entitled to one vote for each whole share owned and a fractional vote for each fraction of a share owned. Voting rights are not cumulative. All shares of a Fund are fully paid and non-assessable and have no preemptive or conversion rights.
The Funds impose a short term trading redemption fee on any Fund shares that are redeemed or exchanged within 30 days following their purchase date. The redemption fee is 1% of the amount redeemed. Such fees are retained by the Funds for the benefit of the remaining shareholders and are accounted for as an addition to paid in capital.
The following is a summary of significant accounting policies followed by the Funds:
Valuation of Investments – Portfolio securities are valued by various methods depending on the primary market or exchange on which they trade. Most equity securities for which the primary market is in the United States are valued at the official closing price, last sale price or, if no sale has occurred, at the closing bid price. Most equity securities for which the primary market is outside the United States are valued using the official closing price or the last sale price in the principal market in which they are traded. If the last sale price on the local exchange is unavailable, the last evaluated quote or closing bid price normally is used. Gold and silver bullion is valued at 4:00 p.m. ET, at the mean between the last bid and asked quotations of the Bloomberg Composite (NY) Spot Price for that metal. Debt obligations with remaining maturities of 60 days or less are valued at cost adjusted for amortization of premiums and accretion of discounts. Other debt securities may be priced through pricing services that may utilize a matrix pricing system which takes into consideration factors such as yields, prices, maturities, call features, and ratings on comparable securities or according to prices quoted by a securities dealer that offers pricing services. Open end investment companies are valued at their net asset value. Foreign securities markets may be open on days when the U.S. markets are closed. For this reason, the value of any foreign securities owned by a Fund could change on a day when shareholders cannot buy or sell shares of the Fund. Securities for which market quotations are not readily available or reliable and other assets may be valued as determined in good faith by the Investment Manager under the direction of or pursuant to procedures approved by a Fund’s Board of Directors, called “fair value pricing.” Due to the inherent uncertainty of valuation, fair value pricing values may differ from the values that would have been used had a readily available market for the securities existed. These differences in valuation could be material. A security’s valuation may differ depending on the method used for determining value. The use of fair value pricing by a Fund may cause the net asset value of its shares to differ from the net asset value that would be calculated using market prices.
Investments in Other Investment Companies – Each Fund may invest in shares of other investment companies (the “Acquired Funds”) in accordance with the Act and related rules. Shareholders in each Fund bear the pro rata portion of the fees and expenses of the Acquired Funds in addition to the Fund’s expenses. Expenses incurred by each Fund that are disclosed in the Statement of Operations do not include fees and expenses incurred by the Acquired Funds. The fees and expenses of the Acquired Funds are reflected in each Fund’s total returns.
NOTES to Financial Statements | June 30, 2012 (Unaudited) continued |
Foreign Currency Translation – Securities denominated in foreign currencies are translated into U.S. dollars at prevailing exchange rates. Realized gain or loss on sales of such investments in local currency terms is reported separately from gain or loss attributable to a change in foreign exchange rates for those investments.
Foreign Currency Contracts – Forward foreign currency contracts are marked to market and the change in market value is recorded by a Fund as an unrealized gain or loss. When a contract is closed, a Fund records a realized gain or loss equal to the difference between the value of the contract at the time it was opened and the value at the time it was closed. A Fund could be exposed to risk if a counter-party is unable to meet the terms of the contract or if the value of the currency changes unfavorably.
Derivatives – Midas Fund and Midas Magic may use derivatives for a variety of reasons, such as to attempt to protect against possible changes in the value of their portfolio holdings or to generate potential gain. Derivatives are financial contracts that derive their values from other securities or commodities, or that are based on indices. Derivatives are marked to market with the change in value reflected in unrealized appreciation or depreciation. Upon disposition, a realized gain or loss is recognized accordingly, except when taking delivery of the asset underlying a contract in which case the recognition of gain or loss is postponed until the disposal of the asset. The Funds risk loss if counterparties fail to meet the terms of the contract. Derivative contracts include, among other things, options, futures, forward currency contracts, and swap agreements.
Short Sales – Midas Fund and Midas Magic may sell a security short it does not own in anticipation of a decline in the value of the security. When a Fund sells a security short, it must borrow the security sold short and deliver it to the broker/dealer through which it made the short sale. A Fund is liable for any dividends or interest paid on securities sold short. A gain, limited to the price at which a Fund sold the security short, or a loss, unlimited in size, will be recognized upon the termination of the short sale. Securities sold short result in off balance sheet risk as a Fund’s ultimate obligation to satisfy the terms of the sale of securities sold short may exceed the amount recognized in the Statement of Assets and Liabilities.
Investment Transactions – Investment transactions are accounted for on the trade date (the date the order to buy or sell is executed). Realized gains or losses are determined by specifically identifying the cost basis of the investment sold.
Investment Income – Interest income is recorded on the accrual basis. Amortization of premium and accretion of discount on debt securities are included in interest income. Dividend income is recorded on the ex-dividend date or in the case of certain foreign securities, as soon as a practicable after Fund is notified. Taxes withheld on income from foreign securities have been provided for in accordance with a Fund’s understanding of the applicable country’s tax rules and rates.
Expenses – Expenses deemed by the Investment Manager to have been incurred solely by a Fund are charged to that Fund. Expenses deemed by the Investment Manager to have been incurred jointly by a Fund and one or more of the other investment companies for which the Investment Manager or its affiliates serve as investment manager and an internally managed investment company with substantially similiar officers and directors (the “Fund Complex”) or other entities are allocated on the basis of relative net assets, except where a more appropriate allocation can be made fairly in the judgment of the Investment Manager.
Expense Reduction Arrangement – Through arrangements with the Funds’ custodian and cash management bank, credits realized as a result of uninvested cash balances are used to reduce custodian and transfer agent expenses. No credits were realized by the Funds during the periods covered by this report.
Distributions to Shareholders – Distributions to shareholders are determined in accordance with income tax regulations and recorded on the ex-dividend date.
NOTES to Financial Statements | June 30, 2012 (Unaudited) continued |
Income Taxes – No provision has been made for U.S. income taxes because each Fund intends to qualify as a regulated investment company under the Internal Revenue Code (the “IRC”) and to distribute to its shareholders substantially all of its taxable income and net realized gains. Foreign securities held by a Fund may be subject to foreign taxation. Foreign taxes, if any, are recorded based on the tax regulations and rates that exist in the foreign markets in which a Fund invests. The Funds recognize the tax benefits of uncertain tax positions only where the position is “more likely than not” to be sustained assuming examination by tax authorities. The Funds have reviewed their tax positions and have concluded that no liability for unrecognized tax benefits should be recorded related to uncertain tax position taken on federal, state, and local income tax returns for all open tax years (2009 - 2011) or expected to be taken in the Funds’ 2012 tax returns.
Use of Estimates – In preparing financial statements in conformity with accounting principles generally accepted in the United States of America (“GAAP”), management makes estimates and assumptions that affect the reported amounts of assets and liabilities at the date of the financial statements, as well as the reported amounts of revenues and expenses during the reporting period. Actual results could differ from those estimates.
Recent Accounting Standards Update – In December 2011, FASB issued ASU 2011-11 “Disclosures about Offsetting Assets and Liabilities.” The amendments in ASU 2011-11 will require the Funds to disclose information about offsetting and related arrangements to enable users of its financial statements to understand the effect of those arrangements on its financial position. ASU 2011-11 is effective for annual reporting periods beginning on or after January 1, 2013, and interim periods within those annual periods. ASU 2011-11 requires retrospective application for all comparative periods presented. The Funds are evaluating ASU 2011-11 and the impact it may have to its financial statement disclosures.
2 FEES AND TRANSACTIONS WITH RELATED PARTIES Under the prior and interim investment management agreements of Midas Fund, the Investment Manager receives a management fee, payable monthly, based on the average daily net assets of the Fund at the annual rate of 1% on the first $200 million, .95% from $200 million to $400 million, .90% from $400 million to $600 million, .85% from $600 million to $800 million, .80% from $800 million to $1 billion, and .75% over $1 billion. Under the prior and interim investment management agreements of Midas Magic, the Investment Manager receives a management fee, payable monthly, based on the average daily net assets of the Fund at the annual rate of 1% on the first $10 million, 7/8 of 1% from $10 million to $30 million, 3/4 of 1% from $30 million to $150 million, 5/8 of 1% from $150 million to $500 million, and 1/2 of 1% over $500 million. Under the prior and interim investment management agreements of Midas Perpetual Portfolio, the Investment Manager receives a management fee, payable monthly, based on the average daily net assets of the Fund at the annual rate of .50% of the first $250 million, .45% from $250 million to $500 million, and .40% over $500 million.
The Investment Manager contractually agreed with Midas Perpetual Portfolio to waive its fee for the period from January 1, 2012 to April 30, 2013. The fee waiver agreement may only be amended or terminated with the approval of the Fund’s Board of Directors.
Each Fund has adopted a plan of distribution pursuant to Rule 12b-1 under the Act. Under the plans, each Fund pays the Distributor, Midas Securities Group, Inc., an affiliate of the Investment Manager, a fee of .25% (Midas Fund and Midas Perpetual Portfolio) or 1.00% (Midas Magic) for distribution and shareholder services. The shareholder service fee is intended to cover personal services provided to the shareholders of the Funds and the maintenance of shareholder accounts. The distribution fee is to cover all other activities and expenses primarily intended to result in the sale of the Funds’ shares. In addition, Midas Fund, Midas Magic, and Midas Perpetual Portfolio each reimbursed the Distributor $30,549, $684, and $3,540, respectively, for payments made to certain brokers for record keeping services for the six months ended June 30, 2012.
Certain officers and directors of the Funds are officers and directors of the Investment Manager and the Distributor.
Pursuant to the prior and interim investment management agreements, the Funds reimburse the Investment Manager for providing certain administrative services at cost comprised of compliance and accounting services. For the six months ended June 30, 2012, the Funds incurred administrative services expenses as follows:
| | MIDAS Fund | | MIDAS Magic | | MIDAS Perpetual Portfolio | |
| Compliance | | $ | 35,100 | | | $ | 6,850 | | | $ | 7,960 | |
| Accounting | | | 13,910 | | | | 2,470 | | | | 3,820 | |
| Total | | $ | 49,010 | | | $ | 9,320 | | | $ | 11,780 | |
NOTES to Financial Statements | June 30, 2012 (Unaudited) continued |
3 DISTRIBUTIONS TO SHAREHOLDERS AND DISTRIBUTABLE EARNINGS During the year ended December 31, 2011, Midas Fund paid a distribution of $1,287,150 comprised of ordinary income and Midas Perpetual Portfolio paid a distribution of $1,044,960 comprised of $214,689 of ordinary income and $830,271 of long term capital gains.
At December 31, 2011, the components of distributable earnings on a tax basis were as follows:
| | | MIDAS Fund | | | MIDAS Magic | | | MIDAS Perpetual Portfolio | |
| Accumulated net realized loss on investments | | $ | (11,313,505 | ) | | $ | (3,118,868 | ) | | $ | - | |
| Net unrealized appreciation (depreciation) | | | (9,633,572 | ) | | | 6,829,633 | | | | 1,147,705 | |
| Post-October losses | | | (3,637,864 | ) | | | - | | | | (3 | ) |
| Total | | $ | (24,584,941 | ) | | $ | 3,710,765 | | | $ | 1,147,702 | |
Federal income tax regulations permit post-October net capital losses, if any, to be deferred and recognized on the tax return of the next succeeding taxable year.
At December 31, 2011, Midas Fund had net a capital loss carryover of $11,313,505 expiring in 2017 that may be used to offset future realized capital gains for federal income tax purposes.
At December 31, 2011, Midas Magic had net a capital loss carryover of $3,118,868, of which $340,513, $1,154,753, $406,657, and $664,083 expire in 2014, 2016, 2017, and 2018, respectively, that may be used to offset future realized capital gains for federal income tax purposes. In addition, $552,862 of long term capital losses may be carried forward indefinitely.
4 VALUE MEASUREMENTS A hierarchy established by GAAP prioritizes inputs to valuation methods. The three levels of inputs are:
• Level 1 - unadjusted quoted prices in active markets for identical assets or liabilities including securities actively traded on a
securities exchange.
• Level 2 - observable inputs other than quoted prices included in level 1 that are observable for the asset or liability which may include quoted prices for similar instruments, interest rates, prepayment speeds, credit risk, yield curves, default rates, and similar data.
• Level 3 - unobservable inputs for the asset or liability including the Fund’s own assumptions about the assumptions a market participant would use in valuing the asset or liability.
The availability of observable inputs can vary from security to security and is affected by a wide variety of factors, including, for example, the type of security, whether the security is new and not yet established in the marketplace, the liquidity of markets for the security, and other characteristics particular to the security. To the extent that valuation is based on models or inputs that are less observable or unobservable in the market, the determination of fair value requires more judgment. Accordingly, the degree of judgment exercised in determining fair value is greatest for investments categorized in level 3.
The inputs used to measure fair value may fall into different levels of the fair value hierarchy. In such cases, the level in the fair value hierarchy, within which the fair value measurement falls in its entirety, is determined based on the lowest level input that is significant to the fair value measurement in its entirety.
The inputs and methodology used for valuing investments are not an indication of the risk associated with investing in those securities.
The following is a description of the valuation techniques applied to a Fund’s major categories of assets and liabilities measured at fair value on a recurring basis:
Equity securities (common and preferred stock) – Equity securities traded on a national securities exchange or market are stated normally at the official closing price, last sale price or, if no sale has occurred, at the most recent last sale or closing bid price on the day of valuation. To the extent these securities are actively traded and valuation adjustments are not applied, they may be categorized in level 1 of the fair value hierarchy. Preferred stock and other equities on inactive markets or valued by reference to similar instruments may be categorized in level 2.
Bonds – The fair value of bonds is estimated using various techniques, which may consider, among other things, recently executed transactions in securities of the issuer or comparable issuers, market price quotations (where observable), bond spreads, and fundamental data relating to the issuer. Although most bonds may be categorized in level 2 of the fair value hierarchy, in instances where lower relative consideration is placed on transaction prices, quotations, or similar observable inputs, they may be categorized in level 3.
NOTES to Financial Statements | June 30, 2012 (Unaudited) continued |
Restricted and/or illiquid securities – Restricted and/or illiquid securities for which quotations are not readily available or reliable may be valued with fair value pricing as determined in good faith by the Investment Manager under the direction of or pursuant to procedures approved by a Fund’s Board of Directors. Restricted securities issued by publicly traded companies are generally valued at a discount to similar publicly traded securities. Restricted or illiquid securities issued by nonpublic entities may be valued by reference to comparable public entities or fundamental data relating to the issuer or both or similar inputs. Depending on the relative significance of valuation inputs, these instruments may be classified in either level 2 or level 3 of the fair value hierarchy.
The following is a summary of the June 30, 2012 valuation of each Fund’s assets and liabilities carried at fair value. Refer to each Fund’s Schedule of Portfolio Investments for detailed information on specific investments.
| MIDAS FUND | | Level 1 | | | Level 2 | | | Level 3 | | | Total | |
| Assets | | | | | | | | | | | | |
| Investments, at value | | | | | | | | | | | | |
| Common stocks | | $ | 48,763,291 | | | $ | - | | | $ | 113,097 | | | $ | 48,876,388 | |
| Warrants | | | 56,772 | | | | - | | | | - | | | | 56,772 | |
| Money market fund | | | 635 | | | | - | | | | - | | | | 635 | |
| Securities held as collateral on loaned securities | | | 693 | | | | - | | | | - | | | | 693 | |
| Total investments, at value | | $ | 48,821,391 | | | $ | - | | | $ | 113,097 | | | $ | 48,934,488 | |
| MIDAS MAGIC | | Level 1 | | | Level 2 | | | Level 3 | | | Total | |
| | | | | | | | | | | | |
| | | | | | | | | | | | |
| Common stocks | | $ | 15,682,827 | | | $ | - | | | $ | - | | | $ | 15,862,827 | |
| Money market fund | | | 1,690 | | | | - | | | | - | | | | 1,690 | |
| Total investments, at value | | $ | 15,684,517 | | | $ | - | | | $ | - | | | $ | 15,684,517 | |
| MIDAS PERPETUAL PORTFOLIO | | Level 1 | | | Level 2 | | | Level 3 | | | Total | |
| | | | | | | | | | | | |
| | | | | | | | | | | | |
| Gold | | $ | 3,046,002 | | | $ | - | | | $ | - | | | $ | 3,046,002 | |
| Silver | | | 656,736 | | | | - | | | | - | | | | 656,736 | |
| Swiss franc assets | | | - | | | | 1,473,964 | | | | - | | | | 1,473,964 | |
| Hard asset securities | | | 2,593,974 | | | | - | | | | - | | | | 2,593,974 | |
| Large capitalization growth stocks | | | 2,986,171 | | | | - | | | | - | | | | 2,986,171 | |
| Money market fund | | | 5,106,747 | | | | - | | | | - | | | | 5,106,747 | |
| Total investments, at value | | $ | 14,389,630 | | | $ | 1,473,964 | | | $ | - | | | $ | 15,863,594 | |
NOTES to Financial Statements | June 30, 2012 (Unaudited) continued |
There were no securities that transferred from level 1 on December 31, 2011 to level 2 on June 30, 2012 for any of the Funds. Transfers from level 1 to level 2, or from level 2 to level 1 are valued utilizing values at the beginning of the period.
The following is a reconciliation of assets for which significant unobservable inputs were used to determine fair value:
| MIDAS FUND | | Common Stocks | |
| Balance at December 31, 2011 | | $ | 113,097 | |
| Change in unrealized appreciation | | | - | |
| Balance at June 30, 2012 | | $ | 113,097 | |
| Net change in unrealized appreciation attributable to assets still held as level 3 at June 30, 2012 | | $ | - | |
There were no transfers into or out of level 3 assets during the period. Unrealized gains (losses) are included in the related amounts on investments in the Statement of Operations.
The Investment Manager under the direction of the Funds Board of Directors considers various valuation approaches for valuing securities categorized within level 3 of the fair value hierarchy. The factors used in determining the value of a Fund’s private investments may include, but are not limited to, the discounts applied to the selection of comparable investments due to the private nature of the investment; the type of the security; the size of the holding; the initial cost of the security; the existence of any contractual restrictions on the security’s disposition; the price and extent of public trading in similar securities of the issuer or of comparable companies; quotations or evaluated prices from broker-dealers and/or pricing services; information obtained from the issuer or analysts; an analysis of the company’s or issuer’s financial statements; an evaluation of the forces that influence the issuer and the market in which the security is purchased and sold. Significant changes in any of those inputs in isolation would result in a significantly lower or higher fair value measurement. The pricing of all fair value holdings is subsequently reported to the Funds Board of Directors.
The following table presents additional information about valuation methodologies and inputs used for investments that are measured at fair value and categorized as level 3 as of June 30, 2012:
| Common Stocks | | Fair Value June 30, 2012 | | Valuation Technique | Unobservable Input | | Amount | |
Exploration and Project Development Companies | | $ | 113,097 | | Analysis of operating results and comparable sales | Discount rate for lack of marketability | | | 75% | |
5 INVESTMENT TRANSACTIONS At June 30, 2012, the aggregate gross unrealized appreciation and depreciation of investments, based on cost for federal income tax purposes, are summarized as follows:
| | | | | | | | | | |
| | | | | | Gross Unrealized Appreciation (Depreciation) | | | Net Unrealized Appreciation (Depreciation) | |
| Midas Fund | | $ | 70,627,781 | | | $ | 2,096,462 | | | $ | (23,789,755 | ) | | $ | (21,693,293 | ) |
| Midas Magic | | $ | 7,654,230 | | | $ | 8,052,928 | | | $ | (22,641 | ) | | $ | 8,030,287 | |
| Midas Perpetual Portfolio | | $ | 14,377,452 | | | $ | 2,134,786 | | | $ | (648,644 | ) | | $ | 1,486,142 | |
Purchases and proceeds from sales of investment securities, excluding short term securities, for the six months ended June 30, 2012 were as follows:
NOTES to Financial Statements | June 30, 2012 (Unaudited) continued |
| | | MIDAS Fund | | | MIDAS Magic | | | MIDAS Perpetual Portfolio | |
| Purchases | | $ | 2,506,500 | | | $ | 511,590 | | | $ | - | |
| Proceeds | | $ | 7,470,599 | | | $ | 545,792 | | | $ | - | |
6 ILLIQUID AND RESTRICTED SECURITIES Midas Fund owns securities which have a limited trading market and/or certain restrictions on trading and, therefore, may be illiquid and/or restricted. Such securities have been valued at fair value. Due to the inherent uncertainty of valuation, fair value pricing values may differ from the values that would have been used had a readily available market for the securities existed. These differences in valuation could be material. Illiquid and/or restricted securities owned at June 30, 2012 were as follows:
| | Acquisition | | | | | | |
| | Date | | Cost | | | Value | |
| Ivanplats Ltd. | 4/30/97 | | $ | 0 | | | $ | 113,097 | |
| Percent of net assets | | | | 0.0 | % | | | 0.3 | % |
7 BORROWING AND SECURITIES LENDING Effective March 29, 2012, Midas Fund entered into a Committed Facility Agreement (“CFA”) and a Lending Agreement with BNP Paribas Prime Brokerage, Inc. (“BNP”) that allows the Fund to borrow up to $20,000,000, and up to $25,000,000 with the consent of BNP. Midas Magic and Midas Perpetual Portfolio have each entered into a Lending Agreement with BNP pursuant to which BNP may make loans to each such Fund from time to time in its sole discretion and in amounts determined by BNP in its sole discretion. Borrowings under the CFA and the Lending Agreement (collectively with Midas Fund the “Lending Agreements”) are secured by assets of the borrowing Fund (the “pledged collateral”) that are held in a segregated account with the Fund’s custodian. Interest is charged at the 1 month LIBOR (London Inter-bank Offered Rate) plus 0.95% on the amount borrowed. The undrawn balance under the CFA is subject to a charge of 1 month LIBOR plus 0.50%.
The Lending Agreements provide that BNP may borrow a portion of the pledged collateral (the “Lent Securities”) in an amount not to exceed the outstanding borrowings owed by each Fund to BNP. BNP may re-register the Lent Securities in its own name or in another name other than the Fund and may pledge, re-pledge, sell, lend, or otherwise transfer or use the Lent Securities with all attendant rights of ownership. A Fund may designate any security within the pledged collateral as ineligible to be a Lent Security, provided there are eligible securities within the pledged collateral in an amount equal to the outstanding borrowing owed by a Fund. BNP must remit payment to a Fund equal to the amount of all dividends, interest, or other distributions earned or made by the Lent Securities.
Lent Securities are marked to market daily, and if the value of the Lent Securities exceeds the value of the then outstanding borrowings owed by a Fund to BNP (the “Current Borrowings”), BNP must, on that day, either (1) return Lent Securities to the Funds’ custodian in an amount sufficient to cause the value of the outstanding Lent Securities to equal the Current Borrowings; or (2) post cash collateral with the Funds’ custodian equal to the difference between the value of the Lent Securities and the value of the Current Borrowings. If BNP fails to perform either of these actions as required, the Funds will recall securities, as discussed below, in an amount sufficient to cause the value of the outstanding Lent Securities to equal the Current Borrowings. The Funds can recall any of the Lent Securities and BNP shall, to the extent commercially possible, return such security or equivalent security to the Funds’ custodian no later than three business days after such request. If a Fund recalls a Lent Security and BNP fails to return the Lent Securities or equivalent securities in a timely fashion, BNP shall remain liable to the Funds’ custodian for the ultimate delivery of such Lent Securities, or equivalent securities, and for any buy-in costs that the executing broker for the sales transaction may impose with respect to the failure to deliver. The Funds also have the right to apply and set-off an amount equal to one hundred percent (100%) of the then-current fair value of such Lent Securities against the Current Borrowings. There were no Lent Securities as of June 30, 2012 for Midas Fund, Midas Magic, or Midas Perpetual Portfolio.
NOTES to Financial Statements | June 30, 2012 (Unaudited) continued |
Prior to March 29, 2012, the Funds (except Midas Perpetual Portfolio) and the other Funds in the Fund Complex (the “Borrowers”) had a committed secured line of credit facility with a bank in aggregate of $30,000,000. The borrowing of each Borrower was collateralized by the underlying investments of such Borrower, the bank made revolving loans to a Borrower not to exceed in the aggregate outstanding at any time with respect to any one Borrower, the least of 30% of the total net assets (as defined in the line of credit facility) of a Borrower, the maximum amount permitted pursuant to each Borrower’s investment policies, or as permitted under the Act. The commitment fee on this facility was 0.15% per annum and all loans under this facility were available at the Borrower’s option of (i) overnight Federal funds or (ii) LIBOR (30, 60, 90 days), each as in effect from time to time, plus 1.10% per annum. In addition, the Funds also had an uncommitted secured redemption facility with a bank with an aggregate amount available of $30,000,000. The borrowing of each Borrower was collateralized by the underlying investments of such Borrower. This facility carried no legal obligation on the part of the bank to lend any amount of money to the Funds at any time and there was no commitment fee under this facility. The bank made revolving loans to a Borrower that did not exceed in the aggregate outstanding at any time with respect to any one Borrower the least of $30,000,000, the maximum amount permitted pursuant to the Borrower’s investment policies, or as permitted under the Act. All loans under this facility were available at the higher of LIBOR and overnight Federal funds rates, each as in effect from time to time, plus 1.25% per annum.
The outstanding loan balance and the value of eligible collateral investments at June 30, 2012, and the average daily amount outstanding and weighted average interest rate under the CFA and the bank credit facilities combined for the six months ended June 30, 2012 were as follows:
| | | MIDAS Fund | | | MIDAS Magic | | | MIDAS Perpetual Portfolio | |
| Outstanding balance | | $ | 5,281,057 | | | $ | 3,211,291 | | | $ | 0 | |
| Value of eligible collateral | | $ | 48,876,388 | | | $ | 15,682,827 | | | $ | 0 | |
| Average daily amount outstanding | | $ | 6,385,914 | | | $ | 2,743,028 | | | $ | 0 | |
| Weighted average interest rate | | | 1.22 | % | | | 1.16 | % | | | 0.00 | % |
8 SECURITIES LENDING Under an agreement with the Funds’ custodian, the Funds may lend their securities to qualified financial institutions. The Funds receive compensation in the form of fees, or retain a portion of the returns on the investment of any cash received as collateral. The Funds receive as collateral cash, U.S. Government securities, or bank letters of credit valued greater than the value of the securities on loan. Cash is invested in a money market fund. The value of the loaned securities is determined based upon the most recent closing prices and any additional required collateral is to be delivered to the Funds on the next business day. Any increase or decrease in the value of the securities loaned that might occur and any interest earned or dividends declared on those securities during the term of the loan is retained by the Funds. The Funds have the right under the lending agreement to recover the loaned securities from the borrower on demand. As with other extensions of credit, the Funds bear the risk of delay on recovery or loss of rights in the collateral should the borrower of the securities default.
The value of loaned securities and related collateral outstanding at June 30, 2012 were as follows:
| | | MIDAS | | | MIDAS | | | MIDAS | |
| | | Fund | | | Magic | | | Perpetual Portfolio | |
| Value of securities loaned | | $ | 272 | | | $ | 0 | | | $ | 0 | |
| Value of related collateral | | $ | 693 | | | $ | 0 | | | $ | 0 | |
NOTES to Financial Statements | |
9 PORTFOLIO CONCENTRATION Each Fund operates as a “non-diversified” investment company, which means that the portion of the Fund’s assets that may be invested in the securities of a single issuer is not limited by the Act and the amount of the outstanding voting securities of a particular issuer held by a Fund is not limited. Each Fund, however, currently intends to continue to conduct its operations so as to qualify as a “regulated investment company” for purposes of the Internal Revenue Code, which currently requires that, at the end of each quarter of the taxable year, with respect to 50% of a Fund’s total assets, the Fund limits to 5% the portion of its total assets invested in the securities of a single issuer. There are no such limitations with respect to the balance of a Fund’s portfolio, although no single investment can exceed 25% of a Fund’s total assets at the time of purchase. A more concentrated portfolio may cause a Fund’s net asset value to be more volatile and thus may subject shareholders to more risk. As of June 30, 2012, Midas Magic held approximately 35% and 35% of its net assets in Berkshire Hathaway, Inc. and MasterCard Inc., respectively, primarily as a result of market appreciation since the time of purchase. Thus, the volatility of the Fund’s net assets value and its performance in general, depends disproportionately more on the respective performance of a single issuer than that of a more diversified fund.
10 FOREIGN SECURITIES RISK Investments in the securities of foreign issuers involve special risks which include changes in foreign exchange rates and the possibility of future adverse political and economic developments, which could adversely affect the value of such securities. Moreover, securities in foreign issuers and markets may be less liquid and their prices more volatile than those of U.S. issuers and markets.
11 CONTINGENCIES The Funds indemnify officers and directors for certain liabilities that might arise from their performance of their duties for the Funds. Additionally, in the normal course of business, the Funds enter into contracts that contain a variety of representations and warranties and which may provide general indemnifications. The Funds’ maximum exposure under these arrangements is unknown, as it involves future claims that may be made against the Funds under circumstances that have not occurred.
12 SUBSEQUENT EVENTS The Funds have evaluated subsequent events through the date the financial statements were issued and determined that no subsequent events have occurred that require additional disclosure in the financial statements.
| | | Six Months Ended June 30, 2012 | | | | | | | | | | | | | | | | |
| MIDAS FUND | | | | For the Year Ended December 31, | |
| | | | | 2011 | | | 2010 | | | 2009 | | | 2008 | | | 2007 | |
| Per Share Data (for a share outstanding throughout each period) | | | | | | | | | | | | | | | | | | |
| Net asset value, beginning of period | | $ | 3.57 | | | $ | 5.65 | | | $ | 3.82 | | | $ | 2.11 | | | $ | 5.64 | | | $ | 4.29 | |
| Income (loss) from investment operations: | | | | | | | | | | | | | | | | | | | | | | | | |
Net investment loss (1) | | | (0.02 | ) | | | (0.06 | ) | | | (0.07 | ) | | | (0.05 | ) | | | (0.06 | ) | | | (0.08 | ) |
| Net realized and unrealized gain (loss) on investments | | | (1.20 | ) | | | (1.96 | ) | | | 1.90 | | | | 1.80 | | | | (3.36 | ) | | | 1.44 | |
| Total from investment operations | | | (1.22 | ) | | | (2.02 | ) | | | 1.83 | | | | 1.75 | | | | (3.42 | ) | | | 1.36 | |
| Less distributions: | | | | | | | | | | | | | | | | | | | | | | | | |
| Net investment income | | | - | | | | (0.06 | ) | | | - | | | | (0.04 | ) | | | (0.11 | ) | | | (0.01 | ) |
| Tax return of capital | | | - | | | | - | | | | - | | | | - | | | | - | | | | - | |
| Total distributions | | | - | | | | (0.06 | ) | | | - | | | | (0.04 | ) | | | (0.11 | ) | | | (0.01 | ) |
| Net asset value, end of period | | $ | 2.35 | | | $ | 3.57 | | | $ | 5.65 | | | $ | 3.82 | | | $ | 2.11 | | | $ | 5.64 | |
| | | | | | | | | | | | | | | | | | | | | | | | | |
| Total Return | | | (34.17 | )% | | | (35.97 | )% | | | 47.91 | % | | | 83.88 | % | | | (60.89 | )% | | | 31.70 | % |
| | | | | | | | | | | | | | | | | | | | | | | | | |
| Ratios/Supplemental Data | | | | | | | | | | | | | | | | | | | | | | | | |
| Net assets at end of period (000s omitted) | | $ | 44,298 | | | $ | 72,973 | | | $ | 139,644 | | | $ | 116,311 | | | $ | 77,502 | | | $ | 251,394 | |
| Ratio of total expenses to average net assets | | | 2.53 | %* | | | 2.31 | % | | | 2.29 | % | | | 2.39 | % | | | 2.37 | % | | | 2.43 | % |
| Ratio of net expenses to average net assets | | | 2.53 | %* | | | 2.31 | % | | | 2.29 | % | | | 2.39 | % | | | 2.37 | % | | | 2.43 | % |
| Ratio of net expenses excluding loan interest and | | | | | | | | | | | | | | | | | | | | | | | | |
| fees to average net assets | | | 2.40 | %* | | | 2.16 | % | | | 2.14 | % | | | 2.29 | % | | | 2.02 | % | | | 1.87 | % |
| Ratio of net investment loss to average net assets | | | (0.92 | )%* | | | (1.30 | )% | | | (1.58 | )% | | | (1.67 | )% | | | (1.42 | )% | | | (1.58 | )% |
| Portfolio turnover rate | | | 4 | % | | | 44 | % | | | 63 | % | | | 82 | % | | | 129 | % | | | 126 | % |
| | |
| (1) Average shares outstanding during the period are used to calculate per share data. | |
* Annualized. | | | | | | | | | | | | | | | | | | | | | | | | |
| | | Six Months Ended June 30, 2012 | | | | | | | | | | | | | | | | |
| MIDAS MAGIC | | | | For the Year Ended December 31, | |
| | | | | 2011 | | | 2010 | | | 2009 | | | 2008 | | | 2007 | |
Per Share Data (for a share outstanding throughout each period) | | | | | | | | | | | | | | | | | | |
| Net asset value, beginning of period | | $ | 16.00 | | | $ | 14.73 | | | $ | 13.94 | | | $ | 10.36 | | | $ | 19.13 | | | $ | 16.74 | |
| Income (loss) from investment operations: | | | | | | | | | | | | | | | | | | | | | | | | |
Net investment loss (1) | | | (0.25 | ) | | | (0.48 | ) | | | (0.48 | ) | | | (0.37 | ) | | | (0.43 | ) | | | (0.50 | ) |
| Net realized and unrealized gain (loss) on investments | | | 1.79 | | | | 1.75 | | | | 1.27 | | | | 3.95 | | | | (8.34 | ) | | | 2.89 | |
| Total from investment operations | | | 1.54 | | | | 1.27 | | | | 0.79 | | | | 3.58 | | | | (8.77 | ) | | | 2.39 | |
| Net asset value, end of period | | $ | 17.54 | | | $ | 16.00 | | | $ | 14.73 | | | $ | 13.94 | | | $ | 10.36 | | | $ | 19.13 | |
| | | | | | | | | | | | | | | | | | | | | | | | | |
| | | 9.63 | % | | | 8.62 | % | | | 5.67 | % | | | 34.56 | % | | | (45.84 | )% | | | 14.28 | % |
| | | | | | | | | | | | | | | | | | | | | | | | | |
| | | | | | | | | | | | | | | | | | | | | | | | |
| Net assets at end of period (000s omitted) | | $ | 12,408 | | | $ | 11,768 | | | $ | 12,240 | | | $ | 11,582 | | | $ | 8,911 | | | $ | 17,334 | |
| Ratio of total expenses to average net assets | | | 3.90 | %* | | | 4.16 | % | | | 4.22 | % | | | 4.46 | % | | | 3.89 | % | | | 4.06 | % |
| Ratio of net expenses to average net assets | | | 3.90 | %* | | | 4.16 | % | | | 4.22 | % | | | 4.46 | % | | | 3.89 | % | | | 4.06 | % |
| Ratio of net expenses excluding loan interest and | | | | | | | | | | | | | | | | | | | | | | | | |
| fees to average net assets | | | 3.68 | %* | | | 3.83 | % | | | 3.84 | % | | | 4.11 | % | | | 3.32 | % | | | 3.22 | % |
| Ratio of net investment loss to average net assets | | | (2.98 | )%* | | | (3.17 | )% | | | (3.39 | )% | | | (3.23 | )% | | | (2.71 | )% | | | (2.85 | )% |
| Portfolio turnover rate | | | 4 | % | | | 4 | % | | | 0 | % | | | 9 | % | | | 13 | % | | | 36 | % |
| | |
| (1) Average shares outstanding during the period are used to calculate per share data. | |
* Annualized. | | | | | | | | | | | | | | | | | | | | | | | | |
See notes to financial statements.
| | | | | | | | | | | | | | | | | | | |
| | | Six Months Ended | | | For the Year Ended December 31, | |
| MIDAS PERPETUAL PORTFOLIO | | | | | 2011 | | | 2010 | | | 2009 | | | 2008 | | | 2007 | |
Per Share Data (for a share outstanding throughout each period) | | | | | | | | | | | | | | | | | | |
| Net asset value, beginning of period | | $ | 1.22 | | | $ | 1.30 | | | $ | 1.15 | | | $ | 1.00 | | | $ | 1.000 | | | $ | 1.000 | |
| Income (loss) from investment operations: | | | | | | | | | | | | | | | | | | | | | | | | |
Net investment income (loss) (2) | | | - | | | | (0.01 | ) | | | (0.01 | ) | | | (0.01 | ) | | | 0.012 | | | | 0.039 | |
| Net realized and unrealized gain on investments | | $ | 0.02 | | | | 0.02 | | | | 0.16 | | | | 0.18 | | | | - | | | | - | |
| Total from investment operations | | $ | 0.02 | | | | 0.01 | | | | 0.15 | | | | 0.17 | | | | - | | | | - | |
| Less distributions: | | | | | | | | | | | | | | | | | | | | | | | | |
| Net investment income | | | - | | | | (0.01 | ) | | | - | | | | - | | | | (0.012 | ) | | | (0.039 | ) |
| Realized gains | | | - | | | | (0.08 | ) | | | - | | | | (0.02 | ) | | | - | | | | - | |
| Total distributions | | | - | | | | (0.09 | ) | | | - | | | | (0.02 | ) | | | (0.012 | ) | | | (0.039 | ) |
| Net asset value, end of period | | $ | 1.24 | | | $ | 1.22 | | | $ | 1.30 | | | $ | 1.15 | | | $ | 1.000 | | | $ | 1.000 | |
| | | | | | | | | | | | | | | | | | | | | | | | | |
| | | 1.64 | % | | | 0.96 | % | | | 13.04 | % | | | 17.03 | % | | | 1.22 | % | | | 4.00 | % |
| | | | | | | | | | | | | | | | | | | | | | | | | |
| Ratios/Supplemental Data | | | | | | | | | | | | | | | | | | | | | | | | |
| Net assets at end of period (000s omitted) | | $ | 15,853 | | | $ | 15,459 | | | $ | 10,620 | | | $ | 8,311 | | | $ | 7,191 | | | $ | 14,516 | |
Ratio of total expenses to average net assets (4) | | | 2.04 | %* | | | 1.85 | % | | | 2.51 | % | | | 2.98 | % | | | 1.77 | % | | | 1.91 | % |
Ratio of net expenses to average net assets (3) (5) | | | 1.54 | %* | | | 1.35 | % | | | 1.93 | % | | | 2.23 | % | | | 1.21 | % | | | 1.16 | % |
| Ratio of net expenses excluding loan interest and | | | | | | | | | | | | | | | | | | | | | | | | |
| fees to average net assets | | | 1.54 | %* | | | 1.35 | % | | | 1.90 | % | | | 2.22 | % | | | - | | | | - | |
Ratio of net investment income (loss) to average net assets (3) | | | (0.48 | )%* | | | (0.45 | )% | | | (1.03 | )% | | | (1.29 | )% | | | 1.22 | % | | | 3.92 | % |
| Portfolio turnover rate | | | 0 | % | | | 44 | % | | | 4 | % | | | 24 | % | | | 0 | % | | | 0 | % |
| | |
| (1) These financial highlights reflect the Fund’s operation as a money market fund up to December 28, 2008. On December 29, 2008, the Fund changed its name to Midas Perpetual Portfolio, Inc. from Midas Dollar Reserves, Inc., ceased operating as a money market fund, and began operating as a fluctuating net asset value fund pursuant to its current investment objective and policies. | |
| (2) Average shares outstanding during the period are used to calculate per share data. | |
| (3) Fees contractually waived by the Investment Manager reduced the ratio of expenses to average net assets by 0.50% in each of the periods for the six months ended June 30, 2012 and the year ended December 31, 2011, and by the Investment Manager and Distributor by 0.58%, and 0.75% for the years ended December 31, 2010 and 2009, respectively. Fees voluntarily waived by the Investment Manager and Distributor reduced the ratio of net expenses to average net assets by 0.24% and 0.75% for the years ended December 31, 2008 and 2007, respectively. In addition, the Investment Manager voluntarily reimbursed the Fund for certain operating expenses which further reduced the ratio of net expenses to average net assets by 0.32%, for the year ended December 31, 2008. The impact of the fee waivers and reimbursements is reflected in both the total return and the ratio of net investment income (loss) to average net assets. | |
| (4) “Total expenses” are the expenses of the Fund as presented in the Statement of Operations before fee waivers. | |
| (5) “Net expenses” are the expenses of the Fund as presented in the Statement of Operations after fee waivers. | |
* Annualized. | | | | | | | | | | | | | | | | | | | | | | | | |
BOARD APPROVAL of Agreements | |
As discussed previously, Midas Management Corporation currently serves as the Investment Manager to each of the Funds under the Interim Management Agreements. The Investment Manager previously served as investment manager to each of the Funds pursuant to the Prior Management Agreements that terminated in accordance with their terms on May 15, 2012, as a result of the Transfer. The Investment Manager is currently managing the Funds pursuant to the Interim Management Agreements which, pursuant to the rules under the Act, allows the Investment Manager to continue performing investment management services for the Funds for a maximum of 150 days following termination of the Prior Management Agreements. The Interim Management Agreements are identical to the Prior Management Agreements except with respect to certain provisions required by law regarding effectiveness, duration, and termination. The Boards are now soliciting shareholder approval of the New Management Agreements prior to the expiration of the 150-day duration of the Interim Management Agreements on October 12, 2012.
Basis for Approval of Prior Management Agreements
In considering the annual approval of the Prior Management Agreements at the joint meeting of the Boards of the Funds held on March 6, 2012, the Boards considered all relevant factors, including, among other things, information that had been provided at other meetings of the Funds’ Boards, as well as information furnished to the Boards for the meeting. Such information included, among other things: information comparing the management fees of each Fund with a peer group of broadly comparable funds as determined by an independent data service; information regarding each Fund’s investment performance in comparison to a relevant peer group of funds as determined by an independent data service; the economic outlook and the general investment outlook in relevant investment markets; the Investment Manager’s results and financial condition and the overall organization of the Investment Manager; the allocation of brokerage and the benefits received by the Investment Manager as a result of brokerage allocation; the Investment Manager’s trading practices, including soft dollars; the Investment Manager’s management of relationships with custodians, transfer agents, pricing agents, brokers, and other service providers; the resources devoted to the Investment Manager’s compliance efforts undertaken on behalf of each Fund and the record of compliance with the compliance programs of each Fund, the Investment Manager, and its affiliates; the quality, nature, cost, and character of the administrative and other non-investment management services provided by the Investment Manager and its affiliates; the terms of the Prior Management Agreements; the Investment Manager’s gifts and entertainment log; and the reasonableness and appropriateness of the fee paid by each Fund for the services provided. The Boards concluded that the Investment Manager was using soft dollars for the benefit of each Fund and its shareholders. The Boards further concluded that the Investment Manager was using each Fund’s assets for the benefit of that Fund and its shareholders and was acting in the best interests of that Fund.
The Boards also considered the nature, extent, and quality of the management services provided by the Investment Manager. In so doing, the Boards considered the Investment Manager’s management capabilities with respect to the types of investments held by each Fund, including information relating to the education, experience, and number of investment professionals and other personnel who provided services under the Prior Management Agreements. The Boards also took into account the time and attention to be devoted by management to the Fund. The Boards evaluated the level of skill required to manage each Fund and concluded that the resources available at the Investment Manager were appropriate to fulfill effectively its duties on behalf of each Fund. The Boards noted that the employees of the Investment Manager are also employees of affiliates of the Investment Manager which have managed funds for many years and indicated their belief that a long-term relationship with capable, conscientious personnel is in the best interests of each Fund.
The Boards received information concerning the investment philosophy and investment process applied by the Investment Manager in managing each Fund. In this regard, the Boards considered the Investment Manager’s in-house research capabilities as well as other resources available to the Investment Manager’s personnel, including research services that may be available to the Investment Manager as a result of securities transactions effected for each Fund. The Boards concluded that the Investment Manager’s investment process, research capabilities, and philosophy were well suited to the Funds, given each Fund’s investment objective and policies. In their review of comparative information with respect to the Funds’ investment performance, the Boards received information from an independent data service comparing each Fund’s performance to that of a peer group of investment companies pursuing broadly similar strategies. After reviewing this information, the Boards concluded that Midas Magic and Perpetual Portfolio had performed within a range that the Boards deemed competitive. The Board noted that the performance of Midas Fund had lagged its peer group and discussed with personnel of the Investment Manager the factors that contributed to that Fund’s performance over certain periods and the steps that the Investment Manager had taken, or intended to take, to seek to improve the Fund’s long-term performance.
With respect to their review of the fees payable under the Prior Management Agreements, the Boards considered information from an independent data service comparing each Fund’s management fee and expense ratio to those of a peer group of broadly comparable funds. The Boards considered the mean and median of the management fees and expense ratios of each Fund’s peer group. In reviewing the information regarding the expense ratios of the Funds, the Boards concluded that although each Fund’s expense ratio, excluding extraordinary expenses, was within a higher range relative to that Fund’s peer group, it was competitive with comparable funds in light of the quality of services received and the level of assets managed. The Boards also evaluated any apparent or anticipated economies of scale in relation to the services the Investment Manager provided to each Fund. The Boards noted that economies of scale may develop for each Fund as its assets increase and fund level expenses decline as a percentage of assets, although such economies of scale may not necessarily be experienced by the Investment Manager. This information assisted the Boards in concluding that the fee paid by each Fund is within the range of those paid by comparable funds within the fund industry. Further, the Boards concluded that the Investment Manager’s fee bears a reasonable relationship to the services rendered and has been the product of arm’s-length bargaining.
BOARD APPROVAL of Agreements | |
In addition to the factors mentioned above, the Boards considered the fiduciary duty assumed by the Investment Manager in connection with the services rendered to each Fund and the business reputation of the Investment Manager and its financial resources. The Boards also considered information regarding the character and amount of other incidental benefits received by The Investment Manager and its affiliates from their association with the Funds. The Boards concluded that potential “fall-out” benefits that the Investment Manager and its affiliates may receive, such as greater name recognition, affiliated brokerage commissions, or increased ability to obtain research services, appear to be reasonable and may, in some cases, benefit the Funds. The Boards also considered the profitability of The Investment Manager from its association with the Funds. The Boards concluded that in light of the services rendered, the profits realized by the Investment Manager are not unreasonable.
The Boards considered all relevant factors and did not consider any single factor as controlling in determining whether or not to renew the Prior Management Agreements. In assessing the information provided by the Investment Manager and its affiliates, the Boards also noted that they were taking into consideration the benefits to shareholders of investing in a Fund or Funds that are part of the Fund Complex, which provides a variety of shareholder services.
Based on their consideration of the foregoing factors and conclusions, and such other factors and conclusions as they deemed relevant, the Boards, including all of the Independent Directors, concluded that the approval of the Prior Management Agreements, including the fee structure, is in the best interests of each Fund.
Basis for Approval of New Management Agreements
At joint in-person meetings of the Boards held on June 13, 2012 and August 2, 2012, the Boards, including all of the Independent Directors, unanimously approved a New Management Agreement for each Fund and unanimously determined to recommend that shareholders approve the New Investment Management Agreements for the Fund or Funds in which they hold shares.
Consideration of the New Management Agreements occurred soon after the Board’s annual consideration of whether to renew the Prior Management Agreements, carried out at their March 6, 2012 meeting pursuant to Section 15(c) of the Act. In that process, the Boards, following careful review of materials submitted by management of the Investment Manager and a report from an independent data service, unanimously determined that the Prior Management Agreement for each Fund was fair and reasonable and that its renewal would be in the best interests of each Fund. Accordingly, in considering the New Management Agreements, the Boards took into account the fact that the terms of the New Management Agreements are substantially similar to the Prior Management Agreements except for their effective dates and the addition of certain provisions that will standardize terms and language across all funds in the Fund Complex.
In evaluating the proposed New Management Agreements, the Boards noted that they had generally been satisfied with the nature, extent and quality of the services provided to each Fund by the Investment Manager. The Boards considered the nature, extent, and quality of the services expected to be provided by the Investment Manager in light of the passing of Bassett Winmill and the Transfer. In so doing, the Boards considered the Investment Manager’s management capabilities, including information relating to the experience and qualifications of the personnel at the Investment Manager who are responsible for providing services to the Funds.
With respect to Perpetual Portfolio, the Boards considered that Bassett Winmill had served as the Chief Investment Strategist on the Investment Policy Committee (the “IPC”) of The Investment Manager, which managed the investments of Perpetual Portfolio. The Board noted in this regard that the IPC, which has assumed portfolio management of the Fund, is currently comprised of Thomas Winmill as Chairman, Mark C. Winmill as Chief Investment Strategist, John F. Ramirez as Director of Fixed Income, and Irene Kawczynski as Vice President-Trading, and is well qualified to manage the Fund’s portfolio and provide day-to-day management of the Fund’s investments. The Boards took into account assurances from the Investment Manager that the appointment of Mark Winmill as Chief Investment Strategist had not resulted in any changes to the investment philosophy or investment process applied by the Investment Manager in managing Perpetual Portfolio and that the current members of the IPC had no current plans to change the investment philosophy or investment process applied by The Investment Manager in managing Perpetual Portfolio.
With respect to Midas Magic, the Boards considered that Bassett Winmill had served as portfolio manager of Midas Magic since 1999. The Boards noted that the IPC had been appointed to manage the investments of Midas Magic on May 15, 2012 following the passing of Bassett Winmill. The Boards took into account assurances from the Investment Manager that the current members of the IPC had no current plans to change the investment philosophy or investment process applied by Bassett Winmill or the Investment Manager in managing Midas Magic.
BOARD APPROVAL of Agreements | |
With respect to Midas Fund, the Boards noted that Thomas Winmill had served as the portfolio manager of Midas Fund since 2002 and would continue to serve as Midas Fund’s portfolio manager under the New Management Agreement for the Midas Fund. The Boards took into account assurances from the Investment Manager that Thomas Winmill had no current plans to change the investment philosophy or investment process applied by the Investment Manager in managing Midas Fund.
The Boards also considered whether there were any proposed changes to the management structure, capitalization, staffing, or operations at the Investment Manager aside from those changes discussed above. The Boards noted in this regard that Bassett Winmill had not been involved in the day-to-day administrative operations of the Investment Manager. The Boards took into account assurances from the Investment Manager that the passing of Bassett Winmill and the Transfer were not expected to result in any changes that would materially adversely impact the Investment Manager’s ability to provide the same level and quality of services as was provided in the past.
In addition, in connection with their consideration of the New Management Agreements, the Boards re-examined the factors they had taken into account in approving the Prior Management Agreements at the March 6, 2012 meeting including, among others: (1) the nature, extent, and quality of the services provided by the Investment Manager; (2) the performance of the Funds compared to their market indexes and their peer groups of investment companies; (3) the costs of the services provided and profits or losses realized by the Investment Manager and its affiliates from their relationship with the Funds; (4) the extent to which economies of scale might be realized as each Fund grows; and (5) whether fee levels reflect any such potential economies of scale for the benefit of investors in a Fund. In their deliberations, the Boards did not identify any particular information that was determinative or controlling, and each Director may have attributed different weights to the various factors.
In unanimously approving and recommending the New Management Agreements, the Boards, including all of the Independent Directors, concluded that the terms of the New Management Agreements are fair and reasonable and that approval of the New Management Agreements is in the best interests of each Fund. In reaching this determination, the Boards considered the following factors, among others:
| 1 | the similarities between the terms and conditions of the New Management Agreements and the terms and conditions of the Prior Management Agreements, and how the addition of certain provisions to the New Management Agreements will standardize terms and language in the investment management agreements across all funds in the Fund Complex; |
| 2 | the qualification of the Investment Manager, as well as the qualifications of its personnel and the Investment Manager’s financial condition; |
| 3 | the commitment of the Investment Manager to maintaining the investment philosophy and investment process applied by the Investment Manager in managing the Funds and the level and quality of services provided to the Funds; |
| 4 | the performance of each Fund relative to comparable mutual funds and unmanaged indices; |
| 5 | that the performance of each Fund was within the range that the Boards deemed competitive; |
| 6 | the fees and expense ratio of each Fund relative to comparable funds; |
| 7 | that the management fee is identical to that paid by each Fund under the Prior Management Agreement; and |
| 8 | that the expense ratios of the Funds although within a higher range of their peer groups as determined by an independent data service (excluding extraordinary expenses) is competitive with comparable funds in light of the quality of services received and assets managed. |
Quarterly Schedules of Portfolio Holdings
The Funds file their complete schedule of portfolio holdings with the Securities and Exchange Commission (“SEC”) for the first and third quarters of each fiscal year on Form N-Q. The Funds’ Forms N-Q are available on the SEC’s website at www.sec.gov and may be reviewed and copied at the SEC’s Public Reference Room in Washington, D.C. Information on the operation of the Public Reference Room may be obtained by calling 1-800-SEC-0330. The Funds’ quarterly reports on Form N-Q are also available on the Funds’ website at www.MidasFunds.com.
Proxy Voting Policies and Procedures
A description of the policies and procedures that the Funds use to determine how to vote proxies relating to portfolio securities is available, without charge, by calling 1-800-400-MIDAS (6432) and on the website of the SEC at www.sec.gov. Information regarding how the Funds voted proxies relating to portfolio securities during the most recent 12 month period ended June 30 is available without charge, by calling 1-800-400-MIDAS (6432), on the website of the SEC at www.sec.gov, and on the Funds’ website at www.MidasFunds.com.
| | • IRA Retirement Accounts, including Traditional, Roth, Self-Employed, and Small Business (SEP, SIMPLE) |
| | • Education Savings Accounts |
| | • Health Savings Accounts |
| | • Online and toll free telephone account access |
| | • Electronic delivery of account statements, reports, and prospectus, etc. |
Only $1,000 minimum to open a Midas Funds account, with subsequent minimum investments of $100.
There is NO FEE to open an account.
Join our free and automatic Midas Bank Transfer Plan and open an account for only $100, and make subsequent monthly investments of $100 or more.
SIGN UP FOR ELECTRONIC DELIVERY
Midas shareholders can now sign up for electronic delivery of their account statements, confirmations, annual and semi-annual reports, prospectuses, and other material to receive Midas information more quickly and conveniently.
It is fast and easy to sign up for electronic delivery. Just follow these three simple steps:
(1) go to www.MidasFunds.com and log into THE MIDAS TOUCH® - Account Access
(2) after logging in, at the Portfolio Summary, click on an account number and then select Account Detail from the left side menu, and
(3) click on Electronic Document Delivery. On this page you can choose to have either account and confirmation statements or regulatory items, such as annual and semi-annual reports and prospectuses, or both, sent to any e-mail address you wish. That’s it!
NEW ACCOUNT Application Instructions | |
MIDAS REGULAR ACCOUNT APPLICATION
| 1 | REGISTRATION If there is more than one owner of the account, the registration will be “Joint Tenants with Right of Survivor-ship” unless you specify “Tenants in Common.” If this is a Uniform Gift/Transfer to a Minor, please enter all information requested for the minor. |
| 2 | MAILING AND E-MAIL ADDRESSES, TELEPHONE NUMBER, AND CITIZENSHIP If you are a non-U.S. citizen residing in the United States, in addition to this Account Application, you will be required to attach a Form W-8 BEN, which can be obtained from the IRS website at www.irs.gov or calling 1-800-829-3676. If this is a Uniform Gift/Transfer to a Minor, please enter all information for the Custodian, including the custodian’s physical address. |
| 3 | CHOOSE FUND(S) AND AMOUNT INVESTED Indicate the Fund(s) in which you are opening an account. The opening minimum for a Fund is $1,000 ($100 for Midas Automatic Investment Programs – see Section 7 of the Account Application). The minimum subsequent investment is $100. |
| 4 | DISTRIBUTIONS Your dividends and distributions will be reinvested in additional shares of the Fund unless you instruct Midas otherwise. |
| 5 | SHAREHOLDER COMMUNICATIONS Account and confirmation statements, shareholder reports, and prospectuses will be sent to the address you provided in Section 2 above. To learn more about how you can access your account online and sign up for electronic delivery of these materials, please visit www.MidasFunds.com/edelivery. |
| 6 | COST BASIS Check the method of cost basis you would prefer. Mutual funds are required to report cost basis to the IRS. The cost basis of the different shares you own is used to calculate the gain or loss of the shares sold. Cost basis is the original price paid for your shares. The default cost basis for each of the Midas Funds is the Average Cost method. Under the Average Cost method, all of the share purchase costs are added together in an aggregate cost amount. The cost per share is then determined by dividing the aggregate cost amount by the total shares in the account. Other cost basis calculation methods permitted by the IRS are available. Visit www.MidasFunds.com/tax-planning for additional information on cost basis. |
| 7 | MIDAS SHAREHOLDER SERVICES - MIDAS BANK TRANSFER PLAN/THE MIDAS TOUCH® With the free Midas Bank Transfer Plan (BTP), you can establish a convenient and affordable long term investment program. The $1,000 minimum investment requirement is waived since the Midas BTP is designed to facilitate an automatic monthly investment of $100 or more into your Fund account(s). Please specify the total amount you want to invest each month, the Fund and when you’d like to start. |
All shareholders can obtain information about their account 24 hours a day, every day, at www.MidasFunds.com and by automated telephone response at 1-800-400-MIDAS (6432). Only with THE MIDAS TOUCH® can you manage your account by purchasing or redeeming Fund shares using electronic funds transfer, initiate Fund to Fund transfers among the three Midas Funds, and perform transactions through a Shareholder Services Representative.
To activate these features, please indicate your bank routing and account numbers or attach a voided check.
| 8 | SIGNATURE AND CERTIFICATION TO AVOID BACKUP WITHHOLDING After reading this section, please sign and date the Account Application. |
SEND BY MAIL Mail your completed Account Application to Midas Funds, P.O. Box 6110, Indianapolis, IN 46206-6110. Checks must be payable to Midas Funds in U.S. dollars. Third party checks and money orders (other than money orders issued by a bank) cannot be accepted.
SEND BY WIRE Call 1-800-400-MIDAS (6432) between 8 a.m. and 6 p.m. ET, on business days to speak with a Shareholder Services Representative. A completed Account Application, the name of the bank sending the wire, and the amount to be wired are required before the wired funds can be accepted. The completed Account Application should be faxed to 1-317-937-3014, Attn: Midas Funds. You will then be assigned a Fund account number and receive wiring address information. Your account number and name(s) must be specified in the wire as they are to appear on the account registration. You should then enter your account number on your completed Account Application and promptly mail it to Midas Funds, P.O. Box 6110, Indianapolis, IN 46206-6110. This service is not available on days when the Federal Reserve wire system is closed.
IF YOU NEED ANY ASSISTANCE IN COMPLETING THE ACCOUNT APPLICATION, PLEASE CALL A SHAREHOLDER SERVICES REPRESENTATIVE AT 1-800-400-MIDAS (6432) BETWEEN THE HOURS OF 8 A.M. AND 6 P.M. ET.

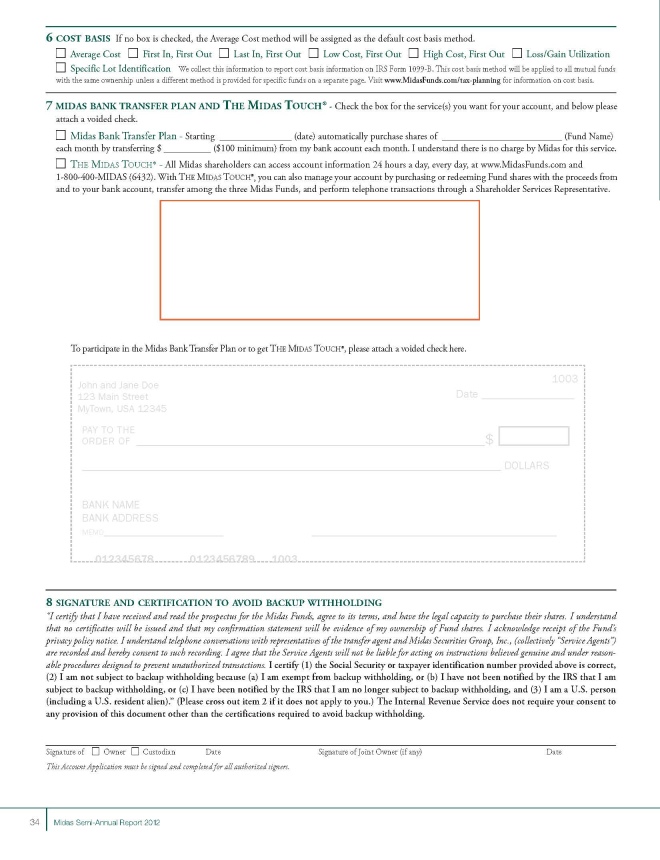


Item 2. Code of Ethics.
Not applicable.
Item 3. Audit Committee Financial Expert.
Not applicable.
Item 4. Principal Accountant Fees and Services.
Not applicable.
Item 5. Audit Committee of Listed Registrants.
Not applicable.
Item 6. Investments.
Included as part of the report to stockholders filed under Item 1 of this Form.
Item 7. Disclosure of Proxy Voting Policies and Procedures for Closed-End Management Investment Companies.
Not applicable.
Item 8. Portfolio Managers of Closed-End Management Investment Companies.
Not applicable.
Item 9. Purchases of Equity Securities by Closed-End Management Investment Company and Affiliated Purchase.
Not applicable.
Item 10. Submission of Matters to a Vote of Security Holders.
There were no material changes to the procedures by which shareholders may recommend nominees to the registrant's board of directors made or implemented after the registrant last provided disclosure in response to the requirements of Item 407(c)(2)(iv) of Regulation S-K (17 CFR 229.407), or this Item.
Item 11. Controls and Procedures.
| (a) | The registrant's principal executive officer and principal financial officer have concluded that the registrant's disclosure controls and procedures (as defined in Rule 30a- 3(c) under the Investment Company Act of 1940, as amended (the "1940 Act")) are effective as of a date within 90 days of the filing date of this report that includes the disclosure required by this paragraph, based on their evaluation of the disclosure controls and procedures required by Rule 30a-3(b) under the 1940 Act and 15d-15(b) under the Securities Exchange Act of 1934. |
| (b) | There were no changes in the registrant's internal control over financial reporting (as defined in Rule 30a-3(d) under the 1940 Act) that occurred during the registrant's second fiscal quarter of the period covered by the report that have materially affected, or are likely to materially affect the registrant's internal control over financial reporting. |
| (a) | Certifications pursuant to Rule 30a-2(a) under the Investment Company Act of 1940(17 CFR 270.360a-2) attached hereto as Exhibits EX-31 and certifications pursuant to 18 U.S.C. Section 1350, as adopted pursuant to Section 906 of the Sarbanes-Oxley Act of 2002 attached hereto as Exhibit EX-32. |
Pursuant to the requirements of the Securities Exchange Act of 1934 and the Investment Company Act of 1940, the registrant has duly caused this report to be signed on its behalf by the undersigned, thereunto duly authorized.
| | |
| | Midas Perpetual Portfolio, Inc. |
| | |
| September 10, 2012 | By: /s/ Thomas B. Winmill |
| | Thomas B. Winmill |
| | President |
| | |
| | |
| | Midas Perpetual Portfolio, Inc. |
| | |
| By: /s/ Thomas O’Malley |
| | Thomas O’Malley |
| | Chief Financial Officer |
Pursuant to the requirements of the Securities Exchange Act of 1934 and the Investment Company Act of 1940, the registrant has duly caused this report to be signed below by the following persons on behalf of the registrant and in the capacities and on the dates indicated.
| | |
| | Midas Perpetual Portfolio, Inc. |
| | |
| By: /s/ Thomas B. Winmill |
| | Thomas B. Winmill |
| | President |
| | |
| | |
| | Midas Perpetual Portfolio, Inc. |
| | |
| By: /s/ Thomas O’Malley |
| | Thomas O’Malley |
| | Chief Financial Officer |