| |
| | |
| 1 |
| | |
| Portfolio Commentary | |
| 2 |
| 3 |
| 4 |
| | |
| 5 |
| | |
| Financial Statements | |
| Schedule of Portfolio Investments | |
| 6 |
| 8 |
| 10 |
| 12 |
| 13 |
| 14 |
| 15 |
| 16 |
| 24 |
| | |
| Supplemental Information | |
| 27 |
| 29 |
| 30 |
| | |
| Opening Your Account | |
| 31 |
| 32 |
Midas Fund (Ticker: MIDSX) | Midas Magic (Ticker: MISEX) | Midas Perpetual Portfolio (Ticker: MPERX) |
| Seeks capital appreciation and protection against inflation and, secondarily, current income through investments primarily in precious metals and natural resource companies and gold, silver, and platinum bullion. | Seeks capital appreciation by investing in any security type in any industry sector and in domestic and foreign companies of any size. | Seeks to preserve and increase the purchasing power value of its shares over the long term by investing in gold, silver, Swiss franc assets, hard asset securities, large capitalization growth stocks, and dollar assets. |
| | Some things just about never change. As an example, for 94 years the United States has been given the coveted “AAA” rating, the highest investment grade, by Moody's Investors Service, Inc. But, how is that possible in view of a recent analysis of U.S. debt and future obligations estimating the total at $76 trillion? Annual U.S tax receipts are only $2.1 trillion, and about $0.5 trillion of that goes to pay interest on the debt. Meanwhile, U.S. spending currently exceeds $3.4 trillion per year. |  |
So it seems clear to us at Midas that some things may change for the United States if it is to deal effectively with its $76 trillion burden. Taxes may increase, inflation may increase, reduced government spending may mean a slower economy, and entitlement benefits may be reduced. Speaking of the future, investors might plan for even more market volatility in 2013. That’s when some estimate the United States will be faced with yet another debt ceiling crisis, the Bush tax cuts are scheduled to expire, and the sequester goes into effect, i.e. across the board spending cuts if U.S. debt reduction goals are not met.
Economic changes, market volatility, and the future always pose challenges for investors. That’s what makes financial planning now so important. To support sound financial plans, at Midas we emphasize quality investing over the long term.
DISCOVERING OPPORTUNITIES AND PLANNING
Standard & Poor’s, in contrast to Moody’s, recently did downgrade U.S. debt from AAA to AA+. Interestingly, Canada lost its AAA rating in April 1993 and then Canadian stocks gained more than 15% in the subsequent year. After Moody's downgraded Japan in November 1998, its stock market rose over 25% in the following 12 months. By riding out the current storm of market volatility and investor worry, could U.S. investors likewise benefit? No one knows today, of course, but the current situation may represent an opportunity to get started for those seeking to plan for financial goals, such as college tuition or retirement.
At Midas, we have long recognized the importance of dealing with economic and market uncertainty in an investment portfolio and that is why we offer three funds – so investors can diversify their portfolios among the three funds, with their differing investment objectives and policies. Midas Fund seeks primarily capital appreciation and protection against inflation and, secondarily, current income through investments primarily in precious metals and natural resource companies and gold, silver, and platinum bullion. Midas Perpetual Portfolio seeks to preserve and increase the purchasing power value of its shares with a target asset allocation strategy that includes gold and silver, Swiss franc assets, hard asset securities, large cap growth stocks, and dollar assets. Midas Magic seeks capital appreciation by investing in any security type in any industry sector and in domestic and foreign companies of any size and typically employs leverage to enhance returns.
Given the uncertainties, we suggest that investors take positive steps today to implement a plan to seek their own long term goals. Positive steps might include regularly adding to your Midas account pursuant to a long term plan and contributing to a tax advantaged retirement account. In this connection, we suggest you consider one or more of the Midas Funds and the tax advantaged Midas Traditional, Roth, SEP, and SIMPLE IRA. Midas also offers Health Savings Accounts as well as Education Savings Accounts. Forms for all of these plans may be found at www.MidasFunds.com.
SIGN UP FOR ELECTRONIC DELIVERY
Midas shareholders can also sign up for electronic delivery of their account statements, confirmations, annual and semi-annual reports, prospectuses, and other updates. Benefits of electronic delivery include getting all your Midas information more quickly and conveniently, securely storing your account documents on the site for up to four years where you can view or print them at any time, and reducing the risk of identity theft. It is fast and easy to sign up for electronic delivery. Just follow these three simple steps: (1) go to www.MidasFunds.com and log into “Account Access,” (2) after logging in, at the Portfolio Summary, click on an account number and then select “Account Detail” from the left side menu, and (3) click on “Electronic Document Delivery.” On this page you can choose to have either account and confirmation statements or regulatory items, such as annual and semi-annual reports and prospectuses, or both, sent to the email address you wish.
MIDAS QUALITY FOR THE LONG TERM
If you would like to learn more about the Midas philosophy of quality investing for the long term, the Midas family of funds, or our attractive suite of shareholder services, please call us at 1-800-400-MIDAS (6432), or visit www.MidasFunds.com. We will be happy to answer any questions you may have, without any obligation on your part. We look forward to hearing from you. Thank you for investing with Midas!
Sincerely,
Thomas B. Winmill
President
Midas Fund seeks primarily capital appreciation and protection against inflation and, secondarily, current income. The Fund primarily invests in (i) securities of companies principally involved in the business of mining, processing, fabricating, distributing or otherwise dealing in gold, silver, platinum, or other natural resources and (ii) gold, silver, and platinum bullion. We are pleased to submit this 2011 Semi-Annual report and to welcome new shareholders attracted to the Fund by its objectives and policies, as well as its track record of past performance and its no charge shareholder services.
MARKET REVIEW, STRATEGIES, AND OUTLOOK
In the first half of 2011, gold prices fluctuated between $1,319 and $1,552 per ounce, averaging about $1,447 and ending the period at $1,505 (all prices based on the London pm fix). The gold price has recently continued to strengthen to over $1,600, apparently as worries of global fiscal instability from the threatened insolvency of Greece and ongoing weakness of U.S. and other world economies make headlines. Less often mentioned in the media are U.S. Bureau of Labor Statistics reports of continuing increases in the consumer price index (the CPI, which is often viewed as a measure of inflation). In the 12 months ending in June 2010, the CPI rose 1.1%, but since then inflation has started to accelerate. In the 12 months ending in December 2010 the CPI rose 1.5%, by March 2011, 2.7%, and in June 2011 to 3.6%. We expect even more inflation in the years ahead.
While the “fear factor” may drive future short term price swings, we believe that gold has the potential to spike as high as $1,700 per ounce by year end due to medium term favorable seasonal and fundamental supply and demand factors. According to the World Gold Council, Chinese and Indian jewelry purchasing could remain a continuing source of gold demand in the second half of 2011, as seen during the recent Akshaya Tritiya festival and the beginning of the wedding season. Formerly a dampening source of supply, net purchasing by central banks is resulting in an important new actual and psychological source of demand. Meanwhile, increased scrap sales and mining supply appear to be offset in part by increased retail investment demand both in the United States and abroad. But it is due to longer term, intractable, U.S. fiscal and monetary woes that we are projecting gold prices to rise as high as $1,800 in 2012. Global institutional capital, and its enormous money flows, could seek gold as an “alternative currency.” Catalysts for the perception of gold as a viable and attractive alternative to currencies, particularly the currencies of debtor nations, include the continuation of the fiscaland monetary policies, including seemingly unstoppable deficit spending, being implemented in most industrial countries today in order to counter sluggish economies and stubbornly high unemployment rates. Indeed, if this stimulus spending is successful in raising productivity rates and economic growth, the result might be dramatically lower gold prices. By searching for quality investments consistent with our growth discipline, however, we seek to address the risks inherent in the precious metals sector yet position Midas Fund to benefit from these important global trends.
The first half of the year witnessed much market volatility, and mining stocks generally underperformed the metal. The Fund’s strategy of investing in quality precious metals and natural resource companies resulted in disappointing returns in the first half. Nevertheless, Midas Fund increased its overall investments in the second quarter as we waited patiently for the valuations of the shares versus the metal to come back in balance. As economic and market conditions and concerns unfold over the second half 2011, the Fund expects its aggressively leveraged posture to result in further volatility, but also further potential to enhance returns with its portfolio of strong companies at attractive valuations. Midas continues to emphasize mining companies offering financial strength, expanding production profiles, increasing cash flow, promising exploration potential, and/or other special growth features.
| TOP 10 |
| HOLDINGS |
| AS OF JUNE 30, 2011 |
| 1 | Goldcorp Inc. |
| 2 | Avocet Mining PLC |
| 3 | Freeport-McMoRan Copper & Gold Inc. |
| 4 | Northgate Minerals Corp. |
| 5 | Newmont Mining Corp. |
| 6 | Northern Dynasty Minerals Ltd. |
| 7 | Kinross Gold Corp. |
| 8 | Eldorado Gold Corp. Ltd. |
| 9 | Jaguar Mining, Inc. |
| 10 | Impala Platinum Holdings Ltd. |
| Top Ten Holdings comprise approximately 46% of total assets. |
Although renamed from Midas Special Fund, Midas Magic has continued seeking its objective of capital appreciation in quality companies with unique combinations of strength in operations, products, and finances with growth or value characteristics. We are pleased to submit this 2011 Semi-Annual Report for the Fund to update shareholders on the Fund’s strategy of investing in any security type and in any industry sector, in domestic or foreign companies, and in companies of any size to seek its investment objective. We note that the Fund also may invest defensively, as well as employ speculative investment techniques such as borrowing money for investment purposes, a practice known as leveraging.
ECONOMIC AND MARKET REPORT
While the global economy is no longer in crisis, according to a recent report of the World Bank, economic activity in developing countries has slowed due to the earthquake and tsunami in Japan and political turmoil in the Middle East and North Africa. Possibly, economic activity has been further dampened by uncertainty over the ongoing sovereign debt crisis in Europe and the debt ceiling impasse in the United States. Interestingly, the World Bank forecasts global growth to recover from 2011 through 2013, strengthening from 3.2% in 2011 to a 3.6% pace in each of 2012 and 2013.
In the United States, economic activity in the manufacturing sector expanded in June for the 23rd consecutive month, but non-manufacturing declined, indicating a slowing of service sector growth, according to the Institute of Supply Management. In keeping its target rate to a range of between 0% and 0.25% –which has been in effect since December 2008 – the U.S. Federal Reserve Open Market Committee (FOMC) noted at its June meeting that recent economic data had been weaker than expected, and expressed caution about the likely pace of improvement in the economy over coming quarters. Specific concerns of the FOMC were recent increases in the prices of food and energy (with annualized general inflation recently over 3%), damped consumer sentiment, the pace of business investment and hiring, unemployment, and the depressed housing sector. Slowing growth appears to be leading to a jobless recovery in the United States. In the recent quarter, real personal income and spending weakened and the number of Americans working in full time jobs is actually down slightly from June 2010.
CAPITAL APPRECIATION STRATEGIES AND OUTLOOK
In these uncertain economic conditions, the Fund’s strategy was generally to stay the course, maintain a disciplined but aggres-sively leveraged investment posture, and concentrate its portfolio in quality companies with attractive valuations. At June 30, 2011, the Fund held shares in just 12 companies and its top ten holdings comprised approximately 87% of its total assets, with its long term holdings including some of the largest and best known U.S. companies with global operations in finance, technology, insurance, and banking. Our current view of financial markets suggests that the Fund may benefit during the remainder of 2011 from its flexible portfolio approach, investing opportunistically, and employing aggressive and speculative investment techniques as deemed appropriate. As the Fund pursues its capital appreciation objective through this flexible approach, its holdings and allocations are subject to substantial change at any time.
CONTACT US FOR INFORMATION AND SERVICES
Midas Magic’s solid approach to quality companies makes it an attractive vehicle for a program of long term investing and we believe the Fund can be especially appropriate for tax advantaged retirement accounts. For retirement, medical, and tuition financial planning goals, consider the Midas Traditional, Roth, SEP, or SIMPLE IRA, the Midas Health Savings Account, as well as the Midas Education Savings Account. Forms for all of these tax advantaged plans may be found at www.MidasFunds.com.
| TOP 10 |
| HOLDINGS |
| AS OF JUNE 30, 2011 |
| 1 | Berkshire Hathaway, Inc. Class B |
| 2 | MasterCard, Inc. |
| 3 | Google, Inc. |
| 4 | Apple Inc. |
| 5 | Canadian Natural Resources Ltd. |
| 6 | Costco Wholesale Corp. |
| 7 | JPMorgan Chase & Co. |
| 8 | Johnson & Johnson |
| 9 | General Electric Company |
| 10 | Abbott Laboratories |
| Top Ten Holdings comprise approximately 87% of total assets. |
MIDAS Perpetual Portfolio
We are delighted to welcome our new shareholders who have invested in Midas Perpetual Portfolio directly or through one of the many brokerage firms making the Fund available to its customers. In these times particularly, it is gratifying indeed to see such a welcoming response to Midas Perpetual Portfolio’s objective of preserving and increasing the purchasing power value of its shares over the long term. It is also a pleasure to submit this 2011 Semi-Annual Report for the Fund.
ECONOMIC REPORT AND FUND STRATEGIES
The pace of growth in the world economy is generally slowing. Real U.S. gross domestic product (GDP) – the output of goods and services produced by labor and property located in the country – increased at an annual rate of 1.9% in the first quarter of 2011, according to the U.S. Bureau of Economic Analysis, compared to 3.1% in the fourth quarter. GDP growth in China, the world second biggest economy, was reported by its National Bureau of Statistics to have moderated to a 9.7% rate in the first quarter’s end, still impressive but reflective of the government’s attempt to cool the economy and tame inflation apparently now exceeding a 6% annualized rate. Japan, the world third largest economy, saw its GDP actually contract 0.9% in the first quarter of 2011. In contrast, the Euro area is showing slightly improving growth, with its GDP estimated to have increased by 0.8% during the first quarter of 2011 compared to 0.3% in the fourth quarter of 2010, according to estimates released by Eurostat, the statistical office of the European Union.
| Investment Category | Target Percentage |
| Gold | 20% |
| Silver | 5% |
| Swiss Franc Assets | 10% |
| Hard Asset Securities | 15% |
| Large Capitalization Growth Stocks | 15% |
| Dollar Assets | 35% |
| Total | 100% |
In the first half of 2011, Midas Perpetual Portfolio hewed to its core asset allocation strategy to preserve and increase the value of its overall portfolio in view of these challenging circumstances. The Fund invested in gold and silver (through exchange traded funds), Swiss franc denominated bonds of the federal government of Switzerland, shares of real estate and natural resource companies, large capitalization growth stocks, and U.S. money market funds. In pursuit of its investment objective, the Fund generally seeks to invest a “Target Percentage” of its total assets in each ofthe above categories, consistent with tax planning and controlling portfolio turnover. These investment categories, although subject to risk of potential loss, have been chosen and weighted with the goal of providing downside protection to the overall portfolio in most foreseeable economic conditions, whether the outcome of slowing world growth is inflation or deflation, fluctuating interest rates, a depreciating U.S. dollar, a resurgent U.S. economy, or otherwise.
TAX ADVANTAGED INVESTING
Importantly, the investment strategy of Midas Perpetual Portfolio acknowledges a broad range of economic possibilities and investing outlooks, and seeks to incorporate investments appropriate for each of them. Investors who wish to invest all or a portion of their capital in a way that does not depend on any particular outcome for the economy should consider purchasing shares of the Fund. To make regular investing in Midas Perpetual Portfolio as easy, convenient, and affordable as possible, we offer the Midas Bank Transfer Plan. The Fund’s objective also makes it attractive for investment through our Traditional or Roth IRAs, Health Savings Accounts, and our Education Savings Accounts. For information simply give us a call toll free at 1-800-400-MIDAS (6432) and we will be happy to provide this information to you or a friend or relative.
| TOP 10 |
| HOLDINGS |
| AS OF JUNE 30, 2011 |
| 1 | SSgA Money Market Fund |
| 2 | SPDR Gold Trust |
| 3 | Switzerland Government, 2.5% Notes, due 3/12/16 |
| 4 | iShares Silver Trust |
| 5 | Companhia de Bebidas das Americas - AMBEV |
| 6 | Banco Bradesco S.A. |
| 7 | Apple Inc. |
| 8 | China Mobile Ltd. ADR |
| 9 | Microsoft Corp. |
| 10 | Enbridge Inc. |
| Top Ten Holdings comprise approximately 69% of total assets. |
| Financial Statements | |
| MIDAS Fund | Schedule of Portfolio Investments - June 30, 2011 (Unaudited) |
| Common Stocks (117.58%) | | | | | | |
| Shares | | | | Cost | | | Value | |
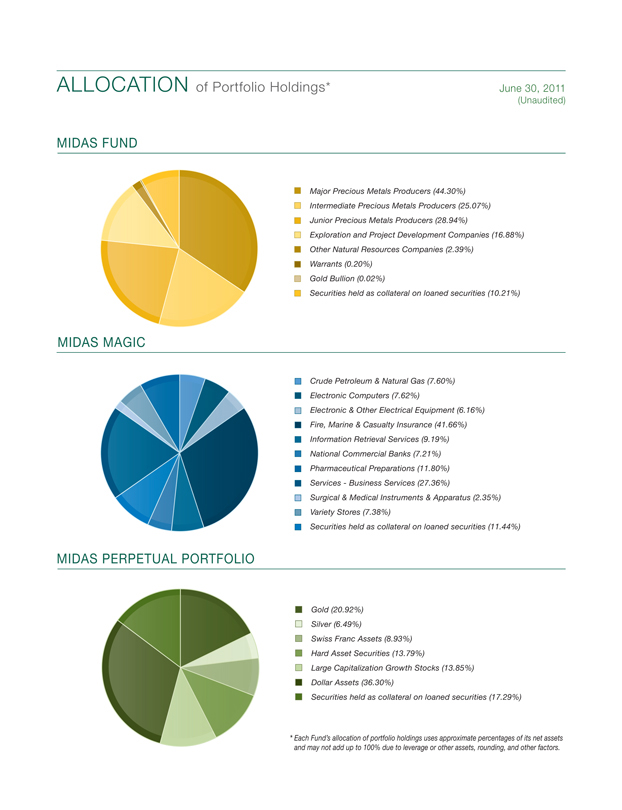
| Major Precious Metals Producers (44.30%) | | | | | | |
| | 100,000 | | AngloGold Ashanti Ltd. ADR (a) | | $ | 4,479,423 | | | $ | 4,209,000 | |
| | 45,000 | | BHP Billiton Ltd. (b) (c) | | | 4,323,573 | | | | 4,258,350 | |
| | 120,000 | | Freeport-McMoRan Copper & Gold Inc. (a) | | | 5,054,576 | | | | 6,348,000 | |
| | 190,000 | | Goldcorp Inc. (a) | | | 9,416,419 | | | | 9,171,300 | |
| | 170,000 | | Impala Platinum Holdings Ltd. (a) | | | 5,222,169 | | | | 4,568,860 | |
| | 319,369 | | Kinross Gold Corp. (a) | | | 6,409,617 | | | | 5,046,030 | |
| | 100,755 | | Newcrest Mining Ltd. (b) | | | 2,220,469 | | | | 4,067,695 | |
| | 100,000 | | Newmont Mining Corp. (a) | | | 5,940,870 | | | | 5,397,000 | |
| | | | | | | 43,067,116 | | | | 43,066,235 | |
| | | | | | | | | | | | |
| Intermediate Precious Metals Producers (25.07%) | | | | | | | | |
| | 350,000 | | African Barrick Gold plc | | | 3,061,809 | | | | 2,327,976 | |
| | 275,400 | | Centerra Gold Inc. (a) (c) | | | 2,833,774 | | | | 4,565,744 | |
| | 325,000 | | Eldorado Gold Corp. Ltd. (a) | | | 5,655,700 | | | | 4,790,500 | |
| | 200,000 | | IAMGOLD Corp. (c) | | | 3,671,460 | | | | 3,752,000 | |
| | 575,000 | | Northam Platinum Ltd. | | | 1,552,969 | | | | 3,602,338 | |
| | 30,000 | | Randgold Resources Ltd. ADR (b) | | | 2,403,978 | | | | 2,521,500 | |
| | 300,000 | | Silvercorp Metals, Inc. (a) | | | 1,941,191 | | | | 2,814,000 | |
| | | | | | | 21,120,881 | | | | 24,374,058 | |
| | | | | | | | | | | | |
| Junior Precious Metals Producers (28.94%) | | | | | | | | |
| | 200,000 | | Alamos Gold Inc. (a) | | | 2,506,500 | | | | 3,309,502 | |
| | 135,000 | | Aurizon Mines Ltd. (b) (c) | | | 797,838 | | | | 754,650 | |
| | 2,100,000 | | Avocet Mining PLC (c) | | | 3,548,756 | | | | 7,257,016 | |
| | 600,000 | | CGA Mining Ltd. (c) | | | 895,814 | | | | 1,858,875 | |
| | 1,000,000 | | Great Basin Gold Ltd. (b) (c) | | | 2,816,753 | | | | 2,090,042 | |
| | 175,000 | | HudBay Minerals Inc. | | | 2,861,250 | | | | 2,619,750 | |
| | 1,000,000 | | Jaguar Mining, Inc. (b) (c) | | | 4,985,274 | | | | 4,780,023 | |
| | 2,100,000 | | Northgate Minerals Corp. (b) (c) | | | 6,007,060 | | | | 5,460,000 | |
| | | | | | | 24,419,245 | | | | 28,129,858 | |
| | | | | | | | | | | | |
| Exploration and Project Development Companies (16.88%) | | | | | | | | |
| | 250,000 | | Corvus Gold Inc. (b) (c) | | | 290,236 | | | | 147,653 | |
| | 85,000 | | Detour Gold Corp. (a) (c) | | | 1,266,311 | | | | 2,461,662 | |
| | 500,000 | | Geomark Exploration Ltd. (c) | | | 174,406 | | | | 538,804 | |
| | 500,000 | | International Tower Hill Mines Ltd. (c) | | | 2,657,727 | | | | 3,770,000 | |
| | 37,699 | | Ivanhoe Nickel & Platinum Ltd. (c) (d) | | | 0 | | | | 113,097 | |
| | 500,000 | | Northern Dynasty Minerals Ltd. (c) | | | 6,315,719 | | | | 5,050,000 | |
| | 1,500,000 | | Platinum Group Metals Ltd. (b) (c) | | | 3,159,430 | | | | 2,625,000 | |
| | 1,000,000 | | Romarco Minerals Inc. (c) | | | 1,998,208 | | | | 1,699,306 | |
| | | | | | | 15,862,037 | | | | 16,405,522 | |
| | | | | | | | | | | | |
| | | | | | | | | | | | |
See notes to financial statements.
| Financial Statements | |
| MIDAS Fund | Schedule of Portfolio Investments - June 30, 2011 (Unaudited) continued |
Common Stocks - continued Shares | | | | | | | |
| Other Natural Resources Companies (2.39%) | | Cost | | | Value | |
| | | | | | | | | | |
| | | 445,000 | | Forsys Metals Corp. (c) | | $ | 2,112,344 | | | $ | 689,750 | |
| | | 550,000 | | Mercator Minerals Ltd. (b) (c) | | | 2,891,248 | | | | 1,629,883 | |
| | | | | | | | 5,003,592 | | | | 2,319,633 | |
| | Total common stocks | | | 109,472,871 | | | | 114,295,306 | |
| | | | | | | | | | | | | |
| Warrants (0.20%) (c) | | | | | | | | |
| | | | | | | | | | | | |
| | Units | | | | | | | | | | |
| | | 100,000 | | Kinross Gold Corp., expiring 9/07/11 | | | - | | | | 5,050 | |
| | | 142,900 | | Kinross Gold Corp., expiring 9/03/13 | | | 577,052 | | | | 168,797 | |
| | | 7,150 | | Kinross Gold Corp., expiring 9/17/14 (b) | | | - | | | | 18,151 | |
| | Total warrants | | | | 577,052 | | | | 191,998 | |
| | | | | | | | | | | | |
| Bullion Ounces (0.02%) (c) | | | 577,052 | | | | 191,998 | |
| | | | | | | | | | | | | |
| | | 10 | | Gold | | | 9,643 | | | | 14,992 | |
| | | | | | | | | | | | | |
| Securities held as Collateral on Loaned Securities (10.21%) | | | | | | | | |
| | | | | | | | | | | | | |
| | | 9,923,549 | | State Street Navigator Securities Lending Prime Portfolio | | | 9,923,549 | | | | 9,923,549 | |
| | | | | | | | | | | | | |
| | Total investments (128.01%) | | $ | 119,983,115 | | | | 124,425,845 | |
| | | | | | | | | | | | | |
| | Liabilities in excess of other assets (-28.01%) | | | | | | | (27,217,772 | ) |
| | | | | | | | | | | | | |
| | Net assets (100.00%) | | | | | | $ | 97,208,073 | |
| | | | | | | | | | | | | |
(a) Fully or partially pledged as collateral on bank credit facility.
(b) All or a portion of this security was on loan.
(c) Non-income producing.
(d) Illiquid and/or restricted security that has been fair valued.
ADR means “American Depositary Receipt.”
See notes to financial statements.
| Financial Statements | |
| MIDAS Magic | Schedule of Portfolio Investments - June 30, 2011 (Unaudited) |
| Common Stocks (128.33%) | | | | | | |
| Shares | | | | Cost | | | Value | |
| Crude Petroleum & Natural Gas (7.60%) | | | | | | |
| | | | | | | | | | | | |
| | 20,000 | | Canadian Natural Resources Ltd. | | $ | 522,599 | | | $ | 837,200 | |
| | | | | | | | | | | | |
| Electronic Computers (7.62%) | | | | | | | | |
| | | | | | | | | | | | |
| | 2,500 | | Apple Inc. (a) (b) | | | 477,375 | | | | 839,175 | |
| | | | | | | | | | | | |
| Electronic & Other Electrical Equipment (6.16%) | | | | | | | | |
| | | | | | | | | | | | |
| | 36,000 | | General Electric Company (b) | | | 435,510 | | | | 678,960 | |
| | | | | | | | | | | | |
| Fire, Marine & Casualty Insurance (41.66%) | | | | | | | | |
| | | | | | | | | | | | |
| | 52,500 | | Berkshire Hathaway, Inc. Class B (a) (b) (c) | | | 1,744,890 | | | | 4,062,975 | |
| | 9,000 | | The Travelers Companies, Inc. (c) | | | 416,182 | | | | 525,420 | |
| | | | | | | 2,161,072 | | | | 4,588,395 | |
| | | | | | | | | | | | |
| Information Retrieval Services (9.19%) | | | | | | | | |
| | | | | | | | | | | | |
| | 2,000 | | Google, Inc. (a) (b) | | | 758,730 | | | | 1,012,760 | |
| | | | | | | | | | | | |
| National Commercial Banks (7.21%) | | | | | | | | |
| | | | | | | | | | | | |
| | 19,400 | | JP Morgan Chase & Co. (b) | | | 691,858 | | | | 794,236 | |
| | | | | | | | | | | | |
| Pharmaceutical Preparations (11.80%) | | | | | | | | |
| | | | | | | | | | | | |
| | 10,800 | | Abbott Laboratories | | | 572,587 | | | | 568,296 | |
| | 11,000 | | Johnson & Johnson (b) | | | 669,169 | | | | 731,720 | |
| | | | | | | 1,241,756 | | | | 1,300,016 | |
| | | | | | | | | | | | |
| Services - Business Services (27.36%) | | | | | | | | |
| | | | | | | | | | | | |
| | 10,000 | | MasterCard, Inc. (b) | | | 937,175 | | | | 3,013,400 | |
| | | | | | | | | | | | |
| Surgical & Medical Instruments & Apparatus (2.35%) | | | | | | | | |
| | | | | | | | | | | | |
| | 3,000 | | Becton, Dickinson and Company (c) | | | 210,947 | | | | 258,510 | |
| | | | | | | | | | | | |
See notes to financial statements.
| Financial Statements | |
| MIDAS Magic | Schedule of Portfolio Investments - June 30, 2011 (Unaudited) continued |
| | Common Stocks - continued | | | | | | |
| | Shares | | | | Cost | | | Value | |
| | Variety Stores (7.38%) | | | | | | |
| | | | | | | | | | | | | |
| | | 10,000 | | Costco Wholesale Corp. (b) | | $ | 692,696 | | | $ | 812,400 | |
| | Total common stocks | | | 8,129,718 | | | | 14,135,052 | |
| | | | | | | | | | |
| | Securities held as Collateral on Loaned Securities (11.44%) | | | | | | | | |
| | | | | | | | | | | | | |
| | | 1,259,957 | | State Street Navigator Securities Lending Prime Portfolio | | | 1,259,957 | | | | 1,259,957 | |
| | | | | | | | | | | | | |
| | Total investments (139.77%) | | $ | 9,389,675 | | | | 15,395,009 | |
| | | | | | | | | | | | | |
| | Liabilities in excess of other assets (-39.77%) | | | | | | | (4,380,087 | ) |
| | | | | | | | | | | | | |
| | Net assets (100.00%) | | | | | | $ | 11,014,922 | |
| | | | | | | | | | | | | |
| | (a) Non-income producing. (b) Fully or partially pledged as collateral on bank credit facility. (c) All or a portion of this security was on loan. | | | | | | | | |
See notes to financial statements.
| Shares | | | | Cost | | | Value | |
| Gold (20.92%) | | | | | | | | |
| | 18,471 | | SPDR Gold Trust (a) )b) | | $ | 1,821,139 | | | $ | 2,696,397 | |
| Silver (6.49%) | | | | | | | | | | |
| | 24,643 | | iShares Silver Trust (a) (b) | | | 302,396 | | | | 834,166 | |
| Swiss Franc Assets (8.93%) | | | | | | | | |
| | 907,000 | | Switzerland Government 2.50% Notes, due 3/12/16 (c) | | | 960,327 | | | | 1,150,360 | |
| Hard Asset Securities (13.79%) | | | | | | | | |
| Agricultural Chemicals (1.40%) | | | | | | | | |
| | 2,678 | | Syngenta AG | | | 170,440 | | | | 180,926 | |
| Crude Petroleum & Natural Gas (2.57%) | | | | | | | | |
| | 2,717 | | Contango Oil & Gas Company (a) (b) | | | 157,155 | | | | 158,782 | |
| | 1,182 | | PetroChina Company Limited | | | 141,065 | | | | 172,608 | |
| | | | | | | 298,220 | | | | 331,390 | |
| | | | | | | | | | | | |
| Metal Mining (1.26%) | | | | | | | | |
| | 2,249 | | Rio Tinto Ltd. | | | 159,432 | | | | 162,648 | |
| Mining & Quarrying of Nonmetallic Minerals (1.35%) | | | | | | | | |
| | 2,694 | | Sociedad Quimica Y Minera De Chile S.A. | | | 154,921 | | | | 174,356 | |
| Miscellaneous Metal Ores (0.80%) | | | | | | | | |
| | 3,898 | | Cameco Corp. | | | 155,237 | | | | 102,712 | |
| Petroleum Refining (1.31%) | | | | | | | | |
| | 2,079 | | Exxon Mobil Corp. | | | 161,883 | | | | 169,189 | |
| Pipe Lines (1.41%) | | | | | | | | |
| | 5,582 | | Enbridge Inc. | | | 156,064 | | | | 181,192 | |
| Real Estate Investment Trusts (2.56%) | | | | | | | | |
| | 3,330 | | Health Care REIT, Inc. (b) | | | 147,952 | | | | 174,592 | |
| | 2,825 | | PS Business Parks, Inc. (b) | | | 165,852 | | | | 155,658 | |
| | | | | | | 313,804 | | | | 330,250 | |
| | | | | | | | | | | | |
| Steel Works, Blast Furnaces & Rolling Mills (Coke Ovens) (1.13%) | | | | | | | | |
| | 3,519 | | Nucor Corp. (b) | | | 160,522 | | | | 145,053 | |
| | | | | | | | | | | | |
| Total hard asset securities | | | 1,730,523 | | | | 1,777,716 | |
See notes to financial statements.
| Financial Statements | |
| MIDAS Perpetual Portfolio | Schedule of Portfolio Investments - June 30, 2011 (Unaudited) continued |
| Shares | | | | Cost | | | Value | |
| Large Capitalization Growth Stocks (13.85%) | | | | | | |
| Beverages (1.75%) | | | | | | |
| | 6,692 | | Companhia de Bebidas das Americas-AMBEV (b) | | $ | 196,126 | | | $ | 225,721 | |
| Communications Equipment (1.14%) | | | | | | | | |
| | 9,422 | | Cisco Systems, Inc. | | | 172,573 | | | | 147,077 | |
| Electronic Computers (2.71%) | | | | | | | | |
| | 572 | | Apple Inc. (a) | | | 197,522 | | | | 192,003 | |
| | 4,331 | | Hewlett-Packard Company (b) | | | 181,161 | | | | 157,648 | |
| | | | | | | 378,683 | | | | 349,651 | |
| | | | | | | | | | | | |
| Information Retrieval Services (1.25%) | | | | | | | | |
| | 319 | | Google Inc. (a) | | | 158,527 | | | | 161,535 | |
| Life Insurance (1.28%) | | | | | | | | |
| | 3,180 | | China Life Insurance Company Ltd. ADR | | | 191,727 | | | | 164,851 | |
| National Commercial Banks (1.34%) | | | | | | | | |
| | 6,140 | | Wells Fargo & Company (b) | | | 196,956 | | | | 172,288 | |
| Services-Prepackaged Software (1.41%) | | | | | | | | |
| | 6,994 | | Microsoft Corp. | | | 181,291 | | | | 181,844 | |
| State Commercial Banks (1.54%) | | | | | | | | |
| | 9,672 | | Banco Bradesco S.A. (b) | | | 196,953 | | | | 198,179 | |
| Telephone Communications (1.43%) | | | | | | | | |
| | 3,935 | | China Mobile Ltd. ADR | | | 199,078 | | | | 184,079 | |
| | | | | | | | | | | | |
| Total large capitalization growth stocks | | | 1,871,914 | | | | 1,785,225 | |
Dollar Assets (36.30%) | | | | | | | | |
| Money Market Fund | | | | | | | | |
| | 4,678,131 | | SSgA Money Market Fund, 7 day annualized yield 0.01% | | | 4,678,131 | | | | 4,678,131 | |
| Securities held as Collateral on Loaned Securities (17.29%) | | | | | | | | |
| | 2,228,766 | | State Street Navigator Securities Lending Prime Portfolio | | | 2,228,766 | | | | 2,228,766 | |
| | | | | | | | | | | | |
| Total investments (117.57%) | | | | $ 13,593,196 | | | | 15,150,761 | |
| | | | | | | | | |
| Liabilities in excess of other assets (-17.57%) | | | | | | | (2,263,428) | |
| | | | | | | | | |
| Net assets (100.00%) | | | | | | | $ 12,887,333 | |
| | | | | | | | | |
| (a) Non-income producing. (b) All or a portion of this security was on loan. (c) Principal amount denominated in Swiss Francs. ADR means “American Depositary Receipt.” | | | | | | | | |
See notes to financial statements.
STATEMENTS of Assets and Liabilities
| June 30, 2011 (Unaudited) | | Midas | | | Midas | | | Midas | |
| | Fund | | | Magic | | | Perpetual Portfolio | |
| Assets | | | | | | | | | |
| Investments at cost | | $ | 119,983,115 | | | $ | 9,389,675 | | | $ | 13,593,196 | |
| Investments, at value (including $9,455,962, $1,236,354, | | | | | | | | | | | | |
| and $2,182,392 for securities loaned, respectively) | | $ | 124,425,845 | | | $ | 15,395,009 | | | $ | 15,150,761 | |
| Receivables | | | | | | | | | | | | |
| Dividends | | | 22,284 | | | | 6,985 | | | | 9,021 | |
| Fund shares sold | | | 21,111 | | | | - | | | | 5,000 | |
| Income from securities loaned | | | 8,587 | | | | 156 | | | | 639 | |
| Interest | | | - | | | | - | | | | 5,003 | |
| Foreign withholding taxes reclaimed | | | - | | | | - | | | | 34,807 | |
| Other assets | | | 29,567 | | | | 7,157 | | | | 6,772 | |
| | | | | | | | | | | | | |
| Total assets | | | 124,507,394 | | | | 15,409,307 | | | | 15,212,003 | |
| | | | | | | | | | | | | |
| Liabilities | | | | | | | | | | | | |
| Bank line of credit | | | 16,633,575 | | | | 3,038,849 | | | | - | |
| Collateral on securities loaned, at value | | | 9,923,549 | | | | 1,259,957 | | | | 2,228,766 | |
| Payables | | | | | | | | | | | | |
| Accrued expenses | | | 378,994 | | | | 77,206 | | | | 68,206 | |
| Fund shares redeemed | | | 256,310 | | | | - | | | | 24,397 | |
| Investment management fees | | | 74,762 | | | | 8,062 | | | | - | |
| Distribution fees | | | 20,524 | | | | 8,736 | | | | 2,512 | |
| Administrative services | | | 11,607 | | | | 1,575 | | | | 789 | |
| | | | | | | | | | | | | |
| Total liabilities | | | 27,299,321 | | | | 4,394,385 | | | | 2,324,670 | |
| | | | | | | | | | | | | |
| Net assets | | $ | 97,208,073 | | | $ | 11,014,922 | | | $ | 12,887,333 | |
| | | | | | | | | | | | | |
| Shares outstanding, $0.01 par value | | | 21,665,211 | | | | 725,433 | | | | 9,984,753 | |
| | | | | | | | | | | | | |
| Net asset value, offering, and redemption price per share | | $ | 4.49 | | | $ | 15.18 | | | $ | 1.29 | |
| | | | | | | | | | | | | |
| Net assets consist of | | | | | | | | | | | | |
| Paid in capital | | $ | 103,962,205 | | | $ | 10,105,125 | | | $ | 10,593,197 | |
| Accumulated undistributed net investment loss | | | (4,095,480 | ) | | | (188,613 | ) | | | (326,022 | ) |
| Accumulated net realized gain (loss) | | | (7,101,486 | ) | | | (4,906,934 | ) | | | 1,049,602 | |
| Net unrealized appreciation on investments | | | | | | | | | | | | |
| and foreign currencies | | | 4,442,834 | | | | 6,005,344 | | | | 1,570,556 | |
| | | | | | | | | | | | | |
| | | $ | 97,208,073 | | | $ | 11,014,922 | | | $ | 12,887,333 | |
| | | | | | | | | | | | | |
See notes to financial statements.
| For the Six Months Ended June 30, 2011 (Unaudited) | | Midas Fund | | | Midas Magic | | | Midas Perpetual Portfolio | |
| Investment income | | | | | | | | | |
| Dividends | | $ | 497,720 | | | $ | 50,377 | | | $ | 56,318 | |
| Income from securities loaned | | | 37,890 | | | | 1,007 | | | | 3,521 | |
| Foreign tax withholding | | | (35,538 | ) | | | (556 | ) | | | (3,477 | ) |
| Interest | | | - | | | | - | | | | 10,585 | |
| | | | | | | | | | | | | |
| Total investment income | | | 500,072 | | | | 50,828 | | | | 66,947 | |
| | | | | | | | | | | | | |
| Expenses | | | | | | | | | | | | |
| Investment management | | | 576,926 | | | | 56,777 | | | | 36,689 | |
| Transfer agent | | | 220,600 | | | | 38,755 | | | | 15,940 | |
| Distribution | | | 144,231 | | | | 57,804 | | | | 18,344 | |
| Legal | | | 82,525 | | | | 6,410 | | | | 9,400 | |
| Interest and fees on bank credit facility | | | 73,266 | | | | 18,496 | | | | - | |
| Administrative services | | | 53,040 | | | | 4,729 | | | | 6,415 | |
| Bookkeeping and pricing | | | 34,075 | | | | 11,765 | | | | 12,975 | |
| Printing and postage | | | 32,368 | | | | 5,220 | | | | 6,751 | |
| Registration | | | 24,005 | | | | 18,490 | | | | 14,480 | |
| Directors | | | 22,875 | | | | 5,068 | | | | 2,189 | |
| Custodian | | | 15,980 | | | | 2,544 | | | | 3,018 | |
| Insurance | | | 14,118 | | | | 1,448 | | | | 362 | |
| Auditing | | | 13,510 | | | | 11,057 | | | | 9,350 | |
| Other | | | 3,050 | | | | 878 | | | | 334 | |
| | | | | | | | | | | | | |
| Total expenses | | | 1,310,569 | | | | 239,441 | | | | 136,247 | |
| Less contractual waiver of investment management fee | | | - | | | | - | | | | (36,689 | ) |
| | | | | | | | | | | | | |
| Net expenses | | | 1,310,569 | | | | 239,441 | | | | 99,558 | |
| | | | | | | | | | | | | |
| Net investment loss | | | (810,497 | ) | | | (188,613 | ) | | | (32,611 | ) |
| | | | | | | | | | | | | |
| Realized and unrealized gain (loss) | | | | | | | | | | | | |
| Net realized gain (loss) on | | | | | | | | | | | | |
| Investments | | | 6,500,431 | | | | (517,192 | ) | | | 716,842 | |
| Foreign currencies | | | 83,952 | | | | 9 | | | | 171,363 | |
| Unrealized appreciation (depreciation) on | | | | | | | | | | | | |
| Investments | | | (30,334,854 | ) | | | 1,097,716 | | | | (286,883 | ) |
| Translation of assets and liabilities in foreign currencies | | | (1,212,184 | ) | | | 10 | | | | (166,242 | ) |
| | | | | | | | | | | | | |
| Net realized and unrealized gain (loss) | | | (24,962,655 | ) | | | 580,543 | | | | 435,080 | |
| | | | | | | | | | | | | |
| Net increase (decrease) in net assets resulting | | | | | | | | | | | | |
| from operations | | $ | (25,773,152 | ) | | $ | 391,930 | | | $ | 402,469 | |
| | | | | | | | | | | | | |
See notes to financial statements.
| | | Midas Fund | | | Midas Magic | | | Midas Perpetual Portfolio | |
| | | Six Months Ended 6/30/11 | | | Year Ended 12/31/10 | | | Six Months Ended 6/30/11 | | | Year Ended 12/31/10 | | | Six Months Ended 6/30/11 | | | Year Ended 12/31/10 | |
| Operations | | | | | | | | | | | | | | | | | | |
| Net investment loss | | $ | (810,497 | ) | | $ | (1,811,559 | ) | | $ | (188,613 | ) | | $ | (379,956 | ) | | $ | (32,611 | ) | | $ | (90,997 | ) |
| Net realized gain (loss) | | | 6,584,383 | | | | 17,273,383 | | | | (517,183 | ) | | | (664,083 | ) | | | 888,205 | | | | 161,056 | |
| Unrealized appreciation (depreciation) | | | (31,547,038 | ) | | | 31,005,965 | | | | 1,097,726 | | | | 1,687,394 | | | | (453,125 | ) | | | 1,012,057 | |
| | | | | | | | | | | | | | | | | | | | | | | | | |
| Net increase (decrease) in net assets | | | | | | | | | | | | | | | | | | | | | | | | |
| resulting from operations | | | (25,773,152 | ) | | | 46,467,789 | | | | 391,930 | | | | 643,355 | | | | 402,469 | | | | 1,082,116 | |
| | | | | | | | | | | | | | | | | | | | | | | | | |
| Distributions to shareholders | | | | | | | | | | | | | | | | | | | | | | | | |
| Ordinary income | | | (1,145,564 | ) | | | - | | | | - | | | | - | | | | - | | | | - | |
| Tax return of capital | | | (141,586 | ) | | | - | | | | - | | | | - | | | | - | | | | - | |
| Net realized gains | | | - | | | | - | | | | - | | | | - | | | | (293,411 | ) | | | - | |
| | | | | | | | | | | | | | | | | | | | | | | | | |
| Total distributions to shareholders | | | (1,287,150 | ) | | | - | | | | - | | | | - | | | | (293,411 | ) | | | - | |
| | | | | | | | | | | | | | | | | | | | | | | | | |
| Capital share transactions | | | | | | | | | | | | | | | | | | | | | | | | |
| Change in net assets resulting from | | | | | | | | | | | | | | | | | | | | | | | | |
capital share transactions (a) | | | (15,378,850 | ) | | | (23,146,852 | ) | | | (1,617,083 | ) | | | 13,884 | | | | 2,154,858 | | | | 1,222,457 | |
| Redemption fees | | | 3,542 | | | | 11,801 | | | | 492 | | | | 626 | | | | 3,906 | | | | 4,281 | |
| | | | | | | | | | | | | | | | | | | | | | | | | |
| Increase (decrease) in net assets resulting | | | | | | | | | | | | | | | | | | | | | | | | |
| from capital share transactions | | | (15,375,308 | ) | | | (23,135,051 | ) | | | (1,616,591 | ) | | | 14,510 | | | | 2,158,764 | | | | 1,226,738 | |
| | | | | | | | | | | | | | | | | | | | | | | | | |
| Total change in net assets | | | (42,435,610 | ) | | | 23,332,738 | | | | (1,224,661 | ) | | | 657,865 | | | | 2,267,822 | | | | 2,308,854 | |
| | | | | | | | | | | | | | | | | | | | | | | | | |
| Net assets | | | | | | | | | | | | | | | | | | | | | | | | |
| Beginning of period | | | 139,643,683 | | | | 116,310,945 | | | | 12,239,583 | | | | 11,581,718 | | | | 10,619,511 | | | | 8,310,657 | |
| | | | | | | | | | | | | | | | | | | | | | | | | |
End of period (b) | | | 97,208,073 | | | $ | 139,643,683 | | | $ | 11,014,922 | | | $ | 12,239,583 | | | $ | 12,887,333 | | | $ | 10,619,511 | |
| | | | | | | | | | | | | | | | | | | | | | | | | |
(a) Capital share transactions were as follows: | | | | | | | | | | | | | | | | | | | | | | | | |
| Value | | | | | | | | | | | | | | | | | | | | | | | | |
| Shares sold | | | 9,993,590 | | | $ | 25,448,976 | | | $ | 254,768 | | | $ | 1,309,859 | | | $ | 8,948,983 | | | $ | 4,131,103 | |
| Shares issued in reinvestment of distributions | | | 1,188,565 | | | | - | | | | - | | | | - | | | | 283,631 | | | | - | |
| Shares redeemed | | | (26,561,005 | ) | | | (48,595,828 | ) | | | (1,871,851 | ) | | | (1,295,975 | ) | | | (7,077,756 | ) | | | (2,908,646 | ) |
| | | | | | | | | | | | | | | | | | | | | | | | | |
| Net increase (decrease) | | $ | (15,378,850 | ) | | $ | (23,146,852 | ) | | $ | (1,617,083 | ) | | | 13,884 | | | $ | 2,154,858 | | | $ | 1,222,457 | |
| | | | | | | | | | | | | | | | | | | | | | | | | |
| Number | | | | | | | | | | | | | | | | | | | | | | | | |
| Shares sold | | | 1,934,234 | | | | 5,795,951 | | | | 16,566 | | | | 91,033 | | | | 6,913,541 | | | | 3,456,412 | |
| Shares issued in reinvestment of distributions | | | 264,432 | | | | - | | | | - | | | | - | | | | 219,429 | | | | - | |
| Shares redeemed | | | (5,238,452 | ) | | | (11,539,586 | ) | | | (121,795 | ) | | | (91,222 | ) | | | (5,339,778 | ) | | | (2,468,976 | ) |
| | | | | | | | | | | | | | | | | | | | | | | | | |
| Net increase (decrease) | | | (3,039,786 | ) | | | (5,743,635 | ) | | | (105,229 | ) | | | (189 | ) | | | 1,793,192 | | | | 987,436 | |
| | | | | | | | | | | | | | | | | | | | | | | | | |
(b) End of period net assets include | | | | | | | | | | | | | | | | | | | | | | | | |
| undistributed net investment income (loss) | | | (4,095,480 | ) | | $ | (1,997,833 | ) | | $ | (188,613 | ) | | | - | | | $ | (326,022 | ) | | $ | - | |
| | | | | | | | | | | | | | | | | | | | | | | | | |
See notes to financial statements.
| For the Six Months Ended June 30, 2011 (Unaudited) | | Midas Fund | | | Midas Magic | | | Midas Perpetual Portfolio | |
| Cash flows from operating activities | | | | | | | | | |
| Net increase (decrease) in net assets resulting from operations | | $ | (25,773,152 | ) | | $ | 391,930 | | | $ | 402,469 | |
| Adjustments to reconcile change in net assets | | | | | | | | | | | | |
| resulting from operations to net cash provided | | | | | | | | | | | | |
| by (used in) operating activities: | | | | | | | | | | | | |
| Proceeds from sales of long term investments | | | 68,784,771 | | | | 1,315,285 | | | | 3,831,168 | |
| Purchase of long term investments | | | (49,382,730 | ) | | | (1,095,186 | ) | | | (4,585,190 | ) |
| Unrealized depreciation (appreciation) of investments | | | | | | | | | | | | |
| and foreign currencies | | | 31,547,038 | | | | (1,097,726 | ) | | | 453,125 | |
| Net realized (gain) loss on sales of investments | | | | | | | | | | | | |
| and foreign currencies | | | (6,584,383 | ) | | | 517,183 | | | | (888,205 | ) |
| Net purchases (sales) of short term investments | | | 83,951 | | | | 10 | | | | (1,050,338 | ) |
| Amortization of premium of investment securities | | | - | | | | - | | | | 7,417 | |
| Decrease (increase) in collateral for securities loaned | | | 8,629,072 | | | | (333,662 | ) | | | 743,798 | |
| (Increase) decrease in dividends receivable | | | (3,480 | ) | | | (661 | ) | | | (4,643 | ) |
| (Increase) decrease in securities lending income receivable | | | (7,059 | ) | | | 67 | | | | (260 | ) |
| Decrease in interest receivable | | | - | | | | - | | | | 8,880 | |
| Increase in foreign withholding taxes reclaimed | | | - | | | | - | | | | (13,548 | ) |
| Decrease other assets | | | 14,118 | | | | 1,448 | | | | 362 | |
| Decrease (increase) in payable upon return of securities loaned | | | (8,629,072 | ) | | | 333,662 | | | | (743,798 | ) |
| Decrease in payable for investments purchased | | | - | | | | - | | | | (117,101 | ) |
| Increase in accrued expenses | | | 145,882 | | | | 1,307 | | | | 11,787 | |
| Decrease in investment management fees payable | | | (35,543 | ) | | | (1,993 | ) | | | - | |
| (Decrease) increase in distribution fees payable | | | (8,886 | ) | | | (1,549 | ) | | | 319 | |
| Decrease in administrative services payable | | | (3,223 | ) | | | (784 | ) | | | (248 | ) |
| | | | | | | | | | | | | |
| Net cash provided by (used in) operating activities | | | 18,777,304 | | | | 29,331 | | | | (1,944,006 | ) |
| | | | | | | | | | | | | |
| Cash flows from financing activities | | | | | | | | | | | | |
| Net shares (redeemed) sold | | | (16,319,022 | ) | | | (1,579,902 | ) | | | 1,953,786 | |
| (Repayment) borrowing on bank line of credit | | | (2,359,697 | ) | | | 1,544,736 | | | | - | |
| Cash distributions paid to shareholders | | | (98,585 | ) | | | - | | | | (9,780 | ) |
| | | | | | | | | | | | | |
| Net cash (used in) provided by financing activities | | | (18,777,304 | ) | | | (35,166 | ) | | | 1,944,006 | |
| | | | | | | | | | | | | |
| Net change in cash | | | - | | | | (5,835 | ) | | | - | |
| | | | | | | | | | | | | |
| Cash | | | | | | | | | | | | |
| Beginning of period | | | - | | | | 5,835 | | | | - | |
| | | | | | | | | | | | | |
| End of period | | $ | - | | | $ | - | | | $ | - | |
| | | | | | | | | | | | | |
| Supplemental disclosure of cash flow information | | | | | | | | | | | | |
| Cash paid for interest and fees on bank line of credit | | $ | 95,976 | | | $ | 20,663 | | | $ | 2,862 | |
| Noncash financing activities consisting of reinvestment | | | | | | | | | | | | |
| of distributions | | $ | 1,188,565 | | | $ | - | | | $ | 283,631 | |
| | | | | | | | | | | | | |
See notes to financial statements.
1 ORGANIZATION AND SIGNIFICANT ACCOUNTING POLICIES The Midas Funds are Maryland corporations registered under the Investment Company Act of 1940, as amended (the “Act”), as open end management investment companies. The investment objectives of Midas Fund are primarily capital appreciation and protection against inflation and, secondarily, current income, and it invests primarily in precious metals and natural resource companies and bullion. Midas Magic’s (formerly Midas Special Fund) investment objective is capital appreciation, which it seeks by investing aggressively in any security type in any industry sector and in domestic and foreign companies of any size. The investment objective of Midas Perpetual Portfolio (formerly Midas Dollar Reserves) is to preserve and increase the purchasing power value of its shares over the long term with a policy of investing a fixed target percentage of its total assets in gold, silver, Swiss franc assets, hard asset securities, large capitalization growth stocks, and dollar assets. On December 29, 2008, the Fund changed its name to Midas Perpetual Portfolio, ceased operating as a money market fund, and began operating as a fluctuating net asset value fund pursuant to its current investment objective and policies. The Funds retain Midas Management Corporation as their Investment Manager.
Midas Fund and Midas Perpetual Portfolio each has authorized capital of one billion shares of common stock, par value $0.01 per share. Midas Magic has authorized capital of 500 million shares of common stock, par value $0.01. Each Fund offers only one class of shares. Each Fund’s shareholders are entitled to one vote for each whole share owned and a fractional vote for each fraction of a share owned. Voting rights are not cumulative. All shares of a Fund are fully paid and non-assessable and have no preemptive or conversion rights.
The Funds impose a short term trading redemption fee on any Fund shares that are redeemed or exchanged within 30 days following their purchase date. The redemption fee is 1% of the amount redeemed. Such fees are retained by the Funds for the benefit of the remaining shareholders and are accounted for as an addition to paid in capital.
The following is a summary of significant accounting policies followed by the Funds:
Valuation of Investments – Portfolio securities are valued by various methods depending on the primary market or exchange on which they trade. Most equity securities for which the primary market is the United States are valued at the official closing price, last sale price or, if no sale has occurred, at the closing bid price. Most equity securities for which the primary market is outside the United States are valued using the official closing price or the last sale price in the principal market in which they are traded. If the last sale price on the local exchange is unavailable, the last evaluated quote or closing bid price normally is used. Gold and silver bullion is valued at 4:00 p.m. ET, at the mean between the last bid and asked quotations of the Bloomberg Composite (NY) Spot Price for that metal. Debt obligations with remaining maturities of 60 days or less are valued at cost adjusted for amortization of premiums and accretion of discounts. Certain of the securities in which the Funds may invest are priced through pricing services that may utilize a matrix pricing system which takes into consideration factors such as yields, prices, maturities, call features, and ratings on comparable securities. Bonds may be valued according to prices quoted by a bond dealer that offers pricing services. Open end investment companies are valued at their net asset value. Foreign securities markets may be open on days when the U.S. markets are closed. For this reason, the value of any foreign securities owned by a Fund could change on a day when stockholders cannot buy or sell shares of the Fund. Securities for which market quotations are not readily available or reliable and other assets may be valued as determined in good faith by the Investment Manager under the direction of or pursuant to procedures established by a Fund’s Board of Directors, called “fair value pricing.” Due to the inherent uncertainty of valuation, fair value pricing values may differ from the values that would have been used had a readily available market for the securities existed. These differences in valuation could be material. A security’s valuation may differ depending on the method used for determining value. The use of fair value pricing by a Fund may cause the net asset value of its shares to differ from the net asset value that would be calculated using market prices.
Foreign Currency Translation – Securities denominated in foreign currencies are translated into U.S. dollars at prevailing exchange rates. Realized gain or loss on sales of such investments in local currency terms is reported separately from gain or loss attributable to a change in foreign exchange rates for those investments.
Foreign Currency Contracts – Forward foreign currency contracts are marked to market and the change in market value is recorded by a Fund as an unrealized gain or loss. When a contract is closed, a Fund records a realized gain or loss equal to the difference between the value of the contract at the time it was opened and the value at the time it was closed. A Fund could be exposed to risk if the counterparties are unable to meet the terms of the contracts or if the value of the currency changes unfavorably.
| Financial Statements | |
| NOTES to Financial Statements | (Unaudited) continued |
Derivatives – Midas Fund and Midas Magic may use derivatives for a variety of reasons, such as to attempt to protect against possible changes in the value of their portfolio holdings or to generate potential gain. Derivatives are financial instruments that derive their values from other securities or commodities, or that are based on indices. Derivative instruments are marked to market with the change in value reflected in unrealized appreciation or depreciation. Upon disposition, a realized gain or loss is recognized accordingly, except when taking delivery of a security underlying a contract. In these instances, the recognition of gain or loss is postponed until the disposal of the security underlying the contract. Risk may arise as a result of the potential inability of the counterparties to meet the terms of their contracts. Derivative instruments include written options, purchased options, futures contracts, forward foreign currency exchange contracts, and swap agreements.
Short Sales – Midas Fund and Midas Magic may sell a security it does not own in anticipation of a decline in the market value of the security. When a Fund sells a security short, it must borrow the security sold short and deliver it to the broker/dealer through which it made the short sale. A Fund is liable for any dividends or interest paid on securities sold short. A gain, limited to the price at which a Fund sold the security short, or a loss, unlimited in size, will be recognized upon the termination of a short sale. Securities sold short result in off balance sheet risk as a Fund’s ultimate obligation to satisfy the terms of the sale of securities sold short may exceed the amount recognized in the Statement of Assets and Liabilities.
Investment Transactions – Investment transactions are accounted for on the trade date (the date the order to buy or sell is executed). Realized gains or losses are determined by specifically identifying the cost basis of the investment sold.
Investment Income – Interest income is recorded on the accrual basis. Amortization of premium and accretion of discount on debt securities are included in interest income. Dividend income is recorded on the ex-dividend date or in the case of certain foreign securities, as soon as a Fund is notified. Taxes withheld on income from foreign securities have been provided for in accordance with a Fund’s understanding of the applicable country’s tax rules and rates.
Expenses – Expenses deemed by the Investment Manager to have been incurred solely by the Fund are charged to the Fund. Expenses deemed by the Investment Manager to have been incurred jointly by the Fund and one or more of the investment companies for which the Investment Manager and its affiliates serve as investment manager (the “Fund Complex”) or other entities are allocated on the basis of relative net assets, except where a more appropriate allocation can be made fairly in the judgment of the Investment Manager. Expense Reduction Arrangement – Through arrangements with the Funds’ custodian and cash management bank, credits realized as a result of uninvested cash balances are used to reduce custodian and transfer agent expenses. No credits were realized by the Funds during the period covered by this report.
Distributions to Shareholders – Distributions to shareholders, are determined in accordance with income tax regulations, and recorded on the ex-dividend date.
Income Taxes – No provision has been made for U.S. income taxes because each Fund intends to qualify as a regulated investment company under the Internal Revenue Code and to distribute to shareholders substantially all taxable income and net realized gains. Foreign securities held by a Fund may be subject to foreign taxation. Foreign taxes, if any, are recorded based on the tax regulations and rates that exist in the foreign markets in which a Fund invests. The Funds recognize the tax benefits of uncertain tax positions only where the position is “more likely than not” to be sustained assuming examination by tax authorities. The Funds have reviewed their tax positions and have concluded that no liability for unrecognized tax benefits should be recorded related to uncertain tax position taken on federal, state, and local income tax returns for all open tax years (2008 - 2010) or expected to be taken in the Funds’ 2011 tax returns.
Use of Estimates – In preparing financial statements in conformity with accounting principles generally accepted in the United States of America (“GAAP”), management makes estimates and assumptions that affect the reported amounts of assets and liabilities at the date of the financial statements, as well as the reported amounts of revenues and expenses during the reporting period. Actual results could differ from those estimates.
2 FEES AND TRANSACTIONS WITH RELATED PARTIES Under the investment management agreement of Midas Fund, the Investment Manager receives a management fee, payable monthly, based on the average daily net assets of the Fund at the annual rate of 1% on the first $200 million, .95% from $200 million to $400 million, .90% from $400 million to $600 million, .85% from $600 million to $800 million, .80% from $800 million to $1 billion, and .75% over $1 billion. Under the investment management agreement of Midas Magic, the Investment Manager receives a management fee, payable monthly, based on the average daily net assets of the Fund at the annual rate of 1% on the first $10 million, 7/8 of 1% from $10 million to $30 million, 3/4 of 1% from $30 million to $150 million, 5/8 of 1% from $150 million to $500 million, and 1/2 of 1% over $500 million. Under the investment management agreement of Midas Perpetual Portfolio, the Investment Manager receives a management fee, payable monthly, based on the average daily net assets of the Fund at the annual rate of .50% of the first $250 million, .45% from $250 million to $500 million, and .40% over $500 million.
| Financial Statements | |
| NOTES to Financial Statements | (Unaudited) continued |
The Investment Manager contractually agreed with Midas Perpetual Portfolio to waive its fee for the period from January 1, 2011 to April 29, 2012. The fee waiver agreement may only be amended or terminated with the approval of the Fund’s Board of Directors. The investment manager may continue such waiver after April 29, 2012 but is not contractually obligated to do so.
Each Fund has adopted a plan of distribution pursuant to Rule 12b-1 under the Act. Under each plan, each Fund pays the Distributor, Midas Securities Group, Inc., an affiliate of the Investment Manager, a fee of .25% (Midas Fund and Midas Perpetual Portfolio) or 1.00% (Midas Magic) for distribution and shareholder services. The shareholder service fee is intended to cover personal services provided to the shareholders of the Funds and the maintenance of shareholder accounts. The distribution fee is to cover all other activities and expenses primarily intended to result in the sale of the Funds’ shares. In addition, Midas Fund, Midas Magic, and Midas Perpetual Portfolio ech reimbursed the Distributor $59,867, $528, and $2,108, respectively, for payments made to certain brokers for record keeping services for the six months ended June 30, 2011.
Certain officers and directors of the Funds are officers and directors of the Investment Manager and the Distributor.
Pursuant to the investment management agreements, the Funds reimburse the Investment Manager for providing certain administrative services at cost comprised of compliance and accounting services. For the six months ended June 30, 2011, the Funds incurred administrative services expenses as follows:
| | | Midas Fund | | | Midas Magic | | | Midas Perpetual Portfolio | |
| Compliance | | $ | 35,845 | | | $ | 3,100 | | | $ | 3,530 | |
| Accounting | | | 17,195 | | | | 1,629 | | | | 2,885 | |
| Total | | $ | 53,040 | | | $ | 4,729 | | | $ | 6,415 | |
3 DISTRIBUTIONS TO SHAREHOLDERS AND DISTRIBUTABLE EARNINGS During the six months ended June 30, 2011, Midas Fund paid a distribution of $1,287,150 and Midas Perpetual Portfolio paid a distribution of $293,411. The classification of these distributions for federal income tax purposes will be determined after the Funds’ fiscal year ending December 31, 2011.
The Funds paid no distributions for the year ended December 31, 2010.
At December 31, 2010, the components of distributable earnings on a tax basis were as follows:
| | | Midas Fund | | | Midas Magic | | | Midas Perpetual Portfolio | |
| Accumulated net investment income | | $ | 1,140,431 | | | $ | - | | | $ | - | |
| Accumulated net realized gain (loss) on investments | | | (13,685,848 | ) | | | (4,389,751 | ) | | | 161,397 | |
| Net unrealized appreciation | | | 32,851,587 | | | | 4,907,618 | | | | 2,023,681 | |
| Total | | $ | 20,306,170 | | | $ | 517,867 | | | $ | 2,185,078 | |
Federal income tax regulations permit post-October net capital losses, if any, to be deferred and recognized on the tax return of the next succeeding taxable year.
| Financial Statements | |
| NOTES to Financial Statements | (Unaudited) continued |
| | | Midas Fund | | | Midas Magic | | | Midas Perpetual Portfolio | |
| Decrease in accumulated undistributed net investment loss | | $ | 537,471 | | | $ | 379,956 | | | $ | 90,997 | |
| (Increase) decrease in accumulated net realized gain (loss) on investments | | $ | (537,471 | ) | | $ | - | | | $ | 341 | |
| Decrease in paid in capital | | $ | - | | | $ | (379,956 | ) | | $ | (91,338 | ) |
At December 31, 2010, Midas Fund had net a capital loss carryover of $13,685,848 expiring in 2017 that may be used to offset future realized capital gains for federal income tax purposes.
At December 31, 2010, Midas Magic had net a capital loss carryover of $4,389,751, of which $1,823,745, $340,513, $1,154,753, $406,657, and $664,083 expire in 2011, 2014, 2016, 2017, and 2018, respectively, that may be used to offset future realized capital gains for federal income tax purposes.
4 FAIR VALUE MEASUREMENTS GAAP establishes a hierarchy that prioritizes inputs to valuation methods. The three levels of inputs are:
| • | Level 1 - unadjusted quoted prices in active markets for identical assets or liabilities including securities actively traded on a securities exchange. |
| • | Level 2 - observable inputs other than quoted prices included in level 1 that are observable for the asset or liability which may include quoted prices for similar instruments, interest rates, prepayment speeds, credit risk, yield curves, default rates, and similar data. |
| • | Level 3 - unobservable inputs for the asset or liability including the Fund’s own assumptions about the assumptions a market participant would use in valuing the asset or liability. |
The availability of observable inputs can vary from security to security and is affected by a wide variety of factors, including, for example the type of security, whether the security is new and not yet established in the marketplace, the liquidity of markets, and other characteristics particular to the security. To the extent that valuation is based on models or inputs that are less observable or unobservable in the market, the determination of fair value requires more judgment. Accordingly, the degree of judgment exercised in determining fair value is greatest for investments categorized in level 3.
The inputs used to measure fair value may fall into different levels of the fair value hierarchy. In such cases, the level in the fair value hierarchy within which the fair value measurement falls in its entirety, is determined based on the lowest level input that is significant to the fair value measurement in its entirety.
The inputs or methodology used for valuing investments are not an indication of the risk associated with investing in those securities. A description of the valuation techniques applied to a Fund’s major categories of assets and liabilities measured at fair value on a recurring basis follows: Equity Securities (common and preferred stock) – Equity securities traded on a national securities exchange or market are stated normally at the official closing price, last sale price or, if no sale has occurred, at the closing bid price on the day of valuation. To the extent these securities are actively traded and valuation adjustments are not applied, they may be categorized in level 1. Preferred stock and other equities on inactive markets or valued by reference to similar instruments may be categorized in level 2.
Bonds – The fair value of bonds is estimated using various techniques, which may consider recently executed transactions in securities of the issuer or comparable issuers, market price quotations (where observable), bond spreads, and fundamental data relating to the issuer. Although most bonds are categorized in level 2 of the fair value hierarchy, in instances where lower relative weight is place on transaction prices, quotations, or similar observable inputs, they may be categorized in level 3.
| Financial Statements | |
| NOTES to Financial Statements | (Unaudited) continued |
Restricted and/or Illiquid Securities – Restricted and/or illiquid securities for which quotations are not readily available or reliable may be valued as determined in good faith by the Investment Manager under the direction of or pursuant to procedures established by a Fund’s Board of Directors. Restricted securities issued by publicly traded companies are generally valued at a discount to similar publicly traded securities. Restricted or illiquid securities issued by nonpublic entities may be valued by reference to comparable public entities or fundamental data relating to the issuer or both. Depending on the relative significance of valuation inputs, these instruments may be classified in either level 2 or level 3.
The following is a summary of the inputs used as of June 30, 2011 in valuing each Fund’s assets and liabilities carried at fair value. Refer to each Fund’s Schedule of Portfolio Investments for detailed information on specific investments.
| MIDAS FUND | | Level 1 | | | Level 2 | | | Level 3 | | | Total | |
| Assets | | | | | | | | | | | | |
| Investments, at value | | | | | | | | | | | | |
| Common stocks | | $ | 114,182,209 | | | $ | - | | | $ | 113,097 | | | $ | 114,295,306 | |
| Warrants | | | 191,998 | | | | - | | | | - | | | | 191,998 | |
| Bullion | | | 14,992 | | | | - | | | | - | | | | 14,992 | |
| Securities held as collateral on loaned securities | | | 9,923,549 | | | | - | | | | - | | | | 9,923,549 | |
| Total investments, at value | | $ | 124,312,748 | | | $ | - | | | $ | 113,097 | | | $ | 124,425,845 | |
| MIDAS MAGIC | | Level 1 | | | Level 2 | | | Level 3 | | | Total | |
| Assets | | | | | | | | | | | | |
| Investments, at value | | | | | | | | | | | | |
| Common stocks | | $ | 14,135,052 | | | $ | - | | | $ | - | | | $ | 14,135,052 | |
| Securities held as collateral on loaned securities | | | 1,259,957 | | | | - | | | | - | | | | 1,259,957 | |
| Total investments, at value | | $ | 15,395,009 | | | $ | - | | | $ | - | | | $ | 15,395,009 | |
| MIDAS PERPETUAL PORTFOLIO | | Level 1 | | | Level 2 | | | Level 3 | | | Total | |
| Assets | | | | | | | | | | | | |
| Investments, at value | | | | | | | | | | | | |
| Gold | | $ | 2,696,397 | | | $ | - | | | $ | - | | | $ | 2,696,397 | |
| Silver | | | 834,166 | | | | - | | | | - | | | | 834,166 | |
| Swiss franc assets | | | - | | | | 1,150,360 | | | | - | | | | 1,150,360 | |
| Hard asset securities | | | 1,777,716 | | | | - | | | | - | | | | 1,777,716 | |
| Large capitalization growth stocks | | | 1,785,225 | | | | - | | | | - | | | | 1,785,225 | |
| Dollar assets | | | 4,678,131 | | | | - | | | | - | | | | 4,678,131 | |
| Securities held as collateral on loaned securities | | | 2,228,766 | | | | - | | | | - | | | | 2,228,766 | |
| Total investments, at value | | $ | 14,000,401 | | | $ | 1,150,360 | | | $ | - | | | $ | 15,150,761 | |
| Financial Statements | |
| NOTES to Financial Statements | (Unaudited) continued |
There were no transfers between level 1 and level 2 by the Funds during the six months ended June 30, 2011.
The following is a reconciliation of level 3 investments for which significant unobservable inputs were used to determine fair value:
| MIDAS FUND | | Common Stocks | |
| Balance at December 31, 2010 | | $ | 0 | |
| Change in unrealized depreciation | | | 113,097 | |
| Purchases or (sales) | | | - | |
| Net realized gain (loss) | | | - | |
| Transfers in or (out) of level 3 | | | - | |
| Balance at June 30, 2011 | | $ | 113,097 | |
5 INVESTMENT TRANSACTIONS At June 30, 2011, the aggregate gross unrealized appreciation and depreciation of investments, based on cost for federal income tax purposes, are summarized as follows:
| | | Federal Income | | | Gross Unrealized | | | Net Unrealized | |
| | | Tax Cost | | | Appreciation | | | Depreciation | | | Appreciation | |
| Midas Fund | | $ | 119,983,115 | | | $ | 16,280,852 | | | $ | (11,838,122 | ) | | $ | 4,442,730 | |
| Midas Magic | | $ | 9,389,675 | | | $ | 6,009,625 | | | $ | (4,291 | ) | | $ | 6,005,334 | |
| Midas Perpetual Portfolio | | $ | 13,593,196 | | | $ | 1,756,824 | | | $ | (199,259 | ) | | $ | 1,557,565 | |
Purchases and proceeds from sales of investment securities, excluding short term securities, for the six months ended June 30, 2011 were as follows:
| | Midas | Midas | Midas |
| | Fund | Magic | Perpetual Portfolio |
| Purchases | $ 49,382,730 | $ 1,095,186 | $ 4,585,190 |
| Proceeds | $ 68,784,771 | $ 1,253,194 | $ 3,381,168 |
6 ILLIQUID AND RESTRICTED SECURITIES Midas Fund owns securities which have a limited trading market and/or certain restrictions on trading and, therefore, may be illiquid and/or restricted. Such securities have been valued using fair value pricing in accordance with the procedures described in Note 1. Due to the inherent uncertainty of valuation, fair value pricing values may differ from the values that would have been used had a readily available market for the securities existed. These differences in valuation could be material. Illiquid and/or restricted securities owned at June 30, 2011 were as follows:
| | Acquisition | | |
| | Date | Cost | Value |
| Ivanhoe Nickel & Platinum Ltd. | 4/30/97 | $ 0 | $ 113,097 |
| Percent of net assets | | 0.0% | 0.1% |
| Financial Statements | |
| NOTES to Financial Statements | (Unaudited) continued |
7 BANK CREDIT FACILITIES Effective April 1, 2011, the Funds (except Midas Perpetual Portfolio) and the other funds in the Fund Complex (the “Borrowers”) entered into a committed secured line of credit facility, which is subject to annual renewal, with State Street Bank and Trust Company (“SSB”), the Funds’ custodian. The aggregate amount of the credit facility is $30,000,000. The borrowing of each Borrower is collateralized by the underlying investments of such Borrower. SSB will make revolving loans to a Borrower not to exceed in the aggregate outstanding at any time with respect to any one Borrower the least of 30% of the total net assets (as defined in the line of credit facility) of a Borrower, the maximum amount permitted pursuant to each Borrower’s investment policies, or as permitted under the Act. The commitment fee on this facility is 0.15% per annum on the unused portion of the commitment, based on a 360 day year. All loans under this facility will be available at the Borrower’s option of (i) overnight Federal funds or (ii) LIBOR (30, 60, 90 days), each as in effect from time to time, plus 1.10% per annum, calculated on the basis of actual days elapsed for a 360 day year. Prior to April 1, 2011, the aggregate amount of the credit facility was $10,000,000 available at the Borrower’s option of (i) overnight Federal funds or (ii) LIBOR (30, 60, 90 days), plus 1.50% per annum.
The Funds have also entered into an uncommitted secured redemption facility, which is subject to annual renewal, with SSB with an aggregate amount available of $30,000,000. The borrowing of each Borrower is collateralized by the underlying investments of such Borrower. This facility carries no legal obligation on the part of SSB to lend any amount of money to the Funds at any time and the Borrower does not pay a commitment fee under this facility. SSB may make revolving loans to a Borrower not to exceed in the aggregate outstanding at any time with respect to any one Borrower the least of $30,000,000, the maximum amount permitted pursuant to the Borrower’s investment policies, or as permitted under the Act. All loans under this facility will be available at the higher of LIBOR and overnight Federal funds rates, each as in effect from time to time, plus 1.25% per annum, calculated on the basis of actual days elapsed for a 360 day year.
The outstanding loan balance and the value of eligible collateral investments at June 30, 2011, and the weighted average interest rate and average daily amount outstanding under the committed and uncommitted facilities for the six months ended June 30, 2011 were as follows:
| | | Midas | | | Midas | | | Midas | |
| | | Fund | | | Magic | | | Perpetual Portfolio | |
| Outstanding balance | | $ | 16,633,575 | | | $ | 3,038,849 | | | $ | 0 | |
| Value of eligible collateral | | $ | 47,665,088 | | | $ | 7,913,272 | | | $ | 0 | |
| Average daily amount outstanding | | $ | 9,899,852 | | | $ | 2,428,839 | | | $ | 0 | |
| Weighted average interest rate | | | 1.43 | % | | | 1.44 | % | | | 0.00 | % |
8 SECURITIES LENDING The Funds may lend their securities to qualified financial institutions. The Funds receive compensation in the form of fees, or retain a portion of the returns on the investment of any cash received as collateral. The Funds receive as collateral cash, U.S. Government securities, or bank letters of credit valued greater than the value of the securities on loan. Cash is invested in a money market fund. The value of the loaned securities is determined based upon the most recent closing prices and any additional required collateral is delivered to the Funds on the next business day. Any increase or decrease in the value of the securities loaned that might occur and any interest earned or dividends declared on those securities during the term of the loan is retained by the Funds. The Funds have the right under the lending agreement to recover the loaned securities from the borrower on demand. As with other extensions of credit, the Funds bear the risk of delay on recovery or loss of rights in the collateral should the borrower of the securities default.
| Financial Statements | |
| NOTES to Financial Statements | (Unaudited) continued |
The value of loaned securities and related collateral outstanding at June 30, 2011 were as follows:
| | | Midas | | | Midas | | | Midas | |
| | | Fund | | | Magic | | | Perpetual Portfolio | |
| Value of securities loaned | | $ | 9,455,962 | | | $ | 1,236,354 | | | $ | 2,182,392 | |
| Value of related collateral | | $ | 9,923,549 | | | $ | 1,259,957 | | | $ | 2,228,766 | |
9 PORTFOLIO CONCENTRATION Each Fund operates as a “non-diversified” investment company, which means that the portion of the Fund’s assets that may be invested in the securities of a single issuer is not limited by the Act and the amount of the outstanding voting securities of a particular issuer held by a Fund is not limited. Each Fund, however, currently intends to continue to conduct its operations so as to qualify as a “regulated investment company” for purposes of the Internal Revenue Code, which currently requires that, at the end of each quarter of the taxable year, with respect to 50% of a Fund’s total assets, the Fund limits to 5% the portion of its total assets invested in the securities of a single issuer. There are no such limitations with respect to the balance of a Fund’s portfolio, although no single investment can exceed 25% of a Fund’s total assets at the time of purchase. A more concentrated portfolio may cause a Fund’s net asset value to be more volatile and thus may subject stockholders to more risk. As of June 30, 2011, Midas Magic held approximately 37% and 27% of its net assets in Berkshire Hathaway, Inc. and MasterCard Inc., respectively, primarily as a result of market appreciation since the time of purchase, and Midas Perpetual Portfolio held approximately 21% of its net assets in SPDR Gold Trust. Thus, the volatility of each Fund’s net assets value and its performance in general, depends disproportionately more on the respective performance of a single issuer than that of a more diversified fund.
10 FOREIGN SECURITIES RISK Investments in the securities of foreign issuers involve special risks which include changes in foreign exchange rates and the possibility of future adverse political and economic developments which could adversely affect the value of such securities. Moreover, securities in foreign issuers and markets may be less liquid and their prices more volatile than those of U.S. issuers and markets.
11 CONTINGENCIES The Funds indemnify officers and directors for certain liabilities that might arise from their performance of their duties for the Funds. Additionally, in the normal course of business, the Funds enter into contracts that contain a variety of representations and warranties and which may provide general indemnifications. The Funds’ maximum exposure under these arrangements is unknown, as it involves future claims that may be made against the Funds under circumstances that have not occurred.
12 SUBSEQUENT EVENTS The Funds have evaluated subsequent events through the date the financial statements were issued and determined that no subsequent events have occurred that require additional disclosure in the financial statements.
| MIDAS FUND | | | | | For the Year Ended December 31, | |
| | Six Months Ended June 30, 2011 | | | 2010 | | | 2009 | | | 2008 | | | 2007 | | | 2006 | |
| Per Share Data (for a share outstanding throughout each period) | | | | | | | | | | | | | | | | | | |
| Net asset value, beginning of period | | $ | 5.65 | | | $ | 3.82 | | | $ | 2.11 | | | $ | 5.64 | | | $ | 4.29 | | | $ | 2.99 | |
| Income (loss) from investment operations: | | | | | | | | | | | | | | | | | | | | | | | | |
Net investment loss (1) | | | (0.04 | ) | | | (0.07 | ) | | | (0.05 | ) | | | (0.06 | ) | | | (0.08 | ) | | | (0.08 | ) |
| Net realized and unrealized gain (loss) on investments | | | (1.06 | ) | | | 1.90 | | | | 1.80 | | | | (3.36 | ) | | | 1.44 | | | | 1.39 | |
| Total from investment operations | | | (1.10 | ) | | | 1.83 | | | | 1.75 | | | | (3.42 | ) | | | 1.36 | | | | 1.31 | |
| Paid in capital from redemption fees | | | - | (2) | | | - | (2) | | | - | (2) | | | - | (2) | | | - | (2) | | | 0.01 | |
| Less distributions: | | | | | | | | | | | | | | | | | | | | | | | | |
| Net investment income | | | (0.05 | ) | | | - | | | | (0.04 | ) | | | (0.11 | ) | | | (0.01 | ) | | | (0.02 | ) |
| Tax return of capital | | | (0.01 | ) | | | - | | | | - | | | | - | | | | - | | | | - | |
| Total distributions | | | (0.06 | ) | | | - | | | | (0.04 | ) | | | (0.11 | ) | | | (0.01 | ) | | | (0.02 | ) |
| Net asset value, end of period | | $ | 4.49 | | | $ | 5.65 | | | $ | 3.82 | | | $ | 2.11 | | | $ | 5.64 | | | $ | 4.29 | |
| | | | | | | | | | | | | | | | | | | | | | | | | |
| Total Return | | | (19.47 | )% | | | 47.91 | % | | | 83.88 | % | | | (60.89 | )% | | | 31.70 | % | | | 44.02 | % |
| | | | | | | | | | | | | | | | | | | | | | | | | |
| Ratios/Supplemental Data | | | | | | | | | | | | | | | | | | | | | | | | |
| Net assets at end of period (000s omitted) | | $ | 97,208 | | | $ | 139,644 | | | $ | 116,311 | | | $ | 77,502 | | | $ | 251,394 | | | $ | 138,726 | |
| Ratio of total expenses to average net assets | | | 2.26 | %(3) | | | 2.29 | % | | | 2.39 | % | | | 2.37 | % | | | 2.43 | % | | | 2.39 | % |
| Ratio of net expenses to average net assets | | | 2.26 | %(3) | | | 2.29 | % | | | 2.39 | % | | | 2.37 | % | | | 2.43 | % | | | 2.38 | % |
| Ratio of net expenses excluding loan interest and | | | | | | | | | | | | | | | | | | | | | | | | |
| fees to average net assets | | | 2.13 | %(3) | | | 2.14 | % | | | 2.29 | % | | | 2.02 | % | | | 1.87 | % | | | 1.96 | % |
| Ratio of net investment loss to average net assets | | | (1.40 | )%(3) | | | (1.58 | )% | | | (1.67 | )% | | | (1.42 | )% | | | (1.58 | )% | | | (1.96 | )% |
| Portfolio turnover rate | | | 38 | % | | | 63 | % | | | 82 | % | | | 129 | % | | | 126 | % | | | 118 | % |
| | |
| (1) Average shares outstanding during the period are used to calculate per share data. | |
| (2) Less than $.005 per share. | |
| (3) Annualized. | |
| MIDAS MAGIC | | | | | For the Year Ended December 31, | |
| | Six Months Ended June 30, 2011 | | | 2010 | | | 2009 | | | 2008 | | | 2007 | | | 2006 | |
| Per Share Data (for a share outstanding throughout each period) | | | | | | | | | | | | | | | | | | |
| Net asset value, beginning of period | | $ | 14.73 | | | $ | 13.94 | | | $ | 10.36 | | | $ | 19.13 | | | $ | 16.74 | | | $ | 14.80 | |
| Income (loss) from investment operations: | | | | | | | | | | | | | | | | | | | | | | | | |
Net investment loss (1) | | | (0.25 | ) | | | (0.48 | ) | | | (0.37 | ) | | | (0.43 | ) | | | (0.50 | ) | | | (0.35 | ) |
| Net realized and unrealized gain (loss) on investments | | | 0.70 | | | | 1.27 | | | | 3.95 | | | | (8.34 | ) | | | 2.89 | | | | 2.29 | |
| Total from investment operations | | | 0.45 | | | | 0.79 | | | | 3.58 | | | | (8.77 | ) | | | 2.39 | | | | 1.94 | |
Paid in capital from redemption fees (2) | | | - | | | | - | | | | - | | | | - | | | | - | | | | - | |
| Net asset value, end of period | | $ | 15.18 | | | $ | 14.73 | | | $ | 13.94 | | | $ | 10.36 | | | $ | 19.13 | | | $ | 16.74 | |
| | | | | | | | | | | | | | | | | | | | | | | | | |
| Total Return | | | 3.05 | % | | | 5.67 | % | | | 34.56 | % | | | (45.84 | )% | | | 14.28 | % | | | 13.11 | % |
| | | | | | | | | | | | | | | | | | | | | | | | | |
| Ratios/Supplemental Data | | | | | | | | | | | | | | | | | | | | | | | | |
| Net assets at end of period (000s omitted) | | $ | 11,015 | | | $ | 12,240 | | | $ | 11,582 | | | $ | 8,911 | | | $ | 17,334 | | | $ | 17,149 | |
| Ratio of total expenses to average net assets | | | 4.11 | %(3) | | | 4.22 | % | | | 4.46 | % | | | 3.89 | % | | | 4.06 | % | | | 3.89 | % |
| Ratio of net expenses to average net assets | | | 4.11 | %(3) | | | 4.22 | % | | | 4.46 | % | | | 3.89 | % | | | 4.06 | % | | | 3.88 | % |
| Ratio of net expenses excluding loan interest and | | | | | | | | | | | | | | | | | | | | | | | | |
| fees to average net assets | | | 3.79 | %(3) | | | 3.84 | % | | | 4.11 | % | | | 3.32 | % | | | 3.22 | % | | | 3.39 | % |
| Ratio of net investment loss to average net assets | | | (3.24 | )%(3) | | | (3.39 | )% | | | (3.23 | )% | | | (2.71 | )% | | | (2.85 | )% | | | (2.32 | )% |
| Portfolio turnover rate | | | 8 | % | | | 0 | % | | | 9 | % | | | 13 | % | | | 36 | % | | | 73 | % |
| | | | | | | | | | | | | | | | | | | | | | | | | |
| | | | | | | | | | |
| (1) Average shares outstanding during the period are used to calculate per share data. | | | | | | | | | |
| (2) Less than $.005 per share. | | | | | | | | | | | | | |
| (3) Annualized. | | | | | | | | | | | | | |
See notes to financial statements.
| Financial Statements | |
| FINANCIAL Highlights | (Unaudited) continued |
| | | | | | For the Year Ended December 31, | |
| MIDAS PERPETUAL PORTFOLIO | | Six Months Ended June 30, 2011 | | | 2010 | | | 2009 | | | 2008(1) | | | 2007(1) | | | 2006(1) | |
| Per Share Data (for a share outstanding throughout each period) | | | | | | | | | | | | | | | | | | |
| Net asset value, beginning of period | | $ | 1.30 | | | $ | 1.15 | | | $ | 1.00 | | | $ | 1.000 | | | $ | 1.000 | | | $ | 1.000 | |
| Income (loss) from investment operations: | | | | | | | | | | | | | | | | | | | | | | | | |
Net investment loss (2) | | | - | | | | (0.01 | ) | | | (0.01 | ) | | | 0.012 | | | | 0.039 | | | | 0.039 | |
| Net realized and unrealized gain on investments | | | 0.02 | | | | 0.16 | | | | 0.18 | | | | - | | | | - | | | | - | |
| Total from investment operations | | | 0.02 | | | | 0.15 | | | | 0.17 | | | | - | | | | - | | | | - | |
Paid in capital from redemption fees (3) | | | - | | | | - | | | | - | | | | - | | | | - | | | | - | |
| Less distributions: | | | | | | | | | | | | | | | | | | | | | | | | |
| Net investment income | | | - | | | | - | | | | - | | | | (0.012 | ) | | | (0.039 | ) | | | (0.039 | ) |
| Realized gains | | | (0.03 | ) | | | - | | | | (0.02 | ) | | | - | | | | - | | | | - | |
| Total distributions | | | (0.03 | ) | | | - | | | | (0.02 | ) | | | (0.012 | ) | | | (0.039 | ) | | | (0.039 | ) |
| Net asset value, end of period | | $ | 1.29 | | | $ | 1.30 | | | $ | 1.15 | | | $ | 1.000 | | | $ | 1.000 | | | $ | 1.000 | |
Total Return (4) | | | 1.54 | % | | | 13.04 | % | | | 17.03 | % | | | 1.22 | % | | | 4.00 | % | | | 3.88 | % |
| Ratios/Supplemental Data | | | | | | | | | | | | | | | | | | | | | | | | |
| Net assets at end of period (000s omitted) | | $ | 12,887 | | | $ | 10,620 | | | $ | 8,311 | | | $ | 7,191 | | | $ | 14,516 | | | $ | 14,528 | |
Ratio of total expenses to average net assets (5) | | | 1.84 | %(7) | | | 2.51 | % | | | 2.98 | % | | | 1.77 | % | | | 1.91 | % | | | 1.83 | % |
Ratio of net expenses to average net assets (4) (5) | | | 1.34 | %(7) | | | 1.93 | % | | | 2.23 | % | | | 1.21 | % | | | 1.16 | % | | | 1.08 | % |
| Ratio of net expenses excluding loan interest and | | | | | | | | | | | | | | | | | | | | | | | | |
| Fees to average net assets | | | 1.34 | %(7) | | | 1.90 | % | | | 2.22 | % | | | - | | | | - | | | | - | |
Ratio of net investment income (loss) to average net assets (4) | | | (0.44 | )%(7) | | | (1.03 | )% | | | (1.29 | )% | | | 1.22 | % | | | 3.92 | % | | | 3.87 | % |
| Portfolio turnover rate | | | 40 | % | | | 4 | % | | | 24 | % | | | 0 | % | | | 0 | % | | | 0 | % |
| | | | | | | | | | | | | | | | | | | | | | | | | |
| | |
(1) These financial highlights reflect the Fund’s operation as a money market fund up to December 28, 2008. On December 29, 2008, the Fund changed its name to Midas Perpetual Portfolio, Inc. from Midas Dollar Reserves, Inc., ceased operating as a money market fund, and began operating as a fluctuating net asset value fund pursuant to its current investment objective and policies. (2) Average shares outstanding during the period are used to calculate per share data. (3) The Fund began imposing a redemption fee on December 29, 2008. The amount was less than $.005 per share for the six months ended June 30, 2011 and for the years ended December 31, 2010, 2009, and 2008, respectively. (4) Fees contractually waived by the Investment Manager and Distributor reduced the ratio of expenses to average net assets by 0.50%, 0.58%, and 0.75% for the six months ended June 30, 2011 and for the years ended December 31, 2010 and 2009, respectively. Fees voluntarily waived by the Investment Manager and Distributor reduced the ratio of net expenses to average net assets by 0.24%, 0.75%, and 0.75% for the years ended December 31, 2008, 2007, and 2006, respectively. In addition, the Investment Manager voluntarily reimbursed the Fund for certain operating expenses which further reduced the ratio of net expenses to average net assets by 0.32%, for the year ended December 31, 2008. The impact of the fee waivers and reimbursements is reflected in both the total return and the ratio of net investment income (loss) to average net assets. (5) “Total expenses” are the expenses of the Fund as presented in the Statement of Operations before fee waivers. (6) “Net expenses” are the expenses of the Fund as presented in the Statement of Operations after fee waivers. (7) Annualized. | |
See notes to financial statements.
The investment management agreements (each individually, an “Agreement,” and collectively, the “Agreements”) between each of the Midas Funds (each individually, a “Fund,” and collectively, the “Funds”) and the investment manager, Midas Management Corporation (the “Investment Manager”), generally provide that each Agreement shall continue automatically for successive periods of twelve months each, provided that such continuance is specifically approved at least annually (i) by a vote of a majority of the Directors of each Fund who are not parties to the Agreement, or interested persons of any such party and (ii) by the Board of Directors of each Fund or by the vote of the holders of a majority of the outstanding voting securities of each Fund.
In considering the annual approval of each Agreement, each Board of Directors considered all relevant factors, including, among other things, information that had been provided at other Board meetings, as well as information furnished to the Boards for the joint meeting held on March 8, 2011 to specifically consider the continuance of the Agreements. Such information included, among other things, the following: information comparing the management fees of each Fund with a peer group of broadly comparable funds; information regarding Fund investment performance in comparison to a relevant peer group of funds; the economic outlook and the general investment outlook in relevant investment markets; the Investment Manager’s results and financial condition and the overall organization of the Investment Manager; the allocation of brokerage and the benefits received by the Investment Manager as a result of brokerage allocation; the Investment Manager’s trading practices, including soft dollars; the Investment Manager’s management of relationships with custodians, transfer agents, pricing agents, brokers, and other service providers; the resources devoted to the Investment Manager’s compliance efforts undertaken on behalf of each Fund it manages and the record of compliance with the compliance programs of the Funds and the Investment Manager, and their affiliates; the quality, nature, cost, and character of the administrative and other non-investment management services provided by the Investment Manager and its affiliates; the terms of each Agreement; the Investment Manager’s gifts and entertainment log; and the reasonableness and appropriateness of the particular fee paid by each Fund for the services described therein. The directors concluded that the Investment Manager is using soft dollars for the benefit of each Fund and its shareholders. The directors further concluded that the Investment Manager is using each Fund’s assets for the benefit of the Fund and its shareholders and is acting in the best interests of each Fund.
The Boards of Directors also considered the nature, extent, and quality of the management services provided by the Investment Manager. In so doing, the Boards considered the Investment Manager’s management capabilities with respect to the types of investments held by each Fund, including information relating to the education, experience, and number of investment professionals and other personnel who provide services under each Agreement. The Boards also took into account the time and attention to be devoted by management to each Fund. The Boards evaluated the level of skill required to manage each Fund and concluded that the resources available at the Investment Manager were appropriate to fulfill effectively its duties on behalf of each Fund. The directors also noted that the Investment Manager has managed the Funds for several years and indicated their belief that a long term relationship with the investment manager, during which the Investment Manager had demonstrated being conscientious and capable, is in the best interests of the Funds.
The Boards then received information concerning the investment philosophy and investment process applied by the Investment Manager in managing each Fund. In this regard, the Boards considered the Investment Manager’s in-house research capabilities as well as other resources available to the Investment Manager’s personnel, including research services that may be available to the Investment Manager as a result of securities transactions effected for the Funds. The Boards concluded that the Investment Manager’s investment process, research capabilities, and philosophy were well suited to each Fund, given each Fund’s investment objective and policies. In their review of comparative information with respect to each Fund’s investment performance, the Boards received comparative information, comparing the Funds’ performance to that of a peer group of investment companies pursuing broadly similar strategies. In the case of those Funds that had underperformed their peer groups and/or relevant market indices, the Board discussed with personnel of the Investment Manager the factors that contributed to each Fund’s performance and steps that the Investment Manager had taken, or intended to take, to seek to improve each Fund’s performance. The Board also considered the Investment Manager’s resources and responsiveness with respect to the Funds that experienced lagging performance.
With respect to their review of fees payable under the Agreements, the Boards considered information comparing the Funds’ management fees and expense ratios to those of a peer group of broadly comparable funds. The Boards considered the mean and median of the management fees and expense ratios of each peer group. The Boards also considered the profitability of the Investment Manager from its association with the Funds. In addition, the Board of Midas Perpetual Portfolio noted the extent to which the Investment Manager had waived its fee pursuant to the contractual limits on the Fund’s expenses undertaken by the Investment Manager, and the Board also noted that the Investment Manager incurred a loss on the Fund. In reviewing the information regarding the expense ratio of the Funds, the Boards concluded that although the Funds’ expense ratios were higher relative to each Fund’s peer group, they were competitive with comparable funds in light of the quality of services received and the level of assets managed. The Boards noted that economies of scale may develop for each Fund as its assets increase and fund level expenses decline as a percentage of assets, but that fund level economies of scale may not necessarily result in
Investment Manager level economies of scale. This information assisted the Boards in concluding that the fees paid by each Fund are within a range of those paid by comparable funds within the fund industry. Further, the Boards concluded that the Investment Manager’s fees bear a reasonable relationship to the services rendered and have been the product of arm’s length bargaining.
In addition to the factors mentioned above, the Boards considered the fiduciary duty assumed by the Investment Manager in connection with the services rendered to the Funds and the business reputation of the Investment Manager and its financial resources. The Boards also considered information regarding the character and amount of other incidental benefits received by the Investment Manager and its affiliates from their association with the Funds. The Boards concluded that potential “fall-out” benefits that the Investment Manager and its affiliates may receive, such as greater name recognition, affiliated brokerage commissions, or increased ability to obtain research services, appear to be reasonable, and may, in some cases, benefit the Funds. The Boards concluded that in light of the services rendered, the profits realized by the Investment Manager are not unreasonable.
The Boards considered all relevant factors and did not consider any single factor as controlling in determining whether or not to renew each Agreement. In assessing the information provided by the Investment Manager and its affiliates, the Boards also noted that they were taking into consideration the benefits to shareholders of investing in a fund that is part of a fund complex which provides a variety of shareholder services.
Based on their consideration of the foregoing factors and conclusions, and such other factors and conclusions as they deemed relevant, and assisted by counsel, the Boards concluded that the approval of each Agreement, including the fee structure, is in the best interests of each Fund.
| |
| ABOUT Your Fund’s Expenses | (Unaudited) |
Fund shareholders may incur two types of costs: (1) transaction costs, including redemption or small account fees; and (2) ongoing costs, including management fees, distribution and service 12b-1 fees, and other fund expenses. This example is intended to help you understand your ongoing costs (in dollars) of investing in your Fund and to compare these costs with the ongoing cost of investing in other mutual funds. The example is based on an investment of $1,000 made at the beginning of the period and held for the entire period from January 1, 2011 to June 30, 2011.
ACTUAL EXPENSES
The table provides information about actual account values and actual expenses for each Fund. You may use the information, together with the amount you invested, to estimate the expenses that you paid over the period. First, identify the Fund you own. Then simply divide your account value by $1,000 (for example, an $8,600 account value divided by $1,000 = 8.6), then multiply the result by the number under the heading “Expenses Paid During Period” to estimate the expenses you paid on your account during this period. The Fund may charge you a $20 annual small balance account fee if the value of those shares is less than $500. We will redeem shares automatically in one of your accounts to pay the $20 fee. In determining your total eligible investment amount, we will include your investments in all personal accounts registered under your Social Security number. Personal accounts include individual accounts, joint accounts, UGMA/UTMA accounts, personal trusts, Coverdell Education Savings Accounts, and IRAs (including traditional, Roth, Rollover, SEP, SARSEP, and SIMPLE-IRAs), and certain other retirement accounts.
HYPOTHETICAL EXAMPLE FOR COMPARISON PURPOSES
The table also provides information about hypothetical account values and hypothetical expenses based on the actual expense ratio of each Fund and an assumed rate of return of 5% per year before expenses, which is not the actual return of a Fund. The hypothetical account values and expenses may not be used to estimate the actual ending account balance or expenses you paid for the period. You may use this information to compare the ongoing costs of investing in your Fund and other funds. To do so, compare this 5% hypothetical example with the 5% hypothetical examples that appear in the shareholder reports of the other funds.
| EXPENSE ANALYSIS TABLE | |
| | | Beginning Account Value January 1, 2011 | | | Ending Account Value June 30, 2011 | | | Expenses Paid During Period January 1, 2011-June 30, 2011(a) | | | Annualized Expense Ratio | |
| Midas Fund | | | | | | | | | | | | |
| Actual | | $ | 1,000.00 | | | $ | 902.65 | | | $ | 10.12 | | | | 2.26 | % |
Hypothetical (b) | | $ | 1,000.00 | | | $ | 1,013.59 | | | $ | 11.28 | | | | 2.26 | % |
| Midas Magic | | | | | | | | | | | | | | | | |
| Actual | | $ | 1,000.00 | | | $ | 1,030.55 | | | $ | 20.69 | | | | 4.11 | % |
Hypothetical (b) | | $ | 1,000.00 | | | $ | 1,004.41 | | | $ | 20.43 | | | | 4.11 | % |
| Midas Perpetual Portfolio | | | | | | | | | | | | | | | | |
| Actual | | $ | 1,000.00 | | | $ | 1,015.38 | | | $ | 9.19 | | | | 1.84 | % |
Hypothetical (b) | | $ | 1,000.00 | | | $ | 1,015.67 | | | $ | 9.20 | | | | 1.84 | % |
| | | | | | | | | | | | | | | | | |
(a) Expenses are equal to the Fund’s annualized expense ratio multiplied by the average account value over the period, multiplied by 181, the number of days in the most recent fiscal half year, divided by 365, to reflect the one half year period. (b) Assumes 5% total return before expenses. | |
| |
| ADDITIONAL Information | (Unaudited) |
QUARTERLY SCHEDULES OF PORTFOLIO HOLDINGS
The Funds file their complete schedule of portfolio holdings with the Securities and Exchange Commission (“SEC”) for the first and third quarters of each fiscal year on Form N-Q. The Funds’ Forms N-Q are available on the SEC’s website at www.sec.gov and may be reviewed and copied at the SEC’s Public Reference Room in Washington, D.C. Information on the operation of the Public Reference Room may be obtained by calling 1-800-SEC-0330. The Funds’ quarterly reports on Form N-Q are also available on the Funds’ website at www.MidasFunds.com.
PROXY VOTING POLICIES AND PROCEDURES
A description of the policies and procedures that the Funds use to determine how to vote proxies relating to portfolio securities is available, without charge, by calling 1-800-400-MIDAS (6432) and on the website of the SEC at www.sec.gov. Information regarding how the Funds voted proxies relating to portfolio securities during the most recent 12 month period ended June 30 is available without charge, by calling 1-800-400-MIDAS (6432), on the website of the SEC at www.sec.gov, and on the Funds’ website at www.MidasFunds.com.
| MIDAS FUNDS OFFER |
• Regular Accounts • IRA Retirement Accounts, including Traditional, Roth, Self-Employed, and Small Business (SEP, SIMPLE) • Education Savings Accounts • Health Savings Accounts • Online account access • Electronic delivery of account statements, reports, and prospectus, etc. Only $1,000 minimum to open a Midas Funds account, with subsequent minimum investments of $100. There is NO FEE to open an account. Join our free and automatic Midas Bank Transfer Plan and open an account for only $100, and make subsequent monthly investments of $100 or more. |
| SIGN UP FOR ELECTRONIC DELIVERY |
Midas shareholders can now sign up for electronic delivery of their account statements, confirmations, annual and semi-annual reports, prospectuses, and other material to receive Midas information more quickly and conveniently. It is fast and easy to sign up for electronic delivery. Just follow these three simple steps: (1) go to www.MidasFunds.com and log into THE MIDAS TOUCH® - Account Access, (2) after logging in, at the Portfolio Summary, click on an account number and then select Account Detail from the left side menu, and (3) click on Electronic Document Delivery. On this page you can choose to have either account and confirmation statements or regulatory items, such as annual and semi-annual reports and prospectuses, or both, sent to any email address you wish. That's it! |
NEW ACCOUNT Application Instructions
MIDAS REGULAR ACCOUNT APPLICATION
| 1 | REGISTRATION If there is more than one owner of the account, the registration will be “Joint Tenants with Right of Survivor-ship” unless you specify “Tenants in Common.” If this is a Uniform Gift/Transfer to a Minor, please enter all information requested for the minor. |
| 2 | MAILING AND E-MAIL ADDRESSES, TELEPHONE NUMBER, AND CITIZENSHIP If you are a non-U.S. citizen residing in the United States, in addition to this Account Application, you will be required to attach a Form W-8 BEN, which can be obtained from the IRS website at www.irs.gov or calling 1-800-829-3676. If this is a Uniform Gift/Transfer to a Minor, please enter all information for the Custodian, including custodian’s physical address. |
| 3 | CHOOSE FUND(S) AND AMOUNT INVESTED Indicate the Fund(s) in which you are opening an account. The opening minimum for a Fund is $1,000 ($100 for Midas Automatic Investment Programs – see Section 6 of the Account Application). The minimum subsequent investment is $100. |
| 4 | DISTRIBUTIONS Your dividends and distributions will be reinvested in additional shares of the Fund unless you instruct Midas otherwise. |
| 5 | SHAREHOLDER COMMUNICATIONS Check the method of shareholder communications you would prefer (electronic or paper copies). Electronic communications for account and confirmation statements and regulatory items, such as annual and semi-annual reports and prospectuses, will be sent to the e-mail address provided in Section 2 of the Account Application. |
| 6 | MIDAS SHAREHOLDER SERVICES - MIDAS BANK TRANSFER PLAN/THE MIDAS TOUCH® With the Bank Transfer Plan (BTP), you can establish a convenient and affordable long term investment program. The $1,000 minimum investment requirement is waived since the BTP is designed to facilitate an automatic monthly investment of $100 or more into your Fund account(s). Please specify the total amount you want to invest each month, the frequency, and when you’d like to start your automatic investing. |
All shareholders can access their account 24 hours a day, every day, at www.MidasFunds.com and by automated telephone response at 1-800-400-MIDAS (6432). Only with THE MIDAS TOUCH® can you manage your account by purchasing or redeeming Fund shares using electronic funds transfer, initiate Fund to Fund transfers among the three Midas Funds, and perform transactions through a Shareholder Services Representative.
To activate these features, please indicate your bank routing and account numbers or attach a voided check.
| 7 | SIGNATURE AND CERTIFICATION TO AVOID BACKUP WITHHOLDING After reading this section, please sign and date the Account Application. |
SEND BY MAIL Mail your completed Account Application to Midas Funds, P.O. Box 6110, Indianapolis, IN 46206-6110. Checks must be payable to Midas Funds in U.S. dollars. Third party checks and money orders (other than money orders issued by a bank) cannot be accepted.
SEND BY WIRE Call 1-800-400-MIDAS (6432) between 8 a.m. and 6 p.m. ET, on business days to speak with a Shareholder Services Representative. A completed Account Application, the name of the bank sending the wire, and the amount to be wired are required before the wired funds can be accepted. The completed Account Application should be faxed to 1-317-937-3014, Attn: Midas Funds. You will then be assigned a Fund account number and receive wiring address information. Your account number and name(s) must be specified in the wire as they are to appear on the account registration. You should then enter your account number on your completed Account Application and promptly mail it to Midas Funds, P.O. Box 6110, Indianapolis, IN 46206-6110. This service is not available on days when the Federal Reserve wire system is closed.
IF YOU NEED ANY ASSISTANCE IN COMPLETING THE ACCOUNT APPLICATION,
PLEASE CALL A SHAREHOLDER SERVICES REPRESENTATIVE AT 1-800-400-MIDAS (6432)
BETWEEN THE HOURS OF 8 A.M. AND 6 P.M. ET.
WITH THE MIDAS TOUCH®, YOU ENJOY ENHANCED ACCESS AT ANY TIME, ONLINE
AT WWW.MIDASFUNDS.COM OR BY TELEPHONE 1-800-400-MIDAS (6432), TO
| * | Monitor your investments |
| | |
| * | Retrieve your account history |
| | |
| * | Review recent transactions |
| | |
| * | Obtain Fund prices |
| | |
| * | Check your account balances and account activity |
| | |
| * | Obtain prospectuses, shareholder reports, and account applications, as well as IRA transfer forms and Automatic Investment Program forms for regular monthly investing |
| | |
| * | Purchase or redeem Fund shares using electronic funds transfer to move money to or from your authorized bank account |
| | |
| * | Initiate account transactions, such as Fund to Fund transfers among the three Midas Funds |
| | |
| * | Perform transactions through a Shareholder Services Representative Monday through Friday, from 8 a.m. to 6 p.m. ET |
| | |
MIDAS FUNDS
P.O. BOX 6110
INDIANAPOLIS, IN 46206-6110
1-800-400-MIDAS (6432) FOR INVESTMENT INFORMATION
Past performance does not guarantee future results. Investment return will fluctuate, so shares when redeemed may be worth more or less than their cost. Dollar cost averaging does not assure a profit or protect against loss in a declining market and investors should consider their ability to make purchases when prices are low. One of Midas’ guiding principles is that we will communicate with our shareholders as candidly as possible because we believe shareholders benefit from understanding our investment philosophy and approach. Our views and opinions regarding the prospects of our portfolio holdings, Funds, and the economy are “forward looking statements” which may or may not be accurate and may be materially different over future periods. We disclaim any obligation to update or alter any forward looking statements, whether as a result of new information, future events, or otherwise. Thus, you should not place undue reliance on forward looking statements, which also speak only as of the date of this Report. Current performance may be lower or higher than the performance quoted herein. This Report and the financial statements it contains are submitted for the general information of the shareholders of the Midas Funds. The Report is not authorized for distribution to prospective investors in the Funds unless preceded or accompanied by an effective Prospectus which contains more complete information, including charges, risks and expenses. Please read it carefully before you invest or send money.
Midas Securities Group, Inc., Distributor. Member, FINRA.