UNITED STATES
SECURITIES AND EXCHANGE COMMISSION
Washington, D.C. 20549
FORM N-CSRS
CERTIFIED SHAREHOLDER REPORT OF REGISTERED
MANAGEMENT INVESTMENT COMPANIES
| Investment Company Act file number: | 811-02474 |
|---|
| |
Midas Perpetual Portfolio, Inc.
(Exact name of registrant as specified in charter)
11 Hanover Square, New York, NY 10005
(Address of principal executive offices) (Zipcode)
John F. Ramírez, Esq.
11 Hanover Square
New York, NY 10005
(Name and address of agent for service)
Registrant's telephone number, including area code: 1-212-480-6432
Date of fiscal year end: 12/31
Date of reporting period: 1/1/09 - 06/30/09
Form N-CSRS is to be used by management investment companies to file reports with the Commission not later than 10 days after the transmission to stockholders of any report that is required to be transmitted to stockholders under Rule 30e-1 under the Investment Company Act of 1940 (17 CFR 270.30e-1). The Commission may use the information provided on Form N-CSRS in its regulatory, disclosure review, inspection, and policy making roles.
A registrant is required to disclose the information specified by Form N-CSRS and the Commission will make this information public. A registrant is not required to respond to the collection of information contained in Form N-CSRS unless the Form displays a current valid Office of Management and Budget ("OMB") control number. Please direct comments concerning the accuracy of the information collection burden estimate and any suggestions for reducing the burden to Secretary, Securities and Exchange Commission, 450 Fifth Street, NW, Washington, DC 20549-0609. The OMB has reviewed this collection of information under clearance requirements of 44 U.S.C. sec. 3507.
Item 1. Report to Stockholders.

| | |
| Midas Special Fund | | Midas Fund |
Table of Contents
| | • | | Midas Fund (Ticker: MIDSX) |
Seeks capital appreciation and protection against inflation and secondarily current income through investments primarily in precious metals and natural resources bullion and companies.
| | • | | Midas Special Fund (Ticker: MISEX) |
Invests aggressively for capital appreciation in any security in any sector.
| | • | | Midas Perpetual Portfolio (Ticker: MPERX) |
Seeks to preserve and increase the purchasing power value of its shares over the long term by investing in gold, silver, Swiss franc assets, hard asset securities, large capitalization growth stocks, and dollar assets.
To Our Shareholders
Do stock market prices efficiently reflect the values of businesses? Or, do market prices reflect the emotions of volatile investors? Let’s look at some recent history for clues. First clue: 2008 saw the most severe stock market decline since 1931. Second clue: January 2009’s approximate 9% decline was followed by a nearly equal decline in February, leaving the S&P 500 down approximately 18% in the first 2 months of 2009, and down 26% since the November election. Third clue: the S&P 500 rocketed up approximately 36% from early March lows through the end of June 2009 for a total return in the first six months of 2009 of about 3%.
At Midas, we have long emphasized the importance of dealing with market volatility. We have noted that good investors will have a long term perspective and seek to insulate themselves from market volatility and their own emotions. Moreover, by making a distinction between an investment’s intrinsic worth and its market value, such investors will realize that volatility provides investment opportunities and will use market declines to make additional investments. Over the long term, their patience may be rewarded if their analysis of intrinsic worth is correct. While today it appears that government control of the economy, government regulations, and taxes might increase along with inflation and interest rates resulting in slower U.S. economic growth, investing fundamentals at Midas will remain the same: focus on quality for the long term.
Midas: Quality for the Long Term
At Midas, we believe quality securities, although subject to risk of potential loss, are more likely to weather a temporary market or economic downturn. We also believe that with a long term investing outlook we can keep our disciplined focus on companies with combinations of strength in operations, finances, and products that we find most attractive, even through volatile markets. Although it does not eliminate the potential for loss, a disciplined and flexible analytical process can reward Fund shareholders with investments that offer the potential for gratifying returns, even as economic activity and markets evolve in unpredictable patterns.
Midas Perpetual Portfolio
So, at Midas, we first seek to invest in quality; second, we invest for the long term; and third, we offer three separate investment options to provide overall portfolio diversity: Midas Special Fund for a longer term, stock market oriented objective; Midas Fund for precious metals capital appreciation and as a hedge against inflation; and, Midas Perpetual Portfolio for investors who wish to preserve and increase the purchasing power value of their capital for the long term with a strategy that does not depend on any particular outcome for the economy.
The logic of our newest offering, Midas Perpetual Portfolio, involves investing a fixed target percentage of its total assets in set investment categories: gold, silver, Swiss franc assets, stocks of U.S. and foreign companies dealing primarily in real estate and natural resources, large capitalization growth stocks, and dollar assets. The investment strategy of the Fund acknowledges a broad range of economic possibilities and investment outlooks and seeks to incorporate investments appropriate for each of them.
Discovering Opportunities Now
For Your Future
Midas offers an excellent service - the Midas Bank Transfer Plan - which makes regular investing convenient to help you seek your future financial goals. With the free Midas Bank Transfer Plan, you decide now to invest a certain amount each month in the future for as long as you like and Midas will transfer the money from your bank account for investment in your designated Midas Funds account. Periodically, you should review your overall portfolio. For retirement investing goals, consider the tax advantaged Midas Traditional, Roth, SEP, or SIMPLE IRA. At Midas, we also offer Health Savings Accounts as well as Education Savings Accounts. Forms for all of these plans may be found at www.MidasFunds.com.
Investing the same amount regularly, known as “dollar cost averaging,” can reduce the anxiety of investing in a rising or falling market or buying all of your shares at market highs. Although this strategy cannot assure a profit or protect against loss in a declining market, it can result in a lower average cost for your purchases. Of course, you should consider your financial ability to continue your purchases through periods of low price levels when undertaking such a strategy.

If you have any questions, we will be happy to assist you without any obligation on your part. Please call us today at 1-800-400-MIDAS (6432), or visit www.MidasFunds.com. We look forward to hearing from you.
|
| Sincerely, |
|
 |
| Thomas B. Winmill |
| President |
1
Midas Fund
COMMENTARY
We are pleased to welcome all new shareholders attracted to Midas Fund by its track record of past performance, its policy of investing primarily in securities of companies principally involved in mining, processing, distributing or otherwise dealing in gold, silver, platinum, or other natural resources, and its shareholder services. Midas Fund’s value rose 26.48% for its shareholders in the first half of 2009, a gratifying result for our quality, “growth in gold” and other natural resources investment approach, particularly given the relatively lackluster return for gold bullion in the same period of only 7.44%.
Market Review
In the first half of 2009, gold prices based on the London p.m. fix fluctuated between $810 and $989 per ounce, ending the period at $934. In view of the stresses confronting the economy, gold’s price pattern seems muted. Indeed, gold’s average price was $914 in the first half of 2009, barely changed from its average of $910 in the first half of 2008. In our view, it is currency strength or weakness that has determined the desirability of gold and resource investing. For example, in the first six months of 2009, gold advanced approximately 7% in U.S. dollar terms but declined about the same amount in Australian dollar terms as the Aussie currency strengthened. Similarly, as the Japanese yen weakened, pushing gold in yen terms up approximately 14% in the period, UK investors saw gold values go down about 6% due to recovering pound sterling prices.
TOP 10 HOLDINGS
AS OF JUNE 30, 2009
| 4 | Compania De Minas Buenaventura ADR |
| 5 | Northern Dynasty Minerals Ltd. |
| 8 | AngloGold Ashanti Ltd. ADR |
| 10 | Silvercorp Metals, Inc. |
Strategies Focusing on Quality
Given this market environment, Midas Fund’s focus on quality gold mining companies in the first half of 2009 enhanced returns. As the price of gold fluctuated, the Fund reallocated capital to those gold miners whose exploration programs offered the greatest potential to add resource ounces of gold to their holdings. The Fund’s short selling of certain companies whose valuations were stretched or whose operations appeared substandard negatively impacted performance as market exuberance drove their stock prices even higher. The Fund’s strategy in the months ahead will continue to be seeking investments in attractive gold, platinum, and other natural resource companies opportunistically as markets recover. Midas Fund will generally emphasize larger companies with operations generating strong cash flow, expanding growth profiles, exploration potential, and/or other special features.
Outlook for Gold with Growth
Significantly, it appears that the deflationary pressure of declining equity markets, the recession, and other economic factors may give way to powerful, pro-gold changes occurring in the world economies by virtue of the aggressive cuts in interest rates by the central banks of many nations and massive fiscal spending programs contemplated in key developed and developing economies. Also, low U.S. interest rates may decrease the attractiveness of the U.S. dollar and, by stimulating the economy, heighten inflationary expectations. With inflation, the U.S. dollar could show weakness versus other currencies, boosting gold prices for U.S. investors. Slowing industrial growth, difficult credit conditions, and higher oil and other resource prices may result in an economic environment with a “stagflationary” feel, meaning a combination of high unemployment (stagnation) while prices rise (inflation). By seeking quality investments with growth potential, we seek to address the risks inherent in the sector yet position Midas Fund to benefit from these emerging trends.
2
Midas Special Fund
COMMENTARY
It is a pleasure to submit this 2009 Semi-Annual Report for Midas Special Fund, and to welcome new shareholders. Midas Special Fund invests aggressively for capital appreciation, using a flexible strategy in the selection of securities, and is not limited by the issuer’s location, size, or industry sector. The Fund may employ speculative investment techniques such as borrowing money for investment purposes, a practice known as “leveraging,” and may also invest defensively.
The Economy and the Financial Markets
As the global economy staggers under pressure of historic proportions, the unemployment rate in the United States has increased from a 15 year high in 2008 of 6.7% to a recent 26 year high of 9.5%. At a June 2009 joint meeting of the U.S. Federal Open Market Committee and the Board of Governors of the Federal Reserve System, officials forecasted unemployment at year end within a range of 9.7% to 10.6%. Europe is also still in a deep recession, although there are some signs for optimism. For example, even as the U.K. unemployment rate rose to a 12 year high of 7.6% in June, according to official data, those claiming unemployment benefits rose at the slowest pace for 13 months. In the world’s second largest economy, the Bank of Japan recently announced its expectations that Japan’s economy, in terms of gross domestic product or GDP (the market value of all final goods and services made within the borders of a nation in a year), will fall 3.4% in the year ending March 31, 2010. Meanwhile, the financial markets roughly tracked the ebb and flow of economic data.
Midas Special Fund’s Capital Appreciation Strategies
In these market conditions, the Fund’s strategy was to stay the course, maintain an aggressively leveraged investment posture, and concentrate its portfolio in quality companies with attractive valuations. With holdings of some of the largest and best known U.S. companies in insurance, technology, banking, and finance, the Fund’s total return for the first half of 2009 was a gratifying 2.41%, according to Morningstar, Inc., and currently has risen on the year to 6.85%. While Midas Special Fund may use a seasonal investing strategy to invest the Fund’s assets and achieve its objective, in the current environment of depressed valuations for many companies, the Fund is de-emphasizing this strategy and instead seeking to be aggressively positioned for further gains in stock prices.
Looking ahead, we note that at the June meeting discussed above some Federal Reserve officials expressed a belief that the economic contraction was slowing and that, with a fall in the unemployment rate next year, the decline in economic activity could cease before long. Moreover, other forecasts made at the meeting suggest that real U.S. GDP may decline at a substantially slower rate in the second quarter of 2009 than it had in the first quarter, and then increase in the second half of 2009 and into 2010, giving reasons for cautious optimism. We believe the Fund’s investing discipline of flexible and quality portfolio selection may offer attractive potential, although it does not eliminate the risk of loss, during the remainder of 2009.
Objective: Capital Appreciation
Midas Special Fund will pursue its capital appreciation objective aggressively as financial market conditions evolve, seeking to discover long term opportunities for attractive investment - whether due to a changing outlook for the prospects of a particular company or industry sector generally. Since these strategies reflect longer term wealth building goals, we believe the Fund can be especially appropriate for tax advantaged retirement accounts. For long term investing goals, consider the Midas Traditional, Roth, SEP, or SIMPLE IRA, the Midas Health Savings Account, as well as the Midas Education Savings Account. Forms for all of these tax advantaged plans may be found at www.MidasFunds.com.
TOP 10 HOLDINGS
AS OF AS OF JUNE 30, 2009
| 1 | Berkshire Hathaway, Inc. Class B |
| 6 | The Goldman Sachs Group, Inc. |
| 7 | Canadian Natural Resources Ltd. |
| 9 | General Electric Company |
| 10 | Leucadia National Corporation |
3
Midas Perpetual Portfolio
COMMENTARY
Since December 29, 2008, Midas Perpetual Portfolio’s objective has been to preserve and increase the purchasing power value of its shares over the long term. The investment strategy of the Fund acknowledges a broad range of economic possibilities and investing outlooks, and seeks to incorporate investments appropriate for each of them. In pursuit of its investment objective, the Fund seeks to invest a fixed “Target Percentage” of its total assets in each of the following categories:
| | | |
Investment Category | | Target Percentage | |
Gold | | 20 | % |
Silver | | 5 | % |
Swiss Franc Assets | | 10 | % |
Hard Asset Securities | | 15 | % |
Large Capitalization Growth Stocks | | 15 | % |
Dollar Assets | | 35 | % |
| | | |
Total | | 100 | % |
These investment categories, although subject to risk of potential loss, have been chosen and weighted with the goal of providing downside protection in all foreseeable economic conditions, and it is not currently anticipated that the Fund would waver from this strategy, notwithstanding market fluctuations.
TOP 10 HOLDINGS
AS OF JUNE 30, 2009
| 3 | Switzerland Government, 2.5% Notes, due 3/12/16 |
| 7 | China Life Insurance Co. Ltd. ADR |
Gold and silver investments may include bullion, bullion type coins, and exchange traded funds. Swiss franc assets may include Swiss franc denominated deposits and bonds of the federal government of Switzerland of any maturity. Hard asset securities may include those of U.S. and foreign companies dealing primarily in real estate (such as timberland, ranching and farm land, raw land, and land with improvements and structures) and natural resources (such as oil, gas, coal, precious and non-precious metals, and minerals). Large capitalization growth stocks normally may include U.S. and foreign companies with market capitalization over $50 billion with growth in revenues, earnings, or other similar measure and may include options, warrants, and similar derivatives on such stocks. Dollar assets may include U.S. Treasury bills, notes and bonds, obligations of U.S. government agencies, instrumentalities and sponsored enterprises, and U.S. dollar denominated cash, money market funds, money market instruments, bank deposits, high grade, short term corporate bonds and banker’s acceptances, and similar investments.
Off to a Good Start
Midas Perpetual Portfolio is off to a good start with a total return in the first six months of 2009 of 4.79%, as compared to that of the Standard & Poor’s 500 of 3.16%, according to Morningstar, Inc. The Federal Reserve Open Market Committee apparently still sees prospects for weak economic activity, substantial resource slack, and subdued inflation. In the midst of the challenges of the current economic environment, the Fund continues to employ its investment strategy of asset category diversification. Investors who wish to invest all or a portion of their capital in a way that does not depend on any particular outcome for the economy should consider purchasing shares in the Fund.
Contact Us for Information and Services
Designed to provide growth at lower risk, the Fund’s all weather approach makes it an attractive vehicle for a program of steady monthly investing. To make regular investing in the Fund as easy, convenient, and affordable as possible, we offer the Midas Bank Transfer Plan. For information on this free service, simply give us a call toll free at 1-800-400-MIDAS (6432) and we will be delighted to provide such information to you or a friend or relative. Midas Perpetual Portfolio’s long term objective also makes it attractive for investment through our Traditional or Roth IRAs, Health Savings Accounts, and also our Education Savings Accounts. If you would like to learn more, we would be very pleased to hear from you and look forward to helping you get started.
4
Midas Fund
Schedule of Portfolio Investments - June 30, 2009 (Unaudited)
Common Stocks (93.99%)
| | | | | | |
Shares | | Value | |
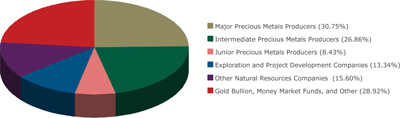
Major Precious Metals Producers (29.82%) | | | | |
| | |
| 100,000 | | AngloGold Ashanti Ltd. ADR (a) | | $ | 3,663,000 | |
| 100,000 | | Barrick Gold Corp. (b) | | | 3,355,000 | |
| 200,000 | | Compania De Minas Buenaventura ADR | | | 4,806,000 | |
| 291,453 | | Fresnillo plc | | | 2,495,974 | |
| 50,000 | | Goldcorp Inc. (b) | | | 1,737,500 | |
| 200,000 | | Kinross Gold Corp. (b) | | | 3,630,000 | |
| 150,000 | | Newcrest Mining Ltd. (c) | | | 3,701,188 | |
| 50,000 | | Newmont Mining Corp. | | | 2,043,500 | |
| 105,800 | | Yamana Gold, Inc. (a) | | | 935,272 | |
| | | | | | |
| | | | | 26,367,434 | |
| |
Intermediate Precious Metals Producers (26.86%) | | | | |
| | |
| 53,300 | | Agnico-Eagle Mines Ltd. (b) | | | 2,797,184 | |
| 18,000 | | Aquarius Platinum Ltd. (a) (c) | | | 68,626 | |
| 548,300 | | Centerra Gold Inc. (c) | | | 2,513,947 | |
| 650,000 | | Eldorado Gold Corp. (a) | | | 5,817,500 | |
| 1,925,000 | | Lihir Gold Limited (c) | | | 4,491,044 | |
| 100,000 | | Lihir Gold Limited ADR (a) (c) | | | 2,322,000 | |
| 575,000 | | Northam Platinum Ltd. | | | 2,226,287 | |
| 1,000,000 | | Silvercorp Metals, Inc. | | | 3,510,000 | |
| | | | | | |
| | | | | 23,746,588 | |
| |
Junior Precious Metals Producers (8.37%) | | | | |
| | |
| 1,250,326 | | Avocet Mining PLC (c) | | | 1,719,404 | |
| 1,642,000 | | Etruscan Resources Inc. (c) | | | 289,831 | |
| 450,000 | | First Majestic Silver Corp. (c) | | | 920,226 | |
| 1,000,000 | | Great Basin Gold Ltd. (a) (c) | | | 1,380,000 | |
| 407,675 | | Jaguar Mining, Inc. (c) | | | 3,090,172 | |
| | | | | | |
| | | | | 7,399,633 | |
| |
Exploration and Project Development Companies (13.34%) | | | | |
| | |
| 1,400,000 | | Andean Resources Ltd. (a) (c) | | | 1,958,843 | |
| 500,000 | | Comaplex Minerals Corp. (c) | | | 1,868,435 | |
| 93,100 | | Guyana Goldfields (c) | | | 299,405 | |
| 37,699 | | Ivanhoe Nickel & Platinum Ltd. (c) (d) | | | — | |
| 600,000 | | Northern Dynasty Minerals Ltd. (b) (c) | | | 4,230,000 | |
| 2,530,000 | | Ridge Mining PLC (c) | | | 3,437,500 | |
| | | | | | |
| | | | | 11,794,183 | |
| |
Shares | | Value | |
Other Natural Resources Companies (15.60%) | | | | |
| | |
| 450,000 | | Anvil Mining Ltd. (a) (c) | | $ | 604,443 | |
| 76,000 | | BHP Billiton Ltd. ADR (a) | | | 4,159,480 | |
| 6,915,000 | | Farallon Resources Ltd. (c) | | | 1,771,321 | |
| 525,000 | | Forsys Metals Corp. (c) | | | 2,142,787 | |
| 500,000 | | International Royalty Corp. (a) | | | 1,630,000 | |
| 150,000 | | Johnson Matthey PLC (c) | | | 2,840,909 | |
| 550,000 | | Mercator Minerals Ltd. (a) (c) | | | 636,947 | |
| | | | | | |
| | | | | 13,785,887 | |
| | | | | | |
| |
Total common stocks (cost: $106,452,554) | | | 83,093,725 | |
| |
Warrants (0.99%) (c) | | | | |
| | |
| 562,500 | | Etruscan Resources Inc., expiring 11/02/10 | | | 18,162 | |
| 258,500 | | Etruscan Resources Inc., expiring 8/06/11 | | | 12,798 | |
| 225,000 | | First Majestic Silver Corp., expiring 3/25/10 | | | 24,701 | |
| 100,000 | | Kinross Gold Corp., expiring 9/07/11 | | | 219,560 | |
| 142,900 | | Kinross Gold Corp., expiring 9/03/13 | | | 599,826 | |
| | | | | | |
| |
Total warrants (cost: $577,052) | | | 875,047 | |
| |
Bullion Ounces (0.01%) | | | | |
| | |
| 10 | | Gold (cost: $9,643) (c) | | | 9,285 | |
| |
Shares Money Market Fund (6.24%) | | | | |
| 5,520,601 | | SSgA Money Market Fund, 0.25% (cost: $5,520,601) (e) | | | 5,520,601 | |
| |
Securities held as Collateral on Loaned Securities (22.67%) | | | | |
| 20,037,767 | | State Street Navigator Securities Lending | | | | |
| | Prime Portfolio | | | 20,037,767 | |
| 2,250 | | U.S. Treasury Bonds and Notes, 0.9% - 5.0%, 11/30/09 - 5/15/37 | | | 2,203 | |
| | | | | | |
| |
Total securities held as collateral on loaned securities (cost: $20,039,970) | | | 20,039,970 | |
| | | | | | |
Total investments (cost: $132,599,820) (123.90%) | | | 109,538,628 | |
Liabilities in excess of other assets (-23.90%) | | | (21,129,797 | ) |
| | | | | | |
Net assets (100.00%) | | $ | 88,408,831 | |
| | | | | | |
| (a) | All or a portion of this security was on loan as of June 30, 2009. |
| (b) | Fully or partially pledged as collateral on bank credit facility. |
| (d) | Illiquid and/or restricted security that has been fair valued. |
| (e) | Rate represents the 7-day annualized yield at June 30, 2009. |
ADR means “American Depositary Receipt.”
See notes to financial statements.
5
Midas Special Fund
Schedule of Portfolio Investments - June 30, 2009 (Unaudited)
Common Stocks (120.47%)
| | | | | | |
Shares | | Value | |
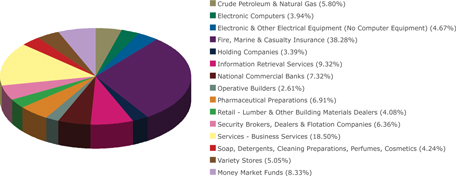
Crude Petroleum & Natural Gas (5.80%) | | | | |
| | |
| 10,000 | | Canadian Natural Resources Ltd. | | $ | 524,900 | |
| |
Electronic Computers (3.94%) | | | | |
| | |
| 2,500 | | Apple Inc. (a) (b) | | | 356,075 | |
| |
Electronic & Other Electrical Equipment (No Computer Equipment) (4.67%) | | | | |
| | |
| 36,000 | | General Electric Company (c) | | | 421,920 | |
| |
Fire, Marine & Casualty Insurance (38.28%) | | | | |
| | |
| 1,050 | | Berkshire Hathaway, Inc. Class B (a) (b) | | | 3,040,516 | |
| 20,000 | | Leucadia National Corporation (a) (b) | | | 421,800 | |
| | | | | | |
| | | | | 3,462,316 | |
| |
Holding Companies (3.39%) | | | | |
| | |
| 18,000 | | Brookfield Asset Management Inc. | | | 307,260 | |
| |
Information Retrieval Services (9.32%) | | | | |
| | |
| 2,000 | | Google, Inc. - Class A (a) (b) | | | 843,180 | |
| |
National Commercial Banks (7.32%) | | | | |
| | |
| 19,400 | | JP Morgan Chase & Co. (b) | | | 661,734 | |
| |
Operative Builders (2.61%) | | | | |
| | |
| 25,000 | | Hovnanian Enterprises, Inc. (a) (c) | | | 59,000 | |
| 20,000 | | Pulte Homes, Inc. (a) (c) | | | 176,600 | |
| | | | | | |
| | | | | 235,600 | |
Pharmaceutical Preparations (6.91%) | | | | |
| | |
| 11,000 | | Johnson & Johnson (b) | | | 624,800 | |
| |
Retail - Lumber & Other Building Materials Dealers (4.08%) | | | | |
| | |
| 19,000 | | Lowe’s Companies, Inc. (c) | | | 368,790 | |
| |
Shares | | Value | |
Security Brokers, Dealers & Flotation Companies (6.36%) | |
| | |
| 3,900 | | The Goldman Sachs Group, Inc. (b) | | $ | 575,016 | |
| |
Services - Business Services (18.50%) | | | | |
| | |
| 10,000 | | MasterCard, Inc. (b) | | | 1,673,100 | |
| |
Soap, Detergents, Cleaning Preparations, Perfumes, Cosmetics (4.24%) | | | | |
| | |
| 7,500 | | Procter & Gamble Company | | | 383,250 | |
| |
Variety Stores (5.05%) | | | | |
| | |
| 10,000 | | Costco Wholesale Corp. (b) | | | 457,000 | |
| | | | | | |
| |
Total common stocks (cost: $10,797,415) (120.47%) | | | 10,894,941 | |
| |
Securities held as Collateral on Loaned Securities (8.33%) | | | | |
| | |
| 752,960 | | State Street Navigator Securities Lending | | | | |
| | Prime Portfolio (cost: $752,960) | | | 752,960 | |
| | | | | | |
Total investments (cost: $11,550,375) (128.80%) | | | 11,647,901 | |
| |
Liabilities in excess of other assets (-28.80%) | | | (2,604,779 | ) |
| | | | | | |
| |
Net assets (100.00%) | | $ | 9,043,122 | |
| | | | | | |
| (b) | Fully or partially pledged as collateral on bank credit facility. |
| (c) | All or a portion of this security was on loan as of June 30, 2009. |
See notes to financial statements.
6
Midas Perpetual Portfolio
Schedule of Portfolio Investments - June 30, 2009 (Unaudited)
| | | | | |
Shares | | Value |
Gold (19.98%) | | | |
| |
Exchange Traded Fund | | | |
| 15,310 | | SPDR Gold Trust (cost: $1,331,058) (a) | | $ | 1,395,966 |
| |
Silver (4.88%) | | | |
| |
Exchange Traded Fund | | | |
| | |
| 25,464 | | iShares Silver Trust (cost: $287,208) (a) | | | 340,708 |
| |
Swiss Franc Assets (9.85%) | | | |
| |
Principal Amount (b) | | | |
Debt Securities | | | |
| CHF 725,000 | | Switzerland Government 2.50% Notes, due 3/12/16 (cost: $664,426) | | | 688,227 |
| |
Hard Asset Securities (16.03%) | | | |
| |
Copper Ores (1.34%) | | | |
| 4,576 | | Southern Copper Corp. | | | 93,533 |
| |
Crude Petroleum & Natural Gas (1.15%) | | | |
| 1,219 | | Occidental Petroleum Corp. | | | 80,222 |
| |
Gold Ores (2.17%) | | | |
| 2,051 | | Barrick Gold Corp. | | | 68,811 |
| 2,385 | | Goldcorp Inc. | | | 82,879 |
| �� | | | | |
| | | | | 151,690 |
| |
Industrial Gases (1.25%) | | | |
| 1,231 | | Praxair, Inc. | | | 87,487 |
| |
Metal Mining (1.34%) | | | |
| 1,716 | | BHP Billiton Ltd. ADR | | | 93,917 |
| |
Petroleum Refining (1.76%) | | | |
| 1,408 | | ConocoPhillips | | | 59,220 |
| 915 | | Exxon Mobil Corp. | | | 63,968 |
| | | | | |
| | | | | 123,188 |
| |
Plastic Materials, Resins & Nonvulcanelastomers (1.07%) | | | |
| 2,907 | | E.I. du Pont De Nemours and Company | | | 74,477 |
| |
Shares | | Value |
Hard Asset Securities (continued) |
| |
Potash, Soda, & Borate Minerals (1.33%) | | | |
| 996 | | Potash Corporation of Saskatchewan Inc. | | $ | 92,678 |
| |
Real Estate Investment Trusts (2.66%) | | | |
| 1,213 | | Federal Realty Investment Trust | | | 62,494 |
| 1,778 | | Health Care REIT, Inc. | | | 60,630 |
| 958 | | Public Storage | | | 62,730 |
| | | | | |
| | | | | 185,854 |
| |
Soybean Oil Mills (0.97%) | | | |
| 2,525 | | Archer-Daniels-Midland Company | | | 67,594 |
| |
Steel Works, Blast Furnaces & Rolling Mills (Coke Ovens) (0.99%) | | | |
| 1,558 | | Nucor Corp. | | | 69,222 |
| | | | | |
| |
Total hard asset securities (cost: $1,107,846) | | | 1,119,862 |
| |
Large Capitalization Growth Stocks (15.59%) | | | |
| |
Communications Equipment (1.48%) | | | |
| 5,559 | | Cisco Systems, Inc. (a) | | | 103,620 |
| |
Electronic Computers (1.63%) | | | |
| 801 | | Apple Inc. (a) | | | 114,086 |
| |
Fire, Marine & Casualty Insurance (1.24%) | | | |
| 30 | | Berkshire Hathaway Inc. Class B (a) | | | 86,872 |
| |
Information Retrieval Services (1.53%) | | | |
| 254 | | Google Inc. - Class A (a) | | | 107,084 |
| |
Life Insurance (1.56%) | | | |
| 1,971 | | China Life Insurance Company Ltd. ADR | | | 109,272 |
| |
Oil & Gas Field Services (1.19%) | | | |
| 1,533 | | Schlumberger Ltd. | | | 82,951 |
| |
Pharmaceutical Preparations (1.20%) | | | |
| 2,851 | | Sanofi-Aventis ADR | | | 84,076 |
See notes to financial statements.
7
Midas Perpetual Portfolio
Schedule of Portfolio Investments - June 30, 2009 (Unaudited)
| | | | | | |
Shares | | Value | |
Large Capitalization Growth Stocks (continued) | | | | |
| |
Services-Prepackaged Software (3.15%) | | | | |
| 4,667 | | Microsoft Corp. | | $ | 110,935 | |
| 5,096 | | Oracle Corp. | | | 109,156 | |
| | | | | | |
| | | | | 220,091 | |
Telephone Communications (2.61%) | | | | |
| 1,799 | | China Mobile Ltd. ADR | | | 90,094 | |
| 1,359 | | Telefonica, S.A. ADR | | | 92,263 | |
| | | | | | |
| | | | | 182,357 | |
| | | | | | |
Total large capitalization growth stocks (cost: $947,000) | | | | |
| | | | | 1,090,409 | |
| |
Shares | | Value | |
Dollar Assets (34.05%) | | | | |
| |
Money Market Fund | | | | |
| 2,379,927 | | SSgA Money Market Fund, 0.25% (cost: $2,379,927) (c) | | $ | 2,379,927 | |
| | | | | | |
| |
Total investments (cost: $6,717,465) (100.38%) | | | 7,015,099 | |
| |
Liabilities in excess of other assets (-0.38%) | | | (26,605 | ) |
| | | | | | |
| |
Net assets (100.00%) | | $ | 6,988,494 | |
| | | | | | |
| (b) | Principal amount denominated in Swiss Francs (CHF). |
| (c) | Rate represents the 7-day annualized yield at June 30, 2009. ADR means “American Depositary Receipt.” |
See notes to financial statements.
8
Allocation of Portfolio Holdings*
June 30, 2009 (Unaudited)
Midas Fund
Midas Special Fund
Midas Perpetual Portfolio

| * | Each Fund’s allocation of portfolio holdings uses approximate percentages of its net assets and may not add up to 100% due to leverage or other assets, rounding, and other factors. |
See notes to financial statements.
9
Statements of Assets and Liabilities
| | | | | | | | | | | | |
June 30, 2009 (Unaudited) | | Midas
Fund | | | Midas Special
Fund | | | Midas Perpetual
Portfolio | |
Assets | | | | | | | | | | | | |
Investments at cost | | $ | 132,599,820 | | | $ | 11,550,375 | | | $ | 6,717,465 | |
| | | | | | | | | | | | |
| | | |
Investments at value | | $ | 109,538,628 | | | $ | 11,647,901 | | | $ | 7,015,099 | |
Receivables: | | | | | | | | | | | | |
Dividends | | | 87,828 | | | | 4,513 | | | | 3,745 | |
Income from securities loaned | | | 12,435 | | | | 360 | | | | — | |
Fund shares sold | | | 4,917 | | | | 20 | | | | — | |
Foreign withholding taxes reclaimed | | | — | | | | — | | | | 5,527 | |
Interest | | | — | | | | — | | | | 4,903 | |
Other assets | | | 31,564 | | | | 7,758 | | | | 7,370 | |
| | | | | | | | | | | | |
Total assets | | | 109,675,372 | | | | 11,660,552 | | | | 7,036,644 | |
| | | | | | | | | | | | |
| | | |
Liabilities | | | | | | | | | | | | |
Collateral on securities loaned, at value | | | 20,039,970 | | | | 752,960 | | | | — | |
Payables: | | | | | | | | | | | | |
Fund shares redeemed | | | 815,003 | | | | 4,190 | | | | 550 | |
Investments purchased | | | 165,188 | | | | — | | | | — | |
Accrued expenses | | | 140,747 | | | | 64,539 | | | | 45,781 | |
Investment management fees | | | 73,662 | | | | 7,528 | | | | — | |
Distribution fees | | | 20,250 | | | | 7,528 | | | | — | |
Administrative services | | | 11,721 | | | | 1,715 | | | | 1,819 | |
Bank line of credit | | | — | | | | 1,778,970 | | | | — | |
| | | | | | | | | | | | |
Total liabilities | | | 21,266,541 | | | | 2,617,430 | | | | 48,150 | |
| | | | | | | | | | | | |
| | | |
Net assets | | $ | 88,408,831 | | | $ | 9,043,122 | | | $ | 6,988,494 | |
| | | | | | | | | | | | |
| | | |
Shares outstanding, $0.01 par value | | | 33,463,583 | | | | 852,678 | | | | 6,697,293 | |
| | | |
Net asset value, offering, and redemption price per share | | $ | 2.64 | | | $ | 10.61 | | | $ | 1.04 | |
| | | |
Net assets consist of | | | | | | | | | | | | |
Paid in capital | | $ | 158,820,438 | | | $ | 15,990,578 | | | $ | 6,714,962 | |
Accumulated undistributed net investment loss | | | (692,444 | ) | | | (156,938 | ) | | | (106,993 | ) |
Accumulated net realized gain (loss) on investments | | | (46,658,819 | ) | | | (6,888,044 | ) | | | 82,747 | |
Net unrealized appreciation (depreciation) on investments and foreign currencies | | | (23,060,344 | ) | | | 97,526 | | | | 297,778 | |
| | | | | | | | | | | | |
| | $ | 88,408,831 | | | $ | 9,043,122 | | | $ | 6,988,494 | |
| | | | | | | | | | | | |
See notes to financial statements.
10
Statements of Operations
| | | | | | | | | | | | |
For the Six Months Ended June 30, 2009 (Unaudited) | | Midas
Fund | | | Midas Special
Fund | | | Midas Perpetual
Portfolio | |
Investment income | | | | | | | | | | | | |
Dividends | | $ | 283,789 | | | $ | 52,384 | | | $ | 27,808 | |
Foreign tax withholding | | | (13,809 | ) | | | (702 | ) | | | (1,723 | ) |
Income from securities loaned | | | 39,985 | | | | 1,652 | | | | — | |
Interest | | | 3,351 | | | | — | | | | 12,204 | |
| | | | | | | | | | | | |
| | | |
Total investment income | | | 313,316 | | | | 53,334 | | | | 38,289 | |
| | | | | | | | | | | | |
| | | |
Expenses | | | | | | | | | | | | |
Investment management | | | 410,061 | | | | 45,897 | | | | — | |
Transfer agent | | | 193,400 | | | | 38,240 | | | | 26,970 | |
Distribution | | | 102,515 | | | | 43,674 | | | | — | |
Administrative services | | | 66,342 | | | | 7,320 | | | | 6,295 | |
Interest and fees on bank credit facility | | | 39,557 | | | | 11,709 | | | | 582 | |
Bookkeeping and pricing | | | 35,785 | | | | 12,992 | | | | 13,535 | |
Legal | | | 30,050 | | | | 2,640 | | | | 10,570 | |
Printing and postage | | | 26,310 | | | | 6,832 | | | | 5,611 | |
Registration | | | 18,940 | | | | 18,850 | | | | 13,575 | |
Directors | | | 18,195 | | | | 5,025 | | | | 2,050 | |
Insurance | | | 16,652 | | | | 2,353 | | | | 1,991 | |
Auditing | | | 14,214 | | | | 10,949 | | | | 7,476 | |
Other | | | 13,337 | | | | 1,966 | | | | 1,569 | |
Custodian | | | 12,215 | | | | 1,825 | | | | 1,874 | |
Interest and fees related to short sales | | | 6,733 | | | | — | | | | — | |
| | | | | | | | | | | | |
| | | |
Total expenses | | | 1,004,306 | | | | 210,272 | | | | 92,098 | |
| | | | | | | | | | | | |
| | | |
Net investment loss | | | (690,990 | ) | | | (156,938 | ) | | | (53,809 | ) |
| | | | | | | | | | | | |
| | | |
Realized and Unrealized Gain (Loss) on Investments and Foreign Currencies | | | | | | | | | | | | |
Net realized gain (loss) on | | | | | | | | | | | | |
Short sales | | | (1,968,375 | ) | | | — | | | | — | |
Investments | | | (534,771 | ) | | | (252,964 | ) | | | 68,696 | |
Foreign currencies | | | (940,980 | ) | | | — | | | | 6,782 | |
Unrealized appreciation on | | | | | | | | | | | | |
Investments | | | 17,290,513 | | | | 633,135 | | | | 267,905 | |
Translation of assets and liabilities in foreign currencies | | | 6,307,506 | | | | — | | | | 35,663 | |
| | | | | | | | | | | | |
| | | |
Net realized and unrealized gain on investments and foreign currencies | | | 20,153,893 | | | | 380,171 | | | | 379,046 | |
| | | | | | | | | | | | |
| | | |
Net increase in net assets resulting from operations | | $ | 19,462,903 | | | $ | 223,233 | | | $ | 325,237 | |
| | | | | | | | | | | | |
See notes to financial statements.
11
Statements of Changes in Net Assets
| | | | | | | | | | | | | | | | | | | | | | | | |
| | | Midas
Fund | | | Midas Special
Fund | | | Midas Perpetual
Portfolio | |
| | Six Months Ended
6/30/09
(Unaudited) | | | Year Ended
12/31/08 | | | Six Months Ended
6/30/09
(Unaudited) | | | Year Ended
12/31/08 | | | Six Months Ended
6/30/09
(Unaudited) | | | Year Ended
12/31/08 | |
Operations | | | | | | | | | | | | | | | | | | | | | | | | |
Net investment income (loss) | | $ | (690,990 | ) | | $ | (2,476,123 | ) | | $ | (156,938 | ) | | $ | (380,590 | ) | | $ | (53,809 | ) | | $ | 157,604 | |
Net realized gain (loss) from sale of investments, short sales, and foreign currencies | | | (3,444,126 | ) | | | (25,905,170 | ) | | | (252,964 | ) | | | (882,407 | ) | | | 75,478 | | | | 8,211 | |
Unrealized appreciation (depreciation) of investments and foreign currencies | | | 23,598,019 | | | | (99,459,217 | ) | | | 633,135 | | | | (6,424,283 | ) | | | 303,568 | | | | (5,790 | ) |
| | | | | | | | | | | | | | | | | | | | | | | | |
| | | | | | |
Net increase (decrease) in net assets resulting from operations | | | 19,462,903 | | | | (127,840,510 | ) | | | 223,233 | | | | (7,687,280 | ) | | | 325,237 | | | | 160,025 | |
| | | | | | |
Distributions to shareholders | | | | | | | | | | | | | | | | | | | | | | | | |
Distributions from ordinary income | | | (1,406,861 | ) | | | (3,921,447 | ) | | | — | | | | — | | | | (53,184 | ) | | | (158,511 | ) |
| | | | | | |
Capital share transactions | | | | | | | | | | | | | | | | | | | | | | | | |
Change in net assets resulting from capital share transactions (a) | | | (7,163,052 | ) | | | (42,201,714 | ) | | | (91,518 | ) | | | (737,226 | ) | | | (476,103 | ) | | | (7,326,676 | ) |
Redemption fees | | | 13,952 | | | | 71,475 | | | | 646 | | | | 1,441 | | | | 1,473 | | | | — | |
| | | | | | | | | | | | | | | | | | | | | | | | |
| | | | | | |
Decrease in net assets resulting from capital share transactions | | | (7,149,100 | ) | | | (42,130,239 | ) | | | (90,872 | ) | | | (735,785 | ) | | | (474,630 | ) | | | (7,326,676 | ) |
| | | | | | | | | | | | | | | | | | | | | | | | |
| | | | | | |
Total change in net assets | | | 10,906,942 | | | | (173,892,196 | ) | | | 132,361 | | | | (8,423,065 | ) | | | (202,577 | ) | | | (7,325,162 | ) |
| | | | | | |
Net assets | | | | | | | | | | | | | | | | | | | | | | | | |
Beginning of period | | | 77,501,889 | | | | 251,394,085 | | | | 8,910,761 | | | | 17,333,826 | | | | 7,191,071 | | | | 14,516,233 | |
| | | | | | | | | | | | | | | | | | | | | | | | |
| | | | | | |
End of period (b) | | $ | 88,408,831 | | | $ | 77,501,889 | | | $ | 9,043,122 | | | $ | 8,910,761 | | | $ | 6,988,494 | | | $ | 7,191,071 | |
| | | | | | | | | | | | | | | | | | | | | | | | |
(a) Capital share transactions were as follows: | | | | | | | | | | | | | | | | | | | | | | | | |
Value | | | | | | | | | | | | | | | | | | | | | | | | |
Shares sold | | $ | 9,813,336 | | | $ | 86,340,401 | | | $ | 308,268 | | | $ | 432,144 | | | $ | 567,123 | | | $ | 37,779,628 | |
Shares issued and reinvestment of distributions | | | 1,307,965 | | | | 3,509,980 | | | | — | | | | — | | | | 52,458 | | | | 155,107 | |
Shares redeemed | | | (18,284,353 | ) | | | (132,052,095 | ) | | | (399,786 | ) | | | (1,169,370 | ) | | | (1,095,684 | ) | | | (45,261,411 | ) |
| | | | | | | | | | | | | | | | | | | | | | | | |
| | | | | | |
Net decrease | | $ | (7,163,052 | ) | | $ | (42,201,714 | ) | | $ | (91,518 | ) | | $ | (737,226 | ) | | $ | (476,103 | ) | | $ | (7,326,676 | ) |
| | | | | | | | | | | | | | | | | | | | | | | | |
| | | | | | |
Number | | | | | | | | | | | | | | | | | | | | | | | | |
Shares sold | | | 4,071,301 | | | | 19,268,243 | | | | 32,590 | | | | 25,427 | | | | 552,926 | | | | 37,779,277 | |
Shares issued and reinvestment of distributions | | | 489,199 | | | | 1,466,673 | | | | — | | | | — | | | | 49,960 | | | | 155,089 | |
Shares redeemed | | | (7,893,628 | ) | | | (28,509,611 | ) | | | (40,198 | ) | | | (71,330 | ) | | | (1,094,304 | ) | | | (45,261,411 | ) |
| | | | | | | | | | | | | | | | | | | | | | | | |
Net decrease | | | (3,333,128 | ) | | | (7,774,695 | ) | | | (7,608 | ) | | | (45,903 | ) | | | (491,418 | ) | | | (7,327,045 | ) |
| | | | | | | | | | | | | | | | | | | | | | | | |
(b) End of period net assets include undistributed net investment income (loss) | | $ | (692,444 | ) | | $ | 1,405,407 | | | $ | (156,938 | ) | | $ | — | | | $ | (106,993 | ) | | $ | — | |
| | | | | | | | | | | | | | | | | | | | | | | | |
See notes to financial statements.
12
Statements of Cash Flows
| | | | | | | | | | | | |
For the Six Months Ended June 30, 2009 (Unaudited) | | Midas
Fund | | | Midas Special
Fund | | | Midas Perpetual
Portfolio | |
| | | |
Cash flows from operating activities | | | | | | | | | | | | |
Net increase in net assets resulting from operations | | $ | 19,462,903 | | | $ | 223,233 | | | $ | 325,237 | |
Adjustments to reconcile change in net assets resulting from operations to net cash provided by (used in) operating activities: | | | | | | | | | | | | |
Proceeds from sales of long term investments | | | 42,562,443 | | | | 441,578 | | | | 554,582 | |
Purchase of long term investments | | | (25,662,451 | ) | | | (435,510 | ) | | | (753,712 | ) |
Proceeds from short sale of investments | | | 12,302,113 | | | | — | | | | — | |
Buy to cover investments held short | | | (14,270,488 | ) | | | — | | | | — | |
Net (purchases) sales of short term investments | | | (5,505,449 | ) | | | — | | | | 4,904,826 | |
Amortization of premium of investment securities | | | — | | | | — | | | | 1,913 | |
Increase in collateral for securities loaned | | | (20,039,970 | ) | | | (752,960 | ) | | | — | |
Increase in dividends receivable | | | (22,375 | ) | | | (2,878 | ) | | | (3,745 | ) |
Increase in securities lending income receivable | | | (12,435 | ) | | | (360 | ) | | | — | |
Increase in foreign withholding taxes reclaimed | | | — | | | | — | | | | (5,527 | ) |
Increase in interest receivable | | | — | | | | — | | | | (4,903 | ) |
Decrease other assets | | | 16,651 | | | | 2,352 | | | | 1,990 | |
Increase in payable upon return of securities loaned | | | 20,039,970 | | | | 752,960 | | | | — | |
Increase (decrease) in payable for investments purchased | | | 165,188 | | | | — | | | | (4,077,300 | ) |
Decrease in accrued expenses | | | (98,851 | ) | | | (5,025 | ) | | | (12,910 | ) |
Increase in investment management fees payable | | | 23,782 | | | | 3,478 | | | | — | |
Decrease in distribution fees payable | | | 5,946 | | | | 1,256 | | | | — | |
(Decrease) increase in administrative services payable | | | (74 | ) | | | 373 | | | | 809 | |
Unrealized appreciation of investments and foreign currencies | | | (23,597,121 | ) | | | (633,135 | ) | | | (303,424 | ) |
Net realized loss (gain) on sales of investments, short sales, and foreign currencies | | | 3,444,126 | | | | 252,964 | | | | (75,478 | ) |
| | | | | | | | | | | | |
| | | |
Net cash provided by (used in) operating activities | | | 8,813,908 | | | | (151,674 | ) | | | 552,358 | |
| | | | | | | | | | | | |
| | | |
Cash flows from financing activities | | | | | | | | | | | | |
Net shares redeemed | | | (8,014,055 | ) | | | (108,659 | ) | | | (551,632 | ) |
(Repayment) borrowing on bank line of credit | | | (716,200 | ) | | | 124,309 | | | | — | |
Cash distributions paid | | | (98,896 | ) | | | — | | | | (726 | ) |
| | | | | | | | | | | | |
| | | |
Net cash (used in) provided by financing activities | | | (8,829,151 | ) | | | 15,650 | | | | (552,358 | ) |
| | | | | | | | | | | | |
| | | |
Net change in cash | | | (15,243 | ) | | | (136,024 | ) | | | — | |
| | | |
Cash | | | | | | | | | | | | |
Beginning of period | | | 15,243 | | | | 136,024 | | | | — | |
| | | | | | | | | | | | |
| | | |
End of period | | $ | — | | | $ | — | | | $ | — | |
| | | | | | | | | | | | |
| | | |
Supplemental disclosure of cash flow information: | | | | | | | | | | | | |
Cash paid for interest and fees on bank line of credit | | $ | 43,504 | | | $ | 12,867 | | | $ | 618 | |
Noncash financing activities not included herein consisted of reinvestment of distributions | | $ | 1,307,965 | | | $ | — | | | $ | 52,458 | |
See notes to financial statements.
13
Notes to Financial Statements
(UNAUDITED)
June 30, 2009
1 Organization and Significant Accounting Policies
The Midas Funds are Maryland corporations registered under the Investment Company Act of 1940, as amended (the “Act”), as open end management investment companies. Midas Fund’s investment objectives are primarily capital appreciation and protection against inflation and, secondarily, current income through investments primarily in precious metals and natural resource companies. Midas Special Fund’s investment objective is capital appreciation which it seeks by investing aggressively in any security in any sector. The investment objective of Midas Perpetual Portfolio (formerly Midas Dollar Reserves) is to preserve and increase the purchasing power value of its shares over the long term by investing a fixed target percentage of its total assets in each of the following investment categories: gold, silver, Swiss franc assets, hard asset securities, large capitalization growth stocks, and dollar assets. Prior to December 29, 2008, Midas Perpetual Portfolio (formerly known as Midas Dollar Reserves, Inc.) operated as a money market fund. On December 29, 2008, the Fund changed its name to Midas Perpetual Portfolio, ceased operating as a money market fund, and began operating as a fluctuating net asset value fund pursuant to its current investment objective and policies. The Funds retain Midas Management Corporation as their Investment Manager.
Midas Fund and Midas Perpetual Portfolio each has authorized capital of one billion shares of common stock, par value $0.01 per share. Midas Special Fund has authorized capital of 500 million shares of common stock, par value $0.01. The Funds each offer only one class of shares. Each Fund’s shareholders are entitled to one vote for each whole share owned and a fractional vote for each fraction of a share owned. Voting rights are not cumulative. All shares of a Fund are fully paid and non-assessable and have no preemptive or conversion rights.
The Funds impose a short term trading redemption fee on any Fund shares that are redeemed or exchanged within 30 days following their purchase date. The redemption fee is 1% of the amount redeemed. Such fees are retained by the Funds for the benefit of the remaining shareholders and are accounted for as an addition to paid in capital.
The following is a summary of significant accounting policies consistently followed by each Fund in the preparation of its financial statements.
Valuation of Investments - Securities traded primarily on a U.S. national securities exchange (“USNSE”) are valued at the last reported sale price on the day the valuations are made. Securities traded primarily on the Nasdaq Stock Market (“Nasdaq”) are normally valued by the Funds at the Nasdaq Official Closing Price (“NOCP”) provided by Nasdaq each business day. The NOCP is the most recently reported price as of 4:00:02 p.m., ET, unless that price is outside the range of the “inside” bid and asked prices (i.e., the bid and asked prices that dealers quote to each other when trading for their own accounts); in such case, Nasdaq will adjust the price to equal the inside bid or asked price, whichever is closer. Because of delays in reporting trades, the NOCP may not be based on the price of the last trade to occur before the market closes. Securities that are not traded on a particular day and securities traded in foreign and over-the-counter markets that are not also traded on a USNSE or Nasdaq are valued at the mean between the last bid and asked prices. Gold and silver bullion is valued at 4:00 p.m., ET, at the mean between the last bid and asked quotations of the Bloomberg Composite (NY) Spot Price for that metal. Debt obligations with remaining maturities of 60 days or less are valued at cost adjusted for amortization of premiums and accretion of discounts. Certain of the securities in which the Funds may invest are priced through pricing services that may utilize a matrix pricing system which takes into consideration factors such as yields, prices, maturities, call features, and ratings on comparable securities. Bonds may be valued according to prices quoted by a bond dealer that offers pricing services. Open end investment companies are valued at their net asset value. Foreign securities markets may be open on days when the U.S. markets are closed. For this reason, the value of any foreign securities owned by the Fund could change on a day when stockholders cannot buy or sell shares of the Fund. Securities for which market quotations are not readily available or reliable and other assets may be valued as determined in good faith by the Investment Manager under the direction of or pursuant to procedures established by each Fund’s Board of Directors. Due to the inherent uncertainty of valuation, these values may differ from the values that would have been used had a readily available or reliable market quotation for the securities existed. These differences in valuation could be material. A security’s valuation may differ depending on the method used for determining value. The use of fair value pricing by a Fund may cause the net asset value of its shares to differ from the net asset value that would be calculated using market prices.
14
Notes to Financial Statements
(UNAUDITED)
Foreign Currency Translation - Securities denominated in foreign currencies are translated into U.S. dollars at prevailing exchange rates. Realized gain or loss on sales of such investments in local currency terms is reported separately from gain or loss attributable to the change in foreign exchange rates for those investments.
Foreign Currency Contracts - Forward foreign currency contracts are marked to market and the change in market value is recorded by the Fund as an unrealized gain or loss. When a contract is closed, the Fund records a realized gain or loss equal to the difference between the value of the contract at the time it was opened and the value at the time it was closed. The Fund could be exposed to risk if the counterparties are unable to meet the terms of the contract or if the value of the currency changes unfavorably.
Futures Contracts - The Funds may engage in transactions in futures contracts. Upon entering into a futures contract, the Fund provides the broker/dealer an amount of cash or securities at least equal to a certain percentage of the contract amount. This is known as “initial margin.” Subsequent payments (“variation margin”) are credited to or debited from the Fund each day, depending on the daily fluctuation of the value of the contract. The daily change in the contract is included in unrealized appreciation or depreciation on investments and futures contracts. The Fund recognizes a realized gain or loss when the contract is closed. Futures transactions sometimes may reduce returns or increase volatility. In addition, futures can be illiquid and highly sensitive to changes in their underlying security, interest rate, or index, and as a result can be highly volatile. A small investment in futures could have a large impact on a Fund’s performance.
Short Sales - Midas Fund and Midas Special Fund may sell a security it does not own in anticipation of a decline in the market value of the security. When a Fund sells a security short, it must borrow the security sold short and deliver it to the broker/dealer through which it made the short sale. The Fund is liable for any dividends or interest paid on securities sold short. A gain, limited to the price at which the Fund sold the security short, or a loss, unlimited in size, will be recognized upon the termination of a short sale.
Investment Transactions - Investment transactions are accounted for on the trade date (the date the order to buy or sell is executed). Realized gains or losses are determined by specifically identifying the cost basis of the security sold.
Investment Income - Interest income is recorded on the accrual basis. Amortization of premium and accretion of discount on debt securities are included in interest income. Dividend income is recorded on the ex-dividend date. Taxes withheld on foreign dividends have been provided for in accordance with a Fund’s understanding of the applicable country’s tax rules and rates.
Expenses - Estimated expenses are accrued daily. Expenses directly attributable to a Fund are charged to that Fund. Expenses borne by the complex of related investment companies, which includes open end and closed end investment companies for which the Investment Manager and its affiliate serve as investment manager, that are not directly attributed to the Fund, are allocated among the Fund and the other investment companies in the complex on the basis of relative net assets, except where a more appropriate allocation of expenses can otherwise be made fairly.
Expense Reduction Arrangement - Through arrangements with the Funds’ custodian and transfer agent, credits realized as a result of uninvested cash balances are used to reduce custody and transfer agency expenses. No credits were realized by the Funds during the period.
Distributions - Distributions to shareholders, which are determined in accordance with income tax regulations, are recorded on the ex-dividend date.
Income Taxes - No provision has been made for U.S. income taxes because each Fund intends to qualify as a regulated investment company under the Internal Revenue Code and to distribute to shareholders substantially all taxable income and net realized gains. Foreign securities held by a Fund may be subject to foreign taxation. Foreign taxes, if any, are recorded based on the tax regulations and rates that exist in the foreign markets in which the Fund invests. The Funds recognize the tax benefits of uncertain tax positions only where the position is “more likely than not” to be sustained assuming examination by tax authorities. The Funds have reviewed their tax positions and have concluded that no liability for unrecognized tax benefits should be recorded related to uncertain tax positions taken on federal, state, and local income tax returns for open tax years (2005 – 2008), or expected to be taken in the Funds’ 2009 tax returns.
15
Notes to Financial Statements
(UNAUDITED)
Use of Estimates - In preparing financial statements in conformity with accounting principles generally accepted in the United States of America (“GAAP”), management makes estimates and assumptions that affect the reported amounts of assets and liabilities at the date of the financial statements, as well as the reported amounts of revenues and expenses during the reporting period. Actual results could differ from those estimates.
Indemnifications - The Funds indemnify officers and directors for certain liabilities that might arise from their performance of their duties for the Funds. Additionally, in the normal course of business the Funds enter into contracts that contain a variety of representations and warranties and which may provide general indemnifications. The Funds’ maximum exposure under these arrangements is unknown, as it involves future claims that may be made against the Funds under circumstances that have not occurred.
2 Fees and Transactions with Related Parties
Under the investment management agreement of Midas Fund, the Investment Manager receives a management fee, payable monthly, based on the average daily net assets of the Fund at the annual rate of 1% on the first $200 million, .95% over $200 million to $400 million, .90% over $400 million to $600 million, .85% over $600 million to $800 million, .80% over $800 million to $1 billion, and .75% over $1 billion. Under the investment management agreement of Midas Special Fund, the Investment Manager receives a management fee, payable monthly, based on the average daily net assets of the Fund at the annual rate of 1% on the first $10 million, 7/8 of 1% over $10 million to $30 million, 3/4 of 1% over $30 million to $150 million, 5/8 of 1% over $150 million to $500 million, and 1/2 of 1% over $500 million. Under the investment management agreement of Midas Perpetual Portfolio, the Investment Manager receives a management fee, payable monthly, based on the average daily net assets of the Fund, at the annual rate of .50 of 1% up to the first $250 million, .45 of 1% from $250 million to $500 million, and .40 of 1% over $500 million.
Each Fund has adopted a plan of distribution pursuant to Rule 12b-1 under the Act. Under each plan, each Fund pays the Distributor, Investor Service Center, Inc., an affiliate of the Investment Manager, a fee of .25% (Midas Fund and Midas Perpetual Portfolio) or 1.00% (Midas Special Fund) for distribution and shareholder services. The shareholder service fee is intended to cover personal services provided to the shareholders of the Funds and the maintenance of shareholder accounts. The distribution fee is to cover all other activities and expenses primarily intended to result in the sale of the Funds’ shares. In addition, Midas Fund, Midas Special Fund, and Midas Perpetual Portfolio each reimbursed the Distributor $58,644, $418, and $19, respectively, for payments made to certain brokers for record keeping services for the six months ended June 30, 2009.
The Investment Manager and the Distributor have contractually agreed with Midas Perpetual Portfolio to waive their fees, respectively, for fiscal year 2009. The contractual fee waiver agreements expire on April 29, 2010.
Certain officers and directors of the Funds are officers and directors of the Investment Manager and Distributor.
Pursuant to the investment management agreements, the Funds reimburse the Investment Manager for providing at cost certain administrative services comprised of compliance and accounting services. For the six months ended June 30, 2009, the Funds incurred administrative services expenses as follows:
| | | | | | | | | |
| | | Midas
Fund | | Midas Special
Fund | | Midas Perpetual
Portfolio |
Compliance services | | $ | 50,846 | | $ | 5,430 | | $ | 4,485 |
Accounting services | | | 15,496 | | | 1,890 | | | 1,810 |
| | | | | | | | | |
Total administrative services | | $ | 66,342 | | $ | 7,320 | | $ | 6,295 |
| | | | | | | | | |
16
Notes to Financial Statements
(UNAUDITED)
3 Distributions to Shareholders and Distributable Earnings
The tax character of distributions paid during the six months ended June 30, 2009 and year ended December 31, 2008 are summarized as follows:
| | | | | | | | | | | | |
| | | Midas
Fund | | Midas Perpetual
Portfolio |
| | | 2009 | | 2008 | | 2009 | | 2008 |
Distributions paid from ordinary income | | $ | 1,406,861 | | $ | 3,921,447 | | $ | 53,184 | | $ | 158,511 |
There were no distributions paid by Midas Special Fund during the six months ended June 30, 2009 and year ended December 31, 2008.
At December 31, 2008, the components of distributable earnings on a tax basis were as follows:
| | | | | | | | | | | | |
| | | Midas
Fund | | | Midas Special
Fund | | | Midas Perpetual
Portfolio | |
Accumulated undistributed net investment income | | $ | 1,405,407 | | | $ | — | | | $ | — | |
Accumulated net realized gain (loss) on investments | | | (22,454,852 | ) | | | (6,635,080 | ) | | | 7,269 | |
Post-October losses | | | (15,235,031 | ) | | | — | | | | — | |
Net unrealized depreciation | | | (52,183,173 | ) | | | (535,609 | ) | | | (5,790 | ) |
| | | | | | | | | | | | |
| | $ | (88,467,649 | ) | | $ | (7,170,689 | ) | | $ | 1,479 | |
| | | | | | | | | | | | |
Federal income tax regulations permit post-October net capital losses to be deferred and recognized on the tax return of the next succeeding taxable year. The differences between book basis and tax basis unrealized appreciation is attributable primarily to the Passive Foreign Investment Company (“PFIC”) mark to market adjustments. GAAP requires certain components of net assets to be reclassified between financial and tax reporting. These reclassifications have no effect on net assets or net asset value per share. At December 31, 2008, permanent differences between book and tax accounting have been reclassified to paid in capital as follows:
| | | | | | | | | | | | |
| | | Midas
Fund | | | Midas Special
Fund | | | Midas Perpetual
Portfolio | |
Decrease in accumulated undistributed net investment loss | | $ | 10,429,497 | | | $ | 380,856 | | | $ | 655 | |
Decrease (increase) in accumulated undistributed net realized gain (loss) on investments | | | 62,212,377 | | | | 127,829 | | | | (655 | ) |
Decrease in paid in capital | | | (72,641,874 | ) | | | (508,685 | ) | | | — | |
At December 31, 2008, Midas Fund had net capital loss carryovers that may be used to offset future realized capital gains for federal income tax purposes of $22,454,852, of which $6,800,444, $79,582, and $15,574,826 expire in 2009, 2010, and 2016, respectively.
At December 31, 2008, Midas Special Fund had net capital loss carryovers that may be used to offset future realized gains for federal income tax purposes of $6,635,080, of which $3,316,069, $1,823,745, $340,513, and $1,154,753 expire in 2009, 2011, 2014, and 2016, respectively.
17
Notes to Financial Statements
(UNAUDITED)
4 Fair Value Measurements
The Funds utilize various methods to measure the fair value of investments as described in Note 1. GAAP establishes a hierarchy for fair value measurements based on the transparency of inputs to the valuation of an asset or liability. Inputs may be observable or unobservable and refer broadly to the assumptions that market participants would use in pricing the asset or liability. Observable inputs reflect the assumptions market participants would use in pricing the asset or liability based on market data obtained from sources independent of the Funds. Unobservable inputs reflect a Fund’s own assumptions about the assumptions that market participants would use in pricing the asset or liability developed based on the best information available under the circumstances. A Fund’s investment in its entirety is assigned a level based upon the inputs which are significant to the overall valuation. The hierarchy of inputs is summarized below.
| | | | | | |
• | | Level 1 | | - | | quoted prices in active markets for identical investments. |
| | | |
• | | Level 2 | | - | | other significant observable inputs (including quoted prices for similar investments, interest rates, prepayment speeds, credit risk, etc.). |
| | | |
• | | Level 3 | | - | | significant unobservable inputs (including a Fund’s own assumptions in determining fair value of investments). |
The inputs or methodology used for valuing investments are not an indication of the risk associated with investing in those investments.
The following is a summary of the inputs used as of June 30, 2009 in valuing the Funds’ investments:
| | | | | | | | | | | | |
Midas Fund | | Level 1 | | Level 2 | | Level 3 | | Total |
Common stocks | | $ | 83,093,725 | | $ | — | | $ | — | | $ | 83,093,725 |
Warrants | | | 875,047 | | | — | | | — | | | 875,047 |
Gold bullion | | | 9,285 | | | — | | | — | | | 9,285 |
Money market funds | | | 25,558,368 | | | — | | | — | | | 25,558,368 |
U.S. government obligations | | | — | | | 2,203 | | | — | | | 2,203 |
| | | | | | | | | | | | |
Total | | $ | 109,536,425 | | $ | 2,203 | | $ | — | | $ | 109,538,628 |
| | | | | | | | | | | | |
| | | | |
Midas Special Fund | | Level 1 | | Level 2 | | Level 3 | | Total |
Common stocks | | $ | 10,894,941 | | $ | — | | $ | — | | $ | 10,894,941 |
Money market funds | | | 752,960 | | | — | | | — | | | 752,960 |
| | | | | | | | | | | | |
Total | | $ | 11,647,901 | | $ | — | | $ | — | | $ | 11,647,901 |
| | | | | | | | | | | | |
| | | | |
Midas Perpetual Portfolio | | Level 1 | | Level 2 | | Level 3 | | Total |
Exchange traded funds | | $ | 1,736,674 | | $ | — | | $ | — | | $ | 1,736,674 |
Debt securities | | | — | | | 688,227 | | | — | | | 688,227 |
Common stocks | | | 2,210,271 | | | — | | | — | | | 2,210,271 |
Money market funds | | | 2,379,927 | | | — | | | — | | | 2,379,927 |
| | | | | | | | | | | | |
Total | | $ | 6,326,872 | | $ | 688,227 | | $ | — | | $ | 7,015,099 |
| | | | | | | | | | | | |
5 Investment Transactions
At June 30, 2009, the aggregate gross unrealized appreciation and depreciation of investments, based on cost for federal income tax purposes, are summarized as follows:
| | | | | | | | | | | | | | |
| | | Federal Income
Tax Cost | | Gross Unrealized | | | Net Unrealized
Appreciation
(Depreciation) | |
| | | Appreciation | | Depreciation | | |
Midas Fund | | $ | 133,931,983 | | $ | 11,861,966 | | $ | (36,255,321 | ) | | $ | (24,393,355 | ) |
Midas Special Fund | | | 11,550,375 | | | 2,118,302 | | | (2,020,776 | ) | | | 97,526 | |
Midas Perpetual Portfolio | | | 6,717,465 | | | 394,324 | | | (96,690 | ) | | | 297,634 | |
18
Notes to Financial Statements
(UNAUDITED)
Purchases and sales of securities, excluding short sale transactions and short term investments, for the six months ended June 30, 2009 were as follows:
| | | | | | | | | |
| | | Midas
Fund | | Midas Special
Fund | | Midas Perpetual
Portfolio |
Purchases | | $ | 25,662,451 | | $ | 435,510 | | $ | 753,712 |
Proceeds | | | 42,562,443 | | | 437,848 | | | 554,582 |
6 Illiquid and Restricted Securities
Midas Fund owns securities which have a limited trading market and/or certain restrictions on trading and, therefore, may be illiquid and/or restricted. Such securities have been valued at fair value in accordance with the procedures described in Note 1. Due to the inherent uncertainty of valuation, these values may differ from the values that would have been used had a readily available market for the securities existed. These differences in valuation could be material. Illiquid and/or restricted securities owned at June 30, 2009, were as follows:
| | | | | | | | | | |
| | | Acquisition Date | | Cost | | | Value | |
Ivanhoe Nickel & Platinum Ltd., common stock | | 4/30/1997 | | $ | — | | | $ | — | |
| | | | | | | | | | |
Percent of net assets | | | | | 0.0 | % | | | 0.0 | % |
7 Bank Credit Facilities
The Funds (except Midas Perpetual Portfolio), Global Income Fund, Inc., and Foxby Corp. (the “Borrowers”) have entered into a committed secured line of credit facility, which is subject to annual renewal, with State Street Bank and Trust Company (“SSB”), the Funds’ custodian. Global Income Fund, Inc. and Foxby Corp. are closed end investment companies advised by an affiliate of the Investment Manager. The aggregate amount of the credit facility is $10,000,000 which prior to April 24, 2009 had been $25,000,000. The borrowing of each Borrower is collateralized by the underlying investments of such Borrower. SSB will make revolving loans to a Borrower not to exceed in the aggregate outstanding at any time with respect to any one Borrower the least of $10,000,000, the maximum amount permitted pursuant to each Borrower’s investment policies, or as permitted under the Act. The commitment fee on this facility is 0.15% per annum on the unused portion of the commitment, based on a 360 day year. All loans under this facility will be available at the Borrower’s option of (i) overnight Federal funds or (ii) LIBOR (30, 60, 90 days), each as in effect from time to time, plus 1.80% per annum, calculated on the basis of actual days elapsed for a 360 day year.
The Funds have also entered into an uncommitted secured redemption facility, which is subject to annual renewal, with SSB with an aggregate amount available of $25,000,000. The borrowing of each Borrower is collateralized by the underlying investments of such Borrower. This facility carries no legal obligation on the part of SSB to lend any amount of money to the Funds at any time and the Borrower does not pay a commitment fee under this facility. SSB may make revolving loans to a Borrower not to exceed in the aggregate outstanding at any time with respect to any one Borrower the least of $25,000,000, the maximum amount permitted pursuant to the Borrower’s investment policies, or as permitted under the Act. All loans under this facility will be available at the overnight Federal Funds rate in effect from time to time plus 1.25%, calculated on the basis of actual days elapsed for a 360 day year.
The outstanding loan balance and the market value of eligible collateral investments at June 30, 2009, and the weighted average interest rate and average daily amount outstanding under the committed and uncommitted facilities for the six months ended June 30, 2009 were as follows:
| | | | | | | | | | | |
| | | Midas
Fund | | | Midas Special
Fund | | | Midas Perpetual
Portfolio |
Outstanding balance | | $ | — | | | $ | 1,778,970 | | | $ | — |
Value of eligible collateral | | | 18,590,594 | | | | 8,254,987 | | | | — |
Average daily amount outstanding | | | 2,519,422 | | | | 1,594,654 | | | | — |
Weighted average interest rate | | | 0.97 | % | | | 1.06 | % | | | — |
19
Notes to Financial Statements
(UNAUDITED)
8 Securities Lending
Midas Fund and Midas Special Fund may lend their securities to qualified financial institutions. The Funds receive compensation in the form of fees, or retain a portion of the interest on the investment in any cash received as collateral. The Funds receive as collateral cash deposits, U.S. Government securities, or bank letters of credit valued at not less than 102% of the value of the securities on loan. Cash deposits are invested in a registered money market fund. The value of the loaned securities is determined based upon the most recent closing prices and any additional required collateral is delivered to the Funds on the next business day. Any increase or decrease in the value of the securities loaned that might occur and any interest earned or dividends declared on those securities during the term of the loan would remain in the Funds. The Funds have the right under the lending agreement to recover the securities from the borrower on demand. As with other extensions of credit, the Funds bear the risk of delay on recovery or loss of rights in the collateral should the borrower of the securities default.
The value of loaned securities and related collateral outstanding at June 30, 2009 were as follows:
| | | | | | |
| | | Midas
Fund | | Midas Special
Fund |
Value of securities loaned | | $ | 19,870,271 | | $ | 733,300 |
Value of related collateral | | | 20,039,970 | | | 752,960 |
9 Off Balance Sheet Risks
Option contracts written and securities sold short result in off balance sheet risk as a Fund’s ultimate obligation to satisfy the terms of the contract or the sale of securities sold short may exceed the amount recognized in the Statement of Assets and Liabilities.
10 Recently Issued Accounting Standards
The Funds adopted Financial Accounting Standards Board (“FASB”) Statement of Financial Accounting Standards No. 161, Disclosures about Derivative Instruments and Hedging Activities, an amendment of FASB Statement No. 133 (“FAS 161”), on January 1, 2009. FAS 161 amends and expands disclosures about derivative instruments and hedging activities to illustrate how and why an entity uses derivative instruments, how derivative instruments and related hedged items are accounted for, and how derivative instruments and related hedged items affect an entity’s financial position, results of operations, and cash flows. The adoption of FAS 161 had no impact on the financial statements of the Funds.
The Funds adopted FASB Statement of Financial Accounting Standards No. 165, Subsequent Events (“FAS 165”), on June 15, 2009. FAS 165 requires an entity to recognize in the financial statements the effects of all subsequent events that provide additional evidence about conditions that existed at the date of the balance sheet. For non-recognized subsequent events that must be disclosed to keep the financial statements from being misleading, an entity is required to disclose the nature of the event as well as an estimate of its financial effect, or a statement that such an estimate cannot be made. In addition, FAS 165 requires an entity to disclose the date through which subsequent events have been evaluated. The Funds have evaluated the impact of all subsequent events through August 24, 2009, the date the financial statements were issued, and have determined that there were no subsequent events requiring recognition or disclosure in the financial statements.
20
Financial Highlights
Midas Fund
| | | | | | | | | | | | | | | | | | | | | | | | |
| | | Six Months Ended
June 30, 2009
(Unaudited) | | | For the Year Ended December 31, | |
| | | 2008 | | | 2007 | | | 2006 | | | 2005 | | | 2004 | |
Per Share Data (for a share outstanding throughout each period) | | | | | | | | | | | | | | | | | | | | | | | | |
Net asset value, beginning of period | | $ | 2.11 | | | $ | 5.64 | | | $ | 4.29 | | | $ | 2.99 | | | $ | 2.14 | | | $ | 2.20 | |
| | | | | | | | | | | | | | | | | | | | | | | | |
Income (loss) from investment operations: | | | | | | | | | | | | | | | | | | | | | | | | |
Net investment loss(1) | | | (0.02 | ) | | | (0.06 | ) | | | (0.08 | ) | | | (0.08 | ) | | | (0.05 | ) | | | (0.05 | ) |
Net realized and unrealized gain (loss) on investments | | | 0.59 | | | | (3.36 | ) | | | 1.44 | | | | 1.39 | | | | 0.90 | | | | (0.01 | ) |
| | | | | | | | | | | | | | | | | | | | | | | | |
Total from investment operations | | | 0.57 | | | | (3.42 | ) | | | 1.36 | | | | 1.31 | | | | 0.85 | | | | (0.06 | ) |
| | | | | | | | | | | | | | | | | | | | | | | | |
Paid-in capital from redemption fees | | | — | (2) | | | — | (2) | | | — | (2) | | | 0.01 | | | | — | (2) | | | — | (2) |
| | | | | | | | | | | | | | | | | | | | | | | | |
Less distributions: | | | | | | | | | | | | | | | | | | | | | | | | |
Dividends from net investment income | | | (0.04 | ) | | | (0.11 | ) | | | (0.01 | ) | | | (0.02 | ) | | | — | | | | — | |
| | | | | | | | | | | | | | | | | | | | | | | | |
Net asset value, end of period | | $ | 2.64 | | | $ | 2.11 | | | $ | 5.64 | | | $ | 4.29 | | | $ | 2.99 | | | $ | 2.14 | |
| | | | | | | | | | | | | | | | | | | | | | | | |
| | | | | | |
Total Return | | | 27.08 | % | | | (60.89 | )% | | | 31.70 | % | | | 44.02 | % | | | 39.72 | % | | | (2.72 | )% |
| | | | | | |
Ratios/Supplemental Data | | | | | | | | | | | | | | | | | | | | | | | | |
Net assets at end of period (000s omitted) | | $ | 88,409 | | | $ | 77,502 | | | $ | 251,394 | | | $ | 138,726 | | | $ | 74,732 | | | $ | 56,770 | |
Ratio of total expenses to average net assets | | | 2.43 | %(3) | | | 2.37 | % | | | 2.43 | % | | | 2.39 | % | | | 2.79 | % | | | 2.58 | % |
Ratio of net expenses to average net assets | | | 2.43 | %(3) | | | 2.37 | % | | | 2.43 | % | | | 2.38 | % | | | 2.78 | % | | | 2.58 | % |
Ratio of net expenses excluding loan interest and fees to average net assets | | | 2.33 | %(3) | | | 2.02 | % | | | 1.87 | % | | | 1.96 | % | | | 2.44 | % | | | 2.39 | % |
Ratio of net investment loss to average net assets | | | (1.67 | )%(3) | | | (1.42 | )% | | | (1.58 | )% | | | (1.96 | )% | | | (2.39 | )% | | | (2.40 | )% |
Portfolio turnover rate | | | 31 | % | | | 129 | % | | | 126 | % | | | 118 | % | | | 63 | % | | | 34 | % |
| |
| | (1) | Average shares outstanding during the period are used to calculate per share data. |
| | (2) | Less than $.005 per share. |
Midas Special Fund
| | | | | | | | | | | | | | | | | | | | | | | | |
| | | Six Months Ended
June 30, 2009
(Unaudited) | | | For the Year Ended December 31, | |
| | | 2008 | | | 2007 | | | 2006 | | | 2005 | | | 2004 | |
Per Share Data (for a share outstanding throughout each period) | | | | | | | | | | | | | | | | | | | | | | | | |
Net asset value, beginning of period | | $ | 10.36 | | | $ | 19.13 | | | $ | 16.74 | | | $ | 14.80 | | | $ | 14.98 | | | $ | 13.54 | |
| | | | | | | | | | | | | | | | | | | | | | | | |
Income (loss) from investment operations: | | | | | | | | | | | | | | | | | | | | | | | | |
Net investment loss(1) | | | (0.18 | ) | | | (0.43 | ) | | | (0.50 | ) | | | (0.35 | ) | | | (0.32 | ) | | | (0.26 | ) |
Net realized and unrealized gain (loss) on investments | | | 0.43 | | | | (8.34 | ) | | | 2.89 | | | | 2.29 | | | | 0.14 | | | | 1.70 | |
| | | | | | | | | | | | | | | | | | | | | | | | |
Total from investment operations | | | 0.25 | | | | (8.77 | ) | | | 2.39 | | | | 1.94 | | | | (0.18 | ) | | | 1.44 | |
Paid-in capital from redemption fees(2) | | | — | | | | — | | | | — | | | | — | | | | — | | | | — | |
| | | | | | | | | | | | | | | | | | | | | | | | |
Net asset value, end of period | | $ | 10.61 | | | $ | 10.36 | | | $ | 19.13 | | | $ | 16.74 | | | $ | 14.80 | | | $ | 14.98 | |
| | | | | | | | | | | | | | | | | | | | | | | | |
| | | | | | |
Total Return | | | 2.41 | % | | | (45.84 | )% | | | 14.28 | % | | | 13.11 | % | | | (1.20 | )% | | | 10.63 | % |
| | | | | | |
Ratios/Supplemental Data | | | | | | | | | | | | | | | | | | | | | | | | |
Net assets at end of period (000s omitted) | | $ | 9,043 | | | $ | 8,911 | | | $ | 17,334 | | | $ | 17,149 | | | $ | 16,431 | | | $ | 18,110 | |
Ratio of total expenses to average net assets | | | 4.89 | %(3) | | | 3.89 | % | | | 4.06 | % | | | 3.89 | % | | | 4.03 | % | | | 3.49 | % |
Ratio of net expenses to average net assets | | | 4.89 | %(3) | | | 3.89 | % | | | 4.06 | % | | | 3.88 | % | | | 4.03 | % | | | 3.49 | % |
Ratio of net expenses excluding loan interest and fees to average net assets | | | 4.62 | %(3) | | | 3.32 | % | | | 3.22 | % | | | 3.39 | % | | | 3.83 | % | | | 3.39 | % |
Ratio of net investment loss to average net assets | | | (3.65 | )%(3) | | | (2.71 | )% | | | (2.85 | )% | | | (2.32 | )% | | | (2.15 | )% | | | (1.82 | )% |
Portfolio turnover rate | | | 4 | % | | | 13 | % | | | 36 | % | | | 73 | % | | | 118 | % | | | 9 | % |
| |
| | (1) | Average shares outstanding during the period are used to calculate per share data. |
| | (2) | Less than $.005 per share. |
See notes to financial statements.
21
Financial Highlights
Midas Perpetual Portfolio
| | | | | | | | | | | | | | | | | | | | | | | | |
| | | Six Months Ended
June 30, 2009
(Unaudited) | | | For the Year Ended December 31, | |
| | | 2008(1) | | | 2007(1) | | | 2006(1) | | | 2005(1) | | | 2004(1) | |
Per Share Data (for a share outstanding throughout each period) | | | | | | | | | | | | | | | | | | | | | | | | |
Net asset value, beginning of period | | $ | 1.000 | | | $ | 1.000 | | | $ | 1.000 | | | $ | 1.000 | | | $ | 1.000 | | | $ | 1.000 | |
| | | | | | | | | | | | | | | | | | | | | | | | |
Income (loss) from investment operations: | | | | | | | | | | | | | | | | | | | | | | | | |
Net investment income (loss) (2) | | | (0.01 | ) | | | .012 | | | | .039 | | | | .039 | | | | .016 | | | | .003 | |
Net realized and unrealized gain (loss) on investments | | | 0.06 | | | | — | | | | — | | | | — | | | | ��� | | | | — | |
| | | | | | | | | | | | | | | | | | | | | | | | |
Total from investment operations | | | 0.05 | | | | — | | | | — | | | | — | | | | — | | | | — | |
| | | | | | | | | | | | | | | | | | | | | | | | |
Paid capital from redemption fees (3) | | | — | | | | — | | | | — | | | | — | | | | — | | | | — | |
| | | | | | | | | | | | | | | | | | | | | | | | |
Less distributions: | | | | | | | | | | | | | | | | | | | | | | | | |
Dividends from net investment income | | | (0.01 | ) | | | (.012 | ) | | | (.039 | ) | | | (.039 | ) | | | (.016 | ) | | | (.003 | ) |
| | | | | | | | | | | | | | | | | | | | | | | | |
Net asset value, end of period | | $ | 1.04 | | | $ | 1.000 | | | $ | 1.000 | | | $ | 1.000 | | | $ | 1.000 | | | $ | 1.000 | |
| | | | | | | | | | | | | | | | | | | | | | | | |
| | | | | | |
Total Return | | | 4.79 | % | | | 1.22 | %(4) | | | 4.00 | %(4) | | | 3.88 | %(4) | | | 1.61 | %(4) | | | 0.29 | %(4) |
| | | | | | |
Ratios/Supplemental Data | | | | | | | | | | | | | | | | | | | | | | | | |
Net assets at end of period (000s omitted) | | $ | 6,988 | | | $ | 7,191 | | | $ | 14,516 | | | $ | 14,528 | | | $ | 12,889 | | | $ | 15,543 | |
Ratio of total expenses to average net assets | | | 2.73 | %(5) | | | 1.77 | % | | | 1.91 | % | | | 1.83 | % | | | 2.34 | % | | | 1.97 | % |
Ratio of net expenses to average net assets | | | 2.73 | %(5) | | | 1.21 | %(4) | | | 1.15 | %(4) | | | 1.08 | %(4) | | | 1.59 | %(4) | | | 1.12 | %(4) |
Ratio of net investment income (loss) to average net assets | | | (1.59 | )%(5) | | | 1.22 | %(4) | | | 3.92 | %(4) | | | 3.87 | %(4) | | | 1.58 | %(4) | | | 0.24 | %(4) |
Portfolio turnover rate | | | 12 | % | | | 0 | % | | | 0 | % | | | 0 | % | | | 0 | % | | | 0 | % |
| |
| | (1) | These financial highlights reflect the Fund’s operation as a money market fund up to December 28, 2008. On December 29, 2008, the Fund changed its name to Midas Perpetual Portfolio, Inc. from Midas Dollar Reserves, Inc., ceased operating as a money market fund and began operating as a fluctuating net asset value fund pursuant to its current investment objective and policies. |
| | (2) | Average shares outstanding during the period are used to calculate per share data. |
| | (3) | The Fund began imposing a redemption fee on December 29, 2008. The amount is less than $.005 per share. |
| | (4) | Fees voluntarily waived by the Investment Manager and Distributor reduced the ratio of net expenses to average net assets by 0.24%, 0.75%, 0.75%, 0.75%, and 0.75% for the years ended December 31, 2008, 2007, 2006, 2005, and 2004, respectively. In addition, the Investment Manager voluntarily reimbursed the Fund for certain operating expenses which further reduced the ratio of net expenses to average net assets by 0.32%, 0.00%, 0.00%, 0.00%, and 0.10% for the years ended December 31, 2008, 2007, 2006, 2005, and 2004, respectively. The impact of the voluntary fee waivers and reimbursements is reflected in both the total return and the ratio of net investment income to average net assets. |
See notes to financial statements.
22
About Your Fund’s Expenses
(UNAUDITED)
Fund shareholders may incur two types of costs: (1) transaction costs, including redemption or small account fees; and (2) ongoing costs, including management fees, distribution and service 12b-1 fees, and other fund expenses. This example is intended to help you understand your ongoing costs (in dollars) of investing in your Fund and to compare these costs with the ongoing cost of investing in other mutual funds. The example is based on an investment of $1,000 made at the beginning of the period and held for the entire period from January 1, 2009 to June 30, 2009.
Actual Expenses
The table provides information about actual account values and actual expenses for each Fund. You may use the information, together with the amount you invested, to estimate the expenses that you paid over the period. First, identify the Fund you own. Then simply divide your account value by $1,000 (for example, an $8,600 account value divided by $1,000 = 8.6), then multiply the result by the number under the heading “Expenses Paid During Period” to estimate the expenses you paid on your account during this period. The Fund may charge you a $20 annual small balance account fee if the value of those shares is less than $500. We will
redeem shares automatically in one of your accounts to pay the $20 fee. In determining your total eligible investment amount, we will include your investments in all personal accounts registered under your Social Security number. Personal accounts include individual accounts, joint accounts, UGMA/UTMA accounts, personal trusts, Coverdell Education Savings Accounts, and IRAs (including traditional, Roth, Rollover, SEP, SARSEP, and SIMPLE-IRAs), and certain other retirement accounts.
Hypothetical Example for Comparison Purposes
The table also provides information about hypothetical account values and hypothetical expenses based on the actual expense ratio of each Fund and an assumed rate of return of 5% per year before expenses, which is not the actual return of a Fund. The hypothetical account values and expenses may not be used to estimate the actual ending account balance or expenses you paid for the period. You may use this information to compare the ongoing costs of investing in your Fund and other funds. To do so, compare this 5% hypothetical example with the 5% hypothetical examples that appear in the shareholder reports of the other funds.
Expense Analysis Tables
Midas Fund
| | | | | | | | | |
| | | Beginning Account Value
January 1, 2009 | | Ending Account Value
June 30, 2009 | | Expenses Paid During Period
January 1, 2009-June 30, 2009(a) |
Actual | | $ | 1,000.00 | | $ | 1,270.81 | | $ | 13.68 |
Hypothetical (5% return before expenses) | | $ | 1,000.00 | | $ | 1,012.74 | | $ | 12.13 |
|
| | (a) | Expenses are equal to the Fund’s annualized expense ratio of 2.43%, multiplied by the average account value over the period, multiplied by 181/365 to reflect the one half year period. |
Midas Special Fund
| | | | | | | | | |
| | | Beginning Account Value
January 1, 2009 | | Ending Account Value
June 30, 2009 | | Expenses Paid During Period
January 1, 2009-June 30, 2009(b) |
Actual | | $ | 1,000.00 | | $ | 1,024.13 | | $ | 24.54 |
Hypothetical (5% return before expenses) | | $ | 1,000.00 | | $ | 1000.55 | | $ | 24.26 |
|
| | (b) | Expenses are equal to the Fund’s annualized expense ratio of 4.89%, multiplied by the average account value over the period, multiplied by 181/365 to reflect the one half year period. |
Midas Perpetual Portfolio
| | | | | | | | | |
| | | Beginning Account Value
January 1, 2009 | | Ending Account Value
June 30, 2009 | | Expenses Paid During Period
January 1, 2009-June 30, 2009(c) |
Actual | | $ | 1,000.00 | | $ | 1,047.92 | | $ | 13.86 |
Hypothetical (5% return before expenses) | | $ | 1,000.00 | | $ | 1,011.26 | | $ | 13.61 |
|
| | (c) | Expenses are equal to the Fund’s annualized expense ratio of 2.73%, multiplied by the average account value over the period, multiplied by 181/365 to reflect the one half year period. |
23
Board Approval of Agreements
(UNAUDITED)
The investment management agreements (each individually, an “Agreement,” and collectively, the “Agreements”) between each of the Midas Funds and the investment manager, Midas Management Corporation, generally provide that each Agreement shall continue automatically for successive periods of twelve months each, provided that such continuance is specifically approved at least annually (i) by a vote of a majority of the Directors of each Fund who are not parties to the Agreement, or interested persons of any such party and (ii) by the Board of Directors of each Fund or by the vote of the holders of a majority of the outstanding voting securities of each Fund.
In considering the annual approval of the Agreements, the Boards of Directors considered information that had been provided throughout the year at regular Board meetings, as well as information furnished to the Boards for the meeting held in March 2009 to specifically consider the continuance of the Agreements. Such information included, among other things, the following: information comparing the management fees of each Fund with those of comparable funds; information regarding Fund investment performance in comparison to a relevant peer group of funds; the economic outlook and the general investment outlook in relevant investment markets; the investment manager’s results and financial condition and the overall organization of the investment manager; the allocation of brokerage and the benefits received by the investment manager as a result of brokerage allocation; the investment manager’s trading practices, including soft dollars; the investment manager’s management of relationships with the custodians, transfer agents, pricing agents, brokers, and other service providers; the resources devoted to the investment manager’s compliance efforts undertaken on behalf of the funds it manages and the record of compliance with the investment policies and restrictions and with policies on personal securities transactions; the quality, nature, cost, and character of the administrative and other non-investment management services provided by the investment manager and its affiliates; and the terms of the Agreements; the investment manager’s gifts and entertainment log; and the reasonableness and appropriateness of the particular fee paid by a Fund for the services described therein. The Boards concluded that the investment manager is using soft dollars for the benefit of each Fund and its shareholders. The directors further concluded that the investment manager is using each Fund’s assets for the benefit of the Fund and its shareholders and is operating in the best interests of each Fund.
The Boards of Directors also considered the nature, extent and quality of the management services provided by the investment manager. In so doing, the Boards considered the investment manager’s management capabilities with respect to the types of investments held by each Fund, including information relating to the education, experience and number of investment professionals and other personnel who provide services under the Agreements. The Boards also took into account the time and attention to be devoted by management to each Fund and the other funds in the complex. The Boards evaluated the level of skill required to manage each Fund and concluded that the human resources available at the investment manager were appropriate to fulfill effectively its duties on behalf of each Fund. The Directors also noted that the investment manager has managed the Funds for several years and indicated their belief that a long term relationship with a capable, conscientious investment manager is in the best interests of the Funds.
The Boards received information concerning the investment philosophy and investment process applied by the investment manager in managing each Fund. In this regard, the Boards considered the investment manager’s in house research capabilities as well as other resources available to the investment manager personnel, including research services that may be available to the investment manager as a result of securities transactions effected for the Funds. The Boards concluded that the investment manager’s investment process, research capabilities and philosophy were well suited to each Fund, given each Fund’s investment objective and policies.
In its review of comparative information with respect to Fund investment performance, the Boards received comparative information, comparing the Funds’ performance to that of similar peer groups. After reviewing this information, the Boards concluded that each Fund has performed within a range that the Boards deemed competitive. With respect to their review of investment management fees, the Boards considered information comparing the Funds’ management fees and expense ratios to those of comparable funds. The Boards noted that economies of scale may develop for each Fund as its assets increase and fund level expenses decline as a percentage of assets, but that fund level economies of scale may not necessarily result in investment manager level economies of scale. This information assisted the Boards in concluding that the fees paid by each Fund are within the range of those paid by comparable funds within the mutual fund industry.
In reviewing the information regarding the expense ratio of the Funds, the Boards concluded that although the Funds’ expense ratios are within a higher range, excluding extraordinary expenses, they are competitive with comparable funds in light of the quality of services received and assets managed.
In addition to the factors mentioned above, the Boards reviewed the level of the investment manager’s profits in providing investment management and related services for each Fund and for all the funds in the complex. The Boards considered the fiduciary duty assumed by the investment manager in connection with the services rendered to the Funds and the business reputation of the investment manager and its financial resources. The Boards also considered information regarding the character and amount of other incidental benefits received by the investment manager and its affiliates from their association with the Funds. The Boards concluded that potential “fall out” benefits that the investment manager and its affiliates may receive, such as greater name recognition, affiliated brokerage commissions or increased ability to obtain research services, appear to be reasonable, and may, in some cases, benefit the Funds. The Boards concluded that in light of the services rendered, the profits realized by the investment manager are not unreasonable.
The Boards did not consider any single factor as controlling in determining whether or not to renew the Agreements. In assessing the information provided by the investment manager and its affiliates, the Boards also noted that they were taking into consideration the benefits to shareholders of investing in a fund that is part of a family of funds which provides a variety of shareholder services.
Based on their consideration of the foregoing factors and conclusions, and such other factors and conclusions as it deemed relevant, and assisted by counsel, the Boards concluded that the approval of each Agreement, including the fee structure, is in the best interests of each Fund.
24
Additional Information
(UNAUDITED)
Quarterly Schedules of Portfolio Holdings
The Funds file their complete schedule of portfolio holdings with the Securities and Exchange Commission (“SEC”) for the first and third quarters of each fiscal year on Form N-Q. The Funds’ Forms N-Q are available on the SEC’s website at www.sec.gov and may be reviewed and copied at the SEC’s Public Reference Room in Washington, D.C. Information on the operation of the Public Reference Room may be obtained by calling 1-800-SEC-0330. The Funds’ quarterly reports on Form N-Q are also available on the Funds’ website at www.MidasFunds.com.
Proxy Voting Policies and Procedures
A description of the policies and procedures that the Funds use to determine how to vote proxies relating to portfolio securities is available, without charge, by calling 1-800-400-MIDAS (6432) and on the website of the SEC at www.sec.gov. Information regarding how the Fund voted proxies relating to portfolio securities during the most recent 12 month period ended June 30 is available without charge, by calling 1-800-400-MIDAS (6432), on the website of the SEC at www.sec.gov, and on the Funds’ website at www.MidasFunds.com.
Midas Funds Offer
| | • | | IRA Retirement Accounts, including Traditional, Roth, Self-Employed, and Small Business (SEP, SIMPLE) |
| | • | | Education Savings Accounts |
| | • | | Health Savings Accounts |
| | • | | Electronic Funds Transfers |
| | • | | Automatic Investment Program |
Only $1,000 minimum to open a Midas Funds account, with subsequent minimum investments of $100.
There is NO FEE to open an account.
Join our Automatic Investment Program, and open an account for only $100, and make subsequent monthly investments of as little as $100.
25
MIDAS FUNDS REGULAR ACCOUNT APPLICATION
INSTRUCTIONS
| 1. | Registration. If there is more than one owner of the account, the registration will be “Joint Tenants with Right of Survivorship” unless you specify “Tenants in Common.” If this is a Uniform Gift/Transfer to a Minor, please enter all information requested for the minor. |
| 2. | Mailing and E-mail Addresses, Telephone Number, and Citizenship. If you are a non-U.S. citizen residing in the U.S., in addition to this Account Application, you will be required to attach a Form W-8 BEN, which can be obtained from the IRS website at www.irs.gov or calling 1-800-829-3676. If this is a Uniform Gift/Transfer to a Minor, please enter all information for the Custodian, including Custodian’s physical address. |
| 3. | Choose Fund(s) and amount invested. Indicate the Fund(s) in which you are opening an account. The opening minimum is $1,000 per Fund ($100 for Midas Automatic Investment Programs – see Section 6 of the Account Application). The minimum subsequent investment is $100. |
| 4. | Distributions. Your dividends and distributions will be reinvested in additional shares of the Fund unless you instruct Midas otherwise. |
| 5. | Shareholder Communications. Check the method of shareholder communications you would prefer (electronic or paper copies). Electronic communications will be sent to the e-mail address provided in Section 2. |
| 6. | Midas Funds Bank Transfer Plan/The Midas Touch®. With the Bank Transfer Plan (BTP), you can establish a convenient and affordable long term investment program. The $1,000 minimum investment requirement is waived since the BTP is designed to facilitate an automatic monthly investment of $100 or more into your Fund account(s). Please specify the total amount you want to invest each month, the frequency, and when you’d like to start your automatic investing. |
All shareholders can access their account 24 hours a day, every day, at www.MidasFunds.com and by automated telephone response at 1-800-400-MIDAS (6432). Only with The Midas Touch® can you manage your account by purchasing or redeeming Fund shares using Electronic Funds Transfer, initiate Fund to Fund transfers between the three Midas Funds, and perform transactions through a Shareholder Services Representative. To access these features, please indicate your bank routing and account numbers or attach a voided check.
| 7. | Signature and Certification to Avoid Backup Withholding. After reading this section, please sign and date the Account Application. |
Send By Mail. Mail your completed Account Application to Midas Funds, P.O. Box 6110, Indianapolis, IN 46206-6110. Checks must be payable to Midas Funds in U.S. dollars. Third party checks and money orders cannot be accepted.
Send By Wire. Call 1-800-400-MIDAS (6432) between 8 a.m. and 6 p.m., ET, on business days to speak with a Shareholder Services Representative. A completed Account Application, the name of the bank sending the wire, and the amount to be wired are required before the wired funds can be accepted. The completed Account Application should be faxed to 1-317-937-3014, Attn: Midas Funds. You will then be assigned a Fund account number and receive wiring address information. Your account number and name(s) must be specified in the wire as they are to appear on the account registration. You should then enter your account number on your completed Account Application and promptly mail it to Midas Funds, P.O. Box 6110, Indianapolis, IN 46206-6110. This service is not available on days when the Federal Reserve wire system is closed.
If you need any assistance in completing the Account Application, please
call a Shareholder Services Representative at 1-800-400-MIDAS (6432)
between the hours of 8 a.m. and 6 p.m., ET.
26

27
28

With The Midas Touch®, you enjoy enhanced access at any time, online at www.MidasFunds.com or by telephone 1-800-400-MIDAS (6432), to
| | • | | Monitor your investments |
| | • | | Retrieve your account history |
| | • | | Review recent transactions |
| | • | | Obtain closing market information and Fund closing prices |
| | • | | Check your account balances and account activity |
| | • | | Obtain prospectuses, shareholder reports, and account applications, as well as IRA transfer forms and Automatic Investment Program forms for regular monthly investing |
| | • | | Purchase or redeem Fund shares using electronic funds transfer to move money to or from your authorized bank account |
| | • | | Initiate account transactions, such as Fund to Fund transfers among the three Midas Funds |
| | • | | Perform transactions through a Shareholder Services Representative Monday through Friday, from 8 a.m. to 6 p.m., ET |
Midas Funds
P.O. Box 6110
Indianapolis, IN 46206-6110
1-800-400-MIDAS (6432) for Investment Information
Past performance does not guarantee future results. Investment return will fluctuate, so shares when redeemed may be worth more or less than their cost. Dollar cost averaging does not assure a profit or protect against loss in a declining market and investors should consider their ability to make purchases when prices are low. One of Midas’ guiding principles is that we will communicate with our shareholders as candidly as possible because we believe shareholders benefit from understanding our investment philosophy and approach. Our views and opinions regarding the prospects of our portfolio holdings, Funds, and the economy are “forward looking statements” which may or may not be accurate and may be materially different over future periods. We disclaim any obligation to update or alter any forward looking statements, whether as a result of new information, future events, or otherwise. Thus, you should not place undue reliance on forward looking statements, which also speak only as of the date of this Report. Current performance may be lower or higher than the performance quoted herein. This Report and the financial statements it contains are submitted for the general information of the shareholders of the Midas Funds. The Report is not authorized for distribution to prospective investors in the Funds unless preceded or accompanied by an effective Prospectus which contains more complete information, including charges, risks and expenses. Please read it carefully before you invest or send money.
Investor Service Center, Inc., Distributor. Member, FINRA.

Item 2. Code of Ethics.
Not applicable.
Item 3. Audit Committee Financial Expert.
Not applicable.
Item 4. Principal Accountant Fees and Services.
Not applicable.
Item 5. Audit Committee of Listed Registrants.
Not applicable.
Item 6. Investments.
Included as part of the report to stockholders filed under Item 1 of this Form.
Item 7. Disclosure of Proxy Voting Policies and Procedures for Closed-End Management Investment Companies.
Not applicable.
Item 8. Portfolio Managers of Closed-End Management Investment Companies.
Not applicable.
Item 9. Purchases of Equity Securities by Closed-End Management Investment Company and Affiliated Purchase.
Not applicable.
Item 10. Submission of Matters to a Vote of Security Holders.
Not applicable.
Item 11. Controls and Procedures.
| | (a) | | The registrant's principal executive officer and principal financial officer have concluded that the registrant's disclosure controls and procedures (as defined in Rule 30a-3(c) under the Investment Company Act of 1940, as amended (the "1940 Act")) are effective as of a date within 90 days of the filing date of this report that includes the disclosure required by this paragraph, based on their evaluation of the disclosure controls and procedures required by Rule 30a-3(b) under the 1940 Act and 15d-15(b) under the Securities Exchange Act of 1934. |
| | (b) | | There were no changes in the registrant's internal control over financial reporting (as defined in Rule 30a-3(d) under the 1940 Act) that occurred during the registrant's last fiscal quarter that have materially affected, or are reasonably likely to materially affect, the registrant's internal control over financial reporting. |
Item 12. Exhibits.
| | (a) | | Certifications of the registrant's principal executive officer and principal financial officer as required by Rule 30a-2(a) under the 1940 Act. |
SIGNATURES
Pursuant to the requirements of the Securities Exchange Act of 1934 and the 1940 Act, the registrant has duly caused this report to be signed on its behalf by the undersigned, thereunto duly authorized.
September 4, 2009 | | Midas Perpetual Portfolio, Inc.
By: /s/ Thomas B. Winmill
——————————————
Thomas B. Winmill
President |
September 4, 2009 | | Midas Perpetual Portfolio, Inc.
By: /s/ Thomas O'Malley
——————————————
Thomas O'Malley
Chief Financial Officer |