UNITED STATES
SECURITIES AND EXCHANGE COMMISSION
Washington, D.C. 20549
FORM N-CSR
CERTIFIED SHAREHOLDER REPORT OF REGISTERED
MANAGEMENT INVESTMENT COMPANIES
Investment Company Act file number: 811-23146
Natixis ETF Trust
(Exact name of Registrant as specified in charter)
888 Boylston Street, Suite 800 Boston, Massachusetts 02199-8197
(Address of principal executive offices) (Zip code)
Russell L. Kane, Esq.
Natixis Distribution, L.P.
888 Boylston Street, Suite 800
Boston, Massachusetts 02199-8197
(Name and address of agent for service)
Registrant’s telephone number, including area code: (617) 449-2822
Date of fiscal year end: December 31
Date of reporting period: December 31, 2017
| Item 1. | Reports to Stockholders. |
The Registrant’s annual report transmitted to shareholders pursuant to Rule 30e-1 under the Investment Company Act of 1940 is as follows:
ANNUAL REPORT
December 31, 2017

Natixis Loomis Sayles Short Duration Income ETF
Natixis Seeyond International Minimum Volatility ETF

TABLE OF CONTENTS
Portfolio Review page 1
Portfolio of Investments page 13
Financial Statements page 18
Notes to Financial Statements page 24
NATIXIS LOOMIS SAYLES SHORT DURATION INCOME ETF
| Managers | NYSE Arca: LSST | |
| Christopher T. Harms | ||
| Clifton V. Rowe, CFA® | ||
| Kurt L. Wagner, CFA® | ||
| Loomis, Sayles & Company, L.P. |
Investment Goal
The Fund’s investment objective is current income consistent with preservation of capital.
Market Conditions
Risk assets continued their yearlong rally through December, fueled by improving fundamentals across the globe. Performance was broadly positive across many asset classes, led by US and global equities. Fixed income performance was strong as domestic and global credit, US bank loans, sovereign bonds and local-currency emerging market bonds earned positive total returns. The Federal Reserve (Fed) raised interest rates again in December; investors took the increase in stride as a number of developments supported fixed income market performance.
Performance Results
The Natixis Loomis Sayles Short Duration Income Exchange Traded Fund (ETF) was launched on December 27, 2017. For the period ending December 31, 2017, the Fund returned 0.08% at net asset value. The Fund was in line with its benchmark, the Bloomberg Barclays 1-3 Year U.S. Government/Credit Bond Index, which returned 0.04%.
Explanation of Fund Performance
We were invested in US Treasurys during the seeding period of the ETF, which was the last two trading days of 2017. Given the liquidity constraints in the market at that time, we felt it was in the best interest of all parties to maintain liquidity and flexibility by owning risk-free assets with the expectation that the portfolio composition would change in earnest beginning January 2, 2018.
Outlook
We believe that the Fed will tighten monetary conditions in a gradual and measured way as aggregate demand remains healthy, with three hikes in 2018. Corporate fundamentals have continued to indicate the US is in the late expansion phase of the credit cycle,1 with slowing margin growth, increased mergers and acquisitions and rising leverage. Our view is that the cycle will continue to evolve slowly. Asset classes like corporate credit could benefit from US tax reform and potential fiscal stimulus from the Trump administration. While valuations may not be as attractive as they were last year, we continue to favor investment grade credit. We believe the primary risks to the credit markets include the pace of global growth, the timing of Fed tightening and commodity price volatility.
Given the macro environment of stable to improving US growth, we favor risk assets such as corporate credit. We are focused on security selection opportunities, buying new issues
1 |
with concessions and secondary bonds that can potentially offer favorable risk/return profiles. We will monitor our portfolio and diversify our holdings with an eye toward minimizing undue exposure to macro and/or issuer events.
| 1 | A credit cycle is a cyclical pattern that follows credit availability and corporate health. |
Total Returns — December 31, 20173
| Inception 12/27/17 | Expense Ratio4 | |||||||||||
| Life of Fund | Gross | Net | ||||||||||
| NAV1 | 0.08 | % | 0.87 | % | 0.38 | % | ||||||
| Market1 | 0.08 | |||||||||||
| Comparative Performance | ||||||||||||
| Bloomberg Barclays 1-3 Year U.S. Government/Credit Bond Index2 | 0.04 | |||||||||||
Performance data shown represents past performance and is no guarantee of, and not necessarily indicative of, future results. Total return and value will vary, and you may have a gain or loss when shares are sold. Current performance may be lower or higher than quoted. For most recent month-end performance, visit im.natixis.com. You may not invest directly in an index. Performance for periods less than one year is cumulative, not annualized. Returns reflect changes in share price and reinvestment of dividends and capital gains, if any. The table(s) do not reflect taxes shareholders might owe on any fund distributions or when they redeem or sell their shares.
The fund is new with a limited operating history.
| 1 | The NAV return is based on the NAV of the Fund, and the market return is based on the market price per share of the Fund, which is determined by using the midpoint between the highest bid and the lowest offer on the primary stock exchange on which the shares of the Fund are listed for trading, as of the time that the Fund’s NAV is calculated. Since shares of the Fund did not trade on the secondary market until December 28, 2017, NAV is used as a proxy for the market price prior to that date. Market and NAV returns assume that dividends and capital gain distributions have been reinvested in the Fund at market price and NAV, respectively. |
| 2 | The Bloomberg Barclays 1-3 Year U.S. Government/Credit Bond Index is the one- to three-year component of the Bloomberg Barclays U.S. Government/Credit Bond Index that includes securities in the Government and Credit Indexes. The Government Index includes Treasuries (that is, public obligations of the U.S. Treasury that have remaining maturities of more than one year) and agencies (that is, publicly issued debt of U.S. government agencies, quasi-federal corporations, and corporate or foreign debt guaranteed by the U.S. government). The Credit Index includes publicly issued U.S. corporate and foreign debentures and secured notes that meet specified maturity, liquidity, and quality requirements. |
| 3 | Fund performance has been increased by fee waivers and/or expense reimbursements, if any, without which performance would have been lower. |
| 4 | Expense ratios are as shown in the Fund’s prospectus in effect as of the date of this report. The expense ratios for the current reporting period can be found in the Financial Highlights section of this report under Ratios to Average Net Assets. Net expenses reflect contractual expense caps set to expire on 4/30/19. When a Fund’s expenses are below the cap, gross and net expense ratios will be the same. See Note 5 of the Notes to Financial Statements for more information about the Fund’s expense caps. |
| 2
NATIXIS SEEYOND INTERNATIONAL MINIMUM VOLATILITY ETF
| Managers | NYSE Arca: MVIN | |
| Frédéric Babu | ||
| Alexander J. Nary | ||
| Nicolas Just, CFA® | ||
| Juan-Sebastian Caicedo, CFA® | ||
| Natixis Asset Management U.S., LLC (“Natixis AM U.S.”) | ||
Investment Goal
The Fund seeks long-term capital appreciation with less volatility than typically experienced by international equity markets.
Market Conditions
2017 will be remembered as a dream year for equity investors, bringing together incessantly rising stock prices and low market volatility. This set the stage for a very successful year for traditional active managers overall, but was also very favorable to low volatility strategies which managed to keep up with the rising market while reducing volatility even further.
Equity markets started the year with cyclicals (materials, industrials) outperforming. The key event during the month of January was Donald Trump’s inauguration as the 45th President of the United States. Uncertainty showed no sign of abating as markets became focused on the implications of President Trump’s political agenda. In Europe, all heads were turned toward the upcoming elections in France and progress made around Brexit1 negotiations. Within this context the dollar gave up some ground against most major world currencies and US interest rates inched higher. The tone was set for 2017.
Investors ended the year with further optimism regarding the global macroeconomic environment and the impact of President Trump’s tax reform in the US, along with improved Gross Domestic Product (GDP) forecasts in the euro zone. The Federal Reserve decision to raise the federal funds rate by 25 basis points on December 13 was already priced in by market participants and the US dollar depreciated further against the euro. Political tensions eased somewhat in Europe and in Asia, while oil prices reached a year-high level. In this cheerful context, equity volatilities around the globe reached new lows and emerging markets led global equity markets. Not surprisingly, cyclical sectors (including materials and industrials) as well as technology stocks outperformed more defensive ones (notably healthcare, utilities, and telecommunications).
Performance Results
For the 12 months ended December 31, 2017, the Fund returned 22.17%. The Fund underperformed its benchmark, the MSCI EAFE (Net), which returned 25.03%.
Performance Explanation
Although the nature of the global market rally could have penalized our rather conservative strategy, the Fund managed to keep up fairly well with its benchmark index over the period, while at the same time reducing volatility by 20% and displaying a beta2 of ..53 when compared to the index.
3 |
In 2017, investors witnessed a marked drop in correlations among equities from a previously high level, as a result of the growing market. Looking under the surface, however, equity markets have remained polarized between cyclical and defensive stocks. In fact, the Fund was able to benefit from this situation throughout the year by seizing the opportunity to reach across the aisle to low volatility stocks in sectors that are traditionally more volatile, enabling it to keep up with the rising market while further reducing volatility.
Healthcare, energy and financials have been the best performing sectors on a relative term while real estate, industrials and telecommunication services have weighed on relative Fund performance. Among the best performers, Techtronic Industries, one of the largest producers of branded power tools and floor care products, benefited from a recovery in demand in the US and Europe. Partners Group Holdings, a leading Swiss-based private equity firm, has proven well positioned to capture the favorable dynamics in the private market industry. And Oriental Land, the company operating the Tokyo Disney Resort, rose on more bullish traffic assumptions as the company managed to surprise on the upside in 2017. On the negative side, news flow has overshadowed operations over the summer at Bezeq The Israeli Telecommunication Corporation, Ltd. In Japan, the difficult environment for REITs has been amplified at Japan Prime Realty by cautious guidance on occupancy. Finally, at BIC, sales have suffered from softer demand and increased competition for its famous lighters, pens and shavers.
Outlook
Investors seem to have been reassured on three fronts in December. First, macroeconomic dynamics seem to be converging around the globe towards higher GDP forecasts for 2018, stimulated by pro-business reforms in the US and Europe. Second, international political tensions are perceived to be “within control” by governments and any thoughts of quick deterioration seem to be remote. Third, expectations are high that central banks around the world will carefully manage the transition period as they unwind the unorthodox monetary policies they have been carrying out over the last five to ten years.
2018 is starting on a strong footing, but before we become complacent, it is essential to acknowledge that 2017 also carried a sense of uneasiness for investors worldwide. The ongoing combination of high equity returns and low volatility simply underscores the fact that in spite of all the tectonic economic, political and geopolitical shifts, very little is happening on the surface. At Seeyond, we believe this is a very unusual situation as low volatility is typically a sign of consensus about the path of the world economy, which we don’t believe is the case today. We fully understand the dynamics driving equity markets up — global growth picking up steam and fiscal stimulus in the US. We also understand why equity volatility is low: in spite of all the tectonic shifts at play in the marketplace, very little is happening on a day-to-day basis. But the combination of the two is more of a surprise to us in the current environment, and we believe that one of the two might have to give in 2018.
It looks increasingly likely that 2018 will start as a rollover year where winning positions are retained in hope of further equity momentum, and also in expectation of more favorable tax treatment going forward. Keeping positions for the wrong reasons is rarely a good idea, and we believe this can actually increase the depth of any market pullback.
| 4
NATIXIS SEEYOND INTERNATIONAL MINIMUM VOLATILITY ETF
That being said, while we believe that higher levels of volatility could actually be healthy for the market, we would caution against the temptation to time such volatility. Ultimately we believe that investors today should be looking for ships that can take sail in the current winds, while displaying the potential to navigate rockier waters in the future.
| 1 | A term for the departure of the United Kingdom from the European Union. |
| 2 | Measures the volatility of a security or a portfolio in comparison to the market as a whole. |
Hypothetical Growth of $10,000 Investment
October 25, 2016 (inception) through December 31, 2017
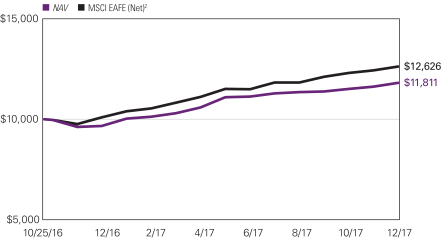
The chart above represents historical performance of a hypothetical investment of $10,000 in the fund since inception. Past performance does not guarantee future results. This chart does not reflect the deduction of taxes that a shareholder would pay on fund distributions or the redemption of fund shares.
Top Ten Holdings as of December 31, 2017
| Security name | % of net assets | |||||
| 1 | Partners Group Holding AG | 3.06 | % | |||
| 2 | Thales S.A. | 2.55 | ||||
| 3 | Carnival PLC | 2.50 | ||||
| 4 | HKT Trust & HKT Ltd. | 2.18 | ||||
| 5 | Spark New Zealand Ltd. | 2.13 | ||||
| 6 | BCE, Inc. | 2.05 | ||||
| 7 | Medibank Pvt Ltd. | 1.95 | ||||
| 8 | Yamada Denki Co. Ltd. | 1.89 | ||||
| 9 | Swisscom AG | 1.87 | ||||
| 10 | Swiss Prime Site AG | 1.81 | ||||
The portfolio is actively managed and holdings are subject to change. There is no guarantee the Fund continues to invest in the securities referenced. The holdings listed exclude any temporary cash investments.
5 |
Average Annual Total Returns — December 31, 20173
| Expense Ratios4 | ||||||||||||||||
1 Year | Life of Fund | Gross | Net | |||||||||||||
NAV1 | 22.17 | % | 15.11 | % | 2.89 | % | 0.55 | % | ||||||||
Market1 | 22.46 | 15.39 | ||||||||||||||
Comparative Performance | ||||||||||||||||
MSCI EAFE (Net)2 | 25.03 | 21.89 | ||||||||||||||
Performance data shown represents past performance and is no guarantee of, and not necessarily indicative of, future results. Total return and value will vary, and you may have a gain or loss when shares are sold. Current performance may be lower or higher than quoted. For most recent month-end performance, visit im.natixis.com. You may not invest directly in an index. Performance for periods less than one year is cumulative, not annualized. Returns reflect changes in share price and reinvestment of dividends and capital gains, if any. The table(s) do not reflect taxes shareholders might owe on any fund distributions or when they redeem or sell their shares.
| 1 | The NAV return is based on the NAV of the Fund, and the market return is based on the market price per share of the Fund, which is determined by using the midpoint between the highest bid and the lowest offer on the primary stock exchange on which the shares of the Fund are listed for trading, as of the time that the Fund’s NAV is calculated. Since shares of the Fund did not trade on the secondary market until October 27, 2016, NAV is used as a proxy for the market price prior to that date. Market and NAV returns assume that dividends and capital gain distributions have been reinvested in the Fund at market price and NAV, respectively. |
| 2 | The MSCI EAFE Index is a free float-adjusted market capitalization index designed to measure developed market equity performance, excluding the U.S. and Canada. The MSCI EAFE Index consists of the following 21 developed market country indices: Australia, Austria, Belgium, Denmark, Finland, France, Germany, Greece, Hong Kong, Ireland, Italy, Japan, the Netherlands, New Zealand, Norway, Portugal, Singapore, Spain, Sweden, Switzerland and the United Kingdom. |
| 3 | Fund performance has been increased by fee waivers and/or expense reimbursements, if any, without which performance would have been lower. |
| 4 | Expense ratios are as shown in the Fund’s prospectus in effect as of the date of this report. The expense ratios for the current reporting period can be found in the Financial Highlights section of this report under Ratios to Average Net Assets. Net expenses reflect contractual expense caps set to expire on 4/30/18. When a Fund’s expenses are below the cap, gross and net expense ratios will be the same. See Note 5 of the Notes to Financial Statements for more information about the Fund’s expense caps. |
| 6
ADDITIONAL INFORMATION
The views expressed in this report reflect those of the portfolio managers as of the dates indicated. The managers’ views are subject to change at any time without notice based on changes in market or other conditions. References to specific securities or industries should not be regarded as investment advice. Because the Funds are actively managed, there is no assurance that they will continue to invest in the securities or industries mentioned.
All investing involves risk, including the risk of loss. There is no assurance that any investment will meet its performance objectives or that losses will be avoided.
ADDITIONAL INDEX INFORMATION
This document may contain references to third party copyrights, indexes, and trademarks, each of which is the property of its respective owner. Such owner is not affiliated with Natixis Investment Managers or any of its related or affiliated companies (collectively “Natixis Affiliates”) and does not sponsor, endorse or participate in the provision of any Natixis Affiliates services, funds or other financial products.
The index information contained herein is derived from third parties and is provided on an “as is” basis. The user of this information assumes the entire risk of use of this information. Each of the third party entities involved in compiling, computing or creating index information disclaims all warranties (including, without limitation, any warranties of originality, accuracy, completeness, timeliness, non-infringement, merchantability and fitness for a particular purpose) with respect to such information.
PROXY VOTING INFORMATION
A description of the Funds’ proxy voting policies and procedures is available without charge, upon request, by calling 800-458-7452; through the Funds’ website at im.natixis.com; and on the Securities and Exchange Commission’s (SEC) website at www.sec.gov. Information regarding how the Fund voted proxies relating to its portfolio securities during the period from October 25, 2016 through June 30, 2017 for the Natixis Seeyond International Minimum Volatility ETF is available on the Fund’s website and the SEC’s website.
QUARTERLY PORTFOLIO SCHEDULES
The Funds will file a complete schedule of portfolio holdings with the SEC for the first and third quarters of each fiscal year on Form N-Q. The Funds’ Forms N-Q are available on the SEC’s website at www.sec.gov and may be reviewed and copied at the SEC’s Public Reference Room in Washington, DC. Information on the operation of the Public Reference Room may be obtained by calling 800-SEC-0330.
7 |
UNDERSTANDING FUND EXPENSES
As a shareholder, you incur two types of costs: (1) transaction costs, which may include creation and redemption fees and brokerage charges, and (2) ongoing costs, including management fees and other fund expenses. These ongoing costs are described in more detail in the Fund’s prospectus. The following examples are intended to help you understand the ongoing costs of investing in the Fund and help you compare these with the ongoing costs of investing in other funds.
The first line in the table shows the actual account values and actual Fund expenses you would have paid on a $1,000 investment in the Fund from July 1, 2017 (December 27, 2017 for the Natixis Loomis Sayles Short Duration Income ETF) through December 31, 2017. To estimate the expenses you paid over the period, simply divide your account value by $1,000 (for example $8,600 account value divided by $1,000 = 8.60) and multiply the result by the number in the Expenses Paid During Period column as shown below for your class.
The second line in the table provides information about hypothetical account values and hypothetical expenses based on the Fund’s actual expense ratios and an assumed rate of return of 5% per year before expenses, which is not the Fund’s actual return. The hypothetical account values and expenses may not be used to estimate the actual ending account balance or expenses you paid on your investment for the period. You may use this information to compare the ongoing costs of investing in the Fund and other funds. To do so, compare this 5% hypothetical example with the 5% hypothetical examples that appear in the shareholder reports of the other funds.
Please note that the expenses shown reflect ongoing costs only, and do not include any transaction costs, such as brokerage commissions on purchases and sales of Fund shares. Therefore, the second line in the table is useful in comparing ongoing costs only, and will not help you determine the relative costs of owning different funds. If transaction costs were included, total costs would be higher.
| NATIXIS LOOMIS SAYLES SHORT DURATION INCOME ETF | BEGINNING ACCOUNT VALUE 7/1/20171 | ENDING ACCOUNT VALUE 12/31/2017 | EXPENSES PAID DURING PERIOD 7/1/20171 – 12/31/2017 | |||||||||
| Actual | $1,000.00 | $1,000.80 | $0.04 | 1 | ||||||||
| Hypothetical (5% return before expenses) | $1,000.00 | $1,023.29 | $1.94 | * | ||||||||
The chart above represents historical performance of a hypothetical investment of $1,000 in the fund for the most recent six-month period. Past performance does not guarantee future results. This chart does not reflect the deduction of taxes that a shareholder would pay on fund distributions or the redemption of fund shares.
| * | Hypothetical expenses are equal to the Fund’s annualized expense ratio (after waiver/reimbursement) of 0.38%, multiplied by the average account value over the period, multiplied by the number of days in the most recent fiscal half-year (184), divided by 365 (to reflect the half-year period). |
| 1 | Fund commenced operations on December 27, 2017. Actual expenses are equal to the Fund’s annualized expense ratio (after waiver/reimbursement) of 0.38%, multiplied by the average account value over the period, multiplied by the number of days in the most recent fiscal period (4), divided by 365 (to reflect the partial period). |
| 8
| NATIXIS SEEYOND INTERNATIONAL MINIMUM VOLATILITY ETF | BEGINNING ACCOUNT VALUE 7/1/2017 | ENDING ACCOUNT VALUE 12/31/2017 | EXPENSES PAID DURING PERIOD* 7/1/2017 – 12/31/2017 | |||||||||
| Actual | $1,000.00 | $1,062.10 | $2.86 | |||||||||
| Hypothetical (5% return before expenses) | $1,000.00 | $1,022.43 | $2.80 | |||||||||
The chart above represents historical performance of a hypothetical investment of $1,000 in the fund for the most recent six-month period. Past performance does not guarantee future results. This chart does not reflect the deduction of taxes that a shareholder would pay on fund distributions or the redemption of fund shares.
| * | Expenses are equal to the Fund’s annualized expense ratio (after waiver/reimbursement), of 0.55%, multiplied by the average account value over the period, multiplied by the number of days in the most recent fiscal half-year (184), divided by 365 (to reflect the half-year period). |
9 |
BOARD APPROVAL OF THE INITIAL ADVISORY AND SUB-ADVISORY AGREEMENTS
NATIXIS LOOMIS SAYLES SHORT DURATION INCOME ETF
The Investment Company Act of 1940, as amended (the “1940 Act”), requires that both the full Board of Trustees of the Trust and a majority of the Trustees who are not “interested persons” (as defined in the 1940 Act) of the Trust (the “Independent Trustees”), voting separately, initially approve any new investment advisory and sub-advisory agreements for a registered investment company, including a newly formed fund such as the Natixis Loomis Sayles Short Duration Income ETF (the “Fund”). The Trustees, including the Independent Trustees, unanimously approved, for an initial two-year term, the proposed investment advisory and sub-advisory agreements (together, the “Agreements”) for the Fund at an in-person meeting held on November 17, 2017.
In connection with this review, the Trustees met with Fund management and other representatives of the Fund’s adviser, Natixis Advisors, L.P. (“Natixis Advisors”) and the Fund’s sub-adviser, Loomis, Sayles & Company, L.P. (“Loomis Sayles”) (collectively, the “Advisers”) on September 15, 2017 and November 17, 2017 to discuss the Fund’s structure and operations as an exchange-traded fund (“ETF”), and the services to be provided by the Advisers and other service providers to the Fund. Over the course of several months, the Trustees received and evaluated materials provided by Fund management including, among other items, information regarding (i) the Fund’s investment objective and strategies, (ii) the proposed advisory fees and other expenses to be charged to the Fund, including information comparing the Fund’s proposed advisory fees and net expense ratio to those of peer groups of actively managed ETFs and mutual funds that are managed using similar investment strategies, (iii) the size, education and experience of the Advisers’ investment staff and the investment strategies proposed to be used in managing the Fund, (iv) proposed arrangements for the distribution and trading of the Fund’s shares, (v) the procedures proposed to be employed to determine the value of the Fund’s assets, (vi) the Fund’s investment policies and restrictions, policies on personal securities transactions and other compliance policies, (vii) information about the Advisers’ performance, and (viii) the general economic outlook with particular emphasis on the asset management industry.
The Trustees also requested and received additional information regarding the Fund’s operations as an ETF, including service provider arrangements and proposed arrangements for the distribution and trading of the Fund’s shares, as well as information comparing the distribution, trading and operations of an ETF to those of a mutual fund. The Trustees also reviewed educational materials provided by Fund management describing these arrangements and the structure and operations of ETFs generally. The Trustees considered information about the differences between ETFs and mutual funds and how the services provided to the Fund by the Advisers and their affiliates would differ from the services provided to mutual funds generally. The Trustees considered the fact that they oversee other funds advised by the Advisers as well as information about the Advisers they had received in connection with their oversight of those other funds. Because the Fund is newly formed and had not commenced operations at the time of the Trustees’ review, certain information, including data relating to Fund performance, was not available, and therefore could not be distributed to the Trustees. Throughout the process, the Trustees were afforded the opportunity to ask questions of, and request additional materials from, the Advisers.
| 10
In considering whether to initially approve the Agreements, the Board of Trustees, including the Independent Trustees, did not identify any single factor as determinative. Individual Trustees may have evaluated the information presented differently from one another, giving weight to various factors. Matters considered by the Trustees, including the Independent Trustees, in connection with their approval of the Agreements included, but were not limited to, the factors listed below:
The nature, extent and quality of the services to be provided to the Fund under the Agreements. The Trustees considered the nature, extent and quality of the services to be provided by the Advisers and their affiliates to the Fund, which include advisory and non-advisory services directed to the needs and operations of the Fund as an ETF. The Trustees also considered the resources to be dedicated to the Fund by the Advisers and their affiliates. The Trustees noted that although the Fund is new the Advisers had extensive experience managing other types of funds and had made significant investments in the resources appropriate for the management of an ETF. The Trustees also considered their experience with other funds advised or sub-advised by the Advisers, as well as the affiliation between the Advisers and Natixis Investment Managers, L.P. (“Natixis LP”), whose affiliates provide investment advisory services to other funds in the Natixis family of mutual funds. In this regard, the Trustees considered not only the advisory and sub-advisory services proposed to be provided by the Advisers to the Fund, but also the monitoring and administrative services proposed to be provided by Natixis Advisors and its affiliates to the Fund.
After reviewing these and related factors, the Trustees concluded, within the context of their overall conclusions regarding the Agreements, that the scope of the services to be provided to the Fund under the Agreements seemed consistent with the Fund’s operational requirements, and that the Advisers had the capabilities, resources and personnel necessary to provide the advisory and sub-advisory services that would be required by the Fund. The Trustees determined that the nature, extent and quality of services proposed to be provided under the Agreements supported approval of the Agreements.
Investment performance of the Fund and the Advisers. Because the Fund had not yet commenced operations, performance information for the Fund was not considered; however, the Board considered the performance of other funds and accounts managed by the Advisers.
The Trustees also considered the Advisers’ performance and reputation generally, the performance of the fund family generally, and the historical responsiveness of the Advisers to Trustee concerns about performance and the willingness of the Advisers to take steps intended to improve performance.
Based on this and other information, the Trustees concluded, within the context of their overall conclusions regarding the Agreements, that these relevant factors supported approval of the Agreements.
The costs of the services to be provided by the Advisers and their affiliates and the profits to be realized by the Advisers and their affiliates from their relationships with the Fund. Although the Fund had not yet commenced operations at the time of the Trustees’ review of the Agreements, the Trustees reviewed information comparing the proposed advisory and sub-advisory fees and estimated total expenses of the Fund with the fees and expenses of comparable actively managed ETFs and mutual funds identified by the Advisers that are
11 |
managed using similar investment strategies, including information about how those funds were selected, as well as information about differences in such fees. The Trustees also considered that Loomis Sayles manages other funds pursuing the same investment strategy as the Fund’s proposed strategy. In evaluating the Fund’s proposed advisory and sub-advisory fees, the Trustees also took into account the demands, complexity and quality of the investment management of the Fund, including the additional responsibilities of the Advisers in overseeing an ETF. The Trustees also noted that the Fund would have an expense cap in place, and that the proposed advisory fees and net expense ratio of the Fund compared favorably to the advisory fees and net expense ratios of comparable funds in the relevant peer groups.
Because the Fund had not yet commenced operations, historical profitability information with respect to the Fund was not considered. However, the Trustees noted the information provided in court cases in which adviser profitability was an issue, the estimated expense level of the Fund, and that the Fund would be subject to an expense cap.
After reviewing these and related factors, the Trustees concluded, within the context of their overall conclusions regarding the Agreements, that the advisory and sub-advisory fees and expenses proposed to be charged to the Fund were fair and reasonable, and supported the approval of the Agreements.
Economies of scale. The Trustees considered the extent to which the Advisers may realize economies of scale or other efficiencies in managing the Fund, and whether those economies could be shared with the Fund through breakpoints in the advisory and sub-advisory fees or other means, such as expense waivers or caps. The Trustees noted that the Fund will be subject to an expense cap. After reviewing these and related factors, the Trustees concluded, within the context of their overall conclusions regarding the Agreements, that the extent to which economies of scale might be shared with the Fund supported the approval of the Agreements.
The Trustees also considered other factors, which included but were not limited to the following:
| · | The compliance-related resources the Advisers and their affiliates would provide to the Fund. |
| · | So-called “fallout benefits” to the Advisers, such as the engagement of affiliates of the Advisers to provide distribution and administrative services to the Fund, the benefits to Natixis LP, Natixis Advisors, and Loomis Sayles of being able to offer an additional ETF in the Natixis family of funds, and the benefits of research made available to the Advisers by reason of brokerage commissions (if any) generated by the Fund’s securities transactions. The Trustees also considered the benefits to the Natixis organization from the retention of the Advisers. The Trustees considered the possible conflicts of interest associated with these fallout and other benefits, and the reporting, disclosure and other processes in place to disclose and monitor such possible conflicts of interest. |
Based on their evaluation of all factors that they deemed to be material, including those factors described above, and assisted by the advice of independent counsel, the Trustees, including the Independent Trustees, concluded that the Agreements should be approved.
| 12
Portfolio of Investments – as of December 31, 2017
Natixis Loomis Sayles Short Duration Income ETF
| Principal Amount | Description | Value (†) | ||||||
| Bonds and Notes — 94.9% of Net Assets | ||||||||
| Treasuries — 94.9% | ||||||||
| $ | 19,040,000 | U.S. Treasury Note, 1.750%, 11/30/2019 (Identified Cost $18,987,320) | $ | 18,992,400 | ||||
|
| |||||||
| Short-Term Investments — 0.6% | ||||||||
| 124,655 | Tri-Party Repurchase Agreement with Fixed Income Clearing Corporation, dated 12/29/2017 at 0.540% to be repurchased at $124,663 on 1/02/2018 collateralized by $125,000 U.S. Treasury Note, 2.750% due 2/15/2024 valued at $129,361 including accrued interest (Note 2 of Notes to Financial Statements) (Identified Cost $124,655) | 124,655 | ||||||
|
| |||||||
Total Investments — 95.5% (Identified Cost $19,111,975) | 19,117,055 | |||||||
| Other assets less liabilities — 4.5% | 898,634 | |||||||
|
| |||||||
| Net Assets — 100.0% | $ | 20,015,689 | ||||||
|
| |||||||
| (†) | See Note 2 of Notes to Financial Statements. | |||||||
Industry Summary at December 31, 2017
Treasuries | 94.9 | % | ||
Short-Term Investments | 0.6 | |||
|
| |||
Total Investments | 95.5 | |||
Other assets less liabilities | 4.5 | |||
|
| |||
Net Assets | 100.0 | % | ||
|
|
See accompanying notes to financial statements.
13 |
Portfolio of Investments – as of December 31, 2017
Natixis Seeyond International Minimum Volatility ETF
| Shares | Description | Value (†) | ||||||
| Common Stocks — 99.7% | ||||||||
| Australia — 3.8% | ||||||||
| 27,648 | Aurizon Holdings Ltd. | $ | 106,999 | |||||
| 944 | CSL Ltd. | 104,075 | ||||||
| 134,608 | Medibank Private Ltd. | 345,542 | ||||||
| 7,032 | Sonic Healthcare Ltd. | 125,427 | ||||||
|
| |||||||
| 682,043 | ||||||||
|
| |||||||
| Canada — 8.9% | ||||||||
| 7,592 | BCE, Inc. | 364,682 | ||||||
| 2,392 | CCL Industries, Inc., Class B | 110,523 | ||||||
| 3,208 | Emera, Inc. | 119,898 | ||||||
| 456 | Fairfax Financial Holdings Ltd. | 242,816 | ||||||
| 2,280 | Intact Financial Corp. | 190,435 | ||||||
| 3,808 | Open Text Corp. | 135,446 | ||||||
| 928 | Royal Bank of Canada | 75,783 | ||||||
| 3,360 | SNC-Lavalin Group, Inc. | 152,496 | ||||||
| 1,584 | TELUS Corp. | 60,008 | ||||||
| 2,952 | Thomson Reuters Corp. | 128,672 | ||||||
|
| |||||||
| 1,580,759 | ||||||||
|
| |||||||
| Denmark — 3.0% | ||||||||
| 1,024 | Chr. Hansen Holding AS | 96,051 | ||||||
| 2,688 | H Lundbeck AS | 136,464 | ||||||
| 10,728 | William Demant Holding AS(a) | 299,984 | ||||||
|
| |||||||
| 532,499 | ||||||||
|
| |||||||
| Finland — 1.5% | ||||||||
| 4,032 | Elisa Oyj | 158,293 | ||||||
| 2,176 | Nokian Renkaat Oyj | 98,691 | ||||||
|
| |||||||
| 256,984 | ||||||||
|
| |||||||
| France — 7.6% | ||||||||
| 1,264 | BioMerieux | 113,276 | ||||||
| 152 | Dassault Aviation S.A. | 236,707 | ||||||
| 352 | Hermes International | 188,472 | ||||||
| 2,744 | Publicis Groupe S.A. | 186,514 | ||||||
| 4,200 | Thales S.A. | 452,938 | ||||||
| 2,944 | Total S.A. | 162,647 | ||||||
|
| |||||||
| 1,340,554 | ||||||||
|
| |||||||
| Germany — 3.0% | ||||||||
| 1,408 | Fresenius Medical Care AG & Co. KGaA | 148,294 | ||||||
| 11,944 | K&S AG | 297,440 | ||||||
| 416 | Muenchener Rueckversicherungs-Gesellschaft AG | 90,219 | ||||||
|
| |||||||
| 535,953 | ||||||||
|
| |||||||
| Hong Kong — 5.3% | ||||||||
| 304,000 | HKT Trust & HKT Ltd. | 387,546 | ||||||
| 34,800 | Hong Kong & China Gas Co. Ltd. | 68,238 | ||||||
| 160,000 | PCCW Ltd. | 92,975 | ||||||
| 40,000 | Techtronic Industries Co. Ltd. | 260,852 | ||||||
See accompanying notes to financial statements.
| 14
Portfolio of Investments – as of December 31, 2017
Natixis Seeyond International Minimum Volatility ETF – (continued)
| Shares | Description | Value (†) | ||||||
| Hong Kong — continued | ||||||||
| 32,000 | Yue Yuen Industrial Holdings Ltd. | $ | 125,742 | |||||
|
| |||||||
| 935,353 | ||||||||
|
| |||||||
| Ireland — 0.9% | ||||||||
| 1,568 | DCC PLC | 158,037 | ||||||
|
| |||||||
| Israel — 5.3% | ||||||||
| 2,808 | Azrieli Group Ltd. | 156,796 | ||||||
| 31,392 | Bank Hapoalim BM | 230,863 | ||||||
| 25,120 | Bank Leumi Le-Israel BM | 151,385 | ||||||
| 62,200 | Bezeq The Israeli Telecommunication Corp. Ltd. | 94,024 | ||||||
| 832 | Elbit Systems Ltd. | 111,184 | ||||||
| 10,256 | Mizrahi Tefahot Bank Ltd. | 189,077 | ||||||
|
| |||||||
| 933,329 | ||||||||
|
| |||||||
| Italy — 1.7% | ||||||||
| 3,472 | Luxottica Group SpA | 213,085 | ||||||
| 2,040 | Recordati S.p.A. | 90,711 | ||||||
|
| |||||||
| 303,796 | ||||||||
|
| |||||||
| Japan — 26.5% | ||||||||
| 11,200 | Amada Holdings Co. Ltd. | 152,481 | ||||||
| 4,800 | Aozora Bank Ltd. | 186,803 | ||||||
| 7,200 | Astellas Pharma, Inc. | 91,825 | ||||||
| 88 | Daiwa House REIT Investment Corp. | 209,076 | ||||||
| 4,000 | Eisai Co. Ltd. | 227,770 | ||||||
| 800 | FANUC Corp. | 192,128 | ||||||
| 300 | Fast Retailing Co. Ltd. | 119,574 | ||||||
| 4,800 | Japan Airlines Co. Ltd. | 187,782 | ||||||
| 24 | Japan Prime Realty Investment Corp. | 76,255 | ||||||
| 40 | Japan Real Estate Investment Corp. | 189,927 | ||||||
| 2,400 | Kyocera Corp. | 157,046 | ||||||
| 8,000 | Mitsubishi Tanabe Pharma Corp. | 165,573 | ||||||
| 10,400 | Mitsui & Co. Ltd. | 169,095 | ||||||
| 8,000 | Nagoya Railroad Co. Ltd. | 201,429 | ||||||
| 8,800 | Nikon Corp. | 177,289 | ||||||
| 128 | Nippon Prologis REIT, Inc. | 270,711 | ||||||
| 8,000 | NTT Data Corp. | 95,070 | ||||||
| 3,200 | NTT DOCOMO, Inc. | 75,573 | ||||||
| 24,000 | Obayashi Corp. | 290,535 | ||||||
| 3,200 | Oriental Land Co. Ltd. | 291,671 | ||||||
| 8,000 | Park24 Co. Ltd. | 191,489 | ||||||
| 4,000 | Secom Co. Ltd. | 302,001 | ||||||
| 4,000 | Seibu Holdings, Inc. | 75,651 | ||||||
| 800 | Shimamura Co. Ltd. | 88,041 | ||||||
| 3,200 | Trend Micro, Inc.(a) | 181,478 | ||||||
| 60,800 | Yamada Denki Co. Ltd. | 335,095 | ||||||
|
| |||||||
| 4,701,368 | ||||||||
|
| |||||||
See accompanying notes to financial statements.
15 |
Portfolio of Investments – as of December 31, 2017
Natixis Seeyond International Minimum Volatility ETF – (continued)
| Shares | Description | Value (†) | ||||||
| Luxembourg — 1.1% | ||||||||
| 2,528 | RTL Group S.A.(a) | $ | 203,438 | |||||
|
| |||||||
| Netherlands — 2.0% | ||||||||
| 4,608 | NN Group NV | 199,704 | ||||||
| 4,648 | Royal Dutch Shell PLC, A Shares | 155,632 | ||||||
|
| |||||||
| 355,336 | ||||||||
|
| |||||||
| New Zealand — 3.1% | ||||||||
| 10,120 | Fisher & Paykel Healthcare Corp. Ltd., Class C | 102,919 | ||||||
| 36,336 | Meridian Energy Ltd. | 75,322 | ||||||
| 147,240 | Spark New Zealand Ltd. | 378,787 | ||||||
|
| |||||||
| 557,028 | ||||||||
|
| |||||||
| Singapore — 5.6% | ||||||||
| 142,743 | CapitaLand Mall Trust | 227,330 | ||||||
| 63,200 | SATS Ltd. | 245,721 | ||||||
| 33,600 | Singapore Airlines Ltd. | 268,057 | ||||||
| 45,600 | Singapore Exchange Ltd. | 253,665 | ||||||
|
| |||||||
| 994,773 | ||||||||
|
| |||||||
| Sweden — 0.6% | ||||||||
| 2,880 | Swedish Match AB | 113,471 | ||||||
|
| |||||||
| Switzerland — 14.4% | ||||||||
| 1,928 | Baloise Holding AG, (Registered) | 300,146 | ||||||
| 40 | Chocoladefabriken Lindt & Spruengli AG | 244,240 | ||||||
| 264 | EMS-Chemie Holding AG, (Registered) | 176,235 | ||||||
| 1,096 | Novartis AG, (Registered) | 92,678 | ||||||
| 792 | Partners Group Holding AG | 542,928 | ||||||
| 24 | Sika AG, Series BR | 190,631 | ||||||
| 216 | Straumann Holding AG | 152,615 | ||||||
| 3,488 | Swiss Prime Site AG, (Registered) | 322,151 | ||||||
| 1,200 | Swiss Re AG | 112,371 | ||||||
| 624 | Swisscom AG, (Registered) | 332,027 | ||||||
| 304 | Zurich Insurance Group AG | 92,531 | ||||||
|
| |||||||
| 2,558,553 | ||||||||
|
| |||||||
| United Kingdom — 5.4% | ||||||||
| 6,728 | Carnival PLC | 444,380 | ||||||
| 9,011 | Compass Group PLC | 194,659 | ||||||
| 13,488 | RELX PLC | 316,687 | ||||||
|
| |||||||
| 955,726 | ||||||||
|
| |||||||
Total Common Stocks (Identified Cost $16,187,045) | 17,699,000 | |||||||
|
| |||||||
Total Investments — 99.7% (Identified Cost $16,187,045) | 17,699,000 | |||||||
| Other assets less liabilities — 0.3% | 52,110 | |||||||
|
| |||||||
| Net Assets — 100.0% | $ | 17,751,110 | ||||||
|
| |||||||
| (†) | See Note 2 of Notes to Financial Statements. | |||||||
| (a) | Non-income producing security. | |||||||
See accompanying notes to financial statements.
| 16
Portfolio of Investments – as of December 31, 2017
Natixis Seeyond International Minimum Volatility ETF – (continued)
Industry Summary at December 31, 2017
Diversified Telecommunication Services | 10.4 | % | ||
Insurance | 8.8 | |||
Hotels, Restaurants & Leisure | 5.2 | |||
Capital Markets | 5.1 | |||
Banks | 4.8 | |||
Pharmaceuticals | 4.5 | |||
Aerospace & Defense | 4.5 | |||
Chemicals | 4.3 | |||
Health Care Equipment & Supplies | 3.8 | |||
Specialty Retail | 3.1 | |||
Textiles, Apparel & Luxury Goods | 3.0 | |||
Commercial Services & Supplies | 2.8 | |||
Real Estate Management & Development | 2.7 | |||
Airlines | 2.6 | |||
Construction & Engineering | 2.5 | |||
Household Durables | 2.5 | |||
Media | 2.2 | |||
Machinery | 2.0 | |||
Other Investments, less than 2% each | 24.9 | |||
|
| |||
Total Investments | 99.7 | |||
Other assets less liabilities | 0.3 | |||
|
| |||
Net Assets | 100.0 | % | ||
|
|
Currency Exposure Summary at December 31, 2017
Japanese Yen | 26.5 | % | ||
Euro | 16.0 | |||
Swiss Franc | 14.4 | |||
Canadian Dollar | 8.9 | |||
British Pound | 7.2 | |||
Singapore Dollar | 5.6 | |||
Hong Kong Dollar | 5.3 | |||
Israeli Shekel | 5.3 | |||
Australian Dollar | 3.8 | |||
New Zealand Dollar | 3.1 | |||
Danish Krone | 3.0 | |||
Swedish Krona | 0.6 | |||
|
| |||
Total Investments | 99.7 | |||
Other assets less liabilities | 0.3 | |||
|
| |||
Net Assets | 100.0 | % | ||
|
|
See accompanying notes to financial statements.
17 |
Statements of Assets and Liabilities
December 31, 2017
| Natixis Loomis Sayles Short Duration Income ETF | Natixis Seeyond International Minimum Volatility ETF | |||||||
ASSETS | ||||||||
Investments at cost | $ | 19,111,975 | $ | 16,187,045 | ||||
Net unrealized appreciation | 5,080 | 1,511,955 | ||||||
|
|
|
| |||||
Investments at value | 19,117,055 | 17,699,000 | ||||||
Cash | — | 33,148 | ||||||
Foreign currency at value (identified cost $0 and $61,183, respectively) | — | 62,519 | ||||||
Receivable for Fund shares sold | 17,508,762 | — | ||||||
Receivable from investment adviser (Note 5) | 23,180 | 13,937 | ||||||
Dividends and interest receivable | 30,099 | 17,494 | ||||||
Tax reclaims receivable | — | 13,651 | ||||||
|
|
|
| |||||
TOTAL ASSETS | 36,679,096 | 17,839,749 | ||||||
|
|
|
| |||||
LIABILITIES | ||||||||
Payable for securities purchased | 16,639,576 | — | ||||||
Deferred Trustees’ fees (Note 5) | 3 | 5,824 | ||||||
Administrative fees payable (Note 5) | 76 | 689 | ||||||
Other accounts payable and accrued expenses | 23,752 | 82,126 | ||||||
|
|
|
| |||||
TOTAL LIABILITIES | 16,663,407 | 88,639 | ||||||
|
|
|
| |||||
NET ASSETS | $ | 20,015,689 | $ | 17,751,110 | ||||
|
|
|
| |||||
NET ASSETS CONSIST OF: | ||||||||
Paid-in capital | $ | 20,010,609 | $ | 16,258,542 | ||||
Distributions in excess of net investment income | — | (25,461 | ) | |||||
Accumulated net realized gain on investments and foreign currency transactions | — | 4,171 | ||||||
Net unrealized appreciation on investments and foreign currency translations | 5,080 | 1,513,858 | ||||||
|
|
|
| |||||
NET ASSETS | $ | 20,015,689 | $ | 17,751,110 | ||||
|
|
|
| |||||
COMPUTATION OF NET ASSET VALUE AND OFFERING PRICE: | ||||||||
Net assets | $ | 20,015,689 | $ | 17,751,110 | ||||
|
|
|
| |||||
Shares of beneficial interest | 800,000 | 400,000 | ||||||
|
|
|
| |||||
Net asset value, offering and redemption price per share | $ | 25.02 | $ | 44.38 | ||||
|
|
|
| |||||
See accompanying notes to financial statements.
| 18
Statements of Operations
For the Year Ended December 31, 2017
| Natixis Loomis Sayles Short Duration Income ETF(a) | Natixis Seeyond International Minimum Volatility ETF | |||||||
INVESTMENT INCOME | ||||||||
Interest | $ | 498 | $ | 567 | ||||
Dividends | — | 434,211 | ||||||
Less net foreign taxes withheld | — | (44,012 | ) | |||||
|
|
|
| |||||
| 498 | 390,766 | |||||||
|
|
|
| |||||
Expenses | ||||||||
Management fees (Note 5) | 514 | 77,707 | ||||||
Administrative fees (Note 5) | 76 | 6,920 | ||||||
Trustees’ fees and expenses (Note 5) | 6 | 15,697 | ||||||
Audit and tax services fees | 15,753 | 41,158 | ||||||
Custodian fees and expenses | 3,705 | 75,868 | ||||||
Legal fees | 38 | 12,042 | ||||||
Registration fees | 2,318 | 256 | ||||||
Shareholder reporting expenses | 376 | 20,449 | ||||||
Miscellaneous expenses | 1,559 | 23,407 | ||||||
|
|
|
| |||||
Total expenses | 24,345 | 273,504 | ||||||
Less waiver and/or expense reimbursement (Note 5) | (23,694 | ) | (187,527 | ) | ||||
|
|
|
| |||||
Net expenses | 651 | 85,977 | ||||||
|
|
|
| |||||
Net investment income (loss) | (153 | ) | 304,789 | |||||
|
|
|
| |||||
NET REALIZED AND UNREALIZED GAIN ON INVESTMENTS AND FOREIGN CURRENCY TRANSACTIONS | ||||||||
Net realized gain on: | ||||||||
Investments | — | 815,792 | ||||||
Foreign currency transactions (Note 2c) | — | 1,699 | ||||||
Net change in unrealized appreciation (depreciation) on: | ||||||||
Investments | 5,080 | 1,908,820 | ||||||
Foreign currency translations (Note 2c) | — | 2,075 | ||||||
|
|
|
| |||||
Net realized and unrealized gain on investments and foreign currency transactions | 5,080 | 2,728,386 | ||||||
|
|
|
| |||||
NET INCREASE IN NET ASSETS RESULTING FROM OPERATIONS | $ | 4,927 | $ | 3,033,175 | ||||
|
|
|
| |||||
| (a) | From commencement of operations on December 27, 2017 through December 31, 2017. |
See accompanying notes to financial statements.
19 |
Statements of Changes in Net Assets
| Natixis Loomis Sayles Short Duration Income ETF | ||||
| Period Ended December 31, 2017(a) | ||||
FROM OPERATIONS: | ||||
Net investment income (loss) | $ | (153 | ) | |
Net realized gain on investments | — | |||
Net change in unrealized appreciation (depreciation) on investments | 5,080 | |||
|
| |||
Net increase in net assets resulting from operations | 4,927 | |||
|
| |||
NET INCREASE IN NET ASSETS FROM CAPITAL SHARE TRANSACTIONS (NOTE 7) | 20,010,762 | |||
|
| |||
Net increase in net assets | 20,015,689 | |||
NET ASSETS | ||||
Beginning of the year | — | |||
|
| |||
End of the year | $ | 20,015,689 | ||
|
| |||
ACCUMULATED NET INVESTMENT LOSS/UNDISTRIBUTED NET INVESTMENT INCOME | $ | — | ||
|
| |||
| (a) | From commencement of operations on December 27, 2017 through December 31, 2017. |
See accompanying notes to financial statements.
| 20
Statements of Changes in Net Assets (continued)
| Natixis Seeyond International Minimum Volatility ETF | ||||||||
| Year Ended December 31, 2017 | Period Ended December 31, 2016(a) | |||||||
FROM OPERATIONS: | ||||||||
Net investment income | $ | 304,789 | $ | 36,979 | ||||
Net realized gain (loss) on investments and foreign currency transactions | 817,491 | (102,688 | ) | |||||
Net change in unrealized appreciation (depreciation) on investments and foreign currency translations | 1,910,895 | (397,037 | ) | |||||
|
|
|
| |||||
Net increase (decrease) in net assets resulting from operations | 3,033,175 | (462,746 | ) | |||||
|
|
|
| |||||
FROM DISTRIBUTIONS TO SHAREHOLDERS: | ||||||||
Net investment income | (337,960 | ) | (40,950 | ) | ||||
Net realized capital gains | (702,760 | ) | — | |||||
|
|
|
| |||||
Total distributions | (1,040,720 | ) | (40,950 | ) | ||||
|
|
|
| |||||
NET INCREASE IN NET ASSETS FROM CAPITAL SHARE TRANSACTIONS (NOTE 7) | 2,294,815 | 13,867,536 | ||||||
|
|
|
| |||||
Net increase in net assets | 4,287,270 | 13,363,840 | ||||||
NET ASSETS | ||||||||
Beginning of the year | 13,463,840 | 100,000 | ||||||
|
|
|
| |||||
End of the year | $ | 17,751,110 | $ | 13,463,840 | ||||
|
|
|
| |||||
DISTRIBUTIONS IN EXCESS OF NET INVESTMENT INCOME | $ | (25,461 | ) | $ | (3,314 | ) | ||
|
|
|
| |||||
| (a) | From commencement of operations on October 25, 2016 through December 31, 2016. |
See accompanying notes to financial statements.
21 |
Financial Highlights
For a share outstanding throughout each period.
| Natixis Loomis Sayles Short Duration Income ETF | ||||
| Period Ended December 31, 2017* | ||||
Net asset value, beginning of the period | $ | 25.00 | ||
|
| |||
INCOME (LOSS) FROM INVESTMENT OPERATIONS: | ||||
Net investment loss(a) | (0.00 | )(b) | ||
Net realized and unrealized gain (loss) | 0.02 | |||
|
| |||
Total from Investment Operations | 0.02 | |||
|
| |||
Net asset value, end of the period | $ | 25.02 | ||
|
| |||
Total return(c) | 0.08 | % | ||
RATIOS TO AVERAGE NET ASSETS: | ||||
Net assets, end of the period (000’s) | $ | 20,016 | ||
Net expenses(d)(e) | 0.38 | % | ||
Gross expenses(d) | 14.21 | % | ||
Net investment loss(d) | (0.09 | )% | ||
Portfolio turnover rate(f) | 0 | % | ||
| * | From commencement of operations on December 27, 2017 through December 31, 2017. |
| (a) | Per share net investment loss has been calculated using the average shares outstanding during the period. |
| (b) | Amount rounds to less than $0.01. |
| (c) | Total return is calculated assuming a purchase of shares at net asset value on the first day and a sale at net asset value on the last day of each period reported. Had certain expenses not been waived/reimbursed during the period, total returns would have been lower. Periods less than one year are not annualized. |
| (d) | Computed on an annualized basis for periods less than one year. |
| (e) | The investment adviser agreed to waive its fees and/or reimburse a portion of the Fund’s expenses during the period. Without this waiver/reimbursement, expenses would have been higher. |
| (f) | Portfolio turnover rate excludes securities received or delivered from in-kind processing of creations or redemptions. |
See accompanying notes to financial statements.
| 22
Financial Highlights (continued)
For a share outstanding throughout each period.
| Natixis Seeyond International Minimum Volatility ETF | ||||||||
| Year Ended December 31, 2017 | Period Ended December 31, 2016* | |||||||
Net asset value, beginning of the period | $ | 38.47 | $ | 39.91 | ||||
|
|
|
| |||||
INCOME (LOSS) FROM INVESTMENT OPERATIONS: | ||||||||
Net investment income(a) | 0.85 | 0.11 | ||||||
Net realized and unrealized gain (loss) | 7.66 | (1.43 | ) | |||||
|
|
|
| |||||
Total from Investment Operations | 8.51 | (1.32 | ) | |||||
|
|
|
| |||||
LESS DISTRIBUTIONS FROM: | ||||||||
Net investment income | (0.84 | ) | (0.12 | ) | ||||
Net realized capital gains | (1.76 | ) | — | |||||
|
|
|
| |||||
Total Distributions | (2.60 | ) | (0.12 | ) | ||||
|
|
|
| |||||
Net asset value, end of the period | $ | 44.38 | $ | 38.47 | ||||
|
|
|
| |||||
Total return(b) | 22.17 | % | (3.31 | )%(c) | ||||
RATIOS TO AVERAGE NET ASSETS: | ||||||||
Net assets, end of the period (000’s) | $ | 17,751 | $ | 13,464 | ||||
Net expenses(d) | 0.55 | % | 0.55 | %(e) | ||||
Gross expenses | 1.76 | % | 2.61 | %(e) | ||||
Net investment income | 1.96 | % | 1.49 | %(e) | ||||
Portfolio turnover rate(f) | 93 | % | 20 | % | ||||
| * | From commencement of operations on October 25, 2016 through December 31, 2016. |
| (a) | Per share net investment income has been calculated using the average shares outstanding during the period. |
| (b) | Total return is calculated assuming a purchase of shares at net asset value on the first day and a sale at net asset value on the last day of each period reported. Had certain expenses not been waived/ reimbursed during the period, total returns would have been lower. |
| (c) | Periods less than one year are not annualized. |
| (d) | The investment adviser agreed to waive its fees and/or reimburse a portion of the Fund’s expenses during the period. Without this waiver/reimbursement, expenses would have been higher. |
| (e) | Computed on an annualized basis for periods less than one year. |
| (f) | Portfolio turnover rate excludes securities received or delivered from in-kind processing of creations or redemptions. |
See accompanying notes to financial statements.
23 |
December 31, 2017
1. Organization. Natixis ETF Trust (the “Trust”) is organized as a Massachusetts business trust. The Trust is registered under the Investment Company Act of 1940, as amended (the “1940 Act”), as an open-end management investment company. The Declaration of Trust permits the Board of Trustees to authorize the issuance of an unlimited number of shares of beneficial interest of the Funds. Shares of the Funds are listed for trading on the NYSE Arca, Inc. (the “NYSE Arca”) and traded on other exchanges. The following Funds (individually, a “Fund” and collectively, the “Funds”) are included in this report:
Natixis Loomis Sayles Short Duration Income ETF (the “Short Duration Income ETF”)
Natixis Seeyond International Minimum Volatility ETF (the “International Minimum Volatility ETF”)
Each Fund is a diversified investment company.
Short Duration Income ETF commenced operations on December 27, 2017 via a cash contribution to the Fund by an Authorized Participant of $2,500,000 in exchange for 100,000 shares of the Fund. On December 28, 2017 the Authorized Participant created an additional 700,000 shares of the Fund in exchange for $17,508,762, comprised of an in-kind contribution of securities of $16,639,576 (including interest) and a cash contribution of $869,186. Natixis Investment Managers, L.P. (“Natixis”) subsequently purchased 799,300 shares of the Fund on the secondary market.
The Funds issue and redeem shares on a continuous basis through ALPS Distributors, Inc. (“ALPS”). Each Fund may pay ALPS, an unaffiliated distributor, fees under a plan adopted pursuant to Rule 12b-1 under the 1940 Act (the “12b-1 Plan”). Currently, no Rule 12b-1 fees are charged. Future payments may be made under the Plan without further shareholder approval.
Most expenses can be directly attributed to a Fund. Expenses which cannot be directly attributed to a Fund are generally apportioned based on the relative net assets of each of the funds in Natixis Funds Trust I, Natixis Funds Trust II, Natixis Funds Trust IV and Gateway Trust (“Natixis Funds Trusts”), Loomis Sayles Funds I and Loomis Sayles Funds II (“Loomis Sayles Funds Trusts”) and Natixis ETF Trust.
2. Significant Accounting Policies. The following is a summary of significant accounting policies consistently followed by each Fund in the preparation of its financial statements. The Funds’ financial statements follow the accounting and reporting guidelines provided for investment companies and are prepared in accordance with accounting principles generally accepted in the United States of America which require the use of management estimates that affect the reported amounts and disclosures in the financial statements. Actual results could differ from those estimates. Management has evaluated the events and transactions subsequent to year-end through the date the financial statements were issued and has determined that there were no material events that would require disclosure in the Funds’ financial statements.
| 24
Notes to Financial Statements (continued)
December 31, 2017
a. Valuation. Fund securities and other investments are valued at market value based on market quotations obtained or determined by independent pricing services recommended by the adviser or subadviser and approved by the Board of Trustees. Fund securities and other investments for which market quotations are not readily available are valued at fair value as determined in good faith by the adviser or subadviser pursuant to procedures approved by the Board of Trustees, as described below. Market value is determined as follows:
Listed equity securities (including shares of closed-end investment companies and exchange-traded funds) are valued at the last sale price quoted on the exchange where they are traded most extensively or, if there is no reported sale during the day, the closing bid quotation as reported by an independent pricing service. Unlisted equity securities (except unlisted preferred equity securities) are valued at the last sale price quoted in the market where they are traded most extensively or, if there is no reported sale during the day, the closing bid quotation as reported by an independent pricing service. If there is no last sale price or closing bid quotation available, unlisted equity securities will be valued using evaluated bids furnished by an independent pricing service, if available. In some foreign markets, an official close price and a last sale price may be available from the foreign exchange or market. In those cases, the official close price is used. Debt securities and unlisted preferred equity securities are valued based on evaluated bids furnished to the Funds by an independent pricing service or bid prices obtained from broker-dealers. Broker-dealer bid prices may be used to value debt and unlisted equity securities where an independent pricing service is unable to price a security or where an independent pricing service does not provide a reliable price for the security.
Fund securities and other investments for which market quotations are not readily available are valued at fair value as determined in good faith by the adviser pursuant to procedures approved by the Board of Trustees. The Funds may also value securities and other investments at fair value in other circumstances such as when extraordinary events occur after the close of a foreign market but prior to the close of the New York Stock Exchange (“NYSE”). This may include situations relating to a single issuer (such as a declaration of bankruptcy or a delisting of the issuer’s security from the primary market on which it has traded) as well as events affecting the securities markets in general (such as market disruptions or closings and significant fluctuations in U.S. and/or foreign markets). Fair value pricing may require subjective determinations about the value of a security, and fair values used to determine a Fund’s net asset value (“NAV”) may differ from quoted or published prices, or from prices that are used by others, for the same securities. In addition, the use of fair value pricing may not always result in adjustments to the prices of securities held by a Fund.
b. Investment Transactions and Related Investment Income. Investment transactions are accounted for on a trade date plus one day basis for daily NAV calculation. However, for financial reporting purposes, investment transactions are reported on
25 |
Notes to Financial Statements (continued)
December 31, 2017
trade date. Dividend income is recorded on ex-dividend date, or in the case of certain foreign securities, as soon as a Fund is notified, and interest income is recorded on an accrual basis. Interest income is increased by the accretion of discount and decreased by the amortization of premium, if applicable. Distributions received from investments in securities that represent a return of capital or capital gain are recorded as a reduction of cost of investments or as a realized gain, respectively. In determining net gain or loss on securities sold, the cost of securities has been determined on an identified cost basis.
c. Foreign Currency Translation. The books and records of the Funds are maintained in U.S. dollars. The values of securities, currencies and other assets and liabilities denominated in currencies other than U.S. dollars are translated into U.S. dollars based upon foreign exchange rates prevailing at the end of the period. Purchases and sales of investment securities, income and expenses are translated into U.S. dollars on the respective dates of such transactions.
Net realized foreign exchange gains or losses arise from sales of foreign currency, changes in exchange rates between the trade and settlement dates on securities transactions and the difference between the amounts of dividends, interest and foreign withholding taxes recorded on the Funds’ books and the U.S. dollar equivalent of the amounts actually received or paid. Net unrealized foreign exchange gains or losses arise from changes in the value of assets and liabilities, other than investment securities, as of the end of the fiscal period, resulting from changes in exchange rates. Net realized foreign exchange gains or losses and the net change in unrealized foreign exchange gains or losses are disclosed in the Statements of Operations. For federal income tax purposes, net realized foreign exchange gains or losses are characterized as ordinary income and may, if the Funds have net losses, reduce the amount of income available to be distributed by the Funds.
The values of investment securities are presented at the foreign exchange rates prevailing at the end of the period for financial reporting purposes. Net realized and unrealized gains or losses on investments reported in the Statements of Operations reflect gains or losses resulting from changes in exchange rates and fluctuations which arise due to changes in market prices of investment securities.
The Funds may use foreign currency exchange contracts to facilitate transactions in foreign-denominated investments. Losses may arise from changes in the value of the foreign currency or if the counterparties do not perform under the contracts’ terms.
d. Federal and Foreign Income Taxes. The Trust treats each Fund as a separate entity for federal income tax purposes. Each Fund intends to meet the requirements of the Internal Revenue Code of 1986, as amended, applicable to regulated investment companies, and to distribute to its shareholders substantially all of its net investment income and any net realized capital gains at least annually. Management has performed an analysis of each Fund’s tax positions for the open tax years (period for
| 26
Notes to Financial Statements (continued)
December 31, 2017
Short Duration Income ETF) as of December 31, 2017 and has concluded that no provisions for income tax are required. The International Minimum Volatility ETF federal tax return for the prior fiscal period remains subject to examination by the Internal Revenue Service. Management is not aware of any events that are reasonably possible to occur in the next twelve months that would result in the amounts of any unrecognized tax benefits significantly increasing or decreasing for the Funds. However, management’s conclusions regarding tax positions taken may be subject to review and adjustment at a later date based on factors including, but not limited to, new tax laws and accounting regulations and interpretations thereof.
A Fund may be subject to foreign withholding taxes on investment income and taxes on capital gains on investments that are accrued and paid based upon the Fund’s understanding of the tax rules and regulations that exist in the countries in which the Fund invests. Foreign withholding taxes on dividend and interest income are reflected on the Statements of Operations as a reduction of investment income, net of amounts eligible to be reclaimed. Dividends and interest receivable on the Statements of Assets and Liabilities are net of foreign withholding taxes. Foreign withholding taxes where reclaims have been or will be filed are reflected on the Statements of Assets and Liabilities as tax reclaims receivable. Capital gains taxes paid are included in net realized gain (loss) on investments in the Statements of Operations. Accrued but unpaid capital gains taxes are reflected as foreign taxes payable on the Statements of Assets and Liabilities, if applicable, and reduce unrealized gains on investments. In the event that realized gains on investments are subsequently offset by realized losses, taxes paid on realized gains may be returned to a Fund. Such amounts, if applicable, are reflected as foreign tax rebates receivable on the Statements of Assets and Liabilities and are recorded as a realized gain when received.
e. Dividends and Distributions to Shareholders. Dividends and distributions are recorded on ex-dividend date. The timing and characterization of certain income and capital gain distributions are determined in accordance with federal tax regulations, which may differ from accounting principles generally accepted in the United States of America. Permanent differences are primarily due to differing treatments for book and tax purposes of items such as foreign currency gains and losses, net operating losses and passive foreign investment company adjustments. Permanent book and tax basis differences relating to shareholder distributions, net investment income and net realized gains will result in reclassifications to capital accounts reported on the Statements of Assets and Liabilities. Temporary differences between book and tax distributable earnings are primarily due to deferred Trustees’ fees, wash sales, partnership basis adjustments and passive foreign investment company adjustments. Amounts of income and capital gain available to be distributed on a tax basis are determined annually, and at other times during the Funds’ fiscal year as may be necessary to avoid knowingly declaring and paying a return of capital distribution. Distributions from net investment income and short-term capital gains are considered to be distributed from ordinary income for tax purposes.
27 |
Notes to Financial Statements (continued)
December 31, 2017
The tax characterization of distributions is determined on an annual basis. The tax character of distributions paid to shareholders during the year ended (period ended for Short Duration Income ETF) and period ended December 31, 2017 and 2016, respectively, were as follows:
| 2017 Distributions Paid From: | 2016 Distributions Paid From: | |||||||||||||||||||||||
Fund | Ordinary | Long-Term | Total | Ordinary | Long-Term | Total | ||||||||||||||||||
Short Duration Income ETF | $ | — | $ | — | $ | — | $ | — | $ | — | $ | — | ||||||||||||
International Minimum Volatility ETF | 789,280 | 251,440 | 1,040,720 | 40,950 | — | 40,950 | ||||||||||||||||||
Differences between these amounts and those reported in the Statements of Changes in Net Assets are primarily attributable to different book and tax treatment for short-term capital gains.
As of December 31, 2017, the components of distributable earnings on a tax basis were as follows:
Short | International | |||||||
Undistributed ordinary income | $ | — | $ | 32,007 | ||||
Undistributed long-term capital gains | — | 826 | ||||||
|
|
|
| |||||
Total undistributed earnings | — | 32,833 | ||||||
Unrealized appreciation | 5,080 | 1,465,559 | ||||||
|
|
|
| |||||
Total accumulated earnings | $ | 5,080 | $ | 1,498,392 | ||||
|
|
|
| |||||
Capital loss carryforward utilized in the current year | $ | — | $ | 92,161 | ||||
|
|
|
| |||||
As of December 31, 2017, the cost of investments and unrealized appreciation (depreciation) on a federal tax basis were as follows:
Short | International | |||||||
Federal tax cost | $ | 19,111,975 | $ | 16,235,344 | ||||
|
|
|
| |||||
Gross tax appreciation | 5,080 | 1,604,947 | ||||||
Gross tax depreciation | — | (141,291 | ) | |||||
|
|
|
| |||||
Net tax appreciation | $ | 5,080 | $ | 1,463,656 | ||||
|
|
|
| |||||
Differences between these amounts and those reported in the components of distributable earnings are primarily attributable to foreign currency mark-to-market.
| 28
Notes to Financial Statements (continued)
December 31, 2017
f. Repurchase Agreements. The Funds may enter into repurchase agreements, under the terms of a Master Repurchase Agreement, under which each Fund acquires securities as collateral and agrees to resell the securities at an agreed upon time and at an agreed upon price. It is each Fund’s policy that the market value of the collateral for repurchase agreements be at least equal to 102% of the repurchase price, including interest. Certain repurchase agreements are tri-party arrangements whereby the collateral is held in a segregated account for the benefit of the Fund and on behalf of the counterparty. Repurchase agreements could involve certain risks in the event of default or insolvency of the counterparty including possible delays or restrictions upon the Fund’s ability to dispose of the underlying securities. As of December 31, 2017, Short Duration Income ETF had an investment in a repurchase agreement for which the value of the related collateral exceeded the value of the repurchase agreement. The gross value of repurchase agreements is included in the Statement of Assets and Liabilities for financial reporting purposes.
g. Indemnifications. Under the Trust’s organizational documents, its officers and Trustees are indemnified against certain liabilities arising out of the performance of their duties to the Funds. Additionally, in the normal course of business, the Funds enter into contracts with service providers that contain general indemnification clauses. The Funds’ maximum exposure under these arrangements is unknown as this would involve future claims that may be made against the Funds that have not yet occurred. However, based on experience, the Funds expect the risk of loss to be remote.
3. Fair Value Measurements. In accordance with accounting standards related to fair value measurements and disclosures, the Funds have categorized the inputs utilized in determining the value of each Fund’s assets or liabilities. These inputs are summarized in the three broad levels listed below:
| • | Level 1 – quoted prices in active markets for identical assets or liabilities; |
| • | Level 2 – prices determined using other significant inputs that are observable either directly, or indirectly through corroboration with observable market data (which could include quoted prices for similar assets or liabilities, interest rates, credit risk, etc.); and |
| • | Level 3 – prices determined using significant unobservable inputs when quoted prices or observable inputs are unavailable such as when there is little or no market activity for an asset or liability (unobservable inputs reflect the Fund’s own assumptions in determining the fair value of assets or liabilities and would be based on the best information available). |
The inputs or methodology used for valuing securities are not necessarily an indication of the risk associated with investing in those securities.
29 |
Notes to Financial Statements (continued)
December 31, 2017
The following is a summary of the inputs used to value the Funds’ investments as of December 31, 2017, at value:
Short Duration Income ETF
Asset Valuation Inputs
Description | Level 1 | Level 2 | Level 3 | Total | ||||||||||||
Bonds and Notes(a) | $ | $ | 18,992,400 | $ | $ | 18,992,400 | ||||||||||
Short-Term Investments | — | 124,655 | — | 124,655 | ||||||||||||
|
|
|
|
|
|
|
| |||||||||
Total | $ | — | $ | 19,117,055 | $ | — | $ | 19,117,055 | ||||||||
|
|
|
|
|
|
|
| |||||||||
| (a) | Details of the major categories of the Fund’s investments are reflected within the Portfolio of Investments. |
For the period ended December 31, 2017, there were no transfers among Levels 1, 2 and 3.
International Minimum Volatility ETF
Asset Valuation Inputs
Description | Level 1 | Level 2 | Level 3 | Total | ||||||||||||
Common Stocks(a) | $ | 17,699,000 | $ | — | $ | — | $ | 17,699,000 | ||||||||
|
|
|
|
|
|
|
| |||||||||
| (a) | Details of the major categories of the Fund’s investments are reflected within the Portfolio of Investments. |
For the year ended December 31, 2017, there were no transfers among Levels 1, 2 and 3.
4. Purchases and Sales of Securities. For the year ended (period ended for Short Duration Income ETF) December 31, 2017, purchases and sales of securities (excluding in-kind transactions, short-term investments and U.S. Government/Agency securities and including paydowns) were as follows:
Fund | Purchases | Sales | ||||||
International Minimum Volatility ETF | $ | 14,185,843 | $ | 14,879,563 | ||||
For the year ended (period ended for Short Duration Income ETF) December 31, 2017, in-kind transactions were as follows:
Fund | In-Kind | |||
Short Duration Income ETF | $ | 16,613,144 | ||
International Minimum Volatility ETF | 2,244,051 | |||
For the period ended December 31, 2017, purchases and sales of U.S. Government/Agency securities by the Short Duration Income ETF were $2,374,143 and $0, respectively.
| 30
Notes to Financial Statements (continued)
December 31, 2017
5. Management Fees and Other Transactions with Affiliates.
a. Management Fees. Natixis Advisors, L.P. (“Natixis Advisors”) serves as investment adviser to each Fund. Natixis Advisors is a wholly-owned subsidiary of Natixis, which is part of Natixis Investment Managers an international asset management group based in Paris, France. Under the terms of the management agreements, each Fund pays a management fee at the following annual rates, calculated daily and payable monthly, based on each Fund’s average daily net assets:
Fund | Percentage of | |||
Short Duration Income ETF | 0.30 | % | ||
International Minimum Volatility ETF | 0.50 | % | ||
Natixis Advisors has entered into subadvisory agreements for each Fund as listed below.
Short Duration Income ETF | Loomis Sayles & Company, L.P. (“Loomis Sayles”) | |
International Minimum Volatility ETF | Natixis Asset Management U.S., LLC (“Natixis AM US”) |
Natixis AM US is a subsidiary of Natixis Asset Management, which is in turn a subsidiary of Natixis Investment Managers.
Under the terms of the subadvisory agreements, each Fund has agreed to pay its respective subadviser a subadvisory fee at the following annual rates, calculated daily and payable monthly, based on each Fund’s average daily net assets:
Fund | Subadviser | Percentage of | ||||||
Short Duration Income ETF | Loomis Sayles | 0.15 | % | |||||
International Minimum Volatility ETF | Natixis AM US | 0.30 | % | |||||
Payments to Natixis Advisors are reduced by the amount of payments to the subadvisers, as calculated based on above.
Natixis Advisors has given a binding undertaking to the Funds to waive management fees and/or reimburse certain expenses to limit the Funds’ operating expenses, exclusive of acquired fund fees and expenses, brokerage expenses, interest expense, taxes, organizational and extraordinary expenses such as litigation and indemnification expenses. This undertaking is in effect until April 30, 2019 for Short Duration Income ETF and April 30, 2018 for International Minimum Volatility ETF, may be terminated before then only with the consent of the Funds’ Board of Trustees, and is reevaluated
31 |
Notes to Financial Statements (continued)
December 31, 2017
on an annual basis. Management fees payable, as reflected on the Statements of Assets and Liabilities, is net of waivers and/or expense reimbursements, if any, pursuant to these undertakings. Waivers/reimbursements that exceed management fees payable are reflected on the Statements of Assets and Liabilities as receivable from investment adviser.
For the year ended December 31, 2017 (period ended for Short Duration Income ETF), the expense limits as a percentage of average daily net assets under the expense limitation agreements were as follows:
Fund | Expense Limit | |||
Short Duration Income ETF | 0.38 | % | ||
International Minimum Volatility ETF | 0.55 | % | ||
Natixis Advisors shall be permitted to recover expenses it has borne under the expense limitation agreements (whether through waiver of its management fees or otherwise) in later periods to the extent the annual operating expenses of a Fund fall below a Fund’s expense limits, provided, however, that a Fund is not obligated to pay such waived/reimbursed fees or expenses more than one year after the end of the fiscal year in which the fees or expenses were waived/reimbursed.
For the year ended (period ended for Short Duration Income ETF) December 31, 2017, the management fees and waiver of management fees for each Fund were as follows:
Gross | Contractual | Net | Percentage | |||||||||||||||||
Fund | Fees | Fees1 | Fees1 | Gross | Net | |||||||||||||||
Short Duration Income ETF | $ | 514 | $ | 514 | $ | — | 0.30 | % | — | % | ||||||||||
International Minimum Volatility ETF | 77,707 | 77,707 | — | 0.50 | % | — | % | |||||||||||||
| 1 | Management fee waiver is subject to possible recovery until December 31, 2018. |
For the year ended (period ended for Short Duration Income ETF) December 31, 2017, expenses have been reimbursed as follows:
Fund | Reimbursements2 | |||
Short Duration Income ETF | $ | 23,180 | ||
International Minimum Volatility ETF | 109,820 | |||
| 2 | Expense reimbursement is subject to possible recovery until December 31, 2018. |
| 32
Notes to Financial Statements (continued)
December 31, 2017
No expenses were recovered during the year ended (period ended for Short Duration Income ETF) December 31, 2017 under the terms of the expense limitation agreement.
b. Administrative Fees. Natixis Advisors provides certain administrative services for the Funds and subcontracts with State Street Bank and Trust Company to serve as sub-administrator. Pursuant to an agreement among Natixis Funds Trusts, Loomis Sayles Funds Trusts, Natixis ETF Trust and Natixis Advisors, the Funds pay Natixis Advisors monthly its pro rata portion of fees equal to an annual rate of 0.0575% of the first $15 billion of the average daily net assets of the Natixis Funds Trusts, Loomis Sayles Funds Trusts and Natixis ETF Trust 0.0500% of the next $15 billion, 0.0400% of the next $30 billion, 0.0350% of the next $30 billion and 0.0325% of such assets in excess of $90 billion, subject to an annual aggregate minimum fee for the Natixis Funds Trusts, Loomis Sayles Funds Trusts and Natixis ETF Trust of $10 million, which is reevaluated on an annual basis.
For the year ended (period ended for Short Duration Income Fund) December 31, 2017, the administrative fees for each Fund were as follows:
Fund | Administrative | |||
Short Duration Income ETF | $ | 76 | ||
International Minimum Volatility ETF | 6,920 | |||
c. Trustees Fees and Expenses. The Trust does not pay any compensation directly to its officers or Trustees who are directors, officers or employees of Natixis Advisors, Natixis Distribution, Natixis or their affiliates. The Chairperson of the Board of Trustees receives a retainer fee at the annual rate of $325,000. The Chairperson does not receive any meeting attendance fees for Board of Trustees meetings or committee meetings that he attends. Each Independent Trustee (other than the Chairperson) receives, in the aggregate, a retainer fee at the annual rate of $155,000. Each Independent Trustee also receives a meeting attendance fee of $10,000 for each meeting of the Board of Trustees that he or she attends in person and $5,000 for each meeting of the Board of Trustees that he or she attends telephonically. In addition, the chairperson of the Contract Review Committee and the chairperson of the Audit Committee each receive an additional retainer fee at the annual rate of $17,500. The chairperson of the Governance Committee receives an additional retainer fee at the annual rate of $10,000. Each Contract Review Committee member is compensated $6,000 for each Committee meeting that he or she attends in person and $3,000 for each meeting that he or she attends telephonically. Each Audit Committee member is compensated $6,000 for each Committee meeting that he or she attends in person and $3,000 for each meeting that he or she attends telephonically. These fees are allocated among the funds in the Natixis Funds Trusts, Loomis Sayles Funds Trusts and Natixis ETF Trust based on a formula that takes into account, among other factors, the relative net assets of each fund. Trustees are reimbursed for travel expenses in connection with attendance at meetings.
33 |
Notes to Financial Statements (continued)
December 31, 2017
Effective January 1, 2018, the Chairperson of the Board will receive a retainer fee at the annual rate of $340,000, each Independent Trustee (other than the Chairperson) will receive, in the aggregate, a retainer fee at the annual rate of $170,000, the chairperson of the Contract Review Committee and Audit Committee each will receive an additional retainer fee at the annual rate of $20,000 and the chairperson of the Governance Committee will receive an additional retainer fee at the annual rate of $12,000. All other Trustee fees will remain unchanged.
A deferred compensation plan (the “Plan”) is available to the Trustees on a voluntary basis. Deferred amounts remain in the Funds until distributed in accordance with the provisions of the Plan. The value of a participating Trustee’s deferral account is based on theoretical investments of deferred amounts, on the normal payment dates, in certain funds of the Natixis Funds Trusts, Loomis Sayles Funds Trusts and Natixis ETF Trust as designated by the participating Trustees. Changes in the value of participants’ deferral accounts are allocated pro rata among the funds in the Natixis Funds Trusts, Loomis Sayles Funds Trusts and Natixis ETF Trust are normally reflected as Trustees’ fees and expenses in the Statements of Operations. The portions of the accrued obligations allocated to the Funds under the Plan are reflected as Deferred Trustees’ fees in the Statements of Assets and Liabilities.
d. Affiliated Ownership. As of December 31, 2017, Natixis held shares of Short Duration Income ETF and International Minimum Volatility ETF representing 99.71% and 66.78%, respectively, of the Funds’ net assets. Investment activities of affiliated shareholders could have material impacts on the Funds.
6. Risk. The Funds have exposure to certain types of risk as summarized below.
a. Authorized Participant Concentration Risk. Only an authorized participant (“Authorized Participant”) may engage in creation or redemption transactions directly with the Funds. The Funds have a limited number of institutions that act as Authorized Participants, none of which are or will be obligated to engage in creation or redemption transactions. To the extent that these institutions exit the business or are unable to proceed with creation and/or redemption orders with respect to the Funds and no other Authorized Participant is able to step forward to create or redeem Creation Units, Fund shares may trade at a discount to NAV and possibly face trading halts and/or delisting.
b. Foreign Securities Risk. Investments in foreign securities may be subject to greater political, economic, environmental, credit and information risks. The Funds’ investments in foreign securities also are subject to foreign currency fluctuations and other foreign currency-related risks. Foreign securities may be subject to higher volatility than U.S. securities, varying degrees of regulation and limited liquidity. Foreign securities held by the Funds may trade on foreign exchanges that are closed when the securities exchange on which the Funds’ shares trade is open, which may result in deviations between the current price of a foreign security and the last quoted price for
| 34
Notes to Financial Statements (continued)
December 31, 2017
that security (i.e., the Funds’ quote from the closed foreign market). This could result in premiums or discounts to NAV that may be greater than those experienced by other ETFs.
c. Premium/Discount Risk. Shares of the Funds are listed for trading on the NYSE Arca and are bought and sold in the secondary market at market prices that may differ from their most recent NAV. The market value of the Funds’ shares will fluctuate, in some cases materially, in response to changes in the Funds’ NAV, the intraday value of the Funds’ holdings, and the relative supply and demand for the Funds’ shares on the exchange. Disruptions to creations and redemptions, the existence of extreme market volatility or potential lack of an active trading market for shares may result in shares trading at a significant premium or discount to NAV and/or in a reduced liquidity of your investment. If a shareholder purchases shares at a time when the market price is at a premium to the NAV or sells shares at a time when the market price is at a discount to the NAV, the shareholder may sustain losses.
d. Secondary Market Trading Risk. Investors buying or selling shares of the Funds in the secondary market will pay brokerage commissions or other charges imposed by broker-dealers as determined by that broker. Brokerage commissions are often a fixed amount and may be a significant proportional cost for investors seeking to buy or sell relatively small amounts of shares.
e. Trading Issues Risk. Trading in shares on the NYSE Arca may be halted in certain circumstances. There can be no assurance that the requirements of the NYSE Arca necessary to maintain the listing of the Funds will continue to be met.
7. Capital Shares. Shares of the Funds may be acquired or redeemed directly from the Funds by Authorized Participants only in aggregations of 100,000 shares for Short Duration Income ETF and 50,000 shares for International Minimum Volatility ETF (“Creation Units”), or multiples thereof. Each Authorized Participant enters into an Authorized Participant agreement with the Funds’ Distributor.
A creation transaction order, which is subject to acceptance by ALPS, generally takes place when an Authorized Participant deposits into the Funds a designated portfolio of securities and/or cash (including any portion of such securities for which cash may be substituted) and a specified amount of cash approximating the holdings of the Funds in exchange for a specified number of Creation Units.
Similarly, shares can be redeemed only in Creation Units, generally for a designated portfolio of securities and/or cash (including any portion of such securities for which cash may be substituted) held by the Funds and a specified amount of cash. Except when aggregated in Creation Units, shares are not redeemable directly with the Funds.
The prices at which creations and redemptions occur are based on the next calculation of NAV after a creation or redemption order is received in an acceptable
35 |
Notes to Financial Statements (continued)
December 31, 2017
form under the Authorized Participant agreement. These prices may differ from the market price of the Fund’s shares.
The Funds may impose a creation transaction fee and a redemption transaction fee to offset transfer and other transaction costs associated with the issuance and redemption of Creation Units. Transaction fees are included in capital share transactions on the Statements of Changes in Net Assets.
Transactions in capital shares were as follows:
| | Period Ended December 31, 2017(a) | | ||||||
Short Duration Income ETF | Shares | Amount | ||||||
Issued from the sale of shares | 800,000 | $ | 20,010,762 | |||||
|
|
|
| |||||
Increase (decrease) from capital share transactions | 800,000 | $ | 20,010,762 | |||||
|
|
|
| |||||
| (a) | From commencement of operations on December 27, 2017 through December 31, 2017. |
| | Year Ended December 31, 2017 | | | Period Ended December 31, 2016(a) | | |||||||||||
International Minimum Volatility ETF | Shares | Amount | Shares | Amount | ||||||||||||
Issued from the sale of shares | 50,000 | $ | 2,294,815 | 350,000 | $ | 13,966,839 | ||||||||||
Redeemed | — | — | (2,500 | ) | (99,303 | ) | ||||||||||
|
|
|
|
|
|
|
| |||||||||
Net change | 50,000 | $ | 2,294,815 | 347,500 | $ | 13,867,536 | ||||||||||
|
|
|
|
|
|
|
| |||||||||
Increase (decrease) from capital share transactions | 50,000 | $ | 2,294,815 | 347,500 | $ | 13,867,536 | ||||||||||
|
|
|
|
|
|
|
| |||||||||
| (a) | From commencement of operations on October 25, 2016 through December 31, 2016 |
| 36
Report of Independent Registered Public
Accounting Firm
To the Board of Trustees of Natixis ETF Trust and Shareholders of Natixis Seeyond International Minimum Volatility ETF and Natixis Loomis Sayles Short Duration Income ETF
Opinions on the Financial Statements
We have audited the accompanying statements of assets and liabilities, including the portfolios of investments, of Natixis Seeyond International Minimum Volatility ETF and Natixis Loomis Sayles Short Duration Income ETF (constituting the Natixis ETF Trust, hereafter collectively referred to as the “Funds”) as of December 31, 2017, for Natixis Seeyond International Minimum Volatility ETF the related statement of operations for the year ended December 31, 2017 and the statement of changes in net assets for the year ended December 31, 2017 and for the period October 25, 2016 (commencement of operations) through December 31, 2016, and for Natixis Loomis Sayles Short Duration Income ETF the related statements of operations and changes in net assets for the period December 27, 2017 (commencement of operations) through December 31, 2017, including the related notes, and each of the financial highlights for each of the periods indicated therein (collectively referred to as the “financial statements”). In our opinion, the financial statements present fairly, in all material respects, the financial position of each of the Funds as of December 31, 2017, for Natixis Seeyond International Minimum Volatility ETF the results of its operations for the year ended December 31, 2017 and the changes in its net assets for the year ended December 31, 2017 and for the period October 25, 2016 (commencement of operations) through December 31, 2016, and for Natixis Loomis Sayles Short Duration Income ETF the results of its operations and changes in its net assets for the period December 27, 2017 through December 31, 2017, and each of the financial highlights for each of the periods indicated therein in conformity with accounting principles generally accepted in the United States of America.
Basis for Opinions
These financial statements are the responsibility of the Funds’ management. Our responsibility is to express an opinion on the Funds’ financial statements based on our audits. We are a public accounting firm registered with the Public Company Accounting Oversight Board (United States) (“PCAOB”) and are required to be independent with respect to the Funds in accordance with the U.S. federal securities laws and the applicable rules and regulations of the Securities and Exchange Commission and the PCAOB.
We conducted our audits of these financial statements in accordance with the standards of the PCAOB. Those standards require that we plan and perform the audit to obtain reasonable assurance about whether the financial statements are free of material misstatement, whether due to error or fraud.
37 |
Report of Independent Registered Public
Accounting Firm
Our audits included performing procedures to assess the risks of material misstatement of the financial statements, whether due to error or fraud, and performing procedures that respond to those risks. Such procedures included examining, on a test basis, evidence regarding the amounts and disclosures in the financial statements. Our audits also included evaluating the accounting principles used and significant estimates made by management, as well as evaluating the overall presentation of the financial statements. Our procedures included confirmation of securities owned as of December 31, 2017 by correspondence with the custodian, and brokers; when replies were not received from brokers, we performed other auditing procedures. We believe that our audits provide a reasonable basis for our opinions.
/s/ PricewaterhouseCoopers LLP
Boston, Massachusetts
February 22, 2018
We have served as the auditor of one or more investment companies in the Natixis Investment Company Complex since at least 1995. We have not determined the specific year we began serving as auditor.
| 38
2017 U.S. Tax Distribution Information to Shareholders (Unaudited)
Capital Gains Distributions. Pursuant to Internal Revenue Section 852(b), the following Funds paid distributions, which have been designated as capital gains distributions for the fiscal year ended December 31, 2017.
Fund | Amount | |||
International Minimum Volatility ETF | $ | 251,440 | ||
Qualified Dividend Income. A percentage of dividends distributed by the Funds during the fiscal year ended December 31, 2017 are considered qualified dividend income, and are eligible for reduced tax rates. These lower rates range from 0% to 20% depending on an individual’s tax bracket. These percentages are noted below:
Fund | Qualifying | |||
International Minimum Volatility ETF | 39.84 | % | ||
Foreign Tax Credit. For the year ended December 31, 2017, the Fund intends to pass through foreign tax credits and have derived gross income from sources within foreign countries amounting to:
Fund | Foreign Tax Credit | Foreign Source | ||||||
International Minimum Volatility ETF | $ | 39,751 | $ | 435,806 | ||||
39 |
Additional Information
Premium/Discount Analysis (Unaudited)
Fund shares are bought and sold on the secondary market at current market prices. Premium/discount represents the difference between the market price (midpoint between the highest bid and lowest offer on the primary listing exchange) and net asset value (“NAV”) of Fund shares determined as of the close of the NYSE. Premium/discount will fluctuate regularly based on the supply of, and demand for, shares of the Fund. Shareholders may pay more than NAV when they buy Fund shares and receive less than NAV when they sell shares.
The frequency distribution of discounts and premiums, as stated in days, for the period from the beginning of secondary market trading on October 27, 2016 through December 31, 2017 for the International Minimum Volatility ETF is as follows:
Market Price Above NAV (Premium) | Market Price Below NAV (Discount) | |||||||||
0.00 - <0.50% | 0.50 - <1.00% | 1.00 - <1.50% | 0.00 - <0.50% | 0.50 - <1.00% | 1.00 - <1.50% | |||||
| 204 | 9 | 1 | 78 | 4 | — | |||||
The frequency distribution of discounts and premiums, as stated in days, for the period from the beginning of secondary market trading on December 28, 2017 through December 31, 2017 for the Short Duration Income ETF is as follows:
Market Price Above NAV (Premium) | Market Price Below NAV (Discount) | |||||||||
0.00 - <0.50% | 0.50 - <1.00% | 1.00 - <1.50% | 0.00 - <0.50% | 0.50 - <1.00% | 1.00 - <1.50% | |||||
| — | — | 2 | — | — | — | |||||
Data shown represents past performance and is no guarantee of, and not necessarily indicative of, future results.
| 40
Additional Information
Special Meeting of Shareholders. (Unaudited)
A special meeting of shareholders of the Trust was held on December 4, 2017 to consider a proposal to elect thirteen Trustees to the Board of Trustees. The proposal was approved by shareholders of the Trust. The results of the shareholder vote were as follows:
Natixis ETF Trust
Nominee | Voted “For”* | Withheld* | ||||||
Kevin P. Charleston | 343,333.000 | 171.000 | ||||||
Kenneth A. Drucker | 343,333.000 | 171.000 | ||||||
Edmond J. English | 343,333.000 | 171.000 | ||||||
David L. Giunta | 343,333.000 | 171.000 | ||||||
Richard A. Goglia | 343,333.000 | 171.000 | ||||||
Wendell J. Knox | 343,333.000 | 171.000 | ||||||
Martin T. Meehan | 343,333.000 | 171.000 | ||||||
Maureen B. Mitchell | 343,504.000 | 0.000 | ||||||
Sandra O. Moose** | 343,504.000 | 0.000 | ||||||
James P. Palermo | 343,333.000 | 171.000 | ||||||
Erik R. Sirri | 343,333.000 | 171.000 | ||||||
Peter J. Smail | 343,333.000 | 171.000 | ||||||
Cynthia L. Walker | 343,504.000 | 0.000 | ||||||
| * | Trust-wide voting results. |
| ** | Ms. Moose retired as a Trustee effective January 1, 2018. |
41 |
Trustee and Officer Information
The tables below provide certain information regarding the trustees and officers of Natixis ETF Trust (the “Trust”). Unless otherwise indicated, the address of all persons below is 888 Boylston Street, Suite 800, Boston, MA 02199-8197. The Funds’ Statements of Additional Information include additional information about the trustees of the Trust and are available by calling the Funds at 800-458-7452.
Name and Year of Birth | Position(s) Held of Office1 | Principal 5 Years | Number of and Other 5 Years | Experience, Membership | ||||
| INDEPENDENT TRUSTEES | ||||||||
Kenneth A. Drucker (1945) | Chairperson of the Board of Trustees since January 2017 Trustee since 2016 Ex Officio member of Audit Committee, Contract Review Committee and Governance Committee | Retired | 54 None | Significant experience on the Board and on the boards of other business organizations (including at investment companies); executive experience (including as treasurer of an aerospace, automotive, and metal manufacturing corporation) | ||||
Edmond J. English (1953) | Trustee since 2016 Audit Committee Member and Governance Committee Member | Executive Chairman; formerly, Chief Executive Officer of Bob’s Discount Furniture (retail) | 54 Director, Burlington Stores, Inc. (retail) | Significant experience on the Board and significant experience on the boards of other business organizations (including retail companies and a bank); executive experience (including at a retail company) | ||||
| 42
Trustee and Officer Information
Name and Year of Birth | Position(s) Held of Office1 | Principal 5 Years | Number of and Other 5 Years | Experience, Membership | ||||
INDEPENDENT TRUSTEES continued | ||||||||
Richard A. Goglia (1951) | Trustee since 2016 Audit Committee Member | Retired; formerly Vice President and Treasurer of Raytheon Company (defense) | 54 None | Experience on the Board and executive experience (including his role as vice president and treasurer of a defense company and experience at a financial services company) | ||||
Wendell J. Knox (1948) | Trustee since 2016 Contract Review Committee Member and Governance Committee Member | Director of Abt Associates Inc. (research and consulting) | 54 Director, Eastern Bank (bank); Director, The Hanover Insurance Group (property and casualty insurance) | Significant experience on the Board and on the boards of other business organizations (including at a bank and at a property and casualty insurance firm); executive experience (including roles as president and chief executive officer of a research and consulting company) | ||||
43 |
Trustee and Officer Information
Name and Year of Birth | Position(s) Held of Office1 | Principal 5 Years | Number of and Other 5 Years | Experience, Membership | ||||
INDEPENDENT TRUSTEES continued | ||||||||
| Martin T. Meehan (1956) | Trustee since 2016 Audit Committee Member | President, University of Massachusetts; formerly, Chancellor and faculty member, University of Massachusetts Lowell | 54 None | Significant experience on the Board and on the boards of other business organizations; experience as President of the University of Massachusetts; government experience (including as a member of the U.S. House of Representatives); academic experience | ||||
Maureen B. Mitchell3 (1951) | Trustee since 2017 Contract Review Committee Member | Retired; formerly President, Global Sales and Marketing, GE Asset Management, Inc. (financial services) | 54 None | Experience on the Board; financial services industry and executive experience (including role as president of global sales and marketing at a financial services company) | ||||
| 44
Trustee and Officer Information
Name and Year of Birth | Position(s) Held of Office1 | Principal 5 Years | Number of and Other 5 Years | Experience, Membership | ||||
INDEPENDENT TRUSTEES continued | ||||||||
James P. Palermo (1955) | Trustee since 2016 Contract Review Committee Member | Founding Partner, Breton Capital Management, LLC (private equity); Partner, STEP Partners, LLC (private equity); formerly, Chief Executive Officer of Global Client Management of The Bank of New York Mellon Corporation | 54 None | Experience on the Board; financial services industry and executive experience (including roles as chief executive officer of client management and asset servicing for a banking and financial services company) | ||||
Erik R. Sirri (1958) | Trustee since 2016 Chairperson of the Audit Committee | Professor of Finance at Babson College | 54 None | Significant experience on the Board; experience as Director of the Division of Trading and Markets at the Securities and Exchange Commission; academic experience; training as an economist | ||||
Peter J. Smail (1952) | Trustee since 2016 Chairperson of the Contract Review Committee and Governance Committee Member | Retired | 54 None | Significant experience on the Board; mutual fund industry and executive experience (including roles as president and chief executive officer for an investment adviser) | ||||
45 |
Trustee and Officer Information
Name and Year of Birth | Position(s) Held of Office1 | Principal 5 Years | Number of and Other 5 Years | Experience, Membership | ||||
INDEPENDENT TRUSTEES continued | ||||||||
Cynthia L. Walker (1956) | Trustee since 2016 Chairperson of the Governance Committee and Audit Committee Member | Deputy Dean for Finance and Administration, Yale University School of Medicine | 54 None | Significant experience on the Board; executive experience in a variety of academic organizations (including roles as dean for finance and administration) | ||||
| INTERESTED TRUSTEES | ||||||||
Kevin P. Charleston4 (1965) One Financial Center Boston, MA 02111 | Trustee since 2016 | President, Chief Executive Officer and Chairman of the Board of Directors; formerly, Chief Financial Officer, Loomis, Sayles & Company, L.P. | 54 None | Experience on the Board; continuing service as President, Chief Executive Officer and Chairman of the Board of Directors of Loomis, Sayles & Company, L.P. | ||||
David L. Giunta5 (1965) | Trustee since 2015 President and Chief Executive Officer since 2011 | President and Chief Executive Officer, Natixis Advisors, L.P., Natixis Distribution, L.P., Natixis Distribution Corporation and Chairman of the Board of Natixis Distribution Corporation. | 54 None | Significant experience on the Board; experience as President and Chief Executive Officer, Natixis Advisors, L.P., Natixis Distribution, L.P., Natixis Distribution Corporation and Chairman of the Board of Natixis Distribution Corporation. | ||||
| 1 | Each trustee serves until retirement, resignation or removal from the Board. The current retirement age is 75. The position of Chairperson of the Board is appointed for a three-year term. |
| 46
Trustee and Officer Information
| 2 | The trustees of the Trust serve as trustees of a fund complex that includes all series of the Natixis Funds Trust I, Natixis Funds Trust II, Natixis Funds Trust IV and Gateway Trust (collectively, the “Natixis Funds Trusts”), Loomis Sayles Funds I and Loomis Sayles Funds II (collectively, the “Loomis Sayles Funds Trusts”) and Natixis ETF Trust (collectively, the “Fund Complex”). |
| 3 | Ms. Mitchell was appointed as a Trustee effective July 1, 2017. |
| 4 | Mr. Charleston is deemed an “interested person” of the Trust because he holds the following positions with an affiliated person of the Trust: President, Chief Executive Officer and Chairman of the Board of Directors of Loomis, Sayles & Company, L.P. |
| 5 | Mr. Giunta is deemed an “interested person” of the Trust because he holds the following positions with an affiliated person of the Trust: President and Chief Executive Officer, Natixis Advisors, L.P., Natixis Distribution, L.P., Natixis Distribution Corporation and Chairman of the Board of Natixis Distribution Corporation. |
47 |
Trustee and Officer Information
Name and Year of Birth | Position(s) Held with the Trust | Term of Office1 and Length of Time Served | Principal Occupation(s) During Past 5 Years2 | |||
| OFFICERS OF THE TRUST | ||||||
Russell L. Kane (1969) | Secretary, Clerk and Chief Legal Officer | Since 2016 | Executive Vice President, General Counsel, Secretary and Clerk, Natixis Distribution Corporation, Natixis Advisors, L.P. and Natixis Distribution, L.P.; formerly, Chief Compliance Officer for Mutual Funds, Senior Vice President, Deputy General Counsel, Assistant Secretary and Assistant Clerk, Natixis Distribution Corporation, Natixis Advisors, L.P. and Natixis Distribution, L.P. | |||
Michael C. Kardok (1959) | Treasurer, Principal Financial and Accounting Officer | Since 2011 | Senior Vice President, Natixis Advisors, L.P. and Natixis Distribution, L.P. | |||
Rosa Licea-Mailloux (1976) | Chief Compliance Officer, Assistant Secretary and Anti-Money Laundering Officer | Since 2016 | Senior Vice President, Deputy General Counsel, Assistant Secretary and Assistant Clerk, Natixis Distribution Corporation, Natixis Advisors, L.P. and Natixis Distribution, L.P.; formerly, Associate General Counsel, Natixis Distribution, L.P. | |||
| 1 | Each officer of the Trust serves for an indefinite term in accordance with the Trust’s current by-laws until the date his or her successor is elected and qualified, or until he or she sooner dies, retires, is removed or becomes disqualified. |
| 2 | Each person listed above, except as noted, holds the same position(s) with the Fund Complex. Previous positions during the past five years with Natixis Distribution, L.P., Natixis Advisors, L.P. or Loomis, Sayles & Company, L.P. are omitted, if not materially different from an officer’s current position with such entity. |
| 48
| Item 2. | Code of Ethics. |
The Registrant has adopted a code of ethics that applies to the Registrant’s principal executive officer, principal financial officer and persons performing similar functions. There have been no amendments or waivers of the Registrant’s code of ethics during the period.
| Item 3. | Audit Committee Financial Expert. |
The Board of Trustees of the Registrant has established an audit committee. Mr. Edmond J. English, Mr. Richard A. Goglia, Mr. Martin T. Meehan, Mr. Erik R. Sirri and Ms. Cynthia L. Walker are members of the audit committee and have been designated as “audit committee financial experts” by the Board of Trustees. Each of these individuals is also an Independent Trustee of the Registrant.
| Item 4. | Principal Accountant Fees and Services. |
Fees billed by the Principal Accountant for services rendered to the Registrant.
The table below sets forth fees billed by the principal accountant, PricewaterhouseCoopers LLP, for the past two fiscal years for professional services rendered in connection with a) the audit of the Registrant’s annual financial statements and services provided in connection with regulatory filings; b) audit-related services (including services that are reasonably related to the performance of the audit of the Registrant’s financial statements but not reported under “Audit Fees”); c) tax compliance, tax advice and tax planning and d) all other fees billed for professional services rendered by the principal accountant to the Registrant, other than the services provided as reported as a part of (a) through (c) of this Item.
| Audit fees | Audit-related fees1 | Tax fees2 | All other fees | |||||||||||||||||||||||||||||
| 10/25/16-12/31/16 | 1/1/17-12/31/17 | 10/25/16-12/31/16 | 1/1/17-12/31/17 | 10/25/16-12/31/16 | 1/1/17-12/31/17 | 10/25/16-12/31/16 | 1/1/17-12/31/17 | |||||||||||||||||||||||||
Natixis ETF Trust | $ | 35,096 | $ | 48,547 | $ | — | $ | 3 | $ | 13,034 | $ | 8,795 | $ | — | $ | — | ||||||||||||||||
| 1. | Audit-related fees consist of: |
2016 & 2017 – performance of agreed-upon procedures related to the Registrant’s deferred compensation.
| 2. | Tax fees consist of: |
2016 & 2017 – review of Registrant’s tax returns
Aggregate fees billed to the Registrant for non-audit services during 2016 and 2017 were $13,034 and $8,798 respectively.
Fees billed by the Principal Accountant for services rendered to the Adviser and Control Affiliates.
The following table sets forth the fees billed by the Registrant’s principal accountant for non-audit services rendered to Natixis Advisors, L.P.(“Natixis, Advisors”) and entities controlling, controlled by or under common control with Natixis Advisors. (“Control Affiliates”) that provide ongoing services to the Registrant, for engagements that related directly to the operations and financial reporting of the Registrant for the last two fiscal years.
| Audit-related fees | Tax fees | All other fees | ||||||||||||||||||||||
| 10/25/16-12/31/16 | 1/1/17-12/31/17 | 10/25/16-12/31/16 | 1/1/17-12/31/17 | 10/25/16-12/31/16 | 1/1/17-12/31/17 | |||||||||||||||||||
Control Affiliates | $ | — | $ | — | $ | — | $ | — | $ | — | $ | — | ||||||||||||
The following table sets forth the aggregate fees billed by the Registrant’s principal accountant for non-audit services rendered to NAM US, and Control Affiliates that provide ongoing services to the Registrant, for the last two fiscal years, including the fees disclosed in the table above.
| Aggregate Non-Audit Fees | ||||||||
| 10/25/16-12/31/16 | 1/1/17-12/31/17 | |||||||
Control Affiliates | $ | 82,978 | $ | 0 | ||||
None of the services described above were approved pursuant to (c)(7)(i)(C) of Regulation S-X.
Audit Committee Pre Approval Policies.
Annually, the Registrant’s Audit Committee reviews the audit, audit-related, tax and other non-audit services together with the projected fees, for services proposed to be rendered to the Trust and/or other entities for which pre-approval is required during the upcoming year. Any subsequent revisions to already pre-approved services or fees (including fee increases) and requests for pre-approval of new services would be presented for consideration quarterly as needed.
If, in the opinion of management, a proposed engagement by the Registrant’s independent accountants needs to commence before the next regularly scheduled Audit Committee meeting, any member of the Audit Committee who is an independent Board member is authorized to pre-approve the engagement, but only for engagements to provide audit, audit related and tax services. This approval is subject to review of the full Audit Committee at its next quarterly meeting. All other engagements require the approval of all the members of the Audit Committee.
| Item 5. | Audit Committee of Listed Registrants. |
This registrant has a separately designated standing audit committee comprised of independent Trustees. Mr. Edmond J. English, Mr. Richard A. Goglia, Mr. Martin T. Meehan, Mr. Erik R. Sirri and Ms. Cynthia L. Walker are members of the audit committee.
| Item 6. | Schedule of Investments. |
Included as part of the Report to Shareholders filed as Item 1 herewith.
Item 7. Disclosure of Proxy Voting Policies and Procedures for Closed-End Management Investment Companies.
Not applicable.
| Item 8. | Portfolio Managers of Closed-End Management Investment Companies. |
Not applicable.
Item 9. Purchases of Equity Securities by Closed-End Management Investment Companies and Affiliated Purchasers.
Not applicable.
| Item 10. | Submission of Matters to a Vote of Securities Holders. |
There were no material changes to the procedures by which shareholders may recommend nominees to the Registrant’s Board of Trustees.
| Item 11. | Controls and Procedures. |
The Registrant’s principal executive officer and principal financial officer have concluded that the Registrant’s disclosure controls and procedures are sufficient to ensure that information required to be disclosed by the Registrant in this Form N-CSR was recorded, processed, summarized and reported within the time periods specified in the Securities and Exchange Commission’s rules and forms, based upon such officers’ evaluation of these controls and procedures as of a date within 90 days of the filing date of the report.
There were no changes in the Registrant’s internal control over financial reporting that occurred during the Registrant’s last fiscal quarter of the period covered by the report that has materially affected, or is reasonably likely to materially affect, the Registrant’s internal control over financial reporting.
Item 12. Disclosure of Securities Lending Activities for Closed-End Management Investment Companies.
Not applicable.
| Item 13. | Exhibits. |
| (a)(1) | Code of Ethics required by Item 2 hereof, filed herewith as Exhibit (a)(1). | |
| (a)(2) | Certifications of Principal Executive Officer and Principal Financial Officer pursuant to Rule 30a-2(a) under the Investment Company Act of 1940 [17 CFR 270.30a-2(a)], filed herewith as Exhibits (a)(2)(1) and (a)(2)(2), respectively. | |
| (a)(3) | Not applicable. | |
| (b) | Certifications of Principal Executive Officer and Principal Financial Officer pursuant to Section 906 of Sarbanes-Oxley Act of 2002 filed herewith as Exhibit (b). | |
SIGNATURES
Pursuant to the requirements of the Securities Exchange Act of 1934 and the Investment Company Act of 1940, the Registrant has duly caused this report to be signed on its behalf by the undersigned, thereunto duly authorized.
| Natixis ETF Trust | ||
| By: | /s/ David L. Giunta | |
| Name: | David L. Giunta | |
| Title: | President and Chief Executive Officer | |
| Date: | February 21, 2018 | |
Pursuant to the requirements of the Securities Exchange Act of 1934 and the Investment Company Act of 1940, this report has been signed by the following persons on behalf of the Registrant and in the capacities and on the dates indicated.
| By: | /s/ David L. Giunta | |
| Name: | David L. Giunta | |
| Title: | President and Chief Executive Officer | |
| Date: | February 21, 2018 | |
| By: | /s/ Michael C. Kardok | |
| Name: | Michael C. Kardok | |
| Title: | Treasurer | |
| Date: | February 21, 2018 | |