UNITED STATES
SECURITIES AND EXCHANGE COMMISSION
Washington, D.C. 20549
FORM N-CSR
CERTIFIED SHAREHOLDER REPORT OF REGISTERED
MANAGEMENT INVESTMENT COMPANIES
Investment Company Act file number: 811-23146
Natixis ETF Trust
(Exact name of Registrant as specified in charter)
| | |
| 888 Boylston Street, Suite 800 Boston, Massachusetts | | 02199-8197 |
| (Address of principal executive offices) | | (Zip code) |
Russell L. Kane, Esq.
Natixis Distribution, L.P.
888 Boylston Street, Suite 800
Boston, Massachusetts 02199-8197
(Name and address of agent for service)
Registrant’s telephone number, including area code: (617) 449-2822
Date of fiscal year end: December 31
Date of reporting period: December 31, 2020
Item 1. Reports to Stockholders.
The Registrant’s annual report transmitted to shareholders pursuant to Rule 30e-1 under the Investment Company Act of 1940 is as follows:


Annual Report
December 31, 2020
Natixis Loomis Sayles Short Duration Income ETF
Natixis U.S. Equity Opportunities ETF
Natixis Vaughan Nelson Mid Cap ETF
Natixis Vaughan Nelson Select ETF
Table of Contents

NATIXIS LOOMIS SAYLES SHORT DURATION INCOME ETF
| | |
| |
| Managers | | NYSE Arca: LSST |
| |
| Daniel Conklin, CFA® | | |
| |
| Christopher T. Harms | | |
| |
| Clifton V. Rowe, CFA® | | |
| |
| Loomis, Sayles & Company, L.P. | | |
Investment Goal
The Fund’s investment objective is current income consistent with preservation of capital.
Market Conditions
The financial markets experienced significant volatility in 2020, as investors grappled with the persistent uncertainty surrounding Covid-19. The bulk of the market disruptions occurred in February and March, when world governments first aimed to contain the virus by locking down broad swaths of their economies. Higher-risk assets were hit hard in the ensuing selloff, while demand for “safe-haven” investments surged. The US Federal Reserve (Fed) sought to counter the extraordinary developments by cutting short-term interest rates to zero, reestablishing traditional quantitative easing through asset purchases in the Treasury and mortgage-backed securities markets, and establishing lending facilities which either have only been used during the global financial crisis or were created for the first time in Fed history, such as the Corporate Credit facility. Aided by the $2.2 trillion stimulus package passed by the US Congress in late March, the Fed’s response fueled an impressive recovery in higher-risk assets from early spring onward. After pausing in the lead-up to the US elections, the rally gained steam in November thanks to the long-awaited headline that coronavirus vaccines would soon become available to the public. The markets took this as an indication that economic conditions could gradually return to normal in 2021, boosting sentiment into year-end.
US Treasurys were the primary beneficiaries of the first-quarter “flight to quality” and the Fed’s subsequent commitment to maintain its low-rate monetary policy indefinitely. Twelve-month returns were progressively higher along the yield curve, with 30-year issues generating the largest gain.
Although investment-grade corporate bonds suffered a sharp downturn in the February-March selloff, the category finished as the top performing major segment of the fixed-income market for the full, 12-month period. Corporates benefited from the gradual improvement in the credit outlook throughout the course of the year, together with rising demand for high-quality alternatives to low-yielding government debt.
Securitized assets — including mortgage-backed securities (MBS), asset-backed securities (ABS), and commercial mortgage-backed securities (CMBS) — posted positive total returns but failed to keep pace with the broader U.S. bond market. CMBS was the strongest performer in this segment despite concerns about the outlook for commercial real estate in the wake of the pandemic.
Performance Results
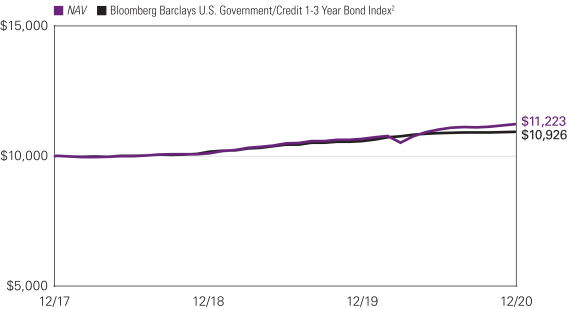
For the 12 months ended December 31, 2020, the Natixis Loomis Sayles Short Duration Income ETF returned 5.27%. The Fund outperformed its benchmark, the Bloomberg Barclays U.S. Government/Credit 1-3 Year Bond Index, which returned 3.33%.
Explanation of Fund Performance
Security selection was the largest positive contributor to the Fund’s performance during the period. By asset class, both investment grade and non-investment grade corporate bond security selection drove positive relative performance. Allocation decisions were also additive to performance as the Fund used risk assets such as corporate bonds and securitized assets to generate above-benchmark returns. By industry, security selection was most beneficial within technology, consumer non-cyclical and energy names.
The effects of positioning along the yield curve (which depicts the relationship among bond yields across the maturity spectrum) detracted, as did the Fund’s stance with respect to duration (and corresponding interest rate sensitivity). An underweight allocation to government-related sectors detracted slightly from relative return. Finally, an allocation to sovereign bonds marginally detracted from relative performance.
Outlook
We believe the Federal Reserve will remain accommodative for the foreseeable future, keeping the fed funds rate unchanged at the zero lower bound and anchoring the front end of the Treasury yield curve through 2021 (and likely through 2023). Current Fed balance sheet policy with respect to quantitative easing should remain in place through most of 2021, with some possible tapering of
1 |
asset purchases anticipated by around the fourth quarter. We do not expect the economy to return to full strength until the later part of 2021 as fiscal and monetary policy remain supportive and vaccine distribution progresses toward herd immunity.
We believe the credit cycle1 is migrating from the credit repair phase into the recovery phase, with a generally healthy consumer, strength in housing and improving economic growth. Credit sector valuations look less attractive as they return to levels observed at the end of 2019. However, favorable technical factors could support modest spread compression given a positive economic and fiscal outlook in our view.
We continue to favor spread sectors, such as corporate bonds and securitized assets. However, we have reduced the portfolio’s overall risk level to the lower end of our range, a similar posture to the beginning of 2020.
Reduction in corporate bond risk has been the biggest driver in the decline of overall portfolio risk. While corporate fundamentals are improving, we believe valuations are not compelling and favor a low use of our risk budget for the asset class. We remain overweight both agency and non-agency commercial mortgage-backed securities, particularly senior parts of the capital stack. Within mortgage-backed securities, we remain focused on securities with limited prepayment risk. We believe the high-quality asset-backed securities sector remains attractive relative to government bonds, and favor auto loans and credit card receivables within the sector.
We continue to follow our process in building diversified exposures by asset class, industry and issuer.
| 1. | A credit cycle is a cyclical pattern that follows credit availability and corporate health. |
Hypothetical Growth of $10,000 Investment3
December 27, 2017 (inception) through December 31, 2020
See notes to chart on page 3.
| 2
NATIXIS LOOMIS SAYLES SHORT DURATION INCOME ETF
Average Annual Total Returns – December 31, 20203
| | | | | | | | | | | | | | | | |
| | | | |
| | | 1 Year | | | Life of Fund
(Inception 12/27/17) | | | Expense Ratios4 | |
| | Gross | | | Net | |
| NAV1 | | | 5.27 | % | | | 3.91 | % | | | 0.95 | % | | | 0.38 | % |
| Market1 | | | 5.55 | | | | 3.99 | | | | | | | | | |
| | | | | |
| Comparative Performance | | | | | | | | | | | | | | | | |
| Bloomberg Barclays U.S. Government/Credit 1-3 Year Bond Index2 | | | 3.33 | | | | 2.97 | | | | | | | | | |
Performance data shown represents past performance and is no guarantee of, and not necessarily indicative of, future results. Total return and value will vary, and you may have a gain or loss when shares are sold. Current performance may be lower or higher than quoted. For most recent month-end performance, visit im.natixis.com. You may not invest directly in an index. Performance for periods less than one year is cumulative, not annualized. Returns reflect changes in share price and reinvestment of dividends and capital gains, if any. The table(s) do not reflect taxes shareholders might owe on any fund distributions or when they redeem or sell their shares.
| 1 | The NAV return is based on the NAV of the Fund, and the market return is based on the market price per share of the Fund, which is determined by using the midpoint between the highest bid and the lowest offer on the primary stock exchange on which the shares of the Fund are listed for trading, as of the time that the Fund’s NAV is calculated. Since shares of the Fund did not trade on the secondary market until December 28, 2017, NAV is used as a proxy for the market price prior to that date. Market and NAV returns assume that dividends and capital gain distributions have been reinvested in the Fund at market price and NAV, respectively. |
| 2 | The Bloomberg Barclays U.S. Government/Credit 1-3 Year Bond Index is an unmanaged index which is a component of the U.S. Government/Credit Bond Index, which includes Treasury and agency securities (U.S. Government Bond Index) and publicly issued US corporate and foreign debentures and secured notes (U.S. Credit Bond Index). The bonds in the index are investment grade with a maturity between one and three years. |
| 3 | Fund performance has been increased by fee waivers and/or expense reimbursements, if any, without which performance would have been lower. |
| 4 | Expense ratios are as shown in the Fund’s prospectus in effect as of the date of this report. The expense ratios for the current reporting period can be found in the Financial Highlights section of this report under Ratios to Average Net Assets. Net expenses reflect contractual expense limitations set to expire on 4/30/23. When a Fund’s expenses are below the limitation, gross and net expense ratios will be the same. See Note 6 of the Notes to Financial Statements for more information about the Fund’s expense limitations. |
3 |
NATIXIS U.S. EQUITY OPPORTUNITIES ETF
| | |
| |
| Managers | | NYSE Arca: EQOP |
| |
| William C. Nygren, CFA® | | |
| |
| Kevin G. Grant, CFA® | | |
| |
| M. Colin Hudson, CFA® | | |
| |
| Michael J. Mangan, CFA®, CPA | | |
| |
| Michael A. Nicolas, CFA® | | |
| |
| Harris Associates L.P. | | |
| |
| | |
| |
| Aziz V. Hamzaogullari, CFA® | | |
| |
| Loomis, Sayles & Company, L.P. | | |
Investment Goal
The Fund seeks long-term growth of capital.
Market Conditions
As the U.S. economy ended the third quarter, economic activity had picked up during the summer as more states allowed stores and restaurants to re-open. Covid-19 case and death rates were fairly stable throughout the country. However, as the weather grew colder across much of the United States, both case and death rates began to rise again. Holiday travel over Thanksgiving created a new wave of cases into December and the New Year.
During the fourth quarter, the economy expanded by 4 percent, slightly under the 4.2 percent expected by Bloomberg consensus data. For the full year, economic output declined by 3.5 percent, the first decline since 2009 and the largest drop in gross domestic product since 1946. Bright spots in the economy include the housing market and corporate investment.
Unemployment also declined during the fourth quarter, falling from 7.8 percent in the last month of the third quarter, September, to 6.7 percent in December. New jobless claims continued to fall, although they remained significantly above the pre-pandemic peak.
Despite the recovery, Moody’s Analytics estimated that the economy had only recovered about 75 percent of the strength it had demonstrated pre-pandemic by the end of the year. In December, the U.S. Food and Drug Administration approved two vaccines for distribution. Just before the end of the year, Congress and the Trump Administration agreed to a $900 billion stimulus to continue the economic recovery.
The S&P 500 ended the year with a 16.26 percent gain in price (excluding reinvested dividends); the Dow Jones Industrial Average1 rose by 7.25 percent and the Nasdaq Composite Index2 by 43.64 percent. The yield on the benchmark U.S. 10-Year Treasury bond ended the year at 0.93 percent.
As 2020 drew to a close, the country waited to welcome the Biden administration in 2021 and looked forward to the widespread deployment of two Covid-19 vaccines, which many hoped would lead to a return to normalcy after a year in which anything was normal.
Performance Results
The Natixis U.S. Equity Opportunities ETF was launched on September 16, 2020. For the period ending December 31, 2020, the Fund returned 14.78% at net asset value. The Fund outperformed its primary benchmark, the S&P 500® Index, which returned 11.45%. The Fund also outperformed its secondary benchmark, the Russell 1000® Index3, which returned 13.12%.
Explanation of Fund Performance
Each of the portfolio’s segments uses a distinct investment style, providing shareholders with exposure to a variety of different stocks:
| | • | | The Harris Associates L.P. Large Cap Value segment invests primarily in the common stocks of larger-capitalization companies that Harris Associates believes are trading at a substantial discount to the company’s “true business value.” |
| | • | | The Loomis, Sayles & Company, L.P. All Cap Growth segment invests primarily in equity securities and may invest in companies of any size. The segment employs a growth style of equity management that emphasizes companies with sustainable competitive advantages, long-term structural growth drivers, attractive cash flow returns on invested capital, and management teams focused on creating long-term value for shareholders. The segment aims to invest in companies when they trade at a significant discount to the estimate of intrinsic value. |
| 1. | The Dow Jones Industrial Average (DJIA) is a popular stock market index that tracks 30 U.S. blue-chip stocks. |
| 2. | The Nasdaq Composite Index is a broad-based market index that includes over 3,000 of the equities listed on the Nasdaq stock exchange. |
| 3. | The Russell 1000 Index, a subset of the Russell 3000 Index, represents the 1000 top companies by market capitalization in the United States. |
| 4
NATIXIS U.S. EQUITY OPPORTUNITIES ETF
Harris Associates Large Cap Value Segment
As value investors with an emphasis on individual stock selection, our sector weights are a byproduct of our bottom-up process. On an absolute-return basis, the industrials sector gained the most value, while holdings in the materials sector delivered the smallest positive collective return.
The largest contributors to fund performance for the reporting period were Charles Schwab and Citigroup. Third-quarter revenue and earnings per share from Charles Schwab were slightly better than market expectations. Although year-over-year net revenue and net profit fell, we found the results were good considering the challenging operating environment. Ongoing low interest rates continued to pressure net interest income and pushed down the net interest margin by more than 100 basis points. However, we were pleased that net new asset (NNA) growth, a metric that we see as the core business driver for the long term, remained strong. NNA finished the third quarter at $52 billion and totaled roughly $250 billion for the trailing 12-month period, which reflected a 6.5% advance from the same period last year. Third-quarter total client assets increased by 17% from a year earlier to $4.40 trillion from a combination of net inflows and rising markets. In addition, the acquisition of TD Ameritrade closed in mid-October, which management cited brings total client assets to $6 trillion and brokerage accounts to 28 million. Citigroup’s third-quarter results were acceptable to us and certain metrics, including non-interest income, investment bank revenues and earnings per share, surpassed market expectations. At a financial services conference held in December, Citigroup’s CFO Mark Mason stated full-year 2020 revenue would likely be unchanged from the 2019 level of roughly $74 billion, while expenses would increase about 2% from last year, which appears reasonable considering the current macroeconomic environment. In addition, Citigroup passed the latest stress test the Federal Reserve conducted on financial firms as its common equity Tier 1 ratio of 11.8% exceeds the minimum requirement of 9.6%. Also in December, we had an opportunity to meet with new CEO Jane Fraser and found her to be a thoughtful, well-balanced and sensible executive. Fraser is in the process of performing a detailed strategy review with the goal of improving Citigroup’s growth profile, assessing the impact of technology change on banking and identifying opportunities to commoditize certain businesses, while creating revenue-boosting opportunities in others.
Loomis, Sayles and Company All Cap Growth Segment
We are an active manager with a long-term, private equity approach to investing. Through our proprietary bottom-up research framework, we look to invest in those few high-quality businesses with sustainable competitive advantages and profitable growth when they trade at a significant discount to intrinsic value. For the period, the All Cap Growth segment posted a positive absolute return. Our holdings in the industrials, communication services, consumer staples and financials sectors contributed positively to results.
Autodesk, Disney, and Deere were the largest contributors to performance during the period. A global leader in 3D design software and services, the Autodesk name is synonymous with computer-aided design. The company offers a broad suite of products that are viewed as mission critical among its clients and create high switching costs. In early 2016, the company began transitioning its business model to a cloud-delivered, subscription-based model where fees are recognized ratably over the life of the customer relationship. During the transition, margins, earnings, and cash flow have been predictably under pressure and operating margins were negative in the company’s 2017 and 2018 fiscal years, which we believe represented the trough for cash flow and operating margins. We believe the subscription model will result in increased visibility of future revenue streams and higher lifetime customer value, leading to increased revenue, profitability, and free cash flow. During the period, Autodesk reported strong results that exceeded consensus expectations for revenues, earnings, and free cash flow, despite customer usage patterns in the US and UK that remain below their pre-Covid-19 levels. While the US and UK remain impacted, usage patterns, which correlate strongly with new business trends, were above pre-Covid-19 levels in China, Korea, Japan, and most of Europe. Importantly, Autodesk demonstrated continued progress in its model transition, which is now largely complete, including recurring revenue that grew to 97% of the revenue mix from approximately 50% prior to the transition. As the business model transition matures over time, we believe Autodesk will be able to improve operating leverage and increase adjusted operating margins, resulting in high and sustainable free cash flow that we believe is not currently reflected in the share price. As a result, Autodesk’s shares are selling at a significant discount to our estimate of intrinsic value, creating a compelling reward-to-risk opportunity.
Disney is one of the largest and most renowned vertically integrated media companies in the world, with iconic entertainment brands and decades of film and TV content that it leverages across its media networks, theme parks, motion picture studios, and direct-to-consumer (DTC) businesses. The company’s financial results continue to reflect the negative impact of Covid-19, which has substantially disrupted some of Disney’s largest profit drivers. However, the company reported revenue and operating profit that exceeded consensus expectations, with profitability benefiting from better-than-expected results in media and networks and lower-than-expected losses in its parks and DTC businesses. Subscribers to its Disney+ streaming service reached 87 million within approximately twelve months of its November 2019 launch — a feat that took Netflix approximately seven years to achieve globally. The company substantially increased its estimate for global subscribers to its multiple DTC services to over 300 million by 2024, up from its prior estimate of approximately 130 million, and announced its intention to increase pricing for certain offerings, including Disney+. We believe that Covid-19 will continue to have a near-to-mid-term impact, but will ultimately be transient, and we added to
5 |
our position in the period. Over our long-term investment horizon, we believe the company’s portfolio of iconic brands, its massive scale and geographic reach, and nearly impossible-to-replicate guest experiences, leave the company well positioned to benefit from secular growth in global entertainment spending. We believe current market expectations substantially underestimate the uniqueness of the company’s intellectual property (IP), the opportunity to monetize that IP across several global business segments, and its ability to generate sustainable growth in free cash flow. As a result we believe the shares trade at a substantial discount to our estimate of intrinsic value and offer a compelling reward-to-risk opportunity.
Deere manufactures a full line of equipment used in agriculture, construction, forestry, and turf care, including value-added components such as precision agriculture tools. We believe the company’s competitive advantages include its iconic brand, scale, and global distribution. Deere’s distribution network of approximately 1,500 exclusive dealers in North America gives it unmatched reach for sales and service, and the company is also among the market leaders in Europe and Latin America. Deere reported better-than-expected financial results that reflected strong demand for smaller agricultural equipment, improvements in its key large agricultural equipment end markets, and operating margins in the agriculture and turf segment that reached their highest level since revenues peaked in 2013. While demand for large agricultural equipment remains well below mid-cycle, strong growth in its early order book and strengthening agricultural fundamentals led the company to provide guidance for strong revenue growth of 10-15% in 2021. We believe Deere’s long-term secular growth driver is the global growth in demand for agricultural equipment, fueled by the steady increase in global demand for grains from a growing population with increasing affluence. We believe Deere’s market leadership, superior technology, demonstrated pricing power, and improving margin structure leave it well positioned over our long-term investment horizon as its major agricultural end market improves. We believe the company’s shares trade at a significant discount to our estimate of intrinsic value and offer a compelling long-term reward-to-risk opportunity.
Alibaba, Regeneron Pharmaceuticals, and Salesforce.com were the three lowest contributors during the period. Alibaba is a leading China e-commerce and consumer-engagement platform provider. With over 60% of China’s e-commerce transactions estimated to take place through its marketplaces, we believe Alibaba’s scale and interconnected sites create an unparalleled and difficult-to-replicate business ecosystem. During the period, Alibaba reported financial results that reflected strong fundamentals, continued market share gains, and were above consensus expectations. However, shares have come under pressure due to a series of regulatory actions by the Chinese government, most recently a late-December notice from China’s State Administration for Market Regulation (SAMR) that it is looking into allegations that Alibaba requires merchants to enter exclusive relationships which prevent them from offering the same products on competing platforms. If the company is found to have violated the rules, it would need to change such practices and could potentially be fined a percentage of prior-year revenue. However, we do not believe the investigation or any currently proposed regulations will ultimately impact Alibaba’s strong and sustainable competitive advantages. Of course, such developments can weigh on stock prices over the short term. As we do with any legislative or regulatory developments, we continue to monitor and assess any potential structural impact to our investment thesis. We believe Alibaba continues to execute well on its business model, allowing it to expand its already dominant market position and to invest to strengthen its competitive advantages. The company benefits from secular growth in China e-commerce, as well as advertising growth, digitizing offline retail, cloud computing, and international expansion. We believe the current market price embeds expectations for revenue and cash flow growth that are well below our long-term assumptions. With its shares trading at a significant discount to our estimate of intrinsic value, we believe Alibaba offers a compelling reward-to-risk opportunity.
Regeneron Pharmaceuticals, Inc. is a fully integrated biopharmaceutical company created with the vision to empower scientists to shape the path of the business. Regeneron has created enabling technologies, platforms, and methods that materially speed target discovery and development timelines, allowing the company to develop viable candidates for clinical trial faster than its competitors. As a result of these technologies, Regeneron was able to negotiate risk-mitigating collaborations with larger biopharmaceutical company partners that fund early-stage research and development in exchange for a share of potential profits, enabling Regeneron to access scale and distribution strength. Regeneron reported solid financial results that exceeded consensus expectations for both revenue and earnings per share (EPS), aided in part by the timing of government payments for its Covid-19 antibody therapy, but also reflected continued penetration for leading therapies Eylea and Dupixent. However, shares declined modestly in response to management’s suggestion that research and development (R&D) expenses would be higher in 2021 as more therapies in its robust pipeline progressed into later clinical stages and still-uncertain investments to support its Covid-19 therapy would further increase R&D costs. We view the market reaction to higher R&D as short-sighted as such investments lay the groundwork for sustainable long-term revenue generation. We believe Regeneron is among the highest quality businesses in healthcare, with both broad-based established therapies and meaningful pipeline assets, which include over 20 product candidates in clinical development that were generated using the company’s proprietary technology. We believe Regeneron’s market price embeds a lack of appreciation for the company’s multiple short-term and longer-term growth opportunities and the uniqueness of its financial model. We believe the shares trade at a significant discount to our estimate of intrinsic value and offer a compelling reward-to-risk opportunity.
| 6
NATIXIS U.S. EQUITY OPPORTUNITIES ETF
Founded in 1999, Salesforce.com is the leading provider of cloud-based enterprise software, services, and applications focused on customer relationship management (CRM). As an early mover in the shift to cloud solutions and digitization of CRM, the Salesforce brand became synonymous with CRM, and the company’s brand strength is reflected in its leading market share and premium pricing. Salesforce is focused on its Customer 360 platform that unites sales, service, marketing, and commerce to provide a comprehensive customer view, and today is one of very few companies that can offer solutions for every aspect of the customer lifecycle. Because its products serve mission-critical functions, they become deeply embedded in customer work flows and create high switching costs for users, resulting in customer retention rates in excess of 90%. During the period, Salesforce reported strong financial results that exceeded consensus expectations. However, shares were pressured following the company’s announcement that it reached an agreement to acquire business collaboration software provider Slack Technologies for $27.7 billion in cash and stock. While the market is understandably concerned about the price paid and dilutive impact of the company’s largest-ever acquisition, we see significant potential in driving long-term value for the company. We believe the acquisition has the potential to improve Salesforce’s competitive positioning by facilitating even better collaboration and decision making across CRM functions and further improving client experience. We believe salesforce will significantly improve the distribution strength of Slack, whose strong and successful viral offering can leverage the massive installed base of Salesforce clients and its direct sales force of approximately 10,000 employees. We expect the combined business will improve its margins and benefit from further scale. Ultimately, we believe Salesforce is one of very few companies capable of successfully delivering on the proposed integration and realizing value from the acquisition. We will continue to carefully monitor and assess the company’s progress for any impact to our investment thesis. We believe Salesforce’s strong and sustainable competitive advantages will enable it to continue to benefit from secular growth in adoption of its cloud-based applications and to grow faster than the industry as a whole. We believe Salesforce’s share price embeds expectations for key revenue and cash flow growth drivers that are well below our long-term assumptions. As a result, we believe the company is selling at a significant discount to our estimate of its intrinsic value and offers a compelling reward-to-risk opportunity.
Outlook:
The Natixis U.S. Equity Opportunities Fund is comprised of two separate segments combining the value expertise of Harris Associates with the growth expertise of Loomis Sayles. The two segments have common investment philosophies and a rigorous long-term, bottom-up research process focused on high quality businesses trading at a significant discount to intrinsic value. Given encouraging news around Covid-19 vaccines and treatments, we think economic activity in 2021 will look more like 2019, than 2020, and we expect to start seeing signs of that in the second half of 2021. Our thesis for each investment, almost by definition, differs from consensus. Our responsibility is, and always has been, to monitor any new information to constantly challenge those theses. If we are correct that normal will return faster than others expect it will, we believe our stocks are well-positioned. We are patient investors and maintain coverage of high-quality businesses in order to take advantage of meaningful price dislocations if and when they occur.
Top Ten Holdings as of December 31, 2020
| | | | | | | | |
| | | |
| | | | Security name | | % of net assets | |
| | 1 | | | Facebook, Inc., Class A | | | 4.63 | % |
| | 2 | | | Alphabet, Inc., Class A | | | 3.58 | |
| | 3 | | | Amazon.com, Inc. | | | 3.35 | |
| | 4 | | | Autodesk, Inc. | | | 2.62 | |
| | 5 | | | Capital One Financial Corp. | | | 2.53 | |
| | 6 | | | Citigroup, Inc. | | | 2.51 | |
| | 7 | | | Bank of America Corp. | | | 2.51 | |
| | 8 | | | Charles Schwab Corp. (The) | | | 2.36 | |
| | 9 | | | Booking Holdings, Inc. | | | 2.31 | |
| | 10 | | | NVIDIA Corp. | | | 2.28 | |
The portfolio is actively managed and holdings are subject to change. There is no guarantee the Fund continues to invest in the securities referenced. The holdings listed exclude any temporary cash investments.
7 |
Total Returns – December 31, 20204
| | | | | | | | | | | | |
| | | |
| | | Life of Fund
(Inception 9/16/20) | | | Expense Ratios5 | |
| | Gross | | | Net | |
| NAV1 | | | 14.78 | % | | | 3.14 | % | | | 0.90 | % |
| Market1 | | | 14.82 | | | | | | | | | |
| | | | |
| Comparative Performance | | | | | | | | | | | | |
| S&P 500® Index2 | | | 11.45 | | | | | | | | | |
| Russell 1000® Index3 | | | 13.12 | | | | | | | | | |
Performance data shown represents past performance and is no guarantee of, and not necessarily indicative of, future results. Total return and value will vary, and you may have a gain or loss when shares are sold. Current performance may be lower or higher than quoted. For most recent month-end performance, visit im.natixis.com. You may not invest directly in an index. Performance for periods less than one year is cumulative, not annualized. Returns reflect changes in share price and reinvestment of dividends and capital gains, if any. The table(s) do not reflect taxes shareholders might owe on any fund distributions or when they redeem or sell their shares.
| 1 | The NAV return is based on the NAV of the Fund, and the market return is based on the market price per share of the Fund, which is determined by using the midpoint between the highest bid and the lowest offer on the primary stock exchange on which the shares of the Fund are listed for trading, as of the time that the Fund’s NAV is calculated. Since shares of the Fund did not trade on the secondary market until September 17, 2020, NAV is used as a proxy for the market price prior to that date. Market and NAV returns assume that dividends and capital gain distributions have been reinvested in the Fund at market price and NAV, respectively. |
| 2 | S&P 500® Index is a widely recognized measure of U.S. stock market performance. It is an unmanaged index of 500 common stocks chosen for market size, liquidity, and industry group representation, among other factors. It also measures the performance of the large cap segment of the US equities market. |
| 3 | Russell 1000® Index measures the performance of the large-cap segment of the U.S. equity universe. It is a subset of the Russell 3000® Index and includes approximately 1000 of the largest securities based on a combination of their market cap and current index membership. The Russell 1000® Index represents approximately 92% of the U.S. market and is constructed to provide a comprehensive and unbiased barometer for the large-cap segment and is completely reconstituted annually to ensure new and growing equities are reflected. |
| 4 | Fund performance has been increased by fee waivers and/or expense reimbursements, if any, without which performance would have been lower. |
| 5 | Expense ratios are as shown in the Fund’s prospectus in effect as of the date of this report. The expense ratios for the current reporting period can be found in the Financial Highlights section of this report under Ratios to Average Net Assets. Net expenses reflect contractual expense limitations set to expire on 4/30/23. When a Fund’s expenses are below the limitation, gross and net expense ratios will be the same. See Note 6 of the Notes to Financial Statements for more information about the Fund’s expense limitations. |
| 8
NATIXIS VAUGHAN NELSON MID CAP ETF
| | |
| |
| Managers | | NYSE Arca: VNMC |
| |
| Dennis G. Alff, CFA® | | |
| |
| Chad D. Fargason | | |
| |
| Chris D. Wallis, CFA® | | |
| |
| Vaughan Nelson Investment Management, L.P. | | |
Investment Goal
The Fund seeks long-term capital appreciation.
Market Overview
The recovery in financial markets continued in Q4 2020 with the S&P 500®1 and Russell 2000 Value2 rising 12.13% and 33.36%, respectively. For the year, the S&P 500® and Russell 2000 Value rose 18.4% and 4.6%, respectively. Positive vaccine data, combined with election results that indicated further stimulus is expected, were the impetus for the strong fourth quarter rally. The equity market rally materially boosted valuation multiples indicating a portion of the 2021 earnings recovery has already been discounted. As the economy continues to recover, additional policy support may be needed to offset the damage that occurred to key service sectors and the commercial real estate market.
US and international economies remain buoyed by the continued strong recovery in the industrial sector as global supply chains are busy rebuilding inventories and preparing for a post-Covid-19 normalization of activity. The recovery in the services side of the economy continues at a modest pace as renewed lockdowns have presented headwinds in the fourth quarter. One of the brightest spots in the US economy has been the strength in housing. The rapid increase in demand has pushed home prices materially higher. Higher home prices represent a near-term headwind but are a harbinger of increased economic activity as additional supply is brought to market to balance supply and demand.
A key driver of the recovery has been the weaker US dollar, which boosted commodity prices and eased the debt service burden of foreign borrowers. However, the falling US dollar and supply chain disruptions are leading to domestic price increases which will likely cause headline inflation to exceed the Federal Reserve’s 2% target during the first half of 2021. Should this increase in inflationary pressure prove transitory, and there are no material shifts in real yields, then we would not expect a material impact to risk assets. To the extent higher inflation expectations become more entrenched, or real yields move higher, a broader repricing of risk assets across sectors and asset classes is expected.
Performance Results
The Natixis Vaughan Nelson Mid Cap ETF was launched on September 16, 2020. For the period ending December 31, 2020, the Fund returned 18.91% at net asset value. The Fund outperformed its benchmark, the Russell Midcap® Value Index, which returned 16.70%.
Explanation of Fund Performance
As a result of buys and sells and market action, the largest sector overweights are Industrials, Information Technology, Financials, Materials, Health Care, and Consumer Staples. Real Estate, Consumer Discretionary, Utilities, Communication Services, and Energy are the most underweight sectors.
During the quarter, the portfolio experienced positive absolute and relative performance. Positive relative contributions from Industrials, Consumer Staples, Materials, Consumer Discretionary, Utilities, Real Estate, Financials, and Communication Services were modestly offset by negative relative contribution in Information Technology, Health Care, and Energy.
Outlook
After decades of reliance on monetary stimulus, the economy and capital markets suffer from excess leverage, malinvestment and structural imbalances that hamper the effectiveness of monetary tools. With the election behind us, we expect fiscal policy in close coordination with the Federal Reserve to take center stage in driving economic growth.
The last bout of loose fiscal policy was combined with tight monetary policy, which sustained US dollar strength. The next round of loose fiscal policy will likely be combined with loose monetary policy, which will pressure the US dollar. Should such economic policy be pursued, and successfully increase nominal GDP growth, it will represent a fundamental shift in the underlying economic conditions that have not been witnessed in years. Such a shift in the economic environment will likely lead to increased market volatility and broad changes in market leadership.
| 1. | The S&P 500 Index or the Standard & Poor’s 500 Index is a market-capitalization-weighted index of 500 of the largest publicly traded companies in the U.S. |
| 2. | Russell 2000® Value Index is an unmanaged index that measures the performance of the small-cap value segment of the U.S. equity universe. It includes those Russell 2000® companies with lower price-to-book ratios and lower forecasted growth values. |
9 |
Top Ten Holdings as of December 31, 2020
| | | | | | | | |
| | | |
| | | | Security name | | % of
net assets | |
| | 1 | | | Avantor, Inc. | | | 3.09 | % |
| | 2 | | | Timken Co. (The) | | | 3.04 | |
| | 3 | | | Nexstar Media Group, Inc., Class A | | | 2.99 | |
| | 4 | | | WillScot Mobile Mini Holdings Corp. | | | 2.86 | |
| | 5 | | | Crane Co. | | | 2.80 | |
| | 6 | | | Motorola Solutions, Inc. | | | 2.77 | |
| | 7 | | | Otis Worldwide Corp. | | | 2.55 | |
| | 8 | | | Vistra Corp. | | | 2.47 | |
| | 9 | | | nVent Electric PLC | | | 2.43 | |
| | 10 | | | AMETEK, Inc. | | | 2.17 | |
The portfolio is actively managed and holdings are subject to change. There is no guarantee the Fund continues to invest in the securities referenced. The holdings listed exclude any temporary cash investments.
| 10
NATIXIS VAUGHAN NELSON MID CAP ETF
Total Returns – December 31, 20203
| | | | | | | | | | | | |
| | | |
| | | Life of Fund
(Inception 9/16/20) | | | Expense Ratios4 | |
| | Gross | | | Net | |
| NAV1 | | | 18.91 | % | | | 5.64 | % | | | 0.90 | % |
| Market1 | | | 18.99 | | | | | | | | | |
| | | | |
| Comparative Performance | | | | | | | | | | | | |
| Russell Midcap® Value Index2 | | | 16.70 | | | | | | | | | |
Performance data shown represents past performance and is no guarantee of, and not necessarily indicative of, future results. Total return and value will vary, and you may have a gain or loss when shares are sold. Current performance may be lower or higher than quoted. For most recent month-end performance, visit im.natixis.com. You may not invest directly in an index. Performance for periods less than one year is cumulative, not annualized. Returns reflect changes in share price and reinvestment of dividends and capital gains, if any. The table(s) do not reflect taxes shareholders might owe on any fund distributions or when they redeem or sell their shares.
| 1 | The NAV return is based on the NAV of the Fund, and the market return is based on the market price per share of the Fund, which is determined by using the midpoint between the highest bid and the lowest offer on the primary stock exchange on which the shares of the Fund are listed for trading, as of the time that the Fund’s NAV is calculated. Since shares of the Fund did not trade on the secondary market until September 17, 2020, NAV is used as a proxy for the market price prior to that date. Market and NAV returns assume that dividends and capital gain distributions have been reinvested in the Fund at market price and NAV, respectively. |
| 2 | Russell Midcap® Value Index is an unmanaged index that measures the performance of the mid-cap value segment of the U.S. equity universe. It includes those Russell Midcap® Index companies with lower price-to-book ratios and lower forecasted growth values. |
| 3 | Fund performance has been increased by fee waivers and/or expense reimbursements, if any, without which performance would have been lower. |
| 4 | Expense ratios are as shown in the Fund’s prospectus in effect as of the date of this report. The expense ratios for the current reporting period can be found in the Financial Highlights section of this report under Ratios to Average Net Assets. Net expenses reflect contractual expense limitations set to expire on 4/30/23. When a Fund’s expenses are below the limitation, gross and net expense ratios will be the same. See Note 6 of the Notes to Financial Statements for more information about the Fund’s expense limitations. |
11 |
NATIXIS VAUGHAN NELSON SELECT ETF
| | |
| |
| Managers | | NYSE Arca: VNSE |
| |
| Scott J. Weber, CFA® | | |
| |
| Chris D. Wallis, CFA® | | |
| |
| Vaughan Nelson Investment Management, L.P. | | |
Investment Goal
The Fund seeks long-term capital appreciation.
Market Conditions
The recovery in financial markets continued in Q4 2020 with the S&P 500® and Russell 2000 Value rising 12.13% and 33.36%, respectively. For the year, the S&P 500® and Russell 2000 Value rose 18.4% and 4.6%, respectively. Positive vaccine data, combined with election results that indicated further stimulus is expected, were the impetus for the strong fourth quarter rally. The equity market rally materially boosted valuation multiples indicating a portion of the 2021 earnings recovery has already been discounted. As the economy continues to recover, additional policy support may be needed to offset the damage that occurred to key service sectors and the commercial real estate market.
US and international economies remain buoyed by the continued strong recovery in the industrial sector as global supply chains are busy rebuilding inventories and preparing for a post-Covid-19 normalization of activity. The recovery in the services side of the economy continues at a modest pace as renewed lockdowns have presented headwinds in the fourth quarter. One of the brightest spots in the US economy has been the strength in housing. The rapid increase in demand has pushed home prices materially higher. Higher home prices represent a near-term headwind but are a harbinger of increased economic activity as additional supply is brought to market to balance supply and demand.
A key driver of the recovery has been the weaker US dollar, which boosted commodity prices and eased the debt service burden of foreign borrowers. However, the falling US dollar and supply chain disruptions are leading to domestic price increases which will likely cause headline inflation to exceed the Federal Reserve’s 2% target during the first half of 2021. Should this increase in inflationary pressure prove transitory, and there are no material shifts in real yields, then we would not expect a material impact to risk assets. To the extent higher inflation expectations become more entrenched, or real yields move higher, a broader repricing of risk assets across sectors and asset classes is expected.
Performance Results
The Natixis Vaughan Nelson Select ETF was launched on September 16, 2020. For the period ending December 31, 2020, the Fund returned 10.37% at net asset value. The Fund underperformed its benchmark, the S&P 500® Index, which returned 11.45%.
Explanation of Fund Performance
As a result of buys and sells and market action, the largest sector overweights are Materials, Information Technology, Energy, and Industrials. Consumer Staples, Consumer Discretionary, Utilities, Financials, Real Estate, Health Care, and Communication Services are the most underweight sectors.
During the quarter, the portfolio experienced positive absolute and negative relative performance. Positive relative contributions from Information Technology, Health Care, Energy, Consumer Staples, Real Estate, and Utilities were modestly offset by negative relative contribution in Communication Services, Materials, Industrials, Financials, and Consumer Discretionary.
Outlook
After decades of reliance on monetary stimulus, the economy and capital markets suffer from excess leverage, malinvestment and structural imbalances that hamper the effectiveness of monetary tools. With the election behind us, we expect fiscal policy in close coordination with the Federal Reserve to take center stage in driving economic growth.
The last bout of loose fiscal policy was combined with tight monetary policy, which sustained US dollar strength. The next round of loose fiscal policy will likely be combined with loose monetary policy, which will pressure the US dollar. Should such economic policy be pursued, and successfully increase nominal GDP growth, it will represent a fundamental shift in the underlying economic conditions that have not been witnessed in years. Such a shift in the economic environment will likely lead to increased market volatility and broad changes in market leadership.
| 12
NATIXIS VAUGHAN NELSON SELECT ETF
Top Ten Holdings as of December 31, 2020
| | | | | | | | |
| | | |
| | | | Security name | | % of
net assets | |
| | 1 | | | Microsoft Corp. | | | 5.79 | % |
| | 2 | | | Facebook, Inc., Class A | | | 5.50 | |
| | 3 | | | Union Pacific Corp. | | | 5.41 | |
| | 4 | | | Amazon.com, Inc. | | | 5.28 | |
| | 5 | | | ON Semiconductor Corp. | | | 5.19 | |
| | 6 | | | Texas Instruments, Inc. | | | 5.13 | |
| | 7 | | | MasterCard, Inc., Class A | | | 4.98 | |
| | 8 | | | Sherwin-Williams Co. (The) | | | 4.93 | |
| | 9 | | | UnitedHealth Group, Inc. | | | 4.76 | |
| | 10 | | | Aon PLC, Class A | | | 4.04 | |
The portfolio is actively managed and holdings are subject to change. There is no guarantee the Fund continues to invest in the securities referenced. The holdings listed exclude any temporary cash investments.
13 |
Total Returns – December 31, 20203
| | | | | | | | | | | | |
| | | |
| | | Life of Fund
(Inception 9/16/20) | | | Expense Ratios4 | |
| | Gross | | | Net | |
| NAV1 | | | 10.37 | % | | | 5.59 | % | | | 0.85 | % |
| Market1 | | | 10.41 | | | | | | | | | |
| | | | |
| Comparative Performance | | | | | | | | | | | | |
| S&P 500® Index2 | | | 11.45 | | | | | | | | | |
Performance data shown represents past performance and is no guarantee of, and not necessarily indicative of, future results. Total return and value will vary, and you may have a gain or loss when shares are sold. Current performance may be lower or higher than quoted. For most recent month-end performance, visit im.natixis.com. You may not invest directly in an index. Performance for periods less than one year is cumulative, not annualized. Returns reflect changes in share price and reinvestment of dividends and capital gains, if any. The table(s) do not reflect taxes shareholders might owe on any fund distributions or when they redeem or sell their shares.
| 1 | The NAV return is based on the NAV of the Fund, and the market return is based on the market price per share of the Fund, which is determined by using the midpoint between the highest bid and the lowest offer on the primary stock exchange on which the shares of the Fund are listed for trading, as of the time that the Fund’s NAV is calculated. Since shares of the Fund did not trade on the secondary market until September 17, 2020, NAV is used as a proxy for the market price prior to that date. Market and NAV returns assume that dividends and capital gain distributions have been reinvested in the Fund at market price and NAV, respectively. |
| 2 | S&P 500® Index is a widely recognized measure of U.S. stock market performance. It is an unmanaged index of 500 common stocks chosen for market size, liquidity, and industry group representation, among other factors. It also measures the performance of the large cap segment of the US equities market. |
| 3 | Fund performance has been increased by fee waivers and/or expense reimbursements, if any, without which performance would have been lower. |
| 4 | Expense ratios are as shown in the Fund’s prospectus in effect as of the date of this report. The expense ratios for the current reporting period can be found in the Financial Highlights section of this report under Ratios to Average Net Assets. Net expenses reflect contractual expense limitations set to expire on 4/30/23. When a Fund’s expenses are below the limitation, gross and net expense ratios will be the same. See Note 6 of the Notes to Financial Statements for more information about the Fund’s expense limitations. |
| 14
ADDITIONAL INFORMATION
The views expressed in this report reflect those of the portfolio managers as of the dates indicated. The managers’ views are subject to change at any time without notice based on changes in market or other conditions. References to specific securities or industries should not be regarded as investment advice. Because the Funds are actively managed, there is no assurance that they will continue to invest in the securities or industries mentioned.
All investing involves risk, including the risk of loss. There is no assurance that any investment will meet its performance objectives or that losses will be avoided.
ADDITIONAL INDEX INFORMATION
This document may contain references to third party copyrights, indexes, and trademarks, each of which is the property of its respective owner. Such owner is not affiliated with Natixis Investment Managers or any of its related or affiliated companies (collectively “Natixis Affiliates”) and does not sponsor, endorse or participate in the provision of any Natixis Affiliates services, funds or other financial products.
The index information contained herein is derived from third parties and is provided on an “as is” basis. The user of this information assumes the entire risk of use of this information. Each of the third party entities involved in compiling, computing or creating index information disclaims all warranties (including, without limitation, any warranties of originality, accuracy, completeness, timeliness, non-infringement, merchantability and fitness for a particular purpose) with respect to such information.
PROXY VOTING INFORMATION
A description of the Funds’ proxy voting policies and procedures is available without charge, upon request, by calling 800-458-7452; through the Funds’ website at im.natixis.com; and on the Securities and Exchange Commission’s (SEC) website at www.sec.gov. Information regarding how the Funds voted proxies relating to portfolio securities during the most recent 12-month period ended June 30 is available on Natixis Funds’ website and the SEC’s website.
QUARTERLY PORTFOLIO SCHEDULES
The Natixis Funds file a complete schedule of portfolio holdings with the SEC for the first and third quarters of each fiscal year as an exhibit to its reports on Form N-PORT. The Funds’ Form N-PORT reports are available on the SEC’s website at www.sec.gov. First and third quarter schedules of portfolio holdings are also available at im.natixis.com/funddocuments. A hard copy may be requested from the Fund at no charge by calling 800-225-5478.
CFA® and Chartered Financial Analyst® are registered trademarks owned by the CFA Institute.
15 |
UNDERSTANDING FUND EXPENSES
As a shareholder, you incur two types of costs: (1) transaction costs, which may include creation and redemption fees and brokerage charges, and (2) ongoing costs, including management fees and other fund expenses. These ongoing costs are described in more detail in the Fund’s prospectus. The following examples are intended to help you understand the ongoing costs of investing in the Fund and help you compare these with the ongoing costs of investing in other funds.
The first line in the table shows the actual account values and actual Fund expenses you would have paid on a $1,000 investment in the Fund from July 1, 2020 through December 31, 2020. To estimate the expenses you paid over the period, simply divide your account value by $1,000 (for example $8,600 account value divided by $1,000 = 8.60) and multiply the result by the number in the Expenses Paid During Period column as shown below for your class.
The second line in the table provides information about hypothetical account values and hypothetical expenses based on the Fund’s actual expense ratios and an assumed rate of return of 5% per year before expenses, which is not the Fund’s actual return. The hypothetical account values and expenses may not be used to estimate the actual ending account balance or expenses you paid on your investment for the period. You may use this information to compare the ongoing costs of investing in the Fund and other funds. To do so, compare this 5% hypothetical example with the 5% hypothetical examples that appear in the shareholder reports of the other funds.
Please note that the expenses shown reflect ongoing costs only, and do not include any transaction costs, such as brokerage commissions on purchases and sales of Fund shares. Therefore, the second line in the table is useful in comparing ongoing costs only, and will not help you determine the relative costs of owning different funds. If transaction costs were included, total costs would be higher.
| | | | | | | | | | | | |
| NATIXIS LOOMIS SAYLES SHORT DURATION INCOME ETF | | BEGINNING
ACCOUNT VALUE
7/1/2020 | | | ENDING
ACCOUNT VALUE
12/31/2020 | | | EXPENSES PAID
DURING PERIOD*
7/1/2020 – 12/31/2020 | |
| Actual | | | $1,000.00 | | | | $1,018.40 | | | | $1.93 | |
| Hypothetical (5% return before expenses) | | | $1,000.00 | | | | $1,023.23 | | | | $1.93 | |
The chart above represents historical performance of a hypothetical investment of $1,000 in the fund for the most recent six-month period. Past performance does not guarantee future results. This chart does not reflect the deduction of taxes that a shareholder would pay on fund distributions or the redemption of fund shares.
| * | Expenses are equal to the Fund’s annualized expense ratio (after waiver/reimbursement) of 0.38%, multiplied by the average account value over the period, multiplied by the number of days in the most recent fiscal half-year (184), divided by 366 (to reflect the half-year period). |
| | | | | | | | | | | | |
| NATIXIS U.S. EQUITY OPPORTUNITIES ETF | | BEGINNING
ACCOUNT VALUE
7/1/20201 | | | ENDING
ACCOUNT VALUE
12/31/2020 | | | EXPENSES PAID
DURING PERIOD
7/1/20201 – 12/31/2020 | |
| Actual | | | $1,000.00 | | | | $1,147.80 | | | | $2.77 | 1 |
| Hypothetical (5% return before expenses) | | | $1,000.00 | | | | $1,020.61 | | | | $4.57 | * |
The chart above represents historical performance of a hypothetical investment of $1,000 in the fund for the most recent six-month period. Past performance does not guarantee future results. This chart does not reflect the deduction of taxes that a shareholder would pay on fund distributions or the redemption of fund shares.
| * | Expenses are equal to the Fund’s annualized expense ratio (after waiver/reimbursement) of 0.90%, multiplied by the average account value over the period, multiplied by the number of days in the most recent fiscal half-year (184), divided by 366 (to reflect the half-year period). |
| 1 | Fund commenced operations on September 16, 2020. Actual expenses are equal to the Fund’s annualized expense ratio (after waiver/reimbursement) of 0.90%, multiplied by the average account value over the period, multiplied by the number of days in the most recent fiscal period (105), divided by 366 (to reflect the partial period). |
| 16
| | | | | | | | | | | | |
| NATIXIS VAUGHAN NELSON MID CAP ETF | | BEGINNING
ACCOUNT VALUE
7/1/20201 | | | ENDING
ACCOUNT VALUE
12/31/2020 | | | EXPENSES PAID
DURING PERIOD
7/1/20201 – 12/31/2020 | |
| Actual | | | $1,000.00 | | | | $1,189.10 | | | | $2.83 | 1 |
| Hypothetical (5% return before expenses) | | | $1,000.00 | | | | $1,020.61 | | | | $4.57 | * |
The chart above represents historical performance of a hypothetical investment of $1,000 in the fund for the most recent six-month period. Past performance does not guarantee future results. This chart does not reflect the deduction of taxes that a shareholder would pay on fund distributions or the redemption of fund shares.
| * | Expenses are equal to the Fund’s annualized expense ratio (after waiver/reimbursement) of 0.90%, multiplied by the average account value over the period, multiplied by the number of days in the most recent fiscal half-year (184), divided by 366 (to reflect the half-year period). |
| 1 | Fund commenced operations on September 16, 2020. Actual expenses are equal to the Fund’s annualized expense ratio (after waiver/reimbursement) of 0.90%, multiplied by the average account value over the period, multiplied by the number of days in the most recent fiscal period (105), divided by 366 (to reflect the partial period). |
| | | | | | | | | | | | |
| NATIXIS VAUGHAN NELSON SELECT ETF | | BEGINNING
ACCOUNT VALUE
7/1/20201 | | | ENDING
ACCOUNT VALUE
12/31/2020 | | | EXPENSES PAID
DURING PERIOD
7/1/20201 – 12/31/2020 | |
| Actual | | | $1,000.00 | | | | $1,103.70 | | | | $2.56 | 1 |
| Hypothetical (5% return before expenses) | | | $1,000.00 | | | | $1,020.86 | | | | $4.32 | * |
The chart above represents historical performance of a hypothetical investment of $1,000 in the fund for the most recent six-month period. Past performance does not guarantee future results. This chart does not reflect the deduction of taxes that a shareholder would pay on fund distributions or the redemption of fund shares.
| * | Expenses are equal to the Fund’s annualized expense ratio (after waiver/reimbursement) of 0.85%, multiplied by the average account value over the period, multiplied by the number of days in the most recent fiscal half-year (184), divided by 366 (to reflect the half-year period). |
| 1 | Fund commenced operations on September 16, 2020. Actual expenses are equal to the Fund’s annualized expense ratio (after waiver/reimbursement) of 0.85%, multiplied by the average account value over the period, multiplied by the number of days in the most recent fiscal period (105), divided by 366 (to reflect the partial period). |
17 |
BOARD APPROVAL OF THE INITIAL ADVISORY AND SUB-ADVISORY AGREEMENTS FOR NATIXIS U.S. EQUITY OPPORTUNITIES ETF, NATIXIS VAUGHAN NELSON MID CAP ETF AND NATIXIS VAUGHAN NELSON SELECT ETF
The Investment Company Act of 1940, as amended (the “1940 Act”), requires that both the full Board of Trustees of the Trust (the “Board”) and a majority of the Trustees who are not “interested persons” (as defined in the 1940 Act) of the Trust (the “Independent Trustees”), voting separately, initially approve any new investment advisory and sub-advisory agreements for a registered investment company, including a newly formed fund such as the Natixis U.S. Equity Opportunities ETF, Natixis Vaughan Nelson Mid Cap ETF and Natixis Vaughan Nelson Select ETF (each, a “Fund” and together, the “Funds”). The Trustees, including the Independent Trustees, unanimously approved, for an initial two-year term, the proposed investment advisory and sub-advisory agreements (together, the “Agreements”) for the Funds at a meeting held on June 4, 2020.
In connection with this review, Fund management and other representatives of the Funds’ adviser, Natixis Advisors, L.P. (the “Adviser”), and the Funds’ sub-advisers, Harris Associates L.P. (“Harris Associates”), Loomis, Sayles & Company, L.P. (“Loomis Sayles”) and Vaughan Nelson Investment Management, L.P. (“Vaughan Nelson,” and, together with Harris Associates and Loomis Sayles, the “Subadvisers”), as applicable, distributed to the Trustees materials including, among other items, information regarding (i) each Fund’s investment objective, strategies and risks, (ii) the proposed advisory and sub-advisory fees and other expenses to be charged to each Fund, including information comparing each Fund’s expenses to those of peer groups and categories of funds and information on fees charged to other funds and accounts advised by the Adviser and the proposed expense cap, (iii) the size, education and experience of the Adviser’s and Subadvisers’ respective investment staffs and the investment strategies proposed to be used in managing the Funds, (iv) proposed arrangements for the distribution and trading of each Fund’s shares, (v) information about the Adviser’s performance, (vi) information about the unique attributes of the Funds as semi-transparent, actively managed ETFs as compared with traditional ETFs and the policies and procedures being implemented in respect of those attributes, and (vi) the general economic outlook with particular emphasis on the asset management industry.
The Trustees also considered the fact that they oversee other funds advised by the Adviser and Subadvisers as well as information about the Adviser and Subadvisers they had received in connection with their oversight of those other funds. Because each Fund is newly formed and had not commenced operations at the time of the Trustees’ review, certain information, including data relating to Fund performance, was not available, and therefore could not be distributed to the Trustees. Throughout the process, the Trustees were afforded the opportunity to ask questions of, and request additional materials from, the Adviser and the Subadvisers.
In considering whether to initially approve the Agreements, the Board, including the Independent Trustees, did not identify any single factor as determinative. Individual Trustees may have evaluated the information presented differently from one another, giving different weights to various factors. Matters considered by the Trustees, including the Independent Trustees, in connection with their approval of the Agreements included, but were not limited to, the factors listed below.
The nature, extent and quality of the services to be provided to the Funds under the Agreements. The Trustees considered the nature, extent and quality of the services to be provided by the Adviser, the Subadvisers and the Adviser’s affiliates to the Funds, which include advisory and non-advisory services directed to the needs and operations of each of the Funds as a semi-transparent, actively managed ETF. The Trustees also considered the resources to be dedicated to the Funds by the Adviser, the Subadvisers and the Adviser’s affiliates. The Trustees considered their experience with other funds advised or sub-advised by the Adviser and the Subadvisers, as well as the affiliation between the Adviser and Natixis Investment Managers, LLC (“Natixis Investment Managers”), whose affiliates provide investment advisory services to other funds in the same family of funds. In this regard, the Trustees considered not only the advisory and sub-advisory services proposed to be provided by the Adviser and the Subadvisers to the Funds, but also the monitoring and oversight services proposed to be provided by the Adviser. They also considered the administrative and shareholder services proposed to be provided by the Adviser and its affiliates to the Funds. They also considered the policies and infrastructure the Adviser and its affiliates had developed to operate the Funds as semi-transparent, actively managed ETFs.
After reviewing these and related factors, the Trustees concluded, within the context of their overall conclusions regarding the Agreements, that the scope of the services to be provided to the Funds under the Agreements seemed consistent with the Funds’ operational requirements, and that the Adviser and the Subadvisers had the capabilities, resources and personnel necessary to provide the advisory and sub-advisory services that would be required by each Fund. The Trustees determined that the nature, extent and quality of services proposed to be provided under the Agreements supported approval of the Agreements.
Investment performance of the Funds, the Adviser and the Subadvisers. Because each Fund had not yet commenced operations, performance information for each Fund was not considered; however, the Board considered the performance of other funds and accounts managed by the Adviser and the Subadvisers.
The Trustees also considered the Adviser’s and the Subadvisers’ performance and reputation generally, the performance of the fund family generally, and the historical responsiveness of the Adviser to Trustee concerns about performance and the willingness of the Adviser to take steps intended to improve performance.
| 18
After reviewing these and related factors, the Trustees concluded, within the context of their overall conclusions regarding the Agreements, that these relevant factors supported approval of the Agreements.
The costs of the services to be provided by the Adviser and profits to be realized by the Adviser and its affiliates from their respective relationships with each Fund. Although each Fund had not yet commenced operations at the time of the Trustees’ review of the Agreements, the Trustees reviewed information comparing the proposed advisory and sub-advisory fees and estimated total expenses of each Fund with the fees and expenses of comparable funds identified by the Adviser, including information about how those funds were selected and information about differences in such fees. In evaluating each Fund’s proposed advisory and sub-advisory fees, the Trustees also took into account the demands, complexity and quality of the investment management of each Fund, including the additional responsibilities of the Adviser and the Subadvisers and their affiliates in managing a semi-transparent, actively managed ETF. The Trustees also noted that each Fund would have an expense cap in place. In addition, the Trustees considered information regarding the administrative fees to be paid by each Fund to the Adviser.
Because each Fund had not yet commenced operations, historical profitability information with respect to each Fund was not considered. However, the Trustees noted the information provided in court cases in which adviser profitability was an issue, the estimated expense level of each Fund, and that each Fund would be subject to an expense cap.
After reviewing these and related factors, the Trustees concluded, within the context of their overall conclusions regarding the Agreements, that the advisory and sub-advisory fees and expenses proposed to be charged to each Fund were fair and reasonable, and supported the approval of the Agreements.
Economies of scale. The Trustees considered the extent to which the Adviser and the Subadvisers may realize economies of scale in the provision of services by the Adviser and the Subadvisers, respectively, and whether those economies could be shared with each Fund through breakpoints in its investment advisory and sub-advisory fees or other means, such as expense caps. The Trustees noted that each Fund will be subject to an expense cap. After reviewing these and related factors, the Trustees concluded, within the context of their overall conclusions regarding the Agreements, that the extent to which economies of scale might be shared with each Fund supported the approval of the Agreements.
The Trustees also considered other factors, which included but were not limited to the following:
| • | | The compliance-related resources the Adviser, the Subadvisers and the Adviser’s affiliates would provide to each Fund. |
| • | | The nature, quality, cost and extent of administrative and shareholder services to be performed by the Adviser and its affiliates, both under the Agreements and under separate agreements covering administrative services. |
| • | | So-called “fallout benefits” to the Adviser and its affiliates, such as the engagement of the Adviser to provide administrative services to each Fund, the benefits to Natixis Investment Managers and the Adviser of being able to offer semi-transparent ETFs in the Natixis family of funds and the benefits of research made available to the Adviser by reason of brokerage commissions (if any) generated by each Fund’s securities transactions. The Trustees also considered the benefits to the parent company of the Adviser from the retention of the Adviser and the Subadvisers. The Trustees considered the possible conflicts of interest associated with these fallout and other benefits, and the reporting, disclosure and other processes in place to disclose and monitor such possible conflicts of interest. |
Based on their evaluation of all factors that they deemed to be material, including those factors described above, and assisted by the advice of independent counsel, the Trustees, including the Independent Trustees, concluded that the Agreements should be approved.
19 |
Portfolio of Investments – as of December 31, 2020
Natixis Loomis Sayles Short Duration Income ETF
| | | | | | | | |
Principal
Amount | | | Description | | Value (†) | |
| | Bonds and Notes — 93.4% of Net Assets | |
| | | | ABS Car Loan — 11.0% | |
| $ | 160,000 | | | Ally Master Owner Trust, Series 2018-1, Class A2, 2.700%, 1/17/2023(a) | | $ | 160,143 | |
| | 20,000 | | | American Credit Acceptance Receivables Trust, Series 2020-2, Class B, 2.480%, 9/13/2024, 144A(a) | | | 20,480 | |
| | 105,000 | | | American Credit Acceptance Receivables Trust, Series 2019-4, Class C, 2.690%, 12/12/2025, 144A(a) | | | 107,235 | |
| | 15,000 | | | American Credit Acceptance Receivables Trust, Series 2020-1A, Class B, 2.080%, 12/13/2023, 144A | | | 15,144 | |
| | 5,000 | | | American Credit Acceptance Receivables Trust, Series 2020-3, Class B, 1.150%, 8/13/2024, 144A | | | 5,026 | |
| | 10,000 | | | American Credit Acceptance Receivables Trust, Series 2020-4, Class C, 1.310%, 12/14/2026, 144A(a) | | | 10,044 | |
| | 115,000 | | | AmeriCredit Automobile Receivables Trust, Series 2018-3, Class B, 3.580%, 10/18/2024(a) | | | 118,965 | |
| | 20,000 | | | AmeriCredit Automobile Receivables Trust, Series 2019-2, Class B, 2.540%, 7/18/2024(a) | | | 20,564 | |
| | 10,000 | | | AmeriCredit Automobile Receivables Trust, Series 2020-3, Class C, 1.060%, 8/18/2026 | | | 10,042 | |
| | 100,000 | | | Avis Budget Rental Car Funding AESOP LLC, Series 2019-2A, Class A, 3.350%, 9/22/2025, 144A(a) | | | 106,772 | |
| | 37,120 | | | CarMax Auto Owner Trust, Series 2019-4, Class A2A, 2.010%, 3/15/2023(a) | | | 37,360 | |
| | 20,114 | | | CarMax Auto Owner Trust, Series 2018-1, Class A3, 2.480%, 11/15/2022(a) | | | 20,258 | |
| | 15,000 | | | CarMax Auto Owner Trust, Series 2019-3, Class A3, 2.180%, 8/15/2024(a) | | | 15,373 | |
| | 35,000 | | | Carvana Auto Receivables Trust, Series 2020-P1, Class A3, 0.440%, 6/09/2025 | | | 35,051 | |
| | 70,145 | | | Carvana Auto Receivables Trust, Series 2019-3A, Class A3, 2.340%, 6/15/2023, 144A(a) | | | 70,543 | |
| | 104,283 | | | CIG Auto Receivables Trust, Series 2020-1A, Class A, 0.680%, 10/12/2023, 144A(a) | | | 104,303 | |
| | 6,633 | | | CPS Auto Receivables Trust, Series 2018-D, Class B, 3.610%, 11/15/2022, 144A(a) | | | 6,641 | |
| | 13,659 | | | Drive Auto Receivables Trust, Series 2018-5, Class B, 3.680%, 7/15/2023(a) | | | 13,678 | |
| | 5,000 | | | Drive Auto Receivables Trust, Series 2019-3, Class B, 2.650%, 2/15/2024 | | | 5,052 | |
| | 4,805 | | | DT Auto Owner Trust, Series 2018-2A, Class C, 3.670%, 3/15/2024, 144A | | | 4,822 | |
| | 35,000 | | | DT Auto Owner Trust, Series 2019-1A, Class C, 3.610%, 11/15/2024, 144A(a) | | | 35,658 | |
| | 35,000 | | | DT Auto Owner Trust, Series 2019-2A, Class C, 3.180%, 2/18/2025, 144A(a) | | | 35,721 | |
| | 10,000 | | | DT Auto Owner Trust, Series 2019-4A, Class B, 2.360%, 1/16/2024, 144A | | | 10,131 | |
| | 10,000 | | | DT Auto Owner Trust, Series 2020-1A, Class B, 2.160%, 5/15/2024, 144A | | | 10,147 | |
| | 15,000 | | | DT Auto Owner Trust, Series 2020-2A, Class C, 3.280%, 3/16/2026, 144A(a) | | | 15,767 | |
| | 35,799 | | | DT Auto Owner Trust, Series 2020-3A, Class A, 0.540%, 4/15/2024, 144A(a) | | | 35,864 | |
| | 35,000 | | | DT Auto Owner Trust, Series 2020-3A, Class C, 1.470%, 6/15/2026, 144A(a) | | | 35,190 | |
| | 17,111 | | | Exeter Automobile Receivables Trust, Series 2019-2A, Class B, 3.060%, 5/15/2023, 144A(a) | | | 17,198 | |
| | 9,768 | | | Exeter Automobile Receivables Trust, Series 2019-3A, Class B, 2.580%, 8/15/2023, 144A(a) | | | 9,828 | |
| | 20,000 | | | Exeter Automobile Receivables Trust, Series 2020-1A, Class B, 2.260%, 4/15/2024, 144A(a) | | | 20,240 | |
| | 25,000 | | | Exeter Automobile Receivables Trust, Series 2020-2A, Class C, 3.280%, 5/15/2025, 144A(a) | | | 26,244 | |
| | | | ABS Car Loan — continued | | | | |
| 30,000 | | | Exeter Automobile Receivables Trust, Series 2020-3A, Class C, 1.320%, 7/15/2025(a) | | | 30,156 | |
| | 15,143 | | | First Investors Auto Owner Trust, Series 2019-1A, Class A, 2.890%, 3/15/2024, 144A(a) | | | 15,294 | |
| | 27,999 | | | First Investors Auto Owner Trust, Series 2019-2A, Class A, 2.210%, 9/16/2024, 144A(a) | | | 28,243 | |
| | 35,994 | | | Flagship Credit Auto Trust, Series 2018-1, Class B, 3.130%, 1/17/2023, 144A(a) | | | 36,152 | |
| | 35,000 | | | Flagship Credit Auto Trust, Series 2018-4, Class B, 3.880%, 10/16/2023, 144A(a) | | | 35,837 | |
| | 10,000 | | | Flagship Credit Auto Trust, Series 2020-2, Class C, 3.800%, 4/15/2026, 144A(a) | | | 10,663 | |
| | 15,000 | | | Flagship Credit Auto Trust, Series 2020-4, Class C, 1.280%, 2/16/2027, 144A(a) | | | 15,119 | |
| | 40,000 | | | Ford Credit Auto Lease Trust, Series 2020-A, Class A3, 1.850%, 3/15/2023(a) | | | 40,537 | |
| | 4,221 | | | Ford Credit Auto Owner Trust, Series 2019-B, Class A2A, 2.350%, 2/15/2022(a) | | | 4,224 | |
| | 47,274 | | | Foursight Capital Automobile Receivables Trust, Series 2018-2, Class A3, 3.640%, 5/15/2023, 144A(a) | | | 47,614 | |
| | 18,188 | | | GLS Auto Receivables Issuer Trust, Series 2019-2A, Class A, 3.060%, 4/17/2023, 144A(a) | | | 18,308 | |
| | 35,000 | | | GLS Auto Receivables Issuer Trust, Series 2019-4A, Class B, 2.780%, 9/16/2024, 144A(a) | | | 35,964 | |
| | 3,403 | | | GLS Auto Receivables Trust, Series 2018-1A, Class A, 2.820%, 7/15/2022, 144A(a) | | | 3,406 | |
| | 32,384 | | | GLS Auto Receivables Trust, Series 2018-3A, Class B, 3.780%, 8/15/2023, 144A(a) | | | 32,912 | |
| | 65,000 | | | GLS Auto Receivables Trust, Series 2020-3A, Class B, 1.380%, 8/15/2024, 144A(a) | | | 65,573 | |
| | 40,000 | | | GM Financial Automobile Leasing Trust, Series 2020-3, Class A3, 0.450%, 8/21/2023(a) | | | 40,099 | |
| | 51,341 | | | GM Financial Consumer Automobile Receivables Trust, Series 2018-2, Class A3, 2.810%, 12/16/2022(a) | | | 51,834 | |
| | 55,000 | | | GM Financial Consumer Automobile Receivables Trust, Series 2019-3, Class A3, 2.180%, 4/16/2024(a) | | | 55,890 | |
| | 17,844 | | | GM Financial Consumer Automobile Receivables Trust, Series 2020-1, Class A2, 1.830%, 1/17/2023(a) | | | 17,913 | |
| | 35,000 | | | Harley-Davidson Motorcycle Trust, Series 2020-A, Class A3, 1.870%, 10/15/2024(a) | | | 35,623 | |
| | 70,000 | | | Honda Auto Receivables Owner Trust, Series 2020-3, Class A3, 0.370%, 10/18/2024(a) | | | 70,190 | |
| | 30,976 | | | Mercedes-Benz Auto Lease Trust, Series 2019-B, Class A2, 2.010%, 12/15/2021(a) | | | 31,038 | |
| | 100,000 | | | NextGear Floorplan Master Owner Trust, Series 2020-1A, Class A2, 1.550%, 2/15/2025, 144A(a) | | | 102,200 | |
| | 50,000 | | | Nissan Auto Lease Trust, Series 2020-A, Class A3, 1.840%, 1/17/2023(a) | | | 50,758 | |
| | 50,000 | | | Nissan Auto Lease Trust, Series 2020-B, Class A3, 0.430%, 10/16/2023(a) | | | 50,066 | |
| | 70,000 | | | Prestige Auto Receivables Trust, Series 2020-1A, Class C, 1.310%, 11/16/2026, 144A(a) | | | 70,213 | |
| | 25,000 | | | Santander Consumer Auto Receivables Trust, Series 2020-AA, Class C, 3.710%, 2/17/2026, 144A(a) | | | 26,580 | |
| | 26,410 | | | Santander Drive Auto Receivables Trust, Series 2019-1, Class B, 3.210%, 9/15/2023(a) | | | 26,521 | |
| | 30,000 | | | Santander Drive Auto Receivables Trust, Series 2019-2, Class C, 2.900%, 10/15/2024(a) | | | 30,709 | |
| | 37,861 | | | Santander Drive Auto Receivables Trust, Series 2018-5, Class C, 3.810%, 12/16/2024(a) | | | 38,279 | |
| | 27,527 | | | Santander Drive Auto Receivables Trust, Series 2019-3, Class A3, 2.160%, 11/15/2022(a) | | | 27,572 | |
| | 10,000 | | | Santander Drive Auto Receivables Trust, Series 2020-2, Class B, 0.960%, 11/15/2024(a) | | | 10,061 | |
See accompanying notes to financial statements.
| 20
Portfolio of Investments – as of December 31, 2020
Natixis Loomis Sayles Short Duration Income ETF – (continued)
| | | | | | | | |
Principal
Amount | | | Description | | Value (†) | |
| | | | ABS Car Loan — continued | | | | |
| $ | 65,000 | | | Santander Drive Auto Receivables Trust, Series 2020-3, Class C, 1.120%, 1/15/2026(a) | | $ | 65,535 | |
| | 40,000 | | | Santander Drive Auto Receivables Trust, Series 2020-4, Class C, 1.010%, 1/15/2026(a) | | | 40,174 | |
| | 43,429 | | | USAA Auto Owner Trust, Series 2019-1, Class A3, 2.160%, 7/17/2023(a) | | | 43,812 | |
| | 25,000 | | | Westlake Automobile Receivables Trust, Series 2019-1A, Class B, 3.260%, 10/17/2022, 144A(a) | | | 25,148 | |
| | 25,000 | | | Westlake Automobile Receivables Trust, Series 2020-2A, Class C, 2.010%, 7/15/2025, 144A(a) | | | 25,463 | |
| | 15,000 | | | Westlake Automobile Receivables Trust, Series 2020-3A, Class C, 1.240%, 11/17/2025, 144A(a) | | | 15,092 | |
| | 57,159 | | | World Omni Auto Receivables Trust, Series 2018-B, Class A3, 2.870%, 7/17/2023(a) | | | 57,969 | |
| | 80,000 | | | World Omni Auto Receivables Trust, Series 2020-A, Class A3, 1.700%, 1/17/2023(a) | | | 81,577 | |
| | 35,000 | | | World Omni Select Auto Trust, Series 2020-A, Class A3, 0.550%, 7/15/2025(a) | | | 35,079 | |
| | | | | | | | |
| | | | | | | 2,684,881 | |
| | | | | | | | |
| | | | ABS Credit Card — 0.9% | |
| | 100,000 | | | World Financial Network Credit Card Master Trust, Series 2016-A, Class A, 2.030%, 4/15/2025(a) | | | 100,751 | |
| | 110,000 | | | World Financial Network Credit Card Master Trust, Series 2019-C, Class A, 2.210%, 7/15/2026(a) | | | 113,400 | |
| | | | | | | | |
| | | | | | | 214,151 | |
| | | | | | | | |
| | | | ABS Other — 0.5% | |
| | 67,798 | | | OneMain Financial Issuance Trust, Series 2015-3A, Class A, 3.630%, 11/20/2028, 144A(a) | | | 67,888 | |
| | 20,543 | | | SCF Equipment Leasing LLC, Series 2018-1A, Class A2, 3.630%, 10/20/2024, 144A(a) | | | 20,607 | |
| | 10,377 | | | SoFi Consumer Loan Program Trust, Series 2018-2, Class A2, 3.350%, 4/26/2027, 144A(a) | | | 10,406 | |
| | 11,986 | | | SoFi Consumer Loan Program Trust, Series 2018-4, Class A, 3.540%, 11/26/2027, 144A(a) | | | 12,031 | |
| | | | | | | | |
| | | | | | | 110,932 | |
| | | | | | | | |
| | | | ABS Student Loan — 0.6% | |
| | 32,445 | | | SoFi Professional Loan Program LLC, Series 2015-D, Class A2, 2.720%, 10/27/2036, 144A(a) | | | 32,908 | |
| | 118,416 | | | SoFi Professional Loan Program Trust , Series 2020-A, Class A1FX, 2.060%, 5/15/2046, 144A(a) | | | 119,690 | |
| | | | | | | | |
| | | | | | | 152,598 | |
| | | | | | | | |
| | | | Aerospace & Defense — 0.5% | |
| | 25,000 | | | Boeing Co. (The), 3.625%, 2/01/2031 | | | 27,359 | |
| | 60,000 | | | General Dynamics Corp., 3.000%, 5/11/2021(a) | | | 60,578 | |
| | 20,000 | | | Huntington Ingalls Industries, Inc., 3.844%, 5/01/2025 | | | 22,224 | |
| | 2,000 | | | Raytheon Technologies Corp., 3.650%, 8/16/2023 | | | 2,156 | |
| | | | | | | | |
| | | | | | | 112,317 | |
| | | | | | | | |
| | | | Agency Commercial Mortgage-Backed Securities — 0.4% | |
| | 54,991 | | | FHLMC Multifamily Structured Pass Through Certificates, Series KF81, Class AL, 1-month LIBOR + 0.360%, 0.513%, 6/25/2027(a)(b) | | | 55,388 | |
| | 39,993 | | | FHLMC Multifamily Structured Pass Through Certificates, Series KF81, Class AS, 30-day Average SOFR + 0.400%, 0.485%, 6/25/2027(a)(b) | | | 40,114 | |
| | 9,113 | | | FHLMC Multifamily Structured Pass Through Certificates, Series KJ28, Class A1,
1.766%, 2/25/2025(a) | | | 9,264 | |
| | | | | | | | |
| | | | | | | 104,766 | |
| | | | | | | | |
| | | | Airlines — 0.4% | |
| 25,000 | | | Southwest Airlines Co., 5.125%, 6/15/2027 | | | 29,740 | |
| | 55,000 | | | Southwest Airlines Co., 5.250%, 5/04/2025 | | | 63,699 | |
| | | | | | | | |
| | | | | | | 93,439 | |
| | | | | | | | |
| | | | Automotive — 3.2% | |
| | 30,000 | | | Allison Transmission, Inc., 3.750%, 1/30/2031, 144A | | | 30,694 | |
| | 65,000 | | | American Honda Finance Corp., MTN,
0.650%, 9/08/2023(a) | | | 65,410 | |
| | 75,000 | | | American Honda Finance Corp., MTN,
2.200%, 6/27/2022(a) | | | 77,072 | |
| | 60,000 | | | BMW U.S. Capital LLC, 3.400%, 8/13/2021, 144A(a) | | | 61,118 | |
| | 55,000 | | | BMW U.S. Capital LLC, 3.450%, 4/12/2023, 144A(a) | | | 58,611 | |
| | 35,000 | | | General Motors Co., 3-month LIBOR + 0.900%,
1.130%, 9/10/2021(b) | | | 35,040 | |
| | 60,000 | | | General Motors Financial Co., Inc., 2.900%, 2/26/2025 | | | 64,075 | |
| | 25,000 | | | Harley-Davidson Financial Services, Inc.,
3.350%, 6/08/2025, 144A | | | 27,080 | |
| | 30,000 | | | Harley-Davidson Financial Services, Inc.,
4.050%, 2/04/2022, 144A(a) | | | 31,048 | |
| | 40,000 | | | Hyundai Capital America, 2.375%, 2/10/2023, 144A | | | 41,225 | |
| | 45,000 | | | Hyundai Capital America, 3.000%, 2/10/2027, 144A | | | 47,986 | |
| | 40,000 | | | Nissan Motor Acceptance Corp.,
3.150%, 3/15/2021, 144A(a) | | | 40,177 | |
| | 25,000 | | | PACCAR Financial Corp., MTN, 1.900%, 2/07/2023(a) | | | 25,817 | |
| | 15,000 | | | PACCAR Financial Corp., MTN, 2.000%, 9/26/2022 | | | 15,444 | |
| | 40,000 | | | PACCAR Financial Corp., MTN, 2.800%, 3/01/2021(a) | | | 40,137 | |
| | 75,000 | | | Toyota Motor Credit Corp., GMTN,
3.050%, 1/08/2021(a) | | | 75,018 | |
| | 50,000 | | | Toyota Motor Credit Corp., MTN, 0.450%, 7/22/2022(a) | | | 50,138 | |
| | | | | | | | |
| | | | | | | 786,090 | |
| | | | | | | | |
| | | | Banking — 9.0% | |
| | 100,000 | | | Ally Financial, Inc., 3.050%, 6/05/2023 | | | 105,440 | |
| | 75,000 | | | American Express Co., 3.700%, 11/05/2021(a) | | | 76,916 | |
| | 125,000 | | | Bank of America Corp., (fixed rate to 1/20/2022, variable rate thereafter), MTN, 3.124%, 1/20/2023(a) | | | 128,589 | |
| | 40,000 | | | Bank of America Corp., (fixed rate to 5/17/2021, variable rate thereafter), MTN, 3.499%, 5/17/2022(a) | | | 40,474 | |
| | 40,000 | | | Bank of America Corp., (fixed rate to 6/19/2025, variable rate thereafter), MTN, 1.319%, 6/19/2026(a) | | | 40,853 | |
| | 35,000 | | | Bank of Montreal, SOFR + 0.350%,
0.438%, 12/08/2023(a)(b) | | | 35,018 | |
| | 65,000 | | | Bank of Montreal, MTN, 2.900%, 3/26/2022(a) | | | 67,113 | |
| | 35,000 | | | Bank of New York Mellon Corp. (The), MTN,
1.600%, 4/24/2025(a) | | | 36,592 | |
| | 55,000 | | | Bank of Nova Scotia (The), 1.950%, 2/01/2023(a) | | | 56,801 | |
| | 50,000 | | | Bank of Nova Scotia (The), 2.500%, 1/08/2021(a) | | | 50,009 | |
| | 15,000 | | | Canadian Imperial Bank of Commerce,
0.950%, 6/23/2023(a) | | | 15,198 | |
| | 20,000 | | | Canadian Imperial Bank of Commerce,
2.700%, 2/02/2021(a) | | | 20,036 | |
| | 70,000 | | | Canadian Imperial Bank of Commerce, (fixed rate to 7/22/2022, variable rate thereafter),
2.606%, 7/22/2023(a) | | | 72,412 | |
| | 85,000 | | | Capital One Financial Corp., 3.200%, 1/30/2023(a) | | | 89,556 | |
| | 15,000 | | | Capital One Financial Corp., 3.750%, 3/09/2027 | | | 17,118 | |
| | 80,000 | | | Citigroup, Inc., (fixed rate to 1/24/2022, variable rate thereafter), 3.142%, 1/24/2023(a) | | | 82,263 | |
| | 75,000 | | | Comerica, Inc., 3.700%, 7/31/2023(a) | | | 80,913 | |
| | 50,000 | | | Fifth Third Bancorp, 2.600%, 6/15/2022(a) | | | 51,531 | |
| | 85,000 | | | Goldman Sachs Group, Inc. (The), (fixed rate to 11/17/2022, variable rate thereafter),
0.627%, 11/17/2023(a) | | | 85,397 | |
See accompanying notes to financial statements.
21 |
Portfolio of Investments – as of December 31, 2020
Natixis Loomis Sayles Short Duration Income ETF – (continued)
| | | | | | | | |
Principal
Amount | | | Description | | Value (†) | |
| | | | Banking — continued | | | | |
| $ | 110,000 | | | JPMorgan Chase & Co., (fixed rate to 4/01/2022, variable rate thereafter), 3.207%, 4/01/2023(a) | | $ | 113,994 | |
| | 80,000 | | | Macquarie Bank Ltd., 2.100%, 10/17/2022, 144A(a) | | | 82,517 | |
| | 110,000 | | | Mitsubishi UFJ Financial Group, Inc.,
2.665%, 7/25/2022(a) | | | 113,807 | |
| | 100,000 | | | Morgan Stanley, GMTN, SOFR + 0.700%,
0.785%, 1/20/2023(a)(b) | | | 100,321 | |
| | 35,000 | | | Royal Bank of Canada, GMTN, 1.600%, 4/17/2023(a) | | | 35,992 | |
| | 80,000 | | | Royal Bank of Canada, GMTN, 1.950%, 1/17/2023(a) | | | 82,616 | |
| | 55,000 | | | Santander Holdings USA, Inc., 3.450%, 6/02/2025 | | | 60,066 | |
| | 55,000 | | | State Street Corp., (fixed rate to 3/30/2025, variable rate thereafter), 2.901%, 3/30/2026(a) | | | 59,913 | |
| | 65,000 | | | Synchrony Financial, 2.850%, 7/25/2022 | | | 67,122 | |
| | 15,000 | | | Synchrony Financial, 4.375%, 3/19/2024 | | | 16,515 | |
| | 40,000 | | | Toronto-Dominion Bank (The), GMTN,
2.550%, 1/25/2021(a) | | | 40,048 | |
| | 40,000 | | | Toronto-Dominion Bank (The), MTN,
3.250%, 6/11/2021(a) | | | 40,527 | |
| | 95,000 | | | Truist Financial Corp., 2.700%, 1/27/2022(a) | | | 97,242 | |
| | 40,000 | | | Truist Financial Corp., MTN, 3.050%, 6/20/2022(a) | | | 41,516 | |
| | 65,000 | | | Westpac Banking Corp., 2.650%, 1/25/2021(a) | | | 65,092 | |
| | 25,000 | | | Westpac Banking Corp., 2.800%, 1/11/2022(a) | | | 25,651 | |
| | | | | | | | |
| | | | | | | 2,195,168 | |
| | | | | | | | |
| | | | Brokerage — 0.7% | |
| | 80,000 | | | Ameriprise Financial, Inc., 3.000%, 3/22/2022(a) | | | 82,613 | |
| | 40,000 | | | Charles Schwab Corp. (The), 1.650%, 3/11/2031(a) | | | 40,392 | |
| | 15,000 | | | Charles Schwab Corp. (The), 3.250%, 5/21/2021(a) | | | 15,134 | |
| | 35,000 | | | Owl Rock Technology Finance Corp., 3.750%, 6/17/2026, 144A | | | 35,190 | |
| | | | | | | | |
| | | | | | | 173,329 | |
| | | | | | | | |
| | | | Building Materials — 0.3% | |
| | 30,000 | | | American Woodmark Corp., 4.875%, 3/15/2026, 144A | | | 30,750 | |
| | 40,000 | | | Vulcan Materials Co., 3-month LIBOR + 0.650%, 0.875%, 3/01/2021(b) | | | 40,017 | |
| | | | | | | | |
| | | | | | | 70,767 | |
| | | | | | | | |
| | | | Cable Satellite — 0.4% | |
| | 80,000 | | | Comcast Corp., 3.300%, 4/01/2027(a) | | | 90,968 | |
| | | | | | | | |
| | | | Chemicals — 0.7% | |
| | 95,000 | | | DuPont de Nemours, Inc., 2.169%, 5/01/2023 | | | 96,259 | |
| | 45,000 | | | LYB International Finance III LLC, 3-month LIBOR + 1.000%, 1.238%, 10/01/2023(b) | | | 45,078 | |
| | 30,000 | | | Nutrition & Biosciences, Inc.,
1.832%, 10/15/2027, 144A | | | 30,920 | |
| | | | | | | | |
| | | | | | | 172,257 | |
| | | | | | | | |
| | | | Collateralized Mortgage Obligations — 2.9% | |
| | 143,503 | | | Government National Mortgage Association, Series 2019-H13, Class FT, 1-year CMT + 0.450%,
0.570%, 8/20/2069(a)(b) | | | 143,372 | |
| | 2,701 | | | Government National Mortgage Association, Series 2011-H23, Class HA, 3.000%, 12/20/2061(a)(c)(d) | | | 2,752 | |
| | 1,184 | | | Government National Mortgage Association, Series 2012-H28, Class FA, 1-month LIBOR + 0.580%,
0.720%, 9/20/2062(a)(b)(c)(d) | | | 1,176 | |
| | 16,094 | | | Government National Mortgage Association, Series 2013-H04, Class BA, 1.650%, 2/20/2063(a)(c)(d) | | | 16,053 | |
| | 13,342 | | | Government National Mortgage Association, Series 2013-H10, Class LA, 2.500%, 4/20/2063(a) | | | 13,414 | |
| | 44,315 | | | Government National Mortgage Association, Series 2013-H11, Class JA, 3.500%, 4/20/2063(a) | | | 44,990 | |
| | | | Collateralized Mortgage Obligations — continued | | | | |
| 30,858 | | | Government National Mortgage Association, Series 2016-H13, Class FT, 1-month LIBOR + 0.580%,
0.720%, 5/20/2066(a)(b) | | | 30,931 | |
| | 9,680 | | | Government National Mortgage Association, Series 2017-H24, Class FJ, 1-month LIBOR + 0.250%,
0.390%, 10/20/2067(a)(b)(c)(d) | | | 9,631 | |
| | 19,001 | | | Government National Mortgage Association, Series 2018-H02, Class FJ, 1-month LIBOR + 0.200%,
0.340%, 10/20/2064(a)(b) | | | 18,970 | |
| | 58,394 | | | Government National Mortgage Association, Series 2019-H01, Class FJ, 1-month LIBOR + 0.300%,
0.440%, 9/20/2068(a)(b) | | | 58,292 | |
| | 48,694 | | | Government National Mortgage Association, Series 2019-H01, Class FT, 1-month LIBOR + 0.400%,
0.540%, 10/20/2068(a)(b) | | | 48,684 | |
| | 69,430 | | | Government National Mortgage Association, Series 2019-H0A, Class FT, 1-year CMT + 0.430%,
0.550%, 4/20/2069(a)(b) | | | 69,602 | |
| | 240,860 | | | Government National Mortgage Association, Series 2020-HO1, Class FT, 1-year CMT + 0.500%,
2.036%, 1/20/2070(a)(b) | | | 240,939 | |
| | | | | | | | |
| | | | | | | 698,806 | |
| | | | | | | | |
| | | | Construction Machinery — 1.3% | |
| | 40,000 | | | Caterpillar Financial Services Corp.,
0.650%, 7/07/2023(a) | | | 40,335 | |
| | 75,000 | | | Caterpillar Financial Services Corp., MTN,
1.950%, 11/18/2022(a) | | | 77,380 | |
| | 40,000 | | | Caterpillar Financial Services Corp., MTN,
3.150%, 9/07/2021(a) | | | 40,773 | |
| | 80,000 | | | CNH Industrial Capital LLC, 1.950%, 7/02/2023 | | | 82,356 | |
| | 40,000 | | | John Deere Capital Corp., MTN, 2.875%, 3/12/2021(a) | | | 40,197 | |
| | 30,000 | | | John Deere Capital Corp., MTN, 2.950%, 4/01/2022(a) | | | 31,000 | |
| | | | | | | | |
| | | | | | | 312,041 | |
| | | | | | | | |
| | | | Consumer Cyclical Services — 0.9% | |
| | 70,000 | | | Expedia Group, Inc., 6.250%, 5/01/2025, 144A | | | 81,137 | |
| | 50,000 | | | Mastercard, Inc., 3.300%, 3/26/2027(a) | | | 57,044 | |
| | 70,000 | | | Western Union Co. (The), 4.250%, 6/09/2023 | | | 75,928 | |
| | | | | | | | |
| | | | | | | 214,109 | |
| | | | | | | | |
| | | | Consumer Products — 0.4% | |
| | 95,000 | | | Hasbro, Inc., 3.550%, 11/19/2026 | | | 106,030 | |
| | | | | | | | |
| | | | Diversified Manufacturing — 1.3% | |
| | 35,000 | | | Amphenol Corp., 2.050%, 3/01/2025 | | | 36,974 | |
| | 75,000 | | | Carrier Global Corp., 1.923%, 2/15/2023 | | | 77,263 | |
| | 45,000 | | | General Electric Co., 3.450%, 5/01/2027 | | | 50,897 | |
| | 35,000 | | | Honeywell International, Inc., 1.850%, 11/01/2021(a) | | | 35,414 | |
| | 85,000 | | | Otis Worldwide Corp., 3-month LIBOR + 0.450%, 0.688%, 4/05/2023(b) | | | 84,990 | |
| | 30,000 | | | Trane Technologies Global Holding Co. Ltd.,
2.900%, 2/21/2021 | | | 30,095 | |
| | | | | | | | |
| | | | | | | 315,633 | |
| | | | | | | | |
| | | | Electric — 5.0% | |
| | 55,000 | | | AES Corp. (The), 1.375%, 1/15/2026, 144A | | | 55,472 | |
| | 45,000 | | | AES Corp. (The), 3.300%, 7/15/2025, 144A | | | 49,050 | |
| | 25,000 | | | Alliant Energy Finance LLC, 3.750%, 6/15/2023, 144A | | | 26,786 | |
| | 65,000 | | | Alliant Energy Finance LLC, 4.250%, 6/15/2028, 144A | | | 75,414 | |
| | 65,000 | | | American Electric Power Co., Inc., Series A, 3-month LIBOR + 0.480%, 0.680%, 11/01/2023(b) | | | 65,096 | |
| | 85,000 | | | Consolidated Edison, Inc., Series A,
0.650%, 12/01/2023 | | | 85,169 | |
| | 30,000 | | | Dominion Energy, Inc., 3.071%, 8/15/2024 | | | 32,386 | |
See accompanying notes to financial statements.
| 22
Portfolio of Investments – as of December 31, 2020
Natixis Loomis Sayles Short Duration Income ETF – (continued)
| | | | | | | | |
Principal
Amount | | | Description | | Value (†) | |
| | | | Electric — continued | | | | |
| $ | 65,000 | | | Dominion Energy, Inc., Series D, 3-month LIBOR + 0.530%, 0.747%, 9/15/2023(b) | | $ | 65,120 | |
| | 5,000 | | | Edison International, 4.950%, 4/15/2025 | | | 5,691 | |
| | 45,000 | | | Eversource Energy, Series N, 3.800%, 12/01/2023(a) | | | 49,264 | |
| | 70,000 | | | Exelon Corp., 2.450%, 4/15/2021 | | | 70,275 | |
| | 15,000 | | | Liberty Utilities Finance GP, 2.050%, 9/15/2030, 144A | | | 15,078 | |
| | 70,000 | | | National Rural Utilities Cooperative Finance Corp., MTN, 2.900%, 3/15/2021(a) | | | 70,352 | |
| | 65,000 | | | NRG Energy, Inc., 2.000%, 12/02/2025, 144A | | | 67,361 | |
| | 45,000 | | | Pacific Gas & Electric Co., 3-month LIBOR + 1.375%, 1.600%, 11/15/2021(b) | | | 45,025 | |
| | 45,000 | | | PNM Resources, Inc., 3.250%, 3/09/2021 | | | 45,177 | |
| | 35,000 | | | PSEG Power LLC, 3.850%, 6/01/2023 | | | 37,656 | |
| | 75,000 | | | Southern California Edison Co., Series D, 3-month LIBOR + 0.270%, 0.501%, 12/03/2021(a)(b) | | | 75,032 | |
| | 75,000 | | | Vistra Operations Co. LLC, 3.700%, 1/30/2027, 144A | | | 82,701 | |
| | 110,000 | | | WEC Energy Group, Inc., 0.550%, 9/15/2023(a) | | | 110,550 | |
| | 90,000 | | | Xcel Energy, Inc., 0.500%, 10/15/2023 | | | 90,255 | |
| | | | | | | | |
| | | | | | | 1,218,910 | |
| | | | | | | | |
| | | | Environmental — 0.1% | |
| | 30,000 | | | Waste Management, Inc., 1.500%, 3/15/2031(a) | | | 29,718 | |
| | | | | | | | |
| | | | Finance Companies — 3.2% | |
| | 40,000 | | | Air Lease Corp., 2.500%, 3/01/2021 | | | 40,122 | |
| | 80,000 | | | Aircastle Ltd., 5.250%, 8/11/2025, 144A | | | 88,108 | |
| | 75,000 | | | Ares Capital Corp., 3.250%, 7/15/2025 | | | 79,484 | |
| | 70,000 | | | Aviation Capital Group LLC, 3.875%, 5/01/2023, 144A | | | 72,938 | |
| | 5,000 | | | Avolon Holdings Funding Ltd., 4.250%, 4/15/2026, 144A | | | 5,387 | |
| | 50,000 | | | Avolon Holdings Funding Ltd., 5.500%, 1/15/2026, 144A | | | 56,646 | |
| | 75,000 | | | FS KKR Capital Corp., 3.400%, 1/15/2026 | | | 74,535 | |
| | 15,000 | | | FS KKR Capital Corp., 4.125%, 2/01/2025 | | | 15,614 | |
| | 80,000 | | | Goldman Sachs BDC, Inc., 2.875%, 1/15/2026 | | | 81,630 | |
| | 15,000 | | | Navient Corp., 5.000%, 3/15/2027 | | | 15,131 | |
| | 75,000 | | | Navient Corp., MTN, 7.250%, 1/25/2022 | | | 78,375 | |
| | 65,000 | | | Oaktree Specialty Lending Corp., 3.500%, 2/25/2025 | | | 67,307 | |
| | 100,000 | | | Owl Rock Capital Corp., 3.400%, 7/15/2026 | | | 101,432 | |
| | | | | | | | |
| | | | | | | 776,709 | |
| | | | | | | | |
| | | | Financial Other — 0.4% | |
| | 85,000 | | | ORIX Corp., 2.900%, 7/18/2022(a) | | | 88,093 | |
| | | | | | | | |
| | | | Food & Beverage — 1.1% | |
| | 35,000 | | | Bunge Ltd. Finance Corp., 4.350%, 3/15/2024 | | | 38,610 | |
| | 80,000 | | | Mondelez International, Inc., 0.625%, 7/01/2022 | | | 80,348 | |
| | 60,000 | | | PepsiCo, Inc., 0.400%, 10/07/2023(a) | | | 60,330 | |
| | 75,000 | | | Sysco Corp., 5.650%, 4/01/2025 | | | 89,175 | |
| | | | | | | | |
| | | | | | | 268,463 | |
| | | | | | | | |
| | | | Gaming — 0.3% | |
| | 65,000 | | | GLP Capital LP/GLP Financing II, Inc.,
5.250%, 6/01/2025 | | | 73,130 | |
| | | | | | | | |
| | | | Health Insurance — 0.2% | |
| | 40,000 | | | Centene Corp., 3.000%, 10/15/2030 | | | 42,396 | |
| | | | | | | | |
| | | | Healthcare — 1.1% | |
| | 102,000 | | | Cigna Corp., 3.750%, 7/15/2023(a) | | | 110,269 | |
| | 30,000 | | | CVS Health Corp., 1.875%, 2/28/2031 | | | 30,373 | |
| | 20,000 | | | CVS Health Corp., 3.700%, 3/09/2023 | | | 21,396 | |
| | 85,000 | | | McKesson Corp., 0.900%, 12/03/2025 | | | 85,425 | |
| | 24,000 | | | Zimmer Biomet Holdings, Inc., 3-month LIBOR + 0.750%, 0.989%, 3/19/2021(b) | | | 24,000 | |
| | | | | | | | |
| | | | | | | 271,463 | |
| | | | | | | | |
| | | | Independent Energy — 0.5% | |
| | 55,000 | | | EQT Corp., 7.875%, 2/01/2025 | | | 62,631 | |
| | 50,000 | | | Occidental Petroleum Corp., 8.000%, 7/15/2025 | | | 56,950 | |
| | | | | | | | |
| | | | | | | 119,581 | |
| | | | | | | | |
| | | | Integrated Energy — 1.0% | |
| 30,000 | | | Exxon Mobil Corp., 3.294%, 3/19/2027(a) | | | 34,189 | |
| | 115,000 | | | Shell International Finance BV, 2.375%, 4/06/2025(a) | | | 123,337 | |
| | 95,000 | | | Total Capital International S.A., 2.218%, 7/12/2021(a) | | | 95,805 | |
| | | | | | | | |
| | | | | | | 253,331 | |
| | | | | | | | |
| | | | Life Insurance — 3.3% | |
| | 20,000 | | | AIG Global Funding, 0.800%, 7/07/2023, 144A | | | 20,197 | |
| | 95,000 | | | AIG Global Funding, 2.300%, 7/01/2022, 144A(a) | | | 97,569 | |
| | 50,000 | | | Athene Global Funding, 2.500%, 1/14/2025, 144A(a) | | | 52,405 | |
| | 30,000 | | | Athene Global Funding, 2.550%, 11/19/2030, 144A(a) | | | 30,023 | |
| | 65,000 | | | Equitable Holdings, Inc., 3.900%, 4/20/2023 | | | 69,932 | |
| | 40,000 | | | Guardian Life Global Funding,
1.100%, 6/23/2025, 144A(a) | | | 40,571 | |
| | 45,000 | | | Guardian Life Global Funding,
3.400%, 4/25/2023, 144A(a) | | | 48,070 | |
| | 75,000 | | | Jackson National Life Global Funding,
3.300%, 2/01/2022, 144A(a) | | | 77,381 | |
| | 20,000 | | | Jackson National Life Global Funding,
3.875%, 6/11/2025, 144A(a) | | | 22,548 | |
| | 175,000 | | | Principal Life Global Funding II,
0.500%, 1/08/2024, 144A(a) | | | 175,379 | |
| | 70,000 | | | Reliance Standard Life Global Funding II,
2.150%, 1/21/2023, 144A(a) | | | 71,761 | |
| | 75,000 | | | Unum Group, 4.500%, 3/15/2025 | | | 84,949 | |
| | | | | | | | |
| | | | | | | 790,785 | |
| | | | | | | | |
| | | | Lodging — 0.2% | |
| | 10,000 | | | Choice Hotels International, Inc., 3.700%, 1/15/2031 | | | 11,075 | |
| | 30,000 | | | Hyatt Hotels Corp., 5.375%, 4/23/2025 | | | 33,904 | |
| | | | | | | | |
| | | | | | | 44,979 | |
| | | | | | | | |
| | | | Media Entertainment — 0.3% | |
| | 80,000 | | | Outfront Media Capital LLC/Outfront Media Capital Corp., 6.250%, 6/15/2025, 144A | | | 84,400 | |
| | | | | | | | |
| | | | Metals & Mining — 0.5% | |
| | 40,000 | | | Freeport-McMoRan, Inc., 4.625%, 8/01/2030 | | | 43,900 | |
| | 65,000 | | | Glencore Funding LLC, 4.125%, 3/12/2024, 144A | | | 71,526 | |
| | | | | | | | |
| | | | | | | 115,426 | |
| | | | | | | | |
| | | | Midstream — 1.5% | |
| | 55,000 | | | Gray Oak Pipeline LLC, 2.600%, 10/15/2025, 144A | | | 56,687 | |
| | 55,000 | | | Midwest Connector Capital Co. LLC,
3.625%, 4/01/2022, 144A(a) | | | 55,963 | |
| | 90,000 | | | MPLX LP, 3.375%, 3/15/2023 | | | 95,318 | |
| | 50,000 | | | Northriver Midstream Finance LP,
5.625%, 2/15/2026, 144A | | | 51,640 | |
| | 75,000 | | | ONEOK, Inc., 5.850%, 1/15/2026 | | | 89,882 | |
| | 10,000 | | | Plains All American Pipeline LP/PAA Finance Corp., 3.800%, 9/15/2030 | | | 10,751 | |
| | | | | | | | |
| | | | | | | 360,241 | |
| | | | | | | | |
| | | | Natural Gas — 0.2% | |
| | 45,000 | | | CenterPoint Energy Resources Corp.,
3.550%, 4/01/2023(a) | | | 47,994 | |
| | | | | | | | |
| | | | Non-Agency Commercial Mortgage-Backed Securities — 0.7% | |
| | 164,502 | | | Benchmark Mortgage Trust, Series 2019-B10, Class A1, 2.793%, 3/15/2062(a) | | | 169,765 | |
| | | | | | | | |
| | | | Paper — 0.4% | |
| | 85,000 | | | Georgia-Pacific LLC, 0.625%, 5/15/2024, 144A(a) | | | 85,279 | |
| | | | | | | | |
| | | | Pharmaceuticals — 2.1% | |
| | 120,000 | | | AbbVie, Inc., 2.150%, 11/19/2021(a) | | | 121,933 | |
| | 95,000 | | | AstraZeneca PLC, 3.500%, 8/17/2023(a) | | | 102,333 | |
| | 80,000 | | | Bayer U.S. Finance II LLC, 3.375%, 7/15/2024, 144A | | | 86,489 | |
| | 10,000 | | | Bristol-Myers Squibb Co., 2.000%, 8/01/2022 | | | 10,263 | |
See accompanying notes to financial statements.
23 |
Portfolio of Investments – as of December 31, 2020
Natixis Loomis Sayles Short Duration Income ETF – (continued)
| | | | | | | | |
Principal
Amount | | | Description | | Value (†) | |
| | | | Pharmaceuticals — continued | | | | |
| $ | 70,000 | | | Bristol-Myers Squibb Co., 3.550%, 8/15/2022(a) | | $ | 73,749 | |
| | 60,000 | | | Pfizer, Inc., 3.200%, 9/15/2023(a) | | | 64,720 | |
| | 50,000 | | | Viatris, Inc., 2.300%, 6/22/2027, 144A | | | 53,231 | |
| | | | | | | | |
| | | | | | | 512,718 | |
| | | | | | | | |
| | | | Property & Casualty Insurance — 0.7% | |
| | 30,000 | | | Allstate Corp. (The), 3-month LIBOR + 0.630%,
0.881%, 3/29/2023(a)(b) | | | 30,248 | |
| | 80,000 | | | AON Corp., 2.200%, 11/15/2022(a) | | | 82,686 | |
| | 45,000 | | | Assurant, Inc., 4.200%, 9/27/2023 | | | 49,222 | |
| | | | | | | | |
| | | | | | | 162,156 | |
| | | | | | | | |
| | | | Refining — 0.7% | |
| | 85,000 | | | Marathon Petroleum Corp., 4.500%, 5/01/2023 | | | 92,295 | |
| | 30,000 | | | Phillips 66, 3-month LIBOR + 0.600%,
0.833%, 2/26/2021(a)(b) | | | 30,004 | |
| | 50,000 | | | Valero Energy Corp., 2.150%, 9/15/2027 | | | 51,088 | |
| | | | | | | | |
| | | | | | | 173,387 | |
| | | | | | | | |
| | | | REITs – Diversified — 0.2% | |
| | 45,000 | | | Digital Realty Trust LP, 2.750%, 2/01/2023 | | | 46,985 | |
| | | | | | | | |
| | | | REITs – Mortgage — 0.5% | |
| | 55,000 | | | Ladder Capital Finance Holdings LLLP/Ladder Capital Finance Corp., 4.250%, 2/01/2027, 144A | | | 54,037 | |
| | 70,000 | | | Starwood Property Trust, Inc.,
5.500%, 11/01/2023, 144A | | | 73,150 | |
| | | | | | | | |
| | | | | | | 127,187 | |
| | | | | | | | |
| | | | REITs – Office Property — 0.3% | |
| | 60,000 | | | Office Properties Income Trust, 4.500%, 2/01/2025 | | | 63,571 | |
| | | | | | | | |
| | | | REITs – Regional Malls — 0.5% | |
| | 70,000 | | | Simon Property Group LP, 2.625%, 6/15/2022(a) | | | 71,835 | |
| | 45,000 | | | Simon Property Group LP, 3.500%, 9/01/2025(a) | | | 49,973 | |
| | | | | | | | |
| | | | | | | 121,808 | |
| | | | | | | | |
| | | | REITs – Shopping Centers — 0.2% | |
| | 40,000 | | | Federal Realty Investment Trust, 3.950%, 1/15/2024(a) | | | 43,514 | |
| | | | | | | | |
| | | | Restaurants — 0.2% | |
| | 50,000 | | | McDonald’s Corp., MTN, 3.500%, 7/01/2027 | | | 57,357 | |
| | | | | | | | |
| | | | Retailers — 0.9% | |
| | 65,000 | | | Alimentation Couche-Tard, Inc.,
2.700%, 7/26/2022, 144A | | | 67,183 | |
| | 80,000 | | | Home Depot, Inc. (The), 2.500%, 4/15/2027(a) | | | 87,791 | |
| | 20,000 | | | Ken Garff Automotive LLC, 4.875%, 9/15/2028, 144A | | | 20,800 | |
| | 50,000 | | | NIKE, Inc., 2.750%, 3/27/2027(a) | | | 55,326 | |
| | | | | | | | |
| | | | | | | 231,100 | |
| | | | | | | | |
| | | | Supermarkets — 0.2% | |
| | 60,000 | | | Albertsons Cos, Inc./Safeway, Inc./New Albertsons LP/Albertsons LLC, 3.250%, 3/15/2026, 144A | | | 60,900 | |
| | | | | | | | |
| | | | Technology — 4.2% | |
| | 50,000 | | | Broadcom, Inc., 3.150%, 11/15/2025 | | | 54,598 | |
| | 30,000 | | | CDW LLC/CDW Finance Corp., 3.250%, 2/15/2029 | | | 30,591 | |
| | 80,000 | | | Dell International LLC/EMC Corp.,
5.850%, 7/15/2025, 144A | | | 96,065 | |
| | 60,000 | | | DXC Technology Co., 4.125%, 4/15/2025 | | | 66,327 | |
| | 105,000 | | | Genpact Luxembourg S.a.r.l., 3.700%, 4/01/2022 | | | 107,058 | |
| | 20,000 | | | Hewlett Packard Enterprise Co., 1.450%, 4/01/2024 | | | 20,550 | |
| | 75,000 | | | Hewlett Packard Enterprise Co., 4.650%, 10/01/2024 | | | 85,133 | |
| | 80,000 | | | Infor, Inc., 1.450%, 7/15/2023, 144A | | | 81,293 | |
| | 80,000 | | | Juniper Networks, Inc., 1.200%, 12/10/2025 | | | 80,952 | |
| | 90,000 | | | Marvell Technology Group Ltd., 4.200%, 6/22/2023 | | | 97,394 | |
| | 15,000 | | | Microchip Technology, Inc., 0.972%, 2/15/2024, 144A | | | 15,037 | |
| | 75,000 | | | Microchip Technology, Inc., 2.670%, 9/01/2023, 144A | | | 78,440 | |
| | | | Technology — continued | | | | |
| 20,000 | | | Microchip Technology, Inc., 3.922%, 6/01/2021 | | | 20,284 | |
| | 75,000 | | | Micron Technology, Inc., 2.497%, 4/24/2023 | | | 78,151 | |
| | 35,000 | | | NXP BV/NXP Funding LLC/NXP USA, Inc.,
3.150%, 5/01/2027, 144A | | | 38,589 | |
| | 65,000 | | | Seagate HDD Cayman, 4.875%, 3/01/2024 | | | 70,603 | |
| | | | | | | | |
| | | | | | | 1,021,065 | |
| | | | | | | | |
| | | | Tobacco — 0.8% | |
| | 80,000 | | | Altria Group, Inc., 3.800%, 2/14/2024(a) | | | 87,359 | |
| | 85,000 | | | BAT Capital Corp., 4.700%, 4/02/2027(a) | | | 99,949 | |
| | | | | | | | |
| | | | | | | 187,308 | |
| | | | | | | | |
| | | | Transportation Services — 1.4% | |
| | 50,000 | | | Element Fleet Management Corp.,
3.850%, 6/15/2025, 144A | | | 53,293 | |
| | 85,000 | | | FedEx Corp., 3.400%, 1/14/2022 | | | 87,685 | |
| | 60,000 | | | Penske Truck Leasing Co. LP/PTL Finance Corp., 3.650%, 7/29/2021, 144A | | | 60,926 | |
| | 30,000 | | | Penske Truck Leasing Co. LP/PTL Finance Corp., 4.125%, 8/01/2023, 144A | | | 32,608 | |
| | 35,000 | | | Ryder System, Inc., MTN, 3.875%, 12/01/2023 | | | 38,205 | |
| | 50,000 | | | Ryder System, Inc., MTN, 4.625%, 6/01/2025 | | | 57,937 | |
| | | | | | | | |
| | | | | | | 330,654 | |
| | | | | | | | |
| | | | Treasuries — 24.9% | |
| | 5,905,000 | | | U.S. Treasury Note, 0.125%, 11/30/2022 | | | 5,905,692 | |
| | 155,000 | | | U.S. Treasury Note, 0.375%, 11/30/2025 | | | 155,218 | |
| | | | | | | | |
| | | | | | | 6,060,910 | |
| | | | | | | | |
| | | | Wirelines — 0.2% | |
| | 50,000 | | | Verizon Communications, Inc., 3.000%, 3/22/2027(a) | | | 55,472 | |
| | | | | | | | |
| | | | Total Bonds and Notes
(Identified Cost $22,245,505) | | | 22,705,037 | |
| | | | | | | | |
| | | | | | | | |
| | Short-Term Investments — 6.3% | |
| | 341,369 | | | Tri-Party Repurchase Agreement with Fixed Income Clearing Corporation, dated 12/31/2020 at 0.000% to be repurchased at $341,369 on 1/04/2021 collateralized by $334,800 U.S. Treasury Note, 2.125% due 12/31/2022 valued at $348,244 including accrued interest (Note 2 of Notes to Financial Statements) | | | 341,369 | |
| | 315,000 | | | U.S. Treasury Bills, 0.073%, 2/04/2021(a)(e) | | | 314,985 | |
| | 470,000 | | | U.S. Treasury Bills, 0.078%, 1/14/2021(e) | | | 469,994 | |
| | 390,000 | | | U.S. Treasury Bills, 0.084%, 1/28/2021(e) | | | 389,985 | |
| | | | | | | | |
| | | | Total Short-Term Investments
(Identified Cost $1,516,309) | | | 1,516,333 | |
| | | | | | | | |
| | | | | | | | |
| | | | Total Investments — 99.7%
(Identified Cost $23,761,814) | | | 24,221,370 | |
| | | | Other assets less liabilities — 0.3% | | | 82,307 | |
| | | | | | | | |
| | | | Net Assets — 100.0% | | $ | 24,303,677 | |
| | | | | | | | |
| | | | | | | | |
| | (†) | | | See Note 2 of Notes to Financial Statements. | |
| | (a) | | | Security (or a portion thereof) has been designated to cover the Fund’s obligations under open derivative contracts. | |
| | (b) | | | Variable rate security. Rate as of December 31, 2020 is disclosed. | |
| | (c) | | | Level 3 security. Value has been determined using significant unobservable inputs. See Note 3 of Notes to Financial Statements. | |
| | (d) | | | Fair valued by the Fund’s adviser. At December 31, 2020, the value of these securities amounted to $29,612 or 0.1% of net assets. See Note 2 of Notes to Financial Statements. | |
| | (e) | | | Interest rate represents discount rate at time of purchase; not a coupon rate. | |
See accompanying notes to financial statements.
| 24
Portfolio of Investments – as of December 31, 2020
Natixis Loomis Sayles Short Duration Income ETF – (continued)
| | | | | | |
| | 144A | | | All or a portion of these securities are exempt from registration under Rule 144A of the Securities Act of 1933. These securities may be resold in transactions exempt from registration, normally to qualified institutional buyers. At December 31, 2020, the value of Rule 144A holdings amounted to $4,683,143 or 19.3% of net assets. |
| | ABS | | | Asset-Backed Securities |
| | CMT | | | Constant Maturity Treasury |
| | FHLMC | | | Federal Home Loan Mortgage Corp. |
| | GMTN | | | Global Medium Term Note |
| | LIBOR | | | London Interbank Offered Rate |
| | MTN | | | Medium Term Note |
| | REITs | | | Real Estate Investment Trusts |
| | SOFR | | | Secured Overnight Financing Rate |
At December 31, 2020, open long futures contracts were as follows:
| | | | | | | | | | | | | | | | | | | | |
| Financial Futures | | Expiration
Date | | | Contracts | | | Notional
Amount | | | Value | | | Unrealized
Appreciation
(Depreciation) | |
2 Year U.S. Treasury Note | | | 3/31/2021 | | | | 20 | | | $ | 4,416,357 | | | $ | 4,419,531 | | | $ | 3,174 | |
| | | | | | | | | | | | | | | | | | | | |
| | | | | | | | | | | | | | | | | | | | |
At December 31, 2020, open short futures contracts were as follows: | |
| Financial Futures | | Expiration
Date | | | Contracts | | | Notional
Amount | | | Value | | | Unrealized
Appreciation
(Depreciation) | |
5 Year U.S. Treasury Note | | | 3/31/2021 | | | | 9 | | | $ | 1,133,420 | | | $ | 1,135,476 | | | $ | (2,056 | ) |
10 Year U.S. Treasury Note | | | 3/22/2021 | | | | 10 | | | | 1,379,782 | | | | 1,380,781 | | | | (999 | ) |
| | | | | | | | | | | | | | | | | | | | |
Total | | | $ | (3,055 | ) |
| | | | | | | | | | | | | | | | | | | | |
Industry Summary at December 31, 2020
| | | | |
Treasuries | | | 24.9 | % |
ABS Car Loan | | | 11.0 | |
Banking | | | 9.0 | |
Electric | | | 5.0 | |
Technology | | | 4.2 | |
Life Insurance | | | 3.3 | |
Automotive | | | 3.2 | |
Finance Companies | | | 3.2 | |
Collateralized Mortgage Obligations | | | 2.9 | |
Pharmaceuticals | | | 2.1 | |
Other Investments, less than 2% each | | | 24.6 | |
Short-Term Investments | | | 6.3 | |
| | | | |
Total Investments | | | 99.7 | |
Other assets less liabilities (including futures contracts) | | | 0.3 | |
| | | | |
Net Assets | | | 100.0 | % |
| | | | |
See accompanying notes to financial statements.
25 |
Portfolio of Investments – as of December 31, 2020
Natixis U.S. Equity Opportunities ETF
| | | | | | | | |
| Shares | | | Description | | Value (†) | |
| | Common Stocks — 96.9% of Net Assets | |
| | | | Aerospace & Defense — 2.1% | |
| | 1,171 | | | Boeing Co. (The) | | $ | 250,664 | |
| | | | | | | | |
| | | | Air Freight & Logistics — 1.4% | |
| | 1,782 | | | Expeditors International of Washington, Inc. | | | 169,486 | |
| | | | | | | | |
| | | | Automobiles — 1.7% | |
| | 4,832 | | | General Motors Co. | | | 201,204 | |
| | | | | | | | |
| | | | Banks — 6.1% | |
| | 9,828 | | | Bank of America Corp. | | | 297,887 | |
| | 4,833 | | | Citigroup, Inc. | | | 298,003 | |
| | 4,134 | | | Wells Fargo & Co. | | | 124,764 | |
| | | | | | | | |
| | | | | | | 720,654 | |
| | | | | | | | |
| | | | Beverages — 3.9% | |
| | 902 | | | Constellation Brands, Inc., Class A | | | 197,583 | |
| | 2,858 | | | Monster Beverage Corp.(a) | | | 264,308 | |
| | | | | | | | |
| | | | | | | 461,891 | |
| | | | | | | | |
| | | | Biotechnology — 1.8% | |
| | 712 | | | BioMarin Pharmaceutical, Inc.(a) | | | 62,435 | |
| | 324 | | | Regeneron Pharmaceuticals, Inc.(a) | | | 156,528 | |
| | | | | | | | |
| | | | | | | 218,963 | |
| | | | | | | | |
| | | | Capital Markets — 7.8% | |
| | 5,282 | | | Charles Schwab Corp. (The) | | | 280,157 | |
| | 247 | | | FactSet Research Systems, Inc. | | | 82,128 | |
| | 571 | | | Moody’s Corp. | | | 165,727 | |
| | 209 | | | MSCI, Inc. | | | 93,325 | |
| | 1,547 | | | SEI Investments Co. | | | 88,906 | |
| | 2,909 | | | State Street Corp. | | | 211,717 | |
| | | | | | | | |
| | | | | | | 921,960 | |
| | | | | | | | |
| | | | Communications Equipment — 0.7% | |
| | 1,788 | | | Cisco Systems, Inc. | | | 80,013 | |
| | | | | | | | |
| | | | Consumer Finance — 3.7% | |
| | 1,147 | | | American Express Co. | | | 138,684 | |
| | 3,032 | | | Capital One Financial Corp. | | | 299,713 | |
| | | | | | | | |
| | | | | | | 438,397 | |
| | | | | | | | |
| | | | Electronic Equipment, Instruments & Components — 1.3% | |
| | 1,269 | | | TE Connectivity Ltd. | | | 153,638 | |
| | | | | | | | |
| | | | Energy Equipment & Services — 0.6% | |
| | 3,201 | | | Schlumberger NV | | | 69,878 | |
| | | | | | | | |
| | | | Entertainment — 4.1% | |
| | 452 | | | Netflix, Inc.(a) | | | 244,410 | |
| | 1,305 | | | Walt Disney Co. (The)(a) | | | 236,440 | |
| | | | | | | | |
| | | | | | | 480,850 | |
| | | | | | | | |
| | | | Health Care Equipment & Supplies — 0.5% | |
| | 79 | | | Intuitive Surgical, Inc.(a) | | | 64,630 | |
| | | | | | | | |
| | | | Health Care Providers & Services — 3.9% | |
| | 2,046 | | | CVS Health Corp. | | | 139,742 | |
| | 1,025 | | | HCA Healthcare, Inc. | | | 168,571 | |
| | 369 | | | Humana, Inc. | | | 151,390 | |
| | | | | | | | |
| | | | | | | 459,703 | |
| | | | | | | | |
| | | | Health Care Technology — 0.9% | |
| | 1,305 | | | Cerner Corp. | | | 102,416 | |
| | | | | | | | |
| | | | Hotels, Restaurants & Leisure — 5.4% | | | | |
| | 1,436 | | | Hilton Worldwide Holdings, Inc. | | | 159,769 | |
| | 6,000 | | | MGM Resorts International | | | 189,060 | |
| | 1,331 | | | Starbucks Corp. | | | 142,391 | |
| | 1,515 | | | Yum China Holdings, Inc. | | | 86,491 | |
| | 545 | | | Yum! Brands, Inc. | | | 59,165 | |
| | | | | | | | |
| | | | | | | 636,876 | |
| | | | | | | | |
| | | | Household Products — 0.5% | |
| | 753 | | | Colgate-Palmolive Co. | | | 64,389 | |
| | | | | | | | |
| | | | Industrial Conglomerates — 1.6% | |
| | 17,553 | | | General Electric Co. | | | 189,572 | |
| | | | | | | | |
| | | | Insurance — 3.1% | |
| | 5,732 | | | American International Group, Inc. | | | 217,014 | |
| | 1,310 | | | Reinsurance Group of America, Inc. | | | 151,829 | |
| | | | | | | | |
| | | | | | | 368,843 | |
| | | | | | | | |
| | | | Interactive Media & Services — 9.3% | |
| | 242 | | | Alphabet, Inc., Class A(a) | | | 424,139 | |
| | 77 | | | Alphabet, Inc., Class C(a) | | | 134,895 | |
| | 2,010 | | | Facebook, Inc., Class A(a) | | | 549,051 | |
| | | | | | | | |
| | | | | | | 1,108,085 | |
| | | | | | | | |
| | | | Internet & Direct Marketing Retail — 7.9% | |
| | 1,116 | | | Alibaba Group Holding Ltd., Sponsored ADR(a) | | | 259,727 | |
| | 122 | | | Amazon.com, Inc.(a) | | | 397,345 | |
| | 123 | | | Booking Holdings, Inc.(a) | | | 273,954 | |
| | | | | | | | |
| | | | | | | 931,026 | |
| | | | | | | | |
| | | | IT Services — 3.6% | |
| | 227 | | | Automatic Data Processing, Inc. | | | 39,997 | |
| | 5,461 | | | DXC Technology Co. | | | 140,621 | |
| | 1,134 | | | Visa, Inc., Class A | | | 248,040 | |
| | | | | | | | |
| | | | | | | 428,658 | |
| | | | | | | | |
| | | | Life Sciences Tools & Services — 1.2% | |
| | 376 | | | Illumina, Inc.(a) | | | 139,120 | |
| | | | | | | | |
| | | | Machinery — 3.2% | |
| | 942 | | | Caterpillar, Inc. | | | 171,463 | |
| | 769 | | | Deere & Co. | | | 206,899 | |
| | | | | | | | |
| | | | | | | 378,362 | |
| | | | | | | | |
| | | | Media — 3.4% | |
| | 246 | | | Charter Communications, Inc., Class A(a) | | | 162,741 | |
| | 4,627 | | | Comcast Corp., Class A | | | 242,455 | |
| | | | | | | | |
| | | | | | | 405,196 | |
| | | | | | | | |
| | | | Oil, Gas & Consumable Fuels — 2.6% | |
| | 9,822 | | | Apache Corp. | | | 139,374 | |
| | 3,395 | | | EOG Resources, Inc. | | | 169,309 | |
| | | | | | | | |
| | | | | | | 308,683 | |
| | | | | | | | |
| | | | Pharmaceuticals — 1.8% | |
| | 1,796 | | | Novartis AG, Sponsored ADR | | | 169,596 | |
| | 654 | | | Novo Nordisk A/S, Sponsored ADR | | | 45,682 | |
| | | | | | | | |
| | | | | | | 215,278 | |
| | | | | | | | |
| | | | Semiconductors & Semiconductor Equipment — 3.5% | |
| | 517 | | | NVIDIA Corp. | | | 269,977 | |
| | 966 | | | QUALCOMM, Inc. | | | 147,161 | |
| | | | | | | | |
| | | | | | | 417,138 | |
| | | | | | | | |
| | | | Software — 8.5% | | | | |
| | 1,017 | | | Autodesk, Inc.(a) | | | 310,531 | |
| | 666 | | | Microsoft Corp. | | | 148,132 | |
| | 3,293 | | | Oracle Corp. | | | 213,024 | |
| | 725 | | | salesforce.com, Inc.(a) | | | 161,334 | |
| | 703 | | | Workday, Inc., Class A(a) | | | 168,446 | |
| | | | | | | | |
| | | | | | | 1,001,467 | |
| | | | | | | | |
| | | | Textiles, Apparel & Luxury Goods — 0.8% | | | | |
| | 5,651 | | | Under Armour, Inc., Class A(a) | | | 97,028 | |
| | | | | | | | |
| | | | Total Common Stocks
(Identified Cost $9,960,679) | | | 11,484,068 | |
| | | | | | | | |
See accompanying notes to financial statements.
| 26
Portfolio of Investments – as of December 31, 2020
Natixis U.S. Equity Opportunities ETF — (continued)
| | | | | | | | |
Principal
Amount | | | Description | | Value (†) | |
| | Short-Term Investments — 3.3% | | | | |
| $ | 398,701 | | | Tri-Party Repurchase Agreement with Fixed Income Clearing Corporation, dated 12/31/2020 at 0.000% to be repurchased at $398,701 on 1/04/2021 collateralized by $406,800 U.S. Treasury Note, 0.125% due 8/15/2023 valued at $406,752 including accrued interest (Note 2 of Notes to Financial Statements) (Identified Cost $398,701) | | $ | 398,701 | |
| | | | | | | | |
| | | | | | | | |
| | | | Total Investments — 100.2%
(Identified Cost $10,359,380) | | | 11,882,769 | |
| | | | Other assets less liabilities — (0.2)% | | | (27,644 | ) |
| | | | | | | | |
| | | | Net Assets — 100.0% | | $ | 11,855,125 | |
| | | | | | | | |
| | | | | | | | |
| | (†) | | | See Note 2 of Notes to Financial Statements. | | | | |
| | (a) | | | Non-income producing security. | | | | |
| | | | | | | | |
| | ADR | | | An American Depositary Receipt is a certificate issued by a custodian bank representing the right to receive securities of the foreign issuer described. The values of ADRs may be significantly influenced by trading on exchanges not located in the United States. | |
Industry Summary at December 31, 2020
| | | | |
Interactive Media & Services | | | 9.3 | % |
Software | | | 8.5 | |
Internet & Direct Marketing Retail | | | 7.9 | |
Capital Markets | | | 7.8 | |
Banks | | | 6.1 | |
Hotels, Restaurants & Leisure | | | 5.4 | |
Entertainment | | | 4.1 | |
Beverages | | | 3.9 | |
Health Care Providers & Services | | | 3.9 | |
Consumer Finance | | | 3.7 | |
IT Services | | | 3.6 | |
Semiconductors & Semiconductor Equipment | | | 3.5 | |
Media | | | 3.4 | |
Machinery | | | 3.2 | |
Insurance | | | 3.1 | |
Oil, Gas & Consumable Fuels | | | 2.6 | |
Aerospace & Defense | | | 2.1 | |
Other Investments, less than 2% each | | | 14.8 | |
Short-Term Investments | | | 3.3 | |
| | | | |
Total Investments | | | 100.2 | |
Other assets less liabilities | | | (0.2 | ) |
| | | | |
Net Assets | | | 100.0 | % |
| | | | |
See accompanying notes to financial statements.
27 |
Portfolio of Investments – as of December 31, 2020
Natixis Vaughan Nelson Mid Cap ETF
| | | | | | | | |
| Shares | | | Description | | Value (†) | |
| | Common Stocks — 99.3% of Net Assets | |
| | | | Banks — 4.0% | |
| | 2,975 | | | Bank of N.T. Butterfield & Son Ltd. (The) | | $ | 92,701 | |
| | 2,219 | | | PacWest Bancorp | | | 56,363 | |
| | 4,378 | | | TCF Financial Corp. | | | 162,073 | |
| | | | | | | | |
| | | | | | | 311,137 | |
| | | | | | | | |
| | | | Beverages — 2.1% | |
| | 729 | | | Constellation Brands, Inc., Class A | | | 159,688 | |
| | | | | | | | |
| | | | Building Products — 0.9% | |
| | 569 | | | Allegion PLC | | | 66,220 | |
| | | | | | | | |
| | | | Capital Markets — 5.8% | |
| | 1,549 | | | Ares Management Corp., Class A | | | 72,880 | |
| | 6,886 | | | Brightsphere Investment Group, Inc. | | | 132,762 | |
| | 602 | | | Nasdaq, Inc. | | | 79,910 | |
| | 1,750 | | | Raymond James Financial, Inc. | | | 167,423 | |
| | | | | | | | |
| | | | | | | 452,975 | |
| | | | | | | | |
| | | | Chemicals — 5.5% | |
| | 4,446 | | | Axalta Coating Systems Ltd.(a) | | | 126,933 | |
| | 1,287 | | | FMC Corp. | | | 147,915 | |
| | 1,662 | | | LyondellBasell Industries NV, Class A | | | 152,339 | |
| | | | | | | | |
| | | | | | | 427,187 | |
| | | | | | | | |
| | | | Commercial Services & Supplies — 1.9% | |
| | 2,335 | | | IAA, Inc.(a) | | | 151,728 | |
| | | | | | | | |
| | | | Communications Equipment — 2.8% | |
| | 1,269 | | | Motorola Solutions, Inc. | | | 215,806 | |
| | | | | | | | |
| | | | Construction & Engineering — 2.9% | |
| | 9,588 | | | WillScot Mobile Mini Holdings Corp.(a) | | | 222,154 | |
| | | | | | | | |
| | | | Consumer Finance — 0.7% | |
| | 1,618 | | | Synchrony Financial | | | 56,161 | |
| | | | | | | | |
| | | | Containers & Packaging — 2.9% | |
| | 474 | | | Avery Dennison Corp. | | | 73,522 | |
| | 1,529 | | | Crown Holdings, Inc.(a) | | | 153,206 | |
| | | | | | | | |
| | | | | | | 226,728 | |
| | | | | | | | |
| | | | Diversified Consumer Services — 3.2% | |
| | 737 | | | Grand Canyon Education, Inc.(a) | | | 68,622 | |
| | 4,501 | | | Laureate Education, Inc., Class A(a) | | | 65,535 | |
| | 2,281 | | | Terminix Global Holdings, Inc.(a) | | | 116,354 | |
| | | | | | | | |
| | | | | | | 250,511 | |
| | | | | | | | |
| | | | Electric Utilities — 2.2% | |
| | 1,224 | | | Alliant Energy Corp. | | | 63,073 | |
| | 1,883 | | | Evergy, Inc. | | | 104,525 | |
| | | | | | | | |
| | | | | | | 167,598 | |
| | | | | | | | |
| | | | Electrical Equipment — 6.8% | |
| | 1,396 | | | AMETEK, Inc. | | | 168,832 | |
| | 1,076 | | | Hubbell, Inc. | | | 168,706 | |
| | 8,120 | | | nVent Electric PLC | | | 189,115 | |
| | | | | | | | |
| | | | | | | 526,653 | |
| | | | | | | | |
| | | | Electronic Equipment, Instruments & Components — 2.1% | |
| | 352 | | | CDW Corp. | | | 46,390 | |
| | 909 | | | Keysight Technologies, Inc.(a) | | | 120,070 | |
| | | | | | | | |
| | | | | | | 166,460 | |
| | | | | | | | |
| | | | Food & Staples Retailing — 2.0% | |
| | 3,193 | | | Performance Food Group Co.(a) | | | 152,019 | |
| | | | | | | | |
| | | | Health Care Equipment & Supplies — 2.0% | |
| | 289 | | | Cooper Cos., Inc. (The) | | | 104,999 | |
| | 702 | | | Hologic, Inc.(a) | | | 51,127 | |
| | | | | | | | |
| | | | | | | 156,126 | |
| | | | | | | | |
| | | | Health Care Providers & Services — 0.7% | |
| | 927 | | | Centene Corp.(a) | | | 55,648 | |
| | | | | | | | |
| | | | Hotels, Restaurants & Leisure — 1.1% | |
| | 2,311 | | | Aramark | | | 88,927 | |
| | | | | | | | |
| | | | Independent Power & Renewable Electricity Producers — 2.5% | |
| | 9,767 | | | Vistra Corp. | | | 192,019 | |
| | | | | | | | |
| | | | Insurance — 7.4% | |
| | 879 | | | Allstate Corp. (The) | | | 96,629 | |
| | 575 | | | Arthur J. Gallagher & Co. | | | 71,133 | |
| | 3,856 | | | Athene Holding Ltd., Class A(a) | | | 166,348 | |
| | 2,326 | | | First American Financial Corp. | | | 120,091 | |
| | 1,056 | | | Reinsurance Group of America, Inc. | | | 122,390 | |
| | | | | | | | |
| | | | | | | 576,591 | |
| | | | | | | | |
| | | | IT Services — 4.8% | |
| | 377 | | | Booz Allen Hamilton Holding Corp. | | | 32,867 | |
| | 653 | | | CACI International, Inc., Class A(a) | | | 162,813 | |
| | 479 | | | Global Payments, Inc. | | | 103,186 | |
| | 1,054 | | | MAXIMUS, Inc. | | | 77,142 | |
| | | | | | | | |
| | | | | | | 376,008 | |
| | | | | | | | |
| | | | Life Sciences Tools & Services — 5.6% | |
| | 483 | | | Agilent Technologies, Inc. | | | 57,231 | |
| | 8,527 | | | Avantor, Inc.(a) | | | 240,035 | |
| | 766 | | | IQVIA Holdings, Inc.(a) | | | 137,244 | |
| | | | | | | | |
| | | | | | | 434,510 | |
| | | | | | | | |
| | | | Machinery — 10.5% | |
| | 2,804 | | | Crane Co. | | | 217,759 | |
| | 1,890 | | | Oshkosh Corp. | | | 162,672 | |
| | 2,932 | | | Otis Worldwide Corp. | | | 198,057 | |
| | 3,057 | | | Timken Co. (The) | | | 236,489 | |
| | | | | | | | |
| | | | | | | 814,977 | |
| | | | | | | | |
| | | | Media — 3.0% | |
| | 2,133 | | | Nexstar Media Group, Inc., Class A | | | 232,902 | |
| | | | | | | | |
| | | | Metals & Mining — 1.9% | |
| | 10,721 | | | Constellium SE(a) | | | 149,987 | |
| | | | | | | | |
| | | | Multi-Utilities — 1.1% | |
| | 675 | | | Ameren Corp. | | | 52,690 | |
| | 555 | | | CMS Energy Corp. | | | 33,861 | |
| | | | | | | | |
| | | | | | | 86,551 | |
| | | | | | | | |
| | | | Multiline Retail — 0.7% | |
| | 241 | | | Dollar General Corp. | | | 50,682 | |
| | | | | | | | |
| | | | Oil, Gas & Consumable Fuels — 3.4% | |
| | 1,282 | | | Pioneer Natural Resources Co. | | | 146,007 | |
| | 14,888 | | | WPX Energy, Inc.(a) | | | 121,337 | |
| | | | | | | | |
| | | | | | | 267,344 | |
| | | | | | | | |
| | | | REITs – Diversified — 0.7% | |
| | 5,585 | | | New Residential Investment Corp. | | | 55,515 | |
| | | | | | | | |
| | | | REITs – Warehouse/Industrials — 1.2% | |
| | 1,276 | | | CyrusOne, Inc. | | | 93,340 | |
| | | | | | | | |
| | | | Semiconductors & Semiconductor Equipment — 3.1% | |
| | 495 | | | Analog Devices, Inc. | | | 73,126 | |
| | 458 | | | CMC Materials, Inc. | | | 69,296 | |
| | 1,008 | | | Entegris, Inc. | | | 96,869 | |
| | | | | | | | |
| | | | | | | 239,291 | |
| | | | | | | | |
| | | | Software — 1.7% | |
| | 256 | | | Check Point Software Technologies Ltd.(a) | | | 34,025 | |
| | 136 | | | RingCentral, Inc., Class A(a) | | | 51,540 | |
| | 3,151 | | | SolarWinds Corp.(a) | | | 47,107 | |
| | | | | | | | |
| | | | | | | 132,672 | |
| | | | | | | | |
See accompanying notes to financial statements.
| 28
Portfolio of Investments – as of December 31, 2020
Natixis Vaughan Nelson Mid Cap ETF – (continued)
| | | | | | | | |
| Shares | | | Description | | Value (†) | |
| | | | Specialty Retail — 1.7% | |
| | 4,859 | | | Leslie’s, Inc.(a) | | $ | 134,837 | |
| | | | | | | | |
| | | | Thrifts & Mortgage Finance — 0.4% | |
| | 800 | | | Essent Group Ltd. | | | 34,560 | |
| | | | | | | | |
| | | | Total Common Stocks
(Identified Cost $6,673,933) | | | 7,725,512 | |
| | | | | | | | |
| | | | | | | | |
Principal
Amount | | | | | | |
| | Short-Term Investments — 1.0% | | | | |
| $ | 78,535 | | | Tri-Party Repurchase Agreement with Fixed Income Clearing Corporation, dated 12/31/2020 at 0.000% to be repurchased at $78,535 on 1/04/2021 collateralized by $80,200 U.S. Treasury Note, 0.125% due 8/15/2023 valued at $80,191 including accrued interest (Note 2 of Notes to Financial Statements)
(Identified Cost $78,535) | | | 78,535 | |
| | | | | | | | |
| | | | | | | | |
| | | | Total Investments — 100.3%
(Identified Cost $6,752,468) | | | 7,804,047 | |
| | | | Other assets less liabilities — (0.3)% | | | (24,787 | ) |
| | | | | | | | |
| | | | Net Assets — 100.0% | | $ | 7,779,260 | |
| | | | | | | | |
| | | | | | | | |
| | (†) | | | See Note 2 of Notes to Financial Statements. | |
| | (a) | | | Non-income producing security. | |
| | REITs | | | Real Estate Investment Trusts | | | | |
Industry Summary at December 31, 2020
| | | | |
Machinery | | | 10.5 | % |
Insurance | | | 7.4 | |
Electrical Equipment | | | 6.8 | |
Capital Markets | | | 5.8 | |
Life Sciences Tools & Services | | | 5.6 | |
Chemicals | | | 5.5 | |
IT Services | | | 4.8 | |
Banks | | | 4.0 | |
Oil, Gas & Consumable Fuels | | | 3.4 | |
Diversified Consumer Services | | | 3.2 | |
Semiconductors & Semiconductor Equipment | | | 3.1 | |
Media | | | 3.0 | |
Containers & Packaging | | | 2.9 | |
Construction & Engineering | | | 2.9 | |
Communications Equipment | | | 2.8 | |
Independent Power & Renewable Electricity Producers | | | 2.5 | |
Electric Utilities | | | 2.2 | |
Electronic Equipment, Instruments & Components | | | 2.1 | |
Beverages | | | 2.1 | |
Health Care Equipment & Supplies | | | 2.0 | |
Food & Staples Retailing | | | 2.0 | |
Other Investments, less than 2% each | | | 14.7 | |
Short-Term Investments | | | 1.0 | |
| | | | |
Total Investments | | | 100.3 | |
Other assets less liabilities | | | (0.3 | ) |
| | | | |
Net Assets | | | 100.0 | % |
| | | | |
See accompanying notes to financial statements.
29 |
Portfolio of Investments – as of December 31, 2020
Natixis Vaughan Nelson Select ETF
| | | | | | | | |
Shares | | | Description | | Value (†) | |
| | Common Stocks — 99.0% of Net Assets | |
| | | | Banks — 1.0% | |
| | 1,099 | | | Popular, Inc. | | $ | 61,896 | |
| | | | | | | | |
| | | | Capital Markets — 3.0% | |
| | 2,646 | | | Morgan Stanley | | | 181,330 | |
| | | | | | | | |
| | | | Chemicals — 7.5% | |
| | 3,189 | | | Nutrien Ltd. | | | 153,582 | |
| | 405 | | | Sherwin-Williams Co. (The) | | | 297,639 | |
| | | | | | | | |
| | | | | | | 451,221 | |
| | | | | | | | |
| | | | Communications Equipment — 3.6% | |
| | 1,264 | | | Motorola Solutions, Inc. | | | 214,956 | |
| | | | | | | | |
| | | | Distributors — 2.5% | |
| | 4,351 | | | LKQ Corp.(a) | | | 153,329 | |
| | | | | | | | |
| | | | Diversified Telecommunication Services — 2.0% | |
| | 2,039 | | | Cogent Communications Holdings, Inc. | | | 122,075 | |
| | | | | | | | |
| | | | Entertainment — 3.1% | |
| | 1,291 | | | Electronic Arts, Inc. | | | 185,388 | |
| | | | | | | | |
| | | | Food Products — 2.8% | |
| | 2,147 | | | Lamb Weston Holdings, Inc. | | | 169,055 | |
| | | | | | | | |
| | | | Health Care Equipment & Supplies — 2.7% | |
| | 605 | | | Masimo Corp.(a) | | | 162,370 | |
| | | | | | | | |
| | | | Health Care Providers & Services — 7.2% | |
| | 888 | | | HCA Healthcare, Inc. | | | 146,040 | |
| | 820 | | | UnitedHealth Group, Inc. | | | 287,558 | |
| | | | | | | | |
| | | | | | | 433,598 | |
| | | | | | | | |
| | | | Insurance — 4.0% | |
| | 1,155 | | | Aon PLC, Class A | | | 244,017 | |
| | | | | | | | |
| | | | Interactive Media & Services — 5.5% | |
| | 1,216 | | | Facebook, Inc., Class A(a) | | | 332,163 | |
| | | | | | | | |
| | | | Internet & Direct Marketing Retail — 5.3% | |
| | 98 | | | Amazon.com, Inc.(a) | | | 319,179 | |
| | | | | | | | |
| | | | IT Services — 10.3% | |
| | 756 | | | Accenture PLC, Class A | | | 197,475 | |
| | 808 | | | Broadridge Financial Solutions, Inc. | | | 123,786 | |
| | 843 | | | MasterCard, Inc., Class A | | | 300,900 | |
| | | | | | | | |
| | | | | | | 622,161 | |
| | | | | | | | |
| | | | Life Sciences Tools & Services — 2.0% | |
| | 253 | | | Thermo Fisher Scientific, Inc. | | | 117,842 | |
| | | | | | | | |
| | | | Machinery — 2.9% | |
| | 775 | | | Cummins, Inc. | | | 176,003 | |
| | | | | | | | |
| | | | Metals & Mining — 2.5% | |
| | 3,676 | | | Wheaton Precious Metals Corp. | | | 153,436 | |
| | | | | | | | |
| | | | Oil, Gas & Consumable Fuels — 4.4% | |
| | 1,923 | | | Chevron Corp. | | | 162,397 | |
| | 44,731 | | | Kosmos Energy Ltd. | | | 105,118 | |
| | | | | | | | |
| | | | | | | 267,515 | |
| | | | | | | | |
| | | | Road & Rail — 6.8% | |
| | 476 | | | Saia, Inc.(a) | | | 86,061 | |
| | 1,571 | | | Union Pacific Corp. | | | 327,113 | |
| | | | | | | | |
| | | | | | | 413,174 | |
| | | | | | | | |
| | | | Semiconductors & Semiconductor Equipment — 12.2% | |
| | 1,201 | | | Entegris, Inc. | | | 115,416 | |
| | 9,591 | | | ON Semiconductor Corp.(a) | | | 313,913 | |
| | 1,889 | | | Texas Instruments, Inc. | | | 310,042 | |
| | | | | | | | |
| | | | | | | 739,371 | |
| | | | | | | | |
| | | | Software — 5.8% | |
| | 1,572 | | | Microsoft Corp. | | | 349,644 | |
| | | | | | | | |
| | | | Specialty Retail — 1.9% | |
| | 431 | | | Home Depot, Inc. (The) | | | 114,482 | |
| | | | | | | | |
| | | | Total Common Stocks
(Identified Cost $5,421,430) | | | 5,984,205 | |
| | | | | | | | |
| | | | | | | | |
Principal
Amount | | | Description | | Value (†) | |
| | Short-Term Investments — 1.4% | | | | |
| $ | 83,773 | | | Tri-Party Repurchase Agreement with Fixed Income Clearing Corporation, dated 12/31/2020 at 0.000% to be repurchased at $83,773 on 1/04/2021 collateralized by $85,500 U.S. Treasury Note, 0.125% due 8/15/2023 valued at $85,490 including accrued interest (Note 2 of Notes to Financial Statements)
(Identified Cost $83,773) | | $ | 83,773 | |
| | | | | | | | |
| | | | | | | | |
| | | | Total Investments – 100.4%
(Identified Cost $5,505,203) | | | 6,067,978 | |
| | | | Other assets less liabilities — (0.4)% | | | (25,262 | ) |
| | | | | | | | |
| | | | Net Assets — 100.0% | | $ | 6,042,716 | |
| | | | | | | | |
| | | | | | | | |
| | (†) | | | See Note 2 of Notes to Financial Statements. | | | | |
| | (a) | | | Non-income producing security. | | | | |
| | | | | | | | |
Industry Summary at December 31, 2020
| | | | |
Semiconductors & Semiconductor Equipment | | | 12.2 | % |
IT Services | | | 10.3 | |
Chemicals | | | 7.5 | |
Health Care Providers & Services | | | 7.2 | |
Road & Rail | | | 6.8 | |
Software | | | 5.8 | |
Interactive Media & Services | | | 5.5 | |
Internet & Direct Marketing Retail | | | 5.3 | |
Oil, Gas & Consumable Fuels | | | 4.4 | |
Insurance | | | 4.0 | |
Communications Equipment | | | 3.6 | |
Entertainment | | | 3.1 | |
Capital Markets | | | 3.0 | |
Machinery | | | 2.9 | |
Food Products | | | 2.8 | |
Health Care Equipment & Supplies | | | 2.7 | |
Metals & Mining | | | 2.5 | |
Distributors | | | 2.5 | |
Diversified Telecommunication Services | | | 2.0 | |
Life Sciences Tools & Services | | | 2.0 | |
Other Investments, less than 2% each | | | 2.9 | |
Short-Term Investments | | | 1.4 | |
| | | | |
Total Investments | | | 100.4 | |
Other assets less liabilities | | | (0.4 | ) |
| | | | |
Net Assets | | | 100.0 | % |
| | | | |
See accompanying notes to financial statements.
| 30
Statements of Assets and Liabilities
December 31, 2020
| | | | | | | | | | | | | | | | |
| | | Natixis Loomis
Sayles Short
Duration
Income ETF | | | Natixis U.S.
Equity
Opportunities
ETF | | | Natixis Vaughan
Nelson Mid Cap
ETF | | | Natixis Vaughan
Nelson Select
ETF | |
ASSETS | | | | | | | | | | | | | | | | |
Investments at cost | | $ | 23,761,814 | | | $ | 10,359,380 | | | $ | 6,752,468 | | | $ | 5,505,203 | |
Net unrealized appreciation | | | 459,556 | | | | 1,523,389 | | | | 1,051,579 | | | | 562,775 | |
| | | | | | | | | | | | | | | | |
Investments at value | | | 24,221,370 | | | | 11,882,769 | | | | 7,804,047 | | | | 6,067,978 | |
Cash | | | 20,755 | | | | — | | | | — | | | | — | |
Due from brokers (Note 2) | | | 48,000 | | | | — | | | | — | | | | — | |
Receivable from investment adviser (Note 6) | | | 14,117 | | | | 7,559 | | | | 9,164 | | | | 10,416 | |
Dividends and interest receivable | | | 101,588 | | | | 3,974 | | | | 4,614 | | | | 2,786 | |
Prepaid expenses (Note 7) | | | 2 | | | | — | | | | — | | | | — | |
| | | | | | | | | | | | | | | | |
TOTAL ASSETS | | | 24,405,832 | | | | 11,894,302 | | | | 7,817,825 | | | | 6,081,180 | |
| | | | | | | | | | | | | | | | |
LIABILITIES | | | | | | | | | | | | | | | | |
Payable for securities purchased | | | 20,755 | | | | — | | | | — | | | | — | |
Payable for variation margin on futures contracts (Note 2) | | | 1,090 | | | | — | | | | — | | | | — | |
Deferred Trustees’ fees (Note 6) | | | 12,359 | | | | 466 | | | | 454 | | | | 452 | |
Administrative fees payable (Note 6) | | | 803 | | | | 426 | | | | 268 | | | | 214 | |
Audit and tax services fees payable | | | 37,264 | | | | 35,011 | | | | 35,002 | | | | 34,984 | |
Other accounts payable and accrued expenses | | | 29,884 | | | | 3,274 | | | | 2,841 | | | | 2,814 | |
| | | | | | | | | | | | | | | | |
TOTAL LIABILITIES | | | 102,155 | | | | 39,177 | | | | 38,565 | | | | 38,464 | |
| | | | | | | | | | | | | | | | |
NET ASSETS | | $ | 24,303,677 | | | $ | 11,855,125 | | | $ | 7,779,260 | | | $ | 6,042,716 | |
| | | | | | | | | | | | | | | | |
NET ASSETS CONSIST OF: | | | | | | | | | | | | | | | | |
Paid-in capital | | $ | 23,467,106 | | | $ | 10,320,075 | | | $ | 6,695,250 | | | $ | 5,488,358 | |
Accumulated earnings | | | 836,571 | | | | 1,535,050 | | | | 1,084,010 | | | | 554,358 | |
| | | | | | | | | | | | | | | | |
NET ASSETS | | $ | 24,303,677 | | | $ | 11,855,125 | | | $ | 7,779,260 | | | $ | 6,042,716 | |
| | | | | | | | | | | | | | | | |
COMPUTATION OF NET ASSET VALUE AND OFFERING PRICE: | | | | | | | | | | | | | | | | |
Net assets | | $ | 24,303,677 | | | $ | 11,855,125 | | | $ | 7,779,260 | | | $ | 6,042,716 | |
| | | | | | | | | | | | | | | | |
Shares of beneficial interest | | | 950,000 | | | | 413,200 | | | | 260,400 | | | | 220,400 | |
| | | | | | | | | | | | | | | | |
Net asset value, offering and redemption price per share | | $ | 25.58 | | | $ | 28.69 | | | $ | 29.87 | | | $ | 27.42 | |
| | | | | | | | | | | | | | | | |
See accompanying notes to financial statements.
31 |
Statements of Operations
For the Year Ended December 31, 2020
| | | | | | | | | | | | | | | | |
| | | Natixis Loomis
Sayles Short
Duration
Income ETF | | | Natixis U.S.
Equity
Opportunities
ETF(a) | | | Natixis Vaughan
Nelson Mid Cap
ETF(a) | | | Natixis Vaughan
Nelson Select
ETF(a) | |
INVESTMENT INCOME | | | | | | | | | | | | | | | | |
Interest | | $ | 712,316 | | | $ | — | | | $ | — | | | $ | — | |
Dividends | | | — | | | | 27,630 | | | | 25,210 | | | | 17,528 | |
Less net foreign taxes withheld | | | (360 | ) | | | — | | | | — | | | | (490 | ) |
| | | | | | | | | | | | | | | | |
| | | 711,956 | | | | 27,630 | | | | 25,210 | | | | 17,038 | |
| | | | | | | | | | | | | | | | |
Expenses | | | | | | | | | | | | | | | | |
Management fees (Note 6) | | | 93,086 | | | | 23,392 | | | | 14,139 | | | | 11,747 | |
Administrative fees (Note 6) | | | 13,678 | | | | 1,355 | | | | 767 | | | | 680 | |
Trustees’ fees and expenses (Note 6) | | | 18,224 | | | | 3,060 | | | | 3,019 | | | | 3,011 | |
Transfer agent fees and expenses (Note 7) | | | 15,600 | | | | 4,507 | | | | 4,507 | | | | 4,507 | |
Audit and tax services fees | | | 42,357 | | | | 35,934 | | | | 35,925 | | | | 35,906 | |
Custodian fees and expenses (Note 7) | | | 33,303 | | | | 5,583 | | | | 5,659 | | | | 5,699 | |
Legal fees (Note 7) | | | 41,091 | | | | 5,947 | | | | 3,056 | | | | 3,025 | |
Registration fees | | | 234 | | | | 936 | | | | 503 | | | | 473 | |
Shareholder reporting expenses | | | 23,656 | | | | 559 | | | | 559 | | | | 559 | |
Miscellaneous expenses (Note 7) | | | 44,912 | | | | 12,131 | | | | 11,980 | | | | 11,981 | |
| | | | | | | | | | | | | | | | |
Total expenses | | | 326,141 | | | | 93,404 | | | | 80,114 | | | | 77,588 | |
Less waiver and/or expense reimbursement (Note 6) | | | (208,233 | ) | | | (65,228 | ) | | | (64,208 | ) | | | (64,275 | ) |
| | | | | | | | | | | | | | | | |
Net expenses | | | 117,908 | | | | 28,176 | | | | 15,906 | | | | 13,313 | |
| | | | | | | | | | | | | | | | |
Net investment income | | | 594,048 | | | | (546 | ) | | | 9,304 | | | | 3,725 | |
| | | | | | | | | | | | | | | | |
NET REALIZED AND UNREALIZED GAIN (LOSS) ON INVESTMENTS AND FUTURES CONTRACTS | | | | | | | | | | | | | | | | |
Net realized gain (loss) on: | | | | | | | | | | | | | | | | |
Investments | | | 900,643 | | | | 13,656 | | | | 38,350 | | | | (8,469 | ) |
Futures contracts | | | (38,060 | ) | | | — | | | | — | | | | — | |
Net change in unrealized appreciation (depreciation) on: | | | | | | | | | | | | | | | | |
Investments | | | 133,166 | | | | 1,523,389 | | | | 1,051,579 | | | | 562,775 | |
Futures contracts | | | (14,072 | ) | | | — | | | | — | | | | — | |
| | | | | | | | | | | | | | | | |
Net realized and unrealized gain on investments and futures contracts | | | 981,677 | | | | 1,537,045 | | | | 1,089,929 | | | | 554,306 | |
| | | | | | | | | | | | | | | | |
NET INCREASE IN NET ASSETS RESULTING FROM OPERATIONS | | $ | 1,575,725 | | | $ | 1,536,499 | | | $ | 1,099,233 | | | $ | 558,031 | |
| | | | | | | | | | | | | | | | |
| (a) | From commencement of operations on September 16, 2020 through December 31, 2020. |
See accompanying notes to financial statements.
| 32
Statements of Changes in Net Assets
| | | | | | | | | | | | |
| | | Natixis Loomis Sayles Short
Duration Income ETF | | | Natixis U.S. Equity
Opportunities ETF | |
| | | Year Ended
December 31,
2020 | | | Year Ended
December 31,
2019 | | | Period Ended
December 31,
2020(a) | |
FROM OPERATIONS: | | | | | | | | | | | | |
Net investment income (loss) | | $ | 594,048 | | | $ | 733,901 | | | $ | (546 | ) |
Net realized gain on investments and futures contracts | | | 862,583 | | | | 195,193 | | | | 13,656 | |
Net change in unrealized appreciation (depreciation) on investments and futures contracts | | | 119,094 | | | | 568,765 | | | | 1,523,389 | |
| | | | | | | | | | | | |
Net increase in net assets resulting from operations | | | 1,575,725 | | | | 1,497,859 | | | | 1,536,499 | |
| | | | | | | | | | | | |
FROM DISTRIBUTIONS TO SHAREHOLDERS: | | | (1,078,630 | ) | | | (779,880 | ) | | | (1,777 | ) |
| | | | | | | | | | | | |
NET INCREASE (DECREASE) IN NET ASSETS FROM
CAPITAL SHARE TRANSACTIONS (NOTE 10) | | | (6,524,428 | ) | | | 2,529,226 | | | | 10,240,403 | |
| | | | | | | | | | | | |
Net increase (decrease) in net assets | | | (6,027,333 | ) | | | 3,247,205 | | | | 11,775,125 | |
NET ASSETS | | | | | | | | | | | | |
Beginning of the year | | | 30,331,010 | | | | 27,083,805 | | | | 80,000 | |
| | | | | | | | | | | | |
End of the year | | $ | 24,303,677 | | | $ | 30,331,010 | | | $ | 11,855,125 | |
| | | | | | | | | | | | |
| (a) | From commencement of operations on September 16, 2020 through December 31, 2020. |
See accompanying notes to financial statements.
33 |
Statements of Changes in Net Assets (continued)
| | | | | | | | |
| | | Natixis Vaughan
Nelson Mid Cap ETF | | | Natixis Vaughan
Nelson Select ETF | |
| | | Period Ended
December 31,
2020(a) | | | Period Ended
December 31,
2020(a) | |
FROM OPERATIONS: | | | | | | | | |
Net investment income | | $ | 9,304 | | | $ | 3,725 | |
Net realized gain (loss) on investments | | | 38,350 | | | | (8,469 | ) |
Net change in unrealized appreciation (depreciation) on investments | | | 1,051,579 | | | | 562,775 | |
| | | | | | | | |
Net increase in net assets resulting from operations | | | 1,099,233 | | | | 558,031 | |
| | | | | | | | |
FROM DISTRIBUTIONS TO SHAREHOLDERS: | | | (15,338 | ) | | | (3,769 | ) |
| | | | | | | | |
NET INCREASE IN NET ASSETS FROM
CAPITAL SHARE TRANSACTIONS (NOTE 10) | | | 6,685,365 | | | | 5,478,454 | |
| | | | | | | | |
Net increase in net assets | | | 7,769,260 | | | | 6,032,716 | |
NET ASSETS | | | | | | | | |
Beginning of the year | | | 10,000 | | | | 10,000 | |
| | | | | | | | |
End of the year | | $ | 7,779,260 | | | $ | 6,042,716 | |
| | | | | | | | |
| (a) | From commencement of operations on September 16, 2020 through December 31, 2020. |
See accompanying notes to financial statements.
| 34
Financial Highlights
For a share outstanding throughout each period
| | | | | | | | | | | | | | | | |
| | | Natixis Loomis Sayles Short Duration Income ETF | |
| | | Year Ended
December 31,
2020
| | | Year Ended
December 31,
2019
| | | Year Ended
December 31,
2018
| | | Period Ended
December 31,
2017*
| |
Net asset value, beginning of the period | | $ | 25.28 | | | $ | 24.62 | | | $ | 25.02 | | | $ | 25.00 | |
| | | | | | | | | | | | | | | | |
INCOME (LOSS) FROM INVESTMENT OPERATIONS: | | | | | | | | | | | | | | | | |
Net investment income (loss)(a) | | | 0.49 | | | | 0.64 | | | | 0.61 | | | | (0.00 | )(b) |
Net realized and unrealized gain (loss) | | | 0.83 | | | | 0.70 | | | | (0.37 | ) | | | 0.02 | |
| | | | | | | | | | | | | | | | |
Total from Investment Operations | | | 1.32 | | | | 1.34 | | | | 0.24 | | | | 0.02 | |
| | | | | | | | | | | | | | | | |
LESS DISTRIBUTIONS FROM: | | | | | | | | | | | | | | | | |
Net investment income | | | (0.51 | ) | | | (0.67 | ) | | | (0.64 | ) | | | — | |
Net realized capital gains | | | (0.51 | ) | | | (0.01 | ) | | | — | | | | — | |
| | | | | | | | | | | | | | | | |
Total Distributions | | | (1.02 | ) | | | (0.68 | ) | | | (0.64 | ) | | | — | |
| | | | | | | | | | | | | | | | |
Net asset value, end of the period | | $ | 25.58 | | | $ | 25.28 | | | $ | 24.62 | | | $ | 25.02 | |
| | | | | | | | | | | | | | | | |
Total return(c) | | | 5.27 | % | | | 5.51 | % | | | 0.97 | % | | | 0.08 | %(d) |
RATIOS TO AVERAGE NET ASSETS: | | | | | | | | | | | | | | | | |
Net assets, end of the period (000’s) | | $ | 24,304 | | | $ | 30,331 | | | $ | 27,084 | | | $ | 20,016 | |
Net expenses(e) | | | 0.38 | % | | | 0.38 | % | | | 0.38 | % | | | 0.38 | %(f) |
Gross expenses | | | 1.05 | % | | | 0.95 | % | | | 1.09 | % | | | 14.21 | %(f) |
Net investment income (loss) | | | 1.91 | % | | | 2.56 | % | | | 2.46 | % | | | (0.09 | )%(f) |
Portfolio turnover rate(g) | | | 181 | % | | | 113 | % | | | 167 | % | | | 0 | % |
| * | From commencement of operations on December 27, 2017 through December 31, 2017. |
| (a) | Per share net investment income (loss) has been calculated using the average shares outstanding during the period. |
| (b) | Amount rounds to less than $0.01. |
| (c) | Total return is calculated at net asset value assuming reinvestment of dividends and capital gains, if any. Had certain expenses not been waived/reimbursed during the period, total returns would have been lower. |
| (d) | Periods less than one year are not annualized. |
| (e) | The investment adviser agreed to waive its fees and/or reimburse a portion of the Fund’s expenses during the period. Without this waiver/reimbursement, expenses would have been higher. |
| (f) | Computed on an annualized basis for periods less than one year. |
| (g) | Portfolio turnover rate excludes securities received or delivered from in-kind processing of creations or redemptions. |
See accompanying notes to financial statements.
35 |
Financial Highlights (continued)
For a share outstanding throughout each period
| | | | |
| | | Natixis U.S.
Equity
Opportunities
ETF | |
| | | Period Ended
December 31,
2020*
| |
Net asset value, beginning of the period | | $ | 25.00 | |
| | | | |
INCOME (LOSS) FROM INVESTMENT OPERATIONS: | | | | |
Net investment loss(a) | | | (0.00 | )(b) |
Net realized and unrealized gain (loss) | | | 3.69 | |
| | | | |
Total from Investment Operations | | | 3.69 | |
| | | | |
LESS DISTRIBUTIONS FROM: | | | | |
Net realized capital gains | | | (0.00 | )(b) |
| | | | |
Net asset value, end of the period | | $ | 28.69 | |
| | | | |
Total return(c)(d) | | | 14.78 | % |
RATIOS TO AVERAGE NET ASSETS: | | | | |
Net assets, end of the period (000’s) | | $ | 11,855 | |
Net expenses(e)(f) | | | 0.90 | % |
Gross expenses(f) | | | 2.99 | % |
Net investment loss(f) | | | (0.02 | )% |
Portfolio turnover rate(g) | | | 6 | % |
| * | From commencement of operations on September 16, 2020 through December 31, 2020. |
| (a) | Per share net investment loss has been calculated using the average shares outstanding during the period. |
| (b) | Amount rounds to less than $0.01. |
| (c) | Total return is calculated at net asset value assuming reinvestment of dividends and capital gains, if any. Had certain expenses not been waived/reimbursed during the period, total returns would have been lower. |
| (d) | Periods less than one year are not annualized. |
| (e) | The investment adviser agreed to waive its fees and/or reimburse a portion of the Fund’s expenses during the period. Without this waiver/reimbursement, expenses would have been higher. |
| (f) | Computed on an annualized basis for periods less than one year. |
| (g) | Portfolio turnover rate excludes securities received or delivered from in-kind processing of creations or redemptions. |
See accompanying notes to financial statements.
| 36
Financial Highlights (continued)
For a share outstanding throughout each period
| | | | |
| | | Natixis
Vaughan
Nelson Mid
Cap ETF | |
| | | Period Ended
December 31,
2020*
| |
Net asset value, beginning of the period | | $ | 25.17 | |
| | | | |
INCOME (LOSS) FROM INVESTMENT OPERATIONS: | |
Net investment income(a) | | | 0.04 | |
Net realized and unrealized gain (loss) | | | 4.72 | |
| | | | |
Total from Investment Operations | | | 4.76 | |
| | | | |
LESS DISTRIBUTIONS FROM: | |
Net investment income | | | (0.04 | ) |
Net realized capital gains | | | (0.02 | ) |
| | | | |
Total Distributions | | | (0.06 | ) |
| | | | |
Net asset value, end of the period | | $ | 29.87 | |
| | | | |
Total return(b)(c) | | | 18.91 | % |
RATIOS TO AVERAGE NET ASSETS: | |
Net assets, end of the period (000’s) | | $ | 7,779 | |
Net expenses(d)(e) | | | 0.90 | % |
Gross expenses(e) | | | 4.53 | % |
Net investment income(e) | | | 0.53 | % |
Portfolio turnover rate(f) | | | 10 | % |
| * | From commencement of operations on September 16, 2020 through December 31, 2020. |
| (a) | Per share net investment income has been calculated using the average shares outstanding during the period. |
| (b) | Total return is calculated at net asset value assuming reinvestment of dividends and capital gains, if any. Had certain expenses not been waived/reimbursed during the period, total returns would have been lower. |
| (c) | Periods less than one year are not annualized. |
| (d) | The investment adviser agreed to waive its fees and/or reimburse a portion of the Fund’s expenses during the period. Without this waiver/reimbursement, expenses would have been higher. |
| (e) | Computed on an annualized basis for periods less than one year. |
| (f) | Portfolio turnover rate excludes securities received or delivered from in-kind processing of creations or redemptions. |
See accompanying notes to financial statements.
37 |
Financial Highlights (continued)
For a share outstanding throughout each period
| | | | |
| | | Natixis
Vaughan
Nelson
Select ETF | |
| | | Period Ended
December 31,
2020* | |
Net asset value, beginning of the period | | $ | 24.86 | |
| | | | |
INCOME (LOSS) FROM INVESTMENT OPERATIONS: | | | | |
Net investment income(a) | | | 0.02 | |
Net realized and unrealized gain (loss) | | | 2.56 | |
| | | | |
Total from Investment Operations | | | 2.58 | |
| | | | |
LESS DISTRIBUTIONS FROM: | | | | |
Net investment income | | | (0.02 | ) |
| | | | |
Net asset value, end of the period | | $ | 27.42 | |
| | | | |
Total return(b)(c) | | | 10.37 | % |
RATIOS TO AVERAGE NET ASSETS: | | | | |
Net assets, end of the period (000’s) | | $ | 6,043 | |
Net expenses(d)(e) | | | 0.85 | % |
Gross expenses(e) | | | 4.95 | % |
Net investment income(e) | | | 0.24 | % |
Portfolio turnover rate(f) | | | 16 | % |
| * | From commencement of operations on September 16, 2020 through December 31, 2020. |
| (a) | Per share net investment income has been calculated using the average shares outstanding during the period. |
| (b) | Total return is calculated at net asset value assuming reinvestment of dividends and capital gains, if any. Had certain expenses not been waived/reimbursed during the period, total returns would have been lower. |
| (c) | Periods less than one year are not annualized. |
| (d) | The investment adviser agreed to waive its fees and/or reimburse a portion of the Fund’s expenses during the period. Without this waiver/reimbursement, expenses would have been higher. |
| (e) | Computed on an annualized basis for periods less than one year. |
| (f) | Portfolio turnover rate excludes securities received or delivered from in-kind processing of creations or redemptions. |
See accompanying notes to financial statements.
| 38
Notes to Financial Statements
December 31, 2020
1. Organization. Natixis ETF Trust and Natixis ETF Trust II (the “Trusts” and each a “Trust”) are each organized as a Massachusetts business trust. Each Trust is registered under the Investment Company Act of 1940, as amended (the “1940 Act”), as an open-end management investment company. Each Declaration of Trust permits the Board of Trustees to authorize the issuance of an unlimited number of shares of beneficial interest of the Funds. Shares of the Funds are listed for trading on the NYSE Arca, Inc. (the “NYSE Arca”) and traded on other exchanges. The following funds (individually, a “Fund” and collectively, the “Funds”) are included in this report:
Natixis ETF Trust:
Natixis Loomis Sayles Short Duration Income ETF (the “Short Duration Income ETF”)
Natixis ETF Trust II:
Natixis U.S. Equity Opportunities ETF (the “U.S. Equity Opportunities ETF”)
Natixis Vaughan Nelson Mid Cap ETF (the “Mid Cap ETF”)
Natixis Vaughan Nelson Select ETF (the “Select ETF”)
Each Fund is a diversified investment company, except for Select ETF, which is a non-diversified investment company.
In consideration of the formation of the Natixis ETF Trust II, Natixis Investment Managers, LLC contributed to the U.S. Equity Opportunities ETF, Mid Cap ETF and Select ETF $80,000, $10,000 and $10,000, respectively, on August 27, 2020, in exchange for 3,200, 400 and 400 shares of each Fund respectively.
On September 16, 2020, U.S. Equity Opportunities ETF, Mid Cap ETF and Select ETF received in-kind and cash contributions from the ETFs’ Authorized Participant and commenced operations. U.S. Equity Opportunities ETF was initially funded via an in-kind contribution by an Authorized Participant of $9,502,122 and cash of $497,892 in exchange for 400,000 shares. Mid Cap ETF was initially funded via an in-kind contribution by an Authorized Participant of $4,980,890 and cash of $53,491 in exchange for 200,000 shares. Select ETF was initially funded via an in-kind contribution by an Authorized Participant of $4,751,215 and cash of $220,612 in exchange for 200,000 shares. Natixis Investment Managers, LLC purchased all shares of each ETF from the Authorized Participant via secondary market purchases on September 17, 2020.
Unlike traditional ETFs that provide daily disclosure of their portfolio holdings, U.S. Equity Opportunities ETF, Mid Cap ETF and Select ETF do not disclose the daily holdings of the actual portfolio. Instead, the Funds disclose a portfolio that is designed to reflect the economic exposure and risk characteristics of the actual portfolio on any given trading day (the “Proxy Portfolio”). Although the Proxy Portfolio is intended to provide Authorized Participants and other market participants with enough information to allow them to engage in effective arbitrage transactions that will keep the market price of the Funds’ shares trading at or close to the underlying NAV per share of the Fund, while at the same time enabling them to establish cost-effective hedging strategies to reduce risk, there is a risk that market prices will vary significantly from the underlying NAV of the Funds.
The Funds issue and redeem shares on a continuous basis through ALPS Distributors, Inc. (“ALPS”). Each Fund may pay ALPS, an unaffiliated distributor, fees under a plan adopted pursuant to Rule 12b-1 under the 1940 Act (the “12b-1 Plan”). Currently, no Rule 12b-1 fees are charged. Future payments may be made under the 12b-1 Plan without further shareholder approval.
Most expenses can be directly attributed to a Fund. Expenses which cannot be directly attributed to a Fund are generally apportioned based on the relative net assets of each of the funds in Natixis Funds Trust I, Natixis Funds Trust II, Natixis Funds Trust IV and Gateway Trust (“Natixis Funds Trusts”), Loomis Sayles Funds I and Loomis Sayles Funds II (“Loomis Sayles Funds Trusts”) and the Trusts.
2. Significant Accounting Policies. The following is a summary of significant accounting policies consistently followed by each Fund in the preparation of its financial statements. The Funds’ financial statements follow the accounting and reporting guidelines provided for investment companies and are prepared in accordance with accounting principles generally accepted in the United States of America which require the use of management estimates that affect the reported amounts and disclosures in the financial statements. Actual results could differ from those estimates. Management has evaluated the events and transactions subsequent to year-end through the date the financial statements were issued and has determined that there were no material events that would require disclosure in the Funds’ financial statements.
a. Valuation. Fund securities and other investments are valued at market value based on market quotations obtained or determined by independent pricing services recommended by the adviser or sub-adviser and approved by the Board of Trustees. Fund securities and other investments for which market quotations are not readily available are valued at fair value as determined in good faith by the adviser or sub-adviser pursuant to procedures approved by the Board of Trustees, as described below. Market value is determined as follows:
Listed equity securities (including shares of closed-end investment companies and exchange-traded funds) are valued at the last sale price quoted on the exchange where they are traded most extensively or, if there is no reported sale during the day, the closing bid
39 |
Notes to Financial Statements (continued)
December 31, 2020
quotation as reported by an independent pricing service. Unlisted equity securities (except unlisted preferred equity securities) are valued at the last sale price quoted in the market where they are traded most extensively or, if there is no reported sale during the day, the closing bid quotation as reported by an independent pricing service. If there is no last sale price or closing bid quotation available, unlisted equity securities will be valued using evaluated bids furnished by an independent pricing service, if available. In some foreign markets, an official close price and a last sale price may be available from the foreign exchange or market. In those cases, the official close price is used. Debt securities and unlisted preferred equity securities are valued based on evaluated bids furnished to the Funds by an independent pricing service or bid prices obtained from broker-dealers. Broker-dealer bid prices may be used to value debt and unlisted equity securities where an independent pricing service is unable to price a security or where an independent pricing service does not provide a reliable price for the security. Futures contracts are valued at the most recent settlement price on the exchange on which the adviser believes that, over time, they are traded most extensively.
Fund securities and other investments for which market quotations are not readily available are valued at fair value as determined in good faith by the adviser pursuant to procedures approved by the Board of Trustees. The Funds may also value securities and other investments at fair value in other circumstances such as when extraordinary events occur after the close of a foreign market but prior to the close of the New York Stock Exchange. This may include situations relating to a single issuer (such as a declaration of bankruptcy or a delisting of the issuer’s security from the primary market on which it has traded) as well as events affecting the securities markets in general (such as market disruptions or closings and significant fluctuations in U.S. and/or foreign markets). Fair value pricing may require subjective determinations about the value of a security, and fair values used to determine a Fund’s net asset value (“NAV”) may differ from quoted or published prices, or from prices that are used by others, for the same securities. In addition, the use of fair value pricing may not always result in adjustments to the prices of securities held by a Fund.
As of December 31, 2020, certain securities held by Short Duration Income ETF were fair valued at $29,612, representing 0.1% of net assets.
b. Investment Transactions and Related Investment Income. Investment transactions are accounted for on a trade date plus one day basis for daily NAV calculation. However, for financial reporting purposes, investment transactions are reported on trade date. Dividend income (including income reinvested) and foreign withholding tax, if applicable, is recorded on the ex-dividend date, or in the case of certain foreign securities, as soon as a Fund is notified, and interest income is recorded on an accrual basis. Interest income is increased by the accretion of discount and decreased by the amortization of premium, if applicable. Distributions received from investments in securities that represent a return of capital or capital gain are recorded as a reduction of cost of investments or as a realized gain, respectively. In determining net gain or loss on securities sold, the cost of securities has been determined on an identified cost basis.
c. Foreign Currency Translation. The books and records of the Funds are maintained in U.S. dollars. The values of securities, currencies and other assets and liabilities denominated in currencies other than U.S. dollars, if any, are translated into U.S. dollars based upon the World Market or “WM11” foreign exchange rates supplied by an independent pricing service. Purchases and sales of investment securities, income and expenses are translated into U.S. dollars on the respective dates of such transactions.
Net realized foreign exchange gains or losses arise from sales of foreign currency, changes in exchange rates between the trade and settlement dates on securities transactions and the difference between the amounts of dividends, interest and foreign withholding taxes recorded on the Funds’ books and the U.S. dollar equivalent of the amounts actually received or paid. Net unrealized foreign exchange gains or losses arise from changes in the value of assets and liabilities, other than investment securities, as of the end of the fiscal period, resulting from changes in exchange rates. Net realized foreign exchange gains or losses and the net change in unrealized foreign exchange gains or losses are disclosed in the Statements of Operations. For federal income tax purposes, net realized foreign exchange gains or losses are characterized as ordinary income and may, if the Funds have net losses, reduce the amount of income available to be distributed by the Funds.
The values of investment securities are presented at the foreign exchange rates prevailing at the end of the period for financial reporting purposes. Net realized and unrealized gains or losses on investments reported in the Statements of Operations reflect gains or losses resulting from changes in exchange rates and fluctuations which arise due to changes in market prices of investment securities.
The Funds may use foreign currency exchange contracts to facilitate transactions in foreign-denominated investments. Losses may arise from changes in the value of the foreign currency or if the counterparties do not perform under the contracts’ terms.
d. Futures Contracts. The Funds may enter into futures contracts. Futures contracts are agreements between two parties to buy and sell a particular instrument or index for a specified price on a specified future date.
| 40
Notes to Financial Statements (continued)
December 31, 2020
When a Fund enters into a futures contract, it is required to deposit with (or for the benefit of) its broker an amount of cash or short-term high-quality securities as “initial margin.” As the value of the contract changes, the value of the futures contract position increases or declines. Subsequent payments, known as “variation margin,” are made or received by a Fund, depending on the price fluctuations in the fair value of the contract and the value of cash or securities on deposit with the broker. The aggregate principal amounts of the contracts are not recorded in the financial statements. Daily fluctuations in the value of the contracts are recorded in the Statements of Assets and Liabilities as a receivable (payable) and in the Statements of Operations as unrealized appreciation (depreciation) until the contracts are closed, when they are recorded as realized gains (losses). Realized gain or loss on a futures position is equal to the difference between the value of the contract at the time it was opened and the value at the time it was closed, minus brokerage commissions. When a Fund enters into a futures contract certain risks may arise, such as illiquidity in the futures market, which may limit a Fund’s ability to close out a futures contract prior to settlement date, and unanticipated movements in the value of securities or interest rates.
Futures contracts are exchange-traded. Exchange-traded futures contracts are standardized and are settled through a clearing house with fulfillment supported by the credit of the exchange. Therefore, counterparty credit risks to the Funds are reduced; however, in the event that a counterparty enters into bankruptcy, a Fund’s claim against initial/variation margin on deposit with the counterparty may be subject to terms of a final settlement in bankruptcy court.
e. Federal and Foreign Income Taxes. The Trusts treat each Fund as a separate entity for federal income tax purposes. Each Fund intends to meet the requirements of the Internal Revenue Code of 1986 (“IRC”), as amended, applicable to regulated investment companies, and to distribute to its shareholders substantially all of its net investment income and any net realized capital gains at least annually. Management has performed an analysis of each Fund’s tax positions for the open tax years as of December 31, 2020 and has concluded that no provisions for income tax are required. The Funds’ federal tax return for the prior three fiscal years, where applicable, remain subject to examination by the Internal Revenue Service. Management is not aware of any events that are reasonably possible to occur in the next twelve months that would result in the amounts of any unrecognized tax benefits significantly increasing or decreasing for the Funds. However, management’s conclusions regarding tax positions taken may be subject to review and adjustment at a later date based on factors including, but not limited to, new tax laws and accounting regulations and interpretations thereof.
A Fund may be subject to foreign withholding taxes on investment income and taxes on capital gains on investments that are accrued and paid based upon the Fund’s understanding of the tax rules and regulations that exist in the countries in which the Fund invests. Foreign withholding taxes on dividend and interest income are reflected on the Statements of Operations as a reduction of investment income, net of amounts eligible to be reclaimed. Dividends and interest receivable on the Statements of Assets and Liabilities are net of foreign withholding taxes. Foreign withholding taxes where reclaims have been or will be filed are reflected on the Statements of Assets and Liabilities as tax reclaims receivable. Capital gains taxes paid are included in net realized gain (loss) on investments in the Statements of Operations. Accrued but unpaid capital gains taxes are reflected as foreign taxes payable on the Statements of Assets and Liabilities, if applicable, and reduce unrealized gains on investments. In the event that realized gains on investments are subsequently offset by realized losses, taxes paid on realized gains may be returned to a Fund. Such amounts, if applicable, are reflected as foreign tax rebates receivable on the Statements of Assets and Liabilities and are recorded as a realized gain when received.
f. Dividends and Distributions to Shareholders. Dividends and distributions are recorded on the ex-dividend date. The timing and characterization of certain income and capital gain distributions are determined in accordance with federal tax regulations, which may differ from accounting principles generally accepted in the United States of America. Permanent differences are primarily due to differing treatments for book and tax purposes of items such as premium amortization, deferred Trustees’ fees, futures contract mark-to-market, non-deductible expenses and paydown gains and losses. Permanent book and tax basis differences relating to shareholder distributions, net investment income and net realized gains will result in reclassifications to capital accounts reported on the Statements of Assets and Liabilities. Temporary differences between book and tax distributable earnings are primarily due to deferred Trustees’ fees, futures contract mark-to-market, paydown gains and losses, straddle loss deferrals, premium amortization and wash sales. Amounts of income and capital gain available to be distributed on a tax basis are determined annually, and at other times during the Funds’ fiscal year as may be necessary to avoid knowingly declaring and paying a return of capital distribution. Distributions from net investment income and net realized short-term capital gains are reported as distributed from ordinary income for tax purposes.
41 |
Notes to Financial Statements (continued)
December 31, 2020
The tax characterization of distributions is determined on an annual basis. The tax character of distributions paid to shareholders during the years ended December 31, 2020 and 2019 were as follows:
| | | | | | | | | | | | | | | | | | | | | | | | |
| | | 2020 Distributions | | | 2019 Distributions | |
Fund | | Ordinary
Income | | | Long-Term
Capital Gains | | | Total | | | Ordinary
Income | | | Long-Term
Capital Gains | | | Total | |
Short Duration Income ETF | | $ | 1,077,550 | | | $ | 1,080 | | | $ | 1,078,630 | | | $ | 779,880 | | | $ | — | | | $ | 779,880 | |
U.S. Equity Opportunities ETF | | | 1,777 | | | | — | | | | 1,777 | | | | — | | | | — | | | | — | |
Mid Cap ETF | | | 15,182 | | | | 156 | | | | 15,338 | | | | — | | | | — | | | | — | |
Select ETF | | | 3,769 | | | | — | | | | 3,769 | | | | — | | | | — | | | | — | |
Distributions paid to shareholders from net investment income and net realized capital gains, based on accounting principles generally accepted in the United States of America, are consolidated and reported on the Statements of Changes in Net Assets as Distributions to Shareholders. Distributions paid to shareholders from net investment income and net realized capital gains expressed in per-share amounts, based on accounting principles generally accepted in the United States of America, are separately stated and reported within the Financial Highlights.
As of December 31, 2020, the components of distributable earnings on a tax basis were as follows:
| | | | | | | | | | | | | | | | |
| | | Short
Duration
Income ETF | | | U.S. Equity
Opportunities
ETF | | | Mid Cap
ETF | | | Select
ETF | |
Undistributed ordinary income | | $ | 208,801 | | | $ | 13,066 | | | $ | 36,595 | | | $ | 504 | |
Undistributed long-term capital gains | | | 187,510 | | | | — | | | | 218 | | | | — | |
| | | | | | | | | | | | | | | | |
Total undistributed earnings | | | 396,311 | | | | 13,066 | | | | 36,813 | | | | 504 | |
| | | | | | | | | | | | | | | | |
Capital loss carryforward: | |
Short-term: | |
No expiration date | | | — | | | | — | | | | — | | | | (6,608 | ) |
| | | | | | | | | | | | | | | | |
Unrealized appreciation | | | 452,619 | | | | 1,522,450 | | | | 1,047,651 | | | | 560,914 | |
| | | | | | | | | | | | | | | | |
Total accumulated earnings | | $ | 848,930 | | | $ | 1,535,516 | | | $ | 1,084,464 | | | $ | 554,810 | |
| | | | | | | | | | | | | | | | |
As of December 31, 2020, the tax cost of investments (including derivatives, if applicable) and unrealized appreciation (depreciation) on a federal tax basis were as follows:
| | | | | | | | | | | | | | | | |
| | | Short
Duration
Income ETF | | | U.S. Equity
Opportunities
ETF | | | Mid Cap
ETF | | | Select
ETF | |
Federal tax cost | | $ | 23,768,751 | | | $ | 10,360,319 | | | $ | 6,756,396 | | | $ | 5,507,064 | |
| | | | | | | | | | | | | | | | |
Gross tax appreciation | | $ | 455,404 | | | $ | 1,619,717 | | | $ | 1,069,688 | | | $ | 618,819 | |
Gross tax depreciation | | | (2,785 | ) | | | (97,267 | ) | | | (22,037 | ) | | | (57,905 | ) |
| | | | | | | | | | | | | | | | |
Net tax appreciation | | $ | 452,619 | | | $ | 1,522,450 | | | $ | 1,047,651 | | | $ | 560,914 | |
| | | | | | | | | | | | | | | | |
g. Repurchase Agreements. Each Fund may enter into repurchase agreements, under the terms of a Master Repurchase Agreement, under which each Fund acquires securities as collateral and agrees to resell the securities at an agreed upon time and at an agreed upon price. It is each Fund’s policy that the market value of the collateral for repurchase agreements be at least equal to 102% of the repurchase price, including interest. Certain repurchase agreements are tri-party arrangements whereby the collateral is held in a segregated account for the benefit of the Fund and on behalf of the counterparty. Repurchase agreements could involve certain risks in the event of default or insolvency of the counterparty including possible delays or restrictions upon the Fund’s ability to dispose of the underlying securities. As of December 31, 2020, each Fund, as applicable, had investments in repurchase agreements for which the value of the related collateral exceeded the value of the repurchase agreement. The gross value of repurchase agreements is included in the Statements of Assets and Liabilities for financial reporting purposes.
h. Due from Brokers. Transactions and positions in certain futures contracts are maintained and cleared by registered U.S. broker/dealers pursuant to customer agreements between a Fund and the various broker/dealers. The due from brokers balance in the Statements of Assets and Liabilities for Short Duration Income ETF represents cash pledged as initial margin for futures contracts. In certain circumstances a Fund’s use of cash and/or securities held at brokers is restricted by regulation or broker mandated limits.
| 42
Notes to Financial Statements (continued)
December 31, 2020
i. Indemnifications. Under the Trusts’ organizational documents, their officers and Trustees are indemnified against certain liabilities arising out of the performance of their duties to the Funds. Additionally, in the normal course of business, the Funds enter into contracts with service providers that contain general indemnification clauses. The Funds’ maximum exposure under these arrangements is unknown as this would involve future claims that may be made against the Funds that have not yet occurred. However, based on experience, the Funds expect the risk of loss to be remote.
j. New Accounting Pronouncement. In March 2020, the Financial Accounting Standards Board issued Accounting Standard Update 2020-04, Reference Rate Reform (Topic 848) (“ASU 2020-04”). In response to concerns about structural risks of interbank offered rates, and particularly the risk of cessation of the London Interbank Offered Rate (“LIBOR”), which is expected to occur no later than December 31, 2021, regulators have undertaken reference rate reform initiatives to identify alternative reference rates that are more observable or transaction based and less susceptible to manipulation. ASU 2020-04 provides temporary guidance to ease the potential burden in accounting for (or recognizing the effects of) reference rate reform on financial reporting. ASU 2020-04 is elective and applies to all entities, subject to meeting certain criteria, that have contracts that reference LIBOR or another reference rate expected to be discontinued because of reference rate reform. ASU 2020-04 amendments offer optional expedients for contract modifications that would allow an entity to account for such modifications by prospectively adjusting the effective interest rate, instead of evaluating each contract, in accordance with existing accounting standards, as to whether reference rate modifications constitute the establishment of new contracts or the continuation of existing contracts. ASU 2020-04 amendments are currently effective and an entity may elect to apply its provisions as of any date from the beginning of an interim period that includes or is subsequent to March 12, 2020. No Fund contracts have yet been impacted by reference rate reform. Management expects to apply the optional expedients when appropriate.
3. Fair Value Measurements. In accordance with accounting standards related to fair value measurements and disclosures, the Funds have categorized the inputs utilized in determining the value of each Fund’s assets or liabilities. These inputs are summarized in the three broad levels listed below:
| | • | | Level 1 – quoted prices in active markets for identical assets or liabilities; |
| | • | | Level 2 – prices determined using other significant inputs that are observable either directly, or indirectly through corroboration with observable market data (which could include quoted prices for similar assets or liabilities, interest rates, credit risk, etc.); and |
| | • | | Level 3 – prices determined using significant unobservable inputs when quoted prices or observable inputs are unavailable such as when there is little or no market activity for an asset or liability (unobservable inputs reflect each Fund’s own assumptions in determining the fair value of assets or liabilities and would be based on the best information available). |
The inputs or methodology used for valuing securities are not necessarily an indication of the risk associated with investing in those securities.
The Funds’ pricing policies and procedures are recommended by the adviser and approved by the Board of Trustees. Debt securities are valued based on evaluated bids furnished to the Funds by an independent pricing service. Broker-dealer bid prices may be used if an independent pricing service either is unable to price a security or does not provide a reliable price for a security. The Funds’ adviser may use internally developed models to validate broker-dealer bid prices that are only available from a single broker or market maker. Such securities are considered and classified as fair valued. Broker-dealer bid prices for which the Funds do not have knowledge of the inputs used by the broker-dealer are categorized in Level 3. Securities for which market quotations are not readily available are valued at fair value as determined in good faith by the Funds’ adviser pursuant to procedures approved by the Board of Trustees. Fair valued securities may be categorized in Level 3.
The following is a summary of the inputs used to value the Funds’ investments as of December 31, 2020, at value:
Short Duration Income ETF
Asset Valuation Inputs
| | | | | | | | | | | | | | | | |
Description | | Level 1 | | | Level 2 | | | Level 3 | | | Total | |
Bonds and Notes | | | | | | | | | | | | | | | | |
Collateralized Mortgage Obligations | | $ | — | | | $ | 669,194 | | | $ | 29,612 | (b) | | $ | 698,806 | |
All Other Bonds and Notes(a) | | | — | | | | 22,006,231 | | | | — | | | | 22,006,231 | |
| | | | | | | | | | | | | | | | |
Total Bonds and Notes | | $ | — | | | $ | 22,675,425 | | | $ | 29,612 | | | $ | 22,705,037 | |
| | | | | | | | | | | | | | | | |
Short-Term Investments | | | — | | | | 1,516,333 | | | | — | | | | 1,516,333 | |
Futures Contracts (unrealized appreciation) | | | 3,174 | | | | — | | | | — | | | | 3,174 | |
| | | | | | | | | | | | | | | | |
Total | | $ | 3,174 | | | $ | 24,191,758 | | | $ | 29,612 | | | $ | 24,224,544 | |
| | | | | | | | | | | | | | | | |
43 |
Notes to Financial Statements (continued)
December 31, 2020
Liability Valuation Inputs
| | | | | | | | | | | | | | | | |
Description | | Level 1 | | | Level 2 | | | Level 3 | | | Total | |
Futures Contracts (unrealized depreciation) | | $ | (3,055 | ) | | $ | — | | | $ | — | | | $ | (3,055 | ) |
| | | | | | | | | | | | | | | | |
| (a) | Details of the major categories of the Fund’s investments are reflected within the Portfolio of Investments. |
| (b) | Fair valued by the Fund’s adviser. |
U.S. Equity Opportunities ETF
Asset Valuation Inputs
| | | | | | | | | | | | | | | | |
Description | | Level 1 | | | Level 2 | | | Level 3 | | | Total | |
Common Stocks(a) | | $ | 11,484,068 | | | $ | — | | | $ | — | | | $ | 11,484,068 | |
Short-Term Investments | | | — | | | | 398,701 | | | | — | | | | 398,701 | |
| | | | | | | | | | | | | | | | |
Total | | $ | 11,484,068 | | | $ | 398,701 | | | $ | — | | | $ | 11,882,769 | |
| | | | | | | | | | | | | | | | |
| (a) | Details of the major categories of the Fund’s investments are reflected within the Portfolio of Investments. |
Mid Cap ETF
Asset Valuation Inputs
| | | | | | | | | | | | | | | | |
Description | | Level 1 | | | Level 2 | | | Level 3 | | | Total | |
Common Stocks(a) | | $ | 7,725,512 | | | $ | — | | | $ | — | | | $ | 7,725,512 | |
Short-Term Investments | | | — | | | | 78,535 | | | | — | | | | 78,535 | |
| | | | | | | | | | | | | | | | |
Total | | $ | 7,725,512 | | | $ | 78,535 | | | $ | — | | | $ | 7,804,047 | |
| | | | | | | | | | | | | | | | |
| (a) | Details of the major categories of the Fund’s investments are reflected within the Portfolio of Investments. |
Select ETF
Asset Valuation Inputs
| | | | | | | | | | | | | | | | |
Description | | Level 1 | | | Level 2 | | | Level 3 | | | Total | |
Common Stocks(a) | | $ | 5,984,205 | | | $ | — | | | $ | — | | | $ | 5,984,205 | |
Short-Term Investments | | | — | | | | 83,773 | | | | — | | | | 83,773 | |
| | | | | | | | | | | | | | | | |
Total | | $ | 5,984,205 | | | $ | 83,773 | | | $ | — | | | $ | 6,067,978 | |
| | | | | | | | | | | | | | | | |
| (a) | Details of the major categories of the Fund’s investments are reflected within the Portfolio of Investments. |
The following is a reconciliation of Level 3 investments for which significant unobservable inputs were used to determine fair value as of December 31, 2019 and/or December 31, 2020:
Short Duration Income ETF
Asset Valuation Inputs
| | | | | | | | | | | | | | | | | | | | | | | | | | | | | | | | | | | | | | | | |
Investments in Securities | | Balance as of
December 31,
2019 | | | Accrued
Discounts
(Premiums) | | | Realized
Gain
(Loss) | | | Change in
Unrealized
Appreciation
(Depreciation) | | | Purchases | | | Sales | | | Transfers
into
Level 3 | | | Transfers
out of
Level 3 | | | Balance as of
December 31,
2020 | | | Change in Unrealized
Appreciation
(Depreciation)
from Investments
Still Held at
December 31,
2020 | |
Bonds and Notes | | | | | | | | | | | | | | | | | | | | | | | | | | | | | | | | | | | | | | | | |
Collateralized Mortgage Obligations | | $ | 15,131 | | | $ | — | | | $ | 1,430 | | | $ | (738 | ) | | $ | 23 | | | $ | (346,966 | ) | | $ | 360,732 | | | $ | — | | | $ | 29,612 | | | $ | (773 | ) |
| | | | | | | | | | | | | | | | | | | | | | | | | | | | | | | | | | | | | | | | |
| 44
Notes to Financial Statements (continued)
December 31, 2020
Debt securities valued at $360,732 were transferred from Level 2 to Level 3 during the period ended December 31, 2020. At December 31, 2019, these securities were valued on the basis of evaluated bids furnished to the Fund by an independent pricing service in accordance with the Fund’s valuation policies. At December 31, 2020, these securities were valued at fair value as determined in good faith by the Fund’s adviser as an independent pricing service did not provide a reliable price for the securities.
4. Derivatives. Derivative instruments are defined as financial instruments whose value and performance are based on the value and performance of an underlying asset, reference rate or index. Derivative instruments that Short Duration Income ETF used during the period include futures contracts.
The Fund is subject to the risk that changes in interest rates will affect the value of the Fund’s investments in fixed-income securities. The Fund will be subject to increased interest rate risk to the extent that it invests in fixed-income securities with longer maturities or durations, as compared to investing in fixed-income securities with shorter maturities or durations. The Fund may use futures contracts to hedge against changes in interest rates and to manage duration without having to buy or sell portfolio securities. During the year ended December 31, 2020, Short Duration Income ETF used futures contracts to manage duration.
The following is a summary of derivative instruments for Short Duration Income ETF as of December 31, 2020, as reflected within the Statements of Assets and Liabilities:
| | | | |
Assets | | Unrealized
appreciation on
futures contracts1 | |
Exchange-traded asset derivatives | | | | |
Interest rate contracts | | $ | 3,174 | |
| |
Liabilities | | Unrealized
depreciation on
futures contracts1 | |
Exchange-traded liability derivatives | | | | |
Interest rate contracts | | $ | (3,055 | ) |
| 1 | Represents cumulative unrealized appreciation (depreciation) on futures contracts. Only the current day’s variation margin on futures contracts is reported within the Statements of Assets and Liabilities as receivable or payable for variation margin, as applicable. |
Transactions in derivative instruments for Short Duration Income ETF during the year ended December 31, 2020, as reflected within the Statements of Operations, were as follows:
| | | | |
Net Realized Gain (Loss) on: | | Futures
contracts | |
Interest rate contracts | | $ | (38,060 | ) |
| |
Net Change in Unrealized Appreciation (Depreciation) on: | | Futures
contracts | |
Interest rate contracts | | $ | (14,072 | ) |
As the Fund values its derivatives at fair value and recognizes changes in fair value through the Statement of Operations, it does not qualify for hedge accounting under authoritative guidance for derivative instruments. The Fund’s investments in derivatives may represent an economic hedge; however, they are considered to be non-hedge transactions for the purpose of these disclosures.
The volume of futures contract activity, as a percentage of net assets, based on gross month-end notional amounts outstanding during the period, including long and short positions at absolute value, was as follows for the year ended December 31, 2020:
| | | | |
Short Duration Income ETF | | Futures | |
Average Notional Amount Outstanding | | | 32.95 | % |
Highest Notional Amount Outstanding | | | 40.70 | % |
Lowest Notional Amount Outstanding | | | 28.54 | % |
Notional Amount Outstanding as of December 31, 2020 | | | 28.54 | % |
Notional amounts outstanding at the end of the prior period, if applicable, are included in the averages above.
Unrealized gain and/or loss on open futures contracts is recorded in the Statements of Assets and Liabilities. The aggregate notional values of futures contracts are not recorded in the Statements of Assets and Liabilities, and therefore are not included in the net assets.
45 |
Notes to Financial Statements (continued)
December 31, 2020
Counterparty risk is managed based on policies and procedures established by each Fund’s adviser. Such policies and procedures may include, but are not limited to, minimum counterparty credit rating requirements, monitoring of counterparty credit default swap spreads and posting of collateral. With exchange-traded derivatives, there is minimal counterparty credit risk to the Fund because the exchange’s clearing house, as counterparty to these instruments, stands between the buyer and the seller of the contract. Credit risk still exists in exchange-traded derivatives with respect to initial and variation margin that is held in a broker’s customer accounts. While brokers are required to segregate customer margin from their own assets, in the event that a broker becomes insolvent or goes into bankruptcy and at that time there is a shortfall in the aggregate amount of margin held by the broker for all its clients, U.S. bankruptcy laws will typically allocate that shortfall on a pro rata basis across all of the broker’s customers, potentially resulting in losses to the Fund. Based on balances reflected on each Fund’s Statement of Assets and Liabilities, the following table shows the maximum amount of loss due to credit risk that, based on the gross fair value of the financial instrument, the applicable Fund would incur if parties to the relevant financial instruments failed completely to perform according to the terms of the contracts and the collateral or other security, if any, for the amount due proved to be of no value to the Fund:
| | | | | | | | |
Fund | | Maximum
Amount of
Loss - Gross | | | Maximum
Amount of
Loss - Net | |
Short Duration Income ETF | | $ | 48,000 | | | $ | 48,000 | |
5. Purchases and Sales of Securities. For the year ended (period ended for U.S. Equity Opportunities ETF, Mid Cap ETF and Select ETF) December 31, 2020, purchases and sales of securities (excluding in-kind transactions and short-term investments and including paydowns) were as follows:
| | | | | | | | | | | | | | | | |
| | | U.S. Government/Agency
Securities | | | Other Securities | |
Fund | | Purchases | | | Sales | | | Purchases | | | Sales | |
Short Duration Income ETF | | $ | 22,896,059 | | | $ | 21,846,156 | | | $ | 32,734,136 | | | $ | 42,007,739 | |
U.S. Equity Opportunities ETF | | | — | | | | — | | | | 797,344 | | | | 578,740 | |
Mid Cap ETF | | | — | | | | — | | | | 666,051 | | | | 638,264 | |
Select ETF | | | — | | | | — | | | | 1,048,337 | | | | 865,780 | |
For the year ended (period ended for U.S. Equity Opportunities ETF, Mid Cap ETF and Select ETF) December 31, 2020, in-kind transactions were as follows:
| | | | |
Fund | | In-Kind Purchases | |
U.S. Equity Opportunities ETF | | $ | 9,728,419 | |
Mid Cap ETF | | | 6,609,279 | |
Select ETF | | | 5,247,342 | |
6. Management Fees and Other Transactions with Affiliates.
a. Management Fees. Natixis Advisors serves as investment adviser to each Fund. Natixis Advisors is a wholly-owned subsidiary of Natixis, which is part of Natixis Investment Managers, an international asset management group based in Paris, France. Under the terms of the management agreements, each Fund pays a management fee at the following annual rates, calculated daily and payable monthly, based on each Fund’s average daily net assets:
| | | | | | | | |
| | | Percentage of Average
Daily Net Assets | |
Fund | | First $1.5 billion | | | Over $1.5 billion | |
Short Duration Income ETF | | | 0.30 | % | | | 0.30 | % |
U.S. Equity Opportunities ETF | | | 0.75 | % | | | 0.75 | % |
Mid Cap ETF | | | 0.80 | % | | | 0.75 | % |
Select ETF | | | 0.75 | % | | | 0.75 | % |
| 46
Notes to Financial Statements (continued)
December 31, 2020
Natixis Advisors has entered into subadvisory agreements for each Fund as listed below.
| | |
Short Duration Income ETF | | Loomis, Sayles & Company, L.P. (“Loomis Sayles”) |
U.S. Equity Opportunities ETF | | Harris Associates L.P. (“Harris”), |
| | Loomis Sayles |
Mid Cap ETF | | Vaughan Nelson Investment Management, L.P. (“Vaughan Nelson”) |
Select ETF | | Vaughan Nelson |
Harris and Vaughan Nelson are subsidiaries of Natixis. Loomis Sayles is a limited partnership whose sole general partner, Loomis, Sayles & Company, Inc., is indirectly owned by Natixis.
Under the terms of the subadvisory agreements, each Fund has agreed to pay its respective subadviser a subadvisory fee at the following annual rates, calculated daily and payable monthly, based on each Fund’s average daily net assets:
| | | | | | | | | | |
| | | | | Percentage of Average Daily Net Assets | |
Fund | | Subadviser | | First $1.5 billion | | | Over $1.5 billion | |
Short Duration Income ETF | | Loomis Sayles | | | 0.15 | % | | | 0.15 | % |
U.S. Equity Opportunities ETF | | | | | | | | | | |
Large Cap Value Segment | | Harris | | | 0.52 | % | | | 0.52 | % |
All Cap Growth Segment | | Loomis Sayles | | | 0.40 | % | | | 0.40 | % |
Mid Cap ETF | | Vaughan Nelson | | | 0.50 | % | | | 0.47 | % |
Select ETF | | Vaughan Nelson | | | 0.50 | % | | | 0.50 | % |
Payments to Natixis Advisors are reduced by the amounts of payments to the subadvisers, as calculated based on the table above.
Natixis Advisors has given a binding undertaking to the Funds to waive management fees and/or reimburse certain expenses to limit the Funds’ operating expenses, exclusive of acquired fund fees and expenses, brokerage expenses, interest expense, taxes, organizational and extraordinary expenses such as litigation and indemnification expenses. This undertaking is in effect until April 30, 2023, may be terminated before then only with the consent of the Funds’ Board of Trustees, and is reevaluated on an annual basis. Management fees payable, as reflected on the Statements of Assets and Liabilities, is net of waivers and/or expense reimbursements, if any, pursuant to these undertakings. Waivers/reimbursements that exceed management fees payable are reflected on the Statements of Assets and Liabilities as receivable from investment adviser.
For the year ended (period ended for U.S. Equity Opportunities ETF, Mid Cap ETF and Select ETF) December 31, 2020, the expense limits as a percentage of average daily net assets under the expense limitation agreements were as follows:
| | | | |
Fund | | Expense Limit as
a Percentage of
Average Daily
Net Assets | |
Short Duration Income ETF | | | 0.38 | % |
U.S. Equity Opportunities ETF | | | 0.90 | % |
Mid Cap ETF | | | 0.90 | % |
Select ETF | | | 0.85 | % |
Natixis Advisors shall be permitted to recover expenses borne under the expense limitation agreements (whether through waiver of management fees or otherwise) in later periods to the extent the annual operating expenses of a Fund fall below a Fund’s expense limits, provided, however, that a Fund is not obligated to pay such waived/reimbursed fees or expenses more than one year after the end of the fiscal year in which the fees or expenses were waived/reimbursed.
For the year ended (period ended for U.S. Equity Opportunities ETF, Mid Cap ETF and Select ETF) December 31, 2020, the management fees and waiver of management fees for each Fund were as follows:
| | | | | | | | | | | | | | | | | | | | |
| | | Gross
Management
Fees | | | Contractual
Waivers of
Management
Fees1 | | | Net
Management
Fees | | | Percentage of Average
Daily Net Assets | |
Fund | | Gross | | | Net | |
Short Duration Income ETF | | $ | 93,086 | | | $ | 93,086 | | | $ | — | | | | 0.30 | % | | | — | % |
U.S. Equity Opportunities ETF | | | 23,392 | | | | 23,392 | | | | — | | | | 0.75 | % | | | — | % |
47 |
Notes to Financial Statements (continued)
December 31, 2020
| | | | | | | | | | | | | | | | | | | | |
| | | Gross
Management
Fees | | | Contractual
Waivers of
Management
Fees1 | | | Net
Management
Fees | | | Percentage of Average
Daily Net Assets | |
Fund | | Gross | | | Net | |
Mid Cap ETF | | $ | 14,139 | | | $ | 14,139 | | | $ | — | | | | 0.80 | % | | | — | % |
Select ETF | | | 11,747 | | | | 11,747 | | | | — | | | | 0.75 | % | | | — | % |
| 1 | Management fee waiver is subject to possible recovery until December 31, 2021. |
For the year ended (period ended for U.S. Equity Opportunities ETF, Mid Cap ETF and Select ETF) December 31, 2020, expenses have been reimbursed as follows:
| | | | |
Fund | | Reimbursements2 | |
Short Duration Income ETF | | $ | 115,147 | |
U.S. Equity Opportunities ETF | | | 27,413 | |
Mid Cap ETF | | | 35,570 | |
Select ETF | | | 37,989 | |
| 2 | Expense reimbursement is subject to possible recovery until December 31, 2021. |
No expenses were recovered for any of the Funds during the year ended (period ended for U.S. Equity Opportunities ETF, Mid Cap ETF and Select ETF) December 31, 2020 under the terms of the expense limitation agreements.
b. Administrative Fees. Natixis Advisors provides certain administrative services for the Funds and contracts with State Street Bank and Trust Company (“State Street Bank”) to serve as sub-administrator. Pursuant to an agreement among Natixis Funds Trusts, Loomis Sayles Funds Trusts, the Trusts and Natixis Advisors, each Fund pays Natixis Advisors monthly its pro rata portion of fees equal to an annual rate of 0.0540% of the first $15 billion of the average daily net assets of the Natixis Funds Trusts, Loomis Sayles Funds Trusts and the Trusts, 0.0500% of the next $15 billion, 0.0400% of the next $30 billion, 0.0275% of the next $30 billion and 0.0225% of such assets in excess of $90 billion, subject to an annual aggregate minimum fee for the Natixis Funds Trusts, Loomis Sayles Funds Trusts and the Trusts of $10 million, which is reevaluated on an annual basis.
For the year ended (period ended for U.S. Equity Opportunities ETF, Mid Cap ETF and Select ETF) December 31, 2020, the administrative fees for each Fund were as follows:
| | | | |
Fund | | Administrative Fees | |
Short Duration Income ETF | | $ | 13,678 | |
U.S. Equity Opportunities ETF | | | 1,355 | |
Mid Cap ETF | | | 767 | |
Select ETF | | | 680 | |
c. Trustees Fees and Expenses. The Trusts do not pay any compensation directly to their officers or Trustees who are directors, officers or employees of Natixis Advisors, Natixis Distribution, L.P. (“Natixis Distribution”), Natixis or their affiliates. The Chairperson of the Board of Trustees receives a retainer fee at the annual rate of $369,000. The Chairperson does not receive any meeting attendance fees for Board of Trustees meetings or committee meetings that he attends. Each Independent Trustee (other than the Chairperson) receives, in the aggregate, a retainer fee at the annual rate of $199,000. Each Independent Trustee also receives a meeting attendance fee of $10,000 for each meeting of the Board of Trustees that he or she attends in person and $5,000 for each meeting of the Board of Trustees that he or she attends telephonically. In addition, the chairperson of the Contract Review Committee, the chairperson of the Audit Committee and the chairperson of the Governance Committee each receive an additional retainer fee at the annual rate of $20,000. Each Contract Review Committee member is compensated $6,000 for each Committee meeting that he or she attends in person and $3,000 for each meeting that he or she attends telephonically. Each Audit Committee member is compensated $6,000 for each Committee meeting that he or she attends in person and $3,000 for each meeting that he or she attends telephonically. These fees are allocated among the funds in the Natixis Funds Trusts, Loomis Sayles Funds Trusts and Natixis ETF Trusts based on a formula that takes into account, among other factors, the relative net assets of each fund. Trustees are reimbursed for travel expenses in connection with attendance at meetings.
A deferred compensation plan (the “Plan”) is available to the Trustees on a voluntary basis. Deferred amounts remain in the Funds until distributed in accordance with the provisions of the Plan. The value of a participating Trustee’s deferral account is based on theoretical investments of deferred amounts, on the normal payment dates, in certain funds of the Natixis Funds Trusts, Loomis Sayles Funds Trusts and the Trusts as designated by the participating Trustees. Changes in the value of participants’ deferral accounts are allocated pro rata among the funds in the Natixis Funds Trusts, Loomis Sayles Funds Trusts and the Trusts, and are normally reflected as Trustees’ fees and expenses in the Statements of Operations. The portions of the accrued obligations allocated to the Funds under the Plan are reflected as Deferred Trustees’ fees in the Statements of Assets and Liabilities.
| 48
Notes to Financial Statements (continued)
December 31, 2020
Certain officers and employees of Natixis Advisors and affiliates are also officers and/or Trustees of the Trusts.
d. Affiliated Ownership. As of December 31, 2020, the percentage of each Fund’s net assets owned by Natixis is as follows:
| | | | |
Fund | | Percentage of Net Assets | |
Short Duration Income ETF | | | 15.48 | % |
U.S. Equity Opportunities ETF | | | 97.33 | % |
Mid Cap ETF | | | 77.01 | % |
Select ETF | | | 91.76 | % |
Investment activities of affiliated shareholders could have material impacts on the Funds.
7. Transfer Agent and Custodian Fees and Expenses. State Street Bank, custodian and transfer agent to the Funds, has agreed to waive the transfer agent fees, custodian fees and certain other expenses for the first 12 months of operations for US Equity Opportunities ETF, Mid Cap ETF, and Select ETF. For the period ended December 31, 2020, total fees waived for each fund were $14,423, $14,499 and $14,539 respectively.
8. Line of Credit. Short Duration Income ETF, together with certain other funds of Natixis Funds Trusts, Loomis Sayles Funds Trusts and the Trusts, entered into a $400,000,000 committed unsecured line of credit provided by State Street Bank. Any one Fund may borrow up to $350,000,000 under the line of credit agreement (as long as all borrowings by all Funds in the aggregate do not exceed the $400,000,000 limit at any time), subject to each Fund’s investment restrictions and its contractual obligations under the line of credit. Interest is charged to the Funds based upon the terms set forth in the agreement. In addition, a commitment fee of 0.15% per annum, payable at the end of each calendar quarter, is accrued and apportioned among the participating funds based on their average daily unused portion of the line of credit. The Funds paid an arrangement fee, an upfront fee, and certain other legal fees in connection with the line of credit agreement, which are being amortized over a period of 364 days and are reflected in legal fees and/or miscellaneous expenses on the Statements of Operations. The unamortized balance is reflected as prepaid expenses on the Statements of Assets and Liabilities.
For the year ended December 31, 2020, the Fund had no borrowings under this agreement.
9. Risk. The Funds have exposure to certain types of risk as summarized below.
a. Authorized Participant Concentration Risk. Only an authorized participant (“Authorized Participant”) may engage in creation or redemption transactions directly with the Funds. The Funds have a limited number of institutions that act as Authorized Participants, none of which are or will be obligated to engage in creation or redemption transactions. To the extent that these institutions exit the business or are unable to proceed with creation and/or redemption orders with respect to the Funds and no other Authorized Participant is able to step forward to create or redeem Creation Units, Fund shares may trade at a discount to NAV and possibly face trading halts and/or delisting.
b. Premium/Discount Risk. Shares of the Funds are listed for trading on the NYSE Arca and are bought and sold in the secondary market at market prices that may differ from their most recent NAV. The market value of the Funds’ shares will fluctuate, in some cases materially, in response to changes in the Funds’ NAV, the intraday value of the Funds’ holdings, and the relative supply and demand for the Funds’ shares on the exchange. Disruptions to creations and redemptions, the existence of extreme market volatility or potential lack of an active trading market for shares may result in shares trading at a significant premium or discount to NAV and/or in a reduced liquidity of your investment. If a shareholder purchases shares at a time when the market price is at a premium to the NAV or sells shares at a time when the market price is at a discount to the NAV, the shareholder may sustain losses.
c. Secondary Market Trading Risk. Investors buying or selling shares of the Funds in the secondary market will pay brokerage commissions or other charges imposed by broker-dealers as determined by that broker. Brokerage commissions are often a fixed amount and may be a significant proportional cost for investors seeking to buy or sell relatively small amounts of shares.
d. Trading Issues Risk. Trading in shares on the NYSE Arca may be halted in certain circumstances. There can be no assurance that the requirements of the NYSE Arca necessary to maintain the listing of the Funds will continue to be met. Because U.S. Equity Opportunities ETF, Mid Cap ETF, and Select ETF trade on the basis of a published Proxy Portfolio, they may trade at a wider bid/ask spread and may experience a wider premium/discount than traditional ETFs that publish their portfolios on a daily basis, and therefore, may cost investors more to trade especially during periods of market disruption or volatility.
e. Non-Diversified Risk. Select ETF is non-diversified, which means that it is not limited under the 1940 Act to a percentage of assets that it may invest in any one issuer. Because the Fund may invest in the securities of a limited number of issuers, an investment in the Fund may involve a higher degree of risk than would be present in a diversified portfolio.
f. Other. Global markets have experienced periods of high volatility triggered by the ongoing public health emergency known as coronavirus (“Covid-19”). As the situation continues, the extent and duration of the impact that the Covid-19 outbreak may have on
49 |
Notes to Financial Statements (continued)
December 31, 2020
financial markets and the economy as a whole remains highly uncertain. If the effects of the Covid-19 outbreak on financial markets and the economy continue for an extended period of time, the Funds’ future financial and investment results may be adversely affected.
10. Capital Shares. Shares of the Funds may be acquired or redeemed directly from the Funds by Authorized Participants only in aggregations of 50,000 shares (prior to October 1, 2020, in aggregations of 100,000 shares) for Short Duration Income ETF and 10,000 shares for U.S. Equity Opportunities ETF, Mid Cap ETF and Select ETF (“Creation Units”), or multiples thereof. Each Authorized Participant enters into an Authorized Participant agreement with the Funds’ Distributor.
A creation transaction order, which is subject to acceptance by ALPS, generally takes place when an Authorized Participant deposits into the Funds a designated portfolio of securities and/or cash (including any portion of such securities for which cash may be substituted) and a specified amount of cash approximating the holdings of the Funds in exchange for a specified number of Creation Units.
Similarly, shares can be redeemed only in Creation Units, generally for a designated portfolio of securities and/or cash (including any portion of such securities for which cash may be substituted) held by the Funds and a specified amount of cash. Except when aggregated in Creation Units, shares are not redeemable directly with the Funds.
The prices at which creations and redemptions occur are based on the next calculation of NAV after a creation or redemption order is received in an acceptable form under the Authorized Participant agreement. These prices may differ from the market price of the Fund’s shares.
The Funds may impose a creation transaction fee and a redemption transaction fee to offset transfer and other transaction costs associated with the issuance and redemption of Creation Units. Transaction fees are included in capital share transactions on the Statements of Changes in Net Assets.
Transactions in capital shares were as follows:
| | | | | | | | | | | | | | | | |
| | | Year Ended
December 31, 2020 | | | Year Ended
December 31, 2019 | |
Short Duration Income ETF | | Shares | | | Amount | | | Shares | | | Amount | |
Issued from the sale of shares | | | 500,000 | | | $ | 12,999,407 | | | | 100,000 | | | $ | 2,529,226 | |
Redeemed | | | (750,000 | ) | | | (19,523,835 | ) | | | — | | | | — | |
| | | | | | | | | | | | | | | | |
Increase (decrease) from capital share transactions | | | (250,000 | ) | | $ | (6,524,428 | ) | | | 100,000 | | | $ | 2,529,226 | |
| | | | | | | | | | | | | | | | |
| | | | | | | | |
| | | Period Ended
December 31, 2020(a) | |
U.S. Equity Opportunities ETF | | Shares | | | Amount | |
Issued from the sale of shares | | | 410,000 | | | $ | 10,240,403 | |
| | | | | | | | |
Increase from capital share transactions | | | 410,000 | | | $ | 10,240,403 | |
| | | | | | | | |
| (a) | From commencement of operations on September 16, 2020 through December 31, 2020. |
| | | | | | | | |
| | | Period Ended
December 31, 2020(a) | |
Mid Cap ETF | | Shares | | | Amount | |
Issued from the sale of shares | | | 260,000 | | | $ | 6,685,365 | |
| | | | | | | | |
Increase from capital share transactions | | | 260,000 | | | $ | 6,685,365 | |
| | | | | | | | |
| (a) | From commencement of operations on September 16, 2020 through December 31, 2020. |
| | | | | | | | |
| | | Period Ended
December 31, 2020(a) | |
Select ETF | | Shares | | | Amount | |
Issued from the sale of shares | | | 220,000 | | | $ | 5,478,454 | |
| | | | | | | | |
Increase from capital share transactions | | | 220,000 | | | $ | 5,478,454 | |
| | | | | | | | |
| (a) | From commencement of operations on September 16, 2020 through December 31, 2020. |
| 50
Report of Independent Registered Public Accounting Firm
To the Board of Trustees of Natixis ETF Trust and Natixis ETF Trust II and Shareholders of Natixis Loomis Sayles Short Duration Income ETF, Natixis U.S. Equity Opportunities ETF, Natixis Vaughan Nelson Mid Cap ETF and Natixis Vaughan Nelson Select ETF
Opinions on the Financial Statements
We have audited the accompanying statements of assets and liabilities, including the portfolios of investments, of Natixis Loomis Sayles Short Duration Income ETF (constituting Natixis ETF Trust), Natixis U.S. Equity Opportunities ETF, Natixis Vaughan Nelson Mid Cap ETF and Natixis Vaughan Nelson Select ETF (constituting Natixis ETF Trust II) (hereafter collectively referred to as the “Funds”) as of December 31, 2020, the related statements of operations and of changes in net assets for each of the periods indicated in the table below, including the related notes, and the financial highlights for each of the periods indicated therein (collectively referred to as the “financial statements”). In our opinion, the financial statements present fairly, in all material respects, the financial position of each of the Funds as of December 31, 2020, the results of each of their operations and the changes in each of their net assets for the periods indicated in the table below, and each of the financial highlights for each of the periods indicated therein, in conformity with accounting principles generally accepted in the United States of America.
| | | | |
| Fund | | Statements of operations | | Statements of changes in net assets |
Natixis Loomis Sayles Short Duration Income ETF | | For the year ended December 31, 2020 | | For the years ended December 31, 2020 and 2019 |
Natixis U.S. Equity Opportunities ETF | | For the period from September 16, 2020 (commencement of operations) through December 31, 2020 | | For the period from September 16, 2020 (commencement of operations) through December 31, 2020 |
Natixis Vaughan Nelson Mid Cap ETF | | For the period from September 16, 2020 (commencement of operations) through December 31, 2020 | | For the period from September 16, 2020 (commencement of operations) through December 31, 2020 |
Natixis Vaughan Nelson Select ETF | | For the period from September 16, 2020 (commencement of operations) through December 31, 2020 | | For the period from September 16, 2020 (commencement of operations) through December 31, 2020 |
Basis for Opinions
These financial statements are the responsibility of the Funds’ management. Our responsibility is to express an opinion on the Funds’ financial statements based on our audits. We are a public accounting firm registered with the Public Company Accounting Oversight Board (United States) (PCAOB) and are required to be independent with respect to the Funds in accordance with the U.S. federal securities laws and the applicable rules and regulations of the Securities and Exchange Commission and the PCAOB.
We conducted our audits of these financial statements in accordance with the standards of the PCAOB. Those standards require that we plan and perform the audit to obtain reasonable assurance about whether the financial statements are free of material misstatement, whether due to error or fraud.
Our audits included performing procedures to assess the risks of material misstatement of the financial statements, whether due to error or fraud, and performing procedures that respond to those risks. Such procedures included examining, on a test basis, evidence regarding the amounts and disclosures in the financial statements. Our audits also included evaluating the accounting principles used and significant estimates made by management, as well as evaluating the overall presentation of the financial statements. Our procedures included confirmation of securities owned as of December 31, 2020 by correspondence with the custodian and brokers; when replies were not received from brokers, we performed other auditing procedures. We believe that our audits provide a reasonable basis for our opinions.
/s/PricewaterhouseCoopers LLP
Boston, Massachusetts
February 22, 2021
We have served as the auditor of one or more of the investment companies in the Natixis Investment Company Complex since at least 1995. We have not been able to determine the specific year we began serving as auditor.
51 |
2020 U.S. Tax Distribution Information to Shareholders (Unaudited)
Corporate Dividends Received Deduction. For the fiscal year ended December 31, 2020, a percentage of dividends distributed by the Fund listed below qualifies for the dividends received deduction for corporate shareholders. This percentage is as follows:
| | | | |
Fund | | Qualifying
Percentage | |
U.S. Equity Opportunities ETF | | | 100.00 | % |
Mid Cap ETF | | | 37.83 | % |
Select ETF | | | 100.00 | % |
Capital Gains Distributions. Pursuant to Internal Revenue Section 852(b), the following Funds paid distributions, which have been designated as capital gains distributions for the fiscal year ended December 31, 2020, unless subsequently determined to be different.
| | | | |
Fund | | Amount | |
Short Duration Income ETF | | $ | 1,080 | |
Mid Cap ETF | | | 156 | |
Qualified Dividend Income. For the fiscal year ended December 31, 2020, the Fund below will designate up to the maximum amount allowable pursuant to the Internal Revenue Code as qualified dividend income eligible for reduced tax rates. These lower rates range from 0% to 20% depending on an individual’s tax bracket. If the Fund pays a distribution during calendar year 2020, complete information will be reported in conjunction with Form 1099-DIV.
| | | | |
Fund | | Qualifying
Percentage | |
U.S. Equity Opportunities ETF | | | 100.00 | % |
Mid Cap ETF | | | 100.00 | % |
Select ETF | | | 100.00 | % |
| 52
Other Information
Premium/Discount Analysis (Unaudited)
Fund shares are bought and sold on the secondary market at current market prices. Premium/discount represents the difference between the market price (midpoint between the highest bid and lowest offer on the primary listing exchange) and net asset value (“NAV”) of Fund shares determined as of the close of the NYSE.
Premium/discount will fluctuate regularly based on the supply of, and demand for, shares of the Fund. Shareholders may pay more than NAV when they buy Fund shares and receive less than NAV when they sell shares.
The following information presents the frequency of distributions of premiums and discounts for the Funds, as stated in trading days. Trading days are presented by year, starting with the date the Fund began trading on the secondary market. Premium/discount ranges with no trading days are omitted.
The frequency distribution of premiums and discounts, for Short Duration Income ETF, for the period from December 28, 2017 through December 31, 2020 is as follows:
| | | | | | | | | | | | | | | | |
| | | Number of Days | |
Premium/Discount Range | | 2020 | | | 2019 | | | 2018 | | | 2017 | |
Greater than 2.0% and Less than 2.5% | | | 1 | | | | — | | | | — | | | | — | |
Greater than 1.5% and Less than 2.0% | | | 1 | | | | — | | | | — | | | | — | |
Greater than 0.5% and Less than 1.0% | | | 1 | | | | — | | | | 1 | | | | — | |
Greater than 0.0% and Less than 0.5% | | | 221 | | | | 155 | | | | 221 | | | | 1 | |
At NAV | | | 16 | | | | 69 | | | | 15 | | | | 1 | |
Less than 0.0% and Greater than -0.5% | | | 12 | | | | 29 | | | | 14 | | | | — | |
The frequency distribution of premiums and discounts, for U.S. Equity Opportunities ETF, for the period from September 16, 2020 through December 31, 2020 is as follows:
| | | | |
| | | Number of Days | |
Premium/Discount Range | | 2020 | |
Greater than 0.5% and Less than 1.0% | | | 5 | |
Greater than 0.0% and Less than 0.5% | | | 55 | |
At NAV | | | 7 | |
Less than 0.0% and Greater than -0.5% | | | 7 | |
The frequency distribution of premiums and discounts, for Mid Cap ETF, for the period from September 16, 2020 through December 31, 2020 is as follows:
| | | | |
| | | Number of Days | |
Premium/Discount Range | | 2020 | |
Greater than 0.5% and Less than 1.0% | | | 2 | |
Greater than 0.0% and Less than 0.5% | | | 66 | |
At NAV | | | 3 | |
Less than 0.0% and Greater than -0.5% | | | 2 | |
Less than -0.5% and Greater than -1.0% | | | 1 | |
The frequency distribution of premiums and discounts, for Select ETF, for the period from September 16, 2020 through December 31, 2020 is as follows:
| | | | |
| | | Number of Days | |
Premium/Discount Range | | 2020 | |
Greater than 0.5% and Less than 1.0% | | | 3 | |
Greater than 0.0% and Less than 0.5% | | | 60 | |
At NAV | | | 7 | |
Less than 0.0% and Greater than -0.5% | | | 4 | |
Data shown represents past performance and is no guarantee of, and not necessarily indicative of, future results.
Information regarding premium/discount history on a daily basis is available from the Natixis Funds’ website.
53 |
Trustee and Officer Information
The tables below provide certain information regarding the trustees and officers of Natixis ETF Trust and Natixis ETF Trust II (the “Trusts”). Unless otherwise indicated, the address of all persons below is 888 Boylston Street, Suite 800, Boston, MA 02199-8197. The Funds’ Statements of Additional Information include additional information about the trustees of the Trusts and are available by calling Natixis ETFs at 800-458-7452.
| | | | | | | | |
Name and Year of Birth | | Position(s) Held with the Trusts, Length of Time Served and Term of Office1 | | Principal
Occupation(s) During Past 5 Years | | Number of Portfolios in Fund Complex Overseen2 and Other Directorships Held During Past 5 Years | | Experience, Qualifications, Attributes, Skills for Board Membership |
|
| INDEPENDENT TRUSTEES |
| | | | |
Edmond J. English (1953) | | Trustee since 2016 for Natixis ETF Trust and 2020 for Natixis ETF Trust II Chairperson of Governance Committee and Audit Committee Member | | Executive Chairman of Bob’s Discount Furniture (retail) | | 54 Director, Burlington Stores, Inc. (retail) | | Significant experience on the Board and on the boards of other business organizations (including retail companies and a bank); executive experience (including at a retail company) |
| | | | |
Richard A. Goglia (1951) | | Trustee since 2016 for Natixis ETF Trust and 2020 for Natixis ETF Trust II Contract Review Committee Member and Governance Committee Member | | Retired | | 54 Director of Triumph Group (aerospace industry) | | Significant experience on the Board and executive experience (including his role as vice president and treasurer of a defense company and experience at a financial services company) |
| | | | |
Wendell J. Knox (1948) | | Trustee since 2016 for Natixis ETF Trust and 2020 for Natixis ETF Trust II Chairperson of Contract Review Committee | | Retired | | 54 Director of Abt Associates Inc. (research and consulting); Director, The Hanover Insurance Group (property and casualty insurance); formerly, Director, Eastern Bank (bank) | | Significant experience on the Board and on the boards of other business organizations (including at a bank and at a property and casualty insurance firm); executive experience (including roles as president and chief executive officer of a research and consulting company) |
| | | | |
Martin T. Meehan (1956) | | Trustee since 2016 for Natixis ETF Trust and 2020 for Natixis ETF Trust II Audit Committee Member | | President, University of Massachusetts | | 54 None | | Significant experience on the Board and on the boards of other business organizations; experience as President of the University of Massachusetts; government experience (including as a member of the U.S. House of Representatives); academic experience |
| 54
Trustee and Officer Information
| | | | | | | | |
Name and Year of Birth | | Position(s) Held with the Trusts, Length of Time Served and Term of Office1 | | Principal
Occupation(s) During Past 5 Years | | Number of Portfolios in Fund Complex Overseen2 and Other Directorships Held During Past 5 Years | | Experience, Qualifications, Attributes, Skills for Board Membership |
|
| INDEPENDENT TRUSTEES – continued |
| | | | |
Maureen B. Mitchell (1951) | | Trustee since 2017 for Natixis ETF Trust and 2020 for Natixis ETF Trust II Contract Review Committee Member and Governance Committee Member | | Retired; formerly President, Global Sales and Marketing, GE Asset Management, Inc. (financial services) | | 54 Director, Sterling Bancorp (bank) | | Experience on the Board; financial services industry and executive experience (including role as president of global sales and marketing at a financial services company) |
| | | | |
James P. Palermo (1955) | | Trustee since 2016 for Natixis ETF Trust and 2020 for Natixis ETF Trust II Contract Review Committee Member | | Founding Partner, Breton Capital Management, LLC (private equity); Partner, STEP Partners, LLC (private equity) | | 54 Director, FutureFuel.io (chemicals and biofuels) | | Experience on the Board; financial services industry and executive experience (including roles as chief executive officer of client management and asset servicing for a banking and financial services company) |
| | | | |
Erik R. Sirri (1958) | | Chairperson of the Board of Trustees since January 2021 Trustee since 2016 for Natixis ETF Trust and 2020 for Natixis ETF Trust II Ex Officio member of Audit Committee, Contract Review Committee and Governance Committee | | Professor of Finance at Babson College | | 54 None | | Significant experience on the Board; experience as Director of the Division of Trading and Markets at the Securities and Exchange Commission; academic experience; training as an economist |
| | | | |
Peter J. Smail (1952) | | Trustee since 2016 for Natixis ETF Trust and 2020 for Natixis ETF Trust II Audit Committee Member and Governance Committee Member | | Retired | | 54 None | | Significant experience on the Board; mutual fund industry and executive experience (including roles as president and chief executive officer for an investment adviser) |
55 |
Trustee and Officer Information
| | | | | | | | |
Name and Year of Birth | | Position(s) Held with the Trusts, Length of Time Served and Term of Office1 | | Principal
Occupation(s) During Past 5 Years | | Number of Portfolios in Fund Complex Overseen2 and Other Directorships Held During Past 5 Years | | Experience, Qualifications, Attributes, Skills for Board Membership |
|
| INDEPENDENT TRUSTEES – continued |
| | | | |
Kirk A. Sykes (1958) | | Trustee since 2019 for Natixis ETF Trust and 2020 for Natixis ETF Trust II Contract Review Committee Member | | Managing Director of Accordia Partners, LLC (real estate development); President of Primary Corporation (real estate development); Managing Principal of Merrick Capital Partners (infrastructure finance); formerly, President of Urban Strategy America Fund (real estate fund manager) | | 54 Trustee, Eastern Bank (bank); Director, Apartment Investment and Management Company (real estate investment trust); formerly Director, Ares Commercial Real Estate Corporation (real estate investment trust) | | Experience on the Board and significant experience on the boards of other business organizations (including real estate companies and banks) |
| | | | |
Cynthia L. Walker (1956) | | Trustee since 2016 for Natixis ETF Trust and 2020 for Natixis ETF Trust II Chairperson of the Audit Committee and Governance Committee Member | | Retired; formerly, Deputy Dean for Finance and Administration, Yale University School of Medicine | | 54 None | | Significant experience on the Board; executive experience in a variety of academic organizations (including roles as dean for finance and administration) |
|
| INTERESTED TRUSTEES |
| | | | |
Kevin P. Charleston3 (1965) One Financial Center Boston, MA 02111 | | Trustee since 2016 for Natixis ETF Trust and 2020 for Natixis ETF Trust II | | President, Chief Executive Officer and Chairman of the Board of Directors, Loomis, Sayles & Company, L. | | 54 None | | Significant experience on the Board; continuing service as President, Chief Executive Officer and Chairman of the Board of Directors of Loomis, Sayles & Company, L.P. |
| | | | |
David L. Giunta4 (1965) | | Trustee since 2015 for Natixis ETF Trust and 2017 for Natixis ETF Trust II President and Chief Executive Officer of Natixis ETF Trust since 2011; President and Chief Executive Officer of Natixis ETF Trust II since 2017 | | President and Chief Executive Officer, Natixis Advisors, L.P., Natixis Distribution, L.P., Natixis Distribution Corporation and Chairman of the Board of Natixis Distribution Corporation | | 54 None | | Significant experience on the Board; experience as President and Chief Executive Officer of Natixis Advisors, L.P., Natixis Distribution, L.P., Natixis Distribution Corporation and Chairman of the Board of Natixis Distribution Corporation |
| 56
Trustee and Officer Information
| 1 | Each trustee serves until retirement, resignation or removal from the Board. The current retirement age is 75. The position of Chairperson of the Board is appointed for a three-year term. |
| 2 | The trustees of the Trusts serve as trustees of a fund complex that includes all series of the Natixis Funds Trust I, Natixis Funds Trust II, Natixis Funds Trust IV, Gateway Trust, Loomis Sayles Funds I, Loomis Sayles Funds II, Natixis ETF Trust and Natixis ETF Trust II (collectively, the “Fund Complex”). |
| 3 | Mr. Charleston is deemed an “interested person” of the Trusts because he holds the following positions with an affiliated person of the Trusts: President, Chief Executive Officer and Chairman of the Board of Directors of Loomis, Sayles & Company, L.P. |
| 4 | Mr. Giunta is deemed an “interested person” of the Trusts because he holds the following positions with an affiliated person of the Trusts: President and Chief Executive Officer, Natixis Advisors, L.P., Natixis Distribution, L.P., Natixis Distribution Corporation and Chairman of the Board of Natixis Distribution Corporation. |
57 |
Trustee and Officer Information
| | | | | | |
Name and Year of Birth | | Position(s) Held with the Trusts | | Term of Office1 and Length of Time Served | | Principal Occupation(s) During Past 5 Years2 |
|
| OFFICERS OF THE TRUSTS |
| | | |
Russell L. Kane (1969) | | Secretary, Clerk and Chief Legal Officer Chief Compliance Officer and Anti-Money Laundering Officer | | Since 2016 for Natixis ETF Trust and since 2017 for Natixis ETF Trust II Since 2020 | | Executive Vice President, General Counsel, Secretary and Clerk, Natixis Distribution Corporation, Natixis Advisors, L.P. and Natixis Distribution, L.P.; formerly, Chief Compliance Officer for Mutual Funds, Senior Vice President, Deputy General Counsel, Assistant Secretary and Assistant Clerk, Natixis Distribution Corporation, Natixis Advisors, L.P. and Natixis Distribution, L.P. |
| | | |
Michael C. Kardok (1959) | | Treasurer, Principal Financial and Accounting Officer | | Since 2011 for Natixis ETF Trust and since 2017 for Natixis ETF Trust II | | Senior Vice President, Natixis Advisors, L.P. and Natixis Distribution, L.P. |
| 1 | Each officer of the Trusts serves for an indefinite term in accordance with the Trusts’ current by-laws until the date his or her successor is elected and qualified, or until he or she sooner dies, retires, is removed or becomes disqualified. |
| 2 | Each person listed above, except as noted, holds the same position(s) with the Fund Complex. Previous positions during the past five years with Natixis Distribution, L.P., Natixis Advisors, L.P. or Loomis, Sayles & Company, L.P. are omitted, if not materially different from an officer’s current position with such entity. |
| 58
Item 2. Code of Ethics.
The Registrant has adopted a code of ethics that applies to the Registrant’s principal executive officer, principal financial officer and persons performing similar functions. There have been no amendments or waivers of the Registrant’s code of ethics during the period.
Item 3. Audit Committee Financial Expert.
The Board of Trustees of the Registrant has established an audit committee. Mr. Edmond J. English, Mr. Martin T. Meehan, Mr. Peter J. Smail and Ms. Cynthia L. Walker are members of the audit committee and have been designated as “audit committee financial experts” by the Board of Trustees. Each of these individuals is also an Independent Trustee of the Registrant.
Item 4. Principal Accountant Fees and Services.
Fees billed by the Principal Accountant for services rendered to the Registrant.
The table below sets forth fees billed by the principal accountant, PricewaterhouseCoopers LLP, for the past two fiscal years for professional services rendered in connection with a) the audit of the Registrant’s annual financial statements and services provided in connection with regulatory filings; b) audit-related services (including services that are reasonably related to the performance of the audit of the Registrant’s financial statements but not reported under “Audit Fees”); c) tax compliance, tax advice and tax planning and d) all other fees billed for professional services rendered by the principal accountant to the Registrant, other than the services provided as reported as a part of (a) through (c) of this Item.
| | | | | | | | | | | | | | | | | | | | | | | | | | | | | | | | |
| | | Audit fees | | | Audit-related fees1 | | | Tax fees2 | | | All other fees | |
| | | 1/1/19-12/31/19 | | | 1/1/20-12/31/20 | | | 1/1/19-12/31/19 | | | 1/1/20-12/31/20 | | | 1/1/19-12/31/19 | | | 1/1/20-12/31/20 | | | 1/1/19-12/31/19 | | | 1/1/20-12/31/20 | |
Natixis ETF Trust | | $ | 67,779 | | | $ | 35,255 | | | $ | 7 | | | $ | 10 | | | $ | 16,250 | | | $ | 16,250 | | | $ | — | | | $ | — | |
| 1. | Audit-related fees consist of: |
2019 & 2020 – performance of agreed-upon procedures related to the Registrant’s deferred compensation.
2019 & 2020 – review of Registrant’s tax returns
Aggregate fees billed to the Registrant for non-audit services during 2019 and 2020 were $16,257 and $16,260 respectively.
Fees billed by the Principal Accountant for services rendered to the Adviser and Control Affiliates.
The following table sets forth the fees billed by the Registrant’s principal accountant for non-audit services rendered to Natixis Advisors, L.P.(“Natixis, Advisors”) and entities controlling, controlled by or under common control with Natixis Advisors. (“Control Affiliates”) that provide ongoing services to the Registrant, for engagements that related directly to the operations and financial reporting of the Registrant for the last two fiscal years.
| | | | | | | | | | | | | | | | | | | | | | | | |
| | | Audit-related fees | | | Tax fees | | | All other fees | |
| | | 1/1/19-12/31/19 | | | 1/1/20-12/31/20 | | | 1/1/19-12/31/19 | | | 1/1/20-12/31/20 | | | 1/1/19-12/31/19 | | | 1/1/20-12/31/20 | |
Control Affiliates | | $ | — | | | $ | — | | | $ | — | | | $ | — | | | $ | — | | | $ | — | |
The following table sets forth the aggregate fees billed by the Registrant’s principal accountant for non-audit services rendered to Natixis Advisors, and Control Affiliates that provide ongoing services to the Registrant, for the last two fiscal years, including the fees disclosed in the table above.
| | | | | | | | |
| | | Aggregate Non-Audit Fees | |
| | | 1/1/19-12/31/19 | | | 1/1/20-12/31/20 | |
Control Affiliates | | $ | 27,252 | | | $ | 1,646 | |
None of the services described above were approved pursuant to (c)(7)(i)(C) of Regulation S-X.
Audit Committee Pre Approval Policies.
Annually, the Registrant’s Audit Committee reviews the audit, audit-related, tax and other non-audit services together with the projected fees, for services proposed to be rendered to the Trust and/or other entities for which pre-approval is required during the upcoming year. Any subsequent revisions to already pre-approved services or fees (including fee increases) and requests for pre-approval of new services would be presented for consideration quarterly as needed.
If, in the opinion of management, a proposed engagement by the Registrant’s independent accountants needs to commence before the next regularly scheduled Audit Committee meeting, any member of the Audit Committee who is an independent Board member is authorized to pre-approve the engagement, but only for engagements to provide audit, audit related and tax services. This approval is subject to review of the full Audit Committee at its next quarterly meeting. All other engagements require the approval of all the members of the Audit Committee.
Item 5. Audit Committee of Listed Registrants.
This registrant has a separately designated standing audit committee comprised of independent Trustees. Mr. Edmond J. English, Mr. Martin T. Meehan, Mr. Peter J. Smail and Ms. Cynthia L. Walker are members of the audit committee.
Item 6. Schedule of Investments.
Included as part of the Report to Shareholders filed as Item 1 herewith.
Item 7. Disclosure of Proxy Voting Policies and Procedures for Closed-End Management Investment Companies.
Not applicable.
Item 8. Portfolio Managers of Closed-End Management Investment Companies.
Not applicable.
Item 9. Purchases of Equity Securities by Closed-End Management Investment Companies and Affiliated Purchasers.
Not applicable.
Item 10. Submission of Matters to a Vote of Securities Holders.
There were no material changes to the procedures by which shareholders may recommend nominees to the Registrant’s Board of Trustees.
Item 11. Controls and Procedures.
The Registrant’s principal executive officer and principal financial officer have concluded that the Registrant’s disclosure controls and procedures are sufficient to ensure that information required to be disclosed by the Registrant in this Form N-CSR was recorded, processed, summarized and reported within the time periods specified in the Securities and Exchange Commission’s rules and forms, based upon such officers’ evaluation of these controls and procedures as of a date within 90 days of the filing date of the report.
There were no changes in the Registrant’s internal control over financial reporting that occurred during the Registrant’s last fiscal quarter of the period covered by the report that has materially affected, or is reasonably likely to materially affect, the Registrant’s internal control over financial reporting.
Item 12. Disclosure of Securities Lending Activities for Closed-End Management Investment Companies.
Not applicable.
Item 13. Exhibits.
SIGNATURES
Pursuant to the requirements of the Securities Exchange Act of 1934 and the Investment Company Act of 1940, the Registrant has duly caused this report to be signed on its behalf by the undersigned, thereunto duly authorized.
| | |
| Natixis ETF Trust |
| |
| By: | | /s/ David L. Giunta |
| |
| Name: | | David L. Giunta |
| Title: | | President and Chief Executive Officer |
| Date: | | February 22, 2021 |
Pursuant to the requirements of the Securities Exchange Act of 1934 and the Investment Company Act of 1940, this report has been signed by the following persons on behalf of the Registrant and in the capacities and on the dates indicated.
| | |
| By: | | /s/ David L. Giunta |
| |
| Name: | | David L. Giunta |
| Title: | | President and Chief Executive Officer |
| Date: | | February 22, 2021 |
| |
| By: | | /s/ Michael C. Kardok |
| |
| Name: | | Michael C. Kardok |
| Title: | | Treasurer and Principal Financial and Accounting Officer |
|
| Date: | | February 22, 2021 |