UNITED STATES
SECURITIES AND EXCHANGE COMMISSION
Washington, D.C. 20549
FORMN-CSR
CERTIFIED SHAREHOLDER REPORT OF REGISTERED
MANAGEMENT INVESTMENT COMPANIES
Investment Company Act file number:811-23146
Natixis ETF Trust
(Exact name of Registrant as specified in charter)
888 Boylston Street, Suite 800 Boston, Massachusetts 02199-8197
(Address of principal executive offices) (Zip code)
Russell L. Kane, Esq.
Natixis Distribution, L.P.
888 Boylston Street, Suite 800
Boston, Massachusetts 02199-8197
(Name and address of agent for service)
Registrant’s telephone number, including area code: (617)449-2822
Date of fiscal year end: December 31
Date of reporting period: December 31, 2018
Item 1. Reports to Stockholders.
The Registrant’s annual report transmitted to shareholders pursuant to Rule30e-1 under the Investment Company Act of 1940 is as follows:


Annual Report
December 31, 2018
Natixis Loomis Sayles Short Duration Income ETF
Natixis Seeyond International Minimum Volatility ETF
Table of Contents
IMPORTANT NOTICE TO SHAREHOLDERS
Beginning on January 1, 2021, as permitted by regulations adopted by the Securities and Exchange Commission, paper copies of the shareholder reports like this one will no longer be sent by mail, unless you specifically request paper copies of the reports from the Fund or from your financial intermediary, such as a broker-dealer or bank. Instead, the reports will be made available on the Funds’ website, and you will be notified by mail each time a report is posted and provided with a website link to access the report. If you wish to continue receiving paper copies of your shareholder reports after January 1, 2021, you can inform the Fund at any time by calling1-800-458-7452. If you hold your account with a financial intermediary and you wish to continue receiving paper copies after January 1, 2021, you should call your financial intermediary directly. Paper copies are provided free of charge, and your election to receive reports in paper will apply to all funds held with the Natixis Funds complex. If you have already elected to receive shareholder reports electronically, you will not be affected by this change and you need not take any action. You currently may elect to receive shareholder reports and other communications from the Fund or your financial intermediary electronically atwww.icsdelivery.com/natixisfunds.
NATIXIS LOOMIS SAYLES SHORT DURATION INCOME ETF
| | |
| |
| Managers | | NYSE Arca: LSST |
| |
| Christopher T. Harms | | |
| |
| Clifton V. Rowe, CFA® | | |
| |
| Kurt L. Wagner, CFA® | | |
| |
| Loomis, Sayles & Company, L.P. | | |
Investment Goal
The Fund’s investment objective is current income consistent with preservation of capital.
Market Conditions
For much of 2018, financial markets rode a wave of optimism stemming from robust economic growth and rising corporate earnings. However, market sentiment turned sharply lower in the fourth quarter. Concerns about US trade policy and weaker economic conditions overseas sparked a downturn in global equities and other asset classes seen as having higher risk. The Federal Reserve (Fed) met expectations and undertook a steady pace of rate increases, including raising rates by a quarter-point at its December meeting. However, signs of slowing growth in the fourth quarter and commentary from Fed officials fueled market expectations that the cycle of rate increases was nearing its conclusion.
Volatility roared back with a vengeance at the end of 2018. After 15 months of relatively calm markets, a combination of uncertainty around interest rates, a stronger US dollar, persistent trade tensions and European politics dampened risk sentiment in global markets.
US Treasuries performed relatively well and finished as one of the few major asset categories to post a positive return for the year. Government bonds were aided by weaker economic data and a “flight to quality” that benefited lower-risk investments.
Corporate credit spreads (the difference in yield between corporate bonds and Treasury securities of similar maturity) widened despite healthy profits and positive cyclical dynamics. Rising trade tensions, emerging market volatility and political instability in the euro zone periphery lowered investor confidence and likely contributed to reduced global demand for credit.
Performance Results
For the 12 months ended December 31, 2018 the Natixis Loomis Sayles Short Duration Income ETF returned 0.97%. The Fund underperformed its benchmark, the Bloomberg Barclays 1-3 Year U.S. Government/Credit Bond Index, which returned 1.60%.
Explanation of Fund Performance
The largest detractor during the period was the Fund’s tilt toward risk and away from risk-free assets such as US Treasuries. Security selection within investment grade credit, specifically within industrials and financials, had the largest negative impact on the Fund’s performance. In particular, bond choices within the banking, consumer (cyclical andnon-cyclical) and insurance sectors weighed on return.
1 |
An allocation to high yield corporate credit also detracted from performance relative to the benchmark, with the largest negative impact from selections within finance company, communication and utility issuers.
Security selection within asset-backed securities (ABS) added to the Fund’s performance relative to the benchmark, with positive contributions led by issues backed by credit card debt and car loans. Issuer selection within Agency collateralized mortgage obligations (CMOs) also proved beneficial to the Fund’s performance for the period.
Outlook
We believe that the Fed will tighten monetary conditions in a gradual and measured way as aggregate demand remains healthy, with another four hikes likely remaining through 2020.
Corporate industries continue to exhibit profiles consistent with late expansion of the credit cycle with slowing margin growth, increased mergers and acquisitions and rising leverage. Our view is that the cycle will continue to evolve slowly. Corporate credit remains in demand due to a need for yield, positive fundamentals like healthy corporate earnings, and technical factors such as lower bond supply. We continue to favor corporate credit over risk-free assets. We believe the primary risks to the credit markets include the pace of global growth, the timing of Fed tightening, concerns about a protracted trade war and a significant uptick in inflation.
We remain underweight government bonds, given low yields, and continue to favor sectors offering higher yield potential than Treasuries.
Hypothetical Growth of $10,000 Investment3
December 27, 2017 (inception) through December 31, 2018
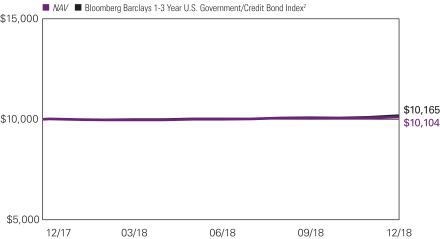
See notes to chart on page 3.
| 2
NATIXIS LOOMIS SAYLES SHORT DURATION INCOME ETF
Average Annual Total Returns — December 31, 20183
| | | | | | | | | | | | | | | | |
| | | | |
| | | | | | | | | Expense Ratio4 | |
| | | 1 Year | | | Life of Fund | | | Gross | | | Net | |
| NAV1 | | | 0.97 | % | | | 1.04 | % | | | 0.87 | % | | | 0.38 | % |
| Market1 | | | 0.96 | | | | 1.03 | | | | | | | | | |
| | | | | |
| Comparative Performance | | | | | | | | | | | | | | | | |
| Bloomberg Barclays1-3 Year U.S. Government/Credit Bond Index2 | | | 1.60 | | | | 1.62 | | | | | | | | | |
Performance data shown represents past performance and is no guarantee of, and not necessarily indicative of, future results. Total return and value will vary, and you may have a gain or loss when shares are sold. Current performance may be lower or higher than quoted. For most recentmonth-end performance, visit im.natixis.com.You may not invest directly in an index. Performance for periods less than one year is cumulative, not annualized. Returns reflect changes in share price and reinvestment of dividends and capital gains, if any. The table(s) do not reflect taxes shareholders might owe on any fund distributions or when they redeem or sell their shares.
| 1 | The NAV return is based on the NAV of the Fund, and the market return is based on the market price per share of the Fund, which is determined by using the midpoint between the highest bid and the lowest offer on the primary stock exchange on which the shares of the Fund are listed for trading, as of the time that the Fund’s NAV is calculated. Since shares of the Fund did not trade on the secondary market until December 28, 2017, NAV is used as a proxy for the market price prior to that date. Market and NAV returns assume that dividends and capital gain distributions have been reinvested in the Fund at market price and NAV, respectively. |
| 2 | The Bloomberg Barclays 1-3 Year U.S. Government/Credit Bond Index is an unmanaged index which is a component of the US Government/Credit Bond Index, which includes Treasury and agency securities (US Government Bond Index) and publicly issued US corporate and foreign debentures and secured notes (US Credit Bond Index). The bonds in the index are investment grade with a maturity between one and three years. |
| 3 | Fund performance has been increased by fee waivers and/or expense reimbursements, if any, without which performance would have been lower. |
| 4 | Expense ratios are as shown in the Fund’s prospectus in effect as of the date of this report. The expense ratios for the current reporting period can be found in the Financial Highlights section of this report under Ratios to Average Net Assets. Net expenses reflect contractual expense limitations set to expire on 4/30/21. When a Fund’s expenses are below the limitation, gross and net expense ratios will be the same. See Note 6 of the Notes to Financial Statements for more information about the Fund’s expense limitations. |
3 |
NATIXIS SEEYOND INTERNATIONAL MINIMUM VOLATILITY ETF
| | |
| |
| Managers | | NYSE Arca: MVIN |
| |
| Frédéric Babu | | |
| |
| Alexander J. Nary | | |
| |
| Nicolas Just, CFA® | | |
| |
| Juan-Sebastian Caicedo, CFA® | | |
|
Ostrum Asset Management U.S., LLC
(“Ostrum US” formerly, Natixis Asset Management U.S., LLC) |
Investment Goal
The Fund seeks long-term capital appreciation with less volatility than typically experienced by international equity markets.
Market Conditions
Coming off a strong 2017, developed markets outside the US were basking in the glory of over 25% in added value since the start of the year, supported by ever-mounting optimism from global investors and strong earnings growth dynamics. After 25 days and over 6% in gains across developed market equities, the party was over and volatility was back in the market. The decline was likely the result of a confluence of factors including rising interest rates, trade tensions, high valuations and pressure on corporate margins. The result was a year with developed markets erasing gains made in 2017. Fortunately, increased dispersion in returns (at stock, sector and country levels) has been present in the equity market over the period, which can be a source of opportunity for active managers.
Performance Results
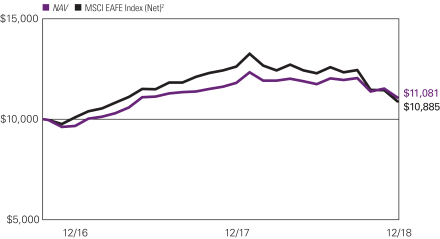
For the 12 months ended December 31, 2018, the Natixis Seeyond International Minimum Volatility ETF (MVIN) returned-6.17%. The Fund held up better than its benchmark, the MSCI EAFE Index (Net), which returned-13.79%.
Performance Explanation
As a strategy based on risk, fundamental and macro views do not play a role in how the Fund is managed and implemented. To the contrary, we systematically focus our investments on stocks that we believe display a lower level of risk, as measured by volatility and correlations. As we expected, our rather conservative approach paid off over the period, in an environment of increased volatility. The Fund was able to reduce the drawdown by more than half, reduce volatility by more than 25%, and display a beta1 of 0.63 in 2018 when compared to its benchmark, in line with our dual objective to outperform over the longer term while consistently reducing volatility.
As readers of our last annual report might recall, the Fund seized the opportunity in 2017 to reach across the aisle to low volatility stocks in sectors that were traditionally more volatile, enabling it to keep up with the rising market while further reducing volatility. For the first half of 2018, the Fund has maintained this higher than usual exposure to more cyclical sectors, which was built in the aftermath of the 2016 US election. This exposure was then notably reduced during the summer, by trimming consumer discretionary and
| 1 | Beta measures the volatility of a security or a portfolio in comparison to the market as a whole. |
| 4
NATIXIS SEEYOND INTERNATIONAL MINIMUM VOLATILITY ETF
industrials, and was further reduced in November. In terms of geographic allocation, combined local dynamics and currency moves continue to highlight core Europe and the UK as higher risk regions while Asia appears more stable in comparison. As a result, country allocation remained relatively stable as we continue to see more low volatility opportunities in Asia generally.
That being said, in spite of strong sector and country dispersion, performance has mostly come from stock selection as opposed to country or sector selection over the period. The good performance of Coca-Cola European Partners (European beverage), Thales (French defense) or Japan Real Estate Investment (Japanese real estate) are to be noted. On the negative side, while no particular stock stands out, Danske Bank (Danish bank), Carnival PLC (UK cruise line) and Osram (German lights manufacturer) were the Fund’s three worst performers.
Thanks to our active management, and the ability to find low volatility stocks within a diversified range of sectors and countries, the Fund was able to participate in the market rally in 2017, while weathering the drawdown and responding well to rising interest rates in 2018.
Outlook
Our core scenario continues to point towards low growth and higher volatility. The US Federal Reserve continues to anticipate a 3.0% long-term level for interest rates in the US, not pointing towards high growth or high inflation. Some signs of peaking growth are emerging in international trade and European growth figures, but current growth readings and expectations remain positive, and consensus points towards a low likelihood of recession in the short term. That being said, we believe interest rates, trade tension, high valuations and pressure on corporate margins will continue to push investors to look beyond the immediate solid earnings.
As a consequence, associated volatility and uncertainty will likely continue to create anxiety in the marketplace. We believe investors should avoid putting themselves at the mercy of emotionally driven investment decisions, which can adversely impact their long-term financial plans. We believe now is the time to complement portfolios with strategies specifically designed to help investors become more independent ofday-to-day gyrations in equity markets.
5 |
Hypothetical Growth of $10,000 Investment3
October 25, 2016 (inception) through December 31, 2018
Top Ten Holdings as of December 31, 2018
| | | | | | |
| | | Security name | | % of
net assets | |
| 1 | | Nestle S.A., (Registered) | | | 2.89 | % |
| 2 | | Kerry Group PLC, Series A | | | 2.24 | |
| 3 | | Coca-Cola European Partners PLC | | | 2.19 | |
| 4 | | HKT Trust & HKT Ltd. | | | 2.12 | |
| 5 | | Direct Line Insurance Group PLC | | | 1.99 | |
| 6 | | Japan Post Holdings Co. Ltd. | | | 1.99 | |
| 7 | | NN Group NV | | | 1.83 | |
| 8 | | Bank LeumiLe-Israel BM | | | 1.76 | |
| 9 | | Zurich Insurance Group AG | | | 1.73 | |
| 10 | | Woolworths Ltd. | | | 1.73 | |
The portfolio is actively managed and holdings are subject to change. There is no guarantee the Fund continues to invest in the securities referenced. The holdings listed exclude any temporary cash investments.
See notes to chart on pg. 7
| 6
NATIXIS SEEYOND INTERNATIONAL MINIMUM VOLATILITY ETF
Average Annual Total Returns — December 31, 20183
| | | | | | | | | | | | | | | | |
| | | | |
| | | | | | | | | Expense Ratios4 | |
| | | 1 Year | | | Life of Fund | | | Gross | | | Net | |
| NAV1 | | | -6.17 | % | | | 4.82 | % | | | 1.76 | % | | | 0.55 | % |
| Market1 | | | -6.50 | | | | 4.79 | | | | | | | | | |
| | | | | |
| Comparative Performance | | | | | | | | | | | | | | | | |
| MSCI EAFE Index (Net)2 | | | -13.79 | | | | 4.01 | | | | | | | | | |
Performance data shown represents past performance and is no guarantee of, and not necessarily indicative of, future results. Total return and value will vary, and you may have a gain or loss when shares are sold. Current performance may be lower or higher than quoted. For most recent month-end performance, visit im.natixis.com. You may not invest directly in an index. Performance for periods less than one year is cumulative, not annualized. Returns reflect changes in share price and reinvestment of dividends and capital gains, if any. The table(s) do not reflect taxes shareholders might owe on any fund distributions or when they redeem or sell their shares.
| 1 | The NAV return is based on the NAV of the Fund, and the market return is based on the market price per share of the Fund, which is determined by using the midpoint between the highest bid and the lowest offer on the primary stock exchange on which the shares of the Fund are listed for trading, as of the time that the Fund’s NAV is calculated. Since shares of the Fund did not trade on the secondary market until October 27, 2016, NAV is used as a proxy for the market price prior to that date. Market and NAV returns assume that dividends and capital gain distributions have been reinvested in the Fund at market price and NAV, respectively. |
| 2 | The MSCI EAFE Index (Net) is a free float-adjusted market capitalization index designed to measure large and mid-cap equity performance in developed markets, excluding the U.S. and Canada. The Index includes countries in Europe, Australasia, and the Far East. |
| 3 | Fund performance has been increased by fee waivers and/or expense reimbursements, if any, without which performance would have been lower. |
| 4 | Expense ratios are as shown in the Fund’s prospectus in effect as of the date of this report. The expense ratios for the current reporting period can be found in the Financial Highlights section of this report under Ratios to Average Net Assets. Net expenses reflect contractual expense limitations set to expire on 4/30/21. When a Fund’s expenses are below the limitation, gross and net expense ratios will be the same. See Note 6 of the Notes to Financial Statements for more information about the Fund’s expense limitations. |
7 |
ADDITIONAL INFORMATION
The views expressed in this report reflect those of the portfolio managers as of the dates indicated. The managers’ views are subject to change at any time without notice based on changes in market or other conditions. References to specific securities or industries should not be regarded as investment advice. Because the Fund is actively managed, there is no assurance that they will continue to invest in the securities or industries mentioned.
All investing involves risk, including the risk of loss. There is no assurance that any investment will meet its performance objectives or that losses will be avoided.
ADDITIONAL INDEX INFORMATION
This document may contain references to third party copyrights, indexes, and trademarks, each of which is the property of its respective owner. Such owner is not affiliated with Natixis Investment Managers or any of its related or affiliated companies (collectively “Natixis Affiliates”) and does not sponsor, endorse or participate in the provision of any Natixis Affiliates services, funds or other financial products.
The index information contained herein is derived from third parties and is provided on an “as is” basis. The user of this information assumes the entire risk of use of this information. Each of the third party entities involved in compiling, computing or creating index information disclaims all warranties (including, without limitation, any warranties of originality, accuracy, completeness, timeliness, non-infringement, merchantability and fitness for a particular purpose) with respect to such information.
PROXY VOTING INFORMATION
A description of the Funds’ proxy voting policies and procedures is available without charge, upon request, by calling 800-458-7452; through the Funds’ website at im.natixis.com; and on the Securities and Exchange Commission’s (SEC) website at www.sec.gov. Information regarding how the Funds voted proxies relating to portfolio securities during the most recent 12-month period ended June 30 is available on Natixis Funds’ website and the SEC’s website.
QUARTERLY PORTFOLIO SCHEDULES
The Funds will file a complete schedule of portfolio holdings with the SEC for the first and third quarters of each fiscal year on FormN-Q. The Funds’ Forms N-Q are available on the SEC’s website at www.sec.gov and may be reviewed and copied at the SEC’s Public Reference Room in Washington, DC. Information on the operation of the Public Reference Room may be obtained by calling 800-SEC-0330.
| 8
UNDERSTANDING FUND EXPENSES
As a shareholder, you incur two types of costs: (1) transaction costs, which may include creation and redemption fees and brokerage charges, and (2) ongoing costs, including management fees and other fund expenses. These ongoing costs are described in more detail in the Fund’s prospectus. The following examples are intended to help you understand the ongoing costs of investing in the Fund and help you compare these with the ongoing costs of investing in other funds.
The first line in the table shows the actual account values and actual Fund expenses you would have paid on a $1,000 investment in the Fund from July 1, 2018 through December 31, 2018. To estimate the expenses you paid over the period, simply divide your account value by $1,000 (for example $8,600 account value divided by $1,000 = 8.60) and multiply the result by the number in the Expenses Paid During Period column as shown below for your class.
The second line in the table provides information about hypothetical account values and hypothetical expenses based on the Fund’s actual expense ratios and an assumed rate of return of 5% per year before expenses, which is not the Fund’s actual return. The hypothetical account values and expenses may not be used to estimate the actual ending account balance or expenses you paid on your investment for the period. You may use this information to compare the ongoing costs of investing in the Fund and other funds. To do so, compare this 5% hypothetical example with the 5% hypothetical examples that appear in the shareholder reports of the other funds.
Please note that the expenses shown reflect ongoing costs only, and do not include any transaction costs, such as brokerage commissions on purchases and sales of Fund shares. Therefore, the second line in the table is useful in comparing ongoing costs only, and will not help you determine the relative costs of owning different funds. If transaction costs were included, total costs would be higher.
| | | | | | | | | | | | |
NATIXIS LOOMIS SAYLES SHORT
DURATION INCOME ETF | | BEGINNING
ACCOUNT VALUE
7/1/2018 | | | ENDING
ACCOUNT VALUE
12/31/2018 | | | EXPENSES PAID
DURING PERIOD*
7/1/2018 – 12/31/2018 | |
| Actual | | | $1,000.00 | | | | $1,011.40 | | | | $1.93 | |
| Hypothetical (5% return before expenses) | | | $1,000.00 | | | | $1,023.29 | | | | $1.94 | |
The chart above represents historical performance of a hypothetical investment of $1,000 in the fund for the most recent six-month period. Past performance does not guarantee futures results. This chart does not reflect the deduction of taxes that a shareholder would pay on fund distributions or the redemption of fund shares.
| * | Expenses are equal to the Fund’s annualized expense ratio (after waiver/reimbursement) of 0.38%, multiplied by the average account value over the period, multiplied by the number of days in the most recent fiscal half-year (184), divided by 365 (to reflect the half-year period). |
9 |
| | | | | | | | | | | | |
NATIXIS SEEYOND INTERNATIONAL
MINIMUM VOLATILITY ETF | | BEGINNING
ACCOUNT VALUE
7/1/2018 | | | ENDING
ACCOUNT VALUE
12/31/2018 | | | EXPENSES PAID
DURING PERIOD*
7/1/2018 – 12/31/2018 | |
| Actual | | | $1,000.00 | | | | $943.60 | | | | $2.69 | |
| Hypothetical (5% return before expenses) | | | $1,000.00 | | | | $1,022.43 | | | | $2.80 | |
The chart above represents historical performance of a hypothetical investment of $1,000 in the fund for the most recent six-month period. Past performance does not guarantee futures results. This chart does not reflect the deduction of taxes that a shareholder would pay on fund distributions or the redemption of fund shares.
| * | Expenses are equal to the Fund’s annualized expense ratio (after waiver/reimbursement) of 0.55%, multiplied by the average account value over the period, multiplied by the number of days in the most recent fiscal half-year (184), divided by 365 (to reflect the half-year period). |
| 10
Portfolio of Investments – as of December 31, 2018
Natixis Loomis Sayles Short Duration Income ETF
| | | | | | | | |
Principal
Amount | | | Description | | Value (†) | |
| | Bonds and Notes — 98.4% of Net Assets | |
| | | | ABS Car Loan — 11.7% | |
| $ | 8,942 | | | Ally Auto Receivables Trust, Series2017-3, Class A2,
1.530%, 3/16/2020 | | $ | 8,935 | |
| | 160,000 | | | Ally Master Owner Trust, Series2018-1, Class A2,
2.700%, 1/17/2023(a) | | | 158,808 | |
| | 75,000 | | | AmeriCredit Automobile Receivables Trust, Series2015-3, Class C,
2.730%, 3/08/2021(a) | | | 74,805 | |
| | 74,000 | | | AmeriCredit Automobile Receivables Trust, Series2016-3, Class B,
1.800%, 10/08/2021(a) | | | 73,172 | |
| | 115,000 | | | AmeriCredit Automobile Receivables Trust, Series2018-3, Class B,
3.580%, 10/18/2024(a) | | | 116,488 | |
| | 100,477 | | | Avid Automobile Receivables Trust, Series2018-1, Class A,
2.840%, 8/15/2023, 144A(a) | | | 99,790 | |
| | 100,000 | | | Avis Budget Rental Car Funding AESOP LLC, Series2017-2A, Class A,
2.970%, 3/20/2024, 144A(a) | | | 97,926 | |
| | 55,000 | | | CarMax Auto Owner Trust, Series2018-1, Class A3, 2.480%, 11/15/2022(a) | | | 54,587 | |
| | 120,000 | | | CarMax Auto Owner Trust, Series2018-2, Class A4, 3.160%, 7/17/2023(a) | | | 120,730 | |
| | 183,398 | | | CPS Auto Receivables Trust, Series2014-D, Class C, 4.350%, 11/16/2020, 144A(a) | | | 184,090 | |
| | 100,000 | | | CPS Auto Receivables Trust, Series2018-D, Class B, 3.610%, 11/15/2022, 144A(a) | | | 100,566 | |
| | 140,000 | | | Drive Auto Receivables Trust, Series2018-1, Class B, 2.880%, 2/15/2022(a) | | | 139,823 | |
| | 130,000 | | | Drive Auto Receivables Trust, Series2018-5, Class B, 3.680%, 7/15/2023(a) | | | 130,903 | |
| | 100,000 | | | DT Auto Owner Trust, Series2017-4A, Class B, 2.440%, 1/15/2021, 144A(a) | | | 99,800 | |
| | 65,000 | | | DT Auto Owner Trust, Series2018-1A, Class B, 3.040%, 1/18/2022, 144A(a) | | | 64,835 | |
| | 20,000 | | | DT Auto Owner Trust, Series2018-2A, Class C, 3.670%, 3/15/2024, 144A | | | 20,095 | |
| | 40,000 | | | Exeter Automobile Receivables Trust, Series2018-1A, Class B,
2.750%, 4/15/2022, 144A | | | 39,808 | |
| | 60,000 | | | Exeter Automobile Receivables Trust, Series2018-2A, Class B,
3.270%, 5/16/2022, 144A(a) | | | 59,967 | |
| | 93,000 | | | First Investors Auto Owner Trust, Series2017-1A, Class A2,
2.200%, 3/15/2022, 144A(a) | | | 92,473 | |
| | 72,467 | | | First Investors Auto Owner Trust, Series2018-2A, Class A1, 3.230%, 12/15/2022, 144A | | | 72,548 | |
| | 105,000 | | | Flagship Credit Auto Trust, Series2016-3, Class B, 2.430%, 6/15/2021, 144A(a) | | | 104,601 | |
| | 65,000 | | | Flagship Credit Auto Trust, Series2018-1, Class B, 3.130%, 1/17/2023, 144A(a) | | | 64,906 | |
| | 35,000 | | | Flagship Credit Auto Trust, Series2018-4, Class B, 3.880%, 10/16/2023, 144A | | | 35,384 | |
| | 100,000 | | | Foursight Capital Automobile Receivables Trust, Series2018-2, Class A3,
3.640%, 5/15/2023, 144A(a) | | | 100,742 | |
| | 99,026 | | | GLS Auto Receivables Trust, Series2018-1A, Class A, 2.820%, 7/15/2022, 144A(a) | | | 98,669 | |
| | 35,000 | | | GLS Auto Receivables Trust, Series2018-3A, Class B, 3.780%, 8/15/2023, 144A | | | 35,155 | |
| | 110,000 | | | GM Financial Consumer Automobile Receivables Trust, Series2018-2, Class A3,
2.810%, 12/16/2022(a) | | | 109,571 | |
| | 80,000 | | | Hyundai Auto Lease Securitization Trust, Series2018-A, Class A3,
2.810%, 4/15/2021, 144A(a) | | | 79,717 | |
| | 2,673 | | | Hyundai Auto Receivables Trust, Series2015-C, Class A3, 1.460%, 2/18/2020 | | | 2,671 | |
| | 119,000 | | | NextGear Floorplan Master Owner Trust, Series2016-1A, Class A2,
2.740%, 4/15/2021, 144A(a) | | | 118,862 | |
| | 40,000 | | | Santander Drive Auto Receivables Trust, Series2018-1, Class B, 2.630%, 7/15/2022 | | | 39,762 | |
See accompanying notes to financial statements.
11 |
Portfolio of Investments – as of December 31, 2018
Natixis Loomis Sayles Short Duration Income ETF – (continued)
| | | | | | | | |
Principal
Amount | | | Description | | Value (†) | |
| | | | ABS Car Loan — continued | |
| $ | 30,000 | | | Santander Drive Auto Receivables Trust, Series2018-2, Class B, 3.030%, 9/15/2022 | | $ | 29,966 | |
| | 50,000 | | | Santander Drive Auto Receivables Trust, Series2018-5, Class C, 3.810%, 12/16/2024 | | | 50,346 | |
| | 22,338 | | | Toyota Auto Receivables Owner Trust, Series2016-A, Class A3, 1.250%, 3/16/2020(a) | | | 22,268 | |
| | 110,000 | | | United Auto Credit Securitization Trust, Series2018-1, Class B,
2.760%, 10/13/2020, 144A(a) | | | 109,668 | |
| | 20,000 | | | Westlake Automobile Receivables Trust, Series18-2A, Class B, 3.200%, 1/16/2024, 144A | | | 19,946 | |
| | 150,000 | | | Westlake Automobile Receivables Trust, Series2017-1A, Class C,
2.700%, 10/17/2022, 144A(a) | | | 149,245 | |
| | 30,000 | | | Westlake Automobile Receivables Trust, Series2018-3A, Class A2A,
2.980%, 1/18/2022, 144A | | | 29,985 | |
| | 110,000 | | | World Omni Auto Receivables Trust, Series2018-B, Class A3, 2.870%, 7/17/2023(a) | | | 109,756 | |
| | 60,000 | | | World Omni Automobile Lease Securitization Trust, Series2018-A, Class A3,
2.830%, 7/15/2021(a) | | | 59,805 | |
| | | | | | | | |
| | | | | | | 3,181,174 | |
| | | | | | | | |
| | | | ABS Credit Card — 2.0% | |
| | 265,000 | | | Citibank Credit Card Issuance Trust, Series2018-A2, Class A2,
1-month LIBOR + 0.330%, 2.800%, 1/20/2025(a)(b) | | | 263,455 | |
| | 100,000 | | | World Financial Network Credit Card Master Trust, Series2016-A, Class A,
2.030%, 4/15/2025(a) | | | 97,387 | |
| | 185,000 | | | World Financial Network Credit Card Master Trust, Series2018-A, Class A,
3.070%, 12/16/2024(a) | | | 184,466 | |
| | | | | | | | |
| | | | | | | 545,308 | |
| | | | | | | | |
| | | | ABS Other — 1.9% | |
| | 30,000 | | | Navistar Financial Dealer Note Master Owner Trust II, Series2018-1, Class A,
1-month LIBOR + 0.630%, 3.136%, 9/25/2023, 144A(b) | | | 29,989 | |
| | 100,000 | | | OneMain Financial Issuance Trust, Series2015-3A, Class A,
3.630%, 11/20/2028, 144A(a) | | | 99,845 | |
| | 100,000 | | | SCF Equipment Trust LLC, Series2018-1A, Class A2, 3.630%, 10/20/2024, 144A(a) | | | 100,204 | |
| | 100,000 | | | SoFi Consumer Loan Program Trust, Series2018-2, Class A2, 3.350%, 4/26/2027, 144A(a) | | | 99,860 | |
| | 175,936 | | | SoFi Consumer Loan Program Trust, Series2018-4, Class A, 3.540%, 11/26/2027, 144A(a) | | | 176,124 | |
| | | | | | | | |
| | | | | | | 506,022 | |
| | | | | | | | |
| | | | ABS Student Loan — 0.6% | |
| | 89,866 | | | Navient Private Education Refi Loan Trust2018-A, Series2018-A, Class A1,
2.530%, 2/18/2042, 144A(a) | | | 89,214 | |
| | 78,554 | | | SoFi Professional Loan Program LLC, Series2015-D, Class A2,
2.720%, 10/27/2036, 144A(a) | | | 77,248 | |
| | | | | | | | |
| | | | | | | 166,462 | |
| | | | | | | | |
| | | | Aerospace & Defense — 0.9% | |
| | 110,000 | | | General Dynamics Corp., 2.875%, 5/11/2020(a) | | | 110,076 | |
| | 60,000 | | | General Dynamics Corp., 3.000%, 5/11/2021(a) | | | 60,048 | |
See accompanying notes to financial statements.
| 12
Portfolio of Investments – as of December 31, 2018
Natixis Loomis Sayles Short Duration Income ETF – (continued)
| | | | | | | | |
Principal
Amount | | | Description | | Value (†) | |
| | | | Aerospace & Defense — continued | |
| $ | 10,000 | | | Spirit AeroSystems, Inc., 4.600%, 6/15/2028 | | $ | 9,600 | |
| | 55,000 | | | Textron, Inc., 7.250%, 10/01/2019 | | | 56,674 | |
| | | | | | | | |
| | | | | | | 236,398 | |
| | | | | | | | |
| | | | Agency Commercial Mortgage-Backed Securities — 0.2% | |
| | 43,150 | | | FHLMC Multifamily Structured Pass Through Certificates, Series KI01, Class A,
1-month LIBOR + 0.160%, 2.507%, 9/25/2022(a)(b) | | | 43,036 | |
| | | | | | | | |
| | | | Airlines — 0.5% | |
| | 150,000 | | | Delta Air Lines, Inc., 2.600%, 12/04/2020 | | | 147,497 | |
| | | | | | | | |
| | | | Automotive — 5.8% | |
| | 150,000 | | | American Honda Finance Corp., MTN, 2.000%, 2/14/2020(a) | | | 148,251 | |
| | 90,000 | | | American Honda Finance Corp., MTN, 3.625%, 10/10/2023(a) | | | 90,638 | |
| | 60,000 | | | BMW U.S. Capital LLC, 1.850%, 9/15/2021, 144A(a) | | | 57,517 | |
| | 60,000 | | | BMW U.S. Capital LLC, 3.400%, 8/13/2021, 144A | | | 59,752 | |
| | 55,000 | | | BMW U.S. Capital LLC, 3.450%, 4/12/2023, 144A(a) | | | 54,600 | |
| | 150,000 | | | Daimler Finance North America LLC, 3.700%, 5/04/2023, 144A(a) | | | 149,312 | |
| | 200,000 | | | Ford Motor Credit Co. LLC, 2.979%, 8/03/2022 | | | 184,843 | |
| | 95,000 | | | General Motors Co.,3-month LIBOR + 0.900%, 3.667%, 9/10/2021(b) | | | 92,367 | |
| | 75,000 | | | General Motors Financial Co., Inc., 3.550%, 4/09/2021 | | | 73,967 | |
| | 25,000 | | | General Motors Financial Co., Inc., 4.150%, 6/19/2023 | | | 24,359 | |
| | 85,000 | | | Harley-Davidson Financial Services, Inc., 3.350%, 2/15/2023, 144A | | | 83,160 | |
| | 50,000 | | | Harley-Davidson Financial Services, Inc.,3-month LIBOR + 0.940%,
3.647%, 3/02/2021, 144A(b) | | | 49,999 | |
| | 120,000 | | | Hyundai Capital America, 2.750%, 9/18/2020, 144A | | | 118,150 | |
| | 110,000 | | | Nissan Motor Acceptance Corp., 2.150%, 7/13/2020, 144A | | | 107,361 | |
| | 105,000 | | | Nissan Motor Acceptance Corp., 3.150%, 3/15/2021, 144A | | | 103,515 | |
| | 110,000 | | | PACCAR Financial Corp., MTN, 2.800%, 3/01/2021(a) | | | 109,004 | |
| | 60,000 | | | Toyota Motor Credit Corp., GMTN, 2.200%, 1/10/2020 | | | 59,456 | |
| | | | | | | | |
| | | | | | | 1,566,251 | |
| | | | | | | | |
| | | | Banking — 16.6% | |
| | 135,000 | | | American Express Co., 3.700%, 11/05/2021 | | | 136,213 | |
| | 180,000 | | | American Express Credit Corp., MTN, 1.875%, 5/03/2019(a) | | | 179,336 | |
| | 210,000 | | | Bank of America Corp., (fixed rate to 1/20/2022, variable rate thereafter), MTN,
3.124%, 1/20/2023(a) | | | 206,466 | |
| | 110,000 | | | Bank of America Corp., (fixed rate to 5/17/2021, variable rate thereafter), MTN,
3.499%, 5/17/2022 | | | 110,017 | |
| | 70,000 | | | Bank of Montreal, Series D, 3.100%, 4/13/2021(a) | | | 69,965 | |
| | 175,000 | | | Bank of New York Mellon Corp. (The), (fixed rate to 5/16/2022, variable rate thereafter), MTN, 2.661%, 5/16/2023(a) | | | 170,120 | |
| | 150,000 | | | Bank of Nova Scotia (The), 1.650%, 6/14/2019(a) | | | 149,149 | |
| | 50,000 | | | Bank of Nova Scotia (The), 2.500%, 1/08/2021 | | | 49,371 | |
| | 135,000 | | | BB&T Corp., MTN, 3.750%, 12/06/2023 | | | 136,136 | |
| | 100,000 | | | BB&T Corp., MTN, 2.150%, 2/01/2021(a) | | | 97,896 | |
| | 20,000 | | | Canadian Imperial Bank of Commerce, 2.700%, 2/02/2021(a) | | | 19,798 | |
| | 105,000 | | | Capital One Financial Corp., 3.200%, 1/30/2023 | | | 102,178 | |
| | 75,000 | | | Capital One Financial Corp., 3.300%, 10/30/2024 | | | 70,931 | |
| | 230,000 | | | Citigroup, Inc., 2.450%, 1/10/2020(a) | | | 228,153 | |
See accompanying notes to financial statements.
13 |
Portfolio of Investments – as of December 31, 2018
Natixis Loomis Sayles Short Duration Income ETF – (continued)
| | | | | | | | |
Principal
Amount | | | Description | | Value (†) | |
| | | | Banking — continued | |
| $ | 90,000 | | | Citigroup, Inc., (fixed rate to 1/24/2022, variable rate thereafter), 3.142%, 1/24/2023 | | $ | 88,403 | |
| | 70,000 | | | Comerica, Inc., 3.700%, 7/31/2023 | | | 69,961 | |
| | 75,000 | | | Commonwealth Bank of Australia, 3.450%, 3/16/2023, 144A(a) | | | 74,931 | |
| | 40,000 | | | Deutsche Bank AG, 2.700%, 7/13/2020 | | | 38,905 | |
| | 110,000 | | | Deutsche Bank AG, 4.100%, 1/13/2026 | | | 100,867 | |
| | 45,000 | | | Goldman Sachs Bank USA, 3.200%, 6/05/2020 | | | 44,919 | |
| | 225,000 | | | Goldman Sachs Group, Inc. (The),3-month LIBOR + 1.200%, 3.988%, 9/15/2020(a)(b) | | | 226,055 | |
| | 245,000 | | | JPMorgan Chase & Co., 2.750%, 6/23/2020(a) | | | 243,596 | |
| | 25,000 | | | JPMorgan Chase & Co., 4.250%, 10/15/2020 | | | 25,450 | |
| | 85,000 | | | JPMorgan Chase & Co., (fixed rate to 6/18/2021, variable rate thereafter),
3.514%, 6/18/2022(a) | | | 85,192 | |
| | 45,000 | | | KeyCorp, MTN, 4.150%, 10/29/2025 | | | 45,709 | |
| | 70,000 | | | Macquarie Bank Ltd., 2.350%, 1/15/2019, 144A | | | 69,985 | |
| | 65,000 | | | Mitsubishi UFJ Financial Group, Inc., 2.665%, 7/25/2022(a) | | | 63,169 | |
| | 115,000 | | | Mitsubishi UFJ Financial Group, Inc., 3.761%, 7/26/2023(a) | | | 115,530 | |
| | 235,000 | | | Morgan Stanley, Series 3NC2,3-month LIBOR + 0.800%, 3.414%, 2/14/2020(a)(b) | | | 235,006 | |
| | 160,000 | | | Royal Bank of Canada, GMTN, 2.125%, 3/02/2020(a) | | | 158,349 | |
| | 145,000 | | | Santander Holdings USA, Inc., 3.700%, 3/28/2022 | | | 142,404 | |
| | 200,000 | | | Santander UK PLC,3-month LIBOR + 0.660%, 3.276%, 11/15/2021(a)(b) | | | 198,144 | |
| | 150,000 | | | State Street Corp., 1.950%, 5/19/2021(a) | | | 145,789 | |
| | 110,000 | | | SunTrust Bank, (fixed rate to 1/29/2020, variable rate thereafter), 2.590%, 1/29/2021 | | | 108,929 | |
| | 95,000 | | | SunTrust Bank, (fixed rate to 10/26/2020, variable rate thereafter), 3.525%, 10/26/2021 | | | 95,114 | |
| | 70,000 | | | SunTrust Banks, Inc., 2.700%, 1/27/2022 | | | 68,270 | |
| | 40,000 | | | Toronto Dominion Bank (The), Series MTN, 3.250%, 6/11/2021 | | | 40,164 | |
| | 110,000 | | | Toronto-Dominion Bank, GMTN, 2.550%, 1/25/2021(a) | | | 108,882 | |
| | 165,000 | | | Westpac Banking Corp., 2.650%, 1/25/2021(a) | | | 163,333 | |
| | 25,000 | | | Westpac Banking Corp., 2.800%, 1/11/2022 | | | 24,533 | |
| | | | | | | | |
| | | | | | | 4,507,318 | |
| | | | | | | | |
| | | | Brokerage — 0.2% | |
| | 50,000 | | | Ameriprise Financial, Inc., 7.300%, 6/28/2019 | | | 51,005 | |
| | | | | | | | |
| | | | Building Materials — 1.1% | |
| | 10,000 | | | American Woodmark Corp., 4.875%, 3/15/2026, 144A | | | 8,850 | |
| | 70,000 | | | Fortune Brands Home & Security, Inc., 4.000%, 9/21/2023 | | | 69,258 | |
| | 120,000 | | | Martin Marietta Materials, Inc.,3-month LIBOR + 0.650%, 3.327%, 5/22/2020(b) | | | 119,353 | |
| | 110,000 | | | Vulcan Materials Co.,3-month LIBOR + 0.650%, 3.388%, 3/01/2021(b) | | | 109,174 | |
| | | | | | | | |
| | | | | | | 306,635 | |
| | | | | | | | |
| | | | Cable Satellite — 0.9% | |
| | 145,000 | | | Comcast Corp., 3.450%, 10/01/2021 | | | 146,470 | |
| | 105,000 | | | DISH DBS Corp., 5.000%, 3/15/2023 | | | 87,413 | |
| | | | | | | | |
| | | | | | | 233,883 | |
| | | | | | | | |
| | | | Chemicals — 0.6% | |
| | 25,000 | | | Dow Chemical Co. (The), 4.550%, 11/30/2025, 144A | | | 25,433 | |
| | 35,000 | | | DowDuPont, Inc., 3.766%, 11/15/2020 | | | 35,336 | |
See accompanying notes to financial statements.
| 14
Portfolio of Investments – as of December 31, 2018
Natixis Loomis Sayles Short Duration Income ETF – (continued)
| | | | | | | | |
Principal
Amount | | | Description | | Value (†) | |
| | | | Chemicals — continued | |
| $ | 105,000 | | | EI du Pont de Nemours & Co., 2.200%, 5/01/2020 | | $ | 104,263 | |
| | | | | | | | |
| | | | | | | 165,032 | |
| | | | | | | | |
| | | | Collateralized Mortgage Obligations — 4.5% | |
| | 62,257 | | | Government National Mortgage Association, Series2011-H23, Class HA,
3.000%, 12/20/2061(a) | | | 62,087 | |
| | 63,593 | | | Government National Mortgage Association, Series2012-H28, Class FA,1-month LIBOR + 0.580%, 2.894%, 9/20/2062(a)(b) | | | 63,658 | |
| | 68,525 | | | Government National Mortgage Association, Series2016-H13, Class FT,1-month LIBOR + 0.580%, 2.894%, 5/20/2066(b) | | | 68,702 | |
| | 700,795 | | | Government National Mortgage Association, Series2017-H24, Class FJ,1-month LIBOR + 0.250%, 2.564%, 10/20/2067(a)(b) | | | 699,913 | |
| | 337,344 | | | Government National Mortgage Association, Series2018-H02, Class FJ,1-month LIBOR + 0.200%, 2.514%, 10/20/2064(a)(b) | | | 336,820 | |
| | | | | | | | |
| | | | | | | 1,231,180 | |
| | | | | | | | |
| | | | Construction Machinery — 1.4% | |
| | 155,000 | | | Caterpillar Financial Services Corp., MTN, 2.100%, 1/10/2020(a) | | | 153,487 | |
| | 40,000 | | | Caterpillar Financial Services Corp., MTN, 3.150%, 9/07/2021 | | | 40,105 | |
| | 90,000 | | | Caterpillar Financial Services Corp., MTN, 3.650%, 12/07/2023 | | | 91,087 | |
| | 100,000 | | | John Deere Capital Corp., MTN, 2.875%, 3/12/2021 | | | 99,732 | |
| | | | | | | | |
| | | | | | | 384,411 | |
| | | | | | | | |
| | | | Consumer Cyclical Services — 0.8% | |
| | 155,000 | | | eBay, Inc., 2.150%, 6/05/2020 | | | 153,037 | |
| | 70,000 | | | Western Union Co. (The), 4.250%, 6/09/2023 | | | 70,432 | |
| | | | | | | | |
| | | | | | | 223,469 | |
| | | | | | | | |
| | | | Diversified Manufacturing — 1.6% | |
| | 50,000 | | | 3M Co., MTN, 3.250%, 2/14/2024 | | | 50,306 | |
| | 85,000 | | | Ingersoll-Rand Global Holding Co. Ltd., 2.900%, 2/21/2021 | | | 84,198 | |
| | 85,000 | | | Roper Technologies, Inc., 3.650%, 9/15/2023 | | | 85,061 | |
| | 135,000 | | | United Technologies Corp., 1.900%, 5/04/2020 | | | 132,481 | |
| | 55,000 | | | United Technologies Corp., 3.650%, 8/16/2023 | | | 54,784 | |
| | 35,000 | | | Wabtec Corp.,3-month LIBOR + 1.050%, 3.838%, 9/15/2021(b) | | | 35,005 | |
| | | | | | | | |
| | | | | | | 441,835 | |
| | | | | | | | |
| | | | Electric — 6.1% | |
| | 25,000 | | | Alliant Energy Finance LLC, 3.750%, 6/15/2023, 144A | | | 25,154 | |
| | 65,000 | | | Alliant Energy Finance LLC, 4.250%, 6/15/2028, 144A | | | 64,523 | |
| | 130,000 | | | American Electric Power Co., Inc., 2.150%, 11/13/2020 | | | 127,407 | |
| | 135,000 | | | American Electric Power Co., Inc., Series I, 3.650%, 12/01/2021 | | | 136,014 | |
| | 85,000 | | | Clearway Energy Operating LLC, 5.750%, 10/15/2025, 144A | | | 81,175 | |
| | 105,000 | | | DTE Energy Co., 1.500%, 10/01/2019 | | | 103,444 | |
| | 120,000 | | | Edison International, 2.125%, 4/15/2020 | | | 116,813 | |
| | 125,000 | | | Eversource Energy, Series N, 3.800%, 12/01/2023 | | | 126,204 | |
| | 70,000 | | | Exelon Corp., 2.450%, 4/15/2021 | | | 68,463 | |
| | 130,000 | | | National Rural Utilities Cooperative Finance Corp., MTN, 1.500%, 11/01/2019(a) | | | 128,285 | |
| | 70,000 | | | National Rural Utilities Cooperative Finance Corp., MTN, 2.900%, 3/15/2021 | | | 69,681 | |
See accompanying notes to financial statements.
15 |
Portfolio of Investments – as of December 31, 2018
Natixis Loomis Sayles Short Duration Income ETF – (continued)
| | | | | | | | |
Principal
Amount | | | Description | | Value (†) | |
| | | | Electric — continued | |
| $ | 115,000 | | | PNM Resources, Inc., 3.250%, 3/09/2021 | | $ | 114,075 | |
| | 70,000 | | | PSEG Power LLC, 3.850%, 6/01/2023 | | | 70,057 | |
| | 90,000 | | | Public Service Enterprise Group, Inc., 1.600%, 11/15/2019 | | | 88,743 | |
| | 110,000 | | | South Carolina Electric & Gas Co., 3.500%, 8/15/2021 | | | 110,309 | |
| | 90,000 | | | Southern California Edison Co., Series A, 2.900%, 3/01/2021(a) | | | 88,887 | |
| | 130,000 | | | Wisconsin Public Service Corp., 3.350%, 11/21/2021 | | | 131,269 | |
| | | | | | | | |
| | | | | | | 1,650,503 | |
| | | | | | | | |
| | | | Finance Companies — 3.3% | |
| | 110,000 | | | Air Lease Corp., 2.500%, 3/01/2021 | | | 107,235 | |
| | 40,000 | | | Air Lease Corp., 3.500%, 1/15/2022 | | | 39,364 | |
| | 50,000 | | | Aircastle Ltd., 4.400%, 9/25/2023 | | | 49,176 | |
| | 115,000 | | | Ares Capital Corp., 3.625%, 1/19/2022 | | | 111,646 | |
| | 70,000 | | | Aviation Capital Group LLC, 3.875%, 5/01/2023, 144A | | | 68,581 | |
| | 95,000 | | | Aviation Capital Group LLC, 4.375%, 1/30/2024, 144A | | | 95,122 | |
| | 85,000 | | | Avolon Holdings Funding Ltd., 5.125%, 10/01/2023, 144A | | | 81,175 | |
| | 95,000 | | | GATX Corp., 4.350%, 2/15/2024 | | | 96,542 | |
| | 100,000 | | | iStar, Inc., 4.625%, 9/15/2020 | | | 97,500 | |
| | 25,000 | | | Navient Corp., 6.750%, 6/15/2026 | | | 20,750 | |
| | 80,000 | | | Navient LLC, MTN, 7.250%, 1/25/2022 | | | 77,200 | |
| | 60,000 | | | Springleaf Finance Corp., 5.250%, 12/15/2019 | | | 60,143 | |
| | | | | | | | |
| | | | | | | 904,434 | |
| | | | | | | | |
| | | | Financial Other — 0.4% | |
| | 110,000 | | | ORIX Corp., 2.900%, 7/18/2022 | | | 107,481 | |
| | | | | | | | |
| | | | Food & Beverage — 2.2% | |
| | 130,000 | | | Archer-Daniels-Midland Co., 3.375%, 3/15/2022 | | | 130,495 | |
| | 100,000 | | | Bacardi Ltd., 4.450%, 5/15/2025, 144A | | | 98,661 | |
| | 85,000 | | | Bunge Ltd. Finance Corp., 4.350%, 3/15/2024 | | | 83,395 | |
| | 50,000 | | | Hershey Co. (The), 2.900%, 5/15/2020(a) | | | 49,973 | |
| | 95,000 | | | Kellogg Co., 3.250%, 5/14/2021 | | | 94,085 | |
| | 10,000 | | | Kraft Heinz Food Co.,3-month LIBOR + 0.570%, 3.188%, 2/10/2021(b) | | | 9,917 | |
| | 65,000 | | | Kraft Heinz Foods Co., 4.000%, 6/15/2023 | | | 64,830 | |
| | 80,000 | | | Pilgrim’s Pride Corp., 5.750%, 3/15/2025, 144A | | | 75,000 | |
| | | | | | | | |
| | | | | | | 606,356 | |
| | | | | | | | |
| | | | Gaming — 0.3% | |
| | 80,000 | | | GLP Capital LP/GLP Financing II, Inc., 5.250%, 6/01/2025 | | | 79,434 | |
| | | | | | | | |
| | | | Government Owned – No Guarantee — 0.2% | |
| | 65,000 | | | Petroleos Mexicanos, 6.375%, 2/04/2021 | | | 65,715 | |
| | | | | | | | |
| | | | Health Insurance — 1.3% | |
| | 95,000 | | | Cigna Corp., 3.750%, 7/15/2023, 144A | | | 94,684 | |
| | 95,000 | | | UnitedHealth Group, Inc., 1.700%, 2/15/2019(a) | | | 94,847 | |
| | 60,000 | | | UnitedHealth Group, Inc., 3.500%, 6/15/2023 | | | 60,517 | |
| | 100,000 | | | UnitedHealth Group, Inc., 3.500%, 2/15/2024 | | | 100,640 | |
| | | | | | | | |
| | | | | | | 350,688 | |
| | | | | | | | |
See accompanying notes to financial statements.
| 16
Portfolio of Investments – as of December 31, 2018
Natixis Loomis Sayles Short Duration Income ETF – (continued)
| | | | | | | | |
Principal
Amount | | | Description | | Value (†) | |
| | | | Healthcare — 3.0% | |
| $ | 150,000 | | | Becton Dickinson and Co.,3-month LIBOR + 0.875%, 3.678%, 12/29/2020(b) | | $ | 148,492 | |
| | 165,000 | | | CVS Health Corp., 3.700%, 3/09/2023 | | | 163,234 | |
| | 135,000 | | | Express Scripts Holding Co., 4.750%, 11/15/2021 | | | 138,865 | |
| | 135,000 | | | McKesson Corp., 3.650%, 11/30/2020 | | | 135,645 | |
| | 80,000 | | | MEDNAX, Inc., 6.250%, 1/15/2027, 144A | | | 77,200 | |
| | 140,000 | | | Zimmer Biomet Holdings, Inc.,3-month LIBOR + 0.750%, 3.554%, 3/19/2021(b) | | | 138,689 | |
| | | | | | | | |
| | | | | | | 802,125 | |
| | | | | | | | |
| | | | Home Construction — 0.1% | |
| | 25,000 | | | William Lyon Homes, Inc., 6.000%, 9/01/2023 | | | 22,500 | |
| | | | | | | | |
| | | | Independent Energy — 0.4% | |
| | 105,000 | | | EQT Corp., 3.000%, 10/01/2022 | | | 99,564 | |
| | | | | | | | |
| | | | Integrated Energy — 0.6% | |
| | 150,000 | | | BP Capital Markets PLC,3-month LIBOR + 0.540%, 3.158%, 5/10/2019(a)(b) | | | 150,076 | |
| | | | | | | | |
| | | | Leisure — 0.5% | |
| | 135,000 | | | Royal Caribbean Cruises Ltd., 2.650%, 11/28/2020 | | | 132,523 | |
| | | | | | | | |
| | | | Life Insurance — 3.0% | |
| | 80,000 | | | American International Group, Inc., 3.300%, 3/01/2021 | | | 79,729 | |
| | 105,000 | | | AXA Equitable Holdings, Inc., 3.900%, 4/20/2023, 144A | | | 103,699 | |
| | 115,000 | | | Guardian Life Global Funding, 3.400%, 4/25/2023, 144A(a) | | | 114,568 | |
| | 40,000 | | | Jackson National Life Global Funding, 3.875%, 6/11/2025, 144A(a) | | | 40,213 | |
| | 150,000 | | | Metropolitan Life Global Funding I, 3.450%, 10/09/2021, 144A(a) | | | 150,628 | |
| | 120,000 | | | New York Life Global Funding, 2.000%, 4/09/2020, 144A(a) | | | 118,627 | |
| | 115,000 | | | New York Life Global Funding,3-month LIBOR + 0.100%, 2.569%, 1/21/2020, 144A(a)(b) | | | 114,695 | |
| | 100,000 | | | Reliance Standard Life Global Funding, 3.850%, 9/19/2023, 144A | | | 100,839 | |
| | | | | | | | |
| | | | | | | 822,998 | |
| | | | | | | | |
| | | | Lodging — 0.5% | |
| | 130,000 | | | Marriott International, Inc., Series Y,3-month LIBOR + 0.600%, 3.229%, 12/01/2020(b) | | | 129,687 | |
| | | | | | | | |
| | | | Media Entertainment — 0.6% | |
| | 45,000 | | | 21st Century Fox America, Inc., 6.900%, 3/01/2019 | | | 45,258 | |
| | 100,000 | | | CBS Corp., 2.900%, 6/01/2023 | | | 95,310 | |
| | 25,000 | | | Interpublic Group of Cos., Inc. (The), 3.500%, 10/01/2020 | | | 25,031 | |
| | | | | | | | |
| | | | | | | 165,599 | |
| | | | | | | | |
| | | | Metals & Mining — 0.3% | |
| | 85,000 | | | Commercial Metals Co., 5.750%, 4/15/2026, 144A | | | 78,838 | |
| | | | | | | | |
| | | | Midstream — 2.8% | |
| | 50,000 | | | Cheniere Energy Partners LP, 5.625%, 10/01/2026, 144A | | | 46,750 | |
| | 80,000 | | | Dominion Energy Gas Holdings LLC, 2.800%, 11/15/2020 | | | 78,813 | |
| | 145,000 | | | Enbridge Energy Partners LP, 4.375%, 10/15/2020 | | | 146,693 | |
| | 130,000 | | | Energy Transfer Operating LP, 9.700%, 3/15/2019 | | | 131,545 | |
| | 20,000 | | | Enterprise Products Operating LLC, 3.750%, 2/15/2025 | | | 19,789 | |
| | 50,000 | | | Enterprise Products Operating LLC, 4.150%, 10/16/2028 | | | 49,748 | |
| | 135,000 | | | EQM Midstream Partners LP, Series 5Y, 4.750%, 7/15/2023 | | | 134,710 | |
See accompanying notes to financial statements.
17 |
Portfolio of Investments – as of December 31, 2018
Natixis Loomis Sayles Short Duration Income ETF – (continued)
| | | | | | | | |
Principal
Amount | | | Description | | Value (†) | |
| | | | Midstream — continued | |
| $ | 45,000 | | | Kinder Morgan, Inc., 4.300%, 6/01/2025 | | $ | 44,645 | |
| | 120,000 | | | MPLX LP, 3.375%, 3/15/2023 | | | 116,476 | |
| | | | | | | | |
| | | | | | | 769,169 | |
| | | | | | | | |
| | | | Natural Gas — 0.8% | |
| | 120,000 | | | CenterPoint Energy Resources Corp., 3.550%, 4/01/2023 | | | 120,064 | |
| | 85,000 | | | Sempra Energy, 1.625%, 10/07/2019 | | | 83,825 | |
| | | | | | | | |
| | | | | | | 203,889 | |
| | | | | | | | |
| | | | Paper — 0.4% | |
| | 20,000 | | | WestRock Co., 4.650%, 3/15/2026, 144A | | | 20,306 | |
| | 75,000 | | | WRKCo., Inc., 3.750%, 3/15/2025, 144A | | | 73,593 | |
| | | | | | | | |
| | | | | | | 93,899 | |
| | | | | | | | |
| | | | Pharmaceuticals — 2.2% | |
| | 150,000 | | | Amgen, Inc., 2.200%, 5/11/2020 | | | 148,108 | |
| | 135,000 | | | AstraZeneca PLC, 3.500%, 8/17/2023 | | | 134,292 | |
| | 60,000 | | | Bayer U.S. Finance II LLC, 3.375%, 7/15/2024, 144A | | | 57,076 | |
| | 45,000 | | | Celgene Corp., 3.550%, 8/15/2022 | | | 44,506 | |
| | 60,000 | | | Pfizer, Inc., 3.200%, 9/15/2023(a) | | | 60,237 | |
| | 140,000 | | | Shire Acquisitions Investments Ireland DAC, 1.900%, 9/23/2019 | | | 138,038 | |
| | | | | | | | |
| | | | | | | 582,257 | |
| | | | | | | | |
| | | | Property & Casualty Insurance — 0.6% | |
| | 80,000 | | | Allstate Corp. (The),3-month LIBOR + 0.630%, 3.433%, 3/29/2023(b) | | | 78,363 | |
| | 25,000 | | | Assurant, Inc., 4.200%, 9/27/2023 | | | 25,073 | |
| | 50,000 | | | Chubb INA Holdings, Inc., 5.900%, 6/15/2019 | | | 50,647 | |
| | | | | | | | |
| | | | | | | 154,083 | |
| | | | | | | | |
| | | | Railroads — 0.2% | |
| | 50,000 | | | Union Pacific Corp., 2.250%, 2/15/2019 | | | 49,912 | |
| | | | | | | | |
| | | | Refining — 0.3% | |
| | 85,000 | | | Phillips 66,3-month LIBOR + 0.600%, 3.289%, 2/26/2021(b) | | | 84,050 | |
| | | | | | | | |
| | | | REITs – Diversified — 0.4% | |
| | 125,000 | | | Digital Realty Trust LP, 2.750%, 2/01/2023 | | | 119,425 | |
| | | | | | | | |
| | | | REITs – Mortgage — 0.1% | |
| | 35,000 | | | Starwood Property Trust, Inc., 3.625%, 2/01/2021 | | | 33,688 | |
| | | | | | | | |
| | | | REITs – Regional Malls — 0.5% | |
| | 125,000 | | | Simon Property Group LP, 2.625%, 6/15/2022(a) | | | 121,587 | |
| | | | | | | | |
| | | | Retailers — 1.1% | |
| | 110,000 | | | Alimentation Couche-Tard, Inc., 2.700%, 7/26/2022, 144A | | | 106,148 | |
| | 55,000 | | | Dollar Tree, Inc.,3-month LIBOR + 0.700%, 3.149%, 4/17/2020(b) | | | 54,649 | |
| | 130,000 | | | Home Depot, Inc. (The), 3.250%, 3/01/2022 | | | 131,349 | |
| | | | | | | | |
| | | | | | | 292,146 | |
| | | | | | | | |
| | | | Technology — 4.2% | |
| | 90,000 | | | Analog Devices, Inc., 2.850%, 3/12/2020 | | | 89,684 | |
| | 140,000 | | | Dell International LLC/EMC Corp., 3.480%, 6/01/2019, 144A | | | 139,586 | |
See accompanying notes to financial statements.
| 18
Portfolio of Investments – as of December 31, 2018
Natixis Loomis Sayles Short Duration Income ETF – (continued)
| | | | | | | | |
Principal
Amount | | | Description | | Value (†) | |
| | | | Technology — continued | |
| $ | 120,000 | | | DXC Technology Co., 2.875%, 3/27/2020 | | $ | 118,963 | |
| | 125,000 | | | Fidelity National Information Services, Inc., 2.250%, 8/15/2021 | | | 120,710 | |
| | 105,000 | | | Genpact Luxembourg S.a.r.l., 3.700%, 4/01/2022 | | | 104,202 | |
| | 130,000 | | | Hewlett Packard Enterprise Co., 2.100%, 10/04/2019, 144A | | | 128,535 | |
| | 110,000 | | | IBM Credit LLC, 2.650%, 2/05/2021(a) | | | 108,763 | |
| | 135,000 | | | IBM Credit LLC, 3.600%, 11/30/2021 | | | 136,222 | |
| | 70,000 | | | Marvell Technology Group Ltd., 4.200%, 6/22/2023 | | | 69,797 | |
| | 20,000 | | | Microchip Technology, Inc., 3.922%, 6/01/2021, 144A | | | 19,840 | |
| | 25,000 | | | Pitney Bowes, Inc., 4.950%, 4/01/2023 | | | 22,062 | |
| | 20,000 | | | Seagate Hdd Cayman, 4.875%, 3/01/2024 | | | 18,192 | |
| | 5,000 | | | Trimble, Inc., 4.150%, 6/15/2023 | | | 5,026 | |
| | 70,000 | | | Xerox Corp., 3.625%, 3/15/2023 | | | 62,976 | |
| | | | | | | | |
| | | | | | | 1,144,558 | |
| | | | | | | | |
| | | | Tobacco — 1.0% | |
| | 165,000 | | | BAT Capital Corp., 2.764%, 8/15/2022 | | | 155,846 | |
| | 110,000 | | | Philip Morris International, Inc., 1.875%, 1/15/2019 | | | 109,950 | |
| | | | | | | | |
| | | | | | | 265,796 | |
| | | | | | | | |
| | | | Transportation Services — 0.7% | |
| | 80,000 | | | Penske Truck Leasing Co. LP/PTL Finance Corp., 4.125%, 8/01/2023, 144A | | | 79,859 | |
| | 30,000 | | | Ryder System, Inc., MTN, 3.750%, 6/09/2023 | | | 29,815 | |
| | 70,000 | | | Ryder System, Inc., MTN, 3.875%, 12/01/2023 | | | 70,093 | |
| | | | | | | | |
| | | | | | | 179,767 | |
| | | | | | | | |
| | | | Treasuries — 7.7% | |
| | 1,860,000 | | | U.S. Treasury Note, 2.750%, 9/30/2020 | | | 1,866,975 | |
| | 80,000 | | | U.S. Treasury Note, 2.875%, 11/15/2021 | | | 80,890 | |
| | 130,000 | | | U.S. Treasury Note, 2.875%, 11/30/2023 | | | 132,265 | |
| | | | | | | | |
| | | | | | | 2,080,130 | |
| | | | | | | | |
| | | | Wireless — 0.1% | |
| | 35,000 | | | Vodafone Group PLC, 4.125%, 5/30/2025 | | | 34,576 | |
| | | | | | | | |
| | | | Wirelines — 1.2% | |
| | 40,000 | | | AT&T, Inc.,3-month LIBOR + 1.180%, 3.956%, 6/12/2024(b) | | | 38,800 | |
| | 135,000 | | | Orange S.A., 1.625%, 11/03/2019 | | | 133,311 | |
| | 160,000 | | | Verizon Communications, Inc.,3-month LIBOR + 1.100%, 3.716%, 5/15/2025(b) | | | 155,140 | |
| | | | | | | | |
| | | | | | | 327,251 | |
| | | | | | | | |
| | | | Total Bonds and Notes
(Identified Cost $26,844,730) | | | 26,641,620 | |
| | | | | | | | |
| | | | | | | | |
| | | | Total Investments — 98.4%
(Identified Cost $26,844,730) | | | 26,641,620 | |
| | | | Other assets less liabilities — 1.6% | | | 442,185 | |
| | | | | | | | |
| | | | Net Assets — 100.0% | | $ | 27,083,805 | |
| | | | | | | | |
| | | | | | | | |
| | (†) | | | See Note 2 of Notes to Financial Statements. | |
| | (a) | | | Security (or a portion thereof) has been designated to cover the Fund’s obligations under open derivative contracts. | |
See accompanying notes to financial statements.
19 |
Portfolio of Investments – as of December 31, 2018
Natixis Loomis Sayles Short Duration Income ETF – (continued)
| | | | | | | | |
| | | | | | | | |
| | (b) | | | Variable rate security. Rate as of December 31, 2018 is disclosed. | |
| | | | | |
| | 144A | | | All or a portion of these securities are exempt from registration under Rule 144A of the Securities Act of 1933. These securities may be resold in transactions exempt from registration, normally to qualified institutional buyers. At December 31, 2018, the value of Rule 144A holdings amounted to $5,768,902 or 21.3% of net assets. | |
| | ABS | | | Asset-Backed Securities | |
| | FHLMC | | | Federal Home Loan Mortgage Corp. | |
| | GMTN | | | Global Medium Term Note | |
| | LIBOR | | | London Interbank Offered Rate | |
| | MTN | | | Medium Term Note | |
| | REITs | | | Real Estate Investment Trusts | |
At December 31, 2018, open long futures contracts were as follows:
| | | | | | | | | | | | | | | | | | | | |
| Financial Futures | | Expiration
Date | | | Contracts | | | Notional
Amount | | | Value | | | Unrealized
Appreciation
(Depreciation) | |
2 Year U.S. Treasury Note | | | 3/29/2019 | | | | 24 | | | $ | 5,064,008 | | | $ | 5,095,500 | | | $ | 31,492 | |
| | | | | | | | | | | | | | | | | | | | |
At December 31, 2018, open short futures contracts were as follows:
| | | | | | | | | | | | | | | | | | | | |
| Financial Futures | | Expiration
Date | | | Contracts | | | Notional
Amount | | | Value | | | Unrealized
Appreciation
(Depreciation) | |
5 Year U.S. Treasury Note | | | 3/29/2019 | | | | 19 | | | $ | 2,146,074 | | | $ | 2,179,063 | | | $ | (32,989 | ) |
10 Year U.S. Treasury Note | | | 3/20/2019 | | | | 9 | | | | 1,074,563 | | | | 1,098,140 | | | | (23,577 | ) |
| | | | | | | | | | | | | | | | | | | | |
Total | | | $ | (56,566 | ) |
| | | | | | | | | | | | | | | | | | | | |
Industry Summary at December 31, 2018
| | | | |
Banking | | | 16.6 | % |
ABS Car Loan | | | 11.7 | |
Treasuries | | | 7.7 | |
Electric | | | 6.1 | |
Automotive | | | 5.8 | |
Collateralized Mortgage Obligations | | | 4.5 | |
Technology | | | 4.2 | |
Finance Companies | | | 3.3 | |
Life Insurance | | | 3.0 | |
Healthcare | | | 3.0 | |
Midstream | | | 2.8 | |
Food & Beverage | | | 2.2 | |
Pharmaceuticals | | | 2.2 | |
ABS Credit Card | | | 2.0 | |
Other Investments, less than 2% each | | | 23.3 | |
| | | | |
Total Investments | | | 98.4 | |
Other assets less liabilities (including futures contracts) | | | 1.6 | |
| | | | |
Net Assets | | | 100.0 | % |
| | | | |
See accompanying notes to financial statements.
| 20
Portfolio of Investments – as of December 31, 2018
Natixis Seeyond International Minimum Volatility ETF
| | | | | | | | |
| Shares | | | Description | | Value (†) | |
| | Common Stocks — 99.1% of Net Assets | |
| | | | Australia — 10.7% | |
| | 16,412 | | | Amcor Ltd. | | $ | 153,091 | |
| | 109,505 | | | Aurizon Holdings Ltd. | | | 329,952 | |
| | 45,188 | | | Brambles Ltd. | | | 322,895 | |
| | 17,435 | | | Crown Resorts Ltd. | | | 145,572 | |
| | 32,340 | | | Dexus | | | 241,789 | |
| | 18,359 | | | Newcrest Mining Ltd. | | | 281,759 | |
| | 15,587 | | | Sonic Healthcare Ltd. | | | 242,619 | |
| | 14,388 | | | Transurban Group | | | 118,005 | |
| | 60,819 | | | Vicinity Centres | | | 111,323 | |
| | 18,073 | | | Woolworths Ltd. | | | 374,322 | |
| | | | | | | | |
| | | | | | | 2,321,327 | |
| | | | | | | | |
| | | | Austria — 0.6% | |
| | 3,850 | | | Erste Group Bank AG | | | 127,853 | |
| | | | | | | | |
| | | | Belgium — 0.9% | |
| | 1,540 | | | Ageas | | | 69,186 | |
| | 1,474 | | | UCB S.A. | | | 120,140 | |
| | | | | | | | |
| | | | | | | 189,326 | |
| | | | | | | | |
| | | | Bermuda — 0.4% | |
| | 11,000 | | | CK Infrastructure Holdings Ltd. | | | 83,315 | |
| | | | | | | | |
| | | | Canada — 8.3% | |
| | 11,396 | | | Barrick Gold Corp. | | | 153,777 | |
| | 5,038 | | | Empire Co. Ltd. | | | 106,345 | |
| | 627 | | | Fairfax Financial Holdings Ltd. | | | 275,893 | |
| | 4,895 | | | Fortis, Inc. | | | 163,107 | |
| | 2,585 | | | Franco-Nevada Corp. | | | 181,185 | |
| | 4,906 | | | Great-West Lifeco, Inc. | | | 101,223 | |
| | 6,138 | | | Metro, Inc. | | | 212,749 | |
| | 1,430 | | | Onex Corp. | | | 77,845 | |
| | 2,728 | | | Open Text Corp. | | | 88,883 | |
| | 2,035 | | | Restaurant Brands International, Inc. | | | 106,264 | |
| | 6,633 | | | TELUS Corp. | | | 219,756 | |
| | 2,255 | | | Toronto-Dominion Bank (The) | | | 112,040 | |
| | | | | | | | |
| | | | | | | 1,799,067 | |
| | | | | | | | |
| | | | Denmark — 0.4% | |
| | 1,672 | | | Novo Nordisk AS, Class B | | | 76,301 | |
| | | | | | | | |
| | | | France — 5.9% | |
| | 7,084 | | | Alstom S.A. | | | 285,619 | |
| | 2,391 | | | EssilorLuxottica S.A. | | | 301,890 | |
| | 2,618 | | | SCOR SE | | | 117,915 | |
| | 946 | | | Teleperformance | | | 150,966 | |
| | 2,728 | | | Thales S.A. | | | 318,088 | |
| | 1,980 | | | Total S.A. | | | 104,526 | |
| | | | | | | | |
| | | | | | | 1,279,004 | |
| | | | | | | | |
See accompanying notes to financial statements.
21 |
Portfolio of Investments – as of December 31, 2018
Natixis Seeyond International Minimum Volatility ETF – (continued)
| | | | | | | | |
| Shares | | | Description | | Value (†) | |
| | | | Germany — 1.2% | |
| | 726 | | | Adidas AG | | $ | 151,378 | |
| | 8,338 | | | TUI AG | | | 119,520 | |
| | | | | | | | |
| | | | | | | 270,898 | |
| | | | | | | | |
| | | | Hong Kong — 4.8% | |
| | 22,000 | | | AIA Group Ltd. | | | 182,646 | |
| | 19,340 | | | Dairy Farm International Holdings Ltd. | | | 175,027 | |
| | 319,000 | | | HKT Trust & HKT Ltd. | | | 459,594 | |
| | 374,000 | | | PCCW Ltd. | | | 215,438 | |
| | | | | | | | |
| | | | | | | 1,032,705 | |
| | | | | | | | |
| | | | Ireland — 2.2% | |
| | 4,917 | | | Kerry Group PLC, Series A | | | 486,205 | |
| | | | | | | | |
| | | | Israel — 4.4% | |
| | 3,410 | | | Azrieli Group Ltd. | | | 162,892 | |
| | 43,164 | | | Bank Hapoalim BM | | | 273,186 | |
| | 63,140 | | | Bank LeumiLe-Israel BM | | | 381,873 | |
| | 8,030 | | | Mizrahi Tefahot Bank Ltd. | | | 135,683 | |
| | | | | | | | |
| | | | | | | 953,634 | |
| | | | | | | | |
| | | | Italy — 0.7% | |
| | 9,669 | | | Assicurazioni Generali SpA. | | | 161,375 | |
| | | | | | | | |
| | | | Japan — 29.4% | |
| | 4,400 | | | ABC-Mart, Inc. | | | 243,832 | |
| | 4,400 | | | Aozora Bank Ltd. | | | 131,340 | |
| | 7,700 | | | Astellas Pharma, Inc. | | | 98,360 | |
| | 4,400 | | | Benesse Holdings, Inc. | | | 112,211 | |
| | 9,900 | | | Chugoku Electric Power Co., Inc. (The) | | | 128,854 | |
| | 1,100 | | | FamilyMart UNY Holdings Co. Ltd. | | | 139,461 | |
| | 9,700 | | | Japan Airlines Co. Ltd. | | | 344,007 | |
| | 8,800 | | | Japan Post Bank Co. Ltd. | | | 97,051 | |
| | 37,400 | | | Japan Post Holdings Co. Ltd. | | | 431,217 | |
| | 77 | | | Japan Prime Realty Investment Corp. | | | 292,658 | |
| | 66 | | | Japan Real Estate Investment Corp. | | | 370,560 | |
| | 8,800 | | | Kansai Electric Power Co., Inc. (The) | | | 132,343 | |
| | 5,500 | | | Kintetsu Group Holdings Co. Ltd. | | | 239,120 | |
| | 14,300 | | | Kyushu Electric Power Co., Inc. | | | 170,612 | |
| | 2,200 | | | Lawson, Inc. | | | 139,361 | |
| | 13,200 | | | Mitsubishi Motors Corp. | | | 72,428 | |
| | 11,000 | | | Nagoya Railroad Co. Ltd. | | | 290,352 | |
| | 11,700 | | | NEC Corp. | | | 348,179 | |
| | 33 | | | Nippon Building Fund, Inc. | | | 207,839 | |
| | 30,800 | | | Nissan Motor Co. Ltd. | | | 247,124 | |
| | 198 | | | Nomura Real Estate Master Fund, Inc. | | | 260,595 | |
| | 4,400 | | | Osaka Gas Co. Ltd. | | | 80,569 | |
| | 8,800 | | | Park24 Co. Ltd. | | | 193,541 | |
| | 1,700 | | | Secom Co. Ltd. | | | 141,219 | |
| | 8,800 | | | Sega Sammy Holdings, Inc. | | | 123,199 | |
| | 5,500 | | | Suntory Beverage & Food Ltd. | | | 248,644 | |
See accompanying notes to financial statements.
| 22
Portfolio of Investments – as of December 31, 2018
Natixis Seeyond International Minimum Volatility ETF – (continued)
| | | | | | | | |
| Shares | | | Description | | Value (†) | |
| | | | Japan — continued | |
| | 13,200 | | | Tohoku Electric Power Co., Inc. | | $ | 174,452 | |
| | 7,700 | | | Toshiba Corp. | | | 217,564 | |
| | 110 | | | United Urban Investment Corp. | | | 170,642 | |
| | 4,400 | | | West Japan Railway Co. | | | 311,246 | |
| | 22,000 | | | Yamada Denki Co. Ltd. | | | 105,674 | |
| | 12,100 | | | Yamaguchi Financial Group, Inc. | | | 116,352 | |
| | | | | | | | |
| | | | | | | 6,380,606 | |
| | | | | | | | |
| | | | Netherlands — 5.6% | |
| | 5,790 | | | AerCap Holdings NV(a) | | | 229,284 | |
| | 1,232 | | | Heineken NV | | | 108,725 | |
| | 11,803 | | | Koninklijke Ahold Delhaize NV | | | 297,849 | |
| | 9,966 | | | NN Group NV | | | 396,464 | |
| | 6,391 | | | Royal Dutch Shell PLC, A Shares | | | 187,821 | |
| | | | | | | | |
| | | | | | | 1,220,143 | |
| | | | | | | | |
| | | | New Zealand — 1.9% | |
| | 49,962 | | | Meridian Energy Ltd. | | | 114,074 | |
| | 110,132 | | | Spark New Zealand Ltd. | | | 306,474 | |
| | | | | | | | |
| | | | | | | 420,548 | |
| | | | | | | | |
| | | | Norway — 0.5% | |
| | 4,895 | | | Marine Harvest ASA | | | 103,280 | |
| | | | | | | | |
| | | | Singapore — 5.8% | |
| | 48,400 | | | Ascendas Real Estate Investment Trust | | | 91,261 | |
| | 209,000 | | | CapitaLand Commercial Trust | | | 268,342 | |
| | 66,472 | | | CapitaLand Mall Trust | | | 110,218 | |
| | 66,000 | | | SATS Ltd. | | | 225,649 | |
| | 25,300 | | | Singapore Airlines Ltd. | | | 174,854 | |
| | 33,000 | | | Singapore Telecommunications Ltd. | | | 71,665 | |
| | 3,300 | | | Singapore Telecommunications Ltd. | | | 7,094 | |
| | 132,000 | | | Wilmar International Ltd. | | | 302,157 | |
| | | | | | | | |
| | | | | | | 1,251,240 | |
| | | | | | | | |
| | | | Switzerland — 7.6% | |
| | 77 | | | Givaudan S.A., (Registered) | | | 177,777 | |
| | 7,755 | | | Nestle S.A., (Registered) | | | 627,763 | |
| | 209 | | | Partners Group Holding AG | | | 126,358 | |
| | 682 | | | Roche Holding AG | | | 168,390 | |
| | 176 | | | Swiss Life Holding AG, (Registered) | | | 67,594 | |
| | 1,166 | | | Swiss Prime Site AG, (Registered) | | | 94,091 | |
| | 1,265 | | | Zurich Insurance Group AG | | | 376,112 | |
| | | | | | | | |
| | | | | | | 1,638,085 | |
| | | | | | | | |
| | | | United Kingdom — 7.8% | |
| | 2,640 | | | Bunzl PLC | | | 79,653 | |
| | 4,587 | | | Carnival PLC | | | 219,835 | |
| | 10,373 | | | Coca-Cola European Partners PLC(a) | | | 475,602 | |
| | 9,240 | | | Compass Group PLC | | | 194,173 | |
| | 106,326 | | | Direct Line Insurance Group PLC | | | 431,573 | |
See accompanying notes to financial statements.
23 |
Portfolio of Investments – as of December 31, 2018
Natixis Seeyond International Minimum Volatility ETF – (continued)
| | | | | | | | |
| Shares | | | Description | | Value (†) | |
| | | | United Kingdom — continued | |
| | 108,163 | | | Wm Morrison Supermarkets PLC | | $ | 293,765 | |
| | | | | | | | |
| | | | | | | 1,694,601 | |
| | | | | | | | |
| | | | | | | | |
| | | | Total Common Stocks
(Identified Cost $22,135,985) | | | 21,489,513 | |
| | | | | | | | |
| | | | | | | | |
Principal
Amount | | | | | | |
| | Short-Term Investments — 0.7% | |
| $ | 151,492 | | | Tri-Party Repurchase Agreement with Fixed Income Clearing Corporation, dated 12/31/2018 at 1.500% to be repurchased at $151,504 on 1/02/2019 collateralized by $165,000 U.S. Treasury Bond, 2.750% due 11/15/2042 valued at $157,824 including accrued interest (Note 2 of Notes to Financial Statements)
(Identified Cost $151,492) | | | 151,492 | |
| | | | | | | | |
| | | | Total Investments — 99.8%
(Identified Cost $22,287,477) | | | 21,641,005 | |
| | | | Other assets less liabilities — 0.2% | | | 44,754 | |
| | | | | | | | |
| | | | Net Assets — 100.0% | | $ | 21,685,759 | |
| | | | | | | | |
| | | | | | | | |
| | (†) | | | See Note 2 of Notes to Financial Statements. | |
| | (a) | | | Non-income producing security. | |
Industry Summary at December��31, 2018
| | | | |
Insurance | | | 12.1 | % |
Food & Staples Retailing | | | 7.9 | |
Food Products | | | 7.0 | |
Banks | | | 6.4 | |
Diversified Telecommunication Services | | | 5.8 | |
Road & Rail | | | 5.3 | |
Equity Real Estate Investment Trusts | | | 4.9 | |
REITs - Office Property | | | 4.1 | |
Electric Utilities | | | 3.9 | |
Beverages | | | 3.8 | |
Hotels, Restaurants & Leisure | | | 3.6 | |
Commercial Services & Supplies | | | 3.1 | |
Metals & Mining | | | 2.8 | |
Airlines | | | 2.4 | |
Pharmaceuticals | | | 2.3 | |
Textiles, Apparel & Luxury Goods | | | 2.1 | |
Other Investments, less than 2% each | | | 21.6 | |
Short-Term Investments | | | 0.7 | |
| | | | |
Total Investments | | | 99.8 | |
Other assets less liabilities | | | 0.2 | |
| | | | |
Net Assets | | | 100.0 | % |
| | | | |
See accompanying notes to financial statements.
| 24
Portfolio of Investments – as of December 31, 2018
Natixis Seeyond International Minimum Volatility ETF – (continued)
Currency Exposure Summary at December 31, 2018
| | | | |
Japanese Yen | | | 29.4 | % |
Euro | | | 14.7 | |
Australian Dollar | | | 10.7 | |
Canadian Dollar | | | 8.3 | |
Swiss Franc | | | 7.6 | |
British Pound | | | 7.0 | |
Singapore Dollar | | | 5.8 | |
United States Dollar | | | 4.7 | |
Israeli Shekel | | | 4.4 | |
Hong Kong Dollar | | | 4.4 | |
Other, less than 2% each | | | 2.8 | |
| | | | |
Total Investments | | | 99.8 | |
Other assets less liabilities | | | 0.2 | |
| | | | |
Net Assets | | | 100.0 | % |
| | | | |
See accompanying notes to financial statements.
25 |
Statements of Assets and Liabilities
December 31, 2018
| | | | | | | | |
| | | Natixis Loomis
Sayles Short
Duration
Income ETF | | | Natixis Seeyond
International
Minimum
Volatility ETF | |
ASSETS | |
Investments at cost | | $ | 26,844,730 | | | $ | 22,287,477 | |
Net unrealized depreciation | | | (203,110 | ) | | | (646,472 | ) |
| | | | | | | | |
Investments at value | | | 26,641,620 | | | | 21,641,005 | |
Cash | | | 320,308 | | | | — | |
Due from brokers (Note 2) | | | 25,000 | | | | — | |
Foreign currency at value (identified cost $0 and $55,306, respectively) | | | — | | | | 55,677 | |
Receivable from investment adviser (Note 6) | | | 2,081 | | | | 6,786 | |
Dividends and interest receivable | | | 164,165 | | | | 43,077 | |
Tax reclaims receivable | | | 171 | | | | 25,840 | |
Prepaid expenses (Note 7) | | | 7 | | | | 5 | |
| | | | | | | | |
TOTAL ASSETS | | | 27,153,352 | | | | 21,772,390 | |
| | | | | | | | |
LIABILITIES | |
Payable for variation margin on futures contracts (Note 2) | | | 4,935 | | | | — | |
Deferred Trustees’ fees (Note 6) | | | 3,867 | | | | 9,627 | |
Administrative fees payable (Note 6) | | | 959 | | | | 749 | |
Other accounts payable and accrued expenses | | | 59,786 | | | | 76,255 | |
| | | | | | | | |
TOTAL LIABILITIES | | | 69,547 | | | | 86,631 | |
| | | | | | | | |
NET ASSETS | | $ | 27,083,805 | | | $ | 21,685,759 | |
| | | | | | | | |
NET ASSETS CONSIST OF: | |
Paid-in capital | | $ | 27,462,308 | | | $ | 22,704,328 | |
Accumulated loss | | | (378,503 | ) | | | (1,018,569 | ) |
| | | | | | | | |
NET ASSETS | | $ | 27,083,805 | | | $ | 21,685,759 | |
| | | | | | | | |
COMPUTATION OF NET ASSET VALUE AND OFFERING PRICE: | |
Net assets | | $ | 27,083,805 | | | $ | 21,685,759 | |
| | | | | | | | |
Shares of beneficial interest | | | 1,100,000 | | | | 550,000 | |
| | | | | | | | |
Net asset value, offering and redemption price per share | | $ | 24.62 | | | $ | 39.43 | |
| | | | | | | | |
See accompanying notes to financial statements.
| 26
Statements of Operations
For the Year Ended December 31, 2018
| | | | | | | | |
| | | Natixis Loomis
Sayles Short
Duration
Income ETF | | | Natixis Seeyond
International
Minimum
Volatility ETF | |
INVESTMENT INCOME | |
Interest | | $ | 667,556 | | | $ | 1,828 | |
Dividends | | | — | | | | 642,033 | |
Less net foreign taxes withheld | | | — | | | | (69,269 | ) |
| | | | | | | | |
| | | 667,556 | | | | 574,592 | |
| | | | | | | | |
Expenses | |
Management fees (Note 6) | | | 70,568 | | | | 100,070 | |
Administrative fees (Note 6) | | | 10,327 | | | | 8,783 | |
Trustees’ fees and expenses (Note 6) | | | 14,972 | | | | 15,502 | |
Audit and tax services fees | | | 42,932 | | | | 42,682 | |
Custodian fees and expenses | | | 41,978 | | | | 58,205 | |
Legal fees | | | 29,796 | | | | 39,290 | |
Registration fees | | | 173 | | | | 20 | |
Shareholder reporting expenses | | | 12,517 | | | | 18,778 | |
Miscellaneous expenses | | | 33,182 | | | | 30,978 | |
| | | | | | | | |
Total expenses | | | 256,445 | | | | 314,308 | |
Less waiver and/or expense reimbursement (Note 6) | | | (167,059 | ) | | | (204,173 | ) |
| | | | | | | | |
Net expenses | | | 89,386 | | | | 110,135 | |
| | | | | | | | |
Net investment income | | | 578,170 | | | | 464,457 | |
| | | | | | | | |
NET REALIZED AND UNREALIZED GAIN (LOSS) ON INVESTMENTS, FUTURES CONTRACTS AND FOREIGN CURRENCY TRANSACTIONS | | | | | | | | |
Net realized gain (loss) on: | |
Investments | | | (98,744 | ) | | | 340,508 | |
Futures contracts | | | (9,184 | ) | | | — | |
Foreign currency transactions (Note 2c) | | | — | | | | 1,506 | |
Net change in unrealized appreciation (depreciation) on: | |
Investments | | | (208,190 | ) | | | (2,158,427 | ) |
Futures contracts | | | (25,074 | ) | | | — | |
Foreign currency translations (Note 2c) | | | — | | | | (1,241 | ) |
| | | | | | | | |
Net realized and unrealized loss on investments, futures contracts and foreign currency transactions | | | (341,192 | ) | | | (1,817,654 | ) |
| | | | | | | | |
NET INCREASE (DECREASE) IN NET ASSETS RESULTING FROM OPERATIONS | | $ | 236,978 | | | $ | (1,353,197 | ) |
| | | | | | | | |
See accompanying notes to financial statements.
27 |
Statements of Changes in Net Assets
| | | | | | | | |
| | | Natixis Loomis Sayles Short
Duration Income ETF | |
| | | Year Ended
December 31,
2018 | | | Period Ended
December 31,
2017(a) | |
FROM OPERATIONS: | |
Net investment income (loss) | | $ | 578,170 | | | $ | (153 | ) |
Net realized gain (loss) on investments and futures contracts | | | (107,928 | ) | | | — | |
Net change in unrealized appreciation (depreciation) on investments and futures contracts | | | (233,264 | ) | | | 5,080 | |
| | | | | | | | |
Net increase in net assets resulting from operations | | | 236,978 | | | | 4,927 | |
| | | | | | | | |
FROM DISTRIBUTIONS TO SHAREHOLDERS | | | (620,940 | ) | | | — | |
| | | | | | | | |
NET INCREASE IN NET ASSETS FROM CAPITAL SHARE TRANSACTIONS (NOTE 9) | | | 7,452,078 | | | | 20,010,762 | |
| | | | | | | | |
Net increase in net assets | | | 7,068,116 | | | | 20,015,689 | |
NET ASSETS | |
Beginning of the year | | | 20,015,689 | | | | — | |
| | | | | | | | |
End of the year | | $ | 27,083,805 | | | $ | 20,015,689 | |
| | | | | | | | |
| (a) | From commencement of operations on December 27, 2017 through December 31, 2017. |
See accompanying notes to financial statements.
| 28
Statements of Changes in Net Assets (continued)
| | | | | | | | |
| | | Natixis Seeyond International
Minimum Volatility ETF | |
| | | Year Ended
December 31,
2018 | | | Year Ended
December 31,
2017 | |
FROM OPERATIONS: | |
Net investment income | | $ | 464,457 | | | $ | 304,789 | |
Net realized gain on investments and foreign currency transactions | | | 342,014 | | | | 817,491 | |
Net change in unrealized appreciation (depreciation) on investments and foreign currency translations | | | (2,159,668 | ) | | | 1,910,895 | |
| | | | | | | | |
Net increase (decrease) in net assets resulting from operations | | | (1,353,197 | ) | | | 3,033,175 | |
| | | | | | | | |
FROM DISTRIBUTIONS TO SHAREHOLDERS | | | (1,157,940 | ) | | | (1,040,720 | )(a) |
| | | | | | | | |
NET INCREASE IN NET ASSETS FROM CAPITAL SHARE TRANSACTIONS (NOTE 9) | | | 6,445,786 | | | | 2,294,815 | |
| | | | | | | | |
Net increase in net assets | | | 3,934,649 | | | | 4,287,270 | |
NET ASSETS | |
Beginning of the year | | | 17,751,110 | | | | 13,463,840 | |
| | | | | | | | |
End of the year | | $ | 21,685,759 | | | $ | 17,751,110 | |
| | | | | | | | |
| (a) | See Note 2e of Notes to Financial Statements. |
See accompanying notes to financial statements.
29 |
Financial Highlights
For a share outstanding throughout each period.
| | | | | | | | |
| | | Natixis Loomis Sayles Short
Duration Income ETF | |
| | | Year Ended
December 31,
2018 | | | Period Ended
December 31,
2017* | |
Net asset value, beginning of the period | | $ | 25.02 | | | $ | 25.00 | |
| | | | | | | | |
INCOME (LOSS) FROM INVESTMENT OPERATIONS: | | | | | | | | |
Net investment income (loss)(a) | | | 0.61 | | | | (0.00 | )(b) |
Net realized and unrealized gain (loss) | | | (0.37 | ) | | | 0.02 | |
| | | | | | | | |
Total from Investment Operations | | | 0.24 | | | | 0.02 | |
| | | | | | | | |
LESS DISTRIBUTIONS FROM: | | | | | | | | |
Net investment income | | | (0.64 | ) | | | — | |
| | | | | | | | |
Net asset value, end of the period | | $ | 24.62 | | | $ | 25.02 | |
| | | | | | | | |
Total return(c) | | | 0.97 | % | | | 0.08 | %(d) |
RATIOS TO AVERAGE NET ASSETS: | | | | | | | | |
Net assets, end of the period (000’s) | | $ | 27,084 | | | $ | 20,016 | |
Net expenses(e) | | | 0.38 | % | | | 0.38 | %(f) |
Gross expenses | | | 1.09 | % | | | 14.21 | %(f) |
Net investment income (loss) | | | 2.46 | % | | | (0.09 | )%(f) |
Portfolio turnover rate(g) | | | 167 | % | | | 0 | % |
| * | From commencement of operations on December 27, 2017 through December 31, 2017. |
| (a) | Per share net investment income (loss) has been calculated using the average shares outstanding during the period. |
| (b) | Amount rounds to less than $0.01. |
| (c) | Total return is calculated assuming a purchase of shares at net asset value on the first day and a sale at net asset value on the last day of each period reported. Had certain expenses not been waived/ reimbursed during the period, total returns would have been lower. |
| (d) | Periods less than one year are not annualized. |
| (e) | The investment adviser agreed to waive its fees and/or reimburse a portion of the Fund’s expenses during the period. Without this waiver/reimbursement, expenses would have been higher. |
| (f) | Computed on an annualized basis for periods less than one year. |
| (g) | Portfolio turnover rate excludes securities received or delivered fromin-kind processing of creations or redemptions. |
See accompanying notes to financial statements.
| 30
Financial Highlights (continued)
For a share outstanding throughout each period.
| | | | | | | | | | | | |
| | | Natixis Seeyond International Minimum
Volatility ETF | |
| | | Year Ended
December 31,
2018 | | | Year Ended
December 31,
2017 | | | Period Ended
December 31,
2016* | |
Net asset value, beginning of the period | | $ | 44.38 | | | $ | 38.47 | | | $ | 39.91 | |
| | | | | | | | | | | | |
INCOME (LOSS) FROM INVESTMENT OPERATIONS: | | | | | | | | | | | | |
Net investment income(a) | | | 1.02 | | | | 0.85 | | | | 0.11 | |
Net realized and unrealized gain (loss) | | | (3.75 | ) | | | 7.66 | | | | (1.43 | ) |
| | | | | | | | | | | | |
Total from Investment Operations | | | (2.73 | ) | | | 8.51 | | | | (1.32 | ) |
| | | | | | | | | | | | |
LESS DISTRIBUTIONS FROM: | | | | | | | | | | | | |
Net investment income | | | (1.01 | ) | | | (0.84 | ) | | | (0.12 | ) |
Net realized capital gains | | | (1.21 | ) | | | (1.76 | ) | | | — | |
| | | | | | | | | | | | |
Total Distributions | | | (2.22 | ) | | | (2.60 | ) | | | (0.12 | ) |
| | | | | | | | | | | | |
Net asset value, end of the period | | $ | 39.43 | | | $ | 44.38 | | | $ | 38.47 | |
| | | | | | | | | | | | |
Total return(b) | | | (6.17 | )% | | | 22.17 | % | | | (3.31 | )%(c) |
RATIOS TO AVERAGE NET ASSETS: | | | | | | | | | | | | |
Net assets, end of the period (000’s) | | $ | 21,686 | | | $ | 17,751 | | | $ | 13,464 | |
Net expenses(d) | | | 0.55 | % | | | 0.55 | % | | | 0.55 | %(e) |
Gross expenses | | | 1.57 | % | | | 1.76 | % | | | 2.61 | %(e) |
Net investment income | | | 2.32 | % | | | 1.96 | % | | | 1.49 | %(e) |
Portfolio turnover rate(f) | | | 135 | % | | | 93 | % | | | 20 | % |
| * | From commencement of operations on October 25, 2016 through December 31, 2016. |
| (a) | Per share net investment income has been calculated using the average shares outstanding during the period. |
| (b) | Total return is calculated assuming a purchase of shares at net asset value on the first day and a sale at net asset value on the last day of each period reported. Had certain expenses not been waived/ reimbursed during the period, total returns would have been lower. |
| (c) | Periods less than one year are not annualized. |
| (d) | The investment adviser agreed to waive its fees and/or reimburse a portion of the Fund’s expenses during the period. Without this waiver/reimbursement, expenses would have been higher. |
| (e) | Computed on an annualized basis for periods less than one year. |
| (f) | Portfolio turnover rate excludes securities received or delivered fromin-kind processing of creations or redemptions. |
See accompanying notes to financial statements.
31 |
Notes to Financial Statements
December 31, 2018
1. Organization. Natixis ETF Trust (the “Trust”) is organized as a Massachusetts business trust. The Trust is registered under the Investment Company Act of 1940, as amended (the “1940 Act”), as anopen-end management investment company. The Declaration of Trust permits the Board of Trustees to authorize the issuance of an unlimited number of shares of beneficial interest of the Funds. Shares of the Funds are listed for trading on the NYSE Arca, Inc. (the “NYSE Arca”) and traded on other exchanges. The following funds (individually, a “Fund” and collectively, the “Funds”) are included in this report:
Natixis Loomis Sayles Short Duration Income ETF (the “Short Duration Income ETF”)
Natixis Seeyond International Minimum Volatility ETF (the “International Minimum Volatility ETF”)
Each Fund is a diversified investment company.
The Funds issue and redeem shares on a continuous basis through ALPS Distributors, Inc. (“ALPS”). Each Fund may pay ALPS, an unaffiliated distributor, fees under a plan adopted pursuant to Rule12b-1 under the 1940 Act (the “Plan”). Currently, noRule 12b-1 fees are charged. Future payments may be made under the Plan without further shareholder approval.
Most expenses can be directly attributed to a Fund. Expenses which cannot be directly attributed to a Fund are generally apportioned based on the relative net assets of each of the funds in Natixis Funds Trust I, Natixis Funds Trust II, Natixis Funds Trust IV and Gateway Trust (“Natixis Funds Trusts”), Loomis Sayles Funds I and Loomis Sayles Funds II (“Loomis Sayles Funds Trusts”) and Natixis ETF Trust.
2. Significant Accounting Policies. The following is a summary of significant accounting policies consistently followed by each Fund in the preparation of its financial statements. The Funds’ financial statements follow the accounting and reporting guidelines provided for investment companies and are prepared in accordance with accounting principles generally accepted in the United States of America which require the use of management estimates that affect the reported amounts and disclosures in the financial statements. Actual results could differ from those estimates. Management has evaluated the events and transactions subsequent toyear-end through the date the financial statements were issued and has determined that there were no material events that would require disclosure in the Funds’ financial statements.
a. Valuation. Fund securities and other investments are valued at market value based on market quotations obtained or determined by independent pricing services recommended by the adviser or subadviser and approved by the Board of Trustees. Fund securities and other investments for which market quotations are not readily
| 32
Notes to Financial Statements (continued)
December 31, 2018
available are valued at fair value as determined in good faith by the adviser or subadviser pursuant to procedures approved by the Board of Trustees, as described below. Market value is determined as follows:
Listed equity securities (including shares ofclosed-end investment companies and exchange-traded funds) are valued at the last sale price quoted on the exchange where they are traded most extensively or, if there is no reported sale during the day, the closing bid quotation as reported by an independent pricing service. Unlisted equity securities (except unlisted preferred equity securities) are valued at the last sale price quoted in the market where they are traded most extensively or, if there is no reported sale during the day, the closing bid quotation as reported by an independent pricing service. If there is no last sale price or closing bid quotation available, unlisted equity securities will be valued using evaluated bids furnished by an independent pricing service, if available. In some foreign markets, an official close price and a last sale price may be available from the foreign exchange or market. In those cases, the official close price is used. Debt securities and unlisted preferred equity securities are valued based on evaluated bids furnished to the Funds by an independent pricing service or bid prices obtained from broker-dealers. Broker-dealer bid prices may be used to value debt and unlisted equity securities where an independent pricing service is unable to price a security or where an independent pricing service does not provide a reliable price for the security. Futures contracts are valued at the most recent settlement price on the exchange on which the adviser believes that, over time, they are traded most extensively.
Fund securities and other investments for which market quotations are not readily available are valued at fair value as determined in good faith by the adviser pursuant to procedures approved by the Board of Trustees. The Funds may also value securities and other investments at fair value in other circumstances such as when extraordinary events occur after the close of a foreign market but prior to the close of the New York Stock Exchange. This may include situations relating to a single issuer (such as a declaration of bankruptcy or a delisting of the issuer’s security from the primary market on which it has traded) as well as events affecting the securities markets in general (such as market disruptions or closings and significant fluctuations in U.S. and/or foreign markets). Fair value pricing may require subjective determinations about the value of a security, and fair values used to determine a Fund’s net asset value (“NAV”) may differ from quoted or published prices, or from prices that are used by others, for the same securities. In addition, the use of fair value pricing may not always result in adjustments to the prices of securities held by a Fund.
b. Investment Transactions and Related Investment Income. Investment transactions are accounted for on a trade date plus one day basis for daily NAV calculation. However, for financial reporting purposes, investment transactions are reported on trade date. Dividend income (including income reinvested) and foreign withholding tax,
33 |
Notes to Financial Statements (continued)
December 31, 2018
if applicable, is recorded onex-dividend date, or in the case of certain foreign securities, as soon as a Fund is notified, and interest income is recorded on an accrual basis. Interest income is increased by the accretion of discount and decreased by the amortization of premium, if applicable. Distributions received from investments in securities that represent a return of capital or capital gain are recorded as a reduction of cost of investments or as a realized gain, respectively. In determining net gain or loss on securities sold, the cost of securities has been determined on an identified cost basis.
c. Foreign Currency Translation. The books and records of the Funds are maintained in U.S. dollars. The values of securities, currencies and other assets and liabilities denominated in currencies other than U.S. dollars are translated into U.S. dollars based upon foreign exchange rates prevailing at the end of the period. Purchases and sales of investment securities, income and expenses are translated into U.S. dollars on the respective dates of such transactions.
Net realized foreign exchange gains or losses arise from sales of foreign currency, changes in exchange rates between the trade and settlement dates on securities transactions and the difference between the amounts of dividends, interest and foreign withholding taxes recorded on the Funds’ books and the U.S. dollar equivalent of the amounts actually received or paid. Net unrealized foreign exchange gains or losses arise from changes in the value of assets and liabilities, other than investment securities, as of the end of the fiscal period, resulting from changes in exchange rates. Net realized foreign exchange gains or losses and the net change in unrealized foreign exchange gains or losses are disclosed in the Statements of Operations. For federal income tax purposes, net realized foreign exchange gains or losses are characterized as ordinary income and may, if the Funds have net losses, reduce the amount of income available to be distributed by the Funds.
The values of investment securities are presented at the foreign exchange rates prevailing at the end of the period for financial reporting purposes. Net realized and unrealized gains or losses on investments reported in the Statements of Operations reflect gains or losses resulting from changes in exchange rates and fluctuations which arise due to changes in market prices of investment securities.
The Funds may use foreign currency exchange contracts to facilitate transactions in foreign-denominated investments. Losses may arise from changes in the value of the foreign currency or if the counterparties do not perform under the contracts’ terms.
d. Futures Contracts. The Funds may enter into futures contracts. Futures contracts are agreements between two parties to buy and sell a particular instrument or index for a specified price on a specified future date.
When a Fund enters into a futures contract, it is required to deposit with (or for the benefit of) its broker an amount of cash or short-term high-quality securities as “initial
| 34
Notes to Financial Statements (continued)
December 31, 2018
margin.” As the value of the contract changes, the value of the futures contract position increases or declines. Subsequent payments, known as “variation margin,” are made or received by a Fund, depending on the price fluctuations in the fair value of the contract and the value of cash or securities on deposit with the broker. The aggregate principal amounts of the contracts are not recorded in the financial statements. Fluctuations in the value of the contracts are recorded in the Statements of Assets and Liabilities as an asset (liability) and in the Statements of Operations as unrealized appreciation (depreciation) until the contracts are closed, when they are recorded as realized gains (losses). Realized gain or loss on a futures position is equal to the difference between the value of the contract at the time it was opened and the value at the time it was closed, minus brokerage commissions. When a Fund enters into a futures contract certain risks may arise, such as illiquidity in the futures market, which may limit a Fund’s ability to close out a futures contract prior to settlement date, and unanticipated movements in the value of securities or interest rates.
Futures contracts are exchange-traded. Exchange-traded futures contracts are standardized and are settled through a clearing house with fulfillment supported by the credit of the exchange. Therefore, counterparty credit risks to the Funds are reduced; however, in the event that a counterparty enters into bankruptcy, a Fund’s claim against initial/variation margin on deposit with the counterparty may be subject to terms of a final settlement in bankruptcy court.
e. New Disclosure Requirements. In accordance with new reporting requirements pursuant to RegulationS-X of the Securities and Exchange Commission, presentation of certain amounts on the Statements of Changes in Net Assets for the year ended December 31, 2017 have been conformed to the new disclosure requirements. Where the prior disclosure of Distributions to Shareholders separately stated distributions from net investment income and from net realized capital gains for each share class of the Fund, they are now combined into a single line item for each respective share class. In addition, disclosure of Distributions in Excess of Net Investment Income has been removed from the Statements of Changes in Net Assets.
The following is a summary of the previously disclosed amounts, as reported at December 31, 2017:
| | | | |
| International Minimum Volatility ETF | | | |
FROM DISTRIBUTIONS TO SHAREHOLDERS: | | | | |
Net investment income | | $ | (337,960 | ) |
Net realized capital gains | | | (702,760 | ) |
| | | | |
Total distributions | | $ | (1,040,720 | ) |
| | | | |
DISTRIBUTIONS IN EXCESS OF NET INVESTMENT INCOME | | $ | (25,461 | ) |
| | | | |
There were no distributions for Short Duration Income ETF for the period ended December 31, 2017.
35 |
Notes to Financial Statements (continued)
December 31, 2018
f. Federal and Foreign Income Taxes. The Trust treats each Fund as a separate entity for federal income tax purposes. Each Fund intends to meet the requirements of the Internal Revenue Code of 1986, as amended, applicable to regulated investment companies, and to distribute to its shareholders substantially all of its net investment income and any net realized capital gains at least annually. Management has performed an analysis of each Fund’s tax positions for the open tax years as of December 31, 2018 and has concluded that no provisions for income tax are required. The Funds’ federal tax return for the prior fiscal periods remain subject to examination by the Internal Revenue Service. Management is not aware of any events that are reasonably possible to occur in the next twelve months that would result in the amounts of any unrecognized tax benefits significantly increasing or decreasing for the Funds. However, management’s conclusions regarding tax positions taken may be subject to review and adjustment at a later date based on factors including, but not limited to, new tax laws and accounting regulations and interpretations thereof.
A Fund may be subject to foreign withholding taxes on investment income and taxes on capital gains on investments that are accrued and paid based upon the Fund’s understanding of the tax rules and regulations that exist in the countries in which the Fund invests. Foreign withholding taxes on dividend and interest income are reflected on the Statements of Operations as a reduction of investment income, net of amounts eligible to be reclaimed. Dividends and interest receivable on the Statements of Assets and Liabilities are net of foreign withholding taxes. Foreign withholding taxes where reclaims have been or will be filed are reflected on the Statements of Assets and Liabilities as tax reclaims receivable. Capital gains taxes paid are included in net realized gain (loss) on investments in the Statements of Operations. Accrued but unpaid capital gains taxes are reflected as foreign taxes payable on the Statements of Assets and Liabilities, if applicable, and reduce unrealized gains on investments. In the event that realized gains on investments are subsequently offset by realized losses, taxes paid on realized gains may be returned to a Fund. Such amounts, if applicable, are reflected as foreign tax rebates receivable on the Statements of Assets and Liabilities and are recorded as a realized gain when received.
g. Dividends and Distributions to Shareholders. Dividends and distributions are recorded onex-dividend date. The timing and characterization of certain income and capital gain distributions are determined in accordance with federal tax regulations, which may differ from accounting principles generally accepted in the United States of America. Permanent differences are primarily due to differing treatments for book and tax purposes of items such as foreign currency gains and losses, distribution redesignations, taxable over-distribution, partnership basis adjustments, paydown gains and losses, premium amortization and passive foreign investment company adjustments. Permanent book and tax basis differences relating to shareholder distributions, net investment income and net realized gains will result in reclassifications to capital accounts reported on the Statements of Assets and
| 36
Notes to Financial Statements (continued)
December 31, 2018
Liabilities. Temporary differences between book and tax distributable earnings are primarily due to deferred Trustees’ fees, futures contractmark-to-market, passive foreign investment company adjustments, premium amortization and wash sales. Amounts of income and capital gain available to be distributed on a tax basis are determined annually, and at other times during the Funds’ fiscal year as may be necessary to avoid knowingly declaring and paying a return of capital distribution. Distributions from net investment income and net realized short-term capital gains are reported as distributed from ordinary income for tax purposes.
The tax characterization of distributions is determined on an annual basis. The tax character of distributions paid to shareholders during the years ended December 31, 2018 and 2017 (period ended for Short Duration Income ETF) were as follows:
| | | | | | | | | | | | | | | | | | | | | | | | |
| | | 2018 Distributions Paid From: | | | 2017 Distributions Paid From: | |
Fund | | Ordinary Income | | | Long-Term
Capital Gains | | | Total | | | Ordinary Income | | | Long-Term
Capital Gains | | | Total | |
Short Duration Income ETF | | $ | 620,940 | | | $ | — | | | $ | 620,940 | | | $ | — | | | $ | — | | | $ | — | |
International Minimum Volatility ETF | | | 514,660 | | | | 643,280 | | | | 1,157,940 | | | | 789,280 | | | | 251,440 | | | | 1,040,720 | |
For the year ended December 31, 2017, differences between these amounts and amounts disclosed in Note 2e of the Notes to Financial Statements for the International Minimum Volatility ETF are primarily attributable to different book and tax treatment for short-term capital gains.
Distributions paid to shareholders from net investment income and net realized capital gains, based on accounting principles generally accepted in the United States of America, are consolidated and reported on the Statements of Changes in Net Assets as Distributions to Shareholders. Distributions paid to shareholders from net investment income and net realized capital gains expressed inper-share amounts, based on accounting principles generally accepted in the United States of America, are separately stated and reported within the Financial Highlights.
37 |
Notes to Financial Statements (continued)
December 31, 2018
As of December 31, 2018, the components of distributable earnings on a tax basis were as follows:
| | | | | | | | |
| | | Short
Duration
Income ETF | | | International
Minimum
Volatility ETF | |
Undistributed ordinary income | | $ | — | | | $ | 74,759 | |
Undistributed long-term capital gains | | | — | | | | 2,074 | |
| | | | | | | | |
Total undistributed earnings | | | — | | | | 76,833 | |
| | | | | | | | |
Capital loss carryforward: | |
Short-term: | |
No expiration date | | | (121,973 | ) | | | — | |
Long-term: | |
No expiration date | | | (20,556 | ) | | | — | |
| | | | | | | | |
Total capital loss carryforward | | | (142,529 | ) | | | — | |
| | | | | | | | |
Late-year ordinary and post-October capital loss deferrals* | | | — | | | | (335,603 | ) |
| | | | | | | | |
Unrealized depreciation | | | (232,107 | ) | | | (750,173 | ) |
| | | | | | | | |
Total accumulated losses | | $ | (374,636 | ) | | $ | (1,008,943 | ) |
| | | | | | | | |
| * | Under current tax law, capital losses, foreign currency losses, and losses on passive foreign investment companies and contingent payment debt instruments after October 31 or December 31, as applicable, may be deferred and treated as occurring on the first day of the following taxable year. As of December 31, 2018, International Minimum Volatility ETF is deferring capital losses. |
As of December 31, 2018, the cost of investments (including derivatives, if applicable) and unrealized appreciation (depreciation) on a federal tax basis were as follows:
| | | | | | | | |
| | | Short
Duration
Income ETF | | | International
Minimum
Volatility ETF | |
Federal tax cost | | $ | 26,873,727 | | | $ | 22,391,839 | |
| | | | | | | | |
Gross tax appreciation | | $ | 48,221 | | | $ | 479,570 | |
Gross tax depreciation | | | (280,328 | ) | | | (1,230,404 | ) |
| | | | | | | | |
Net tax depreciation | | $ | (232,107 | ) | | $ | (750,834 | ) |
| | | | | | | | |
Differences between these amounts and those reported in the components of distributable earnings are primarily attributable to foreign currencymark-to-market.
h. Repurchase Agreements. Each Fund may enter into repurchase agreements, under the terms of a Master Repurchase Agreement, under which each Fund acquires securities as collateral and agrees to resell the securities at an agreed upon time and
| 38
Notes to Financial Statements (continued)
December 31, 2018
at an agreed upon price. It is each Fund’s policy that the market value of the collateral for repurchase agreements be at least equal to 102% of the repurchase price, including interest. Certain repurchase agreements aretri-party arrangements whereby the collateral is held in a segregated account for the benefit of the Fund and on behalf of the counterparty. Repurchase agreements could involve certain risks in the event of default or insolvency of the counterparty including possible delays or restrictions upon the Fund’s ability to dispose of the underlying securities. As of December 31, 2018, International Minimum Volatility ETF had an investment in a repurchase agreement for which the value of the related collateral exceeded the value of the repurchase agreement. The gross value of repurchase agreements is included in the Statement of Assets and Liabilities for financial reporting purposes.
i. Due from Brokers. Transactions and positions in certain futures contracts are maintained and cleared by registered U.S. broker/dealers pursuant to customer agreements between a Fund and the various broker/dealers. The due from brokers balance in the Statements of Assets and Liabilities for Short Duration Income ETF represents cash pledged as initial margin for futures contracts. In certain circumstances a Fund’s use of cash and/or securities held at brokers is restricted by regulation or broker mandated limits.
j. Indemnifications. Under the Trust’s organizational documents, its officers and Trustees are indemnified against certain liabilities arising out of the performance of their duties to the Funds. Additionally, in the normal course of business, the Funds enter into contracts with service providers that contain general indemnification clauses. The Funds’ maximum exposure under these arrangements is unknown as this would involve future claims that may be made against the Funds that have not yet occurred. However, based on experience, the Funds expect the risk of loss to be remote.
k. New Accounting Pronouncement. In March 2017, the Financial Accounting Standards Board (FASB) issued Accounting Standards Update (ASU) No.2017-08, Receivables—Nonrefundable Fees and Other Costs (Subtopic310-20): Premium Amortization on Purchased Callable Debt Securities. The amendments in the ASU shorten the amortization period for certain callable debt securities acquired at a premium, to be amortized to the earliest call date. The ASU does not require an accounting change for securities acquired at a discount, which continues to be amortized to maturity. The ASU is effective for fiscal years and interim periods within those fiscal years beginning after December 15, 2018. Management is currently evaluating the impact, if any, of applying this provision.
3. Fair Value Measurements. In accordance with accounting standards related to fair value measurements and disclosures, the Funds have categorized the inputs utilized in determining the value of each Fund’s assets or liabilities. These inputs are summarized in the three broad levels listed below:
| | • | | Level 1 – quoted prices in active markets for identical assets or liabilities; |
39 |
Notes to Financial Statements (continued)
December 31, 2018
| | • | | Level 2 – prices determined using other significant inputs that are observable either directly, or indirectly through corroboration with observable market data (which could include quoted prices for similar assets or liabilities, interest rates, credit risk, etc.); and |
| | • | | Level 3 – prices determined using significant unobservable inputs when quoted prices or observable inputs are unavailable such as when there is little or no market activity for an asset or liability (unobservable inputs reflect each Fund’s own assumptions in determining the fair value of assets or liabilities and would be based on the best information available). |
The inputs or methodology used for valuing securities are not necessarily an indication of the risk associated with investing in those securities.
The following is a summary of the inputs used to value the Funds’ investments as of December 31, 2018, at value:
Short Duration Income ETF
Asset Valuation Inputs
| | | | | | | | | | | | | | | | |
Description | | Level 1 | | | Level 2 | | | Level 3 | | | Total | |
Bonds and Notes(a) | | $ | — | | | $ | 26,641,620 | | | $ | — | | | $ | 26,641,620 | |
Futures Contracts (unrealized appreciation) | | | 31,492 | | | | — | | | | — | | | | 31,492 | |
| | | | | | | | | | | | | | | | |
Total | | $ | 31,492 | | | $ | 26,641,620 | | | $ | — | | | $ | 26,673,112 | |
| | | | | | | | | | | | | | | | |
| | | | |
| Liability Valuation Inputs | | | | | | | | | | | | | | | | |
Description | | Level 1 | | | Level 2 | | | Level 3 | | | Total | |
Futures Contracts (unrealized depreciation) | | $ | (56,566 | ) | | $ | — | | | $ | — | | | $ | (56,566 | ) |
| | | | | | | | | | | | | | | | |
| (a) | Details of the major categories of the Fund’s investments are reflected within the Portfolio of Investments. |
For the year ended December 31, 2018, there were no transfers among Levels 1, 2 and 3.
International Minimum Volatility ETF
Asset Valuation Inputs
| | | | | | | | | | | | | | | | |
Description | | Level 1 | | | Level 2 | | | Level 3 | | | Total | |
Common Stocks(a) | | $ | 21,489,513 | | | $ | — | | | $ | — | | | $ | 21,489,513 | |
Short-Term Investments | | | — | | | | 151,492 | | | | — | | | | 151,492 | |
| | | | | | | | | | | | | | | | |
Total | | $ | 21,489,513 | | | $ | 151,492 | | | $ | — | | | $ | 21,641,005 | |
| | | | | | | | | | | | | | | | |
| (a) | Details of the major categories of the Fund’s investments are reflected within the Portfolio of Investments. |
| 40
Notes to Financial Statements (continued)
December 31, 2018
For the year ended December 31, 2018, there were no transfers among Levels 1, 2 and 3.
4. Derivatives. Derivative instruments are defined as financial instruments whose value and performance are based on the value and performance of an underlying asset, reference rate or index. Derivative instruments that Short Duration Income ETF used during the period include futures contracts.
The Fund is subject to the risk that changes in interest rates will affect the value of the Fund’s investments in fixed-income securities. The Fund will be subject to increased interest rate risk to the extent that it invests in fixed-income securities with longer maturities or durations, as compared to investing in fixed-income securities with shorter maturities or durations. The Fund may use futures contracts to hedge against changes in interest rates and to manage duration without having to buy or sell portfolio securities. During the year ended December 31, 2018, Short Duration Income ETF used futures contracts to manage duration and to hedge against changes in interest rates.
The following is a summary of derivative instruments for Short Duration Income ETF as of December 31, 2018, as reflected within the Statements of Assets and Liabilities:
| | | | |
Assets | | Unrealized
appreciation on
futures contracts1 | |
Exchange-traded asset derivatives | | | | |
Interest rate contracts | | $ | 31,492 | |
| | | | |
Liabilities | | Unrealized
depreciation on
futures contracts1 | |
Exchange-traded liability derivatives | | | | |
Interest rate contracts | | $ | (56,566 | ) |
| 1 | Represents cumulative unrealized appreciation (depreciation) on futures contracts. Only the current day’s variation margin on futures contracts is reported within the Statements of Assets and Liabilities as receivable or payable for variation margin, as applicable. |
Transactions in derivative instruments for Short Duration Income ETF during the year ended December 31, 2018, as reflected within the Statements of Operations, were as follows:
| | | | |
Net Realized Gain (Loss) on: | | Futures
contracts | |
Interest rate contracts | | $ | (9,184 | ) |
| | | | |
Net Change in Unrealized
Appreciation (Depreciation) on: | | Futures
contracts | |
Interest rate contracts | | $ | (25,074 | ) |
41 |
Notes to Financial Statements (continued)
December 31, 2018
As the Fund values its derivatives at fair value and recognizes changes in fair value through the Statements of Operations, it does not qualify for hedge accounting under authoritative guidance for derivative instruments. The Fund’s investments in derivatives may represent an economic hedge; however, they are considered to benon-hedge transactions for the purpose of these disclosures.
The volume of futures contract activity, as a percentage of net assets, based on grossmonth-end notional amounts outstanding during the period, including long and short positions at absolute value, was as follows for the year ended December 31, 2018:
| | | | |
Short Duration Income ETF | | Futures | |
| Average Notional Amount Outstanding | | | 29.69% | |
| Highest Notional Amount Outstanding | | | 38.54% | |
| Lowest Notional Amount Outstanding | | | 4.75% | |
| Notional Amount Outstanding as of December 31, 2018 | | | 30.91% | |
Notional amounts outstanding at the end of the prior period, if applicable, are included in the averages above.
Unrealized gain and/or loss on open futures contracts is recorded in the Statements of Assets and Liabilities. The aggregate notional values of futures contracts are not recorded in the Statements of Assets and Liabilities, and therefore are not included in the Funds’ net assets.
Counterparty risk is managed based on policies and procedures established by each Fund’s adviser. Such policies and procedures may include, but are not limited to, minimum counterparty credit rating requirements, monitoring of counterparty credit default swap spreads and posting of collateral. With exchange-traded derivatives, there is minimal counterparty credit risk to the Fund because the exchange’s clearing house, as counterparty to these instruments, stands between the buyer and the seller of the contract. Credit risk still exists in exchange-traded derivatives with respect to initial and variation margin that is held in a broker’s customer accounts. While brokers are required to segregate customer margin from their own assets, in the event that a broker becomes insolvent or goes into bankruptcy and at that time there is a shortfall in the aggregate amount of margin held by the broker for all its clients, U.S. bankruptcy laws will typically allocate that shortfall on a pro rata basis across all of the broker’s customers, potentially resulting in losses to the Fund. Based on balances reflected on each Fund’s Statement of Assets and Liabilities, the following table shows the maximum amount of loss due to credit risk that, based on the gross fair value of the financial instrument, the applicable Fund would incur if parties to the relevant financial instruments failed completely to
| 42
Notes to Financial Statements (continued)
December 31, 2018
perform according to the terms of the contracts and the collateral or other security, if any, for the amount due proved to be of no value to the Fund:
| | | | | | | | |
Fund | | Maximum Amount
of Loss - Gross | | | Maximum Amount of Loss - Net | |
Short Duration Income ETF | | $ | 25,000 | | | $ | 25,000 | |
5. Purchases and Sales of Securities. For the year ended December 31, 2018, purchases and sales of securities (excludingin-kind transactions and short-term investments and including paydowns) were as follows:
| | | | | | | | | | | | | | | | |
| | | U.S. Government/Agency
Securities | | | Other Securities | |
Fund | | Purchases | | | Sales | | | Purchases | | | Sales | |
Short Duration Income ETF | | $ | 11,099,140 | | | $ | 27,966,277 | | | $ | 35,449,861 | | | $ | 10,617,304 | |
International Minimum Volatility ETF | | | — | | | | — | | | | 26,738,167 | | | | 27,427,384 | |
For the year ended December 31, 2018,in-kind transactions were as follows:
| | | | |
Fund | | In-Kind Purchases | |
International Minimum Volatility ETF | | $ | 6,297,697 | |
6. Management Fees and Other Transactions with Affiliates.
a. Management Fees. Natixis Advisors, L.P. (“Natixis Advisors”) serves as investment adviser to each Fund. Natixis Advisors is a wholly-owned subsidiary of Natixis, which is part of Natixis Investment Managers an international asset management group based in Paris, France. Under the terms of the management agreements, each Fund pays a management fee at the following annual rates, calculated daily and payable monthly, based on each Fund’s average daily net assets:
| | | | |
Fund | | Percentage of
Average
Daily Net Assets | |
Short Duration Income ETF | | | 0.30 | % |
International Minimum Volatility ETF | | | 0.50 | % |
Natixis Advisors has entered into subadvisory agreements for each Fund as listed below.
| | |
Short Duration Income ETF | | Loomis, Sayles & Company, L.P. (“Loomis Sayles”) |
International Minimum Volatility ETF | | Ostrum Asset Management U.S., LLC (“Ostrum US”) (formerly, Natixis Asset Management U.S., LLC) |
43 |
Notes to Financial Statements (continued)
December 31, 2018
Loomis Sayles is a limited partnership whose sole general partner, Loomis, Sayles & Company, Inc., is indirectly owned by Natixis Investment Managers, L.P. which is part of Natixis Investment Managers.
Ostrum US is a subsidiary of Ostrum Asset Management, which is in turn a subsidiary of Natixis Investment Managers.
Under the terms of the subadvisory agreements, each Fund has agreed to pay its respective subadviser a subadvisory fee at the following annual rates, calculated daily and payable monthly, based on each Fund’s average daily net assets:
| | | | | | |
Fund | | Subadviser | | Percentage of
Average
Daily Net Assets | |
Short Duration Income ETF | | Loomis Sayles | | | 0.15 | % |
International Minimum Volatility ETF | | Ostrum US | | | 0.30 | % |
Payments to Natixis Advisors are reduced by the amount of payments to the subadvisers, as calculated based on above.
Natixis Advisors has given a binding undertaking to the Funds to waive management fees and/or reimburse certain expenses to limit the Funds’ operating expenses, exclusive of acquired fund fees and expenses, brokerage expenses, interest expense, taxes, organizational and extraordinary expenses such as litigation and indemnification expenses. This undertaking is in effect until April 30, 2021, may be terminated before then only with the consent of the Funds’ Board of Trustees, and is reevaluated on an annual basis. Management fees payable, as reflected on the Statements of Assets and Liabilities, is net of waivers and/or expense reimbursements, if any, pursuant to these undertakings. Waivers/reimbursements that exceed management fees payable are reflected on the Statements of Assets and Liabilities as receivable from investment adviser.
For the year ended December 31, 2018, the expense limits as a percentage of average daily net assets under the expense limitation agreements were as follows:
| | | | |
Fund | | Expense Limit
as a Percentage
of Average
Daily Net Assets | |
Short Duration Income ETF | | | 0.38 | % |
International Minimum Volatility ETF | | | 0.55 | % |
Natixis Advisors shall be permitted to recover expenses borne under the expense limitation agreements (whether through waiver of management fees or otherwise) in later periods to the extent the annual operating expenses of a Fund fall below a Fund’s expense limits, provided, however, that a Fund is not obligated to pay such waived/reimbursed fees or expenses more than one year after the end of the fiscal year in which the fees or expenses were waived/reimbursed.
| 44
Notes to Financial Statements (continued)
December 31, 2018
For the year ended December 31, 2018, the management fees and waiver of management fees for each Fund were as follows:
| | | | | | | | | | | | | | | | | | | | |
Fund | | Gross
Management
Fees | | | Contractual
Waivers of
Management
Fees1 | | | Net
Management
Fees | | | Percentage of
Average Daily
Net Assets | |
| | Gross | | | Net | |
Short Duration Income ETF | | $ | 70,568 | | | $ | 70,568 | | | $ | — | | | | 0.30 | % | | | — | % |
International Minimum Volatility ETF | | | 100,070 | | | | 100,070 | | | | — | | | | 0.50 | % | | | — | % |
| 1 | Management fee waiver is subject to possible recovery until December 31, 2019. |
For the year ended December 31, 2018, expenses have been reimbursed as follows:
| | | | |
Fund | | Reimbursements2 | |
Short Duration Income ETF | | $ | 96,491 | |
International Minimum Volatility ETF | | | 104,103 | |
| 2 | Expense reimbursement is subject to possible recovery until December 31, 2019. |
No expenses were recovered during the year ended December 31, 2018 under the terms of the expense limitation agreement.
b. Administrative Fees. Natixis Advisors provides certain administrative services for the Funds and subcontracts with State Street Bank and Trust Company (“State Street Bank”) to serve assub-administrator. Pursuant to an agreement among Natixis Funds Trusts, Loomis Sayles Funds Trusts, Natixis ETF Trust and Natixis Advisors, each Fund pays Natixis Advisors monthly itspro rata portion of fees equal to an annual rate of 0.0575% of the first $15 billion of the average daily net assets of the Natixis Funds Trusts, Loomis Sayles Funds Trusts and Natixis ETF Trust, 0.0500% of the next $15 billion, 0.0400% of the next $30 billion, 0.0275% of the next $30 billion and 0.0225% of such assets in excess of $90 billion, subject to an annual aggregate minimum fee for the Natixis Funds Trusts, Loomis Sayles Funds Trusts and Natixis ETF Trust of $10 million, which is reevaluated on an annual basis.
Prior to July 1, 2018, each Fund paid Natixis Advisors monthly itspro rata portion of fees equal to an annual rate of 0.0575% of the first $15 billion of the average daily net assets of the Natixis Funds Trusts, Loomis Sayles Funds Trusts and Natixis ETF Trust, 0.0500% of the next $15 billion, 0.0400% of the next $30 billion, 0.0350% of the next $30 billion and 0.0325% of such assets in excess of $90 billion, subject to an annual aggregate minimum fee for the Natixis Funds Trusts, Loomis Sayles Funds Trusts and Natixis ETF Trust of $10 million, which was reevaluated on an annual basis.
45 |
Notes to Financial Statements (continued)
December 31, 2018
Effective October 1, 2018, State Street Bank agreed to reduce the fees it receives from Natixis Advisors for serving assub-administrator to the Funds. Also, effective October 1, 2018, Natixis Advisors agreed to voluntarily waive fees paid by the Funds in an amount equal to the reduction insub-administrative fees discussed above. The waiver is in effect through June 30, 2019, at which time it will be reevaluated as part of the annual review of the administrative fee contract, as noted above.
For the year ended December 31, 2018, the administrative fees for each Fund were as follows:
| | | | | | | | | | | | |
Fund | | Gross
Administrative
Fees | | | Waiver of
Administrative
Fees | | | Net
Administrative
Fees | |
Short Duration Income ETF | | $ | 10,327 | | | $ | 66 | | | $ | 10,261 | |
International Minimum Volatility ETF | | | 8,783 | | | | 53 | | | | 8,730 | |
c. Trustees Fees and Expenses. The Trust does not pay any compensation directly to its officers or Trustees who are directors, officers or employees of Natixis Advisors, Natixis Distribution, Natixis or their affiliates. The Chairperson of the Board of Trustees receives a retainer fee at the annual rate of $340,000. The Chairperson does not receive any meeting attendance fees for Board of Trustees meetings or committee meetings that he attends. Each Independent Trustee (other than the Chairperson) receives, in the aggregate, a retainer fee at the annual rate of $170,000. Each Independent Trustee also receives a meeting attendance fee of $10,000 for each meeting of the Board of Trustees that he or she attends in person and $5,000 for each meeting of the Board of Trustees that he or she attends telephonically. In addition, the chairperson of the Contract Review Committee and the chairperson of the Audit Committee each receive an additional retainer fee at the annual rate of $20,000. The chairperson of the Governance Committee receives an additional retainer fee at the annual rate of $12,000. Each Contract Review Committee member is compensated $6,000 for each Committee meeting that he or she attends in person and $3,000 for each meeting that he or she attends telephonically. Each Audit Committee member is compensated $6,000 for each Committee meeting that he or she attends in person and $3,000 for each meeting that he or she attends telephonically. These fees are allocated among the funds in the Natixis Funds Trusts, Loomis Sayles Funds Trusts and Natixis ETF Trust based on a formula that takes into account, among other factors, the relative net assets of each fund. Trustees are reimbursed for travel expenses in connection with attendance at meetings.
Effective January 1, 2019, the Chairperson of the Board will receive a retainer fee at the annual rate of $360,000, each Independent Trustee (other than the Chairperson) will receive, in the aggregate, a retainer fee at the annual rate of $190,000, and the chairperson of the Governance Committee will receive an additional retainer fee at the annual rate of $15,000. All other Trustee fees will remain unchanged.
| 46
Notes to Financial Statements (continued)
December 31, 2018
A deferred compensation plan (the “Plan”) is available to the Trustees on a voluntary basis. Deferred amounts remain in the Funds until distributed in accordance with the provisions of the Plan. The value of a participating Trustee’s deferral account is based on theoretical investments of deferred amounts, on the normal payment dates, in certain funds of the Natixis Funds Trusts, Loomis Sayles Funds Trusts and Natixis ETF Trust as designated by the participating Trustees. Changes in the value of participants’ deferral accounts are allocatedpro rataamong the funds in the Natixis Funds Trusts, Loomis Sayles Funds Trusts and Natixis ETF Trust, and are normally reflected as Trustees’ fees and expenses in the Statements of Operations. The portions of the accrued obligations allocated to the Funds under the Plan are reflected as Deferred Trustees’ fees in the Statements of Assets and Liabilities.
Certain officers and employees of Natixis Advisors and Loomis Sayles are also officers and/or Trustees of the Trusts.
d. Affiliated Ownership. As of December 31, 2018, Natixis held shares of the Short Duration Income ETF and International Minimum Volatility ETF representing 74.49% and 50.92%, respectively, of the Funds’ net assets.
Investment activities of affiliated shareholders could have material impacts on the Funds.
7. Line of Credit. Effective April 12, 2018, each Fund, together with certain other funds of Natixis Funds Trusts, Loomis Sayles Funds Trusts and Natixis ETF Trust, entered into a $400,000,000 committed unsecured line of credit provided by State Street Bank. Any one Fund may borrow up to $350,000,000 under the line of credit agreement (as long as all borrowings by all Funds in the aggregate do not exceed the $400,000,000 limit at any time), subject to each Fund’s investment restrictions and its contractual obligations under the line of credit. Interest is charged to the Funds based upon the terms set forth in the agreement. In addition, a commitment fee of 0.15% per annum, payable at the end of each calendar quarter, is accrued and apportioned among the participating funds based on their average daily unused portion of the line of credit. The Funds paid an arrangement fee, an upfront fee, and other fees in connection with the new line of credit agreement, which are being amortized over a period of 364 days and are reflected as miscellaneous expenses on the Statements of Operations. The unamortized balance is reflected as prepaid expenses on the Statements of Assets and Liabilities.
For the year ended December 31, 2018, neither Fund had borrowings under this agreement.
8. Risk. The Funds have exposure to certain types of risk as summarized below.
a. Authorized Participant Concentration Risk. Only an authorized participant (“Authorized Participant”) may engage in creation or redemption transactions directly with the Funds. The Funds have a limited number of institutions that act as Authorized
47 |
Notes to Financial Statements (continued)
December 31, 2018
Participants, none of which are or will be obligated to engage in creation or redemption transactions. To the extent that these institutions exit the business or are unable to proceed with creation and/or redemption orders with respect to the Funds and no other Authorized Participant is able to step forward to create or redeem Creation Units, Fund shares may trade at a discount to NAV and possibly face trading halts and/or delisting.
b. Foreign Securities Risk. Investments in foreign securities may be subject to greater political, economic, environmental, credit and information risks. The Funds’ investments in foreign securities also are subject to foreign currency fluctuations and other foreign currency-related risks. Foreign securities may be subject to higher volatility than U.S. securities, varying degrees of regulation and limited liquidity. Foreign securities held by the Funds may trade on foreign exchanges that are closed when the securities exchange on which the Funds’ shares trade is open, which may result in deviations between the current price of a foreign security and the last quoted price for that security (i.e., the Funds’ quote from the closed foreign market). This could result in premiums or discounts to NAV that may be greater than those experienced by other ETFs.
c. Premium/Discount Risk. Shares of the Funds are listed for trading on the NYSE Arca and are bought and sold in the secondary market at market prices that may differ from their most recent NAV. The market value of the Funds’ shares will fluctuate, in some cases materially, in response to changes in the Funds’ NAV, the intraday value of the Funds’ holdings, and the relative supply and demand for the Funds’ shares on the exchange. Disruptions to creations and redemptions, the existence of extreme market volatility or potential lack of an active trading market for shares may result in shares trading at a significant premium or discount to NAV and/or in a reduced liquidity of your investment. If a shareholder purchases shares at a time when the market price is at a premium to the NAV or sells shares at a time when the market price is at a discount to the NAV, the shareholder may sustain losses.
d. Secondary Market Trading Risk. Investors buying or selling shares of the Funds in the secondary market will pay brokerage commissions or other charges imposed by broker-dealers as determined by that broker. Brokerage commissions are often a fixed amount and may be a significant proportional cost for investors seeking to buy or sell relatively small amounts of shares.
e. Trading Issues Risk. Trading in shares on the NYSE Arca may be halted in certain circumstances. There can be no assurance that the requirements of the NYSE Arca necessary to maintain the listing of the Funds will continue to be met.
9. Capital Shares. Shares of the Funds may be acquired or redeemed directly from the Funds by Authorized Participants only in aggregations of 100,000 shares for Short Duration Income ETF and 50,000 shares for International Minimum Volatility ETF (“Creation Units”), or multiples thereof. Each Authorized Participant enters into an Authorized Participant agreement with the Funds’ Distributor.
| 48
Notes to Financial Statements (continued)
December 31, 2018
A creation transaction order, which is subject to acceptance by ALPS, generally takes place when an Authorized Participant deposits into the Funds a designated portfolio of securities and/or cash (including any portion of such securities for which cash may be substituted) and a specified amount of cash approximating the holdings of the Funds in exchange for a specified number of Creation Units.
Similarly, shares can be redeemed only in Creation Units, generally for a designated portfolio of securities and/or cash (including any portion of such securities for which cash may be substituted) held by the Funds and a specified amount of cash. Except when aggregated in Creation Units, shares are not redeemable directly with the Funds.
The prices at which creations and redemptions occur are based on the next calculation of NAV after a creation or redemption order is received in an acceptable form under the Authorized Participant agreement. These prices may differ from the market price of the Fund’s shares.
The Funds may impose a creation transaction fee and a redemption transaction fee to offset transfer and other transaction costs associated with the issuance and redemption of Creation Units. Transaction fees are included in capital share transactions on the Statements of Changes in Net Assets.
Transactions in capital shares were as follows:
| | | | | | | | | | | | | | | | |
| |
| Year Ended
December 31, 2018 |
| |
| Period Ended
December 31, 2017(a) |
|
Short Duration Income ETF | | | Shares | | | | Amount | | | | Shares | | | | Amount | |
Issued from the sale of shares | | | 300,000 | | | $ | 7,452,078 | | | | 800,000 | | | $ | 20,010,762 | |
| | | | | | | | | | | | | | | | |
Increase (decrease) from capital share transactions | | | 300,000 | | | $ | 7,452,078 | | | | 800,000 | | | $ | 20,010,762 | |
| | | | | | | | | | | | | | | | |
| (a) | From commencement of operations on December 27, 2017 through December 31, 2017. |
| | | | | | | | | | | | | | | | |
| |
| Year Ended
December 31, 2018 |
| |
| Year Ended
December 31, 2017 |
|
International Minimum Volatility ETF | | | Shares | | | | Amount | | | | Shares | | | | Amount | |
Issued from the sale of shares | | | 150,000 | | | $ | 6,445,786 | | | | 50,000 | | | $ | 2,294,815 | |
| | | | | | | | | | | | | | | | |
Increase (decrease) from capital share transactions | | | 150,000 | | | $ | 6,445,786 | | | | 50,000 | | | $ | 2,294,815 | |
| | | | | | | | | | | | | | | | |
49 |
Report of Independent Registered Public
Accounting Firm
To the Board of Trustees of Natixis ETF Trust and Shareholders of Natixis Loomis Sayles Short Duration Income ETF and Natixis Seeyond International Minimum Volatility ETF
Opinions on the Financial Statements
We have audited the accompanying statements of assets and liabilities, including the portfolios of investments, of each of the funds indicated in the table below (constituting Natixis ETF Trust, hereafter collectively referred to as the “Funds”) as of December 31, 2018, the related statements of operations and of changes in net assets for each of the periods indicated in the table below, including the related notes, and the financial highlights for each of the periods indicated in the table below (collectively referred to as the “financial statements”). In our opinion, the financial statements present fairly, in all material respects, the financial position of each of the Funds as of December 31, 2018, the results of each of their operations, the changes in each of their net assets, and each of the financial highlights for each of the periods indicated in the table below, in conformity with accounting principles generally accepted in the United States of America.
| | | | | | |
Fund | | Statement of
operations | | Statement of changes
in net assets | | Financial
highlights |
Natixis Loomis Sayles Short Duration Income ETF | | For the year ended December 31, 2018 | | For the year ended December 31, 2018 and the period from December 27, 2017 (commencement of operations) through December 31, 2017 | | For the year ended December 31, 2018 and the period from December 27, 2017 (commencement of operations) through December 31, 2017 |
Natixis Seeyond International Minimum Volatility ETF | | For the year ended December 31, 2018 | | For the years ended December 31, 2018 and 2017 | | For the years ended December 31, 2018 and 2017, and the period from October 25, 2016 (commencement of operations) through December 31, 2016 |
| 50
Report of Independent Registered Public
Accounting Firm
Basis for Opinions
These financial statements are the responsibility of the Funds’ management. Our responsibility is to express an opinion on the Funds’ financial statements based on our audits. We are a public accounting firm registered with the Public Company Accounting Oversight Board (United States) (PCAOB) and are required to be independent with respect to the Funds in accordance with the U.S. federal securities laws and the applicable rules and regulations of the Securities and Exchange Commission and the PCAOB.
We conducted our audits of these financial statements in accordance with the standards of the PCAOB. Those standards require that we plan and perform the audit to obtain reasonable assurance about whether the financial statements are free of material misstatement, whether due to error or fraud.
Our audits included performing procedures to assess the risks of material misstatement of the financial statements, whether due to error or fraud, and performing procedures that respond to those risks. Such procedures included examining, on a test basis, evidence regarding the amounts and disclosures in the financial statements. Our audits also included evaluating the accounting principles used and significant estimates made by management, as well as evaluating the overall presentation of the financial statements. Our procedures included confirmation of securities owned as of December 31, 2018 by correspondence with the custodian and brokers; when replies were not received from brokers, we performed other auditing procedures. We believe that our audits provide a reasonable basis for our opinions.
/s/ PricewaterhouseCoopers LLP
Boston, Massachusetts
February 21, 2019
We have served as the auditor of one or more of the investment companies in the Natixis Investment Company Complex since at least 1995. We have not been able to determine the specific year we began serving as auditor.
51 |
2018 U.S. Tax Distribution Information to Shareholders (Unaudited)
Capital Gains Distributions. Pursuant to Internal Revenue Section 852(b), the following Funds paid distributions, which have been designated as capital gains distributions for the fiscal year ended December 31, 2018.
| | | | |
Fund | | Amount | |
International Minimum Volatility ETF | | $ | 643,280 | |
Qualified Dividend Income. A percentage of dividends distributed by the Funds during the fiscal year ended December 31, 2018 are considered qualified dividend income, and are eligible for reduced tax rates. These lower rates range from 0% to 20% depending on an individual’s tax bracket. These percentages are noted below:
| | | | |
Fund | | Qualifying
Percentage | |
International Minimum Volatility ETF | | | 84.24 | % |
Foreign Tax Credit. For the year ended December 31, 2018, the Fund intends to pass through foreign tax credits and have derived gross income from sources within foreign countries amounting to:
| | | | | | | | |
Fund | | Foreign Tax
Credit Pass-Through | | | Foreign Source
Income | |
International Minimum Volatility ETF | | $ | 63,107 | | | $ | 642,033 | |
| 52
Other Information
Premium/Discount Analysis (Unaudited)
Fund shares are bought and sold on the secondary market at current market prices. Premium/discount represents the difference between the market price (midpoint between the highest bid and lowest offer on the primary listing exchange) and net asset value (“NAV”) of Fund shares determined as of the close of the NYSE.
Premium/discount will fluctuate regularly based on the supply of, and demand for, shares of the Fund. Shareholders may pay more than NAV when they buy Fund shares and receive less than NAV when they sell shares.
The following information presents the frequency of distributions of premiums and discounts for the Funds, as stated in trading days. Trading days are presented by year, starting with the date the Fund began trading on the secondary market. Premium/discount ranges with no trading days are omitted.
The frequency distribution of premiums and discounts, for the International Minimum Volatility ETF, for the period from October 27, 2016 through December 31, 2018 is as follows:
| | | | | | | | | | | | |
| | | Number of Days | |
Premium/Discount Range | | 2018 | | | 2017 | | | 2016 | |
Greater than 2.0% and Less than 2.5% | | | 1 | | | | — | | | | — | |
Greater than 1.5% and Less than 2.0% | | | 2 | | | | — | | | | — | |
Greater than 1.0% and Less than 1.5% | | | 8 | | | | — | | | | 1 | |
Greater than 0.5% and Less than 1.0% | | | 92 | | | | 8 | | | | 1 | |
Greater than 0.0% and Less than 0.5% | | | 119 | | | | 157 | | | | 34 | |
At NAV | | | 1 | | | | 11 | | | | 2 | |
Less than 0.0% and Greater than-0.5% | | | 18 | | | | 71 | | | | 7 | |
Less than-0.5% and Greater than-1.0% | | | 8 | | | | 4 | | | | — | |
Less than-1.0% and Greater than-1.5% | | | 1 | | | | — | | | | — | |
Less than-1.5% and Greater than-2.0% | | | 1 | | | | — | | | | — | |
The frequency distribution of premiums and discounts, for the Short Duration Income ETF, for the period from December 28, 2017 through December 31, 2018 is as follows:
| | | | | | | | |
| | | Number of Days | |
Premium/Discount Range | | 2018 | | | 2017 | |
Greater than 0.5% and Less than 1.0% | | | 1 | | | | — | |
Greater than 0.0% and Less than 0.5% | | | 221 | | | | 1 | |
At NAV | | | 15 | | | | 1 | |
Less than 0.0% and Greater than-0.5% | | | 14 | | | | — | |
Data shown represents past performance and is no guarantee of, and not necessarily indicative of, future results.
Information regarding premium/discount history on a daily basis is available from the Natixis Funds’ website.
53 |
Trustee and Officer Information
The tables below provide certain information regarding the trustees and officers of Natixis ETF Trust (the “Trust”). Unless otherwise indicated, the address of all persons below is 888 Boylston Street, Suite 800, Boston, MA 02199-8197. The Funds’ Statements of Additional Information include additional information about the trustees of the Trust and are available by calling Natixis ETFs at800-458-7452.
| | | | | | | | |
Name and Year of
Birth | | Position(s) Held
with the Trust,
Length of Time
Served and Term
of Office1 | | Principal
Occupation(s)
During Past
5 Years | | Number of
Portfolios in
Fund Complex
Overseen2
and Other
Directorships Held
During Past
5 Years | | Experience,
Qualifications,
Attributes, Skills
for Board
Membership |
| | | |
| INDEPENDENT TRUSTEES | | | | | | |
| | | | |
Kenneth A. Drucker (1945) | | Chairperson of the Board of Trustees since January 2017 Trustee since 2016 Ex Officio member of Audit Committee, Contract Review Committee and Governance Committee | | Retired | | 52 None | | Significant experience on the Board and on the boards of other business organizations (including at investment companies); executive experience (including as treasurer of an aerospace, automotive, and metal manufacturing corporation) |
| | | | |
Edmond J. English
(1953) | | Trustee since 2016 Audit Committee Member and Governance Committee Member | | Executive Chairman; formerly, Chief Executive Officer of Bob’s Discount Furniture (retail) | | 52 Director, Burlington Stores, Inc. (retail) | | Significant experience on the Board and significant experience on the boards of other business organizations (including retail companies and a bank); executive experience (including at a retail company) |
| 54
Trustee and Officer Information
| | | | | | | | |
Name and Year of
Birth | | Position(s) Held
with the Trust,
Length of Time
Served and Term
of Office1 | | Principal
Occupation(s)
During Past
5 Years | | Number of
Portfolios in
Fund Complex
Overseen2
and Other
Directorships Held
During Past
5 Years | | Experience,
Qualifications,
Attributes, Skills
for Board
Membership |
| | | |
INDEPENDENT TRUSTEES continued | | | | | | |
| | | | |
Richard A. Goglia (1951) | | Trustee since 2016 Audit Committee Member | | Retired; formerly Vice President and Treasurer of Raytheon Company (defense) | | 52 None | | Experience on the Board and executive experience (including his role as vice president and treasurer of a defense company and experience at a financial services company) |
| | | | |
Wendell J. Knox (1948) | | Trustee since 2016 Contract Review Committee Member and Governance Committee Member | | Director of Abt Associates Inc. (research and consulting) | | 52 Director, The Hanover Insurance Group (property and casualty insurance); formerly, Director, Eastern Bank (bank) | | Significant experience on the Board and on the boards of other business organizations (including at a bank and at a property and casualty insurance firm); executive experience (including roles as president and chief executive officer of a research and consulting company) |
55 |
Trustee and Officer Information
| | | | | | | | |
Name and Year of
Birth | | Position(s) Held
with the Trust,
Length of Time
Served and Term
of Office1 | | Principal
Occupation(s)
During Past
5 Years | | Number of
Portfolios in
Fund Complex
Overseen2
and Other
Directorships Held
During Past
5 Years | | Experience,
Qualifications,
Attributes, Skills
for Board
Membership |
| | | |
INDEPENDENT TRUSTEES continued | | | | | | |
| | | | |
Martin T. Meehan
(1956) | | Trustee since 2016 Audit Committee Member | | President, University of Massachusetts; formerly, Chancellor and faculty member, University of Massachusetts Lowell | | 52 None | | Significant experience on the Board and on the boards of other business organizations; experience as President of the University of Massachusetts; government experience (including as a member of the U.S. House of Representatives); academic experience |
| | | | |
Maureen B. Mitchell (1951) | | Trustee since 2017 Contract Review Committee Member | | Retired; formerly President, Global Sales and Marketing, GE Asset Management, Inc. (financial services) | | 52 Director, Sterling Bancorp (Bank) | | Experience on the Board and on the boards of other business organizations; financial services industry and executive experience (including role as president of global sales and marketing at a financial services company) |
| 56
Trustee and Officer Information
| | | | | | | | |
Name and Year of
Birth | | Position(s) Held
with the Trust,
Length of Time
Served and Term
of Office1 | | Principal
Occupation(s)
During Past
5 Years | | Number of
Portfolios in
Fund Complex
Overseen2
and Other
Directorships Held
During Past
5 Years | | Experience,
Qualifications,
Attributes, Skills
for Board
Membership |
| | | |
INDEPENDENT TRUSTEES continued | | | | | | |
| | | | |
James P. Palermo (1955) | | Trustee since 2016 Contract Review Committee Member | | Founding Partner, Breton Capital Management, LLC (private equity); Partner, STEP Partners, LLC (private equity); formerly, Chief Executive Officer of Global Client Management of The Bank of New York Mellon Corporation | | 52 Director, FutureFuel Corp. (Chemicals and Biofuels) | | Experience on the Board and on the boards of other business organizations; financial services industry and executive experience (including roles as chief executive officer of client management and asset servicing for a banking and financial services company) |
| | | | |
Erik R. Sirri (1958) | | Trustee since 2016 Chairperson of the Audit Committee | | Professor of Finance at Babson College | | 52 None | | Significant experience on the Board; experience as Director of the Division of Trading and Markets at the Securities and Exchange Commission; academic experience; training as an economist |
57 |
Trustee and Officer Information
| | | | | | | | |
Name and Year of
Birth | | Position(s) Held
with the Trust,
Length of Time
Served and Term
of Office1 | | Principal
Occupation(s)
During Past
5 Years | | Number of
Portfolios in
Fund Complex
Overseen2
and Other
Directorships Held
During Past
5 Years | | Experience,
Qualifications,
Attributes, Skills
for Board
Membership |
| | | |
INDEPENDENT TRUSTEES continued | | | | | | |
| | | | |
Peter J. Smail (1952) | | Trustee since 2016 Chairperson of the Contract Review Committee and Governance Committee Member | | Retired | | 52 None | | Significant experience on the Board; mutual fund industry and executive experience (including roles as president and chief executive officer for an investment adviser) |
| | | | |
Cynthia L. Walker (1956) | | Trustee since 2016 Chairperson of the Governance Committee and Audit Committee Member | | Deputy Dean for Finance and Administration, Yale University School of Medicine | | 52 None | | Significant experience on the Board; executive experience in a variety of academic organizations (including roles as dean for finance and administration) |
| | | |
| INTERESTED TRUSTEES | | | | | | |
| | | | |
Kevin P. Charleston3 (1965) One Financial Center Boston, MA 02111 | | Trustee since 2016 | | President, Chief Executive Officer and Chairman of the Board of Directors; formerly, Chief Financial Officer, Loomis, Sayles & Company, L.P. | | 52 None | | Experience on the Board; continuing service as President, Chief Executive Officer and Chairman of the Board of Directors of Loomis, Sayles & Company, L.P. |
| 58
Trustee and Officer Information
| | | | | | | | |
Name and Year of
Birth | | Position(s) Held
with the Trust,
Length of Time
Served and Term
of Office1 | | Principal
Occupation(s)
During Past
5 Years | | Number of
Portfolios in
Fund Complex
Overseen2
and Other
Directorships Held
During Past
5 Years | | Experience,
Qualifications,
Attributes, Skills
for Board
Membership |
| | | |
INTERESTED TRUSTEES continued | | | | | | |
| | | | |
David L. Giunta4
(1965) | | Trustee since 2015 President and Chief Executive Officer of since 2011 | | President and Chief Executive Officer, Natixis Advisors, L.P., Natixis Distribution, L.P., Natixis Distribution Corporation and Chairman of the Board of Natixis Distribution Corporation | | 52 None | | Significant experience on the Board; experience as President and Chief Executive Officer, Natixis Advisors, L.P., Natixis Distribution, L.P., Natixis Distribution Corporation and Chairman of the Board of Natixis Distribution Corporation |
| 1 | Each trustee serves until retirement, resignation or removal from the Board. The current retirement age is 75. The position of Chairperson of the Board is appointed for a three-year term. |
| 2 | The trustees of the Trust serve as trustees of a fund complex that includes all series of the Natixis Funds Trust I, Natixis Funds Trust II, Natixis Funds Trust IV, Gateway Trust, Loomis Sayles Funds I, Loomis Sayles Funds II and Natixis ETF Trust (collectively, the “Fund Complex”). |
| 3 | Mr. Charleston is deemed an “interested person” of the Trust because he holds the following positions with an affiliated person of the Trust: President, Chief Executive Officer and Chairman of the Board of Directors of Loomis, Sayles & Company, L.P. |
| 4 | Mr. Giunta is deemed an “interested person” of the Trust because he holds the following positions with an affiliated person of the Trust: President and Chief Executive Officer, Natixis Advisors, L.P., Natixis Distribution, L.P., Natixis Distribution Corporation and Chairman of the Board of Natixis Distribution Corporation. |
59 |
Trustee and Officer Information
| | | | | | |
Name and Year of Birth | | Position(s) Held with the Trust | | Term of Office1 and
Length of Time Served | | Principal Occupation(s)
During Past 5 Years2 |
|
| OFFICERS OF THE TRUST |
| | | |
Russell L. Kane (1969) | | Secretary, Clerk and Chief Legal Officer | | Since 2016 | | Executive Vice President, General Counsel, Secretary and Clerk, Natixis Distribution Corporation, Natixis Advisors, L.P. and Natixis Distribution, L.P.; formerly, Chief Compliance Officer for Mutual Funds, Senior Vice President, Deputy General Counsel, Assistant Secretary and Assistant Clerk, Natixis Distribution Corporation, Natixis Advisors, L.P. and Natixis Distribution, L.P. |
| | | |
Michael C. Kardok (1959) | | Treasurer, Principal Financial and Accounting Officer | | Since 2011 | | Senior Vice President, Natixis Advisors, L.P. and Natixis Distribution, L.P. |
| | | |
Kirk D. Johnson (1981) | | Chief Compliance Officer, Assistant Secretary and Anti-Money Laundering Officer | | Since 2018 | | Senior Vice President, Deputy General Counsel, Assistant Secretary and Assistant Clerk, Natixis Distribution Corporation, Natixis Advisors, L.P. and Natixis Distribution, L.P.; formerly, Vice President and Counsel, Natixis Investment Managers, L.P. |
| 1 | Each officer of the Trust serves for an indefinite term in accordance with the Trust’s currentby-laws until the date his or her successor is elected and qualified, or until he or she sooner dies, retires, is removed or becomes disqualified. |
| 2 | Each person listed above, except as noted, holds the same position(s) with the Fund Complex. Previous positions during the past five years with Natixis Distribution, L.P., Natixis Advisors, L.P. or Loomis, Sayles & Company, L.P. are omitted, if not materially different from an officer’s current position with such entity. |
| 60
Item 2. Code of Ethics.
The Registrant has adopted a code of ethics that applies to the Registrant’s principal executive officer, principal financial officer and persons performing similar functions. There have been no amendments or waivers of the Registrant’s code of ethics during the period.
Item 3. Audit Committee Financial Expert.
The Board of Trustees of the Registrant has established an audit committee. Mr. Edmond J. English, Mr. Richard A. Goglia, Mr. Martin T. Meehan, Mr. Erik R. Sirri and Ms. Cynthia L. Walker are members of the audit committee and have been designated as “audit committee financial experts” by the Board of Trustees. Each of these individuals is also an Independent Trustee of the Registrant.
Item 4. Principal Accountant Fees and Services.
Fees billed by the Principal Accountant for services rendered to the Registrant.
The table below sets forth fees billed by the principal accountant, PricewaterhouseCoopers LLP, for the past two fiscal years for professional services rendered in connection with a) the audit of the Registrant’s annual financial statements and services provided in connection with regulatory filings; b) audit-related services (including services that are reasonably related to the performance of the audit of the Registrant’s financial statements but not reported under “Audit Fees”); c) tax compliance, tax advice and tax planning and d) all other fees billed for professional services rendered by the principal accountant to the Registrant, other than the services provided as reported as a part of (a) through (c) of this Item.
| | | | | | | | | | | | | | | | | | | | | | | | | | | | | | | | |
| | | Audit fees | | | Audit-related
fees1 | | | Tax fees2 | | | All other fees | |
| | | 1/1/17-
12/31/17 | | | 1/1/18-
12/31/18 | | | 1/1/17-
12/31/17 | | | 1/1/18-
12/31/18 | | | 1/1/17-
12/31/17 | | | 1/1/18-
12/31/18 | | | 1/1/17-
12/31/17 | | | 1/1/18-
12/31/18 | |
Natixis ETF Trust | | $ | 48,547 | | | $ | 69,106 | | | $ | 3 | | | $ | 7 | | | $ | 8,795 | | | $ | 16,251 | | | $ | — | | | $ | — | |
| | 1. | Audit-related fees consist of: |
2017 & 2018 – performance of agreed-upon procedures related to the Registrant’s deferred compensation.
2017 & 2018 – review of Registrant’s tax returns
Aggregate fees billed to the Registrant fornon-audit services during 2017 and 2018 were $8,798 and $16,258 respectively.
Fees billed by the Principal Accountant for services rendered to the Adviser and Control Affiliates.
The following table sets forth the fees billed by the Registrant’s principal accountant fornon-audit services rendered to Natixis Advisors, L.P.(“Natixis, Advisors”) and entities controlling, controlled by or under common control with Natixis Advisors. (“Control Affiliates”) that provide ongoing services to the Registrant, for engagements that related directly to the operations and financial reporting of the Registrant for the last two fiscal years.
| | | | | | | | | | | | | | | | | | | | | | | | |
| | | Audit-related fees | | | Tax fees | | | All other fees | |
| | | 1/1/17-
12/31/17 | | | 1/1/18-
12/31/18 | | | 1/1/17-
12/31/17 | | | 1/1/18-
12/31/18 | | | 1/1/17-
12/31/17 | | | 1/1/18-
12/31/18 | |
Control Affiliates | | $ | — | | | $ | — | | | $ | — | | | $ | — | | | $ | — | | | $ | — | |
The following table sets forth the aggregate fees billed by the Registrant’s principal accountant fornon-audit services rendered to Natixis Advisors, and Control Affiliates that provide ongoing services to the Registrant, for the last two fiscal years, including the fees disclosed in the table above.
| | | | | | | | |
| | | Aggregate Non-Audit Fees | |
| | | 1/1/17-
12/31/17 | | | 1/1/18-
12/31/18 | |
Control Affiliates | | $ | 0 | | | $ | 51,815 | |
None of the services described above were approved pursuant to (c)(7)(i)(C) of RegulationS-X.
Audit Committee Pre Approval Policies.
Annually, the Registrant’s Audit Committee reviews the audit, audit-related, tax and othernon-audit services together with the projected fees, for services proposed to be rendered to the Trust and/or other entities for whichpre-approval is required during the upcoming year. Any subsequent revisions to alreadypre-approved services or fees (including fee increases) and requests forpre-approval of new services would be presented for consideration quarterly as needed.
If, in the opinion of management, a proposed engagement by the Registrant’s independent accountants needs to commence before the next regularly scheduled Audit Committee meeting, any member of the Audit Committee who is an independent Board member is authorized topre-approve the engagement, but only for engagements to provide audit, audit related and tax services. This approval is subject to review of the full Audit Committee at its next quarterly meeting. All other engagements require the approval of all the members of the Audit Committee.
Item 5. Audit Committee of Listed Registrants.
This registrant has a separately designated standing audit committee comprised of independent Trustees. Mr. Edmond J. English, Mr. Richard A. Goglia, Mr. Martin T. Meehan, Mr. Erik R. Sirri and Ms. Cynthia L. Walker are members of the audit committee.
Item 6. Schedule of Investments.
Included as part of the Report to Shareholders filed as Item 1 herewith.
Item 7. Disclosure of Proxy Voting Policies and Procedures forClosed-End Management Investment Companies.
Not applicable.
Item 8. Portfolio Managers ofClosed-End Management Investment Companies.
Not applicable.
Item 9. Purchases of Equity Securities byClosed-End Management Investment Companies and Affiliated Purchasers.
Not applicable.
Item 10. Submission of Matters to a Vote of Securities Holders.
There were no material changes to the procedures by which shareholders may recommend nominees to the Registrant’s Board of Trustees.
Item 11. Controls and Procedures.
The Registrant’s principal executive officer and principal financial officer have concluded that the Registrant’s disclosure controls and procedures are sufficient to ensure that information required to be disclosed by the Registrant in this FormN-CSR was recorded, processed, summarized and reported within the time periods specified in the Securities and Exchange Commission’s rules and forms, based upon such officers’ evaluation of these controls and procedures as of a date within 90 days of the filing date of the report.
There were no changes in the Registrant’s internal control over financial reporting that occurred during the Registrant’s last fiscal quarter of the period covered by the report that has materially affected, or is reasonably likely to materially affect, the Registrant’s internal control over financial reporting.
Item 12. Disclosure of Securities Lending Activities forClosed-End Management Investment Companies.
Not applicable.
Item 13. Exhibits.
| | (a) | (1) Code of Ethics required by Item 2 hereof, filed herewith as Exhibit (a)(1). |
| | (a) | (2) Certifications of Principal Executive Officer and Principal Financial Officer pursuant to Rule30a-2(a) under the Investment Company Act of 1940 [17 CFR270.30a-2(a)], filed herewith as Exhibits (a)(2)(1)and (a)(2)(2), respectively. |
| | (b) | Certifications of Principal Executive Officer and Principal Financial Officer pursuant to Section 906 of Sarbanes-Oxley Act of 2002 filed herewith as Exhibit (b). |
SIGNATURES
Pursuant to the requirements of the Securities Exchange Act of 1934 and the Investment Company Act of 1940, the Registrant has duly caused this report to be signed on its behalf by the undersigned, thereunto duly authorized.
| | |
Natixis ETF Trust |
| |
By: | | /s/ David L. Giunta |
| | |
Name: | | David L. Giunta |
Title: | | President and Chief Executive Officer |
Date: | | February 21, 2019 |
Pursuant to the requirements of the Securities Exchange Act of 1934 and the Investment Company Act of 1940, this report has been signed by the following persons on behalf of the Registrant and in the capacities and on the dates indicated.
| | |
Name: | | David L. Giunta |
Title: | | President and Chief Executive Officer |
Date: | | February 21, 2019 |
| | |
By: | | /s/ Michael C. Kardok |
| | |
Name: | | Michael C. Kardok |
Title: | | Treasurer |
Date: | | February 21, 2019 |