 March 3, 2016 Bank of America Merrill Lynch 2016 Refining Conference Filed by Northern Tier Energy LP Pursuant to Rule 425 under the Securities Act of 1933 And deemed filed pursuant to Rule 14a-12 under the Securities Exchange Act of 1934 Subject Company: Northern Tier Energy LP Form S-4 File No.: 333-209031 On March 3, 2016, Northern Tier Energy LP made the following presentation, which it presented later that day at the Bank of America Merrill Lynch 2016 Refining Conference, available on its website. |
 Forward Looking Statements 2 Forward-Looking Statements This presentation contains forward-looking statements. The forward-looking statements contained herein include statements about, among other things, future: integration of refining, marketing, retail and logistics assets; entity structure; amount & type of crude oil we’ll run at our refinery and yields; location of our assets; flexibility of our refinery; advantageous access to crude oil supplies and the attractiveness of our refined product outlets; safe operations; leverage and financial flexibility; ability to identify growth opportunities and complete accretive acquisitions; incentives of our management team; redundancy of our operations and assets, refinery utilization and increased maintenance flexibility; ability to process a variety of light, heavy, sweet and sour crude oils and the pricing thereof; fuel quality requirements and regulations, our ability to comply therewith and capex required for and financial impacts of such compliance; liquid volume yield; FCC capacity; increases in NDL and/or WCS crude oil production; adjusted gross margin per barrel of throughput; number of company-operated & franchised stores, the locations thereof and the ability of such stores to sell any or all of our refinery’s gasoline; commitments for supply of third party retail networks; improved netbacks; increases in total fuel gallons sold to the SuperAmerica Network; brand presence of SuperAmerica including its benchmark against national top tier fuel retailers; new stores and franchise growth; organic growth opportunities and our ability to identify and/or complete high return projects successfully or at all; replacement of desalters including the costs, timing, EBITDA, IRR and payback thereof including increases in crude oil input flexibility and optionality, replacement of Syncrude with higher valued crude oils up to 10 MPD or at all, margin benefit of $4.50/bbl or at all, improved process reliability, reduction in salt-related corrosion and diesel v. gasoline recovery flexibility; modification of our crude units and distillate hydrotreaters and the timing, costs, IRR, payback and results thereof including increases in distillate yield, increases in crude capacity, crude margin benefits and diesel recovery incentive; installation of a solvent deasphalting unit including costs, timing, expected product spread benefit, product yields, pitch yields and its ability to fill FCC capacity; ability to achieve IRR above 30%; improvements in higher value light product yields, efficiency of operations and crude flexibility; optimization of first purchaser barrels in the Bakken and utilization of crude oil transport fleet; ability to source some or all Bakken crude oil from the field and associated increases in gross margins and crude oil quality; growth of the SuperAmerica brand by building new stores, expanding our franchise network or otherwise; acquisition of refining assets, including assets that are well-maintained and/or have access to advantaged crude oil and attractive refined product dynamics; Bakken growth; the announced merger with Western Refining, Inc. (“Western” or “WNR”), including the financing thereof, the timing and likelihood of completion thereof and the management team of the combined company following the merger; and, support of Western Refining. The words “believe,” “expect,” “anticipate,” “plan,” “intend,” “foresee,” “should,” “would,” “could,” “attempt,” “appears,” “forecast,” “outlook,” “estimate,” “project,” “potential,” “may,” “will,” “are likely” or other similar expressions are intended to identify forward-looking statements. These forward-looking statements are based on management’s current expectations and beliefs concerning future developments and their potential effect on us. While management believes that these forward-looking statements are reasonable as and when made, there can be no assurance that future developments affecting us will be those that we anticipate, and any and all of our forward-looking statements in this presentation may turn out to be inaccurate. Our forward-looking statements involve significant risks and uncertainties (some of which are beyond our control) and assumptions that could cause actual results to differ materially from our historical experience and our present expectations or projections. These statements are subject to the general risks inherent in our business, and our statements about the merger are also subject to risks related to the merger generally (including the risk that is it not completed when expected or at all) as well as general risks inherent in the business of Western. In addition, if the merger with Western is consummated, it may impact the operation of our business, including with respect to future growth plans and strategies. These expectations may or may not be realized, and may be based upon assumptions or judgments that prove to be incorrect. In addition, our business and operations involve numerous risks and uncertainties, many of which are beyond our control, which could result in our expectations not being realized, or otherwise materially affect our financial condition, results of operations and cash flows. Other known, unknown or unpredictable factors could have material adverse effects on our future results. Additional information regarding such factors and our uncertainties, risks and assumptions are contained in our filings with the Securities and Exchange Commission. All forward-looking statements are only as of the date hereof, and we do not undertake any obligation to (and expressly disclaim any obligation to) update any forward looking statements to reflect events or circumstances after the date such statements were made, or to reflect the occurrence of unanticipated events. Important Notice to Investors This communication does not constitute an offer to sell or the solicitation of an offer to buy any securities or a solicitation of any vote or approval in any jurisdiction where such an offer or solicitation is unlawful. Any such offer will be made only by means of a prospectus meeting the requirements of Section 10 of the Securities Act of 1933, pursuant to a registration statement filed with the SEC. The proposed transaction between Western Refining, Inc. (“Western”) and Northern Tier Energy LP (“NTI”) will be submitted to the unitholders of NTI for their consideration. On January 19, 2016, Western filed a registration statement on Form S-4 with the SEC that included a preliminary prospectus of Western and a preliminary proxy statement of NTI. Western and NTI will also file other documents with the SEC regarding the proposed transaction, including a definitive prospectus and proxy statement. INVESTORS AND SECURITY HOLDERS OF NTI ARE URGED TO READ THE DEFINITIVE PROXY STATEMENT/PROSPECTUS AND ANY OTHER RELEVANT DOCUMENTS THAT WILL BE FILED WITH THE SEC CAREFULLY AND IN THEIR ENTIRETY WHEN THEY BECOME AVAILABLE BECAUSE THEY WILL CONTAIN IMPORTANT INFORMATION ABOUT THE PROPOSED TRANSACTION. Investors and security holders may obtain free copies of the definitive proxy statement/prospectus and other documents containing important information about Western and NTI once such documents are filed with the SEC through the website maintained by the SEC at www.sec.gov. Copies of the documents filed with the SEC by Western will be available free of charge on Western’s website at www.wnr.com under the “Investor Relations” section or by contacting Western’s Investor Relations Department at (602) 286- 1530. Copies of the documents filed with the SEC by NTI will be available free of charge on NTI’s website at www.northerntier.com under the “Investors” section or by contacting NTI’s Investor Relations Department at (651) 769-6700. Participants in Solicitation Relating to the Merger Western, NTI and certain of their respective directors and executive officers may be deemed to be participants in the solicitation of proxies from the unitholders of NTI in connection with the proposed transaction. Information about the directors and executive officers of Western is set forth in the Proxy Statement on Schedule 14A for Western’s 2015 annual meeting of shareholders, which was filed with the SEC on April 22, 2015. Information about the directors and executive officers of the general partner of NTI is set forth in the 2015 Annual Report on Form 10-K for NTI, which was filed with the SEC on February 26, 2016. These documents can be obtained free of charge from the sources indicated above. Other information regarding the participants in the proxy solicitation and a description of their direct and indirect interests, by security holdings or otherwise, will be contained in the proxy statement/prospectus and other relevant materials to be filed with the SEC when they become available. |
 Key Business Highlights 3 • Strategically-Located Refinery with Advantaged Access to Crude Oil Supplies and Attractive Refined Product Outlets • Integrated Refining, Marketing, Retail, and Logistics Operations • Flexible Refinery with Operational Redundancies • Refinery Track Record of Safe Operations • Low Leverage with Financial Flexibility • Focused on Organic Growth Opportunities and Potential for Accretive Acquisitions • Experienced, Proven and Incentivized Management Team |
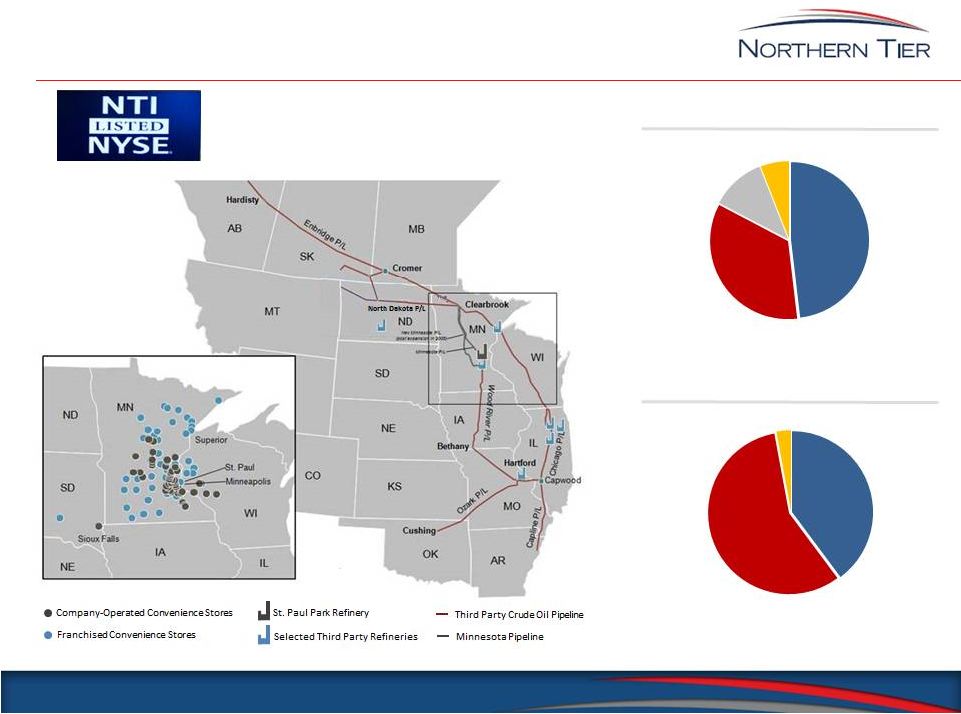 Northern Tier Overview Integrated refining, marketing, retail, and logistics assets operating as a variable distribution publicly traded partnership. St. Paul Park Refinery Product Yields St. Paul Park Refinery Feedstocks Total Input: 96,515 bpd Total Yield: 96,506 bpd 1 Full Year Ended December 31, 2015. 4 Gasoline 48% Distillates 35% Asphalt 11% Other 6% Canadian Crude 40% Domestic Crude 57% Other 3% 1 1 |
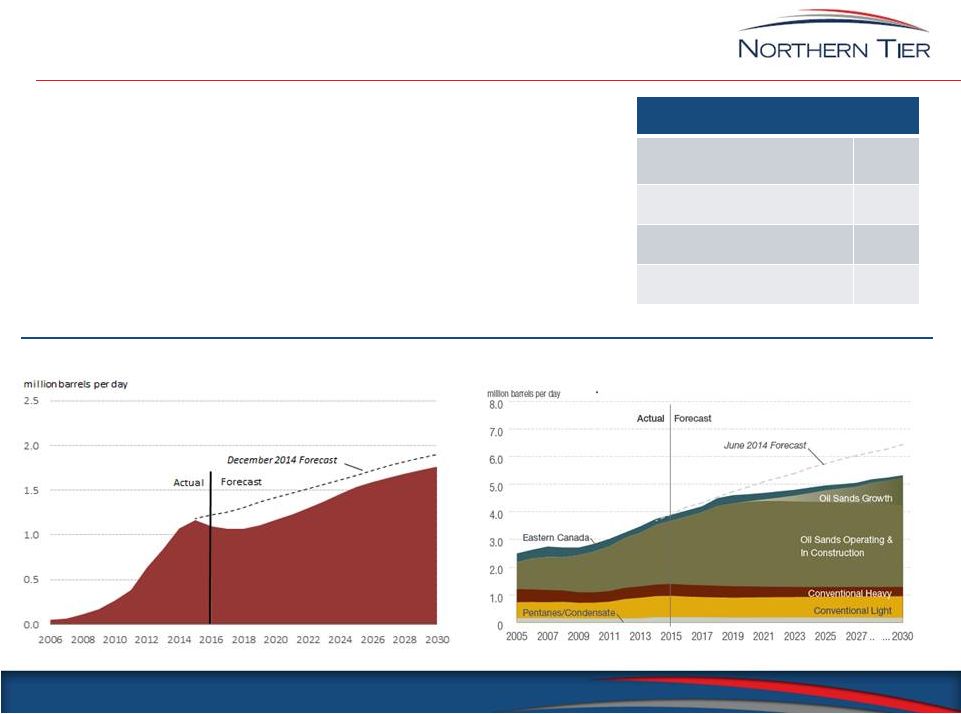 5 • Redundant refining assets, allowing for higher refinery utilization and increased maintenance flexibility • Refinery configuration allows it to process a variety of light, heavy, sweet and sour crude oils, most of which have historically priced on average below WTI • Compliance with currently known prospective Group 3 fuel quality requirements without requiring significant additional capital expenditure, including upcoming Tier 3 gasoline sulfur regulations • High liquid volume yield – typically greater than 100% on crude oil input • Available FCC capacity Flexible Refinery with Crude Oil Advantage Operational Redundancy Crude Distillation / Vacuum Towers 2 Reformers 2 Sulfur Recovery Units 2 Hydrotreating Units 6 North Dakota Crude Oil Production Western Canadian Crude Oil Production Source: PIRA Long Range Crude Production Forecast (December 2015) Source: Canadian Association of Petroleum Producers (June 2015) |
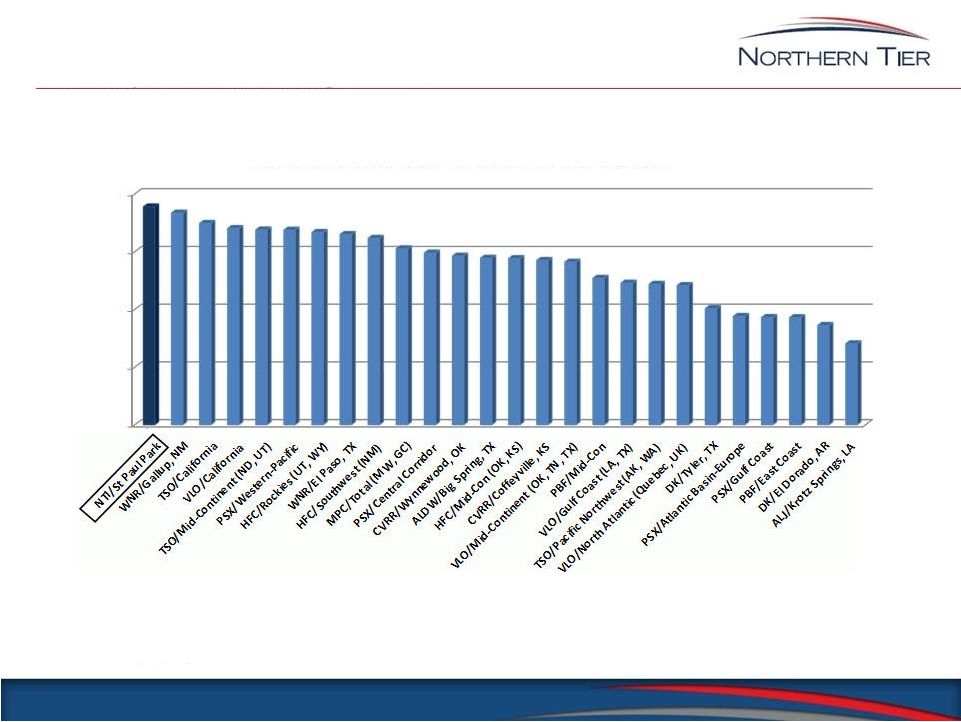 Refinery Benchmarking 6 Source: Company filings. $0 $5 $10 $15 $20 US Independent Refiners Full Year 2015 Adjusted Gross Margin per Barrel of Throughput |
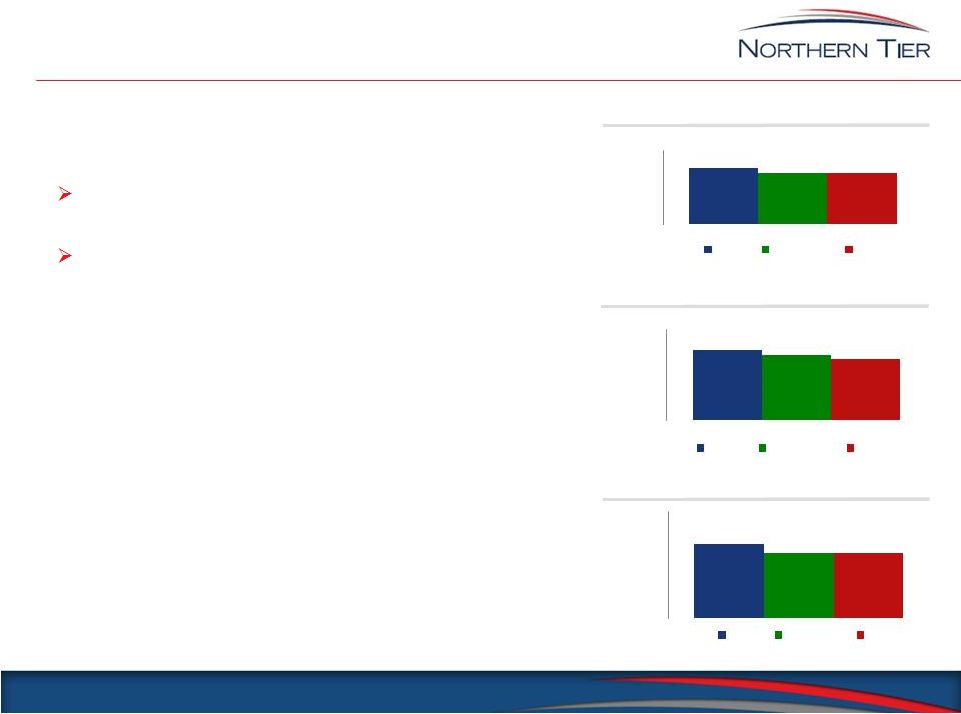 Integrated Marketing Channel 7 • Northern Tier’s integrated marketing network included 168 company-operated and 109 franchised SuperAmerica convenience stores as of December 31, 2015 Approximately 264 stores are located in Minnesota with a majority clustered in the Twin Cities metropolitan area 40% - 50% of St. Paul Park Refinery gasoline is sold through the SuperAmerica network • Northern Tier has additional committed fuel supply contracts for 3 party retail networks • Integrated refining and marketing operations provide for improved netback • Total fuel gallons sold to the SuperAmerica network increased 9% in 2015 versus 2014 • Opened three new company-operated stores in the fourth quarter 2015 and another one in January 2016 • Added 20 franchise locations in 2015 Total Retail Fuel Sold (000 gal/store/month) (company-operated stores) Retail Fuel Margin ($/gallon) (company-operated stores) Inside Sales ($000/store/month) (company-operated stores) Source: Full Year Ended December 31, 2015. SA Source is Internal Reporting. Central and US reporting source is CSX LLC 153 141 140 - 50 100 150 200 SA Central US $0.234 $0.218 $0.203 - $0.05 $0.10 $0.15 $0.20 $0.25 $0.30 SA Central US $175 $152 $152 $- $50 $100 $150 $200 $250 SA Central US Inside Sales ($$$) rd |
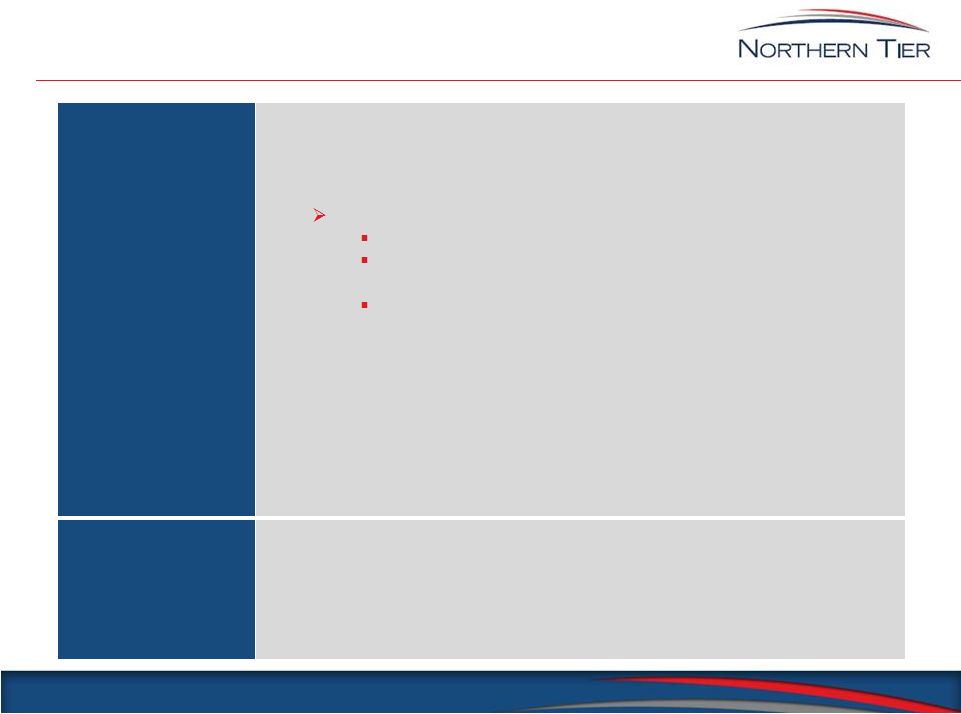 Growth Strategy Organic • Slate of high return projects (IRR in excess of 30%) which should improve yields of higher value light products, efficiency of operations, and/or crude oil slate flexibility: Projects underway intended to: replace the desalters to increase crude oil input flexibility modify the No. 2 crude unit and diesel hydrotreater to increase distillate yield and crude oil throughput capacity install a solvent deasphalting unit to utilize available FCC capacity • Optimize first purchaser crude oil barrels in the Bakken with flexible utilization of crude oil transport fleet • Grow the SuperAmerica brand by opening new stores and expanding franchise network Acquisitions • Evaluate well-maintained refining assets with access to advantaged crude oil and attractive refined product dynamics • Grow the SuperAmerica brand by acquiring existing retail assets 8 |
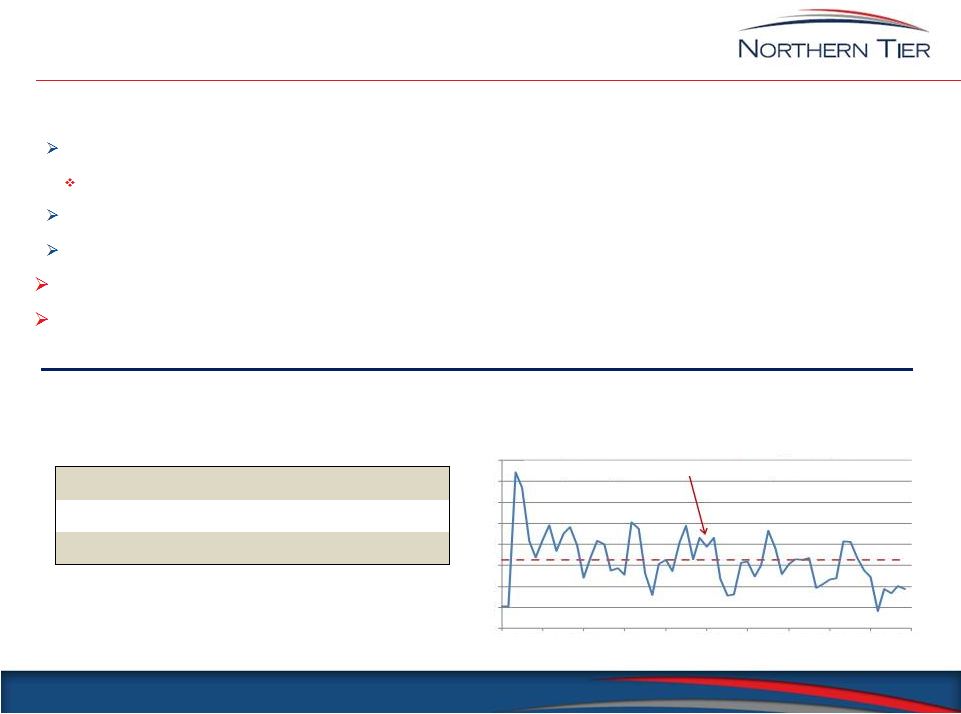 Crude Unit Desalter Project Replace Existing Single Stage Desalters with State of the Art Two Stage Desalters, intended to: Gain optionality to replace up to 10 MBPSD of Canadian Syncrude with higher valued crude oils Expected $4.50/bbl margin benefit based on 5-year average (2011 – 2015) historical crude oil differentials Improve process reliability through reduction in salt related corrosion Gain diesel versus gasoline recovery flexibility Expect to complete No. 1 Crude Unit Desalter with commissioning starting in the second quarter 2016 Expect to complete No. 2 Crude Unit Desalter installation in connection with our fall 2016 turnaround 9 Advantaged Crude Mix Opportunity (not including quality adjustment) Project Economics 1 Based primarily on average crude oil differentials and other assumptions for the full five fiscal years of 2011 through 2015. Actual results may differ. 2 From operational start-up Capital Expenditure, $MM $30 Expected Annual EBITDA, $MM $21 Simple Payback, Months 2 17 Source: Argus Month 1 Crude Prices 0 2 4 6 8 10 12 14 16 Jan-11 Jul-11 Jan-12 Jul-12 Jan-13 Jul-13 Jan-14 Jul-14 Jan-15 Jul-15 Jan-16 $/bbl Month Average Syncrude minus North Dakota Light Price Delivered to St. Paul Park Refinery January 2011 through December 2015 delivered average of $6.5 0/bbl 1 |
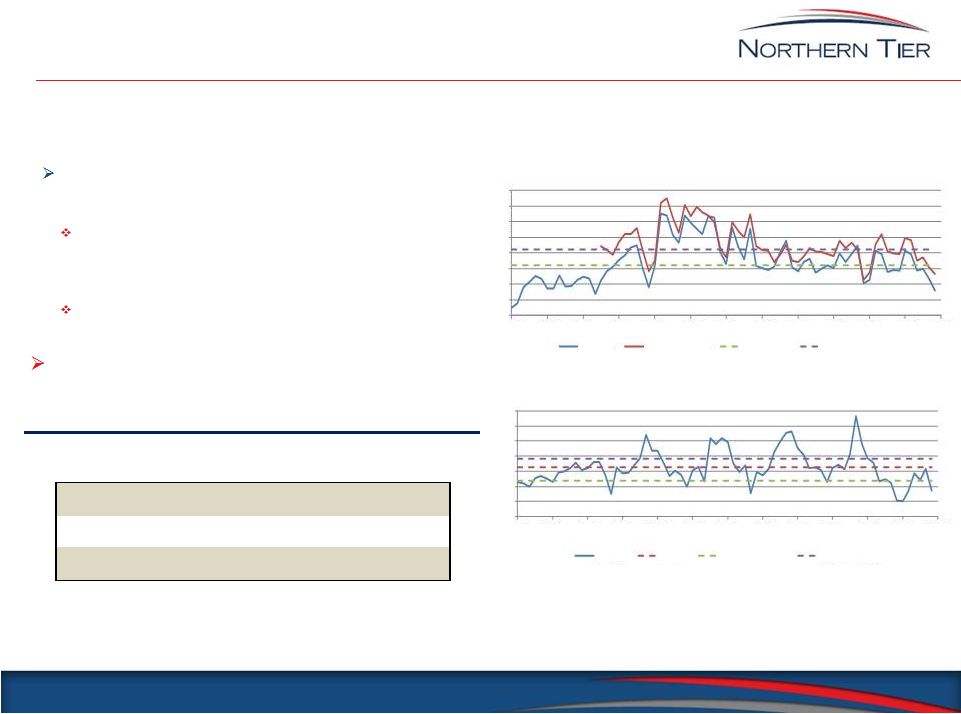 No. 2 Crude Unit and Diesel Hydrotreater Revamp Projects Increase crude oil throughput capability by up to 4 MBPSD while increasing diesel recovery by 2% Expected $11/bbl Syncrude or similar crude oil margin benefit to overhead processing limits based on 5-year average (2011 – 2015) historical margins 1 Expected $6.50/bbl diesel recovery incentive based on 5-year average (2011 – 2015) historical spreads 1 Expect to complete the project in connection with our fall 2016 turnaround 10 Project Economics 1 Based primarily on average crude prices, product netbacks, and other assumptions for the five full fiscal years of 2011 through 2015. Actual results may differ. 2 From operational start-up Upgrade Key Charge Rate & Distillate Recovery Limiting Equipment in the No. 2 Crude Unit, intended to: Sources: Assumptions: Argus Month 1 Crude Prices 1) Asphalt Price Equals FOB Hardisty WCS OPIS Group 3 Midpoint Product Prices 2) Incremental Gasoline sold at Group 3 Midpoint minus 6 cpg 3) Incremental Distillate sold at Group 3 Midpoint minus 2 cpg -10 -5 0 5 10 15 20 25 Jan-10 Jul-10 Jan-11 Jul-11 Jan-12 Jul-12 Jan-13 Jul-13 Jan-14 Jul-14 Jan-15 Jul-15 Jan-16 $/bbl ULSD Recovery Incentive Incentive Average 1 Year Worst (2015) 1 Year Best (2014) -5 0 5 10 15 20 25 30 35 Jan-10 Jul-10 Jan-11 Jul-11 Jan-12 Jul-12 Jan-13 Jul-13 Jan-14 Jul-14 Jan-15 Jul-15 Jan-16 $/bbl Historic Incremental Crude Margins Syncrude & North Dakota Light Syncrude North Dakota Light Avg Syncrude Avg North Dakota Light Capital Expenditure, $MM $19 Expected Annual EBITDA, $MM $10 Simple Payback, Months 2 23 |
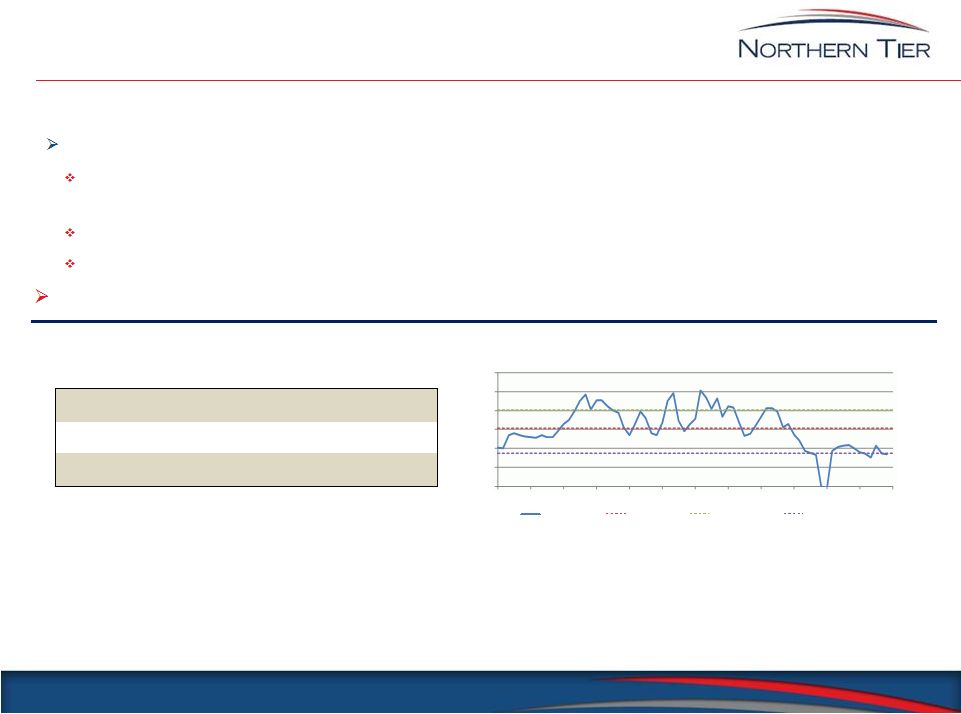 Solvent Deasphalting Project Upgrade residual oil for conversion to gasoline and diesel by utilizing excess FCC capacity Expected $31.50/bbl project light to heavy product spread benefit based on 5-year (2011-2015) average historical prices 1 Expected 60% light product yield from unit Pitch yield from unit is expected to be blended into asphalt Expect to complete the project by the middle of 2017 11 Project Economics 1 Based primarily on average crude prices, product netbacks, and other assumptions for the five full fiscal years of 2011 through 2015. Actual results may differ. 2 From operational start-up Install a 5,000 BPSD Solvent Deasphalting Unit, intended to: Capital Expenditure, $MM $63 Expected Annual EBITDA, $MM $27 Simple Payback, Months 2 28 Sources: Assumptions: OPIS Group 3 Midpoint Product Prices 1) Solvent Deasphalting Unit feed is 50% residual fuel oil and Historic Asphalt sales netbacks 50% asphalt Argus Gulf Coast 3% No. 6 Fuel Oil 2) Residual fuel oil is priced at 80% 3% No. 6 Fuel Oil minus $10/bbl and 20% local roofing flux sales (asphalt plus $75/ton) 3) Asphalt is priced at average sales netback 4) Incremental Gasoline sold at Group 3 Midpoint minus 6 cpg 5) Incremental Distillate sold at Group 3 Midpoint minus 2 cpg 6) Pitch is sold at average asphalt sales netback Month Average 6 Year Average 1 Year Best (2011) 1 Year Worst (2015) 0 10 20 30 40 50 60 Jan-10 Jul-10 Jan-11 Jul-11 Jan-12 Jul-12 Jan-13 Jul-13 Jan-14 Jul-14 Jan-15 Jul-15 Jan-16 $/bbl Historic Project Light to Heavy Product Spread |
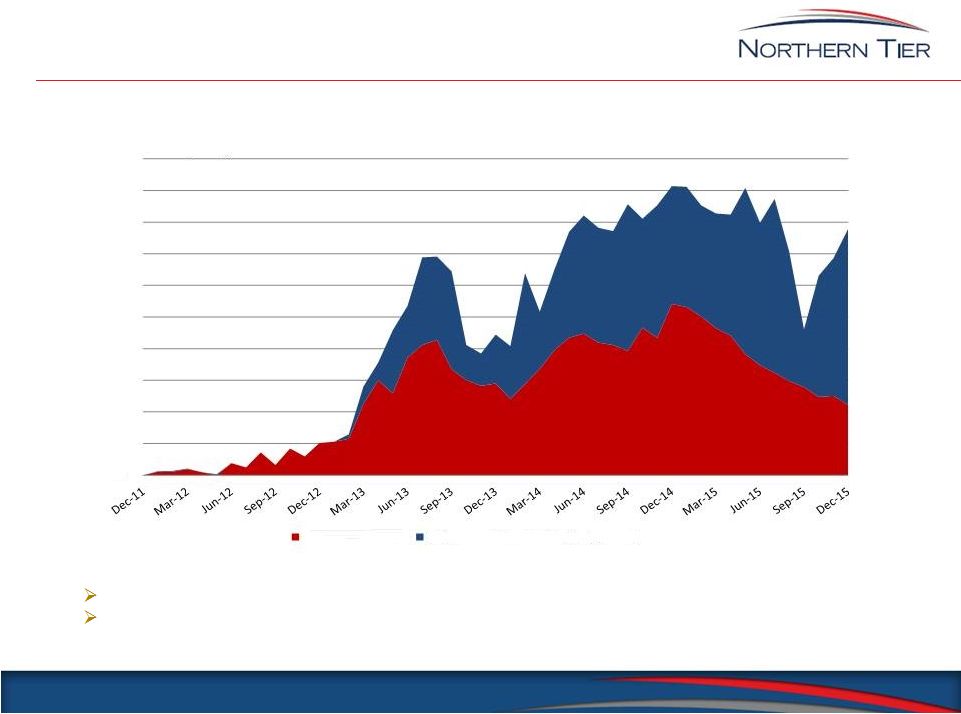 Bakken First Purchase Strategy 12 Source: Company Information We Strive to Optimize Our First Purchases in the Bakken Field Goal: Optionality to Source all Bakken Crude Oil from the Field Goal: Increase Gross Margin by Acquiring the Best Quality Crude Oil for our Process Configuration - 5,000 10,000 15,000 20,000 25,000 30,000 35,000 40,000 45,000 50,000 barrels per day Bakken Crude Oil Purchases Leases & Gathering System Pipelines Lease Purchases Enbridge Gathering Pipeline Purchases |
 Merger of Western Refining and Northern Tier Summary of Transaction 13 • As announced on December 21, 2015, Western Refining , Inc. (WNR) will acquire all of the outstanding common units of Northern Tier Energy LP (NTI) not already owned by WNR. Consideration 20-day 18-Dec Undisturbed VWAP Closing Price WNR Shares per NTI Unit 0.2986 0.2986 WNR Price 44.68 $ 37.04 $ Equity Value per NTI Unit 13.34 $ 11.06 $ Cash per NTI Unit 15.00 $ 15.00 $ Implied Consideration 28.34 $ 26.06 $ Premium to NTI Closing Price (12/18) 18% 9% Premium to NTI 20-day Undisturbed VWAP Price 18% 8% WNR Price • The cash portion of consideration ($858 million) expected to be funded by cash-on-hand and bank or capital markets debt • WNR will issue 17.1 million shares as part of the transaction consideration • Paul Foster to remain Executive Chairman; Jeff Stevens to remain Chief Executive Officer; Dave Lamp to be appointed President and Chief Operating Officer • Transaction expected to close during 1H 2016, subject to NTI unitholder approval and customary closing conditions |
 Key Business Highlights 14 • Strategically-Located Refinery with Advantaged Access to Crude Oil Supplies and Attractive Refined Product Outlets • Integrated Refining, Marketing, Retail, and Logistics Operations • Flexible Refinery with Operational Redundancies • Refinery Track Record of Safe Operations • Low Leverage with Financial Flexibility • Focused on Organic Growth Opportunities and Potential for Accretive Acquisitions • Experienced, Proven and Incentivized Management Team |
 APPENDIX |
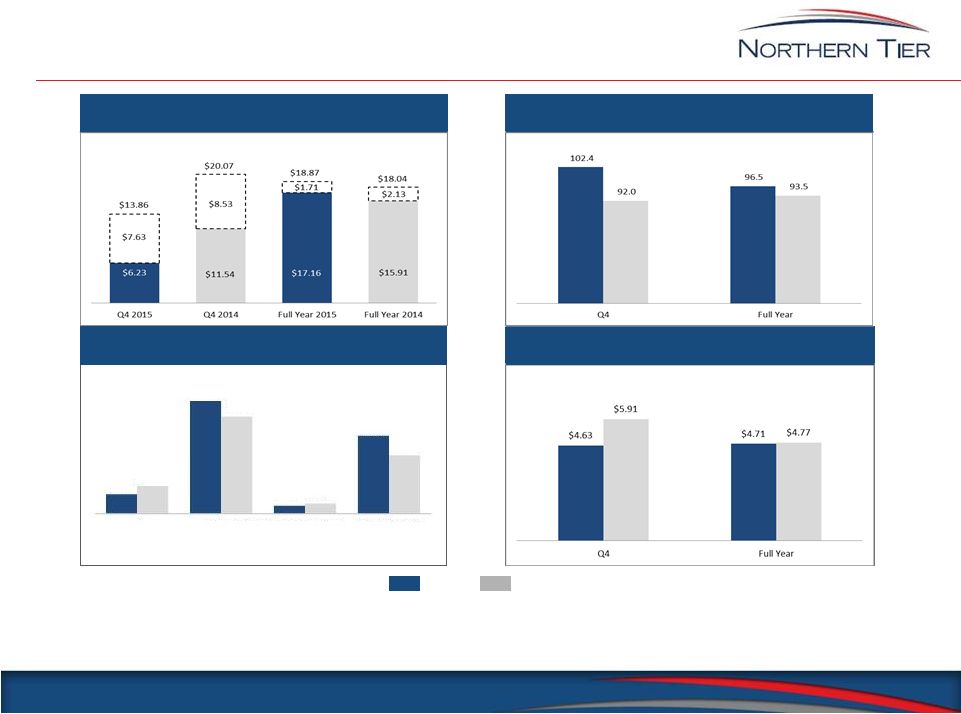 Q4 and Full Year 2015 Financial Summary 16 Gross Margin 1 ($ per throughput barrel) Direct Operating Expenses 4 ($ per throughput barrel) Total Refinery Throughput 3 (thousands of barrels per day) 2015 2014 Adjusted EBITDA 2 and Cash Available for Distribution $86.0 $499.2 $35.7 $345.2 $123.2 $430.7 $45.6 $258.9 Q4 Adjusted EBITDA Full Year Adjusted EBITDA Q4 Cash Available for Distribution Full Year Cash Available for Distribution 1 Gross margin data includes the impact of the lower of cost or market inventory adjustment which is depicted by dotted lines. See page 18 for the components used in this calculation (revenue, cost of sales, and lower of cost or market inventory adjustment). 2 See page 19 for reconciliations of Net Income to Adjusted EBITDA and Adjusted EBITDA to Cash Available for Distribution. 3 Total refinery throughput includes crude oil and other feedstocks. 4 Direct operating expenses per barrel is calculated by dividing direct operating expenses by the total barrels of throughput for the respective periods presented. |
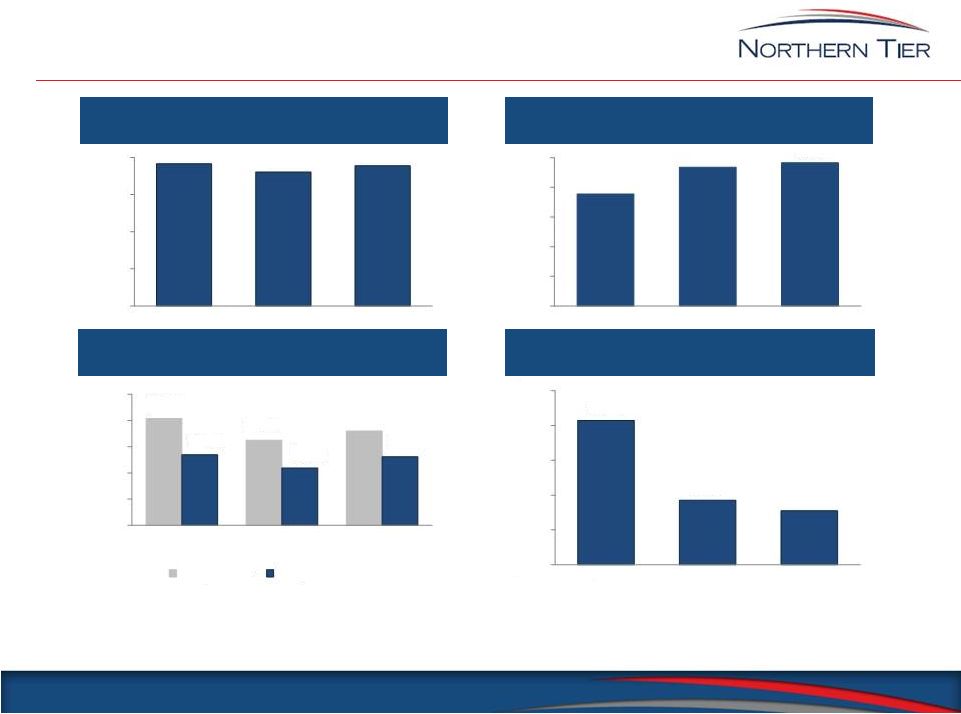 Key Refining Performance Metrics 17 1 Gross margin data for 2014 and 2015 excludes the impact of a lower of cost or market inventory adjustment. See page 18 for the components used in this calculation (revenue, cost of sales, and lower of cost or market inventory adjustment). 2 Typically, 80% of our products are comparable to a 3-2-1 crack spread, while 95% of our products are comparable to a 6-3-2-1 crack spread. 3 See page 16 for components used in this calculation (refinery operating expenses and refinery barrels of throughput). Gross Margin 1 ($ per throughput barrel) Group 3 Benchmark Crack Spread 2 ($ per barrel) Direct Operating Expenses 3 ($ per throughput barrel) Total Refinery Throughput (thousands of barrels per day) $19.15 $18.04 $18.87 $0.00 $5.00 $10.00 $15.00 $20.00 2013 2014 2015 75.5 93.5 96.5 0.0 20.0 40.0 60.0 80.0 100.0 2013 2014 2015 $20.37 $16.25 $17.99 $13.45 $10.97 $13.08 $0.00 $5.00 $10.00 $15.00 $20.00 $25.00 2013 2014 2015 Group 3 3:2:1 Group 3 6:3:2:1 $5.23 $4.77 $4.71 $4.40 $4.60 $4.80 $5.00 $5.20 $5.40 2013 2014 2015 |
  Refining Operating Information Per Barrel of Throughput Reconciliation 18 ($ in millions, unless otherwise indicated) ($ in millions unless otherwise indicated) 2013 2014 Q1 2015 Q2 2015 Q3 2015 Q4 2015 2015 Refinery gross margin per barrel: Refinery revenue $4,536.0 $5,097.7 $689.6 $839.8 $762.3 $645.1 $2,936.8 Refinery costs of sales $4,008.4 $4,554.7 $513.7 $641.9 $590.2 $586.4 $2,332.2 Refinery gross margin $527.6 $543.0 $175.9 $197.9 $172.1 $58.7 $604.6 Lower of cost or market inventory adjustment - 72.2 (10.5) (37.2) 36.0 71.8 60.1 Refinery gross margin excluding lower of cost or market inventory adjustment $527.6 $615.2 $165.4 $160.7 $208.1 $130.5 $664.7 Total refinery throughput (mmbbls) 27.5 34.1 8.5 9.0 8.3 9.4 35.2 Refinery gross margin per total throughput barrel ($/bbl) $19.15 $15.91 $20.77 $21.98 $20.65 $6.23 $17.16 Refinery gross margin excluding lower of cost or market inventory adjustment per total throughput barrel ($/bbl) $19.15 $18.04 $19.53 $17.85 $24.97 $13.86 $18.87 Operating expense per barrel: Direct operating expense $144.1 $163.0 $38.9 $43.2 $40.3 $43.6 $166.0 Total refinery throughput (mmbbls) 27.5 34.1 8.5 9.0 8.3 9.4 35.2 Direct operating expense per total throughput barrel ($/bbl) $5.23 $4.77 $4.59 $4.80 $4.84 $4.63 $4.71 |
 Adjusted EBITDA & Cash Available for Distribution Reconciliation 19 Q1 Q2 Q3 Q4 Q1 Q2 Q3 Q4 Net Income (Loss) $71.5 $57.9 $96.2 $16.0 $111.2 $128.9 $103.5 ($12.6) Adjustments: Interest expense 6.2 6.2 6.7 7.5 7.5 7.5 7.5 6.2 Income tax provision 0.1 1.5 1.9 3.6 0.8 2.9 3.6 1.1 Depreciation and amortization 9.9 10.2 10.7 11.1 10.8 10.8 11.0 11.4 EBITDA Subtotal $87.7 $75.8 $115.5 $38.2 $130.3 $150.1 $125.6 $6.1 MPL proportionate depreciation expense 0.7 0.7 0.7 0.8 0.7 0.7 0.7 0.8 Turnaround and related expenses 0.5 0.9 4.6 8.9 0.4 1.2 7.8 1.2 Equity-based compensation impacts 7.4 2.9 2.0 1.7 2.6 2.9 2.4 2.4 Lower of cost or market inventory adjustment - - - 73.6 (10.8) (38.2) 36.8 73.0 Reorganization and related costs 6.3 1.8 - - - - - - Merger-related expenses - - - - - - - 2.5 Adjusted EBITDA $102.6 $82.1 $122.8 $123.2 $123.2 $116.7 $173.3 $86.0 Adjustments: Cash interest expense (5.6) (5.6) (5.7) (6.9) (7.0) (6.9) (7.1) (7.1) Cash income tax paid (0.1) (1.5) (1.9) (1.0) (1.0) (1.0) (0.7) (3.4) MPL proportionate depreciation expense (0.7) (0.7) (0.7) (0.8) (0.7) (0.7) (0.7) (0.8) Capital expenditures (10.0) (10.1) (9.1) (6.2) (6.2) (14.3) (12.4) (16.0) Cash reserve for turnaround and related expenses (7.5) (7.5) (7.5) (7.5) (7.5) (7.5) (7.5) (7.5) Cash reserve for discretionary capital expenditures (7.5) (7.5) (5.0) - - - (7.5) (7.5) Working capital reserve (increase)/decrease - - - (55.2) - 25.0 (40.0) (8.0) Cash available for distribution $71.2 $49.2 $92.9 $45.6 $100.8 $111.3 $97.4 $35.7 2014 2015 |
 Organic Growth Projects: Reconciliation of Annual Forecasted Net Income to Annual Forecasted EBITDA 20 Annual Forecasted Net Income 1 $24.0 Add: Estimated Depreciation and Amortization 3.0 Annual Forecasted EBITDA $27.0 ($ in millions) 1 Based primarily on average crude prices, product netbacks, and other assumptions for the five full fiscal years of 2011 through 2015. Actual results may differ. Annual Forecasted Net Income 1 $9.3 Add: Estimated Depreciation and Amortization 0.7 Annual Forecasted EBITDA $10.0 Annual Forecasted Net Income 1 $19.5 Add: Estimated Depreciation and Amortization 1.5 Annual Forecasted EBITDA $21.0 Desalter Project No. 2 Crude and Diesel Hydrotreater Project Solvent Deasphalting Project |
 Non-GAAP Measures This presentation includes Non-GAAP financial and performance measures, including: EBITDA and Adjusted EBITDA Adjusted EBITDA is defined as net income (loss) before interest expense, income taxes and depreciation and amortization, adjusted for depreciation from the Minnesota Pipe Line operations, lower of cost or market inventory adjustments, turnaround and related expenses, equity-based compensation expense, and merger- related expenses. Adjusted EBITDA is not a presentation made in accordance with GAAP and our computation of Adjusted EBITDA may vary from others in our industry. In addition, Adjusted EBITDA contains some, but not all, adjustments that are taken into account in calculating the components of various covenants in the agreements governing our 2020 Secured Notes and the ABL Facility. We believe the presentation of Adjusted EBITDA is useful to investors because it is frequently used by securities analysts, investors and other interested parties in the evaluation of companies in our industry. The calculation of Adjusted EBITDA generally eliminates the effects of financings, income taxes and the accounting effects of significant turnaround activities which many of our peers capitalize and therefore exclude from Adjusted EBITDA. Adjusted EBITDA should not be considered as an alternative to operating income or net income as measures of operating performance. In addition, Adjusted EBITDA is not presented as, and should not be considered, an alternative to cash flow from operations as a measure of liquidity. Adjusted EBITDA has limitations as an analytical tool and should not be considered in isolation, or as a substitute for analysis of the results as reported under GAAP. Cash Available for Distribution Cash available for distribution is a non-GAAP performance measure that we believe is important to investors in evaluating our overall cash generation performance. Cash available for distribution should not be considered as an alternative to operating income or net income as measures of operating performance. In addition, cash available for distribution is not presented as, and should not be considered, an alternative to cash flow from operations as a measure of liquidity. As shown in the tables in this Appendix, we have reconciled cash available for distribution to Adjusted EBITDA and in addition reconciled Adjusted EBITDA to net income. Cash available for distribution has limitations as an analytical tool and should not be considered in isolation, or as a substitute for analysis of the results as reported under GAAP. Our calculation of cash available for distribution may differ from similar calculations of other companies in our industry, thereby limiting its usefulness as a comparative measure. Cash available for distribution for each quarter will be determined by the board of directors of our general partner following the end of such quarter. Refining Gross Margin Refining gross margin is calculated by subtracting refining costs of sales from total refining revenues. Refining gross margin excluding lower of cost or market (“LCM”) inventory adjustment is calculated by adding back the non-cash LCM inventory adjustment to refining gross margin. Refining gross margin and refining gross margin excluding LCM are non-GAAP measures that we believe are important to investors in evaluating our refining segment performance as a general indication of the amount above its cost of products that is able to sell refined products. NTI’s calculation of refining gross margin and refining gross margin excluding LCM may differ from similar calculations by other companies in our industry, thereby limiting its usefulness as a comparative measure. 21 |