UNITED STATES
SECURITIES AND EXCHANGE COMMISSION
Washington, DC 20549
FORM N-CSR
CERTIFIED SHAREHOLDER REPORT OF REGISTERED
MANAGEMENT INVESTMENT COMPANY
Investment Company Act file number 811-22678
Salient MF Trust
(Exact name of registrant as specified in charter)
4265 SAN FELIPE, 8TH FLOOR, HOUSTON, TX 77027
(Address of principal executive offices) (Zip code)
| | |
| | With a copy to: |
| John A. Blaisdell | | George J. Zornada |
| Salient MF Trust | | K & L Gates LLP |
| 4265 San Felipe, 8th Floor | | State Street Financial Center |
| Houston, TX 77027 | | One Lincoln St. |
| (Name and address of agent for service) | | Boston, MA 02111-2950 |
| | (617) 261-3231 |
��
Registrant’s telephone number, including area code: 713-993-4675
Date of fiscal year end: 12/31/13
Date of reporting period: 12/31/13
Item 1. Reports to Stockholders.
Salient Risk Parity Fund
Salient MLP & Energy Infrastructure Fund II Salient Alternative Beta Fund
Salient Trend Fund (formerly Salient Pure Trend Fund)
Salient Global Equity Fund
Shareholders’ Report
For the periods ended December 31, 2013
TABLE OF CONTENTS
This report is prepared for shareholders of the Salient MF Trust mutual funds and may be distributed to others only if preceded or accompanied by a current prospectus.

Management Discussion of Fund Performance (Unaudited)
Letter to Shareholders
Dear Fellow Shareholders:1
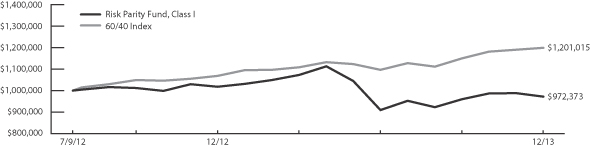
Relative to the strong returns of equity markets, 2013 was a difficult year for risk parity strategies, including the Salient Risk Parity Fund (the “Fund”). After four months of positive performance, the Fund suffered a sharp drawdown during May and June as a result of speculation that the Federal Reserve would begin reducing quantitative easing earlier than expected. After the June drawdown, the Fund rallied, returning 6.9% from July through December, ultimately finishing down 4.6% for the year of which all was attributable to futures contracts.
| | | | | | | | | | |
| | | | |
Share Class | | Commencement
Date | | Net Performance without
Sales Charge | | 60/40 Index2 Return |
| | | 2013 | | Since Inception
(Annualized) | | 2013 | | Since Inception of
Fund Share Class
(Annualized) |
Class A (SRPAX) | | 11/15/2012 | | -4.78% | | -2.11% | | 12.34% | | 15.53% |
Class C (SRPCX) | | 10/01/2012 | | -5.49% | | -4.08% | | 12.34% | | 11.96% |
Class I (SRPFX) | | 7/9/2012 | | -4.59% | | -1.88% | | 12.34% | | 14.03% |
| | | | | | |
| | | |
| Share Class | | Commencement
Date | | Net Performance with
Maximum Sales Charge |
| | | 2013 | | Since Inception |
Class A (SRPAX) | | 11/15/2012 | | -10.00% | | -6.92% |
Class C (SRPCX) | | 10/01/2012 | | -6.37% | | -4.08% |
Source: Salient Advisors, L.P. and Bloomberg, December 2013.
Returns above as of December 31, 2013.
The performance data quoted here represents past performance. Past performance is no guarantee of future results. Investment return and principal value will fluctuate, so that an investor’s shares, when redeemed, may be worth more or less than their original cost. Current performance may be lower or higher than the performance information quoted. To obtain performance information current to the most recent month-end please call 866-667-9228. The total annual gross and net operating expense ratios for the Fund based on the current Fund prospectus dated April 30, 2013, are as follows: Class A shares are 1.89% and 1.56% respectively, Class C shares are 2.64% and 2.31% respectively and Class I shares are 1.64% and 1.31% respectively. The adviser has contractually agreed to waive fees and/or reimburse expenses to maintain the Fund’s total operating expenses at 1.55% for Class A, 2.30% for Class C and 1.30% for Class I shares, excluding certain expenses, until July 31, 2014. Additional information pertaining to the December 31, 2013 expense ratios can be found in the financial highlights. Returns do not reflect the taxes that investors may pay or distributions or the sale of shares.
1 Certain statements in this letter are forward-looking statements. The forward-looking statements and other views expressed herein are those of the portfolio managers and the Fund as of the date of this letter. Actual future results or occurrences may differ significantly from those anticipated in any forward-looking statements, and there is no guarantee that any predictions will come to pass. The views expressed herein are subject to change at any time, due to numerous market and other factors. The Fund disclaims any obligation to update publicly or revise any forward-looking statements or views expressed herein. There can be no assurance that the Fund will achieve its investment objectives. The value of the Fund will fluctuate with the value of the underlying securities.
2 The 60/40 Index represents an allocation of 60% MSCI AC World Index (Equities), 40% Barclays Aggregate Bond Index (Bonds)—formerly the Lehman Aggregate Bond Index through Nov. 2008. The MSCI World Index is a free float-adjusted market capitalization weighted index that is designed to measure the equity market performance of developed and emerging markets. The Barclays Capital U.S. Aggregate Bond Index is a composite comprised of the Barclays Capital U.S. Intermediate Government/Credit Index and the Barclay Capital Mortgage-Backed Securities Index. All issues in the index are rated investment grade or higher, have a least one year to maturity, and have an outstanding par value of at least $100 million. Note that the Fund’s allocation may differ substantially from 60% equities and 40% bonds. The index returns are from 1/1/2013 onward. One cannot invest directly in an index.
1
Equity markets, especially domestic equities for US investors, were among the best performers in 2013. Most notably, the S&P 500 Index rose by 32.4%. In contrast, commodities, fixed income and even many international equity markets produced negative returns. In brief periods where a small number of assets perform very well, we believe investors should expect diversified portfolios like risk parity to be challenged. As allocators, we believe it is prudent to recall that equity volatility is a two-way street. In fact, extreme negative return outliers in the equity markets have historically occurred more often than extreme positive return outliers. Just as an over-exposure to equity risk can yield excellent returns during periods of exceptional equity performance, it can also result in sharp losses during more turbulent periods.
If it were possible to accurately predict which asset class would perform best each year, investors would do best to forego diversification altogether and allocate 100% of their portfolios to the asset class that would perform best over the next holding period. However, history has shown that predicting asset class returns has been extremely difficult for even the most seasoned market professionals. This lack of certainty is the primary justification for risk parity. By allowing lowly correlated asset classes an equal chance to drive portfolio returns, risk parity strategies are designed to perform well across a variety of economic environments without making subjective bets as to what the next environment will look like. Put more simply, the investment industry makes a great deal of money selling crystal balls, but we don’t believe they exist.
While the negative return in 2013 could lend credence to the argument that risk parity strategies result in an overallocation to fixed income, we would argue that our allocation to rates is not too large, but just right in order to meet our objective of giving this asset class an equal opportunity to affect portfolio volatility. While 2013 was an extremely trying period for fixed income, we saw the power of diversification as the equity holdings in the Salient Risk Parity Fund returned more over the course of the year than the rates positions lost.
The Fund’s allocation as of December 31, 2013 is shown in the pie chart below:
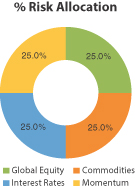
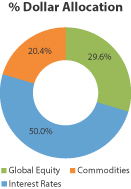
The data displayed in pie charts have been rounded to the nearest whole number for illustrative purposes only. Allocations are subject to change.
Source: Salient Advisors, L.P., December 31, 2013.
Investment Strategies and Techniques
The Salient Risk Parity Fund seeks long term capital appreciation. The Fund seeks to achieve this goal by constructing a portfolio that balances equal risk exposure to a set of equities, commodities, interest rates, and momentum. While equities, commodities, and interest rates are asset classes, momentum is a strategy that trades the same underlying assets used in our long-only equity, commodity, and interest rate sleeves on a long/short basis. The momentum strategy buys exposure (i.e. “goes long”) assets that have appreciated in the past year and
2
sells exposure (i.e. “goes short) assets that have depreciated. Risk is measured in terms of a statistic called covariance, which measures the degree to which assets have moved together historically.^
Salient Advisors, L.P. (the “Advisor” or “Salient”) uses a mathematical approach in seeking to achieve the investment objective of the Fund. Using this approach, Salient determines the type, quantity, and mix of investment positions that the Fund should hold in order to achieve equal risk across asset classes/strategies and, to the degree possible, within the asset classes as well. The Advisor does not invest the assets of the Fund in securities or financial instruments based on its view of the investment merit of a particular security or instrument. In addition, the Advisor does not conduct conventional research or analysis, forecast market movements, or take defensive positions apart from those resulting from the systematic allocation to momentum.^
The Fund invests, under normal conditions, in derivatives that create economic leverage and whose performance is expected to correspond to the performance of the underlying asset classes, without investing directly in those asset classes. Using derivatives allows us to gain more exposure to the asset classes than investing in more traditional assets such as stocks and bonds would allow. The performance of derivative instruments is tied to the performance of an underlying currency, security, index, commodity or other asset. In addition to risks relating to their underlying assets, the use of derivatives may include other, possibly greater, risks. Derivatives involve costs, may be volatile, and may involve a small initial investment relative to the risk assumed. Risks associated with the use of derivatives may include counterparty, margin, leverage, correlation, liquidity, tax, market, interest rate and management risks, as well as the risk of potential increased regulation of swaps and other derivatives. Derivatives may also be more difficult to purchase, sell or value than other investments. The Fund may lose more than the cash amount invested on investments in derivatives. Each of these risks is greater for the Fund than mutual funds that do not use derivatives to implement their investment strategy.^
The Fund’s top five positions based on risk contribution as of December 31, 2013 are shown below:
| | |
| | |
| Top 5 Positions by Risk | | % of Risk |
| S&P Mid Futures | | 4.9% |
| Russell 2K Mini | | 4.8% |
| S&P Futures | | 4.5% |
| JSE Futures | | 4.2% |
| MSCI Taiwan Futures | | 3.8% |
The calculation of risk contribution is based on modern portfolio theory’s calculation of portfolio risk and the contribution of a portfolio’s underlying assets to the portfolio risk are based on the dollar weights, standard deviation, and correlation as calculated by Salient Advisors, L.P.
Allocations are subject to change. Data displayed here has been rounded to the nearest tenth for illustrative purposes only. The specific securities identified are not representative of all securities purchased or held by the Fund, and it should not be assumed that the investment in the securities was or will be profitable. Source: Salient Advisors, L.P., December 31, 2013.
^ Portfolio composition is subject to change.
2014 Macro Outlook
More than ever following a year where investing domestically was so profitable for US-based investors, we believe that “globally” remains the operative word for 2014. The forces that drive investment returns, namely the behaviors and risk preferences of investors, are human forces, whether one is discussing sovereign debt in emerging Eastern Europe or small cap stocks here in the U.S.
Understanding the narratives which guide investor behaviors is important, but we believe that starting from a foundation of true diversification among the drivers of investment returns remains key. Thus, we believe that
3
shrewd investing starts from a place of humility, introducing views only where we believe we know something of value that should change our positioning. Here is what we know:
| | • | | US Equity Dominance: The U.S. led developed markets in 2013 with a 32.4% return while emerging markets lagged considerably, posting a -2.4% return for the year. |
| | • | | Low Rates Anchored: Low growth rates, low inflation rates and persistent unemployment have kept short term interest rates in core markets anchored at or near zero. |
| | • | | Rising Rates Already Discounted: In the U.S., markets have already priced in a significant expectation of rising rates into forward curves. |
Based on what we know, here is what we think:
| | • | | Emerging over Developed: We favor emerging equity versus developed equity markets as they approach a 40% discount to developed markets based on P/E multiples. Growing consensus against emerging markets serves only to increase our conviction. |
| | • | | US Valuations Not Extreme: Despite the recent outperformance of U.S. equity markets, they do not appear expensive versus other developed equity markets based upon either price to earnings or enterprise value to trailing 12-month Earnings Before Interest, Taxes, Depreciation and Amortization (EBITDA). |
| | • | | Rally is Old but Supported: Extremely positive sentiment provides a contrarian indicator as we approach the five-year mark of the current bull market; however, it seems unlikely that policy makers would stand idle should the threats of the financial crisis resurface. This may, in our view, place limits on the severity of any market correction this year. |
| | • | | Still Opportunities in Sovereign Debt: The sovereign debt of Latin American issuers and other resourced-based economies like Australia and New Zealand looks attractive as investors are compensated for higher inflation with higher real yields. Furthermore, the secular growth outlooks and structural underpinnings bolster the credit quality of these countries. |
| | • | | Corporate Debt Concerns: We expect any meaningful rise in interest rates to be contemporaneous with a counter-cyclical widening of spreads. The low absolute yield levels of corporate debt issues are justifiable based on the low interest rate environment and historically low default rates; however, the combination of narrow credit spreads and low interest rates renders them more vulnerable to rising rates than duration measures suggest. |
| | • | | Closer to Home: Energy infrastructure remains a favorite theme as domestic oil production has increased by 30% since 2008 and the breakdown between Brent and West Texas Intermediate crude prices reveals logistical impediments in the current architecture of the global energy supply chain. |
Summary
In spite of the negative return for 2013, we are optimistic about the future. We continue to believe in the viability of risk parity as a practical means of implementing modern portfolio theory. The fundamental principle that drives modern portfolio theory and our risk parity strategy is that over a long investment horizon, a truly diversified portfolio is the best way to maximize an investor’s return per unit of risk. In times where one asset class dramatically outperforms others, diversified portfolios can lag ones with concentrated positions in the best performing asset class; however, over the long run, we believe that it is exceedingly difficult to accurately predict which asset class will outperform over the next holding period. Therefore, a diversified portfolio targeting a consistent level of risk high enough to generate meaningful returns over time is in our opinion a sound core building block to many investment portfolios.
4
We look forward to providing regular updates in the future on our progress in executing the Fund’s business plan. Please visit our website at www.salientfunds.com for the latest updates.
Please note that this letter, including the financial information herein, is made available to shareholders of the Fund for their information. It is not a prospectus, circular or representation intended for use in the purchase or sale of shares of the Fund or of any securities mentioned herein.
Sincerely,
Lee Partridge
Chief Investment Officer
Roberto M. Croce, Ph.D.
Director of Quantitative Research
5
Salient Risk Parity Fund
|
| |
| Value of a $1,000,000 Investment |
|
The charts above represent a historical since inception performance comparison of a hypothetical $1,000,000 investment in the indicated share class versus a similar investment in the Fund’s benchmark and represents the reinvestment of dividends and capital gains in the Fund.
The performance data quoted here represents past performance. Past performance is no guarantee of future results. Investment return and principal value will fluctuate, so that an investor’s shares, when redeemed, may be worth more or less than their original cost. Current performance may be lower or higher than the performance information quoted. To obtain performance information current to the most recent month-end please call 866-667-9228.
The performance above reflects any fee waivers that have been in effect during the applicable periods, as well as any expense reimbursements that have periodically been made. Absent such waivers and reimbursements, returns would have been lower. Currently, contractual fee waivers are in effect for the Fund through July 31, 2014.
The 60/40 Index represents an allocation of 60% MSCI AC World Index (Equities), 40% Barclays Aggregate Bond Index (Bonds)—formerly the Lehman Aggregate Bond Index through Nov. 2008. The MSCI World Index is a free float-adjusted market capitalization weighted index that is designed to measure the equity market performance of developed and emerging markets. The Barclays Capital U.S. Aggregate Bond Index is a composite comprised of the Barclays Capital U.S. Intermediate Government/Credit Index and the Barclay Capital Mortgage-Backed Securities Index. All issues in the index are rated investment grade or higher, have a least one year to maturity, and have an outstanding par value of at least $100 million. Note that the Fund’s allocation may differ substantially from 60% equities and 40% bonds. The index returns are from 1/1/2013 onward. One cannot invest directly in an index.
6

Management Discussion of Fund Performance (Unaudited)
Letter to Shareholders
Dear Fellow Shareholders:1
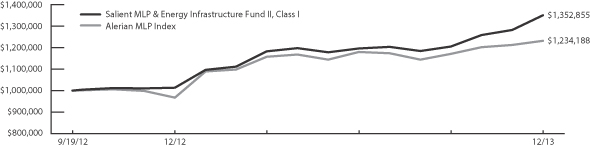
We are pleased to provide the annual report of the Salient MLP & Energy Infrastructure Fund II (“Fund”) for the period ended December 31, 2013. The Fund finished the year with a 5.5% return in December, which was 373 basis points ahead of the Alerian MLP Index (“AMZ”).2 We believe our outperformance in December was driven by stock selection as seven of the 35 names in our portfolio (representing an aggregate 25.0% of the Fund’s weighting) had monthly gains in excess of 10.0%. It should be noted that none of these names (two Shipping, three General Partners (GPs), and two “Other”- NYLD and PEGI) are represented in the AMZ. From a sector standpoint, our overarching theme to overweight General Partners and high-growth MLPs served us well in the month as our eight GPs averaged 8.2% total return for the month while our 14 MLPs averaged 4.3% in December3—both well above the 1.6% total return recorded by the AMZ. As of December 31, 2013, the Fund had total net assets of $509.0 million and a NAV per share (for Class I) of $12.76.
| | | | | | | | | | |
| | | | |
Share Class | | Commencement
Date | | Net Performance without
Sales Charge | | Alerian MLP Index Return |
| | | 2013 | | Since Inception
(Annualized) | | 2013 | | Since Inception of
Fund Share Class
(Annualized) |
Class A (SMAPX) | | 12/21/2012 | | 33.14% | | 31.01% | | 27.58% | | 24.67% |
Class C (SMFPX) | | 1/8/2013 | | 27.13% | | 27.13% | | 20.58% | | 20.58% |
Class I (SMLPX) | | 9/19/2013 | | 33.46% | | 26.58% | | 27.58% | | 17.83% |
| | | | | | |
| | | |
| Share Class | | Commencement
Date | | Net Performance with
Maximum Sales Charge |
| | | 2013 | | Since Inception |
Class A (SMAPX) | | 12/21/2012 | | 25.85% | | 23.98% |
Class C (SMFPX) | | 1/8/2013 | | 26.13% | | 26.13% |
Sources: Salient Capital Advisors, LLC and Alerian Capital Management, December 2013.
Returns above as of December 31, 2013.
The performance data quoted here represents past performance. Past performance is no guarantee of future results. Investment return and principal value will fluctuate, so that an investor’s shares, when redeemed, may be worth more or less than their original cost. Current performance may be lower or higher than the performance information quoted. To obtain performance information current to the most recent month-end please call 866-667-9228. The total annual gross and net operating expense ratios for the Fund based on the current Fund prospectus dated April 30, 2013, are as follows: Class A shares are 2.94% and 1.58% respectively, Class C shares are 3.69% and 2.33% respectively and Class I shares are 2.69% and 1.33% respectively. The adviser has contractually agreed to waive fees and/or reimburse expenses to maintain the Fund’s total operating expenses at 1.55% for Class A, 2.30% for Class C and 1.30% for Class I shares, excluding certain expenses, until July 31, 2014. Additional information pertaining to the December 31, 2013 expense ratios can be found in the financial highlights. Returns do not reflect the taxes that investors may pay or distributions or the sale of shares.
1 Statements in this letter are forward-looking statements. The forward-looking statements and other views expressed herein are those of the portfolio managers and the Fund as of the date of this letter. Actual future results or occurrences may differ significantly from those anticipated in any forward-looking statements, and there is no guarantee that any predictions will come to pass. The views expressed herein are subject to change at any time, due to numerous market and other factors. The Fund disclaims any obligation to update publicly or revise any forward-looking statements or views expressed herein. There can be no assurance that the Fund will achieve its investment objectives. The value of the Fund will fluctuate with the value of the underlying securities.
2 Alerian MLP Index (AMZ) is a composite of the 50 most prominent energy MLPs that provides investors with a comprehensive benchmark for this emerging asset class. An investor may not invest directly in an index. Index performance does not reflect the deduction of fees and expenses.
3 FactSet, December 2013.
7
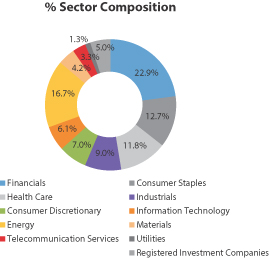
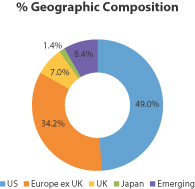
The Fund’s portfolio composition and holdings at year-end are shown below:
Sector Composition4,5
as of December 31, 2013
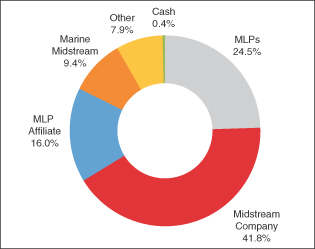
Top 10 Holdings4,5
as of December 31, 2013
| | | | | | | | |
| Company Name | | Ticker | | Sector | | Allocation | |
The Williams Companies, Inc. | | WMB | | Midstream Company | | | 7.5 | % |
Targa Resources Corp | | TRGP | | Midstream Company | | | 7.1 | % |
ONEOK, Inc. | | OKE | | Midstream Company | | | 6.1 | % |
Kinder Morgan Management, LLC | | KMR | | MLP Affiliate | | | 5.8 | % |
LinnCo, LLC | | LNCO | | MLP Affiliate | | | 5.8 | % |
Plains GP Holdings, LP | | PAGP | | Midstream Company | | | 4.7 | % |
Spectra Energy Corp | | SE | | Midstream Company | | | 4.5 | % |
NRG Yield, Inc. | | NYLD | | Other | | | 4.5 | % |
Enbridge Energy Management, LLC | | EEQ | | MLP Affiliate | | | 4.4 | % |
Semgroup Corp | | SEMG | | Midstream Company | | | 4.3 | % |
4 Data displayed here has been rounded to the nearest tenth for illustrative purposes only. The specific securities identified are not representative of all of the securities purchased or held by the Fund, and it should not be assumed that the investment in the securities identified was or will be profitable. Cash includes cash equivalents and unsettled security positions. Allocations are subject to change.
5 Source: Salient Capital Advisors, LLC, December 2013.
8
In 2013, the top and bottom contributors to the Fund’s performance included:
| | | | | | | | |
|
| Top 5 Contributors to Fund Performance |
| | | Security | | Ticker | | Return | | Fund
Contribution |
| 1 | | Targa Resources Corp. | | TRGP | | 69.6% | | 3.9% |
| 2 | | Crosstex Energy Inc. | | XTXI | | 149.9% | | 3.5% |
| 3 | | NRG Yield, Inc. | | NYLD | | 84.0% | | 2.4% |
| 4 | | Williams Companies, Inc. | | WMB | | 20.0% | | 1.7% |
| 5 | | ONEOK, Inc. | | OKE | | 35.4% | | 1.6% |
| | | | | | | | |
|
| Bottom 5 Contributors to Fund Performance |
| | | Security | | Ticker | | Return | | Fund
Contribution |
| 1 | | Cheniere Energy Partners, LP Holdings, LLC | | CQH | | -6.3% | | -0.1% |
| 2 | | TransCanada Corp. | | TRP | | -3.4% | | 0.1% |
| 3 | | SeaDrill Limited | | SDRL | | -27.4% | | -0.1% |
| 4 | | Kinder Morgan Inc warrants | | KMI | | -24.5% | | -0.3% |
| 5 | | EV Energy Partners LP | | EVEP | | -32.2% | | -0.8% |
Source: Salient Advisors, L.P., December 2013.
For illustrative purposes only. Past performance is no guarantee of future results.
Numbers have been rounded for illustrative purposes.
In 2013, MLPs gained 27.6% buoyed in our view by strong organic capex6 budgets that have supported attractive sector-wide distribution growth. Investor interest in MLPs continued to be robust as witnessed by five closed-end fund launches (raising an aggregate of nearly $4B) and a record 21 individual MLP IPOs which raised an additional $9.9 billion including the $2.9 billion Plains GP Holdings offering which was the single largest North American IPO in 2013.^
Performance was front-loaded with MLPs recording 70.0% of their 2013 returns during the first half of the year (through May) which we largely attribute to a “catch-up” as MLPs had lagged the broader market considerably during the prior year. When the Fed raised the possibility of “tapering” it’s quantitative easing (QE) program in late May, MLPs stalled as we believe investors mulled over what the impact would be for MLPs in what would likely be a rising interest rate environment. For the next three months (June-August), MLPs moved sideways gaining just 0.1% as investor’s continued to wrestle with the ultimate impact of the Fed’s actions. During this period, per our analysis, MLPs held up better than other income-oriented asset classes such as utilities which fell 1.7% while REITs tumbled 8.8%.7 Interestingly, MLPs resumed their upward trajectory following the Fed’s September “non-taper” announcement. MLPs gained 5.3% over the final three months of the year, we believe due to investors getting comfortable with slightly higher interest rates if those rates are rising as the result of an improving macroeconomic picture. Our research indicates that MLP performance historically has not gone negative until the yield spread between the US 10 Year Treasury yield and MLP yields dip below 150 bps. The current yield spread is 286 basis points as of December 31, 2013 with MLPs at 5.9% and the U.S. 10 Year Treasury yield at 3.0%, so we believe that MLPs still have some room to run.^
6 “Capex” or capital expenditures are expenditures creating future benefits. A capital expenditure is incurred when a business spends money either to buy fixed assets or to add to the value of an existing fixed asset with a useful life extending beyond the taxable year.
7 Dow Jones U.S. Utilities Index measures the performance of utility companies within the United States. RISKS: Non-diversified and therefore may be more volatile than the S&P 500 Index. MSCI U.S. REIT Index, a free float-adjusted market capitalization index, consists of equity REITs that are included in the MSCI US Investable Market 2500 Index, except for specialty equity REITs that do not generate a majority of their revenue and income from real estate rental and leasing operations. RISKS: Real estate industry concentration risk (non-diversification), interest rate risk (as interest rates rise bond prices usually fall), the risk of issuer default, and inflation risk exist.
^ Portfolio composition is subject to change.
9
Summary
Because fewer “bargains” exist as we continue into 2014, we believe that intelligent stock selection will be even more critical to investing success over the next 12 months than it usually is. We know it is trite to say that 2014 is going to be a “stock picker’s market” but with many MLPs trading at or near their highs as we close out 2013, correctly choosing the names that have the ability to outperform will be challenging. We readily accept this challenge for 2014 and beyond. Please visit our website at www.salientfunds.com for the latest updates.
Please note that this letter, including the financial information herein, is made available to shareholders of the Fund for their information. It is not a prospectus, circular or representation intended for use in the purchase or sale of the Fund or of any securities mentioned in this letter.
Sincerely,
Gregory A. Reid
President and Chief Executive Officer
MLP Business, Salient Capital Advisors, LLC
10
Salient MLP & Energy Infrastructure Fund II
|
| |
| Value of a $1,000,000 Investment |
|
The charts above represent a historical since inception performance comparison of a hypothetical $1,000,000 investment in the indicated share class versus a similar investment in the Fund’s benchmark and represents the reinvestment of dividends and capital gains in the Fund.
The performance data quoted here represents past performance. Past performance is no guarantee of future results. Investment return and principal value will fluctuate, so that an investor’s shares, when redeemed, may be worth more or less than their original cost. Current performance may be lower or higher than the performance information quoted. To obtain performance information current to the most recent month-end please call 866-667-9228.
The performance above reflects any fee waivers that have been in effect during the applicable periods, as well as any expense reimbursements that have periodically been made. Absent such waivers and reimbursements, returns would have been lower. Currently, contractual fee waivers are in effect for the Fund through July 31, 2014.
Alerian MLP Index (AMZ) is a composite of the 50 most prominent energy MLPs that provides investors with a comprehensive benchmark for this emerging asset class.
An investor may not invest directly in an index. Index performance does not reflect the deduction of fees and expenses.
11

Management Discussion of Fund Performance (Unaudited)
Letter to Shareholders
Dear Fellow Shareholders:1
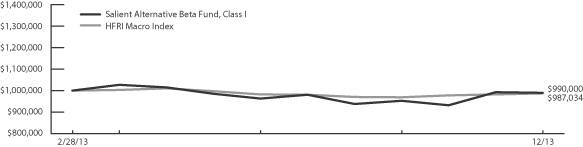
We were pleased to launch the Salient Alternative Beta Fund (the “Fund”) in February 2013. In a challenging environment for alternative funds executing global macro strategies, the Fund (Class I) lost 1% for the period since inception, which was attributable to gains from futures contracts offset by losses from forward currency exchange contracts and swap agreements. While we were pleased to see the Fund outperform its benchmark on both an absolute and risk-adjusted basis, our objective continues to be the generation of positive returns with the potential to diversify equity-oriented investment portfolios.
| | | | | | |
| | | | |
| Share Class | | Commencement
Date | | Net Performance Since
Inception
Without Sales Charge | | HFRI Macro
Index2 Return |
Class A (SABAX) | | 3/28/2013 | | -4.73% | | -1.66% |
Class C (SABCX) | | 3/28/2013 | | -5.30% | | -1.66% |
Class I (SABFX) | | 2/28/2013 | | -1.00% | | -1.26% |
| | | | |
| | | |
| Share Class | | Commencement
Date | | Net Performance Since
Inception With
Maximum Sales Charge |
Class A (SABAX) | | 3/28/2013 | | -9.94% |
Class C (SABCX) | | 3/28/2013 | | -6.25% |
Source: Salient Advisors, L.P. and Bloomberg, December 2013.
Returns above as of December 31, 2013.
The performance data quoted here represents past performance. Past performance is no guarantee of future results. Investment return and principal value will fluctuate, so that an investor’s shares, when redeemed, may be worth more or less than their original cost. Current performance may be lower or higher than the performance information quoted. To obtain performance information current to the most recent month-end please call 866-667-9228. The total annual gross and net operating expense ratios for the Fund based on the current Fund prospectus dated April 30, 2013, are as follows: Class A shares are 2.66% and 1.69% respectively, Class C shares are 3.41% and 2.44% respectively and Class I shares are 2.41% and 1.44% respectively. The adviser has contractually agreed to waive fees and/or reimburse expenses to maintain the Fund’s total operating expenses at 1.55% for Class A, 2.30% for Class C and 1.30% for Class I shares, excluding certain expenses, until July 31, 2014. Additional information pertaining to the December 31, 2013 expense ratios can be found in the financial highlights. Returns do not reflect the taxes that investors may pay or distributions or the sale of shares.
1 Certain statements in this letter are forward-looking statements. The forward-looking statements and other views expressed herein are those of the portfolio managers and the Fund as of the date of this letter. Actual future results or occurrences may differ significantly from those anticipated in any forward-looking statements, and there is no guarantee that any predictions will come to pass. The views expressed herein are subject to change at any time, due to numerous market and other factors. The Fund disclaims any obligation to update publicly or revise any forward-looking statements or views expressed herein. There can be no assurance that the Fund will achieve its investment objectives. The value of the Fund will fluctuate with the value of the underlying securities.
2 The HFRI Macro (Total) Index: is an equally-weighted performance index of numerous hedge fund managers pursuing Macro strategies, which are predicated on theses about future movements in global macroeconomic variables and how financial instruments might respond to such movements. The Fund does not invest in hedge funds; rather it invests both long and short primarily in futures and forward contracts in order to gain exposure to a variety of non-traditional risk premia. The index only reports monthly data, thus the index returns above are from 4/1/2013 onwards (For Class A and C share comparisons) and from 3/1/2013 onwards (for I share comparison). One cannot invest directly in an index.
12
We believe that the alternative risk exposures the Fund seeks out should have a positive expected return over time, and that including them alongside traditional holdings can potentially provide a valuable diversification benefit. We carefully chose the strategies in the Fund, selecting ones where we believe there is substantial academic research documenting a positive risk premium in the strategy, theoretical justification for it to persist, and limited reason to believe it will lose value in sympathy with equities. Thus, while performance will vary from period to period, it is our intent that the portfolio over time will not be indicative or strongly related to equity market returns.
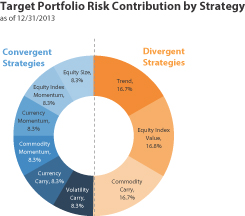
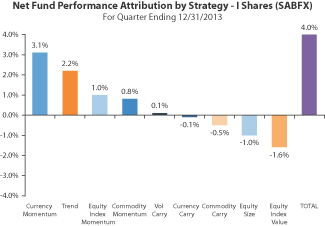
Six of the nine strategies employed in the Fund produced positive returns in 2013, but losses in the Fund’s most defensive strategy, Equity Index Value, along with losses in Commodity Carry and Currency Carry, left the Fund down for the year. Equity Index Value detracted the most from Fund performance as more expensive European equity markets outperformed less expensive Asian equities. Equity Index Momentum was the second largest contributor to Fund performance as positive trends in domestic and developed international equity markets continued through the year. Both Equity Index Value and Equity Index Momentum take offsetting positions resulting in a zero net exposure to equities in each sleeve. Even though both strategies operate in the equity asset class, they produced very different returns in 2013. This serves as an excellent illustration of how the strategies employed in Alternative Beta are designed to capture alternative risk premia within different asset classes, not the risk premia of the asset classes themselves.^
Investment Strategies and Techniques
The investment objective of the Salient Alternative Beta Fund is to seek long term capital appreciation with low correlation to traditional core equity and bond market exposures. The Fund invests both long and short, primarily in futures and forward contracts, in order to gain exposure to a variety of non-traditional risk premia.^
The Fund invests, under normal conditions, in derivatives that create economic leverage and whose performance is expected to correspond to the performance of the underlying asset classes, without investing directly in those asset classes. Using derivatives allows us to gain more exposure to the asset classes than investing in more traditional assets such as stocks and bonds would allow. The performance of derivative instruments is tied to the performance of an underlying currency, security, index, commodity or other asset. In addition to risks relating to their underlying assets, the use of derivatives may include other, possibly greater, risks. Derivatives involve costs, may be volatile, and may involve a small initial investment relative to the risk assumed. Risks associated with the use of derivatives may include counterparty, margin, leverage, correlation, liquidity, tax, market, interest rate and management risks, as well as the risk of potential increased regulation of swaps and other derivatives. Derivatives may also be more difficult to purchase, sell or value than other investments. The Fund may lose more than the cash amount invested on investments in derivatives. Each of these risks is greater for the Fund than mutual funds that do not use derivatives to implement their investment strategy.^
^ Portfolio composition is subject to change.
The data displayed in pie chart have been rounded to the nearest tenth decimal for illustrative purposes only. Allocations are subject to change.
Source: Salient Advisors, L.P., December 31, 2013.
13
2014 Macro Outlook
More than ever following a year where investing domestically was so profitable for US-based investors, we believe that “globally” remains the operative word for 2014. The forces that drive investment returns, namely the behaviors and risk preferences of investors, are human forces, whether one is discussing sovereign debt in emerging Eastern Europe or small cap stocks here in the U.S.
Understanding the narratives which guide investor behaviors is important, but we believe that starting from a foundation of true diversification among the drivers of investment returns remains key. Thus, we believe that shrewd investing starts from a place of humility, introducing views only where we believe we know something of value that should change our positioning. Here is what we know:
| | n | | US Equity Dominance: The U.S. led developed markets in 2013 with a 32.4% return while emerging markets lagged considerably, posting a -2.4% return for the year. |
| | n | | Low Rates Anchored: Low growth rates, low inflation rates and persistent unemployment have kept short term interest rates in core markets anchored at or near zero. |
| | n | | Rising Rates Already Discounted: In the U.S., markets have already priced in a significant expectation of rising rates into forward curves. |
Based on what we know, here is what we think:
| | n | | Emerging over Developed: We favor emerging equity versus developed equity markets as they approach a 40% discount to developed markets based on P/E multiples. Growing consensus against emerging markets serves only to increase our conviction. |
| | n | | US Valuations Not Extreme: Despite the recent outperformance of U.S. equity markets, they do not appear expensive versus other developed equity markets based upon either price to earnings or enterprise value to trailing 12-month Earnings Before Interest, Taxes, Depreciation and Amortization (EBITDA). |
| | n | | Rally is Old but Supported: Extremely positive sentiment provides a contrarian indicator as we approach the five-year mark of the current bull market; however, it seems unlikely that policy makers would stand idle should the threats of the financial crisis resurface. This may, in our view, place limits on the severity of any market correction this year. |
| | n | | Still Opportunities in Sovereign Debt: The sovereign debt of Latin American issuers and other resourced-based economies like Australia and New Zealand looks attractive as investors are compensated for higher inflation with higher real yields. Furthermore, the secular growth outlooks and structural underpinnings bolster the credit quality of these countries. |
| | n | | Corporate Debt Concerns: We expect any meaningful rise in interest rates to be contemporaneous with a counter-cyclical widening of spreads. The low absolute yield levels of corporate debt issues are justifiable based on the low interest rate environment and historically low default rates; however, the combination of narrow credit spreads and low interest rates renders them more vulnerable to rising rates than duration measures suggest. |
| | n | | Closer to Home: Energy infrastructure remains a favorite theme as domestic oil production has increased by 30% since 2008 and the breakdown between Brent and West Texas Intermediate crude prices reveals logistical impediments in the current architecture of the global energy supply chain. |
14
Summary
While we are hopeful that absolute returns in the future will be improved, performance in 2013 was in line with the benchmark and well within our range of expectations. The alternative return streams targeted in the Salient Alternative Beta Fund are ones that we believe have theoretical justification for a long term positive expected return. Furthermore, with the offsetting exposures in most of the strategies employed, we anticipate the Fund will remain loosely correlated with traditional beta exposures. For these reasons, we are proud to have launched the Salient Alternative Beta Fund and look forward to 2014.
We look forward to providing regular updates in the future on our progress in executing the Fund’s business plan. Please visit our website at www.salientfunds.com for the latest updates.
Please note that this letter, including the financial information herein, is made available to shareholders of the Fund for their information. It is not a prospectus, circular or representation intended for use in the purchase or sale of shares of the Fund or of any securities mentioned herein.
Sincerely,
Lee Partridge
Chief Investment Officer
Roberto M. Croce, Ph.D.
Director of Quantitative Research
15
Salient Alternative Beta Fund
|
| |
| Value of a $1,000,000 Investment |
|
The charts above represent a historical since inception performance comparison of a hypothetical $1,000,000 investment in the indicated share class versus a similar investment in the Fund’s benchmark and represents the reinvestment of dividends and capital gains in the Fund.
The performance data quoted here represents past performance. Past performance is no guarantee of future results. Investment return and principal value will fluctuate, so that an investor’s shares, when redeemed, may be worth more or less than their original cost. Current performance may be lower or higher than the performance information quoted. To obtain performance information current to the most recent month-end please call 866-667-9228.
The performance above reflects any fee waivers that have been in effect during the applicable periods, as well as any expense reimbursements that have periodically been made. Absent such waivers and reimbursements, returns would have been lower. Currently, contractual fee waivers are in effect for the Fund through July 31, 2014.
The HFRI Macro (Total) Index: is an equally weighted performance index of numerous hedge fund managers pursuing Macro strategies, which are predicated on theses about future movements in global macroeconomic variables and how financial instruments might respond to such movements. The Fund does not invest in hedge funds; rather it invests both long and short primarily in futures and forward contracts in order to gain exposure to a variety of non-traditional risk premia. The index only reports monthly data, thus the index returns above are from 4/1/2013 onwards (For Class A and C share comparisons) and from 3/1/2013 onwards (for I share comparison). One cannot invest directly in an index.
16

Management Discussion of Fund Performance (Unaudited)
Letter to Shareholders
Dear Fellow Shareholders:1
2013 was an exciting inaugural year for the Salient Trend Fund (the “Fund”) as surging equity markets and well-positioned commodity exposures resulted in a 22.24% return (for Class I), of which all was attributable to futures contracts. The Fund was able to capture gains from the equity markets while still achieving a moderately low correlation to the S&P 500 of 0.47. In the long run, we expect the correlation to equities to be substantially lower as the fund will take both long and short equity positions as market sentiment changes.
| | | | | | |
| | | | |
| Share Class | | Commencement
Date | | Net Performance Since
Inception
Without Sales Charge | | Barclay
BTOP 50
Index2 Return |
Class A (SPTAX) | | 3/28/2013 | | 14.73% | | -1.07% |
Class C (SPTCX) | | 3/28/2013 | | 13.96% | | -1.07% |
Class I (SPTIX) | | 1/2/2013 | | 22.24% | | 0.92% |
| | | | |
| | | |
| Share Class | | Commencement
Date | | Net Performance Since
Inception With
Maximum Sales Charge |
Class A (SPTAX) | | 3/28/2013 | | 8.42% |
Class C (SPTCX) | | 3/28/2013 | | 12.96% |
Source: Salient Advisors, L.P. and Barclay Hedge, December 2013.
Returns above as of December 31, 2013.
The performance data quoted here represents past performance. Past performance is no guarantee of future results. Investment return and principal value will fluctuate, so that an investor’s shares, when redeemed, may be worth more or less than their original cost. Current performance may be lower or higher than the performance information quoted. To obtain performance information current to the most recent month-end please call 866-667-9228. The total annual gross and net operating expense ratios for the Fund based on the current Fund prospectus dated April 30, 2013, are as follows: Class A shares are 2.62% and 1.69% respectively, Class C shares are 3.37% and 2.44% respectively and Class I shares are 2.37% and 1.44% respectively. The adviser has contractually agreed to waive fees and/or reimburse expenses to maintain the Fund’s total operating expenses at 1.55% for Class A, 2.30% for Class C and 1.30% for Class I shares, excluding certain expenses, until July 31, 2014. Additional information pertaining to the December 31, 2013 expense ratios can be found in the financial highlights. Returns do not reflect the taxes that investors may pay or distributions or the sale of shares.
1 Certain statements in this letter are forward-looking statements. The forward-looking statements and other views expressed herein are those of the portfolio managers and the Fund as of the date of this letter. Actual future results or occurrences may differ significantly from those anticipated in any forward-looking statements, and there is no guarantee that any predictions will come to pass. The views expressed herein are subject to change at any time, due to numerous market and other factors. The Fund disclaims any obligation to update publicly or revise any forward-looking statements or views expressed herein. There can be no assurance that the Fund will achieve its investment objectives. The value of the Fund will fluctuate with the value of the underlying securities.
2 The Barclay BTOP50 Index: seeks to replicate the overall composition of the managed futures industry with regard to trading style and overall market exposure. To be included in the BTOP50, the trading advisors must be: open for investment, willing to provide daily returns, at least two years of trading activity, and the advisors must have at least three years of operating history. The BTOP50 portfolio is equally weighted among the selected programs at the beginning of each calendar year and is rebalanced annually. The BTOP50 consists of a subset of the advisors who make up the managed futures industry, whereas the Fund is a single advisor. The index returns are from 3/27/2013 onwards (For Class A and C share comparisons) and from 1/2/2013 onwards (for I share comparison). One cannot invest directly in an index.
17
The Salient Trend Fund generated positive returns in each quarter of 2013. During Q1, the Fund gained 5.5% from strong returns in the equities and commodities sleeves. Q2 started off with the strongest month of the year as the Fund generated a 10.62% gain in April with positive contributions from equities, commodities and fixed income. May and June were difficult months as the Fund gave back 7.6% as a result of losses in the equities and fixed income buckets. Following the drawdown, the Fund realized its strongest quarterly return for the year as large equity gains in July and September resulted in a 7.05% Q3 return. Equities generated a positive return in each month during Q4, which, along with a modest contribution from the fixed income sleeve, more than offset losses in the commodities sleeve, resulting in a 5.89% return for the quarter.^
The majority of the returns for the year were generated by the long term signal as well-established trends in investor sentiment continued throughout 2013. The medium term signal was close to flat for the year while the short term signal detracted slightly from fund performance. March served as an excellent illustration of the diversifying power of the three signals as gains in the short and medium term signals nearly offset losses in the long term signal, leaving the fund down 0.09%.^
The Fund’s emphasis on long-term trend-following strategies, which we believe exhibit the lowest correlation to equity markets in periods of stress, was the primary source of strong results in 2013.
The Fund entered 2013 with a long position in equities and a slightly short fixed income position. The commodities sleeve was long energies, long metals, and short agricultural commodities. By the start of the second quarter, the allocation shifted to one that was short agricultural commodities and long fixed income. Rising yields in May shifted the fixed income positions back to slightly short, which proved to be a beneficial change as yields rose sharply in June. The Fund finished the year bullish on equities, short fixed income and short commodities.
The Fund’s risk allocation as of December 31, 2013 is shown in the pie charts below:
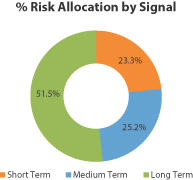
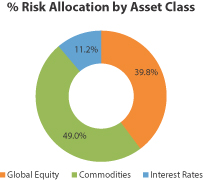
The data displayed in the pie charts have been rounded to the nearest tenth for illustrative purposes only. Allocations are subject to change.
Source: Salient Advisors, L.P., December 31, 2013.
^ Portfolio composition is subject to change.
Investment Strategies and Techniques
The Salient Trend Fund seeks long term capital appreciation with low correlation to traditional core equity and bond market exposures. The Fund seeks to achieve this goal by constructing a portfolio that captures short, medium and long term price trends. The Fund can invest in equities, commodities, interest rates, and currencies. Risk is measured in terms of a statistic called covariance, which measures the degree to which assets have moved together historically.
18
The Fund’s investment process begins with the construction of a proprietary, systematic trend-following strategy. Next, the Fund determines which global markets are appropriate for this strategy. The Fund then constructs a portfolio in which it attempts to balance the risk contribution of each trend-following strategy and the asset classes within each strategy and for which it targets a 20% annualized standard deviation of returns. The risk calculation is derived from each strategy’s standard deviation of returns, its correlation with each of the other strategies within the portfolio and the percentage weight of each strategy within the portfolio. The portfolio is rebalanced dynamically according to this framework on a monthly basis.^
The Fund invests, under normal conditions, in derivatives that create economic leverage and whose performance is expected to correspond to the performance of the underlying asset classes, without investing directly in those asset classes. Using derivatives allows us to gain more exposure to the asset classes than investing in more traditional assets such as stocks and bonds would allow. The performance of derivative instruments is tied to the performance of an underlying currency, security, index, commodity or other asset. In addition to risks relating to their underlying assets, the use of derivatives may include other, possibly greater, risks. Derivatives involve costs, may be volatile, and may involve a small initial investment relative to the risk assumed. Risks associated with the use of derivatives may include counterparty, margin, leverage, correlation, liquidity, tax, market, interest rate and management risks, as well as the risk of potential increased regulation of swaps and other derivatives. Derivatives may also be more difficult to purchase, sell or value than other investments. The Fund may lose more than the cash amount invested on investments in derivatives. Each of these risks is greater for the Fund than mutual funds that do not use derivatives to implement their investment strategy.^
The Fund’s top five long and short positions based on risk contribution as of December 31, 2013 are shown below:^
| | | | | | | | |
| | |
| LONG POSITIONS | | | | SHORT POSITIONS |
| Holding | | % Risk
Allocation | | | | Holding | | % Risk
Allocation |
| GasOil Futures | | 5.3% | | | | Aluminum Futures | | 5.0% |
| Cocoa Futures | | 5.1% | | | | Sugar Futures | | 4.9% |
| Nat Gas Futures | | 4.2% | | | | Silver Futures | | 4.8% |
| Soybean Futures | | 3.1% | | | | Nickel Futures | | 4.8% |
| MSCI Taiwan Futures | | 3.1% | | | | Gold Futures | | 4.7% |
Allocations are subject to change. Data displayed here has been rounded to the nearest tenth for illustrative purposes only. The specific securities identified are not representative of all securities purchased or held by the Fund, and it should not be assumed that the investment in the securities was or will be profitable. Source: Salient Advisors, L.P., December 31, 2013.
2014 Macro Outlook
More than ever following a year where investing domestically was so profitable for US-based investors, we believe that “globally” remains the operative word for 2014. The forces that drive investment returns, namely the behaviors and risk preferences of investors, are human forces, whether one is discussing sovereign debt in emerging Eastern Europe or small cap stocks here in the U.S.
Understanding the narratives which guide investor behaviors is important, but we believe that starting from a foundation of true diversification among the drivers of investment returns remains key. Thus, we believe that shrewd investing starts from a place of humility, introducing views only where we believe we know something of value that should change our positioning. Here is what we know:
| | n | | US Equity Dominance: The U.S. led developed markets in 2013 with a 32.4% return while emerging markets lagged considerably, posting a -2.4% return for the year. |
19
^ Portfolio composition is subject to change.
| | n | | Low Rates Anchored: Low growth rates, low inflation rates and persistent unemployment have kept short term interest rates in core markets anchored at or near zero. |
| | n | | Rising Rates Already Discounted: In the U.S., markets have already priced in a significant expectation of rising rates into forward curves. |
Based on what we know, here is what we think:
| | n | | Emerging over Developed: We favor emerging equity versus developed equity markets as they approach a 40% discount to developed markets based on P/E multiples. Growing consensus against emerging markets serves only to increase our conviction. |
| | n | | US Valuations Not Extreme: Despite the recent outperformance of U.S. equity markets, they do not appear expensive versus other developed equity markets based upon either price to earnings or enterprise value to trailing 12-month Earnings Before Interest, Taxes, Depreciation and Amortization (EBITDA). |
| | n | | Rally is Old but Supported: Extremely positive sentiment provides a contrarian indicator as we approach the five-year mark of the current bull market; however, it seems unlikely that policy makers would stand idle should the threats of the financial crisis resurface. This may, in our view, place limits on the severity of any market correction this year. |
| | n | | Still Opportunities in Sovereign Debt: The sovereign debt of Latin American issuers and other resourced-based economies like Australia and New Zealand looks attractive as investors are compensated for higher inflation with higher real yields. Furthermore, the secular growth outlooks and structural underpinnings bolster the credit quality of these countries. |
| | n | | Corporate Debt Concerns: We expect any meaningful rise in interest rates to be contemporaneous with a counter-cyclical widening of spreads. The low absolute yield levels of corporate debt issues are justifiable based on the low interest rate environment and historically low default rates; however, the combination of narrow credit spreads and low interest rates renders them more vulnerable to rising rates than duration measures suggest. |
| | n | | Closer to Home: Energy infrastructure remains a favorite theme as domestic oil production has increased by 30% since 2008 and the breakdown between Brent and West Texas Intermediate crude prices reveals logistical impediments in the current architecture of the global energy supply chain. |
Summary
We were very pleased with the Salient Trend Fund’s performance in 2013. We strongly believe in the viability of trend-following as a practical means of diversifying one’s traditional portfolio without potentially sacrificing the upside and without relying solely on interest rate-sensitive assets.
We look forward to providing regular updates in the future on our progress in executing the Fund’s business plan. Please visit our website at www.salientfunds.com for the latest updates.
Please note that this letter, including the financial information herein, is made available to shareholders of the Fund for their information. It is not a prospectus, circular or representation intended for use in the purchase or sale of shares of the Fund or of any securities mentioned herein.
Sincerely,
Lee Partridge
Chief Investment Officer
Roberto M. Croce, Ph.D.
Director of Quantitative Research
20
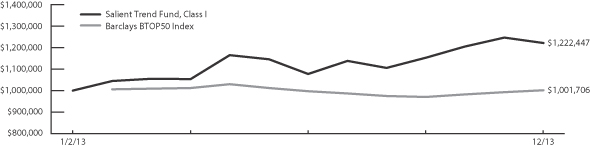
Salient Trend Fund
|
| |
| Value of a $1,000,000 Investment |
|
The charts above represent a historical since inception performance comparison of a hypothetical $1,000,000 investment in the indicated share class versus a similar investment in the Fund’s benchmark and represents the reinvestment of dividends and capital gains in the Fund.
The performance data quoted here represents past performance. Past performance is no guarantee of future results. Investment return and principal value will fluctuate, so that an investor’s shares, when redeemed, may be worth more or less than their original cost. Current performance may be lower or higher than the performance information quoted. To obtain performance information current to the most recent month-end please call 866-667-9228
The performance above reflects any fee waivers that have been in effect during the applicable periods, as well as any expense reimbursements that have periodically been made. Absent such waivers and reimbursements, returns would have been lower. Currently, contractual fee waivers are in effect for the Fund through July 31, 2014.
The Barclay BTOP50 Index: seeks to replicate the overall composition of the managed futures industry with regard to trading style and overall market exposure. To be included in the BTOP50, the trading advisors must be: open for investment, willing to provide daily returns, at least two years of trading activity, and the advisors must have at least three years of operating history. The BTOP50 portfolio is equally weighted among the selected programs at the beginning of each calendar year and is rebalanced annually. The BTOP50 consists of a subset of the advisors who make up the managed futures industry, whereas the Fund is a single advisor. The index returns are from 3/27/2013 onwards (For Class A and C share comparisons) and from 1/2/2013 onwards (for I share comparison). One cannot invest directly in an index.
21

Management Discussion of Fund Performance (Unaudited)
Letter to Shareholders
Dear Fellow Shareholders:1
It has been an exciting first year for the Salient Global Equity Fund (SGEAX, SGECX, SGEIX) (the “Fund”). As of December 31, 2013, the Fund had total investments of over $60 million and a NAV per share of $11.77 (for Class I) after paying $0.31 in dividends.
| | | | | | |
| | | | |
| Share Class | | Commencement
Date | | Net Performance Since
Inception
Without Sales Charge | | MSCI AC
World
Index2 Return |
Class A (SGEAX) | | 2/4/2013 | | 16.69% | | 16.52% |
Class C (SGECX) | | 2/4/2013 | | 15.84% | | 16.52% |
Class I (SGEIX) | | 1/3/2013 | | 20.80% | | 20.19% |
| | | | |
| | | |
| Share Class | | Commencement
Date | | Net Performance Since
Inception With
Maximum Sales Charge |
Class A (SGEAX) | | 2/4/2013 | | 10.28% |
Class C (SGECX) | | 2/4/2013 | | 14.84% |
Source: Salient Advisors, L.P. and MSCI, December 2013.
Returns above as of December 31, 2013.
The performance data quoted here represents past performance. Past performance is no guarantee of future results. Investment return and principal value will fluctuate, so that an investor’s shares, when redeemed, may be worth more or less than their original cost. Current performance may be lower or higher than the performance information quoted. To obtain performance information current to the most recent month-end please call 866-667-9228. The total annual gross and net operating expense ratios for the Fund based on the current Fund prospectus dated April 30, 2013, are as follows: Class A shares are 3.14% and 1.85% respectively, Class C shares are 3.89% and 2.60% respectively and Class I shares are 2.89% and 1.60% respectively. The adviser has contractually agreed to waive fees and/or reimburse expenses to maintain the Fund’s total operating expenses at 1.85% for Class A, 2.60% for Class C and 1.60% for Class I shares, excluding certain expenses, until July 31, 2014. Additional information pertaining to the December 31, 2013 expense ratios can be found in the financial highlights. Returns do not reflect the taxes that investors may pay or distributions or the sale of shares.
1 Certain statements in this letter are forward-looking statements. The forward-looking statements and other views expressed herein are those of the portfolio managers and the Fund as of the date of this letter. Actual future results or occurrences may differ significantly from those anticipated in any forward-looking statements, and there is no guarantee that any predictions will come to pass. The views expressed herein are subject to change at any time, due to numerous market and other factors. The Fund disclaims any obligation to update publicly or revise any forward-looking statements or views expressed herein. There can be no assurance that the Fund will achieve its investment objectives. The value of the Fund will fluctuate with the value of the underlying securities.
2 The MSCI All Country World Index: is a free float-adjusted market capitalization weighted index that is designed to measure the equity market performance of developed and emerging markets. The Index consists of approximately 2,500 stocks as of December, 2013, while the Fund will build a portfolio of 40-60 stocks. The index returns are from 2/3/2013 onwards (For Class A and C share comparisons) and from 1/3/2013 onwards (for I share comparison). One cannot invest directly in an index.
22
Annual Update
2013 was a strong year for global equities, with MSCI ACWI up 22.8% (up 20.2% since the inception of the Fund). U.S. markets led with a 31.5% return for the S&P 500 while Europe lagged with the MSCI Europe Index returning 22.3%. Notably, emerging markets were down 2.6% and Japan, which was up 54.6% in local currency, was only up 27.2% in dollar terms. Although the Fund lagged in the first quarter of 2013, it subsequently experienced three consecutive quarters of outperformance, ending the year with a gain of 20.8% compared to the benchmark’s gain of 20.2%.
While global equities lagged the U.S. markets substantially in the first half of the year, they followed one another more closely in the second half of 2013 with the MSCI ACWI generating a total return of 15.8% compared to the
S&P 500’s 15.9%. Within the MSCI ACWI, Europe was the breakout performer with the MSCI Europe Index up 22.6%. Asia-Pacific markets and emerging markets lagged however, with Japan, Australia and the emerging markets indices up only 9.1%, 11.0% and 7.7%, respectively, during the second half of 2013.3
The Fund outperformed the MSCI ACWI benchmark in the second half primarily due to the Fund’s overweight to Europe. We remain bullish on Europe’s recovery and are collecting healthy dividends from investments in high quality multinationals with above-average yields while we wait for potential price appreciation. It is for this reason that we will look to maintain our approximate double weight to Europe/UK versus the MSCI ACWI.^
Throughout the second half of the year, we began cautiously adding exposure to emerging markets. It was our view and an operative theme at the start of 2013, that the commodity super-cycle had ended and that emerging markets would suffer due to their high correlations with commodity prices; however, we think valuations in markets like China have become increasingly compelling. We have added a few positions in China and will continue to look for attractively priced stocks that may benefit from our emerging markets consumption theme.^
The data displayed in pie charts have been rounded to the nearest whole number for illustrative purposes only. Allocations are subject to change.
Source: Salient Advisors, L.P., December 31, 2013.
3 Japan returns are based on the MSCI Japan Index. Australia returns are based on the MSCI Australia Index. Emerging markets returns are based on the MSCI Emerging Markets Index.
^ Portfolio composition is subject to change.
23
For the second half of 2013, the top five contributors to the Fund’s performance were Vivendi (VIV-PAR), Daimler AG, (DAI-ETR), Rockwell Automation (ROK), CVS Caremark (CVS), and Fiserv (FISV). The European names (VIV-PAR and DAI-ETR) were opportunistic investments that we believe benefited from our tactical view on Europe. ROK, CVS and FISV are quality companies that exhibit sustainable competitive advantages over their industry peers, reporting strong growth and profitability for the second half of 2013.^
The five largest detractors to the Fund’s performance were TGS Nopec Geophysical (TGS-NO), Saipem (SPM-MIL), Tenaris (TS), ICICI Bank (IBN), and Kellogg (K). TGS-NO is a seismic data company exposed to offshore exploration activity, which we decided to sell out of it due to a change in the industry outlook. Kellogg is a name which we trimmed and were monitoring for signs of business turnaround. However, after the fourth quarter earnings result we believed that the business may continue to deteriorate and decided to exit the position. Saipem is an Italian E&C Company specializing in energy infrastructure that is a turnaround play with a margin of safety from its asset value. It fits in the “Opportunistic” bucket of our portfolio. Tenaris is a high quality pipe manufacturer that is a beneficiary of the U.S. energy renaissance. Both Saipem and Tenaris depreciated sharply at the end of the year, but since then have rebounded considerably. ICICI is the largest private bank in India. We hold the view that the Indian markets have the potential to rally as we approach elections in May of this year.^
^ Portfolio composition is subject to change.
2014 Outlook
Following a year where investing domestically was so profitable for U.S.-based investors, we believe now, more than ever, that “global” remains the operative word for 2014.
In our view, valuations for global equities remain attractive. We believe that our thesis of a synchronous global recovery will play out in 2014. Sovereign bonds in Italy and Spain (two of our favorite markets this year) are still trading at a substantial premium to German Bunds, and a convergence in these rates to their historical norms (given implicit ECB backing) should help equity valuations. In the last 10 years, U.S. equities have compounded at an annual rate of 5.2%, nearly double that of the nominal U.S. Gross Domestic Product (GDP) growth rate of 2.8% per annum. However, while Italian GDP has stayed relatively flat through the credit crisis and the European crisis, Italian shares have fallen 60% from their peak and still have not fully recovered. Similarly, while Chinese GDP grew six-fold since 2001, share prices are essentially flat over this time period. We have found attractive opportunities in each of these markets.
Historically investing in global equities has delivered total returns similar to equity investing in the United States. However, in the last three years, MSCI ACWI has annualized returns of only 9.7% while the S&P 500 has annualized returns of 16.1%. By capitalizing on this divergence in the performance of global equities, and by investing in high quality companies, we believe that we can potentially generate positive risk-adjusted returns for investors.
We look forward to providing regular updates on our progress. Please visit our website at www.salientfunds.com for the latest details.
Please note this letter, including the financial information herein, is made available to shareholders of the Fund for their information. It is not a prospectus, circular or representation intended for the use in the purchase of sale of shares of the Fund.
Sincerely,
Ajay Mehra
Managing Director
Head of Equities, Salient Advisors, L.P.
24
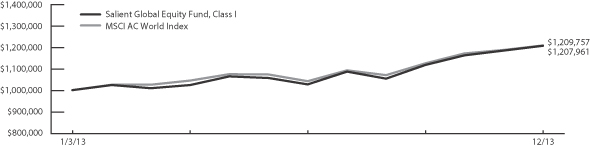
Salient Global Equity Fund
|
| |
| Value of a $1,000,000 Investment |
|
The charts above represent a historical since inception performance comparison of a hypothetical $1,000,000 investment in the indicated share class versus a similar investment in the Fund’s benchmark and represents the reinvestment of dividends and capital gains in the Fund.
The performance data quoted here represents past performance. Past performance is no guarantee of future results. Investment return and principal value will fluctuate, so that an investor’s shares, when redeemed, may be worth more or less than their original cost. Current performance may be lower or higher than the performance information quoted. To obtain performance information current to the most recent month-end please call 866-667-9228.
The performance above reflects any fee waivers that have been in effect during the applicable periods, as well as any expense reimbursements that have periodically been made. Absent such waivers and reimbursements, returns would have been lower. Currently, contractual fee waivers are in effect for the Fund through July 31, 2014.
The MSCI All Country World Index: is a free float-adjusted market capitalization weighted index that is designed to measure the equity market performance of developed and emerging markets. The Index consists of approximately 2,500 stocks as of December, 2013, while the Fund will build a portfolio of 40-60 stocks. The index returns are from 2/3/2013 onwards (For Class A and C share comparisons) and from 1/3/2013 onwards (for I share comparison). One cannot invest directly in an index.
25
Expense Examples
26
Table of Shareholder Expenses—as of December 31, 2013 (Unaudited)
As a shareholder of the Funds, you incur two types of costs: (1) transaction costs, including sales charges (loads) on purchases, redemption fees and exchange fees; and (2) ongoing costs, including management fees, distribution fees and other Fund expenses. These examples are intended to help you understand your ongoing costs (in dollars) of investing in the Funds and to compare the cost with the ongoing costs of investing in other mutual funds.
These examples are based on an investment of $1,000 invested at the beginning of the period and held for the entire period from July 1, 2013 through December 31, 2013 (unless otherwise noted).
Actual Example
The table below provides information about actual account values and actual expenses. You may use the information below, together with the amount you invested, to estimate the expenses that you paid over the period. Simply divide your account value by $1,000 (for example, an $8,600 account value divided by $1,000 = 8.6), then multiply the result by the number in the table under the heading entitled “Expenses Paid During Period” to estimate the expenses you paid on your account during this period.
| | | | | | | | | | | | | | | | | | |
| | | | | Beginning
Account Value
7/1/13 | | | Ending
Account Value
12/31/13 | | | Expenses Paid
During Period(1)
7/1/13 – 12/31/13 | | | Annualized
Expense Ratio
During Period
7/1/13 – 12/31/13 | |
Salient Risk Parity Fund | | Class A | | $ | 1,000.00 | | | $ | 1,069.00 | | | $ | 8.08 | | | | 1.55 | % |
| | Class C | | | 1,000.00 | | | | 1,063.80 | | | | 12.02 | | | | 2.31 | % |
| | Class I | | | 1,000.00 | | | | 1,070.00 | | | | 6.83 | | | | 1.31 | % |
Salient MLP & Energy Infrastructure Fund II | | Class A | | | 1,000.00 | | | | 1,127.20 | | | | 9.76 | | | | 1.82 | % |
| | Class C | | | 1,000.00 | | | | 1,123.50 | | | | 14.02 | | | | 2.62 | % |
| | Class I | | | 1,000.00 | | | | 1,129.50 | | | | 8.37 | | | | 1.56 | % |
Salient Alternative Beta Fund | | Class A | | | 1,000.00 | | | | 1,027.00 | | | | 8.28 | | | | 1.62 | % |
| | Class C | | | 1,000.00 | | | | 1,022.90 | | | | 12.03 | | | | 2.36 | % |
| | Class I | | | 1,000.00 | | | | 1,028.00 | | | | 6.80 | | | | 1.33 | % |
Salient Trend Fund | | Class A | | | 1,000.00 | | | | 1,133.50 | | | | 8.87 | | | | 1.65 | % |
| | Class C | | | 1,000.00 | | | | 1,127.90 | | | | 13.36 | | | | 2.49 | % |
| | Class I | | | 1,000.00 | | | | 1,134.00 | | | | 7.32 | | | | 1.36 | % |
Salient Global Equity Fund | | Class A | | | 1,000.00 | | | | 1,174.80 | | | | 10.47 | | | | 1.91 | % |
| | Class C | | | 1,000.00 | | | | 1,170.90 | | | | 14.61 | | | | 2.67 | % |
| | Class I | | | 1,000.00 | | | | 1,176.20 | | | | 8.89 | | | | 1.62 | % |
(1) Expenses are equal to the average account value multiplied by the Fund’s annualized expense ratio multiplied by 184/365 (the number of days in the most recent fiscal half-year divided by the number of days in the fiscal year).
27
Table of Shareholder Expenses—as of December 31, 2013 (Unaudited) (continued)
Hypothetical Example for Comparison Purposes
The table below provides information about hypothetical account values and hypothetical expenses based on each Fund’s actual expense ratio and an assumed rate of return of 5% per year before expenses, which is not the Fund’s actual return. The hypothetical account values and expenses may not be used to estimate the actual ending account balance or expenses you paid for the period. You may use this information to compare this 5% hypothetical example with the 5% hypothetical examples that appear in the shareholder reports of other funds.
Please note that the expenses shown in the table are meant to highlight your ongoing costs only and do not reflect any transactional costs, such as sales charges (loads), redemption fees, or exchange fees. Therefore, the table is useful in comparing ongoing costs only, and will not help you determine the relative total costs of owning different funds. In addition, if these transactional costs were included, your costs would have been higher.
| | | | | | | | | | | | | | | | | | |
| | | | | Beginning
Account Value
7/1/13 | | | Ending
Account Value
12/31/13 | | | Expenses Paid
During Period(1)
7/1/13 – 12/31/13 | | | Annualized
Expense Ratio
During Period
7/1/13 – 12/31/13 | |
Salient Risk Parity Fund | | Class A | | $ | 1,000.00 | | | $ | 1,017.39 | | | $ | 7.88 | | | | 1.55 | % |
| | Class C | | | 1,000.00 | | | | 1,013.56 | | | | 11.72 | | | | 2.31 | % |
| | Class I | | | 1,000.00 | | | | 1,018.60 | | | | 6.67 | | | | 1.31 | % |
Salient MLP & Energy Infrastructure Fund II | | Class A | | | 1,000.00 | | | | 1,016.03 | | | | 9.25 | | | | 1.82 | % |
| | Class C | | | 1,000.00 | | | | 1,012.00 | | | | 13.29 | | | | 2.62 | % |
| | Class I | | | 1,000.00 | | | | 1,017.34 | | | | 7.93 | | | | 1.56 | % |
Salient Alternative Beta Fund | | Class A | | | 1,000.00 | | | | 1,017.04 | | | | 8.24 | | | | 1.62 | % |
| | Class C | | | 1,000.00 | | | | 1,013.31 | | | | 11.98 | | | | 2.36 | % |
| | Class I | | | 1,000.00 | | | | 1,018.50 | | | | 6.77 | | | | 1.33 | % |
Salient Trend Fund | | Class A | | | 1,000.00 | | | | 1,016.89 | | | | 8.39 | | | | 1.65 | % |
| | Class C | | | 1,000.00 | | | | 1,012.65 | | | | 12.63 | | | | 2.49 | % |
| | Class I | | | 1,000.00 | | | | 1,018.35 | | | | 6.92 | | | | 1.36 | % |
Salient Global Equity Fund | | Class A | | | 1,000.00 | | | | 1,015.58 | | | | 9.70 | | | | 1.91 | % |
| | Class C | | | 1,000.00 | | | | 1,011.75 | | | | 13.54 | | | | 2.67 | % |
| | Class I | | | 1,000.00 | | | | 1,017.04 | | | | 8.24 | | | | 1.62 | % |
(1) Expenses are equal to the average account value multiplied by the Fund’s annualized expense ratio multiplied by 184/365 (the number of days in the most recent fiscal half-year divided by the number of days in the fiscal year).
28
SALIENT RISK PARITY FUND
Consolidated Schedule of Investments
December 31, 2013
| | | | | | | | | | | | | | |
Other Assets and Liabilities—100.0% | | | | | | | | | | | | $ | 101,884,915 | |
| | | | | | | | | | | | | | |
Net Assets—100.0% | | | | | | | | | | | | $ | 101,884,915 | |
| | | | | | | | | | | | | | |
Futures Contracts Purchased: | | | | | | | | | | | | | | |
| Description | | Expiration Date | | Number of
Contracts | | | Notional
Amount at
Value | | | Unrealized
Appreciation
(Depreciation) | |
10 Year Australia Commonwealth Treasury Bond | | March 2014 | | | 148 | | | $ | 15,149,227 | | | $ | 195,075 | |
10 Year Canada Bond | | March 2014 | | | 159 | | | | 18,973,411 | | | | (251,188 | ) |
10 Year Japan Government Bond | | March 2014 | | | 46 | | | | 62,614,872 | | | | (388,224 | ) |
10 Year U.S. Treasury Note | | March 2014 | | | 164 | | | | 20,179,688 | | | | (369,114 | ) |
ASX SPI 200 Index | | March 2014 | | | 49 | | | | 5,815,524 | | | | 201,214 | |
CAC 40 10 Euro | | January 2014 | | | 76 | | | | 4,493,865 | | | | 175,038 | |
Cocoa* | | March 2014 | | | 379 | | | | 10,267,110 | | | | 135,702 | |
Copper* | | March 2014 | | | 17 | | | | 1,443,513 | | | | 84,751 | |
Cotton No. 2* | | March 2014 | | | 6 | | | | 253,920 | | | | 17,312 | |
E-Mini S&P 500 | | March 2014 | | | 101 | | | | 9,297,555 | | | | 194,906 | |
E-Mini S&P MidCap 400 | | March 2014 | | | 56 | | | | 7,500,640 | | | | 175,162 | |
Euro-Bund | | March 2014 | | | 207 | | | | 39,628,301 | | | | (390,486 | ) |
FTSE 100 Index | | March 2014 | | | 50 | | | | 5,544,563 | | | | 153,331 | |
FTSE/JSE Top 40 Index | | March 2014 | | | 167 | | | | 6,664,019 | | | | 198,422 | |
FTSE/MIB Index | | March 2014 | | | 35 | | | | 4,579,860 | | | | 170,096 | |
Gasoline RBOB* | | February 2014 | | | 12 | | | | 1,404,094 | | | | 27,798 | |
German Stock Index | | March 2014 | | | 14 | | | | 4,624,635 | | | | 193,083 | |
Gold 100 Oz* | | February 2014 | | | 18 | | | | 2,164,140 | | | | (71,876 | ) |
Hang Seng China Enterprises Index | | January 2014 | | | 54 | | | | 3,772,131 | | | | 12,864 | |
Hang Seng Index | | January 2014 | | | 32 | | | | 4,814,651 | | | | 87,409 | |
IBEX 35 Index | | January 2014 | | | 31 | | | | 4,208,641 | | | | 191,039 | |
ICE Brent Crude* | | February 2014 | | | 69 | | | | 7,626,570 | | | | 2,756 | |
ICE Gas Oil* | | February 2014 | | | 5 | | | | 471,750 | | | | 3,016 | |
Lean Hogs* | | February 2014 | | | 291 | | | | 9,943,470 | | | | (661,856 | ) |
LME Lead* | | February 2014 | | | 4 | | | | 221,050 | | | | 11,736 | |
LME Nickel* | | February 2014 | | | 6 | | | | 499,212 | | | | 11,342 | |
Long Gilt | | March 2014 | | | 94 | | | | 16,584,665 | | | | (376,804 | ) |
MSCI Taiwan Stock Index | | January 2014 | | | 232 | | | | 7,034,240 | | | | 212,612 | |
NY Harbor ULSD* | | February 2014 | | | 12 | | | | 1,544,861 | | | | 12,687 | |
NYMEX WTI Crude* | | February 2014 | | | 114 | | | | 11,219,880 | | | | 76,533 | |
OMXS30 Index | | January 2014 | | | 221 | | | | 4,588,485 | | | | 180,626 | |
Russell 2000 Mini Index | | March 2014 | | | 61 | | | | 7,084,540 | | | | 210,768 | |
S&P/Toronto Stock Exchange 60 Index | | March 2014 | | | 47 | | | | 6,911,270 | | | | 157,680 | |
SGX S&P CNX Nifty Index | | January 2014 | | | 375 | | | | 4,763,250 | | | | 91,610 | |
Silver* | | March 2014 | | | 14 | | | | 1,355,900 | | | | (35,435 | ) |
Soybean* | | March 2014 | | | 160 | | | | 10,340,000 | | | | (175,195 | ) |
Tokyo Price Index | | March 2014 | | | 33 | | | | 4,082,297 | | | | 143,496 | |
| | | | | | | | | | | | | | |
| | | | | | | | $ | 327,665,800 | | | $ | 607,886 | |
| | | | | | | | | | | | | | |
See accompanying Notes to Financial Statements.
29
SALIENT RISK PARITY FUND
Consolidated Schedule of Investments, continued
December 31, 2013
| | | | | | | | | | | | | | |
Futures Contracts Sold: | | | | | | | | | | | �� | | | |
| Description | | Expiration
Date | | Number of
Contracts | | | Notional
Amount at
Value | | | Unrealized
Appreciation
(Depreciation) | |
Coffee ‘C’* | | March 2014 | | | 134 | | | $ | 5,562,675 | | | | $(163,529) | |
Corn* | | March 2014 | | | 137 | | | | 2,890,700 | | | | 107,888 | |
Live Cattle* | | February 2014 | | | 141 | | | | 7,592,850 | | | | (55,877 | ) |
LME Primary Aluminum* | | February 2014 | | | 52 | | | | 2,314,325 | | | | (15,906 | ) |
LME Zinc* | | February 2014 | | | 65 | | | | 3,335,313 | | | | (287,717 | ) |
Natural Gas* | | February 2014 | | | 93 | | | | 3,933,900 | | | | (233,355 | ) |
Sugar #11* | | March 2014 | | | 317 | | | | 5,826,206 | | | | 651,074 | |
Wheat * | | March 2014 | | | 72 | | | | 2,178,900 | | | | 267,086 | |
| | | | | | | | | | | | | | |
| | | | | | | | $ | 33,634,869 | | | $ | 269,664 | |
| | | | | | | | | | | | | | |
| * | All or a portion of these investments are held by Salient Risk Parity Offshore Fund, Ltd. (the “Risk Parity Subsidiary”). |
| | | | | | | | |
Allocation of Portfolio Holdings: | | | | | | | | |
Risk Exposure | | Notional
Value | | | Percent of Total
Derivative Exposure | |
Commodity Risk | | $ | 92,390,339 | | | | 25.6 | % |
Equity Risk | | | 95,780,166 | | | | 26.5 | % |
Interest Rate Risk | | | 173,130,164 | | | | 47.9 | % |
| | | | | | | | |
Total | | $ | 361,300,669 | | | | 100.0 | % |
| | | | | | | | |
See accompanying Notes to Financial Statements.
30
SALIENT MLP & ENERGY INFRASTRUCTURE FUND II
Consolidated Schedule of Investments
December 31, 2013
| | | | | | | | |
| | | Shares/Units | | | Fair Value | |
| | | | | | | | |
Common Stock—1.0% | | | | | | | | |
Independent Power Producers & Energy Traders—1.0% | | | | | | | | |
United States—1.0% | | | | | | | | |
Pattern Energy Group, Inc. | | | 166,967 | | | $ | 5,060,770 | |
| | | | | | | | |
Total Common Stock (Cost $3,859,046) | | | | | | $ | 5,060,770 | |
| | | | | | | | |
Master Limited Partnerships and Related Companies—97.6% | | | | | | | | |
Coal—0.8% | | | | | | | | |
United States—0.8% | | | | | | | | |
Alliance Holdings GP, L.P.(1)(2) | | | 67,338 | | | | 3,923,785 | |
| | | | | | | | |
| | | | | | | 3,923,785 | |
| | | | | | | | |
Crude/Natural Gas Production—2.1% | | | | | | | | |
United States—2.1% | | | | | | | | |
Memorial Production Partners, L.P.(2) | | | 208,000 | | | | 4,563,520 | |
Western Gas Equity Partners, L.P.(2) | | | 150,420 | | | | 5,943,094 | |
| | | | | | | | |
| | | | | | | 10,506,614 | |
| | | | | | | | |
Crude/Refined Products Pipelines—28.7% | | | | | | | | |
United States—28.7% | | | | | | | | |
Arc Logistics Partners, L.P.(2) | | | 174,521 | | | | 3,822,010 | |
Enbridge Energy Management, LLC(2)(3) | | | 773,472 | | | | 22,183,177 | |
Kinder Morgan Management, LLC(2)(3) | | | 390,453 | | | | 29,541,673 | |
Kinder Morgan, Inc. | | | 418,712 | | | | 15,073,632 | |
Magellan Midstream Partners, L.P.(1)(2) | | | 103,287 | | | | 6,534,968 | |
Plains GP Holdings, L.P., Class A(2) | | | 879,745 | | | | 23,550,774 | |
Rose Rock Midstream, L.P.(2) | | | 171,323 | | | | 6,630,200 | |
SemGroup Corp. | | | 332,164 | | | | 21,667,058 | |
Summit Midstream Partners, L.P.(2) | | | 144,318 | | | | 5,289,255 | |
Tesoro Logistics, L.P.(2) | | | 172,058 | | | | 9,005,516 | |
Western Refining Logistics, L.P.(2) | | | 114,300 | | | | 2,956,941 | |
| | | | | | | | |
| | | | | | | 146,255,204 | |
| | | | | | | | |
Electric Utilities—4.5% | | | | | | | | |
United States—4.5% | | | | | | | | |
NRG Yield, Inc., Class A(2) | | | 567,943 | | | | 22,723,399 | |
| | | | | | | | |
| | | | | | | 22,723,399 | |
| | | | | | | | |
Natural Gas Gathering/ Processing—31.4% | | | | | | | | |
United States—31.4% | | | | | | | | |
Crosstex Energy, Inc. | | | 537,922 | | | | 19,451,260 | |
Linn Co., LLC | | | 953,956 | | | | 29,391,384 | |
MarkWest Energy Partners, L.P.(2) | | | 153,422 | | | | 10,145,797 | |
Midcoast Energy Partners, L.P.(2) | | | 224,500 | | | | 4,388,975 | |
NGL Energy Partners, L.P.(2)(4)(5) | | | 329,500 | | | | 10,999,430 | |
NGL Energy Partners, L.P.(2) | | | 152,000 | | | | 5,244,000 | |
See accompanying Notes to Financial Statements.
31
SALIENT MLP & ENERGY INFRASTRUCTURE FUND II
Consolidated Schedule of Investments, continued
December 31, 2013
| | | | | | | | |
| | | Shares/Units | | | Fair Value | |
| | | | | | | | |
Natural Gas Gathering/ Processing (continued) | | | | | | | | |
United States (continued) | | | | | | | | |
Targa Resources Corp. | | | 407,584 | | | $ | 35,936,681 | |
Targa Resources Partners, L.P.(2) | | | 120,345 | | | | 6,294,044 | |
Williams Companies, Inc. | | | 984,457 | | | | 37,970,506 | |
| | | | | | | | |
| | | | | | | 159,822,077 | |
| | | | | | | | |
Natural Gas/ Natural Gas Liquids Pipelines—18.0% | | | | | | | | |
United States—18.0% | | | | | | | | |
Buckeye Partners, L.P.(2) | | | 80,626 | | | | 5,725,252 | |
Energy Transfer Equity, L.P.(1)(2) | | | 89,011 | | | | 7,275,759 | |
Enterprise Products Partners, L.P.(2) | | | 295,673 | | | | 19,603,120 | |
EQT Midstream Partners, L.P.(2) | | | 96,203 | | | | 5,655,774 | |
ONEOK, Inc. | | | 493,214 | | | | 30,668,047 | |
Spectra Energy Corp. | | | 643,396 | | | | 22,917,766 | |
| | | | | | | | |
| | | | | | | 91,845,718 | |
| | | | | | | | |
Oil, Gas & Consumable Fuels—1.0% | | | | | | | | |
United States—1.0% | | | | | | | | |
Cheniere Energy Partners, L.P.(2) | | | 262,835 | | | | 4,928,156 | |
| | | | | | | | |
| | | | | | | 4,928,156 | |
| | | | | | | | |
Shipping—9.4% | | | | | | | | |
Bermuda—3.4% | | | | | | | | |
Golar LNG Partners, L.P. | | | 576,236 | | | | 17,431,139 | |
| | | | | | | | |
Republic of the Marshall Islands—2.5% | | | | | | | | |
Teekay Offshore Partners, L.P.(2) | | | 384,636 | | | | 12,727,605 | |
| | | | | | | | |
United States—3.5% | | | | | | | | |
Capital Product Partners, L.P.(2) | | | 1,261,491 | | | | 13,207,811 | |
Seadrill Partners, LLC(2) | | | 142,238 | | | | 4,409,378 | |
| | | | | | | | |
| | | | | | | 47,775,933 | |
| | | | | | | | |
Transportation Infrastructure—1.7% | | | | | | | | |
United States—1.7% | | | | | | | | |
Macquarie Infrastructure Co. | | | 162,305 | | | | 8,834,261 | |
| | | | | | | | |
| | | | | | | 8,834,261 | |
| | | | | | | | |
Total Master Limited Partnerships and Related Companies (Cost $433,767,686) | | | | | | $ | 496,615,147 | |
| | | | | | | | |
Warrant—0.7% | | | | | | | | |
Crude/Refined Products Pipelines—0.7% | | | | | | | | |
United States—0.7% | | | | | | | | |
Kinder Morgan, Inc.(2) | | | 888,427 | | | | 3,607,014 | |
| | | | | | | | |
Total Warrant (Cost $4,430,900) | | | | | | $ | 3,607,014 | |
| | | | | | | | |
Total Investments—99.3% (Cost $442,057,632) | | | | | | | 505,282,931 | |
Other Assets and Liabilities—0.7% | | | | | | | 3,750,538 | |
| | | | | | | | |
Net Assets—100.0% | | | | | | $ | 509,033,469 | |
| | | | | | | | |
See accompanying Notes to Financial Statements.
32
SALIENT MLP & ENERGY INFRASTRUCTURE FUND II
Consolidated Schedule of Investments, continued
December 31, 2013
| | All percentages disclosed are calculated by dividing the indicated amounts by net assets. |
| (1) | All or a portion of these securities are held by Salient MLP & Energy Infrastructure Fund II, Inc. (the “MLP Subsidiary”). |
| (2) | Non-income producing security. |
| (3) | Distributions are paid-in-kind. |
| (4) | Restricted security is exempt from registration under the Securities Act of 1933. The security may be resold in transactions exempt from registration, normally to qualified institutional buyers. |
| (5) | Securities have been fair valued in good faith using fair value procedures approved by the Board of Trustees and represent 2.2% of net assets applicable to common shareholders. |
Allocation of Portfolio Holdings:
Salient MLP & Energy Infrastructure Fund II invested in the following industries as of December 31, 2013:
| | | | | | | | |
| | | Value | | | % of
Total Investments | |
Coal | | $ | 3,923,785 | | | | 0.8 | % |
Crude/Natural Gas Production | | | 10,506,614 | | | | 2.1 | % |
Crude/Refined Products Pipelines | | | 149,862,218 | | | | 29.7 | % |
Electric Utilities | | | 22,723,399 | | | | 4.5 | % |
Independent Power Producers & Energy Traders | | | 5,060,770 | | | | 1.0 | % |
Natural Gas Gathering/ Processing | | | 159,822,077 | | | | 31.5 | % |
Natural Gas/ Natural Gas Liquids Pipelines | | | 91,845,718 | | | | 18.2 | % |
Oil, Gas & Consumable Fuels | | | 4,928,156 | | | | 1.0 | % |
Shipping | | | 47,775,933 | | | | 9.5 | % |
Transportation Infrastructure | | | 8,834,261 | | | | 1.7 | % |
| | | | | | | | |
Total | | $ | 505,282,931 | | | | 100.0 | % |
| | | | | | | | |
Salient MLP & Energy Infrastructure Fund II invested in securities with exposure to the following countries as of December 31, 2013:
| | | | | | | | |
| | | Value | | | % of
Total Investments | |
Bermuda | | $ | 17,431,139 | | | | 3.4 | % |
Republic of the Marshall Islands | | | 12,727,605 | | | | 2.5 | % |
United States | | | 475,124,187 | | | | 94.1 | % |
| | | | | | | | |
Total | | $ | 505,282,931 | | | | 100.0 | % |
| | | | | | | | |
See accompanying Notes to Financial Statements.
33
SALIENT ALTERNATIVE BETA FUND
Consolidated Schedule of Investments
December 31, 2013
| | | | | | | | | | | | | | |
Other Assets and Liabilities—100.0% | | | | | | | | | | | | $ | 41,271,289 | |
| | | | | | | | | | | | | | |
Net Assets—100.0% | | | | | | | | | | | | $ | 41,271,289 | |
| | | | | | | | | | | | | | |
| | | | |
Futures Contracts Purchased: | | | | | | | | | | | | | | |
| Description | | Expiration
Date | | Number of
Contracts | | | Notional
Amount at
Value | | | Unrealized
Appreciation
(Depreciation) | |
10 Year Japan Government Bond | | March 2014 | | | 1 | | | $ | 1,361,193 | | | $ | (8,511 | ) |
ASX SPI 200 Index | | March 2014 | | | 1 | | | | 118,684 | | | | 4,054 | |
CAC 40 10 Euro | | January 2014 | | | 28 | | | | 1,655,634 | | | | 64,061 | |
Cocoa* | | March 2014 | | | 95 | | | | 2,573,550 | | | | 37,669 | |
Corn* | | May 2014 | | | 384 | | | | 8,260,800 | | | | (184,323 | ) |
Euro-Bund | | March 2014 | | | 5 | | | | 957,205 | | | | (8,907 | ) |
FTSE 100 Index | | March 2014 | | | 51 | | | | 5,655,455 | | | | 154,493 | |
Gasoline RBOB* | | May 2014 | | | 84 | | | | 10,419,948 | | | | 81,903 | |
German Stock Index | | March 2014 | | | 23 | | | | 7,597,615 | | | | 317,209 | |
Hang Seng China Enterprises Index | | January 2014 | | | 89 | | | | 6,217,030 | | | | 21,202 | |
Hang Seng Index | | January 2014 | | | 43 | | | | 6,469,687 | | | | 117,456 | |
ICE Brent Crude* | | February 2014 | | | 24 | | | | 2,652,720 | | | | (62 | ) |
ICE Gas Oil* | | May 2014 | | | 110 | | | | 10,285,000 | | | | (3,475 | ) |
Lean Hogs* | | February 2014 | | | 71 | | | | 2,426,070 | | | | (163,701 | ) |
Live Cattle* | | February 2014 | | | 175 | | | | 9,423,750 | | | | 61,892 | |
Natural Gas* | | April 2014 | | | 266 | | | | 10,892,700 | | | | 280,290 | |
NY Harbor ULSD* | | May 2014 | | | 81 | | | | 10,321,328 | | | | 7,534 | |
NYMEX WTI Crude* | | April 2014 | | | 111 | | | | 10,876,890 | | | | 117,340 | |
OMXS30 Index | | January 2014 | | | 150 | | | | 3,114,356 | | | | 121,585 | |
Russell 2000 Mini Index | | March 2014 | | | 209 | | | | 24,273,261 | | | | 712,134 | |
S&P/Toronto Stock Exchange 60 Index | | March 2014 | | | 17 | | | | 2,499,821 | | | | 56,906 | |
SGX S&P CNX Nifty Index | | January 2014 | | | 78 | | | | 990,756 | | | | 19,055 | |
Soybean* | | March 2014 | | | 222 | | | | 14,346,750 | | | | (235,674 | ) |
Sugar #11* | | March 2014 | | | 449 | | | | 8,252,261 | | | | (888,964 | ) |
Tokyo Price Index | | March 2014 | | | 50 | | | | 6,185,298 | | | | 203,810 | |
| | | | | | | | | | | | | | |
| | | | | | | | $ | 167,827,762 | | | $ | 884,976 | |
| | | | | | | | | | | | | | |
| | | | |
Futures Contracts Sold: | | | | | | | | | | | | | | |
| Description | | Expiration
Date | | Number of
Contracts | | | Notional
Amount at
Value | | | Unrealized
Appreciation
(Depreciation) | |
10 Year Australia Commonwealth Treasury Bond | | March 2014 | | | 22 | | | $ | 2,251,912 | | | $ | (30,334 | ) |
10 Year Canada Bond | | March 2014 | | | 5 | | | | 596,648 | | | | 7,589 | |
10 Year U.S. Treasury Note | | March 2014 | | | 8 | | | | 984,375 | | | | 18,380 | |
CBOE Volatility Index (VIX) | | January 2014 | | | 102 | | | | 1,422,900 | | | | 93,543 | |
See accompanying Notes to Financial Statements.
34
SALIENT ALTERNATIVE BETA FUND
Consolidated Schedule of Investments, continued
December 31, 2013
| | | | | | | | | | | | | | |
| Description | | Expiration
Date | | Number of
Contracts | | | Notional
Amount at
Value | | | Unrealized
Appreciation
(Depreciation) | |
Coffee ‘C’* | | March 2014 | | | 103 | | | $ | 4,275,788 | | | $ | (185,849 | ) |
Copper* | | March 2014 | | | 29 | | | | 2,462,463 | | | | (119,304 | ) |
Corn* | | March 2014 | | | 501 | | | | 10,571,100 | | | | 213,654 | |
Cotton No. 2* | | March 2014 | | | 16 | | | | 677,120 | | | | (47,790 | ) |
E-Mini S&P 500 | | March 2014 | | | 235 | | | | 21,632,925 | | | | (451,790 | ) |
E-Mini S&P MidCap 400 | | March 2014 | | | 10 | | | | 1,339,400 | | | | (31,175 | ) |
FTSE/JSE Top 40 Index | | March 2014 | | | 126 | | | | 5,027,943 | | | | (150,556 | ) |
FTSE/MIB Index | | March 2014 | | | 80 | | | | 10,468,251 | | | | (399,090 | ) |
Gasoline RBOB* | | February 2014 | | | 96 | | | | 11,232,749 | | | | (210,190 | ) |
Gold 100 Oz* | | February 2014 | | | 27 | | | | 3,246,210 | | | | 183,317 | |
IBEX 35 Index | | January 2014 | | | 56 | | | | 7,602,707 | | | | (344,769 | ) |
ICE Brent Crude* | | May 2014 | | | 4 | | | | 438,000 | | | | 571 | |
ICE Gas Oil* | | February 2014 | | | 113 | | | | 10,661,550 | | | | 1,127 | |
Live Cattle* | | July 2014 | | | 191 | | | | 9,888,070 | | | | (70,241 | ) |
Long Gilt | | March 2014 | | | 13 | | | | 2,293,624 | | | | 46,645 | |
MSCI Taiwan Stock Index | | January 2014 | | | 284 | | | | 8,610,880 | | | | (262,294 | ) |
Natural Gas* | | February 2014 | | | 292 | | | | 12,351,600 | | | | (524,172 | ) |
NY Harbor ULSD* | | February 2014 | | | 85 | | | | 10,942,764 | | | | (29,491 | ) |
NYMEX WTI Crude* | | February 2014 | | | 74 | | | | 7,283,080 | | | | (38,192 | ) |
Silver* | | March 2014 | | | 16 | | | | 1,549,600 | | | | 170,504 | |
Soybean* | | May 2014 | | | 160 | | | | 10,216,000 | | | | (349,066 | ) |
Sugar #11* | | May 2014 | | | 531 | | | | 9,848,563 | | | | 890,614 | |
Wheat* | | May 2014 | | | 12 | | | | 367,200 | | | | 30,709 | |
Wheat* | | March 2014 | | | 66 | | | | 1,997,325 | | | | 209,327 | |
| | | | | | | | | | | | | | |
| | | | | | | | $ | 170,240,747 | | | $ | (1,378,323 | ) |
| | | | | | | | | | | | | | |
| * | All or a portion of these investments are held by Salient Alternative Beta Offshore Fund, Ltd. (the “Alternative Beta Subsidiary”). |
| | | | | | | | | | | | | | | | |
| Total Return Swap Agreements: | | | | | | | | | | | | |
| Underlying Instrument | | Counterparty | | | Maturity
Date | | | Notional
Amount
at Value | | | Unrealized
Gain (Loss) | |
KOSPI 200 Index | | | Goldman Sachs | | | | 3/20/14 | | | $ | 5,286,818 | | | $ | 55,304 | |
| | | | | | | | | | | | | | | | |
Forward Foreign Currency Exchange Contracts:
| | | | | | | | | | | | | | | | | | | | | | | | |
| Type of Contract | | Counterparty | | | Delivery
Date | | | Contract
Amount
(Local Currency) | | | Contract
Value | | | Value | | | Unrealized
Appreciation
(Depreciation) | |
Long Contracts: | | | | | | | | | | | | | | | | | | | | | | | | |
Brazilian Real | | | Goldman Sachs | | | | 1/15/14 | | | | 6,881,891 | | | $ | 2,901,303 | | | $ | 2,906,186 | | | $ | 4,883 | |
Chilean Peso | | | Goldman Sachs | | | | 1/15/14 | | | | 920,379,650 | | | | 1,721,140 | | | | 1,749,193 | | | | 28,053 | |
See accompanying Notes to Financial Statements.
35
SALIENT ALTERNATIVE BETA FUND
Consolidated Schedule of Investments, continued
December 31, 2013
| | | | | | | | | | | | | | | | | | | | | | | | |
| Type of Contract | | Counterparty | | | Delivery
Date | | | Contract
Amount
(Local Currency) | | | Contract
Value | | | Value | | | Unrealized
Appreciation
(Depreciation) | |
Euro | | | Goldman Sachs | | | | 1/15/14 | | | | 1,480,382 | | | $ | 2,005,770 | | | $ | 2,036,387 | | | $ | 30,617 | |
Hungarian Forint | | | Goldman Sachs | | | | 1/15/14 | | | | 536,598,675 | | | | 2,393,820 | | | | 2,483,572 | | | | 89,752 | |
Indian Rupee | | | Goldman Sachs | | | | 1/15/14 | | | | 87,855,166 | | | | 1,402,317 | | | | 1,415,240 | | | | 12,923 | |
Israeli New Shekel | | | Goldman Sachs | | | | 1/15/14 | | | | 11,944,294 | | | | 3,381,067 | | | | 3,442,284 | | | | 61,217 | |
Korean Won | | | Goldman Sachs | | | | 1/15/14 | | | | 5,313,103,720 | | | | 5,017,095 | | | | 5,032,184 | | | | 15,089 | |
Mexican Peso | | | Goldman Sachs | | | | 1/15/14 | | | | 35,274,453 | | | | 2,661,922 | | | | 2,700,441 | | | | 38,519 | |
New Zealand Dollar | | | Goldman Sachs | | | | 1/15/14 | | | | 3,090,095 | | | | 2,520,900 | | | | 2,537,486 | | | | 16,586 | |
Polish Zloty | | | Goldman Sachs | | | | 1/15/14 | | | | 11,239,207 | | | | 3,616,218 | | | | 3,719,550 | | | | 103,332 | |
Russian Ruble | | | Goldman Sachs | | | | 1/15/14 | | | | 129,114,334 | | | | 3,858,767 | | | | 3,922,538 | | | | 63,771 | |
Swedish Krona | | | Goldman Sachs | | | | 1/15/14 | | | | 11,528,847 | | | | 1,756,509 | | | | 1,792,536 | | | | 36,027 | |
| | | | | | | | | | | | | | | | | | | | | | | | |
| | | | | | | | | | | | | | $ | 33,236,828 | | | $ | 33,737,597 | | | $ | 500,769 | |
| | | | | | | | | | | | | | | | | | | | | | | | |
Short Contracts: | | | | | | | | | | | | | | | | | | | | | | | | |
Australian Dollar | | | Goldman Sachs | | | | 1/15/14 | | | | 2,214,160 | | | $ | 2,009,572 | | | $ | 1,974,533 | | | $ | 35,039 | |
British Pound | | | Goldman Sachs | | | | 1/15/14 | | | | 756,034 | | | | 1,236,720 | | | | 1,251,639 | | | | (14,919 | ) |
Canadian Dollar | | | Goldman Sachs | | | | 1/15/14 | | | | 3,116,339 | | | | 2,926,690 | | | | 2,933,026 | | | | (6,336 | ) |
Czech Koruna | | | Goldman Sachs | | | | 1/15/14 | | | | 31,588,473 | | | | 1,558,847 | | | | 1,592,143 | | | | (33,296 | ) |
Indonesian Rupiah | | | Goldman Sachs | | | | 1/15/14 | | | | 4,758,732,000 | | | | 401,242 | | | | 390,382 | | | | 10,860 | |
Japanese Yen | | | Goldman Sachs | | | | 1/14/14 | | | | 656,528,922 | | | | 6,372,830 | | | | 6,235,888 | | | | 136,942 | |
Malaysian Ringgit | | | Goldman Sachs | | | | 1/15/14 | | | | 1,244,774 | | | | 385,558 | | | | 379,840 | | | | 5,718 | |
Norwegian Krone | | | Goldman Sachs | | | | 1/15/14 | | | | 9,103,389 | | | | 1,483,120 | | | | 1,500,512 | | | | (17,392 | ) |
Philippine Peso | | | Goldman Sachs | | | | 1/15/14 | | | | 299,000,724 | | | | 6,845,254 | | | | 6,741,845 | | | | 103,409 | |
Singapore Dollar | | | Goldman Sachs | | | | 1/15/14 | | | | 3,577,847 | | | | 2,848,604 | | | | 2,835,993 | | | | 12,611 | |
South African Rand | | | Goldman Sachs | | | | 1/15/14 | | | | 2,252,349 | | | | 217,839 | | | | 215,072 | | | | 2,767 | |
Swiss Franc | | | Goldman Sachs | | | | 1/15/14 | | | | 417,434 | | | | 459,729 | | | | 468,133 | | | | (8,404 | ) |
Taiwan Dollar | | | Goldman Sachs | | | | 1/15/14 | | | | 190,381,664 | | | | 6,443,786 | | | | 6,391,865 | | | | 51,921 | |
Turkish Lira | | | Goldman Sachs | | | | 1/15/14 | | | | 101,894 | | | | 49,535 | | | | 47,331 | | | | 2,204 | |
| | | | | | | | | | | | | | | | | | | | | | | | |
| | | | | | | | | | | | | | $ | 33,239,326 | | | $ | 32,958,202 | | | $ | 281,124 | |
| | | | | | | | | | | | | | | | | | | | | | | | |
Allocation of Portfolio Holdings:
| | | | | | | | |
Risk Exposure | | Notional/Contract
Value | | | Percent
of Total
Derivative
Exposure | |
Commodity Risk | | $ | 208,740,949 | | | | 50.9 | % |
Equity Risk | | | 126,169,421 | | | | 30.8 | % |
Foreign Exchange Rate Risk | | | 66,476,154 | | | | 16.2 | % |
Interest Rate Risk | | | 8,444,957 | | | | 2.1 | % |
| | | | | | | | |
Total | | $ | 409,831,481 | | | | 100.0 | % |
| | | | | | | | |
See accompanying Notes to Financial Statements.
36
SALIENT TREND FUND
Consolidated Schedule of Investments
December 31, 2013
| | | | | | | | | | | | | | |
Other Assets and Liabilities—100.0% | | | | | | | | | | | | $ | 75,290,048 | |
| | | | | | | | | | | | | | |
Net Assets—100.0% | | | | | | | | | | | | $ | 75,290,048 | |
| | | | | | | | | | | | | | |
Futures Contracts Purchased: | | | | | | | | | | | | | | |
| Description | | Expiration
Date | | Number of
Contracts | | | Notional
Amount
at Value | | | Unrealized
Appreciation
(Depreciation) | |
10 Year Japan Government Bond | | March 2014 | | | 5 | | | $ | 6,805,964 | | | $ | (42,557 | ) |
ASX SPI 200 Index | | March 2014 | | | 68 | | | | 8,070,523 | | | | 273,633 | |
CAC 40 10 Euro | | January 2014 | | | 110 | | | | 6,504,278 | | | | 252,420 | |
Cocoa * | | March 2014 | | | 546 | | | | 14,791,140 | | | | 174,695 | |
E-Mini S&P 500 | | March 2014 | | | 74 | | | | 6,812,070 | | | | 143,202 | |
E-Mini S&P MidCap 400 | | March 2014 | | | 49 | | | | 6,563,060 | | | | 155,409 | |
FTSE 100 Index | | March 2014 | | | 71 | | | | 7,873,280 | | | | 215,704 | |
FTSE/JSE Top 40 Index | | March 2014 | | | 236 | | | | 9,417,416 | | | | 279,849 | |
FTSE/MIB Index | | March 2014 | | | 47 | | | | 6,150,098 | | | | 226,436 | |
German Stock Index | | March 2014 | | | 19 | | | | 6,276,291 | | | | 255,915 | |
Hang Seng China Enterprises Index | | January 2014 | | | 63 | | | | 4,400,819 | | | | 15,145 | |
Hang Seng Index | | January 2014 | | | 34 | | | | 5,115,566 | | | | 92,873 | |
IBEX 35 Index | | January 2014 | | | 43 | | | | 5,837,793 | | | | 262,490 | |
ICE Brent Crude * | | February 2014 | | | 53 | | | | 5,858,090 | | | | (5,744 | ) |
Lean Hogs * | | February 2014 | | | 377 | | | | 12,882,090 | | | | (862,598 | ) |
MSCI Taiwan Stock Index | | January 2014 | | | 187 | | | | 5,669,840 | | | | 171,382 | |
NYMEX WTI Crude * | | February 2014 | | | 77 | | | | 7,578,340 | | | | 171,739 | |
OMXS30 Index | | January 2014 | | | 351 | | | | 7,287,594 | | | | 284,575 | |
Russell 2000 Mini Index | | March 2014 | | | 53 | | | | 6,155,420 | | | | 183,889 | |
S&P/Toronto Stock Exchange 60 Index | | March 2014 | | | 85 | | | | 12,499,106 | | | | 288,733 | |
SGX S&P CNX Nifty Index | | January 2014 | | | 238 | | | | 3,023,076 | | | | 58,116 | |
Soybean * | | March 2014 | | | 309 | | | | 19,969,125 | | | | (307,096 | ) |
Tokyo Price Index | | March 2014 | | | 35 | | | | 4,329,708 | | | | 150,691 | |
| | | | | | | | | | | | | | |
| | | | | | | | $ | 179,870,687 | | | $ | 2,438,901 | |
| | | | | | | | | | | | | | |
| | | | |
Futures Contracts Sold: | | | | | | | | | | | | | | |
| | | | |
| Description | | Expiration
Date | | Number of
Contracts | | | Notional
Amount
at Value | | | Unrealized
Appreciation
(Depreciation) | |
10 Year Australia Commonwealth Treasury Bond | | March 2014 | | | 237 | | | $ | 24,259,235 | | | $ | (319,545 | ) |
10 Year Canada Bond | | March 2014 | | | 151 | | | | 18,018,774 | | | | 218,438 | |
10 Year U.S. Treasury Note | | March 2014 | | | 57 | | | | 7,013,672 | | | | 128,093 | |
Coffee ‘C’ * | | March 2014 | | | 380 | | | | 15,774,750 | | | | (581,967 | ) |
Copper * | | March 2014 | | | 80 | | | | 6,793,000 | | | | (279,696 | ) |
Corn * | | March 2014 | | | 332 | | | | 7,005,200 | | | | 190,525 | |
Cotton No. 2 * | | March 2014 | | | 192 | | | | 8,125,440 | | | | (539,763 | ) |
See accompanying Notes to Financial Statements.
37
SALIENT TREND FUND
Consolidated Schedule of Investments, continued
December 31, 2013
| | | | | | | | | | | | | | |
| Description | | Expiration
Date | | Number of
Contracts | | | Notional
Amount
at Value | | | Unrealized
Appreciation
(Depreciation) | |
Gasoline RBOB * | | February 2014 | | | 47 | | | $ | 5,499,367 | | | $ | (181,387 | ) |
Gold 100 Oz * | | February 2014 | | | 69 | | | | 8,295,870 | | | | 459,165 | |
ICE Gas Oil * | | February 2014 | | | 59 | | | | 5,566,650 | | | | (27,070 | ) |
Live Cattle * | | February 2014 | | | 182 | | | | 9,800,700 | | | | (45,743 | ) |
LME Lead * | | February 2014 | | | 100 | | | | 5,526,250 | | | | (366,461 | ) |
LME Nickel * | | February 2014 | | | 109 | | | | 9,069,018 | | | | (254,924 | ) |
LME Primary Aluminum * | | February 2014 | | | 166 | | | | 7,388,038 | | | | (90,141 | ) |
LME Zinc * | | February 2014 | | | 235 | | | | 12,058,437 | | | | (1,030,552 | ) |
Long Gilt | | March 2014 | | | 81 | | | | 14,291,041 | | | | 287,689 | |
Natural Gas * | | February 2014 | | | 278 | | | | 11,759,400 | | | | (701,821 | ) |
NY Harbor ULSD * | | February 2014 | | | 60 | | | | 7,724,304 | | | | (30,879 | ) |
Silver * | | March 2014 | | | 60 | | | | 5,811,000 | | | | 508,841 | |
Sugar #11 * | | March 2014 | | | 431 | | | | 7,921,435 | | | | 489,511 | |
Wheat * | | March 2014 | | | 210 | | | | 6,355,125 | | | | 640,610 | |
| | | | | | | | | | | | | | |
| | | | | | | | $ | 204,056,706 | | | | $ (1,527,077) | |
| | | | | | | | | | | | | | |
| * | All or a portion of these investments are held by Salient Trend Offshore Fund, Ltd. (the “Trend Subsidiary”). |
| | | | | | | | |
Allocation of Portfolio Holdings: | | | | | | | | |
Risk Exposure | | Notional
Value | | | Percent
of Total
Derivative
Exposure | |
Commodity Risk | | $ | 201,552,769 | | | | 52.5 | % |
Equity Risk | | | 111,985,938 | | | | 29.2 | % |
Interest Rate Risk | | | 70,388,686 | | | | 18.3 | % |
| | | | | | | | |
Total | | $ | 383,927,393 | | | | 100.0 | % |
| | | | | | | | |
See accompanying Notes to Financial Statements.
38
SALIENT GLOBAL EQUITY FUND
Schedule of Investments
December 31, 2013
| | | | | | | | |
| | | Shares/Units | | | Fair Value | |
| | | | | | | | |
Common Stocks—89.3% | | | | | | | | |
Consumer Discretionary—6.6% | | | | | | | | |
France—2.4% | | | | | | | | |
Vivendi SA | | | 61,930 | | | $ | 1,631,821 | |
Germany—1.4% | | | | | | | | |
Daimler AG | | | 10,323 | | | | 893,195 | |
United States—2.8% | | | | | | | | |
Johnson Controls, Inc. | | | 17,928 | | | | 919,706 | |
Ross Stores, Inc. | | | 11,868 | | | | 889,269 | |
| | | | | | | | |
| | | | | | | 4,333,991 | |
| | | | | | | | |
Consumer Staples—11.9% | | | | | | | | |
United Kingdom—4.5% | | | | | | | | |
Reckitt Benckiser Group PLC | | | 20,388 | | | | 1,617,957 | |
Tesco PLC | | | 243,537 | | | | 1,348,189 | |
United States—7.4% | | | | | | | | |
CVS Caremark Corp. | | | 22,761 | | | | 1,629,005 | |
Kellogg Co. | | | 21,276 | | | | 1,299,325 | |
PepsiCo, Inc. | | | 23,580 | | | | 1,955,725 | |
| | | | | | | | |
| | | | | | | 7,850,201 | |
| | | | | | | | |
Energy—15.7% | | | | | | | | |
France—2.1% | | | | | | | | |
Total SA ADR | | | 22,144 | | | | 1,356,763 | |
Italy—2.0% | | | | | | | | |
Saipem SpA | | | 61,813 | | | | 1,323,058 | |
Luxembourg—2.0% | | | | | | | | |
Tenaris SA ADR | | | 29,921 | | | | 1,307,248 | |
Netherlands—3.5% | | | | | | | | |
Royal Dutch Shell PLC ADR | | | 32,075 | | | | 2,285,985 | |
Norway—1.3% | | | | | | | | |
TGS Nopec Geophysical Co. ASA | | | 31,611 | | | | 838,317 | |
United States—4.8% | | | | | | | | |
CONSOL Energy, Inc. | | | 25,447 | | | | 968,004 | |
Phillips 66 | | | 13,955 | | | | 1,076,349 | |
Targa Resources Corp. | | | 12,542 | | | | 1,105,828 | |
| | | | | | | | |
| | | | | | | 10,261,552 | |
| | | | | | | | |
Financials—21.3% | | | | | | | | |
China—1.1% | | | | | | | | |
China Merchants Bank Co. | | | 350,000 | | | | 745,680 | |
Germany—1.8% | | | | | | | | |
Muenchener Rueckversicherungs-Gesellschaft AG | | | 5,360 | | | | 1,180,813 | |
India—1.1% | | | | | | | | |
ICICI Bank, Ltd. ADR | | | 19,714 | | | | 732,769 | |
Italy—1.5% | | | | | | | | |
Unicredit SpA | | | 131,918 | | | | 976,283 | |
See accompanying Notes to Financial Statements.
39
SALIENT GLOBAL EQUITY FUND
Schedule of Investments, continued
December 31, 2013
| | | | | | | | |
| | | Shares/Units | | | Fair Value | |
| | | | | | | | |
Japan—1.3% | | | | | | | | |
Sumitomo Mitsui Trust Holding, Inc. | | | 166,861 | | | $ | 877,966 | |
Spain—2.0% | | | | | | | | |
Banco Bilbao Vizcaya Argentaria SA ADR | | | 104,233 | | | | 1,291,447 | |
Switzerland—1.4% | | | | | | | | |
UBS GRS | | | 48,695 | | | | 937,379 | |
United States—11.1% | | | | | | | | |
Bank of America Corp. | | | 52,490 | | | | 817,269 | |
Bank of New York Mellon Corp. | | | 32,075 | | | | 1,120,701 | |
Capital One Financial Corp. | | | 17,700 | | | | 1,355,997 | |
Genworth Financial, Inc., Class A(1) | | | 96,460 | | | | 1,498,024 | |
Loews Corp. | | | 31,253 | | | | 1,507,646 | |
MetLife, Inc. | | | 19,490 | | | | 1,050,901 | |
| | | | | | | | |
| | | | | | | 14,092,875 | |
| | | | | | | | |
Health Care—11.2% | | | | | | | | |
France—2.0% | | | | | | | | |
Sanofi SA ADR | | | 24,493 | | | | 1,313,560 | |
Germany—1.8% | | | | | | | | |
Bayer AG | | | 8,450 | | | | 1,185,041 | |
Switzerland—2.3% | | | | | | | | |
Novartis AG ADR | | | 18,657 | | | | 1,499,649 | |
United Kingdom—2.1% | | | | | | | | |
Smith & Nephew PLC | | | 94,845 | | | | 1,352,079 | |
United States—3.0% | | | | | | | | |
Abbott Laboratories | | | 50,900 | | | | 1,950,997 | |
| | | | | | | | |
| | | | | | | 7,301,326 | |
| | | | | | | | |
Industrials—8.5% | | | | | | | | |
Hong Kong—0.6% | | | | | | | | |
Sinotrans Shipping, Ltd. | | | 1,119,783 | | | | 408,690 | |
Switzerland—1.5% | | | | | | | | |
ABB, Ltd. ADR | | | 36,900 | | | | 980,064 | |
United States—6.4% | | | | | | | | |
CSX Corp. | | | 38,134 | | | | 1,097,115 | |
Fluor Corp. | | | 9,811 | | | | 787,725 | |
Rockwell Automation, Inc. | | | 9,478 | | | | 1,119,920 | |
United Technologies Corp. | | | 10,406 | | | | 1,184,203 | |
| | | | | | | | |
| | | | | | | 5,577,717 | |
| | | | | | | | |
Information Technology—5.8% | | | | | | | | |
United States—5.8% | | | | | | | | |
Fiserv, Inc.(1) | | | 22,074 | | | | 1,303,470 | |
Google, Inc., Class A(1) | | | 1,440 | | | | 1,613,822 | |
Tibco Software, Inc.(1) | | | 37,390 | | | | 840,527 | |
| | | | | | | | |
| | | | | | | 3,757,819 | |
| | | | | | | | |
See accompanying Notes to Financial Statements.
40
SALIENT GLOBAL EQUITY FUND
Schedule of Investments, continued
December 31, 2013
| | | | | | | | |
| | | Shares/Units | | | Fair Value | |
| | | | | | | | |
Materials—4.0% | | | | | | | | |
South Korea—2.0% | | | | | | | | |
POSCO ADR | | | 16,764 | | | $ | 1,307,592 | |
Switzerland—2.0% | | | | | | | | |
Syngenta AG ADR | | | 16,317 | | | | 1,304,381 | |
| | | | | | | | |
| | | | | | | 2,611,973 | |
| | | | | | | | |
Telecommunication Services—3.1% | | | | | | | | |
Hong Kong—3.1% | | | | | | | | |
China Mobile, Ltd. ADR | | | 38,694 | | | | 2,023,310 | |
| | | | | | | | |
| | | | | | | 2,023,310 | |
| | | | | | | | |
Utilities—1.2% | | | | | | | | |
France—1.2% | | | | | | | | |
Veolia Environnement ADR | | | 47,238 | | | | 772,814 | |
| | | | | | | | |
| | | | | | | 772,814 | |
| | | | | | | | |
Total Common Stock (Cost $51,078,681) | | | | | | $ | 58,583,578 | |
| | | | | | | | |
Registered Investment Companies—4.7% | | | | | | | | |
United States—4.7% | | | | | | | | |
iShares MSCI China ETF | | | 28,685 | | | | 1,383,191 | |
WisdomTree Japan Hedged Equity Fund ETF | | | 33,172 | | | | 1,686,464 | |
| | | | | | | | |
Total Registered Investment Companies (Cost $2,900,828) | | | | | | $ | 3,069,655 | |
| | | | | | | | |
Total Investments—94.0% (Cost $53,979,509) | | | | | | | 61,653,233 | |
Other Assets and Liabilities—6.0% | | | | | | | 3,908,536 | |
| | | | | | | | |
Net Assets—100.0% | | | | | | $ | 65,561,769 | |
| | | | | | | | |
| | All percentages disclosed are calculated by dividing the indicated amounts by net assets. |
| (1) | Non-income producing security. |
|
ADR—American Depositary Receipt |
ETF—Exchange Traded Fund |
PLC—Public Limited Company |
GRS—Global Registered Shares |
| | | | | | | | | | | | | | |
Futures Contracts Sold: | | | | | | | | | | | | | | |
| Description | | Expiration
Date | | Number of
Contracts | | | Notional
Amount at
Value | | | Unrealized
Appreciation (Depreciation) | |
Euro FX | | March 2014 | | | 30 | | | $ | 5,170,500 | | | $ | 1,970 | |
| | | | | | | | | | | | | | |
| | | | | | | | $ | 5,170,500 | | | $ | 1,970 | |
| | | | | | | | | | | | | | |
See accompanying Notes to Financial Statements.
41
SALIENT GLOBAL EQUITY FUND
Schedule of Investments, continued
December 31, 2013
| | | | | | | | |
Risk Exposure | | Notional
Value | | | Percent
of Total
Derivative
Exposure | |
Foreign Exchange Rate Risk | | $ | 5,170,500 | | | | 100.0 | % |
| | | | | | | | |
Total | | $ | 5,170,500 | | | | 100.0 | % |
| | | | | | | | |
Allocation of Portfolio Holdings:
Salient Global Equity Fund invested in the following industries as of December 31, 2013:
| | | | | | | | |
| | | Value | | | % of
Total Investments | |
Consumer Discretionary | | $ | 4,333,991 | | | | 7.0% | |
Consumer Staples | | | 7,850,201 | | | | 12.7% | |
Energy | | | 10,261,552 | | | | 16.7% | |
Financials | | | 14,092,875 | | | | 22.9% | |
Health Care | | | 7,301,326 | | | | 11.8% | |
Industrials | | | 5,577,717 | | | | 9.0% | |
Information Technology | | | 3,757,819 | | | | 6.1% | |
Materials | | | 2,611,973 | | | | 4.2% | |
Registered Investment Companies | | | 3,069,655 | | | | 5.0% | |
Telecommunication Services | | | 2,023,310 | | | | 3.3% | |
Utilities | | | 772,814 | | | | 1.3% | |
| | | | | | | | |
Total | | $ | 61,653,233 | | | | 100.0% | |
| | | | | | | | |
Salient Global Equity Fund invested in securities with exposure to the following countries as of December 31, 2013:
| | | | | | | | |
| | | Value | | | % of
Total Investments | |
China | | $ | 745,680 | | | | 1.2% | |
France | | | 5,074,958 | | | | 8.2% | |
Germany | | | 3,259,049 | | | | 5.3% | |
Hong Kong | | | 2,432,000 | | | | 3.9% | |
India | | | 732,769 | | | | 1.2% | |
Italy | | | 2,299,341 | | | | 3.7% | |
Japan | | | 877,966 | | | | 1.4% | |
Luxembourg | | | 1,307,248 | | | | 2.1% | |
Netherlands | | | 2,285,985 | | | | 3.7% | |
Norway | | | 838,317 | | | | 1.4% | |
South Korea | | | 1,307,592 | | | | 2.1% | |
Spain | | | 1,291,447 | | | | 2.1% | |
Switzerland | | | 4,721,473 | | | | 7.7% | |
United Kingdom | | | 4,318,225 | | | | 7.0% | |
United States | | | 30,161,183 | | | | 49.0% | |
| | | | | | | | |
Total | | $ | 65,561,769 | | | | 100.0% | |
| | | | | | | | |
See accompanying Notes to Financial Statements.
42
SALIENT MF TRUST
Statements of Assets and Liabilities
December 31, 2013
| | | | | | | | | | | | | | | | | | | | |
| | | Risk Parity
Fund
(Consolidated) | | | MLP Fund
(Consolidated) | | | Alternative Beta
Fund
(Consolidated) | | | Trend Fund
(Consolidated) | | | Global Equity
Fund | |
Assets: | | | | | | | | | | | | | | | | | | | | |
Investments at cost | | $ | — | | | $ | 442,057,632 | | | $ | — | | | $ | — | | | $ | 53,979,509 | |
| | | | | | | | | | | | | | | | | | | | |
Investments at fair value | | | — | | | | 505,282,931 | | | | — | | | | — | | | | 61,653,233 | |
Cash and cash equivalents | | | 91,625,640 | | | | 13,858,784 | | | | 21,031,929 | | | | 57,656,381 | | | | 4,733,985 | |
Foreign currencies (Cost: $76,705) | | | — | | | | — | | | | — | | | | — | | | | 77,401 | |
Deposits with brokers for futures contracts | | | 11,360,030 | | | | — | | | | 9,838,637 | | | | 18,461,449 | | | | 74,250 | |
Deposits with brokers for swap agreements | | | — | | | | — | | | | 3,510,000 | | | | — | | | | — | |
Segregated cash for collateral | | | — | | | | — | | | | 5,740,000 | | | | — | | | | — | |
Unrealized appreciation on forward foreign currency exchange contracts | | | — | | | | — | | | | 862,240 | | | | — | | | | — | |
Unrealized gain on swap agreements | | | — | | | | — | | | | 55,304 | | | | — | | | | — | |
Dividends and interest receivable | | | 15,335 | | | | 54,472 | | | | 3,542 | | | | 9,320 | | | | 32,973 | |
Receivable for capital shares issued | | | 28,212 | | | | 4,899,642 | | | | 6,634 | | | | 33,276 | | | | 12,798 | |
Receivable from investments sold | | | — | | | | — | | | | — | | | | — | | | | 739,507 | |
Reclaims receivable | | | — | | | | — | | | | — | | | | — | | | | 22,403 | |
Variation margin on futures contracts | | | 156,276 | | | | — | | | | 382,794 | | | | 178,457 | | | | 5,250 | |
Offering costs | | | — | | | | — | | | | 14,402 | | | | — | | | | — | |
Prepaids and other assets | | | 20,810 | | | | 27,403 | | | | 677 | | | | 1,108 | | | | 1,472 | |
| | | | | | | | | | | | | | | | | | | | |
Total assets | | | 103,206,303 | | | | 524,123,232 | | | | 41,446,159 | | | | 76,339,991 | | | | 67,353,272 | |
| | | | | | | | | | | | | | | | | | | | |
Liabilities: | | | | | | | | | | | | | | | | | | | | |
Payable for investments purchased | | | — | | | | 11,957,061 | | | | — | | | | — | | | | 1,613,424 | |
Payable for capital shares redeemed | | | 957,432 | | | | 81,021 | | | | — | | | | 801 | | | | — | |
Variation margin on futures contracts | | | 115,363 | | | | — | | | | — | | | | 874,471 | | | | — | |
Unrealized depreciation on forward foreign currency exchange contracts | | | — | | | | — | | | | 80,347 | | | | — | | | | — | |
Payable to Adviser | | | 92,374 | | | | 314,809 | | | | — | | | | 47,660 | | | | 54,787 | |
Distribution and services fees payable | | | 2,561 | | | | 56,695 | | | | 8 | | | | 632 | | | | 1,419 | |
Current tax liability | | | — | | | | 544,067 | | | | — | | | | — | | | | — | |
Deferred tax liability | | | — | | | | 1,595,193 | | | | — | | | | — | | | | — | |
Accounts payable and accrued expenses | | | 153,658 | | | | 540,917 | | | | 94,515 | | | | 126,379 | | | | 121,873 | |
| | | | | | | | | | | | | | | | | | | | |
Total liabilities | | | 1,321,388 | | | | 15,089,763 | | | | 174,870 | | | | 1,049,943 | | | | 1,791,503 | |
| | | | | | | | | | | | | | | | | | | | |
Net Assets | | $ | 101,884,915 | | | $ | 509,033,469 | | | $ | 41,271,289 | | | $ | 75,290,048 | | | $ | 65,561,769 | |
| | | | | | | | | | | | | | | | | | | | |
See accompanying Notes to Financial Statements.
43
SALIENT MF TRUST
Statements of Assets and Liabilities, continued
December 31, 2013
| | | | | | | | | | | | | | | | | | | | |
| | | Risk Parity
Fund
(Consolidated) | | | MLP Fund
(Consolidated) | | | Alternative Beta
Fund
(Consolidated) | | | Trend Fund
(Consolidated) | | | Global Equity
Fund | |
Composition of Net Assets: | | | | | | | | | | | | | | | | | | | | |
Paid-in capital | | $ | 113,162,568 | | | $ | 442,615,967 | | | $ | 40,326,344 | | | $ | 73,720,895 | | | $ | 57,251,368 | |
Accumulated net investment income (loss) | | | (65,880 | ) | | | 5,684,077 | | | | (581,151 | ) | | | (2,424,849 | ) | | | (448 | ) |
Accumulated net realized gains (losses) | | | (11,884,039 | ) | | | (896,678 | ) | | | 1,180,256 | | | | 3,093,659 | | | | 635,264 | |
Unrealized appreciation (depreciation) on investments | | | 672,266 | | | | 61,630,103 | | | | 345,840 | | | | 900,343 | | | | 7,675,585 | |
| | | | | | | | | | | | | | | | | | | | |
Net Assets | | $ | 101,884,915 | | | $ | 509,033,469 | | | $ | 41,271,289 | | | $ | 75,290,048 | | | $ | 65,561,769 | |
| | | | | | | | | | | | | | | | | | | | |
Net Assets: | | | | | | | | | | | | | | | | | | | | |
Class A Shares | | $ | 5,409,458 | | | $ | 147,626,463 | | | $ | 29,304 | | | $ | 2,849,193 | | | $ | 3,164,800 | |
Class C Shares | | | 1,319,069 | | | | 37,527,105 | | | | 12,400 | | | | 116,115 | | | | 1,083,313 | |
Class I Shares | | | 95,156,388 | | | | 323,879,901 | | | | 41,229,585 | | | | 72,324,740 | | | | 61,313,656 | |
| | | | | | | | | | | | | | | | | | | | |
| | $ | 101,884,915 | | | $ | 509,033,469 | | | $ | 41,271,289 | | | $ | 75,290,048 | | | $ | 65,561,769 | |
| | | | | | | | | | | | | | | | | | | | |
Shares Outstanding | | | | | | | | | | | | | | | | | | | | |
Class A Shares | | | 596,683 | | | | 11,557,554 | | | | 2,967 | | | | 258,166 | | | | 268,316 | |
Class C Shares | | | 146,987 | | | | 2,950,468 | | | | 1,263 | | | | 10,573 | | | | 92,245 | |
Class I Shares | | | 10,463,469 | | | | 25,388,008 | | | | 4,166,649 | | | | 6,563,926 | | | | 5,207,447 | |
| | | | | |
Net Asset Value, Offering Price and Redemption Price: | | | | | | | | | | | | | | | | | | | | |
Class A Shares | | $ | 9.07 | | | $ | 12.77 | | | $ | 9.88 | | | $ | 11.04 | | | $ | 11.80 | |
Class C Shares | | $ | 8.97 | | | $ | 12.72 | | | $ | 9.82 | | | $ | 10.98 | | | $ | 11.74 | |
Class I Shares | | $ | 9.09 | | | $ | 12.76 | | | $ | 9.90 | | | $ | 11.02 | | | $ | 11.77 | |
Maximum Sales Charge—Class A Shares | | | 5.50 | % | | | 5.50 | % | | | 5.50 | % | | | 5.50 | % | | | 5.50 | % |
| | | | | | | | | | | | | | | | | | | | |
Maximum Offering Price per share—Class A Shares (Net Asset Value/(100%—maximum sales charge)) | | $ | 9.60 | | | $ | 13.51 | | | $ | 10.46 | | | $ | 11.68 | | | $ | 12.49 | |
| | | | | | | | | | | | | | | | | | | | |
See accompanying Notes to Financial Statements.
44
SALIENT MF TRUST
Statements of Operations
For the periods ended December 31, 2013
| | | | | | | | | | | | | | | | | | | | |
| | | Risk Parity
Fund
(Consolidated)
For the
Year ended
December 31, 2013 | | | MLP Fund
(Consolidated)
For the
Year ended
December 31, 2013 | | | Alternative Beta
Fund
(Consolidated)
For the period
February 28, 2013(1)
through
December 31, 2013 | | | Trend Fund
(Consolidated)
For the period
January 2, 2013(1)
through
December 31, 2013 | | | Global Equity
Fund
For the period
January 3, 2013(1)
through
December 31, 2013 | |
Investment Income: | | | | | | | | | | | | | | | | | | | | |
Distributions from master limited partnerships | | $ | — | | | $ | 6,019,529 | | | $ | — | | | $ | — | | | $ | — | |
Less return of capital on distributions | | | — | | | | (5,865,973 | ) | | | — | | | | — | | | | — | |
| | | | | | | | | | | | | | | | | | | | |
Net distributions from master limited partnerships | | | — | | | | 153,556 | | | | — | | | | — | | | | — | |
Dividend income | | | — | | | | 2,609,396 | | | | — | | | | — | | | | 1,146,366 | |
Interest income | | | 169,718 | | | | 23,105 | | | | 6,317 | | | | 53,403 | | | | 7,383 | |
Foreign tax withholding | | | — | | | | (9,879 | ) | | | — | | | | — | | | | (52,697 | ) |
| | | | | | | | | | | | | | | | | | | | |
Total Investment Income (Loss) | | | 169,718 | | | | 2,776,178 | | | | 6,317 | | | | 53,403 | | | | 1,101,052 | |
| | | | | | | | | | | | | | | | | | | | |
Operating Expenses: | | | | | | | | | | | | | | | | | | | | |
Investment management fees | | | 1,087,210 | | | | 2,237,882 | | | | 300,785 | | | | 504,308 | | | | 620,420 | |
Administration fees | | | 137,000 | | | | 298,588 | | | | 27,112 | | | | 47,885 | | | | 28,372 | |
Distribution and service fee Class A | | | 21,295 | | | | 152,882 | | | | 18 | | | | 1,302 | | | | 1,763 | |
Distribution and service fee Class C | | | 9,811 | | | | 147,124 | | | | 18 | | | | 273 | | | | 4,888 | |
Administrative services fees | | | 69,378 | | | | 171,651 | | | | 5,160 | | | | 21,461 | | | | 35,582 | |
Trustees fees | | | 19,090 | | | | 19,090 | | | | 13,458 | | | | 19,101 | | | | 19,101 | |
Audit fees | | | 33,926 | | | | 34,261 | | | | 30,960 | | | | 31,083 | | | | 31,153 | |
Custodian fees | | | 21,316 | | | | 26,608 | | | | 13,475 | | | | 17,337 | | | | 30,649 | |
Legal fees | | | 77,067 | | | | 127,850 | | | | 23,191 | | | | 44,328 | | | | 34,543 | |
Offering costs | | | 60,017 | | | | 80,414 | | | | 16,659 | | | | 31,061 | | | | 31,176 | |
Registration and filing fees | | | 141,008 | | | | 168,134 | | | | 83,407 | | | | 90,745 | | | | 76,187 | |
Tax preparation fees | | | 18,428 | | | | 111,698 | | | | 14,951 | | | | 15,391 | | | | 15,386 | |
Transfer agent fees | | | 50,966 | | | | 93,395 | | | | 18,780 | | | | 25,831 | | | | 26,129 | |
Other expenses | | | 106,671 | | | | 197,538 | | | | 59,022 | | | | 75,251 | | | | 91,981 | |
| | | | | | | | | | | | | | | | | | | | |
Total Expenses before Fee Reductions | | | 1,853,183 | | | | 3,867,115 | | | | 606,996 | | | | 925,357 | | | | 1,047,330 | |
| | | | | | | | | | | | | | | | | | | | |
Less expenses contractually waived/reim
bursed by the Adviser | | | (280,953 | ) | | | (375,242 | ) | | | (173,558 | ) | | | (191,802 | ) | | | (244,707 | ) |
| | | | | | | | | | | | | | | | | | | | |
Net Expenses | | | 1,572,230 | | | | 3,491,873 | | | | 433,438 | | | | 733,555 | | | | 802,623 | |
| | | | | | | | | | | | | | | | | | | | |
Net Investment Income (Loss), before Income Taxes | | | (1,402,512 | ) | | | (715,695 | ) | | | (427,121 | ) | | | (680,152 | ) | | | 298,429 | |
| | | | | | | | | | | | | | | | | | | | |
Current tax benefit | | | — | | | | (34,154 | ) | | | — | | | | — | | | | — | |
Net Investment Income (Loss) | | | (1,402,512 | ) | | | (681,541 | ) | | | (427,121 | ) | | | (680,152 | ) | | | 298,429 | |
| | | | | | | | | | | | | | | | | | | | |
See accompanying Notes to Financial Statements.
45
SALIENT MF TRUST
Statements of Operations, continued
For the periods ended December 31, 2013
| | | | | | | | | | | | | | | | | | | | |
| | | Risk Parity
Fund
(Consolidated)
For the
Year ended
December 31, 2013 | | | MLP Fund
(Consolidated)
For the
Year ended
December 31, 2013 | | | Alternative Beta
Fund
(Consolidated)
For the period
February 28, 2013(1)
through
December 31, 2013 | | | Trend Fund
(Consolidated)
For the period
January 2, 2013(1)
through
December 31, 2013 | | | Global Equity
Fund
For the period
January 3, 2013(1)
through
December 31, 2013 | |
Realized and Unrealized Gain (Loss) on Investments: | | | | | | | | | | | | | | | | | | | | |
Net realized gain (loss) on investments and foreign currency translations | | $ | (368,443 | ) | | $ | 2,318,706 | | | $ | (66,937 | ) | | $ | 99,800 | | | $ | 1,531,874 | |
Net realized gain (loss) on written option contracts | | | — | | | | 146,742 | | | | — | | | | — | | | | — | |
Net realized gain (loss) on futures contracts | | | (5,511,269 | ) | | | — | | | | 1,531,737 | | | | 8,657,884 | | | | 446,297 | |
Net realized gain (loss) on swap agreements | | | — | | | | — | | | | (620,593 | ) | | | — | | | | — | |
Net realized gain (loss) on forward foreign currency exchange contracts | | | — | | | | — | | | | (1,311,839 | ) | | | — | | | | — | |
| | | | | | | | | | | | | | | | | | | | |
Net realized gain (loss), before income taxes | | | (5,879,712 | ) | | | 2,465,448 | | | | (467,632 | ) | | | 8,757,684 | | | | 1,978,171 | |
Current tax expense | | | — | | | | 580,916 | | | | — | | | | — | | | | — | |
| | | | | | | | | | | | | | | | | | | | |
Net realized gain (loss) | | | (5,879,712 | ) | | | 1,884,532 | | | | (467,632 | ) | | | 8,757,684 | | | | 1,978,171 | |
Change in unrealized appreciation/depreciation on investments, before income taxes | | | 1,142,683 | | | | 62,854,911 | | | | 345,840 | | | | 900,343 | | | | 7,675,585 | |
| | | | | | | | | | | | | | | | | | | | |
Deferred tax expense | | | — | | | | 1,580,105 | | | | — | | | | — | | | | — | |
| | | | | | | | | | | | | | | | | | | | |
Change in unrealized appreciation/depreciation on investments | | | 1,142,683 | | | | 61,274,806 | | | | 345,840 | | | | 900,343 | | | | 7,675,585 | |
| | | | | | | | | | | | | | | | | | | | |
Net Realized and Unrealized Gain (Loss) on Investments | | | (4,737,029 | ) | | | 63,159,338 | | | | (121,792 | ) | | | 9,658,027 | | | | 9,653,756 | |
| | | | | | | | | | | | | | | | | | | | |
Change in Net Assets Resulting from Operations | | $ | (6,139,541 | ) | | $ | 62,477,797 | | | $ | (548,913 | ) | | $ | 8,977,875 | | | $ | 9,952,185 | |
| | | | | | | | | | | | | | | | | | | | |
| (1) | Commencement of operations. |
See accompanying Notes to Financial Statements.
46
SALIENT MF TRUST
Statements of Changes in Net Assets
| | | | | | | | | | | | | | | | |
| | | Risk Parity Fund (Consolidated) | | | MLP Fund (Consolidated) | |
| | | For the
Year ended
December 31, 2013 | | | For the period
July 9, 2012(1)
through
December 31, 2012 | | | For the
Year ended
December 31, 2013 | | | For the period
September 19,
2012(1)
through
December 31, 2012 | |
Operations: | | | | | | | | | | | | | | | | |
Net investment income (loss), net of income taxes | | $ | (1,402,512 | ) | | $ | (596,480 | ) | | $ | (681,541 | ) | | $ | 6,673 | |
Net realized gain (loss) on investments, net of income taxes | | | (5,879,712 | ) | | | 2,699,771 | | | | 1,884,532 | | | | 78,369 | |
Change in unrealized appreciation/depreciation on investments, net of income taxes | | | 1,142,683 | | | | (470,417 | ) | | | 61,274,806 | | | | 355,297 | |
| | | | | | | | | | | | | | | | |
Change in Net Assets resulting from operations | | | (6,139,541 | ) | | | 1,632,874 | | | | 62,477,797 | | | | 440,339 | |
| | | | | | | | | | | | | | | | |
Distributions: | | | | | | | | | | | | | | | | |
Net investment income | | | | | | | | | | | | | | | | |
Class I Shares | | | — | | | | — | | | | — | | | | (6,673 | ) |
In excess of net investment income: | | | | | | | | | | | | | | | | |
Class A Shares | | | — | | | | — | | | | (798,931 | ) | | | — | |
Class C Shares | | | — | | | | — | | | | (170,038 | ) | | | — | |
Class I Shares | | | — | | | | — | | | | (2,321,762 | ) | | | — | |
Return of capital | | | | | | | | | | | | | | | | |
Class A Shares | | | | | | | | | | | (1,614,229 | ) | | | | |
Class C Shares | | | | | | | | | | | (343,559 | ) | | | | |
Class I Shares | | | — | | | | — | | | | (4,691,091 | ) | | | (217,709 | ) |
Net realized gains: | | | | | | | | | | | | | | | | |
Class A Shares | | | (337,775 | ) | | | (12,295 | ) | | | — | | | | — | |
Class C Shares | | | (83,366 | ) | | | (1,112 | ) | | | — | | | | — | |
Class I Shares | | | (6,055,544 | ) | | | (328,561 | ) | | | — | | | | — | |
| | | | | | | | | | | | | | | | |
Change in Net Assets resulting from distributions | | | (6,476,685 | ) | | | (341,968 | ) | | | (9,939,610 | ) | | | (224,382 | ) |
| | | | | | | | | | | | | | | | |
Change in Net Assets resulting from capital transactions | | | 1,921,520 | | | | 111,288,715 | | | | 416,080,266 | | | | 40,199,059 | |
| | | | | | | | | | | | | | | | |
Change in Net Assets | | | (10,694,706 | ) | | | 112,579,621 | | | | 468,618,453 | | | | 40,415,016 | |
Net Assets: | | | | | | | | | | | | | | | | |
Beginning of period | | | 112,579,621 | | | | — | | | | 40,415,016 | | | | — | |
| | | | | | | | | | | | | | | | |
End of period | | $ | 101,884,915 | | | $ | 112,579,621 | | | $ | 509,033,469 | | | $ | 40,415,016 | |
| | | | | | | | | | | | | | | | |
Accumulated net investment income (loss) | | $ | (65,880 | ) | | $ | (23,287 | ) | | $ | 5,684,077 | | | $ | 21,394 | |
| | | | | | | | | | | | | | | | |
See accompanying Notes to Financial Statements.
47
SALIENT MF TRUST
Statements of Changes in Net Assets, continued
| | | | | | | | | | | | | | | | |
| | | Risk Parity Fund (Consolidated) | | | MLP Fund (Consolidated) | |
| | | For the
Year ended
December 31, 2013 | | | For the period
July 9, 2012(1)
through
December 31, 2012 | | | For the
Year ended
December 31, 2013 | | | For the period
September 19,
2012(1)
through
December 31, 2012 | |
Capital Transactions: | | | | | | | | | | | | | | | | |
Class A Shares | | | | | | | | | | | | | | | | |
Proceeds from shares issued | | $ | 9,549,128 | | | $ | 3,974,892 | | | $ | 142,091,673 | | | $ | 2,226,558 | |
Dividends reinvested | | | 324,486 | | | | 12,295 | | | | 2,392,312 | | | | — | |
Value of shares redeemed | | | (7,363,713 | ) | | | (48 | ) | | | (12,172,236 | ) | | | — | |
| | | | | | | | | | | | | | | | |
Class A Shares capital transactions | | | 2,509,901 | | | | 3,987,139 | | | | 132,311,749 | | | | 2,226,558 | |
| | | | | | | | | | | | | | | | |
Class C Shares | | | | | | | | | | | | | | | | |
Proceeds from shares issued | | | 1,413,516 | | | | 375,970 | | | | 34,205,854 | | | | — | |
Dividends reinvested | | | 79,180 | | | | 1,112 | | | | 505,344 | | | | — | |
Value of shares redeemed | | | (362,110 | ) | | | (17,217 | ) | | | (460,475 | ) | | | — | |
| | | | | | | | | | | | | | | | |
Class C Shares capital transactions | | | 1,130,586 | | | | 359,865 | | | | 34,250,723 | | | | — | |
| | | | | | | | | | | | | | | | |
Class I Shares | | | | | | | | | | | | | | | | |
Proceeds from shares issued | | | 67,509,108 | | | | 127,085,250 | | | | 290,869,948 | | | | 39,536,400 | |
Dividends reinvested | | | 4,770,436 | | | | 266,137 | | | | 3,257,260 | | | | 15,004 | |
Value of shares redeemed | | | (73,998,511 | ) | | | (20,409,676 | ) | | | (44,609,414 | ) | | | (1,578,903 | ) |
| | | | | | | | | | | | | | | | |
Class I Shares capital transactions | | | (1,718,967 | ) | | | 106,941,711 | | | | 249,517,794 | | | | 37,972,501 | |
| | | | | | | | | | | | | | | | |
Change in Net Assets resulting from capital transactions | | $ | 1,921,520 | | | $ | 111,288,715 | | | $ | 416,080,266 | | | $ | 40,199,059 | |
| | | | | | | | | | | | | | | | |
Share Transactions: | | | | | | | | | | | | | | | | |
Class A Shares | | | | | | | | | | | | | | | | |
Issued | | | 924,281 | | | | 394,462 | | | | 12,181,266 | | | | 221,993 | |
Reinvested | | | 35,934 | | | | 1,211 | | | | 203,233 | | | | — | |
Redeemed | | | (759,200 | ) | | | (5 | ) | | | (1,048,938 | ) | | | — | |
| | | | | | | | | | | | | | | | |
Change in Class A Shares | | | 201,015 | | | | 395,668 | | | | 11,335,561 | | | | 221,993 | |
| | | | | | | | | | | | | | | | |
Class C Shares | | | | | | | | | | | | | | | | |
Issued | | | 140,524 | | | | 37,384 | | | | 2,947,094 | | | | — | |
Reinvested | | | 8,857 | | | | 110 | | | | 43,078 | | | | — | |
Redeemed | | | (38,168 | ) | | | (1,720 | ) | | | (39,704 | ) | | | — | |
| | | | | | | | | | | | | | | | |
Change in Class C Shares | | | 111,213 | | | | 35,774 | | | | 2,950,468 | | | | — | |
| | | | | | | | | | | | | | | | |
Class I Shares | | | | | | | | | | | | | | | | |
Issued | | | 6,721,859 | | | | 12,644,941 | | | | 25,178,939 | | | | 3,968,359 | |
Reinvested | | | 526,538 | | | | 26,220 | | | | 277,438 | | | | 1,522 | |
Redeemed | | | (7,435,130 | ) | | | (2,020,959 | ) | | | (3,879,767 | ) | | | (158,483 | ) |
| | | | | | | | | | | | | | | | |
Change in Class I Shares | | | (186,733 | ) | | | 10,650,202 | | | | 21,576,610 | | | | 3,811,398 | |
| | | | | | | | | | | | | | | | |
| (1) | Commencement of operations |
See accompanying Notes to Financial Statements.
48
SALIENT MF TRUST
Statements of Changes in Net Assets, continued
| | | | | | | | |
| | | Alternative Beta Fund
(Consolidated) | | | Trend Fund
(Consolidated) | |
| | | For the period
February 28, 2013(1)
through
December 31, 2013 | | | For the period
January 2, 2013(1)
through
December 31, 2013 | |
Operations: | | | | | | | | |
Net investment income (loss), net of income taxes | | $ | (427,121 | ) | | $ | (680,152 | ) |
Net realized gain (loss) on investments, net of income taxes | | | (467,632 | ) | | | 8,757,684 | |
Change in unrealized appreciation/depreciation on investments, net of income taxes | | | 345,840 | | | | 900,343 | |
| | | | | | | | |
Change in Net Assets resulting from operations | | | (548,913 | ) | | | 8,977,875 | |
| | | | | | | | |
Distributions: | | | | | | | | |
Net investment income: | | | | | | | | |
Class A Shares | | | — | | | | (83,044 | ) |
Class C Shares | | | — | | | | (3,007 | ) |
Class I Shares | | | — | | | | (2,298,422 | ) |
Net realized gains: | | | | | | | | |
Class A Shares | | | — | | | | (192,855 | ) |
Class C Shares | | | — | | | | (7,442 | ) |
Class I Shares | | | — | | | | (4,831,611 | ) |
| | | | | | | | |
Change in Net Assets resulting from distributions | | | — | | | | (7,416,381 | ) |
| | | | | | | | |
Change in Net Assets resulting from capital transactions | | | 41,820,202 | | | | 73,728,554 | |
| | | | | | | | |
Change in Net Assets | | | 41,271,289 | | | | 75,290,048 | |
Net Assets: | | | | | | | | |
Beginning of period | | | — | | | | — | |
| | | | | | | | |
End of period | | $ | 41,271,289 | | | $ | 75,290,048 | |
| | | | | | | | |
Accumulated net investment income (loss) | | $ | (581,151 | ) | | $ | (2,424,849 | ) |
| | | | | | | | |
Capital Transactions: | | | | | | | | |
Class A Shares | | | | | | | | |
Proceeds from shares issued | | $ | 27,500 | | | $ | 2,904,147 | |
Dividends reinvested | | | — | | | | 184,431 | |
Value of shares redeemed | | | — | | | | (61,930 | ) |
| | | | | | | | |
Class A Shares capital transactions | | | 27,500 | | | | 3,026,648 | |
| | | | | | | | |
Class C Shares | | | | | | | | |
Proceeds from shares issued | | | 12,500 | | | | 112,455 | |
Dividends reinvested | | | — | | | | 10,449 | |
Value of shares redeemed | | | — | | | | — | |
| | | | | | | | |
Class C Shares capital transactions | | | 12,500 | | | | 122,904 | |
| | | | | | | | |
Class I Shares | | | | | | | | |
Proceeds from shares issued | | | 52,070,631 | | | | 73,608,893 | |
Dividends reinvested | | | — | | | | 5,530,201 | |
Value of shares redeemed | | | (10,290,429 | ) | | | (8,560,092 | ) |
| | | | | | | | |
Class I Shares capital transactions | | | 41,780,202 | | | | 70,579,002 | |
| | | | | | | | |
Change in Net Assets resulting from capital transactions | | $ | 41,820,202 | | | $ | 73,728,554 | |
| | | | | | | | |
See accompanying Notes to Financial Statements.
49
SALIENT MF TRUST
Statements of Changes in Net Assets, continued
| | | | | | | | |
| | | Alternative Beta Fund
(Consolidated) | | | Trend Fund
(Consolidated) | |
| | | For the period
February 28, 2013(1)
through
December 31, 2013 | | | For the period
January 2, 2013(1)
through
December 31, 2013 | |
Share Transactions: | | | | | | | | |
Class A Shares | | | | | | | | |
Issued | | | 2,967 | | | | 246,744 | |
Reinvested | | | — | | | | 17,077 | |
Redeemed | | | — | | | | (5,655 | ) |
| | | | | | | | |
Change in Class A Shares | | | 2,967 | | | | 258,166 | |
| | | | | | | | |
Class C Shares | | | | | | | | |
Issued | | | 1,263 | | | | 9,601 | |
Reinvested | | | — | | | | 972 | |
Redeemed | | | — | | | | — | |
| | | | | | | | |
Change in Class C Shares | | | 1,263 | | | | 10,573 | |
| | | | | | | | |
Class I Shares | | | | | | | | |
Issued | | | 5,250,930 | | | | 6,796,926 | |
Reinvested | | | — | | | | 513,006 | |
Redeemed | | | (1,084,281 | ) | | | (746,006 | ) |
| | | | | | | | |
Change in Class I Shares | | | 4,166,649 | | | | 6,563,926 | |
| | | | | | | | |
| (1) | Commencement of operations |
See accompanying Notes to Financial Statements.
50
SALIENT MF TRUST
Statement of Changes in Net Assets, continued
| | | | |
| | | Global Equity Fund | |
| | | For the period
January 3, 2013(1)
through
December 31, 2013 | |
Operations: | | | | |
Net investment income (loss), net of income taxes | | $ | 298,429 | |
Net realized gain (loss) on investments, net of income taxes | | | 1,978,171 | |
Change in unrealized appreciation/depreciation on investments, net of income taxes | | | 7,675,585 | |
| | | | |
Change in Net Assets resulting from operations | | | 9,952,185 | |
| | | | |
Distributions: | | | | |
Net investment income: | | | | |
Class A Shares | | | (9,826 | ) |
Class C Shares | | | — | |
Class I Shares | | | (420,514 | ) |
Net realized gains: | | | | |
Class A Shares | | | (59,126 | ) |
Class C Shares | | | (20,585 | ) |
Class I Shares | | | (1,139,538 | ) |
| | | | |
Change in Net Assets resulting from distributions | | | (1,649,589 | ) |
| | | | |
Change in Net Assets resulting from capital transactions | | | 57,259,173 | |
| | | | |
Change in Net Assets | | | 65,561,769 | |
Net Assets: | | | | |
Beginning of period | | | — | |
| | | | |
End of period | | $ | 65,561,769 | |
| | | | |
Accumulated net investment income (loss) | | $ | (448 | ) |
| | | | |
Capital Transactions: | | | | |
Class A Shares | | | | |
Proceeds from shares issued | | $ | 3,391,783 | |
Dividends reinvested | | | 68,952 | |
Value of shares redeemed | | | (397,441 | ) |
| | | | |
Class A Shares capital transactions | | | 3,063,294 | |
| | | | |
Class C Shares | | | | |
Proceeds from shares issued | | | 991,866 | |
Dividends reinvested | | | 20,585 | |
Value of shares redeemed | | | (10,831 | ) |
| | | | |
Class C Shares capital transactions | | | 1,001,620 | |
| | | | |
Class I Shares | | | | |
Proceeds from shares issued | | | 71,251,557 | |
Dividends reinvested | | | 983,195 | |
Value of shares redeemed | | | (19,040,493 | ) |
| | | | |
Class I Shares capital transactions | | | 53,194,259 | |
| | | | |
Change in Net Assets resulting from capital transactions | | $ | 57,259,173 | |
| | | | |
See accompanying Notes to Financial Statements.
51
SALIENT MF TRUST
Statement of Changes in Net Assets, continued
| | | | |
| | | Global Equity Fund | |
| | | For the period
January 3, 2013(1)
through
December 31, 2013 | |
Share Transactions: | | | | |
Class A Shares | | | | |
Issued | | | 300,657 | |
Reinvested | | | 5,873 | |
Redeemed | | | (38,214 | ) |
| | | | |
Change in Class A Shares | | | 268,316 | |
| | | | |
Class C Shares | | | | |
Issued | | | 91,411 | |
Reinvested | | | 1,761 | |
Redeemed | | | (927 | ) |
| | | | |
Change in Class C Shares | | | 92,245 | |
| | | | |
Class I Shares | | | | |
Issued | | | 6,898,854 | |
Reinvested | | | 83,891 | |
Redeemed | | | (1,775,298 | ) |
| | | | |
Change in Class I Shares | | | 5,207,447 | |
| | | | |
| (1) | Commencement of operations |
See accompanying Notes to Financial Statements.
52
Financial Highlights
Selected data for a share of beneficial interest outstanding throughout the periods indicated.
| | | | | | | | | | | | | | | | | | | | | | | | | | | | | | | | | | | | | | | | | | | | | | | | | | | | | | | | | | | | | | | | |
| | | | | | Investment Activities | | | Distributions to Shareholders From | | | | | | | | | | | | Ratios to Average Net Assets | | | | |
| | | Net Asset
Value
Beginning
of Period | | | Net
Invest-
ment
Income
(Loss)(a) | | | Net
Realized
and
Unrealized
Gain
(Loss) on
investments | | | Total
from
Investment
Activities | | | Net
Invest-
ment
Income | | | Return
of
Capital | | | Net
Realized
Gain on
Invest-
ments | | | Total
Distri-
butions | | | Net
Asset
Value,
End of
Period | | | Total
Return(b) | | | Net
Assets at
End of
Period
(000s) | | | Gross
Expenses(c) | | | Net
Expen-
ses(c)(d) | | | Net
Expenses
Excluding
Income
Taxes(c)(d) | | | Net
Invest-
ment
Income
(Loss)(c) | | | Port-
folio
Turn-
over(e) | |
Risk Parity Fund (Consolidated) | | | | | | | | | | | | | | | | | | | | | | | | | | | | | | | | | | | | | | | | | | | | | | | | | | | | | | | | | | | | | | | | |
Class A | | | | | | | | | | | | | | | | | | | | | | | | | | | | | | | | | | | | | | | | | | | | | | | | | | | | | | | | | | | | | | | | |
Year ended December 31, 2013 | | $ | 10.16 | | | | (0.14 | ) | | | (0.35 | ) | | | (0.49 | ) | | | — | | | | — | | | | (0.60 | ) | | | (0.60 | ) | | $ | 9.07 | | | | (4.78 | )% | | $ | 5,409 | | | | 1.84 | % | | | 1.60 | % | | | 1.60 | % | | | (1.45 | )% | | | — | |
Period ended December 31, 2012(f) | | $ | 9.94 | | | | (0.07 | ) | | | 0.32 | | | | 0.25 | | | | — | | | | — | | | | (0.03 | ) | | | (0.03 | ) | | $ | 10.16 | | | | 2.53 | % | | $ | 4,018 | | | | 1.92 | % | | | 1.61 | % | | | 1.61 | % | | | (1.59 | )% | | | — | |
Class C | | | | | | | | | | | | | | | | | | | | | | | | | | | | | | | | | | | | | | | | | | | | | | | | | | | | | | | | | | | | | | | | |
Year ended December 31, 2013 | | $ | 10.13 | | | | (0.22 | ) | | | (0.34 | ) | | | (0.56 | ) | | | — | | | | — | | | | (0.60 | ) | | | (0.60 | ) | | $ | 8.97 | | | | (5.49 | )% | | $ | 1,319 | | | | 2.59 | % | | | 2.35 | % | | | 2.35 | % | | | (2.20 | )% | | | — | |
Period ended December 31, 2012(g) | | $ | 10.12 | | | | (0.09 | ) | | | 0.13 | | | | 0.04 | | | | — | | | | — | | | | (0.03 | ) | | | (0.03 | ) | | $ | 10.13 | | | | 0.41 | % | | $ | 363 | | | | 2.67 | % | | | 2.36 | % | | | 2.36 | % | | | (2.34 | )% | | | — | |
Class I | | | | | | | | | | | | | | | | | | | | | | | | | | | | | | | | | | | | | | | | | | | | | | | | | | | | | | | | | | | | | | | | |
Year ended December 31, 2013 | | $ | 10.16 | | | | (0.12 | ) | | | (0.35 | ) | | | (0.47 | ) | | | — | | | | — | | | | (0.60 | ) | | | (0.60 | ) | | $ | 9.09 | | | | (4.59 | )% | | $ | 95,156 | | | | 1.59 | % | | | 1.35 | % | | | 1.35 | % | | | (1.20 | )% | | | — | |
Period ended December 31, 2012(h) | | $ | 10.00 | | | | (0.06 | ) | | | 0.25 | | | | 0.19 | | | | — | | | | — | | | | (0.03 | ) | | | (0.03 | ) | | $ | 10.16 | | | | 1.91 | % | | $ | 108,199 | | | | 1.67 | % | | | 1.36 | % | | | 1.36 | % | | | (1.34 | )% | | | — | |
MLP Fund (Consolidated) | | | | | | | | | | | | | | | | | | | | | | | | | | | | | | | | | | | | | | | | | | | | | | | | | | | | | | | | | | | | | | | | |
Class A | | | | | | | | | | | | | | | | | | | | | | | | | | | | | | | | | | | | | | | | | | | | | | | | | | | | | | | | | | | | | | | | |
Year ended December 31, 2013 | | $ | 10.02 | | | | (0.05 | ) | | | 3.29 | | | | 3.24 | | | | (0.16 | ) | | | (0.33 | ) | | | — | | | | (0.49 | ) | | $ | 12.77 | | | | 33.14 | % | | $ | 147,626 | | | | 2.65 | % | | | 2.49 | % | | | 1.60 | % | | | (0.41 | )% | | | 64 | % |
Period ended December 31, 2012(i) | | $ | 10.09 | | | | — | (j) | | | (0.07 | ) | | | (0.07 | ) | | | — | | | | — | | | | — | | | | — | | | $ | 10.02 | | | | (0.69 | )% | | $ | 2,225 | | | | 6.52 | % | | | 1.82 | % | | | 1.60 | % | | | (0.13 | )% | | | 15 | % |
Class C | | | | | | | | | | | | | | | | | | | | | | | | | | | | | | | | | | | | | | | | | | | | | | | | | | | | | | | | | | | | | | | | |
Period ended December 31, 2013(k) | | $ | 10.40 | | | | (0.13 | ) | | | 2.90 | | | | 2.77 | | | | (0.15 | ) | | | (0.30 | ) | | | — | | | | (0.45 | ) | | $ | 12.72 | | | | 27.13 | % | | $ | 37,527 | | | | 3.40 | % | | | 3.24 | % | | | 2.35 | % | | | (1.16 | )% | | | 64 | % |
Class I | | | | | | | | | | | | | | | | | | | | | | | | | | | | | | | | | | | | | | | | | | | | | | | | | | | | | | | | | | | | | | | | |
Year ended December 31, 2013 | | $ | 10.02 | | | | (0.02 | ) | | | 3.29 | | | | 3.27 | | | | (0.18 | ) | | | (0.35 | ) | | | — | | | | (0.53 | ) | | $ | 12.76 | | | | 33.46 | % | | $ | 323,880 | | | | 2.40 | % | | | 2.24 | % | | | 1.35 | % | | | (0.16 | )% | | | 64 | % |
Period ended December 31, 2012(l) | | $ | 10.00 | | | | — | (j) | | | 0.14 | | | | 0.14 | | | | — | (j) | | | (0.12 | ) | | | — | | | | (0.12 | ) | | $ | 10.02 | | | | 1.47 | % | | $ | 38,190 | | | | 6.27 | % | | | 1.57 | % | | | 1.35 | % | | | 0.12 | % | | | 15 | % |
Alternative Beta Fund (Consolidated) | | | | | | | | | | | | | | | | | | | | | | | | | | | | | | | | | | | | | | | | | | | | | | | | | | | | | | | | | | | | | | | | |
Class A | | | | | | | | | | | | | | | | | | | | | | | | | | | | | | | | | | | | | | | | | | | | | | | | | | | | | | | | | | | | | | | | |
Period ended December 31, 2013(m) | | $ | 10.37 | | | | (0.13 | ) | | | (0.36 | ) | | | (0.49 | ) | | | — | | | | — | | | | — | | | | — | | | $ | 9.88 | | | | (4.73 | )% | | $ | 29 | | | | 2.17 | % | | | 1.63 | % | | | 1.63 | % | | | (1.60 | )% | | | — | |
Class C | | | | | | | | | | | | | | | | | | | | | | | | | | | | | | | | | | | | | | | | | | | | | | | | | | | | | | | | | | | | | | | | |
Period ended December 31, 2013(m) | | $ | 10.37 | | | | (0.18 | ) | | | (0.37 | ) | | | (0.55 | ) | | | — | | | | — | | | | — | | | | — | | | $ | 9.82 | | | | (5.30 | )% | | $ | 12 | | | | 2.91 | % | | | 2.37 | % | | | 2.37 | % | | | (2.35 | )% | | | — | |
Class I | | | | | | | | | | | | | | | | | | | | | | | | | | | | | | | | | | | | | | | | | | | | | | | | | | | | | | | | | | | | | | | | |
Period ended December 31, 2013(n) | | $ | 10.00 | | | | (0.11 | ) | | | 0.01 | | | | (0.10 | ) | | | — | | | | — | | | | — | | | | — | | | $ | 9.90 | | | | (1.00 | )% | | $ | 41,230 | | | | 1.91 | % | | | 1.37 | % | | | 1.37 | % | | | (1.35 | )% | | | — | |
| (a) | Calculated based on average shares outstanding. |
| (b) | Not annualized for periods less than one year. Total return calculations do not include any sales or redemption charges. |
| (c) | Annualized for periods less than one year. |
| (d) | The ratios presented include an investment adviser waiver. Without this waiver, the expense ratios would be higher. |
| (e) | Portfolio turnover rate is calculated on the basis of the Fund as a whole without distinguishing between the classes of shares issued. It is not annualized for periods less than one year. |
| (f) | Commenced operations on November 15, 2012. |
| (g) | Commenced operations on October 1, 2012. |
| (h) | Commenced operations on July 9, 2012. |
| (i) | Commenced operations on December 21, 2012. |
| (j) | Represents less than $0.005 or $(0.005). |
| (k) | Commenced operations on January 8, 2013. |
| (l) | Commenced operations on September 19, 2012. |
| (m) | Commenced operations on March 28, 2013. |
| (n) | Commenced operations on February 28, 2013. |
See accompanying Notes to Financial Statements.
53
Financial Highlights
Selected data for a share of beneficial interest outstanding throughout the periods indicated.
| | | | | | | | | | | | | | | | | | | | | | | | | | | | | | | | | | | | | | | | | | | | | | | | | | | | | | | | | | | | | | | | |
| | | | | | Investment Activities | | | Distributions to Shareholders From | | | | | | | | | | | | Ratios to Average Net Assets | | | | |
| | | Net Asset
Value
Beginning
of Period | | | Net
Invest-
ment
Income
(Loss)(a) | | | Net
Realized
and
Unrealized
Gain
(Loss) on
investments | | | Total
from
Invest-
ment
Activities | | | Net
Invest-
ment
Income | | | Return
of
Capital | | | Net
Realized
Gain on
Invest-
ments | | | Total
Distri-
butions | | | Net
Asset
Value,
End of
Period | | | Total
Return(b) | | | Net
Assets
at End of
Period
(000s) | | | Gross
Expenses(c) | | | Net
Expen-
ses(c)(d) | | | Net
Expenses
Excluding
Income
Taxes(c)(d) | | | Net
Invest-
ment
Income
(Loss)(c) | | | Port-
folio
Turn-
over(e) | |
Trend Fund (Consolidated) | | | | | | | | | | | | | | | | | | | | | | | | | | | | | | | | | | | | | | | | | | | | | | | | | | | | | | | | | | | | | | | | |
Class A | | | | | | | | | | | | | | | | | | | | | | | | | | | | | | | | | | | | | | | | | | | | | | | | | | | | | | | | | | | | | | | | |
Period ended December 31, 2013(f) | | $ | 10.64 | | | | (0.17 | ) | | | 1.71 | | | | 1.54 | | | | (0.34 | ) | | | — | | | | (0.80 | ) | | | (1.14 | ) | | $ | 11.04 | | | | 14.73 | % | | $ | 2,849 | | | | 1.98 | % | | | 1.62 | % | | | 1.62 | % | | | (1.52 | )% | | | — | |
Class C | | | | | | | | | | | | | | | | | | | | | | | | | | | | | | | | | | | | | | | | | | | | | | | | | | | | | | | | | | | | | | | | |
Period ended December 31, 2013(f) | | $ | 10.64 | | | | (0.23 | ) | | | 1.69 | | | | 1.46 | | | | (0.32 | ) | | | — | | | | (0.80 | ) | | | (1.12 | ) | | $ | 10.98 | | | | 13.96 | % | | $ | 116 | | | | 2.73 | % | | | 2.37 | % | | | 2.37 | % | | | (2.27 | )% | | | — | |
Class I | | | | | | | | | | | | | | | | | | | | | | | | | | | | | | | | | | | | | | | | | | | | | | | | | | | | | | | | | | | | | | | | |
Period ended December 31, 2013(g) | | $ | 10.00 | | | | (0.14 | ) | | | 2.34 | | | | 2.20 | | | | (0.38 | ) | | | — | | | | (0.80 | ) | | | (1.18 | ) | | $ | 11.02 | | | | 22.24 | % | | $ | 72,325 | | | | 1.73 | % | | | 1.37 | % | | | 1.37 | % | | | (1.27 | )% | | | — | |
Global Equity Fund | | | | | | | | | | | | | | | | | | | | | | | | | | | | | | | | | | | | | | | | | | | | | | | | | | | | | | | | | | | | | | | | |
Class A | | | | | | | | | | | | | | | | | | | | | | | | | | | | | | | | | | | | | | | | | | | | | | | | | | | | | | | | | | | | | | | | |
Period ended December 31, 2013(h) | | $ | 10.33 | | | | 0.04 | | | | 1.70 | | | | 1.74 | | | | (0.04 | ) | | | — | | | | (0.23 | ) | | | (0.27 | ) | | $ | 11.80 | | | | 16.69 | % | | $ | 3,165 | | | | 2.34 | % | | | 1.85 | % | | | 1.85 | % | | | 0.36 | % | | | 104 | % |
Class C | | | | | | | | | | | | | | | | | | | | | | | | | | | | | | | | | | | | | | | | | | | | | | | | | | | | | | | | | | | | | | | | |
Period ended December 31, 2013(h) | | $ | 10.33 | | | | (0.03 | ) | | | 1.67 | | | | 1.64 | | | | — | | | | — | | | | (0.23 | ) | | | (0.23 | ) | | $ | 11.74 | | | | 15.84 | % | | $ | 1,083 | | | | 3.09 | % | | | 2.60 | % | | | 2.60 | % | | | (0.39 | )% | | | 104 | % |
Class I | | | | | | | | | | | | | | | | | | | | | | | | | | | | | | | | | | | | | | | | | | | | | | | | | | | | | | | | | | | | | | | | |
Period ended December 31, 2013(i) | | $ | 10.00 | | | | 0.07 | | | | 2.01 | | | | 2.08 | | | | (0.08 | ) | | | — | | | | (0.23 | ) | | | (0.31 | ) | | $ | 11.77 | | | | 20.80 | % | | $ | 61,314 | | | | 2.09 | % | | | 1.60 | % | | | 1.60 | % | | | 0.61 | % | | | 104 | % |
| (a) | Calculated based on average shares outstanding. |
| (b) | Not annualized for periods less than one year. Total return calculations do not include any sales or redemption charges. |
| (c) | Annualized for periods less than one year. |
| (d) | The ratios presented include an investment adviser waiver. Without this waiver, the expense ratios would be higher. |
| (e) | Portfolio turnover rate is calculated on the basis of the Fund as a whole without distinguishing between the classes of shares issued. It is not annualized for periods less than one year. |
| (f) | Commenced operations on March 28, 2013. |
| (g) | Commenced operations on January 2, 2013. |
| (h) | Commenced operations on February 4, 2013. |
| (i) | Commenced operations on January 3, 2013. |
See accompanying Notes to Financial Statements.
54
SALIENT MF TRUST
Notes to Financial Statements
December 31, 2013
(1) ORGANIZATION
Salient MF Trust (the “Trust”) was organized on November 15, 2011 as a Delaware statutory trust registered under the Investment Company Act of 1940, as amended (the “1940 Act”), as an open-end management investment company. As of December 31, 2013, the Trust is comprised of five funds. The accompanying financial statements are presented for the following funds (individually a “Fund” and collectively the “Funds”):
| | | | |
Fund | | Short Name | | Commencement of Operations |
Salient Risk Parity Fund | | Risk Parity Fund | | July 9, 2012 |
Salient MLP & Energy Infrastructure Fund II | | MLP Fund | | September 19, 2012 |
Salient Alternative Beta Fund | | Alternative Beta Fund | | February 28, 2013 |
Salient Trend Fund
(formerly Salient Pure Trend Fund) | | Trend Fund | | January 2, 2013 |
Salient Global Equity Fund | | Global Equity Fund | | January 3, 2013 |
The Risk Parity Fund, the MLP Fund, the Alternative Beta Fund and the Trend Fund are classified as non-diversified under the 1940 Act. The Global Equity Fund is classified as diversified under the 1940 Act. The Funds are authorized to issue an unlimited number of shares of beneficial interest (“Shares”) with no par value. The Funds offer three classes of shares: Class A Shares, Class C Shares and Class I Shares. Each class of Shares is identical except as to sales charges, distribution and other expenses borne by each class, voting rights on matters affecting a single class of Shares, and the exchange privilege of each class of Shares. Class A Shares have a maximum sales charge of 5.50% as a percentage of the offering price on investments of less than $1 million (no sales charge for investments of $1 million or more). Class A Shares and Class C Shares are subject to a maximum contingent deferred sales charge of 1.00% if redeemed less than one year after purchase. Class C Shares are offered without any front-end sales charge. No sales charges are assessed with respect to Class I Shares of the Funds.
The Risk Parity Fund’s investment objective is to seek long term capital appreciation by allocating capital across a broad set of asset classes in which Salient Adviser (as defined below) seeks to balance the sources of portfolio risk, as measured by contribution to total volatility. The MLP Fund’s investment objective is to provide a high level of total return with an emphasis on making quarterly cash distributions to its shareholders. The Alternative Beta Fund’s and the Trend Fund’s investment objectives are to seek long term capital appreciation with low correlation to traditional core equity and bond market exposures. The Global Equity Fund’s investment objective is to seek long term capital appreciation. The board of trustees (each member thereof a “Trustee” and, collectively, the “Board”) is authorized to engage an investment adviser, and pursuant to an investment management agreement (the “Investment Management Agreement”), it has selected Salient Advisors, LP (“Salient Adviser”) for the Risk Parity Fund, Alternative Beta Fund, Trend Fund and Global Equity Fund and Salient Capital Advisors, LLC (“SCA”) for the MLP Fund to manage each Fund’s portfolio and operations. Salient Adviser is a Texas limited partnership that is registered as an investment adviser under the Investment Advisers Act of 1940, as amended (the “Advisers Act”), and the Commodities Futures Trading Commission (the “CFTC”) as a commodity pool operator and commodities trading advisor and is a member of the National Futures Association. SCA is a Texas limited liability company that is registered as an investment adviser under the Advisers Act. Under the Investment Management Agreement, Salient Adviser and SCA are responsible for the establishment of an investment committee (the “Investment Committee”), which is responsible for developing, implementing, and supervising the Funds’ investment programs subject to the ultimate supervision of the Board.
55
SALIENT MF TRUST
Notes to Financial Statements, continued
December 31, 2013
Under the Funds’ organizational documents, the Funds’ Trustees and officers are indemnified against certain liabilities arising out of the performance of their duties to the Funds. In the normal course of business, the Funds enter into contracts with service providers, which also provide for indemnifications by the Funds. The Funds’ maximum exposure under these arrangements is unknown as this would involve any future potential claims that may be made against the Funds. However, based on experience, management expects that risk of loss to be remote.
Salient Risk Parity Offshore Fund, Ltd. (the “Risk Parity Subsidiary”), is a company limited by shares organized under the laws of the Cayman Islands. The Risk Parity Subsidiary is wholly-owned by the Risk Parity Fund, and is therefore consolidated in the Risk Parity Fund’s consolidated financial statements. The Risk Parity Subsidiary was formed on July 13, 2012, and has been consolidated since its formation. The Risk Parity Fund invests in the Risk Parity Subsidiary in order to gain additional exposure to certain derivatives trading within the limitations of the federal tax law requirements applicable to regulated investment companies (“RIC”). Where the context requires, the “Risk Parity Fund” includes both the Risk Parity Fund and the Risk Parity Subsidiary.
The MLP Fund may invest up to 25% of its total assets in Salient MLP & Energy Infrastructure Fund II, Inc. (the “MLP Subsidiary”). The MLP Subsidiary, which is wholly-owned by the MLP Fund, and therefore consolidated in the MLP Fund’s consolidated financial statements, is organized under the laws of the state of Delaware and for federal income tax purposes as a Subchapter “C” corporation. The MLP Subsidiary was formed on September 19, 2012, and has been consolidated since its formation. The MLP Fund invests in the MLP Subsidiary in order to gain additional exposure to equity or debt securities of various master limited partnerships. Where the context requires, the “MLP Fund” includes both the MLP Fund and the MLP Subsidiary.
Salient Alternative Beta Offshore Fund, Ltd. (the “Alternative Beta Subsidiary”), is a company limited by shares organized under the laws of the Cayman Islands. The Alternative Beta Subsidiary is wholly-owned by the Alternative Beta Fund, and is therefore consolidated in the Alternative Beta Fund’s consolidated financial statements. The Alternative Beta Subsidiary was formed on August 16, 2012, and has been consolidated since its formation. The Alternative Beta Fund invests in the Alternative Beta Subsidiary in order to gain additional exposure to certain derivatives trading within the limitations of the federal tax law requirements applicable to RICs. Where the context requires, the “Alternative Beta Fund” includes both the Alternative Beta Fund and the Alternative Beta Subsidiary.
Salient Trend Offshore Fund, Ltd. (formerly Salient Pure Trend Offshore Fund, Ltd.) (the “Trend Subsidiary”), is a company limited by shares organized under the laws of the Cayman Islands. The Trend Subsidiary is wholly-owned by the Trend Fund, and is therefore consolidated in the Trend Fund’s consolidated financial statements. The Trend Subsidiary was formed on August 16, 2012, and has been consolidated since its formation. The Trend Fund invests in the Trend Subsidiary in order to gain additional exposure to certain derivatives trading within the limitations of the federal tax law requirements applicable to RICs. Where the context requires, the “Trend Fund” includes both the Trend Fund and the Trend Subsidiary.
The Global Equity Fund is not invested in a wholly-owned subsidiary and is presented on an individual fund basis. For convenience, reference to financial statements shall include those consolidated and on an individual fund basis, as the context requires.
56
SALIENT MF TRUST
Notes to Financial Statements, continued
December 31, 2013
(2) SUMMARY OF SIGNIFICANT ACCOUNTING POLICIES AND PRACTICES
(a) BASIS OF ACCOUNTING
The accounting and reporting policies of the Funds conform with U.S. generally accepted accounting principles (“U.S. GAAP”). The accompanying financial statements reflect the financial positions of the Risk Parity Fund and the Risk Parity Subsidiary, the MLP Fund and the MLP Subsidiary, the Alternative Beta Fund and the Alternative Beta Subsidiary, the Trend Fund and the Trend Subsidiary and the results of their operations, each on a consolidated basis. All intercompany accounts and transactions have been eliminated in consolidation. The Global Equity Fund is presented on an individual fund basis.
(b) CASH EQUIVALENTS
The Funds consider all unpledged temporary cash investments with a maturity date at the time of purchase of three months or less to be cash equivalents.
(c) PORTFOLIO SECURITIES TRANSACTIONS
Security transactions are accounted for on a trade date basis. Realized gains and losses are reported using the specific identification cost basis.
(d) INVESTMENT VALUATION
The Funds record their investments at fair value. Fair value is defined as the price that would be received to sell an asset or paid to transfer a liability in an orderly transaction between market participants at the measurement date. The valuation techniques used to determine fair value are further described below.
The Board has formed a valuation committee (the “Board Valuation Committee”) that is responsible for overseeing the Funds’ valuation policies, making recommendations to the Board on valuation-related matters, and overseeing implementation by Salient Adviser and SCA of the Funds’ valuation policies.
The Board has authorized Salient Adviser and SCA to each establish a valuation committee (the “Adviser Valuation Committee”), which includes representatives from each Fund’s investment adviser. The Adviser Valuation Committee’s function, subject to the oversight of the Board Valuation Committee and the Board, is generally to review valuation methodologies, valuation determinations, and any information provided to the Adviser Valuation Committee by Salient Adviser, SCA, or Citi Fund Services Ohio, Inc., the Funds’ independent administrator (“Administrator”).
To the extent that the price of a security cannot be determined applying the methods described below, the Adviser Valuation Committee in conjunction with the Administrator will determine the price of the security pursuant to the fair value procedures approved by the Board.
Investments held by the Funds are valued as follows:
| | • | | SECURITIES LISTED ON A SECURITIES EXCHANGE OR OVER-THE-COUNTER EXCHANGES—In general, the Funds value these securities at their last sales price on the exchange or over-the-counter market on the valuation date. If the security is listed on more than one exchange, the Funds use the price from the exchange that it considers to be the principal exchange on which the security is traded. If there have been no sales for that day on the exchange where the security is |
57
SALIENT MF TRUST
Notes to Financial Statements, continued
December 31, 2013
| | principally traded, then the price of the security will be valued at the mean between the closing “bid” and “ask” prices on the valuation day. Securities listed on the NASDAQ National Market System (“NASDAQ”) will be valued at the NASDAQ Official Closing Price on the valuation date, which may not necessarily represent the last sale price. |
As of the close of regular trading on the New York Stock Exchange (the “NYSE”), securities traded primarily on security exchanges outside the United States are valued at the last sale price on such exchanges on the day of valuation, or if there is no sale on the day of valuation, at the last reported bid price if held long, or at the last reported ask price if held short. If a security’s price is available from more than one exchange, the Funds use the exchange that is the primary market for the security. Such securities are generally categorized as Level 1 in the fair value hierarchy. However, depending on the foreign market, closing prices may be up to 15 hours old when they are used to price a Fund’s shares, and the Fund may determine that certain closing prices do not reflect the fair value of the security. This determination will be based on review of a number of factors, including developments in foreign markets, the performance of U.S. securities markets, and the performance of instruments trading in U.S. markets that represent foreign securities and baskets of foreign securities. If a Fund determines that closing prices do not reflect the fair value of the securities, the Fund will adjust the previous closing prices in accordance with pricing procedures approved by the Board to reflect what it believes to be the fair value of the securities as of the close of regular trading on the NYSE. The Funds may also fair value securities in other situations, for example, when a particular foreign market is closed but a Fund is open. For foreign equity securities and foreign equity futures contracts, each Fund uses an outside pricing service to provide it with closing market prices and information used for adjusting those prices, and when so adjusted, such securities and futures contracts are generally categorized as Level 2 in the fair value hierarchy.
| | • | | PUBLICLY-TRADED EQUITY SECURITIES ACQUIRED IN A DIRECT PLACEMENT TRANSACTION—Such securities may be subject to restrictions on resale that can affect the security’s liquidity and fair value. Such securities that are convertible or otherwise will become freely tradable will be valued based on the market value of the freely tradable security less an applicable restriction discount. Generally, the discount will initially be equal to the discount at which the Fund purchased the securities and thereafter will be periodically reassessed and likely reduced over the anticipated restricted period. Equity securities are typically categorized as Level 1 or 2 in the fair value hierarchy based upon the inputs utilized in determining the value of such securities. |
| | • | | DERIVATIVES—Exchange traded futures contracts are valued using quoted final settlement prices from the national exchange on which they are principally traded and are typically categorized as Level 1 in the fair value hierarchy. If no such price is reported by such exchange on the valuation date, the Adviser Valuation Committee will determine the fair value in good faith using information that is available at such time. Such fair valued investments are typically categorized as Level 2 or Level 3 in the fair value hierarchy, based upon the inputs used to value the investments. |
Forward foreign currency exchange contracts are valued at the current day’s interpolated foreign exchange rate, which is calculated using the current day’s spot rate, and the 30 to 720 day forward rates converted to U.S. dollars at the exchange rate of such currencies on the valuation date. Such valuations are provided by a pricing service approved by the Board, and are typically categorized as Level 2 in the fair value hierarchy.
Options that are listed on a securities exchange are generally valued at the closing “bid” and “ask” prices for options held long and short, respectively on the valuation date and are typically categorized as Level 1 in the fair value hierarchy. If no such bid or ask price is reported, the positions are valued at
58
SALIENT MF TRUST
Notes to Financial Statements, continued
December 31, 2013
the last sales price on the valuation date. If no such sales price is reported by such exchange on the valuation date, the Adviser Valuation Committee in conjunction with the Administrator will determine the fair value in good faith using information that is available at such time. Such fair valued investments are typically categorized as Level 2 or Level 3 in the fair value hierarchy, based upon the inputs used to value the investments.
Options traded on an over-the-counter market are generally valued using the midpoint of the closing bid and ask prices provided by an independent pricing service. If a quotation is not available from the independent pricing service, the price is obtained from a broker (typically the counterparty to the option) on the valuation date. If no such price is available on the valuation date, the Adviser Valuation Committee in conjunction with the Administrator will determine the fair value of such options in good faith using information that is available at such time. Such fair valued options are typically categorized as Level 2 or Level 3 in the fair value hierarchy, based upon the inputs used to value the investments.
Non exchange-traded derivatives, such as swap agreements, are valued based on procedures approved by the Board and are typically categorized as Level 2 in the fair value hierarchy. Total return swaps are generally fair valued using evaluated quotes provided by an independent pricing service. If a quotation is not available from the independent pricing service, the price is obtained from a broker (typically the counterparty to the swap agreement) on the valuation date.
| | • | | SECURITIES NOT ACTIVELY TRADED—The value of securities, derivatives or synthetic securities that are not actively traded on an exchange shall be determined by obtaining quotes from brokers that normally deal in such securities or by an unaffiliated pricing service that may use actual trade data or procedures using market indices, matrices, yield curves, specific trading characteristics of certain groups of securities, pricing models or a combination of these procedures. In each of these situations, valuations are typically categorized as Level 2 in the fair value hierarchy. Securities for which independent pricing services are not available are valued pursuant to the fair valuation procedures approved by the Board and are typically categorized as Level 2 or Level 3 in the fair value hierarchy, based upon the inputs used to value the investments. |
| | • | | INVESTMENT FUNDS—Investments in investment limited partnerships and shares in unregistered investment funds (“Investment Funds”) for which a market value is not available will generally be valued using the partner’s capital or NAV as a practical expedient, as reported by the investment fund managers or the administrators of such Investment Funds. These Investment Funds value their underlying investments in accordance with policies established by such Investment Funds. Prior to investing in any Investment Fund, the Adviser Valuation Committee, as part of the due diligence process, conducts a review of the valuation methodologies employed by the Investment Fund to determine whether such methods are appropriate for the asset types. The Adviser Valuation Committee will consider whether it is appropriate, in light of the relevant circumstances, to value shares at NAV as reported by an Investment Fund for valuation purposes, or whether to adjust such reported value to reflect an adjusted fair value. Because of the inherent uncertainty of valuation, fair value may differ significantly from the value that would have been used had readily available markets for the investments in Investment Funds existed. The Funds’ investments in Investment Funds are subject to the terms and conditions of the respective operating agreements and offering memoranda of such Investment Funds. Investment Funds are typically categorized as Level 2 or Level 3 in the fair value hierarchy based upon liquidity. |
| | • | | OTHER—Investments in private placement securities and other securities for which market quotations are not readily available will be valued in good faith by using fair value procedures approved by the Board. Such fair value procedures may consider among other factors discounts to publicly traded |
59
SALIENT MF TRUST
Notes to Financial Statements, continued
December 31, 2013
| | issues, time until conversion date, securities with similar yields, quality, type of issue, coupon, duration and rating, and an analysis of the issuer’s financial statements and reports. If events occur that affect the value of the Funds’ securities before the net asset value has been calculated, the securities so affected will generally be priced using fair value procedures. Such investments are typically categorized as Level 2 or Level 3 in the fair value hierarchy based upon the inputs utilized in determining the value of such investments. |
(e) FOREIGN CURRENCY
The accounting records of the Funds are maintained in U.S. dollars. Foreign currency amounts and investments denominated in a foreign currency, if any, are translated into U.S. dollar amounts at current exchange rates on the valuation date. Purchases and sales of investments denominated in foreign currencies are translated into U.S. dollar amounts at the exchange rate on the respective dates of such transactions.
(f) MASTER LIMITED PARTNERSHIPS
Entities commonly referred to as Master Limited Partnerships (“MLPs”) are generally organized under state law as limited partnerships or limited liability companies. The MLP Fund and the MLP Subsidiary invest in MLPs receiving partnership taxation treatment under the Internal Revenue Code of 1986, as amended (the “Code”), and whose interest or “units” are traded on securities exchanges like shares of corporate stock. To be treated as a partnership for U.S. federal income tax purposes, an MLP whose units are traded on a securities exchange must receive at least 90% of its income from qualifying sources such as interest, dividends, real property rents, gains on dispositions of real property, income and gains from mineral or natural resources activities, income and gains from the transportation or storage of certain fuels, and, in certain circumstances, income and gains from commodities or futures, forwards and options on commodities. Mineral or natural resources activities include exploration, development, production, processing, mining, refining, marketing and transportation (including pipelines) of oil and gas, minerals, geothermal energy, fertilizer, timber or industrial source carbon dioxide. An MLP consists of a general partner and limited partners (or in the case of MLPs organized as limited liability companies, a managing member and members).
The general partner or managing member typically controls the operations and management of the MLP and has an ownership stake in the partnership or limited liability company. The limited partners or members, through their ownership of limited partner or member interests, provide capital to the entity, are intended to have no role in the operation and management of the entity and receive cash distributions. The MLP Fund’s investments in MLPs consist only of limited partner or member interests ownership. The MLPs themselves generally do not pay U.S. federal income taxes. Thus, unlike investors in corporate securities, direct MLP investors are generally not subject to double taxation (i.e., corporate level tax and tax on corporate dividends). Currently, most MLPs operate in the energy and/or natural resources sector.
(g) RESTRICTED AND ILLIQUID SECURITIES
The MLP Fund may invest up to 15% of its total assets in unregistered or otherwise restricted securities. A restricted security is a security which has been purchased through a private offering and cannot be resold to the general public without prior registration under the Securities Act of 1933 (the “1933 Act”) or pursuant to the resale limitations provided by Rule 144 under the 1933 Act, or an exemption from the registration requirements of the 1933 Act. Illiquid securities are securities that cannot be sold or disposed of within a reasonable amount of time in the ordinary course of business. Certain restricted securities may be resold in transactions exempt from
60
SALIENT MF TRUST
Notes to Financial Statements, continued
December 31, 2013
registration, normally to qualified institutional buyers, and may be deemed liquid by the Adviser based on procedures approved by the Board. Therefore, not all restricted securities are considered illiquid.
Investments in private placement securities and other securities for which market quotations are not readily available will be valued in good faith by using fair value procedures approved by the Board. Such fair value procedures may consider among other factors discounts to publicly traded issues, time until conversion date, securities with similar yields, quality, type of issue, coupon, duration and rating, and an analysis of the issuer’s financial statements and reports. If events occur that affect the value of the MLP Fund’s securities before the net asset value has been calculated, the securities so affected will generally be priced using fair value procedures.
The restricted securities held at December 31, 2013 are identified below and are also presented in the MLP Fund’s Consolidated Schedule of Investments.
| | | | | | | | | | | | | | | | | | | | | | | | |
Fund | | Security | | | % of Net
Assets | | | Acquisition
Date | | | Acquisition
Cost | | | Shares/Units | | | Fair Value | |
MLP Fund | | | NGL Energy Partners, L.P. | * | | | 0.7 | % | | | 9/30/13 | | | $ | 3,105,000 | | | | 103,500 | | | $ | 3,496,230 | |
MLP Fund | | | NGL Energy Partners, L.P. | * | | | 1.5 | % | | | 11/5/13 | | | | 6,687,340 | | | | 226,000 | | | | 7,503,200 | |
| | | | | | | | | | | | | | | | | | | | | | | | |
Total | | | | 2.2 | % | | | | | | $ | 9,792,340 | | | | 329,500 | | | $ | 10,999,430 | |
| | | | | | | | | | | | | | | | | | | | | | | | |
| * | Securities have been deemed liquid by the Adviser based on procedures approved by the Board. |
(h) INVESTMENT INCOME
Interest income is recognized on the accrual basis. Distributions are recorded on the ex-dividend date. Distributions received from a Fund’s investments in MLPs generally are composed of ordinary income, capital gains and return of capital from the MLP.
(i) USE OF ESTIMATES
The preparation of the consolidated financial statements in accordance with U.S. GAAP requires management to make estimates and assumptions relating to the reported amounts of assets and liabilities, and the disclosure of contingent assets and liabilities at the date of the financial statements and the reported amounts of income and expenses during the reporting period. Actual results could differ from those estimates and such differences may be significant.
(j) DERIVATIVE INSTRUMENTS
All open derivative positions at period-end are presented in the Funds’ Schedules of Investments. The following is a description of the derivative instruments the Funds utilize, including the primary underlying risk exposures related to each instrument type.
FORWARD FOREIGN CURRENCY EXCHANGE CONTRACTS—The Alternative Beta Fund enters into forward foreign currency exchange contracts in connection with its investment objective in order to gain exposure to a variety of non-traditional risk premiums. The forward foreign currency exchange contracts are adjusted by the daily exchange rate of the underlying currency and any gains or losses are recorded for financial statement purposes as unrealized gains or losses until the contract settlement date. The Fund could be exposed to risks if the counterparties to the contracts are unable to meet the terms of their contracts and from unanticipated
61
SALIENT MF TRUST
Notes to Financial Statements, continued
December 31, 2013
movements in the value of a foreign currency relative to the U.S. dollar. The Fund remains subject to credit risk with respect to the amount it expects to receive from counterparties. However, the Fund has sought to mitigate these risks by generally requiring the posting of collateral at prearranged exposure levels to cover its exposure to the counterparty.
FUTURES CONTRACTS—The Risk Parity Fund, the Alternative Beta Fund, the Trend Fund and the Global Equity Fund invest in futures contracts to gain exposure to, or hedge against, changes in the value of equities, commodities, interest rates or foreign currencies, or to gain exposure to momentum, which is defined as the continuation of recent price trends, across a variety of global markets and asset classes. A futures contract represents a commitment for the future purchase or sale of an asset at a specified price on a specified date. Upon entering into a futures contract, the Funds are required to pledge to the broker an amount of cash and/or other assets equal to a certain percentage of the contract amount (initial margin deposit). A portion of the initial margin is restricted as to its use. Subsequent payments, known as “variation margin,” are made or received by the Funds, depending on the fluctuations in the value of the underlying security. The underlying security is not physically delivered. The Funds recognize a gain or loss equal to the variation margin. Should market conditions move unexpectedly, the Funds may not achieve the anticipated benefits of the futures contract and may realize a loss. The use of futures transactions involves, to varying degrees, elements of market risk (generally equity price risk related to stock index or equity futures contracts, interest rate risk related to bond futures contracts, and commodity price risk related to commodity futures contracts) and exposure to loss. The face or contract amount reflects the extent of the total exposure the Funds have in the particular classes of instruments. Among other risks, the use of futures contracts may cause the Funds to have imperfect correlation due to differences between movements in the price of the futures contracts and the market value of the underlying securities. With futures contracts, there is minimal counterparty risk to the Funds since the futures contracts are exchange-traded and the exchange’s clearinghouse, as the counterparty to all exchange-traded futures, guarantees the futures against default.
OPTIONS—The MLP Fund writes equity call options with the purpose of generating realized gains from premiums as a means to enhance distributions to the Fund’s common shareholders. Options are secured by investments, as detailed in the MLP Fund’s Consolidated Schedule of Investments. A call option on a security is a contract that gives the holder of such call option the right to buy the security underlying the call option from the writer of such call option at a specified price at any time during the term of the option. At the time the call option is sold, the writer of a call option receives a premium from the buyer of such call option. If the MLP Fund writes a call option, the MLP Fund will have the obligation upon exercise of such call option to deliver the underlying security upon payment of the exercise price. As the writer of a covered call option, during the option’s life, the MLP Fund gives up the opportunity to profit from increases in the market value of the security covering the call option above the sum of the premium and the strike price of the call, but the MLP Fund retains the risk of loss should the price of the underlying security decline.
The MLP Fund had the following transactions in written call options during the year ended December 31, 2013:
| | | | | | | | |
MLP Fund | | Number of
Contracts | | | Premiums | |
Options outstanding at December 31, 2012 | | | — | | | $ | — | |
Options written | | | 12,470 | | | | 283,465 | |
Options exercised | | | (1,734 | ) | | | (15,544 | ) |
Options expired | | | (6,414 | ) | | | (146,595 | ) |
Options closed | | | (4,322 | ) | | | (121,326 | ) |
| | | | | | | | |
Options outstanding at December 31, 2013 | | | — | | | $ | — | |
| | | | | | | | |
62
SALIENT MF TRUST
Notes to Financial Statements, continued
December 31, 2013
SWAP AGREEMENTS—As of December 31, 2013, the Alternative Beta Fund invested in a total return swap agreement in connection with its investment objective in order to gain exposure to a variety of non-traditional risk premiums.
A total return swap is a bilateral financial contract agreement where one party (the payer) agrees to pay the other (the receiver) the total return on a specified asset or index in exchange for a fixed or floating rate of return. A total return swap allows the receiver or payer to derive the economic benefit of owning or having short exposure to an asset without owning or shorting the underlying asset directly. The receiver is entitled to the amount, if any, by which the notional amount of the total return swap agreement would have increased in value had it been invested in the particular instruments, plus an amount equal to any dividends or interest that would have been received on those instruments. In return, the payer is entitled to an amount equal to a fixed or floating rate of interest (e.g., a LIBOR based rate) on the notional amount of the swap agreement plus the amount, if any, by which the notional amount would have decreased in value had it been invested in such instruments, less any dividends or interest. The amounts to which each party is entitled are normally netted against each other at periodic settlement dates, resulting in a single amount that is either due to or from each party.
Total return swaps are subject to counterparty risk, market risk and interest rate risk. Total return swaps utilized by the Alternative Beta Fund may not perform as expected. Risks may arise as a result of the failure of the counterparty to perform under the agreement. The loss incurred by the failure of a counterparty is generally limited to the market value and premium amounts recorded. The Alternative Beta Fund considers the creditworthiness of each counterparty to a swap agreement in evaluating potential credit risk, and will not enter into any swap agreement unless the Adviser believes the counterparty to the transaction is creditworthy, or unless the swap agreement is centrally cleared. With uncleared swap agreements, the Alternative Beta Fund bears the risk of loss of the amount expected to be received under the swap agreement if the counterparty fails to perform. Additionally, risks may arise from the unanticipated movements in interest rates. The Alternative Beta Fund may use various techniques to minimize credit risk including early termination or periodic reset and payment. The counterparty risk for cleared swap agreements is generally lower than for uncleared over-the-counter swap agreements as the clearing organization becomes substituted for each counterparty and, in effect, guarantees the parties’ performance under the contract as each party to a trade looks only to a clearing house for performance of financial obligations. However, there can be no assurance that the clearing house, or its members, will satisfy its obligations to the Alternative Beta Fund. Collateral, in the form of cash, is held in broker segregated accounts for total return swaps.
The following is a summary of the fair value of derivative instruments held directly by the Funds as of December 31, 2013, and where such derivatives are recorded:
| | | | | | | | | | | | | | | | | | | | |
| | | Assets | | | Liabilities | |
Fund | | Unrealized
Appreciation
on Forward
Foreign Currency
Exchange Contracts | | | Variation
Margin on
Futures
Contracts^ | | | Unrealized
Gain on
Swap
Agreements | | | Unrealized
Depreciation
on Forward
Foreign Currency
Exchange Contracts | | | Variation
Margin on
Futures
Contracts^ | |
Commodity Risk Exposure: | | | | | | | | | | | | | | | | | | | | |
Risk Parity Fund | | $ | — | | | $ | 1,409,681 | | | $ | — | | | $ | — | | | $ | 1,700,746 | |
Alternative Beta Fund | | | — | | | | 2,286,451 | | | | — | | | | — | | | | 3,050,494 | |
Trend Fund | | | — | | | | 2,635,086 | | | | — | | | | — | | | | 5,305,842 | |
Equity Risk Exposure: | | | | | | | | | | | | | | | | | | | | |
Risk Parity Fund | | | — | | | | 2,749,356 | | | | — | | | | — | | | | — | |
Alternative Beta Fund | | | — | | | | 1,885,508 | | | | 55,304 | | | | — | | | | 1,639,674 | |
Trend Fund | | | — | | | | 3,310,462 | | | | — | | | | — | | | | — | |
63
SALIENT MF TRUST
Notes to Financial Statements, continued
December 31, 2013
| | | | | | | | | | | | | | | | | | | | |
| | | Assets | | | Liabilities | |
Fund | | Unrealized
Appreciation
on Forward
Foreign Currency
Exchange Contracts | | | Variation
Margin on
Futures
Contracts^ | | | Unrealized
Gain on
Swap
Agreements | | | Unrealized
Depreciation
on Forward
Foreign Currency
Exchange Contracts | | | Variation
Margin on
Futures
Contracts^ | |
Foreign Exchange Rate Risk Exposure: | | | | | | | | | | | | | | | | | | | | |
Alternative Beta Fund | | $ | 862,240 | | | $ | — | | | $ | — | | | $ | 80,347 | | | $ | — | |
Global Equity Fund | | | — | | | | 1,970 | | | | — | | | | — | | | | — | |
Interest Rate Risk Exposure: | | | | | | | | | | | | | | | | | | | | |
Risk Parity Fund | | | — | | | | 195,075 | | | | — | | | | — | | | | 1,775,816 | |
Alternative Beta Fund | | | — | | | | 72,614 | | | | — | | | | — | | | | 47,752 | |
Trend Fund | | | — | | | | 634,220 | | | | — | | | | — | | | | 362,102 | |
| ^ | Includes cumulative appreciation/depreciation on futures contracts as reported in the Schedules of Investments. Only current outstanding variation margin is reported in the Statements of Assets and Liabilities. |
The following is a summary of the effect of derivative instruments on the Statements of Operations for the periods ended December 31, 2013:
| | | | | | | | | | | | | | | | | | | | |
| | | Realized Gain (Loss) on Derivatives
Recognized as a Result from Operations | | | Change in Unrealized
Appreciation/Depreciation on
Derivatives Recognized as a
Result from Operations | |
Fund | | Net Realized
Gains (Losses)
from Written
Option Contracts | | | Net Realized
Gains (Losses)
from Forward
Foreign Currency
Exchange Contracts | | | Net Realized
Gains
(Losses) from
Futures
Contracts | | | Net Realized
Gains (Losses)
from Swap
Agreements | | | Change in
Unrealized
Appreciation/
Depreciation
on Derivatives | |
Commodity Risk Exposure: | | | | | | | | | | | | | | | | | | | | |
Risk Parity Fund | | $ | — | | | $ | — | | | $ | (10,767,204 | ) | | $ | — | | | $ | 1,100,600 | |
Alternative Beta Fund | | | — | | | | — | | | | 248,035 | | | | — | | | | (764,043 | ) |
Trend Fund | | | — | | | | — | | | | 1,925,161 | | | | — | | | | (2,670,756 | ) |
Equity Risk Exposure: | | | | | | | | | | | | | | | | | | | | |
Risk Parity Fund | | | — | | | | — | | | | 16,174,301 | | | | — | | | | 1,416,316 | |
MLP Fund | | | 146,742 | | | | — | | | | — | | | | — | | | | — | |
Alternative Beta Fund | | | — | | | | — | | | | 1,653,072 | | | | (620,593 | ) | | | 301,138 | |
Trend Fund | | | — | | | | — | | | | 8,842,205 | | | | — | | | | 3,310,462 | |
Global Equity Fund | | | — | | | | — | | | | 351,652 | | | | — | | | | — | |
Foreign Exchange Rate Risk Exposure: | | | | | | | | | | | | | | | | | | | | |
Alternative Beta Fund | | | — | | | | (1,311,839 | ) | | | — | | | | — | | | | 781,893 | |
Global Equity Fund | | | — | | | | — | | | | 94,645 | | | | — | | | | 1,970 | |
Interest Rate Risk Exposure: | | | | | | | | | | | | | | | | | | | | |
Risk Parity Fund | | | — | | | | — | | | | (10,918,366 | ) | | | — | | | | (1,131,996 | ) |
Alternative Beta Fund | | | — | | | | — | | | | (369,370 | ) | | | — | | | | 24,862 | |
Trend Fund | | | — | | | | — | | | | (2,109,482 | ) | | | — | | | | 272,118 | |
Effective January 1, 2013 the Funds adopted Accounting Standards Update (“ASU”) No. 2011-11 “Disclosures about Offsetting Assets and Liabilities” (“ASU 2011-11”), which was subsequently clarified by ASU No. 2013-01 “Clarifying the Scope of Disclosures about Offsetting Assets and Liabilities” (“ASU 2013- 01”).
64
SALIENT MF TRUST
Notes to Financial Statements, continued
December 31, 2013
ASU 2013-01 requires an entity to disclose information about offsetting and related arrangements to enable users of that entity’s financial statements to understand the effect of the arrangements on its financial position.
As described above, the Funds utilized derivative instruments to achieve their investment objectives during the year ended December 31, 2013. The Funds may enter into International Swaps and Derivatives Association, Inc. Master Agreements (“ISDA Master Agreement”) or similar agreements with its derivative contract counterparties whereby the Fund may, under certain circumstances, offset with the counterparty certain derivative financial instruments’ payables and/or receivables with collateral held and/or posted and create one single net payment. Under the ISDA Master Agreements in place at December 31, 2013, the Funds are subject to master netting agreements that allow for amounts owed between each Fund and the counterparty to its transactions to be netted. The party that has the larger payable pays the excess of the larger amount over the smaller amount to the other party. The master netting agreements do not apply to amounts owed to or from different counterparties. At December 31, 2013, the Trust had one ISDA Master Agreement in place with Goldman Sachs for which master netting agreements (“MNA”) apply only to amounts owed in the same currency and in respect of the same transaction.
The following table provides additional disclosures regarding the derivative assets net of amounts available for offset under a MNA and net of the collateral received as of December 31, 2013:
| | | | | | | | | | | | | | | | | | | | |
| | | Gross
Amounts of
Recognized
Assets | | | Gross
Amounts
Available
for Offset | | | Net
Amounts
of Assets ^ | | | Cash
Collateral
Received | | | Net Amount | |
Alternative Beta Fund | | | | | | | | | | | | | | | | | | | | |
Swap Agreement | | $ | 55,304 | | | $ | — | | | $ | 55,304 | | | $ | — | | | $ | 55,304 | |
| | | | | | | | | | | | | | | | | | | | |
Total swap agreement | | $ | 55,304 | | | $ | — | | | $ | 55,304 | | | $ | — | | | $ | 55,304 | |
| | | | | | | | | | | | | | | | | | | | |
Forward Foreign Currency Exchange Contracts | | $ | 862,240 | | | $ | (80,347 | ) | | $ | — | | | $ | — | | | $ | 781,893 | |
| | | | | | | | | | | | | | | | | | | | |
Total forward foreign currency exchange contracts | | $ | 862,240 | | | $ | (80,347 | ) | | $ | — | | | $ | — | | | $ | 781,893 | |
| | | | | | | | | | | | | | | | | | | | |
| ^ | Amounts for swap agreements and forward foreign currency exchange contracts are reflected in the Statements of Assets and Liabilities as Unrealized Gain on Swap Agreements and Unrealized Appreciation on Forward Foreign Currency Exchange Contracts, respectively. |
65
SALIENT MF TRUST
Notes to Financial Statements, continued
December 31, 2013
The following table provides additional disclosures regarding the offsetting of derivative liabilities presented in the Statements of Assets and Liabilities:
| | | | | | | | | | | | | | | | | | | | |
| | | Gross
Amounts of
Recognized
Liabilities | | | Gross
Amounts
Available
for Offset | | | Net
Amounts
of
Liabilities* | | | Cash
Collateral
Pledged | | | Net Amount | |
Alternative Beta Fund | | | | | | | | | | | | | | | | | | | | |
Forward Foreign Currency Exchange Contracts | | $ | 80,347 | | | $ | (80,347 | ) | | $ | — | | | $ | — | | | $ | — | |
| | | | | | | | | | | | | | | | | | | | |
Total forward foreign currency exchange contracts | | $ | 80,347 | | | $ | (80,347 | ) | | $ | — | | | $ | — | | | $ | — | |
| | | | | | | | | | | | | | | | | | | | |
| * | Amounts for swap agreements and forward foreign currency exchange contracts are reflected in the Statements of Assets and Liabilities as Unrealized Loss on Swap Agreements and Unrealized Depreciation on Forward Foreign Currency Exchange Contracts, respectively. |
The following is a summary of the average monthly notional value of futures contracts, swap agreements and forward foreign currency exchange contracts purchased and sold by the Funds for the periods ended December 31, 2013, as well as the notional amount of futures contracts, swap agreements and forward foreign currency exchange contracts outstanding as of December 31, 2013:
| | | | | | | | |
| | | Average Monthly
Notional Value | | | Notional Value
Outstanding at
December 31, 2013 | |
Risk Parity Fund | | | | | | | | |
Futures contracts purchased | | $ | 429,542,764 | | | $ | 327,665,800 | |
Futures contracts sold | | | 28,692,703 | | | | 33,634,869 | |
MLP Fund | | | | | | | | |
Written call options | | $ | 1,445 | | | $ | — | |
Alternative Beta Fund | | | | | | | | |
Futures contracts purchased | | $ | 104,248,704 | | | $ | 167,827,762 | |
Futures contracts sold | | | 93,790,593 | | | | 170,240,747 | |
Total return swap agreements | | | 8,566,807 | | | | 5,286,818 | |
Forward foreign currency exchange contracts | | | 62,841,808 | | | | 66,476,154 | |
Trend Fund | | | | | | | | |
Futures contracts purchased | | $ | 129,360,453 | | | $ | 179,870,688 | |
Futures contracts sold | | | 103,096,168 | | | | 204,056,706 | |
Global Equity Fund | | | | | | | | |
Futures contracts purchased | | $ | 982,566 | | | $ | — | |
Futures contracts sold | | | 1,387,639 | | | | 5,170,500 | |
(k) ORGANIZATION AND OFFERING COSTS
Organization costs associated with the establishment of the Trust were borne by Salient Adviser. Offering costs are amortized to expense over twelve months from the Funds’ commencement of operations on a straight-line basis.
66
SALIENT MF TRUST
Notes to Financial Statements, continued
December 31, 2013
(l) DISTRIBUTION TO SHAREHOLDERS
Dividends to shareholders from net investment income, if any, are declared and distributed at least annually. Distributions from net realized capital gains, if any, are distributed annually and may include short-term capital gains. All net short-term capital gains are included in ordinary income for tax purposes. Distributions to shareholders are recorded on the ex-dividend date. The Funds may also pay, at the end of the calendar year, a special distribution to comply with requirements under the Code.
For the MLP Fund, the character of distributions made during the year from net investment income or net capital gains may differ from its ultimate characterization for federal income tax purposes. For the year ended December 31, 2013, the MLP Fund’s distributions are expected to be comprised of approximately 67% return of capital.
The amount of distributions from net investment income and net realized gains is determined in accordance with federal income tax regulations which may differ from U.S. GAAP. These “book/tax” differences are either considered temporary or permanent in nature. To the extent these differences are permanent in nature (e.g., return of capital, differing treatment on certain swap agreements, net operating loss, distribution reclassification, certain gain/loss and certain distributions), such amounts are reclassified within the composition of net assets based on their federal tax-basis treatment: temporary differences (e.g., wash sales and differing treatment on certain swap agreements) do not require a reclassification. Distributions which exceed net investment income and net realized capital gains for financial reporting purposes but not for tax purposes are reported as distributions in excess of net investment income or net realized gains. To the extent they exceed net investment income and net realized capital gains for tax purposes, they are reported as return of capital.
(m) RETURN OF CAPITAL ESTIMATES
Distributions received from the MLP Fund’s investments in MLPs generally are comprised of income, capital gains and return of capital. The MLP Fund records investment income and return of capital based on estimates made at the time such distributions are received. Such estimates are based on historical information available from each MLP and other industry sources. These estimates may subsequently be revised based on information received from MLPs after their tax reporting periods are concluded.
For the year ended December 31, 2013, the MLP Fund estimated that approximately 97% of the MLP distributions received would be treated as a return of capital. The MLP Fund recorded as return of capital the amount of $5,865,973 of dividends and distributions received from its investments. Net realized gain was increased by $2,209,880 and change in net unrealized appreciation/depreciation was increased by $3,656,093 in the accompanying Statements of Operations, attributable to the recording of such distributions as a reduction in the cost basis of investments.
(n) FEDERAL AND OTHER TAXES
The Funds intend to continue to comply with the requirements of the Code applicable to regulated investment companies and to distribute all of their taxable income to shareholders. Also, in order to avoid the payment of any federal excise taxes, the Funds will distribute substantially all of their net investment income and net realized gains on a calendar year basis.
For the current open tax year and for all major jurisdictions, management of the Funds has evaluated the tax positions taken or expected to be taken in the course of preparing their tax returns to determine whether the tax
67
SALIENT MF TRUST
Notes to Financial Statements, continued
December 31, 2013
positions will “more-likely-than-not” be sustained by the Funds upon challenge by the applicable tax authority. Tax positions not deemed to meet the more-likely-than-not threshold and that would result in a tax benefit or expense to the Funds would be recorded as a tax benefit or expense in the current period. For the year ended December 31, 2013, the Funds did not recognize any amounts for unrecognized tax benefit/expense. A reconciliation of unrecognized tax benefit/expense is not provided herein, as the beginning and ending amounts of unrecognized tax benefit/expense are zero, with no interim additions, reductions or settlements.
The MLP Subsidiary, as a corporation, is obligated to pay federal and state income tax on its taxable income. The MLP Subsidiary invests its assets primarily in MLPs, which generally are treated as partnerships for federal income tax purposes. As a limited partner in the MLPs, the MLP Subsidiary includes its allocable share of the MLP’s taxable income in computing its own taxable income. Deferred income taxes reflect (i) taxes on unrealized gains (losses), which are attributable to the temporary difference between fair market value and tax basis, (ii) the net tax effects of temporary differences between the carrying amounts of assets and liabilities for financial reporting purposes and the amounts used for income tax purposes and (iii) the net tax benefit of accumulated net operating and capital losses. To the extent the MLP Subsidiary has a deferred tax asset, consideration is given as to whether or not a valuation allowance is required. The need to establish a valuation allowance for deferred tax assets is assessed periodically by the MLP Subsidiary. A valuation allowance will be established if it is more-likely-than-not that some portion or the entire deferred tax asset will not be realized. In the assessment of a valuation allowance, consideration is given to all positive and negative evidence related to the realization of the deferred tax asset. This assessment considers, among other matters, the nature, frequency and severity of current and cumulative losses, forecasts of future profitability (which are highly dependent on future cash distributions from the MLP Subsidiary’s MLP holdings), the duration of statutory carry forward periods and the associated risk that operating and capital loss carry forwards may expire unused.
For the current open tax year and for all major jurisdictions, management of the MLP Subsidiary has concluded that there are no significant uncertain tax positions that would require recognition in the financial statements. Furthermore, management of the MLP Subsidiary is also not aware of any tax positions for which it is reasonably possible that the total amounts of unrecognized tax benefits will significantly change in the next twelve months.
The MLP Subsidiary may rely to some extent on information provided by the MLPs, which may not necessarily be timely, to estimate taxable income allocable to the MLP units held in the portfolio and to estimate the associated deferred tax liability. Such estimates are made in good faith. From time to time, as new information becomes available, the MLP Subsidiary may modify its estimates or assumptions regarding the deferred tax liability. The MLP Subsidiary’s policy is to classify interest and penalties associated with underpayment of federal and state income taxes, if any, as income tax expense in its Statement of Operations. The current and prior tax years remain open and subject to examination by tax jurisdictions.
The Risk Parity Subsidiary, the Alternative Beta Subsidiary and the Trend Subsidiary (individually a “Subsidiary”, collectively the “Subsidiaries”) are exempted Cayman investment companies for tax purposes. The Subsidiaries have made applications to the Governor-in-Council of the Cayman Islands for, and have received, an undertaking exempting each Subsidiary from all local income, profits and capital gains taxes for a period of 20 years. Currently, no such taxes are levied in the Cayman Islands.
The Risk Parity Subsidiary, the Alternative Beta Subsidiary and the Trend Subsidiary are Controlled Foreign Corporations (“CFCs”) for U.S. income tax purposes, and are therefore not subject to U.S. income tax. However, as wholly-owned CFCs, the Risk Parity Subsidiary’s, the Alternative Beta Subsidiary’s and the Trend
68
SALIENT MF TRUST
Notes to Financial Statements, continued
December 31, 2013
Subsidiary’s net income and capital gains to the extent of their earnings and profits, are consolidated into the Risk Parity Fund’s, the Alternative Beta Fund’s and the Trend Fund’s investment companies taxable income, respectively.
For the current open tax year and for all major jurisdictions, management of the Risk Parity Subsidiary, the Alternative Beta Subsidiary and the Trend Subsidiary have concluded that there are no significant uncertain tax positions that would require recognition in the financial statements. Management is also not aware of any tax positions for which it is reasonably possible that the total amounts of uncertain unrecognized tax benefits will significantly change in the next twelve months.
(o) CFTC REGULATION
On August 13, 2013, the CFTC adopted rules to harmonize conflicting Securities and Exchange Commission (the “SEC”) and CFTC disclosure, reporting and recordkeeping requirements for registered investment companies that do not meet an exemption from the definition of commodity pool. The harmonization rules provide that the CFTC will accept the SEC’s disclosure, reporting, and recordkeeping regime as substituted compliance for substantially all of the otherwise applicable CFTC regulations as long as such investment companies meet the applicable SEC requirements.
With respect to the MLP Fund and the Global Equity Fund, SCA and Salient Adviser, respectively, have claimed an exemption from the definition of the term “commodity pool operator” under CFTC Regulation 4.5 of the Commodity Exchange Act (“CEA”). As such, the MLP Fund and the Global Equity Fund are not currently subject to registration or regulation as commodity pools under the CEA.
With respect to the Risk Parity Fund, the Alternative Beta Fund and the Trend Fund, Salient Adviser has not renewed a filing under CFTC Regulation 4.5 of the CEA. Salient Adviser meets the definition of a commodity pool operator with respect to these Funds, and each will be subject to regulation by the CFTC as commodity pools upon finalization of CFTC regulation applicable to registered investment companies that do not meet an exemption from the definition of commodity pool.
(p) PROPOSED TAX REGULATIONS
On August 2, 2013, the Internal Revenue Service (“IRS”) issued proposed regulations which, if adopted in their current form, would require the MLP Fund to aggregate investment holdings of the MLP Subsidiary with its direct investment holdings for purposes of determining whether more than 25% of its total assets are invested in the securities of qualified publicly traded partnerships, which includes MLPs. The proposed regulations would not impact MLP Fund investments in affiliates of MLPs or other Energy Infrastructure Companies structured as domestic corporations. If the proposed regulations are adopted and finalized in their current form, the MLP Fund would reduce its overall investment in MLPs, whether held in the MLP Fund directly or held by the MLP Subsidiary, to no more than 25% of the MLP Fund’s total assets. The MLP Fund would otherwise continue to pursue its current investment objective and strategies.
The IRS proposed regulations have no immediate impact on the current operations of the MLP Fund, and will not affect the ability of the MLP Fund to qualify as a RIC for tax purposes in the current year. The IRS had requested comments on the proposed regulations, with the comment period ending October 31, 2013. The IRS received a number of comments on the proposal from issuers and trade associations. IRS action on the proposal remains uncertain.
69
SALIENT MF TRUST
Notes to Financial Statements, continued
December 31, 2013
In August 2013, SCA rebalanced the MLP Fund investment holdings, such that the aggregate holdings of MLPs, held directly in the MLP Fund and in the MLP Subsidiary was below 25% of its total assets. As a result, the MLP Fund will continue to qualify as a RIC for tax purposes even if the IRS regulations are passed.
(3) FAIR VALUE MEASUREMENTS
The Funds define fair value as the price that would be received to sell an asset or paid to transfer a liability in an orderly transaction between market participants at the measurement date under current market conditions.
The valuation techniques employed by the Funds, as described below, maximize the use of observable inputs and minimize the use of unobservable inputs in determining fair value. The inputs used to determine the fair value of the Funds’ investments are summarized in the three broad levels listed below:
| | • | | Level 1—unadjusted quoted prices in active markets for identical investments |
| | • | | Level 2—investments with other significant observable inputs (including quoted prices for similar securities, interest rates, prepayments speeds, credit risk, etc.) |
| | • | | Level 3—investments with significant unobservable inputs (including the Funds’ own assumptions in determining the fair value of investments) |
Changes in valuation techniques may result in transfers in or out of an assigned level within the disclosure hierarchy. The Funds disclose transfers between levels based on valuations at the end of the reporting period. The inputs or methodology used for valuing investments are not necessarily an indication of the risk associated with investing in those investments.
For the year ended December 31, 2013, there were no Level 3 investments for which significant unobservable inputs were used to determine fair value.
The following is a summary categorization as of December 31, 2013, of the Funds’ investments based upon the inputs utilized in determining the value of such investments. The breakdown by category of equity securities is disclosed in the Schedules of Investments.
| | | | | | | | | | | | | | | | | | | | | | | | |
| | | Level 1 | | | Level 2 | | | Total | |
Fund Name | | Investment
Securities | | | Other
Financial
Instruments^ | | | Investment
Securities | | | Other
Financial
Instruments^ | | | Investment
Securities | | | Other
Financial
Instruments^ | |
Risk Parity Fund | | | | | | | | | | | | | | | | | | | | | | | | |
Futures Contracts | | $ | — | | | $ | 877,550 | | | $ | — | | | $ | — | | | $ | — | | | $ | 877,550 | |
| | | | | | | | | | | | | | | | | | | | | | | | |
Total | | $ | — | | | $ | 877,550 | | | $ | — | | | $ | — | | | $ | — | | | $ | 877,550 | |
| | | | | | | | | | | | | | | | | | | | | | | | |
MLP Fund | | | | | | | | | | | | | | | | | | | | | | | | |
Common Stocks | | $ | 5,060,770 | | | $ | — | | | $ | — | | | $ | — | | | $ | 5,060,770 | | | $ | — | |
Master Limited Partnerships and Related Companies | | | | | | | | | | | | | | | | | | | | | | | | |
Natural Gas Gathering/Processing | | | 148,822,647 | | | | — | | | | 10,999,430 | | | | — | | | | 159,822,077 | | | | — | |
Other Master Limited Partnerships and Related Companies(a) | | | 336,793,070 | | | | — | | | | — | | | | — | | | | 336,793,070 | | | | — | |
Warrant | | | 3,607,014 | | | | — | | | | — | | | | — | | | | 3,607,014 | | | | — | |
| | | | | | | | | | | | | | | | | | | | | | | | |
Total | | $ | 494,283,501 | | | $ | — | | | $ | 10,999,430 | | | $ | — | | | $ | 505,282,931 | | | $ | — | |
| | | | | | | | | | | | | | | | | | | | | | | | |
70
SALIENT MF TRUST
Notes to Financial Statements, continued
December 31, 2013
| | | | | | | | | | | | | | | | | | | | | | | | |
| | | Level 1 | | | Level 2 | | | Total | |
Fund Name | | Investment
Securities | | | Other
Financial
Instruments^ | | | Investment
Securities | | | Other
Financial
Instruments^ | | | Investment
Securities | | | Other
Financial
Instruments^ | |
Alternative Beta Fund | | | | | | | | | | | | | | | | | | | | | | | | |
Futures Contracts | | $ | — | | | $ | (493,347 | ) | | $ | — | | | $ | — | | | $ | — | | | $ | (493,347 | ) |
Total Return Swap Agreements | | | — | | | | — | | | | — | | | | 55,304 | | | | — | | | | 55,304 | |
Forward Foreign Currency Exchange Contracts | | | — | | | | — | | | | — | | | | 781,893 | | | | — | | | | 781,893 | |
| | | | | | | | | | | | | | | | | | | | | | | | |
Total | | $ | — | | | $ | (493,347 | ) | | $ | — | | | $ | 837,197 | | | $ | — | | | $ | 343,850 | |
| | | | | | | | | | | | | | | | | | | | | | | | |
Trend Fund | | | | | | | | | | | | | | | | | | | | | | | | |
Futures Contracts | | $ | — | | | $ | 911,824 | | | $ | — | | | $ | — | | | $ | — | | | $ | 911,824 | |
| | | | | | | | | | | | | | | | | | | | | | | | |
Total | | $ | — | | | $ | 911,824 | | | $ | — | | | $ | — | | | $ | — | | | $ | 911,824 | |
| | | | | | | | | | | | | | | | | | | | | | | | |
Global Equity Fund | | | | | | | | | | | | | | | | | | | | | | | | |
Common Stocks | | $ | 58,583,578 | | | $ | — | | | $ | — | | | $ | — | | | $ | 58,583,578 | | | $ | — | |
Exchange Traded Funds | | | 3,069,655 | | | | — | | | | | | | | — | | | | 3,069,655 | | | | — | |
Futures Contracts | | | — | | | | 1,970 | | | | — | | | | — | | | | — | | | | 1,970 | |
| | | | | | | | | | | | | | | | | | | | | | | | |
Total | | $ | 61,653,233 | | | $ | 1,970 | | | $ | — | | | $ | — | | | $ | 61,653,233 | | | $ | 1,970 | |
| | | | | | | | | | | | | | | | | | | | | | | | |
| (a) | For detailed investment categorizations, see the accompanying Schedules of Investments. |
| ^ | Other financial instruments include any derivative instruments not reflected in the Schedules of Investments as Investment Securities, such as forward foreign currency exchange contracts, futures contracts and swap agreements. These investments are generally presented as other assets and liabilities in the Schedules of Investments at the unrealized gain or loss on the investment. |
(4) FEDERAL INCOME TAXES
The tax character of dividends paid to shareholders during the applicable tax year ended 2013 was as follows:
| | | | | | | | | | | | | | | | | | | | |
| | | Ordinary
Income | | | Net Long Term
Capital Gains | | | Total Taxable
Distributions | | | Return
of Capital | | | Total
Distributions
Paid | |
December 31, 2013 | | | | | | | | | | | | | | | | | | | | |
Risk Parity Fund | | $ | 5,416,934 | | | $ | 1,059,751 | | | $ | 6,476,685 | | | $ | — | | | $ | 6,476,685 | |
Alternative Beta Fund | | | — | | | | — | | | | — | | | | — | | | | — | |
Trend Fund | | | 5,546,043 | | | | 1,870,338 | | | | 7,416,381 | | | | — | | | | 7,416,381 | |
Global Equity Fund | | | 1,649,589 | | | | — | | | | 1,649,589 | | | | — | | | | 1,649,589 | |
November 30, 2013 | | | | | | | | | | | | | | | | | | | | |
MLP Fund | | | 3,290,731 | | | | — | | | | 3,290,731 | | | | 6,648,879 | | | | 9,939,610 | |
The tax character of dividends paid to shareholders during the applicable tax year ended 2012 was as follows:
| | | | | | | | | | | | | | | | | | | | |
| | | Ordinary
Income | | | Net Long Term
Capital Gains | | | Total Taxable
Distributions | | | Return
of Capital | | | Total
Distributions
Paid | |
December 31, 2012 | | | | | | | | | | | | | | | | | | | | |
Risk Parity Fund | | $ | 98,410 | | | $ | 243,558 | | | $ | 341,968 | | | $ | — | | | $ | 341,968 | |
November 30, 2012 | | | | | | | | | | | | | | | | | | | | |
MLP Fund | | | 15,004 | | | | — | | | | 15,004 | | | | — | | | | 15,004 | |
71
SALIENT MF TRUST
Notes to Financial Statements, continued
December 31, 2013
As of the latest tax year ended, as noted below, the components of accumulated earnings (deficit) on a tax basis were as follows:
| | | | | | | | | | | | | | | | | | | | |
| | | Undistributed
Ordinary
Income | | | Undistributed
Long Term
Capital Gains | | | Accumulated
Capital and
Other Losses | | | Unrealized
Appreciation
(Depreciation) | | | Accumulated
Earnings
(Deficit) | |
December 31, 2013 | | | | | | | | | | | | | | | | | | | | |
Risk Parity Fund | | $ | 1,631,137 | | | $ | — | | | $ | (742,617 | ) | | $ | (12,166,173 | ) | | $ | (11,277,653 | ) |
Alternative Beta Fund | | | — | | | | 1,536,897 | | | | — | | | | (591,952 | ) | | | 944,945 | |
Trend Fund | | | 1,548,798 | | | | 1,248,320 | | | | — | | | | (1,227,965 | ) | | | 1,569,153 | |
Global Equity Fund | | | 700,277 | | | | — | | | | — | | | | 7,610,124 | | | | 8,310,401 | |
November 30, 2013 | | | | | | | | | | | | | | | | | | | | |
MLP Fund | | | — | | | | — | | | | — | | | | 35,904,405 | | | | 35,904,405 | |
The differences between book-basis and tax-basis unrealized appreciation/depreciation are due to deferral of losses on wash sales and other timing differences.
The following information is provided on a tax basis as of December 31, 2013:
| | | | | | | | | | | | | | | | | | | | |
| | | Tax Cost | | | Tax
Unrealized
Appreciation | | | Tax Unrealized
Depreciation | | | Net
Unrealized
Appreciation
(Depreciation)
Before Taxes | | | Net
Unrealized
Appreciation
(Depreciation)
After Taxes | |
MLP Fund | | $ | 442,345,283 | | | $ | 78,628,241 | | | $ | (15,690,593 | ) | | $ | 62,937,648 | | | $ | 61,342,455 | |
Global Equity Fund | | | 54,042,550 | | | | 8,384,661 | | | | (773,978 | ) | | | 7,610,683 | | | | 7,610,683 | |
Under current tax law, capital losses and specified ordinary losses realized after October 31st and non-specified ordinary losses incurred after December 31st (ordinary losses collectively known as “qualified late year ordinary loss”) may be deferred and treated as occurring on the first business day of the following fiscal year. The Risk Parity Fund had deferred losses, which will be treated as arising on the first day of the following tax year end:
| | | | | | | | | | | | |
| | | Post-October
Capital Loss Deferred | | | Qualified Late Year
Ordinary Loss Deferred | | | Total | |
December 31, 2014 | | | | | | | | | | | | |
Risk Parity Fund | | $ | 742,617 | | | $ | — | | | $ | 742,617 | |
As of the end of the applicable tax year ended in 2013, the Funds had no net capital loss carry forwards (“CLCFs”).
For the MLP Fund, deferred income taxes of the MLP Subsidiary reflect the net tax effect of temporary differences between the carrying amount of assets and liabilities for financial reporting and tax purposes. Components of the MLP Subsidiary’s deferred tax assets and liabilities as of December 31, 2013, are as follows:
| | | | |
Deferred tax assets: | | | | |
Net operating loss carryforward | | $ | — | |
Capital loss carryforward | | | — | |
| | | | |
Total deferred tax assets | | | — | |
Less Deferred tax liabilities: | | | | |
Unrealized gain on investment securities | | | 1,595,193 | |
| | | | |
Total net deferred tax liability | | $ | 1,595,193 | |
| | | | |
72
SALIENT MF TRUST
Notes to Financial Statements, continued
December 31, 2013
With respect to the MLP Subsidiary, NOLs are available to be carried back up to two years to offset past taxable income or carried forward up to 20 years to offset future taxable income. CLCFs are available to be carried back up to three years to offset past capital gains or carried forward up to five years to offset future capital gains. As of December 31, 2013, the MLP Fund has no CLCF’s and no net operating loss carry forwards (“NOL’s”) attributable to the MLP Subsidiary.
Although the MLP Subsidiary currently has a net deferred tax liability, it periodically reviews the recoverability of its deferred tax assets based on the weight of available evidence. When assessing the recoverability of its deferred tax assets, significant weight is given to the effects of net unrealized appreciation/ depreciation as of December 31, 2013, and the period over which these deferred tax assets can be realized. Based on the MLP Subsidiary’s assessment, it has determined that it is more-likely-than-not that its deferred tax asset will be realized through future taxable income of the appropriate character. Accordingly, no valuation allowance has been established for the MLP Subsidiary’s deferred tax asset. The MLP Subsidiary will continue to assess the need for a valuation allowance in the future.
Total income tax expense (current and deferred) differs from the amount computed by applying the federal statutory income tax rate of 34% to the MLP Subsidiary’s net investment income and realized and unrealized gains (losses) on investments before taxes for the fiscal year ended December 31, 2013, as follows:
| | | | | | | | | | | | |
| | | Current | | | Deferred | | | Total | |
Application of statutory income tax rate | | $ | 513,841 | | | $ | 1,494,867 | | | $ | 2,008,708 | |
State income taxes, net of federal tax benefit | | | 30,226 | | | | 87,933 | | | | 118,159 | |
| | | | | | | | | | | | |
Total income tax expense | | $ | 544,067 | | | $ | 1,582,800 | | | $ | 2,126,867 | |
| | | | | | | | | | | | |
(5) INVESTMENT TRANSACTIONS
The aggregate cost of security purchases and proceeds from sales of securities (excluding short-term investments) during the periods ended December 31, 2013, were as follows:
| | | | | | | | |
| | | Purchases | | | Sales | |
Risk Parity Fund | | $ | — | | | $ | — | |
MLP Fund | | | 563,317,054 | | | | 148,784,735 | |
Alternative Beta Fund | | | — | | | | — | |
Trend Fund | | | — | | | | — | |
Global Equity Fund | | | 99,152,397 | | | | 46,809,394 | |
(6) ADMINISTRATION AGREEMENT
In consideration for administrative, accounting, and recordkeeping services, the Funds pay the Administrator a monthly administration fee computed at an annual rate of 0.06% on the first $700 million in aggregate net assets of the Funds, plus 0.055% on the next $300 million in aggregate net assets of the Funds, plus 0.05% on the aggregate net assets of the Funds greater than $1 billion. The minimum annual fee is $65,000 for the first two funds in the Trust, $90,000 for the next two funds in the Trust and $80,000 for the next three funds in the Trust. Each Subsidiary fund is charged a $55,000 per annum fee. Under terms of the agreement, the administration fee is waived for the first four months of each series’ operations. Subsequent to the four month waiver, the administration fee is allocated to the Funds based on month-end net assets. The Administrator also provides the Funds with legal, compliance, custody and other investor-related services. The Funds pay the custodian monthly based on an annual fee of 0.004% on average daily market value, plus transaction costs.
73
SALIENT MF TRUST
Notes to Financial Statements, continued
December 31, 2013
(7) DISTRIBUTION AGREEMENT
Foreside Distribution Services, L.P. (“Foreside”), a wholly-owned subsidiary of Foreside Financial Group LLC, serves the Trust as distributor (the “Distributor’’). The Trust has adopted a Distribution Plan and Agreement (the “Distribution Plan’’) pursuant to Rule 12b-1 under the 1940 Act.
Each Fund may pay financial intermediaries such as broker-dealers, investment advisors (“Authorized Firms”) and the Distributor up to 0.25% and 1.00%, on an annualized basis, of the average daily net assets attributable to Class A and Class C shares, respectively, as compensation for service and distribution-related activities and/or shareholder services with respect to Class A and Class C shares, respectively.
The Funds pay fees to certain intermediaries or financial institutions for record keeping, sub-accounting services, transfer agency and other administrative services as reflected in the Statements of Operations as “Administrative services fees.”
(8) RELATED PARTY TRANSACTIONS
In consideration of the advisory and other services provided by each investment adviser, under the terms of the Investment Management Agreement between Salient Adviser and the Risk Parity Fund, the Alternative Beta Fund, the Trend Fund, the Global Equity Fund and between SCA and the MLP Fund, each Fund, (except the Global Equity Fund), pays its respective adviser a monthly management fee equal to an annual rate of 0.95% of the Fund’s average daily consolidated net assets. The Global Equity Fund pays its respective adviser a monthly management fee equal to an annual rate of 1.25% of the Fund’s average daily net assets.
Each Fund’s investment adviser (except the Global Equity Fund’s), has contractually agreed to waive all or a portion of its management fee and reimburse or pay operating expenses of each Fund to the extent necessary to maintain each Fund’s total operating expenses at 1.55% for Class A, 2.30% for Class C, and 1.30% for Class I shares, excluding certain expenses, such as taxes, brokerage commissions, interest, short dividend expense, acquired fund (MLP Subsidiary, Risk Parity Subsidiary, Alternative Beta Subsidiary or Trend Subsidiary) fees, litigation and extraordinary expenses. The Global Equity Fund’s investment adviser has contractually agreed to waive all or a portion of its management fee and reimburse or pay operating expenses of the Fund to the extent necessary to maintain Fund’s total operating expenses at 1.85% for Class A, 2.60% for Class C, and 1.60% for Class I shares, excluding certain expenses, such as taxes, brokerage commissions, interest, short dividend expense, any acquired fund fees, litigation and extraordinary expenses. Each expense limitation agreement expires on July 31, 2014.
Each Fund’s investment adviser is permitted to recoup expenses that it has borne in later periods to the extent that the expenses for a Class of shares fall below the annual rate in effect at the time of the actual waiver/ reimbursement. The Funds are not obligated to reimburse such expenses beyond three years from the end of such year in which the adviser waived a fee or reimbursed an expense. The table below represents the investment adviser waived expense amounts subject to this potential recoupment arrangement by each fund for 2015 and 2016.
| | | | | | | | |
Fund | | 2016 | | | 2015 | |
Risk Parity Fund | | $ | 280,953 | | | $ | 139,574 | |
MLP Fund | | | 375,242 | | | | 260,226 | |
Alternative Beta Fund | | | 173,558 | | | | — | |
Trend Fund | | | 191,802 | | | | — | |
Global Equity Fund | | | 244,707 | | | | — | |
74
SALIENT MF TRUST
Notes to Financial Statements, continued
December 31, 2013
(9) FUND OWNERSHIP
As of December 31, 2013, there are entities (including omnibus accounts) that are record owners of more than 5% of the outstanding shares of the Funds. The table below presents the number of accounts owning greater than 5% of the outstanding shares of each Fund and the aggregate percentage owned of the outstanding shares of each Fund.
| | | | | | | | |
Fund | | Number of
Accounts | | | Aggregate
Ownership
Percentage | |
Risk Parity Fund | | | 2 | | | | 89.3 | % |
MLP Fund | | | 4 | | | | 77.8 | % |
Alternative Beta Fund | | | 4 | | | | 86.4 | % |
Trend Fund | | | 4 | | | | 79.7 | % |
Global Equity Fund | | | 2 | | | | 93.3 | % |
(10) RISK CONSIDERATIONS
The following summary of certain common principal risk footnotes is not meant to be comprehensive of each Fund’s risks.
(a) GENERAL MARKET RISK
An investment in the Funds’ common shares represents an indirect investment in the securities owned by the Funds, some of which will be traded on a national securities exchange or in the over-the-counter markets. The value of the securities in which the Funds invest, like other market investments, may move up or down, sometimes rapidly and unpredictably. The value of the securities in which the Funds invest may affect the value of the Funds’ common shares. An investment in the Funds’ common shares at any point in time may be worth less than the original investment, even after taking into account the reinvestment of the Funds’ distributions.
(b) CONCENTRATION RISK
The MLP Fund’s investment portfolio will be concentrated in MLPs and energy infrastructure companies in the group of industries that comprise the energy infrastructure sector. The focus of the portfolio on a specific industry or industries within the energy infrastructure sector may present more risks than if the portfolio was broadly diversified over numerous sectors of the economy. A downturn in one or more industries within the energy infrastructure sector would have a larger impact on the MLP Fund than on an investment company that does not concentrate solely in MLPs and energy infrastructure companies. To the extent that the MLP Fund invests a relatively high percentage of the MLP Fund’s assets in the obligations of a limited number of issuers, the MLP Fund may be more susceptible than a more widely diversified investment company to any single economic, political, or regulatory occurrence.
(c) CURRENCY RISK
Currency risk refers to the possibility that changes in currency exchange rates will negatively affect securities denominated in, and/or receiving revenues in, foreign currencies. The liquidity and trading value of foreign currencies could be affected by global economic factors, such as inflation, interest rate levels, and trade balances among countries, as well as the actions of sovereign governments. Adverse changes in currency exchange rates (relative to the U.S. dollar) may erode or reverse any potential gains from a Fund’s investments in
75
SALIENT MF TRUST
Notes to Financial Statements, continued
December 31, 2013
securities denominated in a foreign currency or may widen existing losses. A Fund’s net currency positions may expose it to risks independent of its securities positions.
(d) LEVERAGE RISK
Financial leverage represents the leveraging of the Funds’ investment portfolio. The use of leverage can amplify losses. Unless the income and capital appreciation, if any, on securities acquired with the proceeds from financial leverage exceed the costs of such financial leverage, the use of leverage could cause the Funds’ net asset value to decline. When financial leverage is used, the net asset value and market value of the Funds’ common shares will be more volatile. There is no assurance that the Funds’ use of financial leverage will be successful.
(e) DERIVATIVES RISK
The Funds may purchase and sell derivative instruments (including options, futures contracts and swap agreements). The use of derivatives has risks, including high price volatility, government intervention, non-performance by the counterparty, the imperfect correlation between the value of such instruments and the underlying assets, the possible default of the other party to the transaction and the illiquidity of the derivative investments. Furthermore, the ability to successfully use these techniques depends on the Adviser’s ability to predict pertinent market movements, which cannot be assured. The use of derivatives may result in losses greater than if they had not been used, may require the Funds to sell or purchase portfolio securities at inopportune times or for prices other than current market values, may limit the amount of appreciation the Funds can realize on an investment or may cause the Funds to hold a security that the Funds might otherwise sell. In addition, amounts paid by the Funds as premiums and cash or other assets held in margin accounts with respect to derivative transactions are not otherwise available to the Funds for investment purposes.
(11) SUBSEQUENT EVENTS
The Funds have evaluated the need for disclosures and/or adjustments resulting from subsequent events through the date the financial statements were issued. Based on this evaluation, no adjustments were required to the financial statements as of December 31, 2013.
76
Report of Independent Registered Public Accounting Firm
To the Board of Trustees and Shareholders of
Salient MF Trust:
We have audited the accompanying consolidated statements of assets and liabilities, including the consolidated schedules of investments, of Salient Risk Parity Fund and Subsidiary, Salient MLP & Energy Infrastructure Fund II and Subsidiary, Salient Alternative Beta Fund and Subsidiary, Salient Trend Fund and Subsidiary, and Salient Global Equity Fund (collectively, the “Funds”) as of December 31, 2013, and the related consolidated statements of operations for each of the periods then ended and the consolidated statements of changes in net assets and consolidated financial highlights for each of the periods in the two year period then ended. These consolidated financial statements and consolidated financial highlights are the responsibility of the Funds’ management. Our responsibility is to express an opinion on these consolidated financial statements and consolidated financial highlights based on our audits.
We conducted our audits in accordance with the standards of the Public Company Accounting Oversight Board (United States). Those standards require that we plan and perform the audits to obtain reasonable assurance about whether the consolidated financial statements and consolidated financial highlights are free of material misstatement. An audit includes examining, on a test basis, evidence supporting the amounts and disclosures in the financial statements and financial highlights. Our procedures included confirmation of securities owned as of December 31, 2013, by correspondence with the custodian and brokers or by other appropriate auditing procedures. An audit also includes assessing the accounting principles used and significant estimates made by management, as well as evaluating the overall financial statement presentation. We believe that our audits provide a reasonable basis for our opinion.
In our opinion, the consolidated financial statements and consolidated financial highlights referred to above present fairly, in all material respects, the financial position of the Funds as of December 31, 2013, the results of their operations for each of the periods then ended, and the changes in their net assets and financial highlights for each of the periods in the two year period then ended, in conformity with U.S. generally accepted accounting principles.
/s/ KPMG LLP
Columbus, Ohio
February 27, 2014
77
SALIENT MF TRUST
Additional Tax Information
December 31, 2013
(Unaudited)
For corporate shareholders, the following percentage of the total ordinary income dividends paid during the fiscal year ended December 31, 2013, qualify for the corporate dividends received deduction for the following Funds:
| | | | |
| | | Dividends
Received
Deduction | |
Global Equity Fund | | | 13.91 | % |
For the year ended December 31, 2013, dividends paid by the Funds may be subject to a maximum tax rate of 15%, as provided for by the Jobs and Growth Tax Relief Reconciliation Act of 2003. The Funds intend to designate the maximum amount allowable as taxed at a maximum rate of 15%. Complete information will be reported in conjunction with your 2013 Form 1099-DIV:
| | | | |
| | | Qualified
Dividend
Income | |
Global Equity Fund | | | 39.51 | % |
For the fiscal year ended December 31, 2013, the amounts of long-term capital gain designated by the Funds were as follows:
| | | | |
| | | Long-Term
Capital Gain | |
Risk Parity Fund | | $ | 1,059,751 | |
Trend Fund | | | 1,870,338 | |
For the fiscal year ended December 31, 2013, the amounts of short-term capital gain designated by the Funds were as follows:
| | | | |
| | | Short-Term
Capital Gain | |
Risk Parity Fund | | $ | 5,416,934 | |
MLP Fund | | | 2,857,021 | |
Trend Fund | | | 3,980,215 | |
Global Equity Fund | | | 1,280,855 | |
78
SALIENT MF TRUST
Supplemental Information
December 31, 2013
(Unaudited)
Trustees and Officers
The Fund’s operations are managed under the direction and oversight of the Board. Each Trustee serves for an indefinite term or until he or she reaches mandatory retirement as established by the Board. The Board appoints the officers of the Funds who are responsible for the Funds’ day-to-day business decisions based on policies set by the Board. The officers serve at the pleasure of the Board.
Compensation for Trustees
The Funds pay each Trustee who is not an “interested person” of Salient Adviser, as defined in the 1940 Act (the “Independent Trustees”) an annual retainer of $15,000. Such compensation shall encompass attendance and participation at all Board meetings, and any Committee meetings thereof, including telephonic meetings.
Interested Trustees
| | | | | | | | |
| Name, Address and Age | | Position(s) Held | | Principal Occupation(s)
During the Past 5 Years | | Number of
Portfolios in
Fund Complex
Overseen by
Trustee | | Other Directorships
Held by Trustee |
John A. Blaisdell(1) Age: 53 Address: c/o Salient MF Trust 4265 San Felipe 8th Floor Houston, TX 77027 | | Trustee, Principal Member, Investment Executive Officer (Since inception); Chairman of the Board (Since 2012) | | Member, Investment Committee of the Adviser, since 2002; Managing Director of Salient, since 2002. | | 10 | | The Endowment Funds (investment companies) (five funds) since 2004; Salient Midstream & MLP Fund (investment company) since 2012; Salient MLP & Energy Infrastructure Fund (investment company) since 2011; Salient Alternative Strategies Funds (investment companies) (two funds) since 2010. |
Jeremy L. Radcliffe(1) Age: 39 Address: c/o Salient MF Trust 4265 San Felipe 8th Floor Houston, TX 77027 | | Trustee, Secretary (Since inception) | | Member, Investment Committee of the Adviser, since 2002; Salient, since 2002. | | 8 | | Salient Alternative Strategies Funds (investment companies) (two funds) since 2010. |
| (1) | This person’s status as an “interested” trustee arises from his affiliation with Salient Adviser. |
79
SALIENT MF TRUST
Supplemental Information, continued
December 31, 2013
(Unaudited)
Independent Trustees
| | | | | | | | |
| Name, Address and Age | | Position(s)
Held | | Principal Occupation(s)
During the Past 5 Years | | Number of
Portfolios in
Fund Complex
Overseen by
Trustee | | Other Directorships
Held by Trustee |
Karin B. Bonding, CFA Age: 74 Address: c/o Salient MF Trust 4265 San Felipe 8th Floor Houston, TX 77027 | | Trustee (Since inception) | | Lecturer, University of Virginia, since 1996; President of Capital Markets Institute, Inc. (fee-only financial planner and investment advisor) since 1996. | | 10 | | The Endowment Funds (investment companies) (five funds) since 2010; Salient Midstream & MLP Fund (investment company) since 2012; Salient MLP & Energy Infrastructure Fund (investment company) since 2011; Salient Alternative Strategies Funds (investment companies) (two funds), since 2010; Brandes Investment Trust (investment companies) (four funds), since 2006; Credit Suisse Alternative Capital Funds (investment companies) (six funds), 2005-2010. |
Jonathan P. Carroll Age: 52 Address: c/o Salient MF Trust 4265 San Felipe 8th Floor Houston, TX 77027 | | Trustee (Since inception) | | President, Lazarus Financial LLC (holding company) since 2006; private investor for the past five years. | | 10 | | The Endowment Funds (investment companies) (five funds) since 2004; Salient Midstream & MLP Fund (investment company) since 2012; Salient MLP & Energy Infrastructure Fund (investment company) since 2011; the Salient Alternative Strategies Funds (investment companies) (two funds), since 2010; Lazarus Financial LLC, Lazarus Energy Holdings LLC and affiliates, since 2006. |
80
SALIENT MF TRUST
Supplemental Information, continued
December 31, 2013
(Unaudited)
| | | | | | | | |
| Name, Address and Age | | Position(s)
Held | | Principal Occupation(s)
During the Past 5 Years | | Number of
Portfolios in
Fund Complex
Overseen by
Trustee | | Other Directorships
Held by Trustee |
Dr. Bernard Harris Age: 57 Address: c/o Salient MF Trust 4265 San Felipe 8th Floor Houston, TX 77027 | | Trustee (Since inception) | | Chief Executive Officer and Managing Partner, Vesalius Ventures, Inc (venture investing), since 2002; President, The Space Agency (marketing), since 1999; President, The Harris Foundation (non-profit), since 1998; clinical scientist, flight surgeon and astronaut for NASA, 1986 to 1996. | | 10 | | The Endowment Funds (investment companies) (five funds) since 2009; Salient Midstream & MLP Fund (investment company) since 2012; Salient MLP & Energy Infrastructure Fund (investment company) since 2011; Salient Alternative Strategies Funds (investment companies) (two funds) since 2010; Monebo Technologies Inc., since 2009; The National Math and Science Initiative, and Space Agency, since 2008; Communities in Schools, since 2007; American Telemedicine Association, since 2007; U.S. Physical Therapy, Inc., since 2005; Houston Technology Center, since 2004; Houston Angel Network, since 2004; The Harris Foundation, Inc., since 1998. |
Richard C. Johnson Age: 76 Address: c/o Salient MF Trust 4265 San Felipe 8th Floor Houston, TX 77027 | | Trustee (Since inception) | | Senior Counsel (retired), Baker Botts LLP (law firm); Managing Partner, Baker Botts, 1998 to 2002; practiced law at Baker Botts, 1966 to 2002 (1972 to 2002 as a partner). | | 10 | | The Endowment Funds (investment companies) (five funds) since 2004; Salient Midstream & MLP Fund (investment company) since 2012; Salient MLP & Energy Infrastructure Fund (investment company) since 2011; Salient Alternative Strategies Funds (investment companies) (two funds), since 2010. |
81
SALIENT MF TRUST
Supplemental Information, continued
December 31, 2013
(Unaudited)
| | | | | | | | |
| Name, Address and Age | | Position(s)
Held | | Principal Occupation(s)
During the Past 5 Years | | Number of
Portfolios in
Fund Complex
Overseen by
Trustee | | Other Directorships
Held by Trustee |
G. Edward Powell Age: 77 Address: c/o Salient MF Trust 4265 San Felipe 8th Floor Houston, TX 77027 | | Trustee, Lead Independent Trustee (Since inception) | | Principal, Mills & Stowell (private equity), since 2002; Principal, Innovation Growth Partners (consulting), since 2002; Consultant to emerging and middle market businesses, 1994 to 2002; Managing Partner, Price Waterhouse & Co. (Houston office), 1982 to 1994. | | 10 | | The Endowment Funds (investment companies) (five funds) since 2004; Salient Midstream & MLP Fund (investment company) since 2012; Salient MLP & Energy Infrastructure Fund (investment company) since 2011; Salient Alternative Strategies Funds (investment companies) (two funds) since 2010; Energy Services International, Inc., since 2004; Therapy Track, LLC, since 2009. |
Scott E. Schwinger Age: 48 Address: c/o Salient MF Trust 4265 San Felipe 8th Floor Houston, TX 77027 | | Trustee (Since inception) | | President, The McNair Group (management), since 2006; Senior Vice President and Chief Financial Officer, the Houston Texans (professional football team) (1999). | | 10 | | The Endowment Funds (investment companies) (five funds) since 2004; Salient Midstream & MLP Fund (investment company) since 2012; Salient MLP & Energy Infrastructure Fund (investment company) since 2011; the Salient Alternative Strategies Funds (investment companies) (two funds), since 2010; The Make-A-Wish Foundation, since 2008; YES Prep Public Schools, since 2001. |
82
SALIENT MF TRUST
Supplemental Information, continued
December 31, 2013
(Unaudited)
Officers of the Fund Who Are Not Trustees
| | | | |
| Name, Address and Age | | Position(s)
Held with the
Fund | | Principal Occupation(s) During the Past 5 Years |
Paul Bachtold Age: 40 | | Chief Compliance Officer (“CCO”) (Since inception) | | CCO, Salient Adviser, since 2010; Consultant, Chicago Investment Group (compliance consulting), 2009-2010; US Compliance Manager, Barclays Global Investors, 2005-2008; Consultant, Wells Fargo Bank, 2000-2005. |
John E. Price Age: 46 | | Treasurer; Principal Financial Officer (Since inception) | | Managing Director and Chief Financial Officer, Salient Adviser, since 2003; Partner, Managing Director and Chief Financial Officer of Salient since 2003. |
Form N-Q Filings
The Funds file complete Schedules of Investments with the Securities and Exchange Commission for the first and third quarters of each fiscal year on Form N-Q. The Funds’ Form N-Q is available on the Securities and Exchange Commission website at http://www.sec.gov. The Funds’ Form N-Q may be reviewed and copied at the Securities and Exchange Commission Public Reference Room in Washington, DC and information regarding operation of the Public Reference Room may be obtained by calling (800) SEC-0330.
Forward-Looking Statements
This report contains “forward-looking statements” within the meaning of the Securities Act of 1933 and the Securities Exchange Act of 1934. By their nature, all forward-looking statements involve risks and uncertainties, and actual results could differ materially from those contemplated by the forward-looking statements. Several factors that could materially affect the Funds’ actual results are the performance of the portfolio of investments held by each Fund, the conditions in the U.S. and international financial, petroleum and other markets, and other factors discussed in filings with the Securities and Exchange Commission.
Proxy Voting Policies
A description of the policies and procedures that the Funds use to determine how to vote proxies relating to portfolio securities is available (i) without charge, upon request by calling (800) 809-0525; and (ii) on the Securities and Exchange Commission website at http://www.sec.gov.
Information regarding how the Funds voted proxies relating to portfolio securities during the most recent 12-month period ended June 30 of any year will be made available on or around August 30 of that year (i) without charge, upon request by calling (800) 809-0525; and (ii) on the Securities and Exchange Commission website at http://www.sec.gov.
83
SALIENT MF TRUST
Supplemental Information, continued
December 31, 2013
(Unaudited)
Statement of Additional Information
The Statement of Additional Information (“SAI”) includes additional information about the Funds’ Trustees and is available upon request without charge by calling (800) 809-0525 or by visiting the Securities and Exchange Commission website at http://www.sec.gov.
84
SALIENT MF TRUST
Privacy Policy (Unaudited)
The Funds recognizes the importance of securing personal financial information. It is our policy to safeguard any personal and financial information that may be entrusted to us. The following is a description of the Funds’ policy regarding disclosure of nonpublic personal information.
We collect nonpublic personal information as follows:
We collect information about our investors, including, but not limited to, the investor’s name, address, telephone number, e-mail address, social security number and date of birth. We collect that information from subscription agreements, other forms of correspondence that we receive from investors, from personal conversations and from affiliated entities as permitted by law.
We receive information about investor transactions with us, including, but not limited to, account number, account balance, investment amounts, withdrawal amounts and other financial information.
We are permitted by law to disclose nonpublic information we collect, as described above, to the Funds’ service providers, including the Funds’ investment adviser, sub-advisers, servicing agent, independent administrator, custodian, legal counsel, accountant and auditor. We do not disclose any nonpublic information about our current or former investors to nonaffiliated third parties, except as required or permitted by law. We restrict access to investor nonpublic personal information to those persons who require such information to provide products or services to investors. We maintain physical, electronic and procedural safeguards that comply with federal standards to guard investors’ nonpublic personal information.
If an investor’s investment relationship with the Funds involves a financial intermediary, including, but not limited to, a broker-dealer, bank or trust company, the privacy policy of such investor’s financial intermediary would govern how any nonpublic personal information would be shared by them with nonaffiliated third parties.
85
Independent Trustees
Jonathan P. Carroll
Dr. Bernard Harris
Richard C. Johnson
G. Edward Powell
Scott E. Schwinger
Karin B. Bonding
Interested Trustees and Officers
John A. Blaisdell, Trustee and Principal Executive Officer
Jeremy L. Radcliffe, Trustee and Secretary
John E. Price, Treasurer and Principal Financial Officer
Paul A. Bachtold, Chief Compliance Officer
Investment Advisers
Salient Advisors, L.P.
Houston, TX
Salient Capital Advisors, LLC
Houston, TX
Fund Administrator and Transfer Agent
Citi Fund Services Ohio, Inc.
Columbus, OH
Custodian
Citibank, N.A.
New York, NY
Independent Registered Public Accounting Firm
KPMG LLP
Columbus, OH
Legal Counsel
K&L Gates LLP
Boston, MA
Distributor
Foreside Fund Services LLC
Portland, ME

4265 San Felipe, 8th Floor Houston, Texas 77027 800.994.0755
Item 2. Code of Ethics.
(a) The registrant has adopted a code of ethics that applies to the registrant’s principal executive officer, principal financial officer, principal accounting officer or controller, or persons performing similar functions. This code of ethics is included as Exhibit 12(a)(1).
(b) During the period covered by the report, with respect to the registrant’s code of ethics that applies to its principal executive officer, principal financial officer, principal accounting officer or controller, or persons performing similar functions; there have been no amendments to, nor any waivers granted from, a provision that relates to any element of the code of ethics definition enumerated in paragraph (b) of this Item 2.
Item 3. Audit Committee Financial Expert.
3(a)(1) The registrant’s board of directors has determined that the registrant has at least one audit committee financial expert serving on its audit committee.
3(a)(2) The audit committee financial expert is G. Edward Powell, who is “independent” for purposes of this Item 3 of Form N-CSR.
Item 4. Principal Accountant Fees and Services.
| | | | | | | | | | |
| | | Current Year | | | Previous Year | | | |
Audit Fees | | $ | 150,000 | | | $ | 75,000 | | | |
Audit-Related Fees | | $ | 4,500 | | | $ | 10,000 | | | |
Tax Fees | | $ | 0 | | | $ | 0 | | | |
All Other Fees | | $ | 0 | | | $ | 0 | | | |
(e)(1) Disclose the audit committee’s pre-approval policies and procedures described in paragraph (c)(7) of Rule 2-01 of Regulation S-X.
The audit committee may delegate its authority to pre-approve audit and permissible non-audit services to one or more members of the committee. Any decision of such members to pre-approve services shall be presented to the full audit committee at its next regularly scheduled meeting.
(2) Disclose the percentage of services described in each of paragraphs (b) through (d) of this item that were approved by the audit committee pursuant to paragraph (c) (7)(i)(c) of Rule 2-01 of Regulation S-X.
| | | | | | |
| | | Current Year | | Previous Year | | |
| | 0% | | 0% | | |
(f) Not applicable.
(g) Disclose the aggregate non-audit fees billed by the registrant’s accountant for services rendered to registrant, and rendered to the registrant’s investment adviser (not including any sub-adviser whose role is primarily portfolio management and is subcontracted with or overseen by another investment adviser), and any entity controlling, controlled by, or under common control with the adviser that provides ongoing services to the registrant for each of the last two fiscal years of the registrant.
| | | | | | |
| | | Current Year | | Previous Year | | |
| | 0% | | 0% | | |
(h) Not applicable.
Item 5. Audit Committee of Listed Registrants.
Not applicable.
Item 6. Investments.
(a) Schedules of Investments as of the close of the reporting period are included in the report to the shareholders filed under item 1 of this form.
(b) Not applicable.
Item 7. Disclosure of Proxy Voting Policies and Procedures for Closed-End Management Investment Companies.
Not applicable.
Item 8. Portfolio Managers of Closed-End Management Investment Companies.
Not applicable.
Item 9. Purchases of Equity Securities by Closed-End Management Investment Company and Affiliated Purchasers.
Not applicable.
Item 10. Submission of Matters to a Vote of Security Holders.
Not applicable.
Item 11. Controls and Procedures.
The registrant’s principal executive officer and principal financial officer have concluded, based on their evaluation of the registrant’s disclosure controls and procedures as conducted within 90 days of the filing date of this report, that these disclosure controls and procedures are adequately designed and are operating effectively to ensure that information required to be disclosed by the registrant on Form N-CSR is (i) accumulated and communicated to the investment company’s management, including its certifying officers, to allow timely decisions regarding required disclosure; and (ii) recorded, processed, summarized and reported within the time periods specified in the Securities and Exchange Commission’s rules and forms.
There were no changes in the registrant’s internal control over financial reporting (as defined in Rule 30a-3(d) under the Act (17 CFR 270.30a-3(d)) that occurred during the second fiscal quarter of the period covered by this report that have materially affected or are reasonably likely to materially affect the registrant’s internal control over financial reporting.
Item 12. Exhibits.
(a)(1) The code of ethics that is the subject of the disclosure required by Item 2 is attached hereto.
(a)(2) Certifications pursuant to Rule 30a-2(a) are attached hereto.
(a)(3) Not applicable.
(b) Certifications pursuant to Rule 30a-2(b) are furnished hereto.
SIGNATURES
Pursuant to the requirements of the Securities Exchange Act of 1934 and the Investment Company Act of 1940, the registrant has duly caused this report to be signed on its behalf by the undersigned, thereunto duly authorized.
| | | | | | | | | | |
| | | |
| (Registrant) | | Salient MF Trust | | | | |
| | | |
| By (Signature and Title) | | /s/ John A. Blaisdell | | | | |
| | | | | | John A. Blaisdell | | | | |
| | | | | | Principal Executive Officer | | | | |
| | | |
| Date: | | February 27, 2014 | | | | |
Pursuant to the requirements of the Securities Exchange Act of 1934 and the Investment Company Act of 1940, this report has been signed below by the following persons on behalf of the registrant and in the capacities and on the dates indicated.
| | | | | | | | | | |
| | | |
| By (Signature and Title) | | /s/ John A. Blaisdell | | | | |
| | | | | | John A. Blaisdell | | | | |
| | | | | | Principal Executive Officer | | | | |
| | | |
| Date: | | February 27, 2014 | | | | |
| | | |
| By (Signature and Title) | | /s/ John E. Price | | | | |
| | | | | | John E. Price | | | | |
| | | | | | Principal Financial Officer | | | | |
| | | |
| Date: | | February 27, 2014 | | | | |