UNITED STATES
SECURITIES AND EXCHANGE COMMISSION
Washington, D.C. 20549
FORMN-CSR
CERTIFIED SHAREHOLDER REPORT OF REGISTERED
MANAGEMENT INVESTMENT COMPANIES
Investment Company Act file number:811-22678
Salient MF Trust
(Exact name of registrant as specified in charter)
4265 San Felipe, 8th Floor
Houston, TX 77027
(Address of principal executive offices) (Zip code)
| | |
John A. Blaisdell, Principal Executive Officer Salient MF Trust 4265 San Felipe, 8th Floor Houston, TX 77027 (Name and address of agent for service) | | With a Copy To: George J. Zornada K&L Gates LLP State Street Financial Center One Lincoln St. |
| | Boston, MA 02111-2950 |
| | (617)261-3231 |
Registrant’s telephone number, including area code:(713)993-4001
Date of fiscal year end:December 31
Date of reporting period:December 31, 2018
FormN-CSR is to be used by management investment companies to file reports with the Commission, not later than 10 days after the transmission to stockholders of any report that is required to be transmitted to stockholders underRule 30e-1 under the Investment Company Act of 1940 (17CFR 270.30e-1). The Commission may use the information provided on FormN-CSR in its regulatory, disclosure review, inspection, and policymaking roles.
A registrant is required to disclose the information specified by FormN-CSR, and the Commission will make this information public. A registrant is not required to respond to the collection of information contained in FormN-CSR unless the Form displays a currently valid Office of Management and Budget (“OMB”) control number. Please direct comments concerning the accuracy of the information collection burden estimate and any suggestions for reducing the burden to the Secretary, Securities and Exchange Commission, 100 F Street, NE, Washington, DC 20549. The OMB has reviewed this collection of information under the clearance requirements of 44 U.S.C. § 3507.
| Item 1. | Reports to Stockholders. |
The following is a copy of the report transmitted to shareholders of the Salient MLP & Energy Infrastructure Fund and Salient Tactical Plus Fund (collectively, the “Funds”), each a series of the registrant, pursuant to Rule30e-1 under the Investment Company Act of 1940, as amended (the “Act”) (17 CFR270.30e-1).
Table of Contents
The series of funds under the Salient MF Trust (“Salient Funds”) are distributed by:
Foreside Fund Services, LLC
Portland, Maine
The report has been prepared for the general information of the Funds’ shareholders. It is not authorized for distribution to prospective investors unless accompanied or proceeded by a current Funds’ Prospectus, which contains more complete information about Funds’ investment policies, management fees and expenses, experience of the management teams and other information. Investors are reminded to read the Prospectus before investing or sending money.
Shareholder Update | December 31, 2018
| | |
| A MESSAGE FROM: | | John A. Blaisdell |
| | Chief Executive Officer |
Dear Shareholder:
We enter 2019 with gratitude for the trust that you, the shareholders of the Salient Funds, have placed in us. It is our aim to build strategies that enable you to grow your wealth, and it is our hope that you have found value in your partnership with us over the past year. Thank you.
2018 was a year in which volatility across most financial markets increased substantially and created a challenging environment for investors as returns varied significantly across asset classes. The increase in volatility has been calmly accepted by some investors on the basis that asset prices are more accurately reflecting the uncertainty and wide dispersion of outcomes that are possible in the world around us. Brexit, the shutdown of the United States government and other events represent uncertainty in our political systems. The great trend of globalization appears at risk as tariffs and the undoing of trade partnerships are used as negotiating tactics with trade partners. The unwinding of one of the largest central bank interventions in history creates numerous possibilities for inflation, economic growth and the level of interest rates in the U.S. and globally.
This list is far from comprehensive but simply highlights some of the risks and uncertainty that we observe in the world. It is not meant to imply a bearish view toward the markets or any asset class. Instead, it is a reminder that it is important to have perspective on risk and our mission as professional investors is to develop and hone our perspective with our experiences and work. Further, to ensure that perspective is applied consistently, it is vital to have a defined and disciplined investment process. In a world of so much uncertainty, one may wonder what matters most or where to focus. For us at Salient, we are eagerly focused on process and perspective so that we can deliver the best possible outcome to our investors.
We hope that 2019 proves a prosperous one for you, our shareholders. Thank you for your trust.
Sincerely,

John A. Blaisdell
Chief Executive Officer
Salient Partners
RISKS
There are risks involved with investing, including loss of principal. Past performance does not guarantee future results, share prices will fluctuate and you may have a gain or loss when you redeem shares.
Inflation is the rate at which the general level of prices for goods and services is rising, and, subsequently, purchasing power is falling.
Salient is the trade name for Salient Partners, L.P., which together with its subsidiaries provides asset management and advisory services. This information is being provided solely for educational purposes and is not an offer to sell or solicitation of an offer to buy an interest in any investment fund. Any such offer or solicitation may only be made by means of a confidential private offering memorandum or prospectus relating to a particular fund and only in a manner consistent with federal and applicable state securities laws.
1
The Salient Funds offered under the Salient MF Trust are distributed by Foreside Fund Services LLC.
Not FDIC Insured | No Bank Guarantee | May Lose Value
©2019 Salient. All rights reserved.
The discussions concerning the Funds included in this shareholder report may contain certain forward-looking statements about the factors that may affect performance of the Funds in the future, including the portfolio managers’ outlook regarding economic, financial, market, petroleum, political and other factors relevant to investment performance in the U.S. and abroad. These statements are based on the portfolio managers’ expectations concerning certain future events and their expected impact on the Funds and are current only through the date on the cover of this report. Forward-looking statements are inherently uncertain and are not intended to predict the future performance of the Funds. Actual events may cause adjustments in the portfolio managers’ strategies from those currently expected to be employed, and the outlook of the portfolio managers is subject to change.
2
Fund Commentary and Performance (Unaudited)
Salient MLP & Energy Infrastructure Fund
As of December 31, 2018
For the year ended December 31, 2018, Salient MLP & Energy Infrastructure Fund’s Class I shares returned-18.10%, underperforming the Fund’s benchmark, the Alerian MLP Index, which returned-12.42%.
2018 was a volatile year for master limited partnerships (MLPs) and midstream energy companies. MLPs, as measured by the Alerian MLP Index, were up nearly 12% inmid-August only to finish the year down by over 12%. There was no one factor that drove MLP performance. Instead, during a year in which midstream companies were improving their balance sheets and improving corporate governance, the sector was buffeted by a number of negative events.
The year started on a positive note as investors put money back to work after heavytax-loss harvesting in late 2017, and the Alerian MLP Index quickly advanced to a positive 10% return. At this early part of the year, it had appeared as if the below-average valuations, attractive yields and improving fundamentals would lead to strong MLP performance in 2018. However, technical consolidation coupled with rising interest rate concerns in February quickly put a damper on the bull case for energy midstream companies, leading to a drawdown. Shortly after the February drawdown, the Federal Energy Regulatory Commission (FERC) issued a proposed ruling inmid-March that would have reduced the tariffs—and consequently total revenues—many MLPs could receive on their natural gas pipelines. The ruling led to sharpone-day declines in midstream energy equity prices. Some of the companies that would have been the worst affected by the proposal included TC PipeLines, L.P. (TCP), Williams Partners, L.P. (WPZ) and Enbridge Energy Partners, L.P. (EEP).
Midstream companies had already been contemplating simplification and consolidation, especially as investors appeared to prefer strong balance sheets, self-funding, better-aligned corporate governance and lower cost of capital. Perhaps most notably, Energy Transfer Equity, L.P. (ETE) and Energy Transfer Partners, L.P. (ETP) simplified and consolidated their corporate structure later in 2018. However, the proposed ruling in March accelerated the wave of simplification and consolidation transactions, including Williams Companies, Inc.’s (WMB) rollup of WPZ and Enbridge, Inc.’s (ENB) announced acquisition of EEP and two other affiliated companies. In total, 14 simplification and consolidation transactions were either announced or completed in 2018. MLPs especially benefited from these trends as many received large premiums to be acquired by their parent or affiliated entity. Specifically, ETE paid about an 11% premium to ETP and WMB paid a premium of over 6% to WPZ. These buyout premiums were one reason why MLPs outperformed the broad midstream energy sector during the year.
Throughout the summer months, the industry recovered from the lows established after FERC’s proposed ruling. As the U.S. continued to set record high levels of energy commodities and as volumes increased, particularly out of the Permian Basin in western Texas, fundamentals continued to improve and many midstream companies reported healthy earnings beats. Bottlenecks in the Permian Basin and Canadian oil sands drove high basin differentials and led to several new additional project pipeline announcements. Additionally, relatively high oil prices provided a favorable backdrop to continued domestic energy production growth. The future for midstream companies looked even brighter in July when FERC ultimately removed some of the most negatively impactful measures of its proposed ruling.
However, Proposition 112 in Colorado soon came into focus. Having received enough signatures to be placed on the ballot, the measure proposed an increase in the minimum distance between oil rigs and the nearest structure or protected area from 500 feet to 2500 feet. While seemingly innocuous, the measure would have curtailed production growth in the state of Colorado—namely from the DJ Basin—and likely would have led to production declines. The companies potentially most directly impacted by the measure included Noble Midstream Partners, L.P. (NBLX) and Western Gas Partners, L.P. (WES). Around this time, EQT Midstream Partners, L.P. (EQM) faced regulatory delays on its Mountain Valley Pipeline, and a judge blocked construction of TransCanada Corp’s (TRP) Keystone XL pipeline. Even though Proposition 112 failed on election day, and both EQM and TRP assured investors of the eventual completion of their respective major pipeline projects, the whole space traded down with increased focus on potential regulatory impacts on domestic production and midstream growth.
With midstream companies on the ropes, so to speak, the space suffered yet anotherone-two punch in the form of sharp declines in crude oil prices andtax-loss harvesting. With regard to oil prices, the Organization of the Petroleum Exporting Countries (OPEC), specifically Saudi Arabia, had been
3
Fund Commentary and Performance (Unaudited)
Salient MLP & Energy Infrastructure Fund
As of December 31, 2018
steadily growing production from the beginning of the year, as it had appeared that U.S. sanctions on Iran would lead to supply shortfalls. What was initially unanticipated, however, is how strongly the Trump administration would prioritize lower gasoline prices, encouraging Saudi Arabia to produce more crude oil even as it took a more lenient view with regard to Iranian sanctions. The market quickly responded to what had the potential to become a glut of crude oil supply and oil prices fell. OPEC met in December and, with some difficulty, agreed on a production cut of approximately 1.2 million barrels of oil per day, stabilizing the crude oil market though not much more.Tax-loss harvesting led to large outflows throughout the month of December, putting further downward pressure on the space.
During the year, the Fund underperformed its benchmark index, primarily as a result of strong performance from MLPs, in which the Fund held an underweight position. Two of these underweight positions included Williams Partners, L.P. (WPZ) and Energy Transfer Partners, L.P. (ETP), both of which received large premiums as part of company simplification and consolidation transactions. Also contributing to the Fund’s underperformance was a surprise distribution cut from Macquarie Infrastructure Corp. (MIC). MIC had cut its distribution after noting poor performance from its fuel oil storage business. SemGroup Corp. (SEMG), which also has a fuel oil storage business, traded down in sympathy, but in the context of the midstream sector’s improving fundamentals and investor focus on balance sheet health, SEMG’s persistently high leverage led to the company’s underperformance throughout the year.
On the upside, two of the Fund’s positions not included in the benchmark—ONEOK, Inc. (OKE) and Cheniere Energy, Inc. (LNG)—contributed to the Fund’s performance. OKE performed well as the company continued to execute on its strategies and checked all midstream investor boxes, including having a healthy balance sheet and a diversified asset base. LNG is a first mover when it comes to the export of liquefied natural gas, and low domestic gas prices continued to support thebuild-out of Cheniere’s LNG export facilities along the Gulf Coast.
Refiner sponsors of MLPs performed well in 2018 and contributed to the Fund’s performance. Andeavor (ANDV), BP PLC (BP) and Royal Dutch Shell PLC (RDS) had positive performance during their respective portfolio holding periods, during a year in which MLPs were predominantly negative. Refiner sponsors benefited from defensive sector rotation as oil prices fell in the latter half of 2018, idiosyncratic merger and acquisition activity and potential market impacts of IMO2020, the International Maritime Organization’s regulation that mandates cleaner burning fuels for marine vessels.
All other sectors detracted from the Fund’s performance. Liquids pipelines performed particularly poorly as lower commodity prices and increased focus on a potential near-term recession increased investor concern over impacts to domestic crude oil production. For similar reasons, gathering and processing companies were also negative, on average, for the year, including many companies that would have been impacted by Proposition 112 in Colorado. Natural gas pipelines held up better than other sectors in the portfolio, driven by ETP, which received a large premium from ETE as part of its buyout transaction, OKE, which executed well on its strategies, and Cheniere, which benefited from increased investor interest in natural gas exports.
During the reporting period, the Fund sold covered call option contracts to generate additional income for shareholders. The sale of options generated approximately $2.4 million in premium income, which equates to approximately 11 basis points in performance contribution for the year.
2018 was a transition year for the midstream energy space, marked by a record number of consolidation and simplification transactions. It was also a year in which markets and fundamentals moved in opposite directions—namely, as underlying fundamentals improved and earnings grew, prices fell. Midstream companies seemed unable to catch a break as negative exogenous events buffeted the space.
The investment team believes that many of the factors that drove earnings growth in 2018 may persist into 2019 but could moderate some as pipeline bottlenecks are relieved and production growth estimates come down in the face of lower commodity prices. However, because the midstream sector has worked toward greater balance sheet health and lower commodity price exposure, the team believes that investors may focus on the sector’s more defensive—i.e., less cyclical attributes—especially as broad equities falter in the face of recession fears. This shift would be supported by the
4
Fund Commentary and Performance (Unaudited)
Salient MLP & Energy Infrastructure Fund
As of December 31, 2018
exploration and production sector which, like midstream, has also prioritized balance sheet health in the years following the oil price drawdown of 2015, many having become free-cash-flow positive in recent quarters. This could afford the midstream sector the benefit of counterparties that can better weather commodity price volatility and reduce downside risk to revenues. Moreover, with most of the potential simplification and consolidation transactions already made, the investment team believes midstream companies may offer cleaner investment characteristics to investors looking at the space, which may support positive fund flows throughout the year and which in turn would be supportive of price appreciation. Lastly, the team views the robust midstream yields and depressed valuations as supportive of a potential future recovery and is continuing to target companies that are effectively reducing leverage and have visible growth trajectories.
Effective January 1, 2019, the Alerian Midstream Energy Select Index (AMEI Index) replaced the Alerian MLP Index as the Fund’s primary benchmark index. The team believes the AMEI Index more closely aligns to the Fund’s investment strategies as a result of changes recently made to the composition of the AMEI Index. The AMEI Index includes both midstream master limited partnerships (MLPs) and corporate structures and is designed to be “RIC compliant” by imposing a 25% limitation on MLPs in construction. As such, the team believes the AMEI Index is a more appropriate benchmark for the Fund.
5
Salient MLP & Energy Infrastructure Fund
Asset Allocation as a Percentage of Total Investments
as of December 31, 2018
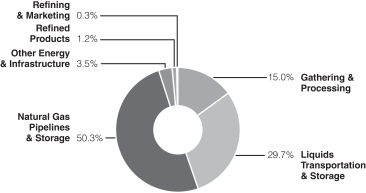
These allocations may not reflect the current or future position of the portfolio.
Hypothetical Growth of $1,000,000 Investment in the Fund
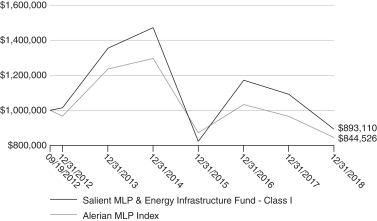
The chart above shows how a hypothetical investment of $1,000,000 in the Fund at its inception would have performed versus an investment in the Fund’s benchmark index. The values indicate what $1,000,000 would have grown to over the time period indicated. The hypothetical example does not represent the returns of any particular investment.
6
Salient MLP & Energy Infrastructure Fund(a)
| | | | | | | | | | | | | | | | |
| | | 1 Year | | | 5 Year | | | Since
Inception | | | Inception
Date | |
| Average Annual Total Return | | | | | | | | | | | | | | | | |
Class A (with sales load)(b) | | | -22.85% | | | | -9.19% | | | | -3.33% | | | | 12/21/12 | |
| | | | |
Class A (without sales load)(c) | | | -18.33% | | | | -8.16% | | | | -2.41% | | | | 12/21/12 | |
| | | | |
Class C (with CDSC)(d) | | | -19.67% | | | | -8.87% | | | | -3.68% | | | | 01/08/13 | |
| | | | |
Class C (without CDSC)(e) | | | -18.89% | | | | -8.87% | | | | -3.68% | | | | 01/08/13 | |
| | | | |
Class I | | | -18.10% | | | | -7.97% | | | | -1.78% | | | | 09/19/12 | |
| | | | |
Class R6(f) | | | -18.04% | | | | N/A | | | | 2.59% | | | | 01/04/16 | |
(a) Returns with sales charges reflect the deduction of the current maximumfront-end sales charge of 5.50% for Class A shares and the maximum contingent deferred sales charge of 1.00%, which is applied to Class C shares. All returns reflect reinvestment of all dividend and capital gain distributions. The total annual operating expense ratios for the Fund, based on the current Fund prospectus dated May 1, 2018, are as follows: Class A shares are 1.43%, Class C shares are 2.22% and Class I shares are 1.22%. The advisor has contractually agreed to waive fees and/or reimburse expenses to maintain the Fund’s total operating expenses at 1.55% for Class A, 2.30% for Class C and 1.30% for Class I shares, excluding certain expenses, until April 30, 2019. Pursuant to the Expense Limitation Agreements, each Fund will reimburse the investment advisor for any fee waivers and expense reimbursements made by the investment advisor, provided that any such reimbursements made by a Fund to the investment advisor will not cause the Fund’s expense limitation to exceed the expense limitation in existence at the time the expenses were incurred or at the time of the reimbursement, whichever is lower, and the reimbursement is made within three years following the year in which the expenses were incurred. Additional information pertaining to the December 31, 2018, expense ratios can be found in the financial highlights. Returns do not reflect the taxes that investors may pay on Fund distributions or the sale of Fund shares.
(b) Includes the effect of the maximum 5.50% sales charge.
(c) Excludes sales charge.
(d) Includes the 1.00% contingent deferred sales charge.
(e) Excludes the 1.00% contingent deferred sales charge.
(f) Performance shown prior to inception date of R6 shares is that of Class I shares.
The performance quoted represents past performance, does not guarantee future results and current performance may be lower or higher than the data quoted. The investment return and principal value of an investment will fluctuate so that shares, when redeemed, may be worth more or less than their original cost. Performance data current to the most recentmonth-end may be obtained at www.salientfunds.com. Investment performance may reflect fee waivers in effect. In the absence of fee waivers, total return would be lower. Total return is based on NAV, assuming reinvestment of all distributions. Performance does not reflect the deduction of taxes that a shareholder would pay on fund distributions or the redemption of fund shares.
7
Fund Commentary and Performance (Unaudited)
Salient Tactical Plus Fund
As of December 31, 2018
For the year ended December 31, 2018, Salient Tactical Plus Fund’s Class I shares returned 2.56%, outperforming the Fund’s benchmark, the S&P 500 Index, which returned-4.38%.
2018 was the first down year for the stock market since 2008. Fourth quarter performance erased all of the S&P 500’s gains earlier in the year. Small cap stocks closed the year with losses of over 10%, with the Russell 2000 Index down-11.01%. International and emerging markets, as represented by the MSCI EAFE Index and the MSCI Emerging Markets Index, ended the year with losses of-13.79% and-14.58%, respectively.
The shutdown of the U.S. government at the end of December, continuing interest rate hikes by the U.S. Federal Reserve (Fed) and fear over a trade war with China all weighed on the market during 2018. The Fed raised the federal funds rate in December to a target rate of 2.25%–2.50%, the ninth increase since December 2015. While the increase was expected, the markets reflected investors’ disappointment that Fed Chair Jerome Powell did not say explicitly that the Fed would reconsider postponing future interest rate hikes in 2019 if economic conditions worsen. Recognizing these risks, the Fund’s investment team decreased the Fund’s allocation to higher beta market indices, increased the Fund’s allocation to cash and opportunistically initiated short positions during the fourth quarter. This reallocation process and the short exposure contributed to the Fund’s outperformance relative to the S&P 500 during the fourth quarter and for the year.
Earlier in the year, the market gained significant ground, with most major market averages climbing to new highs in the third quarter. During this time, investor sentiment grew more bullish (which is a negative from a contrary point of view), valuations were high, interest rates continued to climb and the Fund’s momentum models showed less and less participation by the broader list of stocks. Due to these concerns, the Fund adopted a more defensive posture versus the S&P 500 during the first three quarters of 2018, which detracted from the Fund’s performance. However, this defensive posture benefited the Fund’s return in the fourth quarter during the steep decline in stock prices and resulted in the Fund’s positive performance for the year as a whole.
Several of the Fund’s models improved as the market moved downward in the fourth quarter of 2018. Investor sentiment turned pessimistic quickly, which is a positive sign from a contrary point of view. Interest rates also eased at the end of 2018 and valuation measures improved. In addition, the recent moderation of inflation indicated a potential stabilization of interest rates.
However, a major negative in the Fund’s models was the increase in downside volume versus upside volume toward the end of the year. When downside volume exceeds upside volume over a period of time, it indicates that the market has had a negative rate of return during that time period. This indicator is an integral part of the Fund’s risk management system and alerts the investment team to take a defensive position in the portfolio to preserve capital during the down market. Both the Fund’s intermediate- and long-term volume/breadth momentum models turned down. The Tactical Plus strategy employs several short-term momentum models that enable the Fund’s investment team to react quickly to volatile market movements. As these short-term models turned harshly negative in the fourth quarter, the Fund’s investment team positioned the portfolio to a maximum defensive position in October and again in December. The allocation to cash, the reduction in market exposure and the use of short positions was additive to the Fund’s outperformance relative to the S&P 500. The Fund was thus able to achieve a positive return in 2018—a year in which virtually all of the major indices declined.
Additionally, the Fund regularly used derivative instruments such as options and futures throughout the year. A meaningful portion of the Fund’s return can be attributed to these instruments.
As the Salient Tactical Plus Fund’s investment team looks ahead to 2019, there are a number of factors within its “Four Pillar Process” that the team will be watching to indicate a more favorable stock market environment:
Valuation—Equity valuations declined during 2018. There is a growing perception among investors that peak earnings may have been reached during the current economic cycle and lower valuations reflect this lower assessment. Continued declines in equity valuations could be positive for the market environment in 2019.
8
Fund Commentary and Performance (Unaudited)
Salient Tactical Plus Fund
As of December 31, 2018
Monetary factors and credit conditions—Intermediate- to long-term interest rates rose in 2018, which was negative for the markets. In addition, one of the most important developments in the last few months of the year was the widening of credit spreads. Widening credit spreads have historically indicated future economic weakness. A continuation of the stabilization in interest rates that occurred in late 2018 and a narrowing of credit spreads could be favorable for the market in 2019.
Sentiment—Investor sentiment quickly turned negative as stock prices declined during 2018. Several of the Fund’s measures of investor sentiment reached their most pessimistic level since the February 2016 stock market bottom, which is a positive development from a contrary point of view. From a longer-term perspective, however, mutual fund cash as a percentage of total assets (adjusted for interest rates) has now fallen to its lowest level since the market top of 2007. This low level of cash indicates that mutual funds are nearly fully invested by historical measures. Further liquidation in the coming year may need to occur in order to see a normalization of these low cash levels.
Momentum—The severe December market decline pushed the percentage of stocks above their10- and30-week moving averages to the most oversold levels that have occurred in two years. The severity of the market’s 2018 decline, accompanied by lower valuations and very pessimistic investor sentiment, has created a short-term oversold condition. However, if the Fund’s longer-term models continue to be negative, the investment team would maintain the Fund’s defensive posture and look to take advantage of rallies to initiate hedged or short positions until the Fund’s longer-term models improve.
Effective January 1, 2019, the HFRX Equity Hedge Index replaced the S&P 500 Index as the Fund’s primary benchmark index. The investment team believes the HFRX Equity Hedge Index more closely aligns to the Fund’s investment strategies.
9
Salient Tactical Plus Fund
Allocation of Portfolio Holdings
as of December 31, 2018

These allocations may not reflect the current or future position of the portfolio.
Hypothetical Growth of $1,000,000 Investment in the Fund
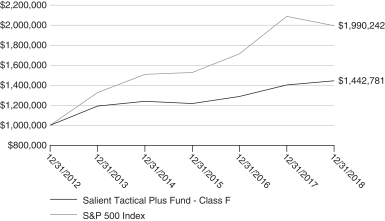
The chart above shows how a hypothetical investment of $1,000,000 in the Fund at its inception would have performed versus an investment in the Fund’s benchmark index. The values indicate what $1,000,000 would have grown to over the time period indicated. The hypothetical example does not represent the returns of any particular investment.
10
Salient Tactical Plus Fund(a)
| | | | | | | | | | | | | | | | |
| | | 1 Year | | | 5 Year | | | Since
Inception | | | Inception
Date | |
| Average Annual Total Return | | | | | | | | | | | | | | | | |
Class A (with sales load)(b) | | | -3.31% | | | | 2.21% | | | | 4.74% | | | | 12/31/12 | |
| | | | |
Class A (without sales load)(c) | | | 2.29% | | | | 3.37% | | | | 5.73% | | | | 12/31/12 | |
| | | | |
Class C (with CDSC)(d) | | | 0.52% | | | | 2.57% | | | | 4.92% | | | | 12/31/12 | |
| | | | |
Class C (without CDSC)(e) | | | 1.50% | | | | 2.57% | | | | 4.92% | | | | 12/31/12 | |
| | | | |
Class I | | | 2.56% | | | | 3.58% | | | | 5.96% | | | | 12/31/12 | |
| | | | |
Class F | | | 2.91% | | | | 3.92% | | | | 6.30% | | | | 12/31/12 | |
(a) Returns with sales charges reflect the deduction of the current maximumfront-end sales charge of 5.50% for Class A shares and the maximum contingent deferred sales charge of 1.00%, which is applied to Class C shares. All returns reflect reinvestment of all dividend and capital gain distributions. The total annual gross and net operating expense ratios for the Fund based on the current Fund prospectus dated May 1, 2018, are as follows: Class A shares are 3.24% and 1.98%, respectively, Class C shares are 7.43% and 2.73%, respectively, Class I shares are 3.94% and 1.73%, respectively, and Class F shares are 2.79% and 1.42%, respectively. The advisor has contractually agreed to waive fees and/or reimburse expenses to maintain the Fund’s total operating expenses at 1.65% for Class A, 2.40% for Class C, 1.40% for Class I and 1.09% for Class F shares, excluding certain expenses, until April 30, 2019. Pursuant to the Expense Limitation Agreements, each Fund will reimburse the investment advisor for any fee waivers and expense reimbursements made by the investment advisor, provided that any such reimbursements made by a Fund to the investment advisor will not cause the Fund’s expense limitation to exceed the expense limitation in existence at the time the expenses were incurred or at the time of the reimbursement, whichever is lower, and the reimbursement is made within three years following the year in which the expenses were incurred. Additional information pertaining to the December 31, 2018, expense ratios can be found in the financial highlights. Returns do not reflect the deduction of taxes a shareholder would pay on Fund distributions or sale of Fund shares.
Class A/C/I shares of the Fund commenced operations on December 15, 2014. The returns prior to that date are those of the predecessor fund’s Investor Class shares, which commenced operations on December 31, 2012. Performance for the period from December 31, 2012, to December 12, 2014, reflects the gross performance of the Investor Class shares of the predecessor fund adjusted to apply the fees and anticipated expenses of Class A/C/I shares of the Fund. All share classes of the Fund are invested in the same portfolio of securities and returns only differ to the extent that fees and expenses of the classes are different. In the reorganization, Investor Class and Institutional Class shares of the Broadmark Tactical Fund were exchanged for Class F shares of the Salient Tactical Plus Fund.
(b) Includes the effect of the maximum 5.50% sales charge.
(c) Excludes sales charge.
(d) Includes the 1.00% contingent deferred sales charge.
(e) Excludes the 1.00% contingent deferred sales charge.
The performance quoted represents past performance, does not guarantee future results and current performance may be lower or higher than the data quoted. The investment return and principal value of an investment will fluctuate so that shares, when redeemed, may be worth more or less than their original cost. Performance data current to the most recentmonth-end may be obtained at www.salientfunds.com. Investment performance may reflect fee waivers in effect. In the absence of fee waivers, total return would be lower. Total return is based on NAV, assuming reinvestment of all distributions. Performance does not reflect the deduction of taxes that a shareholder would pay on fund distributions or the redemption of fund shares.
11
Investment Disclosures
Fund Risk Disclosures
There are risks involved with investing, including loss of principal. Past performance does not guarantee future results, share prices will fluctuate and you may have a gain or loss when you redeem shares.
Asset allocation does not assure profit or protect against risk.
Diversification does not assure profit or protect against risk.
Salient MLP & Energy Infrastructure Fund
The Fund’s investments are concentrated in the energy infrastructure industry with an emphasis on securities issued by MLPs, which may increase price fluctuation. The value of commodity-linked investments such as the MLPs and energy infrastructure companies (including midstream MLPs and energy infrastructure companies) in which the Fund invests are subject to risks specific to the industry they serve, such as fluctuations in commodity prices, reduced volumes of available natural gas or other energy commodities, slowdowns in new construction and acquisitions, a sustained reduced demand for crude oil, natural gas and refined petroleum products, depletion of the natural gas reserves or other commodities, changes in the macroeconomic or regulatory environment, environmental hazards, rising interest rates and threats of attack by terrorists on energy assets, each of which could affect the Fund’s profitability.
MLPs are subject to significant regulation and may be adversely affected by changes in the regulatory environment including the risk that an MLP could lose its tax status as a partnership. If an MLP were to be obligated to pay federal income tax on its income at the corporate tax rate, the amount of cash available for distribution would be reduced and such distributions received by the Fund would be taxed under federal income tax laws applicable to corporate dividends received (as dividend income, return of capital or capital gain).
In addition, investing in MLPs involves additional risks as compared to the risks of investing in common stock, including risks related to cash flow, dilution and voting rights. Such companies may trade less frequently than larger companies due to their smaller capitalizations, which may result in erratic price movement or difficulty in buying or selling.
Additional management fees and other expenses are associated with investing in MLP funds. The tax benefits received by an investor investing in the Fund differ from that of a direct investment in an MLP by an investor.
This document does not constitute an offering of any security, product, service or fund, including the Fund, for which an offer can be made only by the Fund’s prospectus.
No fund is a complete investment program and you may lose money investing in a fund. The Fund may engage in other investment practices that may involve additional risks and you should review the Fund prospectus for a complete description.
Salient Tactical Plus Fund
All securities investing and trading activities risk the loss of capital. No assurance can be given that the Fund’s investment activities will be successful or that the Fund’s shareholders will not suffer losses.
Equity securities may be subject to general movements in the stock market. The Fund may have exposure to or invest in equity securities of companies with small or medium capitalization, which involve certain risks that may differ from, or be greater than, those for larger companies, such as higher volatility, lower trading volume, lack of liquidity, fewer business lines and lack of public information.
The use of derivative instruments exposes the Fund to additional risks and transaction costs. These instruments come in many varieties and have a wide range of potential risks and rewards, and may include futures contracts, options on futures contracts, options (both written and purchased), swaps and swaptions. A risk of the Fund’s use of derivatives is that the fluctuations in their values may not correlate perfectly with the overall securities markets. Derivatives also provide the economic effect of financial leverage by creating additional investment exposure, as well as the potential for greater loss.
12
Investment Disclosures
The Fund may take a short position in a derivative instrument, such as a future, forward or swap. A short position on a derivative instrument involves the risk of a theoretically unlimited increase in the value of the underlying instrument. The Fund may also from time to time sell securities short, which involves borrowing and selling a security and covering such borrowed security through a later purchase. A short sale creates the risk of an unlimited loss, in that the price of the underlying security could theoretically increase without limit, thus increasing the cost of buying those securities to cover the short position.
The Fund invests in exchange-traded funds (ETFs) and in options on ETFs, exposing it to the risks associated with the investments held by such ETFs. The value of any investment in an ETF will fluctuate according to the performance of that ETF. In addition, the Fund will indirectly bear a proportionate share of expenses paid by each ETF in which the Fund invests. Further, individual shares of an ETF may be purchased and sold only on a national securities exchange through a broker-dealer. ETF shares trade at market prices rather than net asset value (“NAV”) and shares may trade at a price greater than NAV (a premium) or less than NAV (a discount). The market price of an ETF’s shares, like the price of any exchange-traded security, includes a“bid-ask spread” charged by the exchange specialists, market makers or other participants that trade the particular security.
The Fund invests in fixed-income securities, which are generally subject to credit risk and interest rate risk. Credit risk refers to the possibility that the issuer of a security will be unable to make interest payments and/or repay the principal on its debt. Interest rate risk refers to fluctuations in the value of a fixed-income security resulting from changes in the general level of interest rates. When the general level of interest rates goes up, the prices of most fixed-income securities go down. When the general level of interest rates goes down, the prices of most fixed-income securities go up.
The Fund may make foreign investments, which often involve special risks not present in U.S. investments that can increase the chances that the Fund will lose money.
To the extent that the Fund makes investments on a shorter-term basis, the Fund may as a result trade more frequently and incur higher levels of brokerage fees and commissions.
This document does not constitute an offering of any security, product, service or fund, including the Fund, for which an offer can be made only by the Fund’s prospectus.
No fund is a complete investment program and you may lose money investing in a fund. The Fund may engage in other investment practices that may involve additional risks and you should review the Fund prospectus for a complete description.
Fund Benchmark Definitions
Alerian MLP Index is the leading gauge of large- andmid-cap energy master limited partnerships (MLPs). The float-adjusted, capitalization-weighted index includes some of the most prominent companies and captures approximately 75% of available market capitalization.
S&P 500 Index is an unmanaged index of 500 common stocks chosen to reflect the industries in the U.S. economy.
One cannot invest directly in an index.
Definition of Terms
Alerian Midstream Energy Select Index (AMEI) is a composite of North American midstream energy infrastructure companies that are engaged in activities involving energy commodities. The capped, float-adjusted, capitalization-weighted index is disseminated in real time on a price-return basis.
Basis point (bps)is a unit of measure that is equal to 1/100th of 1% and used to denote a change in the value or rate of a financial instrument.
Beta is a statistical measure of risk that shows the relative volatility of a stock, fund or other security in comparison to the market as a whole.
Covered call option is an options strategy in which an investor holds a long position in an asset and then sells call options on that same asset in an attempt to generate increased income from the asset.
13
Investment Disclosures
Credit spreadis the spread between Treasury securities andnon-Treasury securities that are identical in all respects except for quality rating.
Derivativeis a security whose price is dependent upon or derived from one or more underlying assets.
Drawdown is the gradual decline in the price of a security or other investment between its high and low over a given time period.
Federal funds rate is the interest rate at which a depository institution lends immediately available funds to another depository institution overnight.
Free cash flow represents the cash that a company is able to generate after laying out the money required to maintain or expand its asset base.
Futuresare financial contracts that obligate the buyer to purchase an asset (or the seller to sell an asset), such as a physical commodity or a financial instrument, at a predetermined future date and price.
HFRX Equity Hedge Index is comprised of private funds with strategies that maintain both long and short positions primarily in equity securities and equity derivatives.
Inflation is the rate at which the general level of prices for goods and services is rising, and, subsequently, purchasing power is falling.
Leverageis the use of various financial instruments or borrowed capital, such as margin, to increase the potential return of an investment.
Master limited partnerships (MLPs) are publicly traded limited partnerships and limited liability companies that are treated as partnerships for federal income tax purposes.
Momentumis the rate of acceleration of a security’s price or volume.
MSCI EAFE (Europe, Australasia and Far East) Index is a stock market index that is designed to measure the equity market performance of developed markets outside of the U.S. and Canada.
MSCI Emerging Markets Indexis a free float-adjusted market capitalization index that is designed to measure equity market performance in the global emerging markets.
Options are contracts sold by one party to another party. A contract offers the buyer the right, but not the obligation, to buy or sell a security or other financial asset at an agreed upon price during a certain period of time or on a specific date.
Russell 2000 Index measures the performance of the 2,000 smallest companies in the Russell 3000 Index. The Russell 3000 Index represents approximately 98% of the investable U.S. equity market.
Shorts are borrowed securities, commodities or currencies that are sold on the open market with the expectation that the asset will fall in value.
Tax-loss harvesting is the selling of securities at a loss to offset a capital gains tax liability.
Valuation is the process of determining the value of an asset or company based on earnings and the market value of assets.
Volatility is a statistical measure of the dispersion of returns for a given security or market index.
Volume is the number of shares or contracts traded in a security or an entire market during a given period of time.
Volume/breadth momentum model is a proprietary model used by Salient Tactical Plus Fund’ssub-advisor, Broadmark Asset Management LLC to determine optimal market exposure.
14
Disclosure of Fund Expenses (Unaudited)
For the Six Months Ended December 31, 2018
As a shareholder of the Salient Funds, you incur two types of costs: (1) transaction costs, including applicable sales charges (loads); and (2) ongoing costs, including management fees, distribution and service (12b-1) fees, shareholder services fees and other Fund expenses. This example is intended to help you understand your ongoing costs (in dollars) of investing in the Funds and to compare these costs with the ongoing costs of investing in other mutual funds. The example is based on an investment of $1,000 invested at the beginning of the (six-month) period and held for the entire period July 1, 2018 through December 31, 2018.
Actual Expenses
The first line for each share class of each Fund in the table provides information about actual account values and actual expenses. You may use this information, together with the amount you invested, to estimate the expenses that you paid over the period. Simply divide your account value by $1,000 (for example, an $8,600 account value divided by $1,000 = 8.6), then multiply the result by the number in the applicable line under the heading entitled “Expenses Paid During Period” to estimate the expenses you paid on your account during this period.
Hypothetical Example For Comparison Purposes
The second line for each share class of each Fund in the table below provides information about hypothetical account values and hypothetical expenses based on the Fund’s actual expense ratio and an assumed rate of return of 5% per year before expenses, which is not the Fund’s actual return. The hypothetical account values and expenses may not be used to estimate the actual ending account balance or expenses you paid for the period. You may use this information to compare the ongoing costs of investing in the Funds and other funds. To do so, compare this 5% hypothetical example with the 5% hypothetical examples that appear in the shareholder reports of other funds.
Please note that the expenses shown in the table below are meant to highlight your ongoing costs only and do not reflect any transactional costs, such as sales charges (loads), redemption fees or exchange fees. Therefore, the second line for each share class of each Fund within the table is useful in comparing ongoing costs only, and will not help you determine the relative total costs of owning different funds. If these transactional costs were included, your costs would have been higher.
| | | | | | | | | | | | | | | | |
| Salient MLP & Energy Infrastructure Fund | | Beginning
Account Value
07/01/18 | | | Ending
Account Value
12/31/18 | | | Expense
Ratios(a) | | | Expenses Paid
During Period(b)
07/01/18 – 12/31/18 | |
| Class A | | | | | | | | | | | | | | | | |
Actual | | $ | 1,000.00 | | | $ | 842.00 | | | | 1.36% | | | $ | 6.31 | |
| | | | |
Hypothetical | | $ | 1,000.00 | | | $ | 1,018.35 | | | | 1.36% | | | $ | 6.92 | |
| Class C | | | | | | | | | | | | | | | | |
Actual | | $ | 1,000.00 | | | $ | 839.00 | | | | 2.12% | | | $ | 9.83 | |
| | | | |
Hypothetical | | $ | 1,000.00 | | | $ | 1,014.52 | | | | 2.12% | | | $ | 10.76 | |
| Class I | | | | | | | | | | | | | | | | |
Actual | | $ | 1,000.00 | | | $ | 842.70 | | | | 1.14% | | | $ | 5.29 | |
| | | | |
Hypothetical | | $ | 1,000.00 | | | $ | 1,019.46 | | | | 1.14% | | | $ | 5.80 | |
| Class R6 | | | | | | | | | | | | | | | | |
Actual | | $ | 1,000.00 | | | $ | 843.00 | | | | 1.06% | | | $ | 4.92 | |
| | | | |
Hypothetical | | $ | 1,000.00 | | | $ | 1,019.86 | | | | 1.06% | | | $ | 5.40 | |
| Salient Tactical Plus Fund | | | | | | | | | | | | |
| Class A | | | | | | | | | | | | | | | | |
Actual | | $ | 1,000.00 | | | $ | 1,025.60 | | | | 1.65% | | | $ | 8.42 | |
| | | | |
Hypothetical | | $ | 1,000.00 | | | $ | 1,016.89 | | | | 1.65% | | | $ | 8.39 | |
15
Disclosure of Fund Expenses (Unaudited)
For the Six Months Ended December 31, 2018
| | | | | | | | | | | | | | | | |
| Salient Tactical Plus Fund (continued) | | Beginning
Account Value
07/01/18 | | | Ending
Account Value
12/31/18 | | | Expense
Ratios(a) | | | Expenses Paid
During Period(b)
07/01/18 – 12/31/18 | |
| Class C | | | | | | | | | | | | | | | | |
Actual | | $ | 1,000.00 | | | $ | 1,022.40 | | | | 2.40% | | | $ | 12.23 | |
| | | | |
Hypothetical | | $ | 1,000.00 | | | $ | 1,013.11 | | | | 2.40% | | | $ | 12.18 | |
| Class I | | | | | | | | | | | | | | | | |
Actual | | $ | 1,000.00 | | | $ | 1,027.40 | | | | 1.40% | | | $ | 7.15 | |
| | | | |
Hypothetical | | $ | 1,000.00 | | | $ | 1,018.15 | | | | 1.40% | | | $ | 7.12 | |
| Class F | | | | | | | | | | | | | | | | |
Actual | | $ | 1,000.00 | | | $ | 1,029.10 | | | | 1.09% | | | $ | 5.57 | |
| | | | |
Hypothetical | | $ | 1,000.00 | | | $ | 1,019.71 | | | | 1.09% | | | $ | 5.55 | |
(a) Annualized, based on the Fund’s most recent fiscal half year expenses.
(b) Expenses are equal to the Fund’s annualized expense ratio multiplied by the average account values over the period, multiplied by the number of days in the most recent fiscal half year (184), then divided by 365.
16
Schedule of Investments (See Note 11)
Salient MLP & Energy Infrastructure Fund
December 31, 2018
| | | | | | | | |
| | | Shares | | | Value
(See Note 2) | |
| Master Limited Partnerships and Related Companies—100.8% | | | | | |
| Gathering & Processing—15.1% | | | | | | | | |
| United States—15.1% | | | | | | | | |
Altus Midstream Co.(a) | | | 3,849,700 | | | $ | 29,758,181 | |
Antero Midstream GP LP | | | 320,664 | | | | 3,585,024 | |
Antero Midstream Partners LP(a) | | | 561,898 | | | | 12,018,998 | |
CNX Midstream Partners LP(a) | | | 233,651 | | | | 3,803,838 | |
Crestwood Equity Partners LP(a) | | | 139,712 | | | | 3,899,362 | |
EnLink Midstream LLC | | | 1,578,877 | | | | 14,983,543 | |
Noble Midstream Partners LP | | | 243,264 | | | | 7,015,734 | |
Oasis Midstream Partners LP(a) | | | 26,151 | | | | 418,154 | |
Targa Resources Corp.(a) | | | 1,226,499 | | | | 44,178,494 | |
Western Gas Equity Partners LP(a) | | | 492,348 | | | | 13,652,810 | |
| | | | | | | | |
| | | | | | | 133,314,138 | |
| | | | | | | | |
| Liquids Transportation & Storage—29.9% | | | | | | | | |
| Canada—11.2% | | | | | | | | |
Enbridge, Inc. | | | 1,410,143 | | | | 43,827,246 | |
Inter Pipeline, Ltd. | | | 895,287 | | | | 12,683,014 | |
TransCanada Corp. | | | 1,193,027 | | | | 42,591,064 | |
| | | | | | | | |
| | | | | | | 99,101,324 | |
| | | | | | | | |
| United States—18.7% | | | | | | | | |
BP Midstream Partners LP(a) | | | 349,468 | | | | 5,430,733 | |
Genesis Energy LP(a) | | | 384,239 | | | | 7,096,894 | |
Marathon Petroleum Corp. | | | 205,641 | | | | 12,134,876 | |
MPLX LP(a) | | | 895,603 | | | | 27,136,771 | |
NGL Energy Partners LP(a) | | | 230,342 | | | | 2,208,980 | |
Phillips 66 Partners LP(a) | | | 176,612 | | | | 7,437,131 | |
Plains GP Holdings LP, Class A(a) | | | 3,218,248 | | | | 64,686,785 | |
SemGroup Corp., Class A | | | 1,777,657 | | | | 24,496,113 | |
Shell Midstream Partners LP(a) | | | 871,776 | | | | 14,305,844 | |
| | | | | | | | |
| | | | | | | 164,934,127 | |
| | | | | | | | |
| Natural Gas Pipelines & Storage—50.7% | | | | | | | | |
| Canada—7.2% | | | | | | | | |
Keyera Corp. | | | 647,962 | | | | 12,250,146 | |
Pembina Pipeline Corp. | | | 681,133 | | | | 20,209,216 | |
Pembina Pipeline Corp. (CAD) | | | 1,043,450 | | | | 30,962,613 | |
| | | | | | | | |
| | | | | | | 63,421,975 | |
| | | | | | | | |
| United States—43.5% | | | | | | | | |
Cheniere Energy, Inc.(a) | | | 965,589 | | | | 57,153,213 | |
DCP Midstream LP(a) | | | 43,037 | | | | 1,140,050 | |
Energy Transfer LP(a) | | | 4,538,447 | | | | 59,952,885 | |
Enterprise Products Partners LP(a) | | | 1,768,319 | | | | 43,482,964 | |
Kinder Morgan, Inc. | | | 4,257,690 | | | | 65,483,272 | |
ONEOK, Inc. | | | 805,960 | | | | 43,481,542 | |
Tallgrass Energy LP(a) | | | 1,821,651 | | | | 44,338,986 | |
| | | | |
| See accompanying Notes to Financial Statements. | | 17 | | |
Schedule of Investments (See Note 11)
Salient MLP & Energy Infrastructure Fund
December 31, 2018
| | | | | | | | |
| | | Shares | | | Value
(See Note 2) | |
Tellurian, Inc.(a) | | | 376,827 | | | $ | 2,618,948 | |
Williams Cos., Inc. | | | 3,016,803 | | | | 66,520,506 | |
| | | | | | | | |
| | | | | | | 384,172,366 | |
| | | | | | | | |
| Other Energy & Infrastructure—3.5% | | | | | | | | |
| United States—3.5% | | | | | | | | |
Macquarie Infrastructure Corp. | | | 295,562 | | | | 10,805,747 | |
NextEra Energy Partners LP(a) | | | 344,254 | | | | 14,820,134 | |
Phillips 66 | | | 59,085 | | | | 5,090,173 | |
| | | | | | | | |
| | | | | | | 30,716,054 | |
| | | | | | | | |
| Refined Products—1.3% | | | | | | | | |
| United States—1.3% | | | | | | | | |
Magellan Midstream Partners LP(a) | | | 192,238 | | | | 10,969,100 | |
| | | | | | | | |
| Refining & Marketing—0.3% | | | | | | | | |
| United States—0.3% | | | | | | | | |
Sunoco LP(a) | | | 108,931 | | | | 2,961,834 | |
| | | | | | | | |
Total Master Limited Partnerships and Related Companies (Cost $933,610,439) | | | | | | | 889,590,918 | |
| | | | | | | | |
| Total Investments—100.8% (Cost $933,610,439) | | | | 889,590,918 | |
| Other Assets and Liabilities—(0.8)% | | | | | | | (7,457,387 | ) |
| | | | | | | | |
| Total Net Assets—100.0% | | | | | | $ | 882,133,531 | |
| | | | | | | | |
All percentages disclosed are calculated by dividing the indicated amounts by net assets.
(a)Non-income producing security.
Allocation of Portfolio Holdings:
Salient MLP & Energy Infrastructure Fund invested in securities with exposure to the following countries as of December 31, 2018:
| | | | | | | | |
| | | Value | | | % of
Total Investments | |
United States | �� | $ | 727,067,619 | | | | 81.8 | % |
Canada | | | 162,523,299 | | | | 18.2 | % |
| | | | | | | | |
| | $ | 889,590,918 | | | | 100.0 | % |
| | | | | | | | |
| | | | |
| See accompanying Notes to Financial Statements. | | 18 | | |
Schedule of Investments (See Note 11)
Salient Tactical Plus Fund
December 31, 2018
| | | | | | | | |
| | | Contracts/
Shares | | | Value
(See Note 2) | |
| Money Market Fund—99.2% | | | | | |
| United States—99.2% | | | | | | | | |
Fidelity® Investments Money Market Government Portfolio—Institutional Class, 2.2%(a) | | | 47,068,510 | | | $ | 47,068,510 | |
| | | | | | | | |
Total Money Market Fund (Cost $47,068,510) | | | | | | | 47,068,510 | |
| | | | | | | | |
| Purchased Put Options—0.2% | | | | | |
E-Mini S&P® 500 | | | 558 | | | | 92,070 | |
| | | | | | | | |
Total Purchased Put Options (Cost $132,057) | | | | | | | 92,070 | |
| | | | | | | | |
| Total Investments—99.4% (Cost $47,200,567) | | | | 47,160,580 | |
| Other Assets and Liabilities—0.6%(b) | | | | | | | 274,179 | |
| | | | | | | | |
| Total Net Assets—100.0% | | | | | | $ | 47,434,759 | |
| | | | | | | | |
All percentages disclosed are calculated by dividing the indicated amounts by net assets.
(a) The rate shown is the7-day effective as of December 31, 2018.
(b) Includes cash which is being held as collateral for purchased options.
Purchased Put Options:
| | | | | | | | | | | | | | | | | | | | | | | | |
| Description | | Exercise
Price | | | Expiration
Date | | | Number of
Contracts | | | Notional
Value | | | Value | | | Unrealized
Appreciation/
(Depreciation) | |
E-Mini S&P® 500 | | $ | 2,250 | | | | January 2019 | | | | 558 | | | $ | 69,941,115 | | | $ | 92,070 | | | $ | (39,987 | ) |
| | | | | | | | | | | | | | | | | | | | | | | | |
| | | | | | | | | | | | | | $ | 69,941,115 | | | $ | 92,070 | | | $ | (39,987 | ) |
| | | | | | | | | | | | | | | | | | | | | | | | |
Salient Tactical Plus Fund invested in the following asset categories as of December 31, 2018:
| | | | | | | | |
| | | Value | | | % of
Total Investments | |
Money Market Fund | | $ | 47,068,510 | | | | 99.8 | % |
Purchased Put Options | | | 92,070 | | | | 0.2 | % |
| | | | | | | | |
| | $ | 47,160,580 | | | | 100.0 | % |
| | | | | | | | |
Salient Tactical Plus Fund invested in securities with exposure to the following countries as of December 31, 2018:
| | | | | | | | |
| | | Value | | | % of
Total Investments | |
United States | | $ | 47,160,580 | | | | 100.0 | % |
| | | | | | | | |
| | $ | 47,160,580 | | | | 100.0 | % |
| | | | | | | | |
| | | | |
| See accompanying Notes to Financial Statements. | | 19 | | |
Statements of Assets and Liabilities
December 31, 2018
| | | | | | | | |
| | | Salient
MLP & Energy
Infrastructure
Fund | | | Salient
Tactical
Plus Fund | |
Assets: | | | | | | | | |
Investments, at value | | $ | 889,590,918 | | | $ | 47,160,580 | |
Cash | | | 7,067,597 | | | | — | |
Deposit with brokers for options and futures contracts | | | — | | | | 219,527 | |
Interest and dividends receivable | | | 873,078 | | | | 78,506 | |
Receivable for shares sold | | | 7,534,943 | | | | 1,457 | |
Receivable for investments sold | | | 2,284,063 | | | | — | |
Prepaids and other assets | | | 136,265 | | | | 39,257 | |
| | | | | | | | |
Total Assets | | | 907,486,864 | | | | 47,499,327 | |
| | | | | | | | |
Liabilities: | | | | | | | | |
Payable for shares redeemed | | | 23,726,099 | | | | 1,016 | |
Payable to advisor | | | 806,019 | | | | 16,043 | |
Payable for distribution and service fees | | | 61,543 | | | | 729 | |
Deferred tax liability | | | 191,701 | | | | — | |
Accrued expenses and other liabilities | | | 567,971 | | | | 46,780 | |
| | | | | | | | |
Total Liabilities | | | 25,353,333 | | | | 64,568 | |
| | | | | | | | |
Total Net Assets | | $ | 882,133,531 | | | $ | 47,434,759 | |
| | | | | | | | |
Net Assets Consist of: | |
Paid-in capital | | $ | 1,670,957,861 | | | $ | 47,573,885 | |
Total distributable earnings | | | (788,824,330 | ) | | | (139,126 | ) |
| | | | | | | | |
Total Net Assets | | $ | 882,133,531 | | | $ | 47,434,759 | |
| | | | | | | | |
Investments, At Cost | | | 933,610,439 | | | | 47,200,567 | |
| | |
Pricing of Shares | | | | | | | | |
Class A Shares: | | | | | | | | |
Net Assets | | $ | 86,551,862 | | | $ | 616,108 | |
Shares Outstanding | | | 13,602,632 | | | | 54,458 | |
Net Asset Value, Offering Price and Redemption Price | | $ | 6.36 | | | $ | 11.31 | |
Maximum offering price per share(a) | | $ | 6.73 | | | $ | 11.97 | |
Class C Shares: | | | | | | | | |
Net Assets | | $ | 44,247,332 | | | $ | 628,812 | |
Shares Outstanding | | | 7,001,493 | | | | 57,566 | |
Net Asset Value, Offering Price and Redemption Price | | $ | 6.32 | | | $ | 10.92 | |
Class F Shares: | | | | | | | | |
Net Assets | | | — | | | $ | 27,687,611 | |
Shares Outstanding | | | — | | | | 2,391,682 | |
Net Asset Value, Offering Price and Redemption Price | | $ | — | | | $ | 11.58 | |
Class I Shares: | | | | | | | | |
Net Assets | | $ | 730,427,058 | | | $ | 18,502,228 | |
Shares Outstanding | | | 115,178,519 | | | | 1,620,988 | |
Net Asset Value, Offering Price and Redemption Price | | $ | 6.34 | | | $ | 11.41 | |
Class R6 Shares: | | | | | | | | |
Net Assets | | $ | 20,907,279 | | | | — | |
Shares Outstanding | | | 3,295,737 | | | | — | |
Net Asset Value, Offering Price and Redemption Price | | $ | 6.34 | | | $ | — | |
(a) Maximum offering price per share (NAV/0.9450, based on maximum sales charge of 5.50% of the offering price).
| | | | |
| See accompanying Notes to Financial Statements. | | 20 | | |
Statements of Operations
For the Year Ended December 31, 2018
| | | | | | | | |
| | | Salient
MLP & Energy
Infrastructure
Fund | | | Salient
Tactical
Plus Fund | |
Investment Income: | |
Distributions from master limited partnerships | | $ | 23,322,909 | | | $ | — | |
Less return of capital on distributions | | | (23,322,909 | ) | | | — | |
| | | | | | | | |
Net investment income from master limited partnerships | | | — | | | | — | |
Dividends from master limited partnership related companies | | | 49,052,191 | | | | — | |
Less return of capital on dividends | | | (20,723,278 | ) | | | — | |
| | | | | | | | |
Net investment income from master limited partnership related companies | | | 28,328,913 | | | | — | |
Interest | | | 40,250 | | | | 11,286 | |
Dividends | | | — | | | | 641,880 | |
Foreign taxes withheld | | | (1,466,016 | ) | | | — | |
| | | | | | | | |
Total Investment Income | | | 26,903,147 | | | | 653,166 | |
| | | | | | | | |
Expenses: | |
Investment advisory fee | | | 11,690,197 | | | | 547,098 | |
Administration fees and expenses | | | 788,670 | | | | 31,464 | |
Distribution and service fees | | | | | | | | |
Class A | | | 333,143 | | | | 15,628 | |
Class C | | | 624,638 | | | | 8,065 | |
Administrative services fees | | | | | | | | |
Class A | | | 78,640 | | | | 6,217 | |
Class C | | | 40,511 | | | | 255 | |
Class I | | | 811,198 | | | | 7,556 | |
Class F | | | — | | | | 21,355 | |
Registration/filing fees | | | 134,164 | | | | 46,312 | |
Transfer agent fees and expenses | | | 114,535 | | | | 33,301 | |
Audit and tax preparation fee | | | 192,980 | | | | 43,006 | |
Custodian fee | | | 82,366 | | | | 5,105 | |
Legal fee | | | 315,967 | | | | 15,324 | |
Reports to shareholder and printing fees | | | 157,412 | | | | 7,731 | |
Compliance fees | | | 176,999 | | | | 5,389 | |
Trustees’ fees and expenses | | | 117,466 | | | | 99,436 | |
ReFlow fees (Note 2(o)) | | | 71,078 | | | | — | |
Other expenses | | | 263,171 | | | | 20,126 | |
| | | | | | | | |
Total expenses before waivers | | | 15,993,135 | | | | 913,368 | |
| | | | | | | | |
Less fees waived/reimbursed by investment advisor (See Note 4) | | | — | | | | (429,651 | ) |
| | | | | | | | |
Total Expenses | | | 15,993,135 | | | | 483,717 | |
| | | | | | | | |
| Net Investment Income | | | 10,910,012 | | | | 169,449 | |
| | | | | | | | |
| | | | |
| See accompanying Notes to Financial Statements. | | 21 | | |
Statements of Operations
For the Year Ended December 31, 2018
| | | | | | | | |
| | | Salient
MLP & Energy
Infrastructure
Fund
(continued) | | | Salient
Tactical
Plus Fund
(continued) | |
Realized and Unrealized Gain/(Loss): | | | | | | | | |
Net realized loss on investments and foreign currency translations | | $ | (199,872,805 | ) | | $ | (12,882 | ) |
Net realized gain/(loss) on written options | | | 2,359,375 | | | | (191,471 | ) |
Net realized gain on futures contracts | | | — | | | | 948,007 | |
Net realized loss on foreign currency | | | (114,157 | ) | | | — | |
| | | | | | | | |
Net realized gain(loss) | | | (197,627,587 | ) | | | 743,654 | |
Change in unrealized appreciation/depreciation on: | | | | | | | | |
Investments | | | (43,715,983 | ) | | | (92,182 | ) |
Written options | | | 293,374 | | | | — | |
Futures contracts | | | — | | | | 51,242 | |
Translation of assets and liabilities in foreign currency transactions | | | (1,175 | ) | | | — | |
| | | | | | | | |
Change in unrealized appreciation/depreciation, before income taxes | | | (43,423,784 | ) | | | (40,940 | ) |
Deferred tax expense/(benefit) | | | (762,034 | ) | | | — | |
| | | | | | | | |
Change in unrealized appreciation/depreciation | | | (42,661,750 | ) | | | (40,940 | ) |
| | | | | | | | |
Net Realized and Unrealized Gain/(Loss) on Investments, Written Options, Futures Contracts, and Foreign Currency Translations | | | (240,289,337 | ) | | | 702,714 | |
| | | | | | | | |
| Net Increase/(Decrease) in Net Assets Resulting From Operations | | $ | (229,379,325 | ) | | $ | 872,163 | |
| | | | | | | | |
| | | | |
| See accompanying Notes to Financial Statements. | | 22 | | |
Statements of Changes in Net Assets
| | | | | | | | | | | | | | | | |
| | | Salient MLP & Energy Infrastructure
Fund | | | Salient Tactical Plus Fund | |
| | | For the
Year Ended
December 31, 2018 | | | For the
Year Ended
December 31, 2017 | | | For the
Year Ended
December 31, 2018 | | | For the
Year Ended
December 31, 2017 | |
Operations: | |
Net investment income/(loss) | | $ | 10,910,012 | | | $ | 8,457,116 | | | $ | 169,449 | | | $ | (177,675 | ) |
Net realized gain/(loss) | | | (197,627,587 | ) | | | (78,609,555 | ) | | | 743,654 | | | | 2,545,610 | |
Net change in unrealized appreciation/depreciation | | | (42,661,750 | ) | | | (54,534,390 | ) | | | (40,940 | ) | | | 50,891 | |
| | | | | | | | | | | | | | | | |
Net increase/(decrease) in net assets resulting from operations | | | (229,379,325 | ) | | | (124,686,829 | ) | | | 872,163 | | | | 2,418,826 | |
| | | | | | | | | | | | | | | | |
Distributions to Shareholders: | | | | | | | | | | | | | | | | |
From distributable earnings(a) | | | | | | | | | | | | | | | | |
Class A | | | (1,242,868 | ) | | | (1,070,916 | ) | | | (18,204 | ) | | | (707,785 | ) |
Class C | | | (497,304 | ) | | | (371,902 | ) | | | (19,356 | ) | | | (73,153 | ) |
Class I | | | (9,661,641 | ) | | | (5,954,385 | ) | | | (516,333 | ) | | | (131,615 | ) |
Class F | | | — | | | | — | | | | (777,699 | ) | | | (1,466,962 | ) |
Class R6 | | | (236,685 | ) | | | (22,433 | ) | | | — | | | | — | |
From return of capital | | | | | | | | | | | | | | | | |
Class A | | | (5,564,471 | ) | | | (11,276,896 | ) | | | — | | | | — | |
Class C | | | (2,226,492 | ) | | | (3,916,186 | ) | | | — | | | | — | |
Class I | | | (43,256,358 | ) | | | (62,700,538 | ) | | | — | | | | — | |
Class R6 | | | (1,059,667 | ) | | | (236,223 | ) | | | — | | | | — | |
| | | | | | | | | | | | | | | | |
Total distributions | | | (63,745,486 | ) | | | (85,549,479 | ) | | | (1,331,592 | ) | | | (2,379,515 | ) |
| | | | | | | | | | | | | | | | |
Capital Transactions: | | | | | | | | | | | | | | | | |
Class A | | | | | | | | | | | | | | | | |
Proceeds from shares issued | | | 24,679,366 | | | | 106,910,246 | | | | 4,291,533 | | | | 2,532,597 | |
Dividends reinvested | | | 6,513,409 | | | | 11,708,040 | | | | 18,204 | | | | 707,786 | |
Value of shares redeemed | | | (72,209,337 | ) | | | (139,338,290 | ) | | | (12,511,224 | ) | | | (810,204 | ) |
| | | | | | | | | | | | | | | | |
Class A capital transactions | | | (41,016,562 | ) | | | (20,720,004 | ) | | | (8,201,487 | ) | | | 2,430,179 | |
| | | | | | | | | | | | | | | | |
Class C | | | | | | | | | | | | | | | | |
Proceeds from shares issued | | | 6,010,422 | | | | 12,776,002 | | | | 80,411 | | | | 458,829 | |
Dividends reinvested | | | 2,664,656 | | | | 4,200,846 | | | | 19,356 | | | | 58,752 | |
Value of shares redeemed | | | (24,624,527 | ) | | | (29,195,344 | ) | | | (332,935 | ) | | | (212,005 | ) |
| | | | | | | | | | | | | | | | |
Class C capital transactions | | | (15,949,449 | ) | | | (12,218,496 | ) | | | (233,168 | ) | | | 305,576 | |
| | | | | | | | | | | | | | | | |
Class I | | | | | | | | | | | | | | | | |
Proceeds from shares issued | | | 568,587,881 | | | | 601,926,916 | | | | 18,436,249 | | | | 2,495,210 | |
Dividends reinvested | | | 44,716,862 | | | | 62,166,440 | | | | 516,333 | | | | 131,615 | |
Value of shares redeemed | | | (709,746,778 | ) | | | (647,999,371 | ) | | | (2,491,645 | ) | | | (2,331,552 | ) |
| | | | | | | | | | | | | | | | |
Class I capital transactions | | | (96,442,035 | ) | | | 16,093,985 | | | | 16,460,937 | | | | 295,273 | |
| | | | | | | | | | | | | | | | |
Class F | | | | | | | | | | | | | | | | |
Proceeds from shares issued | | | — | | | | — | | | | 10,138,469 | | | | 2,038,961 | |
Dividends reinvested | | | — | | | | — | | | | 777,699 | | | | 1,465,380 | |
Value of shares redeemed | | | — | | | | — | | | | (1,533,374 | ) | | | (2,097,754 | ) |
| | | | | | | | | | | | | | | | |
Class F capital transactions | | | — | | | | — | | | | 9,382,794 | | | | 1,406,587 | |
| | | | | | | | | | | | | | | | |
| | | | |
| See accompanying Notes to Financial Statements. | | 23 | | |
Statements of Changes in Net Assets
| | | | | | | | | | | | | | | | |
| | | Salient MLP & Energy Infrastructure
Fund (continued) | | | Salient Tactical Plus Fund (continued) | |
| | | For the
Year Ended
December 31, 2018 | | | For the
Year Ended
December 31, 2017 | | | For the
Year Ended
December 31, 2018 | | | For the
Year Ended
December 31, 2017 | |
Class R6 | | | | | | | | | | | | | | | | |
Proceeds from shares issued | | $ | 16,634,736 | | | $ | 9,935,371 | | | $ | — | | | $ | — | |
Dividends reinvested | | | 621,540 | | | | 258,656 | | | | — | | | | — | |
Value of shares redeemed | | | (1,190,931 | ) | | | (620,801 | ) | | | — | | | | — | |
| | | | | | | | | | | | | | | | |
Class R6 capital transactions | | | 16,065,345 | | | | 9,573,226 | | | | — | | | | — | |
| | | | | | | | | | | | | | | | |
Change in Net Assets resulting from capital transactions | | | (137,342,701 | ) | | | (7,271,289 | ) | | | 17,409,076 | | | | 4,437,615 | |
| | | | | | | | | | | | | | | | |
Change in Net Assets | | $ | (430,467,512 | ) | | $ | (217,507,597 | ) | | $ | 16,949,647 | | | $ | 4,476,926 | |
Net Assets: | |
Beginning of period | | $ | 1,312,601,043 | | | $ | 1,530,108,640 | | | $ | 30,485,112 | | | $ | 26,008,186 | |
| | | | | | | | | | | | | | | | |
End of period | | $ | 882,133,531 | | | | $1,312,601,043(b) | | | $ | 47,434,759 | | | | $30,485,112(c) | |
| | | | | | | | | | | | | | | | |
Changes in shares outstanding: | | | | | | | | | | | | | | | | |
Class A | | | | | | | | | | | | | | | | |
Sold | | | 3,204,814 | | | | 12,356,640 | | | | 368,100 | | | | 219,233 | |
Distributions reinvested | | | 851,739 | | | | 1,414,348 | | | | 1,610 | | | | 62,196 | |
Redeemed | | | (9,708,707 | ) | | | (17,141,946 | ) | | | (1,092,268 | ) | | | (69,557 | ) |
| | | | | | | | | | | | | | | | |
Net increase/(decrease) in shares outstanding | | | (5,652,154 | ) | | | (3,370,958 | ) | | | (722,558 | ) | | | 211,872 | |
| | | | | | | | | | | | | | | | |
Class C | | | | | | | | | | | | | | | | |
Sold | | | 790,909 | | | | 1,531,542 | | | | 7,212 | | | | 40,087 | |
Distributions reinvested | | | 350,552 | | | | 508,013 | | | | 1,773 | | | | 5,303 | |
Redeemed | | | (3,352,113 | ) | | | (3,531,377 | ) | | | (29,645 | ) | | | (18,837 | ) |
| | | | | | | | | | | | | | | | |
Net increase/(decrease) in shares outstanding | | | (2,210,652 | ) | | | (1,491,822 | ) | | | (20,660 | ) | | | 26,553 | |
| | | | | | | | | | | | | | | | |
Class I | | | | | | | | | | | | | | | | |
Sold | | | 76,205,353 | | | | 71,384,895 | | | | 1,593,819 | | | | 215,929 | |
Distributions reinvested | | | 5,877,576 | | | | 7,537,540 | | | | 45,253 | | | | 11,495 | |
Redeemed | | | (98,106,630 | ) | | | (78,973,063 | ) | | | (214,027 | ) | | | (197,312 | ) |
| | | | | | | | | | | | | | | | |
Net increase/(decrease) in shares outstanding | | | (16,023,701 | ) | | | (50,628 | ) | | | 1,425,045 | | | | 30,112 | |
| | | | | | | | | | | | | | | | |
Class F | | | | | | | | | | | | | | | | |
Sold | | | — | | | | — | | | | 858,240 | | | | 174,512 | |
Distributions reinvested | | | — | | | | — | | | | 67,217 | | | | 126,544 | |
Redeemed | | | — | | | | — | | | | (129,657 | ) | | | (178,860 | ) |
| | | | | | | | | | | | | | | | |
Net increase in shares outstanding | | | — | | | | — | | | | 795,800 | | | | 122,196 | |
| | | | | | | | | | | | | | | | |
Class R6 | | | | | | | | | | | | | | | | |
Sold | | | 1,985,150 | | | | 1,184,329 | | | | — | | | | — | |
Distributions reinvested | | | 81,860 | | | | 33,020 | | | | — | | | | — | |
Redeemed | | | (156,118 | ) | | | (74,753 | ) | | | — | | | | — | |
| | | | | | | | | | | | | | | | |
Net increase in shares outstanding | | | 1,910,892 | | | | 1,142,596 | | | | — | | | | — | |
| | | | | | | | | | | | | | | | |
(a) For the year ended December 31, 2017, for the Salient MLP & Energy Infrastructure Fund and Salient Tactical Plus Fund total distributions from distributable earnings consisted of distributions from net investment income of $7,419,636 and $—, respectively and net realized gains of $— and $2,379,515, respectively.
(b) For the prior year ended December 31, 2017, included accumulated net investment loss of $110,290,288.
(c) For the prior year ended December 31, 2017, included accumulated net investment loss of $177,674.
| | | | |
| See accompanying Notes to Financial Statements. | | 24 | | |
Financial Highlights
For a share outstanding throughout the periods presented.
Salient MLP & Energy Infrastructure Fund
| | | | | | | | | | | | | | | | | | | | |
| | | Class A | |
| | | Year Ended
December 31,
2018 | | | Year Ended
December 31,
2017 | | | Year Ended
December 31,
2016(a) | | | Year Ended
December 31,
2015 | | | Year Ended
December 31,
2014(b) | |
Net Asset Value, Beginning of Period | | $ | 8.18 | | | $ | 9.31 | | | $ | 7.08 | | | $ | 13.31 | | | $ | 12.77 | |
Income/(Loss) from Operations: | | | | | | | | | | | | | | | | | | | | |
Net investment income(c) | | | 0.06 | | | | 0.04 | | | | 0.08 | | | | 0.11 | | | | 0.05 | |
Net realized and unrealized gain/(loss) on investments | | | (1.50 | ) | | | (0.69 | ) | | | 2.71 | | | | (5.76 | ) | | | 1.03 | |
| | | | | | | | | | | | | | | | | | | | |
Total from Investment Operations | | | (1.44 | ) | | | (0.65 | ) | | | 2.79 | | | | (5.65 | ) | | | 1.08 | |
| | | | | | | | | | | | | | | | | | | | |
Less Distributions: | | | | | | | | | | | | | | | | | | | | |
From investment income | | | (0.07 | ) | | | (0.04 | ) | | | (0.19 | ) | | | (0.17 | ) | | | (0.10 | ) |
From return of capital | | | (0.31 | ) | | | (0.44 | ) | | | (0.37 | ) | | | (0.41 | ) | | | (0.44 | ) |
| | | | | | | | | | | | | | | | | | | | |
Total Distributions | | | (0.38 | ) | | | (0.48 | ) | | | (0.56 | ) | | | (0.58 | ) | | | (0.54 | ) |
| | | | | | | | | | | | | | | | | | | | |
Net increase/(decrease) in Net Asset Value | | | (1.82 | ) | | | (1.13 | ) | | | 2.23 | | | | (6.23 | ) | | | 0.54 | |
| | | | | | | | | | | | | | | | | | | | |
Net Asset Value, End of Period | | $ | 6.36 | | | $ | 8.18 | | | $ | 9.31 | | | $ | 7.08 | | | $ | 13.31 | |
| | | | | | | | | | | | | | | | | | | | |
Total Return(d) | | | (18.33 | )% | | | (6.92 | )% | | | 41.90 | % | | | (44.10 | )% | | | 8.35 | % |
Ratios/Supplemental Data: | | | | | | | | | | | | | | | | | | | | |
Net Assets, End of Period (000s) | | $ | 86,552 | | | $ | 157,413 | | | $ | 210,688 | | | $ | 127,069 | | | $ | 177,820 | |
Ratios to Average Net Assets: | | | | | | | | | | | | | | | | | | | | |
Gross expenses (including tax expense/benefit) | | | 1.40 | % | | | 1.38 | % | | | 1.51 | % | | | 1.28 | % | | | 1.59 | %(e) |
Net expenses (including tax expense/benefit) | | | 1.40 | % | | | 1.38 | % | | | 1.51 | % | | | 1.28 | % | | | 1.65 | % |
Net expenses (excluding tax expense/benefit) | | | 1.46 | % | | | 1.43 | % | | | 1.44 | % | | | 1.45 | % | | | 1.48 | % |
Net investment income | | | 0.77 | % | | | 0.49 | % | | | 0.98 | % | | | 1.02 | % | | | 0.36 | % |
Portfolio Turnover Rate(f) | | | 48 | % | | | 32 | % | | | 23 | % | | | 39 | % | | | 19 | % |
(a) Prior to May 1, 2016, Salient MLP & Energy Infrastructure Fund was known as Salient MLP & Energy Infrastructure Fund II.
(b) Presented on a consolidated basis.
(c) Calculated based on average shares outstanding.
(d) Total return calculations do not include any sales or redemption charges.
(e) The gross operating expenses are the expenses before reimbursement to Salient MLP & Energy Infrastructure Fund or recoupment by the Advisor.
(f) Portfolio turnover rate is calculated on the basis of the Fund as a whole without distinguishing between the classes of shares issued.
| | | | |
| See accompanying Notes to Financial Statements. | | 25 | | |
Financial Highlights
For a share outstanding throughout the periods presented.
Salient MLP & Energy Infrastructure Fund
| | | | | | | | | | | | | | | | | | | | |
| | | Class C | |
| | | Year Ended
December 31,
2018 | | | Year Ended
December 31,
2017 | | | Year Ended
December 31,
2016(a) | | | Year Ended
December 31,
2015 | | | Year Ended
December 31,
2014(b) | |
Net Asset Value, Beginning of Period | | $ | 8.13 | | | $ | 9.26 | | | $ | 7.04 | | | $ | 13.23 | | | $ | 12.72 | |
Income/(Loss) from Operations: | | | | | | | | | | | | | | | | | | | | |
Net investment income/(loss)(c) | | | (0.00 | )(d) | | | (0.03 | )(d) | | | 0.02 | | | | 0.03 | | | | (0.05 | ) |
Net realized and unrealized gain/(loss) on investments | | | (1.49 | ) | | | (0.68 | ) | | | 2.69 | | | | (5.73 | ) | | | 1.02 | |
| | | | | | | | | | | | | | | | | | | | |
Total from Investment Operations | | | (1.49 | ) | | | (0.71 | ) | | | 2.71 | | | | (5.70 | ) | | | 0.97 | |
| | | | | | | | | | | | | | | | | | | | |
Less Distributions: | | | | | | | | | | | | | | | | | | | | |
From investment income | | | (0.06 | ) | | | (0.04 | ) | | | (0.16 | ) | | | (0.08 | ) | | | (0.08 | ) |
From return of capital | | | (0.26 | ) | | | (0.38 | ) | | | (0.33 | ) | | | (0.41 | ) | | | (0.38 | ) |
| | | | | | | | | | | | | | | | | | | | |
Total Distributions | | | (0.32 | ) | | | (0.42 | ) | | | (0.49 | ) | | | (0.49 | ) | | | (0.46 | ) |
| | | | | | | | | | | | | | | | | | | | |
Net increase/(decrease) in Net Asset Value | | | (1.81 | ) | | | (1.13 | ) | | | 2.22 | | | | (6.19 | ) | | | 0.51 | |
| | | | | | | | | | | | | | | | | | | | |
Net Asset Value, End of Period | | $ | 6.32 | | | $ | 8.13 | | | $ | 9.26 | | | $ | 7.04 | | | $ | 13.23 | |
| | | | | | | | | | | | | | | | | | | | |
Total Return(e) | | | (18.89 | )% | | | (7.68 | )% | | | 40.66 | % | | | (44.50 | )% | | | 7.53 | % |
Ratios/Supplemental Data: | | | | | | | | | | | | | | | | | | | | |
Net Assets, End of Period (000s) | | $ | 44,247 | | | $ | 74,862 | | | $ | 99,130 | | | $ | 78,112 | | | $ | 147,885 | |
Ratios to Average Net Assets: | | | | | | | | | | | | | | | | | | | | |
Gross expenses (including tax expense/benefit) | | | 2.15 | % | | | 2.17 | % | | | 2.30 | % | | | 2.06 | % | | | 2.34 | %(f) |
Net expenses (including tax expense/benefit) | | | 2.15 | % | | | 2.17 | % | | | 2.30 | % | | | 2.06 | % | | | 2.40 | % |
Net expenses (excluding tax expense/benefit) | | | 2.21 | % | | | 2.22 | % | | | 2.23 | % | | | 2.20 | % | | | 2.23 | % |
Net investment income/(loss) | | | (0.01 | )% | | | (0.33 | )% | | | 0.22 | % | | | 0.29 | % | | | (0.39 | )% |
Portfolio Turnover Rate(g) | | | 48 | % | | | 32 | % | | | 23 | % | | | 39 | % | | | 19 | % |
(a) Prior to May 1, 2016, Salient MLP & Energy Infrastructure Fund was known as Salient MLP & Energy Infrastructure Fund II.
(b) Presented on a consolidated basis.
(c) Calculated based on average shares outstanding.
(d) The amount shown for a share outstanding throughout the period may not correlate with the Statement of Operations for the period due to the timing of sales and redemptions of Fund shares in relation to income earned and/or fluctuating market value of the investments of the Fund.
(e) Total return calculations do not include any sales or redemption charges.
(f) The gross operating expenses are the expenses before reimbursement to Salient MLP & Energy Infrastructure Fund or recoupment by the Advisor.
(g) Portfolio turnover rate is calculated on the basis of the Fund as a whole without distinguishing between the classes of shares issued.
| | | | |
| See accompanying Notes to Financial Statements. | | 26 | | |
Financial Highlights
For a share outstanding throughout the periods presented.
Salient MLP & Energy Infrastructure Fund
| | | | | | | | | | | | | | | | | | | | |
| | | Class I | |
| | | Year Ended
December 31,
2018 | | | Year Ended
December 31,
2017 | | | Year Ended
December 31,
2016(a) | | | Year Ended
December 31,
2015 | | | Year Ended
December 31,
2014(b) | |
Net Asset Value, Beginning of Period | | $ | 8.15 | | | $ | 9.28 | | | $ | 7.07 | | | $ | 13.29 | | | $ | 12.76 | |
Income/(Loss) from Operations: | | | | | | | | | | | | | | | | | | | | |
Net investment income(c) | | | 0.07 | | | | 0.06 | | | | 0.08 | | | | 0.15 | | | | 0.09 | |
Net realized and unrealized gain/(loss) on investments | | | (1.49 | ) | | | (0.69 | ) | | | 2.72 | | | | (5.76 | ) | | | 1.02 | |
| | | | | | | | | | | | | | | | | | | | |
Total from Investment Operations | | | (1.42 | ) | | | (0.63 | ) | | | 2.80 | | | | (5.61 | ) | | | 1.11 | |
| | | | | | | | | | | | | | | | | | | | |
Less Distributions: | | | | | | | | | | | | | | | | | | | | |
From investment income | | | (0.07 | ) | | | (0.04 | ) | | | (0.20 | ) | | | (0.20 | ) | | | (0.11 | ) |
From return of capital | | | (0.32 | ) | | | (0.46 | ) | | | (0.39 | ) | | | (0.41 | ) | | | (0.47 | ) |
| | | | | | | | | | | | | | | | | | | | |
Total Distributions | | | (0.39 | ) | | | (0.50 | ) | | | (0.59 | ) | | | (0.61 | ) | | | (0.58 | ) |
| | | | | | | | | | | | | | | | | | | | |
Net increase/(decrease) in Net Asset Value | | | (1.81 | ) | | | (1.13 | ) | | | 2.21 | | | | (6.22 | ) | | | 0.53 | |
| | | | | | | | | | | | | | | | | | | | |
Net Asset Value, End of Period | | $ | 6.34 | | | $ | 8.15 | | | $ | 9.28 | | | $ | 7.07 | | | $ | 13.29 | |
| | | | | | | | | | | | | | | | | | | | |
Total Return | | | (18.10 | )% | | | (6.77 | )% | | | 42.08 | % | | | (43.95 | )% | | | 8.56 | % |
Ratios/Supplemental Data: | | | | | | | | | | | | | | | | | | | | |
Net Assets, End of Period (000s) | | $ | 730,427 | | | $ | 1,069,037 | | | $ | 1,218,042 | | | $ | 688,832 | | | $ | 1,149,509 | |
Ratios to Average Net Assets: | | | | | | | | | | | | | | | | | | | | |
Gross expenses (including tax expense/benefit) | | | 1.17 | % | | | 1.17 | % | | | 1.33 | % | | | 1.04 | % | | | 1.34 | %(d) |
Net expenses (including tax expense/benefit) | | | 1.17 | % | | | 1.17 | % | | | 1.33 | % | | | 1.04 | % | | | 1.40 | % |
Net expenses (excluding tax expense/benefit) | | | 1.23 | % | | | 1.22 | % | | | 1.26 | % | | | 1.20 | % | | | 1.23 | % |
Net investment income | | | 0.95 | % | | | 0.65 | % | | | 1.03 | % | | | 1.31 | % | | | 0.61 | % |
Portfolio Turnover Rate(e) | | | 48 | % | | | 32 | % | | | 23 | % | | | 39 | % | | | 19 | % |
(a) Prior to May 1, 2016, Salient MLP & Energy Infrastructure Fund was known as Salient MLP & Energy Infrastructure Fund II.
(b) Presented on a consolidated basis.
(c) Calculated based on average shares outstanding.
(d) The gross operating expenses are the expenses before reimbursement to Salient MLP & Energy Infrastructure Fund or recoupment by the Advisor.
(e) Portfolio turnover rate is calculated on the basis of the Fund as a whole without distinguishing between the classes of shares issued.
| | | | |
| See accompanying Notes to Financial Statements. | | 27 | | |
Financial Highlights
For a share outstanding throughout the periods presented.
Salient MLP & Energy Infrastructure Fund
| | | | | | | | | | | | |
| | | Class R6 | |
| | | Year Ended
December 31,
2018 | | | Year Ended
December 31,
2017 | | | Period ended
December 31,
2016(a)(b) | |
Net Asset Value, Beginning of Period | | $ | 8.15 | | | $ | 9.28 | | | $ | 7.12 | |
Income/(Loss) from Operations: | | | | | | | | | | | | |
Net investment income(c) | | | 0.09 | | | | 0.10 | | | | 0.01 | |
Net realized and unrealized gain/(loss) on investments | | | (1.50 | ) | | | (0.73 | ) | | | 2.74 | |
| | | | | | | | | | | | |
Total from Investment Operations | | | (1.41 | ) | | | (0.63 | ) | | | 2.75 | |
| | | | | | | | | | | | |
Less Distributions: | | | | | | | | | | | | |
From investment income | | | (0.07 | ) | | | (0.04 | ) | | | (0.20 | ) |
From return of capital | | | (0.33 | ) | | | (0.46 | ) | | | (0.39 | ) |
| | | | | | | | | | | | |
Total Distributions | | | (0.40 | ) | | | (0.50 | ) | | | (0.59 | ) |
| | | | | | | | | | | | |
Net increase/(decrease) in Net Asset Value | | | (1.81 | ) | | | (1.13 | ) | | | 2.16 | |
| | | | | | | | | | | | |
Net Asset Value, End of Period | | $ | 6.34 | | | $ | 8.15 | | | $ | 9.28 | |
| | | | | | | | | | | | |
Total Return(d) | | | (18.04 | )% | | | (6.70 | )% | | | 41.16 | % |
Ratios/Supplemental Data: | | | | | | | | | | | | |
Net Assets, End of Period (000s) | | $ | 20,907 | | | $ | 11,290 | | | $ | 2,249 | |
Ratios to Average Net Assets: | | | | | | | | | | | | |
Gross expenses (including tax expense/benefit)(e) | | | 1.09 | % | | | 1.10 | % | | | 1.20 | % |
Net expenses (including tax expense/benefit)(e) | | | 1.09 | % | | | 1.10 | % | | | 1.20 | % |
Net expenses (excluding tax expense/benefit)(e) | | | 1.15 | % | | | 1.15 | % | | | 1.13 | % |
Net investment income(e) | | | 1.24 | % | | | 1.19 | % | | | 0.11 | % |
Portfolio Turnover Rate(f) | | | 48 | % | | | 32 | % | | | 23 | % |
(a) Commenced operations on January 4, 2016.
(b) Prior to May 1, 2016, Salient MLP & Energy Infrastructure Fund was known as Salient MLP & Energy Infrastructure Fund II.
(c) Calculated based on average shares outstanding.
(d) Not annualized for periods less than one year.
(e) Annualized for periods less than one year.
(f) Portfolio turnover rate is calculated on the basis of the Fund as a whole without distinguishing between the classes of shares issued. It is not annualized for periods less than one year.
| | | | |
| See accompanying Notes to Financial Statements. | | 28 | | |
Financial Highlights
For a share outstanding throughout the periods presented.
Salient Tactical Plus Fund
| | | | | | | | | | | | | | | | | | | | |
| | | Class A | |
| | | Year Ended
December 31,
2018 | | | Year Ended
December 31,
2017 | | | Year Ended
December 31,
2016(a) | | | Year Ended
December 31,
2015 | | | Period ended
December 31,
2014(b) | |
Net Asset Value, Beginning of Period | | $ | 11.40 | | | $ | 11.45 | | | $ | 11.30 | | | $ | 11.86 | | | $ | 12.29 | |
Income/(Loss) from Operations: | | | | | | | | | | | | | | | | | | | | |
Net investment income/(loss)(c) | | | (0.02 | )(d) | | | (0.11 | ) | | | (0.18 | ) | | | (0.22 | ) | | | 0.04 | |
Net realized and unrealized gain/(loss) on investments | | | 0.28 | | | | 1.06 | | | | 0.81 | | | | (0.09 | ) | | | (0.29 | ) |
| | | | | | | | | | | | | | | | | | | | |
Total from Investment Operations | | | 0.26 | | | | 0.95 | | | | 0.63 | | | | (0.31 | ) | | | (0.25 | ) |
| | | | | | | | | | | | | | | | | | | | |
Less Distributions: | | | | | | | | | | | | | | | | | | | | |
From investment income | | | (0.00 | )(e) | | | — | | | | — | | | | — | | | | — | |
From realized gain on investments | | | (0.35 | ) | | | (1.00 | ) | | | (0.48 | ) | | | (0.25 | ) | | | (0.18 | ) |
| | | | | | | | | | | | | | | | | | | | |
Total Distributions | | | (0.35 | ) | | | (1.00 | ) | | | (0.48 | ) | | | (0.25 | ) | | | (0.18 | ) |
| | | | | | | | | | | | | | | | | | | | |
Net increase/(decrease) in Net Asset Value | | | (0.09 | ) | | | (0.05 | ) | | | 0.15 | | | | (0.56 | ) | | | (0.43 | ) |
| | | | | | | | | | | | | | | | | | | | |
Net Asset Value, End of Period | | $ | 11.31 | | | $ | 11.40 | | | $ | 11.45 | | | $ | 11.30 | | | $ | 11.86 | |
| | | | | | | | | | | | | | | | | | | | |
Total Return(f) | | | 2.29 | % | | | 8.31 | % | | | 5.58 | % | | | (2.59 | )% | | | (2.06 | )% |
Ratios/Supplemental Data: | | | | | | | | | | | | | | | | | | | | |
Net Assets, End of Period (000s) | | $ | 616 | | | $ | 8,858 | | | $ | 6,471 | | | $ | 3,489 | | | $ | 3 | |
Ratios to Average Net Assets: | | | | | | | | | | | | | | | | | | | | |
Gross expenses(g) | | | 2.72 | % | | | 2.91 | % | | | 3.12 | % | | | 4.04 | % | | | 519.72 | % |
Net expenses(g)(h) | | | 1.65 | %(i) | | | 2.05 | % | | | 2.05 | % | | | 2.05 | % | | | 2.05 | % |
Net investment income/(loss)(g) | | | (0.15 | )% | | | (0.96 | )% | | | (1.65 | )% | | | (1.93 | )% | | | 6.90 | % |
Portfolio Turnover Rate(j) | | | 5,067 | % | | | 3,584 | % | | | 4,668 | % | | | 146 | % | | | 0 | % |
(a) Prior to May 1, 2016, Salient Tactical Plus Fund was known as Salient Broadmark Tactical Plus Fund.
(b) Commencement of operations of Salient Broadmark Tactical Plus Fund is December 15, 2014. Amounts from December 1, 2014 through December 14, 2014 reflect the operations of the predecessor Broadmark Tactical Plus Fund.
(c) Calculated based on average shares outstanding.
(d) The amount shown for a share outstanding throughout the period may not correlate with the Statement of Operations for the period due to the timing of sales and redemptions of Fund shares in relation to income earned and/or fluctuating market value of the investments of the Fund.
(e) Represents less than $0.005 or $(0.005).
(f) Not annualized for periods less than one year. Total return calculations do not include any sales or redemption charges.
(g) Annualized for periods less than one year.
(h) The ratios presented include an investment advisor waiver. Without this waiver, the expense ratios would be higher.
(i) Effective February 1, 2018, the annual expense limitation rate changed from 2.05% to 1.65%.
(j) Portfolio turnover rate is calculated on the basis of the Fund as a whole without distinguishing between the classes of shares issued. It is not annualized for periods less than one year.
| | | | |
| See accompanying Notes to Financial Statements. | | 29 | | |
Financial Highlights
For a share outstanding throughout the periods presented.
Salient Tactical Plus Fund
| | | | | | | | | | | | | | | | | | | | |
| | | Class C | |
| | | Year Ended
December 31,
2018 | | | Year Ended
December 31,
2017 | | | Year Ended
December 31,
2016(a) | | | Year Ended
December 31,
2015 | | | Period ended
December 31,
2014(b) | |
Net Asset Value, Beginning of Period | | $ | 11.10 | | | $ | 11.26 | | | $ | 11.21 | | | $ | 11.86 | | | $ | 12.29 | |
Income/(Loss) from Operations: | | | | | | | | | | | | | | | | | | | | |
Net investment income/(loss)(c) | | | (0.08 | )(d) | | | (0.19 | ) | | | (0.26 | ) | | | (0.30 | ) | | | 0.03 | |
Net realized and unrealized gain/(loss) on investments | | | 0.25 | | | | 1.03 | | | | 0.79 | | | | (0.10 | ) | | | (0.28 | ) |
| | | | | | | | | | | | | | | | | | | | |
Total from Investment Operations | | | 0.17 | | | | 0.84 | | | | 0.53 | | | | (0.40 | ) | | | (0.25 | ) |
| | | | | | | | | | | | | | | | | | | | |
Less Distributions: | | | | | | | | | | | | | | | | | | | | |
From realized gain on investments | | | (0.35 | ) | | | (1.00 | ) | | | (0.48 | ) | | | (0.25 | ) | | | (0.18 | ) |
| | | | | | | | | | | | | | | | | | | | |
Total Distributions | | | (0.35 | ) | | | (1.00 | ) | | | (0.48 | ) | | | (0.25 | ) | | | (0.18 | ) |
| | | | | | | | | | | | | | | | | | | | |
Net increase/(decrease) in Net Asset Value | | | (0.18 | ) | | | (0.16 | ) | | | 0.05 | | | | (0.65 | ) | | | (0.43 | ) |
| | | | | | | | | | | | | | | | | | | | |
Net Asset Value, End of Period | | $ | 10.92 | | | $ | 11.10 | | | $ | 11.26 | | | $ | 11.21 | | | $ | 11.86 | |
| | | | | | | | | | | | | | | | | | | | |
Total Return(e) | | | 1.50 | % | | | 7.47 | % | | | 4.73 | % | | | (3.35 | )% | | | (2.06 | )% |
Ratios/Supplemental Data: | | | | | | | | | | | | | | | | | | | | |
Net Assets, End of Period (000s) | | $ | 629 | | | $ | 868 | | | $ | 582 | | | $ | 50 | | | $ | 3 | |
Ratios to Average Net Assets: | | | | | | | | | | | | | | | | | | | | |
Gross expenses(f) | | | 5.32 | % | | | 7.10 | % | | | 22.24 | % | | | 97.09 | % | | | 454.38 | % |
Net expenses(f)(g) | | | 2.40 | %(h) | | | 2.80 | % | | | 2.80 | % | | | 2.80 | % | | | 2.80 | % |
Net investment income/(loss)(f) | | | (0.72 | )% | | | (1.68 | )% | | | (2.40 | )% | | | (2.69 | )% | | | 6.03 | % |
Portfolio Turnover Rate(i) | | | 5,067 | % | | | 3,584 | % | | | 4,668 | % | | | 146 | % | | | 0 | % |
(a) Prior to May 1, 2016, Salient Tactical Plus Fund was known as Salient Broadmark Tactical Plus Fund.
(b) Commencement of operations of Salient Broadmark Tactical Plus Fund is December 15, 2014. Amounts from December 1, 2014 through December 14, 2014 reflect the operations of the predecessor Broadmark Tactical Plus Fund.
(c) Calculated based on average shares outstanding.
(d) The amount shown for a share outstanding throughout the period may not correlate with the Statement of Operations for the period due to the timing of sales and redemptions of Fund shares in relation to income earned and/or fluctuating market value of the investments of the Fund.
(e) Not annualized for periods less than one year. Total return calculations do not include any sales or redemption charges.
(f) Annualized for periods less than one year.
(g) The ratios presented include an investment advisor waiver. Without this waiver, the expense ratios would be higher.
(h) Effective February 1, 2018, the annual expense limitation rate change from 2.80% to 2.40%.
(i) Portfolio turnover rate is calculated on the basis of the Fund as a whole without distinguishing between the classes of shares issued. It is not annualized for periods less than one year.
| | | | |
| See accompanying Notes to Financial Statements. | | 30 | | |
Financial Highlights
For a share outstanding throughout the periods presented.
Salient Tactical Plus Fund
| | | | | | | | | | | | | | | | | | | | |
| | | Class I | |
| | | Year Ended
December 31,
2018 | | | Year Ended
December 31,
2017 | | | Year Ended
December 31,
2016(a) | | | Year Ended
December 31,
2015 | | | Period ended
December 31,
2014(b) | |
Net Asset Value, Beginning of Period | | $ | 11.47 | | | $ | 11.49 | | | $ | 11.32 | | | $ | 11.86 | | | $ | 12.29 | |
Income/(Loss) from Operations: | | | | | | | | | | | | | | | | | | | | |
Net investment income/(loss)(c) | | | 0.06 | | | | (0.09 | ) | | | (0.16 | ) | | | (0.19 | ) | | | 0.04 | |
Net realized and unrealized gain/(loss) on investments | | | 0.24 | | | | 1.07 | | | | 0.81 | | | | (0.10 | ) | | | (0.29 | ) |
| | | | | | | | | | | | | | | | | | | | |
Total from Investment Operations | | | 0.30 | | | | 0.98 | | | | 0.65 | | | | (0.29 | ) | | | (0.25 | ) |
| | | | | | | | | | | | | | | | | | | | |
Less Distributions: | | | | | | | | | | | | | | | | | | | | |
From investment income | | | (0.01 | ) | | | — | | | | — | | | | — | | | | — | |
From realized gain on investments | | | (0.35 | ) | | | (1.00 | ) | | | (0.48 | ) | | | (0.25 | ) | | | (0.18 | ) |
| | | | | | | | | | | | | | | | | | | | |
Total Distributions | | | (0.36 | ) | | | (1.00 | ) | | | (0.48 | ) | | | (0.25 | ) | | | (0.18 | ) |
| | | | | | | | | | | | | | | | | | | | |
Net increase/(decrease) in Net Asset Value | | | (0.06 | ) | | | (0.02 | ) | | | 0.17 | | | | (0.54 | ) | | | (0.43 | ) |
| | | | | | | | | | | | | | | | | | | | |
Net Asset Value, End of Period | | $ | 11.41 | | | $ | 11.47 | | | $ | 11.49 | | | $ | 11.32 | | | $ | 11.86 | |
| | | | | | | | | | | | | | | | | | | | |
Total Return(d) | | | 2.56 | % | | | 8.54 | % | | | 5.74 | % | | | (2.42 | )% | | | (2.06 | )% |
Ratios/Supplemental Data: | | | | | | | | | | | | | | | | | | | | |
Net Assets, End of Period (000s) | | $ | 18,502 | | | $ | 2,248 | | | $ | 1,905 | | | $ | 539 | | | $ | 503 | |
Ratios to Average Net Assets: | | | | | | | | | | | | | | | | | | | | |
Gross expenses(e) | | | 2.38 | % | | | 3.61 | % | | | 5.70 | % | | | 7.03 | % | | | 819.13 | % |
Net expenses(e)(f) | | | 1.40 | %(g) | | | 1.80 | % | | | 1.80 | % | | | 1.80 | % | | | 1.80 | % |
Net investment income/(loss)(e) | | | 0.51 | % | | | (0.78 | )% | | | (1.40 | )% | | | (1.71 | )% | | | 7.03 | % |
Portfolio Turnover Rate(h) | | | 5,067 | % | | | 3,584 | % | | | 4,668 | % | | | 146 | % | | | 0 | % |
(a) Prior to May 1, 2016, Salient Tactical Plus Fund was known as Salient Broadmark Tactical Plus Fund.
(b) Commencement of operations of Salient Broadmark Tactical Plus Fund is December 15, 2014. Amounts from December 1, 2014 through December 14, 2014 reflect the operations of the predecessor Broadmark Tactical Plus Fund.
(c) Calculated based on average shares outstanding.
(d) Not annualized for periods less than one year.
(e) Annualized for periods less than one year.
(f) The ratios presented include an investment advisor waiver. Without this waiver, the expense ratios would be higher.
(g) Effective February 1, 2018, the annual expense limitation rate changed from 1.80% to 1.40%.
(h) Portfolio turnover rate is calculated on the basis of the Fund as a whole without distinguishing between the classes of shares issued. It is not annualized for periods less than one year.
| | | | |
| See accompanying Notes to Financial Statements. | | 31 | | |
Financial Highlights
For a share outstanding throughout the periods presented.
Salient Tactical Plus Fund
| | | | | | | | | | | | | | | | | | | | | | | | |
| | | Class F | |
| | | Year Ended
December 31,
2018 | | | Year Ended
December 31,
2017 | | | Year Ended
December 31,
2016(a) | | | Year Ended
December 31,
2015 | | | Period Ended
December 31,
2014(b)(c) | | | Year Ended
November 30,
2014(c) | |
Net Asset Value, Beginning of Period | | $ | 11.60 | | | $ | 11.57 | | | $ | 11.37 | | | $ | 11.86 | | | $ | 12.29 | | | $ | 11.66 | |
Income/(Loss) from Operations: | | | | | | | | | | | | | | | | | | | | | | | | |
Net investment income/(loss)(d) | | | 0.07 | | | | (0.05 | ) | | | (0.12 | ) | | | (0.16 | ) | | | 0.04 | | | | (0.06 | ) |
Net realized and unrealized gain/(loss) on investments | | | 0.27 | | | | 1.08 | | | | 0.80 | | | | (0.08 | ) | | | (0.29 | ) | | | 1.03 | |
| | | | | | | | | | | | | | | | | | | | | | | | |
Total from Investment Operations | | | 0.34 | | | | 1.03 | | | | 0.68 | | | | (0.24 | ) | | | (0.25 | ) | | | 0.97 | |
| | | | | | | | | | | | | | | | | | | | | | | | |
Less Distributions: | | | | | | | | | | | | | | | | | | | | | | | | |
From investment income | | | (0.01 | ) | | | — | | | | — | | | | — | | | | — | | | | — | |
From realized gain on investments | | | (0.35 | ) | | | (1.00 | ) | | | (0.48 | ) | | | (0.25 | ) | | | (0.18 | ) | | | (0.34 | ) |
| | | | | | | | | | | | | | | | | | | | | | | | |
Total Distributions | | | (0.36 | ) | | | (1.00 | ) | | | (0.48 | ) | | | (0.25 | ) | | | (0.18 | ) | | | (0.34 | ) |
| | | | | | | | | | | | | | | | | | | | | | | | |
Net increase/(decrease) in Net Asset Value | | | (0.02 | ) | | | 0.03 | | | | 0.20 | | | | (0.49 | ) | | | (0.43 | ) | | | 0.63 | |
| | | | | | | | | | | | | | | | | | | | | | | | |
Net Asset Value, End of Period | | $ | 11.58 | | | $ | 11.60 | | | $ | 11.57 | | | $ | 11.37 | | | $ | 11.86 | | | $ | 12.29 | |
| | | | | | | | | | | | | | | | | | | | | | | | |
Total Return(e) | | | 2.91 | % | | | 8.91 | % | | | 5.98 | % | | | (2.00 | )% | | | (2.06 | )% | | | 8.53 | % |
Ratios/Supplemental Data: | | | | | | | | | | | | | | | | | | | | | | | | |
Net Assets, End of Period (000s) | | $ | 27,688 | | | $ | 18,511 | | | $ | 17,050 | | | $ | 16,495 | | | $ | 30,743 | | | $ | 17,779 | |
Ratios to Average Net Assets: | | | | | | | | | | | | | | | | | | | | | | | | |
Gross expenses(f) | | | 2.24 | % | | | 2.46 | % | | | 2.62 | % | | | 2.68 | % | | | 4.18 | % | | | 3.09 | % |
Net expenses(f)(g) | | | 1.09 | %(h) | | | 1.49 | % | | | 1.49 | % | | | 1.49 | % | | | 1.53 | % | | | 1.49 | % |
Net investment income/(loss)(f) | | | 0.63 | % | | | (0.42 | )% | | | (1.09 | )% | | | (1.40 | )% | | | 3.56 | % | | | (0.54 | )% |
Portfolio Turnover Rate(i) | | | 5,067 | % | | | 3,584 | % | | | 4,668 | % | | | 146 | % | | | 0 | % | | | 153 | % |
(a) Prior to May 1, 2016, Salient Tactical Plus Fund was known as Salient Broadmark Tactical Plus Fund.
(b) Commencement of operations of Salient Broadmark Tactical Plus Fund is December 15, 2014. Amounts from December 1, 2014 through December 14, 2014 reflect the operations of the predecessor Broadmark Tactical Plus Fund.
(c) The Institutional Class was part of the predecessor Broadmark Tactical Plus Fund and was reorganized into Class F on December 15, 2014.
(d) Calculated based on average shares outstanding.
(e) Not annualized for periods less than one year.
(f) Annualized for periods less than one year.
(g) The ratios presented include an investment advisor waiver. Without this waiver, the expense ratios would be higher.
(h) Effective February 1, 2018, the annual expense limitation rate changed from 1.49% to 1.09%.
(i) Portfolio turnover rate is calculated on the basis of the Fund as a whole without distinguishing between the classes of shares issued. It is not annualized for periods less than one year.
| | | | |
| See accompanying Notes to Financial Statements. | | 32 | | |
Notes to Financial Statements
December 31, 2018
1. ORGANIZATION
Salient MF Trust (the “Trust”) was organized on November 15, 2011 as a Delaware statutory trust registered under the Investment Company Act of 1940, as amended (the “1940 Act”), as anopen-end management investment company. As of December 31, 2018, the Trust is comprised of two funds. The accompanying financial statements are presented for the following funds (individually a “Fund” and collectively the “Funds”):
| | | | |
Fund | | Short Name | | Commencement of
Operations |
Salient MLP & Energy Infrastructure Fund | | MLP Energy Fund | | September 19, 2012 |
Salient Tactical Plus Fund | | Tactical Plus Fund | | December 15, 2014 |
MLP Energy Fund is classified asnon-diversified under the 1940 Act. Tactical Plus Fund is classified as diversified under the 1940 Act. The Funds are authorized to issue an unlimited number of shares of beneficial interest (“Shares”) with no par value. The Funds offer Class A, Class C, and Class I shares. Additionally, MLP Energy Fund offers R6 shares and Tactical Plus Fund offers Class F Shares. All classes of shares have identical rights to earnings, assets and voting privileges, except for class specific expenses, sales charges, distribution, and exclusive rights to vote on matters affecting only individual classes. Class A Shares have a maximum sales charge of 5.50% as a percentage of the offering price on investments of less than $1 million (no sales charge for investments of $1 million or more). Class A Shares and Class C Shares are subject to a maximum contingent deferred sales charge of 1.00% if redeemed less than one year after purchase. Class C Shares are offered without anyfront-end sales charge. No sales charges are assessed with respect to Class I Shares, Class F shares and Class R6 Shares of the Funds.
MLP Energy Fund’s investment objective is to maximize total return (capital appreciation and income) by investing primarily in securities of Master Limited Partnerships (“MLPs”) and Energy Infrastructure Companies. Tactical Plus Fund’s investment objective is to produce, in any market environment, above-average risk adjusted returns and less downside volatility than the S&P 500 Index by investing primarily in a diversified portfolio of instruments that provide exposure to U.S. andnon-U.S. equity securities. The board of trustees of the Trust (each member thereof a “Trustee” and, collectively, the “Board of Trustees” or the “Board”) is authorized to engage an investment advisor, and pursuant to the investment management agreements for each of the Funds (each, an “Investment Management Agreement” and collectively, the “Investment Management Agreements”), it has selected Salient
Advisors, LP (“Salient Advisor”) for Tactical Plus Fund and Salient Capital Advisors, LLC (“SCA”) for MLP Energy Fund to manage each Fund’s portfolio and operations. Salient Advisor is a Texas limited partnership that is registered as an investment advisor under the Investment Advisers Act of 1940, as amended (the “Advisers Act”), and the Commodity Futures Trading Commission (the “CFTC”) as a commodity pool operator and commodity trading advisor and is a member of the National Futures Association. SCA is a Texas limited liability company that is registered as an investment adviser under the Advisers Act and the CFTC as a commodity pool operator and commodity trading advisor and is a member of the National Futures Association. Under the Investment Management Agreements, Salient Advisor and SCA are responsible for the establishment of an investment committee (the “Investment Committee”), which is responsible for developing, implementing, and supervising the Funds’ investment programs subject to the ultimate supervision of the Board. Broadmark Asset Management LLC (the“Sub-Advisor”) serves as the subadvisor to Tactical Plus Fund.
MLP Energy Fund may have invested up to 25% of its total assets in Salient MLP & Energy Infrastructure Fund II, Inc. (the “MLP Subsidiary”). MLP Subsidiary, which was wholly-owned by MLP Energy Fund, and therefore consolidated in MLP Energy Fund’s consolidated financial statements, was organized under the laws of the state of Delaware and for federal income tax purposes as a Subchapter “C” corporation. MLP Subsidiary was formed on September 19, 2012, and had been consolidated since its formation until its liquidation in September 2014. MLP Energy Fund invested in MLP Subsidiary in order to gain additional exposure to equity or debt securities of various master limited partnerships. Where the context requires, the “MLP Energy Fund” includes both MLP Energy Fund and MLP Subsidiary. In July 2014, SCA made the decision to liquidate MLP Subsidiary and simultaneously transfer the investments held to MLP Energy Fund. The orderly liquidation was completed on September 2, 2014. As such, MLP Energy Fund is presented on an individual fund basis. See note 10 for additional tax disclosures related to the transfer of investments held by MLP Subsidiary to MLP Energy Fund.
2. SIGNIFICANT ACCOUNTING POLICIES
(a) BASIS OF ACCOUNTING
The accounting and reporting policies of the Funds conform with U.S. generally accepted accounting principles (“U.S. GAAP”). The financial statements have been prepared in conformity with U.S. GAAP, which requires management to make estimates and assumptions relating to
Notes to Financial Statements
December 31, 2018
the reported amounts of assets and liabilities, and the disclosure of contingent assets and liabilities at the date of the financial statements and the reported amounts of income and expenses during the reporting period. Actual results may differ from those estimates and such differences may be significant. Each Fund is an investment company and follows the investment company accounting and reporting guidance under Financial Accounting Standards Board (“FASB”) Accounting Standards Codification (“ASC”) Topic 946, “Financial Services-Investment Companies”.
(b) PORTFOLIO VALUATION
The Funds record their investments at fair value. Fair value is defined as the price that would be received to sell an asset or paid to transfer a liability in an orderly transaction between market participants at the measurement date. The valuation techniques used to determine fair value are further described below.
The Board has authorized Salient Advisor and SCA to each establish a valuation committee (the “Advisor Valuation Committee”), which includes representatives from each Fund’s investment advisor. The Advisor Valuation Committee’s function, subject to the oversight of the Board, is generally to review valuation methodologies, valuation determinations, and any information provided to the Advisor Valuation Committee by Salient Advisor, SCA, or ALPS Fund Services, Inc., the Funds’ independent administrator (the “Administrator”).
To the extent that the price of a security cannot be determined applying the methods described below, the Advisor Valuation Committee in conjunction with the Administrator will determine the price of the security pursuant to the fair value procedures approved by the Board.
Investments held by the Funds are valued as follows:
SECURITIES LISTED ON A SECURITIES EXCHANGE OROVER-THE-COUNTER EXCHANGES—In general, the Funds value these securities at their last sales price on the exchange orover-the-counter market or a market’s official closing price on the valuation date. If the security is listed on more than one exchange, the Funds use the price from the exchange that it considers to be the principal exchange on which the security is traded. If there have been no sales for that day on the exchange where the security is principally traded, then the price of the security will be valued at the mean between the closing “bid” and “ask” prices on the valuation date. If no bid or ask prices are quoted before closing, the security will be valued using the last
available sale price, or a price will be determined pursuant to the fair value procedures approved by the Board. As of the close of regular trading on the New York Stock Exchange (the “NYSE”), securities traded primarily on security exchanges outside the United States are valued at the last sale price on such exchanges on the valuation date, or if there is no sale on the valuation date, at the mean of the closing bid and ask prices. If no bid or ask prices are quoted before closing, the security will be valued using the last available sale price, or a price will be determined pursuant to the fair value procedures approved by the Board. If a security’s price is available from more than one exchange, the Funds use the exchange that is the primary market for the security. However, depending on the foreign market, closing prices may be up to 15 hours old when they are used to price a Fund’s shares, and the Fund may determine that certain closing prices do not reflect the fair value of the security. This determination will be based on review of a number of factors, including developments in foreign markets, the performance of U.S. securities markets, and the performance of instruments trading in U.S. markets that represent foreign securities and baskets of foreign securities. If the Advisor Valuation Committee determines that closing prices do not reflect the fair value of the securities, the Fund will adjust the previous closing prices in accordance with pricing procedures approved by the Board to reflect what the Advisor Valuation Committee believes to be the fair value of the securities as of the close of regular trading on the NYSE. The Funds may also fair value securities in other situations, for example, when a particular foreign market is closed but a Fund is open. For foreign equity securities and foreign equity futures contracts, each Fund uses an outside pricing service to provide it with closing market prices and information used for adjusting those prices.
PUBLICLY-TRADED EQUITY SECURITIES ACQUIRED IN A DIRECT PLACEMENT TRANSACTION—Such securities may be subject to restrictions on resale that can affect the security’s liquidity and fair value. Such securities that are convertible or otherwise will become freely tradable will be valued based on the market value of the freely tradable security less an applicable restriction discount. Generally, the discount will initially be equal to the discount at which the Fund purchased the securities and thereafter will be periodically reassessed and likely reduced over the anticipated restricted period.
Notes to Financial Statements
December 31, 2018
DERIVATIVES—Exchange traded futures contracts are valued using quoted closing prices from the national exchange on which they are principally traded. If no such price is reported by such exchange on the valuation date, the Advisor Valuation Committee will determine the fair value in good faith using information that is available at such time.
Forward currency contracts have a market value determined by the prevailing daily foreign currency exchange rates and current foreign currency exchange forward rates. The foreign currency exchange forward rates are calculated using an automated system that estimates rates on the basis of the current day foreign currency exchange rates and forward foreign currency exchange rates supplied by a pricing vendor. Foreign currency exchange rates and foreign currency exchange forward rates may generally be obtained at the close of the NYSE, normally 4:00 p.m. Eastern Time.
Options that are listed on a securities exchange are generally valued on the valuation date at the mean of the closing bid and ask price of the posted market on the exchange on which they are listed. If on the valuation date the primary exchange is closed, the prior day price will be used. If no such price is reported, the fair value of such options will be determined in good faith using industry standard pricing models utilizing publicly available input information on the valuation date.
Options traded on anover-the-counter market are generally valued using the mean of the closing bid and ask prices provided by an independent pricing service. If a quotation is not available from the independent pricing service, the price is obtained from a broker (typically the counterparty to the option) on the valuation date. If no such price is available on the valuation date, the Advisor Valuation Committee in conjunction with the Administrator will determine the fair value of such options in good faith using information that is available at such time.
SECURITIES NOT ACTIVELY TRADED—The value of securities, derivatives or synthetic securities that are not actively traded on an exchange are determined by obtaining quotes from brokers that normally deal in such securities or by an unaffiliated pricing service that may use actual trade data or procedures using market indices, matrices, yield curves, specific trading characteristics of certain groups of securities, pricing models or a combination of these procedures. Securities for which
independent pricing services are not available are valued pursuant to the valuation procedures approved by the Board.
OTHER—Investments inopen-end RICs that do not trade on an exchange are valued at the end of day NAV per share. Where no value is readily available from a RIC or other security, or where a value supplied by a RIC is deemed not to be indicative of the RIC’s value, the Advisor Valuation Committee, in consultation with the Administrator or the advisor, will determine, in good faith, the fair value of the RIC or other security. Investments in private placement securities and other securities for which market quotations are not readily available will be valued in good faith by using fair value procedures approved by the Board. Such fair value procedures may consider among other factors discounts to publicly traded issues, time until conversion date, securities with similar yields, quality, type of issue, coupon, duration and rating, and an analysis of the issuer’s financial statements and reports. If events occur that affect the value of the Funds’ securities before the net asset value has been calculated, the securities so affected will generally be priced using fair value procedures.
(c) SECURITIES TRANSACTIONS AND INVESTMENT INCOME
For financial statement purposes, security transactions are accounted for on a trade date basis. Accordingly, differences between the net asset values for financial statement purposes and for executing shareholders transactions may arise. Realized gains and losses on sales of securities are reported using the specific identification cost basis. Interest income, adjusted for accretion of discounts and amortization of premiums, is recognized on the accrual basis. Dividend income is recorded on theex-dividend date. Distributions received from a Fund’s investments in MLPs generally are composed of ordinary income, capital gains and return of capital from the MLP.
(d) FOREIGN CURRENCY TRANSLATION
The accounting records of the Funds are maintained in U.S. dollars. Foreign currency amounts and investments denominated in a foreign currency, if any, are translated into U.S. dollar amounts at current exchange rates on the valuation date. Purchases and sales of investments denominated in foreign currencies are translated into U.S. dollar amounts at the exchange rate on the respective dates of such transactions. The Funds do not isolate the portion of the results of operations resulting from changes in foreign exchange rates on investments from fluctuations arising from changes in market prices of securities held.
Notes to Financial Statements
December 31, 2018
Such fluctuations are included with the net realized and unrealized gain or loss from investments and foreign currency translations.
(e) MASTER LIMITED PARTNERSHIPS
Entities commonly referred to as MLPs are generally organized under state law as limited partnerships or limited liability companies. MLP Energy Fund invests in MLPs receiving partnership taxation treatment under the Internal Revenue Code of 1986, as amended (the “Code”), and whose interests or “units” are traded on securities exchanges like shares of corporate stock. To be treated as a partnership for U.S. federal income tax purposes, an MLP whose units are traded on a securities exchange must receive at least 90% of its income from qualifying sources such as interest, dividends, real property rents, gains on dispositions of real property, income and gains from mineral or natural resources activities, income and gains from the transportation or storage of certain fuels, and, in certain circumstances, income and gains from commodities or futures, forwards and options on commodities. Mineral or natural resources activities include exploration, development, production, processing, mining, refining, marketing and transportation (including pipelines) of oil and gas, minerals, geothermal energy, fertilizer, timber or industrial source carbon dioxide. An MLP consists of a general partner and limited partners (or in the case of MLPs organized as limited liability companies, a managing member and members).
The general partner or managing member typically controls the operations and management of the MLP and has an ownership stake in the partnership or limited liability company. The limited partners or members, through their ownership of limited partner or member interests, provide capital to the entity, are intended to have no role in the operation and management of the entity and receive cash distributions. MLP Energy Fund’s investments in MLPs consist only of limited partner or member interest ownership. The MLPs themselves generally do not pay U.S. federal income taxes. Thus, unlike investors in corporate securities, direct MLP investors are generally not subject to double taxation (i.e., corporate level tax and tax on corporate dividends). Currently, most MLPs operate in the energy and/or natural resources sector.
(f) RESTRICTED SECURITIES
MLP Energy Fund may invest up to 15% of its total assets in unregistered or otherwise restricted securities. A restricted security is a security which has been purchased through a private offering and cannot be resold to the general public without prior registration under the Securities Act of 1933 (the “1933 Act”) or pursuant to the resale
limitations provided by Rule 144 under the 1933 Act, or an exemption from the registration requirements of the 1933 Act. Certain restricted securities may be resold in transactions exempt from registration, normally to qualified institutional buyers.
As of December 31, 2018, MLP Energy Fund did not hold restricted securities.
(g) SHORT SALES
Certain Funds may sell securities short. Short sales are transactions in which a Fund sells a security that it does not own in anticipation of a decline in the value of that security. To complete such a transaction, a Fund must borrow the security to deliver to the buyer. The Fund is then obligated to replace the security borrowed by purchasing it in the open market at some later date. The Fund bears the risk of a loss if the market price of the security increases between the date of the short sale and the date on which the Fund replaces the borrowed security. The Fund will realize a gain if the security declines in value between those dates. There can be no assurance that securities necessary to cover a short position will be available for purchase. All short sales must be fully collateralized. The Fund maintains collateral consisting of cash, U.S. government securities or other liquid assets in an amount at least equal to the value of their respective short positions. The Fund is liable for any dividends or interest payable on securities while those securities are in a short position. No Funds held securities sold short as of December 31, 2018.
(h) DERIVATIVE INSTRUMENTS AND HEDGING ACTIVITIES
The Funds may invest in derivatives in order to meet their investment objectives. The risk in using derivatives varies depending upon the structure of the instruments. All open derivative positions atperiod-end are presented in the Funds’ Schedules of Investments. The following is a description of the derivative instruments the Funds utilize, including the primary underlying risk exposures related to each instrument type.
Futures:Tactical Plus Fund invests in futures contracts to gain exposure to, or hedge against, changes in the value of equities, commodities, interest rates or foreign currencies, or to gain exposure to momentum. A futures contract represents a commitment for the future purchase or sale of an asset at a specified price on a specified date. The underlying asset is not physically delivered. Futures contracts are valued at their quoted daily settlement prices. Upon entering into a futures contract, the Fund is required to segregate liquid assets in accordance with the initial margin requirements of the clearinghouse to
Notes to Financial Statements
December 31, 2018
secure the Fund’s performance. The clearinghouse also requires daily settlement of variation margin representing changes in the value of each contract. Fluctuations in the value of the contracts are recorded as unrealized appreciation (depreciation) until the contracts are closed, when they are recorded as net realized gain (loss) on futures contracts. The primary risks associated with the use of futures contracts are imperfect correlation between changes in fair values of the underlying assets and the prices of futures contracts, and the possibility of an illiquid market. Counterparty risk involving futures is mitigated because a regulated clearinghouse is the counterparty.
Options Writing/Purchasing:MLP Energy Fund writes equity call options with the purpose of generating realized gains from premiums as a means to enhance distributions to the Fund’s common shareholders. Tactical Plus Fund may purchase and write put and call options on broad-based stock indices and on individual securities as part of its investment strategy and for hedging purposes.
A call option on a security is a contract that gives the holder of such call option the right to buy the security underlying the call option from the writer of such call option at a specified price at any time during the term of the option. A put option gives the holder of such put option the right to sell the underlying security to the writer of such put option at a specified price at any time during the term of the option. When purchasing options, the Funds pay a premium which is recorded as the cost basis of the option and which is subsequently marked to market to reflect the current value of the option. Premiums paid for purchasing options that expire are treated as realized losses. When an option is exercised or closed, premiums paid for purchasing options are offset against proceeds to determine the realized gain or loss on the transaction. When Funds write an option, an amount equal to the net premium received by the Fund is recorded as a liability and is subsequently marked to market to reflect the current value of the option written. Premiums received from writing options that expire are treated as realized gains. Premiums received from writing options that are either exercised or closed are offset against the proceeds received or the amount paid on the transaction to determine the realized gains or losses. As the writer of a covered call option, during the option’s life, the Fund gives up the opportunity to profit from increases in the market value of the security covering the call option above the sum of the premium and the strike price of the call, but the Fund retains the risk of loss should the price of the underlying security decline.
Swap Agreements:A Fund may enter into equity, interest rate, index, currency rate, and other types of swap agreements in an attempt to obtain a particular return without the need to actually purchase the reference asset. Swap agreements can be individually negotiated and structured to include exposure to a variety of different types of investments or market factors. Depending on their structure, swap agreements may increase or decrease a Fund’s exposure to long-term or short-term interest rates (in the U.S. or abroad), foreign currency values, mortgage securities, corporate borrowing rates, or other factors such as security prices, baskets of securities, or inflation rates.
Swap agreements aretwo-party contracts entered into primarily to exchange the returns (or differentials in rates of return) earned or realized on particular predetermined investments or instruments, which may be adjusted for an interest factor. The gross returns to be exchanged or “swapped” between the parties are generally calculated with respect to a “notional amount,” i.e., the return on or increase in value of a particular dollar amount invested at a particular interest rate, in a particular foreign currency, or in a “basket” of securities representing a particular index. No Funds invested in such swap agreements during the year ended December 31, 2018, and no Funds hold swap agreements as of December 31, 2018.
The following is a summary of the fair value of derivative instruments held directly by the Funds as of December 31, 2018, and where such derivatives are recorded:
| | | | |
| | | Assets | |
Fund | | Investments
at Value* | |
Equity Risk Exposure: | | | | |
Tactical Plus Fund | | $ | 92,070 | |
* Includes purchased options contracts.
Notes to Financial Statements
December 31, 2018
The following is a summary of the effect of derivative instruments on the Statements of Operations for the year ended December 31, 2018:
| | | | | | | | | | | | |
| | | Realized Gain (Loss) on Derivatives Recognized as a Result from Operations | |
Fund | | Net realized
gain/(loss) on
investments and
foreign currency
translations* | | | Net realized
gain/(loss) on
written options | | | Net realized
gain on
futures
contracts | |
Equity Risk Exposure: | | | | | | | | | | | | |
MLP Energy Fund | | $ | — | | | $ | 2,359,375 | | | $ | — | |
Tactical Plus Fund | | | (154,431 | ) | | | (191,471 | ) | | | 948,007 | |
| | | | | | | | | | | | |
| | | Change in Unrealized Appreciation/Depreciation on Derivatives
Recognized as a Result of Operations | |
Fund | | Change in
unrealized
appreciation/
depreciation on
investments* | | | Change in
unrealized
appreciation/
depreciation on
written options | | | Change in
unrealized
appreciation/
depreciation
on futures
contracts | |
Equity Risk Exposure: | | | | | | | | | | | | |
MLP Energy Fund | | $ | — | | | $ | 293,374 | | | $ | — | |
Tactical Plus Fund | | | (85,657 | ) | | | — | | | | 51,242 | |
* Includes purchased options contracts.
As described above, the Funds utilized derivative instruments to achieve their investment objectives during the year ended December 31, 2018. The Funds may enter into International Swaps and Derivatives Association, Inc. Master Agreements (“ISDA Master Agreements”) or similar agreements with their derivative contract counterparties whereby the Funds may, under certain circumstances, offset with the counterparty certain derivative financial instruments’ payables and/or receivables with collateral held and/or posted and create one single net payment. Under the current ISDA Master Agreements in
place, the Funds are subject to master netting agreements (“MNA”) that allow for amounts owed between each Fund and the counterparty to its transactions to be netted. The party that has the larger payable pays the excess of the larger amount over the smaller amount to the other party. The MNA do not apply to amounts owed to or from different counterparties. Under the current ISDA Master Agreements in place with Goldman Sachs, MNA apply only to amounts owed in the same currency and in respect of the same transaction.
The following is a summary of the average monthly notional value of futures contracts and options purchased and sold by the Funds for the year ended December 31, 2018, as well as the respective notional amount outstanding as of December 31, 2018:
| | | | | | | | |
| | | Average Month-end
Notional Value | | | Notional Value
Outstanding at
December 31, 2018 | |
MLP Energy Fund | | | | | | | | |
Written call options | | $ | 32,672,067 | | | $ | — | |
Tactical Plus Fund | | | | | | | | |
Futures contracts purchased | | $ | 18,043,458 | | | $ | — | |
Futures contracts sold | | | 1,992,795 | | | | — | |
Purchased call options | | | 23,889,990 | | | | — | |
Purchased put options | | | 12,029,788 | | | | 69,941,115 | |
Notes to Financial Statements
December 31, 2018
(i) CASH MANAGEMENT TRANSACTIONS
The Funds may hold cash balances in bank demand deposit accounts with the Funds’ custodian, Citibank, N.A. (“Citibank”). Such amounts are readily accessible to purchase investments or pay Fund expenses. The Funds consider liquid assets deposited in a bank demand deposit account to be cash equivalents. Cash and cash equivalents are valued at cost plus any accrued interest. The Funds may maintain demand deposit accounts that have an aggregate value in excess of Federal Deposit Insurance Corporation (“FDIC”) insurance limits. As a result, the Funds may be exposed to credit risk in the event of insolvency or other failure of Citibank to meet its obligations.
(j) CFTC REGULATION
The CFTC adopted rules to harmonize conflicting United States Securities and Exchange Commission (the “SEC”) and CFTC disclosure, reporting and recordkeeping requirements for registered investment companies that do not meet an exemption from the definition of commodity pool. The harmonization rules provide that the CFTC will accept the SEC’s disclosure, reporting, and recordkeeping regime as substituted compliance for substantially all of the otherwise applicable CFTC regulations as long as such investment companies meet the applicable SEC requirements.
With respect to MLP Energy Fund, SCA has claimed an exemption from the definition of the term “commodity pool operator” under CFTC Regulation 4.5 of the Commodity Exchange Act (“CEA”). As such, MLP Energy Fund is not currently subject to registration or regulation as commodity pools under the CEA.
With respect to Tactical Plus Fund, Salient Advisor has not made an initial filing under CFTC Regulation 4.5 of the CEA. Salient Advisor meets the definition of a commodity pool operator with respect to this Fund, and it will be subject to regulation by the CFTC as a commodity pool.
(k) DISTRIBUTIONS TO SHAREHOLDERS
Dividends from net investment income, if any, are declared and paid quarterly for MLP Energy Fund and annually for Tactical Plus Fund. Distributions from net realized capital gains, if any, are normally distributed annually and may include short-term capital gains. All net short-term capital gains are included in ordinary income for tax purposes. Distributions to shareholders are recorded on theex-dividend date. The Funds may also pay, at the end of the calendar year, a special distribution to comply with requirements under the Code.
For MLP Energy Fund, the character of distributions made during the year from net investment income or net capital gains may differ from its ultimate characterization for federal income tax purposes.
The amount of distributions from net investment income and net realized gains is determined in accordance with federal income tax regulations which may differ from U.S. GAAP. These “book/tax” differences are either considered temporary or permanent in nature. To the extent these differences are permanent in nature (e.g., return of capital, differing treatment on certain investments, net operating loss, distribution reclassification, certain gain/loss and certain distributions), such amounts are reclassified within the composition of net assets based on their federaltax-basis treatment; temporary differences (e.g., wash sales and differing treatment on certain investments) do not require a reclassification. To the extent distributions exceed distributable earnings for tax purposes, they are reported as return of capital.
(l) RETURN OF CAPITAL ESTIMATES
Distributions received from MLP Energy Fund’s investments in MLPs generally are comprised of income, capital gains and return of capital. MLP Energy Fund records investment income, realized gains, and return of capital based on estimates made at the time such distributions are received. Such estimates are based on historical information available from each MLP and other industry sources. These estimates may subsequently be revised based on information received from MLPs after their tax reporting periods are concluded.
For the year ended December 31, 2018, MLP Energy Fund estimated that approximately 100% of the MLP distributions received would be treated as a return of capital. MLP Energy Fund recorded as return of capital the amount of $44,046,187 of dividends and distributions received from its investments. Net realized loss was decreased by $51,163,785 and change in net unrealized appreciation/depreciation was increased by $7,117,598 in the accompanying Statements of Operations, attributable to the recording of cumulative distributions as a reduction in the cost basis of investments.
(m) FEDERAL AND OTHER TAXES
The Funds intend to continue to comply with the requirements of the Code applicable to regulated investment companies and to distribute all of their taxable income to shareholders. Also, in order to avoid the payment of any federal excise taxes, the Funds will distribute substantially all of their net investment income and net realized gains on a calendar year basis.
Notes to Financial Statements
December 31, 2018
For the tax years ended 2015 through 2018, and for all major jurisdictions, management of the Funds has evaluated the tax positions taken or expected to be taken in the course of preparing their tax returns to determine whether the tax positions will“more-likely-than-not” be sustained by the Funds upon challenge by the applicable tax authority. Tax positions not deemed to meet the more-likely-than- not threshold and that would result in a tax benefit or expense to the Funds would be recorded as a tax benefit or expense in the current period. For the year ended December 31, 2018, the Funds did not recognize any amounts for unrecognized tax benefit/expense. A reconciliation of unrecognized tax benefit/expense is not provided herein, as the beginning and ending amounts of unrecognized tax benefit/expense are zero, with no interim additions, reductions or settlements.
(n) ALLOCATIONS
Expenses directly related to a Fund are charged directly to that Fund. Other operating expenses of the Trust not directly related to a Fund are prorated to each Fund in the Trust on the basis of relative net assets or another appropriate basis. Income, expenses, and realized and unrealized gains or losses on investments are allocated to each class of shares based on its relative net assets, except that for Tactical Plus Fund, each class separately bears expenses related specifically to that class, such as transfer agent fees, state registration fees, printing and12b-1 fees. Fees provided under a distribution (Rule12b-1 of the 1940 Act) plan and administrative service fees paid to intermediaries or financial institutions for a particular class of a Fund are charged to the expenses of such class.
Other class specific expenses for Tactical Plus Fund for the year ended December 31, 2018 were as follows:
| | | | | | | | | | | | | | | | |
| Tactical Plus Fund | | Class A
Specific
Expenses | | | Class C
Specific
Expenses | | | Class I
Specific
Expenses | | | Class F
Specific
Expenses | |
Registration and filing fees | | $ | 9,813 | | | $ | 9,766 | | | $ | 10,806 | | | $ | 11,099 | |
Transfer agent fees | | | 8,001 | | | | 8,183 | | | | 9,007 | | | | 8,110 | |
Printing fees | | | 2,049 | | | | 175 | | | | 881 | | | | 4,626 | |
(o) REFLOW TRANSACTIONS
Certain Funds may participate in ReFlow, a program designed to provide an alternative liquidity source for mutual funds experiencing redemptions of their shares. In order to pay cash to shareholders who redeem their shares on a given day, a mutual fund typically must hold cash in its portfolio, liquidate portfolio securities, or borrow money, all of which impose certain costs on the fund. ReFlow provides participating mutual funds with another source of cash by standing ready to purchase shares from a fund equal to the amount of the fund’s net redemptions on a given day. ReFlow then generally redeems those shares when the fund experiences net sales. In return for this service, the fund will pay a fee to ReFlow at a rate determined by a daily auction with other participating mutual funds. The costs to a Fund for participating in ReFlow are generally expected to be influenced by and comparable to the cost of other sources of liquidity, such as the Fund’s short-term lending arrangements or the costs of selling portfolio securities to meet redemptions. ReFlow is prohibited from acquiring more than 3% of the outstanding voting securities of any Fund. The Board has adopted certain procedures to govern the Funds’ participation in ReFlow. ReFlow fees that were incurred by the Funds during the year ended December 31, 2018 are recorded in the Statement of Operations, if applicable.
3. FAIR VALUE MEASUREMENTS
A three-tier hierarchy has been established to classify fair value measurements for disclosure purposes. Inputs refer broadly to the assumptions that market participants would use in pricing the asset or liability, including assumptions about risk. Inputs may be observable or unobservable. Observable inputs are inputs that reflect the assumptions market participants would use in pricing the asset or liability that are developed based on market data obtained from sources independent of the reporting entity. Unobservable inputs are inputs that reflect the reporting entity’s own assumptions about the assumptions market participants would use in pricing the asset or liability that are developed based on the best information available.
Various inputs are used in determining the value of each Fund’s investments as of the reporting period end. The designated input levels are not necessarily an indication of the risk or liquidity associated with these investments. These inputs are categorized in the following hierarchy under applicable financial accounting standards:
Level 1—Unadjusted quoted prices in active markets for identical, unrestricted assets or liabilities that a Fund has the ability to access at the measurement date. Investments in any underlying open-ended investment companies are valued at their net asset value daily and classified as Level 1.
Notes to Financial Statements
December 31, 2018
Level 2—Quoted prices in markets which are not active, quoted prices for similar assets or liabilities in active markets or inputs other than quoted prices that are observable (either directly or indirectly) for substantially the full term of the asset or liability.
Level 3—Significant unobservable prices or inputs (including the Fund’s own assumptions in determining the fair value of investments) where there is little or no market activity for the asset or liability at the measurement date.
The following tables summarize the Funds’ investments and derivative financial instruments categorized in the disclosure hierarchy as of December 31, 2018:
| | | | | | | | | | | | | | | | |
| Investments in Securities | | Level 1 | | | Level 2 | | | Level 3 | | | Total | |
| MLP Energy Fund | | | | | | | | | | | | | | | | |
Master Limited Partnerships and Related Companies(a) | | $ | 889,590,918 | | | $ | — | | | $ | — | | | $ | 889,590,918 | |
| | | | | | | | | | | | | | | | |
Total | | $ | 889,590,918 | | | $ | — | | | $ | — | | | $ | 889,590,918 | |
| | | | | | | | | | | | | | | | |
| | | | |
| Tactical Plus Fund | | | | | | | | | | | | | | | | |
Purchased Options(a) | | $ | 92,070 | | | $ | — | | | $ | — | | | $ | 92,070 | |
Money Market Fund | | | 47,068,510 | | | | — | | | | — | | | | 47,068,510 | |
| | | | | | | | | | | | | | | | |
Total | | $ | 47,160,580 | | | $ | — | | | $ | — | | | $ | 47,160,580 | |
| | | | | | | | | | | | | | | | |
(a) For detailed descriptions of industry or country, see the accompanying Schedule of Investments.
For the year ended December 31, 2018, no Funds had transfers between the fair value levels designated in the preceding table and unobservable inputs (Level 3) used in determining fair value. Therefore, a reconciliation of assets in which significant unobservable inputs (Level 3) were used in determining fair value is not applicable.
4. INVESTMENT MANAGEMENT SERVICES
In consideration of the advisory and other services provided by each investment advisor, under the terms of the Investment Management Agreement between Salient Advisor and Tactical Plus Fund and between SCA and MLP Energy Fund, Salient Advisor and SCA are entitled to receive a fee calculated daily and payable monthly at the following annual rates, as of December 31, 2018, based on each Fund’s average daily net assets:
| | |
| Fund | | Investment Advisory Fee |
MLP Energy Fund | | 0.95% |
| |
Tactical Plus Fund | | 1.45% |
The Trust and Salient Advisor have entered into an investmentsub-advisory agreement with theSub-advisor for Tactical Plus Fund. Pursuant to this agreement, theSub-Advisor provides investmentsub-advisory services to the Fund and is entitled to receive a fee from Salient Advisor calculated daily and payable monthly at the annual rate of 0.725% of the Fund’s average daily net assets.
Expense Limitations:Salient Advisor and SCA have entered into Expense Limitation Agreements which limit the total expenses (exclusive of brokerage and transactional costs, interest, taxes, short dividend expense, acquired fund fees and expenses, litigation and extraordinary expenses) of certain classes of the Funds, through a specified date. In addition, Salient Advisor or SCA may voluntarily reimburse additional expenses of certain classes of certain Funds. Following are the annual expense limitation rates and expiration dates for the Funds with an Expense Limitation Agreement:
| | | | | | | | | | | | | | | | | | | | | | | | |
| Fund | | Class A | | | Class C | | | Class I | | | Class F | | | Class R6 | | | End Date | |
MLP Energy Fund | | | 1.55 | % | | | 2.30 | % | | | 1.30 | % | | | N/A | | | | None | | | | April 30, 2019 | |
Tactical Plus Fund(a) | | | 1.65 | % | | | 2.40 | % | | | 1.40 | % | | | 1.09 | % | | | N/A | | | | April 30, 2019 | |
(a) Effective February 1, 2018, the annual expense limitation rates were reduced for the Tactical Plus Fund’s Class A, Class C, Class I and Class F shares’ from 2.05%, 2.80%, 1.80% and 1.49%, respectively, to the rates presented above. In addition, for the period January 3, 2018 to January 31, 2018, Salient Advisor agreed to voluntarily waive any portion of its fees in amounts to limit the Tactical Plus Fund’s Class A, Class C, Class I and Class F shares’ operating expenses to an annual rate of 1.65%, 2.40%, 1.40% and 1.09%, respectively. The voluntary fee waivers for this period were $10,513 and are reflected in the Statement of Operations.
Notes to Financial Statements
December 31, 2018
Pursuant to the Expense Limitation Agreements, each Fund will reimburse the investment advisor for any fee waivers and expense reimbursements made by the investment advisor, provided that any such reimbursements made by a Fund to the investment advisor will not cause the Fund’s expense limitation to exceed the expense limitation in existence at the time the expenses were incurred or at the time of the reimbursement, whichever is lower, and the reimbursement is made within three years following the year in which the expenses were incurred.
For the year ended December 31, 2018, the fee waivers and/or reimbursements were as follows:
| | | | | | | | | | | | |
| Fund | | Fees Waived/
Reimbursed
by Advisor | | | Recoupment of
Past Waived
Fees by Advisor | | | Total | |
| Tactical Plus Fund | | | | | | | | | | | | |
Class A | | $ | 66,210 | | | $ | — | | | $ | 66,210 | |
Class C | | | 23,546 | | | | — | | | | 23,546 | |
Class I | | | 81,586 | | | | — | | | | 81,586 | |
Class F | | | 258,309 | | | | — | | | | 258,309 | |
As of December 31, 2018, the balances of recoupable expenses for Tactical Plus Fund were waived in the following years:
| | | | | | | | | | | | | | | | |
| Fund | | 2016 | | | 2017 | | | 2018 | | | Total | |
| Tactical Plus Fund | | | | | | | | | | | | | | | | |
Class A | | $ | 57,377 | | | $ | 66,735 | | | $ | 63,074 | | | $ | 187,186 | |
Class C | | | 21,351 | | | | 32,324 | | | | 23,255 | | | | 76,930 | |
Class I | | | 25,940 | | | | 40,757 | | | | 80,926 | | | | 147,623 | |
Class F | | | 181,640 | | | | 170,959 | | | | 251,883 | | | | 604,482 | |
5. DISTRIBUTION AGREEMENT
Foreside Fund Services, LLC, (“Foreside”), serves the Trust as distributor (the “Distributor’’). The Trust has adopted a Distribution Plan and Agreement (the “Distribution Plan’’) pursuant to Rule12b-1 under the 1940 Act.
Each Fund may pay financial intermediaries such as broker-dealers, investment advisors (“Authorized Firms”) and the Distributor up to 0.25% and 1.00%, on an annualized basis, of the average daily net assets attributable to Class A and Class C shares, respectively, as compensation for service and distribution-related activities and/or shareholder services with respect to Class A and Class C shares, respectively.
The Funds pay fees to certain intermediaries or financial institutions for recordkeeping,sub-accounting services, transfer agency and other administrative services as reflected in the Statements of Operations as “Administrative services fees.”
6. SERVICE PROVIDERS
ALPS Fund Services, Inc. (“AFS”) serves as the Funds’ administrator, transfer agent and dividend paying agent for the Funds.
Prior to July 23, 2018, FIS Investor Services, LLC served as transfer agent and dividend paying agent for the Funds.
Citibank, N.A. serves as the Funds’ custodian.
Foreside serves the Trust as distributor.
7. TRUSTEE AND OFFICER FEES
Each Fund’s operations are managed under the direction and oversight of the Board of Trustees. The Board of Trustees appoints officers of the Trust who are responsible for the Funds’day-to-day business decisions based on policies set by the Board of Trustees. The officers serve at the pleasure of the Board of Trustees.
The Funds do not pay any compensation directly to the officers or trustees who are also trustees, officers or employees of Salient Management or its affiliates, except as noted below. As of December 31, 2018, there were six Trustees, five of whom are not “interested persons” of the Trust within the meaning of that term under the 1940 Act (each, an “Independent Trustee”). The Trustees of the Trust may also serve as trustees of other registered investment companies managed by the Advisor and its affiliates, including Forward Funds and Salient Midstream & MLP Fund (together with the Trust, the “Trusts”). Each Fund within the Trusts pays Independent Trustees an allocated portion of the retainer of $50,000 per year (prior to August 1, 2018, the fee was $60,000). Each Fund within the Trusts pays Independent Trustees an
Notes to Financial Statements
December 31, 2018
allocated portion of the amounts of: $6,250 for attendance in person at a regular meeting and $1,500 for attendance by telephone at a regular meeting (prior to August 1, 2018, the fee was $2,500); $1,500 for attendance in person or by video conference at a special meeting that is not held in conjunction with a regular meeting (prior to August 1, 2018, the fee was $3,750) and $1,500 for attendance by telephone at a special meeting that is not held in conjunction with a regular meeting; and $1,500 per day for participation in Trust-related meetings not held in conjunction with a meeting. The Chairman of the Board of Trustees, the Chairman of the Audit Committee, the Chairman of the Nominating Committee, and the Chairman of the Compliance Committee receive a special retainer fee in the amount of $16,000, $6,000, $5,000, and $5,000, respectively, per year (prior to August 1, 2018, the fees were $25,000, $12,500, $7,500 and $7,500, respectively, with the full board addressing valuation issues without a separate committee or chair). In addition, each member of the Audit Committee, Nominating Committee and Compliance Committee receives $1,000, respectively per year, and each member of the Valuation Committee receives $500 per year. In the interest of retaining Independent Trustees of the highest quality, the Board intends to periodically review such compensation and may modify it as the Board deems appropriate. The interested Trustees receive no compensation from the Funds. In addition, Independent Trustees receive reimbursements for reasonableout-of-pocket expenses incurred for their services as a Trustee, including for the transportation and other expenses that they incur in attending meetings.
The Chief Compliance Officer of the Funds (“CCO”) is an employee of, and is compensated by, Salient Management. As of December 31, 2018, the Funds have agreed to pay the Advisor approximately $163,000 per year as (i) an allocated portion of the compensation of an officer or employee of the Advisor to serve as CCO for the Funds (plus the cost of reasonable expenses related to the performance of the CCO’s duties, including travel expenses), and (ii) an allocation of the expenses of other officers or employees of the Advisor who serve in other compliance capacities for the Funds. The Board approves annually an allocation of such costs among such personnel, and each Fund bears its pro rata share of such expense. Other affiliated funds and registered investment companies managed by the Advisor pay additional compensation for the same purposes.
8. INDEMNIFICATIONS
Under the Trust’s organizational documents, its officers and Trustees are indemnified against certain liability arising out of the performance of their duties with respect to the Funds. In addition, in the normal course of business, the Trust, on behalf of the Funds, enters into contracts with vendors and others that provide general indemnification. Each Fund’s maximum exposure under these arrangements is unknown, as this would involve future claims that may be made against the Trust and/or the Funds. Based on experience, however, the Funds expect the risk of loss to be remote.
9. PURCHASES AND SALES OF INVESTMENTS
The aggregate cost of security purchases and proceeds from sales of securities (excluding short-term investments) during the year ended December 31, 2018, were as follows:
| | | | | | | | |
| Fund | | Cost of
Investments
Purchased | | | Proceeds from
Investments
Sold | |
MLP Energy Fund | | $ | 574,372,474 | | | $ | 714,571,281 | |
Tactical Plus Fund | | | 37,431,839 | | | | 44,997,140 | |
10. TAX BASIS INFORMATION
Income and long-term capital gain distributions are determined in accordance with Federal income tax regulations, which may differ from GAAP. The tax character of dividends paid to shareholders during the applicable tax year ended November 30, 2018 was as follows:
| | | | | | | | | | | | | | | | | | | | |
| | | Ordinary
Income | | | Net Long Term
Capital Gains | | | Total Taxable
Distributions | | | Return of
Capital | | | Total
Distributions
Paid | |
MLP Energy Fund | | $ | 11,638,498 | | | $ | — | | | $ | 11,638,498 | | | $ | 52,106,988 | | | $ | 63,745,486 | |
Tactical Plus Fund | | | — | | | | 2,377,933 | | | | 2,377,993 | | | | — | | | | 2,377,993 | |
Notes to Financial Statements
December 31, 2018
The tax character of dividends paid to shareholders during the tax year ended November 30, 2017 was as follows:
| | | | | | | | | | | | | | | | | | | | |
| | | Ordinary
Income | | | Net Long Term
Capital Gains | | | Total Taxable
Distributions | | | Return of
Capital | | | Total
Distributions
Paid | |
MLP Energy Fund | | $ | 7,419,636 | | | $ | — | | | $ | 7,419,636 | | | $ | 78,129,843 | | | $ | 85,549,479 | |
Tactical Plus Fund | | | 215,782 | | | | 781,923 | | | | 997,705 | | | | — | | | | 997,705 | |
As of the tax year ended, November 30, 2018, the components of accumulated earnings/(deficit) on a tax basis were as follows:
| | | | | | | | | | | | | | | | |
| | | Accumulated
Capital
Gains/(Losses) | | | Undistributed
Ordinary
Income | | | Net
Unrealized
Appreciation/
Depreciation | | | Other
Cumulative
Effect of
Timing
Differences | |
MLP Energy Fund | | $ | (597,608,207 | ) | | $ | — | | | $ | (41,765,803 | ) | | $ | (1,044,391 | ) |
Tactical Plus Fund | | | 727,712 | | | | 330,561 | | | | (349,777 | ) | | | — | |
The differences between book-basis andtax-basis unrealized appreciation/(depreciation) are primarily due to deferral of losses on wash sales, partnership investments, and mark-to-market adjustments for certain derivatives. In addition, certain tax cost basis adjustments are finalized subsequent to fiscalyear-end and therefore have not been determined as of December 31, 2018.
The following information is provided on a tax basis as of December 31, 2018 and includes investments and derivatives, and excludes foreign currency:
| | | | | | | | | | | | | | | | | | | | |
Fund | | Tax Cost | | | Tax
Unrealized
Appreciation | | | Tax
Unrealized
Depreciation | | | Net Unrealized
Appreciation/
(Depreciations)
Before Taxes | | | Net Unrealized
Appreciation/
(Depreciations)
After Taxes | |
MLP Energy Fund | | $ | 1,013,460,201 | | | $ | 168,401,301 | | | $ | (292,270,584 | ) | | $ | (123,869,283 | ) | | $ | (124,062,144 | ) |
Tactical Plus Fund | | | 47,223,376 | | | | — | | | | (389,764 | ) | | | (389,764 | ) | | | (389,764 | ) |
As of the end of the tax year ended November 30, 2018, the Fund(s) had the following net capital loss carryovers (“CLCOs”). It is the Board’s intent that the Funds will not distribute any realized gain distributions until the CLCOs have been offset or expire.
| | | | | | | | | | | | |
Fund | | Short-Term | | | Long-Term | | | Total | |
MLP Energy Fund | | $ | 127,769,784 | | | $ | 469,838,423 | | | $ | 597,608,207 | |
At the time of liquidation (see note 1), MLP Subsidiary, which was a Subchapter C corporation for federal income tax purposes, had a deferred tax liability attributable to unrealized gains on investments which were transferred to MLP Energy Fund. Accordingly, a deferred tax liability in the amount of $3,689,597 attributable to these “built in gains” (“BIG”) was recorded on the books of MLP Energy Fund. Federal income tax rules require that MLP Energy Fund treat any BIG related gains recognized on the transferred assets during the 5 year period following the date of transfer as subject to Subchapter C corporate income taxation to the extent such recognized BIG amounts do not exceed the unrealized gain on the transfer date. If the unrealized gain on the transferred assets is not recognized with the 5 year period
following the transfer date, no Subchapter C corporate income taxes will apply to MLP Energy Fund. As of December 31, 2018, MLP Energy Fund has a deferred tax liability (attributable to unrealized gain on MLP Subsidiary investment securities) of $191,701.
With respect to MLP Energy Fund, NOLs (Net Operating Losses) are available to be carried back up to two years to offset past taxable income of MLP Subsidiary or carried forward up to 5 years from the date of the transfer of the investments (the “Holding Period”). SCA does not intend on liquidating these investments prior to the end of the Holding Period. CLCO’s are available to be carried back up to three years to offset past capital gains or carried forward up to five years to offset future capital gains. As of December 31, 2018, MLP Energy Fund has no CLCO’s and NOLs related to MLP Subsidiary.
In accordance with U.S. GAAP, the Funds have made reclassifications among their capital accounts. These reclassifications are intended to adjust the components of the Funds’ net assets to reflect the tax character of permanent book/tax differences and have no impact on the net assets or the net asset value of the Funds. As of December 31,
Notes to Financial Statements
December 31, 2018
2018, the Funds made reclassifications to increase or (decrease) the components of the net assets detailed below:
| | | | | | | | |
Fund | | Paid-In Capital | | | Total Distributable
Earnings | |
MLP Energy Fund | | $ | 6,910,241 | | | $ | (6,910,241 | ) |
11. SCHEDULE OF INVESTMENTS
The investment categories used in this report may differ from the industry classification categories used for determining compliance with industry concentration restrictions and requirements applicable to each of the Funds.
12. AFFILIATED COMPANIES
As defined by the 1940 Act, an affiliated company is one in which a Fund owns 5% or more of the outstanding voting securities or a company that is under common ownership or control. During the year ended December 31, 2018, no funds owned 5% or more of the outstanding voting shares of any securities.
13. NEW ACCOUNTING PRONOUNCEMENTS
In August 2018, the FASB issued ASU2018-13, which changes the fair value measurement disclosure requirements of FASB ASC Topic 820, Fair Value Measurement. The update to Topic 820 includes new, eliminated, and modified disclosure requirements. ASU2018-13 is effective for fiscal years beginning after December 15, 2019, including interim periods. Early adoption of the full standard is permitted. Management has decided to early adopt the elimination and modification requirements, which have been included in the preceding Notes to the Financial Statements.
14. SEC REGULATIONS
On October 4, 2018, the SEC amended RegulationS-X to require certain financial statement disclosure requirements to conform them to US Generally Accepted Accounting Principles for investment companies. Effective November 4, 2018, the Fund adopted disclosure requirement changes for RegulationS-X and these changes are reflected throughout this report. The Fund’s adoption of those amendments, effective with the financial statements prepared as of December 31, 2018, had no effect on the Funds’ net assets or results of operations.
15. SUBSEQUENT EVENTS
The Funds have evaluated the need for disclosures and/or adjustments resulting from subsequent events through the date the financial statements were issued. Based on this evaluation, no adjustments were required to the financial statements as of December 31, 2018. However, the following are details relating to the subsequent events through the date the financial statements were issued.
The following information applies to MLP Energy Fund only:
Effective January 1, 2019, the Alerian Midstream Energy Select Index (AMEI Index) replaced the Alerian MLP Index as the Fund’s primary benchmark index.
The following information applies to Tactical Plus Fund only:
Effective January 1, 2019, the HFRX Equity Hedge Index replaced the S&P 500 Index as the Fund’s primary benchmark index.
The Funds file a complete schedule of portfolio holdings with the Securities and Exchange Commission (“SEC”) for the first and third quarters of each fiscal year on FormN-Q. The Funds’ FormN-Q was filed for the quarter ended September 30, 2018. The Funds’ FormN-Q is available on the SEC’s website at www.sec.gov and may also be reviewed and copied at the SEC’s Public Reference Room in Washington, DC. Information on the operation of the Public Reference Room may be obtained by calling1-800-SEC-0330.
A description of the Funds’ proxy voting policies and procedures and how the Funds voted proxies relating to portfolio securities during the most recent12-month period ended June 30, 2018 are available (i) without charge, upon request, by calling1-800-994-0755 and (ii) on the SEC’s website at www.sec.gov
Report of Independent Registered Public Accounting Firm
To the Shareholders and Board of Trustees
Salient MF Trust:
Opinion on the Financial Statements
We have audited the accompanying statements of assets and liabilities of Salient MLP & Energy Infrastructure Fund and Salient Tactical Plus Fund (collectively, the “Funds”), including the schedules of investments, as of December 31, 2018, the related statements of operations for the year then ended, the statements of changes in net assets for each of the years in the two-year period then ended, and the related notes (collectively, the “financial statements”) and the financial highlights for each of the periods in the five-year period then ended. In our opinion, the financial statements and financial highlights present fairly, in all material respects, the financial position of the Funds as of December 31, 2018, the results of their operations for the year then ended, the changes in their net assets for each of the years in the two-year period then ended, and the financial highlights for each of the periods in the five-year period then ended, in conformity with U.S. generally accepted accounting principles. The accompanying financial highlights for the year ended November 30, 2014 for the Salient Tactical Plus Fund were audited by other independent registered public accountants, whose report thereon dated January 23, 2015, expressed an unqualified opinion on those financial highlights.
Basis for Opinion
These financial statements and financial highlights are the responsibility of the Funds’ management. Our responsibility is to express an opinion on these financial statements and financial highlights based on our audits. We are a public accounting firm registered with the Public Company Accounting Oversight Board (United States) (PCAOB) and are required to be independent with respect to the Funds in accordance with the U.S. federal securities laws and the applicable rules and regulations of the Securities and Exchange Commission and the PCAOB.
We conducted our audits in accordance with the standards of the PCAOB. Those standards require that we plan and perform the audit to obtain reasonable assurance about whether the financial statements and financial highlights are free of material misstatement, whether due to error or fraud. Our audits included performing procedures to assess the risks of material misstatement of the financial statements and financial highlights, whether due to error or fraud, and performing procedures that respond to those risks. Such procedures included examining, on a test basis, evidence regarding the amounts and disclosures in the financial statements and financial highlights. Such procedures also included confirmation of securities owned as of December 31, 2018, by correspondence with custodians and brokers or by other appropriate auditing procedures. Our audits also included evaluating the accounting principles used and significant estimates made by management, as well as evaluating the overall presentation of the financial statements and financial highlights. We believe that our audits provide a reasonable basis for our opinion.
/s/ KPMG LLP
We have served as the auditor of one or more Salient investment companies since 2003.
Columbus, Ohio
February 27, 2019
46
Tax Information (Unaudited)
December 31, 2018
Pursuant to Section 852(b)(3) of the Internal Revenue Code the following Funds designate the amounts listed below as long-term capital gain dividends:
| | | | |
Tactical Plus Fund* | | $ | 2,377,933 | |
The following Funds designate the percentages listed below of the income dividends distributed between January 1, 2018 and December 31, 2018, as qualified dividend income (QDI) as defined in Section 1(h)(11) of the Internal Revenue Code:
The following Funds designate the percentages listed below of the income dividends distributed between January 1, 2018 and December 31, 2018, as qualifying for the corporate dividends received deduction (DRD) as defined in Section 854(b)(2) of the Internal Revenue Code:
Section 19 Notices
The amounts and sources of distributions reported are only estimates and are not being provided for tax reporting purposes. The actual amounts and sources for tax reporting purposes will depend upon the Fund’s investment experience during the year and may be subject to changes based on the tax regulations. The Fund will send you a Form1099-DIV each calendar year that will tell you how to report these distributions for Federal income tax purposes.
| | | | | | | | | | | | | | | | | | | | | | | | | | | | | | | | |
| | | Per Share | | | Percentage | |
| | | Net
Investment
Income | | | Net
Realized
Capital
Gains | | | Return of
Capital | | | Total Per Share | | | Net Investment
Income | | | Net
Realized
Capital
Gains | | | Return of
Capital | | | Total Per Share | |
| MLP Energy Fund* | | | | | | | | | | | | | | | | | | | | | | | | | | | | | | | | |
Class A | | $ | 0.068952 | | | | — | | | $ | 0.308708 | | | $ | 0.377660 | | | | 18.26 | % | | | — | | | | 81.74 | % | | | 100.00 | % |
Class C | | $ | 0.059188 | | | | — | | | $ | 0.264992 | | | $ | 0.324180 | | | | 18.26 | % | | | — | | | | 81.74 | % | | | 100.00 | % |
Institutional | | $ | 0.071936 | | | | — | | | $ | 0.322064 | | | $ | 0.394000 | | | | 18.26 | % | | | — | | | | 81.74 | % | | | 100.00 | % |
Class R6 | | $ | 0.072957 | | | | — | | | $ | 0.326633 | | | $ | 0.399590 | | | | 18.26 | % | | | — | | | | 81.74 | % | | | 100.00 | % |
* MLP Energy Fund and Tactical Plus Fund have a tax year end of November 30 and as such the amounts reported are through November 30, 2018.
47
Additional Company Information (Unaudited)
MANAGEMENT OF THE FUNDS
Board of Trustees and Officers
Each Fund’s operations are managed under the direction and oversight of the Board of Trustees (the “Board”). The Board appoints officers of the Trust (“Salient MF Trust”) who are responsible for the Funds’day-to-day business decisions based on policies set by the Board. The officers serve at the pleasure of the Board.
As of December 31, 2018, there were six Trustees, five of whom are not “interested persons” of the Trust within the meaning of that term under the 1940 Act (each, an “Independent Trustee”). The Trustees and officers of the Trust also may be directors or officers of some or all of the other registered investment companies, including the Forward Funds (“Salient FF Trust” and, together with the Salient MF Trust, the “Trusts”), managed by Salient and its affiliates (hereafter, Salient and Forward Management, both jointly and individually, are referred to as the “Advisor”). Each Trustee holds office for an indefinite term until his/her successor is duly elected and qualified or until he/she dies, retires, resigns, is removed or becomes disqualified. The table below shows, for each Trustee and executive officer, his/her full name, and year of birth, the position held with the Trusts, the length of time served in that position, his/her principal occupation during the last five years, and other directorships held by such Trustee. The address of each Trustee and officer is c/o Salient MF Trust, 4265 San Felipe, Suite 800, Houston, Texas 77027 or c/o Forward Funds, 345 California Street, Suite 1600, San Francisco, California 94104. The Trusts’ Statement of Additional Information includes additional information about the Trustees and is available at www.salientpartners.com or upon request, without charge, by calling800-999-6809.
Interested Trustees*
| | | | | | | | |
Name and
Year of Birth | | Position(s)
Held | | Principal Occupation(s) During the Past 5 Years | | Number of
Portfolios in Fund
Complex
Overseen by
Trustee(1) | | Other
Directorships
During
Past 5 Years** |
John A. Blaisdell* Year of Birth: 1960 | | Salient MF Trust Trustee, President and Principal Executive Officer (since 2012) Salient FF Trust Trustee, President and Principal Executive Officer (since 2015) | | Managing Director of Salient (since 2002). | | 7 | | Salient Private Access Funds (investment companies) (four funds) (since 2004); Endowment PMF Funds (investment companies) (three funds) (since 2014); Salient Midstream & MLP Fund (investment company) (since 2012). |
48
Additional Company Information (Unaudited)
Independent Trustees
| | | | | | | | |
Name and
Year of Birth | | Position(s)
Held | | Principal Occupation(s) During the Past 5 Years | | Number of
Portfolios in Fund
Complex
Overseen by
Trustee(1) | | Other
Directorships
During
Past 5 Years** |
Julie Allecta Year of Birth: 1946 | | Salient MF Trust Trustee (since 2015); Audit Committee Chairperson (2016-2018) Salient FF Trust Trustee (since 2012); Audit Committee Chairperson (2012-2018) | | Retired Partner, Paul Hastings, Janofsky & Walker LLP(1999-2009); Trustee, Litman Gregory Masters Funds Trust (Since 2013); Member of Executive Committee and Governing Council, Independent Directors Council (since 2014); Director, WildCare Bay Area (2007-2017); Parliamentarian and Director, American Society of Botanical Artists, Northern California Chapter (2014-2015). | | 7 | | Litman Gregory Funds Trust (since 2013); Salient Midstream & MLP Fund (investment company) (since 2018). |
| | | | |
Jonathan P. Carroll Year of Birth: 1961 | | Salient MF Trust Trustee (since 2012) Salient FF Trust Trustee (since 2015) | | President, Lazarus Capital LLC (Investment company) (since 2006); President, Lazarus Energy Holdings, LLC (Investment holding company) (since 2006); President and CEO of Blue Dolphin Energy Company (since 2012); private investor (since 1988). | | 7 | | Salient Private Access Funds (investment companies) (four funds) (since 2004); Endowment PMF Funds (investment companies) (three funds) (since 2014); LRR Energy, L.P. (LRE) (energy company) (2014-2015); Blue Dolphin Energy Company (BDCO) (energy company) (since 2014); Salient Midstream & MLP Fund (investment company) (since 2012). |
| | | | |
A. John Gambs Year of Birth: 1945 | | Salient MF Trust Trustee (since 2015); Audit Committee Chairperson (since 2018) Salient FF Trust Trustee (since 2012); Audit Committee Chairperson (since 2018) | | Director and Compensation Committee Chair, NMI Holdings, Inc. (2011-2012); Trustee and Audit Committee Chair, Barclays Global Investors Funds (2006-2010); Trustee and Audit Committee Chair, Master Investment Portfolio (2006-2010); Advisory Board Member, Fairview Capital Management (since 2009); Director, San Francisco Classical Voice(2011-2016); Member, Board of Governors San Francisco Symphony (since 2001); Director, The New Century Chamber Orchestra (since 2010); Executive Vice President and Chief Financial Officer, The Charles Schwab Corporation (1988-1996); President and Director, Gambs Family Foundation (1997-2010). | | 7 | | Salient Midstream & MLP Fund (investment company) (since 2018). |
49
Additional Company Information (Unaudited)
| | | | | | | | |
Name and
Year of Birth | | Position(s)
Held | | Principal Occupation(s) During the Past 5 Years | | Number of
Portfolios in Fund
Complex
Overseen by
Trustee(1) | | Other
Directorships
During
Past 5 Years** |
Dr. Bernard A. Harris, Jr. Year of Birth: 1956 | | Salient MF Trust Trustee (since 2012) Salient FF Trust Trustee (since 2015) | | Chief Executive Officer and Managing Partner, Vesalius Ventures, Inc. (venture investing) (since 2002); CEO, National Math and Science Initiative(non-profit) (since 2018); President and Founder, The Harris Foundation(non-profit) (since 1998); clinical scientist, flight surgeon and astronaut for NASA(1986-1996). | | 7 | | Salient Private Access Funds (investment companies) (four funds) (since 2009); Babson Funds (eleven funds) (since 2011); Monebo Technologies Inc. (since 2009); The National Math and Science Initiative (since 2008); Communities in Schools (since 2007); American Telemedicine Association(2007-2014); U.S. Physical Therapy, Inc. (since 2005); Houston Technology Center (2004-2016); The Harris Foundation, Inc. (since 1998); Salient Midstream & MLP Fund (investment company) (since 2012). |
| | | | |
Haig G. Mardikian Year of Birth: 1947 | | Salient MF Trust Trustee and Chairman of the Board (since 2015) Salient FF Trust Trustee (since 1998), Chairman of the Board (since 2005) | | Owner of Haig G. Mardikian Enterprises, a real estate investment business (since 1971); General Partner of M&B Development, a real estate investment business (since 1983); General Partner of George M. Mardikian Enterprises, a real estate investment business (1983-2002); President and Director of Adiuvana-Invest, Inc., a real estate investment business (since 1989); President of the William Saroyan Foundation (since 1992); Managing Director of the United Broadcasting Company, radio broadcasting(1983-2001); Trustee of the International House of UC Berkeley (2001-2007); Director of the Downtown Association of San Francisco (1982-2006); Director of the Market Street Association (1982-2006); Trustee of Trinity College (1998-2007); Trustee of the Herbert Hoover Presidential Library (since 1997); Trustee of the Herbert Hoover Foundation (since 2002); Trustee of the Advisor California Civil Liberties Public Education Fund (1997-2006); Director of The Walnut Management Co., a privately held family investment company (since 2008); President of the Foundation of City College (2006-2010); Director of Near East Foundation (since 2007). | | 7 | | Chairman and Director of SIFE Trust Fund (1978-2001); Salient Midstream & MLP Fund (investment company) (since 2018). |
| * | This person’s status as an “interested” Trustee arises from his affiliation with the Advisor. |
| ** | This column includes only directorships of companies required to report to the SEC under the Securities Exchange Act of 1934 (i.e., public companies) or other investment companies registered under the 1940 Act. |
50
Additional Company Information (Unaudited)
| (1) | The Fund Complex for the purposes of this table consists of six(6) open-end funds in the Salient MF Trust and the Forward Funds (each, a “Trust”), with the series of each Trust being advised by either the Advisor or an affiliate of the Advisor; andone (1) public closed-end fund advised by either the Advisor or an affiliate of the Advisor. |
Officers of the Funds Who Are Not Trustees
| | | | |
| Name and Year of Birth | | Position(s) with the Trusts | | Principal Occupation(s) During Past 5 Years |
Matthew Hibbetts Year of Birth: 1982 | | Salient MF Trust Vice President (since 2018) Salient FF Trust Vice President (since 2018) | | Chief Financial Officer, Salient (since 2018); Vice President, Salient MF Trust (since 2018); Vice President, Forward Funds (since 2018); Vice President, Salient Midstream & MLP Fund (since 2018); Chief Operating Officer—MLP Investments, Salient (2013-2018). |
| | |
Barbara H. Tolle Year of Birth: 1949 | | Salient MF Trust Treasurer and Principal Financial Officer (since 2017) Salient FF Trust Treasurer and Principal Financial Officer (since 2006) | | Treasurer and Principal Financial Officer, Salient MF Trust (since 2017); Treasurer and Principal Financial Officer, Salient Midstream and MLP Fund (since 2017); Treasurer and Principal Financial Officer, Forward Funds (since 2006); Treasurer, Salient Private Access Funds (four funds) (since 2017); Treasurer, Endowment PMF Funds (three funds) (since 2017); Vice President, Director of Fund Accounting and Operations, Forward Management, LLC (since 2006); Vice President and Director, Fund Accounting and Administration, PFPC Inc. (1998-2006). |
| | |
Paul A. Bachtold Year of Birth: 1973 | | Salient MF Trust Chief Compliance Officer (since 2012) Salient FF Trust Chief Compliance Officer (since 2016) | | Chief Compliance Officer and Secretary, Forward Securities (since 2016); Chief Compliance Officer, Forward Funds (since 2016); Chief Compliance Officer, Forward Management, LLC (since 2015); Chief Compliance Officer, Salient Private Access Funds (since 2010); Chief Compliance Officer, Endowment PMF Funds (since 2014); Chief Compliance Officer, Salient (since 2010); Chief Compliance Officer, Salient Midstream & MLP Fund (since 2012); Chief Compliance Officer, Salient MF Trust (since 2012). |
| | |
Kristen Bayazitoglu Year of Birth: 1981 | | Salient MF Trust Secretary (Since 2018); Vice President (2017-2018) Salient FF Trust Secretary (Since 2018); Vice President (2017-2018) | | Secretary, Forward Funds (since 2018); Secretary, Salient MF Trust (since 2018); Secretary, Salient Midstream & MLP Fund (since 2018); Vice President, Forward Funds (2017-2018); Vice President, Salient MF Trust (2017-2018); Vice President, Salient Midstream & MLP Fund (2017-2018); Chief Operating Officer, Salient Partners, L.P. (since 2017); Vice President, Salient Private Access Funds (since 2017); Vice President, Endowment PMF Funds (since 2017); Vice President of Operations, Salient Partners, L.P. (March 2012 – June 2017). |
51
Board Consideration of the Investment Management Agreement (Unaudited)
Atan in-person meeting of the Board held on October 23, 2018, the Board, including the Trustees who are not “interested persons” as that term is defined in the Investment Company Act of 1940, as amended (the “Independent Trustees”), considered and approved the continuation of the Investment Management Agreements between Salient MF Trust (the “Trust”), on behalf of its series Salient Tactical Plus Fund (a “Fund”), and Salient Advisors, L.P. (“Salient Advisors”) (“Salient Advisors Agreement”); the Investment Management Agreement between the Trust, on behalf of its series Salient MLP & Energy Infrastructure Fund (also, a “Fund,” and together with the Salient Tactical Plus Fund, the “Funds”), and Salient Capital Advisors, LLC (“Salient Capital,” and together with Salient Advisors, the “Advisors”) (“Salient Capital Agreement,” and together with the Salient Advisors Agreement, the “Advisory Agreements”); andthe Sub-Advisory Agreement between Salient Advisors and Broadmark Asset Management LLC (“Broadmark” orthe “Sub-Advisor”) (the “Sub-Advisory Agreement”).
In preparation for review of the Advisory Agreementsand Sub-Advisory Agreement, the Board requested that each of the Advisors and Broadmark provide detailed information that the Board determined to be reasonably necessary to evaluate the Advisory Agreementsand Sub-Advisory Agreement. The Independent Trustees held a telephonic meeting of the Board on October 5, 2018 (the“Pre-15(c) Meeting”) to review and discuss the response materials of the Advisors andSub-Advisor in support of the consideration of the Advisory Agreements and theSub-Advisory Agreement. The Independent Trustees alsomet in-person in executive session, without the presence of Advisor orSub-Advisor personnel, prior to the October 23, 2018 meeting to review and discuss aspects of the response materials. At the request of the Independent Trustees, the Advisors made presentations and responded to questions from the Independent Trustees at both thePre-15(c) Meeting and the October 23, 2018 meeting. The Board, including the Independent Trustees, also took into consideration information furnished for the Board’s review and consideration throughout the year at regular Board meetings. The Independent Trustees were assisted at all times by independent counsel.
The Independent Trustees reported that they had previously met with counsel in executive session without the presence of Advisor personnel. The Independent Trustees reported that the Advisors’ presentations at thePre-15(c) Meeting and the October 23, 2018 meeting, as well as the extensive discussions among themselves and with counsel including during thePre-15(c) Meeting and executive session, regarding their review of the response materials, left them satisfied that the Advisorsand Sub-Advisor had provided responses to the requests for information adequate to allow for an informed decision regarding renewal of the Advisory Agreementsand Sub-Advisory Agreement. The Independent Trustees reported their conclusion that the continuation of the Advisory Agreementsand Sub-Advisory Agreement should enable the Funds to obtain high quality services at a cost that is appropriate, reasonable, and in the interests of investors. They stated that prudent exercise of judgment warranted the approval of the Advisory Agreementsand Sub-Advisory Agreement. It also was noted that the Board’s decision to approve the continuation of the Advisory Agreementsand Sub-Advisory Agreement was not based on any single factor, but rather was based on a comprehensive consideration of all the information provided to the Board. Upon consideration of these and other factors, the Board also determined:
The nature, extent and quality of the advisory services to be provided. With respect to the Advisory Agreements andSub-Advisory Agreement, as applicable, the Board considered: the background and experience of key investment personnel and the Advisors’ andSub-Advisor’s ability to retain them; the Advisors’ andSub-Advisor’s focus on analysis of complex asset categories; the Advisors’ andSub-Advisor’s disciplined investment approach and commitment to investment principles; the Advisors’ andSub-Advisor’s significant investment in and commitment to personnel; the Advisors’ andSub-Advisor’s significant compliance efforts and risk and general oversight; and the Advisors’ oversight of and interaction with service providers. The Board determined that the Advisors andSub-Advisor had, when necessary, taken steps to address any underperformance. The Board concluded that the nature, extent and quality of the management and advisory service to be provided are appropriate and thus support a decision to approve the Advisory Agreements andSub-Advisory Agreement.
The investment performance of the Funds. The Board evaluated the historical performance of the Funds, and comparative information provided regarding the Funds’ investment performance and information on the performance of other investment funds and various indices. The Board also considered the various performance reports received throughout the year, showing variability of returns over the course of the year. The Board noted that, as a general matter, the Funds had periods of both underperformance and outperformance. On the basis of the Board’s assessment, the Board
52
Board Consideration of the Investment Management Agreement (Unaudited)
concluded that the Advisors andSub-Advisor were capable of generating a level of long-term investment performance that is consistent with shareholder expectations in light of the various Funds’ investment objectives, policies and strategies. Specifically, the Board noted that:
| | • | | the Salient MLP & Energy Infrastructure Fund underperformed its index as of the calendaryear-to-date through June 30, 2018, but outperformed its index for the period since the Fund’s inception through June 30, 2018; and underperformed the median and average performance of its peer group as of the calendaryear-to-date through June 30, 2018, but outperformed the median and average performance of its peer group for the period since the Fund’s inception through June 30, 2018; and |
| | • | | the Salient Tactical Plus Fund underperformed its index as of the calendaryear-to-date through June 30, 2018 and for the period since the Fund’s inception through June 30, 2018; and underperformed the median and average performance of its peer group as of the calendaryear-to-date through June 30, 2018 and for the period since the Fund’s inception through June 30, 2018. |
The cost of advisory service to be provided and profits to be realized by the Advisors andSub-Advisor.In analyzing the cost of services and profitability of the Advisors, the Board considered the revenues and expenses of the Advisors and each Fund’s size. The Board took into account the significant investment by and cost to the Advisors regarding investment management infrastructure to support the Funds and other support for investors. In addition, the Board recognized the subjective nature of determining profitability. Further, the Independent Trustees recognized the difficulties in making comparisons as the profitability of other advisers generally is not publicly available and the profitability information that is available for certain advisers or management firms may not be representative of the industry and may be affected by, among other things, the adviser’s particular business mix, capital costs, types of funds managed and expense allocations. On the basis of the Board’s review of the fees charged by the Advisors for investment advisory and related services (including to their other clients, if applicable), the specialized nature of the Funds’ investment programs, the Advisors’ financial information, and the costs associated with managing the Funds, the Board concluded that the level of investment management fees and the Advisors’ profitability are reasonable in light of the services provided and the management fees and overall expense ratios of comparable funds and other clients of the Advisors.
With respect to the fees paid to theSub-Advisor, the Board considered information regarding thesub-advisory fees charged by theSub-Advisor to its other clients (if applicable). The Board considered the operating results and financial condition of theSub-Advisor based on the financial information theSub-Advisor had provided. The Trustees noted that it was difficult to accurately determine or evaluate the profitability of theSub-Advisory Agreement because theSub-Advisor managed assets other than those of the Salient Tactical Plus Fund or has multiple business lines and, further, that any such assessment would involve assumptions regarding theSub-Advisor’s allocation policies, capital structure, cost of capital, business mix, and other factors. Based on the prior information provided and the nature of the negotiation underlying theSub-Advisory Agreement, the Board concluded that it was reasonable to infer that theSub-Advisor’s profitability with respect to the Salient Tactical Plus Fund was not excessive and that thesub-advisory fees received by theSub-Advisor out of the management fee for the Salient Tactical Plus Fund were reasonable in light of the services provided to the Salient Tactical Plus Fund.
The extent to which economies of scale would be realized as the Funds grow and whether fee levels reflect these economies of scale.While noting that the management fees will not decrease as the level of the Funds’ assets increase, the Board noted the Advisors’ expense limitation agreements in place and that the Advisors and not the Funds pay thesub-advisory fees, and concluded that each Fund’s management fee andsub-advisory fee (as applicable) is reasonable under the current circumstances. The Board noted that it will have the opportunity to periodicallyre-examine whether the Funds have achieved economies of scale, as well as the appropriateness of management fees andsub-advisory fees payable to the Advisors andSub-Advisor, respectively.
Benefits (such as soft dollars) to the Advisors andSub-Advisor from their relationships with the Funds. The Board concluded that other benefits derived by the Advisors andSub-Advisor from their relationship with the Funds, to the extent such benefits are identifiable or determinable, are reasonable and fair, result from the provision of appropriate services to the Funds and investors therein, and are consistent with industry practice and the best interests of the Funds and their shareholders. In this regard, the Board noted that it has received regular reports from theSub-Advisor regarding its soft dollar policies and usage. The Board also noted that although Salient Advisors may in the future use soft dollars, it has not done so
53
Board Consideration of the Investment Management Agreement (Unaudited)
to date and has not realized “soft dollar” benefits from a relationship with the Funds. The Board discussed the potential for otherfall-out benefits to the Advisors andSub-Advisor, including reputational benefits and the potential for growth of the Advisors’ andSub-Advisor’s separate account business or other business lines through association with the Funds, and concluded that such benefits are reasonable and typical of those potentially enjoyed by managers of publicly offered mutual funds.
Other considerations. The Board determined that the Advisors andSub-Advisor have made a substantial commitment both to the recruitment and retention of high quality personnel, monitoring and investment decision-making and provision of service, as well as the financial, compliance and operational resources reasonably necessary to manage the Funds in a professional manner that is consistent with the best interests of the Funds and their shareholders, and noted the significant financial, reputational, enterprise and litigation and regulatory risk undertaken by the Advisors andSub-Advisor as managers of publicly offered mutual funds.
54
Privacy Policy (Unaudited)
Salient Funds appreciates the privacy concerns and expectations of our customers. We are committed to maintaining a high level of privacy and confidentiality when it comes to your personal information and we use that information only where permitted by law. We recognize that, as our customer, you not only entrust us with your money but with your personal information. Your trust is important to us and you can be sure we will continue our tradition of protecting your personal information. We provide this privacy notice to you so that you may understand our policy with regard to the collection and disclosure of nonpublic personal information (“Information”) pertaining to you.
We collect the following categories of information about you:
| | • | | Information we receive from you on applications or other forms; and |
| | • | | Information about your transactions with us, our affiliates, or others. |
We do not disclose any Information about you or any current or former customer to anyone, except as permitted by law. We may disclose Information about you and any former customer to our affiliates and to nonaffiliated third parties, as permitted by law. We do not disclose personal information that we collect about you to non-affiliated companies except to enable them to provide marketing services on our behalf, to perform joint marketing agreements with other financial institutions, or in other limited circumstances permitted by law. For example, some instances where we may disclose Information about you to third parties include: for servicing and processing transactions, to protect against fraud, for institutional risk control, to respond to judicial process or to perform services on our behalf. When we share personal information about you with these companies, we require them to limit their use of the personal information to the particular purpose for which it was shared and we do not allow them to share your personal information with others except to fulfill that limited purpose. In addition, these companies are required to adhere to our privacy standards with respect to any personal information that we provide them.
Protecting the Security and Confidentiality of Your Information
We restrict access to Information about you to those employees who need to know that Information to provide products or services to you. We maintain physical, electronic, and procedural safeguards to ensure the confidentiality of your Information. Our privacy policies apply only to those individual investors who have a direct customer relationship with us. If you are an individual shareholder of record of any of the Funds, we consider you to be a customer of Salient Funds. Shareholders purchasing or owning shares of any of the Funds through their bank, broker, or other financial institution should consult that financial institution’s privacy policies. If you own shares or receive investment services through a relationship with a third-party broker, bank, investment advisor or other financial service provider, that third-party’s privacy policies will apply to you and ours will not.
55
Investment Advisors
Salient Advisors, L.P.
Salient Capital Advisors, LLC
InvestmentSub-Advisor
Broadmark Asset Management LLC
Administrator
ALPS Fund Services, Inc.
Custodian
Citibank, N.A.
Distributor
Foreside Fund Services LLC
Independent Registered Public Accounting Firm
KPMG LLP
Legal Counsel
K&L Gates LLP
Transfer Agent
ALPS Fund Services, Inc.

4265 San Felipe
8th Floor
Houston, Texas 77027
800-994-0755
www.salientfunds.com
Salient MLP & Energy Infrastructure Fund
Salient Tactical Plus Fund


| | | | |
| Printed on paper containing recycled content using soy-based inks. | | | 12/18 | |
(a) The registrant, as of the end of the period covered by the report, has adopted a code of ethics that applies to the registrant’s principal executive officer, principal financial officer, principal accounting officer or controller, or any persons performing similar functions on behalf of the registrant. The registrant’s Code of Ethics for principal executive and principal financial officers is filed hereto under Item 13(a)(1) on this FormN-CSR.
(b) During the period covered by the report, with respect to the registrant’s code of ethics that applies to its principal executive officer, principal financial officer, principal accounting officer or controller, or persons performing similar functions; there have been no amendments to, nor any waivers granted from, a provision that relates to any element of the code of ethics definition enumerated in paragraph (b) of this Item 2.
| Item 3. | Audit Committee Financial Expert. |
(a)(1) The registrant’s board of directors has determined that the registrant has at least one audit committee financial expert serving on its audit committee.
(a)(2) The registrant’s audit committee financial expert is A. John Gambs. Mr. Gambs is “independent” for purposes of this Item 3of Form N-CSR.
| Item 4. | Principal Accountant Fees and Services. |
Audit Fees
| | (a) | The aggregate fees billed in each of the last two fiscal years for professional services rendered by the principal accountant for the audit of the Funds’ annual financial statements or services that are normally provided by the accountant in connection with statutory and regulatory filings or engagements on behalf of the Funds were $78,000 for the fiscal year ended December 31, 2018 and $146,000 for the fiscal year ended December 31, 2017. |
Audit-Related Fees
| | (b) | The aggregate fees billed in each of the last two fiscal years for assurance and related services by the principal accountant that are reasonably related to the performance of the audit of the Funds’ financial statements and are not reported under paragraph (a) of this Item on behalf of the Funds were $4,700 for the fiscal year ended December 31, 2018 and $4,600 for the fiscal year ended December 31, 2017. These services consisted of review of the Funds’ registration statement. |
Tax Fees
| | (c) | The aggregate fees billed to the registrant for professional services rendered by the principal accountant for tax compliance, tax advice and tax planning on behalf of the Funds was $14,835 for the fiscal year ended December 31, 2018 and $20,955 for the fiscal year ended December 31, 2017. These services consisted of professional services related to tax compliance and tax planning, including review of federal and state income tax returns, reviews of excise tax distribution requirements and review of excise tax returns. |
All Other Fees
| | (d) | The aggregate fees billed in each of the last two fiscal years for products and services provided by the principal accountant on behalf of the Funds, other than the services reported in paragraphs (a) through (c) of this Item, were NONE for the fiscal year ended December 31, 2018 and NONE for the fiscal year ended December 31, 2017. |
| | (e)(1) | The registrant’s Audit Committee charter requires that the Audit Committeepre-approve all auditing services andnon-audit services to be performed for the registrant by its Auditor. The registrant’s Audit Committee has established policies and procedures (“Procedures”) forpre-approval of all audit and permissiblenon-audit services provided by its independent accountant (“Auditor”). Under the Procedures, the Audit Committee must approve the engagement of the Auditor to certify the Funds’ financial statements for each fiscal year. In approving this engagement, the Audit Committee shall obtain, review and consider sufficient information concerning the Auditor to enable the Audit Committee to make a reasonable evaluation of the Auditor’s qualifications and independence. The Audit Committee shall also consider the Auditor’s proposed fees for the engagement, in light of the scope and nature of the audit services that the Funds will receive. The Audit Committee will report to the registrant’s Board of Trustees regarding its approval of the engagement and the proposed fees for the engagement, and the basis for such approval. |
Additionally, the Audit Committee maypre-approve certain types ofnon-audit services to the Funds and their service affiliates that are not a prohibited service, as described in the Procedures. The Audit Committee may set limits on fees and other conditions on such services, as it believes to be appropriate. On an annual basis, management of the Funds, in consultation with the Auditor, shall provide to the Audit Committee for its consideration: (i) a list of those types ofnon-audit services, if any, that the Funds may request from the Auditor during the fiscal year; and (ii) a list of those types ofnon-audit services directly impacting the Funds’ operations and financial reporting that service affiliates may request from the Auditor during the fiscal year. In addition, the Procedures permit the Audit Committee topre-approvenon-audit services to the Funds and to its service affiliates on aproject-by-project basis.
| | (e)(2) | The percentage of services described in each of paragraphs (b) through (d) of this Item that were approved by the Audit Committee pursuant to paragraph (c)(7)(i)(C) of Rule2-01 of RegulationS-X are as follows: |
(b) Not applicable
(c) 100%
(d) Not applicable
| | (f) | The percentage of hours expended on the principal accountant’s engagement to audit the registrant’s financial statements for the most recent fiscal year that were attributed to work performed by persons other than the principal accountant’s full-time, permanent employees was zero percent (0%). |
| | (g) | The aggregatenon-audit fees billed by the Funds’ accountant for services rendered to the registrant, and rendered to the Funds’ investment adviser (not including anysub-adviser whose role is primarily portfolio management and is subcontracted with or overseen by another investment adviser), and any entity controlling, controlled by, or under common control with the investment adviser that provides ongoing services to the registrant for each of the last two fiscal years on behalf of the Funds were NONE for the fiscal year ended December 31, 2018 and NONE for the fiscal year ended December 31, 2017. |
| | (h) | The registrant’s Audit Committee of the Board of Trustees has considered whether the provision ofnon-audit services that were rendered to the registrant’s investment adviser (not including anysub-adviser whose role is primarily portfolio management and is subcontracted with or overseen by another investment adviser), and any entity controlling, controlled by, or under common control with the investment adviser that provides ongoing services to the registrant that were notpre-approved pursuant to paragraph (c)(7)(ii) of Rule2-01 of RegulationS-X is compatible with maintaining the principal accountant’s independence. |
| Item 5. | Audit Committee of Listed Registrants. |
Not applicable.
| | (a) | The registrant’s Schedules of Investments in securities of unaffiliated issuers as of the close of the reporting period are included as part of the Report to Stockholders filed under Item 1 of FormN-CSR. |
| Item 7. | Disclosure of Proxy Voting Policies and Procedures forClosed-End Management Investment Companies. |
Not applicable.
| Item 8. | Portfolio Managers ofClosed-End Management Investment Companies. |
Not applicable.
| Item 9. | Purchases of Equity Securities byClosed-End Management Investment Company and Affiliated Purchasers. |
Not applicable.
| Item 10. | Submission of Matters to a Vote of Security Holders. |
No material changes to the procedures by which the shareholders may recommend nominees to the registrant’s Board of Trustees have been implemented after the registrant’s last provided disclosure in response to the requirements of Item 407(c)(2)(iv) of RegulationS-K (17 CFR 229.407) (as required by Item 22(b)(15) of Schedule 14A (17 CFR240.14a-101)), or this Item.
| Item 11. | Controls and Procedures. |
| | (a) | The registrant’s principal executive officer and principal financial officer have concluded, based on their evaluation of the registrant’s disclosure controls and procedures as conducted within 90 days of the filing date of this report, that these disclosure controls and procedures are adequately designed and are operating effectively to ensure that information required to be disclosed by the registrant on FormN-CSR is (i) accumulated and communicated to the investment company’s management, including its certifying officers, to allow timely decisions regarding required disclosure; and (ii) recorded, processed, summarized and reported within the time periods specified in the Securities and Exchange Commission’s rules and forms. |
| | (b) | There were no changes in the registrant’s internal control over financial reporting (as defined in Rule30a-3(d) under the Act (17 CFR270.30a-3(d)) that occurred during the period covered by this report that have materially affected, or are reasonably likely to materially affect, the registrant’s internal control over financial reporting. |
| Item 12. | Disclosure of Securities Lending Activities forClosed-End Management Investment Companies. |
Not applicable.
| | (a)(1) | Code of ethics that is subject to Item 2 is attached hereto. |
| | (a)(2) | Certifications pursuant to Rule30a-2(a) under the Act (17 CFR30a-2(a)) are attached hereto. |
| | (b) | Certifications pursuant to Rule30a-2(b) under the Act (17 CFR30a-2(b)) and Section 1350 of Chapter 63 of Title 18 of the United States Code (18 U.S.C. 1350) are attached hereto. |
SIGNATURES
Pursuant to the requirements of the Securities Exchange Act of 1934 and the Investment Company Act of 1940, the registrant has duly caused this report to be signed on its behalf by the undersigned, thereunto duly authorized.
| | |
Salient MF Trust |
| |
By: | | /s/ John A. Blaisdell |
| | John A. Blaisdell |
| | Principal Executive Officer |
| |
Date: | | March 7, 2019 |
Pursuant to the requirements of the Securities Exchange Act of 1934 and the Investment Company Act of 1940, this report has been signed below by the following persons on behalf of the registrant and in the capacities and on the dates indicated.
| | |
By: | | /s/ John A. Blaisdell |
| | John A. Blaisdell |
| | Principal Executive Officer |
| |
Date: | | March 7, 2019 |
| |
By: | | /s/ Barbara H. Tolle |
| | Barbara H. Tolle |
| | Principal Financial Officer |
| |
Date: | | March 7, 2019 |