UNITED STATES
SECURITIES AND EXCHANGE COMMISSION
WASHINGTON, D.C. 20549
FORM N-CSR
CERTIFIED SHAREHOLDER REPORT OF REGISTERED MANAGEMENT
INVESTMENT COMPANIES
| Investment Company Act file number | 811-22655 |
| Northern Lights Fund Trust III |
| (Exact name of registrant as specified in charter) |
| 225 Pictoria Drive, Suite 450, Cincinnati, Ohio | 45246 |
| (Address of principal executive offices) | (Zip code) |
| The Corporation Trust Company |
| 1209 Orange Street Wilmington, DE 19801 |
| (Name and address of agent for service) |
| Registrant’s telephone number, including area code: | 631-490-4300 |
| Date of fiscal year end: | 6/30 |
| | |
| Date of reporting period: | 6/30/24 |
Item 1. Reports to Stockholders.
(a)
HCM Dividend Sector Plus Fund
Annual Shareholder Report - June 30, 2024
This annual shareholder report contains important information about HCM Dividend Sector Plus Fund for the period of July 1, 2023 to June 30, 2024.You can find additional information about the Fund at www.howardcmfunds.com/resources/. You can also request this information by contacting us at 1-855-969-8464. This report describes changes to the Fund that occurred during the reporting period.
What were the Fund’s costs for the last year?
(based on a hypothetical $10,000 investment)
| Class Name | Costs of a $10,000 investment | Costs paid as a percentage of a $10,000 investment |
|---|
| Class A1 Shares | $177 | 1.77% |
How did the Fund perform during the reporting period?
In the early part of the third quarter of 2023 equity markets continued their upward trajectory. However, by August and September 2023 several factors began to weigh on the major indices. Renewed inflation fears and concerns about economic slowdown weighed heavily on the equity markets. October saw continued downward pressure with additional geopolitical concerns around the Israel- Hamas conflict. This downward pressure caused the HCM-BuyLine® to go negative, pushing us to reduce exposure. The downtrend, as determined by the HCM-BuyLine®, was short-lived as the markets staged an impressive reversal thanks to a dovish pivot from the Federal Reserve accompanied by solid economic activity and declining inflation. This reversal quickly pushed us back above the HCM-BuyLine® resulting in us deploying cash back into the markets. The 2023 rally continued into 2024 with no signs of slowing down. However, April 2024 saw a pickup in volatility as fears of no rate cuts in 2024, or even a rate hike, pressured stocks. The higher than expected March Consumer Price Index (CPI) reversed several months of declines in CPI reports and the markets sold off quickly. This swift selloff triggered several HCM Pivot Point® sell stops. Quickly liquidating leveraged ETF positions helped us significantly limit our drawdown. Cash was quickly redeployed as the HCM Pivot Point® turned back up. All the money we took off was reinvested at a lower price. Following dovish comments from Fed Chair Powell at the May 1, 2024 Federal Open Market Committee (FOMC) meeting, markets continued to climb. The resumption of disinflation and increased rate cut expectations fueled the S&P 500 to new highs as we were well positioned to take part in this powerful move higher. HCM Dividend Sector Plus underperformance compared to the S&P 500 over the 1-year period can be attributed to investment in dividend focused ETFs. As we look beyond the reporting period, we remain cautiously optimistic. The HCM-BuyLine® and HCM Pivot Point® will be our compass and we are confident it will lead us in the right direction.
How has the Fund performed since inception?
Total Return Based on $10,000 Investment
| HCM Dividend Sector Plus Fund | HCM Dividend Sector Plus Fund - with load | S&P 500® Index |
|---|
| 03/11/15 | $10,000 | $9,425 | $10,000 |
| 06/30/15 | $10,150 | $9,566 | $10,172 |
| 06/30/16 | $11,176 | $10,534 | $10,578 |
| 06/30/17 | $14,001 | $13,196 | $12,472 |
| 06/30/18 | $15,697 | $14,794 | $14,264 |
| 06/30/19 | $14,921 | $14,063 | $15,750 |
| 06/30/20 | $16,404 | $15,461 | $16,932 |
| 06/30/21 | $26,105 | $24,604 | $23,840 |
| 06/30/22 | $23,639 | $22,280 | $21,309 |
| 06/30/23 | $26,474 | $24,952 | $25,484 |
| 06/30/24 | $32,301 | $30,444 | $31,742 |
Average Annual Total Returns
| 1 Year | 5 Years | Since Inception (3/11/2015) |
|---|
| HCM Dividend Sector Plus Fund | | | |
| Without Load | 22.01% | 16.70% | 13.43% |
| With Load | 14.96% | 15.33% | 12.71% |
S&P 500® Index | 24.56% | 15.05% | 13.22% |
The Fund's past performance is not a good predictor of how the Fund will perform in the future. The graph and table do not reflect the deduction of taxes that a shareholder would pay on fund distributions or redemption of fund shares.
- Net Assets$1,613,490,160
- Number of Portfolio Holdings58
- Advisory Fee $17,428,457
- Portfolio Turnover108%
Asset Weighting (% of total investments)
| Value | Value |
|---|
| Common Stocks | 10.7% |
| Exchange-Traded Funds | 89.3% |
What did the Fund invest in?
Sector Weighting (% of net assets)
| Value | Value |
|---|
| Other Assets in Excess of Liabilities | 0.5% |
| Materials | 0.8% |
| Energy | 0.9% |
| Consumer Staples | 1.0% |
| Technology | 1.0% |
| Health Care | 1.0% |
| Utilities | 1.1% |
| Industrials | 1.1% |
| Communications | 1.2% |
| Financials | 1.2% |
| Consumer Discretionary | 1.3% |
| Equity | 88.9% |
Top 10 Holdings (% of net assets)
| Holding Name | % of Net Assets |
| ProShares Ultra QQQ | 20.8% |
| Vanguard Dividend Appreciation ETF | 19.3% |
| Direxion Daily S&P 500 Bull 3X | 18.6% |
| SPDR S&P 500 ETF Trust | 10.9% |
| ProShares Ultra S&P500 | 9.6% |
| Vanguard High Dividend Yield ETF | 7.7% |
| iShares Select Dividend ETF | 1.7% |
| Synchrony Financial | 0.3% |
| Vanguard Growth ETF | 0.3% |
| Citigroup, Inc. | 0.3% |
Effective February 26, 2024, the Adviser agreed to revise the annual advisory fee for the Fund at an annual rate of 1.25% of the Fund’s average daily net assets up to $2 billion, 1.20% on assets between $2 billion and $3 billion and 1.15% on assets greater than 3 billion.
HCM Dividend Sector Plus Fund - Class A1 Shares (HCMWX)
Annual Shareholder Report - June 30, 2024
Where can I find additional information about the Fund?
Additional information is available on the Fund's website (www.howardcmfunds.com/resources/), including its:
Prospectus
Financial information
Holdings
Proxy voting information
HCM Dividend Sector Plus Fund
Annual Shareholder Report - June 30, 2024
This annual shareholder report contains important information about HCM Dividend Sector Plus Fund for the period of July 1, 2023 to June 30, 2024.You can find additional information about the Fund at www.howardcmfunds.com/resources/. You can also request this information by contacting us at 1-855-969-8464. This report describes changes to the Fund that occurred during the reporting period.
What were the Fund’s costs for the last year?
(based on a hypothetical $10,000 investment)
| Class Name | Costs of a $10,000 investment | Costs paid as a percentage of a $10,000 investment |
|---|
| Class A Shares | $162 | 1.62% |
How did the Fund perform during the reporting period?
In the early part of the third quarter of 2023 equity markets continued their upward trajectory. However, by August and September 2023 several factors began to weigh on the major indices. Renewed inflation fears and concerns about economic slowdown weighed heavily on the equity markets. October saw continued downward pressure with additional geopolitical concerns around the Israel- Hamas conflict. This downward pressure caused the HCM-BuyLine® to go negative, pushing us to reduce exposure. The downtrend, as determined by the HCM-BuyLine®, was short-lived as the markets staged an impressive reversal thanks to a dovish pivot from the Federal Reserve accompanied by solid economic activity and declining inflation. This reversal quickly pushed us back above the HCM-BuyLine® resulting in us deploying cash back into the markets. The 2023 rally continued into 2024 with no signs of slowing down. However, April 2024 saw a pickup in volatility as fears of no rate cuts in 2024, or even a rate hike, pressured stocks. The higher than expected March Consumer Price Index (CPI) reversed several months of declines in CPI reports and the markets sold off quickly. This swift selloff triggered several HCM Pivot Point® sell stops. Quickly liquidating leveraged ETF positions helped us significantly limit our drawdown. Cash was quickly redeployed as the HCM Pivot Point® turned back up. All the money we took off was reinvested at a lower price. Following dovish comments from Fed Chair Powell at the May 1, 2024 Federal Open Market Committee (FOMC) meeting, markets continued to climb. The resumption of disinflation and increased rate cut expectations fueled the S&P 500 to new highs as we were well positioned to take part in this powerful move higher. HCM Dividend Sector Plus underperformance compared to the S&P 500 over the 1-year period can be attributed to investment in dividend focused ETFs. As we look beyond the reporting period, we remain cautiously optimistic. The HCM-BuyLine® and HCM Pivot Point® will be our compass and we are confident it will lead us in the right direction.
How has the Fund performed since inception?
Total Return Based on $10,000 Investment
| HCM Dividend Sector Plus Fund | HCM Dividend Sector Plus Fund - with load | S&P 500® Index |
|---|
| 03/11/15 | $10,000 | $9,425 | $10,000 |
| 06/30/15 | $10,150 | $9,566 | $10,172 |
| 06/30/16 | $11,176 | $10,534 | $10,578 |
| 06/30/17 | $14,012 | $13,206 | $12,472 |
| 06/30/18 | $15,730 | $14,825 | $14,264 |
| 06/30/19 | $14,975 | $14,114 | $15,750 |
| 06/30/20 | $16,481 | $15,533 | $16,932 |
| 06/30/21 | $26,295 | $24,783 | $23,840 |
| 06/30/22 | $23,852 | $22,481 | $21,309 |
| 06/30/23 | $26,754 | $25,216 | $25,484 |
| 06/30/24 | $32,689 | $30,810 | $31,742 |
Average Annual Total Returns
| 1 Year | 5 Years | Since Inception (3/11/2015) |
|---|
| HCM Dividend Sector Plus Fund | | | |
| Without Load | 22.18% | 16.90% | 13.58% |
| With Load | 15.17% | 15.52% | 12.86% |
S&P 500® Index | 24.56% | 15.05% | 13.22% |
The Fund's past performance is not a good predictor of how the Fund will perform in the future. The graph and table do not reflect the deduction of taxes that a shareholder would pay on fund distributions or redemption of fund shares.
- Net Assets$1,613,490,160
- Number of Portfolio Holdings58
- Advisory Fee $17,428,457
- Portfolio Turnover108%
Asset Weighting (% of total investments)
| Value | Value |
|---|
| Common Stocks | 10.7% |
| Exchange-Traded Funds | 89.3% |
What did the Fund invest in?
Sector Weighting (% of net assets)
| Value | Value |
|---|
| Other Assets in Excess of Liabilities | 0.5% |
| Materials | 0.8% |
| Energy | 0.9% |
| Consumer Staples | 1.0% |
| Technology | 1.0% |
| Health Care | 1.0% |
| Utilities | 1.1% |
| Industrials | 1.1% |
| Communications | 1.2% |
| Financials | 1.2% |
| Consumer Discretionary | 1.3% |
| Equity | 88.9% |
Top 10 Holdings (% of net assets)
| Holding Name | % of Net Assets |
| ProShares Ultra QQQ | 20.8% |
| Vanguard Dividend Appreciation ETF | 19.3% |
| Direxion Daily S&P 500 Bull 3X | 18.6% |
| SPDR S&P 500 ETF Trust | 10.9% |
| ProShares Ultra S&P500 | 9.6% |
| Vanguard High Dividend Yield ETF | 7.7% |
| iShares Select Dividend ETF | 1.7% |
| Synchrony Financial | 0.3% |
| Vanguard Growth ETF | 0.3% |
| Citigroup, Inc. | 0.3% |
Effective February 26, 2024, the Adviser agreed to revise the annual advisory fee for the Fund at an annual rate of 1.25% of the Fund’s average daily net assets up to $2 billion, 1.20% on assets between $2 billion and $3 billion and 1.15% on assets greater than 3 billion.
HCM Dividend Sector Plus Fund - Class A Shares (HCMNX)
Annual Shareholder Report - June 30, 2024
Where can I find additional information about the Fund?
Additional information is available on the Fund's website (www.howardcmfunds.com/resources/), including its:
Prospectus
Financial information
Holdings
Proxy voting information
HCM Dividend Sector Plus Fund
Annual Shareholder Report - June 30, 2024
This annual shareholder report contains important information about HCM Dividend Sector Plus Fund for the period of July 1, 2023 to June 30, 2024.You can find additional information about the Fund at www.howardcmfunds.com/resources/. You can also request this information by contacting us at 1-855-969-8464. This report describes changes to the Fund that occurred during the reporting period.
What were the Fund’s costs for the last year?
(based on a hypothetical $10,000 investment)
| Class Name | Costs of a $10,000 investment | Costs paid as a percentage of a $10,000 investment |
|---|
| Class I Shares | $137 | 1.37% |
How did the Fund perform during the reporting period?
In the early part of the third quarter of 2023 equity markets continued their upward trajectory. However, by August and September 2023 several factors began to weigh on the major indices. Renewed inflation fears and concerns about economic slowdown weighed heavily on the equity markets. October saw continued downward pressure with additional geopolitical concerns around the Israel- Hamas conflict. This downward pressure caused the HCM-BuyLine® to go negative, pushing us to reduce exposure. The downtrend, as determined by the HCM-BuyLine®, was short-lived as the markets staged an impressive reversal thanks to a dovish pivot from the Federal Reserve accompanied by solid economic activity and declining inflation. This reversal quickly pushed us back above the HCM-BuyLine® resulting in us deploying cash back into the markets. The 2023 rally continued into 2024 with no signs of slowing down. However, April 2024 saw a pickup in volatility as fears of no rate cuts in 2024, or even a rate hike, pressured stocks. The higher than expected March Consumer Price Index (CPI) reversed several months of declines in CPI reports and the markets sold off quickly. This swift selloff triggered several HCM Pivot Point® sell stops. Quickly liquidating leveraged ETF positions helped us significantly limit our drawdown. Cash was quickly redeployed as the HCM Pivot Point® turned back up. All the money we took off was reinvested at a lower price. Following dovish comments from Fed Chair Powell at the May 1, 2024 Federal Open Market Committee (FOMC) meeting, markets continued to climb. The resumption of disinflation and increased rate cut expectations fueled the S&P 500 to new highs as we were well positioned to take part in this powerful move higher. HCM Dividend Sector Plus underperformance compared to the S&P 500 over the 1-year period can be attributed to investment in dividend focused ETFs. As we look beyond the reporting period, we remain cautiously optimistic. The HCM-BuyLine® and HCM Pivot Point® will be our compass and we are confident it will lead us in the right direction.
How has the Fund performed since inception?
Total Return Based on $50,000 Investment
| HCM Dividend Sector Plus Fund | S&P 500® Index |
|---|
| Mar-15 | $50,000 | $50,000 |
| Jun-15 | 50,750 | 50,862 |
| Jun-16 | 55,881 | 52,892 |
| Jun-17 | 70,060 | 62,358 |
| Jun-18 | 78,643 | 71,322 |
| Jun-19 | 74,870 | 78,751 |
| Jun-20 | 82,685 | 84,662 |
| Jun-21 | 132,296 | 119,199 |
| Jun-22 | 120,326 | 106,545 |
| Jun-23 | 135,301 | 127,421 |
| Jun-24 | 165,752 | 158,711 |
Average Annual Total Returns
| 1 Year | 5 Years | 10 Years |
|---|
| HCM Dividend Sector Plus Fund | 22.51% | 17.23% | 13.75% |
S&P 500® Index | 24.56% | 15.05% | 13.22% |
The Fund's past performance is not a good predictor of how the Fund will perform in the future. The graph and table do not reflect the deduction of taxes that a shareholder would pay on fund distributions or redemption of fund shares.
- Net Assets$1,613,490,160
- Number of Portfolio Holdings58
- Advisory Fee $17,428,457
- Portfolio Turnover108%
Asset Weighting (% of total investments)
| Value | Value |
|---|
| Common Stocks | 10.7% |
| Exchange-Traded Funds | 89.3% |
What did the Fund invest in?
Sector Weighting (% of net assets)
| Value | Value |
|---|
| Other Assets in Excess of Liabilities | 0.5% |
| Materials | 0.8% |
| Energy | 0.9% |
| Consumer Staples | 1.0% |
| Technology | 1.0% |
| Health Care | 1.0% |
| Utilities | 1.1% |
| Industrials | 1.1% |
| Communications | 1.2% |
| Financials | 1.2% |
| Consumer Discretionary | 1.3% |
| Equity | 88.9% |
Top 10 Holdings (% of net assets)
| Holding Name | % of Net Assets |
| ProShares Ultra QQQ | 20.8% |
| Vanguard Dividend Appreciation ETF | 19.3% |
| Direxion Daily S&P 500 Bull 3X | 18.6% |
| SPDR S&P 500 ETF Trust | 10.9% |
| ProShares Ultra S&P500 | 9.6% |
| Vanguard High Dividend Yield ETF | 7.7% |
| iShares Select Dividend ETF | 1.7% |
| Synchrony Financial | 0.3% |
| Vanguard Growth ETF | 0.3% |
| Citigroup, Inc. | 0.3% |
Effective February 26, 2024, the Adviser agreed to revise the annual advisory fee for the Fund at an annual rate of 1.25% of the Fund’s average daily net assets up to $2 billion, 1.20% on assets between $2 billion and $3 billion and 1.15% on assets greater than 3 billion.
HCM Dividend Sector Plus Fund - Class I Shares (HCMQX)
Annual Shareholder Report - June 30, 2024
Where can I find additional information about the Fund?
Additional information is available on the Fund's website (www.howardcmfunds.com/resources/), including its:
Prospectus
Financial information
Holdings
Proxy voting information
HCM Dividend Sector Plus Fund
Annual Shareholder Report - June 30, 2024
This annual shareholder report contains important information about HCM Dividend Sector Plus Fund for the period of July 1, 2023 to June 30, 2024.You can find additional information about the Fund at www.howardcmfunds.com/resources/. You can also request this information by contacting us at 1-855-969-8464. This report describes changes to the Fund that occurred during the reporting period.
What were the Fund’s costs for the last year?
(based on a hypothetical $10,000 investment)
| Class Name | Costs of a $10,000 investment | Costs paid as a percentage of a $10,000 investment |
|---|
| Class R Shares | $147 | 1.47% |
How did the Fund perform during the reporting period?
In the early part of the third quarter of 2023 equity markets continued their upward trajectory. However, by August and September 2023 several factors began to weigh on the major indices. Renewed inflation fears and concerns about economic slowdown weighed heavily on the equity markets. October saw continued downward pressure with additional geopolitical concerns around the Israel- Hamas conflict. This downward pressure caused the HCM-BuyLine® to go negative, pushing us to reduce exposure. The downtrend, as determined by the HCM-BuyLine®, was short-lived as the markets staged an impressive reversal thanks to a dovish pivot from the Federal Reserve accompanied by solid economic activity and declining inflation. This reversal quickly pushed us back above the HCM-BuyLine® resulting in us deploying cash back into the markets. The 2023 rally continued into 2024 with no signs of slowing down. However, April 2024 saw a pickup in volatility as fears of no rate cuts in 2024, or even a rate hike, pressured stocks. The higher than expected March Consumer Price Index (CPI) reversed several months of declines in CPI reports and the markets sold off quickly. This swift selloff triggered several HCM Pivot Point® sell stops. Quickly liquidating leveraged ETF positions helped us significantly limit our drawdown. Cash was quickly redeployed as the HCM Pivot Point® turned back up. All the money we took off was reinvested at a lower price. Following dovish comments from Fed Chair Powell at the May 1, 2024 Federal Open Market Committee (FOMC) meeting, markets continued to climb. The resumption of disinflation and increased rate cut expectations fueled the S&P 500 to new highs as we were well positioned to take part in this powerful move higher. HCM Dividend Sector Plus underperformance compared to the S&P 500 over the 1-year period can be attributed to investment in dividend focused ETFs. As we look beyond the reporting period, we remain cautiously optimistic. The HCM-BuyLine® and HCM Pivot Point® will be our compass and we are confident it will lead us in the right direction.
How has the Fund performed since inception?
Total Return Based on $10,000 Investment
| HCM Dividend Sector Plus Fund | S&P 500® Index |
|---|
| Mar-2015 | $10,000 | $10,000 |
| Jun-2015 | $10,150 | $10,172 |
| Jun-2016 | $11,176 | $10,578 |
| Jun-2017 | $14,012 | $12,472 |
| Jun-2018 | $15,730 | $14,264 |
| Jun-2019 | $14,975 | $15,750 |
| Jun-2020 | $16,520 | $16,932 |
| Jun-2021 | $26,358 | $23,840 |
| Jun-2022 | $23,909 | $21,309 |
| Jun-2023 | $26,818 | $25,484 |
| Jun-2024 | $32,772 | $31,742 |
Average Annual Total Returns
| 1 Year | 5 Years | 10 Years |
|---|
| HCM Dividend Sector Plus Fund | 22.20% | 16.96% | 13.61% |
S&P 500® Index | 24.56% | 15.05% | 13.22% |
The Fund's past performance is not a good predictor of how the Fund will perform in the future. The graph and table do not reflect the deduction of taxes that a shareholder would pay on fund distributions or redemption of fund shares.
- Net Assets$1,613,490,160
- Number of Portfolio Holdings58
- Advisory Fee $17,428,457
- Portfolio Turnover108%
Asset Weighting (% of total investments)
| Value | Value |
|---|
| Common Stocks | 10.7% |
| Exchange-Traded Funds | 89.3% |
What did the Fund invest in?
Sector Weighting (% of net assets)
| Value | Value |
|---|
| Other Assets in Excess of Liabilities | 0.5% |
| Materials | 0.8% |
| Energy | 0.9% |
| Consumer Staples | 1.0% |
| Technology | 1.0% |
| Health Care | 1.0% |
| Utilities | 1.1% |
| Industrials | 1.1% |
| Communications | 1.2% |
| Financials | 1.2% |
| Consumer Discretionary | 1.3% |
| Equity | 88.9% |
Top 10 Holdings (% of net assets)
| Holding Name | % of Net Assets |
| ProShares Ultra QQQ | 20.8% |
| Vanguard Dividend Appreciation ETF | 19.3% |
| Direxion Daily S&P 500 Bull 3X | 18.6% |
| SPDR S&P 500 ETF Trust | 10.9% |
| ProShares Ultra S&P500 | 9.6% |
| Vanguard High Dividend Yield ETF | 7.7% |
| iShares Select Dividend ETF | 1.7% |
| Synchrony Financial | 0.3% |
| Vanguard Growth ETF | 0.3% |
| Citigroup, Inc. | 0.3% |
Effective February 26, 2024, the Adviser agreed to revise the annual advisory fee for the Fund at an annual rate of 1.25% of the Fund’s average daily net assets up to $2 billion, 1.20% on assets between $2 billion and $3 billion and 1.15% on assets greater than 3 billion.
HCM Dividend Sector Plus Fund - Class R Shares (HCMZX)
Annual Shareholder Report - June 30, 2024
Where can I find additional information about the Fund?
Additional information is available on the Fund's website (www.howardcmfunds.com/resources/), including its:
Prospectus
Financial information
Holdings
Proxy voting information
HCM Dividend Sector Plus Fund
Investor Class Shares (HCMPX)
Annual Shareholder Report - June 30, 2024
This annual shareholder report contains important information about HCM Dividend Sector Plus Fund for the period of July 1, 2023 to June 30, 2024.You can find additional information about the Fund at www.howardcmfunds.com/resources/. You can also request this information by contacting us at 1-855-969-8464. This report describes changes to the Fund that occurred during the reporting period.
What were the Fund’s costs for the last year?
(based on a hypothetical $10,000 investment)
| Class Name | Costs of a $10,000 investment | Costs paid as a percentage of a $10,000 investment |
|---|
| Investor Class Shares | $237 | 2.37% |
How did the Fund perform during the reporting period?
In the early part of the third quarter of 2023 equity markets continued their upward trajectory. However, by August and September 2023 several factors began to weigh on the major indices. Renewed inflation fears and concerns about economic slowdown weighed heavily on the equity markets. October saw continued downward pressure with additional geopolitical concerns around the Israel- Hamas conflict. This downward pressure caused the HCM-BuyLine® to go negative, pushing us to reduce exposure. The downtrend, as determined by the HCM-BuyLine®, was short-lived as the markets staged an impressive reversal thanks to a dovish pivot from the Federal Reserve accompanied by solid economic activity and declining inflation. This reversal quickly pushed us back above the HCM-BuyLine® resulting in us deploying cash back into the markets. The 2023 rally continued into 2024 with no signs of slowing down. However, April 2024 saw a pickup in volatility as fears of no rate cuts in 2024, or even a rate hike, pressured stocks. The higher than expected March Consumer Price Index (CPI) reversed several months of declines in CPI reports and the markets sold off quickly. This swift selloff triggered several HCM Pivot Point® sell stops. Quickly liquidating leveraged ETF positions helped us significantly limit our drawdown. Cash was quickly redeployed as the HCM Pivot Point® turned back up. All the money we took off was reinvested at a lower price. Following dovish comments from Fed Chair Powell at the May 1, 2024 Federal Open Market Committee (FOMC) meeting, markets continued to climb. The resumption of disinflation and increased rate cut expectations fueled the S&P 500 to new highs as we were well positioned to take part in this powerful move higher. HCM Dividend Sector Plus underperformance compared to the S&P 500 over the 1-year period can be attributed to investment in dividend focused ETFs. As we look beyond the reporting period, we remain cautiously optimistic. The HCM-BuyLine® and HCM Pivot Point® will be our compass and we are confident it will lead us in the right direction.
How has the Fund performed since inception?
Total Return Based on $10,000 Investment
| HCM Dividend Sector Plus Fund | S&P 500® Index |
|---|
| Mar-2015 | $10,000 | $10,000 |
| Jun-2015 | $10,150 | $10,172 |
| Jun-2016 | $11,090 | $10,578 |
| Jun-2017 | $13,806 | $12,472 |
| Jun-2018 | $15,386 | $14,264 |
| Jun-2019 | $14,529 | $15,750 |
| Jun-2020 | $15,877 | $16,932 |
| Jun-2021 | $25,149 | $23,840 |
| Jun-2022 | $22,631 | $21,309 |
| Jun-2023 | $25,198 | $25,484 |
| Jun-2024 | $30,560 | $31,742 |
Average Annual Total Returns
| 1 Year | 5 Years | 10 Years |
|---|
| HCM Dividend Sector Plus Fund | 21.28% | 16.03% | 12.76% |
S&P 500® Index | 24.56% | 15.05% | 13.22% |
The Fund's past performance is not a good predictor of how the Fund will perform in the future. The graph and table do not reflect the deduction of taxes that a shareholder would pay on fund distributions or redemption of fund shares.
- Net Assets$1,613,490,160
- Number of Portfolio Holdings58
- Advisory Fee $17,428,457
- Portfolio Turnover108%
Asset Weighting (% of total investments)
| Value | Value |
|---|
| Common Stocks | 10.7% |
| Exchange-Traded Funds | 89.3% |
What did the Fund invest in?
Sector Weighting (% of net assets)
| Value | Value |
|---|
| Other Assets in Excess of Liabilities | 0.5% |
| Materials | 0.8% |
| Energy | 0.9% |
| Consumer Staples | 1.0% |
| Technology | 1.0% |
| Health Care | 1.0% |
| Utilities | 1.1% |
| Industrials | 1.1% |
| Communications | 1.2% |
| Financials | 1.2% |
| Consumer Discretionary | 1.3% |
| Equity | 88.9% |
Top 10 Holdings (% of net assets)
| Holding Name | % of Net Assets |
| ProShares Ultra QQQ | 20.8% |
| Vanguard Dividend Appreciation ETF | 19.3% |
| Direxion Daily S&P 500 Bull 3X | 18.6% |
| SPDR S&P 500 ETF Trust | 10.9% |
| ProShares Ultra S&P500 | 9.6% |
| Vanguard High Dividend Yield ETF | 7.7% |
| iShares Select Dividend ETF | 1.7% |
| Synchrony Financial | 0.3% |
| Vanguard Growth ETF | 0.3% |
| Citigroup, Inc. | 0.3% |
Effective February 26, 2024, the Adviser agreed to revise the annual advisory fee for the Fund at an annual rate of 1.25% of the Fund’s average daily net assets up to $2 billion, 1.20% on assets between $2 billion and $3 billion and 1.15% on assets greater than 3 billion.
HCM Dividend Sector Plus Fund - Investor Class Shares (HCMPX)
Annual Shareholder Report - June 30, 2024
Where can I find additional information about the Fund?
Additional information is available on the Fund's website (www.howardcmfunds.com/resources/), including its:
Prospectus
Financial information
Holdings
Proxy voting information
Annual Shareholder Report - June 30, 2024
This annual shareholder report contains important information about HCM Dynamic Income Fund for the period of July 1, 2023 to June 30, 2024.You can find additional information about the Fund at www.howardcmfunds.com/resources/. You can also request this information by contacting us at 1-855-969-8464. This report describes changes to the Fund that occurred during the reporting period.
What were the Fund’s costs for the last year?
(based on a hypothetical $10,000 investment)
| Class Name | Costs of a $10,000 investment | Costs paid as a percentage of a $10,000 investment |
|---|
| Class A Shares | $188 | 1.88% |
How did the Fund perform during the reporting period?
In the early part of the third quarter of 2023 bonds continued to consolidate. However, by August and September 2023 several factors began to weigh on the fixed income markets. Renewed inflation fears, escalating global bond yields, and concerns about economic slowdown weighed heavily on bond markets. October saw continued downward pressure with additional geopolitical concerns around the Israel- Hamas conflict. This downward pressure caused the HCM-BuyLine® to go negative, pushing us to reduce exposure. The downtrend, as determined by the HCM-BuyLine®, was short lived as the markets staged an impressive reversal thanks to a dovish pivot from the Federal Reserve accompanied by solid economic activity and declining inflation. This reversal quickly pushed us back above the HCM-BuyLine® resulting in us deploying cash back into the markets. The 2023 rally continued into 2024. Falling inflation and impending Fed rate cuts fueled the markets higher. However, April 2024 saw a pickup in volatility as fears of no rate cuts in 2024, or even a rate hike, pressured capital markets. The higher then expected March Consumer Price Index (CPI) reversed several months of declines in CPI reports and the markets sold off quickly. This swift selloff triggered HCM Pivot Point® sell stops and we moved these positions to cash and short-term treasuries. Quickly liquidating leveraged ETF positions helped us limit our drawdown. Cash was quickly redeployed as the HCM Pivot Point® turned back up. Following dovish comments from Fed Chair Powell at the May 1, 2024 Federal Open Market Committee (FOMC) meeting, markets continued to climb. The resumption of disinflation and increased rate cut expectations fueled the market higher. HCM Dynamic Income performance can be attributed to the fund’s investment in convertible, high yield, investment grade, and short-term US treasury bond ETFs as well as tactical trading of leveraged 20-plus-year treasury bond ETF. As we look beyond the reporting period, we remain cautiously optimistic. The HCM-BuyLine® and HCM Pivot Point® will be our compass and we are confident it will lead us in the right direction.
How has the Fund performed since inception?
Total Return Based on $10,000 Investment
| HCM Dynamic Income Fund | HCM Dynamic Income Fund - with load | Bloomberg U.S. Aggregate Bond Index |
|---|
| 06/30/22 | $10,000 | $9,425 | $10,000 |
| 06/30/23 | $9,784 | $9,222 | $9,906 |
| 06/30/24 | $10,075 | $9,496 | $10,167 |
Average Annual Total Returns
| 1 Year | Since Inception (6/30/2022) |
|---|
| HCM Dynamic Income Fund | | |
| Without Load | 2.97% | 0.38% |
| With Load | | |
| Bloomberg U.S. Aggregate Bond Index | 2.63% | 0.83% |
The Fund's past performance is not a good predictor of how the Fund will perform in the future. The graph and table do not reflect the deduction of taxes that a shareholder would pay on fund distributions or redemption of fund shares.
- Net Assets$123,216,037
- Number of Portfolio Holdings4
- Advisory Fee $1,629,343
- Portfolio Turnover179%
Asset Weighting (% of total investments)
| Value | Value |
|---|
| Exchange-Traded Funds | 100.0% |
What did the Fund invest in?
Sector Weighting (% of net assets)
| Value | Value |
|---|
| Other Assets in Excess of Liabilities | 15.0% |
| Fixed Income | 85.0% |
Top 10 Holdings (% of net assets)
| Holding Name | % of Net Assets |
| SPDR Bloomberg Convertible Securities ETF | 23.8% |
| iShares Convertible Bond ETF | 23.2% |
| SPDR Bloomberg High Yield Bond ETF | 19.4% |
| iShares iBoxx High Yield Corporate Bond ETF | 18.6% |
Effective February 26, 2024, the Adviser agreed to revise the annual advisory fee for the Fund at an annual rate of 1.25% of the Fund’s average daily net assets up to $2 billion, 1.20% on assets between $2 billion and $3 billion and 1.15% on assets greater than 3 billion.
HCM Dynamic Income Fund - Class A Shares (HCMBX)
Annual Shareholder Report - June 30, 2024
Where can I find additional information about the Fund?
Additional information is available on the Fund's website (www.howardcmfunds.com/resources/), including its:
Prospectus
Financial information
Holdings
Proxy voting information
Annual Shareholder Report - June 30, 2024
This annual shareholder report contains important information about HCM Dynamic Income Fund for the period of July 1, 2023 to June 30, 2024.You can find additional information about the Fund at www.howardcmfunds.com/resources/. You can also request this information by contacting us at 1-855-969-8464. This report describes changes to the Fund that occurred during the reporting period.
What were the Fund’s costs for the last year?
(based on a hypothetical $10,000 investment)
| Class Name | Costs of a $10,000 investment | Costs paid as a percentage of a $10,000 investment |
|---|
| Class I Shares | $162 | 1.62% |
How did the Fund perform during the reporting period?
In the early part of the third quarter of 2023 bonds continued to consolidate. However, by August and September 2023 several factors began to weigh on the fixed income markets. Renewed inflation fears, escalating global bond yields, and concerns about economic slowdown weighed heavily on bond markets. October saw continued downward pressure with additional geopolitical concerns around the Israel- Hamas conflict. This downward pressure caused the HCM-BuyLine® to go negative, pushing us to reduce exposure. The downtrend, as determined by the HCM-BuyLine®, was short lived as the markets staged an impressive reversal thanks to a dovish pivot from the Federal Reserve accompanied by solid economic activity and declining inflation. This reversal quickly pushed us back above the HCM-BuyLine® resulting in us deploying cash back into the markets. The 2023 rally continued into 2024. Falling inflation and impending Fed rate cuts fueled the markets higher. However, April 2024 saw a pickup in volatility as fears of no rate cuts in 2024, or even a rate hike, pressured capital markets. The higher then expected March Consumer Price Index (CPI) reversed several months of declines in CPI reports and the markets sold off quickly. This swift selloff triggered HCM Pivot Point® sell stops and we moved these positions to cash and short-term treasuries. Quickly liquidating leveraged ETF positions helped us limit our drawdown. Cash was quickly redeployed as the HCM Pivot Point® turned back up. Following dovish comments from Fed Chair Powell at the May 1, 2024 Federal Open Market Committee (FOMC) meeting, markets continued to climb. The resumption of disinflation and increased rate cut expectations fueled the market higher. HCM Dynamic Income performance can be attributed to the fund’s investment in convertible, high yield, investment grade, and short-term US treasury bond ETFs as well as tactical trading of leveraged 20-plus-year treasury bond ETF. As we look beyond the reporting period, we remain cautiously optimistic. The HCM-BuyLine® and HCM Pivot Point® will be our compass and we are confident it will lead us in the right direction.
How has the Fund performed since inception?
Total Return Based on $50,000 Investment
| HCM Dynamic Income Fund | Bloomberg U.S. Aggregate Bond Index |
|---|
| Jun-22 | $50,000 | $50,000 |
| Jun-23 | 48,971 | 49,531 |
| Jun-24 | 50,510 | 50,834 |
Average Annual Total Returns
| 1 Year | Since Inception (June 30, 2022) |
|---|
| HCM Dynamic Income Fund | 3.14% | 0.51% |
| Bloomberg U.S. Aggregate Bond Index | 2.63% | 0.83% |
The Fund's past performance is not a good predictor of how the Fund will perform in the future. The graph and table do not reflect the deduction of taxes that a shareholder would pay on fund distributions or redemption of fund shares.
- Net Assets$123,216,037
- Number of Portfolio Holdings4
- Advisory Fee $1,629,343
- Portfolio Turnover179%
Asset Weighting (% of total investments)
| Value | Value |
|---|
| Exchange-Traded Funds | 100.0% |
What did the Fund invest in?
Sector Weighting (% of net assets)
| Value | Value |
|---|
| Other Assets in Excess of Liabilities | 15.0% |
| Fixed Income | 85.0% |
Top 10 Holdings (% of net assets)
| Holding Name | % of Net Assets |
| SPDR Bloomberg Convertible Securities ETF | 23.8% |
| iShares Convertible Bond ETF | 23.2% |
| SPDR Bloomberg High Yield Bond ETF | 19.4% |
| iShares iBoxx High Yield Corporate Bond ETF | 18.6% |
Effective February 26, 2024, the Adviser agreed to revise the annual advisory fee for the Fund at an annual rate of 1.25% of the Fund’s average daily net assets up to $2 billion, 1.20% on assets between $2 billion and $3 billion and 1.15% on assets greater than 3 billion.
HCM Dynamic Income Fund - Class I Shares (HCMUX)
Annual Shareholder Report - June 30, 2024
Where can I find additional information about the Fund?
Additional information is available on the Fund's website (www.howardcmfunds.com/resources/), including its:
Prospectus
Financial information
Holdings
Proxy voting information
Investor Class Shares (HCMFX)
Annual Shareholder Report - June 30, 2024
This annual shareholder report contains important information about HCM Dynamic Income Fund for the period of July 1, 2023 to June 30, 2024.You can find additional information about the Fund at www.howardcmfunds.com/resources/. You can also request this information by contacting us at 1-855-969-8464. This report describes changes to the Fund that occurred during the reporting period.
What were the Fund’s costs for the last year?
(based on a hypothetical $10,000 investment)
| Class Name | Costs of a $10,000 investment | Costs paid as a percentage of a $10,000 investment |
|---|
| Investor Class Shares | $262 | 2.62% |
How did the Fund perform during the reporting period?
In the early part of the third quarter of 2023 bonds continued to consolidate. However, by August and September 2023 several factors began to weigh on the fixed income markets. Renewed inflation fears, escalating global bond yields, and concerns about economic slowdown weighed heavily on bond markets. October saw continued downward pressure with additional geopolitical concerns around the Israel- Hamas conflict. This downward pressure caused the HCM-BuyLine® to go negative, pushing us to reduce exposure. The downtrend, as determined by the HCM-BuyLine®, was short lived as the markets staged an impressive reversal thanks to a dovish pivot from the Federal Reserve accompanied by solid economic activity and declining inflation. This reversal quickly pushed us back above the HCM-BuyLine® resulting in us deploying cash back into the markets. The 2023 rally continued into 2024. Falling inflation and impending Fed rate cuts fueled the markets higher. However, April 2024 saw a pickup in volatility as fears of no rate cuts in 2024, or even a rate hike, pressured capital markets. The higher then expected March Consumer Price Index (CPI) reversed several months of declines in CPI reports and the markets sold off quickly. This swift selloff triggered HCM Pivot Point® sell stops and we moved these positions to cash and short-term treasuries. Quickly liquidating leveraged ETF positions helped us limit our drawdown. Cash was quickly redeployed as the HCM Pivot Point® turned back up. Following dovish comments from Fed Chair Powell at the May 1, 2024 Federal Open Market Committee (FOMC) meeting, markets continued to climb. The resumption of disinflation and increased rate cut expectations fueled the market higher. HCM Dynamic Income performance can be attributed to the fund’s investment in convertible, high yield, investment grade, and short-term US treasury bond ETFs as well as tactical trading of leveraged 20-plus-year treasury bond ETF. As we look beyond the reporting period, we remain cautiously optimistic. The HCM-BuyLine® and HCM Pivot Point® will be our compass and we are confident it will lead us in the right direction.
How has the Fund performed since inception?
Total Return Based on $10,000 Investment
| HCM Dynamic Income Fund | Bloomberg U.S. Aggregate Bond Index |
|---|
| Jun-2022 | $10,000 | $10,000 |
| Jun-2023 | $9,794 | $9,906 |
| Jun-2024 | $10,050 | $10,167 |
Average Annual Total Returns
| 1 Year | Since Inception (June 30, 2022) |
|---|
| HCM Dynamic Income Fund | 2.61% | 0.25% |
| Bloomberg U.S. Aggregate Bond Index | 2.63% | 0.83% |
The Fund's past performance is not a good predictor of how the Fund will perform in the future. The graph and table do not reflect the deduction of taxes that a shareholder would pay on fund distributions or redemption of fund shares.
- Net Assets$123,216,037
- Number of Portfolio Holdings4
- Advisory Fee $1,629,343
- Portfolio Turnover179%
Asset Weighting (% of total investments)
| Value | Value |
|---|
| Exchange-Traded Funds | 100.0% |
What did the Fund invest in?
Sector Weighting (% of net assets)
| Value | Value |
|---|
| Other Assets in Excess of Liabilities | 15.0% |
| Fixed Income | 85.0% |
Top 10 Holdings (% of net assets)
| Holding Name | % of Net Assets |
| SPDR Bloomberg Convertible Securities ETF | 23.8% |
| iShares Convertible Bond ETF | 23.2% |
| SPDR Bloomberg High Yield Bond ETF | 19.4% |
| iShares iBoxx High Yield Corporate Bond ETF | 18.6% |
Effective February 26, 2024, the Adviser agreed to revise the annual advisory fee for the Fund at an annual rate of 1.25% of the Fund’s average daily net assets up to $2 billion, 1.20% on assets between $2 billion and $3 billion and 1.15% on assets greater than 3 billion.
HCM Dynamic Income Fund - Investor Class Shares (HCMFX)
Annual Shareholder Report - June 30, 2024
Where can I find additional information about the Fund?
Additional information is available on the Fund's website (www.howardcmfunds.com/resources/), including its:
Prospectus
Financial information
Holdings
Proxy voting information
Annual Shareholder Report - June 30, 2024
This annual shareholder report contains important information about HCM Income Plus Fund for the period of July 1, 2023 to June 30, 2024. You can find additional information about the Fund at www.howardcmfunds.com/resources/. You can also request this information by contacting us at 1-855-969-8464.
What were the Fund’s costs for the last year?
(based on a hypothetical $10,000 investment)
| Class Name | Costs of a $10,000 investment | Costs paid as a percentage of a $10,000 investment |
|---|
| Class A Shares | $134 | 1.34% |
How did the Fund perform during the reporting period?
In the early part of the third quarter of 2023 equity markets continued their upward trajectory. However, by August and September 2023 several factors began to weigh on the major indices. Renewed inflation fears and concerns about economic slowdown weighed heavy on the equity markets. October saw continued downward pressure with additional geopolitical concerns around the Israel- Hamas conflict. This downward pressure caused the HCM-BuyLine® to go negative, pushing us to reduce exposure. The downtrend, as determined by the HCM-BuyLine®, was short lived as the markets staged an impressive reversal thanks to a dovish pivot from the Federal Reserve accompanied by solid economic activity and declining inflation. This reversal quickly pushed us back above the HCM-BuyLine® resulting in us deploying cash back into the markets. The 2023 rally continued into 2024 with no signs of slowing down. However, April 2024 saw a pickup in volatility as fears of no rate cuts in 2024, or even a rate hike, pressured stocks. The higher than expected March Consumer Price Index (CPI) reversed several months of declines in CPI reports and the markets sold off quickly. This swift selloff triggered several HCM Pivot Point® sell stops. Quickly liquidating leveraged ETF positions helped us significantly limit our drawdown. Cash was quickly redeployed as the HCM Pivot Point® turned back up. All the money we took off was reinvested at a lower price. Following dovish comments from Fed Chair Powell at the May 1, 2024 Federal Open Market Committee (FOMC) meeting, markets continued to climb. The resumption of disinflation and increased rate cut expectations fueled the S&P 500 to new highs as we were well positioned to take part in this powerful move higher. HCM Income Plus underperformance to the S&P 500 can be attributed to investment in fixed income securities. Fund outperformance to the Agg. Bond Index can be attributed to an overall large cap growth tilt and leveraged ETFs. As we look beyond the reporting period, we remain cautiously optimistic. The HCM-BuyLine® and HCM Pivot Point® will be our compass and we are confident it will lead us in the right direction.
How has the Fund performed since inception?
Total Return Based on $10,000 Investment
| HCM Income Plus Fund | HCM Income Plus Fund - with load | S&P 500® Index | Bloomberg U.S. Aggregate Bond Index |
|---|
| 11/09/16 | $10,000 | $9,425 | $10,000 | $10,000 |
| 06/30/17 | $10,411 | $9,812 | $11,352 | $10,111 |
| 06/30/18 | $11,247 | $10,600 | $12,984 | $10,071 |
| 06/30/19 | $11,218 | $10,573 | $14,337 | $10,863 |
| 06/30/20 | $13,569 | $12,789 | $15,413 | $11,813 |
| 06/30/21 | $18,026 | $16,990 | $21,700 | $11,773 |
| 06/30/22 | $14,732 | $13,885 | $19,397 | $10,562 |
| 06/30/23 | $16,180 | $15,250 | $23,197 | $10,463 |
| 06/30/24 | $19,771 | $18,634 | $28,894 | $10,738 |
Average Annual Total Returns
| 1 Year | 5 Years | Since Inception (11/09/2016) |
|---|
| HCM Income Plus Fund | | | |
| Without Load | 22.19% | 12.00% | 9.33% |
| With Load | 15.13% | 10.67% | 8.49% |
S&P 500® Index | 24.56% | 15.05% | 14.90% |
| Bloomberg U.S. Aggregate Bond Index | 2.63% | | 0.94% |
The Fund's past performance is not a good predictor of how the Fund will perform in the future. The graph and table do not reflect the deduction of taxes that a shareholder would pay on fund distributions or redemption of fund shares.
- Net Assets$737,782,662
- Number of Portfolio Holdings7
- Advisory Fee $6,198,795
- Portfolio Turnover106%
Asset Weighting (% of total investments)
| Value | Value |
|---|
| Exchange-Traded Funds | 100.0% |
What did the Fund invest in?
Sector Weighting (% of net assets)
| Value | Value |
|---|
| Other Assets in Excess of Liabilities | 0.4% |
| Fixed Income | 32.1% |
| Equity | 67.5% |
Top 10 Holdings (% of net assets)
| Holding Name | % of Net Assets |
| ProShares Ultra QQQ | 18.8% |
| ProShares Ultra S&P500 | 17.2% |
| WisdomTree Floating Rate Treasury Fund | 16.1% |
| SPDR Bloomberg 1-3 Month T-Bill ETF | 16.0% |
| Vanguard Mega Cap Growth ETF | 13.3% |
| Invesco QQQ Trust Series 1 | 11.0% |
| Direxion Daily S&P 500 Bull 3X | 7.2% |
No material changes occurred during the year ended June 30, 2024.
HCM Income Plus Fund - Class A Shares (HCMEX)
Annual Shareholder Report - June 30, 2024
Where can I find additional information about the Fund?
Additional information is available on the Fund's website ( www.howardcmfunds.com/resources/ ), including its:
Prospectus
Financial information
Holdings
Proxy voting information
Annual Shareholder Report - June 30, 2024
This annual shareholder report contains important information about HCM Income Plus Fund for the period of July 1, 2023 to June 30, 2024. You can find additional information about the Fund at www.howardcmfunds.com/resources/. You can also request this information by contacting us at 1-855-969-8464.
What were the Fund’s costs for the last year?
(based on a hypothetical $10,000 investment)
| Class Name | Costs of a $10,000 investment | Costs paid as a percentage of a $10,000 investment |
|---|
| Class I Shares | $109 | 1.09% |
How did the Fund perform during the reporting period?
In the early part of the third quarter of 2023 equity markets continued their upward trajectory. However, by August and September 2023 several factors began to weigh on the major indices. Renewed inflation fears and concerns about economic slowdown weighed heavy on the equity markets. October saw continued downward pressure with additional geopolitical concerns around the Israel- Hamas conflict. This downward pressure caused the HCM-BuyLine® to go negative, pushing us to reduce exposure. The downtrend, as determined by the HCM-BuyLine®, was short lived as the markets staged an impressive reversal thanks to a dovish pivot from the Federal Reserve accompanied by solid economic activity and declining inflation. This reversal quickly pushed us back above the HCM-BuyLine® resulting in us deploying cash back into the markets. The 2023 rally continued into 2024 with no signs of slowing down. However, April 2024 saw a pickup in volatility as fears of no rate cuts in 2024, or even a rate hike, pressured stocks. The higher than expected March Consumer Price Index (CPI) reversed several months of declines in CPI reports and the markets sold off quickly. This swift selloff triggered several HCM Pivot Point® sell stops. Quickly liquidating leveraged ETF positions helped us significantly limit our drawdown. Cash was quickly redeployed as the HCM Pivot Point® turned back up. All the money we took off was reinvested at a lower price. Following dovish comments from Fed Chair Powell at the May 1, 2024 Federal Open Market Committee (FOMC) meeting, markets continued to climb. The resumption of disinflation and increased rate cut expectations fueled the S&P 500 to new highs as we were well positioned to take part in this powerful move higher. HCM Income Plus underperformance to the S&P 500 can be attributed to investment in fixed income securities. Fund outperformance to the Agg. Bond Index can be attributed to an overall large cap growth tilt and leveraged ETFs. As we look beyond the reporting period, we remain cautiously optimistic. The HCM-BuyLine® and HCM Pivot Point® will be our compass and we are confident it will lead us in the right direction.
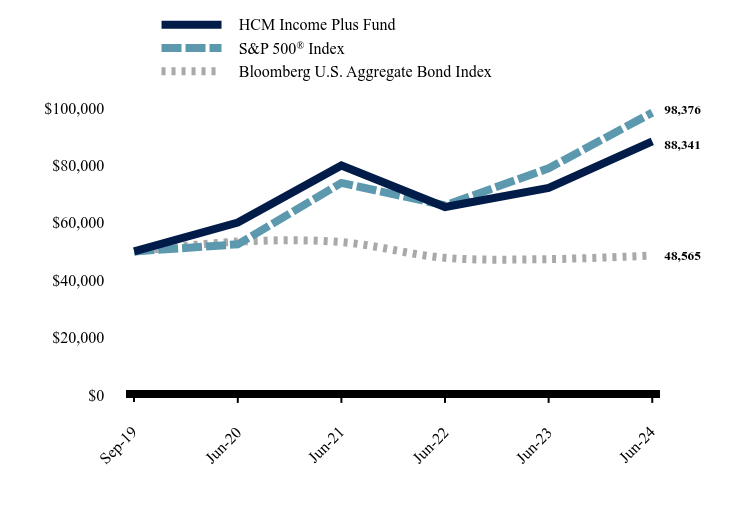
How has the Fund performed since inception?
Total Return Based on $50,000 Investment
| HCM Income Plus Fund | S&P 500® Index | Bloomberg U.S. Aggregate Bond Index |
|---|
| Sep-19 | $50,000 | $50,000 | $50,000 |
| Jun-20 | 60,065 | 52,477 | 53,426 |
| Jun-21 | 79,977 | 73,884 | 53,248 |
| Jun-22 | 65,487 | 66,041 | 47,768 |
| Jun-23 | 72,120 | 78,981 | 47,320 |
| Jun-24 | 88,341 | 98,376 | 48,565 |
Average Annual Total Returns
| 1 Year | Since Inception (September 11, 2019) |
|---|
| HCM Income Plus Fund | 22.49% | 12.58% |
S&P 500® Index | 24.56% | 15.13% |
| Bloomberg U.S. Aggregate Bond Index | 2.63% | |
The Fund's past performance is not a good predictor of how the Fund will perform in the future. The graph and table do not reflect the deduction of taxes that a shareholder would pay on fund distributions or redemption of fund shares.
- Net Assets$737,782,662
- Number of Portfolio Holdings7
- Advisory Fee $6,198,795
- Portfolio Turnover106%
Asset Weighting (% of total investments)
| Value | Value |
|---|
| Exchange-Traded Funds | 100.0% |
What did the Fund invest in?
Sector Weighting (% of net assets)
| Value | Value |
|---|
| Other Assets in Excess of Liabilities | 0.4% |
| Fixed Income | 32.1% |
| Equity | 67.5% |
Top 10 Holdings (% of net assets)
| Holding Name | % of Net Assets |
| ProShares Ultra QQQ | 18.8% |
| ProShares Ultra S&P500 | 17.2% |
| WisdomTree Floating Rate Treasury Fund | 16.1% |
| SPDR Bloomberg 1-3 Month T-Bill ETF | 16.0% |
| Vanguard Mega Cap Growth ETF | 13.3% |
| Invesco QQQ Trust Series 1 | 11.0% |
| Direxion Daily S&P 500 Bull 3X | 7.2% |
No material changes occurred during the year ended June 30, 2024.
HCM Income Plus Fund - Class I Shares (HCMLX)
Annual Shareholder Report - June 30, 2024
Where can I find additional information about the Fund?
Additional information is available on the Fund's website ( www.howardcmfunds.com/resources/ ), including its:
Prospectus
Financial information
Holdings
Proxy voting information
Investor Class Shares (HCMKX)
Annual Shareholder Report - June 30, 2024
This annual shareholder report contains important information about HCM Income Plus Fund for the period of July 1, 2023 to June 30, 2024. You can find additional information about the Fund at www.howardcmfunds.com/resources/. You can also request this information by contacting us at 1-855-969-8464.
What were the Fund’s costs for the last year?
(based on a hypothetical $10,000 investment)
| Class Name | Costs of a $10,000 investment | Costs paid as a percentage of a $10,000 investment |
|---|
| Investor Class Shares | $209 | 2.09% |
How did the Fund perform during the reporting period?
In the early part of the third quarter of 2023 equity markets continued their upward trajectory. However, by August and September 2023 several factors began to weigh on the major indices. Renewed inflation fears and concerns about economic slowdown weighed heavy on the equity markets. October saw continued downward pressure with additional geopolitical concerns around the Israel- Hamas conflict. This downward pressure caused the HCM-BuyLine® to go negative, pushing us to reduce exposure. The downtrend, as determined by the HCM-BuyLine®, was short lived as the markets staged an impressive reversal thanks to a dovish pivot from the Federal Reserve accompanied by solid economic activity and declining inflation. This reversal quickly pushed us back above the HCM-BuyLine® resulting in us deploying cash back into the markets. The 2023 rally continued into 2024 with no signs of slowing down. However, April 2024 saw a pickup in volatility as fears of no rate cuts in 2024, or even a rate hike, pressured stocks. The higher than expected March Consumer Price Index (CPI) reversed several months of declines in CPI reports and the markets sold off quickly. This swift selloff triggered several HCM Pivot Point® sell stops. Quickly liquidating leveraged ETF positions helped us significantly limit our drawdown. Cash was quickly redeployed as the HCM Pivot Point® turned back up. All the money we took off was reinvested at a lower price. Following dovish comments from Fed Chair Powell at the May 1, 2024 Federal Open Market Committee (FOMC) meeting, markets continued to climb. The resumption of disinflation and increased rate cut expectations fueled the S&P 500 to new highs as we were well positioned to take part in this powerful move higher. HCM Income Plus underperformance to the S&P 500 can be attributed to investment in fixed income securities. Fund outperformance to the Agg. Bond Index can be attributed to an overall large cap growth tilt and leveraged ETFs. As we look beyond the reporting period, we remain cautiously optimistic. The HCM-BuyLine® and HCM Pivot Point® will be our compass and we are confident it will lead us in the right direction.
How has the Fund performed since inception?
Total Return Based on $10,000 Investment
| HCM Income Plus Fund | S&P 500® Index | Bloomberg U.S. Aggregate Bond Index |
|---|
| Nov-2016 | $10,000 | $10,000 | $10,000 |
| Jun-2017 | $10,372 | $11,352 | $10,111 |
| Jun-2018 | $11,126 | $12,984 | $10,071 |
| Jun-2019 | $11,009 | $14,337 | $10,863 |
| Jun-2020 | $13,223 | $15,413 | $11,813 |
| Jun-2021 | $17,446 | $21,700 | $11,773 |
| Jun-2022 | $14,149 | $19,397 | $10,562 |
| Jun-2023 | $15,427 | $23,197 | $10,463 |
| Jun-2024 | $18,701 | $28,894 | $10,738 |
Average Annual Total Returns
| 1 Year | 5 Years | Since Inception (November 9, 2016) |
|---|
| HCM Income Plus Fund | 21.22% | 11.18% | 8.54% |
S&P 500® Index | 24.56% | 15.05% | 14.90% |
| Bloomberg U.S. Aggregate Bond Index | 2.63% | | 0.94% |
The Fund's past performance is not a good predictor of how the Fund will perform in the future. The graph and table do not reflect the deduction of taxes that a shareholder would pay on fund distributions or redemption of fund shares.
- Net Assets$737,782,662
- Number of Portfolio Holdings7
- Advisory Fee $6,198,795
- Portfolio Turnover106%
Asset Weighting (% of total investments)
| Value | Value |
|---|
| Exchange-Traded Funds | 100.0% |
What did the Fund invest in?
Sector Weighting (% of net assets)
| Value | Value |
|---|
| Other Assets in Excess of Liabilities | 0.4% |
| Fixed Income | 32.1% |
| Equity | 67.5% |
Top 10 Holdings (% of net assets)
| Holding Name | % of Net Assets |
| ProShares Ultra QQQ | 18.8% |
| ProShares Ultra S&P500 | 17.2% |
| WisdomTree Floating Rate Treasury Fund | 16.1% |
| SPDR Bloomberg 1-3 Month T-Bill ETF | 16.0% |
| Vanguard Mega Cap Growth ETF | 13.3% |
| Invesco QQQ Trust Series 1 | 11.0% |
| Direxion Daily S&P 500 Bull 3X | 7.2% |
No material changes occurred during the year ended June 30, 2024.
HCM Income Plus Fund - Investor Class Shares (HCMKX)
Annual Shareholder Report - June 30, 2024
Where can I find additional information about the Fund?
Additional information is available on the Fund's website ( www.howardcmfunds.com/resources/ ), including its:
Prospectus
Financial information
Holdings
Proxy voting information
Annual Shareholder Report - June 30, 2024
This annual shareholder report contains important information about HCM Tactical Growth Fund for the period of July 1, 2023 to June 30, 2024.You can find additional information about the Fund at www.howardcmfunds.com/resources/. You can also request this information by contacting us at 1-855-969-8464. This report describes changes to the Fund that occurred during the reporting period.
What were the Fund’s costs for the last year?
(based on a hypothetical $10,000 investment)
| Class Name | Costs of a $10,000 investment | Costs paid as a percentage of a $10,000 investment |
|---|
| Class A Shares | $161 | 1.61% |
How did the Fund perform during the reporting period?
In the early part of the third quarter of 2023 equity markets continued their upward trajectory. However, by August and September 2023 several factors began to weigh on the major indices. Renewed inflation fears and concerns about economic slowdown weighed heavily on the equity markets. October saw continued downward pressure with additional geopolitical concerns around the Israel- Hamas conflict. This downward pressure caused the HCM-BuyLine® to go negative, pushing us to reduce exposure. The downtrend, as determined by the HCM-BuyLine®, was short-lived as the markets staged an impressive reversal thanks to a dovish pivot from the Federal Reserve accompanied by solid economic activity and declining inflation. This reversal quickly pushed us back above the HCM-BuyLine® resulting in us deploying cash back into the markets. The 2023 rally continued into 2024 with no signs of slowing down. However, April 2024 saw a pickup in volatility as fears of no rate cuts in 2024, or even a rate hike, pressured stocks. The higher then expected March Consumer Price Index (CPI) reversed several months of declines in CPI reports and the markets sold off quickly. This swift selloff triggered several HCM Pivot Point® sell stops. Quickly liquidating leveraged ETF positions helped us significantly limit our drawdown. Cash was quickly redeployed as the HCM Pivot Point® turned back up. All the money we took off was reinvested at a lower price. Following dovish comments from Fed Chair Powell at the May 1, 2024 Federal Open Market Committee (FOMC) meeting, markets continued to climb. The resumption of disinflation and increased rate cut expectations fueled the S&P 500 to new highs as we were well positioned to take part in this powerful move higher. HCM Tactical Growth performance can be attributed to the fund’s overall large cap growth tilt. Technology sector exposure as well as leveraged ETFs also helped the fund outperform. As we look beyond the reporting period, we remain cautiously optimistic. The HCM-BuyLine® and HCM Pivot Point® will be our compass and we are confident it will lead us in the right direction.
How has the Fund performed since inception?
Total Return Based on $10,000 Investment
| HCM Tactical Growth Fund | HCM Tactical Growth Fund - with load | S&P 500® Index | HFRX Equity Hedge Index |
|---|
| 07/30/14 | $10,000 | $9,425 | $10,000 | $10,000 |
| 06/30/15 | $9,723 | $9,164 | $10,675 | $10,323 |
| 06/30/16 | $8,892 | $8,380 | $11,102 | $9,463 |
| 06/30/17 | $11,828 | $11,148 | $13,088 | $10,227 |
| 06/30/18 | $14,918 | $14,060 | $14,970 | $10,869 |
| 06/30/19 | $13,671 | $12,885 | $16,529 | $10,409 |
| 06/30/20 | $17,430 | $16,428 | $17,770 | $10,189 |
| 06/30/21 | $28,813 | $27,156 | $25,019 | $12,267 |
| 06/30/22 | $22,540 | $21,244 | $22,363 | $12,153 |
| 06/30/23 | $26,289 | $24,778 | $26,744 | $12,714 |
| 06/30/24 | $33,861 | $31,915 | $33,312 | $13,874 |
Average Annual Total Returns
| 1 Year | 5 Years | Since Inception (7/30/2014) |
|---|
| HCM Tactical Growth Fund | | | |
| Without Load | 28.80% | 19.89% | 13.09% |
| With Load | 21.41% | 18.48% | 12.41% |
S&P 500® Index | 24.56% | 15.05% | 12.90% |
| HFRX Equity Hedge Index | 9.13% | 5.92% | 3.36% |
The Fund's past performance is not a good predictor of how the Fund will perform in the future. The graph and table do not reflect the deduction of taxes that a shareholder would pay on fund distributions or redemption of fund shares.
- Net Assets$1,617,331,418
- Number of Portfolio Holdings26
- Advisory Fee $16,794,330
- Portfolio Turnover188%
Asset Weighting (% of total investments)
| Value | Value |
|---|
| Common Stocks | 2.8% |
| Exchange-Traded Funds | 97.2% |
What did the Fund invest in?
Sector Weighting (% of net assets)
| Value | Value |
|---|
| Other Assets in Excess of Liabilities | 6.8% |
| Health Care | 0.1% |
| Materials | 0.1% |
| Consumer Discretionary | 0.2% |
| Real Estate | 0.2% |
| Energy | 0.2% |
| Communications | 0.5% |
| Technology | 1.3% |
| Equity | 90.6% |
Top 10 Holdings (% of net assets)
| Holding Name | % of Net Assets |
| Vanguard Mega Cap Growth ETF | 23.2% |
| Invesco QQQ Trust Series 1 | 21.4% |
| ProShares Ultra QQQ | 20.9% |
| ProShares UltraPro QQQ | 18.0% |
| Direxion Daily Small Cap Bull 3X Shares | 3.6% |
| Direxion Daily S&P 500 Bull 3X | 3.4% |
| NVIDIA Corporation | 0.7% |
| Meta Platforms, Inc., Class A | 0.4% |
| Advanced Micro Devices, Inc. | 0.2% |
| Microsoft Corporation | 0.1% |
Effective February 26, 2024, the Adviser agreed to revise the annual advisory fee for the Fund at an annual rate of 1.25% of the Fund’s average daily net assets up to $2 billion, 1.20% on assets between $2 billion and $3 billion and 1.15% on assets greater than 3 billion.
Annual Shareholder Report - June 30, 2024
Where can I find additional information about the Fund?
Additional information is available on the Fund's website (www.howardcmfunds.com/resources/), including its:
Prospectus
Financial information
Holdings
Proxy voting information
Investor Class Shares (HCMDX)
Annual Shareholder Report - June 30, 2024
This annual shareholder report contains important information about HCM Tactical Growth Fund for the period of July 1, 2023 to June 30, 2024.You can find additional information about the Fund at www.howardcmfunds.com/resources/. You can also request this information by contacting us at 1-855-969-8464. This report describes changes to the Fund that occurred during the reporting period.
What were the Fund’s costs for the last year?
(based on a hypothetical $10,000 investment)
| Class Name | Costs of a $10,000 investment | Costs paid as a percentage of a $10,000 investment |
|---|
| Investor Class Shares | $236 | 2.36% |
How did the Fund perform during the reporting period?
In the early part of the third quarter of 2023 equity markets continued their upward trajectory. However, by August and September 2023 several factors began to weigh on the major indices. Renewed inflation fears and concerns about economic slowdown weighed heavily on the equity markets. October saw continued downward pressure with additional geopolitical concerns around the Israel- Hamas conflict. This downward pressure caused the HCM-BuyLine® to go negative, pushing us to reduce exposure. The downtrend, as determined by the HCM-BuyLine®, was short-lived as the markets staged an impressive reversal thanks to a dovish pivot from the Federal Reserve accompanied by solid economic activity and declining inflation. This reversal quickly pushed us back above the HCM-BuyLine® resulting in us deploying cash back into the markets. The 2023 rally continued into 2024 with no signs of slowing down. However, April 2024 saw a pickup in volatility as fears of no rate cuts in 2024, or even a rate hike, pressured stocks. The higher then expected March Consumer Price Index (CPI) reversed several months of declines in CPI reports and the markets sold off quickly. This swift selloff triggered several HCM Pivot Point® sell stops. Quickly liquidating leveraged ETF positions helped us significantly limit our drawdown. Cash was quickly redeployed as the HCM Pivot Point® turned back up. All the money we took off was reinvested at a lower price. Following dovish comments from Fed Chair Powell at the May 1, 2024 Federal Open Market Committee (FOMC) meeting, markets continued to climb. The resumption of disinflation and increased rate cut expectations fueled the S&P 500 to new highs as we were well positioned to take part in this powerful move higher. HCM Tactical Growth performance can be attributed to the fund’s overall large cap growth tilt. Technology sector exposure as well as leveraged ETFs also helped the fund outperform. As we look beyond the reporting period, we remain cautiously optimistic. The HCM-BuyLine® and HCM Pivot Point® will be our compass and we are confident it will lead us in the right direction.
How has the Fund performed since inception?
Total Return Based on $10,000 Investment
| HCM Tactical Growth Fund | S&P 500® Index | HFRX Equity Hedge Index |
|---|
| Jul-2014 | $10,000 | $10,000 | $10,000 |
| Jun-2015 | $9,720 | $10,675 | $10,323 |
| Jun-2016 | $8,820 | $11,102 | $9,463 |
| Jun-2017 | $11,651 | $13,088 | $10,227 |
| Jun-2018 | $14,584 | $14,970 | $10,869 |
| Jun-2019 | $13,266 | $16,529 | $10,409 |
| Jun-2020 | $16,780 | $17,770 | $10,189 |
| Jun-2021 | $27,540 | $25,019 | $12,267 |
| Jun-2022 | $21,378 | $22,363 | $12,153 |
| Jun-2023 | $24,744 | $26,744 | $12,714 |
| Jun-2024 | $31,649 | $33,312 | $13,874 |
Average Annual Total Returns
| 1 Year | 5 Years | 10 Years |
|---|
| HCM Tactical Growth Fund | 27.90% | 18.99% | 12.32% |
S&P 500® Index | 24.56% | 15.05% | 12.90% |
| HFRX Equity Hedge Index | 9.13% | 5.92% | 3.36% |
The Fund's past performance is not a good predictor of how the Fund will perform in the future. The graph and table do not reflect the deduction of taxes that a shareholder would pay on fund distributions or redemption of fund shares.
- Net Assets$1,617,331,418
- Number of Portfolio Holdings26
- Advisory Fee $16,794,330
- Portfolio Turnover188%
Asset Weighting (% of total investments)
| Value | Value |
|---|
| Common Stocks | 2.8% |
| Exchange-Traded Funds | 97.2% |
What did the Fund invest in?
Sector Weighting (% of net assets)
| Value | Value |
|---|
| Other Assets in Excess of Liabilities | 6.8% |
| Health Care | 0.1% |
| Materials | 0.1% |
| Consumer Discretionary | 0.2% |
| Real Estate | 0.2% |
| Energy | 0.2% |
| Communications | 0.5% |
| Technology | 1.3% |
| Equity | 90.6% |
Top 10 Holdings (% of net assets)
| Holding Name | % of Net Assets |
| Vanguard Mega Cap Growth ETF | 23.2% |
| Invesco QQQ Trust Series 1 | 21.4% |
| ProShares Ultra QQQ | 20.9% |
| ProShares UltraPro QQQ | 18.0% |
| Direxion Daily Small Cap Bull 3X Shares | 3.6% |
| Direxion Daily S&P 500 Bull 3X | 3.4% |
| NVIDIA Corporation | 0.7% |
| Meta Platforms, Inc., Class A | 0.4% |
| Advanced Micro Devices, Inc. | 0.2% |
| Microsoft Corporation | 0.1% |
Effective February 26, 2024, the Adviser agreed to revise the annual advisory fee for the Fund at an annual rate of 1.25% of the Fund’s average daily net assets up to $2 billion, 1.20% on assets between $2 billion and $3 billion and 1.15% on assets greater than 3 billion.
Annual Shareholder Report - June 30, 2024
Where can I find additional information about the Fund?
Additional information is available on the Fund's website (www.howardcmfunds.com/resources/), including its:
Prospectus
Financial information
Holdings
Proxy voting information
Annual Shareholder Report - June 30, 2024
This annual shareholder report contains important information about HCM Tactical Growth Fund for the period of July 1, 2023 to June 30, 2024.You can find additional information about the Fund at www.howardcmfunds.com/resources/. You can also request this information by contacting us at 1-855-969-8464. This report describes changes to the Fund that occurred during the reporting period.
What were the Fund’s costs for the last year?
(based on a hypothetical $10,000 investment)
| Class Name | Costs of a $10,000 investment | Costs paid as a percentage of a $10,000 investment |
|---|
| Class I Shares | $136 | 1.36% |
How did the Fund perform during the reporting period?
In the early part of the third quarter of 2023 equity markets continued their upward trajectory. However, by August and September 2023 several factors began to weigh on the major indices. Renewed inflation fears and concerns about economic slowdown weighed heavily on the equity markets. October saw continued downward pressure with additional geopolitical concerns around the Israel- Hamas conflict. This downward pressure caused the HCM-BuyLine® to go negative, pushing us to reduce exposure. The downtrend, as determined by the HCM-BuyLine®, was short-lived as the markets staged an impressive reversal thanks to a dovish pivot from the Federal Reserve accompanied by solid economic activity and declining inflation. This reversal quickly pushed us back above the HCM-BuyLine® resulting in us deploying cash back into the markets. The 2023 rally continued into 2024 with no signs of slowing down. However, April 2024 saw a pickup in volatility as fears of no rate cuts in 2024, or even a rate hike, pressured stocks. The higher then expected March Consumer Price Index (CPI) reversed several months of declines in CPI reports and the markets sold off quickly. This swift selloff triggered several HCM Pivot Point® sell stops. Quickly liquidating leveraged ETF positions helped us significantly limit our drawdown. Cash was quickly redeployed as the HCM Pivot Point® turned back up. All the money we took off was reinvested at a lower price. Following dovish comments from Fed Chair Powell at the May 1, 2024 Federal Open Market Committee (FOMC) meeting, markets continued to climb. The resumption of disinflation and increased rate cut expectations fueled the S&P 500 to new highs as we were well positioned to take part in this powerful move higher. HCM Tactical Growth performance can be attributed to the fund’s overall large cap growth tilt. Technology sector exposure as well as leveraged ETFs also helped the fund outperform. As we look beyond the reporting period, we remain cautiously optimistic. The HCM-BuyLine® and HCM Pivot Point® will be our compass and we are confident it will lead us in the right direction.
How has the Fund performed since inception?
Total Return Based on $50,000 Investment
| HCM Tactical Growth Fund | S&P 500® Index | HFRX Equity Hedge Index |
|---|
| Jul-14 | $50,000 | $50,000 | $50,000 |
| Jun-15 | 48,600 | 53,377 | 51,615 |
| Jun-16 | 44,451 | 55,508 | 47,317 |
| Jun-17 | 59,115 | 65,442 | 51,135 |
| Jun-18 | 74,541 | 74,848 | 54,346 |
| Jun-19 | 68,317 | 82,646 | 52,043 |
| Jun-20 | 87,089 | 88,848 | 50,944 |
| Jun-21 | 144,306 | 125,093 | 61,337 |
| Jun-22 | 113,204 | 111,813 | 60,764 |
| Jun-23 | 132,316 | 133,722 | 63,569 |
| Jun-24 | 170,904 | 166,559 | 69,370 |
Average Annual Total Returns
| 1 Year | 5 Years | 10 Years |
|---|
| HCM Tactical Growth Fund | 29.16% | 20.13% | 13.19% |
S&P 500® Index | 24.56% | 15.05% | 12.90% |
| HFRX Equity Hedge Index | 9.13% | 5.92% | 3.36% |
The Fund's past performance is not a good predictor of how the Fund will perform in the future. The graph and table do not reflect the deduction of taxes that a shareholder would pay on fund distributions or redemption of fund shares.
- Net Assets$1,617,331,418
- Number of Portfolio Holdings26
- Advisory Fee $16,794,330
- Portfolio Turnover188%
Asset Weighting (% of total investments)
| Value | Value |
|---|
| Common Stocks | 2.8% |
| Exchange-Traded Funds | 97.2% |
What did the Fund invest in?
Sector Weighting (% of net assets)
| Value | Value |
|---|
| Other Assets in Excess of Liabilities | 6.8% |
| Health Care | 0.1% |
| Materials | 0.1% |
| Consumer Discretionary | 0.2% |
| Real Estate | 0.2% |
| Energy | 0.2% |
| Communications | 0.5% |
| Technology | 1.3% |
| Equity | 90.6% |
Top 10 Holdings (% of net assets)
| Holding Name | % of Net Assets |
| Vanguard Mega Cap Growth ETF | 23.2% |
| Invesco QQQ Trust Series 1 | 21.4% |
| ProShares Ultra QQQ | 20.9% |
| ProShares UltraPro QQQ | 18.0% |
| Direxion Daily Small Cap Bull 3X Shares | 3.6% |
| Direxion Daily S&P 500 Bull 3X | 3.4% |
| NVIDIA Corporation | 0.7% |
| Meta Platforms, Inc., Class A | 0.4% |
| Advanced Micro Devices, Inc. | 0.2% |
| Microsoft Corporation | 0.1% |
Effective February 26, 2024, the Adviser agreed to revise the annual advisory fee for the Fund at an annual rate of 1.25% of the Fund’s average daily net assets up to $2 billion, 1.20% on assets between $2 billion and $3 billion and 1.15% on assets greater than 3 billion.
Annual Shareholder Report - June 30, 2024
Where can I find additional information about the Fund?
Additional information is available on the Fund's website (www.howardcmfunds.com/resources/), including its:
Prospectus
Financial information
Holdings
Proxy voting information
Annual Shareholder Report - June 30, 2024
This annual shareholder report contains important information about HCM Tactical Growth Fund for the period of July 1, 2023 to June 30, 2024.You can find additional information about the Fund at www.howardcmfunds.com/resources/. You can also request this information by contacting us at 1-855-969-8464. This report describes changes to the Fund that occurred during the reporting period.
What were the Fund’s costs for the last year?
(based on a hypothetical $10,000 investment)
| Class Name | Costs of a $10,000 investment | Costs paid as a percentage of a $10,000 investment |
|---|
| Class R Shares | $146 | 1.46% |
How did the Fund perform during the reporting period?
In the early part of the third quarter of 2023 equity markets continued their upward trajectory. However, by August and September 2023 several factors began to weigh on the major indices. Renewed inflation fears and concerns about economic slowdown weighed heavily on the equity markets. October saw continued downward pressure with additional geopolitical concerns around the Israel- Hamas conflict. This downward pressure caused the HCM-BuyLine® to go negative, pushing us to reduce exposure. The downtrend, as determined by the HCM-BuyLine®, was short-lived as the markets staged an impressive reversal thanks to a dovish pivot from the Federal Reserve accompanied by solid economic activity and declining inflation. This reversal quickly pushed us back above the HCM-BuyLine® resulting in us deploying cash back into the markets. The 2023 rally continued into 2024 with no signs of slowing down. However, April 2024 saw a pickup in volatility as fears of no rate cuts in 2024, or even a rate hike, pressured stocks. The higher then expected March Consumer Price Index (CPI) reversed several months of declines in CPI reports and the markets sold off quickly. This swift selloff triggered several HCM Pivot Point® sell stops. Quickly liquidating leveraged ETF positions helped us significantly limit our drawdown. Cash was quickly redeployed as the HCM Pivot Point® turned back up. All the money we took off was reinvested at a lower price. Following dovish comments from Fed Chair Powell at the May 1, 2024 Federal Open Market Committee (FOMC) meeting, markets continued to climb. The resumption of disinflation and increased rate cut expectations fueled the S&P 500 to new highs as we were well positioned to take part in this powerful move higher. HCM Tactical Growth performance can be attributed to the fund’s overall large cap growth tilt. Technology sector exposure as well as leveraged ETFs also helped the fund outperform. As we look beyond the reporting period, we remain cautiously optimistic. The HCM-BuyLine® and HCM Pivot Point® will be our compass and we are confident it will lead us in the right direction.
How has the Fund performed since inception?
Total Return Based on $10,000 Investment
| HCM Tactical Growth Fund | S&P 500® Index | HFRX Equity Hedge Index |
|---|
| Jul-2014 | $10,000 | $10,000 | $10,000 |
| Jun-2015 | $9,720 | $10,675 | $10,323 |
| Jun-2016 | $8,890 | $11,102 | $9,463 |
| Jun-2017 | $11,823 | $13,088 | $10,227 |
| Jun-2018 | $14,908 | $14,970 | $10,869 |
| Jun-2019 | $13,663 | $16,529 | $10,409 |
| Jun-2020 | $17,418 | $17,770 | $10,189 |
| Jun-2021 | $28,785 | $25,019 | $12,267 |
| Jun-2022 | $22,520 | $22,363 | $12,153 |
| Jun-2023 | $26,265 | $26,744 | $12,714 |
| Jun-2024 | $33,827 | $33,312 | $13,874 |
Average Annual Total Returns
| 1 Year | 5 Years | 10 Years |
|---|
| HCM Tactical Growth Fund | 28.79% | 19.88% | 13.07% |
S&P 500® Index | 24.56% | 15.05% | 12.90% |
| HFRX Equity Hedge Index | 9.13% | 5.92% | 3.36% |
The Fund's past performance is not a good predictor of how the Fund will perform in the future. The graph and table do not reflect the deduction of taxes that a shareholder would pay on fund distributions or redemption of fund shares.
- Net Assets$1,617,331,418
- Number of Portfolio Holdings26
- Advisory Fee $16,794,330
- Portfolio Turnover188%
Asset Weighting (% of total investments)
| Value | Value |
|---|
| Common Stocks | 2.8% |
| Exchange-Traded Funds | 97.2% |
What did the Fund invest in?
Sector Weighting (% of net assets)
| Value | Value |
|---|
| Other Assets in Excess of Liabilities | 6.8% |
| Health Care | 0.1% |
| Materials | 0.1% |
| Consumer Discretionary | 0.2% |
| Real Estate | 0.2% |
| Energy | 0.2% |
| Communications | 0.5% |
| Technology | 1.3% |
| Equity | 90.6% |
Top 10 Holdings (% of net assets)
| Holding Name | % of Net Assets |
| Vanguard Mega Cap Growth ETF | 23.2% |
| Invesco QQQ Trust Series 1 | 21.4% |
| ProShares Ultra QQQ | 20.9% |
| ProShares UltraPro QQQ | 18.0% |
| Direxion Daily Small Cap Bull 3X Shares | 3.6% |
| Direxion Daily S&P 500 Bull 3X | 3.4% |
| NVIDIA Corporation | 0.7% |
| Meta Platforms, Inc., Class A | 0.4% |
| Advanced Micro Devices, Inc. | 0.2% |
| Microsoft Corporation | 0.1% |
Effective February 26, 2024, the Adviser agreed to revise the annual advisory fee for the Fund at an annual rate of 1.25% of the Fund’s average daily net assets up to $2 billion, 1.20% on assets between $2 billion and $3 billion and 1.15% on assets greater than 3 billion.
Annual Shareholder Report - June 30, 2024
Where can I find additional information about the Fund?
Additional information is available on the Fund's website (www.howardcmfunds.com/resources/), including its:
Prospectus
Financial information
Holdings
Proxy voting information
(b) Not applicable
Item 2. Code of Ethics.
| (a) | The registrant has, as of the end of the period covered by this report, adopted a code of ethics that applies to the registrant’s principal executive officer, principal financial officer, and principal accounting officer or controller, or persons performing similar functions, regardless of whether these individuals are employed by the registrant or a third party. |
| | |
| (b) | N/A |
| | |
| (c) | During the period covered by this report, there were no amendments to any provision of the code of ethics. |
| | |
| (d) | During the period covered by this report, there were no waivers or implicit waivers of a provision of the code of ethics. |
| | |
| (e) | N/A |
| | |
| (f) | See Item 19(a)(1) |
| | |
Item 3. Audit Committee Financial Expert.
(a)(1) The Registrant’s board of trustees has determined that Mark H. Taylor is an audit committee financial expert, as defined in Item 3 of Form N-CSR. Mr. Taylor is independent for purposes of this Item.
(a)(2) Not applicable.
(a)(3) Not applicable.
Item 4. Principal Accountant Fees and Services.
| (a) | Audit Fees. The aggregate fees billed for each of the last two fiscal years for professional services rendered by the registrant’s principal accountant for the audit of the registrant’s annual financial statements or services that are normally provided by the accountant in connection with statutory and regulatory filings or engagements for those fiscal years are as follows: |
2024 - $ 71,000
2023 - $ 70,000
| (b) | Audit-Related Fees. There were no fees billed in each of the last two fiscal years for assurances and related services by the principal accountant that are reasonably related to the performance of the audit of the registrant’s financial statements and are not reported under paragraph (a) of this item. |
| (c) | Tax Fees. The aggregate fees billed in each of the last two fiscal years for professional services rendered by the principal accountant for tax compliance are as follows: |
2024 – $ 16,000
2023 – $ 15,750
Preparation of Federal & State income tax returns, assistance with calculation of required income, capital gain and excise distributions and preparation of Federal excise tax returns.
| (d) | All Other Fees. The aggregate fees billed in each of the last two fiscal years for products and services provided by the registrant’s principal accountant, other than the services reported in paragraphs (a) through (c) of this item were $0 and $0 for the fiscal years ended June 30, 2023, and 2024 respectively. |
| (e)(1) | The audit committee does not have pre-approval policies and procedures. Instead, the audit committee or audit committee chairman approves on a case-by-case basis each audit or non-audit service before the principal accountant is engaged by the registrant. |
| | |
| (e)(2) | There were no services described in each of paragraphs (b) through (d) of this Item that were approved by the audit committee pursuant to paragraph (c)(7)(i)(C) of Rule 2-01 of Regulation S-X. |
| | |
| (f) | Not applicable. The percentage of hours expended on the principal accountant’s engagement to audit the registrant’s financial statements for the most recent fiscal year that were attributed to work performed by persons other than the principal accountant’s full-time, permanent employees was zero percent (0%). |
| | |
| (g) | All non-audit fees billed by the registrant’s principal accountant for services rendered to the registrant for the fiscal years ended June 30, 2023, and 2024 respectively are disclosed in (b)-(d) above. There were no audit or non-audit services performed by the registrant’s principal accountant for the registrant’s adviser. |
| | |
| (h) | Not applicable. |
| | |
| (i) | Not applicable. |
| | |
| (j) | Not applicable. |
| | |
Item 5. Audit Committee of Listed Companies. Not applicable to open-end investment companies.
Item 6. Schedule of Investments. The Registrant’s schedule of investments in unaffiliated issuers is included in the Financial Statements under Item 7 of this form.
Item 7. Financial Statements and Financial Highlights for Open-End Management Investment Companies.
| |
| |
| |
| |
| |
 |
| |
| HCM Tactical Growth Fund |
| | Class A Shares: HCMGX |
| | Class I Shares: HCMIX |
| | Class R Shares: HCMSX |
| | Investor Class Shares: HCMDX |
| |
| HCM Dividend Sector Plus Fund |
| | Class A Shares: HCMNX |
| | Class I Shares: HCMQX |
| | Class R Shares: HCMZX |
| | Class A1 Shares: HCMWX |
| | Investor Class Shares: HCMPX |
| |
| HCM Income Plus Fund |
| | Class A Shares: HCMEX |
| | Class I Shares: HCMLX |
| | Investor Class Shares: HCMKX |
| |
| HCM Dynamic Income Fund |
| | Class A Shares: HCMBX |
| | Class I Shares: HCMUX |
| | Investor Class Shares: HCMFX |
| |
| Annual Financial Statements |
| June 30, 2024 |
| |
| 1-855-969-8464 |
| www.howardcmfunds.com |
| |
| |
| |
| |
| HCM TACTICAL GROWTH FUND |
| SCHEDULE OF INVESTMENTS |
| June 30, 2024 |
| |
| Shares | | | | | Fair Value | |
| | | | | COMMON STOCKS — 2.6% | | | | |
| | | | | BEVERAGES - 0.0%(a) | | | | |
| | 17,605 | | | Brown-Forman Corporation, Class B | | $ | 760,360 | |
| | | | | | | | | |
| | | | | BIOTECH & PHARMA - 0.1% | | | | |
| | 4,240 | | | Amgen, Inc. | | | 1,324,788 | |
| | | | | | | | | |
| | | | | CHEMICALS - 0.1% | | | | |
| | 11,050 | | | CF Industries Holdings, Inc. | | | 819,026 | |
| | | | | | | | | |
| | | | | E-COMMERCE DISCRETIONARY - 0.1% | | | | |
| | 11,651 | | | Amazon.com, Inc.(b) | | | 2,251,555 | |
| | | | | | | | | |
| | | | | HEALTH CARE FACILITIES & SERVICES - 0.1% | | | | |
| | 2,103 | | | Humana, Inc. | | | 785,786 | |
| | | | | | | | | |
| | | | | INFRASTRUCTURE REIT - 0.1% | | | | |
| | 5,594 | | | American Tower Corporation | | | 1,087,362 | |
| | 8,769 | | | Crown Castle, Inc. | | | 856,731 | |
| | | | | | | | 1,944,093 | |
| | | | | INTERNET MEDIA & SERVICES - 0.5% | | | | |
| | 12,288 | | | Alphabet, Inc., Class A | | | 2,238,259 | |
| | 11,824 | | | Meta Platforms, Inc., Class A | | | 5,961,897 | |
| | | | | | | | 8,200,156 | |
| | | | | OIL & GAS PRODUCERS - 0.2% | | | | |
| | 6,500 | | | Chevron Corporation | | | 1,016,730 | |
| | 15,352 | | | Devon Energy Corporation | | | 727,685 | |
| | 8,890 | | | EOG Resources, Inc. | | | 1,118,984 | |
| | | | | | | | 2,863,399 | |
| | | | | RETAIL - DISCRETIONARY - 0.1% | | | | |
| | 6,558 | | | Genuine Parts Company | | | 907,103 | |
| | | | | | | | | |
| | | | | SELF-STORAGE REIT - 0.1% | | | | |
| | 6,704 | | | Extra Space Storage, Inc. | | | 1,041,869 | |
| | | | | | | | | |
See accompanying notes to financial statements.
| HCM TACTICAL GROWTH FUND |
| SCHEDULE OF INVESTMENTS (Continued) |
| June 30, 2024 |
| |
| Shares | | | | | Fair Value | |
| | | | | COMMON STOCKS — 2.6% (Continued) | | | | |
| | | | | SEMICONDUCTORS - 1.0% | | | | |
| | 19,502 | | | Advanced Micro Devices, Inc.(b) | | $ | 3,163,419 | |
| | 88,960 | | | NVIDIA Corporation | | | 10,990,119 | |
| | 10,156 | | | QUALCOMM, Inc. | | | 2,022,872 | |
| | | | | | | | 16,176,410 | |
| | | | | SOFTWARE - 0.1% | | | | |
| | 5,200 | | | Microsoft Corporation | | | 2,324,140 | |
| | | | | | | | | |
| | | | | TECHNOLOGY HARDWARE - 0.1% | | | | |
| | 8,056 | | | Apple, Inc. | | | 1,696,755 | |
| | | | | | | | | |
| | | | | TECHNOLOGY SERVICES - 0.0%(a) | | | | |
| | 13,587 | | | PayPal Holdings, Inc.(b) | | | 788,454 | |
| | | | | | | | | |
| | | | | TOTAL COMMON STOCKS (Cost $24,145,033) | | | 41,883,894 | |
| | | | | | | | | |
| | | | | EXCHANGE-TRADED FUNDS — 90.6% | | | | |
| | | | | EQUITY - 90.6% | | | | |
| | 380,500 | | | Direxion Daily S&P 500 Bull 3X | | | 55,579,635 | |
| | 1,600,000 | | | Direxion Daily Small Cap Bull 3X Shares | | | 58,672,000 | |
| | 722,980 | | | Invesco QQQ Trust Series 1 | | | 346,386,948 | |
| | 3,389,150 | | | ProShares Ultra QQQ | | | 338,271,062 | |
| | 3,951,700 | | | ProShares UltraPro QQQ | | | 291,714,494 | |
| | 1,194,657 | | | Vanguard Mega Cap Growth ETF | | | 375,373,175 | |
| | | | | TOTAL EXCHANGE-TRADED FUNDS (Cost $1,023,227,977) | | | 1,465,997,314 | |
| | | | | | | | | |
| | | | | TOTAL INVESTMENTS - 93.2% (Cost $1,047,373,010) | | $ | 1,507,881,208 | |
| | | | | OTHER ASSETS IN EXCESS OF LIABILITIES - 6.8% | | | 109,450,210 | |
| | | | | NET ASSETS - 100.0% | | $ | 1,617,331,418 | |
| | | | | | | | | |
| ETF | - Exchange-Traded Fund |
| | |
| REIT | - Real Estate Investment Trust |
| | |
| (a) | Percentage rounds to less than 0.1%. |
| (b) | Non-income producing security. |
See accompanying notes to financial statements.
| HCM DIVIDEND SECTOR PLUS FUND |
| SCHEDULE OF INVESTMENTS |
| June 30, 2024 |
| |
| Shares | | | | | Fair Value | |
| | | | | COMMON STOCKS — 10.6% | | | | |
| | | | | APPAREL & TEXTILE PRODUCTS - 0.3% | | | | |
| | 26,333 | | | Ralph Lauren Corporation | | $ | 4,609,855 | |
| | | | | | | | | |
| | | | | AUTOMOTIVE - 0.4% | | | | |
| | 76,278 | | | BorgWarner, Inc. | | | 2,459,203 | |
| | 97,077 | | | General Motors Company | | | 4,510,197 | |
| | | | | | | | 6,969,400 | |
| | | | | BANKING - 0.5% | | | | |
| | 73,828 | | | Citigroup, Inc. | | | 4,685,124 | |
| | 23,871 | | | M&T Bank Corporation | | | 3,613,115 | |
| | | | | | | | 8,298,239 | |
| | | | | BIOTECH & PHARMA - 0.6% | | | | |
| | 178,927 | | | Organon & Company | | | 3,703,789 | |
| | 90,184 | | | Pfizer, Inc. | | | 2,523,348 | |
| | 308,928 | | | Viatris, Inc. | | | 3,283,905 | |
| | | | | | | | 9,511,042 | |
| | | | | CHEMICALS - 0.4% | | | | |
| | 19,313 | | | Albemarle Corporation | | | 1,844,778 | |
| | 34,974 | | | CF Industries Holdings, Inc. | | | 2,592,273 | |
| | 85,615 | | | Mosaic Company (The) | | | 2,474,274 | |
| | | | | | | | 6,911,325 | |
| | | | | ELECTRIC UTILITIES - 1.1% | | | | |
| | 237,447 | | | AES Corporation (The) | | | 4,171,943 | |
| | 32,253 | | | Entergy Corporation | | | 3,451,071 | |
| | 60,741 | | | Evergy, Inc. | | | 3,217,451 | |
| | 126,362 | | | PPL Corporation | | | 3,493,909 | |
| | 51,345 | | | Public Service Enterprise Group, Inc. | | | 3,784,127 | |
| | | | | | | | 18,118,501 | |
| | | | | ENTERTAINMENT CONTENT - 0.4% | | | | |
| | 98,267 | | | Fox Corporation, Class A | | | 3,377,437 | |
| | 106,260 | | | Fox Corporation, Class B | | | 3,402,445 | |
| | | | | | | | 6,779,882 | |
| | | | | FOOD - 0.2% | | | | |
| | 63,601 | | | Tyson Foods, Inc., Class A | | | 3,634,161 | |
| | | | | | | | | |
See accompanying notes to financial statements.
| HCM DIVIDEND SECTOR PLUS FUND |
| SCHEDULE OF INVESTMENTS (Continued) |
| June 30, 2024 |
| |
| Shares | | | | | Fair Value | |
| | | | | COMMON STOCKS — 10.6% (Continued) | | | | |
| | | | | HEALTH CARE FACILITIES & SERVICES - 0.4% | | | | |
| | 5,945 | | | Humana, Inc. | | $ | 2,221,349 | |
| | 23,450 | | | Universal Health Services, Inc., Class B | | | 4,336,609 | |
| | | | | | | | 6,557,958 | |
| | | | | HOME CONSTRUCTION - 0.5% | | | | |
| | 27,216 | | | Lennar Corporation, Class A | | | 4,078,862 | |
| | 41,197 | | | PulteGroup, Inc. | | | 4,535,789 | |
| | | | | | | | 8,614,651 | |
| | | | | INSURANCE - 0.4% | | | | |
| | 8,633 | | | Berkshire Hathaway, Inc., Class B(a) | | | 3,511,905 | |
| | 48,523 | | | MetLife, Inc. | | | 3,405,829 | |
| | | | | | | | 6,917,734 | |
| | | | | OIL & GAS PRODUCERS - 0.9% | | | | |
| | 76,259 | | | APA Corporation | | | 2,245,065 | |
| | 106,605 | | | Coterra Energy, Inc. | | | 2,843,155 | |
| | 67,680 | | | EQT Corporation | | | 2,502,806 | |
| | 20,399 | | | Marathon Petroleum Corporation | | | 3,538,819 | |
| | 23,556 | | | Valero Energy Corporation | | | 3,692,639 | |
| | | | | | | | 14,822,484 | |
| | | | | PUBLISHING & BROADCASTING - 0.3% | | | | |
| | 143,272 | | | News Corporation, Class B | | | 4,067,492 | |
| | | | | | | | | |
| | | | | RETAIL - CONSUMER STAPLES - 0.2% | | | | |
| | 68,091 | | | Kroger Company (The) | | | 3,399,784 | |
| | | | | | | | | |
| | | | | SEMICONDUCTORS - 0.2% | | | | |
| | 30,558 | | | Skyworks Solutions, Inc. | | | 3,256,872 | |
| | | | | | | | | |
| | | | | SPECIALTY FINANCE - 0.3% | | | | |
| | 102,478 | | | Synchrony Financial | | | 4,835,937 | |
| | | | | | | | | |
| | | | | STEEL - 0.4% | | | | |
| | 19,174 | | | Nucor Corporation | | | 3,031,026 | |
| | 27,639 | | | Steel Dynamics, Inc. | | | 3,579,250 | |
| | | | | | | | 6,610,276 | |
| | | | | | | | | |
See accompanying notes to financial statements.
| HCM DIVIDEND SECTOR PLUS FUND |
| SCHEDULE OF INVESTMENTS (Continued) |
| June 30, 2024 |
| |
| Shares | | | | | Fair Value | |
| | | | | COMMON STOCKS — 10.6% (Continued) | | | | |
| | | | | TECHNOLOGY HARDWARE - 0.5% | | | | |
| | 178,604 | | | Hewlett Packard Enterprise Company | | $ | 3,781,046 | |
| | 115,577 | | | HP, Inc. | | | 4,047,506 | |
| | | | | | | | 7,828,552 | |
| | | | | TECHNOLOGY SERVICES - 0.4% | | | | |
| | 44,068 | | | Cognizant Technology Solutions Corporation, Class A | | | 2,996,624 | |
| | 136,795 | | | DXC Technology Company(a) | | | 2,611,417 | |
| | | | | | | | 5,608,041 | |
| | | | | TELECOMMUNICATIONS - 0.5% | | | | |
| | 202,853 | | | AT&T, Inc. | | | 3,876,521 | |
| | 95,278 | | | Verizon Communications, Inc. | | | 3,929,265 | |
| | | | | | | | 7,805,786 | |
| | | | | TOBACCO & CANNABIS - 0.2% | | | | |
| | 70,078 | | | Altria Group, Inc. | | | 3,192,053 | |
| | | | | | | | | |
| | | | | TRANSPORTATION & LOGISTICS - 1.1% | | | | |
| | 88,489 | | | Alaska Air Group, Inc.(a) | | | 3,574,956 | |
| | 245,913 | | | American Airlines Group, Inc.(a) | | | 2,786,194 | |
| | 85,071 | | | Delta Air Lines, Inc. | | | 4,035,767 | |
| | 113,737 | | | Southwest Airlines Company | | | 3,254,016 | |
| | 75,425 | | | United Airlines Holdings, Inc.(a) | | | 3,670,181 | |
| | | | | | | | 17,321,114 | |
| | | | | WHOLESALE - CONSUMER STAPLES - 0.4% | | | | |
| | 40,126 | | | Archer-Daniels-Midland Company | | | 2,425,617 | |
| | 28,136 | | | Bunge Global S.A. | | | 3,004,080 | |
| | | | | | | | 5,429,697 | |
| | | | | | | | | |
| | | | | TOTAL COMMON STOCKS (Cost $154,066,813) | | | 171,100,836 | |
| | | | | | | | | |
| | | | | EXCHANGE-TRADED FUNDS — 88.9% | | | | |
| | | | | EQUITY - 88.9% | | | | |
| | 2,054,100 | | | Direxion Daily S&P 500 Bull 3X | | | 300,042,387 | |
| | 224,100 | | | iShares Select Dividend ETF | | | 27,111,618 | |
| | 3,374,500 | | | ProShares Ultra QQQ | | | 336,808,845 | |
| | | | | | | | | |
See accompanying notes to financial statements.
| HCM DIVIDEND SECTOR PLUS FUND |
| SCHEDULE OF INVESTMENTS (Continued) |
| June 30, 2024 |
| |
| Shares | | | | | Fair Value | |
| | | | | EXCHANGE-TRADED FUNDS — 88.9% (Continued) | | | | |
| | | | | EQUITY - 88.9% (Continued) | | | | |
| | 1,873,100 | | | ProShares Ultra S&P500 | | $ | 154,718,060 | |
| | 323,200 | | | SPDR S&P 500 ETF Trust | | | 175,891,904 | |
| | 1,704,452 | | | Vanguard Dividend Appreciation ETF | | | 311,147,713 | |
| | 12,580 | | | Vanguard Growth ETF | | | 4,705,046 | |
| | 1,044,234 | | | Vanguard High Dividend Yield ETF | | | 123,846,152 | |
| | | | | TOTAL EXCHANGE-TRADED FUNDS (Cost $1,130,848,529) | | | 1,434,271,725 | |
| | | | | | | | | |
| | | | | TOTAL INVESTMENTS - 99.5% (Cost $1,284,915,342) | | $ | 1,605,372,561 | |
| | | | | OTHER ASSETS IN EXCESS OF LIABILITIES - 0.5% | | | 8,117,599 | |
| | | | | NET ASSETS - 100.0% | | $ | 1,613,490,160 | |
| | | | | | | | | |
| ETF | - Exchange-Traded Fund |
| | |
| S.A. | - Société Anonyme |
| | |
| SPDR | - Standard & Poor’s Depositary Receipt |
| | |
| (a) | Non-income producing security. |
See accompanying notes to financial statements.
| HCM INCOME PLUS FUND |
| SCHEDULE OF INVESTMENTS |
| June 30, 2024 |
| |
| Shares | | | | | Fair Value | |
| | | | | EXCHANGE-TRADED FUNDS — 99.6% | | | | |
| | | | | EQUITY - 67.5% | | | | |
| | 363,600 | | | Direxion Daily S&P 500 Bull 3X | | $ | 53,111,052 | |
| | 169,964 | | | Invesco QQQ Trust Series 1 | | | 81,431,452 | |
| | 1,388,800 | | | ProShares Ultra QQQ | | | 138,616,128 | |
| | 1,537,200 | | | ProShares Ultra S&P500 | | | 126,972,720 | |
| | 311,133 | | | Vanguard Mega Cap Growth ETF | | | 97,761,100 | |
| | | | | | | | 497,892,452 | |
| | | | | FIXED INCOME - 32.1% | | | | |
| | 1,283,500 | | | SPDR Bloomberg 1-3 Month T-Bill ETF | | | 117,799,630 | |
| | 2,366,600 | | | WisdomTree Floating Rate Treasury Fund | | | 119,063,646 | |
| | | | | | | | 236,863,276 | |
| | | | | | | | | |
| | | | | TOTAL EXCHANGE-TRADED FUNDS (Cost $585,631,946) | | | 734,755,728 | |
| | | | | | | | | |
| | | | | TOTAL INVESTMENTS - 99.6% (Cost $585,631,946) | | $ | 734,755,728 | |
| | | | | OTHER ASSETS IN EXCESS OF LIABILITIES - 0.4% | | | 3,026,934 | |
| | | | | NET ASSETS - 100.0% | | $ | 737,782,662 | |
| | | | | | | | | |
| ETF | - Exchange-Traded Fund |
| | |
| SPDR | - Standard & Poor’s Depositary Receipt |
| | |
See accompanying notes to financial statements.
| HCM DYNAMIC INCOME FUND |
| SCHEDULE OF INVESTMENTS |
| June 30, 2024 |
| |
| Shares | | | | | Fair Value | |
| | | | | EXCHANGE-TRADED FUNDS — 85.0% | | | | |
| | | | | FIXED INCOME - 85.0% | | | | |
| | 364,500 | | | iShares Convertible Bond ETF | | $ | 28,660,635 | |
| | 296,900 | | | iShares iBoxx High Yield Corporate Bond ETF | | | 22,902,866 | |
| | 406,400 | | | SPDR Bloomberg Convertible Securities ETF | | | 29,285,184 | |
| | 253,200 | | | SPDR Bloomberg High Yield Bond ETF | | | 23,869,164 | |
| | | | | TOTAL EXCHANGE-TRADED FUNDS (Cost $102,809,099) | | | 104,717,849 | |
| | | | | | | | | |
| | | | | TOTAL INVESTMENTS - 85.0% (Cost $102,809,099) | | $ | 104,717,849 | |
| | | | | OTHER ASSETS IN EXCESS OF LIABILITIES - 15.0% | | | 18,498,188 | |
| | | | | NET ASSETS - 100.0% | | $ | 123,216,037 | |
| | | | | | | | | |
| ETF | - Exchange-Traded Fund |
| SPDR | - Standard & Poor’s Depositary Receipt |
See accompanying notes to financial statements.
| The HCM Funds |
| STATEMENTS OF ASSETS AND LIABILITIES |
| June 30, 2024 |
| |
| | | HCM Tactical | | | HCM Dividend | | | HCM Income Plus | | | HCM Dynamic | |
| | | Growth Fund | | | Sector Plus Fund | | | Fund | | | Income Fund | |
| ASSETS | | | | | | | | | | | | | | | | |
| Investment securities: | | | | | | | | | | | | | | | | |
| At cost | | $ | 1,047,373,010 | | | $ | 1,284,915,342 | | | $ | 585,631,946 | | | $ | 102,809,099 | |
| At fair value | | $ | 1,507,881,208 | | | $ | 1,605,372,561 | | | $ | 734,755,728 | | | $ | 104,717,849 | |
| Cash and cash equivalents | | | 169,371,111 | | | | 7,168,593 | | | | 3,292,415 | | | | 19,039,984 | |
| Receivable for fund shares sold | | | 408,136 | | | | 771,945 | | | | 316,200 | | | | 21,749 | |
| Dividends and interest receivable | | | 3,180,057 | | | | 3,772,453 | | | | 793,732 | | | | 72,080 | |
| Prepaid expenses | | | 67,166 | | | | 46,212 | | | | 20,865 | | | | 36,220 | |
| TOTAL ASSETS | | | 1,680,907,678 | | | | 1,617,131,764 | | | | 739,178,940 | | | | 123,887,882 | |
| | | | | | | | | | | | | | | | | |
| LIABILITIES | | | | | | | | | | | | | | | | |
| Payable for investments purchased | | | 59,687,520 | | | | — | | | | — | | | | — | |
| Investment advisory fees payable | | | 1,622,984 | | | | 1,613,432 | | | | 575,968 | | | | 126,911 | |
| Distribution (12b-1) fees payable | | | 585,989 | | | | 621,153 | | | | 234,255 | | | | 22,558 | |
| Payable for fund shares redeemed | | | 1,517,572 | | | | 1,247,074 | | | | 485,333 | | | | 452,741 | |
| Payable to related parties | | | 66,597 | | | | 70,612 | | | | 36,294 | | | | 19,158 | |
| Accrued expenses and other liabilities | | | 95,598 | | | | 89,333 | | | | 64,428 | | | | 50,477 | |
| TOTAL LIABILITIES | | | 63,576,260 | | | | 3,641,604 | | | | 1,396,278 | | | | 671,845 | |
| NET ASSETS | | $ | 1,617,331,418 | | | $ | 1,613,490,160 | | | $ | 737,782,662 | | | $ | 123,216,037 | |
| | | | | | | | | | | | | | | | | |
| Net Assets Consist Of: | | | | | | | | | | | | | | | | |
| Paid in capital | | $ | 1,092,061,304 | | | $ | 1,212,752,830 | | | $ | 590,006,353 | | | $ | 126,038,956 | |
| Accumulated earnings (deficit) | | | 525,270,114 | | | | 400,737,330 | | | | 147,776,309 | | | | (2,822,919 | ) |
| NET ASSETS | | $ | 1,617,331,418 | | | $ | 1,613,490,160 | | | $ | 737,782,662 | | | $ | 123,216,037 | |
| | | | | | | | | | | | | | | | | |
See accompanying notes to financial statements.
| The HCM Funds |
| STATEMENTS OF ASSETS AND LIABILITIES (Continued) |
| June 30, 2024 |
| |
| | | HCM Tactical | | | HCM Dividend | | | HCM Income Plus | | | HCM Dynamic | |
| | | Growth Fund | | | Sector Plus Fund | | | Fund | | | Income Fund | |
| Net Asset Value Per Share: | | | | | | | | | | | | |
| Class A Shares: | | | | | | | | | | | | | | | | |
| Net Assets | | $ | 1,050,838,827 | | | $ | 991,373,787 | | | $ | 468,644,216 | | | $ | 109,321,869 | |
| Shares of beneficial interest outstanding ($0 par value, unlimited shares authorized) | | | 34,762,098 | | | | 47,617,588 | | | | 26,585,747 | | | | 11,179,426 | |
| Net asset value (Net Assets ÷ Shares Outstanding) and redemption price per share (a) | | $ | 30.23 | | | $ | 20.82 | | | $ | 17.63 | | | $ | 9.78 | |
| Maximum offering price per share (maximum sales charge of 5.75%) | | $ | 32.07 | | | $ | 22.09 | | | $ | 18.70 | | | $ | 10.38 | |
| | | | | | | | | | | | | | | | | |
| Class I Shares: | | | | | | | | | | | | | | | | |
| Net Assets | | $ | 100,138,567 | | | $ | 100,145,113 | | | $ | 86,325,491 | | | $ | 13,878,963 | |
| Shares of beneficial interest outstanding ($0 par value, unlimited shares authorized) | | | 3,276,881 | | | | 4,761,888 | | | | 4,879,133 | | | | 1,420,124 | |
| Net asset value (Net Assets ÷ Shares Outstanding), offering price and redemption price per share (a) | | $ | 30.56 | | | $ | 21.03 | | | $ | 17.69 | | | $ | 9.77 | |
| | | | | | | | | | | | | | | | | |
| Class R Shares: | | | | | | | | | | | | | | | | |
| Net Assets | | $ | 34 | | | $ | 33 | | | | | | | | | |
| Shares of beneficial interest outstanding ($0 par value, unlimited shares authorized) | | | 1 | | | | 2 | | | | | | | | | |
| Net asset value (Net Assets ÷ Shares Outstanding), offering price and redemption price per share (a) | | $ | 30.24 | * | | $ | 20.77 | * | | | | | | | | |
| | | | | | | | | | | | | | | | | |
| Class A1 Shares: | | | | | | | | | | | | | | | | |
| Net Assets | | | | | | $ | 5,749 | | | | | | | | | |
| Shares of beneficial interest outstanding ($0 par value, unlimited shares authorized) | | | | | | | 275 | | | | | | | | | |
| Net asset value (Net Assets ÷ Shares Outstanding) and redemption price per share (a) | | | | | | $ | 20.88 | * | | | | | | | | |
| Maximum offering price per share (maximum sales charge of 5.75%) | | | | | | $ | 22.15 | | | | | | | | | |
| | | | | | | | | | | | | | | | | |
| Investor Class Shares: | | | | | | | | | | | | | | | | |
| Net Assets | | $ | 466,353,990 | | | $ | 521,965,478 | | | $ | 182,812,955 | | | $ | 15,205 | |
| Shares of beneficial interest outstanding ($0 par value, unlimited shares authorized) | | | 16,545,450 | | | | 26,399,570 | | | | 10,685,631 | | | | 1,564 | |
| Net asset value (Net Assets ÷ Shares Outstanding), offering price and redemption price per share (a) | | $ | 28.19 | | | $ | 19.77 | | | $ | 17.11 | | | $ | 9.72 | |
| | | | | | | | | | | | | | | | | |
| (a) | Redemptions of shares held less than 30 days may be assessed a redemption fee of 1.00%. |
| * | NAV may not recalculate due to rounding of shares. |
See accompanying notes to financial statements.
| The HCM Funds |
| STATEMENTS OF OPERATIONS |
| For the Year Ended June 30, 2024 |
| |
| | | HCM Tactical | | | HCM Dividend | | | HCM Income | | | HCM Dynamic | |
| | | Growth Fund | | | Sector Plus Fund | | | Plus Fund | | | Income Fund | |
| INVESTMENT INCOME | | | | | | | | | | | | | | | | |
| Dividends | | $ | 8,462,404 | | | $ | 19,867,057 | | | $ | 12,600,955 | | | $ | 5,072,712 | |
| Interest | | | 8,339,757 | | | | 3,667,749 | | | | 660,307 | | | | 513,692 | |
| TOTAL INVESTMENT INCOME | | | 16,802,161 | | | | 23,534,806 | | | | 13,261,262 | | | | 5,586,404 | |
| | | | | | | | | | | | | | | | | |
| EXPENSES | | | | | | | | | | | | | | | | |
| Investment advisory fees | | | 16,794,330 | | | | 17,428,457 | | | | 6,198,795 | | | | 1,629,343 | |
| Distribution (12b-1) fees: | | | | | | | | | | | | | | | | |
| Class A | | | 2,238,414 | | | | 2,206,719 | | | | 1,064,180 | | | | 291,457 | |
| Class A1 | | | — | | | | 23 | | | | — | | | | — | |
| Investor Class | | | 3,638,370 | | | | 4,233,483 | | | | 1,565,443 | | | | 41 | |
| Third party administrative servicing fees | | | 387,045 | | | | 378,217 | | | | 147,074 | | | | 54,815 | |
| Administrative services fees | | | 375,605 | | | | 388,719 | | | | 190,013 | | | | 26,063 | |
| Transfer agent fees | | | 309,409 | | | | 327,615 | | | | 220,203 | | | | 173,750 | |
| Accounting services fees | | | 166,321 | | | | 177,119 | | | | 86,799 | | | | 27,843 | |
| Registration fees | | | 140,084 | | | | 150,370 | | | | 125,344 | | | | 69,616 | |
| Custodian fees | | | 83,745 | | | | 95,859 | | | | 45,681 | | | | 19,912 | |
| Printing and postage expenses | | | 43,621 | | | | 48,211 | | | | 30,690 | | | | 38,526 | |
| Compliance officer fees | | | 35,770 | | | | 36,684 | | | | 24,320 | | | | 16,524 | |
| Audit fees | | | 22,937 | | | | 22,934 | | | | 22,937 | | | | 22,646 | |
| Trustees fees and expenses | | | 18,367 | | | | 18,479 | | | | 17,898 | | | | 13,748 | |
| Legal fees | | | 15,987 | | | | 14,421 | | | | 10,462 | | | | 17,194 | |
| Insurance expense | | | 13,975 | | | | 15,030 | | | | 9,021 | | | | 1,989 | |
| Other expenses | | | 9,880 | | | | 11,127 | | | | 2,689 | | | | 12,920 | |
| TOTAL EXPENSES | | | 24,293,860 | | | | 25,553,467 | | | | 9,761,549 | | | | 2,416,387 | |
| NET INVESTMENT INCOME (LOSS) | | | (7,491,699 | ) | | | (2,018,661 | ) | | | 3,499,713 | | | | 3,170,017 | |
| | | | | | | | | | | | | | | | | |
| REALIZED AND UNREALIZED GAIN ON INVESTMENTS | | | | | | | | | | | | | | | | |
| Net realized gain from investments | | | 191,670,563 | | | | 177,224,583 | | | | 58,860,804 | | | | 97,226 | |
| Net change in unrealized appreciation on investments | | | 175,797,839 | | | | 115,539,588 | | | | 71,232,904 | | | | 722,042 | |
| | | | | | | | | | | | | | | | | |
| NET REALIZED AND UNREALIZED GAIN ON INVESTMENTS | | | 367,468,402 | | | | 292,764,171 | | | | 130,093,708 | | | | 819,268 | |
| | | | | | | | | | | | | | | | | |
| NET INCREASE IN NET ASSETS RESULTING FROM OPERATIONS | | $ | 359,976,703 | | | $ | 290,745,510 | | | $ | 133,593,421 | | | $ | 3,989,285 | |
| | | | | | | | | | | | | | | | | |
See accompanying notes to financial statements.
| HCM Tactical Growth Fund |
| STATEMENTS OF CHANGES IN NET ASSETS |
| |
| | | Year Ended | | | Year Ended | |
| | | June 30, 2024 | | | June 30, 2023 | |
| FROM OPERATIONS | | | | | | | | |
| Net investment loss | | $ | (7,491,699 | ) | | $ | (5,647,297 | ) |
| Net realized gain (loss) from investments | | | 191,670,563 | | | | (113,274,474 | ) |
| Net change in unrealized appreciation on investments | | | 175,797,839 | | | | 296,052,372 | |
| Net increase in net assets resulting from operations | | | 359,976,703 | | | | 177,130,601 | |
| | | | | | | | | |
| DISTRIBUTIONS TO SHAREHOLDERS | | | | | | | | |
| Total distributions paid: | | | | | | | | |
| Class A | | | — | | | | (5,188,529 | ) |
| Class I | | | — | | | | (127,291 | ) |
| Class R | | | — | | | | (1 | ) |
| Investor Class | | | — | | | | (1,504,713 | ) |
| From return of capital: | | | | | | | | |
| Class A | | | — | | | | (8,027 | ) |
| Class I | | | — | | | | (197 | ) |
| Class R | | | — | | | | (0 | ) * |
| Investor Class | | | — | | | | (2,328 | ) |
| Net decrease in net assets resulting from distributions to shareholders | | | — | | | | (6,831,086 | ) |
| | | | | | | | | |
| FROM SHARES OF BENEFICIAL INTEREST | | | | | | | | |
| Proceeds from shares sold: | | | | | | | | |
| Class A | | | 207,859,493 | | | | 304,333,904 | |
| Class I | | | 83,893,377 | | | | 19,852,192 | |
| Investor Class | | | 103,166,705 | | | | 91,270,955 | |
| Net asset value of shares issued in reinvestment of distributions: | | | | | | | | |
| Class A | | | — | | | | 5,040,405 | |
| Class I | | | — | | | | 126,176 | |
| Class R | | | — | | | | 1 | |
| Investor Class | | | — | | | | 1,493,133 | |
| Payments for shares redeemed: | | | | | | | | |
| Class A | | | (327,658,421 | ) | | | (252,642,062 | ) |
| Class I | | | (31,616,283 | ) | | | (13,792,929 | ) |
| Investor Class | | | (49,364,314 | ) | | | (31,314,472 | ) |
| Net increase (decrease) in net assets resulting from shares of beneficial interest | | | (13,719,443 | ) | | | 124,367,303 | |
| | | | | | | | | |
| TOTAL INCREASE IN NET ASSETS | | | 346,257,260 | | | | 294,666,818 | |
| | | | | | | | | |
| NET ASSETS | | | | | | | | |
| Beginning of Year | | | 1,271,074,158 | | | | 976,407,340 | |
| End of Year | | $ | 1,617,331,418 | | | $ | 1,271,074,158 | |
| | | | | | | | | |
| * | Amount represents less than $0.50. |
See accompanying notes to financial statements.
| HCM Tactical Growth Fund |
| STATEMENTS OF CHANGES IN NET ASSETS (Continued) |
| |
| | | Year Ended | | | Year Ended | |
| | | June 30, 2024 | | | June 30, 2023 | |
| SHARE ACTIVITY | | | | | | | | |
| Class A: | | | | | | | | |
| Shares Sold | | | 8,343,583 | | | | 15,017,193 | |
| Shares Reinvested | | | — | | | | 272,749 | |
| Shares Redeemed | | | (13,388,813 | ) | | | (12,628,027 | ) |
| Net increase (decrease) in shares of beneficial interest outstanding | | | (5,045,230 | ) | | | 2,661,915 | |
| | | | | | | | | |
| Class I: | | | | | | | | |
| Shares Sold | | | 3,496,544 | | | | 998,914 | |
| Shares Reinvested | | | — | | | | 6,780 | |
| Shares Redeemed | | | (1,286,131 | ) | | | (690,912 | ) |
| Net increase in shares of beneficial interest outstanding | | | 2,210,413 | | | | 314,782 | |
| | | | | | | | | |
| Class R: | | | | | | | | |
| Shares Reinvested | | | — | | | | — | + |
| Net increase in shares of beneficial interest outstanding | | | — | | | | — | + |
| | | | | | | | | |
| Investor Class: | | | | | | | | |
| Shares Sold | | | 4,498,312 | | | | 4,842,537 | |
| Shares Reinvested | | | — | | | | 85,714 | |
| Shares Redeemed | | | (2,093,282 | ) | | | (1,653,842 | ) |
| Net increase in shares of beneficial interest outstanding | | | 2,405,030 | | | | 3,274,409 | |
| | | | | | | | | |
| * | Amount represents less than one share. |
See accompanying notes to financial statements.
| HCM Dividend Sector Plus Fund |
| STATEMENTS OF CHANGES IN NET ASSETS |
| |
| | | Year Ended | | | Year Ended | |
| | | June 30, 2024 | | | June 30, 2023 | |
| FROM OPERATIONS | | | | | | | | |
| Net investment income (loss) | | $ | (2,018,661 | ) | | $ | 2,480,399 | |
| Net realized gain (loss) from investments | | | 177,224,583 | | | | (10,453,713 | ) |
| Net change in unrealized appreciation on investments | | | 115,539,588 | | | | 149,567,459 | |
| Net increase in net assets resulting from operations | | | 290,745,510 | | | | 141,594,145 | |
| | | | | | | | | |
| DISTRIBUTIONS TO SHAREHOLDERS | | | | | | | | |
| Total distributions paid: | | | | | | | | |
| Class A | | | (41,749,421 | ) | | | (67,501,217 | ) |
| Class I | | | (4,562,769 | ) | | | (1,899,512 | ) |
| Class R | | | (1 | ) | | | (2 | ) |
| Class A1 | | | (268 | ) | | | (404 | ) |
| Investor Class | | | (20,517,789 | ) | | | (21,968,481 | ) |
| Net decrease in net assets resulting from distributions to shareholders | | | (66,830,248 | ) | | | (91,369,616 | ) |
| | | | | | | | | |
| FROM SHARES OF BENEFICIAL INTEREST | | | | | | | | |
| Proceeds from shares sold: | | | | | | | | |
| Class A | | | 162,918,209 | | | | 212,975,482 | |
| Class I | | | 91,585,752 | | | | 22,370,253 | |
| Class A1 | | | 462 | | | | 1,447 | |
| Investor Class | | | 121,176,491 | | | | 101,419,478 | |
| Net asset value of shares issued in reinvestment of distributions: | | | | | | | | |
| Class A | | | 40,892,950 | | | | 65,401,075 | |
| Class I | | | 4,209,591 | | | | 1,803,078 | |
| Class R | | | 1 | | | | 2 | |
| Class A1 | | | 268 | | | | 404 | |
| Investor Class | | | 20,210,124 | | | | 21,646,473 | |
| Payments for shares redeemed: | | | | | | | | |
| Class A | | | (301,842,899 | ) | | | (283,250,826 | ) |
| Class I | | | (33,772,641 | ) | | | (18,177,937 | ) |
| Class A1 | | | (2,485 | ) | | | (1,217 | ) |
| Investor Class | | | (58,710,736 | ) | | | (38,542,003 | ) |
| Net increase in net assets resulting from shares of beneficial interest | | | 46,665,087 | | | | 85,645,709 | |
| | | | | | | | | |
| TOTAL INCREASE IN NET ASSETS | | | 270,580,349 | | | | 135,870,238 | |
| | | | | | | | | |
| NET ASSETS | | | | | | | | |
| Beginning of Year | | | 1,342,909,811 | | | | 1,207,039,573 | |
| End of Year | | $ | 1,613,490,160 | | | $ | 1,342,909,811 | |
| | | | | | | | | |
See accompanying notes to financial statements.
| HCM Dividend Sector Plus Fund |
| STATEMENTS OF CHANGES IN NET ASSETS (Continued) |
| |
| | | Year Ended | | | Year Ended | |
| | | June 30, 2024 | | | June 30, 2023 | |
| SHARE ACTIVITY | | | | | | | | |
| Class A: | | | | | | | | |
| Shares Sold | | | 8,901,000 | | | | 12,682,253 | |
| Shares Reinvested | | | 2,328,756 | | | | 4,197,758 | |
| Shares Redeemed | | | (16,662,608 | ) | | | (17,103,369 | ) |
| Net decrease in shares of beneficial interest outstanding | | | (5,432,852 | ) | | | (223,358 | ) |
| | | | | | | | | |
| Class I: | | | | | | | | |
| Shares Sold | | | 5,038,204 | | | | 1,325,095 | |
| Shares Reinvested | | | 237,696 | | | | 114,773 | |
| Shares Redeemed | | | (1,851,311 | ) | | | (1,089,832 | ) |
| Net increase in shares of beneficial interest outstanding | | | 3,424,589 | | | | 350,036 | |
| | | | | | | | | |
| Class R: | | | | | | | | |
| Shares Reinvested | | | — | + | | | — | + |
| Net increase in shares of beneficial interest outstanding | | | — | + | | | — | + |
| | | | | | | | | |
| Class A1: | | | | | | | | |
| Shares Sold | | | 26 | | | | 87 | |
| Shares Reinvested | | | 15 | | | | 26 | |
| Shares Redeemed | | | (134 | ) | | | (71 | ) |
| Net increase (decrease) in shares of beneficial interest outstanding | | | (93 | ) | | | 42 | |
| | | | | | | | | |
| Investor Class: | | | | | | | | |
| Shares Sold | | | 7,005,627 | | | | 6,394,738 | |
| Shares Reinvested | | | 1,207,295 | | | | 1,445,025 | |
| Shares Redeemed | | | (3,366,745 | ) | | | (2,395,225 | ) |
| Net increase in shares of beneficial interest outstanding | | | 4,846,177 | | | | 5,444,538 | |
| | | | | | | | | |
| + | Amount represents less than one share. |
See accompanying notes to financial statements.
| HCM Income Plus Fund |
| STATEMENTS OF CHANGES IN NET ASSETS |
| |
| | | Year Ended | | | Year Ended | |
| | | June 30, 2024 | | | June 30, 2023 | |
| FROM OPERATIONS | | | | | | | | |
| Net investment income | | $ | 3,499,713 | | | $ | 1,704,381 | |
| Net realized gain (loss) from investments | | | 58,860,804 | | | | (17,708,770 | ) |
| Net change in unrealized appreciation on investments | | | 71,232,904 | | | | 69,742,499 | |
| Net increase in net assets resulting from operations | | | 133,593,421 | | | | 53,738,110 | |
| | | | | | | | | |
| DISTRIBUTIONS TO SHAREHOLDERS | | | | | | | | |
| Total distributions paid: | | | | | | | | |
| Class A | | | (2,655,131 | ) | | | — | |
| Class I | | | (564,644 | ) | | | — | |
| Investor Class | | | (58,786 | ) | | | — | |
| Net decrease in net assets resulting from distributions to shareholders | | | (3,278,561 | ) | | | — | |
| | | | | | | | | |
| FROM SHARES OF BENEFICIAL INTEREST | | | | | | | | |
| Proceeds from shares sold: | | | | | | | | |
| Class A | | | 83,200,618 | | | | 121,521,587 | |
| Class I | | | 89,611,112 | | | | 9,599,848 | |
| Investor Class | | | 50,450,138 | | | | 31,001,550 | |
| Net asset value of shares issued in reinvestment of distributions: | | | | | | | | |
| Class A | | | 2,597,763 | | | | — | |
| Class I | | | 528,443 | | | | — | |
| Investor Class | | | 57,862 | | | | — | |
| Payments for shares redeemed: | | | | | | | | |
| Class A | | | (169,003,459 | ) | | | (259,522,118 | ) |
| Class I | | | (28,164,087 | ) | | | (5,223,755 | ) |
| Investor Class | | | (43,196,036 | ) | | | (19,499,283 | ) |
| Net decrease in net assets resulting from shares of beneficial interest | | | (13,917,646 | ) | | | (122,122,171 | ) |
| | | | | | | | | |
| TOTAL INCREASE (DECREASE) IN NET ASSETS | | | 116,397,214 | | | | (68,384,061 | ) |
| | | | | | | | | |
| NET ASSETS | | | | | | | | |
| Beginning of Year | | | 621,385,448 | | | | 689,769,509 | |
| End of Year | | $ | 737,782,662 | | | $ | 621,385,448 | |
| | | | | | | | | |
See accompanying notes to financial statements.
| HCM Income Plus Fund |
| STATEMENTS OF CHANGES IN NET ASSETS (Continued) |
| |
| | | Year Ended | | | Year Ended | |
| | | June 30, 2024 | | | June 30, 2023 | |
| SHARE ACTIVITY | | | | | | | | |
| Class A: | | | | | | | | |
| Shares Sold | | | 5,417,507 | | | | 9,193,224 | |
| Shares Reinvested | | | 170,569 | | | | — | |
| Shares Redeemed | | | (11,231,280 | ) | | | (19,748,303 | ) |
| Net decrease in shares of beneficial interest outstanding | | | (5,643,204 | ) | | | (10,555,079 | ) |
| | | | | | | | | |
| Class I: | | | | | | | | |
| Shares Sold | | | 5,980,885 | | | | 741,460 | |
| Shares Reinvested | | | 34,607 | | | | — | |
| Shares Redeemed | | | (1,811,388 | ) | | | (397,195 | ) |
| Net increase in shares of beneficial interest outstanding | | | 4,204,104 | | | | 344,265 | |
| | | | | | | | | |
| Investor Class: | | | | | | | | |
| Shares Sold | | | 3,373,785 | | | | 2,428,157 | |
| Shares Reinvested | | | 3,899 | | | | — | |
| Shares Redeemed | | | (2,857,553 | ) | | | (1,522,880 | ) |
| Net increase in shares of beneficial interest outstanding | | | 520,131 | | | | 905,277 | |
| | | | | | | | | |
See accompanying notes to financial statements.
| HCM Dynamic Income Fund |
| STATEMENTS OF CHANGES IN NET ASSETS |
| |
| | | Year Ended | | | Year Ended | |
| | | June 30, 2024 | | | June 30, 2023 * | |
| FROM OPERATIONS | | | | | | | | |
| Net investment income | | $ | 3,170,017 | | | $ | 1,978,277 | |
| Net realized gain (loss) from investments | | | 97,226 | | | | (5,909,280 | ) |
| Net change in unrealized appreciation on investments | | | 722,042 | | | | 1,186,708 | |
| Net increase (decrease) in net assets resulting from operations | | | 3,989,285 | | | | (2,744,295 | ) |
| | | | | | | | | |
| DISTRIBUTIONS TO SHAREHOLDERS | | | | | | | | |
| Total distributions paid: | | | | | | | | |
| Class A | | | (3,092,414 | ) | | | (636,023 | ) |
| Class I | | | (414,975 | ) | | | (0 | ) + |
| Investor Class | | | (0 | ) + | | | (0 | ) + |
| Net decrease in net assets resulting from distributions to shareholders | | | (3,507,389 | ) | | | (636,023 | ) |
| | | | | | | | | |
| FROM SHARES OF BENEFICIAL INTEREST | | | | | | | | |
| Proceeds from shares sold: | | | | | | | | |
| Class A | | | 25,149,770 | | | | 173,919,797 | |
| Class I | | | 16,963,931 | | | | 3,532 | |
| Investor Class | | | 11,571 | | | | 10 | |
| Net asset value of shares issued in reinvestment of distributions: | | | | | | | | |
| Class A | | | 3,037,183 | | | | 604,346 | |
| Class I | | | 366,388 | | | | 0 | + |
| Investor Class | | | 0 | + | | | 0 | + |
| Payments for shares redeemed: | | | | | | | | |
| Class A | | | (48,682,328 | ) | | | (41,803,024 | ) |
| Class I | | | (3,456,717 | ) | | | — | |
| Net increase (decrease) in net assets resulting from shares of beneficial interest | | | (6,610,202 | ) | | | 132,724,661 | |
| | | | | | | | | |
| TOTAL INCREASE (DECREASE) IN NET ASSETS | | | (6,128,306 | ) | | | 129,344,343 | |
| | | | | | | | | |
| NET ASSETS | | | | | | | | |
| Beginning of Year | | | 129,344,343 | | | | — | |
| End of Year | | $ | 123,216,037 | | | $ | 129,344,343 | |
| | | | | | | | | |
| * | The HCM Dynamic Income Fund Class A, Class I and Investor Class commenced operations on June 30, 2022. |
| + | Amount represents less than $0.50. |
See accompanying notes to financial statements.
| HCM Dynamic Income Fund |
| STATEMENTS OF CHANGES IN NET ASSETS (Continued) |
| |
| | | Year Ended | | | Year Ended | |
| | | June 30, 2024 | | | June 30, 2023 * | |
| SHARE ACTIVITY | | | | | | | | |
| Class A: | | | | | | | | |
| Shares Sold | | | 2,587,118 | | | | 17,515,030 | |
| Shares Reinvested | | | 302,508 | | | | 61,921 | |
| Shares Redeemed | | | (4,984,966 | ) | | | (4,302,185 | ) |
| Net increase (decrease) in shares of beneficial interest outstanding | | | (2,095,340 | ) | | | 13,274,766 | |
| | | | | | | | | |
| Class I: | | | | | | | | |
| Shares Sold | | | 1,737,944 | | | | 366 | |
| Shares Reinvested | | | 36,566 | | | | — | + |
| Shares Redeemed | | | (354,752 | ) | | | — | |
| Net increase in shares of beneficial interest outstanding | | | 1,419,758 | | | | 366 | |
| | | | | | | | | |
| Investor Class: | | | | | | | | |
| Shares Sold | | | 1,563 | | | | 1 | |
| Shares Reinvested | | | — | + | | | — | + |
| Net increase in shares of beneficial interest outstanding | | | 1,563 | + | | | 1 | |
| | | | | | | | | |
| * | The HCM Dynamic Income Fund Class A, Class I and Investor Class commenced operations on June 30, 2022. |
| + | Amount represents less than one share. |
See accompanying notes to financial statements.
| HCM Tactical Growth Fund |
| FINANCIAL HIGHLIGHTS |
| |
Per Share Data and Ratios for a Share of Beneficial Interest Outstanding Throughout each Year
| | | Year Ended | | | Year Ended | | | Year Ended | | | Year Ended | | | Year Ended | |
| Class A | | June 30, 2024 | | | June 30, 2023 | | | June 30, 2022 | | | June 30, 2021 | | | June 30, 2020 | |
| Net asset value, beginning of year | | $ | 23.47 | | | $ | 20.26 | | | $ | 26.15 | | | $ | 16.32 | | | $ | 12.80 | |
| Activity from investment operations: | | | | | | | | | | | | | | | | | | | | |
| Net investment loss (1) | | | (0.09 | ) | | | (0.07 | ) | | | (0.31 | ) | | | (0.29 | ) | | | (0.17 | ) |
| Net realized and unrealized gain (loss) on investments | | | 6.85 | | | | 3.41 | | | | (5.30 | ) | | | 10.80 | | | | 3.69 | |
| Total from investment operations | | | 6.76 | | | | 3.34 | | | | (5.61 | ) | | | 10.51 | | | | 3.52 | |
| Less distributions from: | | | | | | | | | | | | | | | | | | | | |
| Return of capital | | | — | | | | (0.00 | ) (6) | | | — | | | | — | | | | — | |
| Net realized gains | | | — | | | | (0.13 | ) | | | (0.28 | ) | | | (0.68 | ) | | | — | |
| Total distributions | | | — | | | | (0.13 | ) | | | (0.28 | ) | | | (0.68 | ) | | | — | |
| Paid-in-Capital From Redemption Fees | | | — | | | | — | | | | 0.00 | (6) | | | 0.00 | (6) | | | 0.00 | (6) |
| Net asset value, end of year | | $ | 30.23 | | | $ | 23.47 | | | $ | 20.26 | | | $ | 26.15 | | | $ | 16.32 | |
| Total return (2) | | | 28.80 | % | | | 16.64 | % | | | (21.77 | )% | | | 65.30 | % | | | 27.50 | % |
| Net assets, at end of year (000s) | | $ | 1,050,839 | | | $ | 934,122 | | | $ | 752,628 | | | $ | 626,800 | | | $ | 216,981 | |
| Ratio of gross expenses to average net assets (3) (4) | | | 1.61 | % | | | 1.63 | % | | | 1.64 | % | | | 1.65 | % | | | 1.71 | % |
| Ratio of net expenses to average net assets (4) | | | 1.61 | % | | | 1.63 | % | | | 1.64 | % | | | 1.65 | % | | | 1.71 | % |
| Ratio of net investment loss to average net assets (4) (5) | | | (0.38 | )% | | | (0.37 | )% | | | (1.20 | )% | | | (1.33 | )% | | | (1.25 | )% |
| Portfolio Turnover Rate | | | 188 | % | | | 298 | % | | | 107 | % | | | 23 | % | | | 140 | % |
| | | | | | | | | | | | | | | | | | | | | |
| (1) | Per share amounts calculated using the average shares method, which more appropriately presents the per share data for each year. |
| (2) | Total returns shown are historical in nature and assume changes in share price, reinvestment of dividends and distributions, if any, and exclude the effect of applicable sales charges and redemption fees. |
| (3) | Represents the ratio of expenses to average net assets absent fee waivers, expense reimbursements and/or expense recaptures by the adviser. |
| (4) | Does not include the expenses of other investment companies in which the Fund invests, as these expenses are included in the realized and unrealized gain/(loss) on investments. |
| (5) | Recognition of net investment loss by the Fund is affected by the timing of declaration of dividends by the underlying investments in which the Fund invests as well as timing of subscriptions and redemptions within each share class. |
| (6) | Amount represents less than $0.005 per share. |
See accompanying notes to financial statements.
| HCM Tactical Growth Fund |
| FINANCIAL HIGHLIGHTS |
| |
Per Share Data and Ratios for a Share of Beneficial Interest Outstanding Throughout each Year
| | | Year Ended | | | Year Ended | | | Year Ended | | | Year Ended | | | Year Ended | |
| Class I | | June 30, 2024 | | | June 30, 2023 | | | June 30, 2022 | | | June 30, 2021 | | | June 30, 2020 | |
| Net asset value, beginning of year | | $ | 23.66 | | | $ | 20.38 | | | $ | 26.23 | | | $ | 16.33 | | | $ | 12.81 | |
| Activity from investment operations: | | | | | | | | | | | | | | | | | | | | |
| Net investment income (loss) (1) | | | (0.02 | ) | | | (0.03 | ) | | | (0.25 | ) | | | (0.25 | ) | | | 0.07 | |
| Net realized and unrealized gain (loss) on investments | | | 6.92 | | | | 3.44 | | | | (5.32 | ) | | | 10.83 | | | | 3.45 | |
| Total from investment operations | | | 6.90 | | | | 3.41 | | | | (5.57 | ) | | | 10.58 | | | | 3.52 | |
| Less distributions from: | | | | | | | | | | | | | | | | | | | | |
| Return of capital | | | — | | | | (0.00 | ) (7) | | | — | | | | — | | | | — | |
| Net realized gains | | | — | | | | (0.13 | ) | | | (0.28 | ) | | | (0.68 | ) | | | — | |
| Total distributions | | | — | | | | (0.13 | ) | | | (0.28 | ) | | | (0.68 | ) | | | — | |
| Paid-in-Capital From Redemption Fees | | | — | | | | — | | | | 0.00 | (7) | | | — | | | | — | |
| Net asset value, end of year | | $ | 30.56 | | | $ | 23.66 | | | $ | 20.38 | | | $ | 26.23 | | | $ | 16.33 | |
| Total return (2) | | | 29.16 | % | | | 16.88 | % | | | (21.55 | )% | | | 65.70 | % | | | 27.48 | % |
| Net assets, at end of year (000s) | | $ | 100,139 | | | $ | 25,235 | | | $ | 15,316 | | | $ | 7,960 | | | $ | 16 | (6) |
| Ratio of gross expenses to average net assets (3) (4) | | | 1.36 | % | | | 1.37 | % | | | 1.39 | % | | | 1.40 | % | | | 1.46 | % |
| Ratio of net expenses to average net assets (4) | | | 1.36 | % | | | 1.37 | % | | | 1.39 | % | | | 1.40 | % | | | 1.46 | % |
| Ratio of net investment income (loss) to average net assets (4) (5) | | | (0.10 | )% | | | (0.13 | )% | | | (0.95 | )% | | | (1.08 | )% | | | 0.47 | % |
| Portfolio Turnover Rate | | | 188 | % | | | 298 | % | | | 107 | % | | | 23 | % | | | 140 | % |
| | | | | | | | | | | | | | | | | | | | | |
| (1) | Per share amounts calculated using the average shares method, which more appropriately presents the per share data for each year. |
| (2) | Total returns shown are historical in nature and assume changes in share price, reinvestment of dividends and distributions, if any, and exclude the effect of applicable sales charges and redemption fees. |
| (3) | Represents the ratio of expenses to average net assets absent fee waivers, expense reimbursements and/or expense recaptures by the adviser. |
| (4) | Does not include the expenses of other investment companies in which the Fund invests, as these expenses are included in the realized and unrealized gain/(loss) on investments. |
| (5) | Recognition of net investment income (loss) by the Fund is affected by the timing of declaration of dividends by the underlying investments in which the Fund invests as well as timing of subscriptions and redemptions within each. |
| (6) | Actual net assets, not truncated. |
| (7) | Amount represents less than $0.005 per share. |
See accompanying notes to financial statements.
| HCM Tactical Growth Fund |
| FINANCIAL HIGHLIGHTS |
| |
Per Share Data and Ratios for a Share of Beneficial Interest Outstanding Throughout each Year
| | | Year Ended | | | Year Ended | | | Year Ended | | | Year Ended | | | Year Ended | |
| Class R | | June 30, 2024 | | | June 30, 2023 | | | June 30, 2022 | | | June 30, 2021 | | | June 30, 2020 | |
| Net asset value, beginning of year | | $ | 23.48 | | | $ | 20.27 | | | $ | 26.16 | | | $ | 16.33 | | | $ | 12.81 | |
| Activity from investment operations: | | | | | | | | | | | | | | | | | | | | |
| Net investment income (1) | | | 0.15 | (7) | | | 0.06 | (7) | | | 0.07 | | | | 0.03 | | | | 0.07 | |
| Net realized and unrealized gain (loss) on investments | | | 6.61 | | | | 3.28 | | | | (5.68 | ) | | | 10.48 | | | | 3.45 | |
| Total from investment operations | | | 6.76 | | | | 3.34 | | | | (5.61 | ) | | | 10.51 | | | | 3.52 | |
| Less distributions from: | | | | | | | | | | | | | | | | | | | | |
| Return of capital | | | — | | | | (0.00 | ) (8) | | | — | | | | — | | | | — | |
| Net realized gains | | | — | | | | (0.13 | ) | | | (0.28 | ) | | | (0.68 | ) | | | — | |
| Total distributions | | | — | | | | (0.13 | ) | | | (0.28 | ) | | | (0.68 | ) | | | — | |
| Net asset value, end of year | | $ | 30.24 | | | $ | 23.48 | | | $ | 20.27 | | | $ | 26.16 | | | $ | 16.33 | |
| Total return (2) | | | 28.79 | % | | | 16.63 | % | | | (21.76 | )% | | | 65.26 | % | | | 27.48 | % |
| Net assets, at end of year (6) | | $ | 34 | | | $ | 26 | | | $ | 23 | | | $ | 29 | | | $ | 16 | |
| Ratio of gross expenses to average net assets (3) (4) | | | 1.46 | % | | | 1.48 | % | | | 1.49 | % | | | 1.50 | % | | | 1.56 | % |
| Ratio of net expenses to average net assets (4) | | | 1.46 | % | | | 1.48 | % | | | 1.49 | % | | | 1.50 | % | | | 1.56 | % |
| Ratio of net investment income (loss) to average net assets (4) (5) | | | 0.61 | % | | | 0.31 | % | | | (1.05 | )% | | | (1.18 | )% | | | 0.47 | % |
| Portfolio Turnover Rate | | | 188 | % | | | 298 | % | | | 107 | % | | | 23 | % | | | 140 | % |
| | | | | | | | | | | | | | | | | | | | | |
| (1) | Per share amounts calculated using the average shares method, which more appropriately presents the per share data for each year. |
| (2) | Total returns shown are historical in nature and assume changes in share price, reinvestment of dividends and distributions, if any, and exclude the effect of applicable sales charges and redemption fees. |
| (3) | Represents the ratio of expenses to average net assets absent fee waivers, expense reimbursements and/or expense recaptures by the adviser. |
| (4) | Does not include the expenses of other investment companies in which the Fund invests, as these expenses are included in the realized and unrealized gain/(loss) on investments. |
| (5) | Recognition of net investment income by the Fund is affected by the timing of declaration of dividends by the underlying investments in which the Fund invests as well as timing of subscriptions and redemptions within each share class. |
| (6) | Actual net assets, not truncated. |
| (7) | Net investment income per share are balancing amounts necessary to reconcile the change in net asset value per share for the period, and may not accord with the aggregate income and loss in the Statement of Operations due to timing of shareholder transactions for the period. |
| (8) | Amount represents less than $0.005 per share. |
See accompanying notes to financial statements.
| HCM Tactical Growth Fund |
| FINANCIAL HIGHLIGHTS |
| |
Per Share Data and Ratios for a Share of Beneficial Interest Outstanding Throughout each Year
| | | Year Ended | | | Year Ended | | | Year Ended | | | Year Ended | | | Year Ended | |
| Investor Class | | June 30, 2024 | | | June 30, 2023 | | | June 30, 2022 | | | June 30, 2021 | | | June 30, 2020 | |
| Net asset value, beginning of year | | $ | 22.04 | | | $ | 19.18 | | | $ | 24.96 | | | $ | 15.71 | | | $ | 12.42 | |
| Activity from investment operations: | | | | | | | | | | | | | | | | | | | | |
| Net investment loss (1) | | | (0.26 | ) | | | (0.22 | ) | | | (0.49 | ) | | | (0.44 | ) | | | (0.27 | ) |
| Net realized and unrealized gain (loss) on investments | | | 6.41 | | | | 3.21 | | | | (5.01 | ) | | | 10.37 | | | | 3.56 | |
| Total from investment operations | | | 6.15 | | | | 2.99 | | | | (5.50 | ) | | | 9.93 | | | | 3.29 | |
| Less distributions from: | | | | | | | | | | | | | | | | | | | | |
| Return of capital | | | — | | | | (0.00 | ) (6) | | | — | | | | — | | | | — | |
| Net realized gains | | | — | | | | (0.13 | ) | | | (0.28 | ) | | | (0.68 | ) | | | — | |
| Total distributions | | | — | | | | (0.13 | ) | | | (0.28 | ) | | | (0.68 | ) | | | — | |
| Paid-in-Capital From Redemption Fees | | | — | | | | — | | | | 0.00 | (6) | | | 0.00 | (6) | | | 0.00 | (6) |
| Net asset value, end of year | | $ | 28.19 | | | $ | 22.04 | | | $ | 19.18 | | | $ | 24.96 | | | $ | 15.71 | |
| Total return (2) | | | 27.90 | % | | | 15.75 | % | | | (22.37 | )% | | | 64.13 | % | | | 26.49 | % |
| Net assets, at end of year (000s) | | $ | 466,354 | | | $ | 311,717 | | | $ | 208,464 | | | $ | 179,812 | | | $ | 61,867 | |
| Ratio of gross expenses to average net assets (3) (4) | | | 2.36 | % | | | 2.37 | % | | | 2.39 | % | | | 2.40 | % | | | 2.46 | % |
| Ratio of net expenses to average net assets (4) | | | 2.36 | % | | | 2.37 | % | | | 2.39 | % | | | 2.40 | % | | | 2.46 | % |
| Ratio of net investment loss to average net assets (4) (5) | | | (1.09 | )% | | | (1.14 | )% | | | (1.95 | )% | | | (2.08 | )% | | | (1.98 | )% |
| Portfolio Turnover Rate | | | 188 | % | | | 298 | % | | | 107 | % | | | 23 | % | | | 140 | % |
| | | | | | | | | | | | | | | | | | | | | |
| (1) | Per share amounts calculated using the average shares method, which more appropriately presents the per share data for each year. |
| (2) | Total returns shown are historical in nature and assume changes in share price, reinvestment of dividends and distributions, if any, and exclude the effect of applicable sales charges and redemption fees. |
| (3) | Represents the ratio of expenses to average net assets absent fee waivers, expense reimbursements and/or expense recaptures by the adviser. |
| (4) | Does not include the expenses of other investment companies in which the Fund invests, as these expenses are included in the realized and unrealized gain/(loss) on investments. |
| (5) | Recognition of net investment loss by the Fund is affected by the timing of declaration of dividends by the underlying investments in which the Fund invests as well as timing of subscriptions and redemptions within each share class. |
| (6) | Amount represents less than $0.005 per share. |
See accompanying notes to financial statements.
| HCM Dividend Sector Plus Fund |
| FINANCIAL HIGHLIGHTS |
| |
Per Share Data and Ratios for a Share of Beneficial Interest Outstanding Throughout each Year
| | | Year Ended | | | Year Ended | | | Year Ended | | | Year Ended | | | Year Ended | |
| Class A | | June 30, 2024 | | | June 30, 2023 | | | June 30, 2022 | | | June 30, 2021 | | | June 30, 2020 | |
| Net asset value, beginning of year | | $ | 17.90 | | | $ | 17.28 | | | $ | 19.05 | | | $ | 11.94 | | | $ | 10.93 | |
| Activity from investment operations: | | | | | | | | | | | | | | | | | | | | |
| Net investment income (loss) (1) | | | 0.01 | (7) | | | 0.06 | | | | (0.03 | ) | | | (0.03 | ) | | | 0.00 | (6) |
| Net realized and unrealized gain (loss) on investments | | | 3.80 | | | | 1.85 | | | | (1.74 | ) | | | 7.14 | | | | 1.10 | |
| Total from investment operations | | | 3.81 | | | | 1.91 | | | | (1.77 | ) | | | 7.11 | | | | 1.10 | |
| Less distributions from: | | | | | | | | | | | | | | | | | | | | |
| Net investment income | | | (0.03 | ) | | | — | | | | — | | | | — | | | | (0.09 | ) |
| Return of capital | | | — | | | | — | | | | — | | | | — | | | | (0.00 | ) (6) |
| Net realized gains | | | (0.86 | ) | | | (1.29 | ) | | | — | | | | — | | | | (0.00 | ) (6) |
| Total distributions | | | (0.89 | ) | | | (1.29 | ) | | | — | | | | — | | | | (0.09 | ) |
| Paid-in-Capital From Redemption Fees | | | — | | | | — | | | | 0.00 | (6) | | | 0.00 | (6) | | | 0.00 | (6) |
| Net asset value, end of year | | $ | 20.82 | | | $ | 17.90 | | | $ | 17.28 | | | $ | 19.05 | | | $ | 11.94 | |
| Total return (2) | | | 22.18 | % | | | 12.17 | % | | | (9.29 | )% | | | 59.55 | % | | | 10.06 | % |
| Net assets, at end of year (000s) | | $ | 991,374 | | | $ | 949,351 | | | $ | 920,476 | | | $ | 739,011 | | | $ | 324,964 | |
| Ratio of gross expenses to average net assets (3) (5) | | | 1.62 | % | | | 1.61 | % | | | 1.63 | % | | | 1.64 | % | | | 1.69 | % |
| Ratio of net expenses to average net assets (5) | | | 1.62 | % | | | 1.61 | % | | | 1.63 | % | | | 1.64 | % | | | 1.69 | % |
| Ratio of net investment income (loss) to average net assets (4) (5) | | | 0.05 | % | | | 0.38 | % | | | (0.14 | )% | | | (0.18 | )% | | | (0.01 | )% |
| Portfolio Turnover Rate | | | 108 | % | | | 178 | % | | | 49 | % | | | 2 | % | | | 129 | % |
| | | | | | | | | | | | | | | | | | | | | |
| (1) | Per share amounts calculated using the average shares method, which more appropriately presents the per share data for each year. |
| (2) | Total returns shown are historical in nature and assume changes in share price, reinvestment of dividends and distributions, if any, and exclude the effect of applicable sales charges and redemption fees. |
| (3) | Represents the ratio of expenses to average net assets absent fee waivers and/or expense reimbursements by the adviser. |
| (4) | Recognition of net investment income (loss) by the Fund is affected by the timing of declaration of dividends by the underlying investments in which the Fund invests as well as timing of subscriptions and redemptions within each. |
| (5) | Does not include the expenses of other investment companies in which the Fund invests, as these expenses are included in the realized and unrealized gain/(loss) on investments. |
| (6) | Amount represents less than $0.005 per share. |
| (7) | Net investment income (loss) per share are balancing amounts necessary to reconcile the change in net asset value per share for the period, and may not accord with the aggregate income and loss in the Statements of Operations due to timing of shareholder transactions for the period. |
See accompanying notes to financial statements.
| HCM Dividend Sector Plus Fund |
| FINANCIAL HIGHLIGHTS |
| |
Per Share Data and Ratios for a Share of Beneficial Interest Outstanding Throughout each Year
| | | Year Ended | | | Year Ended | | | Year Ended | | | Year Ended | | | Year Ended | |
| Class I | | June 30, 2024 | | | June 30, 2023 | | | June 30, 2022 | | | June 30, 2021 | | | June 30, 2020 | |
| Net asset value, beginning of year | | $ | 18.07 | | | $ | 17.39 | | | $ | 19.12 | | | $ | 11.95 | | | $ | 10.93 | |
| Activity from investment operations: | | | | | | | | | | | | | | | | | | | | |
| Net investment income (loss) (1) | | | 0.06 | (8) | | | 0.11 | | | | (0.01 | ) | | | 0.03 | | | | 0.02 | |
| Net realized and unrealized gain (loss) on investments | | | 3.83 | | | | 1.86 | | | | (1.72 | ) | | | 7.14 | | | | 1.12 | |
| Total from investment operations | | | 3.89 | | | | 1.97 | | | | (1.73 | ) | | | 7.17 | | | | 1.14 | |
| Less distributions from: | | | | | | | | | | | | | | | | | | | | |
| Net investment income | | | (0.07 | ) | | | — | | | | — | | | | — | | | | (0.12 | ) |
| Return of capital | | | — | | | | — | | | | — | | | | — | | | | (0.00 | ) (6) |
| Net realized gains | | | (0.86 | ) | | | (1.29 | ) | | | — | | | | — | | | | (0.00 | ) (6) |
| Total distributions | | | (0.93 | ) | | | (1.29 | ) | | | — | | | | — | | | | (0.12 | ) |
| Paid-in-Capital From Redemption Fees | | | — | | | | — | | | | 0.00 | (6) | | | 0.00 | (6) | | | — | |
| Net asset value, end of year | | $ | 21.03 | | | $ | 18.07 | | | $ | 17.39 | | | $ | 19.12 | | | $ | 11.95 | |
| Total return (2) | | | 22.51 | % | | | 12.45 | % | | | (9.05 | )% | | | 60.00 | % | | | 10.44 | % |
| Net assets, at end of year (000s) | | $ | 100,145 | | | $ | 24,163 | | | $ | 17,170 | | | $ | 33,183 | | | $ | 17 | (7) |
| Ratio of gross expenses to average net assets (3) (5) | | | 1.37 | % | | | 1.36 | % | | | 1.38 | % | | | 1.39 | % | | | 1.44 | % |
| Ratio of net expenses to average net assets (5) | | | 1.37 | % | | | 1.36 | % | | | 1.38 | % | | | 1.39 | % | | | 1.44 | % |
| Ratio of net investment income (loss) to average net assets (4) (5) | | | 0.34 | % | | | 0.63 | % | | | (0.04 | )% | | | 0.18 | % | | | 0.17 | % |
| Portfolio Turnover Rate | | | 108 | % | | | 178 | % | | | 49 | % | | | 2 | % | | | 129 | % |
| | | | | | | | | | | | | | | | | | | | | |
| (1) | Per share amounts calculated using the average shares method, which more appropriately presents the per share data for each year. |
| (2) | Total returns shown are historical in nature and assume changes in share price, reinvestment of dividends and distributions, if any, and exclude the effect of applicable sales charges and redemption fees. |
| (3) | Represents the ratio of expenses to average net assets absent fee waivers and/or expense reimbursements by the adviser. |
| (4) | Recognition of net investment income (loss) by the Fund is affected by the timing of declaration of dividends by the underlying investments in which the Fund invests as well as timing of subscriptions and redemptions within each. |
| (5) | Does not include the expenses of other investment companies in which the Fund invests, as these expenses are included in the realized and unrealized gain/(loss) on investments. |
| (6) | Amount represents less than $0.005 per share. |
| (7) | Actual net assets, not truncated. |
| (8) | Net investment income (loss) per share are balancing amounts necessary to reconcile the change in net asset value per share for the period, and may not accord with the aggregate income and loss in the Statements of Operations due to timing of shareholder transactions for the period. |
See accompanying notes to financial statements.
| HCM Dividend Sector Plus Fund |
| FINANCIAL HIGHLIGHTS |
| |
Per Share Data and Ratios for a Share of Beneficial Interest Outstanding Throughout each Year
| | | Year Ended | | | Year Ended | | | Year Ended | | | Year Ended | | | Year Ended | |
| Class R | | June 30, 2024 | | | June 30, 2023 | | | June 30, 2022 | | | June 30, 2021 | | | June 30, 2020 | |
| Net asset value, beginning of year | | $ | 17.90 | | | $ | 17.28 | | | $ | 19.05 | | | $ | 11.94 | | | $ | 10.93 | |
| Activity from investment operations: | | | | | | | | | | | | | | | | | | | | |
| Net investment income (1) | | | 0.19 | (8) | | | 0.16 | | | | 0.19 | | | | 0.18 | | | | 0.09 | |
| Net realized and unrealized gain (loss) on investments | | | 3.61 | | | | 1.75 | | | | (1.96 | ) | | | 6.93 | | | | 1.04 | |
| Total from investment operations | | | 3.80 | | | | 1.91 | | | | (1.77 | ) | | | 7.11 | | | | 1.13 | |
| Less distributions from: | | | | | | | | | | | | | | | | | | | | |
| Net investment income | | | (0.07 | ) | | | — | | | | — | | | | — | | | | (0.12 | ) |
| Return of capital | | | — | | | | — | | | | — | | | | — | | | | (0.00 | ) (6) |
| Net realized gains | | | (0.86 | ) | | | (1.29 | ) | | | — | | | | — | | | | (0.00 | ) (6) |
| Total distributions | | | (0.93 | ) | | | (1.29 | ) | | | — | | | | — | | | | (0.12 | ) |
| Net asset value, end of year | | $ | 20.77 | | | $ | 17.90 | | | $ | 17.28 | | | $ | 19.05 | | | $ | 11.94 | |
| Total return (2) | | | 22.20 | % | | | 12.17 | % | | | (9.29 | )% | | | 59.55 | % | | | 10.32 | % |
| Net assets, at end of year (7) | | $ | 33 | | | $ | 27 | | | $ | 24 | | | $ | 26 | | | $ | 17 | |
| Ratio of gross expenses to average net assets (3) (5) | | | 1.47 | % | | | 1.46 | % | | | 1.48 | % | | | 1.49 | % | | | 1.54 | % |
| Ratio of net expenses to average net assets (5) | | | 1.47 | % | | | 1.46 | % | | | 1.48 | % | | | 1.49 | % | | | 1.54 | % |
| Ratio of net investment income to average net assets (4) (5) | | | 1.03 | % | | | 0.96 | % | | | 0.80 | % | | | 1.00 | % | | | 0.76 | % |
| Portfolio Turnover Rate | | | 108 | % | | | 178 | % | | | 49 | % | | | 2 | % | | | 129 | % |
| | | | | | | | | | | | | | | | | | | | | |
| (1) | Per share amounts calculated using the average shares method, which more appropriately presents the per share data for each year. |
| (2) | Total returns shown are historical in nature and assume changes in share price, reinvestment of dividends and distributions, if any, and exclude the effect of applicable sales charges and redemption fees. |
| (3) | Represents the ratio of expenses to average net assets absent fee waivers and/or expense reimbursements by the adviser. |
| (4) | Recognition of net investment income by the Fund is affected by the timing of declaration of dividends by the underlying investments in which the Fund invests as well as timing of subscriptions and redemptions within each share class. |
| (5) | Does not include the expenses of other investment companies in which the Fund invests, as these expenses are included in the realized and unrealized gain/(loss) on investments. |
| (6) | Amount represents less than $0.005 per share. |
| (7) | Actual net assets, not truncated. |
| (8) | Net investment income per share are balancing amounts necessary to reconcile the change in net asset value per share for the period, and may not accord with the aggregate income and loss in the Statements of Operations due to timing of shareholder transactions for the period. |
See accompanying notes to financial statements.
| HCM Dividend Sector Plus Fund |
| FINANCIAL HIGHLIGHTS |
| |
Per Share Data and Ratios for a Share of Beneficial Interest Outstanding Throughout each Year
| | | Year Ended | | | Year Ended | | | Year Ended | | | Year Ended | | | Year Ended | |
| Class A1 | | June 30, 2024 | | | June 30, 2023 | | | June 30, 2022 | | | June 30, 2021 | | | June 30, 2020 | |
| Net asset value, beginning of year | | $ | 17.95 | | | $ | 17.35 | | | $ | 19.16 | | | $ | 12.04 | | | $ | 11.02 | |
| Activity from investment operations: | | | | | | | | | | | | | | | | | | | | |
| Net investment income (loss) (1) | | | (0.03 | ) | | | 0.03 | | | | (0.07 | ) | | | (0.09 | ) | | | (0.03 | ) |
| Net realized and unrealized gain (loss) on investments | | | 3.82 | | | | 1.86 | | | | (1.74 | ) | | | 7.21 | | | | 1.12 | |
| Total from investment operations | | | 3.79 | | | | 1.89 | | | | (1.81 | ) | | | 7.12 | | | | 1.09 | |
| Less distributions from: | | | | | | | | | | | | | | | | | | | | |
| Net investment income | | | — | | | | — | | | | — | | | | — | | | | (0.07 | ) |
| Net realized gains | | | (0.86 | ) | | | (1.29 | ) | | | — | | | | — | | | | (0.00 | ) (6) |
| Total distributions | | | (0.86 | ) | | | (1.29 | ) | | | — | | | | — | | | | (0.07 | ) |
| Paid-in-Capital From Redemption Fees | | | — | | | | — | | | | — | | | | 0.00 | (6) | | | — | |
| Net asset value, end of year | | $ | 20.88 | | | $ | 17.95 | | | $ | 17.35 | | | $ | 19.16 | | | $ | 12.04 | |
| Total return (2) | | | 22.01 | % | | | 11.99 | % | | | (9.45 | )% | | | 59.14 | % | | | 9.94 | % |
| Net assets, at end of year (000s) | | $ | 6 | | | $ | 7 | | | $ | 6 | | | $ | 5 | | | $ | 36 | |
| Ratio of gross expenses to average net assets (3) (5) | | | 1.77 | % | | | 1.76 | % | | | 1.78 | % | | | 1.79 | % | | | 1.84 | % |
| Ratio of net expenses to average net assets (5) | | | 1.77 | % | | | 1.76 | % | | | 1.78 | % | | | 1.79 | % | | | 1.84 | % |
| Ratio of net investment income (loss) to average net assets (4) (5) | | | (0.15 | )% | | | 0.20 | % | | | (0.33 | )% | | | (0.60 | )% | | | (0.21 | )% |
| Portfolio Turnover Rate | | | 108 | % | | | 178 | % | | | 49 | % | | | 2 | % | | | 129 | % |
| | | | | | | | | | | | | | | | | | | | | |
| (1) | Per share amounts calculated using the average shares method, which more appropriately presents the per share data for each year. |
| (2) | Total returns shown are historical in nature and assume changes in share price, reinvestment of dividends and distributions, if any, and exclude the effect of applicable sales charges and redemption fees. |
| (3) | Represents the ratio of expenses to average net assets absent fee waivers and/or expense reimbursements by the adviser. |
| (4) | Recognition of net investment income (loss) by the Fund is affected by the timing of declaration of dividends by the underlying investments in which the Fund invests as well as timing of subscriptions and redemptions within each. |
| (5) | Does not include the expenses of other investment companies in which the Fund invests, as these expenses are included in the realized and unrealized gain/(loss) on investments. |
| (6) | Amount represents less than $0.005 per share. |
See accompanying notes to financial statements.
| HCM Dividend Sector Plus Fund |
| FINANCIAL HIGHLIGHTS |
| |
Per Share Data and Ratios for a Share of Beneficial Interest Outstanding Throughout each Year
| | | Year Ended | | | Year Ended | | | Year Ended | | | Year Ended | | | Year Ended | |
| Investor Class | | June 30, 2024 | | | June 30, 2023 | | | June 30, 2022 | | | June 30, 2021 | | | June 30, 2020 | |
| Net asset value, beginning of year | | $ | 17.14 | | | $ | 16.72 | | | $ | 18.58 | | | $ | 11.73 | | | $ | 10.76 | |
| Activity from investment operations: | | | | | | | | | | | | | | | | | | | | |
| Net investment income (loss) (1) | | | (0.11 | ) | | | (0.06 | ) | | | (0.17 | ) | | | (0.14 | ) | | | (0.08 | ) |
| Net realized and unrealized gain (loss) on investments | | | 3.60 | | | | 1.77 | | | | (1.69 | ) | | | 6.99 | | | | 1.07 | |
| Total from investment operations | | | 3.49 | | | | 1.71 | | | | (1.86 | ) | | | 6.85 | | | | 0.99 | |
| Less distributions from: | | | | | | | | | | | | | | | | | | | | |
| Net investment income | | | — | | | | — | | | | — | | | | — | | | | (0.02 | ) |
| Net realized gains | | | (0.86 | ) | | | (1.29 | ) | | | — | | | | — | | | | (0.00 | ) (6) |
| Total distributions | | | (0.86 | ) | | | (1.29 | ) | | | — | | | | — | | | | (0.02 | ) |
| Paid-in-Capital From Redemption Fees | | | — | | | | — | | | | 0.00 | (6) | | | 0.00 | (6) | | | 0.00 | (6) |
| Net asset value, end of year | | $ | 19.77 | | | $ | 17.14 | | | $ | 16.72 | | | $ | 18.58 | | | $ | 11.73 | |
| Total return (2) | | | 21.28 | % | | | 11.34 | % | | | (10.01 | )% | | | 58.40 | % | | | 9.18 | % |
| Net assets, at end of year (000s) | | $ | 521,965 | | | $ | 369,389 | | | $ | 269,388 | | | $ | 205,855 | | | $ | 75,510 | |
| Ratio of gross expenses to average net assets (3) (5) | | | 2.37 | % | | | 2.36 | % | | | 2.38 | % | | | 2.39 | % | | | 2.44 | % |
| Ratio of net expenses to average net assets (5) | | | 2.37 | % | | | 2.36 | % | | | 2.38 | % | | | 2.39 | % | | | 2.44 | % |
| Ratio of net investment income (loss) to average net assets (4) (5) | | | (0.68 | )% | | | (0.41 | )% | | | (0.89 | )% | | | (0.90 | )% | | | (0.69 | )% |
| Portfolio Turnover Rate | | | 108 | % | | | 178 | % | | | 49 | % | | | 2 | % | | | 129 | % |
| | | | | | | | | | | | | | | | | | | | | |
| (1) | Per share amounts calculated using the average shares method, which more appropriately presents the per share data for each year. |
| (2) | Total returns shown are historical in nature and assume changes in share price, reinvestment of dividends and distributions, if any, and exclude the effect of applicable sales charges and redemption fees. |
| (3) | Represents the ratio of expenses to average net assets absent fee waivers and/or expense reimbursements by the adviser. |
| (4) | Recognition of net investment income (loss) by the Fund is affected by the timing of declaration of dividends by the underlying investments in which the Fund invests as well as timing of subscriptions and redemptions within each. |
| (5) | Does not include the expenses of other investment companies in which the Fund invests, as these expenses are included in the realized and unrealized gain/(loss) on investments. |
| (6) | Amount represents less than $0.005 per share. |
See accompanying notes to financial statements.
| HCM Income Plus Fund |
| FINANCIAL HIGHLIGHTS |
| |
Per Share Data and Ratios for a Share of Beneficial Interest Outstanding Throughout each Year
| | | Year Ended | | | Year Ended | | | Year Ended | | | Year Ended | | | Year Ended | |
| Class A | | June 30, 2024 | | | June 30, 2023 | | | June 30, 2022 | | | June 30, 2021 | | | June 30, 2020 | |
| Net asset value, beginning of year | | $ | 14.52 | | | $ | 13.22 | | | $ | 16.25 | | | $ | 12.30 | | | $ | 10.25 | |
| Activity from investment operations: | | | | | | | | | | | | | | | | | | | | |
| Net investment income (loss) (1) | | | 0.11 | | | | 0.06 | | | | (0.01 | ) | | | 0.02 | | | | 0.05 | |
| Net realized and unrealized gain (loss) on investments | | | 3.10 | | | | 1.24 | | | | (2.95 | ) | | | 4.01 | | | | 2.09 | |
| Total from investment operations | | | 3.21 | | | | 1.30 | | | | (2.96 | ) | | | 4.03 | | | | 2.14 | |
| Less distributions from: | | | | | | | | | | | | | | | | | | | | |
| Net investment income | | | (0.10 | ) | | | — | | | | (0.04 | ) | | | (0.04 | ) | | | (0.09 | ) |
| Return of capital | | | — | | | | — | | | | (0.00 | ) (6) | | | — | | | | — | |
| Net realized gains | | | — | | | | — | | | | (0.03 | ) | | | (0.04 | ) | | | — | |
| Total distributions | | | (0.10 | ) | | | — | | | | (0.07 | ) | | | (0.08 | ) | | | (0.09 | ) |
| Paid-in-Capital From Redemption Fees | | | — | | | | — | | | | 0.00 | (6) | | | 0.00 | (6) | | | 0.00 | (6) |
| Net asset value, end of year | | $ | 17.63 | | | $ | 14.52 | | | $ | 13.22 | | | $ | 16.25 | | | $ | 12.30 | |
| Total return (2) | | | 22.19 | % | | | 9.83 | % | | | (18.28 | )% | | | 32.85 | % | | | 20.95 | % |
| Net assets, at end of year (000s) | | $ | 468,644 | | | $ | 468,047 | | | $ | 565,518 | | | $ | 416,354 | | | $ | 164,911 | |
| Ratio of gross expenses to average net assets (3) (4) | | | 1.34 | % | | | 1.35 | % | | | 1.35 | % | | | 1.38 | % | | | 1.48 | % |
| Ratio of net expenses to average net assets (4) | | | 1.34 | % | | | 1.35 | % | | | 1.35 | % | | | 1.38 | % | | | 1.48 | % |
| Ratio of net investment income (loss) to average net assets (4) (5) | | | 0.69 | % | | | 0.43 | % | | | (0.05 | )% | | | 0.19 | % | | | 0.38 | % |
| Portfolio Turnover Rate | | | 106 | % | | | 232 | % | | | 128 | % | | | 5 | % | | | 196 | % |
| | | | | | | | | | | | | | | | | | | | | |
| (1) | Per share amounts calculated using the average shares method, which more appropriately presents the per share data for each year. |
| (2) | Total returns shown are historical in nature and assume changes in share price, reinvestment of dividends and distributions, if any, and exclude the effect of applicable sales charges and redemption fees. |
| (3) | Represents the ratio of expenses to average net assets absent fee waivers and/or expense reimbursements by the adviser. |
| (4) | Does not include the expenses of other investment companies in which the Fund invests, as these expenses are included in the realized and unrealized gain on investments. |
| (5) | Recognition of net investment income (loss) by the Fund is affected by the timing of declaration of dividends by the underlying investments in which the Fund invests as well as timing of subscriptions and redemptions within each. |
| (6) | Amount represents less than $0.005 per share. |
See accompanying notes to financial statements.
| HCM Income Plus Fund |
| FINANCIAL HIGHLIGHTS |
| |
Per Share Data and Ratios for a Share of Beneficial Interest Outstanding Throughout each Period
| | | Year Ended | | | Year Ended | | | Year Ended | | | Year Ended | | | Period Ended | |
| Class I | | June 30, 2024 | | | June 30, 2023 | | | June 30, 2022 | | | June 30, 2021 | | | June 30, 2020 (1) | |
| Net asset value, beginning of period | | $ | 14.57 | | | $ | 13.23 | | | $ | 16.26 | | | $ | 12.30 | | | $ | 10.32 | |
| Activity from investment operations: | | | | | | | | | | | | | | | | | | | | |
| Net investment income (loss) (2) | | | 0.14 | | | | 0.10 | | | | 0.05 | | | | (0.01 | ) | | | 0.03 | |
| Net realized and unrealized gain (loss) on investments | | | 2.99 | | | | 1.24 | | | | (2.98 | ) | | | 4.08 | | | | 2.04 | |
| Total from investment operations | | | 3.13 | | | | 1.34 | | | | (2.93 | ) | | | 4.07 | | | | 2.07 | |
| Less distributions from: | | | | | | | | | | | | | | | | | | | | |
| Net investment income | | | (0.01 | ) | | | — | | | | (0.07 | ) | | | (0.07 | ) | | | (0.09 | ) |
| Return of capital | | | — | | | | — | | | | (0.00 | ) (7) | | | — | | | | — | |
| Net realized gains | | | — | | | | — | | | | (0.03 | ) | | | (0.04 | ) | | | — | |
| Total distributions | | | (0.01 | ) | | | — | | | | (0.10 | ) | | | (0.11 | ) | | | (0.09 | ) |
| Paid-in-Capital From Redemption Fees | | | — | | | | — | | | | 0.00 | (7) | | | 0.00 | (7) | | | — | |
| Net asset value, end of period | | $ | 17.69 | | | $ | 14.57 | | | $ | 13.23 | | | $ | 16.26 | | | $ | 12.30 | |
| Total return (3) | | | 22.49 | % | | | 10.13 | % | | | (18.12 | )% | | | 33.15 | % | | | 20.13 | % (9) |
| Net assets, at end of period (000s) | | $ | 86,325 | | | $ | 9,838 | | | $ | 4,376 | | | $ | 6,600 | | | $ | 97 | |
| Ratio of gross expenses to average net assets (4) (5) | | | 1.09 | % | | | 1.10 | % | | | 1.10 | % | | | 1.13 | % | | | 1.23 | % (8) |
| Ratio of net expenses to average net assets (5) | | | 1.09 | % | | | 1.10 | % | | | 1.10 | % | | | 1.13 | % | | | 1.23 | % (8) |
| Ratio of net investment income (loss) to average net assets (5) (6) | | | 0.92 | % | | | 0.79 | % | | | 0.31 | % | | | (0.08 | )% | | | 0.28 | % (8) |
| Portfolio Turnover Rate | | | 106 | % | | | 232 | % | | | 128 | % | | | 5 | % | | | 196 | % (9) |
| | | | | | | | | | | | | | | | | | | | | |
| (1) | The HCM Income Plus Fund’s Class I shares commenced operations on September 11, 2019. |
| (2) | Per share amounts calculated using the average shares method, which more appropriately presents the per share data for each period. |
| (3) | Total returns shown are historical in nature and assume changes in share price, reinvestment of dividends and distributions, if any, and exclude the effect of applicable sales charges and redemption fees. |
| (4) | Represents the ratio of expenses to average net assets absent fee waivers and/or expense reimbursements by the adviser. |
| (5) | Does not include the expenses of other investment companies in which the Fund invests, as these expenses are included in the realized and unrealized gain on investments. |
| (6) | Recognition of net investment income (loss) by the Fund is affected by the timing of declaration of dividends by the underlying investments in which the Fund invests as well as timing of subscriptions and redemptions within each. |
| (7) | Amount represents less than $0.005 per share. |
| (8) | Annualized for periods less than one year. |
See accompanying notes to financial statements.
| HCM Income Plus Fund |
| FINANCIAL HIGHLIGHTS |
| |
Per Share Data and Ratios for a Share of Beneficial Interest Outstanding Throughout each Year
| | | Year Ended | | | Year Ended | | | Year Ended | | | Year Ended | | | Year Ended | |
| Investor Class | | June 30, 204 | | | June 30, 2023 | | | June 30, 2022 | | | June 30, 2021 | | | June 30, 2020 | |
| Net asset value, beginning of year | | $ | 14.12 | | | $ | 12.95 | | | $ | 16.00 | | | $ | 12.16 | | | $ | 10.14 | |
| Activity from investment operations: | | | | | | | | | | | | | | | | | | | | |
| Net investment income (loss) (1) | | | (0.01 | ) (7) | | | (0.03 | ) (7) | | | (0.11 | ) | | | (0.08 | ) | | | (0.04 | ) |
| Net realized and unrealized gain (loss) on investments | | | 3.14 | | | | 1.20 | | | | (2.91 | ) | | | 3.96 | | | | 2.08 | |
| Total from investment operations | | | 3.13 | | | | 1.17 | | | | (3.02 | ) | | | 3.88 | | | | 2.04 | |
| Less distributions from: | | | | | | | | | | | | | | | | | | | | |
| Net investment income | | | (0.14 | ) | | | — | | | | — | | | | — | | | | (0.02 | ) |
| Net realized gains | | | — | | | | — | | | | (0.03 | ) | | | (0.04 | ) | | | — | |
| Total distributions | | | (0.14 | ) | | | — | | | | (0.03 | ) | | | (0.04 | ) | | | (0.02 | ) |
| Paid-in-Capital From Redemption Fees | | | — | | | | — | | | | 0.00 | (6) | | | 0.00 | (6) | | | 0.00 | (6) |
| Net asset value, end of year | | $ | 17.11 | | | $ | 14.12 | | | $ | 12.95 | | | $ | 16.00 | | | $ | 12.16 | |
| Total return (2) | | | 21.22 | % | | | 9.03 | % | | | (18.90 | )% | | | 31.93 | % | | | 20.12 | % |
| Net assets, at end of year (000s) | | $ | 182,813 | | | $ | 143,501 | | | $ | 119,876 | | | $ | 97,342 | | | $ | 39,553 | |
| Ratio of gross expenses to average net assets (3) (4) | | | 2.09 | % | | | 2.10 | % | | | 2.10 | % | | | 2.13 | % | | | 2.23 | % |
| Ratio of net expenses to average net assets (4) | | | 2.09 | % | | | 2.10 | % | | | 2.10 | % | | | 2.13 | % | | | 2.23 | % |
| Ratio of net investment income (loss) to average net assets (4) (5) | | | (0.06 | )% | | | (0.29 | )% | | | (0.75 | )% | | | (0.55 | )% | | | (0.41 | )% |
| Portfolio Turnover Rate | | | 106 | % | | | 232 | % | | | 128 | % | | | 5 | % | | | 196 | % |
| | | | | | | | | | | | | | | | | | | | | |
| (1) | Per share amounts calculated using the average shares method, which more appropriately presents the per share data for each year. |
| (2) | Total returns shown are historical in nature and assume changes in share price, reinvestment of dividends and distributions, if any, and exclude the effect of applicable sales charges and redemption fees. |
| (3) | Represents the ratio of expenses to average net assets absent fee waivers and/or expense reimbursements by the adviser. |
| (4) | Does not include the expenses of other investment companies in which the Fund invests, as these expenses are included in the realized and unrealized gain on investments. |
| (5) | Recognition of net investment income (loss) by the Fund is affected by the timing of declaration of dividends by the underlying investments in which the Fund invests as well as timing of subscriptions and redemptions within each. |
| (6) | Amount represents less than $0.005 per share. |
| (7) | Net investment income (loss) per share are balancing amounts necessary to reconcile the change in net asset value per share for the period, and may not accord with the aggregate income and loss in the Statements of Operations due to timing of shareholder transactions for the period. |
See accompanying notes to financial statements.
| HCM Dynamic Income Fund |
| FINANCIAL HIGHLIGHTS |
| |
Per Share Data and Ratios for a Share of Beneficial Interest Outstanding Throughout each Year
| | | Year Ended | | | Year Ended | |
| Class A | | June 30, 2024 | | | June 30, 2023 (1) | |
| Net asset value, beginning of year | | $ | 9.74 | | | $ | 10.00 | |
| Activity from investment operations: | | | | | | | | |
| Net investment income (2) | | | 0.24 | | | | 0.15 | |
| Net realized and unrealized gain (loss) on investments | | | 0.06 | | | | (0.37 | ) |
| Total from investment operations | | | 0.30 | | | | (0.22 | ) |
| Less distributions from: | | | | | | | | |
| Net investment income | | | (0.26 | ) | | | (0.04 | ) |
| Total distributions | | | (0.26 | ) | | | (0.04 | ) |
| Net asset value, end of year | | $ | 9.78 | | | $ | 9.74 | |
| Total return (3) | | | 2.97 | % | | | (2.16 | )% |
| Net assets, at end of year (000s) | | $ | 109,322 | | | $ | 129,341 | |
| Ratio of gross expenses to average net assets (4) (5) | | | 1.88 | % | | | 1.92 | % |
| Ratio of net expenses to average net assets (5) | | | 1.88 | % | | | 1.92 | % |
| Ratio of net investment income to average net assets (5) (6) | | | 2.42 | % | | | 1.57 | % |
| Portfolio Turnover Rate | | | 179 | % | | | 298 | % |
| | | | | | | | | |
| (1) | The HCM Dynamic Income Fund’s Class A shares commenced operations on June 30, 2022. |
| (2) | Per share amounts calculated using the average shares method, which more appropriately presents the per share data for each year. |
| (3) | Total returns shown are historical in nature and assume changes in share price, reinvestment of dividends and distributions, if any, and exclude the effect of applicable sales charges and redemption fees. |
| (4) | Represents the ratio of expenses to average net assets absent fee waivers and/or expense reimbursements by the adviser. |
| (5) | Does not include the expenses of other investment companies in which the Fund invests, as these expenses are included in the realized and unrealized gain on investments. |
| (6) | Recognition of net investment income by the Fund is affected by the timing of declaration of dividends by the underlying investments in which the Fund invests as well as timing of subscriptions and redemptions within each share class. |
See accompanying notes to financial statements.
| HCM Dynamic Income Fund |
| FINANCIAL HIGHLIGHTS |
| |
Per Share Data and Ratios for a Share of Beneficial Interest Outstanding Throughout each Year
| | | Year Ended | | | Year Ended | |
| Class I | | June 30, 2024 | | | June 30, 2023 (1) | |
| Net asset value, beginning of year | | $ | 9.74 | | | $ | 10.00 | |
| Activity from investment operations: | | | | | | | | |
| Net investment income (2) | | | 0.24 | | | | 0.03 | |
| Net realized and unrealized gain (loss) on investments | | | 0.07 | | | | (0.24 | ) |
| Total from investment operations | | | 0.31 | | | | (0.21 | ) |
| Less distributions from: | | | | | | | | |
| Net investment income | | | (0.28 | ) | | | (0.05 | ) |
| Total distributions | | | (0.28 | ) | | | (0.05 | ) |
| Net asset value, end of year | | $ | 9.77 | | | $ | 9.74 | |
| Total return (3) | | | 3.14 | % | | | (2.06 | )% |
| Net assets, at end of year (000s) | | $ | 13,879 | | | $ | 4 | |
| Ratio of gross expenses to average net assets (4) (5) | | | 1.62 | % | | | 1.66 | % |
| Ratio of net expenses to average net assets (5) | | | 1.62 | % | | | 1.66 | % |
| Ratio of net investment income to average net assets (5) (6) | | | 2.45 | % | | | 0.31 | % |
| Portfolio Turnover Rate | | | 179 | % | | | 298 | % |
| | | | | | | | | |
| (1) | The HCM Dynamic Income Fund’s Class I shares commenced operations on June 30, 2022. |
| (2) | Per share amounts calculated using the average shares method, which more appropriately presents the per share data for each year. |
| (3) | Total returns shown are historical in nature and assume changes in share price, reinvestment of dividends and distributions, if any, and exclude the effect of applicable sales charges and redemption fees. |
| (4) | Represents the ratio of expenses to average net assets absent fee waivers and/or expense reimbursements by the adviser. |
| (5) | Does not include the expenses of other investment companies in which the Fund invests, as these expenses are included in the realized and unrealized gain on investments. |
| (6) | Recognition of net investment income by the Fund is affected by the timing of declaration of dividends by the underlying investments in which the Fund invests as well as timing of subscriptions and redemptions within each share class. |
See accompanying notes to financial statements.
| HCM Dynamic Income Fund |
| FINANCIAL HIGHLIGHTS |
| |
Per Share Data and Ratios for a Share of Beneficial Interest Outstanding Throughout each Year
| | | Year Ended | | | Year Ended | |
| Investor Class | | June 30, 2024 | | | June 30, 2023 (1) | |
| Net asset value, beginning of year | | $ | 9.74 | | | $ | 10.00 | |
| Activity from investment operations: | | | | | | | | |
| Net investment income (loss) (2) | | | 0.08 | | | | (0.23 | ) (8) |
| Net realized and unrealized gain on investments | | | 0.18 | | | | 0.02 | |
| Total from investment operations | | | 0.26 | | | | (0.21 | ) |
| Less distributions from: | | | | | | | | |
| Net investment income | | | (0.28 | ) | | | (0.05 | ) |
| Total distributions | | | (0.28 | ) | | | (0.05 | ) |
| Net asset value, end of year | | $ | 9.72 | | | $ | 9.74 | |
| Total return (3) | | | 2.61 | % | | | (2.06 | )% |
| Net assets, at end of year (000s) | | $ | 15 | | | $ | 10 | (7) |
| Ratio of gross expenses to average net assets (4) (5) | | | 2.62 | % | | | 2.67 | % |
| Ratio of net expenses to average net assets (5) | | | 2.62 | % | | | 2.67 | % |
| Ratio of net investment loss to average net assets (5) (6) | | | 0.84 | % | | | (2.32 | )% |
| Portfolio Turnover Rate | | | 179 | % | | | 298 | % |
| | | | | | | | | |
| (1) | The HCM Dynamic Income Fund’s Investor Class shares commenced operations on June 30, 2022. |
| (2) | Per share amounts calculated using the average shares method, which more appropriately presents the per share data for each year. |
| (3) | Total returns shown are historical in nature and assume changes in share price, reinvestment of dividends and distributions, if any, and exclude the effect of applicable sales charges and redemption fees. |
| (4) | Represents the ratio of expenses to average net assets absent fee waivers and/or expense reimbursements by the adviser. |
| (5) | Does not include the expenses of other investment companies in which the Fund invests, as these expenses are included in the realized and unrealized gain on investments. |
| (6) | Recognition of net investment loss by the Fund is affected by the timing of declaration of dividends by the underlying investments in which the Fund invests as well as timing of subscriptions and redemptions within each share class. |
| (7) | Actual net assets, not truncated. |
| (8) | Net investment income (loss) per share are balancing amounts necessary to reconcile the change in net asset value per share for the period, and may not accord with the aggregate income and loss in the Statements of Operations due to timing of shareholder transactions for the period. |
See accompanying notes to financial statements.
| The HCM Funds |
| NOTES TO FINANCIAL STATEMENTS |
| June 30, 2024 |
| |
The HCM Tactical Growth Fund (“HTGF”), HCM Dividend Sector Plus Fund (“HDSPF”), HCM Income Plus Fund (“HIPF”) and HCM Dynamic Income Fund (“HDIF”) (each a “Fund” and collectively the “Funds”) are each a diversified series of shares of beneficial interest of Northern Lights Fund Trust III (the “Trust”), a Delaware statutory trust organized on December 5, 2011 under the laws of the state of Delaware. The Trust is registered under the Investment Company Act of 1940, as amended, (the “1940 Act”), as an open-end management investment company. HTGF’s and HDSPF’s investment objective is to seek long-term capital appreciation. HIPF’s and HDIF’s investment objective is to seek total return. Each Fund is “fund of funds”, in that they will generally invest in other investment companies. HTGF commenced operations on July 30, 2014. HDSPF commenced operations on March 11, 2015. HIPF commenced operations on November 9, 2016. HDIF commenced operations on June 30, 2022.
The Funds offer Class A, Class I and Investor Class shares. HTGF and HDSPF also offer Class R shares. HDSPF also offers Class A1 shares. Class R shares in HTGF and HDSPF are not currently available for sale. Class I, Class R and Investor Class shares are offered at net asset value. Class A and Class A1 shares are offered at net asset value plus a maximum sales charge of 5.75%. HTGF’s Investor Class shares were formerly known as Class C shares. Each class represents an interest in the same assets of each Fund and classes are identical except for differences in their sales charge structures and ongoing service and distribution charges. All classes of shares have equal voting privileges except that each class has exclusive voting rights with respect to its service and/or distribution plans. Each Fund’s income, expenses (other than class specific distribution fees) and realized and unrealized gains and losses are allocated proportionately each day based upon the relative net assets of each class.
| 2. | SIGNIFICANT ACCOUNTING POLICIES |
The following is a summary of significant accounting policies followed by the Funds in preparation of the financial statements. These policies are in conformity with accounting principles generally accepted in the United States of America (“GAAP”). The preparation of financial statements requires management to make estimates and assumptions that affect the reported amounts of assets and liabilities and disclosure of contingent assets and liabilities at the date of the financial statements and the reported amounts of income and expenses for the year. Actual results could differ from those estimates. The Funds are each an investment company and accordingly follow the investment company accounting and reporting guidance of the Financial Accounting Standards Board (“FASB”) Accounting Standards Codification Topic 946 “Financial Services – Investment Companies” including FASB Accounting Standards Update (“ASU”) 2013-08.
Securities Valuation – Securities listed on an exchange are valued at the last reported sale price at the close of the regular trading session of the primary exchange on the business day the value is being determined, or in the case of securities listed on the NASDAQ, at the NASDAQ Official Closing Price (“NOCP”). In the absence of a sale, such securities shall be valued at the mean between the current bid and ask prices on the day of valuation. Investments in open-end investment non-exchange traded
| The HCM Funds |
| NOTES TO FINANCIAL STATEMENTS (Continued) |
| June 30, 2024 |
| |
companies are valued at net asset value. Short-term debt obligations having 60 days or less remaining until maturity, at time of purchase, may be valued at amortized cost, which approximates fair value.
Valuation of Fund of Funds – The Funds may invest in portfolios of open-end or closed-end investment companies (the “Underlying Funds”). Underlying open-end non-exchange traded investment companies are valued at their respective net asset values as reported by such investment companies. The Underlying Funds value securities in their portfolios for which market quotations are readily available at their market values (generally the last reported sale price) and all other securities and assets at their fair value by the methods established by the boards of the Underlying Funds. The shares of many closed-end investment companies, after their initial public offering, frequently trade at a price per share, which is different than the net asset value per share. The difference represents a market premium or market discount of such shares. There can be no assurances that the market discount or market premium on shares of any closed-end investment company purchased by the Funds will not change.
The Funds may hold investments, such as private investments, interests in commodity pools, other non-traded securities or temporarily illiquid securities, for which market quotations are not readily available or are determined to be unreliable. These securities will be valued using the “fair value” procedures approved by the Board. The Board has delegated execution of these procedures to the Adviser as its valuation designee (the “Valuation Designee”). The Board may also enlist third party consultants such a valuation specialist at a public accounting firm, valuation consultant or financial officer of a security issuer on an as-needed basis to assist the Valuation Designee in determining a security-specific fair value. The Board is responsible for reviewing and approving fair value methodologies utilized by the Valuation Designee, which approval shall be based upon whether the Valuation Designee followed the valuation procedures established by the Board.
Fair Valuation Process – Applicable investments are valued by the Valuation Designee pursuant to valuation procedures established by the Board. For example, fair value determinations are required for the following securities: (i) securities for which market quotations are insufficient or not readily available on a particular business day (including securities for which there is a short and temporary lapse in the provision of a price by the regular pricing source); (ii) securities for which, in the judgment of the Valuation Designee, the prices or values available do not represent the fair value of the instrument; factors which may cause the Valuation Designee to make such a judgment include, but are not limited to, the following: only a bid price or an asked price is available; the spread between bid and asked prices is substantial; the frequency of sales; the thinness of the market; the size of reported trades; and actions of the securities markets, such as the suspension or limitation of trading; (iii) securities determined to be illiquid; and (iv) securities with respect to which an event that will affect the value thereof has occurred (a “significant event”) since the closing prices were established on the principal exchange on which they are traded, but prior to a Fund’s calculation of its net asset value. Specifically, interests in commodity pools or managed futures pools are valued on a daily basis by reference to the closing market prices of each futures contract or other asset held by a pool, as adjusted for pool expenses. Restricted or illiquid investments, such as private investments or non-traded securities are valued based upon the current bid for the security from two or more independent dealers or other parties reasonably familiar with the facts and circumstances of the
| The HCM Funds |
| NOTES TO FINANCIAL STATEMENTS (Continued) |
| June 30, 2024 |
| |
security (who should take into consideration all relevant factors as may be appropriate under the circumstances). If a current bid from such independent dealers or other independent parties is unavailable, the Valuation Designee shall determine, the fair value of such security using the following factors: (i) the type of security; (ii) the cost at date of purchase; (iii) the size and nature of the Fund’s holdings; (iv) the discount from market value of unrestricted securities of the same class at the time of purchase and subsequent thereto; (v) information as to any transactions or offers with respect to the security; (vi) the nature and duration of restrictions on disposition of the security and the existence of any registration rights; (vii) how the yield of the security compares to similar securities of companies of similar or equal creditworthiness; (viii) the level of recent trades of similar or comparable securities; (ix) the liquidity characteristics of the security; (x) current market conditions; and (xi) the market value of any securities into which the security is convertible or exchangeable.
Options Transactions – Each Fund is subject to equity price risk in the normal course of pursuing its investment objective and may purchase or sell options to help hedge against this risk. Each Fund may write call options only if it (i) owns an offsetting position in the underlying security or (ii) has an absolute or immediate right to acquire that security without additional cash consideration or exchange of other securities held in its portfolio. When a Fund writes a call option, an amount equal to the premium received is included in the statement of assets and liabilities as a liability. The amount of the liability is subsequently marked-to-market to reflect the current market value of the option. If an option expires on its stipulated expiration date or if a Fund enters into a closing purchase transaction, a gain or loss is realized. If a written call option is exercised, a gain or loss is realized for the sale of the underlying security and the proceeds from the sale are increased by the premium originally received. As writer of an option, a Fund has no control over whether the option will be exercised and, as a result, retains the market risk of an unfavorable change in the price of the security underlying the written option. When a Fund purchases an option, an amount equal to the premium paid by the Fund is recorded as an investment and is subsequently adjusted to the current value of the option purchased. If an option expires on the stipulated expiration date or if a Fund enters into a closing sale transaction, a gain or loss is realized. If a call option is exercised, the cost of the security acquired is increased by the premium paid for the call. If a put option is exercised, a gain or loss is realized from the sale of the underlying security, and the proceeds from such a sale are decreased by the premium originally paid. Written and purchased options are non-income producing securities. With purchased options, there is minimal counterparty credit risk to the fund since these options are exchange traded and the exchange’s clearinghouse, as counterparty to all exchange traded options, guarantees against a possible default.
The Funds utilize various methods to measure the fair value of all their investments on a recurring basis. GAAP establishes a hierarchy that prioritizes inputs to valuation methods. The three levels of input are:
Level 1 – Unadjusted quoted prices in active markets for identical assets and liabilities that the Funds have the ability to access.
Level 2 – Observable inputs other than quoted prices included in Level 1 that are observable for the asset or liability, either directly or indirectly. These inputs may include quoted prices for the identical
| The HCM Funds |
| NOTES TO FINANCIAL STATEMENTS (Continued) |
| June 30, 2024 |
| |
instrument in an inactive market, prices for similar instruments, interest rates, prepayment speeds, credit risk, yield curves, default rates and similar data.
Level 3 – Unobservable inputs for the asset or liability, to the extent relevant observable inputs are not available, representing the Funds’ own assumptions about the assumptions a market participant would use in valuing the asset or liability, and would be based on the best information available.
The availability of observable inputs can vary from security to security and is affected by a wide variety of factors, including, for example, the type of security, whether the security is new and not yet established in the marketplace, the liquidity of markets, and other characteristics particular to the security. To the extent that valuation is based on models or inputs that are less observable or unobservable in the market, the determination of fair value requires more judgment. Accordingly, the degree of judgment exercised in determining fair value is greatest for instruments categorized in Level 3.
The inputs used to measure fair value may fall into different levels of the fair value hierarchy. In such cases, for disclosure purposes, the level in the fair value hierarchy within which the fair value measurement falls in its entirety, is determined based on the lowest level input that is significant to the fair value measurement in its entirety.
The inputs or methodology used for valuing securities are not necessarily an indication of the risk associated with investing in those securities. The following tables summarize the inputs used as of June 30, 2024 for each Fund’s assets measured at fair value:
| HCM Tactical Growth Fund |
| Assets* | | Level 1 | | | Level 2 | | | Level 3 | | | Total | |
| Common Stocks | | $ | 41,883,894 | | | $ | — | | | $ | — | | | $ | 41,883,894 | |
| Exchange Traded Funds | | | 1,465,997,314 | | | | — | | | | — | | | | 1,465,997,314 | |
| Total | | $ | 1,507,881,208 | | | $ | — | | | $ | — | | | $ | 1,507,881,208 | |
| | | | | | | | | | | | | | | | | |
| HCM Dividend Sector Plus Fund |
| Assets* | | Level 1 | | | Level 2 | | | Level 3 | | | Total | |
| Common Stocks | | $ | 171,100,836 | | | $ | — | | | $ | — | | | $ | 171,100,836 | |
| Exchange Traded Funds | | | 1,434,271,725 | | | | — | | | | — | | | | 1,434,271,725 | |
| Total | | $ | 1,605,372,561 | | | $ | — | | | $ | — | | | $ | 1,605,372,561 | |
| | | | | | | | | | | | | | | | | |
| HCM Income Plus Fund |
| Assets* | | Level 1 | | | Level 2 | | | Level 3 | | | Total | |
| Exchange Traded Funds | | $ | 734,755,728 | | | $ | — | | | $ | — | | | $ | 734,755,728 | |
| Total | | $ | 734,755,728 | | | $ | — | | | $ | — | | | $ | 734,755,728 | |
| The HCM Funds |
| NOTES TO FINANCIAL STATEMENTS (Continued) |
| June 30, 2024 |
| |
| HCM Dynamic Income Fund |
| Assets* | | Level 1 | | | Level 2 | | | Level 3 | | | Total | |
| Exchange Traded Funds | | $ | 104,717,849 | | | $ | — | | | $ | — | | | $ | 104,717,849 | |
| Total | | $ | 104,717,849 | | | $ | — | | | $ | — | | | $ | 104,717,849 | |
The Funds did not hold any Level 2 or 3 securities during the year.
| * | See Schedule of Investments for industry classification. |
Security Transactions and Related Income – Investment security transactions are accounted for on a trade date basis. Cost is determined and realized gains and losses are based upon the specific identification method for both financial statement and federal income tax purposes. Dividend income is recorded on the ex-dividend date and interest income is recorded on an accrual basis. Purchase discounts and premiums on securities are accreted and amortized over the life of the respective securities.
Dividends and Distributions to Shareholders – Dividends from net investment income, if any, are declared and paid quarterly. Distributable net realized capital gains, if any, are declared and distributed annually. Dividends from net investment income and distributions from net realized gains are determined in accordance with federal income tax regulations, which may differ from GAAP. These “book/tax” differences are considered either temporary (e.g., deferred losses) or permanent in nature. To the extent these differences are permanent in nature, such amounts are reclassified within the composition of net assets based on their federal tax-basis treatment; temporary differences do not require reclassification. Any such reclassifications will have no effect on net assets, results from operations, or net asset value per share of the Funds. Dividends and distributions to shareholders are recorded on the ex-dividend date.
Credit Facility – HDSPF has entered into a revolving line of credit agreement with BNP Paribas for investment purposes subject to the limitations of the 1940 Act for borrowings. The maximum amount of borrowing allowed under the agreement is up to 33 1/3% of HDSPF’s daily market value. Borrowings under this agreement bear interest on the outstanding principal at a rate equal to the interest rate. In the event of default, all loans will bear interest at a rate equal to 5.00% in excess of the interest rate specified or OBFR plus 151 bps, per annum, on the principal balance outstanding. During the year ended June 30, 2024, HDSPF did not draw on the line of credit. As a result, average borrowings and the average interest rate on the line during the year ended June 30, 2024 were $0 and 0%, respectively. Effective May 28, 2024 the line of credit agreement with BNP was terminated.
Federal Income Taxes – The Funds have qualified income and intend to continue to comply with the requirements of the Internal Revenue Code applicable to regulated investment companies and to distribute all of their taxable income to their shareholders. Therefore, no provision for federal income tax is required. The Funds recognize the tax benefits of uncertain tax positions only where the position is “more likely than not” to be sustained assuming examination by tax authorities. Management has analyzed the Funds’ tax positions and has concluded that no liability for unrecognized tax benefits should be recorded related to uncertain tax positions taken on returns filed for open tax years June 30, 2021 through June 30, 2023, or expected to be taken in the Funds’ June 30, 2024 tax returns. The Funds have identified their major tax jurisdictions as U.S. federal, Ohio and foreign
| The HCM Funds |
| NOTES TO FINANCIAL STATEMENTS (Continued) |
| June 30, 2024 |
| |
jurisdictions where the Funds make significant investments; however, the Funds are not aware of any tax positions for which it is reasonably possible that the total amounts of unrecognized tax benefits will change materially in the next twelve months.
Exchange Traded Funds – The Funds may invest in exchange traded funds (“ETFs”). ETFs are a type of index fund bought and sold on a securities exchange. An ETF trades like common stock and represents a fixed portfolio of securities. The risks of owning an ETF generally reflect the risks of owning the underlying securities they are designed to track, although the lack of liquidity on an ETF could result in it being more volatile. Additionally, ETFs have fees and expenses that reduce their value.
Please refer to the Funds’ prospectus for a full listing of risks associated with these investments.
Expenses – Expenses of the Trust that are directly identifiable to a specific fund are charged to that fund. Expenses, which are not readily identifiable to a specific fund, are allocated in such a manner as deemed equitable (as determined by the Board), taking into consideration the nature and type of expense and the relative sizes of the funds in the Trust.
Indemnification – The Trust indemnifies its officers and Trustees for certain liabilities that may arise from the performance of their duties to the Trust. Additionally, in the normal course of business, the Funds enter into contracts that contain a variety of representations and warranties and which provide general indemnities. The Funds’ maximum exposure under these arrangements is unknown, as this would involve future claims that may be made against the Funds that have not yet occurred. However, based on experience, the risk of loss due to these warranties and indemnities appears to be remote.
| 3. | INVESTMENT TRANSACTIONS |
For the year ended June 30, 2024, cost of purchases and proceeds from sales of portfolio securities, other than short-term investments and U.S. government securities, were as follows:
| Portfolio | | Purchases | | | Sales | |
| HCM Tactical Growth Fund | | $ | 2,268,853,388 | | | $ | 2,374,837,070 | |
| HCM Dividend Sector Plus Fund | | | 1,438,031,416 | | | | 1,448,278,209 | |
| HCM Income Plus Fund | | | 675,078,260 | | | | 690,003,481 | |
| HCM Dynamic Income Fund | | | 214,114,202 | | | | 239,792,080 | |
| | | | | | | | | |
| 4. | INVESTMENT ADVISORY AGREEMENT AND TRANSACTIONS WITH RELATED PARTIES |
Howard Capital Management, Inc. serves as the Funds’ investment adviser (the “Adviser”). Pursuant to advisory agreements with the Trust, on behalf of each Fund, the Adviser, under the oversight of the Board, directs the daily operations of the Funds and supervises the performance of administrative and professional services provided by others. As compensation for its services and the related expenses
| The HCM Funds |
| NOTES TO FINANCIAL STATEMENTS (Continued) |
| June 30, 2024 |
| |
borne by the Adviser, the Funds paid the Adviser an investment advisory fee, computed and accrued daily and paid monthly, at an annual rate of 1.25% of each Fund’s average daily net assets for HTGF and HDSPF, 0.95% for HIPF and 1.25% for HDIF. For the year ended June 30, 2024, the Adviser earned investment advisory fees of $16,794,330, $17,428,457 $6,198,795 and $1,629,343 for HTGF, HDSPF, HIPF and HDIF, respectively.
Effective February 26, 2024, the Adviser has agreed to revise the annual advisory fee for HTGF, HDSPF and HDIF at the annual rate of 1.25% of the Fund’s average daily net assets up to $2 billion, 1.20% on assets between $2 billion and $3 billion and 1.15% on assets greater than $3 billion.
Pursuant to written contracts (the “Waiver Agreements”), the Adviser has agreed until October 31, 2024 to waive a portion of its advisory fee and agreed to reimburse HDIF for other expenses to the extent necessary so that the total expenses incurred by the Fund (excluding front-end or contingent deferred loads, brokerage fees and commissions, acquired fund fees and expenses, borrowing costs such as interest and dividend expenses on securities sold short, taxes, or extraordinary expenses, such as litigation expenses, not incurred in the ordinary course of each Fund’s business) do not exceed the following amounts per annum of the average daily net assets of each class of shares:
| | | Class A | | Class I | | Investor Class |
| HDIF | | 1.99% | | 1.74% | | 2.74% |
| | | | | | | |
These fee waivers and reimbursements are subject to possible recoupment from the Fund by the Adviser in future years (within the three years after the fees have been waived or reimbursed) if such recoupment can be achieved within the lesser of the expense limitation in place at the time of waiver. HTGF, HDSPF and HIPF currently do not have a Waiver Agreement in place. During the year ended June 30, 2024, the Adviser waived $0 in fees pursuant to the Waiver Agreements for HDIF and there are no waived fees available for recoupment.
Distributor – The Trust, on behalf of the Funds, has adopted the Trust’s Master Distribution and Shareholder Servicing Plans (the “Plans”) pursuant to Rule 12b-1 under the 1940 Act. The Plans provide that a monthly service and/or distribution fee is calculated at an annual rate of 0.25%, 1.00% and 0.10% of the average daily net assets attributable to Class A, Investor Class and Class R shares, respectively, for HTGF, 0.25%, 0.40%, 1.00%, and 0.10% of the average daily net assets attributable to Class A, Class A1, Investor Class and Class R shares, respectively for HDSPF, 0.25% and 1.00% of the average daily net assets attributable to Class A and Investor Class shares, respectively for HIPF and 0.25% and 1.00% of the average daily net assets attributable to Class A and Investor Class shares, respectively for HDIF and is paid to Northern Lights Distributors, LLC to provide compensation for ongoing distribution-related activities or services and/or maintenance of the Funds’ shareholder accounts, not otherwise required to be provided by the Adviser. Class R shares are not currently accruing fees as they are not currently available for sale. During the year ended June 30, 2024, pursuant to the Plans, distribution fees for Class A shares, Class A1 shares and Investor Class shares were as follows:
| Portfolio | | Class A | | | Class A1 | | | Investor Class | |
| HCM Tactical Growth Fund | | $ | 2,238,414 | | | $ | — | | | $ | 3,638,370 | |
| HCM Dividend Sector Plus Fund | | | 2,206,719 | | | | 23 | | | | 4,233,483 | |
| HCM Income Plus Fund | | | 1,064,180 | | | | — | | | | 1,565,443 | |
| HCM Dynamic Income Fund | | | 291,457 | | | | — | | | | 41 | |
| The HCM Funds |
| NOTES TO FINANCIAL STATEMENTS (Continued) |
| June 30, 2024 |
| |
The Distributor acts as each Fund’s principal underwriter in a continuous public offering of the Funds’ shares. On sales of HTGF’s Class A shares for the year ended June 30, 2024, the Distributor received $93,423 from front-end sales charges of which $13,629 was retained by the principal underwriter or other affiliated broker-dealers. On sales of HDSPF’s Class A shares for the year ended June 30, 2024, the Distributor received $69,647 from front-end sales charges of which $9,829 was retained by the principal underwriter or other affiliated broker-dealers. On sales of HIPF’s Class A shares for the year ended June 30, 2024, the Distributor received $21,628 from front-end sales charges, of which $3,065 was retained by the principal underwriter or other affiliated broker-dealers. On sales of HDIF’s Class A shares for the year ended June 30, 2024, the Distributor received $87,239 from front-end sales charges, of which $13,463 was retained by the principal underwriter or other affiliated broker-dealers.
In addition, certain affiliates of the Distributor provide services to the Funds as follows:
Ultimus Fund Solutions, LLC (“UFS”) – UFS, an affiliate of the Distributor, provides administration, fund accounting, and transfer agent services to the Trust. Pursuant to separate servicing agreements with UFS, the Funds pay UFS customary fees for providing administration, fund accounting and transfer agency services to the Funds. Certain officers of the Trust are also officers of UFS and are not paid any fees directly by either Funds for serving in such capacities.
Northern Lights Compliance Services, LLC (“NLCS”) – NLCS, an affiliate of UFS and the Distributor, provides a chief compliance officer to the Trust, as well as related compliance services, pursuant to a consulting agreement between NLCS and the Trust. Under the terms of such agreement, NLCS receives customary fees from each Fund.
Blu Giant, LLC (“Blu Giant”) – Blu Giant, an affiliate of UFS and the Distributor, provides EDGAR conversion and filing services as well as print management services for the Trust on an ad-hoc basis. For the provision of these services, Blu Giant receives customary fees from the Funds.
| 5. | DISTRIBUTION TO SHAREHOLDERS AND TAX COMPONENTS OF CAPITAL |
The tax character of distributions paid for the periods ended June 30, 2024, and June 30, 2023, was as follows:
| For the period ended June 30, 2024: |
| | | Ordinary | | | Long-Term | | | Return | | | Tax-Exempt | | | | |
| Portfolio | | Income | | | Capital Gains | | | of Capital | | | Income | | | Total | |
| HCM Tactical Growth Fund | | $ | — | | | $ | — | | | $ | — | | | $ | — | | | $ | — | |
| HCM Dividend Sector Plus Fund | | | 65,189,207 | | | | 1,641,041 | | | | — | | | | — | | | | 66,830,248 | |
| HCM Income Plus Fund | | | 3,278,561 | | | | — | | | | — | | | | — | | | | 3,278,561 | |
| HCM Dynamic Income Fund | | | 3,507,389 | | | | — | | | | — | | | | — | | | | 3,507,389 | |
| | | | | | | | | | | | | | | | | | | | | |
| For the period ended June 30, 2023: |
| | | Ordinary | | | Long-Term | | | Return | | | Tax-Exempt | | | | |
| Portfolio | | Income | | | Capital Gains | | | of Capital | | | Income | | | Total | |
| HCM Tactical Growth Fund | | $ | — | | | $ | 6,820,534 | | | $ | 10,552 | | | $ | — | | | $ | 6,831,086 | |
| HCM Dividend Sector Plus Fund | | | 2,655 | | | | 91,366,961 | | | | — | | | | — | | | | 91,369,616 | |
| HCM Income Plus Fund | | | — | | | | — | | | | — | | | | — | | | | — | |
| HCM Dynamic Income Fund | | | 636,023 | | | | — | | | | — | | | | — | | | | 636,023 | |
| The HCM Funds |
| NOTES TO FINANCIAL STATEMENTS (Continued) |
| June 30, 2024 |
| |
As of June 30, 2024, the components of accumulated earnings/ (deficit) on a tax basis were as follows:
| | | Undistributed | | | Undistributed | | | Undistributed | | | Post October Loss | | | Capital Loss | | | Other | | | Unrealized | | | Total | |
| | | Ordinary | | | Ordinary | | | Long-Term | | | and | | | Carry | | | Book/Tax | | | Appreciation/ | | | Accumulated | |
| Portfolio | | Tax-Exempt Income | | | Income | | | Capital Gains | | | Late Year Loss | | | Forwards | | | Differences | | | (Depreciation) | | | Earnings/(Deficits) | |
| HCM Tactical Growth Fund | | $ | — | | | $ | 67,065,917 | | | $ | 1,213,070 | | | $ | (3,517,071 | ) | | $ | — | | | $ | — | | | $ | 460,508,198 | | | $ | 525,270,114 | |
| HCM Dividend Sector Plus Fund | | | — | | | | 86,022,224 | | | | 2,139,930 | | | | (1,485,912 | ) | | | — | | | | — | | | | 314,061,088 | | | | 400,737,330 | |
| HCM Income Plus Fund | | | — | | | | 225,463 | | | | 2,741,765 | | | | — | | | | — | | | | — | | | | 144,809,081 | | | | 147,776,309 | |
| HCM Dynamic Income Fund | | | — | | | | 1,080,385 | | | | — | | | | — | | | | (4,987,423 | ) | | | — | | | | 1,084,119 | | | | (2,822,919 | ) |
| | | | | | | | | | | | | | | | | | | | | | | | | | | | | | | | | |
The difference between book basis and tax basis unrealized appreciation, undistributed net investment income, and accumulated net realized gains from investments is primarily attributable to the tax deferral of losses on wash sales.
Late year losses incurred after December 31 within the fiscal year are deemed to arise on the first business day of the following fiscal year for tax purposes. The Funds incurred and elected to defer such late year losses as follows: The HCM Tactical Growth Fund and HCM Dividend Sector Plus Fund incurred and elected to defer such late year losses of $3,517,071 and $1,485,912.
| | | Late Year | |
| Portfolio | | Losses | |
| HCM Tactical Growth Fund | | $ | 3,517,071 | |
| HCM Dividend Sector Plus Fund | | | 1,485,912 | |
| HCM Income Plus Fund | | | — | |
| HCM Dynamic Income Fund | | | — | |
| | | | | |
At June 30, 2024, the Funds had capital loss carry forwards for federal income tax purposes available to offset future capital gains, along with capital loss carryforwards utilized as follows:
| | | Non-Expiring | | | | | | | |
| Portfolio | | Short-Term | | | Long-Term | | | Total | | | CLCF Utilized | |
| HCM Tactical Growth Fund | | $ | — | | | $ | — | | | $ | — | | | $ | 60,946,817 | |
| HCM Dividend Sector Plus Fund | | | — | | | | — | | | | — | | | | 5,051,525 | |
| HCM Income Plus Fund | | | — | | | | — | | | | — | | | | 31,190,270 | |
| HCM Dynamic Income Fund | | | 4,987,423 | | | | — | | | | 4,987,423 | | | | — | |
| | | | | | | | | | | | | | | | | |
Permanent book and tax differences, primarily attributable to the book/tax treatment of the non-deductible expenses, and use of tax equalization credits, resulted in reclassification for the year ended June 30, 2024, as follows:
| | | Paid | | | | |
| | | In | | | Accumulated | |
| Portfolio | | Capital | | | Earnings (Losses) | |
| HCM Tactical Growth Fund | | $ | 1,769,967 | | | $ | (1,769,967 | ) |
| HCM Dividend Sector Plus Fund | | | 4,662,272 | | | | (4,662,272 | ) |
| HCM Income Plus Fund | | | 107,014 | | | | (107,014 | ) |
| HCM Dynamic Income Fund | | | — | | | | — | |
| The HCM Funds |
| NOTES TO FINANCIAL STATEMENTS (Continued) |
| June 30, 2024 |
| |
| 6. | AGGREGATE UNREALIZED APPRECIATION AND DEPRECIATION – TAX BASIS |
| | | | | | | | | | | | Tax Net Unrealized | |
| | | Cost for Federal | | | Gross Unrealized | | | Gross Unrealized | | | Appreciation | |
| | | Tax purposes | | | Appreciation | | | Depreciation | | | (Depreciation) | |
| HCM Tactical Growth Fund | | $ | 1,047,373,010 | | | $ | 464,938,803 | | | $ | (4,430,605 | ) | | $ | 460,508,198 | |
| HCM Dividend Sector Plus Fund | | | 1,291,311,473 | | | | 330,036,696 | | | | (15,975,608 | ) | | | 314,061,088 | |
| HCM Income Plus Fund | | | 589,946,647 | | | | 149,376,831 | | | | (4,567,750 | ) | | | 144,809,081 | |
| HCM Dynamic Income Fund | | | 103,633,730 | | | | 1,908,750 | | | | (824,631 | ) | | | 1,084,119 | |
| | | | | | | | | | | | | | | | | |
The Funds may assess a short-term redemption fee of 1.00% of the total redemption amount if a shareholder sells their shares after holding them for less than 30 days. The redemption fee is paid directly to the specific Fund in which the short-term redemption fee occurs. For the year ended June 30, 2024, no Fund assessed redemption fees.
The beneficial ownership, either directly or indirectly, of more than 25% of the voting securities of a portfolio creates presumption of the control of the portfolio, under section 2(a)(9) of the 1940 Act. As of June 30, 2024, National Financial Services and Pershing LLC owned 28.3% and 27.8% of HTGF, respectively. As of June 30, 2024, National Financial Services and Pershing LLC owned 29.2% and 29.1% of HDSPF, respectively. As of June 30, 2024, Pershing LLC , Charles Schwab, and National Financial Services owned 31.0 %, 28.0%, and 25.4% of HIPF, respectively. As of June 30, 2024, Pershing LLC owned 27.9% of HDIF.
Subsequent events after the date of the Statements of Assets and Liabilities have been evaluated through the date the financial statements were issued.
Management has determined that no events or transactions occurred requiring adjustment or disclosure in the financial statements.
Report of Independent Registered Public Accounting Firm
To the Shareholders of HCM Tactical Growth Fund, HCM Dividend Sector Plus Fund, HCM Income Plus Fund, and HCM Dynamic Income Fund and the Board of Trustees of Northern Lights Fund Trust III
Opinion on the Financial Statements
We have audited the accompanying statements of assets and liabilities of HCM Tactical Growth Fund, HCM Dividend Sector Plus Fund, HCM Income Plus Fund and HCM Dynamic Income Fund (collectively, the Funds), including the schedules of investments, as of June 30, 2024, the related statements of operations for the year then ended, the statements of changes in net assets for each of the two years in the period then ended, and the related notes to the financial statements (collectively, the financial statements), and the financial highlights for each of the years presented below. In our opinion, the financial statements and financial highlights present fairly, in all material respects, the financial position of the Funds as of June 30, 2024, the results of their operations for the year then ended, the changes in net assets for each of the two years in the period then ended, and the financial highlights for each of the years presented below, in conformity with accounting principles generally accepted in the United States of America.
| Fund Name | Financial Highlights |
| HCM Tactical Growth Fund | For the years ended June 30, 2024, 2023, 2022, 2021 and 2020 |
| HCM Dividend Sector Plus Fund | For the years ended June 30, 2024, 2023, 2022, 2021 and 2020 |
| HCM Income Plus Fund | For the years ended June 30, 2024, 2023, 2022, 2021 and 2020 |
| HCM Dynamic Income Fund | For the year ended June 30, 2024 and 2023 |
Basis for Opinion
These financial statements are the responsibility of the Funds’ management. Our responsibility is to express an opinion on the Funds’ financial statements and financial highlights based on our audits. We are a public accounting firm registered with the Public Company Accounting Oversight Board (United States) (PCAOB) and are required to be independent with respect to the Funds in accordance with U.S. federal securities laws and the applicable rules and regulations of the Securities and Exchange Commission and the PCAOB.
We conducted our audits in accordance with the standards of the PCAOB. Those standards require that we plan and perform the audit to obtain reasonable assurance about whether the financial statements are free of material misstatement, whether due to error or fraud. The Funds are not required to have, nor were we engaged to perform, an audit of their internal control over financial reporting. As part of our audits, we are required to obtain an understanding of internal control over financial reporting but not for the purpose of expressing an opinion on the effectiveness of the Funds’ internal control over financial reporting. Accordingly, we express no such opinion.
Our audits included performing procedures to assess the risks of material misstatement of the financial statements, whether due to error or fraud, and performing procedures that respond to those risks. Such procedures included examining, on a test basis, evidence regarding the amounts and disclosures in the financial statements. Our procedures included confirmation of securities owned as of June 30, 2024, by correspondence with the custodian and broker. Our audits also included evaluating the accounting principles used and significant estimates made by management, as well as evaluating the overall presentation of the financial statements. We believe that our audits provide a reasonable basis for our opinion.
/s/ RSM US LLP
We have served as the auditor of one or more Howard Capital Management, Inc. investment companies since 2015.
Denver, Colorado
August 29, 2024
| THE HCM FUNDS |
| SUPPLEMENTAL INFORMATION (Unaudited) |
| June 30, 2024 |
| |
Renewal of Advisory Agreements – HCM Dividend Sector Plus Fund, HCM Income Plus Fund, HCM Tactical Growth Fund and HCM Dynamic Income Fund*
In connection with a meeting held on February 26 & March 4, 2024, the Board, including a majority of the Trustees who are not “interested persons” as that term is defined in the 1940 Act, discussed the renewal of the investment advisory agreements (the “Advisory Agreements”) between Howard Capital Management, Inc. (the “Adviser”) and the Trust, with respect to HCM Dividend Sector Plus Fund (“HCM DSP”), HCM Income Plus Fund (“HCM IP”), HCM Tactical Growth Fund (“HCM TG”) and HCM Dynamic Income Fund (“HCM DI”) (collectively, the “HCM Funds”). In considering the renewal of the Advisory Agreements, the Board reviewed materials specifically relating to the HCM Funds and the Advisory Agreements.
The Board discussed the Adviser’s presentation and materials. The Board relied upon the advice of independent legal counsel and its own business judgment in determining the material factors to be considered in evaluating the Advisory Agreements and the weight to be given to each such factor. The Board’s conclusions were based on an evaluation of all of the information provided and were not the result of any one factor. Moreover, each Trustee may have afforded different weight to the various factors in reaching his or her conclusions with respect to the Advisory Agreements.
Nature, Extent and Quality of Services. The Board recognized that the Adviser had approximately $4.8 billion in total assets under management. The Board noted the broad investment experience and academic credentials of the Adviser’s investment personnel. The Board discussed how the Adviser continually utilized its proprietary quantitative model to determine when and in which market sectors the HCM Funds should be invested and augmented its models with third-party research on interest rate direction, international markets and macroeconomic factors. The Board reviewed the Adviser’s risk management plan that employed stop losses, closely monitored the market during times of market growth, and used mathematical market ratios in an effort to avoid major market downturns. The Board noted that the Adviser had defined inputs in its proprietary model to ensure compliance with each HCM Fund’s investment limitations. The Board discussed the Adviser’s cybersecurity protocols. The Board observed that the Adviser selected broker/dealers based on best execution. The Trust’s CCO and the Board observed that the Adviser had reported no material compliance issues or data security incidents since the Advisory Agreements were last approved. The Board concluded that it could reasonably expect the Adviser to continue providing quality service to the HCM Funds and their respective shareholders.
Performance.
HCM DSP — The Board observed that HCM DSP earned a 3-star Morningstar rating and outperformed its peer group and Morningstar category but underperformed its benchmark over the 1-year period. Over the 3-year period, the Board further observed that HCM DSP underperformed its peer group, Morningstar category and its benchmark. The Board further noted that HCM DSP outperformed its peer group and Morningstar category, but moderately underperformed the
| THE HCM FUNDS |
| SUPPLEMENTAL INFORMATION (Unaudited)(Continued) |
| June 30, 2024 |
| |
benchmark over the 5-year period and since inception. The Board noted that HCM DSP had produced positive returns over the long-term.
HCM IP — The Board commented that HCM IP earned a 3-star Morningstar category and outperformed its peer group, Morningstar category and benchmark. The Board further commented that HCM IP outperformed its benchmark but underperformed its peer group and Morningstar category over the 3-year period. The Board further noted that HCM IP outperformed its peer group, Morningstar category and benchmark over the 5-year and since inception periods.
HCM TG — The Board noted that HCM TG earned a 2-star Morningstar category and underperformed its peer group and Morningstar category but outperformed both the broad based market index and the hedged equity index over the one-year period. The Board commented that HCM TG significantly outperformed the hedged equity index over the 5-year period and since inception.
HCM DI — The Board commented that HCM DI underperformed its peer group, Morningstar and benchmark over the 1-year and since inception periods. The Board noted that HCM DI was a new fund and recent performance had shown improvement.
The Board considered the Adviser’s analysis of the factors that impacted performance, and the Adviser’s ongoing efforts to achieve superior results. After further discussion, the Board concluded that the performance of each HCM Fund was satisfactory.
Fees and Expenses. The Board noted that the advisory fee of each HCM Fund was higher than its peer group and Morningstar category medians and averages, and in the case of HCM TG and HCM DSP, the highest fee in the category. The Board considered the Adviser’s explanation for its fees which included that its proprietary model had been developed over many years through extensive research and was continually being reviewed and refined, as deemed appropriate. The Board discussed that the Adviser believed the utilization of its proprietary model commanded a premium. The Board noted that the Adviser had agreed to introduce breakpoints to the fees paid by HCM DSP, HCM TG and HCM DI when HCM Fund’s assets exceeded $2 billion. The Board acknowledged that HCM DI currently had an expense limitation in place of 1.74% for Class I shares, 1.99% for Class A shares and 2.74% for Investor Class shares. The Board concluded that the advisory fee for each HCM Fund was not unreasonable.
Economies of Scale. The Board noted that the Adviser had considered the Board’s request to add breakpoints to the HCM Funds’ fee schedules to reflect economies of scale realized by the Adviser, and was pleased that the Adviser had agreed to breakpoints for HCM DSP, HCM TG and HCM DI. The Board discussed that the Adviser expressed a willingness to negotiate appropriate breakpoints for HCM IP when it exceeded a specified level of assets. The Board agreed to monitor and revisit this issue at the next renewal.
Profitability. The Board reviewed the Adviser’s profitability analysis in connection with its advisory services provided to each of the HCM Funds and noted that the Adviser had earned a
| THE HCM FUNDS |
| SUPPLEMENTAL INFORMATION (Unaudited)(Continued) |
| June 30, 2024 |
| |
reasonable profit in connection with each HCM Fund. The Board acknowledged the Adviser’s continuing investments in resources to effectively manage the HCM Funds. The Board concluded that the Adviser’s profitability for each of the HCM Funds was not excessive.
Conclusion. Having requested and reviewed such information from the Adviser as the Board believed to be reasonably necessary to evaluate the terms of the Advisory Agreements, and as assisted by the advice of independent counsel, the Board concluded that renewal of each Advisory Agreement was in the best interests of the HCM Funds and their respective shareholders.
| * | Due to timing of the contract renewal schedule, these deliberations may or may not relate to the current performance results of the HCM Funds. |
PROXY VOTING POLICY
Information regarding how the Funds voted proxies relating to portfolio securities for the most recent twelve month period ended June 30 as well as a description of the policies and procedures that the Funds used to determine how to vote proxies is available without charge, upon request, by calling 1-855-969-8464 or by referring to the Securities and Exchange Commission’s (“SEC”) website at http://www.sec.gov.
PORTFOLIO HOLDINGS
The Funds file a complete schedule of portfolio holdings with the SEC for the first and third quarters of each fiscal year as an exhibit to their reports on Form N-PORT, within sixty days after the end of the period. Form N-PORT reports are available at the SEC’s website at www.sec.gov.
| |
| |
| |
| |
| |
| |
| |
| |
| |
| |
| |
| |
| |
| |
| |
| |
| |
| |
| |
| |
| |
| |
| |
| |
| |
| |
| |
| |
| |
| |
| |
| |
| INVESTMENT ADVISER |
| Howard Capital Management, Inc. |
| 1145 Hembree Road |
| Roswell, Georgia 30076 |
| |
| ADMINISTRATOR |
| Ultimus Fund Solutions, LLC |
| 225 Pictoria Drive, Suite 450 |
| Cincinnati, Ohio 45246 |
| |
| |
| |
| HCMF-AR24 |
Item 8. Changes in and Disagreements with Accountants for Open-End Management Investment Companies. Not applicable
Item 9. Proxy Disclosures for Open-End Management Investment Companies. Not applicable
Item 10. Remuneration Paid to Directors, Officers, and Others of Open-End Management Investment Companies. Included under Item 7 of this Form.
Item 11. Statement Regarding Basis for Approval of Investment Advisory Contract. Included under Item 7 of this Form.
Item 12. Disclosure of Proxy Voting Policies and Procedures for Closed-End Management Investment Companies.
Not applicable.
Item 13. Portfolio Managers of Closed-End Management Investment Companies.
Not applicable.
Item 14. Purchases of Equity Securities by Closed-End Management Investment Company and Affiliated Purchasers.
Not applicable.
Item 15. Submission of Matters to a Vote of Security Holders.
None.
Item 16. Controls and Procedures.
(a) The registrant’s Principal Executive Officer and Principal Financial Officer have concluded that the registrant’s disclosure controls and procedures (as defined in Rule 30a-3(c) under the Act) are effective in design and operation and are sufficient to form the basis of the certifications required by Rule 30a-(2) under the Act, based on their evaluation of these disclosure controls and procedures as of a date within 90 days of this report on Form N-CSR.
(b) There were no changes in the registrant’s internal control over financial reporting (as defined in Rule 30a-3(d) under the Act) during the period covered by this report that have materially affected, or are reasonably likely to materially affect, the registrant’s internal control over financial reporting.
Item 17. Disclosure of Securities Lending Activities for Closed-End Management Investment Companies.
Not applicable.
Item 18. Recovery of Erroneously Awarded Compensation.
(a) Not applicable.
(b) Not applicable.
Item 19. Exhibits.
(a)(1) Code of Ethics for Principal Executive and Senior Financial Officers. Exhibit 99. CODE
(a)(2) Not applicable
(a)(3) A separate certification for each principal executive officer and principal financial officer of the registrant as required by Rule 30a-2(a) under the Act (17 CFR 270.30a-2(a)): Attached hereto. Exhibit 99. CERT
(a)(4) Not applicable.
(b) Certifications required by Rule 30a-2(b) under the Act (17 CFR 270.30a-2(b)): Attached hereto Exhibit 99.906CERT
SIGNATURES
Pursuant to the requirements of the Securities Exchange Act of 1934 and the Investment Company Act of 1940, the registrant has duly caused this report to be signed on its behalf by the undersigned, thereunto duly authorized.
| (Registrant) | Northern Lights Fund Trust III |
By (Signature and Title)
| /s/ Brian Curley |
| Brian Curley, Principal Executive Officer/President |
Pursuant to the requirements of the Securities Exchange Act of 1934 and the Investment Company Act of 1940, this report has been signed below by the following persons on behalf of the registrant and in the capacities and on the dates indicated.
By (Signature and Title)
| /s/ Brian Curley |
| Brian Curley, Principal Executive Officer/President |
By (Signature and Title)
| /s/ Rich Gleason |
| Rich Gleason, Principal Financial Officer/Treasurer |