united states
securities and exchange commission
washington, d.c. 20549
form n-csr
certified shareholder report of registered management
investment companies
| Investment Company Act file number | 811-22655 |
| Northern Lights Fund Trust III |
| (Exact name of registrant as specified in charter) |
| 225 Pictoria Drive Cincinnati, OH | 45246 |
| (Address of principal executive offices) | (Zip code) |
| The Corporation Trust Company |
| 1209 Orange Street Wilmington, DE 19801 |
| (Name and address of agent for service) |
| Registrant’s telephone number, including area code: | 631-470-2619 | |
| Date of fiscal year end: | 9/30 | |
| | | |
| Date of reporting period: | 9/30/24 | |
Item 1. Reports to Stockholders.
(a)
Pinnacle Multi-Strategy Core Fund - Class A (APSHX )
Annual Shareholder Report - September 30, 2024
This annual shareholder report contains important information about Pinnacle Multi-Strategy Core Fund for the period of October 1, 2023 to September 30, 2024. You can find additional information about the Fund at pinnacledynamicfunds.com/document-center/. You can also request this information by contacting us at (888) 985-9830.
What were the Fund’s costs for the last year?
(based on a hypothetical $10,000 investment)
| Class Name | Costs of a $10,000 investment | Costs paid as a percentage of a $10,000 investment |
|---|
| Class A | $152 | 1.37% |
How did the Fund perform during the reporting period?
Overall the domestic equity environment during the reporting period (10/1/2023-9/30/2024) was strong and saw across the board gains in various asset classes and sectors. While the Fund participated well for the first 9 months of the reporting period, it struggled in the quarter ended (7/1/24-9/30/24). This can easily be seen in the following table:
The two primary causes for the strong return in the first three quarters (and good return for the year) is first, the equity asset classes demonstrating relative strength continued their trend, and second, our risk management signals were overwhelmingly positive for almost the entire time period, keeping the Fund invested in equities.
The primary cause for the underperformance in the last quarter was the equity allocations to growth oriented names underperformed in July, leading to incorporating small caps and value oriented equity asset classes in August and September. However, as sometimes occurs in times of transition within relative strength strategies, these ended up underperforming in August and September.
In the short term the times of transition in relative strength strategies can sometimes be frustrating. However, over multi year time frames (we prefer rolling 36 month time frames) we believe these strategies provide opportunity.
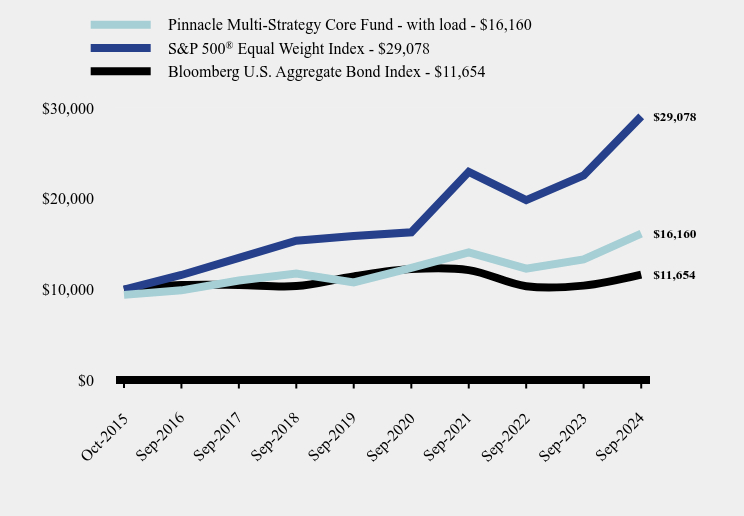
How has the Fund performed since inception?
Total Return Based on $10,000 Investment
| Pinnacle Multi-Strategy Core Fund - with load | S&P 500® Equal Weight Index | Bloomberg U.S. Aggregate Bond Index |
|---|
| Oct-2015 | $9,425 | $10,000 | $10,000 |
| Sep-2016 | $9,925 | $11,617 | $10,513 |
| Sep-2017 | $11,007 | $13,503 | $10,520 |
| Sep-2018 | $11,774 | $15,386 | $10,392 |
| Sep-2019 | $10,795 | $15,909 | $11,462 |
| Sep-2020 | $12,393 | $16,307 | $12,263 |
| Sep-2021 | $14,110 | $22,970 | $12,153 |
| Sep-2022 | $12,312 | $19,862 | $10,379 |
| Sep-2023 | $13,335 | $22,571 | $10,446 |
| Sep-2024 | $16,160 | $29,078 | $11,654 |
Average Annual Total Returns
| 1 Year | 5 Years | Since Inception (10/01/2015) |
|---|
| Pinnacle Multi-Strategy Core Fund | | | |
| Without Load | 21.19% | 8.40% | 6.17% |
| With Load | 14.20% | 7.13% | 5.48% |
S&P 500® Equal Weight Index | 28.83% | 12.82% | 12.59% |
| Bloomberg U.S. Aggregate Bond Index | 11.57% | 0.33% | 1.72% |
The Fund's past performance is not a good predictor of how the Fund will perform in the future. The graph and table do not reflect the deduction of taxes that a shareholder would pay on fund distributions or redemption of fund shares.
| Net Assets | $43,797,909 |
| Number of Portfolio Holdings | 25 |
| Advisory Fee (net of waivers) | $163,845 |
| Portfolio Turnover | 424% |
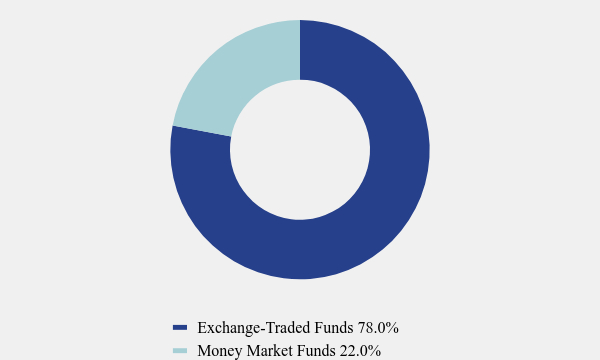
Asset Weighting (% of total investments)
| Value | Value |
|---|
| Exchange-Traded Funds | 78.0% |
| Money Market Funds | 22.0% |
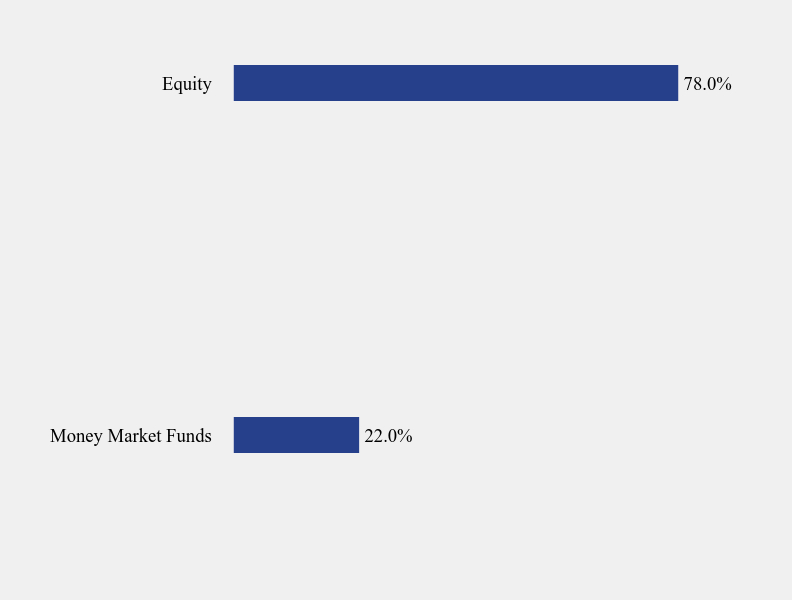
What did the Fund invest in?
Sector Weighting (% of net assets)
| Value | Value |
|---|
| Money Market Funds | 22.0% |
| Equity | 78.0% |
Top 10 Holdings (% of net assets)
| Holding Name | % of Net Assets |
| Pinnacle Focused Opportunities ETF | 24.6% |
| First American Government Obligations Fund, Class X | 22.0% |
| SPDR S&P 500 ETF Trust | 4.2% |
| SPDR S&P 600 Small Cap Value ETF | 3.9% |
| SPDR S&P 600 Small Cap Growth ETF | 3.9% |
| iShares Russell 2000 ETF | 3.9% |
| SPDR Portfolio S&P 500 Value ETF | 3.9% |
| SPDR Dow Jones Industrial Average ETF Trust | 3.8% |
| SPDR S&P 400 Mid Cap Value ETF | 3.8% |
| SPDR Portfolio S&P 400 Mid Cap ETF | 3.8% |
No material changes occurred during the year ended September 30, 2024.
Pinnacle Multi-Strategy Core Fund - Class A (APSHX )
Annual Shareholder Report - September 30, 2024
Additional information is available on the Fund's website ( pinnacledynamicfunds.com/document-center/ ), including its:
Prospectus
Financial information
Holdings
Proxy voting information
Pinnacle Multi-Strategy Core Fund - Class C (CPSHX )
Annual Shareholder Report - September 30, 2024
This annual shareholder report contains important information about Pinnacle Multi-Strategy Core Fund for the period of October 1, 2023 to September 30, 2024. You can find additional information about the Fund at pinnacledynamicfunds.com/document-center/. You can also request this information by contacting us at (888) 985-9830.
What were the Fund’s costs for the last year?
(based on a hypothetical $10,000 investment)
| Class Name | Costs of a $10,000 investment | Costs paid as a percentage of a $10,000 investment |
|---|
| Class C | $234 | 2.12% |
How did the Fund perform during the reporting period?
Overall the domestic equity environment during the reporting period (10/1/2023-9/30/2024) was strong and saw across the board gains in various asset classes and sectors. While the Fund participated well for the first 9 months of the reporting period, it struggled in the quarter ended (7/1/24-9/30/24). This can easily be seen in the following table:
The two primary causes for the strong return in the first three quarters (and good return for the year) is first, the equity asset classes demonstrating relative strength continued their trend, and second, our risk management signals were overwhelmingly positive for almost the entire time period, keeping the Fund invested in equities.
The primary cause for the underperformance in the last quarter was the equity allocations to growth oriented names underperformed in July, leading to incorporating small caps and value oriented equity asset classes in August and September. However, as sometimes occurs in times of transition within relative strength strategies, these ended up underperforming in August and September.
In the short term the times of transition in relative strength strategies can sometimes be frustrating. However, over multi year time frames (we prefer rolling 36 month time frames) we believe these strategies provide opportunity.
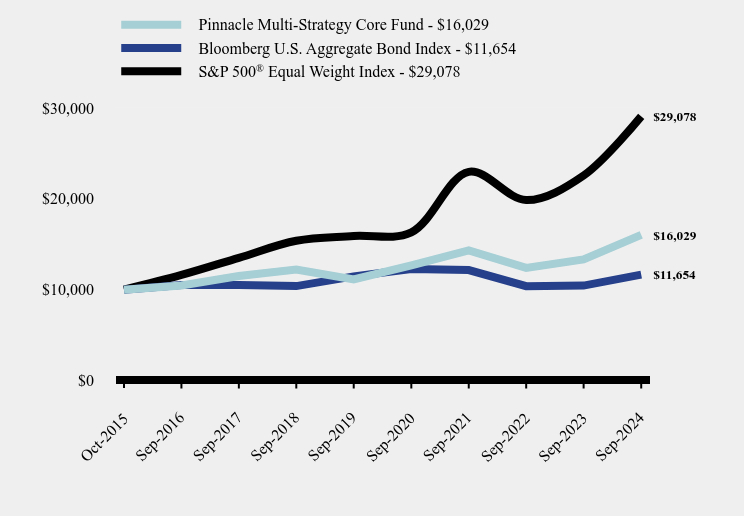
How has the Fund performed since inception?
Total Return Based on $10,000 Investment
| Pinnacle Multi-Strategy Core Fund | Bloomberg U.S. Aggregate Bond Index | S&P 500® Equal Weight Index |
|---|
| Oct-2015 | $10,000 | $10,000 | $10,000 |
| Sep-2016 | $10,460 | $10,513 | $11,617 |
| Sep-2017 | $11,503 | $10,520 | $13,503 |
| Sep-2018 | $12,211 | $10,392 | $15,386 |
| Sep-2019 | $11,118 | $11,462 | $15,909 |
| Sep-2020 | $12,665 | $12,263 | $16,307 |
| Sep-2021 | $14,312 | $12,153 | $22,970 |
| Sep-2022 | $12,391 | $10,379 | $19,862 |
| Sep-2023 | $13,323 | $10,446 | $22,571 |
| Sep-2024 | $16,029 | $11,654 | $29,078 |
Average Annual Total Returns
| 1 Year | 5 Years | Since Inception (October 1, 2015) |
|---|
| Pinnacle Multi-Strategy Core Fund | 20.31% | 7.59% | 5.38% |
| Bloomberg U.S. Aggregate Bond Index | 11.57% | 0.33% | 1.72% |
S&P 500® Equal Weight Index | 28.83% | 12.82% | 12.59% |
The Fund's past performance is not a good predictor of how the Fund will perform in the future. The graph and table do not reflect the deduction of taxes that a shareholder would pay on fund distributions or redemption of fund shares.
| Net Assets | $43,797,909 |
| Number of Portfolio Holdings | 25 |
| Advisory Fee (net of waivers) | $163,845 |
| Portfolio Turnover | 424% |
Asset Weighting (% of total investments)
| Value | Value |
|---|
| Exchange-Traded Funds | 78.0% |
| Money Market Funds | 22.0% |
What did the Fund invest in?
Sector Weighting (% of net assets)
| Value | Value |
|---|
| Money Market Funds | 22.0% |
| Equity | 78.0% |
Top 10 Holdings (% of net assets)
| Holding Name | % of Net Assets |
| Pinnacle Focused Opportunities ETF | 24.6% |
| First American Government Obligations Fund, Class X | 22.0% |
| SPDR S&P 500 ETF Trust | 4.2% |
| SPDR S&P 600 Small Cap Value ETF | 3.9% |
| SPDR S&P 600 Small Cap Growth ETF | 3.9% |
| iShares Russell 2000 ETF | 3.9% |
| SPDR Portfolio S&P 500 Value ETF | 3.9% |
| SPDR Dow Jones Industrial Average ETF Trust | 3.8% |
| SPDR S&P 400 Mid Cap Value ETF | 3.8% |
| SPDR Portfolio S&P 400 Mid Cap ETF | 3.8% |
No material changes occurred during the year ended September 30, 2024.
Pinnacle Multi-Strategy Core Fund - Class C (CPSHX )
Annual Shareholder Report - September 30, 2024
Additional information is available on the Fund's website ( pinnacledynamicfunds.com/document-center/ ), including its:
Prospectus
Financial information
Holdings
Proxy voting information
Pinnacle Multi-Strategy Core Fund - Class I (IPSHX )
Annual Shareholder Report - September 30, 2024
This annual shareholder report contains important information about Pinnacle Multi-Strategy Core Fund for the period of October 1, 2023 to September 30, 2024. You can find additional information about the Fund at pinnacledynamicfunds.com/document-center/. You can also request this information by contacting us at (888) 985-9830.
What were the Fund’s costs for the last year?
(based on a hypothetical $10,000 investment)
| Class Name | Costs of a $10,000 investment | Costs paid as a percentage of a $10,000 investment |
|---|
| Class I | $124 | 1.12% |
How did the Fund perform during the reporting period?
Overall the domestic equity environment during the reporting period (10/1/2023-9/30/2024) was strong and saw across the board gains in various asset classes and sectors. While the Fund participated well for the first 9 months of the reporting period, it struggled in the quarter ended (7/1/24-9/30/24). This can easily be seen in the following table:
The two primary causes for the strong return in the first three quarters (and good return for the year) is first, the equity asset classes demonstrating relative strength continued their trend, and second, our risk management signals were overwhelmingly positive for almost the entire time period, keeping the Fund invested in equities.
The primary cause for the underperformance in the last quarter was the equity allocations to growth oriented names underperformed in July, leading to incorporating small caps and value oriented equity asset classes in August and September. However, as sometimes occurs in times of transition within relative strength strategies, these ended up underperforming in August and September.
In the short term the times of transition in relative strength strategies can sometimes be frustrating. However, over multi year time frames (we prefer rolling 36 month time frames) we believe these strategies provide opportunity.
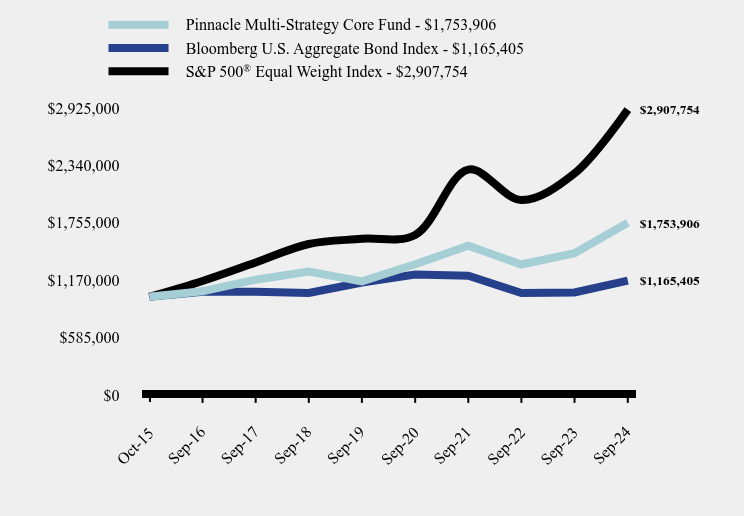
How has the Fund performed since inception?
Total Return Based on $1,000,000 Investment
| Pinnacle Multi-Strategy Core Fund | Bloomberg U.S. Aggregate Bond Index | S&P 500® Equal Weight Index |
|---|
| Oct-15 | $1,000,000 | $1,000,000 | $1,000,000 |
| Sep-16 | $1,057,000 | $1,051,252 | $1,161,690 |
| Sep-17 | $1,174,260 | $1,052,016 | $1,350,253 |
| Sep-18 | $1,258,344 | $1,039,222 | $1,538,583 |
| Sep-19 | $1,157,570 | $1,146,222 | $1,590,940 |
| Sep-20 | $1,332,320 | $1,226,282 | $1,630,671 |
| Sep-21 | $1,520,097 | $1,215,305 | $2,297,048 |
| Sep-22 | $1,329,385 | $1,037,875 | $1,986,199 |
| Sep-23 | $1,443,629 | $1,044,564 | $2,257,119 |
| Sep-24 | $1,753,906 | $1,165,405 | $2,907,754 |
Average Annual Total Returns
| 1 Year | 5 Years | Since Inception (October 1, 2015) |
|---|
| Pinnacle Multi-Strategy Core Fund | 21.49% | 8.67% | 6.44% |
| Bloomberg U.S. Aggregate Bond Index | 11.57% | 0.33% | 1.72% |
S&P 500® Equal Weight Index | 28.83% | 12.82% | 12.59% |
The Fund's past performance is not a good predictor of how the Fund will perform in the future. The graph and table do not reflect the deduction of taxes that a shareholder would pay on fund distributions or redemption of fund shares.
| Net Assets | $43,797,909 |
| Number of Portfolio Holdings | 25 |
| Advisory Fee (net of waivers) | $163,845 |
| Portfolio Turnover | 424% |
Asset Weighting (% of total investments)
| Value | Value |
|---|
| Exchange-Traded Funds | 78.0% |
| Money Market Funds | 22.0% |
What did the Fund invest in?
Sector Weighting (% of net assets)
| Value | Value |
|---|
| Money Market Funds | 22.0% |
| Equity | 78.0% |
Top 10 Holdings (% of net assets)
| Holding Name | % of Net Assets |
| Pinnacle Focused Opportunities ETF | 24.6% |
| First American Government Obligations Fund, Class X | 22.0% |
| SPDR S&P 500 ETF Trust | 4.2% |
| SPDR S&P 600 Small Cap Value ETF | 3.9% |
| SPDR S&P 600 Small Cap Growth ETF | 3.9% |
| iShares Russell 2000 ETF | 3.9% |
| SPDR Portfolio S&P 500 Value ETF | 3.9% |
| SPDR Dow Jones Industrial Average ETF Trust | 3.8% |
| SPDR S&P 400 Mid Cap Value ETF | 3.8% |
| SPDR Portfolio S&P 400 Mid Cap ETF | 3.8% |
No material changes occurred during the year ended September 30, 2024.
Pinnacle Multi-Strategy Core Fund - Class I (IPSHX )
Annual Shareholder Report - September 30, 2024
Additional information is available on the Fund's website ( pinnacledynamicfunds.com/document-center/ ), including its:
Prospectus
Financial information
Holdings
Proxy voting information
(b) Not applicable
Item 2. Code of Ethics.
(a) The registrant has, as of the end of the period covered by this report, adopted a code of ethics that applies to the registrant’s principal executive officer, principal financial officer, principal accounting officer or controller, or persons performing similar functions, regardless of whether these individuals are employed by the registrant or a third party.
(b) N/A
(c) During the period covered by this report, there were no amendments to any provision of the code of ethics.
(d) During the period covered by this report, there were no waivers or implicit waivers of a provision of the code of ethics.
(e) N/A
(f) See Item 19(a)(1)
Item 3. Audit Committee Financial Expert.
| (a) | The Registrant’s board of trustees has determined that Mark H. Taylor is an audit committee financial expert, as defined in Item 3 of Form N-CSR. Mr. Taylor is independent for purposes of this Item 3. |
(a)(2) Not applicable.
(a)(3) Not applicable.
Item 4. Principal Accountant Fees and Services.
| (a) | Audit Fees. The aggregate fees billed for each of the last two fiscal years for professional services rendered by the registrant’s principal accountant for the audit of the registrant’s annual financial statements or services that are normally provided by the accountant in connection with statutory and regulatory filings or engagements for those fiscal years are as follows: |
| | | |
| | | 2024 - $15,000 2023 –$15,000 |
| (b) | Audit-Related Fees. There were no fees billed in each of the last two fiscal years for assurances and related services by the principal accountant that are reasonably related to the performance of the audit of the registrant’s financial statements and are not reported under paragraph (a) of this item. |
| (c) | Tax Fees. The aggregate fees billed in each of the last two fiscal years for professional services rendered by the principal accountant for tax compliance are as follows: |
| | | 2024 - $3,750 |
| | | 2023 –$3,750 |
Preparation of Federal & State income tax returns, assistance with calculation of required income, capital gain and excise distributions and preparation of Federal excise tax returns.
| (d) | All Other Fees. The aggregate fees billed in each of the last two fiscal years for products and services provided by the registrant’s principal accountant, other than the services reported in paragraphs (a) through (c) of this item were $0 and $0 for the fiscal years ended September 30, 2024 and 2023, respectively. |
(e)(1) The audit committee does not have pre-approval policies and procedures. Instead, the audit committee or audit committee chairman approves on a case-by-case basis each audit or non-audit service before the principal accountant is engaged by the registrant.
(e)(2) There were no services described in each of paragraphs (b) through (d) of this Item that were approved by the audit committee pursuant to paragraph (c)(7)(i)(C) of Rule 2-01 of Regulation S-X.
(f) Not applicable. The percentage of hours expended on the principal accountant’s engagement to audit the registrant’s financial statements for the most recent fiscal year that were attributed to work performed by persons other than the principal accountant’s full-time, permanent employees was zero percent (0%).
(g) All non-audit fees billed by the registrant’s principal accountant for services rendered to the registrant for the fiscal years ended September 30, 2024 and 2023 respectively are disclosed in (b)-(d) above. There were no audit or non-audit services performed by the registrant’s principal accountant for the registrant’s adviser.
(h) Not applicable.
(i) Not applicable.
(j) Not applicable.
Item 5. Audit Committee of Listed Registrants. Not applicable.
Item 6. Investments. The Registrant’s schedule of investments in unaffiliated issuers is included in the Financial Statements under Item 7 of this form.
Item 7. Financial Statements and Financial Highlights for Open-End Management Investment Companies.

Pinnacle Multi-Strategy Core Fund
Class A Shares (APSHX)
Class C Shares (CPSHX)
Class I Shares (IPSHX)
Annual Financial Statements
September 30, 2024
| PINNACLE MULTI-STRATEGY CORE FUND |
| SCHEDULE OF INVESTMENTS |
| September 30, 2024 |
| |
| Shares | | | | | Fair Value | |
| | | | | EXCHANGE-TRADED FUNDS — 78.0% | | | | |
| | | | | EQUITY - 78.0% | | | | |
| | 9,045 | | | First Trust Capital Strength ETF | | $ | 821,286 | |
| | 9,885 | | | First Trust Morningstar Dividend Leaders Index | | | 414,676 | |
| | 6,890 | | | First Trust NASDAQ Cybersecurity ETF | | | 408,095 | |
| | 9,055 | | | First Trust Value Line Dividend Index Fund | | | 411,912 | |
| | 2,845 | | | Health Care Select Sector SPDR Fund | | | 438,187 | |
| | 6,475 | | | Industrial Select Sector SPDR Fund | | | 876,974 | |
| | 7,665 | | | iShares Russell 2000 ETF | | | 1,693,122 | |
| | 11,595 | | | iShares U.S. Pharmaceuticals ETF | | | 818,723 | |
| | 4,490 | | | Materials Select Sector SPDR Fund | | | 432,746 | |
| | 367,565 | | | Pinnacle Focused Opportunities ETF(a) (b) | | | 10,757,561 | |
| | 19,705 | | | Real Estate Select Sector SPDR Fund | | | 880,222 | |
| | 3,980 | | | SPDR Dow Jones Industrial Average ETF Trust | | | 1,684,018 | |
| | 30,765 | | | SPDR Portfolio S&P 400 Mid Cap ETF | | | 1,682,230 | |
| | 20,230 | | | SPDR Portfolio S&P 500 Growth ETF | | | 1,677,876 | |
| | 31,950 | | | SPDR Portfolio S&P 500 Value ETF | | | 1,688,877 | |
| | 21,175 | | | SPDR S&P 400 Mid Cap Value ETF | | | 1,682,566 | |
| | 3,200 | | | SPDR S&P 500 ETF Trust | | | 1,836,032 | |
| | 18,195 | | | SPDR S&P 600 Small Cap Growth ETF | | | 1,694,136 | |
| | 19,535 | | | SPDR S&P 600 Small Cap Value ETF | | | 1,696,029 | |
| | 3,345 | | | SPDR S&P Homebuilders ETF | | | 416,653 | |
| | 7,260 | | | SPDR S&P Insurance ETF | | | 412,005 | |
| | 7,295 | | | SPDR S&P Regional Banking ETF | | | 412,897 | |
| | 1,920 | | | Technology Select Sector SPDR Fund | | | 433,459 | |
| | 10,945 | | | Utilities Select Sector SPDR Fund | | | 884,137 | |
| | | | | | | | 34,154,419 | |
| | | | | | | | | |
| | | | | TOTAL EXCHANGE-TRADED FUNDS (Cost $30,743,661) | | | 34,154,419 | |
| | | | | | | | | |
See Accompanying Notes to Financial Statements.
| PINNACLE MULTI-STRATEGY CORE FUND |
| SCHEDULE OF INVESTMENTS (Continued) |
| September 30, 2024 |
| |
| Shares | | | | | Fair Value | |
| | | | | SHORT-TERM INVESTMENTS — 22.0% | | | | |
| | | | | MONEY MARKET FUNDS - 22.0% | | | | |
| | 9,640,211 | | | First American Government Obligations Fund, Class X, 4.82% (Cost $9,640,211)(c) | | $ | 9,640,211 | |
| | | | | | | | | |
| | | | | TOTAL INVESTMENTS - 100.0% (Cost $40,383,872) | | $ | 43,794,630 | |
| | | | | OTHER ASSETS IN EXCESS OF LIABILITIES - 0.0% | | | 3,279 | |
| | | | | NET ASSETS - 100.0% | | $ | 43,797,909 | |
| ETF | - Exchange-Traded Fund |
| | |
| SPDR | - Standard & Poor’s Depositary Receipt |
| | |
| (a) | Non-income producing security |
| | |
| (b) | Affiliated security |
| | |
| (c) | Rate disclosed is the seven-day effective yield as of September 30, 2024. |
| | |
See Accompanying Notes to Financial Statements.
| Pinnacle Multi-Strategy Core Fund |
| STATEMENT OF ASSETS AND LIABILITIES |
| September 30, 2024 |
| |
| ASSETS | | | | |
| Investment Securities: | | | | |
| At cost (including affiliated security of $7,951,217) | | $ | 40,383,872 | |
| At value (including affiliated security of $10,757,561) | | | 43,794,630 | |
| Dividends and interest receivable | | | 33,813 | |
| Receivable for Fund shares sold | | | 200 | |
| Prepaid expenses and other assets | | | 23,660 | |
| TOTAL ASSETS | | | 43,852,303 | |
| | | | | |
| | | | | |
| LIABILITIES | | | | |
| Investment advisory fees payable | | | 20,629 | |
| Payable to related parties | | | 15,585 | |
| Distribution (12b-1) fees payable | | | 8,869 | |
| Trustee fees payable | | | 500 | |
| Accrued expenses and other liabilities | | | 8,811 | |
| TOTAL LIABILITIES | | | 54,394 | |
| NET ASSETS | | $ | 43,797,909 | |
| | | | | |
| Net Assets Consist Of: | | | | |
| Paid in capital | | $ | 40,754,330 | |
| Accumulated earnings | | | 3,043,579 | |
| NET ASSETS | | $ | 43,797,909 | |
| | | | | |
| Net Asset Value Per Share: | | | | |
| Class A Shares: | | | | |
| Net Assets | | $ | 7,289,320 | |
| Shares of beneficial interest outstanding ($0 par value, unlimited shares authorized) | | | 549,393 | |
| Net asset value (Net Assets ÷ Shares Outstanding) and redemption price per share (a) | | $ | 13.27 | |
| Maximum offering price per share (maximum sales charge of 5.75%) | | $ | 14.08 | |
| | | | | |
| Class C Shares: | | | | |
| Net Assets | | $ | 9,962,338 | |
| Shares of beneficial interest outstanding ($0 par value, unlimited shares authorized) | | | 805,013 | |
| Net asset value (Net Assets ÷ Shares Outstanding), offering price and redemption price per share (a) | | $ | 12.38 | |
| | | | | |
| Class I Shares: | | | | |
| Net Assets | | $ | 26,546,251 | |
| Shares of beneficial interest outstanding ($0 par value, unlimited shares authorized) | | | 1,964,252 | |
| Net asset value (Net Assets ÷ Shares Outstanding), offering price and redemption price per share (a) | | $ | 13.51 | |
| | | | | |
| (a) | Redemptions made within 60 days of purchase may be assessed a redemption fee of 1.00%. |
See Accompanying Notes to Financial Statements.
| Pinnacle Multi-Strategy Core Fund |
| STATEMENT OF OPERATIONS |
| For the Year Ended September 30, 2024 |
| |
| | | | | |
| INVESTMENT INCOME | | | | |
| Dividends (including income on affiliated security of $0) | | $ | 373,891 | |
| Interest | | | 201,815 | |
| TOTAL INVESTMENT INCOME | | | 575,706 | |
| | | | | |
| EXPENSES | | | | |
| Investment advisory fees | | | 413,034 | |
| Distribution (12b-1) fees: | | | | |
| Class A | | | 17,585 | |
| Class C | | | 97,182 | |
| Administrative services fees | | | 51,708 | |
| Registration fees | | | 51,631 | |
| Transfer agent fees | | | 46,764 | |
| Compliance officer fees | | | 23,999 | |
| Accounting services fees | | | 23,805 | |
| Printing and postage expenses | | | 20,288 | |
| Audit fees | | | 19,919 | |
| Legal fees | | | 19,422 | |
| Third party administrative servicing fees | | | 16,632 | |
| Trustees fees and expenses | | | 14,412 | |
| Custodian fees | | | 4,547 | |
| Insurance expense | | | 2,500 | |
| Other expenses | | | 4,502 | |
| TOTAL EXPENSES | | | 827,930 | |
| Less: Fees waived by the advisor for affiliated holding | | | (48,636 | ) |
| Less: Fees waived / expenses reimbursed by the advisor | | | (200,553 | ) |
| NET EXPENSES | | | 578,741 | |
| NET INVESTMENT LOSS | | | (3,035 | ) |
| | | | | |
| REALIZED AND UNREALIZED GAIN ON INVESTMENTS | | | | |
| Net realized gain from security transactions (including gain on affiliated security of $240,274) | | | 5,563,144 | |
| | | | 5,563,144 | |
| | | | | |
| Net change in unrealized appreciation on investments (including gain on affiliated security of $2,946,096) | | | 2,200,891 | |
| | | | | |
| NET REALIZED AND UNREALIZED GAIN ON INVESTMENTS | | | 7,764,035 | |
| | | | | |
| NET INCREASE IN NET ASSETS RESULTING FROM OPERATIONS | | $ | 7,761,000 | |
| | | | | |
See Accompanying Notes to Financial Statements.
| Pinnacle Multi-Strategy Core Fund |
| STATEMENTS OF CHANGES IN NET ASSETS |
| |
| | | Year Ended | | | Year Ended | |
| | | September 30, | | | September 30, | |
| | | 2024 | | | 2023 | |
| FROM OPERATIONS | | | | | | | | |
| Net investment income (loss) | | $ | (3,035 | ) | | $ | 89,013 | |
| Net realized gain from security transactions | | | 5,563,144 | | | | 1,305,725 | |
| Net change in unrealized appreciation on investments | | | 2,200,891 | | | | 1,230,557 | |
| Net increase in net assets resulting from operations | | | 7,761,000 | | | | 2,625,295 | |
| | | | | | | | | |
| FROM SHARES OF BENEFICIAL INTEREST | | | | | | | | |
| Proceeds from shares sold: | | | | | | | | |
| Class A | | | 224,730 | | | | 174,340 | |
| Class C | | | 109,385 | | | | 66,128 | |
| Class I | | | 9,718,937 | | | | 424,079 | |
| Payments for shares redeemed: | | | | | | | | |
| Class A | | | (989,324 | ) | | | (2,011,399 | ) |
| Class C | | | (1,140,840 | ) | | | (1,496,881 | ) |
| Class I | | | (2,953,291 | ) | | | (5,731,265 | ) |
| Redemption fee proceeds: | | | | | | | | |
| Class A | | | 118 | | | | 7 | |
| Class C | | | 163 | | | | 8 | |
| Class I | | | 383 | | | | 15 | |
| Net increase (decrease) in net assets resulting from shares of beneficial interest | | | 4,970,261 | | | | (8,574,968 | ) |
| | | | | | | | | |
| TOTAL INCREASE (DECREASE) IN NET ASSETS | | | 12,731,261 | | | | (5,949,673 | ) |
| | | | | | | | | |
| NET ASSETS | | | | | | | | |
| Beginning of Year | | | 31,066,648 | | | | 37,016,321 | |
| End of Year | | $ | 43,797,909 | | | $ | 31,066,648 | |
| | | | | | | | | |
See Accompanying Notes to Financial Statements.
| Pinnacle Multi-Strategy Core Fund |
| STATEMENTS OF CHANGES IN NET ASSETS (Continued) |
| |
| | | Year Ended | | | Year Ended | |
| | | September 30, | | | September 30, | |
| | | 2024 | | | 2023 | |
| SHARE ACTIVITY | | | | | | | | |
| Class A: | | | | | | | | |
| Shares Sold | | | 18,030 | | | | 16,754 | |
| Shares Redeemed | | | (81,728 | ) | | | (189,961 | ) |
| Net decrease in shares of beneficial interest outstanding | | | (63,698 | ) | | | (173,207 | ) |
| | | | | | | | | |
| Class C: | | | | | | | | |
| Shares Sold | | | 9,476 | | | | 6,718 | |
| Shares Redeemed | | | (100,694 | ) | | | (150,163 | ) |
| Net decrease in shares of beneficial interest outstanding | | | (91,218 | ) | | | (143,445 | ) |
| | | | | | | | | |
| Class I: | | | | | | | | |
| Shares Sold | | | 834,163 | | | | 37,423 | |
| Shares Redeemed | | | (230,949 | ) | | | (542,707 | ) |
| Net increase (decrease) in shares of beneficial interest outstanding | | | 603,214 | | | | (505,284 | ) |
| | | | | | | | | |
See Accompanying Notes to Financial Statements.
| Pinnacle Multi-Strategy Core Fund |
| FINANCIAL HIGHLIGHTS |
| |
Per Share Data and Ratios for a Share of Beneficial Interest Outstanding Throughout Each Year Presented
| | | Year Ended | | | Year Ended | | | Year Ended | | | Year Ended | | | Year Ended | |
| Class A | | September 30,2024 | | | September 30, 2023 | | | September 30, 2022 | | | September 30, 2021 | | | September 30, 2020 | |
| Net asset value, beginning of year | | $ | 10.95 | | | $ | 10.11 | | | $ | 13.48 | | | $ | 11.84 | | | $ | 10.36 | |
| | | | | | | | | | | | | | | | | | | | | |
| Activity from investment operations: | | | | | | | | | | | | | | | | | | | | |
| Net investment income (loss) (1) (5) | | | 0.01 | | | | 0.04 | | | | (0.04 | ) | | | (0.07 | ) | | | (0.05 | ) |
| Net realized and unrealized gain (loss) on investments | | | 2.31 | | | | 0.80 | | | | (1.31 | ) | | | 1.71 | | | | 1.58 | |
| Total from investment operations | | | 2.32 | | | | 0.84 | | | | (1.35 | ) | | | 1.64 | | | | 1.53 | |
| | | | | | | | | | | | | | | | | | | | | |
| Less distributions from: | | | | | | | | | | | | | | | | | | | | |
| Net investment income | | | — | | | | — | | | | — | | | | — | | | | (0.05 | ) |
| Net realized gains | | | — | | | | — | | | | (2.02 | ) | | | — | | | | — | |
| Total distributions | | | — | | | | — | | | | (2.02 | ) | | | — | | | | (0.05 | ) |
| Paid-in-Capital From Redemption Fees (1) (6) | | | 0.00 | | | | 0.00 | | | | 0.00 | | | | 0.00 | | | | 0.00 | |
| Net Asset Value, at end of year | | $ | 13.27 | | | $ | 10.95 | | | $ | 10.11 | | | $ | 13.48 | | | $ | 11.84 | |
| Total return (2) | | | 21.19 | % | | | 8.31 | % | | | (12.74 | )% | | | 13.85 | % (7) | | | 14.81 | % |
| Net assets, at end of year (000s) | | $ | 7,289 | | | $ | 6,711 | | | $ | 7,947 | | | $ | 11,864 | | | $ | 8,519 | |
| | | | | | | | | | | | | | | | | | | | | |
| Ratio of gross expenses to average net assets (3)(4) | | | 1.98 | % | | | 2.08 | % | | | 1.84 | % | | | 1.67 | % | | | 1.85 | % |
| Ratio of net expenses to average net assets (4) | | | 1.37 | % (8) | | | 1.49 | % | | | 1.49 | % | | | 1.49 | % | | | 1.49 | % |
| Ratio of net investment income (loss) to average net assets (4)(5) | | | 0.00 | % (8) | | | 0.36 | % | | | (0.33 | %) | | | (0.48 | %) | | | (0.42 | %) |
| Portfolio Turnover Rate | | | 424 | % | | | 512 | % | | | 1127 | % | | | 551 | % | | | 560 | % |
| | | | | | | | | | | | | | | | | | | | | |
| (1) | Per share amounts calculated using the average shares method, which more appropriately presents the per share data for the year. |
| (2) | Total returns shown are historical in nature and assume changes in share price, reinvestment of dividends and distributions, if any, and exclude the effect of applicable sales charges and redemption fees. Had the adviser not waived fees and/or reimbursed a portion of its expenses, total returns would have been lower. |
| (3) | Represents the ratio of expenses to average net assets absent fee waivers and/or expense reimbursements by the adviser. |
| (4) | Does not include the expenses of other investment companies in which the Fund invests. |
| (5) | Recognition of net investment income (loss) by the Fund is affected by the timing of declaration of dividends by the underlying investment companies in which the Fund invests. |
| (6) | Amount represents less than $0.01 per share. |
| (7) | Includes adjustments in accordance with accounting principles generally accepted in the United States and, consequently the net asset value for financial reporting purposes and the returns based upon those net asset values may differ from the net asset values and returns for shareholder transactions. |
| (8) | Includes fees waived by the advisor for affiliated holding. The impact of the affiliated holding waiver is 0.12%. |
See Accompanying Notes to Financial Statements.
| Pinnacle Multi-Strategy Core Fund |
| FINANCIAL HIGHLIGHTS |
| |
Per Share Data and Ratios for a Share of Beneficial Interest Outstanding Throughout Each Year Presented
| | | Year Ended | | | Year Ended | | | Year Ended | | | Year Ended | | | Year Ended | |
| Class C | | September 30, 2024 | | | September 30, 2023 | | | September 30, 2022 | | | September 30, 2021 | | | September 30, 2020 | |
| Net asset value, beginning of year | | $ | 10.29 | | | $ | 9.57 | | | $ | 12.95 | | | $ | 11.46 | | | $ | 10.06 | |
| | | | | | | | | | | | | | | | | | | | | |
| Activity from investment operations: | | | | | | | | | | | | | | | | | | | | |
| Net investment loss (1) (5) | | | (0.09 | ) | | | (0.04 | ) | | | (0.12 | ) | | | (0.16 | ) | | | (0.11 | ) |
| Net realized and unrealized gain (loss) on investments | | | 2.18 | | | | 0.76 | | | | (1.24 | ) | | | 1.65 | | | | 1.51 | |
| Total from investment operations | | | 2.09 | | | | 0.72 | | | | (1.36 | ) | | | 1.49 | | | | 1.40 | |
| | | | | | | | | | | | | | | | | | | | | |
| Less distributions from: | | | | | | | | | | | | | | | | | | | | |
| Net realized gains | | | — | | | | — | | | | (2.02 | ) | | | — | | | | — | |
| Total distributions | | | — | | | | — | | | | (2.02 | ) | | | — | | | | — | |
| Paid-in-Capital From Redemption Fees (1) (6) | | | 0.00 | | | | 0.00 | | | | 0.00 | | | | 0.00 | | | | 0.00 | |
| Net Asset Value, at end of year | | $ | 12.38 | | | $ | 10.29 | | | $ | 9.57 | | | $ | 12.95 | | | $ | 11.46 | |
| Total return (2) | | | 20.31 | % | | | 7.52 | % | | | (13.42 | )% | | | 13.00 | % (7) | | | 13.92 | % |
| Net assets, at end of year (000s) | | $ | 9,962 | | | $ | 9,219 | | | $ | 9,951 | | | $ | 13,781 | | | $ | 11,637 | |
| | | | | | | | | | | | | | | | | | | | | |
| Ratio of gross expenses to average net assets (3)(4) | | | 2.73 | % | | | 2.83 | % | | | 2.60 | % | | | 2.42 | % | | | 2.60 | % |
| Ratio of net expenses to average net assets (4) | | | 2.12 | % (8) | | | 2.24 | % | | | 2.24 | % | | | 2.24 | % | | | 2.24 | % |
| Ratio of net investment loss to average net assets (4)(5) | | | (0.75 | %) (8) | | | (0.42 | %) | | | (1.08 | %) | | | (1.24 | )% | | | (1.05 | )% |
| Portfolio Turnover Rate | | | 424 | % | | | 512 | % | | | 1127 | % | | | 551 | % | | | 560 | % |
| | | | | | | | | | | | | | | | | | | | | |
| (1) | Per share amounts calculated using the average shares method, which more appropriately presents the per share data for the year. |
| (2) | Total returns shown are historical in nature and assume changes in share price, reinvestment of dividends and distributions, if any, and exclude the effect of applicable sales charges and redemption fees. Had the adviser not waived fees and/or reimbursed a portion of its expenses, total returns would have been lower. |
| (3) | Represents the ratio of expenses to average net assets absent fee waivers and/or expense reimbursements by the adviser. |
| (4) | Does not include the expenses of other investment companies in which the Fund invests. |
| (5) | Recognition of net investment loss by the Fund is affected by the timing of declaration of dividends by the underlying investment companies in which the Fund invests. |
| (6) | Amount represents less than $0.01 per share. |
| (7) | Includes adjustments in accordance with accounting principles generally accepted in the United States and, consequently the net asset value for financial reporting purposes and the returns based upon those net asset values may differ from the net asset values and returns for shareholder transactions. |
| (8) | Includes fees waived by the advisor for affiliated holding. The impact of the affiliated holding waiver is 0.12%. |
See Accompanying Notes to Financial Statements.
| Pinnacle Multi-Strategy Core Fund |
| FINANCIAL HIGHLIGHTS |
| |
Per Share Data and Ratios for a Share of Beneficial Interest Outstanding Throughout Each Year Presented
| | | Year Ended | | | Year Ended | | | Year Ended | | | Year Ended | | | Year Ended | |
| Class I | | September 30, 2024 | | | September 30, 2023 | | | September 30, 2022 | | | September 30, 2021 | | | September 30, 2020 | |
| Net asset value, beginning of year | | $ | 11.12 | | | $ | 10.24 | | | $ | 13.60 | | | $ | 11.92 | | | $ | 10.45 | |
| | | | | | | | | | | | | | | | | | | | | |
| Activity from investment operations: | | | | | | | | | | | | | | | | | | | | |
| Net investment income (loss) (1) (5) | | | 0.04 | | | | 0.07 | | | | (0.01 | ) | | | (0.03 | ) | | | (0.02 | ) |
| Net realized and unrealized gain (loss) on investments | | | 2.35 | | | | 0.81 | | | | (1.33 | ) | | | 1.71 | | | | 1.59 | |
| Total from investment operations | | | 2.39 | | | | 0.88 | | | | (1.34 | ) | | | 1.68 | | | | 1.57 | |
| | | | | | | | | | | | | | | | | | | | | |
| Less distributions from: | | | | | | | | | | | | | | | | | | | | |
| Net investment income | | | — | | | | — | | | | — | | | | — | | | | (0.10 | ) |
| Net realized gains | | | — | | | | — | | | | (2.02 | ) | | | — | | | | — | |
| Total distributions | | | — | | | | — | | | | (2.02 | ) | | | — | | | | (0.10 | ) |
| Paid-in-Capital From Redemption Fees (1)(6) | | | 0.00 | | | | 0.00 | | | | 0.00 | | | | 0.00 | | | | 0.00 | |
| Net Asset Value, at end of year | | $ | 13.51 | | | $ | 11.12 | | | $ | 10.24 | | | $ | 13.60 | | | $ | 11.92 | |
| Total return (2) | | | 21.49 | % | | | 8.59 | % | | | (12.55 | )% | | | 14.09 | % (7) | | | 15.10 | % |
| Net assets, at end of year (000s) | | $ | 26,546 | | | $ | 15,137 | | | $ | 19,118 | | | $ | 40,798 | | | $ | 35,793 | |
| | | | | | | | | | | | | | | | | | | | | |
| Ratio of gross expenses to average net assets (3)(4) | | | 1.72 | % | | | 1.83 | % | | | 1.56 | % | | | 1.42 | % | | | 1.60 | % |
| Ratio of net expenses to average net assets (4) | | | 1.12 | % (8) | | | 1.24 | % | | | 1.24 | % | | | 1.24 | % | | | 1.24 | % |
| Ratio of net investment income (loss) to average net assets (4)(5) | | | 0.28 | % (8) | | | 0.62 | % | | | (0.12 | %) | | | (0.24 | )% | | | (0.17 | )% |
| Portfolio Turnover Rate | | | 424 | % | | | 512 | % | | | 1127 | % | | | 551 | % | | | 560 | % |
| | | | | | | | | | | | | | | | | | | | | |
| (1) | Per share amounts calculated using the average shares method, which more appropriately presents the per share data for the year. |
| (2) | Total returns shown are historical in nature and assume changes in share price, reinvestment of dividends and distributions, if any, and exclude the effect of applicable sales charges and redemption fees. Had the adviser not waived fees and/or reimbursed a portion of its expenses, total returns would have been lower. |
| (3) | Represents the ratio of expenses to average net assets absent fee waivers and/or expense reimbursements by the adviser. |
| (4) | Does not include the expenses of other investment companies in which the Fund invests. |
| (5) | Recognition of net investment income (loss) by the Fund is affected by the timing of declaration of dividends by the underlying investment companies in which the Fund invests. |
| (6) | Amount represents less than $0.01 per share. |
| (7) | Includes adjustments in accordance with accounting principles generally accepted in the United States and, consequently the net asset value for financial reporting purposes and the returns based upon those net asset values may differ from the net asset values and returns for shareholder transactions. |
| (8) | Includes fees waived by the advisor for affiliated holding. The impact of the affiliated holding waiver is 0.12%. |
See Accompanying Notes to Financial Statements.
PINNACLE MULTI-STRATEGY CORE FUND |
| NOTES TO FINANCIAL STATEMENTS |
| September 30, 2024 |
| |
The Pinnacle Multi-Strategy Core Fund (“Fund”) is a series of shares of beneficial interest of Northern Lights Fund Trust III (the “Trust”), a Delaware statutory trust organized on December 5, 2011. The Fund is a diversified series of the Trust. The Fund is registered under the Investment Company Act of 1940, as amended (the “1940 Act”), as an open-end management investment company. The investment objective of the Fund is to seek high total return with reasonable risk. The Fund commenced operations on October 1, 2015. The Fund is a “fund of funds” in that the Fund will generally invest in other investment companies.
The Fund currently offers Class A, Class C and Class I shares. Class C and Class I shares are offered at net asset value (“NAV”). Class A shares are offered at NAV plus a maximum sales charge of 5.75%. Each class represents an interest in the same assets of the Fund and classes are identical except for differences in their sales charge structures and ongoing service and distribution charges. All classes of shares have equal voting privileges except that each class has exclusive voting rights with respect to its service and/or distribution plans. The Fund’s income, expenses (other than class specific distribution fees) and realized and unrealized gains and losses are allocated proportionately each day based upon the relative net assets of each class.
| 2. | SIGNIFICANT ACCOUNTING POLICIES |
The following is a summary of significant accounting policies followed by the Fund in preparation of its financial statements. These policies are in conformity with accounting principles generally accepted in the United States of America (“GAAP”). The preparation of financial statements in conformity with GAAP requires management to make estimates and assumptions that affect the reported amounts of assets and liabilities and disclosure of contingent assets and liabilities at the date of the financial statements and the reported amounts of income and expenses for the year. Actual results could differ from those estimates. The Fund is an investment company and accordingly follows the investment company accounting and reporting guidance of the Financial Accounting Standards Board Accounting Standards Codification Topic 946 “Financial Services – Investment Companies”, including Accounting Standards Update 2013-08.
Securities Valuation – Securities listed on an exchange are valued at the last reported sale price at the close of the regular trading session of the primary exchange on the business day the value is being determined or, in the case of securities listed on NASDAQ, at the NASDAQ Official Closing Price. In the absence of a sale, such securities shall be valued at the mean between the current bid and ask prices on the day of valuation. Short-term debt obligations having 60 days or less remaining until maturity, at time of purchase, may be valued at amortized cost.
The Fund may hold investments, such as private investments, interests in commodity pools, other non-traded securities or temporarily illiquid securities, for which market quotations are not readily available or are determined to be unreliable. These investments will be valued using the “fair value” procedures approved by the Board. The Board has delegated execution of these procedures to the adviser as its valuation designee (the “Valuation Designee”). The Board may also enlist third party consultants such
| PINNACLE MULTI-STRATEGY CORE FUND |
| NOTES TO FINANCIAL STATEMENTS (Continued) |
| September 30, 2024 |
| |
a valuation specialist at a public accounting firm, valuation consultant or financial officer of a security issuer on an as-needed basis to assist the Valuation Designee in determining a security-specific fair value. The Board is responsible for reviewing and approving fair value methodologies utilized by the Valuation Designee, which approval shall be based upon whether the Valuation Designee followed the valuation procedures established by the Board.
Fair Valuation Process – Applicable investments are valued by the Valuation Designee pursuant to valuation procedures established by the Board. For example, fair value determinations are required for the following securities: (i) securities for which market quotations are insufficient or not readily available on a particular business day (including securities for which there is a short and temporary lapse in the provision of a price by the regular pricing source); (ii) securities for which, in the judgment of the Valuation Designee, the prices or values available do not represent the fair value of the instrument; factors which may cause the Valuation Designee to make such a judgment include, but are not limited to, the following: only a bid price or an asked price is available; the spread between bid and asked prices is substantial; the frequency of sales; the thinness of the market; the size of reported trades; and actions of the securities markets, such as the suspension or limitation of trading; (iii) securities determined to be illiquid; and (iv) securities with respect to which an event that will affect the value thereof has occurred (a “significant event”) since the closing prices were established on the principal exchange on which they are traded, but prior to the Fund’s calculation of its net asset value. Specifically, interests in commodity pools or managed futures pools are valued on a daily basis by reference to the closing market prices of each futures contract or other asset held by a pool, as adjusted for pool expenses. Restricted or illiquid investments, such as private investments or non-traded securities are valued based upon the current bid for the security from two or more independent dealers or other parties reasonably familiar with the facts and circumstances of the security (who should take into consideration all relevant factors as may be appropriate under the circumstances). If a current bid from such independent dealers or other independent parties is unavailable, the Valuation Designee shall determine, the fair value of such security using the following factors: (i) the type of security; (ii) the cost at date of purchase; (iii) the size and nature of the Fund’s holdings; (iv) the discount from market value of unrestricted securities of the same class at the time of purchase and subsequent thereto; (v) information as to any transactions or offers with respect to the security; (vi) the nature and duration of restrictions on disposition of the security and the existence of any registration rights; (vii) how the yield of the security compares to similar securities of companies of similar or equal creditworthiness; (viii) the level of recent trades of similar or comparable securities; (ix) the liquidity characteristics of the security; (x) current market conditions; and (xi) the market value of any securities into which the security is convertible or exchangeable.
Cash and Cash Equivalents – Cash and cash equivalents includes cash and overnight investments in interest-bearing demand deposits with a financial institution with original maturities of three months or less. The assets of the Fund may be placed in deposit accounts at U.S. banks and such deposits generally exceed Federal Deposit Insurance Corporation (“FDIC”) insurance limits. The FDIC insures deposit accounts up to $250,000 for each accountholder. The counterparty is generally a single bank or other financial institution, rather than a group of financial institutions; thus there may be a greater counterparty credit risk. The Fund places deposits only with those counterparties which are believed to be creditworthy.
| PINNACLE MULTI-STRATEGY CORE FUND |
| NOTES TO FINANCIAL STATEMENTS (Continued) |
| September 30, 2024 |
| |
Valuation of Underlying Funds – The Fund may invest in portfolios of open-end or closed-end investment companies (the “underlying funds”). Underlying funds are valued at their respective NAVs as reported by such investment companies. The underlying funds value securities in their portfolios for which market quotations are readily available at their market values (generally the last reported sale price) and all other securities and assets at their fair value by the methods established by the board of trustees of the underlying funds. The shares of many closed-end investment companies, after their initial public offering, frequently trade at a price per share, which is different than the NAV per share. The difference represents a market premium or market discount of such shares. There can be no assurances that the market discount or market premium on shares of any closed-end investment company purchased by the Fund will not change.
The Fund utilizes various methods to measure the fair value of all their investments on a recurring basis. GAAP establishes a hierarchy that prioritizes inputs to valuation methods. The three levels of inputs are:
Level 1 – Unadjusted quoted prices in active markets for identical assets and liabilities that the Fund has the ability to access.
Level 2 – Observable inputs other than quoted prices included in Level 1 that are observable for the asset or liability, either directly or indirectly. These inputs may include quoted prices for the identical instrument in an inactive market, prices for similar instruments, interest rates, prepayment speeds, credit risk, yield curves, default rates and similar data.
Level 3 – Unobservable inputs for the asset or liability, to the extent relevant observable inputs are not available, representing the Fund’s own assumptions about the assumptions a market participant would use in valuing the asset or liability, and would be based on the best information available.
The availability of observable inputs can vary from security to security and is affected by a wide variety of factors, including, for example, the type of security, whether the security is new and not yet established in the marketplace, the liquidity of markets, and other characteristics particular to the security. To the extent that valuation is based on models or inputs that are less observable or unobservable in the market, the determination of fair value requires more judgment. Accordingly, the degree of judgment exercised in determining fair value is greatest for instruments categorized in Level 3.
The inputs used to measure fair value may fall into different levels of the fair value hierarchy. In such cases, for disclosure purposes, the level in the fair value hierarchy within which the fair value measurement falls in its entirety, is determined based on the lowest level input that is significant to the fair value measurement in its entirety.
| PINNACLE MULTI-STRATEGY CORE FUND |
| NOTES TO FINANCIAL STATEMENTS (Continued) |
| September 30, 2024 |
| |
The inputs or methodology used for valuing securities are not necessarily an indication of the risk associated with investing in those securities. The following tables summarize the inputs used as of September 30, 2024 for the Fund’s investments measured at fair value:
Pinnacle Multi-Strategy Core Fund
| Assets * | | Level 1 | | | Level 2 | | | Level 3 | | | Total | |
| Exchange Traded Funds - Equity | | $ | 34,154,419 | | | $ | — | | | $ | — | | | $ | 34,154,419 | |
| Short-Term Investments | | | 9,640,211 | | | | — | | | | — | | | | 9,640,211 | |
| Total | | $ | 43,794,630 | | | $ | — | | | $ | — | | | $ | 43,794,630 | |
The Fund did not hold any Level 3 securities during the year.
| * | Refer to the Schedule of Investments for classification by asset class. |
Security Transactions and Related Income – Investment security transactions are accounted for on a trade date basis. Cost is determined and gains and losses are based upon the specific identification method for both financial statement and federal income tax purposes. Dividend income is recorded on the ex-dividend date and interest income is recorded on an accrual basis. Purchase discounts and premiums on securities are accreted and amortized over the life of the respective securities using the effective interest method.
Dividends and Distributions to Shareholders – Dividends from net investment income, if any, are declared and paid annually. Distributable net realized capital gains, if any, are declared and distributed annually. Dividends from net investment income and distributions from net realized gains are determined in accordance with federal income tax regulations, which may differ from GAAP. These “book/tax” differences are considered either temporary (e.g., deferred losses) or permanent in nature. To the extent these differences are permanent in nature, such amounts are reclassified within the composition of net assets based on their federal tax-basis treatment; temporary differences do not require reclassification. Any such reclassifications will have no effect on net assets, results from operations, or net asset value per share of the Fund. Dividends and distributions to shareholders are recorded on the ex-dividend date.
Federal Income Taxes – The Fund complies with the requirements of the Internal Revenue Code applicable to regulated investment companies and to distribute all of its taxable income to its shareholders. Therefore, no provision for federal income tax is required. The Fund recognizes the tax benefits of uncertain tax positions only where the position is “more likely than not” to be sustained assuming examination by tax authorities. Management has analyzed the Fund’s tax positions and has concluded that no liability for unrecognized tax benefits should be recorded related to uncertain tax positions for the years ended September 30, 2021 through September 30, 2023 or expected to be taken in the Fund’s September 30, 2024 year-end tax returns. The Fund identifies its major tax jurisdictions as U.S. federal, Ohio and foreign jurisdictions where a Fund makes significant investments; however, the Fund is not aware of any tax positions for which it is reasonably possible that the total amounts of unrecognized tax benefits will change materially in the next twelve months.
The Fund recognizes interest and penalties, if any, related to unrecognized tax benefits as income tax expense in the Statement of Operations. During the year, the Fund did not incur any interest or penalties.
Exchange Traded Funds – The Fund may invest in exchange traded funds (“ETFs”). ETFs are a type of fund bought and sold on a securities exchange. An ETF trades like common stock and may be
| PINNACLE MULTI-STRATEGY CORE FUND |
| NOTES TO FINANCIAL STATEMENTS (Continued) |
| September 30, 2024 |
| |
actively managed or represent a fixed portfolio of securities. The risks of owning an ETF generally reflect the risks of owning the underlying securities in which they invest, although the lack of liquidity on an ETF could result in it being more volatile. Additionally, ETFs have fees and expenses that reduce their value.
Expenses – Expenses of the Trust that are directly identifiable to a specific fund are charged to that fund. Expenses, which are not readily identifiable to a specific fund, are allocated in such a manner as deemed equitable (as determined by the Board), taking into consideration the nature and type of expense and the relative sizes of the funds in the Trust.
Indemnification – The Trust indemnifies its officers and trustees for certain liabilities that may arise from the performance of their duties to the Trust. Additionally, in the normal course of business, the Fund enters into contracts that contain a variety of representations and warranties and which provide general indemnities. The Fund’s maximum exposure under these arrangements is unknown, as this would involve future claims that may be made against the Fund that have not yet occurred. However, based on experience, the risk of loss due to these warranties and indemnities appears to be remote.
| 3. | INVESTMENT TRANSACTIONS |
For the year ended September 30, 2024 cost of purchases and proceeds from sales of portfolio securities, other than short-term investments and U.S. government securities, amounted to the following:
| Fund | | Purchases | | | Sales | |
| Pinnacle Multi-Strategy Core Fund | | $ | 161,228,444 | | | $ | 165,516,114 | |
| | | | | | | | | |
The Fund may assess a short-term redemption fee of 1.00% of the total redemption amount if a shareholder sells their shares after holding them for less than 60 days. The redemption fee is paid directly to the Fund. For the year ended September 30, 2024, the redemption fees paid to the Fund were as follows:
| 5. | INVESTMENT ADVISORY AGREEMENT AND TRANSACTIONS WITH RELATED PARTIES |
Pinnacle Family Advisors, LLC serves as the Fund’s investment adviser (the “Adviser”).
| PINNACLE MULTI-STRATEGY CORE FUND |
| NOTES TO FINANCIAL STATEMENTS (Continued) |
| September 30, 2024 |
| |
Pursuant to an advisory agreement with the Trust on behalf of the Fund, the Adviser, under the oversight of the Board, directs the daily operations of the Fund and supervises the performance of administrative and professional services provided by others. As compensation for its services and the related expenses borne by the Adviser, the Fund pays the Adviser a management fee, computed and accrued daily and paid monthly, at an annual rate of 1.00% of the average daily net assets of the Fund, paid monthly. For the year ended September 30, 2024, the Fund incurred $413,034 in advisory fees.
Pursuant to Rule 12d1-4, the Fund invested a portion of its assets in the Pinnacle Focused Opportunities ETF (“FCUS”). The Adviser has agreed to waive its net advisory fee (after expense limitation agreement waiver) on the portion of the Fund’s assets that are invested in FCUS. For the year ended September 30, 2024, the Fund waived $48,636 in advisory fees pursuant to this agreement.
Pursuant to a written contract (the “Waiver Agreement”), the Adviser has agreed, at least until August 1, 2025, to waive a portion of its advisory fees and reimburse the Fund for other expenses to the extent necessary so that the total expenses incurred by the Fund (excluding front-end or contingent deferred loads, brokerage fees and commissions, acquired fund fees and expenses, borrowing costs such as interest and dividend expenses on securities sold short, taxes, or extraordinary expenses, such as litigation, not incurred in the ordinary course of the Fund’s business) do not exceed 1.49% per annum of Class A average daily net assets, 2.24% per annum for Class C average daily net assets, and 1.24% per annum for Class I average daily net assets for the Fund (the “expense limitation”).
If the Adviser waives any fee or reimburses any expense pursuant to the Waiver Agreement, and the Fund’s operating expenses attributable to Class A, Class C and Class I shares are subsequently less than the expense limitation, the Adviser shall be entitled to reimbursement by the Fund for such waived fees or reimbursed expenses provided that such reimbursement does not cause the Fund’s expenses to exceed the lesser of the expense limitation in place at the time of the waiver or at the time of the reimbursement. If the operating expenses attributable to the Class A, Class C and Class I shares subsequently exceed the expense limitation then in place or in place at time of waiver, the reimbursements shall be suspended. The Adviser may seek recoupment only for expenses waived or paid by it during the three years prior to such reimbursement; provided, however, that such expenses may only be reimbursed to the extent they were waived or paid after the date of the Waiver Agreement (or any similar agreement). The Board may terminate this expense reimbursement arrangement only on 60 days’ notice to the Adviser. For the year ended September 30, 2024, the Adviser waived and/or reimbursed $200,553 for the Fund in advisory fees or expenses pursuant to the Waiver Agreement.
As of September 30, 2024, the following amounts are subject to recapture by the Adviser by September 30 of the following years:
| 2025 | | | 2026 | | | 2027 | |
| $ | 175,049 | | | $ | 200,003 | | | $ | 200,553 | |
| | | | | | | | | | | |
Distributor – The Trust, on behalf of the Fund, has adopted the Trust’s Class A and Class C Master Distribution and Shareholder Servicing Plans (the “Plans”) pursuant to Rule 12b-1 under the 1940 Act.
| PINNACLE MULTI-STRATEGY CORE FUND |
| NOTES TO FINANCIAL STATEMENTS (Continued) |
| September 30, 2024 |
| |
The Plans provide that a monthly service and/or distribution fee is calculated by the Fund up to an annual rate of 0.25% and 1.00% of the average daily net assets attributable to Class A shares and Class C shares, respectively, and is paid to Northern Lights Distributors, LLC (the “Distributor”), to provide compensation for ongoing distribution-related activities or services and/or maintenance of the Fund’s shareholder accounts, not otherwise required to be provided by the Adviser. Pursuant to the Plans, the Fund incurred distribution fees during the year ended September 30, 2024 as follows:
| Class A | | | Class C | |
| $ | 17,585 | | | $ | 97,182 | |
| | | | | | | |
The Distributor acts as the Fund’s principal underwriter in a continuous public offering of the Fund’s shares. For the year ended September 30, 2024, the Distributor received $9,588 from front-end sales charge of which $1,282 was retained by the principal underwriter or other affiliated broker-dealers for the Fund’s Class A shares.
In addition, certain affiliates of the Distributor provide services to the Fund as follows:
Ultimus Fund Solutions, LLC (“UFS”) – UFS, an affiliate of the Distributor, provides administration, fund accounting, and transfer agent services to the Trust. Pursuant to separate servicing agreements with UFS, the Fund pays UFS customary fees for providing administration, fund accounting and transfer agency services to each Fund. Certain officers of the Trust are also officers of UFS, and are not paid any fees directly by the Fund for serving in such capacities.
Northern Lights Compliance Services, LLC (“NLCS”) – NLCS, an affiliate of UFS and the Distributor, provides a Chief Compliance Officer to the Trust, as well as related compliance services, pursuant to a consulting agreement between NLCS and the Trust. Under the terms of such agreement, NLCS receives customary fees from the Fund.
Blu Giant LLC (“Blu Giant”) – Blu Giant, an affiliate of UFS and the Distributor, provides EDGAR conversion and filing services as well as print management services for the Fund on an ad-hoc basis. For the provision of these services, Blu Giant receives customary fees from the Fund.
| PINNACLE MULTI-STRATEGY CORE FUND |
| NOTES TO FINANCIAL STATEMENTS (Continued) |
| September 30, 2024 |
| |
| 6. | INVESTMENT IN AFFILIATED COMPANY |
An affiliated company is a company in which the Fund has ownership of at least 5% of the voting securities or are affiliated through common management. The company which is an affiliate of the Fund as of September 30, 2024 is noted in the Fund’s Schedule of Investments. Transactions with the affiliated company during the year ended September 30, 2024 were as follows:
| | | Value - Beginning | | | | | | | | | | | | Change in | | | Dividend | | | Value - End of | | | | |
| Affiliated Holding | | of Year | | | Purchases | | | Sales Proceeds | | | Realized Gain | | | Unrealized Gain | | | Income | | | Year | | | Ending Shares | |
| Pinnacle Focused Opportunities ETF | | $ | 7,398,408 | | | $ | 2,565,877 | | | $ | (2,393,094 | ) | | $ | 240,274 | | | $ | 2,946,096 | | | $ | — | | | $ | 10,757,561 | | | | 367,565 | |
| | | | | | | | | | | | | | | | | | | | | | | | | | | | | | | | | |
The beneficial ownership, either directly or indirectly, of more than 25% of the voting securities of a fund creates a presumption of control of the fund, under Section 2(a)(9) of the 1940 Act. Persons controlling the Fund can determine the outcome of any proposal submitted to the shareholders for approval, including changes to the Fund’s fundamental policies or the terms of the advisory agreement with the Adviser. As of September 30, 2024, the following held in excess of 25% of the voting securities of the Fund listed, for the sole benefit of customers and may be deemed to control the Fund:
| | | Percentage of Voting Securities as of |
| Shareholder | | September 30, 2024 |
| LPL Financial | | 45.0% |
| | | |
| 8. | AGGREGATE UNREALIZED APPRECIATION AND DEPRECIATION – TAX BASIS |
The identified cost of investments in securities owned by the Fund for federal income tax purposes and its respective gross unrealized appreciation and depreciation at September 30, 2024, were as follows:
| | | | Gross Unrealized | | | Gross Unrealized | | | Net Unrealized | |
| Tax Cost | | | Appreciation | | | (Depreciation) | | | Appreciation | |
| $ | 40,665,115 | | | $ | 3,437,257 | | | $ | (307,742 | ) | | $ | 3,129,515 | |
| | | | | | | | | | | | | | | |
| 9. | DISTRIBUTIONS TO SHAREHOLDERS AND TAX COMPONENTS OF CAPITAL |
As of September 30, 2024, the components of accumulated earnings/ (deficit) on a tax basis were as follows:
| Undistributed | | | Undistributed | | | Post October Loss | | | Capital Loss | | | Other | | | Unrealized | | | | |
| Ordinary | | | Long-Term | | | and | | | Carry | | | Book/Tax | | | Appreciation/ | | | Accumulated | |
| Income | | | Gains | | | Late Year Loss | | | Forwards | | | Differences | | | (Depreciation) | | | Earnings | |
| $ | 205,700 | | | $ | 689,934 | | | $ | (15,506 | ) | | $ | (966,064 | ) | | $ | — | | | $ | 3,129,515 | | | $ | 3,043,579 | |
| PINNACLE MULTI-STRATEGY CORE FUND |
| NOTES TO FINANCIAL STATEMENTS (Continued) |
| September 30, 2024 |
| |
The difference between book basis and tax basis accumulated net realized losses, and unrealized depreciation from investments is primarily attributable to the tax deferral of losses on wash sales.
Late year losses incurred after December 31 within the fiscal year are deemed to arise on the first business day of the following fiscal year for tax purposes. The Fund incurred and elected to defer such late year losses of $15,506.
During the fiscal year ended September 30, 2024, the Fund utilized capital loss carryforwards to offset current year capital gains of $4,931,037. As a result of the acquisition of another Fund during the fiscal year ended September 30, 2020, the Pinnacle Sherman Multi-Strategy Core Fund acquired short-term capital loss carryover, of which, at September 30, 2024, $966,064 is available to offset future capital gains, subject to an annual limitation of $141,535 under the tax rules.
Subsequent events after the date of the Statement of Assets and Liabilities have been evaluated through the date the financial statements were issued. Management has determined that no events or transactions occurred requiring adjustment or disclosure in the financial statements.

REPORT OF INDEPENDENT REGISTERED PUBLIC ACCOUNTING FIRM
To the Shareholders of Pinnacle Multi-Strategy Core Fund and Board of Trustees of
Northern Lights Fund Trust III
Opinion on the Financial Statements
We have audited the accompanying statement of assets and liabilities, including the schedule of investments, of Pinnacle Multi-Strategy Core Fund (the “Fund”), a series of Northern Lights Fund Trust III, as of September 30, 2024, the related statement of operations for the year then ended, the statements of changes in net assets for each of the two years in the period then ended, the financial highlights for each of the five years in the period then ended, and the related notes (collectively referred to as the “financial statements”). In our opinion, the financial statements present fairly, in all material respects, the financial position of the Fund as of September 30, 2024, the results of its operations for the year then ended, the changes in net assets for each of the two years in the period then ended, and the financial highlights for each of the five years in the period then ended, in conformity with accounting principles generally accepted in the United States of America.
Basis for Opinion
These financial statements are the responsibility of the Fund’s management. Our responsibility is to express an opinion on the Fund’s financial statements based on our audits. We are a public accounting firm registered with the Public Company Accounting Oversight Board (United States) (“PCAOB”) and are required to be independent with respect to the Fund in accordance with the U.S. federal securities laws and the applicable rules and regulations of the Securities and Exchange Commission and the PCAOB.
We conducted our audits in accordance with the standards of the PCAOB. Those standards require that we plan and perform the audit to obtain reasonable assurance about whether the financial statements are free of material misstatement whether due to error or fraud.
Our audits included performing procedures to assess the risks of material misstatement of the financial statements, whether due to error or fraud, and performing procedures that respond to those risks. Such procedures included examining, on a test basis, evidence regarding the amounts and disclosures in the financial statements. Our procedures included confirmation of securities owned as of September 30, 2024, by correspondence with the custodian. Our audits also included evaluating the accounting principles used and significant estimates made by management, as well as evaluating the overall presentation of the financial statements. We believe that our audits provide a reasonable basis for our opinion.
We have served as the auditors of one or more investment companies advised by Pinnacle Family Advisors, LLC since 2013.

COHEN & COMPANY, LTD.
Philadelphia, Pennsylvania
November 27, 2024
COHEN & COMPANY, LTD.
800.229.1099 | 866.818.4538 fax | cohencpa.com
Registered with the Public Company Accounting Oversight Board
| PINNACLE MULTI-STRATEGY CORE FUND |
| SUPPLEMENTAL INFORMATION (Unaudited) |
| September 30, 2024 |
| |
Renewal of Advisory Agreement*
In connection with a meeting held on May 29 & 31, 2024, the Board, including a majority of the Trustees who are not “interested persons,” as that term is defined in the Investment Company Act of 1940, as amended, discussed the renewal of the investment advisory agreement (the “Advisory Agreement”) between Pinnacle Family Advisers, LLC (the “Adviser”) and the Trust, with respect to the Pinnacle Multi-Strategy Core Fund (“Pinnacle”). In considering the renewal of the Advisory Agreement, the Board received materials specifically relating to Pinnacle and the Advisory Agreement.
The Board relied upon the advice of independent legal counsel and its own business judgment in determining the material factors to be considered in evaluating the Advisory Agreement and the weight to be given to each such factor. The Board’s conclusions were based on an evaluation of all of the information provided and were not the result of any one factor. Moreover, each Trustee may have afforded different weight to the various factors in reaching conclusions with respect to the Advisory Agreement.
Nature, Extent & Quality of Services. The Board considered that the Adviser was founded in 2008, managed approximately $272 million in assets and provided investment management services to individuals and businesses. The Board reviewed the background information on the Adviser’s investment personnel servicing Pinnacle, noting their education and financial industry experience. The Board considered that the Adviser had developed its own proprietary risk management signals to determine Pinnacle’s equity, fixed income and cash allocations. The Board recognized that the Adviser’s risk management program identified three key risks: individual investment risk, timing signal risk, and relative strength ranking risk, and that all risks were monitored on an ongoing basis. The Board commented that the Adviser used pre-and post-trade checklists to monitor compliance with Pinnacle’s investment limitations. The Board concluded that it could expect the Adviser to continue providing high quality service to Pinnacle and its shareholders.
Performance. The Board observed that Pinnacle earned a 3-star Morningstar rating and outperformed its peer group, Morningstar category, and benchmark over the 1-year period and 5-year period. The Board recognized that Pinnacle underperformed its peer group, Morningstar category and benchmark over the 3-year period and 10-year period. The Board acknowledged that this was the first full year that the Adviser utilized its own signals, and the Adviser was pleased with the resulting performance. The Board agreed the Adviser should continue managing the strategy using the proprietary signals.
Fees and Expenses. The Board noted that the Adviser’s advisory fee for Pinnacle was slightly below the peer group average, the same as the peer group median, and higher than the Morningstar category average and median. The Board acknowledged that Pinnacle’s net expense ratio was below the average and median of its peer group but higher than the Morningstar category average and median. The Board considered the Adviser’s explanation that many of the funds within the Morningstar category had much higher assets or were part of a larger fund family
| PINNACLE MULTI-STRATEGY CORE FUND |
| SUPPLEMENTAL INFORMATION (Unaudited)(Continued) |
| September 30, 2024 |
| |
than Pinnacle. The Board further acknowledged that some funds in the Morningstar category did not invest in ETFs, so they do not have acquired fund fees like Pinnacle. The Board concluded that the Adviser’s advisory fee for Pinnacle was not unreasonable.
Economies of Scale. The Board discussed the size of Pinnacle and its prospects for growth. The Board noted that the Adviser had indicated its willingness to discuss the matter of breakpoints with the Board as Pinnacle reached a specified asset level. The Board agreed that, in light of the expense limitation agreement, which effectively provided Pinnacle shareholders with some benefits of scale despite lower asset levels, and the Adviser’s willingness to consider breakpoints as Pinnacle grew, the absence of breakpoints at this time was acceptable.
Profitability. The Board reviewed the Adviser’s profitability analysis in connection with its management and acknowledged that the Adviser was managing Pinnacle at a loss and concluded, therefore, that excessive profitability was not an issue with respect to Pinnacle at this time.
Conclusion. Having requested and reviewed such information from the Adviser as the Board believed to be reasonably necessary to evaluate the terms of the Advisory Agreement, and as assisted by the advice of independent counsel, the Board concluded that renewal of the Advisory Agreement was in the best interests of Pinnacle and its shareholders.
| * | Due to timing of the contract renewal schedule, these deliberations may or may not relate to the current performance results of Pinnacle. |
PROXY VOTING POLICY
Information regarding how the Fund voted proxies relating to portfolio securities for the most recent 12 month period ended June 30th as well as a description of the policies and procedures that the Fund used to determine how to vote proxies is available without charge, upon request, by calling 1-888-985-9830 or by referring to the Securities and Exchange Commission’s (“SEC”) website at www.sec.gov.
PORTFOLIO HOLDINGS
The Fund files its complete schedules of portfolio holdings with the SEC for the first and third quarters of each fiscal year on Form N-PORT as an exhibit to its reports on Form N-PORT, within sixty days after the end of the period. Form N-PORT reports are available at the SEC’s website at www.sec.gov. The information on Form NPORT is available without charge, upon request, by calling 1-888-985-9830.
| INVESTMENT ADVISER |
| Pinnacle Family Advisors, LLC |
| 620 W. Republic Road, Ste. 104 |
| Springfield, MO 65807 |
| |
| ADMINISTRATOR |
| Ultimus Fund Solutions, LLC |
| 225 Pictoria Drive, Suite 450 |
| Cincinnati, OH 45246 |
Item 8. Changes in and Disagreements with Accountants for Open-End Management Investment Companies Not applicable
Item 9. Proxy Disclosures for Open-End Management Investment Companies. Not applicable
Item 10. Remuneration Paid to Directors, Officers, and Others of Open-End Management Investment Companies. Included under Item 7
Item 11. Statement Regarding Basis for Approval of Investment Advisory Contract. Included under Item 7
Item 12. Disclosure of Proxy Voting Policies and Procedures for Closed-End Management Investment Companies. Not applicable to open-end investment companies.
Item 13. Portfolio Managers of Closed-End Management Investment Companies. Not applicable to open-end investment companies.
Item 14. Purchases of Equity Securities by Closed-End Management Investment Company and Affiliated Purchasers. Not applicable to open-end investment companies.
Item 15. Submission of Matters to a Vote of Security Holders. None
Item 16. Controls and Procedures
(a) The registrant’s Principal Executive Officer and Principal Financial Officer have concluded that the registrant’s disclosure controls and procedures (as defined in Rule 30a-3(c) under the Act) are effective in design and operation and are sufficient to form the basis of the certifications required by Rule 30a-(2) under the Act, based on their evaluation of these disclosure controls and procedures as of a date within 90 days of this report on Form N-CSR.
(b) There were no changes in the registrant’s internal control over financial reporting (as defined in Rule 30a-3(d) under the Act) during the period covered by this report that have materially affected, or are reasonably likely to materially affect, the registrant’s internal control over financial reporting.
Item 17. Disclosure of Securities Lending Activities for Closed-End Management Investment Companies. Not applicable
Item 18. Recovery of Erroneously Awarded Compensation.
(a) Not applicable
(b) Not applicable
Item 19. Exhibits.
(a)(1) Code of Ethics for Principal Executive and Senior Financial Officers is attached hereto.
(a)(2) Not applicable
(a)(3) A separate certification for each principal executive officer and principal financial officer of the registrant as required by Rule 30a-2(a) under the Act (17 CFR 270.30a-2(a)): Attached hereto.
(a)(4) Not applicable
(b) Certifications required by Rule 30a-2(b) under the Act (17 CFR 270.30a-2(b)): Attached hereto
SIGNATURES
Pursuant to the requirements of the Securities Exchange Act of 1934 and the Investment Company Act of 1940, the registrant has duly caused this report to be signed on its behalf by the undersigned, thereunto duly authorized.
| (Registrant) Northern Lights Fund Trust III |
| | |
| By (Signature and Title) | |
| /s/ Brian Curley | |
| Brian Curley, President |
Pursuant to the requirements of the Securities Exchange Act of 1934 and the Investment Company Act of 1940, this report has been signed below by the following person on behalf of the registrant and in the capacities and on the dates indicated.
| By (Signature and Title) | |
| /s/ Brian Curley | |
| Brian Curley, Principal Executive Officer/President |
| By (Signature and Title) | |
| /s/ Rich Gleason | |
| Rich Gleason, Principal Financial Officer/Treasurer |