UNITED STATES
SECURITIES AND EXCHANGE COMMISSION
Washington, D.C. 20549
FORM N-CSR
CERTIFIED SHAREHOLDER REPORT OF REGISTERED MANAGEMENT INVESTMENT COMPANIES
Investment Company Act file number 811-22652
First Trust Variable Insurance Trust
(Exact name of registrant as specified in charter)
120 East Liberty Drive, Suite 400
Wheaton, IL 60187
(Address of principal executive offices) (Zip code)
W. Scott Jardine, Esq.
First Trust Portfolios L.P.
120 East Liberty Drive, Suite 400
Wheaton, IL 60187
(Name and address of agent for service)
registrant's telephone number, including area code: 630-765-8000
Date of fiscal year end: December 31
Date of reporting period: December 31, 2020
Form N-CSR is to be used by management investment companies to file reports with the Commission not later than 10 days after the transmission to stockholders of any report that is required to be transmitted to stockholders under Rule 30e-1 under the Investment Company Act of 1940 (17 CFR 270.30e-1). The Commission may use the information provided on Form N-CSR in its regulatory, disclosure review, inspection, and policymaking roles.
A registrant is required to disclose the information specified by Form N-CSR, and the Commission will make this information public. A registrant is not required to respond to the collection of information contained in Form N-CSR unless the Form displays a currently valid Office of Management and Budget ("OMB") control number. Please direct comments concerning the accuracy of the information collection burden estimate and any suggestions for reducing the burden to Secretary, Securities and Exchange Commission, 100 F Street, NE, Washington, DC 20549. The OMB has reviewed this collection of information under the clearance requirements of 44 U.S.C. § 3507.
Item 1. Reports to Stockholders.
(a) The Report to Shareholders is attached herewith.
First Trust Variable Insurance Trust
Annual Report
For the Period Ended December 31, 2020
First Trust Variable Insurance Trust
Annual Report
December 31, 2020
Caution Regarding Forward-Looking Statements
This report contains certain forward-looking statements within the meaning of the Securities Act of 1933, as amended, and the Securities Exchange Act of 1934, as amended. Forward-looking statements include statements regarding the goals, beliefs, plans or current expectations of First Trust Advisors L.P. (“First Trust” or the “Advisor”), Energy Income Partners, LLC (“EIP” or the “Sub-Advisor”), and/or Stonebridge (“Stonebridge” or the “Sub-Advisor”) and their respective representatives, taking into account the information currently available to them. Forward-looking statements include all statements that do not relate solely to current or historical fact. For example, forward-looking statements include the use of words such as “anticipate,” “estimate,” “intend,” “expect,” “believe,” “plan,” “may,” “should,” “would” or other words that convey uncertainty of future events or outcomes.
Forward-looking statements involve known and unknown risks, uncertainties and other factors that may cause the actual results, performance or achievements of any series of First Trust Variable Insurance Trust (the “Trust”) to be materially different from any future results, performance or achievements expressed or implied by the forward-looking statements. When evaluating the information included in this report, you are cautioned not to place undue reliance on these forward-looking statements, which reflect the judgment of the Advisor and/or Sub-Advisor and their respective representatives only as of the date hereof. We undertake no obligation to publicly revise or update these forward-looking statements to reflect events and circumstances that arise after the date hereof.
Performance and Risk Disclosure
There is no assurance that any series (individually called a “Fund” and collectively the “Funds”) of the Trust will achieve its investment objectives. Each Fund is subject to market risk, which is the possibility that the market values of securities owned by the Fund will decline and that the value of the Fund’s shares may therefore be less than what you paid for them. Accordingly, you can lose money by investing in a Fund. See “Risk Considerations” in the Additional Information section of this report for a discussion of certain other risks of investing in the Funds.
Performance data quoted represents past performance, which is no guarantee of future results, and current performance may be lower or higher than the figures shown. For the most recent month-end performance figures, please visit www.ftportfolios.com or speak with your financial advisor. Investment returns and net asset value will fluctuate and Fund shares, when sold, may be worth more or less than their original cost.
The Advisor may also periodically provide additional information on Fund performance on each Fund’s web page at www.ftportfolios.com.
How to Read This Report
This report contains information that may help you evaluate your investment. It includes details about each Fund and presents data and analysis that provide insight into each Fund’s performance.
By reading the portfolio commentary by the portfolio management team of each Fund, you may obtain an understanding of how the market environment affected each Fund’s performance. The statistical information that follows may help you understand each Fund’s performance compared to that of relevant market benchmarks.
It is important to keep in mind that the opinions expressed by personnel of the Advisor and/or Sub-Advisors are just that: informed opinions. They should not be considered to be promises or advice. The opinions, like the statistics, cover the period through the date on the cover of this report. The material risks of investing in each Fund are spelled out in the prospectus, the statement of additional information, this report and other Fund regulatory filings.
First Trust Variable Insurance Trust
Annual Letter from the Chairman and CEO
December 31, 2020
Dear Shareholders,
First Trust is pleased to provide you with the annual report for the series of the First Trust Variable Insurance Trust (the “Funds”), which contains detailed information about the Funds for the twelve months ended December 31, 2020.
This past year has been a whirlwind of challenges for the U.S. and the coronavirus (“COVID-19”) pandemic tops the list. It has been a nasty, stubborn virus since it arrived early in 2020. Mistakes have been made, but talented people are working the problem. The U.S. appears to be on the cusp of turning the corner on this virus over the next few months thanks to a couple of vaccines that proved effective in clinical testing and garnered approval from the Food and Drug Administration in record time. Hopefully, more vaccines will be gaining approval soon. Speed is key when it comes to distributing the vaccines to the most vulnerable of our population. This is not the time for bottlenecks or logistical problems.
The COVID-19 pandemic not only derailed the bull market in stocks in the first quarter of 2020, but it also threw the U.S. economy into a recession (the first and second quarters of 2020 reflected negative real gross domestic product growth). In response to the negative fallout from the virus, the federal government has stepped up with trillions of dollars of stimulus to help backstop the millions of people who have lost their jobs, in many cases, through no fault of their own, or have seen their incomes slashed due to the curtailed business activity in certain sectors of the economy, such as leisure and entertainment. In addition to putting money in people’s pockets, the government’s efforts instilled some much needed confidence in the securities markets, in my opinion. After factoring in the 33.79% decline in the S&P 500® Index from February 19, 2020 through March 23, 2020, as measured by total return performance, the S&P 500® Index managed to stage a dramatic rally to end 2020 up 18.40%, according to Bloomberg. I think that is incredible when you consider that, from 1926 through 2019, the average annual total return on the S&P 500® Index was 10.20%, according to Morningstar/Ibbotson Associates.
We now know that the Democratic party completed its blue wave by winning the two Senate runoff elections in Georgia on January 5, 2021. And that means the Democrats have voting control, albeit by a slender margin, in the House of Representatives and Senate (by way of Vice President Kamala Harris being the deciding vote in 50-50 split votes) for the next two years once they take office. With President Biden in the White House and the results of the Georgia Senate races, the Democrats now have control of both the Executive and Legislative branches of the government. In addition to focusing on expediting the COVID-19 vaccinations (the President is calling for 100 million doses in his first 100 days in office), we expect President Biden to attempt to make some changes to the individual and corporate tax codes, distribute more financial stimulus to those Americans in need and perhaps push for some form of an infrastructure spending bill, which may receive bipartisan support, in our opinion. I believe the most important fight right now is not between the politicians, it is against the virus. We need to reopen the economy. As always, stay tuned and stay the course!
Thank you for giving First Trust the opportunity to play a role in your financial future. We value our relationship with you and will report on the Funds again in six months.
Sincerely,
James A. Bowen
Chairman of the Board of Trustees
Chief Executive Officer of First Trust Advisors L.P.
Portfolio Commentary and Performance Summary
First Trust/Dow Jones Dividend & Income Allocation Portfolio
Annual Report
December 31, 2020
Advisor
First Trust Advisors L.P. (“First Trust”) is a registered investment advisor based in Wheaton, IL and is the investment advisor to First Trust/Dow Jones Dividend & Income Allocation Portfolio (the “Fund”). In this capacity, First Trust is responsible for the selection and ongoing monitoring of the securities in the Fund’s portfolio and certain other services necessary for the management of the Fund.
Portfolio Management Team
Daniel J. Lindquist, Chairman of the Investment Committee and Managing Director, First Trust
David G. McGarel, Chief Investment Officer, Chief Operating Officer and Managing Director, First Trust
Jon C. Erickson, Senior Vice President, First Trust
Roger F. Testin, Senior Vice President, First Trust
Todd Larson, Senior Vice President, First Trust
Chris A. Peterson, Senior Vice President, First Trust
Eric Maisel, Senior Vice President, First Trust
First Trust/Dow Jones Dividend & Income Allocation Portfolio
For the year ended December 31, 2020, the Fund’s Class I Shares returned 7.81% versus 15.85% for the Blended Benchmark: 50% Russell 3000® Index and 50% Bloomberg Barclays U.S Corporate Investment-Grade Index. As of December 31, 2020, the total investments for the Fund were allocated as follows: Equities, 58.7% and Fixed Income, 41.3%.
Equities Commentary
U.S. equities ended 2020 at all-time highs. The Russell 3000® Index returned 20.89% during 2020, helping that index post a 13.78% average annual over the last decade. U.S. equities had a promising start to the year through mid-February. However, mitigation efforts to slow the spread of the global coronavirus (“COVID-19”) pandemic led to a decline in global economic activity and investor sentiment, creating a deterioration in equity prices. The effect was felt throughout the country as 6.65 million initial jobless claims were filed in a single week at the end of March 2020 due to shuttered restaurants and other businesses such as retail which saw sales decline further than expected. The long running bull market appeared to be at its end as the Russell 3000® Index declined 34.96% from February 19 through March 23, 2020. Despite a rally in late March on the passage of an unprecedented $2 trillion fiscal stimulus package, the Russell 3000® Index returned -20.90% for the first quarter of 2020. U.S. equities experienced a resurgence in investor optimism during the second quarter, after many U.S. states began to relax COVID-19-related restrictions, helping to mitigate the macro contraction and stabilize economic data. Extraordinary accommodation on the part of the Federal Reserve (the “Fed”) also buttressed confidence, with the Federal Open Market Committee (“FOMC”) not only signaling that the fed funds rate would stay near the lower bound, but also announcing that the central bank would begin buying a broad and diversifying portfolio of corporate bonds to support market liquidity and bolster credit availability. By the end of June, the Russell 3000® Index had climbed 22.03% for the second quarter, the best quarterly performance for the index in the last forty years. A rebound in economic activity from the second quarter macro contraction, and supportive monetary policy bolstered U.S. equities during the third quarter of 2020, helping the Russell 3000® Consumer Discretionary Index post the best sector performance with a 17.47% return and the Russell 3000® Index with a 9.21% return. For their part, the Fed announced an aggressive new Flexible Average Inflation Targeting (“FAIT”) strategy, which seeks to achieve inflation that averages 2% over time, with the FOMC signaling that policy would remain accommodative even if inflation rises above its target in order to compensate for periods of low inflation. U.S. equities showed strong momentum in the fourth quarter of 2020 as investor sentiment was lifted by the Food and Drug Administration’s authorization of COVID-19 vaccines from both Pfizer and Moderna, the decreased political uncertainty post the November 2020 U.S. presidential election, and the improving industrial activity. The passage of a major fiscal stimulus package in late December, which included direct cash payments for individuals, was an additional catalyst. All sectors posted positive performance during the final quarter of the year with energy and financials showing best performance and the Russell 3000® Index returning 14.68%.
A portfolio factor attribution reveals the largest factor exposures were small size, value and underweight momentum. Value, dividend yield, and low volatility were the worst performing factors in 2020, while momentum, small size, and quality were the best performing factors. The equity portion of the Fund was hindered by the underweight momentum and quality exposures but benefited from the small size exposure. Despite the positive loading to small size, the value, dividend yield, and low volatility exposures contributed to the Fund’s underperformance.
The equity portion of the Fund has a quarterly rebalance in early January, April, July, and October. The selection process is focused on identifying stocks exhibiting dividend strength, capital strength and price stability. This process resulted in overweight positions in the Financials and Industrials sectors, while the Technology and Health Care sectors were underweight.
Portfolio Commentary and Performance Summary (Continued)
First Trust/Dow Jones Dividend & Income Allocation Portfolio (Continued)
Annual Report
December 31, 2020
The Energy, Utilities, and Real Estate sectors had a positive total attribution effect (allocation effect combined with selection effect), while the Technology, Financials, Consumer Discretionary, and Basic Materials sectors had a negative total attribution effect. The Energy, Real Estate, and Utilities sectors had a positive allocation effect while the Financials, Technology, and Consumer Discretionary sectors had a negative allocation effect. Two sectors had a positive selection effect: Financials and Energy. Four sectors had a negative selection effect: Consumer Discretionary, Basic Materials, Technology, and Industrials. The equity portion of the Fund was hindered by both a negative allocation effect and a negative selection effect.
The Energy sector was the largest overall contributor to relative performance. The Fund’s portfolio was underweight the underperforming sector in the Benchmark, which led to a positive allocation effect and had a positive selection effect. Energy positions in the Fund included Cabot Oil & Gas Corp, OGE Energy Group, ConocoPhilips, and Phillips 66.
The Technology sector was the biggest detractor from relative performance. The Fund’s portfolio was underweight the best performing sector in the Russell 3000® benchmark, which led to a negative allocation effect. The Fund also had a negative selection effect. Some of the Technology positions included Intuit Inc., Microsoft Corp, Texas Instruments Inc., Intel Corp, Amphenol Corp, among others. The Financials and Consumer Discretionary sectors also detracted from relative performance. The Fund’s portfolio was overweight the underperforming Financials and underweight the outperforming Consumer Discretionary sector which led to both having a negative allocation effect. Financials had a positive selection effect while Consumer Discretionary had a negative selection effect.
The Fund’s top five contributors to performance were Evercore Inc., Eaton Vance Corp, William-Sonoma Inc., Garmin LTD, and National General Holdings. The top five detractors from performance were The Cheesecake Factory Inc., Darden Restaurants Inc., Delta Air Lines Inc., Hexcel Corp, and Oxford Industries.
Heading into 2021, the economy is currently in the recovery phase after the recession caused by economic lockdowns from the global COVID-19 pandemic. Historically, in the recovery phase of the business cycle the top three performing factors have been small size, value and dividend yield. The equity portion of the Fund has significant factor loadings to these three factors heading into 2021, and, in our opinion, have significant capital appreciation opportunities if the economy strengthens and the Fed remains accommodative.
Fixed Income Commentary
The investment-grade corporate bond market experienced dramatic volatility during 2020 as markets struggled to appropriately price the impact of COVID-19. Despite a positive start, the global pandemic resulted in a significant spread widening. Only after a steady grind tighter over the rest of the year did spreads get back to nearly unchanged.
For the 12-month period ended December 31, 2020, corporate bonds outperformed Treasuries. As measured by the Bloomberg Barclays U.S. Corporate Investment-Grade Index, spreads widened by 3 basis points (“bps”) to 96 bps at year end. Investment-grade corporate bonds had a positive total return for the period as the slight widening in credit spreads was more than offset by the combination of a dramatic move lower in Treasury rates and the carry provided by corporate bonds.
The year 2020 began with optimism that U.S.-China trade tensions were being dialed down, and that the global growth outlook was bright. This didn’t last, however. Toward the end of March 2020, fear began to take hold as to just how negative an impact the COVID-19 pandemic was likely to have on the economy and markets. By mid-April there was panic with credit spreads gapping wider and liquidity becoming strained. Unprecedented policy intervention, both monetary and fiscal, were quickly put in place which, combined with vaccine optimism, helped stabilize markets -- and then fuel a sharp reversal in sentiment. From there, credit spreads ground steadily tighter into year-end.
The fixed-income portion of the Fund seeks to provide income along with preservation of capital. To accomplish this, the selection process is primarily value oriented, strongly emphasizes downside protection and focuses on free cash flow, leverage, interest coverage and revenue growth rates. This process resulted in overweight positions in Banking, Electric Utilities, and Transportation bonds, while Technology, Capital Goods, and Real Estate Investment Trusts (“REITs”) were the largest underweights.
The total return for the bond portion of the Fund outperformed the Bloomberg Barclays U.S. Corporate Investment-Grade Index. Yield curve changes reduced relative performance. Treasury yields decreased as the pandemic unfolded, and central banks unleashed monetary stimulus. The portfolio entered the 12-month period ended December 31, 2020 with a moderate duration underweight, but quickly recovered as risk sentiment deteriorated and a flight-to-quality rally took hold. Among credit quality and maturity cohorts, an underweight in BBB-rated credits, along with active bets in the 30- and 5-year maturity buckets, added the most to relative performance.
Among the 18 fixed-income industry groups, allocations to Basic Industry, Communications, and Finance Companies added the most to relative returns. Allocations to Technology, Consumer Cyclical, and Banking, by contrast, reduced relative returns. Overall, the
Portfolio Commentary and Performance Summary (Continued)
First Trust/Dow Jones Dividend & Income Allocation Portfolio (Continued)
Annual Report
December 31, 2020
allocation effect modestly added to relative performance. Within these industries, credit selection in Energy, Consumer Non-Cyclical, and Electric Utilities had the greatest positive impacts, while credit selection within Finance Companies, Other Utility, and Brokerage/Asset Managers/Exchanges reduced relative returns. Overall, credit selection within these industries had a significant positive impact on relative performance. Issuer allocation contributed to relative performance, with overweights to T-Mobile, Occidental Petroleum and AT&T having the greatest positive impact on relative returns. Security selection also contributed to relative return, with selection among bonds of AbbVie, Bank of America, and AT&T contributing the most to relative return.
As we begin 2021, we have a positive outlook for credit spreads. We anticipate higher interest rates and a steeper yield curve. Both factors should help U.S. investment grade credit, though should the normalization of interest rates become a disorderly selloff, then credit spreads would likely initially widen. Our expectation for economic recovery during 2021 should help support corporate profitability and cash flow. Robust demand for U.S. fixed income should also benefit investment grade credit due to its yield advantage over much of the global investment grade market which continues to trade at negative yields. That said, valuations are no longer cheap – making selectivity critical. Accordingly, our focus for the portfolio will be on our process --and on issuers and sectors with credit profiles well suited to weather the upcoming challenges.
Portfolio Commentary and Performance Summary (Continued)
First Trust/Dow Jones Dividend & Income Allocation Portfolio (Continued)
Annual Report
December 31, 2020
| Return Comparison | | | |
| | | Average Annual
Total Returns |
| | 1 Year
Ended
12/31/20 | 5 Years
Ended
12/31/20 | Inception
(5/1/12)
to 12/31/20 |
| Fund Performance | | | |
| First Trust/Dow Jones Dividend & Income Allocation Portfolio - Class I | 7.81% | 9.44% | 8.54% |
| Index Performance | | | |
| Blended Benchmark(1) | 15.85% | 11.28% | 9.90% |
| Bloomberg Barclays U.S. Corporate Investment-Grade Index(2) | 9.88% | 6.74% | 5.17% |
| Russell 3000® Index(3) | 20.89% | 15.43% | 14.35% |
| Secondary Blended Benchmark(4) | 16.31% | 11.38% | 10.01% |
| Dow Jones Equal Weight U.S. Issued Corporate Bond IndexSM(5) | 10.72% | 6.98% | 5.46% |
| Dow Jones U.S. Total Stock Market IndexSM(6) | 20.79% | 15.36% | 14.26% |
| Return Comparison | | | |
| | | Average Annual
Total Returns |
| | 1 Year
Ended
12/31/20 | 5 Years
Ended
12/31/20 | Inception
(5/1/14)
to12/31/20 |
| Fund Performance | | | |
| First Trust/Dow Jones Dividend & Income Allocation Portfolio - Class II | 8.13% | 9.74% | 8.47% |
| Index Performance | | | |
| Blended Benchmark(1) | 15.85% | 11.28% | 9.39% |
| Bloomberg Barclays U.S. Corporate Investment-Grade Index(2) | 9.88% | 6.74% | 5.34% |
| Russell 3000® Index(3) | 20.89% | 15.43% | 13.08% |
| Secondary Blended Benchmark(4) | 16.31% | 11.38% | 9.53% |
| Dow Jones Equal Weight U.S. Issued Corporate Bond IndexSM(5) | 10.72% | 6.98% | 5.68% |
| Dow Jones U.S. Total Stock Market IndexSM(6) | 20.79% | 15.36% | 12.99% |
The returns for the Fund do not reflect the deduction of expenses associated with variable products, such as mortality and expense risk charges, separate account charges, and sales charges or the effect of taxes. These expenses would reduce the overall returns shown.
| (1) | The Blended Benchmark returns are a 50/50 split between the Russell 3000® Index and the Bloomberg Barclays U.S. Corporate Investment-Grade Index returns. The Blended Benchmark returns are calculated by using the monthly return of the two indices during each period shown above. At the beginning of each month the two indices are rebalanced to a 50-50 ratio to account for divergence from that ratio that occurred during the course of each month. The monthly returns are then compounded for each period shown above, giving the performance for the Blended Benchmark for each period shown above. |
| (2) | Bloomberg Barclays U.S. Corporate Investment-Grade Index measures the performance of investment grade U.S. corporate bonds. The index includes all publicly issued, dollar-denominated corporate bonds with a minimum of $250 million par outstanding that are investment grade-rated (Baa3/BBB- or higher). The index excludes bonds having less than one year to final maturity as well as floating rate bonds, non-registered private placements, structured notes, hybrids, and convertible securities. (Bloomberg). (The index reflects no deduction for fees, expenses or taxes). |
| (3) | The Russell 3000® Index is composed of 3,000 large U.S. companies, as determined by market capitalization. This index represents approximately 98% of the investable U.S. equity market. (Bloomberg). (The index reflects no deduction for fees, expenses or taxes). |
| (4) | The Secondary Blended Benchmark return is a 50/50 split between the Dow Jones U.S. Total Stock Market IndexSM and the Dow Jones Equal Weight U.S. Issued Corporate Bond IndexSM returns. The Secondary Blended Benchmark returns are calculated by using the monthly return of the two indices during each period shown above. At the beginning of each month the two indices are rebalanced to a 50-50 ratio to account for divergence from that ratio that occurred during the course of each month. The monthly returns are then compounded for each period shown above, giving the performance for the Secondary Blended Benchmark for each period shown above. |
| (5) | The Dow Jones Equal Weight U.S. Issued Corporate Bond IndexSM measures the return of readily tradable, high-grade U.S. corporate bonds. The index includes an equally weighted basket of 96 recently issued investment-grade corporate bonds with laddered maturities. (The index reflects no deduction for fees, expenses or taxes). |
| (6) | The Dow Jones U.S. Total Stock Market IndexSM measures all U.S. equity securities that have readily available prices. (The index reflects no deduction for fees, expenses or taxes). |
Portfolio Commentary and Performance Summary (Continued)
First Trust/Dow Jones Dividend & Income Allocation Portfolio (Continued)
Annual Report
December 31, 2020
Portfolio Commentary and Performance Summary (Continued)
First Trust/Dow Jones Dividend & Income Allocation Portfolio (Continued)
Annual Report
December 31, 2020
| Credit Quality(7) | % of Total
Fixed-Income
Investments |
| AAA | 1.8% |
| AA+ | 0.1 |
| AA | 3.3 |
| AA- | 6.4 |
| A+ | 14.9 |
| A | 18.9 |
| A- | 14.2 |
| BBB+ | 14.7 |
| BBB | 15.6 |
| BBB- | 7.4 |
| A-2 (Short-term) | 0.7 |
| A-3 (Short-term) | 2.0 |
| Total | 100.0% |
| Top Equity Holdings | % of Total
Investments |
| Eaton Vance Corp. | 0.6% |
| Evercore, Inc., Class A | 0.6 |
| First Hawaiian, Inc. | 0.6 |
| Popular, Inc. | 0.6 |
| Bank of Hawaii Corp. | 0.5 |
| Power Integrations, Inc. | 0.5 |
| Dolby Laboratories, Inc., Class A | 0.5 |
| Charles Schwab (The) Corp. | 0.5 |
| Applied Materials, Inc. | 0.5 |
| Interpublic Group of (The) Cos., Inc. | 0.5 |
| Total | 5.4% |
| Top Fixed-Income Holdings by Issuer | % of Total
Investments |
| Bank of America Corp. | 6.0% |
| Citigroup, Inc. | 4.4 |
| JPMorgan Chase & Co. | 3.4 |
| Goldman Sachs Group (The), Inc. | 3.1 |
| Morgan Stanley | 3.0 |
| AbbVie, Inc. | 2.8 |
| Energy Transfer Operating L.P. | 2.5 |
| AT&T, Inc. | 2.5 |
| CVS Health Corp. | 1.9 |
| Verizon Communications, Inc. | 1.8 |
| Total | 31.4% |
| Sector Allocation | % of Total
Investments |
| Common Stocks | |
| Financials | 21.9% |
| Industrials | 13.6 |
| Information Technology | 8.3 |
| Health Care | 4.1 |
| Consumer Staples | 2.9 |
| Materials | 2.7 |
| Consumer Discretionary | 2.0 |
| Communication Services | 1.7 |
| Utilities | 0.8 |
| Real Estate | 0.7 |
| Total Common Stocks | 58.7% |
| Corporate Bonds and Notes | |
| Financials | 11.5 |
| Health Care | 5.3 |
| Utilities | 4.2 |
| Industrials | 4.2 |
| Communication Services | 3.7 |
| Energy | 2.2 |
| Consumer Staples | 2.0 |
| Information Technology | 1.4 |
| Consumer Discretionary | 0.8 |
| Materials | 0.3 |
| Real Estate | 0.2 |
| Transportation | 0.1 |
| Total Corporate Bonds and Notes | 35.9% |
| Foreign Corporate Bonds and Notes | |
| Financials | 1.8 |
| Energy | 0.5 |
| Health Care | 0.4 |
| Communication Services | 0.2 |
| Materials | 0.2 |
| Industrials | 0.2 |
| Consumer Discretionary | 0.1 |
| Information Technology | 0.1 |
| Consumer Staples | 0.1 |
| Total Foreign Corporate Bonds and Notes | 3.6% |
| Commercial Paper | |
| Energy | 0.8 |
| Utilities | 0.3 |
| Total Commercial paper | 1.1% |
| U.S. Government Bonds and Notes | 0.7% |
| Total | 100.0% |
| (7) | The credit quality and ratings information presented above reflect the ratings assigned by one or more nationally recognized statistical rating organizations (NRSROs), including Standard & Poor’s Ratings Group, a division of the McGraw Hill Companies, Inc., Moody’s Investors Service, Inc., Fitch Ratings or a comparably rated NRSRO. For situations in which a security is rated by more than one NRSRO and the ratings are not equivalent, the highest rating is used. Sub-investment grade ratings are those rated BB+/Ba1 or lower. Investment grade ratings are those rated BBB-/Baa3 or higher. The credit ratings shown relate to the creditworthiness of the issuers of the underlying securities in the Fund, and not to the Fund or its shares. Credit ratings are subject to change. |
Portfolio Commentary and Performance Summary
First Trust Multi Income Allocation Portfolio
Annual Report
December 31, 2020
Advisor
First Trust is a registered investment advisor based in Wheaton, IL and is the investment advisor to the First Trust Multi Income Allocation Portfolio (the “Fund”). In this capacity, First Trust is responsible for the selection and ongoing monitoring of the securities in the Fund’s portfolio and certain other services necessary for the management of the Fund. First Trust manages the Fund’s fixed income investments, as well as a portion of the Fund’s equity investments.
Sub-Advisors
Stonebridge Advisors LLC (“Stonebridge” or a “Sub-Advisor”) is a sub-advisor to the Fund and is a registered investment advisor based in Wilton, CT. Stonebridge specializes in the management of preferred securities and North American equity income securities.
Energy Income Partners, LLC (“EIP” or “Sub-Advisor”) is a sub-advisor to the Fund and is a registered investment advisor based in Westport, CT. EIP was founded in 2003 to provide professional asset management services in publicly traded, energy-related infrastructure companies with above average dividend payout ratios operating pipelines and related storage and handling facilities, electric power transmission and distribution as well as long contracted or regulated power generation from renewables and other sources. The corporate structure of the portfolio companies include C-corporations, partnerships and energy infrastructure real estate investment trusts (“REITs”).
Portfolio Management Team
First Trust
Daniel J. Lindquist, Chairman of the Investment Committee and Managing Director, First Trust
David G. McGarel, Chief Investment Officer, Chief Operating Officer and Managing Director, First Trust
Jon C. Erickson, Senior Vice President, First Trust
Roger F. Testin, Senior Vice President, First Trust
William Housey, Senior Vice President, First Trust
Chris A. Peterson, Senior Vice President, First Trust
Todd Larson, Senior Vice President, First Trust
James Snyder, Senior Vice President, First Trust
Jeremiah Charles, Senior Vice President, First Trust
Stonebridge
Scott Fleming, Portfolio Manager, President and Chief Investment Officer of Stonebridge
Robert Wolf, Senior Portfolio Manager and Senior Vice President of Stonebridge
EIP
James J. Murchie, Co-Portfolio Manager, Co-Founder, Principal and CEO of EIP
Eva Pao, Co-Portfolio Manager, Co-Founder, Principal of EIP
John Tysseland, Co-Portfolio Manager, Principal of EIP
First Trust Multi Income Allocation Portfolio
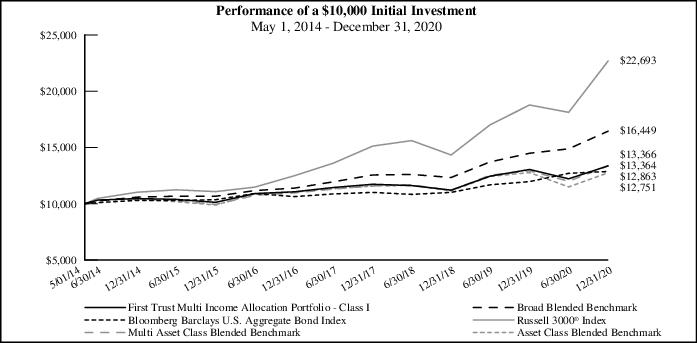
For the year ended December 31, 2020, the Fund’s Class I Shares returned 2.49% versus 13.58% for the Broad Blended Benchmark (60% Bloomberg Barclays U.S. Aggregate Bond Index and 40% Russell 3000® Index), 3.49% for the Multi Asset Class Blended Benchmark (15% Russell 3000® Index; 8% ICE BofA Fixed Rate Preferred Securities Index; 15% Alerian MLP Index; 15% S&P U.S. REIT Index; 8% ICE BofA U.S. High Yield Index; 15% S&P/LSTA Leveraged Loan Index; 8% Bloomberg Barclays U.S. Corporate Investment-Grade Index; 8% ICE BofA U.S. MBS Index; and 8% ICE BofA U.S. Inflation-Linked Treasury Index), and -0.13% for the Asset Class Blended Benchmark (15% Dow Jones U.S. Select Dividend Index; 8% ICE BofA Fixed Rate Preferred Securities Index; 15% Alerian MLP Index; 15% S&P U.S. REIT Index; 8% ICE BofA U.S. High Yield Index; 15% S&P/LSTA Leveraged Loan Index; 8% Bloomberg Barclays U.S. Corporate Investment-Grade Index; 8% ICE BofA U.S. MBS Index; and 8% ICE BofA U.S. Inflation-Linked Treasury Index).
The Fund invests in nine asset classes which are: dividend-paying stocks, preferred stocks, energy infrastructure companies and MLPs, REITs, high yield or “junk” bonds, floating-rate loans, corporate bonds, mortgage-backed securities (“MBS”) and Treasury Inflation Protected Securities (“TIPS”). The weight assigned to each asset class is determined on a quarterly basis. As of December 31, 2020, the dividend-paying securities were the highest-weighted asset class, while the preferred stocks asset class was the lowest-weighted
Portfolio Commentary and Performance Summary (Continued)
First Trust Multi Income Allocation Portfolio (Continued)
Annual Report
December 31, 2020
asset class. As of December 31, 2020, the Fund held approximately 2.5% in cash. The following asset classes had the most positive impact on the overall Fund performance for the year: dividend-paying stocks and TIPS, while the following asset classes had the largest negative impact on the overall Fund performance: MLPs and REITs.
Dividend-paying stocks returned 11.27% (Gross of Fees) for the year ended December 31, 2020 and represented 18.9% of the portfolio as of December 31, 2020. US equities, as measured by the Russell 3000® Index, posted strong gains in 2020 returning 20.89% despite a global pandemic that saw stocks plunge in the first quarter of 2020. Equities began the year with a tailwind as the U.S. and China agreed to a Phase One trade deal in December 2019 and unemployment hit a 50-year low. Equities responded by rising over 5% through mid-February. From February 19 through March 23, 2020, U.S. stocks fell 34.96% as the coronavirus (“COVID-19”) spread around the globe leading to unprecedented lockdowns and a historic drop in economic activity. Stocks then preceded to rally 76.8% the remainder of the year as investors bid up the shares of growth stocks and companies whose business models were not upended by the COVID-19 pandemic. On a factor basis, momentum stocks dominated led by tech stocks. Size (small cap) was also a strong factor for the year though performance was concentrated in the fourth quarter. Value and dividend yield were the two worst factors for the year which had a major impact on portfolio performance. Performance improved in the fourth quarter, but it was not enough to make up for the damage done earlier in the year when value and dividend yield were the two worst factors in 6 of the first 9 months of the year. On a sector basis, the Technology sector was the biggest drag on relative performance. Though our underweight was a drag on performance, the main driver was stock selection as dividend paying tech stocks greatly lagged their higher growth, non-dividend paying (and in many cases unprofitable) peers. The communication services sector also lagged in the portfolio as it was impacted by similar trends as the technology sector. The Industrial and Energy sectors were bright spots for relative portfolio performance. Both sectors benefitted from positive stock selection while Energy also benefited from an underweight as the sector was by far the worst performing sector for the year.
The preferred securities returned 6.68% (Gross of Fees) for the year ended December 31, 2020 and represented 7.0% of the portfolio as of December 31, 2020. The preferred securities market was supported during the year by solid underlying credit fundamentals coupled with high yields relative to other asset classes and accommodative central bank policies. Active management and security selection within the $25 par exchange traded market segment and investments in newly issued preferred and hybrid securities were the largest contributors to positive performance within the Fund’s preferred securities allocation. An overweight to contingent convertible capital securities (“CoCos”) also contributed to the positive performance. This positive performance was modestly offset by a conservative stance on duration management.
The energy infrastructure companies and MLPs returned -17.43% (Gross of Fees) for the year ended December 31, 2020 and represented 15.8% of the portfolio as of December 31, 2020. The performance of the equity securities of energy infrastructure companies underperformed the overall performance of the Fund. The dramatic price declines in the crude oil market in the first quarter of 2020 due to Saudi and Russian production decisions coupled with the demand shock related to the COVID-19 pandemic drove weak market conditions for the Alerian MLP Index and the energy related MLPs in the Fund.
REITs returned -5.50% (Gross of Fees) for the year ended December 31, 2020 and represented 11.2% of the portfolio as of December 31, 2020. The REIT sleeve outperformed the S&P USA REIT Index by 202 basis points (“bps”) in 2020. REITs underperformed the broader market in 2020 due to the sector’s high exposure to COVID-19 travel and business lockdowns. The sector’s performance in 2021 will likely hinge on low interest rates and the ability of the U.S. economy to reopen. Within the portfolio, positive sector allocation drove the majority of positive returns relative to the sleeve’s benchmark. The portfolio benefitted from low exposure to Hotel & Resort REITs during the downturn in the first quarter of 2020 and low exposure to Residential REITs throughout the year. Both industries underperformed the sector’s overall return. The portfolio also benefitted from its high exposure to Specialized REITs. Specialized REITs were largely shielded from the effects of COVID-19-related shutdowns relative to other real estate industries and returned roughly 13% in the benchmark over the year. Stock selections also created a slightly positive effect on relative returns. Diversified REITs and Office REITs in the portfolio both outperformed their respective benchmark returns by over 10%. The best performing equities by contribution to return were Life Storage, Inc.; Prologis, Inc.; and Equinix, Inc. The worst performing equities by contribution to return were Retail Properties of America, Inc.; EPR Properties; and Essex Property Trust, Inc.
High-yield bonds returned 5.27% (Gross of Fees) for the year ended December 31, 2020 and represented 10.8% of the portfolio as of December 31, 2020. High-yield bond spreads over U.S. Treasuries entered the year at T+360 bps. During the year, spreads widened as high as T+1087 during the March sell-off, before coming back in line with the beginning of year levels and ending the year at T+387, well below the historic average (the long-term average spread over U.S. Treasuries is T+565 bps, December 1997 – December 2020). For the 12-month period ended December 31, 2020, high-yield funds experienced cumulative inflows totaling approximately $44.3 billion, which compares to inflows in 2019 totaling $18.8 billion. Within the high yield bond market higher quality BB rated issues outperformed with a 7.89% return compared to 3.12% for B’s and the 4.35% for CCC’s for the year. The high-yield bond default rate within the JP Morgan High-Yield Bond Universe increased to 6.17% from 2.63% entering the year. The current default rate is
Portfolio Commentary and Performance Summary (Continued)
First Trust Multi Income Allocation Portfolio (Continued)
Annual Report
December 31, 2020
above the long-term average default rate of 3.19% (March 1999 – December 2020). In the near term, we anticipate that the high-yield market’s default rate will be relatively stable, however, as the economy recovers, the default rate should begin to fall. We believe individual credits that came into this recession with too much leverage and sectors most impacted by COVID-19 will face a higher likelihood of defaults, including, but not limited to Energy, Travel, Leisure and Retail, in no particular order.
Floating-rate loans returned 2.74% (Gross of Fees) for the year ended December 31, 2020 and represented 10.7% of the portfolio as of December 31, 2020. Senior loan spreads over 3-month London Inter-Bank Offered Rate (“LIBOR”) entered the year at L+461 bps. During the year spreads widened to highs of L+1331 during the March sell-off, before coming back in line with the levels at the beginning of the year and ending the year at L+475. The benchmark rate for senior loan coupons, 3-month LIBOR, fell 167 bps to 0.24% at the end of year due to the Federal Open Market Committee lowering the Federal Funds target rate to 0%-.25% from 1.50% - 1.75% in March 2020. The Federal Reserve’s (the “Fed”) rate cuts contributed to persistent outflows from retail investors in the senior loan market. For the 12-month period ended December 31, 2020 outflows totaled approximately $26.9 billion, which compares to record outflows in 2019 totaling $38.3 billion. Despite consistent outflows we believe senior loans remain relatively attractive given their current yields, the low corporate default rate, the secured position in the capital structure, and potential to protect against inflation. The current senior loan yield-to-maturity (“YTM”) is 4.70%, 187 bps lower than the high-yield bond YTM of 6.57%, which compares to the average YTM difference of 2.01% for the asset classes dating back to December 1998.
Corporate bonds returned 9.67% (Gross of Fees) and represented 8.7% of the portfolio as of December 31, 2020. Performance was modestly below its benchmark. The corporate bond market experienced the highest levels of volatility in over a decade, thanks to the COVID-19 pandemic, but ended the year with robust total returns. Returns were primarily driven by lower Treasury benchmark yields, which hit record low levels during the year. Credit spreads jumped 200+ bps wider in the wake of pandemic-driven uncertainty prompting the Fed and Congress to intervene with unprecedented levels of monetary and fiscal support. The intervention restored investor confidence and catalyzed a sharp recovery in spreads. As measured by the Bloomberg Barclays U.S. Corporate Bond Index, spreads ended the year at 95 basis points, practically on top of where it began 2020. Looking ahead, the rebounding economy leads us to have a positive outlook for corporate credit. However, with Index yields at record low levels, we expect the asset class will return less than recent years.
The MBS asset class returned 3.65% (Gross of Fees) for the year ended December 31, 2020 and represented 8.4% of the portfolio as of December 31, 2020. Although the MBS sleeve benefited the overall portfolio return, the performance of the portfolio was hampered by its structurally shorter and more defensive duration versus the mortgage index which had a negative impact as interest rates rallied over the year, causing the sleeve to underperform the benchmark. The Fund’s performance was also hampered by its holdings in structured mortgages which are currently valued at wide option adjusted spreads versus the generic mortgage market. Overall, the Fund continues to manage its duration more in line with the benchmark, with a focus on strategic MBS basis positioning, liquidity as well as maintaining exposure to U.S. Treasury securities.
TIPS returned 11.54% (Gross of Fees) and represented 8.5% of the portfolio as of December 31, 2020. Performance was in line with its benchmark with TIPS being one of the top performing asset classes in the Multi Income strategy. In the wake of the Fed’s rate cuts and quantitative easing, Treasury securities, particularly longer maturity bonds, provided investors a high level of return in 2020. The monetary and fiscal stimulus initiated by policymakers helped to trigger an increase to inflation expectations that factor into Treasury TIPS prices. As a result, TIPS outperformed nominal Treasury bonds in 2020 with the ICE BofA US Inflation-Linked Treasury Index returning 11.5% compared to 8.2% for the ICE BofA US Treasury Index. Going forward, the low level of yield on Treasury securities pose a challenge for returns in the asset class but we expect an improving inflation picture will lead TIPS to outperform nominal Treasury securities.
Investment Climate
While 2020 has come and gone, the COVID-19 pandemic remains the number one battleground for the U.S. and many foreign nations heading into 2021. The quick approval of two new vaccines by the Food and Drug Administration has lifted the spirits of Americans and investors, but the initial rollout of the vaccines has been much slower than expected. The federal government’s “Operation Warp Speed” initiative called for 20 million vaccinations to be performed in the U.S. by the end of 2020, but it came in at a little more than three million, according to Axios. On January 2, 2021, the U.S. recorded its highest number of COVID-19 cases ever for a single day (277,000), according to Medical Xpress. With infections surging, top U.S. government scientist Anthony Fauci warned just days after Christmas that the worst may be yet to come. These latest statistics suggest that clearing the COVID-19 hurdle may extend a bit further into 2021 than initially thought. Remember, these two vaccines, and any others that may gain approval, are likely the best chance we have for fully reopening the U.S. economy.
The yield on the benchmark 10-year Treasury note (T-Note) closed trading on December 31, 2020, at 0.92%, down 100 bps from its 1.92% close on December 31, 2019, according to Bloomberg. The yield stood -124 bps below its 2.16% average for the 10-year period
Portfolio Commentary and Performance Summary (Continued)
First Trust Multi Income Allocation Portfolio (Continued)
Annual Report
December 31, 2020
ended December 31, 2020. Due to the sizable decline in the yield on the 10-year T-Note, bond investors enjoyed another year of solid performance in 2020. The COVID-19 pandemic coupled with the accommodating monetary policy from the Fed kept a lid on interest rates and bond yields, while the second-half recovery in the U.S. economy helped bolster the credit markets, in our opinion. In September 2020, the Fed stated that it expects to hold short-term interest rates near zero until two things happen: (1) the U.S. unemployment rate is back to normal (around a 4.0% unemployment rate), and (2) inflation is running at or above 2.0%. Brian Wesbury, Chief Economist at First Trust Advisors L.P., notes that the Fed does not expect to achieve both goals until 2024. We believe that one of the Fed’s motivations in promoting a multi-year commitment to a near zero interest rate monetary policy is to incentivize risk-taking. By holding short-term interest rates extraordinarily low, the Fed is essentially disincentivizing saving. Brian Wesbury sees inflation climbing modestly above the Fed’s 2.00% target in 2021 and believes that the yield on the 10-year T-Note will close the year at around 1.40%. Neither reflects a dramatic change from the current climate.
Portfolio Commentary and Performance Summary (Continued)
First Trust Multi Income Allocation Portfolio (Continued)
Annual Report
December 31, 2020
| Return Comparison | | | |
| | | Average Annual
Total Returns |
| | 1 Year
Ended
12/31/20 | 5 Years
Ended
12/31/20 | Inception
(5/1/14)
to 12/31/20 |
| Fund Performance | | | |
| First Trust Multi Income Allocation Portfolio - Class I | 2.49% | 5.72% | 4.44% |
| First Trust Multi Income Allocation Portfolio - Class II | 2.74% | 5.97% | 4.69% |
| Index Performance | | | |
| Broad Blended Benchmark(1) | 13.58% | 9.06% | 7.75% |
| Bloomberg Barclays U.S. Aggregate Bond Index(2) | 7.51% | 4.44% | 3.84% |
| Russell 3000® Index(3) | 20.89% | 15.43% | 13.08% |
| Multi Asset Class Blended Benchmark(4) | 3.49% | 6.12% | 4.45% |
| Asset Class Blended Benchmark(5) | -0.13% | 5.23% | 3.71% |
The returns for the Fund do not reflect the deduction of expenses associated with variable products, such as mortality and expense risk charges, separate account charges, and sales charges or the effect of taxes. These expenses would reduce the overall returns shown.
| (1) | The Broad Blended Benchmark returns are split between the Bloomberg Barclays U.S. Aggregate Bond Index (60%) and the Russell 3000® Index (40%). The Broad Blended Benchmark returns are calculated by using the monthly return of the two indices during each month shown above. At the beginning of each month the two indices are rebalanced to a 60% and 40% ratio, respectively, to account for divergence from that ratio that occurred during the course of each month. The monthly returns are then compounded for each period shown above, giving the performance for the Broad Blended Benchmark for each period shown above. |
| (2) | The Bloomberg Barclays U.S. Aggregate Bond Index represents the U.S. investment grade fixed rate bond market, with index components for government and corporate securities, mortgage pass-through securities, and asset-backed securities. Bonds included in the index are U.S. dollar denominated; have a fixed rate coupon; carry an investment-grade rating; have at least one year to final maturity; and meet certain criteria for minimum amount of outstanding par value. (The index reflects no deduction for fees, expenses or taxes). |
| (3) | The Russell 3000® Index is composed of 3,000 large U.S. companies, as determined by market capitalization. This index represents approximately 98% of the investable U.S. equity market. (Bloomberg). (The index reflects no deduction for fees, expenses or taxes). |
| (4) | The Multi Asset Class Blended Benchmark is weighted to include nine indexes: Russell 3000® Index (15%), ICE BofA Fixed Rate Preferred Securities Index (8%), Alerian MLP Index (15%), S&P U.S. REIT Index (15%), ICE BofA U.S. High Yield Index (8%), S&P/LSTA Leveraged Loan Index (15%), Bloomberg Barclays U.S. Corporate Investment-Grade Index (8%), ICE BofA U.S. MBS Index (8%), and ICE BofA U.S. Inflation-Linked Treasury Index (8%).The Multi Asset Class Benchmark returns are calculated by using the monthly return of the nine indices during each period shown above. At the beginning of each month the nine indices are rebalanced to a 15%, 8%, 15%, 15%, 8%, 15%, 8%, 8% and 8% ratio, respectively, to account for divergence from that ratio that occurred during the course of each month. The monthly returns are then compounded for each period shown above, giving the performance for the Multi Asset Class Blended Benchmark for each period shown above. |
| (5) | The Asset Class Blended Benchmark is weighted to include nine indexes: Dow Jones U.S. Select Dividend TM Index (15%), ICE BofA Fixed Rate Preferred Securities Index (8%), Alerian MLP Index (15%), S&P U.S. REIT Index (15%), ICE BofA U.S. High Yield Index (8%), S&P/LSTA Leveraged Loan Index (15%), Bloomberg Barclays U.S. Corporate Investment-Grade Index (8%), ICE BofA U.S. MBS Index (8%), and ICE BofA U.S. Inflation-Linked Treasury Index (8%).The Asset Class Benchmark returns are calculated by using the monthly return of the nine indices during each period shown above. At the beginning of each month the nine indices are rebalanced to a 15%, 8%, 15%, 15%, 8%, 15%, 8%, 8% and 8% ratio, respectively, to account for divergence from that ratio that occurred during the course of each month. The monthly returns are then compounded for each period shown above, giving the performance for the Asset Class Blended Benchmark for each period shown above. |
Portfolio Commentary and Performance Summary (Continued)
First Trust Multi Income Allocation Portfolio (Continued)
Annual Report
December 31, 2020
| Top Ten Holdings | % of Total
Investments |
| First Trust Tactical High Yield ETF | 10.9% |
| First Trust Senior Loan ETF | 10.8 |
| iShares iBoxx $ Investment Grade Corporate Bond ETF | 7.8 |
| First Trust Preferred Securities and Income ETF | 5.3 |
| First Trust Low Duration Opportunities ETF | 3.2 |
| First Trust Institutional Preferred Securities and Income ETF | 1.8 |
| Enterprise Products Partners, L.P. | 1.3 |
| iShares MBS ETF | 1.3 |
| Magellan Midstream Partners, L.P. | 1.3 |
| TC PipeLines, L.P. | 1.2 |
| Total | 44.9% |
| Sector Allocation | % of Total
Investments |
| Exchange-Traded Funds | 42.3% |
| Common Stocks | |
| Utilities | 7.7% |
| Information Technology | 4.4 |
| Industrials | 3.1 |
| Health Care | 3.1 |
| Energy | 2.7 |
| Consumer Discretionary | 2.2 |
| Financials | 2.0 |
| Consumer Staples | 1.8 |
| Communication Services | 0.9 |
| Materials | 0.2 |
| Total Common Stocks | 28.1% |
| Real Estate Investment Trusts | |
| Financials | 5.7 |
| Real Estate | 5.6 |
| Total Real Estate Investment Trusts | 11.3% |
| U.S. Government Bonds and Notes | 8.7% |
| Master Limited Partnerships | |
| Energy | 5.8 |
| Utilities | 0.6 |
| Materials | 0.5 |
| Total Master Limited Partnerships | 6.9% |
| U.S. Government Agency Mortgage-Backed Securities | 2.7% |
| Mortgage-Backed Securities | 0.0% * |
| Total | 100.0% |
| * | Amount is less than 0.05%. |
Portfolio Commentary and Performance Summary
First Trust Dorsey Wright Tactical Core Portfolio
Annual Report
December 31, 2020
Advisor
First Trust is a registered investment advisor based in Wheaton, IL and is the investment advisor to First Trust Dorsey Wright Tactical Core Portfolio (the “Fund”). In this capacity, First Trust is responsible for the selection and ongoing monitoring of the securities in the Fund’s portfolio and certain other services necessary for the management of the Fund.
Portfolio Management Team
Daniel J. Lindquist, Chairman of the Investment Committee and Managing Director, First Trust
David G. McGarel, Chief Investment Officer, Chief Operating Officer and Managing Director, First Trust
Jon C. Erickson, Senior Vice President, First Trust
Roger F. Testin, Senior Vice President, First Trust
Todd Larson, Senior Vice President, First Trust
Chris A. Peterson, Senior Vice President, First Trust
Eric R. Maisel, Senior Vice President, First Trust
First Trust Dorsey Wright Tactical Core Portfolio
For the year ended December 31, 2020, the Fund’s Class I Shares returned 11.09% versus 14.73% for the Broad Blended Benchmark: 60% S&P 500® Index and 40% Bloomberg Barclays U.S. Aggregate Bond Index.
The Fund seeks to provide total return. The Fund seeks to achieve its investment objective by investing, under normal market conditions, at least 80% of its net assets (including any investment borrowings) in exchange-traded funds (“ETFs”) and cash and cash equivalents that comprise the Dorsey Wright Tactical Tilt Moderate Core Index (the “Index”). It is expected that a majority of the ETFs in which the Fund invests will be advised by First Trust.
The Index is owned and was developed by Dorsey, Wright & Associates (the “Index Provider”). The Index is constructed pursuant to the Index Provider’s proprietary methodology, which takes into account the performance of four distinct asset classes relative to one another. The Index is designed to strategically allocate its investments among (i) domestic equity securities; (ii) international equity securities; (iii) fixed income securities; and (iv) cash and cash equivalents. The Index will gain exposure to the first three asset classes by investing in ETFs that invest in such assets. The Index Provider has retained Nasdaq, Inc. (“Nasdaq”) to calculate and maintain the Index.
The Index will utilize the Dynamic Asset Level Investing (“DALI”) asset allocation process developed by the Index Provider in order to allocate assets over the four asset classes. The asset class allocations are determined using a relative strength methodology that is based upon each asset class’s market performance and characteristics that offer the greatest potential to outperform the other asset classes at a given time. Relative strength is a momentum technique that relies on unbiased, unemotional, and objective data, rather than biased forecasting and subjective research. Relative strength is a way of recording historic performance patterns, and the Index Provider uses relative strength signals as a trend indicator for current momentum trends of each asset class against the others.
Performance Review
The Fund began 2020 with the following allocations to the four asset classes: domestic equity securities (74.2%), international equity securities (4.9%), fixed income securities (19.1%), and cash equivalents (1.8%). The domestic equity allocation started the year at the maximum allocation, but in April 2020, the domestic equity allocation was decreased to 20% and remained at that level until September 2020 when the domestic equity allocation was increased to 75%. From April 13, 2020 until September 3, 2020, the Fund’s Class I Shares net asset value (“NAV”) returned only 10.1% due to a low allocation to domestic equity securities, while the Broad Blended Benchmark returned 16.0% over the same period. At the end of 2020, the Fund had the following allocations: domestic equity securities (75.2%), international equity securities (4.9%), fixed income securities (18.4%), and cash equivalents (1.5%). The Fund’s largest contributing holdings to performance in 2020 were the SPDR® Bloomberg Barclays Convertible Securities ETF and the First Trust Large Cap Core AlphaDEX® Fund. The Fund’s largest detracting holdings were the First Trust Financials AlphaDEX® Fund and the First Trust Small Cap Growth AlphaDEX® Fund.
Portfolio Commentary and Performance Summary (Continued)
First Trust Dorsey Wright Tactical Core Portfolio (Continued)
Annual Report
December 31, 2020
| Return Comparison | | | |
| | | Average Annual
Total Returns |
| | 1 Year
Ended
12/31/20 | 5 Years
Ended
12/31/20 | Inception
(10/30/15)
to 12/31/20 |
| Fund Performance | | | |
| First Trust Dorsey Wright Tactical Core Portfolio - Class I | 11.09% | 7.92% | 7.55% |
| First Trust Dorsey Wright Tactical Core Portfolio - Class II | 10.96% | 8.11% | 7.73% |
| Index Performance | | | |
| Broad Blended Benchmark(1) | 14.73% | 11.11% | 10.51% |
| Bloomberg Barclays U.S. Aggregate Bond Index(2) | 7.51% | 4.44% | 4.17% |
| S&P 500® Index(3) | 18.40% | 15.22% | 14.40% |
The returns for the Fund do not reflect the deduction of expenses associated with variable products, such as mortality and expense risk charges, separate account charges, and sales charges or the effect of taxes. These expenses would reduce the overall returns shown.
| (1) | The Broad Blended Benchmark return is split between the Bloomberg Barclays U.S. Aggregate Bond Index (40%) and the S&P 500® Index (60%). The Broad Blended Benchmark returns are calculated by using the monthly return of the two indices during each period shown above. At the beginning of each month the two indices are rebalanced to a 40% and 60% ratio, respectively, to account for divergence from that ratio that occurred during the course of each month. The monthly returns are then compounded for each period shown above, giving the performance for the Broad Blended Benchmark for each period shown above. |
| (2) | The Bloomberg Barclays U.S. Aggregate Bond Index represents the U.S. investment grade fixed rate bond market, with index components for government and corporate securities, mortgage pass-through securities, and asset-backed securities. Bonds included in the index are U.S. dollar denominated; have a fixed rate coupon; carry an investment-grade rating; have at least one year to final maturity; and meet certain criteria for minimum amount of outstanding par value. (The index reflects no deduction for fees, expenses or taxes). |
| (3) | The S&P 500® Index is an unmanaged index of 500 stocks used to measure large-cap U.S. stock market performance. (The index reflects no deduction for fees, expenses or taxes). |
Portfolio Commentary and Performance Summary (Continued)
First Trust Dorsey Wright Tactical Core Portfolio (Continued)
Annual Report
December 31, 2020
| Top Ten Holdings | % of Total
Investments |
| First Trust Small Cap Growth AlphaDEX® Fund | 11.0% |
| First Trust Mid Cap Growth AlphaDEX® Fund | 10.7 |
| First Trust Large Cap Growth AlphaDEX® Fund | 9.9 |
| First Trust Technology AlphaDEX® Fund | 9.4 |
| First Trust Consumer Discretionary AlphaDEX® Fund | 9.3 |
| First Trust NASDAQ-100-Technology Sector Index Fund | 8.9 |
| First Trust Nasdaq Transportation ETF | 8.8 |
| First Trust Dow Jones Internet Index Fund | 8.3 |
| iShares Core U.S. Aggregate Bond ETF | 5.4 |
| SPDR Bloomberg Barclays Convertible Securities ETF | 3.6 |
| Total | 85.3% |
Portfolio Commentary and Performance Summary
First Trust Capital Strength Portfolio
Annual Report
December 31, 2020
Advisor
First Trust is a registered investment advisor based in Wheaton, IL and is the investment advisor to First Trust Capital Strength Portfolio (the “Fund”). In this capacity, First Trust is responsible for the selection and ongoing monitoring of the securities in the Fund’s portfolio and certain other services necessary for the management of the Fund.
Portfolio Management Team
Daniel J. Lindquist, Chairman of the Investment Committee and Managing Director, First Trust
David G. McGarel, Chief Investment Officer, Chief Operating Officer and Managing Director, First Trust
Jon C. Erickson, Senior Vice President, First Trust
Roger F. Testin, Senior Vice President, First Trust
Chris A. Peterson, Senior Vice President, First Trust
First Trust Capital Strength Portfolio
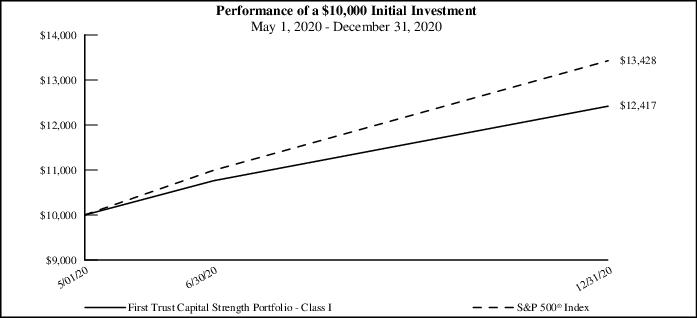
For the period from the Fund’s inception on May 1, 2020 through December 31, 2020, the Fund’s Class I Shares returned 24.17% versus 34.28% for the S&P 500® Index.
The Fund seeks investment results that correspond generally to the price and yield (before the Fund’s fees and expenses) of an equity index called The Capital Strength IndexSM (the “Index”). The Fund will normally invest at least 80% of its net assets (including investment borrowings) in the common stocks and real estate investment trusts that comprise the Index. The Index seeks to provide exposure to well-capitalized companies with strong market positions that have the potential to provide their stockholders with a greater degree of stability and performance over time. The Index is rebalanced and reconstituted quarterly and the Fund will make corresponding changes to its portfolio shortly after the Index changes are made public.
For the period from the Fund’s inception on May 1, 2020 through December 31, 2020, the Fund lagged the broader market as low volatility stocks failed to keep up in a rising equity market led by growth stocks. Over the same period, low volatility was the worst performing of the six major factors we follow. Quality, another factor the Fund has exposure to, performed better but was not able to overcome the headwinds caused by the low volatility exposure. On a sector basis, of the sectors the portfolio had exposure to, the Consumer Discretionary sector was the biggest contributor to relative performance due to both positive allocation and selection effects. Both the Energy and Utilities sectors had positive allocation effects due to the Fund having no exposure to these two underperforming sectors. The biggest drag on relative performance came from Health Care holdings. The Fund was materially overweight the underperforming sector and also suffered from negative stock selection. An underweight to Information Technology stocks, the best performing sector in the benchmark, and to a lesser extent, stock selection in the sector, was also a drag on relative performance. Stock selection in the Financials and Industrials sectors also hurt relative performance over the same period.
Portfolio Commentary and Performance Summary (Continued)
First Trust Capital Strength Portfolio (Continued)
Annual Report
December 31, 2020
| Return Comparison | | |
| | | Cumulative
Total Returns |
| | | Inception (5/1/20)
to 12/31/20 |
| Fund Performance | | |
| First Trust Capital Strength Portfolio - Class I | | 24.17% |
| First Trust Capital Strength Portfolio - Class II | | 24.33% |
| Index Performance | | |
| S&P 500® Index(1) | | 34.28% |
The returns for the Fund do not reflect the deduction of expenses associated with variable products, such as mortality and expense risk charges, separate account charges, and sales charges or the effect of taxes. These expenses would reduce the overall returns shown.
| Top Ten Holdings | % of Total
Investments |
| Honeywell International, Inc. | 2.3% |
| Garmin Ltd. | 2.3 |
| Estee Lauder (The) Cos., Inc., Class A | 2.3 |
| Allstate (The) Corp. | 2.3 |
| Eli Lilly & Co. | 2.2 |
| Monster Beverage Corp. | 2.2 |
| Amphenol Corp., Class A | 2.2 |
| Accenture PLC, Class A | 2.2 |
| CSX Corp. | 2.2 |
| Alphabet, Inc., Class A | 2.2 |
| Total | 22.4% |
| Sector Allocation | % of Total
Investments |
| Industrials | 26.0% |
| Consumer Staples | 19.9 |
| Health Care | 19.8 |
| Financials | 10.1 |
| Information Technology | 8.6 |
| Consumer Discretionary | 7.7 |
| Communication Services | 4.2 |
| Real Estate | 1.9 |
| Materials | 1.8 |
| Total | 100.0% |
| (1) | The S&P 500® Index is an unmanaged index of 500 stocks used to measure large-cap U.S. stock market performance. (The index reflects no deduction for fees, expenses or taxes). |
Portfolio Commentary and Performance Summary
First Trust International Developed Capital Strength Portfolio
Annual Report
December 31, 2020
Advisor
First Trust is a registered investment advisor based in Wheaton, IL and is the investment advisor to First Trust International Developed Capital Strength Portfolio (the “Fund”). In this capacity, First Trust is responsible for the selection and ongoing monitoring of the securities in the Fund’s portfolio and certain other services necessary for the management of the Fund.
Portfolio Management Team
Daniel J. Lindquist, Chairman of the Investment Committee and Managing Director, First Trust
David G. McGarel, Chief Investment Officer, Chief Operating Officer and Managing Director, First Trust
Jon C. Erickson, Senior Vice President, First Trust
Roger F. Testin, Senior Vice President, First Trust
Chris A. Peterson, Senior Vice President, First Trust
First Trust International Developed Capital Strength Portfolio
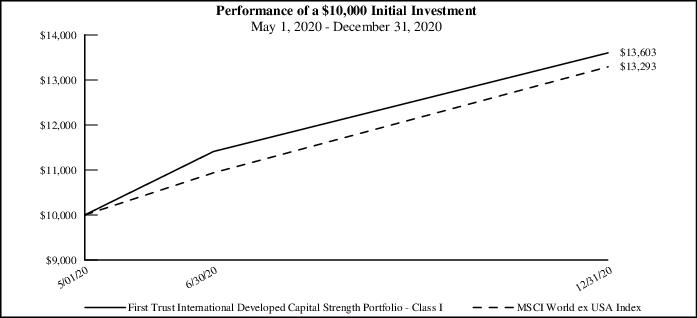
For the period from the Fund’s inception on May 1, 2020 through December 31, 2020, the Fund’s Class I Shares returned 36.03% versus 32.93% for the MSCI World ex USA Index.
The Fund seeks to achieve its investment objective by investing, under normal market conditions, at least 80% of its net assets (including investment borrowings) in the common stocks that comprise The International Developed Capital Strength IndexSM (the “Index”). The Index seeks to provide exposure to well-capitalized non-U.S. companies in developed markets with strong market positions that have the potential to provide their stockholders with a greater degree of stability and performance over time. The Fund may invest in securities of any market capitalization. The Index is rebalanced and reconstituted semi-annually and the Fund will make corresponding changes to its portfolio shortly after the Index changes are made public.
For the period from the Fund’s inception on May 1, 2020 through December 31, 2020, the Fund generated outperformance due to a combination of sector and country allocation and stock selection. An overweight to the Nordic countries was a positive for the Fund’s portfolio as the region outperformed the broader developed ex United States market. An underweight to the United Kingdom was also a positive as returns for the country were hampered by the global pandemic and ongoing Brexit uncertainties. On a sector basis, positive stock selection in the Health Care and Information Technology sectors boosted relative portfolio performance. The performance in Health Care was offset somewhat by an overweight as the sector lagged the broader market. A large overweight to the Industrials sector was also a positive as the sector posted strong absolute performance though the Fund’s holdings slightly lagged the benchmark sector. Stock selection in the Financials sector was the biggest relative drag on performance over the period as holdings in the sector failed to keep up with the benchmark.
Portfolio Commentary and Performance Summary (Continued)
First Trust International Developed Capital Strength Portfolio (Continued)
Annual Report
December 31, 2020
| Return Comparison | | |
| | | Cumulative
Total Returns |
| | | Inception (5/1/20)
to 12/31/20 |
| Fund Performance | | |
| First Trust International Developed Capital Strength Portfolio - Class I | | 36.03% |
| First Trust International Developed Capital Strength Portfolio - Class II | | 36.31% |
| Index Performance | | |
| MSCI World ex USA Index(1) | | 32.93% |
The returns for the Fund do not reflect the deduction of expenses associated with variable products, such as mortality and expense risk charges, separate account charges, and sales charges or the effect of taxes. These expenses would reduce the overall returns shown.
| Top Ten Holdings | % of Total
Investments |
| Sony Corp. | 2.5% |
| Chugai Pharmaceutical Co., Ltd. | 2.4 |
| BHP Group Ltd. | 2.4 |
| Nomura Research Institute Ltd. | 2.4 |
| Epiroc AB, Class A | 2.3 |
| Partners Group Holding AG | 2.3 |
| Logitech International S.A. | 2.3 |
| Skanska AB, Class B | 2.3 |
| Wesfarmers Ltd. | 2.2 |
| Adyen N.V. | 2.2 |
| Total | 23.3% |
| Sector Allocation | % of Total
Investments |
| Industrials | 25.9% |
| Information Technology | 16.5 |
| Health Care | 16.3 |
| Financials | 12.2 |
| Consumer Staples | 9.8 |
| Consumer Discretionary | 9.0 |
| Materials | 6.6 |
| Communication Services | 3.7 |
| Total | 100.0% |
| (1) | The MSCI World ex USA Index includes developed markets and is designed to provide a broad measure of stock performance throughout the world, with the exception of U.S.-based companies. |
First Trust Variable Insurance Trust
Understanding Your Fund Expenses
December 31, 2020 (Unaudited)
As a shareholder of First Trust Dow/Jones Dividend & Income Allocation Portfolio, First Trust Multi Income Allocation Portfolio, First Trust Dorsey Wright Tactical Core Portfolio, First Trust Capital Strength Portfolio or First Trust International Developed Capital Strength Portfolio, you incur two types of costs: (1) transaction costs, including sales charges (loads) on purchases of Class A Shares and contingent deferred sales charges on the lesser of purchase price or redemption proceeds of Class C Shares; and (2) ongoing costs, including management fees, distribution and/or service (12b-1) fees, if any, and other Fund expenses. This Example is intended to help you understand your ongoing costs of investing in the Funds and to compare these costs with the ongoing costs of investing in other funds.
The Example is based on an investment of $1,000 invested at the beginning of the period and held through the six-month period ended December 31, 2020.
Actual Expenses
The first three columns of the table below provide information about actual account values and actual expenses. You may use the information in these columns, together with the amount you invested, to estimate the expenses that you paid over the period. Simply divide your account value by $1,000 (for example, an $8,600 account value divided by $1,000 = 8.6), then multiply the result by the number in the third column under the heading entitled “Expenses Paid During Period” to estimate the expenses you paid on your account during this six-month period.
Hypothetical Example for Comparison Purposes
The next three columns of the table below provide information about hypothetical account values and hypothetical expenses based on each Fund’s actual expense ratio and an assumed rate of return of 5% per year before expenses, which is not each Fund’s actual return. The hypothetical account values and expenses may not be used to estimate the actual ending account balance or expenses you paid for the period. You may use this information to compare the ongoing costs of investing in the Funds and other funds. To do so, compare this 5% hypothetical example with the 5% hypothetical examples that appear in the shareholder reports of the other funds.
Please note that the expenses shown in the table are meant to highlight your ongoing costs only and do not reflect any transactional costs such as sales charges (loads) or contingent deferred sales charges. Therefore, the hypothetical section of the table is useful in comparing ongoing costs only, and will not help you determine the relative total costs of owning different funds. In addition, if these transactional costs were included, your costs would have been higher.
| | | Actual Expenses | | Hypothetical
(5% Return Before Expenses) |
| | Beginning
Account
Value
7/1/2020 | Ending
Account
Value
12/31/2020 | Expenses Paid
During Period
7/1/2020 -
12/31/2020 (a) | Beginning
Account
Value
7/1/2020 | | Ending
Account
Value
12/31/2020 | Expenses Paid
During Period
7/1/2020 -
12/31/2020 (a) | Annualized
Expense
Ratios (b) |
First Trust/Dow Jones Dividend
& Income Allocation Portfolio |
Class I
| $ 1,000.00 | $ 1,144.10 | $ 6.47 | $ 1,000.00 | | $ 1,019.10 | $ 6.09 | 1.20% |
Class II
| $ 1,000.00 | $ 1,146.10 | $ 5.12 | $ 1,000.00 | | $ 1,020.36 | $ 4.82 | 0.95% |
First Trust Multi Income Allocation
Portfolio (c) |
Class I
| $ 1,000.00 | $ 1,094.50 | $ 4.32 | $ 1,000.00 | | $ 1,021.01 | $ 4.17 | 0.82% |
Class II
| $ 1,000.00 | $ 1,095.00 | $ 3.00 | $ 1,000.00 | | $ 1,022.27 | $ 2.90 | 0.57% |
First Trust Dorsey Wright Tactical
Core Portfolio (c) |
Class I
| $ 1,000.00 | $ 1,201.70 | $ 4.54 | $ 1,000.00 | | $ 1,021.01 | $ 4.17 | 0.82% |
Class II
| $ 1,000.00 | $ 1,202.00 | $ 3.10 | $ 1,000.00 | | $ 1,022.32 | $ 2.85 | 0.56% |
First Trust Variable Insurance Trust
Understanding Your Fund Expenses (Continued)
December 31, 2020 (Unaudited)
| | Beginning
Account
Value
7/1/2020 | Ending
Account
Value
12/31/2020 | Expenses Paid
During Period
7/1/2020 -
12/31/2020 (a) | Beginning
Account
Value
7/1/2020 | Ending
Account
Value
12/31/2020 | Expenses Paid
During Period
7/1/2020 -
12/31/2020 (a) | Annualized
Expense
Ratios (b) |
| First Trust Capital Strength Portfolio |
Class I
| $ 1,000.00 | $ 1,154.00 | $ 5.96 | $ 1,000.00 | $ 1,019.61 | $ 5.58 | 1.10% |
Class II
| $ 1,000.00 | $ 1,155.50 | $ 4.61 | $ 1,000.00 | $ 1,020.86 | $ 4.32 | 0.85% |
First Trust International Developed
Capital Strength Portfolio |
Class I
| $ 1,000.00 | $ 1,192.20 | $ 6.61 | $ 1,000.00 | $ 1,019.10 | $ 6.09 | 1.20% |
Class II
| $ 1,000.00 | $ 1,193.60 | $ 5.24 | $ 1,000.00 | $ 1,020.36 | $ 4.82 | 0.95% |
| (a) | Expenses are equal to the annualized expense ratios as indicated in the table multiplied by the average account value over the period (July 1, 2020 through December 31, 2020), multiplied by 184/366 (to reflect the six-month period). |
| (b) | These expense ratios reflect expense caps. First Trust Multi Income Allocation Portfolio expense ratios reflect an additional waiver. See Note 3 in the Notes to Financial Statements. |
| (c) | Annualized expense ratio and expenses paid during the six-month period do not include fees and expenses of the underlying funds in which the Fund invests. |
First Trust/Dow Jones Dividend & Income Allocation Portfolio
Portfolio of Investments
December 31, 2020
| Shares | | Description | | Value |
| COMMON STOCKS – 58.2% |
| | | Aerospace & Defense – 1.5% | | |
| 25,514 | | General Dynamics Corp.
| | $3,796,993 |
| 25,094 | | Huntington Ingalls Industries, Inc.
| | 4,278,025 |
| 20,796 | | L3Harris Technologies, Inc.
| | 3,930,860 |
| 11,197 | | Northrop Grumman Corp.
| | 3,411,950 |
| | | | | 15,417,828 |
| | | Air Freight & Logistics – 0.4% | | |
| 39,019 | | Expeditors International of Washington, Inc.
| | 3,711,097 |
| | | Auto Components – 0.5% | | |
| 137,163 | | Gentex Corp.
| | 4,653,941 |
| | | Banks – 9.7% | | |
| 19,053 | | BancFirst Corp.
| | 1,118,411 |
| 138,415 | | BancorpSouth Bank
| | 3,798,108 |
| 69,913 | | Bank of Hawaii Corp.
| | 5,356,734 |
| 41,223 | | Banner Corp.
| | 1,920,580 |
| 119,743 | | Cathay General Bancorp
| | 3,854,527 |
| 65,883 | | Commerce Bancshares, Inc.
| | 4,328,513 |
| 58,668 | | Community Bank System, Inc.
| | 3,655,603 |
| 178,523 | | CVB Financial Corp.
| | 3,481,198 |
| 115,770 | | First Financial Bankshares, Inc.
| | 4,187,980 |
| 244,089 | | First Hawaiian, Inc.
| | 5,755,619 |
| 84,421 | | First Interstate BancSystem, Inc., Class A
| | 3,441,844 |
| 83,962 | | First Merchants Corp.
| | 3,141,018 |
| 244,388 | | Fulton Financial Corp.
| | 3,108,615 |
| 88,310 | | Glacier Bancorp, Inc.
| | 4,063,143 |
| 159,637 | | Hilltop Holdings, Inc.
| | 4,391,614 |
| 41,239 | | Independent Bank Corp.
| | 3,012,097 |
| 98,354 | | International Bancshares Corp.
| | 3,682,374 |
| 34,450 | | Lakeland Financial Corp.
| | 1,845,831 |
| 38,353 | | M&T Bank Corp.
| | 4,882,337 |
| 18,377 | | Park National Corp.
| | 1,929,769 |
| 97,379 | | Popular, Inc.
| | 5,484,385 |
| 68,145 | | Prosperity Bancshares, Inc.
| | 4,726,537 |
| 68,605 | | ServisFirst Bancshares, Inc.
| | 2,764,095 |
| 195,519 | | Simmons First National Corp., Class A
| | 4,221,255 |
| 64,884 | | UMB Financial Corp.
| | 4,476,347 |
| 145,606 | | United Community Banks, Inc.
| | 4,141,035 |
| | | | | 96,769,569 |
| | | Building Products – 1.1% | | |
| 66,894 | | A.O. Smith Corp.
| | 3,667,129 |
| 42,446 | | AAON, Inc.
| | 2,828,177 |
| 35,711 | | Allegion PLC
| | 4,156,046 |
| | | | | 10,651,352 |
| | | Capital Markets – 7.0% | | |
| 102,854 | | Bank of New York Mellon (The) Corp.
| | 4,365,124 |
| 6,268 | | BlackRock, Inc.
| | 4,522,613 |
| 40,254 | | Cboe Global Markets, Inc.
| | 3,748,453 |
| 97,486 | | Charles Schwab (The) Corp.
| | 5,170,657 |
| 46,274 | | Cohen & Steers, Inc.
| | 3,438,158 |
| 92,580 | | Eaton Vance Corp.
| | 6,288,959 |
| 53,957 | | Evercore, Inc., Class A
| | 5,915,846 |
| 10,546 | | FactSet Research Systems, Inc.
| | 3,506,545 |
Page 24
See Notes to Financial Statements
First Trust/Dow Jones Dividend & Income Allocation Portfolio
Portfolio of Investments (Continued)
December 31, 2020
| Shares | | Description | | Value |
| COMMON STOCKS (Continued) |
| | | Capital Markets (Continued) | | |
| 173,561 | | Franklin Resources, Inc.
| | $4,337,289 |
| 59,813 | | Houlihan Lokey, Inc.
| | 4,021,228 |
| 35,301 | | Intercontinental Exchange, Inc.
| | 4,069,852 |
| 45,297 | | Northern Trust Corp.
| | 4,218,963 |
| 48,542 | | Raymond James Financial, Inc.
| | 4,644,013 |
| 9,794 | | S&P Global, Inc.
| | 3,219,582 |
| 69,635 | | SEI Investments Co.
| | 4,001,923 |
| 27,545 | | T Rowe Price Group, Inc.
| | 4,170,038 |
| | | | | 69,639,243 |
| | | Chemicals – 1.1% | | |
| 11,858 | | Air Products & Chemicals, Inc.
| | 3,239,843 |
| 33,349 | | FMC Corp.
| | 3,832,801 |
| 29,026 | | Stepan Co.
| | 3,463,382 |
| | | | | 10,536,026 |
| | | Commercial Services & Supplies – 1.4% | | |
| 39,513 | | McGrath RentCorp
| | 2,651,322 |
| 36,983 | | Tetra Tech, Inc.
| | 4,281,892 |
| 17,348 | | UniFirst Corp.
| | 3,672,398 |
| 31,208 | | Waste Management, Inc.
| | 3,680,360 |
| | | | | 14,285,972 |
| | | Communications Equipment – 0.8% | | |
| 89,667 | | Cisco Systems, Inc.
| | 4,012,598 |
| 164,277 | | Juniper Networks, Inc.
| | 3,697,876 |
| | | | | 7,710,474 |
| | | Construction Materials – 0.4% | | |
| 26,060 | | Vulcan Materials Co.
| | 3,864,959 |
| | | Consumer Finance – 0.4% | | |
| 61,737 | | FirstCash, Inc.
| | 4,324,060 |
| | | Containers & Packaging – 0.4% | | |
| 32,388 | | Packaging Corp. of America
| | 4,466,629 |
| | | Distributors – 0.4% | | |
| 10,557 | | Pool Corp.
| | 3,932,483 |
| | | Diversified Telecommunication Services – 0.3% | | |
| 59,371 | | Verizon Communications, Inc.
| | 3,488,046 |
| | | Electrical Equipment – 0.4% | | |
| 35,533 | | AMETEK, Inc.
| | 4,297,361 |
| | | Electronic Equipment, Instruments & Components – 0.5% | | |
| 53,289 | | Dolby Laboratories, Inc., Class A
| | 5,175,961 |
| | | Equity Real Estate Investment Trusts – 0.7% | | |
| 196,293 | | Piedmont Office Realty Trust, Inc., Class A
| | 3,185,835 |
| 25,249 | | PS Business Parks, Inc.
| | 3,354,835 |
| | | | | 6,540,670 |
| | | Food & Staples Retailing – 0.4% | | |
| 9,949 | | Costco Wholesale Corp.
| | 3,748,584 |
| | | Food Products – 1.4% | | |
| 72,243 | | Hormel Foods Corp.
| | 3,367,246 |
See Notes to Financial Statements
Page 25
First Trust/Dow Jones Dividend & Income Allocation Portfolio
Portfolio of Investments (Continued)
December 31, 2020
| Shares | | Description | | Value |
| COMMON STOCKS (Continued) |
| | | Food Products (Continued) | | |
| 30,574 | | JM Smucker (The) Co.
| | $3,534,354 |
| 19,753 | | Lancaster Colony Corp.
| | 3,629,219 |
| 61,479 | | Mondelez International, Inc., Class A
| | 3,594,677 |
| | | | | 14,125,496 |
| | | Gas Utilities – 0.8% | | |
| 36,947 | | Atmos Energy Corp.
| | 3,525,852 |
| 41,896 | | Chesapeake Utilities Corp.
| | 4,533,566 |
| | | | | 8,059,418 |
| | | Health Care Equipment & Supplies – 0.4% | | |
| 20,047 | | STERIS PLC
| | 3,799,708 |
| | | Health Care Providers & Services – 1.9% | | |
| 36,442 | | AmerisourceBergen Corp.
| | 3,562,570 |
| 13,151 | | Anthem, Inc.
| | 4,222,655 |
| 7,354 | | Chemed Corp.
| | 3,916,814 |
| 8,535 | | Humana, Inc.
| | 3,501,654 |
| 11,328 | | UnitedHealth Group, Inc.
| | 3,972,503 |
| | | | | 19,176,196 |
| | | Household Durables – 0.4% | | |
| 37,233 | | Garmin Ltd.
| | 4,455,301 |
| | | Household Products – 1.1% | | |
| 37,690 | | Church & Dwight Co., Inc.
| | 3,287,699 |
| 25,411 | | Procter & Gamble (The) Co.
| | 3,535,686 |
| 16,873 | | WD-40 Co.
| | 4,482,819 |
| | | | | 11,306,204 |
| | | Industrial Conglomerates – 1.3% | | |
| 28,863 | | Carlisle Cos., Inc.
| | 4,507,823 |
| 21,456 | | Honeywell International, Inc.
| | 4,563,691 |
| 8,940 | | Roper Technologies, Inc.
| | 3,853,945 |
| | | | | 12,925,459 |
| | | Insurance – 4.1% | | |
| 97,166 | | Aflac, Inc.
| | 4,320,972 |
| 37,519 | | Allstate (The) Corp.
| | 4,124,464 |
| 39,949 | | AMERISAFE, Inc.
| | 2,294,271 |
| 78,020 | | Brown & Brown, Inc.
| | 3,698,928 |
| 69,377 | | First American Financial Corp.
| | 3,581,934 |
| 44,203 | | Globe Life, Inc.
| | 4,197,517 |
| 37,905 | | Hanover Insurance Group (The), Inc.
| | 4,431,853 |
| 95,819 | | Hartford Financial Services Group (The), Inc.
| | 4,693,215 |
| 43,535 | | Horace Mann Educators Corp.
| | 1,830,211 |
| 55,695 | | Selective Insurance Group, Inc.
| | 3,730,451 |
| 32,645 | | Travelers (The) Cos., Inc.
| | 4,582,379 |
| | | | | 41,486,195 |
| | | IT Services – 4.3% | | |
| 15,628 | | Accenture PLC, Class A
| | 4,082,190 |
| 25,319 | | Automatic Data Processing, Inc.
| | 4,461,208 |
| 42,564 | | Booz Allen Hamilton Holding Corp.
| | 3,710,729 |
| 50,878 | | Cognizant Technology Solutions Corp., Class A
| | 4,169,452 |
| 90,680 | | Genpact Ltd.
| | 3,750,525 |
| 21,723 | | Jack Henry & Associates, Inc.
| | 3,518,909 |
Page 26
See Notes to Financial Statements
First Trust/Dow Jones Dividend & Income Allocation Portfolio
Portfolio of Investments (Continued)
December 31, 2020
| Shares | | Description | | Value |
| COMMON STOCKS (Continued) |
| | | IT Services (Continued) | | |
| 47,696 | | ManTech International Corp., Class A
| | $4,242,082 |
| 10,445 | | Mastercard, Inc., Class A
| | 3,728,238 |
| 51,628 | | MAXIMUS, Inc.
| | 3,778,653 |
| 44,276 | | Paychex, Inc.
| | 4,125,638 |
| 17,663 | | Visa, Inc., Class A
| | 3,863,428 |
| | | | | 43,431,052 |
| | | Life Sciences Tools & Services – 0.4% | | |
| 8,001 | | Thermo Fisher Scientific, Inc.
| | 3,726,706 |
| | | Machinery – 3.6% | | |
| 23,679 | | Caterpillar, Inc.
| | 4,310,052 |
| 16,725 | | Cummins, Inc.
| | 3,798,248 |
| 55,845 | | Franklin Electric Co., Inc.
| | 3,865,032 |
| 57,570 | | Graco, Inc.
| | 4,165,190 |
| 19,362 | | IDEX Corp.
| | 3,856,910 |
| 38,374 | | Lincoln Electric Holdings, Inc.
| | 4,460,977 |
| 41,416 | | PACCAR, Inc.
| | 3,573,372 |
| 24,006 | | Snap-on, Inc.
| | 4,108,387 |
| 42,074 | | Toro (The) Co.
| | 3,990,298 |
| | | | | 36,128,466 |
| | | Media – 1.3% | | |
| 76,350 | | Comcast Corp., Class A
| | 4,000,740 |
| 211,875 | | Interpublic Group of (The) Cos., Inc.
| | 4,983,300 |
| 71,351 | | Omnicom Group, Inc.
| | 4,450,162 |
| | | | | 13,434,202 |
| | | Metals & Mining – 0.7% | | |
| 55,665 | | Newmont Corp.
| | 3,333,777 |
| 34,614 | | Reliance Steel & Aluminum Co.
| | 4,145,026 |
| | | | | 7,478,803 |
| | | Multiline Retail – 0.4% | | |
| 16,849 | | Dollar General Corp.
| | 3,543,345 |
| | | Pharmaceuticals – 1.4% | | |
| 23,722 | | Johnson & Johnson
| | 3,733,368 |
| 42,580 | | Merck & Co., Inc.
| | 3,483,044 |
| 96,238 | | Pfizer, Inc.
| | 3,542,521 |
| 11,945 | | Viatris, Inc.
| | 223,849 |
| 21,358 | | Zoetis, Inc.
| | 3,534,749 |
| | | | | 14,517,531 |
| | | Professional Services – 0.9% | | |
| 49,036 | | Exponent, Inc.
| | 4,414,711 |
| 66,716 | | Robert Half International, Inc.
| | 4,168,416 |
| | | | | 8,583,127 |
| | | Road & Rail – 1.7% | | |
| 28,145 | | Landstar System, Inc.
| | 3,790,006 |
| 88,108 | | Marten Transport Ltd.
| | 1,518,101 |
| 16,505 | | Norfolk Southern Corp.
| | 3,921,753 |
| 19,523 | | Old Dominion Freight Line, Inc.
| | 3,810,499 |
| 17,941 | | Union Pacific Corp.
| | 3,735,675 |
| | | | | 16,776,034 |
See Notes to Financial Statements
Page 27
First Trust/Dow Jones Dividend & Income Allocation Portfolio
Portfolio of Investments (Continued)
December 31, 2020
| Shares | | Description | | Value |
| COMMON STOCKS (Continued) |
| | | Semiconductors & Semiconductor Equipment – 1.8% | | |
| 59,411 | | Applied Materials, Inc.
| | $5,127,169 |
| 68,211 | | Intel Corp.
| | 3,398,272 |
| 63,754 | | Power Integrations, Inc.
| | 5,218,902 |
| 24,735 | | Texas Instruments, Inc.
| | 4,059,756 |
| | | | | 17,804,099 |
| | | Software – 0.8% | | |
| 10,828 | | Intuit, Inc.
| | 4,113,016 |
| 16,792 | | Microsoft Corp.
| | 3,734,876 |
| | | | | 7,847,892 |
| | | Specialty Retail – 0.3% | | |
| 24,642 | | Tractor Supply Co.
| | 3,464,172 |
| | | Thrifts & Mortgage Finance – 0.6% | | |
| 210,176 | | Northwest Bancshares, Inc.
| | 2,677,642 |
| 65,870 | | WSFS Financial Corp.
| | 2,956,246 |
| | | | | 5,633,888 |
| | | Trading Companies & Distributors – 1.2% | | |
| 78,333 | | Fastenal Co.
| | 3,825,000 |
| 55,815 | | MSC Industrial Direct Co., Inc., Class A
| | 4,710,228 |
| 15,165 | | Watsco, Inc.
| | 3,435,631 |
| | | | | 11,970,859 |
| | | Total Common Stocks
| | 582,888,408 |
| | | (Cost $467,106,776) | | |
Principal
Value | | Description | | Stated
Coupon | | Stated
Maturity | | Value |
| CORPORATE BONDS AND NOTES – 35.5% |
| | | Aerospace & Defense – 1.1% | | | | | | |
| $750,000 | | Boeing (The) Co.
| | 1.88% | | 06/15/23 | | 763,462 |
| 500,000 | | Boeing (The) Co.
| | 1.95% | | 02/01/24 | | 515,324 |
| 500,000 | | Boeing (The) Co.
| | 2.75% | | 02/01/26 | | 526,143 |
| 500,000 | | Boeing (The) Co.
| | 2.70% | | 02/01/27 | | 520,357 |
| 500,000 | | Boeing (The) Co.
| | 3.25% | | 02/01/28 | | 537,091 |
| 250,000 | | Boeing (The) Co.
| | 3.20% | | 03/01/29 | | 264,093 |
| 500,000 | | Boeing (The) Co.
| | 2.95% | | 02/01/30 | | 517,531 |
| 500,000 | | Boeing (The) Co.
| | 3.63% | | 02/01/31 | | 548,102 |
| 750,000 | | Boeing (The) Co.
| | 3.75% | | 02/01/50 | | 790,094 |
| 500,000 | | L3Harris Technologies, Inc.
| | 1.80% | | 01/15/31 | | 508,706 |
| 383,000 | | Lockheed Martin Corp.
| | 4.09% | | 09/15/52 | | 507,956 |
| 500,000 | | Northrop Grumman Corp.
| | 2.55% | | 10/15/22 | | 519,131 |
| 500,000 | | Northrop Grumman Corp.
| | 2.93% | | 01/15/25 | | 544,128 |
| 500,000 | | Northrop Grumman Corp.
| | 3.25% | | 01/15/28 | | 565,766 |
| 750,000 | | Northrop Grumman Corp.
| | 4.03% | | 10/15/47 | | 942,674 |
| 250,000 | | Northrop Grumman Corp.
| | 5.25% | | 05/01/50 | | 372,931 |
| 250,000 | | Raytheon Technologies Corp.
| | 3.95% | | 08/16/25 | | 286,847 |
| 250,000 | | Raytheon Technologies Corp.
| | 2.25% | | 07/01/30 | | 265,882 |
| 500,000 | | Raytheon Technologies Corp.
| | 4.63% | | 11/16/48 | | 679,973 |
| 250,000 | | Raytheon Technologies Corp.
| | 3.13% | | 07/01/50 | | 276,212 |
| 500,000 | | Textron, Inc.
| | 2.45% | | 03/15/31 | | 515,907 |
| | | | | 10,968,310 |
Page 28
See Notes to Financial Statements
First Trust/Dow Jones Dividend & Income Allocation Portfolio
Portfolio of Investments (Continued)
December 31, 2020
Principal
Value | | Description | | Stated
Coupon | | Stated
Maturity | | Value |
| CORPORATE BONDS AND NOTES (Continued) |
| | | Air Freight & Logistics – 0.7% | | | | | | |
| $394,000 | | FedEx Corp.
| | 3.40% | | 01/14/22 | | $406,570 |
| 850,000 | | FedEx Corp.
| | 3.30% | | 03/15/27 | | 953,637 |
| 500,000 | | FedEx Corp.
| | 4.20% | | 10/17/28 | | 594,655 |
| 648,000 | | FedEx Corp.
| | 4.55% | | 04/01/46 | | 834,993 |
| 550,000 | | FedEx Corp.
| | 4.40% | | 01/15/47 | | 697,237 |
| 250,000 | | United Parcel Service, Inc.
| | 2.20% | | 09/01/24 | | 265,652 |
| 250,000 | | United Parcel Service, Inc.
| | 2.80% | | 11/15/24 | | 270,327 |
| 500,000 | | United Parcel Service, Inc.
| | 2.40% | | 11/15/26 | | 546,495 |
| 250,000 | | United Parcel Service, Inc.
| | 3.05% | | 11/15/27 | | 286,613 |
| 500,000 | | United Parcel Service, Inc.
| | 3.40% | | 03/15/29 | | 583,352 |
| 250,000 | | United Parcel Service, Inc.
| | 2.50% | | 09/01/29 | | 272,777 |
| 500,000 | | United Parcel Service, Inc.
| | 3.40% | | 11/15/46 | | 604,248 |
| 500,000 | | United Parcel Service, Inc.
| | 4.25% | | 03/15/49 | | 684,389 |
| 250,000 | | United Parcel Service, Inc.
| | 3.40% | | 09/01/49 | | 306,832 |
| | | | | 7,307,777 |
| | | Airlines – 0.1% | | | | | | |
| 250,000 | | Southwest Airlines Co.
| | 5.25% | | 05/04/25 | | 289,764 |
| 250,000 | | Southwest Airlines Co.
| | 5.13% | | 06/15/27 | | 297,730 |
| | | | | 587,494 |
| | | Automobiles – 0.1% | | | | | | |
| 243,000 | | General Motors Co.
| | 5.40% | | 10/02/23 | | 272,273 |
| 590,000 | | Hyundai Capital America (a)
| | 1.25% | | 09/18/23 | | 597,389 |
| | | | | 869,662 |
| | | Banks – 6.4% | | | | | | |
| 500,000 | | Bank of America Corp. (b)
| | 2.88% | | 04/24/23 | | 516,058 |
| 500,000 | | Bank of America Corp. (b)
| | 2.82% | | 07/21/23 | | 519,373 |
| 1,207,000 | | Bank of America Corp. (b)
| | 3.00% | | 12/20/23 | | 1,270,866 |
| 500,000 | | Bank of America Corp. (b)
| | 3.55% | | 03/05/24 | | 534,313 |
| 450,000 | | Bank of America Corp.
| | 4.00% | | 04/01/24 | | 499,758 |
| 500,000 | | Bank of America Corp. (b)
| | 3.86% | | 07/23/24 | | 542,300 |
| 3,000,000 | | Bank of America Corp. (b)
| | 0.81% | | 10/24/24 | | 3,029,291 |
| 500,000 | | Bank of America Corp. (b)
| | 3.46% | | 03/15/25 | | 544,645 |
| 250,000 | | Bank of America Corp. (b)
| | 0.98% | | 09/25/25 | | 252,904 |
| 500,000 | | Bank of America Corp. (b)
| | 3.09% | | 10/01/25 | | 541,547 |
| 500,000 | | Bank of America Corp. (b)
| | 2.46% | | 10/22/25 | | 533,306 |
| 250,000 | | Bank of America Corp. (b)
| | 3.37% | | 01/23/26 | | 275,383 |
| 750,000 | | Bank of America Corp. (b)
| | 2.02% | | 02/13/26 | | 786,497 |
| 400,000 | | Bank of America Corp.
| | 4.45% | | 03/03/26 | | 466,438 |
| 950,000 | | Bank of America Corp.
| | 3.50% | | 04/19/26 | | 1,077,451 |
| 250,000 | | Bank of America Corp. (b)
| | 1.32% | | 06/19/26 | | 255,554 |
| 1,000,000 | | Bank of America Corp. (b)
| | 1.20% | | 10/24/26 | | 1,013,787 |
| 500,000 | | Bank of America Corp. (b)
| | 3.56% | | 04/23/27 | | 564,830 |
| 250,000 | | Bank of America Corp.
| | 4.18% | | 11/25/27 | | 290,252 |
| 500,000 | | Bank of America Corp. (b)
| | 3.82% | | 01/20/28 | | 574,609 |
| 500,000 | | Bank of America Corp. (b)
| | 3.71% | | 04/24/28 | | 569,553 |
| 500,000 | | Bank of America Corp. (b)
| | 3.59% | | 07/21/28 | | 568,345 |
| 1,091,000 | | Bank of America Corp. (b)
| | 3.42% | | 12/20/28 | | 1,233,104 |
| 250,000 | | Bank of America Corp. (b)
| | 3.97% | | 03/05/29 | | 292,268 |
| 500,000 | | Bank of America Corp. (b)
| | 4.27% | | 07/23/29 | | 595,765 |
| 500,000 | | Bank of America Corp. (b)
| | 3.97% | | 02/07/30 | | 589,331 |
| 500,000 | | Bank of America Corp. (b)
| | 3.19% | | 07/23/30 | | 560,768 |
| 500,000 | | Bank of America Corp. (b)
| | 2.88% | | 10/22/30 | | 549,485 |
See Notes to Financial Statements
Page 29
First Trust/Dow Jones Dividend & Income Allocation Portfolio
Portfolio of Investments (Continued)
December 31, 2020
Principal
Value | | Description | | Stated
Coupon | | Stated
Maturity | | Value |
| CORPORATE BONDS AND NOTES (Continued) |
| | | Banks (Continued) | | | | | | |
| $250,000 | | Bank of America Corp. (b)
| | 2.50% | | 02/13/31 | | $265,734 |
| 250,000 | | Bank of America Corp. (b)
| | 2.59% | | 04/29/31 | | 268,162 |
| 500,000 | | Bank of America Corp. (b)
| | 1.90% | | 07/23/31 | | 505,611 |
| 1,000,000 | | Bank of America Corp. (b)
| | 1.92% | | 10/24/31 | | 1,014,124 |
| 250,000 | | Bank of America Corp. (b)
| | 4.24% | | 04/24/38 | | 308,357 |
| 500,000 | | Bank of America Corp. (b)
| | 4.08% | | 04/23/40 | | 616,463 |
| 500,000 | | Bank of America Corp. (b)
| | 2.68% | | 06/19/41 | | 522,536 |
| 250,000 | | Bank of America Corp. (b)
| | 4.44% | | 01/20/48 | | 331,740 |
| 500,000 | | Bank of America Corp. (b)
| | 3.95% | | 01/23/49 | | 626,078 |
| 500,000 | | Bank of America Corp. (b)
| | 4.33% | | 03/15/50 | | 657,160 |
| 500,000 | | Bank of America Corp. (b)
| | 2.83% | | 10/24/51 | | 522,596 |
| 1,000,000 | | Citigroup, Inc. (b)
| | 2.31% | | 11/04/22 | | 1,016,146 |
| 500,000 | | Citigroup, Inc. (b)
| | 2.88% | | 07/24/23 | | 519,510 |
| 5,000,000 | | Citigroup, Inc. (b)
| | 0.78% | | 10/30/24 | | 5,035,242 |
| 500,000 | | Citigroup, Inc. (b)
| | 3.35% | | 04/24/25 | | 543,845 |
| 450,000 | | Citigroup, Inc.
| | 4.60% | | 03/09/26 | | 527,720 |
| 500,000 | | Citigroup, Inc. (b)
| | 3.11% | | 04/08/26 | | 547,050 |
| 300,000 | | Citigroup, Inc.
| | 3.40% | | 05/01/26 | | 337,923 |
| 250,000 | | Citigroup, Inc.
| | 3.20% | | 10/21/26 | | 279,632 |
| 300,000 | | Citigroup, Inc.
| | 4.30% | | 11/20/26 | | 349,722 |
| 350,000 | | Citigroup, Inc.
| | 4.45% | | 09/29/27 | | 413,994 |
| 500,000 | | Citigroup, Inc. (b)
| | 3.89% | | 01/10/28 | | 573,351 |
| 1,000,000 | | Citigroup, Inc. (b)
| | 3.67% | | 07/24/28 | | 1,134,373 |
| 500,000 | | Citigroup, Inc.
| | 4.13% | | 07/25/28 | | 585,226 |
| 500,000 | | Citigroup, Inc. (b)
| | 3.52% | | 10/27/28 | | 565,623 |
| 250,000 | | Citigroup, Inc. (b)
| | 4.08% | | 04/23/29 | | 293,409 |
| 500,000 | | Citigroup, Inc. (b)
| | 3.98% | | 03/20/30 | | 588,424 |
| 1,000,000 | | Citigroup, Inc. (b)
| | 2.98% | | 11/05/30 | | 1,102,175 |
| 500,000 | | Citigroup, Inc. (b)
| | 2.67% | | 01/29/31 | | 537,050 |
| 250,000 | | Citigroup, Inc. (b)
| | 2.57% | | 06/03/31 | | 266,689 |
| 500,000 | | Citigroup, Inc. (b)
| | 3.88% | | 01/24/39 | | 597,382 |
| 750,000 | | Citigroup, Inc.
| | 4.75% | | 05/18/46 | | 1,003,644 |
| 500,000 | | Citigroup, Inc. (b)
| | 4.28% | | 04/24/48 | | 655,854 |
| 500,000 | | Citigroup, Inc.
| | 4.65% | | 07/23/48 | | 691,416 |
| 500,000 | | First Republic Bank (CA) (b)
| | 1.91% | | 02/12/24 | | 515,045 |
| 325,000 | | JPMorgan Chase & Co.
| | 3.20% | | 01/25/23 | | 344,153 |
| 500,000 | | JPMorgan Chase & Co. (b)
| | 3.21% | | 04/01/23 | | 518,252 |
| 250,000 | | JPMorgan Chase & Co. (b)
| | 2.78% | | 04/25/23 | | 258,184 |
| 500,000 | | JPMorgan Chase & Co.
| | 2.70% | | 05/18/23 | | 525,786 |
| 400,000 | | JPMorgan Chase & Co.
| | 3.88% | | 02/01/24 | | 440,625 |
| 250,000 | | JPMorgan Chase & Co. (b)
| | 3.56% | | 04/23/24 | | 268,044 |
| 837,000 | | JPMorgan Chase & Co. (b)
| | 1.51% | | 06/01/24 | | 859,649 |
| 250,000 | | JPMorgan Chase & Co. (b)
| | 3.80% | | 07/23/24 | | 271,289 |
| 500,000 | | JPMorgan Chase & Co. (b)
| | 2.30% | | 10/15/25 | | 531,052 |
| 850,000 | | JPMorgan Chase & Co.
| | 3.30% | | 04/01/26 | | 951,999 |
| 500,000 | | JPMorgan Chase & Co. (b)
| | 1.05% | | 11/19/26 | | 505,890 |
| 300,000 | | JPMorgan Chase & Co.
| | 4.13% | | 12/15/26 | | 351,189 |
| 250,000 | | JPMorgan Chase & Co.
| | 3.63% | | 12/01/27 | | 284,287 |
| 500,000 | | JPMorgan Chase & Co. (b)
| | 3.78% | | 02/01/28 | | 575,000 |
| 500,000 | | JPMorgan Chase & Co. (b)
| | 3.54% | | 05/01/28 | | 571,196 |
| 500,000 | | JPMorgan Chase & Co. (b)
| | 3.51% | | 01/23/29 | | 569,182 |
| 250,000 | | JPMorgan Chase & Co. (b)
| | 4.01% | | 04/23/29 | | 293,793 |
| 500,000 | | JPMorgan Chase & Co. (b)
| | 4.20% | | 07/23/29 | | 598,387 |
| 500,000 | | JPMorgan Chase & Co. (b)
| | 3.70% | | 05/06/30 | | 580,444 |
Page 30
See Notes to Financial Statements
First Trust/Dow Jones Dividend & Income Allocation Portfolio
Portfolio of Investments (Continued)
December 31, 2020
Principal
Value | | Description | | Stated
Coupon | | Stated
Maturity | | Value |
| CORPORATE BONDS AND NOTES (Continued) |
| | | Banks (Continued) | | | | | | |
| $500,000 | | JPMorgan Chase & Co. (b)
| | 2.96% | | 05/13/31 | | $548,973 |
| 500,000 | | JPMorgan Chase & Co. (b)
| | 1.76% | | 11/19/31 | | 505,200 |
| 400,000 | | JPMorgan Chase & Co.
| | 6.40% | | 05/15/38 | | 620,509 |
| 250,000 | | JPMorgan Chase & Co. (b)
| | 3.88% | | 07/24/38 | | 304,840 |
| 500,000 | | JPMorgan Chase & Co. (b)
| | 2.53% | | 11/19/41 | | 513,958 |
| 500,000 | | JPMorgan Chase & Co. (b)
| | 4.26% | | 02/22/48 | | 655,963 |
| 750,000 | | JPMorgan Chase & Co. (b)
| | 3.96% | | 11/15/48 | | 945,572 |
| 500,000 | | JPMorgan Chase & Co. (b)
| | 3.90% | | 01/23/49 | | 631,471 |
| 500,000 | | Wells Fargo & Co.
| | 2.63% | | 07/22/22 | | 517,717 |
| 500,000 | | Wells Fargo & Co. (b)
| | 1.65% | | 06/02/24 | | 514,063 |
| 425,000 | | Wells Fargo & Co.
| | 3.30% | | 09/09/24 | | 465,709 |
| 500,000 | | Wells Fargo & Co. (b)
| | 2.41% | | 10/30/25 | | 528,879 |
| 500,000 | | Wells Fargo & Co. (b)
| | 2.16% | | 02/11/26 | | 526,081 |
| 550,000 | | Wells Fargo & Co.
| | 3.00% | | 04/22/26 | | 605,777 |
| 250,000 | | Wells Fargo & Co.
| | 3.00% | | 10/23/26 | | 277,215 |
| 500,000 | | Wells Fargo & Co. (b)
| | 3.58% | | 05/22/28 | | 567,122 |
| 500,000 | | Wells Fargo & Co. (b)
| | 2.88% | | 10/30/30 | | 545,923 |
| 275,000 | | Wells Fargo & Co.
| | 4.40% | | 06/14/46 | | 344,820 |
| 750,000 | | Wells Fargo & Co.
| | 4.75% | | 12/07/46 | | 983,162 |
| 500,000 | | Wells Fargo Bank N.A. (b)
| | 2.08% | | 09/09/22 | | 505,784 |
| | | | | 63,773,926 |
| | | Beverages – 0.7% | | | | | | |
| 875,000 | | Anheuser-Busch Cos., LLC/Anheuser-Busch InBev Worldwide, Inc.
| | 4.70% | | 02/01/36 | | 1,112,733 |
| 1,100,000 | | Anheuser-Busch Cos., LLC/Anheuser-Busch InBev Worldwide, Inc.
| | 4.90% | | 02/01/46 | | 1,434,726 |
| 250,000 | | Anheuser-Busch Inbev Worldwide, Inc.
| | 4.15% | | 01/23/25 | | 284,778 |
| 250,000 | | Anheuser-Busch Inbev Worldwide, Inc.
| | 4.75% | | 01/23/29 | | 308,931 |
| 250,000 | | Anheuser-Busch Inbev Worldwide, Inc.
| | 4.90% | | 01/23/31 | | 318,701 |
| 250,000 | | Anheuser-Busch Inbev Worldwide, Inc.
| | 4.38% | | 04/15/38 | | 309,935 |
| 250,000 | | Anheuser-Busch Inbev Worldwide, Inc.
| | 4.35% | | 06/01/40 | | 307,569 |
| 250,000 | | Anheuser-Busch Inbev Worldwide, Inc.
| | 4.60% | | 04/15/48 | | 316,879 |
| 250,000 | | Anheuser-Busch Inbev Worldwide, Inc.
| | 5.55% | | 01/23/49 | | 356,048 |
| 250,000 | | Anheuser-Busch Inbev Worldwide, Inc.
| | 4.50% | | 06/01/50 | | 316,121 |
| 250,000 | | Anheuser-Busch Inbev Worldwide, Inc.
| | 4.75% | | 04/15/58 | | 328,122 |
| 250,000 | | Anheuser-Busch Inbev Worldwide, Inc.
| | 5.80% | | 01/23/59 | | 385,957 |
| 975,000 | | Coca-Cola (The) Co.
| | 3.20% | | 11/01/23 | | 1,057,697 |
| 500,000 | | Coca-Cola (The) Co.
| | 1.75% | | 09/06/24 | | 524,013 |
| | | | | 7,362,210 |
| | | Biotechnology – 1.7% | | | | | | |
| 2,000,000 | | AbbVie, Inc.
| | 2.15% | | 11/19/21 | | 2,032,477 |
| 375,000 | | AbbVie, Inc.
| | 2.90% | | 11/06/22 | | 392,421 |
| 2,000,000 | | AbbVie, Inc.
| | 2.30% | | 11/21/22 | | 2,073,565 |
| 250,000 | | AbbVie, Inc.
| | 3.75% | | 11/14/23 | | 272,744 |
| 1,000,000 | | AbbVie, Inc.
| | 2.60% | | 11/21/24 | | 1,072,380 |
| 250,000 | | AbbVie, Inc.
| | 3.60% | | 05/14/25 | | 278,683 |
| 1,000,000 | | AbbVie, Inc.
| | 2.95% | | 11/21/26 | | 1,106,728 |
| 250,000 | | AbbVie, Inc.
| | 4.25% | | 11/14/28 | | 299,927 |
| 1,000,000 | | AbbVie, Inc.
| | 3.20% | | 11/21/29 | | 1,122,403 |
| 500,000 | | AbbVie, Inc.
| | 4.05% | | 11/21/39 | | 606,749 |
| 275,000 | | AbbVie, Inc.
| | 4.40% | | 11/06/42 | | 345,850 |
| 300,000 | | AbbVie, Inc.
| | 4.70% | | 05/14/45 | | 393,078 |
| 250,000 | | AbbVie, Inc.
| | 4.88% | | 11/14/48 | | 338,689 |
| 1,000,000 | | AbbVie, Inc.
| | 4.25% | | 11/21/49 | | 1,258,295 |
| 450,000 | | Amgen, Inc.
| | 2.70% | | 05/01/22 | | 463,101 |
See Notes to Financial Statements
Page 31
First Trust/Dow Jones Dividend & Income Allocation Portfolio
Portfolio of Investments (Continued)
December 31, 2020
Principal
Value | | Description | | Stated
Coupon | | Stated
Maturity | | Value |
| CORPORATE BONDS AND NOTES (Continued) |
| | | Biotechnology (Continued) | | | | | | |
| $500,000 | | Amgen, Inc.
| | 1.90% | | 02/21/25 | | $526,578 |
| 750,000 | | Amgen, Inc.
| | 2.20% | | 02/21/27 | | 804,460 |
| 500,000 | | Amgen, Inc.
| | 2.45% | | 02/21/30 | | 536,268 |
| 250,000 | | Amgen, Inc.
| | 2.30% | | 02/25/31 | | 267,121 |
| 750,000 | | Amgen, Inc.
| | 3.15% | | 02/21/40 | | 827,973 |
| 750,000 | | Amgen, Inc.
| | 3.38% | | 02/21/50 | | 840,341 |
| 500,000 | | Gilead Sciences, Inc.
| | 1.20% | | 10/01/27 | | 504,258 |
| 500,000 | | Gilead Sciences, Inc.
| | 1.65% | | 10/01/30 | | 502,818 |
| 500,000 | | Gilead Sciences, Inc.
| | 2.80% | | 10/01/50 | | 498,209 |
| | | | | 17,365,116 |
| | | Capital Markets – 2.8% | | | | | | |
| 500,000 | | Cboe Global Markets, Inc.
| | 1.63% | | 12/15/30 | | 506,331 |
| 500,000 | | Charles Schwab (The) Corp.
| | 0.90% | | 03/11/26 | | 506,778 |
| 500,000 | | Goldman Sachs Group (The), Inc.
| | 3.00% | | 04/26/22 | | 504,081 |
| 500,000 | | Goldman Sachs Group (The), Inc. (b)
| | 2.88% | | 10/31/22 | | 510,210 |
| 700,000 | | Goldman Sachs Group (The), Inc.
| | 3.63% | | 01/22/23 | | 747,216 |
| 250,000 | | Goldman Sachs Group (The), Inc. (b)
| | 2.91% | | 06/05/23 | | 258,942 |
| 500,000 | | Goldman Sachs Group (The), Inc. (b)
| | 2.91% | | 07/24/23 | | 519,478 |
| 715,000 | | Goldman Sachs Group (The), Inc. (b)
| | 0.63% | | 11/17/23 | | 718,159 |
| 500,000 | | Goldman Sachs Group (The), Inc.
| | 3.63% | | 02/20/24 | | 544,711 |
| 600,000 | | Goldman Sachs Group (The), Inc.
| | 4.00% | | 03/03/24 | | 663,282 |
| 500,000 | | Goldman Sachs Group (The), Inc.
| | 3.50% | | 04/01/25 | | 555,929 |
| 500,000 | | Goldman Sachs Group (The), Inc. (b)
| | 3.27% | | 09/29/25 | | 548,004 |
| 600,000 | | Goldman Sachs Group (The), Inc.
| | 4.25% | | 10/21/25 | | 688,535 |
| 550,000 | | Goldman Sachs Group (The), Inc.
| | 3.75% | | 02/25/26 | | 625,195 |
| 500,000 | | Goldman Sachs Group (The), Inc.
| | 3.50% | | 11/16/26 | | 561,702 |
| 500,000 | | Goldman Sachs Group (The), Inc. (b)
| | 1.09% | | 12/09/26 | | 506,102 |
| 750,000 | | Goldman Sachs Group (The), Inc.
| | 3.85% | | 01/26/27 | | 856,294 |
| 250,000 | | Goldman Sachs Group (The), Inc. (b)
| | 3.69% | | 06/05/28 | | 288,173 |
| 500,000 | | Goldman Sachs Group (The), Inc. (b)
| | 3.81% | | 04/23/29 | | 579,084 |
| 500,000 | | Goldman Sachs Group (The), Inc. (b)
| | 4.22% | | 05/01/29 | | 593,562 |
| 500,000 | | Goldman Sachs Group (The), Inc.
| | 2.60% | | 02/07/30 | | 538,466 |
| 500,000 | | Goldman Sachs Group (The), Inc. (b)
| | 4.02% | | 10/31/38 | | 610,946 |
| 500,000 | | Goldman Sachs Group (The), Inc. (b)
| | 4.41% | | 04/23/39 | | 640,014 |
| 400,000 | | Goldman Sachs Group (The), Inc.
| | 6.25% | | 02/01/41 | | 627,300 |
| 250,000 | | Intercontinental Exchange, Inc.
| | 1.85% | | 09/15/32 | | 252,595 |
| 250,000 | | Intercontinental Exchange, Inc.
| | 2.65% | | 09/15/40 | | 258,164 |
| 250,000 | | Intercontinental Exchange, Inc.
| | 3.00% | | 09/15/60 | | 263,060 |
| 500,000 | | Morgan Stanley
| | 2.63% | | 11/17/21 | | 509,935 |
| 1,000,000 | | Morgan Stanley
| | 2.75% | | 05/19/22 | | 1,032,934 |
| 500,000 | | Morgan Stanley
| | 3.13% | | 01/23/23 | | 527,843 |
| 300,000 | | Morgan Stanley
| | 3.75% | | 02/25/23 | | 321,752 |
| 235,000 | | Morgan Stanley (b)
| | 0.56% | | 11/10/23 | | 235,609 |
| 500,000 | | Morgan Stanley (b)
| | 3.74% | | 04/24/24 | | 538,158 |
| 450,000 | | Morgan Stanley
| | 3.88% | | 04/29/24 | | 498,753 |
| 250,000 | | Morgan Stanley (b)
| | 2.72% | | 07/22/25 | | 267,531 |
| 1,000,000 | | Morgan Stanley (b)
| | 0.86% | | 10/21/25 | | 1,008,783 |
| 800,000 | | Morgan Stanley
| | 3.88% | | 01/27/26 | | 918,087 |
| 500,000 | | Morgan Stanley (b)
| | 2.19% | | 04/28/26 | | 528,557 |
| 250,000 | | Morgan Stanley
| | 4.35% | | 09/08/26 | | 294,973 |
| 250,000 | | Morgan Stanley (b)
| | 0.99% | | 12/10/26 | | 252,042 |
| 250,000 | | Morgan Stanley
| | 3.63% | | 01/20/27 | | 286,540 |
| 500,000 | | Morgan Stanley (b)
| | 3.59% | | 07/22/28 | | 571,353 |
Page 32
See Notes to Financial Statements
First Trust/Dow Jones Dividend & Income Allocation Portfolio
Portfolio of Investments (Continued)
December 31, 2020
Principal
Value | | Description | | Stated
Coupon | | Stated
Maturity | | Value |
| CORPORATE BONDS AND NOTES (Continued) |
| | | Capital Markets (Continued) | | | | | | |
| $500,000 | | Morgan Stanley (b)
| | 3.77% | | 01/24/29 | | $580,008 |
| 500,000 | | Morgan Stanley (b)
| | 4.43% | | 01/23/30 | | 608,626 |
| 500,000 | | Morgan Stanley (b)
| | 2.70% | | 01/22/31 | | 545,036 |
| 1,000,000 | | Morgan Stanley (b)
| | 1.79% | | 02/13/32 | | 1,008,078 |
| 500,000 | | Morgan Stanley (b)
| | 3.97% | | 07/22/38 | | 617,018 |
| 500,000 | | Morgan Stanley (b)
| | 4.46% | | 04/22/39 | | 650,966 |
| 350,000 | | Morgan Stanley
| | 6.38% | | 07/24/42 | | 572,409 |
| 500,000 | | Nasdaq, Inc.
| | 1.65% | | 01/15/31 | | 496,085 |
| 750,000 | | Nasdaq, Inc.
| | 2.50% | | 12/21/40 | | 742,057 |
| | | | | 28,085,446 |
| | | Chemicals – 0.6% | | | | | | |
| 500,000 | | Dow Chemical (The) Co.
| | 3.63% | | 05/15/26 | | 563,799 |
| 250,000 | | Dow Chemical (The) Co.
| | 2.10% | | 11/15/30 | | 256,780 |
| 250,000 | | Dow Chemical (The) Co.
| | 4.80% | | 05/15/49 | | 338,800 |
| 250,000 | | Dow Chemical (The) Co.
| | 3.60% | | 11/15/50 | | 281,415 |
| 250,000 | | EI du Pont de Nemours and Co.
| | 1.70% | | 07/15/25 | | 260,695 |
| 250,000 | | EI du Pont de Nemours and Co.
| | 2.30% | | 07/15/30 | | 266,261 |
| 500,000 | | LYB International Finance III, LLC
| | 3.38% | | 10/01/40 | | 529,256 |
| 500,000 | | LYB International Finance III, LLC
| | 3.63% | | 04/01/51 | | 548,411 |
| 750,000 | | LYB International Finance III, LLC
| | 3.80% | | 10/01/60 | | 809,735 |
| 500,000 | | Nutrition & Biosciences, Inc. (a)
| | 1.23% | | 10/01/25 | | 505,650 |
| 500,000 | | Nutrition & Biosciences, Inc. (a)
| | 1.83% | | 10/15/27 | | 515,653 |
| 500,000 | | Nutrition & Biosciences, Inc. (a)
| | 2.30% | | 11/01/30 | | 515,453 |
| 500,000 | | Nutrition & Biosciences, Inc. (a)
| | 3.27% | | 11/15/40 | | 538,079 |
| 500,000 | | Nutrition & Biosciences, Inc. (a)
| | 3.47% | | 12/01/50 | | 544,163 |
| | | | | 6,474,150 |
| | | Commercial Services & Supplies – 0.2% | | | | | | |
| 250,000 | | Republic Services, Inc.
| | 2.50% | | 08/15/24 | | 267,105 |
| 500,000 | | Republic Services, Inc.
| | 0.88% | | 11/15/25 | | 504,158 |
| 500,000 | | Republic Services, Inc.
| | 1.45% | | 02/15/31 | | 489,810 |
| 500,000 | | Republic Services, Inc.
| | 1.75% | | 02/15/32 | | 501,693 |
| 500,000 | | Republic Services, Inc.
| | 3.05% | | 03/01/50 | | 548,334 |
| | | | | 2,311,100 |
| | | Communications Equipment – 0.1% | | | | | | |
| 500,000 | | Cisco Systems, Inc.
| | 3.63% | | 03/04/24 | | 550,058 |
| | | Consumer Finance – 1.1% | | | | | | |
| 1,890,000 | | Ally Financial, Inc.
| | 1.45% | | 10/02/23 | | 1,930,355 |
| 250,000 | | American Express Co.
| | 2.50% | | 08/01/22 | | 258,017 |
| 250,000 | | American Express Co.
| | 3.70% | | 08/03/23 | | 270,853 |
| 250,000 | | American Express Co.
| | 3.40% | | 02/22/24 | | 271,439 |
| 500,000 | | American Express Co.
| | 2.50% | | 07/30/24 | | 533,939 |
| 500,000 | | American Express Co.
| | 3.00% | | 10/30/24 | | 546,391 |
| 250,000 | | American Express Co.
| | 4.20% | | 11/06/25 | | 290,583 |
| 333,000 | | Capital One Financial Corp.
| | 2.60% | | 05/11/23 | | 349,109 |
| 250,000 | | Capital One Financial Corp.
| | 4.25% | | 04/30/25 | | 285,634 |
| 500,000 | | Caterpillar Financial Services Corp.
| | 1.95% | | 11/18/22 | | 516,156 |
| 1,000,000 | | Caterpillar Financial Services Corp.
| | 0.80% | | 11/13/25 | | 1,008,708 |
| 500,000 | | Discover Bank
| | 3.35% | | 02/06/23 | | 527,903 |
| 250,000 | | General Motors Financial Co., Inc.
| | 3.20% | | 07/06/21 | | 252,710 |
| 500,000 | | General Motors Financial Co., Inc.
| | 4.20% | | 11/06/21 | | 515,423 |
| 250,000 | | General Motors Financial Co., Inc.
| | 3.55% | | 07/08/22 | | 260,818 |
See Notes to Financial Statements
Page 33
First Trust/Dow Jones Dividend & Income Allocation Portfolio
Portfolio of Investments (Continued)
December 31, 2020
Principal
Value | | Description | | Stated
Coupon | | Stated
Maturity | | Value |
| CORPORATE BONDS AND NOTES (Continued) |
| | | Consumer Finance (Continued) | | | | | | |
| $250,000 | | General Motors Financial Co., Inc.
| | 5.20% | | 03/20/23 | | $274,238 |
| 500,000 | | General Motors Financial Co., Inc.
| | 1.70% | | 08/18/23 | | 513,206 |
| 250,000 | | General Motors Financial Co., Inc.
| | 5.10% | | 01/17/24 | | 279,917 |
| 250,000 | | General Motors Financial Co., Inc.
| | 3.50% | | 11/07/24 | | 270,446 |
| 500,000 | | General Motors Financial Co., Inc.
| | 2.90% | | 02/26/25 | | 534,474 |
| 250,000 | | General Motors Financial Co., Inc.
| | 2.75% | | 06/20/25 | | 267,547 |
| 200,000 | | General Motors Financial Co., Inc.
| | 5.25% | | 03/01/26 | | 235,378 |
| 250,000 | | General Motors Financial Co., Inc.
| | 4.35% | | 01/17/27 | | 284,965 |
| 250,000 | | General Motors Financial Co., Inc.
| | 2.70% | | 08/20/27 | | 265,533 |
| 500,000 | | General Motors Financial Co., Inc.
| | 3.60% | | 06/21/30 | | 558,154 |
| | | | | 11,301,896 |
| | | Containers & Packaging – 0.1% | | | | | | |
| 350,000 | | International Paper Co.
| | 4.40% | | 08/15/47 | | 459,074 |
| 250,000 | | WRKCo, Inc.
| | 3.00% | | 09/15/24 | | 269,460 |
| | | | | 728,534 |
| | | Diversified Financial Services – 0.4% | | | | | | |
| 500,000 | | Berkshire Hathaway Finance Corp.
| | 1.45% | | 10/15/30 | | 507,192 |
| 250,000 | | Berkshire Hathaway Finance Corp.
| | 4.20% | | 08/15/48 | | 330,718 |
| 500,000 | | Berkshire Hathaway Finance Corp.
| | 4.25% | | 01/15/49 | | 665,384 |
| 500,000 | | Berkshire Hathaway Finance Corp.
| | 2.85% | | 10/15/50 | | 537,107 |
| 425,000 | | Berkshire Hathaway, Inc.
| | 3.13% | | 03/15/26 | | 475,074 |
| 250,000 | | Dell International LLC/EMC Corp. (a)
| | 5.85% | | 07/15/25 | | 300,445 |
| 500,000 | | Dell International LLC/EMC Corp. (a)
| | 4.90% | | 10/01/26 | | 590,859 |
| 250,000 | | Dell International LLC/EMC Corp. (a)
| | 6.10% | | 07/15/27 | | 311,004 |
| 250,000 | | Dell International LLC/EMC Corp. (a)
| | 8.35% | | 07/15/46 | | 378,696 |
| | | | | 4,096,479 |
| | | Diversified Telecommunication Services – 1.8% | | | | | | |
| 350,000 | | AT&T, Inc.
| | 3.40% | | 05/15/25 | | 389,159 |
| 500,000 | | AT&T, Inc.
| | 2.30% | | 06/01/27 | | 533,891 |
| 500,000 | | AT&T, Inc.
| | 1.65% | | 02/01/28 | | 510,812 |
| 500,000 | | AT&T, Inc.
| | 4.35% | | 03/01/29 | | 596,738 |
| 462,000 | | AT&T, Inc.
| | 4.30% | | 02/15/30 | | 552,292 |
| 500,000 | | AT&T, Inc.
| | 2.75% | | 06/01/31 | | 534,787 |
| 500,000 | | AT&T, Inc.
| | 2.25% | | 02/01/32 | | 508,182 |
| 1,392,000 | | AT&T, Inc. (a)
| | 2.55% | | 12/01/33 | | 1,430,077 |
| 250,000 | | AT&T, Inc.
| | 3.50% | | 06/01/41 | | 270,309 |
| 500,000 | | AT&T, Inc.
| | 3.10% | | 02/01/43 | | 509,081 |
| 250,000 | | AT&T, Inc.
| | 3.65% | | 06/01/51 | | 262,256 |
| 500,000 | | AT&T, Inc.
| | 3.30% | | 02/01/52 | | 496,698 |
| 1,186,000 | | AT&T, Inc. (a)
| | 3.50% | | 09/15/53 | | 1,192,322 |
| 504,000 | | AT&T, Inc. (a)
| | 3.55% | | 09/15/55 | | 503,287 |
| 1,044,000 | | AT&T, Inc. (a)
| | 3.65% | | 09/15/59 | | 1,056,342 |
| 250,000 | | AT&T, Inc.
| | 3.85% | | 06/01/60 | | 263,137 |
| 500,000 | | AT&T, Inc.
| | 3.50% | | 02/01/61 | | 499,058 |
| 500,000 | | Level 3 Financing, Inc. (a)
| | 3.40% | | 03/01/27 | | 545,467 |
| 250,000 | | Level 3 Financing, Inc. (a)
| | 3.88% | | 11/15/29 | | 278,209 |
| 1,500,000 | | Verizon Communications, Inc.
| | 0.85% | | 11/20/25 | | 1,512,490 |
| 250,000 | | Verizon Communications, Inc.
| | 2.63% | | 08/15/26 | | 274,158 |
| 250,000 | | Verizon Communications, Inc.
| | 4.13% | | 03/16/27 | | 294,836 |
| 250,000 | | Verizon Communications, Inc.
| | 3.88% | | 02/08/29 | | 294,680 |
| 1,119,000 | | Verizon Communications, Inc.
| | 4.02% | | 12/03/29 | | 1,332,578 |
| 500,000 | | Verizon Communications, Inc.
| | 1.75% | | 01/20/31 | | 498,415 |
Page 34
See Notes to Financial Statements
First Trust/Dow Jones Dividend & Income Allocation Portfolio
Portfolio of Investments (Continued)
December 31, 2020
Principal
Value | | Description | | Stated
Coupon | | Stated
Maturity | | Value |
| CORPORATE BONDS AND NOTES (Continued) |
| | | Diversified Telecommunication Services (Continued) | | | | | | |
| $500,000 | | Verizon Communications, Inc.
| | 2.65% | | 11/20/40 | | $505,646 |
| 298,000 | | Verizon Communications, Inc.
| | 4.13% | | 08/15/46 | | 366,864 |
| 750,000 | | Verizon Communications, Inc.
| | 4.86% | | 08/21/46 | | 1,015,227 |
| 250,000 | | Verizon Communications, Inc.
| | 4.52% | | 09/15/48 | | 326,586 |
| 500,000 | | Verizon Communications, Inc.
| | 2.88% | | 11/20/50 | | 504,800 |
| 500,000 | | Verizon Communications, Inc.
| | 3.00% | | 11/20/60 | | 506,190 |
| | | | | 18,364,574 |
| | | Electric Utilities – 2.6% | | | | | | |
| 500,000 | | AEP Texas, Inc.
| | 2.40% | | 10/01/22 | | 516,047 |
| 250,000 | | AEP Transmission Co., LLC
| | 4.00% | | 12/01/46 | | 312,379 |
| 500,000 | | AEP Transmission Co., LLC
| | 3.75% | | 12/01/47 | | 610,981 |
| 500,000 | | AEP Transmission Co., LLC
| | 4.25% | | 09/15/48 | | 662,254 |
| 250,000 | | Alabama Power Co.
| | 3.70% | | 12/01/47 | | 305,441 |
| 500,000 | | Alabama Power Co.
| | 3.45% | | 10/01/49 | | 588,845 |
| 500,000 | | American Electric Power Co., Inc.
| | 3.65% | | 12/01/21 | | 515,557 |
| 750,000 | | American Electric Power Co., Inc.
| | 2.95% | | 12/15/22 | | 783,738 |
| 412,000 | | American Electric Power Co., Inc.
| | 0.75% | | 11/01/23 | | 413,014 |
| 1,000,000 | | American Electric Power Co., Inc.
| | 1.00% | | 11/01/25 | | 1,012,838 |
| 300,000 | | Appalachian Power Co.
| | 4.40% | | 05/15/44 | | 376,143 |
| 250,000 | | Appalachian Power Co.
| | 3.70% | | 05/01/50 | | 301,182 |
| 500,000 | | Atlantic City Electric Co.
| | 4.00% | | 10/15/28 | | 587,849 |
| 250,000 | | Baltimore Gas & Electric Co.
| | 3.50% | | 08/15/46 | | 291,577 |
| 250,000 | | Baltimore Gas & Electric Co.
| | 3.75% | | 08/15/47 | | 307,481 |
| 250,000 | | Baltimore Gas & Electric Co.
| | 3.20% | | 09/15/49 | | 280,263 |
| 250,000 | | Baltimore Gas & Electric Co.
| | 2.90% | | 06/15/50 | | 269,977 |
| 250,000 | | CenterPoint Energy Houston Electric LLC
| | 2.90% | | 07/01/50 | | 272,058 |
| 250,000 | | Commonwealth Edison Co.
| | 2.95% | | 08/15/27 | | 277,962 |
| 500,000 | | Commonwealth Edison Co.
| | 3.75% | | 08/15/47 | | 603,009 |
| 500,000 | | Commonwealth Edison Co.
| | 4.00% | | 03/01/49 | | 641,220 |
| 500,000 | | DTE Electric Co.
| | 2.25% | | 03/01/30 | | 537,043 |
| 500,000 | | DTE Electric Co.
| | 2.95% | | 03/01/50 | | 558,782 |
| 500,000 | | Duke Energy Corp.
| | 2.40% | | 08/15/22 | | 515,380 |
| 500,000 | | Duke Energy Florida LLC
| | 3.20% | | 01/15/27 | | 558,895 |
| 1,000,000 | | Duke Energy Florida LLC
| | 2.50% | | 12/01/29 | | 1,093,340 |
| 250,000 | | Duke Energy Florida LLC
| | 3.40% | | 10/01/46 | | 286,469 |
| 250,000 | | Duke Energy Florida LLC
| | 4.20% | | 07/15/48 | | 322,525 |
| 500,000 | | Duke Energy Progress LLC
| | 3.45% | | 03/15/29 | | 581,200 |
| 250,000 | | Duke Energy Progress LLC
| | 3.60% | | 09/15/47 | | 303,454 |
| 500,000 | | Exelon Corp.
| | 4.05% | | 04/15/30 | | 592,556 |
| 250,000 | | Florida Power & Light Co.
| | 3.95% | | 03/01/48 | | 326,619 |
| 500,000 | | Georgia Power Co.
| | 2.10% | | 07/30/23 | | 522,577 |
| 500,000 | | Georgia Power Co.
| | 2.20% | | 09/15/24 | | 527,030 |
| 500,000 | | Indiana Michigan Power Co.
| | 3.75% | | 07/01/47 | | 596,659 |
| 250,000 | | Indiana Michigan Power Co.
| | 4.25% | | 08/15/48 | | 324,093 |
| 250,000 | | PECO Energy Co.
| | 3.70% | | 09/15/47 | | 307,272 |
| 500,000 | | PECO Energy Co.
| | 3.90% | | 03/01/48 | | 632,817 |
| 250,000 | | PECO Energy Co.
| | 3.00% | | 09/15/49 | | 276,830 |
| 500,000 | | Public Service Electric & Gas Co.
| | 3.25% | | 09/01/23 | | 535,893 |
| 500,000 | | Public Service Electric & Gas Co.
| | 3.60% | | 12/01/47 | | 604,132 |
| 250,000 | | Public Service Electric & Gas Co.
| | 4.05% | | 05/01/48 | | 323,094 |
| 250,000 | | Public Service Electric & Gas Co.
| | 3.85% | | 05/01/49 | | 315,929 |
| 500,000 | | Public Service Electric & Gas Co.
| | 3.20% | | 08/01/49 | | 574,976 |
| 500,000 | | Public Service Electric & Gas Co.
| | 2.05% | | 08/01/50 | | 471,508 |
See Notes to Financial Statements
Page 35
First Trust/Dow Jones Dividend & Income Allocation Portfolio
Portfolio of Investments (Continued)
December 31, 2020
Principal
Value | | Description | | Stated
Coupon | | Stated
Maturity | | Value |
| CORPORATE BONDS AND NOTES (Continued) |
| | | Electric Utilities (Continued) | | | | | | |
| $500,000 | | Southwestern Electric Power Co.
| | 2.75% | | 10/01/26 | | $542,955 |
| 500,000 | | Virginia Electric & Power Co.
| | 2.75% | | 03/15/23 | | 523,634 |
| 450,000 | | Virginia Electric & Power Co.
| | 2.95% | | 11/15/26 | | 501,359 |
| 250,000 | | Virginia Electric & Power Co.
| | 3.50% | | 03/15/27 | | 285,808 |
| 475,000 | | Virginia Electric & Power Co.
| | 4.45% | | 02/15/44 | | 622,827 |
| 250,000 | | Virginia Electric & Power Co.
| | 4.00% | | 11/15/46 | | 317,491 |
| 250,000 | | Virginia Electric & Power Co.
| | 3.80% | | 09/15/47 | | 310,077 |
| 500,000 | | Virginia Electric & Power Co.
| | 4.60% | | 12/01/48 | | 704,924 |
| 500,000 | | Virginia Electric & Power Co.
| | 2.45% | | 12/15/50 | | 505,261 |
| | | | | 25,933,224 |
| | | Entertainment – 0.0% | | | | | | |
| 500,000 | | Walt Disney (The) Co.
| | 1.75% | | 08/30/24 | | 521,709 |
| | | Equity Real Estate Investment Trusts – 0.2% | | | | | | |
| 500,000 | | Alexandria Real Estate Equities, Inc.
| | 1.88% | | 02/01/33 | | 500,544 |
| 500,000 | | American Tower Corp.
| | 0.60% | | 01/15/24 | | 500,675 |
| 200,000 | | American Tower Corp.
| | 1.50% | | 01/31/28 | | 201,447 |
| 250,000 | | American Tower Corp.
| | 2.90% | | 01/15/30 | | 273,037 |
| 250,000 | | American Tower Corp.
| | 2.95% | | 01/15/51 | | 251,089 |
| 500,000 | | Prologis L.P.
| | 2.13% | | 10/15/50 | | 465,622 |
| | | | | 2,192,414 |
| | | Food & Staples Retailing – 0.7% | | | | | | |
| 325,000 | | Walmart, Inc.
| | 3.30% | | 04/22/24 | | 354,472 |
| 500,000 | | Walmart, Inc.
| | 2.85% | | 07/08/24 | | 541,193 |
| 1,000,000 | | Walmart, Inc.
| | 3.55% | | 06/26/25 | | 1,132,813 |
| 500,000 | | Walmart, Inc.
| | 3.05% | | 07/08/26 | | 563,187 |
| 250,000 | | Walmart, Inc.
| | 3.70% | | 06/26/28 | | 294,653 |
| 500,000 | | Walmart, Inc.
| | 3.25% | | 07/08/29 | | 582,336 |
| 500,000 | | Walmart, Inc.
| | 2.38% | | 09/24/29 | | 547,186 |
| 250,000 | | Walmart, Inc.
| | 3.95% | | 06/28/38 | | 319,318 |
| 1,000,000 | | Walmart, Inc.
| | 3.63% | | 12/15/47 | | 1,270,395 |
| 250,000 | | Walmart, Inc.
| | 4.05% | | 06/29/48 | | 339,874 |
| 750,000 | | Walmart, Inc.
| | 2.95% | | 09/24/49 | | 866,455 |
| | | | | 6,811,882 |
| | | Food Products – 0.2% | | | | | | |
| 500,000 | | Conagra Brands, Inc.
| | 4.30% | | 05/01/24 | | 559,828 |
| 500,000 | | Conagra Brands, Inc.
| | 4.60% | | 11/01/25 | | 589,469 |
| 250,000 | | Conagra Brands, Inc.
| | 1.38% | | 11/01/27 | | 252,468 |
| 500,000 | | Conagra Brands, Inc.
| | 4.85% | | 11/01/28 | | 621,747 |
| 250,000 | | Conagra Brands, Inc.
| | 5.40% | | 11/01/48 | | 357,661 |
| | | | | 2,381,173 |
| | | Gas Utilities – 0.2% | | | | | | |
| 500,000 | | CenterPoint Energy Resources Corp.
| | 1.75% | | 10/01/30 | | 505,923 |
| 250,000 | | East Ohio Gas (The) Co. (a)
| | 2.00% | | 06/15/30 | | 259,654 |
| 250,000 | | East Ohio Gas (The) Co. (a)
| | 3.00% | | 06/15/50 | | 273,861 |
| 500,000 | | Southern Co. Gas Capital Corp.
| | 4.40% | | 05/30/47 | | 629,965 |
| | | | | 1,669,403 |
| | | Health Care Equipment & Supplies – 0.6% | | | | | | |
| 500,000 | | Abbott Laboratories
| | 1.15% | | 01/30/28 | | 507,678 |
| 500,000 | | Abbott Laboratories
| | 1.40% | | 06/30/30 | | 507,915 |
Page 36
See Notes to Financial Statements
First Trust/Dow Jones Dividend & Income Allocation Portfolio
Portfolio of Investments (Continued)
December 31, 2020
Principal
Value | | Description | | Stated
Coupon | | Stated
Maturity | | Value |
| CORPORATE BONDS AND NOTES (Continued) |
| | | Health Care Equipment & Supplies (Continued) | | | | | | |
| $1,100,000 | | Abbott Laboratories
| | 4.90% | | 11/30/46 | | $1,633,463 |
| 550,000 | | Becton Dickinson and Co.
| | 3.36% | | 06/06/24 | | 598,170 |
| 522,000 | | Becton Dickinson and Co.
| | 3.70% | | 06/06/27 | | 599,388 |
| 800,000 | | Becton Dickinson and Co.
| | 4.67% | | 06/06/47 | | 1,052,179 |
| 250,000 | | Boston Scientific Corp.
| | 4.55% | | 03/01/39 | | 319,420 |
| 250,000 | | Boston Scientific Corp.
| | 4.70% | | 03/01/49 | | 343,585 |
| | | | | 5,561,798 |
| | | Health Care Providers & Services – 2.1% | | | | | | |
| 500,000 | | Anthem, Inc.
| | 2.38% | | 01/15/25 | | 535,079 |
| 250,000 | | Anthem, Inc.
| | 2.88% | | 09/15/29 | | 278,256 |
| 250,000 | | Anthem, Inc.
| | 2.25% | | 05/15/30 | | 265,886 |
| 250,000 | | Anthem, Inc.
| | 4.55% | | 03/01/48 | | 333,604 |
| 750,000 | | Anthem, Inc.
| | 3.70% | | 09/15/49 | | 898,645 |
| 250,000 | | Anthem, Inc.
| | 3.13% | | 05/15/50 | | 274,976 |
| 333,000 | | Cigna Corp.
| | 3.75% | | 07/15/23 | | 360,081 |
| 500,000 | | Cigna Corp.
| | 4.13% | | 11/15/25 | | 576,260 |
| 384,000 | | CVS Health Corp.
| | 3.70% | | 03/09/23 | | 410,935 |
| 1,750,000 | | CVS Health Corp.
| | 2.63% | | 08/15/24 | | 1,876,204 |
| 1,500,000 | | CVS Health Corp.
| | 1.30% | | 08/21/27 | | 1,507,898 |
| 282,000 | | CVS Health Corp.
| | 4.30% | | 03/25/28 | | 335,775 |
| 800,000 | | CVS Health Corp.
| | 1.75% | | 08/21/30 | | 805,352 |
| 500,000 | | CVS Health Corp.
| | 1.88% | | 02/28/31 | | 507,353 |
| 500,000 | | CVS Health Corp.
| | 2.70% | | 08/21/40 | | 507,337 |
| 1,250,000 | | CVS Health Corp.
| | 5.05% | | 03/25/48 | | 1,696,881 |
| 1,000,000 | | HCA, Inc.
| | 4.75% | | 05/01/23 | | 1,090,935 |
| 250,000 | | HCA, Inc.
| | 4.13% | | 06/15/29 | | 290,328 |
| 250,000 | | HCA, Inc.
| | 5.13% | | 06/15/39 | | 320,498 |
| 250,000 | | HCA, Inc.
| | 5.25% | | 06/15/49 | | 330,740 |
| 500,000 | | Laboratory Corp. of America Holdings
| | 2.95% | | 12/01/29 | | 553,300 |
| 250,000 | | UnitedHealth Group, Inc.
| | 3.50% | | 02/15/24 | | 273,752 |
| 500,000 | | UnitedHealth Group, Inc.
| | 2.38% | | 08/15/24 | | 533,227 |
| 250,000 | | UnitedHealth Group, Inc.
| | 3.70% | | 12/15/25 | | 287,374 |
| 250,000 | | UnitedHealth Group, Inc.
| | 1.25% | | 01/15/26 | | 257,909 |
| 250,000 | | UnitedHealth Group, Inc.
| | 3.10% | | 03/15/26 | | 280,571 |
| 500,000 | | UnitedHealth Group, Inc.
| | 3.45% | | 01/15/27 | | 572,963 |
| 500,000 | | UnitedHealth Group, Inc.
| | 3.38% | | 04/15/27 | | 571,770 |
| 500,000 | | UnitedHealth Group, Inc.
| | 2.95% | | 10/15/27 | | 562,599 |
| 250,000 | | UnitedHealth Group, Inc.
| | 3.88% | | 12/15/28 | | 300,229 |
| 250,000 | | UnitedHealth Group, Inc.
| | 2.00% | | 05/15/30 | | 265,399 |
| 573,000 | | UnitedHealth Group, Inc.
| | 4.75% | | 07/15/45 | | 807,469 |
| 500,000 | | UnitedHealth Group, Inc.
| | 4.20% | | 01/15/47 | | 662,698 |
| 500,000 | | UnitedHealth Group, Inc.
| | 4.25% | | 04/15/47 | | 666,437 |
| 250,000 | | UnitedHealth Group, Inc.
| | 4.45% | | 12/15/48 | | 345,686 |
| 250,000 | | UnitedHealth Group, Inc.
| | 2.90% | | 05/15/50 | | 277,342 |
| 250,000 | | UnitedHealth Group, Inc.
| | 3.88% | | 08/15/59 | | 324,388 |
| 250,000 | | UnitedHealth Group, Inc.
| | 3.13% | | 05/15/60 | | 290,900 |
| 500,000 | | Universal Health Services, Inc. (a)
| | 2.65% | | 10/15/30 | | 519,994 |
| | | | | 21,557,030 |
| | | Hotels, Restaurants & Leisure – 0.1% | | | | | | |
| 500,000 | | Marriott International (MD), Inc.
| | 5.75% | | 05/01/25 | | 585,186 |
| 250,000 | | Marriott International (MD), Inc.
| | 3.50% | | 10/15/32 | | 274,051 |
| | | | | 859,237 |
See Notes to Financial Statements
Page 37
First Trust/Dow Jones Dividend & Income Allocation Portfolio
Portfolio of Investments (Continued)
December 31, 2020
Principal
Value | | Description | | Stated
Coupon | | Stated
Maturity | | Value |
| CORPORATE BONDS AND NOTES (Continued) |
| | | Household Durables – 0.1% | | | | | | |
| $500,000 | | DR Horton, Inc.
| | 2.50% | | 10/15/24 | | $533,990 |
| | | Independent Power & Renewable Electricity Producers – 0.3% | | | | | | |
| 500,000 | | NextEra Energy Capital Holdings, Inc.
| | 2.80% | | 01/15/23 | | 523,453 |
| 500,000 | | NextEra Energy Capital Holdings, Inc.
| | 3.15% | | 04/01/24 | | 540,742 |
| 500,000 | | NextEra Energy Capital Holdings, Inc.
| | 3.55% | | 05/01/27 | | 570,087 |
| 500,000 | | NextEra Energy Capital Holdings, Inc.
| | 3.50% | | 04/01/29 | | 573,270 |
| 500,000 | | NextEra Energy Capital Holdings, Inc.
| | 2.75% | | 11/01/29 | | 545,783 |
| | | | | 2,753,335 |
| | | Industrial Conglomerates – 0.4% | | | | | | |
| 500,000 | | Baker Hughes a GE Co., LLC/Baker Hughes Co-Obligor, Inc.
| | 2.77% | | 12/15/22 | | 522,530 |
| 500,000 | | Baker Hughes a GE Co., LLC/Baker Hughes Co-Obligor, Inc.
| | 4.08% | | 12/15/47 | | 565,914 |
| 250,000 | | GE Capital Funding LLC (a)
| | 3.45% | | 05/15/25 | | 275,997 |
| 250,000 | | GE Capital Funding LLC (a)
| | 4.05% | | 05/15/27 | | 286,237 |
| 250,000 | | GE Capital Funding LLC (a)
| | 4.40% | | 05/15/30 | | 294,933 |
| 250,000 | | GE Capital Funding LLC (a)
| | 4.55% | | 05/15/32 | | 300,299 |
| 250,000 | | General Electric Co.
| | 3.45% | | 05/01/27 | | 282,920 |
| 250,000 | | General Electric Co.
| | 3.63% | | 05/01/30 | | 286,058 |
| 250,000 | | General Electric Co.
| | 4.25% | | 05/01/40 | | 295,949 |
| 250,000 | | General Electric Co.
| | 4.35% | | 05/01/50 | | 304,573 |
| 366,000 | | Roper Technologies, Inc.
| | 1.00% | | 09/15/25 | | 370,666 |
| 250,000 | | Roper Technologies, Inc.
| | 2.00% | | 06/30/30 | | 255,744 |
| 500,000 | | Roper Technologies, Inc.
| | 1.75% | | 02/15/31 | | 498,536 |
| | | | | 4,540,356 |
| | | Insurance – 0.7% | | | | | | |
| 2,000,000 | | AIG Global Funding (a)
| | 0.45% | | 12/08/23 | | 2,000,631 |
| 500,000 | | AIG Global Funding (a)
| | 0.90% | | 09/22/25 | | 501,239 |
| 500,000 | | American International Group, Inc.
| | 2.50% | | 06/30/25 | | 537,836 |
| 360,000 | | Athene Global Funding (a)
| | 1.20% | | 10/13/23 | | 362,923 |
| 500,000 | | Athene Global Funding (a)
| | 2.55% | | 11/19/30 | | 501,028 |
| 750,000 | | Brown & Brown, Inc.
| | 2.38% | | 03/15/31 | | 786,701 |
| 250,000 | | Hartford Financial Services Group (The), Inc.
| | 3.60% | | 08/19/49 | | 294,195 |
| 250,000 | | Marsh & McLennan Cos., Inc.
| | 4.90% | | 03/15/49 | | 363,344 |
| 500,000 | | Travelers (The) Cos., Inc.
| | 4.00% | | 05/30/47 | | 649,945 |
| 500,000 | | Travelers (The) Cos., Inc.
| | 4.10% | | 03/04/49 | | 660,173 |
| | | | | 6,658,015 |
| | | IT Services – 0.3% | | | | | | |
| 500,000 | | Fiserv, Inc.
| | 2.75% | | 07/01/24 | | 537,160 |
| 500,000 | | Fiserv, Inc.
| | 3.20% | | 07/01/26 | | 560,505 |
| 250,000 | | Fiserv, Inc.
| | 2.25% | | 06/01/27 | | 266,826 |
| 500,000 | | Fiserv, Inc.
| | 3.50% | | 07/01/29 | | 571,964 |
| 250,000 | | Fiserv, Inc.
| | 2.65% | | 06/01/30 | | 270,811 |
| 500,000 | | Fiserv, Inc.
| | 4.40% | | 07/01/49 | | 670,932 |
| 450,000 | | Visa, Inc.
| | 4.30% | | 12/14/45 | | 618,433 |
| | | | | 3,496,631 |
| | | Life Sciences Tools & Services – 0.1% | | | | | | |
| 500,000 | | Thermo Fisher Scientific, Inc.
| | 4.50% | | 03/25/30 | | 625,600 |
| | | Machinery – 0.1% | | | | | | |
| 500,000 | | Otis Worldwide Corp.
| | 3.11% | | 02/15/40 | | 544,524 |
Page 38
See Notes to Financial Statements
First Trust/Dow Jones Dividend & Income Allocation Portfolio
Portfolio of Investments (Continued)
December 31, 2020
Principal
Value | | Description | | Stated
Coupon | | Stated
Maturity | | Value |
| CORPORATE BONDS AND NOTES (Continued) |
| | | Machinery (Continued) | | | | | | |
| $250,000 | | Westinghouse Air Brake Technologies Corp.
| | 4.40% | | 03/15/24 | | $273,875 |
| | | | | 818,399 |
| | | Media – 1.2% | | | | | | |
| 610,000 | | Charter Communications Operating LLC/Charter Communications Operating Capital
| | 4.91% | | 07/23/25 | | 708,902 |
| 500,000 | | Charter Communications Operating LLC/Charter Communications Operating Capital
| | 2.30% | | 02/01/32 | | 501,058 |
| 250,000 | | Charter Communications Operating LLC/Charter Communications Operating Capital
| | 5.38% | | 05/01/47 | | 312,501 |
| 500,000 | | Charter Communications Operating LLC/Charter Communications Operating Capital
| | 4.80% | | 03/01/50 | | 598,196 |
| 1,000,000 | | Charter Communications Operating LLC/Charter Communications Operating Capital
| | 3.70% | | 04/01/51 | | 1,042,242 |
| 500,000 | | Charter Communications Operating LLC/Charter Communications Operating Capital
| | 3.85% | | 04/01/61 | | 505,101 |
| 575,000 | | Comcast Corp.
| | 3.70% | | 04/15/24 | | 632,909 |
| 550,000 | | Comcast Corp.
| | 3.95% | | 10/15/25 | | 632,289 |
| 250,000 | | Comcast Corp.
| | 3.55% | | 05/01/28 | | 288,470 |
| 350,000 | | Comcast Corp.
| | 4.15% | | 10/15/28 | | 421,599 |
| 500,000 | | Comcast Corp.
| | 2.65% | | 02/01/30 | | 547,424 |
| 250,000 | | Comcast Corp.
| | 1.50% | | 02/15/31 | | 248,541 |
| 500,000 | | Comcast Corp.
| | 3.25% | | 11/01/39 | | 568,494 |
| 250,000 | | Comcast Corp.
| | 3.75% | | 04/01/40 | | 302,853 |
| 250,000 | | Comcast Corp.
| | 3.40% | | 07/15/46 | | 288,571 |
| 500,000 | | Comcast Corp.
| | 4.00% | | 08/15/47 | | 630,208 |
| 250,000 | | Comcast Corp.
| | 4.00% | | 03/01/48 | | 315,506 |
| 400,000 | | Comcast Corp.
| | 4.70% | | 10/15/48 | | 559,821 |
| 500,000 | | Comcast Corp.
| | 3.45% | | 02/01/50 | | 591,157 |
| 250,000 | | Comcast Corp.
| | 2.45% | | 08/15/52 | | 243,139 |
| 250,000 | | Cox Communications, Inc. (a)
| | 1.80% | | 10/01/30 | | 250,074 |
| 250,000 | | Cox Communications, Inc. (a)
| | 2.95% | | 10/01/50 | | 256,107 |
| 750,000 | | Discovery Communications LLC
| | 5.30% | | 05/15/49 | | 991,152 |
| 250,000 | | Discovery Communications LLC
| | 4.65% | | 05/15/50 | | 313,498 |
| 250,000 | | ViacomCBS, Inc.
| | 4.75% | | 05/15/25 | | 290,360 |
| 250,000 | | ViacomCBS, Inc.
| | 4.95% | | 05/19/50 | | 324,658 |
| | | | | 12,364,830 |
| | | Multi-Utilities – 1.1% | | | | | | |
| 1,000,000 | | CenterPoint Energy, Inc.
| | 3.85% | | 02/01/24 | | 1,094,851 |
| 750,000 | | CenterPoint Energy, Inc.
| | 2.50% | | 09/01/24 | | 798,007 |
| 250,000 | | CenterPoint Energy, Inc.
| | 2.95% | | 03/01/30 | | 272,643 |
| 500,000 | | Consolidated Edison Co. of New York, Inc.
| | 3.88% | | 06/15/47 | | 592,907 |
| 500,000 | | Consolidated Edison Co. of New York, Inc.
| | 4.13% | | 05/15/49 | | 619,608 |
| 250,000 | | Consolidated Edison Co. of New York, Inc.
| | 4.30% | | 12/01/56 | | 318,592 |
| 1,000,000 | | Consolidated Edison Co. of New York, Inc.
| | 3.70% | | 11/15/59 | | 1,160,523 |
| 250,000 | | Dominion Energy, Inc.
| | 2.75% | | 01/15/22 | | 255,488 |
| 495,000 | | Dominion Energy, Inc.
| | 4.70% | | 12/01/44 | | 649,967 |
| 500,000 | | DTE Energy Co.
| | 2.95% | | 03/01/30 | | 547,971 |
| 500,000 | | Eastern Energy Gas Holdings LLC
| | 3.00% | | 11/15/29 | | 554,959 |
| 500,000 | | Eastern Energy Gas Holdings LLC
| | 3.90% | | 11/15/49 | | 592,273 |
| 667,000 | | NiSource, Inc.
| | 4.38% | | 05/15/47 | | 849,063 |
| 250,000 | | NiSource, Inc.
| | 3.95% | | 03/30/48 | | 308,181 |
| 500,000 | | Public Service Enterprise Group, Inc.
| | 2.65% | | 11/15/22 | | 521,449 |
See Notes to Financial Statements
Page 39
First Trust/Dow Jones Dividend & Income Allocation Portfolio
Portfolio of Investments (Continued)
December 31, 2020
Principal
Value | | Description | | Stated
Coupon | | Stated
Maturity | | Value |
| CORPORATE BONDS AND NOTES (Continued) |
| | | Multi-Utilities (Continued) | | | | | | |
| $1,500,000 | | Public Service Enterprise Group, Inc.
| | 0.80% | | 08/15/25 | | $1,502,137 |
| | | | | 10,638,619 |
| | | Oil, Gas & Consumable Fuels – 2.1% | | | | | | |
| 500,000 | | BP Capital Markets America, Inc.
| | 2.94% | | 04/06/23 | | 527,898 |
| 1,000,000 | | BP Capital Markets America, Inc.
| | 3.80% | | 09/21/25 | | 1,134,675 |
| 500,000 | | BP Capital Markets America, Inc.
| | 3.41% | | 02/11/26 | | 561,352 |
| 500,000 | | BP Capital Markets America, Inc.
| | 3.94% | | 09/21/28 | | 587,382 |
| 500,000 | | BP Capital Markets America, Inc.
| | 1.75% | | 08/10/30 | | 503,496 |
| 500,000 | | BP Capital Markets America, Inc.
| | 2.77% | | 11/10/50 | | 499,293 |
| 500,000 | | BP Capital Markets America, Inc.
| | 2.94% | | 06/04/51 | | 511,786 |
| 500,000 | | Chevron USA, Inc.
| | 0.69% | | 08/12/25 | | 503,356 |
| 500,000 | | Chevron USA, Inc.
| | 2.34% | | 08/12/50 | | 496,259 |
| 250,000 | | Diamondback Energy, Inc.
| | 4.75% | | 05/31/25 | | 281,725 |
| 500,000 | | Energy Transfer Operating L.P.
| | 4.50% | | 04/15/24 | | 547,415 |
| 250,000 | | Energy Transfer Operating L.P.
| | 4.20% | | 04/15/27 | | 275,910 |
| 250,000 | | Energy Transfer Operating L.P.
| | 5.25% | | 04/15/29 | | 292,084 |
| 250,000 | | Energy Transfer Operating L.P.
| | 5.30% | | 04/15/47 | | 277,227 |
| 250,000 | | Energy Transfer Operating L.P.
| | 6.00% | | 06/15/48 | | 295,006 |
| 250,000 | | Energy Transfer Operating L.P.
| | 6.25% | | 04/15/49 | | 302,826 |
| 250,000 | | Exxon Mobil Corp.
| | 2.99% | | 03/19/25 | | 273,840 |
| 250,000 | | Exxon Mobil Corp.
| | 2.61% | | 10/15/30 | | 273,302 |
| 500,000 | | Kinder Morgan, Inc.
| | 3.15% | | 01/15/23 | | 526,005 |
| 250,000 | | Kinder Morgan, Inc.
| | 2.00% | | 02/15/31 | | 251,670 |
| 500,000 | | Magellan Midstream Partners L.P.
| | 3.95% | | 03/01/50 | | 564,500 |
| 500,000 | | Marathon Petroleum Corp.
| | 4.50% | | 05/01/23 | | 543,205 |
| 500,000 | | MPLX L.P.
| | 2.65% | | 08/15/30 | | 524,876 |
| 500,000 | | MPLX L.P.
| | 5.20% | | 03/01/47 | | 609,629 |
| 400,000 | | ONEOK Partners L.P.
| | 3.38% | | 10/01/22 | | 416,527 |
| 250,000 | | ONEOK, Inc.
| | 2.75% | | 09/01/24 | | 264,055 |
| 250,000 | | ONEOK, Inc.
| | 5.85% | | 01/15/26 | | 299,935 |
| 250,000 | | ONEOK, Inc.
| | 4.35% | | 03/15/29 | | 283,718 |
| 250,000 | | ONEOK, Inc.
| | 3.40% | | 09/01/29 | | 268,241 |
| 250,000 | | ONEOK, Inc.
| | 4.45% | | 09/01/49 | | 263,383 |
| 500,000 | | Phillips 66
| | 3.70% | | 04/06/23 | | 535,782 |
| 500,000 | | Phillips 66
| | 0.90% | | 02/15/24 | | 501,320 |
| 500,000 | | Phillips 66
| | 3.85% | | 04/09/25 | | 561,452 |
| 250,000 | | Phillips 66
| | 1.30% | | 02/15/26 | | 253,595 |
| 250,000 | | Phillips 66
| | 2.15% | | 12/15/30 | | 254,347 |
| 500,000 | | Pioneer Natural Resources Co.
| | 1.90% | | 08/15/30 | | 496,233 |
| 250,000 | | Plains All American Pipeline L.P. / PAA Finance Corp.
| | 3.80% | | 09/15/30 | | 269,084 |
| 500,000 | | Sabine Pass Liquefaction LLC
| | 5.00% | | 03/15/27 | | 589,979 |
| 250,000 | | Sabine Pass Liquefaction LLC
| | 4.20% | | 03/15/28 | | 286,829 |
| 500,000 | | Sunoco Logistics Partners Operations L.P.
| | 4.00% | | 10/01/27 | | 549,373 |
| 500,000 | | Sunoco Logistics Partners Operations L.P.
| | 5.40% | | 10/01/47 | | 559,486 |
| 250,000 | | Transcontinental Gas Pipe Line Co., LLC
| | 4.00% | | 03/15/28 | | 288,840 |
| 250,000 | | Transcontinental Gas Pipe Line Co., LLC
| | 3.25% | | 05/15/30 | | 280,706 |
| 250,000 | | Transcontinental Gas Pipe Line Co., LLC
| | 3.95% | | 05/15/50 | | 284,040 |
| 500,000 | | Valero Energy Corp.
| | 2.85% | | 04/15/25 | | 532,838 |
| 300,000 | | Williams (The) Cos., Inc.
| | 3.60% | | 03/15/22 | | 309,771 |
| 250,000 | | Williams (The) Cos., Inc.
| | 3.50% | | 11/15/30 | | 283,498 |
| 625,000 | | Williams (The) Cos., Inc.
| | 4.90% | | 01/15/45 | | 740,208 |
| 270,000 | | Williams (The) Cos., Inc.
| | 5.10% | | 09/15/45 | | 334,458 |
Page 40
See Notes to Financial Statements
First Trust/Dow Jones Dividend & Income Allocation Portfolio
Portfolio of Investments (Continued)
December 31, 2020
Principal
Value | | Description | | Stated
Coupon | | Stated
Maturity | | Value |
| CORPORATE BONDS AND NOTES (Continued) |
| | | Oil, Gas & Consumable Fuels (Continued) | | | | | | |
| $500,000 | | Williams (The) Cos., Inc.
| | 4.85% | | 03/01/48 | | $615,571 |
| | | | | 21,487,986 |
| | | Pharmaceuticals – 0.9% | | | | | | |
| 500,000 | | Bristol-Myers Squibb Co.
| | 0.75% | | 11/13/25 | | 503,784 |
| 500,000 | | Bristol-Myers Squibb Co.
| | 3.20% | | 06/15/26 | | 562,980 |
| 500,000 | | Bristol-Myers Squibb Co.
| | 1.13% | | 11/13/27 | | 505,485 |
| 750,000 | | Bristol-Myers Squibb Co.
| | 3.40% | | 07/26/29 | | 873,763 |
| 500,000 | | Bristol-Myers Squibb Co.
| | 1.45% | | 11/13/30 | | 502,914 |
| 500,000 | | Bristol-Myers Squibb Co.
| | 4.13% | | 06/15/39 | | 638,784 |
| 500,000 | | Bristol-Myers Squibb Co.
| | 2.35% | | 11/13/40 | | 513,738 |
| 500,000 | | Bristol-Myers Squibb Co.
| | 2.55% | | 11/13/50 | | 512,060 |
| 250,000 | | Merck & Co., Inc.
| | 0.75% | | 02/24/26 | | 253,011 |
| 250,000 | | Merck & Co., Inc.
| | 2.35% | | 06/24/40 | | 259,287 |
| 250,000 | | Merck & Co., Inc.
| | 2.45% | | 06/24/50 | | 259,382 |
| 1,300,000 | | Utah Acquisition Sub, Inc.
| | 3.15% | | 06/15/21 | | 1,312,614 |
| 750,000 | | Viatris, Inc. (a)
| | 2.70% | | 06/22/30 | | 796,495 |
| 750,000 | | Viatris, Inc. (a)
| | 3.85% | | 06/22/40 | | 847,672 |
| 500,000 | | Viatris, Inc. (a)
| | 4.00% | | 06/22/50 | | 573,872 |
| | | | | 8,915,841 |
| | | Road & Rail – 0.9% | | | | | | |
| 250,000 | | CSX Corp.
| | 2.40% | | 02/15/30 | | 270,934 |
| 1,000,000 | | CSX Corp.
| | 2.50% | | 05/15/51 | | 1,000,177 |
| 250,000 | | CSX Corp.
| | 4.25% | | 11/01/66 | | 335,800 |
| 250,000 | | Norfolk Southern Corp.
| | 3.65% | | 08/01/25 | | 279,734 |
| 250,000 | | Norfolk Southern Corp.
| | 2.90% | | 06/15/26 | | 276,864 |
| 750,000 | | Norfolk Southern Corp.
| | 4.15% | | 02/28/48 | | 956,157 |
| 500,000 | | Norfolk Southern Corp.
| | 4.10% | | 05/15/49 | | 631,090 |
| 500,000 | | Penske Truck Leasing Co. L.P. / PTL Finance Corp. (a)
| | 1.20% | | 11/15/25 | | 504,745 |
| 500,000 | | Ryder System, Inc.
| | 2.80% | | 03/01/22 | | 513,033 |
| 1,000,000 | | Ryder System, Inc.
| | 2.88% | | 06/01/22 | | 1,033,343 |
| 300,000 | | Union Pacific Corp.
| | 3.75% | | 03/15/24 | | 328,184 |
| 1,000,000 | | Union Pacific Corp.
| | 2.15% | | 02/05/27 | | 1,063,929 |
| 250,000 | | Union Pacific Corp.
| | 3.00% | | 04/15/27 | | 276,880 |
| 250,000 | | Union Pacific Corp.
| | 2.40% | | 02/05/30 | | 269,666 |
| 250,000 | | Union Pacific Corp.
| | 3.25% | | 02/05/50 | | 285,549 |
| 250,000 | | Union Pacific Corp.
| | 4.10% | | 09/15/67 | | 315,420 |
| 250,000 | | Union Pacific Corp.
| | 3.75% | | 02/05/70 | | 303,889 |
| | | | | 8,645,394 |
| | | Semiconductors & Semiconductor Equipment – 0.5% | | | | | | |
| 500,000 | | Broadcom, Inc.
| | 3.15% | | 11/15/25 | | 546,585 |
| 500,000 | | Broadcom, Inc.
| | 5.00% | | 04/15/30 | | 608,487 |
| 250,000 | | Broadcom, Inc.
| | 4.15% | | 11/15/30 | | 290,025 |
| 250,000 | | Broadcom, Inc.
| | 4.30% | | 11/15/32 | | 297,068 |
| 500,000 | | Intel Corp.
| | 4.10% | | 05/11/47 | | 639,031 |
| 500,000 | | Intel Corp.
| | 3.25% | | 11/15/49 | | 560,697 |
| 500,000 | | Intel Corp.
| | 3.10% | | 02/15/60 | | 553,048 |
| 500,000 | | Microchip Technology, Inc. (a)
| | 0.97% | | 02/15/24 | | 501,607 |
| 250,000 | | QUALCOMM, Inc.
| | 2.15% | | 05/20/30 | | 265,016 |
| 500,000 | | QUALCOMM, Inc.
| | 3.25% | | 05/20/50 | | 581,528 |
| | | | | 4,843,092 |
See Notes to Financial Statements
Page 41
First Trust/Dow Jones Dividend & Income Allocation Portfolio
Portfolio of Investments (Continued)
December 31, 2020
Principal
Value | | Description | | Stated
Coupon | | Stated
Maturity | | Value |
| CORPORATE BONDS AND NOTES (Continued) |
| | | Software – 0.4% | | | | | | |
| $500,000 | | Oracle Corp.
| | 2.40% | | 09/15/23 | | $526,008 |
| 250,000 | | Oracle Corp.
| | 3.40% | | 07/08/24 | | 273,765 |
| 250,000 | | Oracle Corp.
| | 2.50% | | 04/01/25 | | 268,903 |
| 350,000 | | Oracle Corp.
| | 2.65% | | 07/15/26 | | 385,106 |
| 400,000 | | Oracle Corp.
| | 5.38% | | 07/15/40 | | 575,648 |
| 350,000 | | Oracle Corp.
| | 4.00% | | 07/15/46 | | 430,332 |
| 500,000 | | Oracle Corp.
| | 3.60% | | 04/01/50 | | 583,634 |
| 250,000 | | VMware, Inc.
| | 4.50% | | 05/15/25 | | 286,401 |
| 250,000 | | VMware, Inc.
| | 4.65% | | 05/15/27 | | 292,940 |
| | | | | 3,622,737 |
| | | Specialty Retail – 0.6% | | | | | | |
| 500,000 | | Advance Auto Parts, Inc.
| | 1.75% | | 10/01/27 | | 508,584 |
| 550,000 | | Home Depot (The), Inc.
| | 3.00% | | 04/01/26 | | 615,738 |
| 1,000,000 | | Home Depot (The), Inc.
| | 2.80% | | 09/14/27 | | 1,114,389 |
| 250,000 | | Home Depot (The), Inc.
| | 2.95% | | 06/15/29 | | 284,381 |
| 500,000 | | Home Depot (The), Inc.
| | 3.90% | | 06/15/47 | | 639,668 |
| 250,000 | | Home Depot (The), Inc.
| | 3.13% | | 12/15/49 | | 288,994 |
| 250,000 | | Home Depot (The), Inc.
| | 3.50% | | 09/15/56 | | 313,269 |
| 500,000 | | Lowe’s Cos., Inc.
| | 1.30% | | 04/15/28 | | 504,752 |
| 500,000 | | Lowe’s Cos., Inc.
| | 1.70% | | 10/15/30 | | 507,478 |
| 500,000 | | Lowe’s Cos., Inc.
| | 3.00% | | 10/15/50 | | 536,929 |
| 250,000 | | O’Reilly Automotive, Inc.
| | 1.75% | | 03/15/31 | | 250,955 |
| | | | | 5,565,137 |
| | | Technology Hardware, Storage & Peripherals – 0.1% | | | | | | |
| 500,000 | | Hewlett Packard Enterprise Co.
| | 1.45% | | 04/01/24 | | 513,998 |
| 500,000 | | Hewlett Packard Enterprise Co.
| | 1.75% | | 04/01/26 | | 518,218 |
| | | | | 1,032,216 |
| | | Telecommunications – 0.6% | | | | | | |
| 500,000 | | T-Mobile USA, Inc. (a)
| | 3.50% | | 04/15/25 | | 552,990 |
| 250,000 | | T-Mobile USA, Inc. (a)
| | 1.50% | | 02/15/26 | | 256,436 |
| 500,000 | | T-Mobile USA, Inc. (a)
| | 3.75% | | 04/15/27 | | 569,900 |
| 750,000 | | T-Mobile USA, Inc. (a)
| | 2.05% | | 02/15/28 | | 781,057 |
| 750,000 | | T-Mobile USA, Inc. (a)
| | 2.55% | | 02/15/31 | | 788,490 |
| 500,000 | | T-Mobile USA, Inc. (a)
| | 2.25% | | 11/15/31 | | 514,108 |
| 1,000,000 | | T-Mobile USA, Inc. (a)
| | 3.00% | | 02/15/41 | | 1,038,595 |
| 1,000,000 | | T-Mobile USA, Inc. (a)
| | 3.30% | | 02/15/51 | | 1,030,705 |
| 500,000 | | T-Mobile USA, Inc. (a)
| | 3.60% | | 11/15/60 | | 531,658 |
| | | | | 6,063,939 |
| | | Tobacco – 0.3% | | | | | | |
| 250,000 | | Altria Group, Inc.
| | 3.49% | | 02/14/22 | | 258,632 |
| 250,000 | | Altria Group, Inc.
| | 3.80% | | 02/14/24 | | 273,115 |
| 250,000 | | Altria Group, Inc.
| | 4.80% | | 02/14/29 | | 299,725 |
| 250,000 | | Altria Group, Inc.
| | 5.95% | | 02/14/49 | | 350,790 |
| 250,000 | | BAT Capital Corp.
| | 3.22% | | 08/15/24 | | 270,789 |
| 250,000 | | BAT Capital Corp.
| | 2.79% | | 09/06/24 | | 267,532 |
| 250,000 | | BAT Capital Corp.
| | 3.22% | | 09/06/26 | | 275,693 |
| 250,000 | | BAT Capital Corp.
| | 4.70% | | 04/02/27 | | 294,364 |
| 250,000 | | BAT Capital Corp.
| | 4.91% | | 04/02/30 | | 302,261 |
| 250,000 | | BAT Capital Corp.
| | 4.39% | | 08/15/37 | | 281,160 |
| 250,000 | | BAT Capital Corp.
| | 4.76% | | 09/06/49 | | 290,792 |
Page 42
See Notes to Financial Statements
First Trust/Dow Jones Dividend & Income Allocation Portfolio
Portfolio of Investments (Continued)
December 31, 2020
Principal
Value | | Description | | Stated
Coupon | | Stated
Maturity | | Value |
| CORPORATE BONDS AND NOTES (Continued) |
| | | Tobacco (Continued) | | | | | | |
| $250,000 | | BAT Capital Corp.
| | 5.28% | | 04/02/50 | | $309,823 |
| | | | | 3,474,676 |
| | | Trading Companies & Distributors – 0.1% | | | | | | |
| 250,000 | | Air Lease Corp.
| | 3.38% | | 07/01/25 | | 269,126 |
| 750,000 | | Air Lease Corp.
| | 2.88% | | 01/15/26 | | 794,334 |
| 250,000 | | Air Lease Corp.
| | 3.13% | | 12/01/30 | | 260,570 |
| | | | | 1,324,030 |
| | | Water Utilities – 0.1% | | | | | | |
| 500,000 | | American Water Capital Corp.
| | 2.80% | | 05/01/30 | | 553,503 |
| 500,000 | | American Water Capital Corp.
| | 3.45% | | 05/01/50 | | 596,832 |
| | | | | 1,150,335 |
| | | Total Corporate Bonds and Notes
| | 356,189,760 |
| | | (Cost $320,604,072) | | | | | | |
| FOREIGN CORPORATE BONDS AND NOTES – 3.6% |
| | | Aerospace & Defense – 0.1% | | | | | | |
| 500,000 | | BAE Systems PLC (a)
| | 3.40% | | 04/15/30 | | 567,329 |
| 500,000 | | BAE Systems PLC (a)
| | 3.00% | | 09/15/50 | | 524,276 |
| | | | | 1,091,605 |
| | | Automobiles – 0.1% | | | | | | |
| 250,000 | | Nissan Motor Co. Ltd. (a)
| | 3.52% | | 09/17/25 | | 267,909 |
| 250,000 | | Nissan Motor Co. Ltd. (a)
| | 4.35% | | 09/17/27 | | 276,449 |
| 250,000 | | Nissan Motor Co. Ltd. (a)
| | 4.81% | | 09/17/30 | | 281,938 |
| | | | | 826,296 |
| | | Banks – 1.3% | | | | | | |
| 400,000 | | Banco Santander S.A.
| | 2.71% | | 06/27/24 | | 427,324 |
| 2,500,000 | | Bank of Montreal
| | 0.45% | | 12/08/23 | | 2,508,432 |
| 500,000 | | Bank of Montreal
| | 3.30% | | 02/05/24 | | 542,624 |
| 1,500,000 | | Barclays PLC
| | 1.01% | | 12/10/24 | | 1,511,507 |
| 250,000 | | BNP Paribas S.A. (a) (b)
| | 3.05% | | 01/13/31 | | 273,132 |
| 250,000 | | Cooperatieve Rabobank U.A. (a)
| | 3.88% | | 09/26/23 | | 272,878 |
| 500,000 | | Cooperatieve Rabobank U.A. (a)
| | 2.63% | | 07/22/24 | | 535,239 |
| 250,000 | | Cooperatieve Rabobank U.A. (a) (b)
| | 1.34% | | 06/24/26 | | 255,562 |
| 1,000,000 | | Cooperatieve Rabobank U.A. (a) (b)
| | 1.00% | | 09/24/26 | | 1,008,071 |
| 250,000 | | Deutsche Bank AG/New York NY (b)
| | 2.22% | | 09/18/24 | | 257,354 |
| 500,000 | | Deutsche Bank AG/New York NY (b)
| | 2.13% | | 11/24/26 | | 511,956 |
| 365,000 | | Mitsubishi UFJ Financial Group, Inc. (b)
| | 0.85% | | 09/15/24 | | 367,323 |
| 250,000 | | Mitsubishi UFJ Financial Group, Inc.
| | 1.41% | | 07/17/25 | | 257,111 |
| 500,000 | | Societe Generale S.A. (a)
| | 2.63% | | 01/22/25 | | 529,851 |
| 200,000 | | Societe Generale S.A. (a) (b)
| | 1.49% | | 12/14/26 | | 202,007 |
| 500,000 | | Sumitomo Mitsui Financial Group, Inc.
| | 2.70% | | 07/16/24 | | 534,095 |
| 500,000 | | Sumitomo Mitsui Financial Group, Inc.
| | 1.47% | | 07/08/25 | | 512,628 |
| 500,000 | | Sumitomo Mitsui Financial Group, Inc.
| | 3.04% | | 07/16/29 | | 554,679 |
| 250,000 | | Sumitomo Mitsui Financial Group, Inc.
| | 2.72% | | 09/27/29 | | 271,137 |
| 500,000 | | Sumitomo Mitsui Financial Group, Inc.
| | 2.14% | | 09/23/30 | | 503,137 |
| 500,000 | | UBS Group AG (a) (b)
| | 1.36% | | 01/30/27 | | 505,969 |
| 100,000 | | Westpac Banking Corp.
| | 2.67% | | 11/15/35 | | 103,141 |
| | | | | 12,445,157 |
See Notes to Financial Statements
Page 43
First Trust/Dow Jones Dividend & Income Allocation Portfolio
Portfolio of Investments (Continued)
December 31, 2020
Principal
Value | | Description | | Stated
Coupon | | Stated
Maturity | | Value |
| FOREIGN CORPORATE BONDS AND NOTES (Continued) |
| | | Capital Markets – 0.2% | | | | | | |
| $500,000 | | Credit Suisse (New York, NY) A.G.
| | 2.10% | | 11/12/21 | | $507,764 |
| 293,000 | | Credit Suisse (New York, NY) A.G.
| | 1.00% | | 05/05/23 | | 297,535 |
| 500,000 | | Credit Suisse Group AG (a)
| | 3.57% | | 01/09/23 | | 515,334 |
| 500,000 | | Credit Suisse Group AG (a) (b)
| | 2.19% | | 06/05/26 | | 523,077 |
| 500,000 | | Credit Suisse Group AG (a) (b)
| | 3.87% | | 01/12/29 | | 567,005 |
| | | | | 2,410,715 |
| | | Chemicals – 0.1% | | | | | | |
| 273,000 | | Nutrien Ltd.
| | 1.90% | | 05/13/23 | | 282,157 |
| 250,000 | | Nutrien Ltd.
| | 2.95% | | 05/13/30 | | 275,486 |
| 250,000 | | Nutrien Ltd.
| | 3.95% | | 05/13/50 | | 306,318 |
| | | | | 863,961 |
| | | Commercial Services & Supplies – 0.0% | | | | | | |
| 250,000 | | Waste Connections, Inc.
| | 2.60% | | 02/01/30 | | 269,303 |
| | | Diversified Financial Services – 0.3% | | | | | | |
| 250,000 | | AerCap Ireland Capital DAC/AerCap Global Aviation Trust
| | 4.50% | | 09/15/23 | | 271,224 |
| 500,000 | | AerCap Ireland Capital DAC/AerCap Global Aviation Trust
| | 3.15% | | 02/15/24 | | 524,511 |
| 444,000 | | GE Capital International Funding Co. Unlimited Co.
| | 4.42% | | 11/15/35 | | 530,532 |
| 500,000 | | Shell International Finance, B.V.
| | 2.00% | | 11/07/24 | | 527,151 |
| 250,000 | | Shell International Finance, B.V.
| | 4.00% | | 05/10/46 | | 315,390 |
| 250,000 | | Shell International Finance, B.V.
| | 3.75% | | 09/12/46 | | 303,276 |
| 500,000 | | Shell International Finance, B.V.
| | 3.25% | | 04/06/50 | | 568,059 |
| | | | | 3,040,143 |
| | | Energy Equipment & Services – 0.0% | | | | | | |
| 250,000 | | Schlumberger Investment S.A.
| | 2.65% | | 06/26/30 | | 267,221 |
| | | Health Care Equipment & Supplies – 0.0% | | | | | | |
| 250,000 | | DH Europe Finance II Sarl
| | 2.20% | | 11/15/24 | | 265,102 |
| | | Metals & Mining – 0.1% | | | | | | |
| 250,000 | | Anglo American Capital PLC (a)
| | 3.63% | | 09/11/24 | | 272,250 |
| 250,000 | | Anglo American Capital PLC (a)
| | 4.00% | | 09/11/27 | | 287,246 |
| 330,000 | | BHP Billiton Finance USA, Ltd.
| | 5.00% | | 09/30/43 | | 486,150 |
| 250,000 | | Teck Resources Ltd.
| | 3.90% | | 07/15/30 | | 278,861 |
| | | | | 1,324,507 |
| | | Oil, Gas & Consumable Fuels – 0.5% | | | | | | |
| 500,000 | | Canadian Natural Resources, Ltd.
| | 2.05% | | 07/15/25 | | 525,050 |
| 500,000 | | Canadian Natural Resources, Ltd.
| | 3.85% | | 06/01/27 | | 561,800 |
| 500,000 | | Canadian Natural Resources, Ltd.
| | 2.95% | | 07/15/30 | | 535,700 |
| 250,000 | | Equinor ASA
| | 1.75% | | 01/22/26 | | 262,745 |
| 250,000 | | Equinor ASA
| | 2.38% | | 05/22/30 | | 267,918 |
| 334,000 | | Suncor Energy, Inc.
| | 2.80% | | 05/15/23 | | 351,629 |
| 500,000 | | Suncor Energy, Inc.
| | 3.10% | | 05/15/25 | | 547,580 |
| 250,000 | | Total Capital International S.A.
| | 2.99% | | 06/29/41 | | 271,108 |
| 500,000 | | Total Capital International S.A.
| | 3.46% | | 07/12/49 | | 583,328 |
| 500,000 | | Total Capital International S.A.
| | 3.13% | | 05/29/50 | | 543,459 |
| 250,000 | | Total Capital International S.A.
| | 3.39% | | 06/29/60 | | 285,075 |
| | | | | 4,735,392 |
| | | Pharmaceuticals – 0.4% | | | | | | |
| 500,000 | | AstraZeneca PLC
| | 0.70% | | 04/08/26 | | 497,767 |
| 500,000 | | Takeda Pharmaceutical Co. Ltd.
| | 4.00% | | 11/26/21 | | 514,519 |
Page 44
See Notes to Financial Statements
First Trust/Dow Jones Dividend & Income Allocation Portfolio
Portfolio of Investments (Continued)
December 31, 2020
Principal
Value | | Description | | Stated
Coupon | | Stated
Maturity | | Value |
| FOREIGN CORPORATE BONDS AND NOTES (Continued) |
| | | Pharmaceuticals (Continued) | | | | | | |
| $1,370,000 | | Takeda Pharmaceutical Co. Ltd.
| | 4.40% | | 11/26/23 | | $1,518,525 |
| 250,000 | | Takeda Pharmaceutical Co. Ltd.
| | 2.05% | | 03/31/30 | | 256,212 |
| 250,000 | | Takeda Pharmaceutical Co. Ltd.
| | 3.03% | | 07/09/40 | | 264,403 |
| 250,000 | | Takeda Pharmaceutical Co. Ltd.
| | 3.18% | | 07/09/50 | | 267,082 |
| 250,000 | | Takeda Pharmaceutical Co. Ltd.
| | 3.38% | | 07/09/60 | | 278,149 |
| | | | | 3,596,657 |
| | | Semiconductors & Semiconductor Equipment – 0.1% | | | | | | |
| 500,000 | | Broadcom Corp./Broadcom Cayman Finance Ltd.
| | 3.63% | | 01/15/24 | | 540,727 |
| | | Thrifts & Mortgage Finance – 0.1% | | | | | | |
| 500,000 | | Nationwide Building Society (a)
| | 2.00% | | 01/27/23 | | 516,248 |
| | | Tobacco – 0.1% | | | | | | |
| 500,000 | | BAT International Finance PLC
| | 1.67% | | 03/25/26 | | 512,187 |
| 500,000 | | Imperial Brands Finance PLC (a)
| | 3.13% | | 07/26/24 | | 536,095 |
| | | | | 1,048,282 |
| | | Wireless Telecommunication Services – 0.2% | | | | | | |
| 250,000 | | Vodafone Group PLC
| | 4.38% | | 05/30/28 | | 299,608 |
| 500,000 | | Vodafone Group PLC
| | 4.88% | | 06/19/49 | | 669,350 |
| 500,000 | | Vodafone Group PLC
| | 4.25% | | 09/17/50 | | 620,410 |
| 500,000 | | Vodafone Group PLC
| | 5.13% | | 06/19/59 | | 691,427 |
| | | | | 2,280,795 |
| | | Total Foreign Corporate Bonds and Notes
| | 35,522,111 |
| | | (Cost $33,063,845) | | | | | | |
Principal
Value | | Description | | Annualized
Yield on Date
of Purchase | | Stated
Maturity | | Value |
| COMMERCIAL PAPER – 1.1% |
| | | Electric Utilities – 0.3% | | | | | | |
| 3,000,000 | | Commonwealth Edison Co.
| | 0.10% | | 01/04/21 | | 2,999,958 |
| | | Oil, Gas & Consumable Fuels – 0.8% | | | | | | |
| 8,200,000 | | ETP Legacy L.P.
| | 0.60% | | 01/04/21 | | 8,199,640 |
| | | Total Commercial Paper
| | 11,199,598 |
| | | (Cost $11,199,565) | | | | | | |
Principal
Value | | Description | | Stated
Coupon | | Stated
Maturity | | Value |
| U.S. GOVERNMENT BONDS AND NOTES – 0.7% |
| 1,500,000 | | U. S. Treasury Bond
| | 1.38% | | 08/15/50 | | 1,405,195 |
| 1,000,000 | | U. S. Treasury Note
| | 0.13% | | 09/30/22 | | 1,000,117 |
| 1,791,000 | | U. S. Treasury Note
| | 0.38% | | 11/30/25 | | 1,793,659 |
See Notes to Financial Statements
Page 45
First Trust/Dow Jones Dividend & Income Allocation Portfolio
Portfolio of Investments (Continued)
December 31, 2020
Principal
Value | | Description | | Stated
Coupon | | Stated
Maturity | | Value |
| U.S. GOVERNMENT BONDS AND NOTES (Continued) |
| $930,000 | | U. S. Treasury Note
| | 0.63% | | 11/30/27 | | 930,000 |
| 2,000,000 | | U. S. Treasury Note
| | 0.88% | | 11/15/30 | | 1,993,594 |
| | | Total U.S. Government Bonds and Notes
| | 7,122,565 |
| | | (Cost $7,107,478) | | | | | | |
| | | Total Investments – 99.1%
| | 992,922,442 |
| | | (Cost $839,081,736) (c) | | | | | | |
| | Net Other Assets and Liabilities – 0.9%
| | 9,241,184 |
| | Net Assets – 100.0%
| | $1,002,163,626 |
|
| (a) | This security, sold within the terms of a private placement memorandum, is exempt from registration upon resale under Rule 144A under the Securities Act of 1933, as amended, and may be resold in transactions exempt from registration, normally to qualified institutional buyers. Pursuant to procedures adopted by the Trust’s Board of Trustees, this security has been determined to be liquid by First Trust Advisors L.P. (the “Advisor”). Although market instability can result in periods of increased overall market illiquidity, liquidity for each security is determined based on security specific factors and assumptions, which require subjective judgment. At December 31, 2020, securities noted as such amounted to $33,892,267 or 3.4% of net assets. |
| (b) | Fixed-to-floating or fixed-to-variable rate security. The interest rate shown reflects the fixed rate in effect at December 31, 2020. At a predetermined date, the fixed rate will change to a floating rate or a variable rate. |
| (c) | Aggregate cost for federal income tax purposes was $839,620,545. As of December 31, 2020, the aggregate gross unrealized appreciation for all investments in which there was an excess of value over tax cost was $159,404,873 and the aggregate gross unrealized depreciation for all investments in which there was an excess of tax cost over value was $6,102,976. The net unrealized appreciation was $153,301,897. |
Valuation Inputs
A summary of the inputs used to value the Fund’s investments as of December 31, 2020 is as follows (see Note 2A - Portfolio Valuation in the Notes to Financial Statements):
| | Total
Value at
12/31/2020 | Level 1
Quoted
Prices | Level 2
Significant
Observable
Inputs | Level 3
Significant
Unobservable
Inputs |
Common Stocks*
| $ 582,888,408 | $ 582,888,408 | $ — | $ — |
Corporate Bonds and Notes*
| 356,189,760 | — | 356,189,760 | — |
Foreign Corporate Bonds and Notes*
| 35,522,111 | — | 35,522,111 | — |
Commercial Paper*
| 11,199,598 | — | 11,199,598 | — |
U.S. Government Bonds and Notes
| 7,122,565 | — | 7,122,565 | — |
Total Investments
| $ 992,922,442 | $ 582,888,408 | $ 410,034,034 | $— |
| * | See Portfolio of Investments for industry breakout. |
Page 46
See Notes to Financial Statements
First Trust Multi Income Allocation Portfolio
Portfolio of Investments
December 31, 2020
| Shares | | Description | | Value |
| COMMON STOCKS – 27.4% |
| | | Aerospace & Defense – 0.4% | | |
| 197 | | Lockheed Martin Corp.
| | $69,931 |
| 239 | | Northrop Grumman Corp.
| | 72,828 |
| | | | | 142,759 |
| | | Air Freight & Logistics – 0.4% | | |
| 843 | | United Parcel Service, Inc., Class B
| | 141,961 |
| | | Banks – 1.2% | | |
| 2,021 | | JPMorgan Chase & Co.
| | 256,809 |
| 984 | | M&T Bank Corp.
| | 125,263 |
| | | | | 382,072 |
| | | Beverages – 0.4% | | |
| 901 | | PepsiCo, Inc.
| | 133,618 |
| | | Biotechnology – 0.3% | | |
| 798 | | AbbVie, Inc.
| | 85,506 |
| | | Building Products – 0.4% | | |
| 892 | | Trane Technologies PLC
| | 129,483 |
| | | Capital Markets – 0.8% | | |
| 162 | | BlackRock, Inc.
| | 116,889 |
| 1,210 | | Intercontinental Exchange, Inc.
| | 139,501 |
| | | | | 256,390 |
| | | Chemicals – 0.2% | | |
| 224 | | Ecolab, Inc.
| | 48,465 |
| | | Communications Equipment – 0.5% | | |
| 957 | | Motorola Solutions, Inc.
| | 162,747 |
| | | Construction & Engineering – 0.2% | | |
| 868 | | Quanta Services, Inc.
| | 62,513 |
| | | Diversified Telecommunication Services – 0.4% | | |
| 2,158 | | Verizon Communications, Inc.
| | 126,783 |
| | | Electric Utilities – 3.4% | | |
| 2,666 | | Alliant Energy Corp.
| | 137,379 |
| 1,136 | | American Electric Power Co., Inc.
| | 94,595 |
| 285 | | Duke Energy Corp.
| | 26,095 |
| 555 | | Emera, Inc. (CAD)
| | 23,588 |
| 304 | | Eversource Energy
| | 26,299 |
| 1,283 | | Exelon Corp.
| | 54,168 |
| 2,802 | | Fortis, Inc. (CAD)
| | 114,466 |
| 1,436 | | IDACORP, Inc.
| | 137,899 |
| 2,152 | | NextEra Energy, Inc.
| | 166,027 |
| 2,784 | | OGE Energy Corp.
| | 88,698 |
| 3,382 | | PPL Corp.
| | 95,373 |
| 1,270 | | Southern (The) Co.
| | 78,016 |
| 997 | | Xcel Energy, Inc.
| | 66,470 |
| | | | | 1,109,073 |
| | | Electrical Equipment – 0.4% | | |
| 1,117 | | Eaton Corp PLC
| | 134,196 |
| | | Electronic Equipment, Instruments & Components – 0.5% | | |
| 1,237 | | TE Connectivity, Ltd.
| | 149,764 |
See Notes to Financial Statements
Page 47
First Trust Multi Income Allocation Portfolio
Portfolio of Investments (Continued)
December 31, 2020
| Shares | | Description | | Value |
| COMMON STOCKS (Continued) |
| | | Food & Staples Retailing – 0.9% | | |
| 1,922 | | Sysco Corp.
| | $142,728 |
| 1,087 | | Walmart, Inc.
| | 156,691 |
| | | | | 299,419 |
| | | Gas Utilities – 1.4% | | |
| 5,691 | | AltaGas Ltd. (CAD)
| | 83,695 |
| 1,214 | | Atmos Energy Corp.
| | 115,852 |
| 551 | | Chesapeake Utilities Corp.
| | 59,624 |
| 2,548 | | New Jersey Resources Corp.
| | 90,581 |
| 1,330 | | ONE Gas, Inc.
| | 102,104 |
| | | | | 451,856 |
| | | Health Care Equipment & Supplies – 1.0% | | |
| 1,602 | | Abbott Laboratories
| | 175,403 |
| 772 | | STERIS PLC
| | 146,325 |
| | | | | 321,728 |
| | | Health Care Providers & Services – 1.0% | | |
| 2,484 | | CVS Health Corp.
| | 169,657 |
| 483 | | UnitedHealth Group, Inc.
| | 169,379 |
| | | | | 339,036 |
| | | Hotels, Restaurants & Leisure – 0.6% | | |
| 1,667 | | Starbucks Corp.
| | 178,336 |
| | | Industrial Conglomerates – 0.4% | | |
| 668 | | Honeywell International, Inc.
| | 142,084 |
| | | IT Services – 1.0% | | |
| 736 | | Accenture PLC, Class A
| | 192,250 |
| 1,004 | | Fidelity National Information Services, Inc.
| | 142,026 |
| | | | | 334,276 |
| | | Machinery – 0.8% | | |
| 460 | | Parker-Hannifin Corp.
| | 125,309 |
| 1,523 | | Timken (The) Co.
| | 117,819 |
| | | | | 243,128 |
| | | Media – 0.5% | | |
| 3,041 | | Comcast Corp., Class A
| | 159,348 |
| | | Multiline Retail – 0.6% | | |
| 1,132 | | Target Corp.
| | 199,832 |
| | | Multi-Utilities – 2.7% | | |
| 793 | | ATCO Ltd., Class I (CAD)
| | 22,733 |
| 960 | | Canadian Utilities Ltd., Class A (CAD)
| | 23,448 |
| 374 | | CMS Energy Corp.
| | 22,818 |
| 2,249 | | Dominion Energy, Inc.
| | 169,125 |
| 202 | | DTE Energy Co.
| | 24,525 |
| 6,605 | | Public Service Enterprise Group, Inc.
| | 385,071 |
| 1,745 | | Sempra Energy
| | 222,330 |
| 237 | | WEC Energy Group, Inc.
| | 21,811 |
| | | | | 891,861 |
| | | Oil, Gas & Consumable Fuels – 2.6% | | |
| 1,152 | | Chevron Corp.
| | 97,286 |
| 3,143 | | Enbridge, Inc.
| | 100,545 |
Page 48
See Notes to Financial Statements
First Trust Multi Income Allocation Portfolio
Portfolio of Investments (Continued)
December 31, 2020
| Shares | | Description | | Value |
| COMMON STOCKS (Continued) |
| | | Oil, Gas & Consumable Fuels (Continued) | | |
| 9,443 | | Equitrans Midstream Corp.
| | $75,922 |
| 3,035 | | Keyera Corp. (CAD)
| | 53,933 |
| 3,667 | | Kinder Morgan, Inc.
| | 50,128 |
| 4,234 | | ONEOK, Inc.
| | 162,501 |
| 1,695 | | Phillips 66
| | 118,548 |
| 3,744 | | TC Energy Corp.
| | 152,456 |
| 2,335 | | Williams (The) Cos., Inc.
| | 46,817 |
| | | | | 858,136 |
| | | Personal Products – 0.4% | | |
| 2,129 | | Unilever PLC
| | 128,506 |
| | | Pharmaceuticals – 0.8% | | |
| 2,154 | | Bristol-Myers Squibb Co.
| | 133,613 |
| 719 | | Johnson & Johnson
| | 113,156 |
| | | | | 246,769 |
| | | Semiconductors & Semiconductor Equipment – 0.9% | | |
| 407 | | Broadcom, Inc.
| | 178,205 |
| 476 | | KLA Corp.
| | 123,241 |
| | | | | 301,446 |
| | | Software – 0.7% | | |
| 963 | | Microsoft Corp.
| | 214,190 |
| | | Specialty Retail – 0.4% | | |
| 527 | | Home Depot (The), Inc.
| | 139,982 |
| | | Technology Hardware, Storage & Peripherals – 0.7% | | |
| 1,709 | | Apple, Inc.
| | 226,767 |
| | | Textiles, Apparel & Luxury Goods – 0.5% | | |
| 1,150 | | NIKE, Inc., Class B
| | 162,690 |
| | | Total Common Stocks
| | 8,904,720 |
| | | (Cost $7,132,972) | | |
| REAL ESTATE INVESTMENT TRUSTS – 11.1% |
| | | Diversified REITs – 1.0% | | |
| 4,575 | | STORE Capital Corp.
| | 155,458 |
| 4,050 | | VEREIT, Inc.
| | 153,057 |
| | | | | 308,515 |
| | | Health Care REITs – 1.4% | | |
| 7,470 | | Medical Properties Trust, Inc.
| | 162,771 |
| 3,975 | | Omega Healthcare Investors, Inc.
| | 144,372 |
| 7,693 | | Physicians Realty Trust
| | 136,936 |
| | | | | 444,079 |
| | | Hotel & Resort REITs – 0.4% | | |
| 4,493 | | MGM Growth Properties LLC
| | 140,631 |
| | | Industrial REITs – 1.8% | | |
| 3,825 | | Americold Realty Trust
| | 142,787 |
| 3,629 | | Duke Realty Corp.
| | 145,051 |
| 1,360 | | Prologis, Inc.
| | 135,538 |
| 4,722 | | STAG Industrial, Inc.
| | 147,893 |
| | | | | 571,269 |
See Notes to Financial Statements
Page 49
First Trust Multi Income Allocation Portfolio
Portfolio of Investments (Continued)
December 31, 2020
| Shares | | Description | | Value |
| REAL ESTATE INVESTMENT TRUSTS (Continued) |
| | | Office REITs – 0.9% | | |
| 811 | | Alexandria Real Estate Equities, Inc.
| | $144,536 |
| 3,752 | | Highwoods Properties, Inc.
| | 148,692 |
| | | | | 293,228 |
| | | Residential REITs – 1.4% | | |
| 1,516 | | Camden Property Trust
| | 151,479 |
| 4,846 | | Invitation Homes, Inc.
| | 143,926 |
| 1,186 | | Mid-America Apartment Communities, Inc.
| | 150,254 |
| | | | | 445,659 |
| | | Retail REITs – 0.9% | | |
| 3,932 | | National Retail Properties, Inc.
| | 160,897 |
| 2,304 | | Realty Income Corp.
| | 143,240 |
| | | | | 304,137 |
| | | Specialized REITs – 3.3% | | |
| 515 | | American Tower Corp.
| | 115,597 |
| 1,843 | | CyrusOne, Inc.
| | 134,816 |
| 893 | | Digital Realty Trust, Inc.
| | 124,582 |
| 181 | | Equinix, Inc.
| | 129,267 |
| 3,557 | | Gaming and Leisure Properties, Inc.
| | 150,817 |
| 1,344 | | Life Storage, Inc.
| | 160,460 |
| 418 | | SBA Communications Corp.
| | 117,930 |
| 5,586 | | VICI Properties, Inc.
| | 142,443 |
| | | | | 1,075,912 |
| | | Total Real Estate Investment Trusts
| | 3,583,430 |
| | | (Cost $3,132,714) | | |
| MASTER LIMITED PARTNERSHIPS – 6.8% |
| | | Chemicals – 0.5% | | |
| 6,119 | | Westlake Chemical Partners, L.P.
| | 145,877 |
| | | Independent Power & Renewable Electricity Producers – 0.6% | | |
| 3,061 | | NextEra Energy Partners, L.P.
| | 205,240 |
| | | Oil, Gas & Consumable Fuels – 5.7% | | |
| 3,755 | | Cheniere Energy Partners, L.P.
| | 132,364 |
| 2,540 | | Energy Transfer, L.P.
| | 15,697 |
| 20,926 | | Enterprise Products Partners, L.P.
| | 409,940 |
| 11,350 | | Holly Energy Partners, L.P.
| | 161,170 |
| 9,393 | | Magellan Midstream Partners, L.P.
| | 398,639 |
| 2,804 | | Phillips 66 Partners, L.P.
| | 74,054 |
| 18,841 | | Plains All American Pipeline, L.P.
| | 155,250 |
| 9,702 | | Shell Midstream Partners, L.P.
| | 97,796 |
| 13,455 | | TC PipeLines, L.P.
| | 396,250 |
| | | | | 1,841,160 |
| | | Total Master Limited Partnerships
| | 2,192,277 |
| | | (Cost $2,088,228) | | |
Principal
Value | | Description | | Stated
Coupon | | Stated
Maturity | | Value |
| U.S. GOVERNMENT BONDS AND NOTES – 8.5% |
| $75,815 | | U.S. Treasury Inflation Indexed Bond (a)
| | 0.13% | | 01/15/22 | | 77,180 |
| 88,867 | | U.S. Treasury Inflation Indexed Bond (a)
| | 0.13% | | 04/15/22 | | 90,743 |
Page 50
See Notes to Financial Statements
First Trust Multi Income Allocation Portfolio
Portfolio of Investments (Continued)
December 31, 2020
Principal
Value | | Description | | Stated
Coupon | | Stated
Maturity | | Value |
| U.S. GOVERNMENT BONDS AND NOTES (Continued) |
| $84,922 | | U.S. Treasury Inflation Indexed Bond (a)
| | 0.13% | | 07/15/22 | | $87,562 |
| 82,351 | | U.S. Treasury Inflation Indexed Bond (a)
| | 0.13% | | 01/15/23 | | 85,561 |
| 83,864 | | U.S. Treasury Inflation Indexed Bond (a)
| | 0.63% | | 04/15/23 | | 88,323 |
| 78,323 | | U.S. Treasury Inflation Indexed Bond (a)
| | 0.38% | | 07/15/23 | | 82,988 |
| 79,233 | | U.S. Treasury Inflation Indexed Bond (a)
| | 0.63% | | 01/15/24 | | 85,060 |
| 56,784 | | U.S. Treasury Inflation Indexed Bond (a)
| | 0.50% | | 04/15/24 | | 60,885 |
| 80,273 | | U.S. Treasury Inflation Indexed Bond (a)
| | 0.13% | | 07/15/24 | | 85,977 |
| 62,924 | | U.S. Treasury Inflation Indexed Bond (a)
| | 0.13% | | 10/15/24 | | 67,490 |
| 145,116 | | U.S. Treasury Inflation Indexed Bond (a)
| | 0.25% | | 01/15/25 | | 156,644 |
| 65,525 | | U.S. Treasury Inflation Indexed Bond (a)
| | 0.13% | | 04/15/25 | | 70,518 |
| 77,959 | | U.S. Treasury Inflation Indexed Bond (a)
| | 0.38% | | 07/15/25 | | 85,659 |
| 27,096 | | U.S. Treasury Inflation Indexed Bond (a)
| | 0.13% | | 10/15/25 | | 29,474 |
| 94,244 | | U.S. Treasury Inflation Indexed Bond (a)
| | 0.63% | | 01/15/26 | | 105,244 |
| 25,583 | | U.S. Treasury Inflation Indexed Bond (a)
| | 2.00% | | 01/15/26 | | 30,431 |
| 68,437 | | U.S. Treasury Inflation Indexed Bond (a)
| | 0.13% | | 07/15/26 | | 75,300 |
| 99,171 | | U.S. Treasury Inflation Indexed Bond (a)
| | 0.38% | | 01/15/27 | | 110,727 |
| 4,519 | | U.S. Treasury Inflation Indexed Bond (a)
| | 2.38% | | 01/15/27 | | 5,621 |
| 68,126 | | U.S. Treasury Inflation Indexed Bond (a)
| | 0.38% | | 07/15/27 | | 76,691 |
| 84,450 | | U.S. Treasury Inflation Indexed Bond (a)
| | 0.50% | | 01/15/28 | | 95,817 |
| 21,130 | | U.S. Treasury Inflation Indexed Bond (a)
| | 1.75% | | 01/15/28 | | 25,933 |
| 115,144 | | U.S. Treasury Inflation Indexed Bond (a)
| | 0.75% | | 07/15/28 | | 134,003 |
| 72,186 | | U.S. Treasury Inflation Indexed Bond (a)
| | 0.88% | | 01/15/29 | | 84,893 |
| 23,043 | | U.S. Treasury Inflation Indexed Bond (a)
| | 2.50% | | 01/15/29 | | 30,290 |
| 23,759 | | U.S. Treasury Inflation Indexed Bond (a)
| | 3.88% | | 04/15/29 | | 34,256 |
| 98,742 | | U.S. Treasury Inflation Indexed Bond (a)
| | 0.25% | | 07/15/29 | | 111,861 |
| 71,857 | | U.S. Treasury Inflation Indexed Bond (a)
| | 0.13% | | 01/15/30 | | 80,225 |
| 48,748 | | U.S. Treasury Inflation Indexed Bond (a)
| | 0.13% | | 07/15/30 | | 54,732 |
| 7,482 | | U.S. Treasury Inflation Indexed Bond (a)
| | 3.38% | | 04/15/32 | | 11,407 |
| 30,118 | | U.S. Treasury Inflation Indexed Bond (a)
| | 2.13% | | 02/15/40 | | 46,712 |
| 49,702 | | U.S. Treasury Inflation Indexed Bond (a)
| | 2.13% | | 02/15/41 | | 78,058 |
| 45,864 | | U.S. Treasury Inflation Indexed Bond (a)
| | 0.75% | | 02/15/42 | | 58,473 |
| 44,849 | | U.S. Treasury Inflation Indexed Bond (a)
| | 0.63% | | 02/15/43 | | 56,003 |
| 42,232 | | U.S. Treasury Inflation Indexed Bond (a)
| | 1.38% | | 02/15/44 | | 60,919 |
| 41,245 | | U.S. Treasury Inflation Indexed Bond (a)
| | 0.75% | | 02/15/45 | | 53,288 |
| 36,265 | | U.S. Treasury Inflation Indexed Bond (a)
| | 1.00% | | 02/15/46 | | 49,550 |
| 32,361 | | U.S. Treasury Inflation Indexed Bond (a)
| | 0.88% | | 02/15/47 | | 43,593 |
| 31,678 | | U.S. Treasury Inflation Indexed Bond (a)
| | 1.00% | | 02/15/48 | | 44,188 |
| 20,696 | | U.S. Treasury Inflation Indexed Bond (a)
| | 1.00% | | 02/15/49 | | 29,202 |
| 16,205 | | U.S. Treasury Inflation Indexed Bond (a)
| | 0.25% | | 02/15/50 | | 19,359 |
| | | Total U.S. Government Bonds and Notes
| | 2,760,840 |
| | | (Cost $2,513,816) | | | | | | |
| U.S. GOVERNMENT AGENCY MORTGAGE-BACKED SECURITIES – 2.6% |
| | | Collateralized Mortgage Obligations – 1.6% | | | | | | |
| | | Fannie Mae REMIC Trust | | | | | | |
| 9,673 | | Series 2007-W8, Class 1A5 (b)
| | 6.44% | | 09/01/37 | | 11,510 |
| | | Fannie Mae REMICS | | | | | | |
| 51 | | Series 1992-24, Class Z
| | 6.50% | | 04/01/22 | | 52 |
| 2 | | Series 1992-44, Class ZQ
| | 8.00% | | 07/01/22 | | 2 |
| 420 | | Series 1993-1, Class KA
| | 7.90% | | 01/01/23 | | 439 |
| 131 | | Series 1993-119, Class H
| | 6.50% | | 07/01/23 | | 138 |
| 1,073 | | Series 1993-178, Class PK
| | 6.50% | | 09/01/23 | | 1,137 |
| 416 | | Series 1993-62, Class E
| | 7.00% | | 04/01/23 | | 437 |
| 877 | | Series 1995-24, Class G
| | 6.50% | | 04/01/23 | | 911 |
| 1,040 | | Series 1999-56, Class Z
| | 7.00% | | 12/01/29 | | 1,178 |
See Notes to Financial Statements
Page 51
First Trust Multi Income Allocation Portfolio
Portfolio of Investments (Continued)
December 31, 2020
Principal
Value | | Description | | Stated
Coupon | | Stated
Maturity | | Value |
| U.S. GOVERNMENT AGENCY MORTGAGE-BACKED SECURITIES (Continued) |
| | | Collateralized Mortgage Obligations (Continued) | | | | | | |
| | | Fannie Mae REMICS (Continued) | | | | | | |
| $959 | | Series 2002-67, Class PE
| | 5.50% | | 11/01/32 | | $1,114 |
| 22,175 | | Series 2002-9, Class MS, IO, 1 Mo. LIBOR x -1 +8.10% (c)
| | 7.95% | | 03/25/32 | | 4,926 |
| 3,448 | | Series 2002-90, Class A1
| | 6.50% | | 06/01/42 | | 4,061 |
| 2,064 | | Series 2003-14, Class AQ
| | 3.50% | | 03/01/33 | | 2,148 |
| 2,695 | | Series 2003-41, Class OA
| | 4.00% | | 05/01/33 | | 2,842 |
| 29,228 | | Series 2004-10, Class ZB
| | 6.00% | | 02/01/34 | | 34,040 |
| 10,846 | | Series 2005-79, Class NF, 1 Mo. LIBOR + 0.41% (d)
| | 0.56% | | 09/25/35 | | 10,918 |
| 18,503 | | Series 2007-10, Class Z
| | 6.00% | | 02/01/37 | | 21,435 |
| 41,307 | | Series 2009-86, Class IP, IO
| | 5.50% | | 10/01/39 | | 7,223 |
| 1,453 | | Series 2012-35, Class PL
| | 2.00% | | 11/01/41 | | 1,496 |
| 446 | | Series 2013-14, Class QE
| | 1.75% | | 03/01/43 | | 462 |
| 28,976 | | Series 2013-31, Class NT
| | 3.00% | | 04/01/43 | | 29,330 |
| | | Fannie Mae Trust | | | | | | |
| 3,283 | | Series 2004-W8, Class 3A
| | 7.50% | | 06/01/44 | | 3,939 |
| | | FHLMC-GNMA | | | | | | |
| 86 | | Series 1993-5, Class HA
| | 7.50% | | 02/01/23 | | 89 |
| 322 | | Series 1994-27, Class D
| | 7.00% | | 03/01/24 | | 343 |
| | | Freddie Mac REMICS | | | | | | |
| 117 | | Series 1992-1250, Class J
| | 7.00% | | 05/01/22 | | 120 |
| 3,638 | | Series 1992-1401, Class Q, 1 Mo. LIBOR + 0.60% (d)
| | 0.76% | | 10/15/22 | | 3,628 |
| 8,192 | | Series 1993-1487, Class P, IO, 1 Mo. LIBOR x -1 +9.50% (c)
| | 9.34% | | 03/15/23 | | 601 |
| 1,813 | | Series 1994-1673, Class FB, 10 Yr. Constant Maturity Treasury Rate - 0.50% (d)
| | 0.37% | | 02/01/24 | | 1,798 |
| 35 | | Series 1996-1847, Class LL
| | 7.50% | | 04/01/26 | | 39 |
| 6,779 | | Series 1998-2033, Class IA, IO
| | 7.00% | | 02/01/28 | | 711 |
| 2,119 | | Series 1999-2130, Class KB
| | 6.38% | | 03/01/29 | | 2,413 |
| 30,525 | | Series 1999-2174, Class PN
| | 6.00% | | 07/01/29 | | 34,442 |
| 6,378 | | Series 2001-2277, Class B
| | 7.50% | | 01/01/31 | | 7,841 |
| 26,725 | | Series 2003-2647, Class LS, 1 Mo. LIBOR x -2.50 +14.00% (c)
| | 13.61% | | 07/01/33 | | 40,551 |
| 34,000 | | Series 2003-2676, Class LL
| | 5.50% | | 09/01/33 | | 38,100 |
| 20,735 | | Series 2004-2768, Class PW
| | 4.25% | | 03/01/34 | | 23,033 |
| 4,000 | | Series 2004-2778, Class MM
| | 5.25% | | 04/01/34 | | 4,500 |
| 23,251 | | Series 2006-3114, Class GI, IO, 1 Mo. LIBOR x -1 +6.60% (c)
| | 6.44% | | 02/15/36 | | 3,975 |
| 27,456 | | Series 2006-3199, Class DS, IO, 1 Mo. LIBOR x -1 + 7.15% (c)
| | 6.99% | | 08/15/36 | | 5,977 |
| 17,071 | | Series 2006-3237, Class CB
| | 5.50% | | 07/01/36 | | 17,687 |
| 441 | | Series 2010-3758, Class M
| | 4.50% | | 10/01/38 | | 441 |
| 7,454 | | Series 2010-3775, Class KZ
| | 4.00% | | 08/01/25 | | 8,120 |
| 1,086 | | Series 2012-3994, Class AE
| | 1.63% | | 02/01/22 | | 1,089 |
| 22,288 | | Series 2013-4178, Class ZN
| | 3.50% | | 03/01/43 | | 29,260 |
| | | Freddie Mac Strips | | | | | | |
| 5,311 | | Series 1994-169, Class IO, IO
| | 8.50% | | 03/01/23 | | 288 |
| | | Government National Mortgage Association | | | | | | |
| 23,112 | | Series 2002-92, Class PB
| | 5.50% | | 12/01/32 | | 24,672 |
| 5,582 | | Series 2006-16, Class OP, PO
| | (e) | | 03/20/36 | | 5,280 |
| 52,269 | | Series 2007-35, Class NE
| | 6.00% | | 06/01/37 | | 60,386 |
| 2,811 | | Series 2009-29, Class TA
| | 4.50% | | 03/01/39 | | 2,905 |
| 49,000 | | Series 2009-61, Class QE
| | 5.50% | | 08/01/39 | | 60,469 |
| 8,912 | | Series 2011-136, Class GB
| | 2.50% | | 05/01/40 | | 9,152 |
| 15,378 | | Series 2013-20, Class KI, IO
| | 5.00% | | 01/01/43 | | 1,760 |
| | | | | 529,408 |
Page 52
See Notes to Financial Statements
First Trust Multi Income Allocation Portfolio
Portfolio of Investments (Continued)
December 31, 2020
Principal
Value | | Description | | Stated
Coupon | | Stated
Maturity | | Value |
| U.S. GOVERNMENT AGENCY MORTGAGE-BACKED SECURITIES (Continued) |
| | | Pass-through Security – 1.0% | | | | | | |
| | | Federal Home Loan Mortgage Corporation | | | | | | |
| $12,203 | | Pool A47829
| | 4.00% | | 08/01/35 | | $13,297 |
| 5,069 | | Pool C01252
| | 6.50% | | 11/01/31 | | 5,754 |
| 34,805 | | Pool G01731
| | 6.50% | | 12/01/29 | | 39,049 |
| 21,010 | | Pool G06358
| | 4.00% | | 04/01/41 | | 23,231 |
| 1,863 | | Pool O20138
| | 5.00% | | 11/01/30 | | 2,049 |
| 12,752 | | Pool U90316
| | 4.00% | | 10/01/42 | | 13,954 |
| | | Federal National Mortgage Association | | | | | | |
| 11,812 | | Pool 890383
| | 4.00% | | 01/01/42 | | 13,010 |
| 15,736 | | Pool AA9393
| | 4.50% | | 07/01/39 | | 17,674 |
| 5,258 | | Pool AD0659
| | 6.00% | | 02/01/23 | | 5,379 |
| 2,933 | | Pool AE0050
| | 5.50% | | 12/01/22 | | 3,004 |
| 17,380 | | Pool AL0791
| | 4.00% | | 02/01/41 | | 19,203 |
| 28,857 | | Pool AU4289
| | 4.00% | | 09/01/43 | | 31,742 |
| 4,374 | | Pool MA0561
| | 4.00% | | 11/01/40 | | 4,799 |
| 21,196 | | Pool MA1028
| | 4.00% | | 04/01/42 | | 23,246 |
| | | Government National Mortgage Association | | | | | | |
| 7,001 | | Pool 3428
| | 5.00% | | 08/01/33 | | 7,967 |
| 14,897 | | Pool 3500
| | 5.50% | | 01/01/34 | | 17,385 |
| 5,359 | | Pool 3711
| | 5.50% | | 05/01/35 | | 6,276 |
| 17,774 | | Pool 667422
| | 5.00% | | 10/01/39 | | 20,670 |
| 8,805 | | Pool 706201
| | 5.50% | | 04/01/39 | | 10,001 |
| 11,637 | | Pool 736558
| | 5.00% | | 02/01/40 | | 13,410 |
| 18,149 | | Pool 759248
| | 4.00% | | 02/01/41 | | 20,107 |
| 9,560 | | Pool MA3525
| | 5.50% | | 03/01/46 | | 11,033 |
| | | | | 322,240 |
| | | Total U.S. Government Agency Mortgage-Backed Securities
| | 851,648 |
| | | (Cost $807,508) | | | | | | |
| MORTGAGE-BACKED SECURITIES – 0.0% |
| | | Collateralized Mortgage Obligations – 0.0% | | | | | | |
| | | Credit Suisse First Boston Mortgage Securities Corp. | | | | | | |
| 299 | | Series 2004-6, Class 2A1
| | 4.75% | | 09/01/19 | | 0 |
| | | MASTR Alternative Loan Trust | | | | | | |
| 619 | | Series 2004-10, Class 2A1
| | 5.50% | | 10/01/19 | | 622 |
| 29 | | Series 2005-1, Class 5A1
| | 5.50% | | 01/01/20 | | 29 |
| | | MASTR Asset Securitization Trust | | | | | | |
| 4,289 | | Series 2004-1, Class 5A4
| | 5.50% | | 02/01/34 | | 4,567 |
| | | Structured Asset Mortgage Investments Trust | | | | | | |
| 5,360 | | Series 1999-1, Class 2A (f)
| | 6.27% | | 06/01/29 | | 5,157 |
| | | Total Mortgage-Backed Securities
| | 10,375 |
| | | (Cost $10,620) | | | | | | |
| Shares | | Description | | Value |
| EXCHANGE-TRADED FUNDS – 41.3% |
| 27,690 | | First Trust Institutional Preferred Securities and Income ETF (g)
| | 564,322 |
| 500 | | First Trust Long Duration Opportunities ETF (g)
| | 14,525 |
| 20,000 | | First Trust Low Duration Opportunities ETF (g)
| | 1,029,400 |
| 82,607 | | First Trust Preferred Securities and Income ETF (g)
| | 1,667,835 |
| 71,920 | | First Trust Senior Loan ETF (g)
| | 3,422,673 |
| 70,800 | | First Trust Tactical High Yield ETF (g)
| | 3,449,376 |
| 16,232 | | Invesco BulletShares 2021 Corporate Bond ETF
| | 344,281 |
See Notes to Financial Statements
Page 53
First Trust Multi Income Allocation Portfolio
Portfolio of Investments (Continued)
December 31, 2020
| Shares | | Description | | Value |
| EXCHANGE-TRADED FUNDS (Continued) |
| 17,845 | | iShares iBoxx $ Investment Grade Corporate Bond ETF
| | $2,464,930 |
| 3,700 | | iShares MBS ETF
| | 407,481 |
| 3,200 | | ProShares Short 20+ Year Treasury
| | 50,496 |
| 1 | | Vanguard Mortgage-Backed Securities ETF
| | 54 |
| | | Total Exchange-Traded Funds
| | 13,415,373 |
| | | (Cost $12,797,186) | | |
| | Total Investments – 97.7%
| | 31,718,663 |
| | (Cost $28,483,044) (h) | | |
| | Net Other Assets and Liabilities – 2.3%
| | 741,702 |
| | Net Assets – 100.0%
| | $32,460,365 |
|
| (a) | Security whose principal value is adjusted in accordance with changes to the country’s Consumer Price Index. Interest is calculated on the basis of the current adjusted principal value. |
| (b) | Weighted Average Coupon security. Coupon is based on the blended interest rate of the underlying holdings, which may have different coupons. The coupon may change in any period. |
| (c) | Inverse floating rate security. |
| (d) | Floating or variable rate security. |
| (e) | Zero coupon security. |
| (f) | Collateral Strip Rate security. Coupon is based on the weighted net interest rate of the investment’s underlying collateral. The interest rate resets periodically. |
| (g) | Investment in an affiliated fund. |
| (h) | Aggregate cost for federal income tax purposes was $28,852,963. As of December 31, 2020, the aggregate gross unrealized appreciation for all investments in which there was an excess of value over tax cost was $3,385,226 and the aggregate gross unrealized depreciation for all investments in which there was an excess of tax cost over value was $519,526. The net unrealized appreciation was $2,865,700. |
| CAD | Canadian Dollar |
| IO | Interest-Only Security - Principal amount shown represents par value on which interest payments are based. |
| LIBOR | London Interbank Offered Rate |
| PO | Principal-Only Security |
Valuation Inputs
A summary of the inputs used to value the Fund’s investments as of December 31, 2020 is as follows (see Note 2A - Portfolio Valuation in the Notes to Financial Statements):
| | Total
Value at
12/31/2020 | Level 1
Quoted
Prices | Level 2
Significant
Observable
Inputs | Level 3
Significant
Unobservable
Inputs |
Common Stocks*
| $ 8,904,720 | $ 8,904,720 | $ — | $ — |
Real Estate Investment Trusts*
| 3,583,430 | 3,583,430 | — | — |
Master Limited Partnerships*
| 2,192,277 | 2,192,277 | — | — |
U.S. Government Bonds and Notes
| 2,760,840 | — | 2,760,840 | — |
U.S. Government Agency Mortgage-Backed Securities
| 851,648 | — | 851,648 | — |
Mortgage-Backed Securities
| 10,375 | — | 10,375 | — |
Exchange-Traded Funds
| 13,415,373 | 13,415,373 | — | — |
Total Investments
| $ 31,718,663 | $ 28,095,800 | $ 3,622,863 | $— |
| * | See Portfolio of Investments for industry breakout. |
Page 54
See Notes to Financial Statements
First Trust Dorsey Wright Tactical Core Portfolio
Portfolio of Investments
December 31, 2020
| Shares | | Description | | Value |
| EXCHANGE-TRADED FUNDS – 98.6% |
| | | Capital Markets – 98.6% | | |
| 7,133 | | First Trust BICK Index Fund (a)
| | $268,224 |
| 4,452 | | First Trust Chindia ETF (a)
| | 262,579 |
| 89,734 | | First Trust Consumer Discretionary AlphaDEX® Fund (a)
| | 4,565,666 |
| 10,675 | | First Trust Developed Markets ex-US AlphaDEX® Fund (a)
| | 603,458 |
| 19,325 | | First Trust Dow Jones Internet Index Fund (a) (b)
| | 4,101,345 |
| 23,666 | | First Trust Emerging Markets AlphaDEX® Fund (a)
| | 598,276 |
| 5,784 | | First Trust Europe AlphaDEX® Fund (a)
| | 220,602 |
| 4,747 | | First Trust Germany AlphaDEX® Fund (a)
| | 241,527 |
| 50,326 | | First Trust Large Cap Growth AlphaDEX® Fund (a)
| | 4,863,505 |
| 80,608 | | First Trust Mid Cap Growth AlphaDEX® Fund (a)
| | 5,270,151 |
| 154,058 | | First Trust Nasdaq Transportation ETF (a)
| | 4,322,482 |
| 31,805 | | First Trust NASDAQ-100-Technology Sector Index Fund (a)
| | 4,391,316 |
| 87,810 | | First Trust Small Cap Growth AlphaDEX® Fund (a)
| | 5,411,730 |
| 4,074 | | First Trust Switzerland AlphaDEX® Fund (a)
| | 243,829 |
| 41,252 | | First Trust Technology AlphaDEX® Fund (a)
| | 4,612,799 |
| 22,283 | | iShares Core U.S. Aggregate Bond ETF
| | 2,633,628 |
| 21,565 | | SPDR Bloomberg Barclays Convertible Securities ETF
| | 1,785,366 |
| 42,581 | | SPDR Bloomberg Barclays International Corporate Bond ETF
| | 1,613,820 |
| 47,774 | | SPDR Portfolio Long-Term Corporate Bond ETF
| | 1,581,319 |
| 35,272 | | SPDR Wells Fargo Preferred Stock ETF
| | 1,566,430 |
| | Total Investments – 98.6%
| | 49,158,052 |
| | (Cost $41,017,631) (c) | | |
| | Net Other Assets and Liabilities – 1.4%
| | 707,777 |
| | Net Assets – 100.0%
| | $49,865,829 |
|
| (a) | Investment in an affiliated fund. |
| (b) | Non-income producing security. |
| (c) | Aggregate cost for federal income tax purposes was $41,092,650. As of December 31, 2020, the aggregate gross unrealized appreciation for all investments in which there was an excess of value over tax cost was $8,131,912 and the aggregate gross unrealized depreciation for all investments in which there was an excess of tax cost over value was $66,510. The net unrealized appreciation was $8,065,402. |
Valuation Inputs
A summary of the inputs used to value the Fund’s investments as of December 31, 2020 is as follows (see Note 2A - Portfolio Valuation in the Notes to Financial Statements):
| | Total
Value at
12/31/2020 | Level 1
Quoted
Prices | Level 2
Significant
Observable
Inputs | Level 3
Significant
Unobservable
Inputs |
Exchange-Traded Funds*
| $ 49,158,052 | $ 49,158,052 | $ — | $ — |
| * | See Portfolio of Investments for industry breakout. |
See Notes to Financial Statements
Page 55
First Trust Capital Strength Portfolio
Portfolio of Investments
December 31, 2020
| Shares | | Description | | Value |
| COMMON STOCKS – 94.6% |
| | | Aerospace & Defense – 5.4% | | |
| 2,021 | | General Dynamics Corp. | | $300,765 |
| 744 | | Lockheed Martin Corp. | | 264,105 |
| 909 | | Northrop Grumman Corp. | | 276,991 |
| | | | | 841,861 |
| | | Air Freight & Logistics – 1.9% | | |
| 3,082 | | Expeditors International of Washington, Inc. | | 293,129 |
| | | Beverages – 6.1% | | |
| 5,747 | | Coca-Cola (The) Co. | | 315,165 |
| 3,560 | | Monster Beverage Corp. (a) | | 329,229 |
| 2,029 | | PepsiCo, Inc. | | 300,901 |
| | | | | 945,295 |
| | | Biotechnology – 1.8% | | |
| 1,220 | | Amgen, Inc. | | 280,502 |
| | | Capital Markets – 1.9% | | |
| 1,956 | | T Rowe Price Group, Inc. | | 296,119 |
| | | Chemicals – 1.7% | | |
| 964 | | Air Products & Chemicals, Inc. | | 263,384 |
| | | Commercial Services &
Supplies – 1.9% | | |
| 2,481 | | Waste Management, Inc. | | 292,584 |
| | | Electrical Equipment – 2.1% | | |
| 2,617 | | AMETEK, Inc. | | 316,500 |
| | | Electronic Equipment,
Instruments & Components – 2.1% | | |
| 2,497 | | Amphenol Corp., Class A | | 326,533 |
| | | Entertainment – 2.0% | | |
| 2,179 | | Electronic Arts, Inc. | | 312,904 |
| | | Food & Staples Retailing – 3.7% | | |
| 773 | | Costco Wholesale Corp. | | 291,251 |
| 1,987 | | Walmart, Inc. | | 286,426 |
| | | | | 577,677 |
| | | Food Products – 5.4% | | |
| 4,610 | | General Mills, Inc. | | 271,068 |
| 1,918 | | Hershey (The) Co. | | 292,169 |
| 5,804 | | Hormel Foods Corp. | | 270,524 |
| | | | | 833,761 |
| | | Health Care Equipment &
Supplies – 1.7% | | |
| 7,480 | | Boston Scientific Corp. (a) | | 268,906 |
| | | Health Care Providers &
Services – 3.8% | | |
| 2,889 | | AmerisourceBergen Corp. | | 282,429 |
| Shares | | Description | | Value |
|
| | | Health Care Providers &
Services (Continued) | | |
| 872 | | UnitedHealth Group, Inc. | | $305,793 |
| | | | | 588,222 |
| | | Household Durables – 2.2% | | |
| 2,901 | | Garmin Ltd. | | 347,134 |
| | | Household Products – 1.8% | | |
| 1,991 | | Procter & Gamble (The) Co. | | 277,028 |
| | | Industrial Conglomerates – 6.0% | | |
| 1,682 | | 3M Co. | | 293,997 |
| 1,644 | | Honeywell International, Inc. | | 349,679 |
| 663 | | Roper Technologies, Inc. | | 285,812 |
| | | | | 929,488 |
| | | Insurance – 7.9% | | |
| 3,106 | | Allstate (The) Corp. | | 341,443 |
| 1,351 | | Aon PLC, Class A | | 285,426 |
| 2,501 | | Marsh & McLennan Cos., Inc. | | 292,617 |
| 2,979 | | Progressive (The) Corp. | | 294,563 |
| | | | | 1,214,049 |
| | | Interactive Media & Services – 2.1% | | |
| 183 | | Alphabet, Inc., Class A (a) | | 320,733 |
| | | Internet & Direct Marketing
Retail – 1.7% | | |
| 5,150 | | eBay, Inc. | | 258,788 |
| | | IT Services – 4.1% | | |
| 1,250 | | Accenture PLC, Class A | | 326,513 |
| 1,436 | | Visa, Inc., Class A | | 314,096 |
| | | | | 640,609 |
| | | Life Sciences Tools &
Services – 2.0% | | |
| 517 | | Bio-Rad Laboratories, Inc., Class A (a) | | 301,380 |
| | | Machinery – 1.8% | | |
| 1,391 | | Illinois Tool Works, Inc. | | 283,597 |
| | | Multiline Retail – 1.8% | | |
| 1,297 | | Dollar General Corp. | | 272,759 |
| | | Personal Products – 2.2% | | |
| 1,283 | | Estee Lauder (The) Cos., Inc., Class A | | 341,522 |
| | | Pharmaceuticals – 9.8% | | |
| 1,968 | | Eli Lilly & Co. | | 332,277 |
| 1,941 | | Johnson & Johnson | | 305,475 |
| 3,602 | | Merck & Co., Inc. | | 294,644 |
| 7,992 | | Pfizer, Inc. | | 294,185 |
Page 56
See Notes to Financial Statements
First Trust Capital Strength Portfolio
Portfolio of Investments (Continued)
December 31, 2020
| Shares | | Description | | Value |
| COMMON STOCKS (Continued) |
| | | Pharmaceuticals (Continued) | | |
| 1,758 | | Zoetis, Inc. | | $290,949 |
| | | | | 1,517,530 |
| | | Road & Rail – 4.0% | | |
| 3,589 | | CSX Corp. | | 325,702 |
| 1,370 | | Union Pacific Corp. | | 285,261 |
| | | | | 610,963 |
| | | Semiconductors &
Semiconductor Equipment – 2.0% | | |
| 1,878 | | Texas Instruments, Inc. | | 308,236 |
| | | Specialty Retail – 1.7% | | |
| 1,878 | | Tractor Supply Co. | | 264,009 |
| | | Trading Companies &
Distributors – 2.0% | | |
| 750 | | WW Grainger, Inc. | | 306,255 |
| | | Total Common Stocks | | 14,631,457 |
| | | (Cost $13,894,619) | | |
| REAL ESTATE INVESTMENT TRUSTS – 1.9% |
| | | Equity Real Estate Investment
Trusts – 1.9% | | |
| 1,234 | | Public Storage | | 284,967 |
| | | (Cost $283,158) | | |
| | | Total Investments – 96.5% | | 14,916,424 |
| | | (Cost $14,177,777) (b) | | |
| | | Net Other Assets and Liabilities – 3.5% | | 543,911 |
| | | Net Assets – 100.0% | | $15,460,335 |
|
| (a) | Non-income producing security. |
| (b) | Aggregate cost for federal income tax purposes was $14,183,196. As of December 31, 2020, the aggregate gross unrealized appreciation for all investments in which there was an excess of value over tax cost was $848,959 and the aggregate gross unrealized depreciation for all investments in which there was an excess of tax cost over value was $115,731. The net unrealized appreciation was $733,228. |
Valuation Inputs
A summary of the inputs used to value the Fund’s investments as of December 31, 2020 is as follows (see Note 2A - Portfolio Valuation in the Notes to Financial Statements):
| | Total
Value at
12/31/2020 | Level 1
Quoted
Prices | Level 2
Significant
Observable
Inputs | Level 3
Significant
Unobservable
Inputs |
| Common Stocks* | $ 14,631,457 | $ 14,631,457 | $ — | $ — |
| Real Estate Investment Trusts* | 284,967 | 284,967 | — | — |
| Total Investments | $ 14,916,424 | $ 14,916,424 | $— | $— |
| * | See Portfolio of Investments for industry breakout. |
See Notes to Financial Statements
Page 57
First Trust International Developed Capital Strength Portfolio
Portfolio of Investments
December 31, 2020
| Shares | | Description | | Value |
| COMMON STOCKS – 101.7% |
| | | Beverages – 2.2% | | |
| 1,087 | | Diageo PLC | | $42,781 |
| | | Biotechnology – 2.1% | | |
| 100 | | Genmab A.S. (a) | | 40,427 |
| | | Capital Markets – 10.3% | | |
| 216 | | Deutsche Boerse AG | | 36,745 |
| 334 | | Euronext N.V. (b) (c) | | 36,784 |
| 800 | | Hong Kong Exchanges & Clearing Ltd. | | 43,857 |
| 1,400 | | Japan Exchange Group, Inc. | | 35,768 |
| 39 | | Partners Group Holding AG | | 45,815 |
| | | | | 198,969 |
| | | Chemicals – 2.0% | | |
| 145 | | Sika AG | | 39,604 |
| | | Commercial Services &
Supplies – 2.0% | | |
| 5,462 | | Rentokil Initial PLC (a) | | 38,064 |
| | | Construction & Engineering – 4.3% | | |
| 1,750 | | Skanska AB, Class B | | 44,603 |
| 1,100 | | Taisei Corp. | | 37,872 |
| | | | | 82,475 |
| | | Diversified Financial Services – 2.2% | | |
| 579 | | Investor AB, Class B | | 42,167 |
| | | Entertainment – 1.6% | | |
| 50 | | Nintendo Co., Ltd. | | 31,877 |
| | | Food & Staples Retailing – 2.0% | | |
| 1,134 | | Alimentation Couche-Tard, Inc., Class B | | 38,646 |
| | | Food Products – 1.9% | | |
| 314 | | Nestle S.A. | | 36,979 |
| | | Health Care Equipment &
Supplies – 2.1% | | |
| 300 | | Hoya Corp. | | 41,460 |
| | | Household Durables – 2.6% | | |
| 500 | | Sony Corp. | | 49,804 |
| | | Household Products – 1.9% | | |
| 1,138 | | Essity AB, Class B | | 36,584 |
| | | IT Services – 7.0% | | |
| 19 | | Adyen N.V. (a) (b) (c) | | 44,217 |
| 555 | | CGI, Inc. (a) | | 44,033 |
| 1,300 | | Nomura Research Institute Ltd. | | 46,521 |
| | | | | 134,771 |
| Shares | | Description | | Value |
|
| | | Machinery – 8.1% | | |
| 784 | | Atlas Copco AB, Class A | | $40,126 |
| 2,531 | | Epiroc AB, Class A | | 46,036 |
| 419 | | Kone OYJ, Class B | | 34,019 |
| 135 | | Schindler Holding AG | | 36,384 |
| | | | | 156,565 |
| | | Marine – 2.1% | | |
| 183 | | Kuehne + Nagel International AG | | 41,507 |
| | | Metals & Mining – 2.4% | | |
| 1,444 | | BHP Group Ltd. | | 47,235 |
| | | Multiline Retail – 2.3% | | |
| 1,140 | | Wesfarmers Ltd. | | 44,296 |
| | | Paper & Forest Products – 2.2% | | |
| 1,816 | | Mondi PLC | | 42,702 |
| | | Personal Products – 2.0% | | |
| 500 | | Kao Corp. | | 38,594 |
| | | Pharmaceuticals – 12.3% | | |
| 358 | | AstraZeneca PLC | | 35,856 |
| 900 | | Chugai Pharmaceutical Co., Ltd. | | 47,966 |
| 521 | | Novo Nordisk A.S., Class B | | 36,485 |
| 109 | | Roche Holding AG | | 38,045 |
| 379 | | Sanofi | | 36,438 |
| 800 | | Shionogi & Co., Ltd. | | 43,659 |
| | | | | 238,449 |
| | | Professional Services – 6.0% | | |
| 14 | | SGS S.A. | | 42,223 |
| 450 | | Thomson Reuters Corp. | | 36,830 |
| 432 | | Wolters Kluwer N.V. | | 36,447 |
| | | | | 115,500 |
| | | Road & Rail – 1.9% | | |
| 342 | | Canadian National Railway Co. | | 37,599 |
| | | Semiconductors &
Semiconductor Equipment – 1.9% | | |
| 100 | | Tokyo Electron Ltd. | | 37,190 |
| | | Software – 5.6% | | |
| 33 | | Constellation Software, Inc. | | 42,852 |
| 4,139 | | Sage Group (The) PLC | | 32,942 |
| 245 | | SAP SE | | 32,091 |
| 61 | | Topicus.com, Inc. (a) (d) (e) | | 231 |
| | | | | 108,116 |
| | | Technology Hardware,
Storage & Peripherals – 2.3% | | |
| 463 | | Logitech International S.A. | | 44,935 |
Page 58
See Notes to Financial Statements
First Trust International Developed Capital Strength Portfolio
Portfolio of Investments (Continued)
December 31, 2020
| Shares | | Description | | Value |
| COMMON STOCKS (Continued) |
| | | Textiles, Apparel & Luxury
Goods – 4.3% | | |
| 40 | | Hermes International | | $42,983 |
| 55 | | Kering S.A. | | 39,938 |
| | | | | 82,921 |
| | | Trading Companies &
Distributors – 2.0% | | |
| 1,152 | | Bunzl PLC | | 38,486 |
| | | Wireless Telecommunication
Services – 2.1% | | |
| 1,400 | | KDDI Corp. | | 41,571 |
| | | Total Investments – 101.7% | | 1,970,274 |
| | | (Cost $1,703,037) (f) | | |
| | | Net Other Assets and Liabilities – (1.7)% | | (32,041) |
| | | Net Assets – 100.0% | | $1,938,233 |
|
| (a) | Non-income producing security. |
| (b) | This security may be resold to qualified foreign investors and foreign institutional buyers under Regulation S of the Securities Act of 1933, as amended (the “1933 Act”). |
| (c) | This security is exempt from registration upon resale under Rule 144A of the 1933 Act and may be resold in transactions exempt from registration, normally to qualified institutional buyers. This security is not restricted on the foreign exchange where it trades freely without any additional registration. As such, it does not require the additional disclosure required of restricted securities. |
| (d) | This security is fair valued by the Advisor’s Pricing Committee in accordance with procedures adopted by the Trust’s Board of Trustees, and in accordance with the provisions of the Investment Company Act of 1940, as amended. At December 31, 2020, securities noted as such are valued at $231 or 0.0% of net assets. |
| (e) | Pursuant to procedures adopted by the Trust’s Board of Trustees, this security has been determined to be illiquid by First Trust Advisors L.P., the Fund’s advisor. |
| (f) | Aggregate cost for federal income tax purposes was $1,714,048. As of December 31, 2020, the aggregate gross unrealized appreciation for all investments in which there was an excess of value over tax cost was $293,252 and the aggregate gross unrealized depreciation for all investments in which there was an excess of tax cost over value was $37,026. The net unrealized appreciation was $256,226. |
Valuation Inputs
A summary of the inputs used to value the Fund’s investments as of December 31, 2020 is as follows (see Note 2A - Portfolio Valuation in the Notes to Financial Statements):
| | Total
Value at
12/31/2020 | Level 1
Quoted
Prices | Level 2
Significant
Observable
Inputs | Level 3
Significant
Unobservable
Inputs |
| Common Stocks: | | | | |
| Software | $ 108,116 | $ 107,885 | $ 231 | $ — |
| Other industry categories* | 1,862,158 | 1,862,158 | — | — |
| Total Investments | $ 1,970,274 | $ 1,970,043 | $ 231 | $— |
| * | See Portfolio of Investments for industry breakout. |
| Country Allocation† | % of Net
Assets |
| Japan | 23.3% |
| Switzerland | 16.8 |
| United Kingdom | 11.9 |
| Sweden | 10.8 |
| Canada | 10.3 |
| France | 6.2 |
| Netherlands | 6.1 |
| Australia | 4.7 |
| Denmark | 4.0 |
| Germany | 3.5 |
| Hong Kong | 2.3 |
| Finland | 1.8 |
| Total Investments | 101.7 |
| Net Other Assets and Liabilities | (1.7) |
| Total | 100.0% |
† Portfolio securities are categorized based upon their country of incorporation.
See Notes to Financial Statements
Page 59
First Trust Variable Insurance Trust
Statements of Assets and Liabilities
December 31, 2020
| | First Trust/Dow
Jones Dividend
& Income
Allocation
Portfolio | | First Trust
Multi Income
Allocation
Portfolio | | First Trust
Dorsey Wright
Tactical Core
Portfolio |
| ASSETS: | | | | | |
Investments, at value - Unaffiliated
| $ 992,922,442 | | $ 21,570,532 | | $ 9,180,563 |
Investments, at value - Affiliated
| — | | 10,148,131 | | 39,977,489 |
Total investments, at value
| 992,922,442 | | 31,718,663 | | 49,158,052 |
Cash
| 4,183,616 | | 800,236 | | 770,835 |
Foreign currency
| — | | 231 | | — |
| Receivables: | | | | | |
Investment securities sold
| 3,944,657 | | — | | — |
Interest
| 2,683,732 | | 9,155 | | — |
Dividends
| 823,564 | | 26,811 | | — |
Dividend reclaims
| — | | 967 | | — |
From investment advisor
| — | | 10,159 | | 32,413 |
Fund shares sold
| — | | — | | — |
Miscellaneous
| — | | — | | — |
Prepaid expenses
| 7,627 | | 251 | | 288 |
Total Assets
| 1,004,565,638 | | 32,566,473 | | 49,961,588 |
| LIABILITIES: | | | | | |
| Payables: | | | | | |
Investment securities purchased
| 900,278 | | — | | — |
Investment advisory fees
| 456,053 | | — | | — |
Fund shares redeemed
| 315,994 | | 643 | | 6,673 |
12b-1 distribution and service fees
| 209,682 | | 6,813 | | 10,416 |
Administrative service fees
| 168,001 | | 5,452 | | 8,361 |
Custodian fees
| 97,022 | | 3,726 | | 1,675 |
Licensing fees
| 75,146 | | — | | 11,696 |
Administrative fees
| 58,815 | | 9,494 | | 4,815 |
Shareholder reporting fees
| 48,689 | | 4,420 | | 8,774 |
Audit and tax fees
| 29,780 | | 51,577 | | 32,045 |
Legal fees
| 16,970 | | 483 | | 1,062 |
Transfer agent fees
| 15,420 | | 18,734 | | 9,261 |
Commitment fees
| 3,508 | | 1,718 | | — |
Financial reporting fees
| 771 | | — | | 771 |
Trustees’ fees and expenses
| 8 | | 1 | | 159 |
Other liabilities
| 5,875 | | 3,047 | | 51 |
Total Liabilities
| 2,402,012 | | 106,108 | | 95,759 |
NET ASSETS
| $1,002,163,626 | | $32,460,365 | | $49,865,829 |
| NET ASSETS consist of: | | | | | |
Paid-in capital
| $ 840,572,696 | | $ 30,086,445 | | $ 40,010,799 |
Accumulated distributable earnings (loss)
| 161,590,930 | | 2,373,920 | | 9,855,030 |
NET ASSETS
| $1,002,163,626 | | $32,460,365 | | $49,865,829 |
Investments, at cost - Unaffiliated
| $839,081,736 | | $18,669,276 | | $8,740,415 |
Investments, at cost - Affiliated
| $— | | $9,813,768 | | $32,277,216 |
Total Investments, at cost
| $839,081,736 | | $28,483,044 | | $41,017,631 |
Foreign currency, at cost
| $— | | $230 | | $— |
| Class I Shares: | | | | | |
NET ASSETS
| $1,000,639,656 | | $32,345,112 | | $49,762,232 |
NET ASSET VALUE, per share
| $15.07 | | $11.44 | | $13.68 |
Number of Shares outstanding
| 66,382,687 | | 2,828,590 | | 3,636,463 |
| Class II Shares: | | | | | |
NET ASSETS
| $1,523,970 | | $115,253 | | $103,597 |
NET ASSET VALUE, per share
| $15.11 | | $11.43 | | $13.63 |
Number of Shares outstanding
| 100,875 | | 10,080 | | 7,600 |
Page 60
See Notes to Financial Statements
First Trust
Capital Strength
Portfolio | | First Trust
International
Developed
Capital Strength
Portfolio |
| | | |
| $ 14,916,424 | | $ 1,970,274 |
| — | | — |
| 14,916,424 | | 1,970,274 |
| 409,258 | | 35,476 |
| — | | — |
| | | |
| — | | — |
| — | | — |
| 9,433 | | 721 |
| — | | 698 |
| 11,081 | | 23,033 |
| 176,970 | | — |
| — | | 612 |
| 72 | | 13 |
| 15,523,238 | | 2,030,827 |
| | | |
| | | |
| — | | 21,351 |
| — | | — |
| 173 | | 20 |
| 2,740 | | 228 |
| 2,278 | | 305 |
| 15,918 | | 26,362 |
| 1,314 | | 228 |
| 6,755 | | 7,764 |
| 5,482 | | 5,483 |
| 17,925 | | 20,875 |
| 483 | | 192 |
| 9,005 | | 8,956 |
| — | | — |
| 771 | | 771 |
| — | | — |
| 59 | | 59 |
| 62,903 | | 92,594 |
| $ 15,460,335 | | $ 1,938,233 |
| | | |
| $ 14,726,659 | | $ 1,661,712 |
| 733,676 | | 276,521 |
| $ 15,460,335 | | $ 1,938,233 |
| $14,177,777 | | $1,703,037 |
| $— | | $— |
| $14,177,777 | | $1,703,037 |
| $— | | $— |
| | | |
| $ 14,831,257 | | $ 1,198,926 |
| $12.06 | | $12.68 |
| 1,230,129 | | 94,541 |
| | | |
| $ 629,078 | | $ 739,307 |
| $12.06 | | $12.69 |
| 52,162 | | 58,279 |
See Notes to Financial Statements
Page 61
First Trust Variable Insurance Trust
Statements of Operations
For the Fiscal Year Ended December 31, 2020
| | First Trust/Dow
Jones Dividend
& Income
Allocation
Portfolio | | First Trust
Multi Income
Allocation
Portfolio | | First Trust
Dorsey Wright
Tactical Core
Portfolio |
| INVESTMENT INCOME: | | | | | |
Interest
| $ 12,049,893 | | $ 308,433 | | $ 1,455 |
Dividends - Unaffiliated
| 12,779,975 | | 420,383 | | 355,559 |
Dividends - Affiliated
| — | | 372,588 | | 235,598 |
Foreign withholding tax on dividend income
| (11,434) | | (232,601) | | — |
Total investment income
| 24,818,434 | | 868,803 | | 592,612 |
| EXPENSES: | | | | | |
Investment advisory fees
| 5,527,839 | | 181,526 | | 158,447 |
| 12b-1 distribution and/or service fees: | | | | | |
Class I
| 2,299,842 | | 75,337 | | 112,960 |
Administrative service fees
| 1,842,467 | | 60,270 | | 90,489 |
Administrative fees
| 538,067 | | 28,451 | | 52,641 |
Licensing fees
| 299,407 | | — | | 45,271 |
Custodian fees
| 206,187 | | 9,566 | | 9,319 |
Shareholder reporting fees
| 142,581 | | 24,904 | | 25,374 |
Legal fees
| 112,141 | | 6,343 | | 20,516 |
Transfer agent fees
| 92,640 | | 55,976 | | 59,528 |
Commitment fees
| 43,779 | | 19,880 | | — |
Audit and tax fees
| 30,804 | | 51,384 | | 39,441 |
Trustees’ fees and expenses
| 16,533 | | 15,661 | | 15,863 |
Financial reporting fees
| 9,250 | | — | | 9,064 |
Other
| 20,848 | | 6,775 | | 884 |
Total expenses
| 11,182,385 | | 536,073 | | 639,797 |
Fees waived and expenses reimbursed by the investment advisor
| (128,310) | | (286,133) | | (264,357) |
Net expenses
| 11,054,075 | | 249,940 | | 375,440 |
NET INVESTMENT INCOME (LOSS)
| 13,764,359 | | 618,863 | | 217,172 |
| NET REALIZED AND UNREALIZED GAIN (LOSS): | | | | | |
| Net realized gain (loss) on: | | | | | |
Investments - Unaffiliated
| 8,949,425 | | (537,510) | | 1,243,148 |
Investments - Affiliated
| — | | (175,559) | | 849,222 |
Foreign currency transactions
| — | | 236 | | — |
Futures contracts
| (1,192,395) | | — | | — |
Net realized gain (loss)
| 7,757,030 | | (712,833) | | 2,092,370 |
| Net change in unrealized appreciation (depreciation) on: | | | | | |
Investments - Unaffiliated
| 49,615,751 | | 777,269 | | 28,091 |
Investments - Affiliated
| — | | 119,745 | | 2,313,211 |
Foreign currency translation
| — | | (10) | | — |
Futures contracts
| (149,827) | | — | | — |
Net change in unrealized appreciation (depreciation)
| 49,465,924 | | 897,004 | | 2,341,302 |
NET REALIZED AND UNREALIZED GAIN (LOSS)
| 57,222,954 | | 184,171 | | 4,433,672 |
NET INCREASE (DECREASE) IN NET ASSETS RESULTING FROM OPERATIONS
| $ 70,987,313 | | $ 803,034 | | $ 4,650,844 |
Page 62
See Notes to Financial Statements
| | First Trust
Capital Strength
Portfolio (a) | | First Trust
International
Developed
Capital Strength
Portfolio (a) |
| | | | |
| | $16 | | $3 |
| | 76,423 | | 14,414 |
| | — | | — |
| | — | | (2,018) |
| | 76,439 | | 12,399 |
| | | | |
| | 22,508 | | 5,574 |
| | | | |
| | 10,620 | | 1,276 |
| | 8,864 | | 497 |
| | 51,830 | | 55,310 |
| | 1,351 | | 7,779 |
| | 21,224 | | 35,149 |
| | 13,053 | | 13,008 |
| | 1,240 | | 735 |
| | 35,974 | | 35,842 |
| | — | | — |
| | 17,925 | | 20,875 |
| | 11,693 | | 11,690 |
| | 6,167 | | 6,167 |
| | 642 | | 863 |
| | 203,091 | | 194,765 |
| | (154,126) | | (184,650) |
| | 48,965 | | 10,115 |
| | 27,474 | | 2,284 |
| | | | |
| | | | |
| | 396,614 | | 137,646 |
| | — | | — |
| | — | | (270) |
| | — | | — |
| | 396,614 | | 137,376 |
| | | | |
| | 738,647 | | 267,237 |
| | — | | — |
| | — | | 14 |
| | — | | — |
| | 738,647 | | 267,251 |
| | 1,135,261 | | 404,627 |
| | $1,162,735 | | $406,911 |
| (a) | The Fund’s Class I and Class II shares were seeded on April 30, 2020, and commenced operations on May 1, 2020. |
See Notes to Financial Statements
Page 63
First Trust Variable Insurance Trust
Statements of Changes in Net Assets
| | First Trust/Dow Jones Dividend
& Income Allocation Portfolio | | First Trust Multi Income
Allocation Portfolio |
| | Year
Ended
12/31/2020 | | Year
Ended
12/31/2019 | | Year
Ended
12/31/2020 | | Year
Ended
12/31/2019 |
| OPERATIONS: | | | | | | | |
Net investment income (loss)
| $ 13,764,359 | | $ 14,574,432 | | $ 618,863 | | $ 683,050 |
Net realized gain (loss)
| 7,757,030 | | 29,914,782 | | (712,833) | | 394,925 |
Net change in unrealized appreciation (depreciation)
| 49,465,924 | | 116,900,455 | | 897,004 | | 3,059,257 |
Net increase (decrease) in net assets resulting from operations
| 70,987,313 | | 161,389,669 | | 803,034 | | 4,137,232 |
| DISTRIBUTIONS TO SHAREHOLDERS FROM INVESTMENT OPERATIONS: | | | | | | | |
Class I Shares
| (44,100,456) | | (47,089,053) | | (1,035,632) | | (720,385) |
Class II Shares
| (69,964) | | (21,664) | | (4,069) | | (4,110) |
Total distributions to shareholders from investment operations
| (44,170,420) | | (47,110,717) | | (1,039,701) | | (724,495) |
| CAPITAL TRANSACTIONS: | | | | | | | |
Proceeds from shares sold
| 64,525,900 | | 113,480,580 | | 4,884,876 | | 5,725,807 |
Proceeds from shares reinvested
| 44,169,805 | | 47,110,027 | | 1,035,632 | | 721,392 |
Cost of shares redeemed
| (95,877,168) | | (80,001,939) | | (4,385,300) | | (3,291,316) |
Net increase (decrease) in net assets resulting from capital transactions
| 12,818,537 | | 80,588,668 | | 1,535,208 | | 3,155,883 |
Total increase (decrease) in net assets
| 39,635,430 | | 194,867,620 | | 1,298,541 | | 6,568,620 |
| NET ASSETS: | | | | | | | |
Beginning of period
| 962,528,196 | | 767,660,576 | | 31,161,824 | | 24,593,204 |
End of period
| $1,002,163,626 | | $962,528,196 | | $32,460,365 | | $31,161,824 |
Page 64
See Notes to Financial Statements
First Trust Dorsey Wright
Tactical Core Portfolio | | First Trust
Capital Strength
Portfolio | | First Trust
International
Developed
Capital Strength
Portfolio |
Year
Ended
12/31/2020 | | Year
Ended
12/31/2019 | | Period
Ended
12/31/2020 (a) | | Period
Ended
12/31/2020 (a) |
| | | | | | | |
| $ 217,172 | | $ 302,343 | | $ 27,474 | | $ 2,284 |
| 2,092,370 | | (379,748) | | 396,614 | | 137,376 |
| 2,341,302 | | 8,560,311 | | 738,647 | | 267,251 |
| 4,650,844 | | 8,482,906 | | 1,162,735 | | 406,911 |
| | | | | | | |
| (218,731) | | (1,047,809) | | (410,483) | | (79,560) |
| (637) | | (2,466) | | (18,576) | | (50,830) |
| (219,368) | | (1,050,275) | | (429,059) | | (130,390) |
| | | | | | | |
| 6,812,284 | | 11,969,513 | | 16,214,632 | | 1,610,210 |
| 219,368 | | 1,050,275 | | 429,059 | | 130,390 |
| (12,549,934) | | (7,861,271) | | (1,917,032) | | (78,888) |
| (5,518,282) | | 5,158,517 | | 14,726,659 | | 1,661,712 |
| (1,086,806) | | 12,591,148 | | 15,460,335 | | 1,938,233 |
| | | | | | | |
| 50,952,635 | | 38,361,487 | | — | | — |
| $49,865,829 | | $50,952,635 | | $15,460,335 | | $1,938,233 |
| (a) | The Fund’s Class I and Class II shares were seeded on April 30, 2020, and commenced operations on May 1, 2020. |
See Notes to Financial Statements
Page 65
First Trust/Dow Jones Dividend & Income Allocation Portfolio
Financial Highlights
For a Share outstanding throughout each period
| Class I Shares | Year Ended December 31, |
| 2020 | | 2019 | | 2018 | | 2017 | | 2016 |
Net asset value, beginning of period
| $ 14.68 | | $ 12.82 | | $ 13.73 | | $ 12.85 | | $ 11.94 |
| Income from investment operations: | | | | | | | | | |
Net investment income (loss)
| 0.21 (a) | | 0.23 | | 0.21 | | 0.18 | | 0.14 |
Net realized and unrealized gain (loss)
| 0.85 | | 2.39 | | (0.88) | | 1.54 | | 1.25 (b) |
Total from investment operations
| 1.06 | | 2.62 | | (0.67) | | 1.72 | | 1.39 |
| Distributions paid to shareholders from: | | | | | | | | | |
Net investment income
| (0.21) | | (0.22) | | (0.21) | | (0.18) | | (0.13) |
Net realized gain
| (0.46) | | (0.54) | | (0.03) | | (0.66) | | (0.35) |
Total distributions
| (0.67) | | (0.76) | | (0.24) | | (0.84) | | (0.48) |
Net asset value, end of period
| $15.07 | | $14.68 | | $12.82 | | $13.73 | | $12.85 |
Total return (c) (d)
| 7.81% | | 20.77% | | (4.92)% | | 13.47% | | 11.74% (b) |
| Ratios to average net assets/supplemental data: | | | | | | | | | |
Net assets, end of period (in 000’s)
| $ 1,000,640 | | $ 961,210 | | $ 767,616 | | $ 737,320 | | $ 543,951 |
Ratio of total expenses to average net assets
| 1.21% | | 1.21% | | 1.22% | | 1.23% | | 1.29% |
Ratio of net expenses to average net assets
| 1.20% | | 1.20% | | 1.20% | | 1.20% | | 1.20% |
Ratio of net investment income (loss) to average net assets
| 1.49% | | 1.65% | | 1.56% | | 1.35% | | 1.29% |
Portfolio turnover rate
| 105% | | 89% | | 76% | | 71% | | 96% |
| (a) | Based on average shares outstanding. |
| (b) | First Trust/Dow Jones Dividend & Income Allocation Portfolio received a reimbursement from the Advisor in the amount of $1,000 in connection with a trade error, which represents less than $0.01 per share. Since the Advisor reimbursed the Fund, there was no effect on the total return. |
| (c) | Total return is based on the combination of reinvested dividends, capital gain and return of capital distributions, if any. Total return is not annualized for periods of less than one year. The returns for the Fund do not reflect the deduction of expenses associated with variable products, such as mortality and expense risk charges, separate account charges, and sales charges or the effect of taxes. These expenses would reduce the overall returns above. |
| (d) | Total returns would have been lower if certain fees had not been waived and expenses reimbursed by the investment advisor. |
Page 66
See Notes to Financial Statements
First Trust/Dow Jones Dividend & Income Allocation Portfolio
Financial Highlights (Continued)
For a Share outstanding throughout each period
| Class II Shares | Year Ended December 31, |
| 2020 | | 2019 | | 2018 | | 2017 | | 2016 |
Net asset value, beginning of period
| $ 14.71 | | $ 12.85 | | $ 13.75 | | $ 12.87 | | $ 11.95 |
| Income from investment operations: | | | | | | | | | |
Net investment income (loss)
| 0.24 (a) | | 0.28 (a) | | 0.25 (a) | | 0.14 | | 0.19 |
Net realized and unrealized gain (loss)
| 0.86 | | 2.38 | | (0.88) | | 1.61 | | 1.24 (b) |
Total from investment operations
| 1.10 | | 2.66 | | (0.63) | | 1.75 | | 1.43 |
| Distributions paid to shareholders from: | | | | | | | | | |
Net investment income
| (0.24) | | (0.26) | | (0.24) | | (0.21) | | (0.16) |
Net realized gain
| (0.46) | | (0.54) | | (0.03) | | (0.66) | | (0.35) |
Total distributions
| (0.70) | | (0.80) | | (0.27) | | (0.87) | | (0.51) |
Net asset value, end of period
| $15.11 | | $14.71 | | $12.85 | | $13.75 | | $12.87 |
Total return (c) (d)
| 8.13% | | 21.02% | | (4.60)% | | 13.75% | | 12.07% (b) |
| Ratios to average net assets/supplemental data: | | | | | | | | | |
Net assets, end of period (in 000’s)
| $ 1,524 | | $ 1,318 | | $ 44 | | $ 202 | | $ 17 |
Ratio of total expenses to average net assets
| 0.96% | | 0.97% | | 0.97% | | 1.00% | | 1.04% |
Ratio of net expenses to average net assets
| 0.95% | | 0.95% | | 0.95% | | 0.95% | | 0.95% |
Ratio of net investment income (loss) to average net assets
| 1.74% | | 2.00% | | 1.79% | | 1.88% | | 1.53% |
Portfolio turnover rate
| 105% | | 89% | | 76% | | 71% | | 96% |
| (a) | Based on average shares outstanding. |
| (b) | First Trust/Dow Jones Dividend & Income Allocation Portfolio received a reimbursement from the Advisor in the amount of $1,000 in connection with a trade error, which represents less than $0.01 per share. Since the Advisor reimbursed the Fund, there was no effect on the total return. |
| (c) | Total return is based on the combination of reinvested dividends, capital gain and return of capital distributions, if any. Total return is not annualized for periods of less than one year. The returns for the Fund do not reflect the deduction of expenses associated with variable products, such as mortality and expense risk charges, separate account charges, and sales charges or the effect of taxes. These expenses would reduce the overall returns above. |
| (d) | Total returns would have been lower if certain fees had not been waived and expenses reimbursed by the investment advisor. |
See Notes to Financial Statements
Page 67
First Trust Multi Income Allocation Portfolio
Financial Highlights (Continued)
For a Share outstanding throughout each period
| Class I Shares | Year Ended December 31, |
| 2020 | | 2019 | | 2018 | | 2017 | | 2016 |
Net asset value, beginning of period
| $ 11.55 | | $ 10.17 | | $ 10.89 | | $ 10.54 | | $ 9.86 |
| Income from investment operations: | | | | | | | | | |
Net investment income (loss)
| 0.22 | | 0.26 | | 0.23 | | 0.24 | | 0.20 |
Net realized and unrealized gain (loss)
| 0.05 | | 1.40 | | (0.71) | | 0.39 | | 0.71 |
Total from investment operations
| 0.27 | | 1.66 | | (0.48) | | 0.63 | | 0.91 |
| Distributions paid to shareholders from: | | | | | | | | | |
Net investment income
| (0.24) | | (0.27) | | (0.24) | | (0.25) | | (0.23) |
Net realized gain
| (0.14) | | (0.01) | | — | | (0.03) | | — |
Total distributions
| (0.38) | | (0.28) | | (0.24) | | (0.28) | | (0.23) |
Net asset value, end of period
| $11.44 | | $11.55 | | $10.17 | | $10.89 | | $10.54 |
Total return (a) (b)
| 2.49% | | 16.38% | | (4.44)% | | 6.04% | | 9.27% |
| Ratios to average net assets/supplemental data: | | | | | | | | | |
Net assets, end of period (in 000’s)
| $ 32,345 | | $ 31,012 | | $ 24,451 | | $ 20,083 | | $ 17,965 |
Ratio of total expenses to average net assets (c)
| 1.77% | | 1.80% | | 2.09% | | 2.17% | | 2.22% |
Ratio of net expenses to average net assets (c)
| 0.83% | | 0.83% | | 0.83% | | 0.83% | | 0.83% |
Ratio of net investment income (loss) to average net assets
| 2.04% | | 2.42% | | 2.29% | | 2.24% | | 2.10% |
Portfolio turnover rate
| 49% | | 30% | | 40% | | 46% | | 46% |
| (a) | Total return is based on the combination of reinvested dividends, capital gain and return of capital distributions, if any. Total return is not annualized for periods of less than one year. The returns for the Fund do not reflect the deduction of expenses associated with variable products, such as mortality and expense risk charges, separate account charges, and sales charges or the effect of taxes. These expenses would reduce the overall returns above. |
| (b) | Total returns would have been lower if certain fees had not been waived and expenses reimbursed by the investment advisor. |
| (c) | The Fund indirectly bears its proportionate share of fees and expenses incurred by the underlying funds in which the Fund invests. This ratio does not include these indirect fees and expenses. |
Page 68
See Notes to Financial Statements
First Trust Multi Income Allocation Portfolio
Financial Highlights (Continued)
For a Share outstanding throughout each period
| Class II Shares | Year Ended December 31, |
| 2020 | | 2019 | | 2018 | | 2017 | | 2016 |
Net asset value, beginning of period
| $ 11.54 | | $ 10.17 | | $ 10.88 | | $ 10.54 | | $ 9.86 |
| Income from investment operations: | | | | | | | | | |
Net investment income (loss)
| 0.24 (a) | | 0.30 | | 0.26 | | 0.27 | | 0.20 |
Net realized and unrealized gain (loss)
| 0.05 | | 1.38 | | (0.70) | | 0.38 | | 0.74 |
Total from investment operations
| 0.29 | | 1.68 | | (0.44) | | 0.65 | | 0.94 |
| Distributions paid to shareholders from: | | | | | | | | | |
Net investment income
| (0.26) | | (0.30) | | (0.27) | | (0.28) | | (0.26) |
Net realized gain
| (0.14) | | (0.01) | | — | | (0.03) | | — |
Total distributions
| (0.40) | | (0.31) | | (0.27) | | (0.31) | | (0.26) |
Net asset value, end of period
| $11.43 | | $11.54 | | $10.17 | | $10.88 | | $10.54 |
Total return (b) (c)
| 2.74% | | 16.57% | | (4.11)% | | 6.22% | | 9.53% |
| Ratios to average net assets/supplemental data: | | | | | | | | | |
Net assets, end of period (in 000’s)
| $ 115 | | $ 150 | | $ 142 | | $ 159 | | $ 156 |
Ratio of total expenses to average net assets (d)
| 1.49% | | 1.56% | | 1.83% | | 1.92% | | 1.99% |
Ratio of net expenses to average net assets (d)
| 0.58% | | 0.58% | | 0.58% | | 0.58% | | 0.58% |
Ratio of net investment income (loss) to average net assets
| 2.25% | | 2.66% | | 2.49% | | 2.49% | | 2.34% |
Portfolio turnover rate
| 49% | | 30% | | 40% | | 46% | | 46% |
| (a) | Based on average shares outstanding. |
| (b) | Total return is based on the combination of reinvested dividends, capital gain and return of capital distributions, if any. Total return is not annualized for periods of less than one year. The returns for the Fund do not reflect the deduction of expenses associated with variable products, such as mortality and expense risk charges, separate account charges, and sales charges or the effect of taxes. These expenses would reduce the overall returns above. |
| (c) | Total returns would have been lower if certain fees had not been waived and expenses reimbursed by the investment advisor. |
| (d) | The Fund indirectly bears its proportionate share of fees and expenses incurred by the underlying funds in which the Fund invests. This ratio does not include these indirect fees and expenses. |
See Notes to Financial Statements
Page 69
First Trust Dorsey Wright Tactical Core Portfolio
Financial Highlights (Continued)
For a Share outstanding throughout each period
| Class I Shares | Year Ended December 31, |
| 2020 | | 2019 | | 2018 | | 2017 | | 2016 |
Net asset value, beginning of period
| $ 12.37 | | $ 10.45 | | $ 11.41 | | $ 9.85 | | $ 9.94 |
| Income from investment operations: | | | | | | | | | |
Net investment income (loss)
| 0.06 | | 0.08 | | 0.04 | | 0.06 | | 0.09 |
Net realized and unrealized gain (loss)
| 1.31 | | 2.10 | | (0.95) | | 1.66 | | 0.01 |
Total from investment operations
| 1.37 | | 2.18 | | (0.91) | | 1.72 | | 0.10 |
| Distributions paid to shareholders from: | | | | | | | | | |
Net investment income
| (0.06) | | (0.08) | | (0.03) | | (0.06) | | (0.09) |
Net realized gain
| — | | (0.18) | | (0.02) | | (0.10) | | (0.10) |
Total distributions
| (0.06) | | (0.26) | | (0.05) | | (0.16) | | (0.19) |
Net asset value, end of period
| $13.68 | | $12.37 | | $10.45 | | $11.41 | | $9.85 |
Total return (a) (b)
| 11.09% | | 20.87% | | (8.00)% | | 17.50% | | 0.95% |
| Ratios to average net assets/supplemental data: | | | | | | | | | |
Net assets, end of period (in 000’s)
| $ 49,762 | | $ 50,843 | | $ 38,277 | | $ 22,477 | | $ 10,360 |
Ratio of total expenses to average net assets (c)
| 1.35% | | 1.23% | | 1.40% | | 1.85% | | 2.13% |
Ratio of net expenses to average net assets (c)
| 0.83% | | 0.77% | | 0.74% | | 0.75% | | 0.83% |
Ratio of net investment income (loss) to average net assets
| 0.48% | | 0.62% | | 0.48% | | 0.76% | | 0.98% |
Portfolio turnover rate
| 284% | | 34% | | 70% | | 31% | | 265% |
| (a) | Total return is based on the combination of reinvested dividends, capital gain and return of capital distributions, if any. Total return is not annualized for periods of less than one year. The returns for the Fund do not reflect the deduction of expenses associated with variable products, such as mortality and expense risk charges, separate account charges, and sales charges or the effect of taxes. These expenses would reduce the overall returns above. |
| (b) | Total returns would have been lower if certain fees had not been waived and expenses reimbursed by the investment advisor. |
| (c) | The Fund indirectly bears its proportionate share of fees and expenses incurred by the underlying funds in which the Fund invests. This ratio does not include these indirect fees and expenses. |
Page 70
See Notes to Financial Statements
First Trust Dorsey Wright Tactical Core Portfolio
Financial Highlights (Continued)
For a Share outstanding throughout each period
| Class II Shares | Year Ended December 31, |
| 2020 | | 2019 | | 2018 | | 2017 | | 2016 |
Net asset value, beginning of period
| $ 12.37 | | $ 10.44 | | $ 11.40 | | $ 9.83 | | $ 9.95 |
| Income from investment operations: | | | | | | | | | |
Net investment income (loss)
| 0.09 | | 0.10 | | 0.07 | | 0.10 | | 0.11 |
Net realized and unrealized gain (loss)
| 1.26 | | 2.12 | | (0.95) | | 1.66 | | (0.02) |
Total from investment operations
| 1.35 | | 2.22 | | (0.88) | | 1.76 | | 0.09 |
| Distributions paid to shareholders from: | | | | | | | | | |
Net investment income
| (0.09) | | (0.11) | | (0.06) | | (0.09) | | (0.11) |
Net realized gain
| — | | (0.18) | | (0.02) | | (0.10) | | (0.10) |
Total distributions
| (0.09) | | (0.29) | | (0.08) | | (0.19) | | (0.21) |
Net asset value, end of period
| $13.63 | | $12.37 | | $10.44 | | $11.40 | | $9.83 |
Total return (a) (b)
| 10.96% | | 21.29% | | (7.77)% | | 17.94% | | 0.88% |
| Ratios to average net assets/supplemental data: | | | | | | | | | |
Net assets, end of period (in 000’s)
| $ 104 | | $ 109 | | $ 84 | | $ 59 | | $ 50 |
Ratio of total expenses to average net assets (c)
| 34.33% | | 26.37% | | 32.62% | | 46.41% | | 57.64% |
Ratio of net expenses to average net assets (c)
| 0.57% | | 0.52% | | 0.49% | | 0.50% | | 0.57% |
Ratio of net investment income (loss) to average net assets
| 0.72% | | 0.87% | | 0.73% | | 0.93% | | 1.13% |
Portfolio turnover rate
| 284% | | 34% | | 70% | | 31% | | 265% |
| (a) | Total return is based on the combination of reinvested dividends, capital gain and return of capital distributions, if any. Total return is not annualized for periods of less than one year. The returns for the Fund do not reflect the deduction of expenses associated with variable products, such as mortality and expense risk charges, separate account charges, and sales charges or the effect of taxes. These expenses would reduce the overall returns above. |
| (b) | Total returns would have been lower if certain fees had not been waived and expenses reimbursed by the investment advisor. |
| (c) | The Fund indirectly bears its proportionate share of fees and expenses incurred by the underlying funds in which the Fund invests. This ratio does not include these indirect fees and expenses. |
See Notes to Financial Statements
Page 71
First Trust Capital Strength Portfolio
Financial Highlights (Continued)
For a Share outstanding throughout the period
| Class I Shares | Period
Ended
12/31/2020 (a) |
Net asset value, beginning of period
| $ 10.00 |
| Income from investment operations: | |
Net investment income (loss)
| 0.02 |
Net realized and unrealized gain (loss)
| 2.39 |
Total from investment operations
| 2.41 |
| Distributions paid to shareholders from: | |
Net investment income
| (0.02) |
Net realized gain
| (0.33) |
Total distributions
| (0.35) |
Net asset value, end of period
| $12.06 |
Total return (b) (c)
| 24.17% |
| Ratios to average net assets/supplemental data: | |
Net assets, end of period (in 000’s)
| $ 14,831 |
Ratio of total expenses to average net assets
| 4.37% (d) |
Ratio of net expenses to average net assets
| 1.10% (d) |
Ratio of net investment income (loss) to average net assets
| 0.60% (d) |
Portfolio turnover rate
| 79% |
| (a) | The Fund’s Class I and Class II shares were seeded on April 30, 2020, and commenced operations on May 1, 2020. |
| (b) | Total return is based on the combination of reinvested dividends, capital gain and return of capital distributions, if any. Total return is not annualized for periods of less than one year. The returns for the Fund do not reflect the deduction of expenses associated with variable products, such as mortality and expense risk charges, separate account charges, and sales charges or the effect of taxes. These expenses would reduce the overall returns above. |
| (c) | Total returns would have been lower if certain fees had not been waived and expenses reimbursed by the investment advisor. |
| (d) | Annualized. |
Page 72
See Notes to Financial Statements
First Trust Capital Strength Portfolio
Financial Highlights (Continued)
For a Share outstanding throughout the period
| Class II Shares | Period
Ended
12/31/2020 (a) |
Net asset value, beginning of period
| $ 10.00 |
| Income from investment operations: | |
Net investment income (loss)
| 0.04 |
Net realized and unrealized gain (loss)
| 2.39 |
Total from investment operations
| 2.43 |
| Distributions paid to shareholders from: | |
Net investment income
| (0.04) |
Net realized gain
| (0.33) |
Total distributions
| (0.37) |
Net asset value, end of period
| $12.06 |
Total return (b) (c)
| 24.33% |
| Ratios to average net assets/supplemental data: | |
Net assets, end of period (in 000’s)
| $ 629 |
Ratio of total expenses to average net assets
| 6.90% (d) |
Ratio of net expenses to average net assets
| 0.85% (d) |
Ratio of net investment income (loss) to average net assets
| 0.84% (d) |
Portfolio turnover rate
| 79% |
| (a) | The Fund’s Class I and Class II shares were seeded on April 30, 2020, and commenced operations on May 1, 2020. |
| (b) | Total return is based on the combination of reinvested dividends, capital gain and return of capital distributions, if any. Total return is not annualized for periods of less than one year. The returns for the Fund do not reflect the deduction of expenses associated with variable products, such as mortality and expense risk charges, separate account charges, and sales charges or the effect of taxes. These expenses would reduce the overall returns above. |
| (c) | Total returns would have been lower if certain fees had not been waived and expenses reimbursed by the investment advisor. |
| (d) | Annualized. |
See Notes to Financial Statements
Page 73
First Trust International Developed Capital Strength Portfolio
Financial Highlights (Continued)
For a Share outstanding throughout the period
| Class I Shares | Period
Ended
12/31/2020 (a) |
Net asset value, beginning of period
| $ 10.00 |
| Income from investment operations: | |
Net investment income (loss)
| 0.01 |
Net realized and unrealized gain (loss)
| 3.57 |
Total from investment operations
| 3.58 |
| Distributions paid to shareholders from: | |
Net investment income
| (0.06) |
Net realized gain
| (0.84) |
Total distributions
| (0.90) |
Net asset value, end of period
| $12.68 |
Total return (b) (c)
| 36.03% |
| Ratios to average net assets/supplemental data: | |
Net assets, end of period (in 000’s)
| $ 1,199 |
Ratio of total expenses to average net assets
| 20.98% (d) |
Ratio of net expenses to average net assets
| 1.20% (d) |
Ratio of net investment income (loss) to average net assets
| 0.14% (d) |
Portfolio turnover rate
| 52% |
| (a) | The Fund’s Class I and Class II shares were seeded on April 30, 2020, and commenced operations on May 1, 2020. |
| (b) | Total return is based on the combination of reinvested dividends, capital gain and return of capital distributions, if any. Total return is not annualized for periods of less than one year. The returns for the Fund do not reflect the deduction of expenses associated with variable products, such as mortality and expense risk charges, separate account charges, and sales charges or the effect of taxes. These expenses would reduce the overall returns above. |
| (c) | Total returns would have been lower if certain fees had not been waived and expenses reimbursed by the investment advisor. |
| (d) | Annualized. |
Page 74
See Notes to Financial Statements
First Trust International Developed Capital Strength Portfolio
Financial Highlights (Continued)
For a Share outstanding throughout the period
| Class II Shares | Period
Ended
12/31/2020 (a) |
Net asset value, beginning of period
| $ 10.00 |
| Income from investment operations: | |
Net investment income (loss)
| 0.03 |
Net realized and unrealized gain (loss)
| 3.58 |
Total from investment operations
| 3.61 |
| Distributions paid to shareholders from: | |
Net investment income
| (0.08) |
Net realized gain
| (0.84) |
Total distributions
| (0.92) |
Net asset value, end of period
| $12.69 |
Total return (b) (c)
| 36.31% |
| Ratios to average net assets/supplemental data: | |
Net assets, end of period (in 000’s)
| $ 739 |
Ratio of total expenses to average net assets
| 20.95% (d) |
Ratio of net expenses to average net assets
| 0.95% (d) |
Ratio of net investment income (loss) to average net assets
| 0.37% (d) |
Portfolio turnover rate
| 52% |
| (a) | The Fund’s Class I and Class II shares were seeded on April 30, 2020, and commenced operations on May 1, 2020. |
| (b) | Total return is based on the combination of reinvested dividends, capital gain and return of capital distributions, if any. Total return is not annualized for periods of less than one year. The returns for the Fund do not reflect the deduction of expenses associated with variable products, such as mortality and expense risk charges, separate account charges, and sales charges or the effect of taxes. These expenses would reduce the overall returns above. |
| (c) | Total returns would have been lower if certain fees had not been waived and expenses reimbursed by the investment advisor. |
| (d) | Annualized. |
See Notes to Financial Statements
Page 75
Notes to Financial Statements
First Trust Variable Insurance Trust
December 31, 2020
1. Organization
First Trust Variable Insurance Trust (the “Trust”) is an open-end management investment company organized as a Massachusetts business trust on December 14, 2011 and is registered with the Securities and Exchange Commission under the Investment Company Act of 1940, as amended (the “1940 Act”). The Trust currently offers shares of five series (each a “Fund” and collectively, the “Funds”), First Trust/Dow Jones Dividend & Income Allocation Portfolio (“First Trust Dow Jones”), which commenced investment operations on May 1, 2012, First Trust Multi Income Allocation Portfolio (“First Trust Multi Income”), which commenced investment operations on May 1, 2014, First Trust Dorsey Wright Tactical Core Portfolio (“First Trust Dorsey Wright”), which commenced investment operations on October 30, 2015, First Trust Capital Strength Portfolio (“First Trust Capital Strength”), which commenced operations on May 1, 2020, and First Trust International Developed Capital Strength Portfolio (“First Trust International”), which commenced operations on May 1, 2020. Each Fund’s shares are sold only to variable insurance accounts (each an “Account”) to fund the benefits of the variable annuity and variable life insurance contracts (each a “Contract” and collectively, the “Contracts”) issued by life insurance companies writing variable annuity contracts and variable life insurance contracts with which the Trust has a contract (each a “Participating Insurance Company”).
First Trust Dow Jones’ investment objective is to seek to provide total return by allocating among dividend-paying stocks and investment grade bonds. First Trust Dow Jones seeks to achieve its investment objective by investing, under normal market conditions, approximately 40-60% of its net assets in equity securities and approximately 40-60% of its net assets in fixed-income securities at the time of purchase. Under normal market conditions at the time of purchase at least 80% of the Fund’s net assets (including investment borrowings) will be invested in securities of issuers included in a Dow Jones index. The equity portion of the portfolio will be derived from a quantitative process that seeks to provide total return through investing generally in dividend-paying stocks included in the Dow Jones U.S. Total Stock Market IndexSM. First Trust Advisors L.P. (“First Trust” or the “Advisor”) reserves the right to over-weight, under-weight or exclude certain securities from the portfolio that would otherwise be selected pursuant to the quantitative process in certain instances.
First Trust Dow Jones’ fixed-income component seeks to provide income and preserve capital through investing in a diversified investment-grade debt portfolio. Investment-grade debt securities are those long-term debt securities rated “BBB–” or higher by Standard & Poor’s Financial Services LLC or Fitch Ratings, Inc. or “Baa3” or higher by Moody’s Investors Service, Inc., and those short-term debt securities rated “A-3” or higher by Standard & Poor’s Financial Services LLC, “F3” or higher by Fitch Ratings, Inc. or “Prime 3” or higher by Moody’s Investor Service, Inc. at the time of purchase. Under normal market conditions, at the time of purchase approximately 80% of the net assets of the Fund allocated to corporate debt will be invested in investment-grade debt securities included in the Dow Jones Equal Weight U.S. Issued Corporate Bond IndexSM (the “Bond Index”) and other investment-grade debt securities of issuers whose securities are included in the Bond Index; and investment-grade debt securities of issuers included in the Dow Jones Composite Average. The Fund may also invest in U.S. government and agency securities, including mortgage-backed securities. The Fund may, at certain times, also hold exchange-traded funds (“ETFs”) that invest in investment-grade corporate debt securities and U.S. government bonds in lieu of investing directly in such securities.
First Trust Multi Income’s primary investment objective is to maximize current income, with a secondary objective of capital appreciation. First Trust Multi Income seeks to achieve its objectives through diversified exposure to nine income generating asset classes: dividend paying stocks, preferred stocks, energy infrastructure companies and master limited partnerships (“MLPs”), real estate investment trusts (“REITs”), high yield or “junk” bonds, floating-rate loans, corporate bonds, mortgage-backed securities and Treasury Inflation Protected Securities (“TIPS”). The Fund is actively managed by First Trust and implementing the strategy involves multiple portfolio managers.
The Advisor tactically adjusts allocation weights in a manner deemed to offer attractive levels of total return relative to the level of expected risk. The Advisor intends to adjust asset allocation weights quarterly but may do so more or less frequently depending upon market conditions. The maximum weight of any asset class, at the time of adjustment, is 20%. The minimum weight of any asset class, at the time of adjustment, is 5%.
First Trust Multi Income may, at certain times, invest in ETFs that generally provide exposure to the nine asset classes in lieu of investing directly in such asset classes. Certain of the ETFs may be advised by First Trust. As a result, First Trust will also earn advisory fees on the underlying ETFs.
In general, the U.S. dollar-denominated fixed-income securities in which First Trust Multi Income invests may be issued by U.S. and non- U.S. issuers, of any credit quality, including high yield securities. The high yield securities in which the Fund invests are rated below investment-grade at the time of purchase or unrated and deemed by the Advisor to be of comparable quality, commonly referred to as “junk” bonds. The Fund also invests in the equity securities of domestic and foreign issuers listed on a U.S. or foreign securities
Notes to Financial Statements (Continued)
First Trust Variable Insurance Trust
December 31, 2020
exchange and non-U.S. securities that are listed on a U.S. securities exchange in the form of American Depository Receipts (“ADRs”) and Global Depository Receipts (“GDRs”). The Fund may invest in equity securities issued by small, mid or large capitalization companies.
First Trust Dorsey Wright’s investment objective is to seek to provide total return. First Trust Dorsey Wright seeks to achieve its investment objective by investing, under normal market conditions, at least 80% of its net assets (including investment borrowings) in ETFs that comprise the Dorsey Wright Tactical Tilt Moderate Core Index. It is expected that a majority of the ETFs in which the Fund invests will be advised by First Trust.
First Trust Capital Strength seeks to provide capital appreciation. First Trust Capital Strength seeks to achieve its investment objective by investing, under normal market conditions, at least 80% of its net assets (including investment borrowings) in the common stocks and REITs that comprise The Capital Strength IndexSM which is developed, maintained and sponsored by Nasdaq, Inc.
First Trust International seeks to provide capital appreciation. First Trust International seeks to achieve its investment objective by investing, under normal market conditions, at least 80% of its net assets (including investment borrowings) in the common stocks that comprise The International Developed Capital Strength IndexSM which is developed, maintained and sponsored by Nasdaq, Inc.
Each Fund offers two classes of shares: Class I and Class II. Each class represents an interest in the same portfolio of investments but with a different combination of service (12b-1) fees, eligibility requirements and other features.
2. Significant Accounting Policies
The Funds are each considered an investment company and follow accounting and reporting guidance under Financial Accounting Standards Board Accounting Standards Codification Topic 946, “Financial Services-Investment Companies.” The following is a summary of significant accounting policies consistently followed by the Funds in the preparation of the financial statements. The preparation of the financial statements in accordance with accounting principles generally accepted in the United States of America (“U.S. GAAP”) requires management to make estimates and assumptions that affect the reported amounts and disclosures in the financial statements. Actual results could differ from those estimates.
A. Portfolio Valuation
The net asset value (“NAV”) for each class of shares in each Fund is determined daily as of the close of regular trading on the New York Stock Exchange (“NYSE”), normally 4:00 p.m. Eastern time, on each day the NYSE is open for trading. If the NYSE closes early on a valuation day, the NAV is determined as of that time. Domestic debt securities and foreign securities are priced using data reflecting the earlier closing of the principal markets for those securities. The NAV for each class is calculated by dividing the value of each Fund’s total assets attributable to such class (including accrued interest and dividends), less all liabilities attributable to such class (including accrued expenses, dividends declared but unpaid, and any borrowings of each Fund) by the total number of shares of the class outstanding. Differences in the NAV of each class of each Fund’s shares are generally expected to be due to the daily expense accruals of the specified service (12b-1) fees, if any, and transfer agency costs applicable to such class of shares and the resulting differential in the dividends that may be paid on each class of shares.
Each Fund’s investments are valued daily at market value or, in the absence of market value with respect to any portfolio securities, at fair value. Market value prices represent last sale or official closing prices from a national or foreign exchange (i.e., a regulated market) and are primarily obtained from third-party pricing services. Fair value prices represent any prices not considered market value prices and are either obtained from a third-party pricing service or are determined by the Advisor’s Pricing Committee, in accordance with valuation procedures adopted by the Trust’s Board of Trustees (the “Board”), and in accordance with provisions of the 1940 Act. Investments valued by the Advisor’s Pricing Committee, if any, are footnoted as such in the footnotes to the Portfolio of Investments. Each Fund’s investments are valued as follows:
Common stocks, preferred stocks, MLPs, ETFs, REITs and other equity securities listed on any national or foreign exchange (excluding The Nasdaq Stock Market LLC (“Nasdaq”) and the London Stock Exchange Alternative Investment Market (“AIM”)) are valued at the last sale price on the exchange on which they are principally traded or, for Nasdaq and AIM securities, the official closing price. Securities traded on more than one securities exchange are valued at the last sale price or official closing price, as applicable, at the close of the securities exchange representing the principal market for such securities.
Securities traded in an over-the-counter market are fair valued at the mean of their most recent bid and asked price, if available, and otherwise at their closing bid price.
Notes to Financial Statements (Continued)
First Trust Variable Insurance Trust
December 31, 2020
Corporate bonds, corporate notes, U.S. government securities and other debt securities are fair valued on the basis of valuations provided by dealers who make markets in such securities or by a third-party pricing service approved by the Trust’s Board, which may use the following valuation inputs when available:
| 1) | benchmark yields; |
| 2) | reported trades; |
| 3) | broker/dealer quotes; |
| 4) | issuer spreads; |
| 5) | benchmark securities; |
| 6) | bids and offers; and |
| 7) | reference data including market research publications. |
Exchange-traded futures contracts are valued at the closing price in the market where such contracts are principally traded. If no closing price is available, exchange-traded futures contracts are fair valued at the mean of their most recent bid and asked price, if available, and otherwise at their closing bid price.
Commercial paper, fixed income and other debt securities having a remaining maturity of sixty days or less when purchased are fair valued at cost adjusted for amortization of premiums and accretion of discounts (amortized cost), provided the Advisor’s Pricing Committee has determined that the use of amortized cost is an appropriate reflection of fair value given market and issuer-specific conditions existing at the time of the determination. Factors that may be considered in determining the appropriateness of the use of amortized cost include, but are not limited to, the following:
| 1) | the credit conditions in the relevant market and changes thereto; |
| 2) | the liquidity conditions in the relevant market and changes thereto; |
| 3) | the interest rate conditions in the relevant market and changes thereto (such as significant changes in interest rates); |
| 4) | issuer-specific conditions (such as significant credit deterioration); and |
| 5) | any other market-based data the Advisor’s Pricing Committee considers relevant. In this regard, the Advisor’s Pricing Committee may use last-obtained market-based data to assist it when valuing portfolio securities using amortized cost. |
Certain securities may not be able to be priced by pre-established pricing methods. Such securities may be valued by the Trust’s Board or its delegate, the Advisor’s Pricing Committee, at fair value. These securities generally include, but are not limited to, restricted securities (securities which may not be publicly sold without registration under the Securities Act of 1933, as amended) for which a third-party pricing service is unable to provide a market price; securities whose trading has been formally suspended; a security whose market or fair value price is not available from a pre-established pricing source; a security with respect to which an event has occurred that is likely to materially affect the value of the security after the market has closed but before the calculation of a Fund’s NAV or make it difficult or impossible to obtain a reliable market quotation; and a security whose price, as provided by the third-party pricing service, does not reflect the security’s fair value. As a general principle, the current fair value of a security would appear to be the amount which the owner might reasonably expect to receive for the security upon its current sale. When fair value prices are used, generally they will differ from market quotations or official closing prices on the applicable exchanges. A variety of factors may be considered in determining the fair value of such securities.
Fair valuation of a debt security will be based on the consideration of all available information, including, but not limited to, the following:
| 1) | the fundamental business data relating to the issuer; |
| 2) | an evaluation of the forces which influence the market in which these securities are purchased and sold; |
| 3) | the type, size and cost of the security; |
| 4) | the financial statements of the issuer; |
| 5) | the credit quality and cash flow of the issuer, based on the Advisor’s or external analysis; |
| 6) | the information as to any transactions in or offers for the security; |
| 7) | the price and extent of public trading in similar securities (or equity securities) of the issuer/borrower, or comparable companies; |
| 8) | the coupon payments; |
| 9) | the quality, value and salability of collateral, if any, securing the security; |
| 10) | the business prospects of the issuer, including any ability to obtain money or resources from a parent or affiliate and an assessment of the issuer’s management (for corporate debt only); |
Notes to Financial Statements (Continued)
First Trust Variable Insurance Trust
December 31, 2020
| 11) | the prospects for the issuer’s industry, and multiples (of earnings and/or cash flows) being paid for similar businesses in that industry (for corporate debt only); and |
| 12) | other relevant factors. |
Fair valuation of an equity security will be based on the consideration of all available information, including, but not limited to, the following:
| 1) | the type of security; |
| 2) | the size of the holding; |
| 3) | the initial cost of the security; |
| 4) | transactions in comparable securities; |
| 5) | price quotes from dealers and/or third-party pricing services; |
| 6) | relationships among various securities; |
| 7) | information obtained by contacting the issuer, analysts, or the appropriate stock exchange; |
| 8) | an analysis of the issuer’s financial statements; and |
| 9) | the existence of merger proposals or tender offers that might affect the value of the security. |
If the securities in question are foreign securities, the following additional information may be considered:
| 1) | the value of similar foreign securities traded on other foreign markets; |
| 2) | ADR trading of similar securities; |
| 3) | closed-end fund or exchange-traded fund trading of similar securities; |
| 4) | foreign currency exchange activity; |
| 5) | the trading prices of financial products that are tied to baskets of foreign securities; |
| 6) | factors relating to the event that precipitated the pricing problem; |
| 7) | whether the event is likely to recur; and |
| 8) | whether the effects of the event are isolated or whether they affect entire markets, countries or regions. |
The Funds are subject to fair value accounting standards that define fair value, establish the framework for measuring fair value and provide a three-level hierarchy for fair valuation based upon the inputs to the valuation as of the measurement date. The three levels of the fair value hierarchy are as follows:
| • | Level 1 – Level 1 inputs are quoted prices in active markets for identical investments. An active market is a market in which transactions for the investment occur with sufficient frequency and volume to provide pricing information on an ongoing basis. |
| • | Level 2 – Level 2 inputs are observable inputs, either directly or indirectly, and include the following: |
| o | Quoted prices for similar investments in active markets. |
| o | Quoted prices for identical or similar investments in markets that are non-active. A non-active market is a market where there are few transactions for the investment, the prices are not current, or price quotations vary substantially either over time or among market makers, or in which little information is released publicly. |
| o | Inputs other than quoted prices that are observable for the investment (for example, interest rates and yield curves observable at commonly quoted intervals, volatilities, prepayment speeds, loss severities, credit risks, and default rates). |
| o | Inputs that are derived principally from or corroborated by observable market data by correlation or other means. |
| • | Level 3 – Level 3 inputs are unobservable inputs. Unobservable inputs may reflect the reporting entity’s own assumptions about the assumptions that market participants would use in pricing the investment. |
The inputs or methodologies used for valuing investments are not necessarily an indication of the risk associated with investing in those investments. A summary of the inputs used to value each Fund’s investments as of December 31, 2020, is included with each Fund’s Portfolio of Investments.
B. Securities Transactions and Investment Income
Securities transactions are recorded as of the trade date. Realized gains and losses from securities transactions are recorded on the identified cost basis. Dividend income is recorded on the ex-dividend date. Interest income is recorded daily on the accrual basis. Amortization of premiums and accretion of discounts are recorded using the effective interest method.
Notes to Financial Statements (Continued)
First Trust Variable Insurance Trust
December 31, 2020
Distributions received from a Fund’s investments in MLPs generally are comprised of return of capital and investment income. A Fund records estimated return of capital and investment income based on historical information available from each MLP. These estimates may subsequently be revised based on information received from the MLPs after their tax reporting periods are concluded.
Distributions received from a Fund’s investments in REITs may be comprised of return of capital, capital gains, and income. The actual character of the amounts received during the year are not known until after the REITs’ fiscal year end. A Fund records the character of distributions received from the REITs during the year based on estimates available. The characterization of distributions received by a Fund may be subsequently revised based on information received from the REITs after their tax reporting periods conclude.
In November 2020, ICE Benchmark Administration Limited (“IBA”), the administrator of the London Interbank Offered Rates (“LIBOR”) announced a consultation process beginning in December 2020 and ending in January 2021 regarding its intention to cease the publication of LIBOR rates. The IBA intends to cease the publication of the one week and two month USD LIBOR settings as well as LIBOR settings in all other currencies immediately following the LIBOR publication on December 31, 2021, and to cease the publication of the remaining USD LIBOR settings (overnight, one month, three month, six month, and twelve month) immediately following the LIBOR publication on June 30, 2023. Follow-up announcements by the Financial Conduct Authority (“FCA”) and US Regulators support the IBA’s intention and include supervisory guidance encouraging parties to adopt fallback LIBOR rates in existing arrangements as soon as practical and to cease entering into new arrangements that use LIBOR as a reference rate no later than December 31, 2021.
In the United States, the Alternative Reference Rates Committee (the “ARRC”), a group of market participants convened by the Board of Governors of the Federal Reserve System and the Federal Reserve Bank of New York in cooperation with other federal and state government agencies, has since 2014 undertaken efforts to identify U.S. dollar reference interest rates as alternatives to LIBOR and to facilitate the mitigation of LIBOR-related risks. In June 2017, the ARRC identified the Secured Overnight Financing Rate (“SOFR”), a broad measure of the cost of cash overnight borrowing collateralized by U.S. Treasury securities, as the preferred alternative for U.S. dollar LIBOR. The Federal Reserve Bank of New York began daily publishing of SOFR in April 2018.
At this time, it is not possible to predict the full impact of the elimination of LIBOR and the establishment of an alternative reference rate on each Fund or its investments.
C. Cash and Cash Equivalents
Normally, the Funds invest substantially all of their assets to meet their investment objectives. The Funds may invest the remainder of their assets in securities with maturities of less than one year or cash equivalents, or they may hold cash. The investment in such instruments is not a principal investment strategy of First Trust Dow Jones, First Trust Multi Income, First Trust Capital Strength or First Trust International. The percentage of each Fund’s net assets invested in such holdings varies and depends on several factors, including market conditions. For temporary defensive purposes and during periods of high cash inflows or outflows, the Funds may depart from their principal investment strategies and invest part or all of their assets in these securities, or they may hold cash.
D. Foreign Currency
The books and records of the Funds are maintained in U.S. dollars. Foreign currencies, investments and other assets and liabilities are translated into U.S. dollars at the exchange rates prevailing at the end of the period. Purchases and sales of investments and items of income and expense are translated on the respective dates of such transactions. Unrealized gains and losses on assets and liabilities, other than investments in securities, which result from changes in foreign currency exchange rates have been included in “Net change in unrealized appreciation (depreciation) on foreign currency translation” on the Statements of Operations. Unrealized gains and losses on investments in securities which result from changes in foreign exchange rates are included with fluctuations arising from changes in market price and are included in “Net change in unrealized appreciation (depreciation) on investments” on the Statements of Operations. Net realized foreign currency gains and losses include the effect of changes in exchange rates between trade date and settlement date on investment security transactions, foreign currency transactions and interest and dividends received and are included in “Net realized gain (loss) on foreign currency transactions” on the Statements of Operations. The portion of foreign currency gains and losses related to fluctuations in exchange rates between the initial purchase settlement date and subsequent sale trade date is included in “Net realized gain (loss) on investments” on the Statements of Operations.
E. Futures Contracts
First Trust Dow Jones purchases or sells (i.e., is long or short) futures contracts to hedge against changes in interest rates (interest rate risk). Futures contracts are agreements between the Fund and a counterparty to buy or sell a specific quantity of an underlying instrument at a specified price and at a specified date. Depending on the terms of the contract, futures contracts are settled either through physical delivery of the underlying instrument on the settlement date or by payment of a cash settlement amount on the settlement date. Open futures contracts can also be closed out prior to settlement by entering into an offsetting transaction in a
Notes to Financial Statements (Continued)
First Trust Variable Insurance Trust
December 31, 2020
matching futures contract. If the Fund is not able to enter into an offsetting transaction, the Fund will continue to be required to maintain margin deposits on the futures contract. When the contract is closed or expires, the Fund records a realized gain or loss equal to the difference between the value of the contract at the time it was opened and the value at the time it was closed or expired. This gain or loss is included in “Net realized gain (loss) on futures” on the Statements of Operations.
Upon entering into a futures contract, the Fund must deposit funds, called margin, with its custodian in the name of the clearing broker equal to a specified percentage of the current value of the contract. Open futures contracts are marked-to-market daily with the change in value recognized as a component of “Net change in unrealized appreciation (depreciation) on futures” on the Statements of Operations. Pursuant to the contract, the Fund agrees to receive from or pay to the broker an amount of cash equal to the daily fluctuation in value of the contract. Such receipts or payments are known as variation margin and are included in “Variation margin” payable or receivable on the Statements of Assets and Liabilities. If market conditions change unexpectedly, the Fund may not achieve the anticipated benefits of the futures contract and may realize a loss. The use of futures contracts involves the risk of imperfect correlation in movements in the price of the futures contracts, interest rates and the underlying instruments.
F. Principal-Only Securities
A principal-only security (“PO Security”) is the principal-only portion of a mortgage-backed security that does not receive any interest, is priced at a deep discount to its redemption value and ultimately receives the redemption value. Generally speaking, when interest rates are falling and prepayment rates are increasing, the value of a PO Security will rise. Conversely, when interest rates are rising and prepayment rates are decreasing, generally the value of a PO Security will fall. These securities, if any, are identified on the Portfolio of Investments.
G. Interest-Only Securities
An interest-only security (“IO Security”) is the interest-only portion of a mortgage-backed security that receives some or all of the interest portion of the underlying mortgage-backed security and little or no principal. A reference principal value called a notional value is used to calculate the amount of interest due to the IO Security. IO Securities are sold at a deep discount to their notional principal amount. Generally speaking, when interest rates are falling and prepayment rates are increasing, the value of an IO Security will fall. Conversely, when interest rates are rising and prepayment rates are decreasing, generally the value of an IO Security will rise. These securities, if any, are identified on the Portfolio of Investments.
H. Affiliated Transactions
First Trust Multi Income and First Trust Dorsey Wright invest in securities of affiliated funds. Dividend income and realized gains and losses from affiliated funds are presented on the Statements of Operations. Each Fund’s investment performance and risks are directly related to the investment performance and risks of the affiliated funds.
Amounts relating to these investments in First Trust Multi Income at December 31, 2020, and for the fiscal year then ended are:
| Security Name | Shares at
12/31/2020 | Value at
12/31/2019 | | Purchases | | Sales | | Change in
Unrealized
Appreciation
(Depreciation) | | Realized
Gain
(Loss) | | Value at
12/31/2020 | | Dividend
Income |
| First Trust Institutional Preferred Securities and Income ETF | 27,690 | $ 612,833 | | $ 95,394 | | $ (168,288) | | $ 24,881 | | $ (498) | | $ 564,322 | | $ 25,860 |
| First Trust Long Duration Opportunities ETF | 500 | 13,550 | | — | | — | | 975 | | — | | 14,525 | | 545 |
| First Trust Low Duration Opportunities ETF | 20,000 | 103,600 | | 1,057,246 | | (130,174) | | (2,532) | | 1,260 | | 1,029,400 | | 8,888 |
| First Trust Preferred Securities and Income ETF | 82,607 | 1,829,180 | | 270,155 | | (502,000) | | 62,037 | | 8,463 | | 1,667,835 | | 73,496 |
| First Trust Senior Loan ETF | 71,920 | 4,265,359 | | 288,502 | | (978,409) | | (10,138) | | (142,641) | | 3,422,673 | | 124,007 |
| First Trust Tactical High Yield ETF | 70,800 | 2,747,853 | | 1,336,929 | | (637,785) | | 44,522 | | (42,143) | | 3,449,376 | | 139,792 |
| | | $9,572,375 | | $3,048,226 | | $(2,416,656) | | $119,745 | | $(175,559) | | $10,148,131 | | $372,588 |
Notes to Financial Statements (Continued)
First Trust Variable Insurance Trust
December 31, 2020
Amounts relating to these investments in First Trust Dorsey Wright at December 31, 2020, and for the fiscal year then ended are:
| Security Name | Shares at
12/31/2020 | Value at
12/31/2019 | | Purchases | | Sales | | Change in
Unrealized
Appreciation
(Depreciation) | | Realized
Gain
(Loss) | | Value at
12/31/2020 | | Dividend
Income |
| First Trust BICK Index Fund | 7,133 | $ 248,903 | | $ 42,937 | | $ (90,205) | | $ 68,726 | | $ (2,137) | | $ 268,224 | | $ 1,152 |
| First Trust Brazil AlphaDEX® Fund | — | 269,032 | | 7,724 | | (154,047) | | (43,739) | | (78,970) | | — | | 2,411 |
| First Trust China AlphaDEX® Fund | — | — | | 204,084 | | (257,945) | | — | | 53,861 | | — | | 8,292 |
| First Trust Chindia ETF | 4,452 | — | | 197,421 | | (80,478) | | 121,716 | | 23,920 | | 262,579 | | 751 |
| First Trust Consumer Discretionary AlphaDEX® Fund | 89,734 | — | | 3,949,637 | | (244,489) | | 822,761 | | 37,757 | | 4,565,666 | | 6,819 |
| First Trust Developed Markets ex-US AlphaDEX® Fund | 10,675 | 603,136 | | 125,822 | | (148,637) | | 60,660 | | (37,523) | | 603,458 | | 14,599 |
| First Trust Dow Jones Internet Index Fund | 19,325 | 4,294,913 | | 2,896,371 | | (3,731,213) | | 36,463 | | 604,811 | | 4,101,345 | | — |
| First Trust Emerging Markets AlphaDEX® Fund | 23,666 | 614,401 | | 151,164 | | (156,998) | | 6,549 | | (16,840) | | 598,276 | | 16,669 |
| First Trust Energy AlphaDEX® Fund | — | — | | 4,079,996 | | (3,658,937) | | — | | (421,059) | | — | | 799 |
| First Trust Enhanced Short Maturity ETF | — | — | | 35,303,028 | | (35,438,667) | | — | | 135,639 | | — | | 77,918 |
| First Trust Europe AlphaDEX® Fund | 5,784 | — | | 223,526 | | — | | (2,924) | | — | | 220,602 | | 2,766 |
| First Trust Financials AlphaDEX® Fund | — | 3,859,715 | | 112,268 | | (2,908,284) | | (138,217) | | (925,482) | | — | | — |
| First Trust Germany AlphaDEX[sup}® Fund | 4,747 | 248,597 | | 39,232 | | (83,393) | | 36,312 | | 779 | | 241,527 | | 3,023 |
| First Trust Health Care AlphaDEX® Fund | — | — | | 2,700,135 | | (2,912,777) | | — | | 212,642 | | — | | — |
| First Trust Large Cap Core AlphaDEX® Fund | — | — | | 7,343,436 | | (8,050,464) | | — | | 707,028 | | — | | 4,093 |
| First Trust Large Cap Growth AlphaDEX® Fund | 50,326 | 5,232,958 | | 3,359,478 | | (4,098,104) | | (15,188) | | 384,361 | | 4,863,505 | | 20,966 |
| First Trust Latin America AlphaDEX® Fund | — | 255,572 | | 7,357 | | (153,327) | | (24,278) | | (85,324) | | — | | 876 |
| First Trust Mid Cap Growth AlphaDEX® Fund | 80,608 | 5,239,659 | | 3,347,276 | | (3,851,088) | | 763,873 | | (229,569) | | 5,270,151 | | 13,542 |
| First Trust Nasdaq Transportation ETF | 154,058 | — | | 3,789,808 | | (151,538) | | 673,558 | | 10,654 | | 4,322,482 | | 6,501 |
| First Trust NASDAQ-100-Technology Sector Index Fund | 31,805 | 5,280,275 | | 3,035,288 | | (4,324,846) | | (639,944) | | 1,040,543 | | 4,391,316 | | 18,437 |
| First Trust Small Cap Growth AlphaDEX® Fund | 87,810 | 4,754,553 | | 9,003,861 | | (7,979,845) | | 634,601 | | (1,001,440) | | 5,411,730 | | 6,413 |
| First Trust Switzerland AlphaDEX® Fund | 4,074 | 266,547 | | 12,325 | | (56,049) | | 12,022 | | 8,984 | | 243,829 | | 4,004 |
| First Trust Technology AlphaDEX® Fund | 41,252 | 4,911,683 | | 2,939,049 | | (3,966,833) | | 87,506 | | 641,394 | | 4,612,799 | | 2,045 |
| First Trust Utilities AlphaDEX® Fund | — | 4,170,633 | | 139,130 | | (3,947,710) | | (147,246) | | (214,807) | | — | | 23,522 |
| | | $40,250,577 | | $83,010,353 | | $(86,445,874) | | $2,313,211 | | $849,222 | | $39,977,489 | | $235,598 |
Notes to Financial Statements (Continued)
First Trust Variable Insurance Trust
December 31, 2020
I. Dividends and Distributions to Shareholders
Distributions from net investment income of each Fund, if any, are declared and paid semi-annually. Each Fund distributes its net realized capital gains, if any, to shareholders at least annually. All dividends payable by each Fund will be reinvested in the Fund.
Distributions from income and capital gains are determined in accordance with federal income tax regulations, which may differ from U.S. GAAP. Certain capital accounts in the financial statements are periodically adjusted for permanent differences in order to reflect their tax character. These permanent differences are primarily due to the varying treatment of income and gain/loss on portfolio securities held by the Funds and have no impact on net assets or NAV per share. Temporary differences, which arise from recognizing certain items of income, expense and gain/loss in different periods for financial statement and tax purposes, will reverse at some time in the future. Permanent differences incurred during the tax year ended December 31, 2020, have been reclassified at year end to reflect the following:
| | Accumulated
Net
Investment
Income (Loss) | | Accumulated
Net Realized
Gain (Loss)
on Investments | | Paid-in
Capital |
First Trust Dow Jones
| $ (15,338) | | $ 15,338 | | $ — |
First Trust Multi Income
| 305,315 | | (304,649) | | (666) |
First Trust Dorsey Wright
| (548) | | 289 | | 259 |
First Trust Capital Strength
| — | | — | | — |
First Trust International
| 1,464 | | (1,464) | | — |
Accumulated distributable earnings (loss) on the Statement of Assets and Liabilities consists of accumulated net investment income (loss), accumulated net realized gain (loss), and unrealized appreciation (depreciation). Net assets were not affected by this reclassification.
The tax character of distributions paid by each Fund during the fiscal year ended December 31, 2020, were as follows:
| | Distributions
paid from
Ordinary
Income | | Distributions
paid from
Capital
Gains | | Distributions
paid from
Return of
Capital |
First Trust Dow Jones
| $ 20,126,368 | | $ 24,044,052 | | $ — |
First Trust Multi Income
| 692,574 | | 347,127 | | — |
First Trust Dorsey Wright
| 219,368 | | — | | — |
First Trust Capital Strength
| 429,059 | | — | | — |
First Trust International
| 130,390 | | — | | — |
The tax character of distributions paid by each Fund during the fiscal year ended December 31, 2019, was as follows:
| | Distributions
paid from
Ordinary
Income | | Distributions
paid from
Capital
Gains | | Distributions
paid from
Return of
Capital |
First Trust Dow Jones
| $ 23,840,429 | | $ 23,270,288 | | $ — |
First Trust Multi Income
| 708,084 | | 16,411 | | — |
First Trust Dorsey Wright
| 312,825 | | 737,450 | | — |
Notes to Financial Statements (Continued)
First Trust Variable Insurance Trust
December 31, 2020
As of December 31, 2020, the components of distributable earnings on a tax basis for each Fund were as follows:
| | Undistributed
Ordinary
Income | | Accumulated
Capital and
Other
Gain (Loss) | | Net
Unrealized
Appreciation
(Depreciation) |
First Trust Dow Jones
| $ 387,947 | | $ 7,901,086 | | $ 153,301,897 |
First Trust Multi Income
| 258,994 | | (750,778) | | 2,865,704 |
First Trust Dorsey Wright
| 3,489 | | 1,786,139 | | 8,065,402 |
First Trust Capital Strength
| 448 | | — | | 733,228 |
First Trust International
| 20,219 | | — | | 256,302 |
J. Income Taxes
First Trust Dow Jones, First Trust Multi Income, and First Trust Dorsey Wright intend to continue to qualify as a regulated investment company by complying with the requirements under Subchapter M of the Internal Revenue Code of 1986, as amended, which includes distributing substantially all of its net investment income and net realized gains to shareholders. First Trust Capital Strength and First Trust International intend to qualify as a regulated investment company by complying with the requirements under Subchapter M of the Internal Revenue Code of 1986, as amended, which includes distributing substantially all of its net investment income and net realized gains to shareholders. Accordingly, no provision has been made for federal and state income taxes. However, due to the timing and amount of distributions, each Fund may be subject to an excise tax of 4% of the amount by which approximately 98% of each Fund’s taxable income exceeds the distributions from such taxable income for the calendar year.
The Funds are subject to accounting standards that establish a minimum threshold for recognizing, and a system for measuring, the benefits of a tax position taken or expected to be taken in a tax return. Taxable years ended 2017, 2018, 2019 and 2020 remain open to federal and state audit for First Trust Dow Jones, First Trust Multi Income and First Trust Dorsey Wright. The taxable year ending 2020 remains open to federal and state audit for First Trust Capital Strength and First Trust International. As of December 31, 2020, management has evaluated the application of these standards to the Funds and has determined that no provision for income tax is required in the Funds’ financial statements for uncertain tax positions.
The Funds intend to utilize provisions of the federal income tax laws, which allow them to carry a realized capital loss forward indefinitely following the year of the loss and offset such loss against any future realized capital gains. The Funds are subject to certain limitations under U.S. tax rules on the use of capital loss carryforwards and net unrealized built-in losses. These limitations apply when there has been a 50% change in ownership. At December 31, 2020, First Trust Multi Income had a non-expiring capital loss carryforward for federal income tax purposes of $750,778.
During the taxable year ended December 31, 2020, First Trust Dorsey Wright utilized its capital loss carryforward in the amount of $373,610.
K. Expenses
Each Fund will pay all expenses directly related to its operations.
Each Participating Insurance Company performs certain administrative services for the Funds, their Accounts and the Contracts. Each Fund pays an administrative services fee of 0.20% of average daily net assets to cover expenses incurred by Participating Insurance Companies in connection with these services.
First Trust has entered into various licensing agreements, which allow First Trust to use certain trademarks and trade names of the applicable licensors (see Licensing Information in the Additional Information section of this report). The Trust, on behalf of First Trust Dow Jones, First Trust Dorsey Wright, First Trust Capital Strength and First Trust International, is a sub-licensee to these license agreements and is required to pay licensing fees, which are shown on the Statements of Operations.
3. Investment Advisory Fee, Affiliated Transactions and Other Fee Arrangements
First Trust, the investment advisor to the Funds, is a limited partnership with one limited partner, Grace Partners of DuPage L.P., and one general partner, The Charger Corporation. The Charger Corporation is an Illinois corporation controlled by James A. Bowen, Chief Executive Officer of First Trust. First Trust provides each Fund with discretionary investment services and certain administrative services necessary for the management of the Funds. For its investment advisory and management services, First Trust is entitled to a monthly fee calculated at an annual rate of 0.60% of the average daily net assets for First Trust Dow Jones, First Trust Multi Income, and First Trust International, 0.35% of the average daily net assets for First Trust Dorsey Wright, and 0.50% of the average daily net
Notes to Financial Statements (Continued)
First Trust Variable Insurance Trust
December 31, 2020
assets for First Trust Capital Strength. First Trust also provides fund reporting services to First Trust Dow Jones, First Trust Dorsey Wright, First Trust Capital Strength, and First Trust International for a flat annual fee in the amount of $9,250 per Fund.
In addition First Trust Multi Income and First Trust Dorsey Wright incur their respective pro rata share of fees and expenses attributable to each Fund’s investments in other investment companies (“acquired fund fees and expenses”). The total of net expenses and acquired fund fees and expenses represents each Fund’s total net annual operating expenses.
First Trust Multi Income and First Trust have retained Energy Income Partners, LLC (“EIP”) and Stonebridge Advisors LLC (“Stonebridge”) (collectively, the “Sub-Advisors”), affiliates of First Trust, to serve as investment sub-advisors. In this capacity, the Sub-Advisors provide recommendations to the Advisor regarding the selection and ongoing monitoring of certain securities in First Trust Multi Income’s investment portfolio. EIP acts as sub-advisor for, and manages on a discretionary basis the investment and reinvestment of, only the assets of First Trust Multi Income allocated to EIP by the Advisor and furnishes an investment program in respect of and makes investment decisions only with respect to the portion of First Trust Multi Income’s investment portfolio allocated to it by the Advisor. EIP, an affiliate of the Advisor, has been retained by First Trust Multi Income and the Advisor to provide recommendations regarding the selection and ongoing monitoring of the MLP, MLP affiliate and energy infrastructure securities in First Trust Multi Income’s investment portfolio and to exercise discretion only with respect to assets of First Trust Multi Income allocated to EIP. Stonebridge serves as a nondiscretionary sub-advisor. Stonebridge has been retained by First Trust Multi Income and the Advisor to provide recommendations regarding the selection and ongoing monitoring of the preferred and hybrid securities in First Trust Multi Income’s investment portfolio.
For the services provided and the expenses assumed pursuant to the investment sub-advisory agreement, First Trust will pay EIP a sub-advisory fee equal to 40% monthly in arrears of any remaining monthly investment management fee paid to the Advisor for the average daily net assets allocated to EIP after First Trust’s waiver of any of its investment management fee to comply with the then-current expense cap, as defined below. For the services provided and the expenses assumed pursuant to the investment sub-advisory agreement, First Trust will pay Stonebridge a portfolio management fee equal to an annual rate of 0.20% of the Fund’s average daily net assets allocated to Stonebridge.
First Trust Capital Partners, LLC (“FTCP”), an affiliate of First Trust, owns, through a wholly-owned subsidiary, a 15% ownership interest in each of EIP and EIP Partners, LLC, an affiliate of EIP. FTCP also owns, through a wholly-owned subsidiary, a 51% ownership interest in Stonebridge.
First Trust has agreed to waive fees and/or pay First Trust Dow Jones’ and First Trust Multi Income’s expenses to the extent necessary to prevent the annual operating expenses of Class I shares and Class II shares (excluding interest expense, brokerage commissions and other trading expenses, acquired fund fees and expenses, if any, taxes and extraordinary expenses) from exceeding 1.20% and 0.95% (each an “Expense Cap”), respectively, of each Fund’s average daily net assets per year at least until May 1, 2021. First Trust has agreed to waive fees and/or pay First Trust Dorsey Wright’s expenses to the extent necessary to prevent the operating expenses of Class I shares and Class II shares (excluding interest expense, brokerage commissions and other trading expenses, taxes and extraordinary expenses) from exceeding 1.30% and 1.05% (each an “Expense Cap”), respectively, of the Fund’s average daily net assets per year at least until May 1, 2021. For First Trust Dorsey Wright, because acquired fund fees and expenses are estimated, First Trust will periodically adjust the amount of the fee waiver and expense reimbursement in order to attempt to meet the Expense Caps. However, total net annual fund expenses may be higher or lower than the Expense Caps. First Trust has agreed to waive fees and/or pay First Trust Capital Strength’s expenses to the extent necessary to prevent the annual operating expenses of Class I shares and Class II shares (excluding interest expense, brokerage commissions and other trading expenses, acquired fund fees and expenses, if any, taxes and extraordinary expenses) from exceeding 1.10% and 0.85% (each an “Expense Cap”), respectively, of the Fund’s average daily net assets per year at least until May 1, 2022. First Trust has agreed to waive fees and/or pay First Trust International’s expenses to the extent necessary to prevent the annual operating expenses of Class I shares and Class II shares (excluding interest expense, brokerage commissions and other trading expenses, acquired fund fees and expenses, if any, taxes and extraordinary expenses) from exceeding 1.20% and 0.95% (each an “Expense Cap”), respectively, of the Fund’s average daily net assets per year at least until May 1, 2022.
Expenses borne and fees waived by First Trust are subject to reimbursement by each Fund for up to three years from the date the fee or expense was incurred by the Fund, but no reimbursement payment will be made by the Fund at any time if it would result in the Fund’s expenses exceeding (i) the Expense Cap in place for the most recent fiscal year for which such expense limitation was in place, (ii) the Expense Cap in place at the time the fees were waived or expenses reimbursed, or (iii) the current Expense Cap. These amounts, if any, are included in “Expenses previously waived or reimbursed” on the Statements of Operations.
The advisory fee waivers and expense reimbursements for the year ended December 31, 2020, and the expenses borne and fees waived by First Trust subject to recovery from the applicable Fund at December 31, 2020, are included in the table below.
Notes to Financial Statements (Continued)
First Trust Variable Insurance Trust
December 31, 2020
| | | | | | Fees Waived or Expenses Borne by First Trust Subject to Recovery |
| | Fees
Waived | | Expenses
Reimbursed | | Year Ended
December 31, 2018 | | Year Ended
December 31, 2019 | | Year Ended
December 31, 2020 | | Total |
| First Trust Dow Jones | $ 128,310 | | $ — | | $ 186,633 | | $ 75,487 | | $ 128,310 | | $ 390,430 |
| First Trust Multi Income | 174,191 | | — | | 192,140 | | 170,572 | | 174,191 | | 536,903 |
| First Trust Dorsey Wright | 158,447 | | 105,910 | | 230,266 | | 251,423 | | 264,357 | | 746,046 |
| First Trust Capital Strength | 22,508 | | 131,618 | | — | | — | | 154,126 | | 154,126 |
| First Trust International | 5,574 | | 179,076 | | — | | — | | 184,650 | | 184,650 |
During the year ended December 31, 2020, First Trust did not recover any fees that were previously waived or reimbursed.
First Trust agreed to waive and/or reimburse the acquired fund fees and expenses of the shares of investment companies held by First Trust Multi Income up to 0.37% of the Fund’s average daily net assets through May 1, 2021. During the year ended December 31, 2020, First Trust reimbursed First Trust Multi Income $111,942 of fees that are not subject to recovery.
BNY Mellon Investment Servicing (US) Inc. (“BNYM IS”) serves as each Fund’s transfer agent in accordance with certain fee arrangements. As transfer agent, BNYM IS is responsible for maintaining shareholder records for the Funds. BNYM IS is a subsidiary of The Bank of New York Mellon Corporation, a financial holding company.
The Bank of New York Mellon (“BNYM”) serves as First Trust Dow Jones’, First Trust Multi Income’s, First Trust Capital Strength’s, and First Trust International’s administrator, fund accountant and custodian in accordance with certain fee arrangements. As administrator and fund accountant, BNYM is responsible for providing certain administrative and accounting services to the Funds, including maintaining the Funds’ books of account, records of the Funds’ securities transactions, and certain other books and records. As custodian, BNYM is responsible for custody of each Fund’s assets. BNYM is a subsidiary of The Bank of New York Mellon Corporation, a financial holding company.
Brown Brothers Harriman & Co. (“BBH”) serves as First Trust Dorsey Wright’s administrator, fund accountant and custodian. As custodian, BBH is responsible for custody of the Fund’s assets. As administrator and fund accountant, BBH is responsible for providing certain administrative and accounting services to the Fund, including maintaining the Fund’s books of account, records of the Fund’s securities transactions, and certain other books and records.
Each Trustee who is not an officer or employee of First Trust, any sub-advisor or any of their affiliates (“Independent Trustees”) is paid a fixed annual retainer that is allocated equally among each fund in the First Trust Fund Complex. Each Independent Trustee is also paid an annual per fund fee that varies based on whether the fund is a closed-end or other actively managed fund, a defined-outcome fund or an index fund.
Additionally, the Lead Independent Trustee and the Chairmen of the Audit Committee, Nominating and Governance Committee and Valuation Committee are paid annual fees to serve in such capacities, with such compensation allocated pro rata among each fund in the First Trust Fund Complex based on net assets. Independent Trustees are reimbursed for travel and out-of-pocket expenses in connection with all meetings. The Lead Independent Trustee and Committee Chairmen rotate every three years. The officers and “Interested” Trustee receive no compensation from the Trust for acting in such capacities.
4. Capital Share Transactions
Capital transactions for First Trust Dow Jones were as follows:
| | Year Ended
December 31, 2020 | | Year Ended
December 31, 2019 |
| | Shares | | Value | | Shares | | Value |
| Sales: | | | | | | | |
| Class I | 4,633,074 | | $ 64,099,713 | | 7,957,769 | | $ 112,219,129 |
| Class II | 30,427 | | 426,187 | | 86,654 | | 1,261,451 |
| Total Sales | 4,663,501 | | $ 64,525,900 | | 8,044,423 | | $ 113,480,580 |
Notes to Financial Statements (Continued)
First Trust Variable Insurance Trust
December 31, 2020
| | Year Ended
December 31, 2020 | | Year Ended
December 31, 2019 |
| | Shares | | Value | | Shares | | Value |
| Dividend Reinvestment: | | | | | | | |
| Class I | 3,266,240 | | $ 44,100,456 | | 3,366,237 | | $ 47,089,053 |
| Class II | 5,113 | | 69,349 | | 1,463 | | 20,974 |
| Total Dividend Reinvestment | 3,271,353 | | $ 44,169,805 | | 3,367,700 | | $ 47,110,027 |
| Redemptions: | | | | | | | |
| Class I | (7,010,657) | | $ (95,542,371) | | (5,686,087) | | $ (79,974,071) |
| Class II | (24,282) | | (334,797) | | (1,932) | | (27,868) |
| Total Redemptions | (7,034,939) | | $ (95,877,168) | | (5,688,019) | | $ (80,001,939) |
Capital transactions for First Trust Multi Income were as follows:
| | Year Ended
December 31, 2020 | | Year Ended
December 31, 2019 |
| | Shares | | Value | | Shares | | Value |
| Sales: | | | | | | | |
| Class I | 447,837 | | $ 4,857,683 | | 512,373 | | $ 5,725,331 |
| Class II | 2,856 | | 27,193 | | 46 | | 476 |
| Total Sales | 450,693 | | $ 4,884,876 | | 512,419 | | $ 5,725,807 |
| Dividend Reinvestment: | | | | | | | |
| Class I | 94,823 | | $ 1,035,632 | | 63,416 | | $ 720,385 |
| Class II | — | | — | | 89 | | 1,007 |
| Total Dividend Reinvestment | 94,823 | | $ 1,035,632 | | 63,505 | | $ 721,392 |
| Redemptions: | | | | | | | |
| Class I | (399,861) | | $ (4,326,849) | | (294,214) | | $ (3,278,342) |
| Class II | (5,779) | | (58,451) | | (1,157) | | (12,974) |
| Total Redemptions | (405,640) | | $ (4,385,300) | | (295,371) | | $ (3,291,316) |
Capital transactions for First Trust Dorsey Wright were as follows:
| | Year Ended
December 31, 2020 | | Year Ended
December 31, 2019 |
| | Shares | | Value | | Shares | | Value |
| Sales: | | | | | | | |
| Class I | 569,579 | | $ 6,793,178 | | 1,020,944 | | $ 11,962,787 |
| Class II | 1,616 | | 19,106 | | 608 | | 6,726 |
| Total Sales | 571,195 | | $ 6,812,284 | | 1,021,552 | | $ 11,969,513 |
| Dividend Reinvestment: | | | | | | | |
| Class I | 16,716 | | $ 218,731 | | 86,854 | | $ 1,047,809 |
| Class II | 49 | | 637 | | 204 | | 2,466 |
| Total Dividend Reinvestment | 16,765 | | $ 219,368 | | 87,058 | | $ 1,050,275 |
Notes to Financial Statements (Continued)
First Trust Variable Insurance Trust
December 31, 2020
| | Year Ended
December 31, 2020 | | Year Ended
December 31, 2019 |
| | Shares | | Value | | Shares | | Value |
| Redemptions: | | | | | | | |
| Class I | (1,059,902) | | $ (12,519,678) | | (662,387) | | $ (7,860,803) |
| Class II | (2,891) | | (30,256) | | (40) | | (468) |
| Total Redemptions | (1,062,793) | | $ (12,549,934) | | (662,427) | | $ (7,861,271) |
Capital transactions for First Trust Capital Strength were as follows:
| | Period Ended
December 31, 2020 |
| | Shares | | Value |
| Sales: | | | |
| Class I | 1,354,544 | | $ 15,614,017 |
| Class II | 53,842 | | 600,615 |
| Total Sales | 1,408,386 | | $ 16,214,632 |
| Dividend Reinvestment: | | | |
| Class I | 34,611 | | $ 410,483 |
| Class II | 1,566 | | 18,576 |
| Total Dividend Reinvestment | 36,177 | | $ 429,059 |
| Redemptions: | | | |
| Class I | (159,026) | | $ (1,879,511) |
| Class II | (3,246) | | (37,521) |
| Total Redemptions | (162,272) | | $ (1,917,032) |
Capital transactions for First Trust International were as follows:
| | Period Ended
December 31, 2020 |
| | Shares | | Value |
| Sales: | | | |
| Class I | 93,653 | | $ 1,044,108 |
| Class II | 55,328 | | 566,102 |
| Total Sales | 148,981 | | $ 1,610,210 |
| Dividend Reinvestment: | | | |
| Class I | 6,416 | | $ 79,560 |
| Class II | 4,099 | | 50,830 |
| Total Dividend Reinvestment | 10,515 | | $ 130,390 |
| Redemptions: | | | |
| Class I | (5,528) | | $ (64,253) |
| Class II | (1,148) | | (14,635) |
| Total Redemptions | (6,676) | | $ (78,888) |
Notes to Financial Statements (Continued)
First Trust Variable Insurance Trust
December 31, 2020
5. Purchases and Sales of Securities
For the fiscal year ended December 31, 2020, the cost of purchases and proceeds from sales of investment securities for each Fund, excluding U.S. Government investment securities and short-term investments, were as follows:
| | Purchases | | Sales |
| First Trust Dow Jones | $ 729,381,445 | | $ 746,134,246 |
| First Trust Multi Income | 14,683,853 | | 12,252,791 |
| First Trust Dorsey Wright | 127,928,287 | | 133,189,948 |
| First Trust Capital Strength | 19,686,734 | | 5,905,571 |
| First Trust International | 2,308,408 | | 742,177 |
| | | | |
For the fiscal year ended December 31, 2020, the cost of purchases and proceeds from sales of U.S. government investment securities for each Fund, excluding short-term investments, were as follows:
| | Purchases | | Sales |
| First Trust Dow Jones | $ 230,999,877 | | $ 242,134,123 |
| First Trust Multi Income | 1,061,578 | | 2,100,269 |
| First Trust Dorsey Wright | — | | — |
| First Trust Capital Strength | — | | — |
| First Trust International | — | | — |
6. Derivative Transactions
None of the Funds held derivatives at December 31, 2020.
The following table presents the amount of net realized gain (loss) and change in net unrealized appreciation (depreciation) recognized for the fiscal year ended December 31, 2020, on derivative instruments held by First Trust Dow Jones, as well as the primary underlying risk exposure associated with each instrument.
| Statements of Operations Location | |
| Net realized gain (loss) on futures contracts | $(1,192,395) |
| Net change in unrealized appreciation (depreciation) on futures contracts | (149,827) |
During the fiscal year ended December 31, 2020, the notional value of futures contracts opened and closed were 15,685,140 and 27,935,437, respectively.
First Trust Dow Jones does not have the right to offset financial assets and liabilities related to forward foreign currency contracts on the Statements of Assets and Liabilities.
7. 12b-1 Service Plan
The Trust has adopted a plan (the “Plan”) pursuant to Rule 12b-1 under the 1940 Act, which provides that Class I shares of each of the Funds will be subject to an annual service fee.
First Trust Portfolios L.P. (“FTP”), an affiliate of First Trust, serves as the selling agent and distributor of shares of the Funds. FTP uses the service fee to compensate each Participating Insurance Company for providing account services to contract owners. These services include establishing and maintaining Contract owners’ accounts, supplying information to Contract owners, delivering Fund materials to Contract owners, answering inquiries, and providing other personal services to Contract owners. Each Fund may spend up to 0.25% per year of the average daily net assets of its Class I shares as a service fee under the Plan. In addition, the Plan permits First Trust to use a portion of its advisory fee to compensate FTP for expenses incurred in connection with the sale of a Fund’s Class I shares including, without limitation, compensation of its sales force, expenses of printing and distributing the Prospectus to persons other than Contract owners, expenses of preparing, printing and distributing advertising and sales literature and reports to Contract owners used in connection with the sale of a Fund’s Class I Shares, certain other expenses associated with the servicing of Class I shares of a Fund, and any service-related expenses that may be authorized from time to time by the Board.
Notes to Financial Statements (Continued)
First Trust Variable Insurance Trust
December 31, 2020
During the year ended December 31, 2020, all service fees received by FTP were paid to the Participating Insurance Companies, with no portion of such fees retained by FTP. The Plan may be renewed from year to year if approved by a vote of the Trust’s Board and a vote of the Independent Trustees, who have no direct or indirect financial interest in the Plan, cast in person at a meeting called for the purpose of voting on the Plan.
8. Borrowings
The Trust, on behalf of First Trust Dow Jones and First Trust Multi Income, along with First Trust Series Fund and First Trust Exchange-Traded Fund IV, has a $200 million Credit Agreement (the “BNYM Line of Credit”) with BNYM to be a liquidity backstop during periods of high redemption volume. A commitment fee of 0.15% of the daily amount of the excess of the commitment amount over the outstanding principal balance of the loans will be charged by BNYM, which First Trust will allocate amongst the funds that have access to the BNYM Line of Credit. These fees are reflected in the Statements of Operations in the “Commitment fees” line item. To the extent that either fund accesses the BNYM Line of Credit, there would also be an interest fee charged. Neither First Trust Dow Jones or First Trust Multi Income drew on the BNYM Line of Credit during the year ended December 31, 2020.
9. Indemnification
The Trust, on behalf of the Funds, has a variety of indemnification obligations under contracts with its service providers. The Trust’s maximum exposure under these arrangements is unknown. However, the Trust has not had prior claims or losses pursuant to these contracts and expects the risk of loss to be remote.
10. Subsequent Events
Management has evaluated the impact of all subsequent events to the Funds through the date the financial statements were issued, and has determined that there were no subsequent events requiring recognition or disclosure in the financial statements that have not already been disclosed.
Report of Independent Registered Public Accounting Firm
To the Shareholders and the Board of Trustees of First Trust Variable Insurance Trust:
Opinion on the Financial Statements and Financial Highlights
We have audited the accompanying statements of assets and liabilities of First Trust/Dow Jones Dividend & Income Allocation Portfolio, First Trust Multi Income Allocation Portfolio, First Trust Dorsey Wright Tactical Core Portfolio, First Trust Capital Strength Portfolio, and First Trust International Developed Capital Strength Portfolio (the “Funds”), each a series of the First Trust Variable Insurance Trust, including the portfolios of investments, as of December 31, 2020, the related statements of operations, the statements of changes in net assets, and the financial highlights for the periods indicated in the table below for the Funds; and the related notes. In our opinion, the financial statements and financial highlights present fairly, in all material respects, the financial position of each of the Funds as of December 31, 2020, and the results of their operations, the changes in their net assets, and the financial highlights for the periods listed in the table below in conformity with accounting principles generally accepted in the United States of America.
| Individual Funds Included in the Trust | Statements
of
Operations | Statements of
Changes to
Net Assets | Financial Highlights |
First Trust/Dow Jones Dividend & Income
Allocation Portfolio | For the year ended
December 31, 2020 | For the years ended
December 31, 2020 and 2019 | For the years ended December 31,
2020, 2019, 2018, 2017, and 2016 |
| First Trust Multi Income Allocation Portfolio |
| First Trust Dorsey Wright Tactical Core Portfolio |
| First Trust Capital Strength Portfolio | For the period from May 1, 2020 (commencement of operations)
through December 31, 2020 |
First Trust International Developed Capital Strength
Portfolio |
Basis for Opinion
These financial statements and financial highlights are the responsibility of the Funds’ management. Our responsibility is to express an opinion on the Funds’ financial statements and financial highlights based on our audits. We are a public accounting firm registered with the Public Company Accounting Oversight Board (United States) (PCAOB) and are required to be independent with respect to the Funds in accordance with the U.S. federal securities laws and the applicable rules and regulations of the Securities and Exchange Commission and the PCAOB.
We conducted our audits in accordance with the standards of the PCAOB. Those standards require that we plan and perform the audit to obtain reasonable assurance about whether the financial statements and financial highlights are free of material misstatement, whether due to error or fraud. The Funds are not required to have, nor were we engaged to perform, an audit of their internal control over financial reporting. As part of our audits, we are required to obtain an understanding of internal control over financial reporting but not for the purpose of expressing an opinion on the effectiveness of the Funds’ internal control over financial reporting. Accordingly, we express no such opinion.
Our audits included performing procedures to assess the risks of material misstatement of the financial statements and financial highlights, whether due to error or fraud, and performing procedures that respond to those risks. Such procedures included examining, on a test basis, evidence regarding the amounts and disclosures in the financial statements and financial highlights. Our audits also included evaluating the accounting principles used and significant estimates made by management, as well as evaluating the overall presentation of the financial statements and financial highlights. Our procedures included confirmation of securities owned as of December 31, 2020, by correspondence with the custodians and brokers; when replies were not received from brokers and agent banks, we performed other auditing procedures. We believe that our audits provide a reasonable basis for our opinion.
Chicago, Illinois
February 16, 2021
We have served as the auditor of one or more First Trust investment companies since 2001.
Additional Information
First Trust Variable Insurance Trust
December 31, 2020 (Unaudited)
Proxy Voting Policies and Procedures
A description of the policies and procedures that the Fund uses to determine how to vote proxies and information on how each Fund voted proxies relating to portfolio investments during the most recent 12-month period ended June 30 is available (1) without charge, upon request, by calling (800) 988-5891; (2) on each Fund’s website at www.ftportfolios.com; and (3) on the Securities and Exchange Commission’s (“SEC”) website at www.sec.gov.
Portfolio Holdings
Each Fund files portfolio holdings information for each month in a fiscal quarter within 60 days after the end of the relevant fiscal quarter on Form N-PORT. Portfolio holdings information for the third month of each fiscal quarter will be publicly available on the SEC’s website at www.sec.gov. Each Fund’s complete schedule of portfolio holdings for the second and fourth quarters of each fiscal year is included in the semi-annual and annual reports to shareholders, respectively, and is filed with the SEC on Form N-CSR. The semi-annual and annual report for each Fund is available to investors within 60 days after the period to which it relates. Each Fund’s Forms N-PORT and Forms N-CSR are available on the SEC’s website listed above.
Federal Tax Information
For the taxable year ended December 31, 2020, the following percentages of income dividend paid by the Funds qualify for the dividends received deduction available to corporations:
| | Dividends
Received Deduction |
First Trust/Dow Jones Dividend & Income Allocation Portfolio
| 75.48% |
First Trust Multi Income Allocation Portfolio
| 26.34% |
First Trust Dorsey Wright Tactical Core Portfolio
| 41.83% |
First Trust Capital Strength Portfolio
| 14.65% |
First Trust International Developed Capital Strength Portfolio
| 0.00% |
For the taxable year ended December 31, 2020, the amount of long-term capital gain distribution by the Funds which is taxable at the applicable capital gains rates for federal income tax purposes were:
| | Long-Term Capital
Gain Distributions |
First Trust/Dow Jones Dividend & Income Allocation Portfolio
| $24,044,052 |
First Trust Multi Income Allocation Portfolio
| 347,127 |
First Trust Dorsey Wright Tactical Core Portfolio
| — |
First Trust Capital Strength Portfolio
| — |
First Trust International Developed Capital Strength Portfolio
| — |
Licensing Information
Standard & Poor’s and S&P are registered trademarks of Standard & Poor’s Financial Services LLC (“S&P”) and Dow Jones is a registered trademark of Dow Jones Trademark Holdings LLC (“Dow Jones”). The trademarks have been licensed to S&P Dow Jones Indices LLC and have been sublicensed for use for certain purposes by First Trust Advisors L.P. (“First Trust”). The DOW JONES EQUAL WEIGHT U.S. ISSUED CORPORATE BOND INDEX℠, DOW JONES U.S. TOTAL STOCK MARKET INDEX℠ AND DOW JONES COMPOSITE AVERAGE are products of S&P Dow Jones Indices LLC and has been licensed for use by First Trust. The First Trust/Dow Jones Dividend & Income Allocation Portfolio is not sponsored, endorsed, sold or promoted by S&P Dow Jones Indices LLC, Dow Jones, S&P, or any of their respective affiliates (collectively, “S&P Dow Jones Indices”). Neither S&P Dow Jones Indices nor its affiliates make any representation or warranty, express or implied, to the owners of the First Trust/Dow Jones Dividend & Income Allocation Portfolio or any member of the public regarding the advisability of investing in securities generally or in the First Trust/Dow Jones Dividend & Income Allocation Portfolio particularly or the ability of the DOW JONES EQUAL WEIGHT U.S. ISSUED CORPORATE BOND INDEX℠, DOW JONES U.S. TOTAL STOCK MARKET INDEX℠ AND DOW JONES COMPOSITE AVERAGE to track general market performance. S&P Dow Jones Indices’ only relationship to First Trust with respect to the DOW JONES EQUAL WEIGHT U.S. ISSUED CORPORATE BOND INDEX℠, DOW JONES U.S. TOTAL STOCK MARKET INDEX℠ AND DOW JONES COMPOSITE AVERAGE is the licensing of the Index and certain trademarks, service marks and/or trade names of S&P Dow Jones Indices. The DOW JONES EQUAL WEIGHT U.S. ISSUED CORPORATE BOND INDEX℠, DOW
Additional Information (Continued)
First Trust Variable Insurance Trust
December 31, 2020 (Unaudited)
JONES U.S. TOTAL STOCK MARKET INDEX℠ AND DOW JONES COMPOSITE AVERAGE is determined, composed and calculated by S&P Dow Jones Indices without regard to First Trust or the First Trust/Dow Jones Dividend & Income Allocation Portfolio. S&P Dow Jones Indices has no obligation to take the needs of First Trust or the owners of the First Trust/Dow Jones Dividend & Income Allocation Portfolio into consideration in determining, composing or calculating the DOW JONES EQUAL WEIGHT U.S. ISSUED CORPORATE BOND INDEX℠, DOW JONES U.S. TOTAL STOCK MARKET INDEX℠ AND DOW JONES COMPOSITE AVERAGE. Neither S&P Dow Jones Indices nor its affiliates are responsible for and have not participated in the determination of the prices, and amount of the First Trust/Dow Jones Dividend & Income Allocation Portfolio or the timing of the issuance or sale of the First Trust/Dow Jones Dividend & Income Allocation Portfolio or in the determination or calculation of the equation by which the First Trust/Dow Jones Dividend & Income Allocation Portfolio is to be managed. S&P Dow Jones Indices has no obligation or liability in connection with the administration, marketing or trading of the First Trust/Dow Jones Dividend & Income Allocation Portfolio. There is no assurance that investment products based on the DOW JONES EQUAL WEIGHT U.S. ISSUED CORPORATE BOND INDEX℠, DOW JONES U.S. TOTAL STOCK MARKET INDEX℠ AND DOW JONES COMPOSITE AVERAGE will accurately track index performance or provide positive investment returns. S&P Dow Jones Indices LLC is not an investment advisor. Inclusion of a security within an index is not a recommendation by S&P Dow Jones Indices to buy, sell, or hold such security, nor is it considered to be investment advice.
NEITHER S&P DOW JONES INDICES NOR ITS AFFILIATES GUARANTEES THE ADEQUACY, ACCURACY, TIMELINESS AND/OR THE COMPLETENESS OF THE DOW JONES EQUAL WEIGHT U.S. ISSUED CORPORATE BOND INDEX℠, DOW JONES U.S. TOTAL STOCK MARKET INDEX℠ AND DOW JONES COMPOSITE AVERAGE OR ANY DATA RELATED THERETO OR ANY COMMUNICATION, INCLUDING BUT NOT LIMITED TO, ORAL OR WRITTEN COMMUNICATION (INCLUDING ELECTRONIC COMMUNICATIONS) WITH RESPECT THERETO. S&P DOW JONES INDICES SHALL NOT BE SUBJECT TO ANY DAMAGES OR LIABILITY FOR ANY ERRORS, OMISSIONS, OR DELAYS THEREIN. S&P DOW JONES INDICES MAKES NO EXPRESS OR IMPLIED WARRANTIES, AND EXPRESSLY DISCLAIMS ALL WARRANTIES, OF MERCHANTABILITY OR FITNESS FOR A PARTICULAR PURPOSE OR USE OR AS TO RESULTS TO BE OBTAINED BY FIRST TRUST, OWNERS OF THE FIRST TRUST/DOW JONES DIVIDEND & INCOME ALLOCATION PORTFOLIO, OR ANY OTHER PERSON OR ENTITY FROM THE USE OF THE DOW JONES EQUAL WEIGHT U.S. ISSUED CORPORATE BOND INDEX℠, DOW JONES U.S. TOTAL STOCK MARKET INDEX℠ AND DOW JONES COMPOSITE AVERAGE OR WITH RESPECT TO ANY DATA RELATED THERETO. WITHOUT LIMITING ANY OF THE FOREGOING, IN NO EVENT WHATSOEVER SHALL S&P DOW JONES INDICES BE LIABLE FOR ANY INDIRECT, SPECIAL, INCIDENTAL, PUNITIVE, OR CONSEQUENTIAL DAMAGES INCLUDING BUT NOT LIMITED TO, LOSS OF PROFITS, TRADING LOSSES, LOST TIME OR GOODWILL, EVEN IF THEY HAVE BEEN ADVISED OF THE POSSIBILITY OF SUCH DAMAGES, WHETHER IN CONTRACT, TORT, STRICT LIABILITY, OR OTHERWISE. THERE ARE NO THIRD PARTY BENEFICIARIES OF ANY AGREEMENTS OR ARRANGEMENTS BETWEEN S&P DOW JONES INDICES AND FIRST TRUST, OTHER THAN THE LICENSORS OF S&P DOW JONES INDICES.
The First Trust Dorsey Wright Tactical Core Portfolio (the “Portfolio”) is not sponsored, endorsed, sold or promoted by Dorsey Wright & Associates, LLC or its affiliates (“Licensor”). Licensor makes no representation or warranty, express or implied, to the owners of the Portfolio or any member of the public regarding the advisability of trading in the Portfolio. Licensor’s only relationship to First Trust Advisors L.P. (“First Trust”) is the licensing of certain trademarks and trade names of Licensor and of the Dorsey Wright Tactical Tilt Moderate Core Index which is determined, composed and calculated by Licensor without regard to First Trust or the Portfolio, Licensor has no obligation to take the needs of First Trust or the owners of the Portfolio into consideration in determining, composing or calculating Dorsey Wright Tactical Tilt Moderate Core Index. Licensor is not responsible for and has not participated in the determination of the timing of, prices at, or quantities of the Portfolio to be listed or in the determination or calculation of the equation by which the Portfolio are to be converted into cash. Licensor has no obligation or liability in connection with the administration, marketing or trading of the Portfolio.
LICENSOR DOES NOT GUARANTEE THE ACCURACY AND/OR THE COMPLETENESS OF THE DORSEY WRIGHT TACTICAL TILT MODERATE CORE OR ANY DATA INCLUDED THEREIN AND LICENSOR SHALL HAVE NO LIABILITY FOR ANY ERRORS, OMISSIONS, OR INTERRUPTIONS THEREIN. LICENSOR MAKES NO WARRANTY, EXPRESS OR IMPLIED, AS TO RESULTS TO BE OBTAINED BY FIRST TRUST, OWNERS OF THE FIRST TRUST DORSEY WRIGHT TACTICAL CORE PORTFOLIO, OR ANY OTHER PERSON OR ENTITY FROM THE USE OF THE DORSEY WRIGHT TACTICAL TILT MODERATE CORE INDEX OR ANY DATA INCLUDED THEREIN. LICENSOR MAKES NO EXPRESS OR IMPLIED WARRANTIES, AND EXPRESSLY DISCLAIMS ALL WARRANTIES, OF MERCHANTABILITY OR FITNESS FOR A PARTICULAR PURPOSE OR USE WITH RESPECT TO THE DORSEY WRIGHT TACTICAL TILT MODERATE CORE INDEX OR ANY DATA INCLUDED THEREIN, WITHOUT LIMITING ANY OF THE FOREGOING, IN NO EVENT SHALL LICENSOR HAVE ANY LIABILITY FOR ANY LOST PROFITS OR INDIRECT, PUNITIVE, SPECIAL OR CONSEQUENTIAL DAMAGES (INCLUDING LOST PROFITS), EVEN IF NOTIFIED OF THE POSSIBILITY OF SUCH DAMAGES. THERE ARE NO THIRD PARTY BENEFICIARIES OF ANY AGREEMENTS OR ARRANGEMENTS BETWEEN LICENSOR AND FIRST TRUST.
Additional Information (Continued)
First Trust Variable Insurance Trust
December 31, 2020 (Unaudited)
First Trust does not guarantee the accuracy and/or the completeness of the Capital Strength IndexSM and/or the International Capital Strength IndexSM (together, the “Indexes”) or any data included therein, and First Trust shall have no liability for any errors, omissions or interruptions therein. First Trust makes no warranty, express or implied, as to results to be obtained by the Fund, owners of the shares of the Fund or any other person or entity from the use of the Indexes or any data included therein. First Trust makes no express or implied warranties, and expressly disclaims all warranties of merchantability or fitness for a particular purpose or use with respect to the Indexes or any data included therein. Without limiting any of the foregoing, in no event shall First Trust have any liability for any special, punitive, direct, indirect or consequential damages (including lost profits) arising out of matters relating to the use of the Indexes, even if notified of the possibility of such damages.
The First Trust Capital Strength Portfolio and the First Trust International Capital Strength Portfolio (the “Capital Strength Funds”) are not sponsored, endorsed, sold or promoted by Nasdaq, Inc. (“Nasdaq”) or its affiliates (Nasdaq with its affiliates are referred to as the “Corporations”). The Corporations have not passed on the legality or suitability of, or the accuracy or adequacy of descriptions and disclosures relating to, the Capital Strength Funds. The Corporations make no representation or warranty, express or implied, to the owners of the Capital Strength Funds or any member of the public regarding the advisability of investing in securities generally or in the Capital Strength Funds particularly, or the ability of the Indexes to track general stock market performance. The Corporations’ only relationship to First Trust with respect to the Capital Strength Funds is in the licensing of the Indexes, and certain trade names of the Corporations and the use of the Indexes, which are determined, composed and calculated by Nasdaq without regard to First Trust or the Capital Strength Funds. Nasdaq has no obligation to take the needs of First Trust or the owners of the Capital Strength Funds into consideration in determining, composing or calculating the Indexes. The Corporations are not responsible for and have not participated in the determination of the timing of, prices at, or quantities of Capital Strength Fund Shares to be issued or in the determination or calculation of the equation by which the Capital Strength Fund Shares are to be converted into cash. The Corporations have no liability in connection with the administration, marketing or trading of the Capital Strength Funds.
THE CORPORATIONS DO NOT GUARANTEE THE ACCURACY AND/OR UNINTERRUPTED CALCULATION OF THE INDEXES OR ANY DATA INCLUDED THEREIN. THE CORPORATIONS MAKE NO WARRANTY, EXPRESS OR IMPLIED, AS TO RESULTS TO BE OBTAINED BY LICENSEE, OWNERS OF THE PRODUCT(S) OR ANY OTHER PERSON OR ENTITY FROM THE USE OF THE INDEXES OR ANY DATA INCLUDED THEREIN. THE CORPORATIONS MAKE NO EXPRESS OR IMPLIED WARRANTIES, AND EXPRESSLY DISCLAIM ALL WARRANTIES OF MERCHANTABILITY OR FITNESS FOR A PARTICULAR PURPOSE OR USE WITH RESPECT TO THE INDEXES OR ANY DATA INCLUDED THEREIN. WITHOUT LIMITING ANY OF THE FOREGOING, IN NO EVENT SHALL THE CORPORATIONS HAVE ANY LIABILITY FOR ANY LOST PROFITS ORSPECIAL, INCIDENTAL, PUNITIVE, INDIRECT OR CONSEQUENTIAL DAMAGES, EVEN IF NOTIFIED OF THE POSSIBILITY OF SUCH DAMAGES.
Risk Considerations
Risks are inherent in all investing. The following summarizes some of the risks that should be considered for the Funds. For additional information about the risks associated with investing in the Funds, please see the Funds’ prospectuses and statements of additional information, as well as other regulatory filings.
Bank Loan Risks. Certain of the Funds invest in bank loans. An investment in bank loans subjects the Fund to credit risk, which is heightened for bank loans in which the Fund invests because companies that issue such loans tend to be highly leveraged and thus are more susceptible to the risks of interest deferral, default and/or bankruptcy. Senior floating loans, in which the Fund may invest, are usually rated below investment grade but may also be unrated. As a result, the risks associated with these senior floating loans are similar to the risks of high yield fixed income instruments. An economic downturn would generally lead to a higher non-payment rate, and a senior floating rate loan may lose significant market value before a default occurs. Moreover, any specific collateral used to secure a senior floating rate loan may decline in value or become illiquid, which would adversely affect the senior floating rate loan’s value. Unlike the securities markets, there is no central clearinghouse for loan trades, and the loan market has not established enforceable settlement standards or remedies for failure to settle. Therefore, portfolio transactions in senior floating rate loan may have uncertain settlement time periods. Senior floating rate loans are subject to a number of risks elsewhere in this report, including liquidity risk and the risk of investing in below grade fixed income instruments.
Call Risk. If an issuer calls higher-yielding debt instruments held by the Funds, performance could be adversely impacted.
Convertible Securities Risk. Certain of the ETFs in which certain of the Funds invest may invest in convertible securities. Convertible securities have characteristics of both equity and debt securities and, as a result, are exposed to certain additional risks. The market values of convertible securities tend to decline as interest rates increase and, conversely, to increase as interest rates decline.
However, a convertible security’s market value also tends to reflect the market price of the common stock of the issuing company, particularly when the stock price is greater than the convertible security’s conversion price (i.e., the predetermined price or exchange
Additional Information (Continued)
First Trust Variable Insurance Trust
December 31, 2020 (Unaudited)
ratio at which the convertible security can be converted or exchanged for the underlying common stock). Convertible securities are also exposed to the risk that an issuer is unable to meet its obligation to make dividend or principal payments when due as a result of changing financial or market conditions. Convertible securities generally offer lower interest or dividend yields than non-convertible debt securities of similar credit quality because of their potential for capital appreciation.
Credit Risk. The Funds are subject to credit risk. Credit risk is the risk that an issuer of a security will be unable or unwilling to make dividend, interest and/or principal payments when due and the related risk that the value of a security may decline because of concerns about the issuer’s ability to make such payments.
Currency Exchange Rate Risk. Certain of the ETFs in which certain of the Funds invest may hold investments that are denominated in non-U.S. currencies, or in securities that provide exposure to such currencies, currency exchange rates or interest rates denominated in such currencies. Changes in currency exchange rates and the relative value of non-U.S. currencies will affect the value of the Funds’ investment and the value of your Fund shares. Currency exchange rates can be very volatile and can change quickly and unpredictably. As a result, the value of an investment in the Funds may change quickly and without warning and you may lose money.
Cyber Security Risk. As the use of Internet technology has become more prevalent in the course of business, the Funds have become more susceptible to potential operational risks through breaches in cybersecurity. A breach in cybersecurity refers to both intentional and unintentional events that may cause the Fund to lose proprietary information, suffer data corruption or lose operational capacity. Such events could cause the Fund to incur regulatory penalties, reputational damage, additional compliance costs associated with corrective measures and/or financial loss. Cyber security breaches may involve unauthorized access to the Fund’s digital information systems through “hacking” or malicious software coding, but may also result from outside attacks such as denial-of-service attacks through efforts to make network services unavailable to intended users. In addition, cyber security breaches of the Fund’s third-party service providers, such as its administrator, transfer agent, custodian, or sub-advisor, as applicable, or issuers in which the Fund invests, can also subject the Fund to many of the same risks associated with direct cyber security breaches. The Fund has established risk management systems designed to reduce the risks associated with cyber security. However, there is no guarantee that such efforts will succeed, especially because the Fund does not directly control the cybersecurity systems of issuers or third-party service providers.
Depository Receipts Risk. Certain of the Funds invest in equity securities in the form of Depositary Receipts, which may be less liquid than the underlying securities in their primary trading market. Any distributions paid to the holders of Depositary Receipts are usually subject to a fee charged by the depositary. Holders of Depositary Receipts may have limited voting rights, and investment restrictions in certain countries may adversely impact the value of Depositary Receipts because such restrictions may limit the ability to convert the securities into Depositary Receipts and vice versa. Such restrictions may cause the securities of the underlying issuer to trade at a discount or premium to the market price of the Depositary Receipts.
Dividend Risk. Certain of the Funds are subject to dividend risk. There is no guarantee that the issuers of the Funds’ equity securities will declare dividends in the future or that, if declared, they will either remain at current levels or increase over time.
Energy Infrastructure Companies Risk. Certain of the Funds invest in energy infrastructure companies. These companies principally include publicly-traded MLPs and limited liability companies taxed as partnerships, MLP affiliates and their successor companies, pipeline companies, utilities, and other companies that derive at least 50% of their revenues from operating or providing services in support of infrastructure assets such as pipeline, power transmission and petroleum and natural gas storage in the petroleum, natural gas and power generation industries. The Fund invests in energy infrastructure companies and is subject to certain risks inherent in investing in these types of securities. Energy infrastructure companies may be directly affected by energy commodity prices, especially those companies that own the underlying energy commodity. A decrease in the production or availability of natural gas, natural gas liquids, crude oil, coal or other energy commodities or a decrease in the volume of such commodities available for transportation, processing, storage or distribution may adversely impact the financial performance of energy infrastructure companies. Energy infrastructure companies are subject to significant federal, state and local government regulation in virtually every aspect of their operations, including how facilities are constructed, maintained and operated, environmental and safety controls, and the prices they may charge for products and services. Various governmental authorities have the power to enforce compliance with these regulations and the permits issued under them and violators are subject to administrative, civil and criminal penalties, including civil fines, injunctions or both. Stricter laws, regulations or enforcement policies could be enacted in the future which would likely increase compliance costs and may adversely affect the financial performance of energy infrastructure companies. Natural disasters, such as hurricanes in the Gulf of Mexico, also may impact energy infrastructure companies.
Certain energy infrastructure companies in the utilities industry are subject to imposition of rate caps, increased competition due to deregulation, difficulty in obtaining an adequate return on invested capital or in financing large construction projects, limitations on operations and increased costs and delays attributable to environmental considerations, and the capital market’s ability to absorb utility
Additional Information (Continued)
First Trust Variable Insurance Trust
December 31, 2020 (Unaudited)
debt. In addition, taxes, government regulation, international politics, price and supply fluctuations, volatile interest rates and energy conservation may cause difficulties for these companies. Such issuers have been experiencing certain of these problems to varying degrees.
Equity Securities Risk. Certain of the Funds hold equity securities. The value of the Funds’ shares will fluctuate with changes in the value of these equity securities. Equity securities prices fluctuate for several reasons, including changes in investors’ perceptions of the financial condition of an issuer or the general condition of the relevant stock market, such as market volatility, or when political or economic events affecting the issuers occur. In addition, common stock prices may be particularly sensitive to rising interest rates, as the cost of capital rises and borrowing costs increase. The equity markets have experienced recent volatility that may lead to sharp declines in the value of the underlying ETFs and the Funds.
Exchange-Traded Fund (“ETF”) Risk. An ETF trades like common stock and represents a portfolio of securities. The risks of owning an ETF generally reflect the risks of owning the underlying securities, although lack of liquidity in an ETF could result in it being more volatile. ETFs have management fees and other operating expenses that increase their costs. In general, as a shareholder in other investment companies, the Funds bear their ratable share of the underlying fund’s expenses and are subject to duplicative expenses to the extent a Fund invests in other ETFs.
Extension Risk. Extension risk is the risk that, when interest rates rise, certain obligations will be paid off by the issuer (or obligor) more slowly than anticipated, causing the value of these securities to fall. Rising interest rates tend to extend the duration of securities, making them more sensitive to changes in interest rates. The value of longer-term securities generally changes more in response to changes in interest rates than shorter-term securities. As a result, in a period of rising interest rates, securities may exhibit additional volatility and may lose value.
Financial Companies Risk. Financial companies are especially subject to the adverse effects of economic recession, currency exchange rates, government regulation, decreases in the availability of capital, volatile interest rates, portfolio concentrations in geographic markets and in commercial and residential real estate loans, and competition from new entrants in their fields of business.
Fixed Income Securities Risk. An investment in the Funds involves risk associated with an investment in fixed income securities including the risk that certain of the securities in the Funds may not have the benefit of covenants that would prevent the issuer from engaging in capital restructurings or borrowing transactions in connection with corporate acquisitions, leveraged buyouts or restructurings. This limitation could reduce the ability of the issuer to meet its payment obligations and might result in increased credit risk. In addition, certain of the securities may be redeemed or prepaid by the issuer, resulting in lower interest payments by the Funds and reduced distributions to shareholders.
Floating Rate Loan Risk. Certain of the ETFs in which certain of the Funds invest may invest in floating rate loans, which may include high yield securities, or “junk” loans. An investment in floating rate loans subjects the Funds to credit risk, which is heightened for loans in which the Funds invest because companies that issue such loans tend to be highly leveraged and thus are more susceptible to the risks of interest deferral and/or bankruptcy.
The loans are usually rated below investment grade but may also be unrated. An economic downturn would generally lead to a higher non-payment rate, and a loan may lose significant market value before a default occurs. Moreover, any specific collateral used to secure a loan may decline in value or become illiquid, which would adversely affect the loan’s value. Loans are subject to a number of risks described elsewhere in this annual report, including liquidity risk and the risk of investing in below investment grade debt instruments. Floating rate loans are subject to prepayment risk. The degree to which borrowers prepay loans, whether as a contractual requirement or at their election, may be affected by general business conditions, the financial condition of the borrower and competitive conditions among loan investors, among others. Floating rate loans may also not be considered “securities” under the 1940 Act and therefore prevent the Funds from relying on the anti-fraud provisions of the Act.
Fund of Funds Risk. Certain of the Funds invest in securities of other ETFs, which involves additional expenses that would not be present in a direct investment in such ETFs. Furthermore, the Funds’ investment performance and risks are directly related to the investment performance and risks of the underlying ETFs in which the Funds invest.
High Yield Securities Risk. Certain of the Funds invest in high yield securities, or “junk” bonds, which are subject to greater market fluctuations and risk of loss than securities with higher ratings, and therefore, may be highly speculative. These securities are issued by companies that may have limited operating history, narrowly focused operations, and/or other impediments to the timely payment of periodic interest and principal at maturity. If the economy slows down or dips into recession, the issuers of high yield securities may not have sufficient resources to continue making timely payment of periodic interest and principal at maturity. The market for high yield securities is generally smaller and less liquid than that for investment grade securities. High yield securities are generally not listed on a national securities exchange but trade in the over-the-counter markets. Due to the smaller, less liquid market for high yield
Additional Information (Continued)
First Trust Variable Insurance Trust
December 31, 2020 (Unaudited)
securities, the bid-offer spread on such securities is generally greater than it is for investment grade securities and the purchase or sale of such securities may take longer to complete.
Illiquid Securities Risk. Some of the securities held by certain of the Funds may be illiquid. Illiquid securities involve the risk that the securities will not be able to be sold at the time desired by the Fund or at prices approximately the value at which the Fund is carrying the securities on its books.
Income Risk. Income from the Funds’ fixed income investments could decline during periods of falling interest rates.
Index Rebalance Risk. Pursuant to the methodology that First Trust Dorsey Wright Tactical Core Portfolio’s index provider uses to calculate and maintain the Fund’s underlying index, the Fund may own a significant portion of the First Trust ETFs included in the Fund. Such ETFs may be removed from the underlying index in the event that it does not comply with the eligibility requirements of the underlying index. As a result, the Fund may be forced to sell shares of certain First Trust ETFs at inopportune times or for prices other than at current market values or may elect not to sell such shares on the day that they are removed from the underlying index, due to market conditions or otherwise. Due to these factors, the variation between the Fund’s annual return and the return of the underlying index may increase significantly. Apart from scheduled rebalances, the index provider may carry out additional ad hoc rebalances to the underlying index to, for example, correct an error in the selection of constituents. When the Fund in turn rebalances its portfolio, any transaction costs and market exposure arising from such portfolio rebalancing will be borne by the Fund and its shareholders. Unscheduled rebalances may also expose the Fund to additional tracking error risk. Therefore, errors and additional ad hoc rebalances carried out by the index provider may increase the Fund’s costs and market exposure.
Interest Rate Risk. Interest rate risk is the risk that the value of the fixed-income securities in the Funds will decline because of rising market interest rates. Interest rate risk is generally lower for shorter term investments and higher for longer term investments. Mortgage-related securities are particularly subject to the risk that interest rate volatility may adversely impact the valuation and price of such securities. Additionally, the return on the floating rate loans in which the Funds may invest will decline during a period of falling interest rates.
Investment Companies Risk. The Funds may invest in the shares of other investment companies, and therefore, the Funds’ investment performance and risks may be related to the investment performance and risks of the underlying funds. In general, as a shareholder in other investment companies, the Funds bear their ratable share of the underlying fund’s expenses and would be subject to duplicative expenses to the extent the Funds invest in other investment companies.
Liquidity Risk. The Funds may be subject to the risks of investing in lower-quality debt issued by companies that are highly leveraged. Lower-quality debt tends to be less liquid than higher-quality debt. Moreover, smaller debt issues tend to be less liquid than larger debt issues. If the economy experiences a sudden downturn, or if the debt markets for such companies become distressed, the Funds may have particular difficulty selling their assets in sufficient amounts, at reasonable prices and in a sufficiently timely manner to raise the cash necessary to meet any potentially heavy redemption requests by shareholders.
Loan Prepayment Risk. Loans are subject to prepayment risk. The degree to which borrowers prepay loans, whether as a contractual requirement or at their election, may be affected by general business conditions, the financial condition of the borrower and competitive conditions among loan investors, among others. As such prepayments cannot be predicted with accuracy. Upon a prepayment, either in part or in full, the actual outstanding debt on which the Funds derive interest income will be reduced. The Funds may not be able to reinvest the proceeds received on terms as favorable as the prepaid loan.
Management Risk. Certain of the Funds are subject to management risk because they have actively managed portfolios. The Advisor will apply investment techniques and risk analyses in making investment decisions for the Funds, but there can be no guarantee that the Funds will achieve their investment objectives.
Market Risk. Market risk is the risk that a particular security owned by a Fund or shares of the Funds in general may fall in value. Shares are subject to market fluctuations caused by such factors as economic, political, regulatory or market developments, changes in interest rates and perceived trends in securities prices. Overall Fund share values could decline generally or could underperform other investments.
MLP Risk. Certain of the Funds invest in Master Limited Partnerships (“MLP’s). Investment in MLP units involves risks which differ from an investment in common stock of a corporation. Holders of MLP units have limited control and voting rights on matters affecting the partnership. In addition, there are certain tax risks associated with an investment in MLP units and conflicts of interest may exist between common unit holders and the general partner, including those arising from incentive distribution payments. In addition, there is the risk that an MLP could be, contrary to its intention, taxed as a corporation, resulting in decreased returns from such MLP. On March 15, 2018, the Federal Energy Regulatory Commission (“FERC”) changed its long-standing tax allowance policy which no longer permits MLPs to include in their cost of service an income tax allowance. This has had a negative impact on the
Additional Information (Continued)
First Trust Variable Insurance Trust
December 31, 2020 (Unaudited)
performance of some MLPs affected by this decision. This policy change and any similar policy changes in the future could adversely impact an MLP’s business, financial condition, results of operations and cash flows and ability to pay cash distributions or dividends.
Mortgage Securities Risk. Certain of the ETFs in which certain of the Funds invest may hold mortgage-related securities, including mortgage-backed securities, which may make the Funds more susceptible to adverse economic, political or regulatory events that affect the value of real estate. Changes in local, state and federal policies could negatively impact the mortgage-related securities market, which include various government initiated and sponsored homeowner assistance programs and eminent domain issues. Mortgage related securities may also face liquidity issues when a Fund seeks to sell such securities but is unable to find buyers at a bid-ask spread to make the transaction feasible. These securities are also subject to the risk that the underlying borrowers may default on their mortgages, resulting in a non-payment of principal and interest. Finally, the mortgage-related securities market may be negatively impacted by regulatory changes including those that are related to the mandate or existence of the government-sponsored enterprises, Fannie Mae, Freddie Mac and Ginnie Mae. Mortgage-related securities are subject to prepayment risk. The degree to which borrowers prepay loans, whether as a contractual requirement or at their election, may be affected by general business conditions, the financial condition of the borrower and competitive conditions among loan investors, among others. As such, prepayments cannot be predicted with accuracy.
Upon a prepayment, either in part or in full, the actual outstanding debt on which a Fund derives interest income will be reduced. In declining interest rate environments, the extent to which borrowers prepay a mortgage generally increases, which increase reinvestment risk, or the risk that the proceeds received are not reinvested on terms as favorable as the prepaid loan. Conversely, mortgage-related securities are subject to the risk that the rate of mortgage prepayments decreases, which extends the average life of a security and increases the interest rate risk exposure.
Municipal Bonds Risk. Certain of the ETFs in which certain of the Funds invest may invest in municipal bonds. In addition to being subject to credit, income and interest rate risk (as described in the prospectus), municipal bonds are subject to tax risk. Interest income from municipal bonds is normally not subject to regular federal income tax, but income from municipal bonds held by the underlying ETFs could be declared taxable because of, among other things, unfavorable changes in tax laws, adverse interpretations by the Internal Revenue Service or state tax authorities or noncompliant conduct of a bond issuer. Consequently, the attractiveness of municipal bonds in relation to other investment alternatives is affected by changes in federal income tax rates or changes in the tax-exempt status of interest income from municipal bonds.
Non-Correlation Risk. The Funds’ returns may not match the return of an Index for a number of reasons. For example, the Funds incur operating expenses not applicable to the Indexes, and may incur costs in buying and selling securities, especially when rebalancing the Funds’ portfolio holdings to reflect changes in the composition of the Indexes. In addition, the Funds’ portfolio holdings may not exactly replicate the securities included in the Indexes or the ratios between the securities included in the Indexes.
Non-Diversification Risk. The First Trust Dorsey Wright Tactical Core Portfolio is classified as “non-diversified” under the 1940 Act. As a result, the First Trust Dorsey Wright Tactical Core Portfolio is only limited as to the percentage of its assets that may be invested in the securities of any one issuer by the diversification requirements imposed by the Internal Revenue Code of 1986, as amended (the “Code”). The First Trust Dorsey Wright Tactical Core Portfolio may invest a relatively high percentage of its assets in a limited number of issuers. As a result, the First Trust Dorsey Wright Tactical Core Portfolio may be more susceptible to a single adverse economic or regulatory occurrence affecting one or more of these issuers, experience increased volatility and be highly invested in certain issuers.
Non-U.S. Securities and Emerging Markets Risk. Certain of the Funds invest in securities of non-U.S. issuers. Non-U.S. securities are subject to higher volatility than securities of domestic issuers due to possible adverse political, social or economic developments; restrictions on foreign investment or exchange of securities; lack of liquidity; currency exchange rates; excessive taxation; government seizure of assets; different legal or accounting standards and less government supervision and regulation of exchanges in foreign countries. These risks may be heightened for securities of companies located in, or with significant operations in, emerging market countries.
Preferred Securities Risk. The Funds and certain of the ETFs in which certain of the Funds invest, invest in preferred securities. Preferred securities combine some of the characteristics of both common stocks and bonds. Preferred securities are typically subordinated to bonds and other debt instruments in a company’s capital structure in terms of priority to corporate income, and therefore will be subject to greater credit risk than those debt instruments. Preferred securities are also subject to credit risk, interest rate risk and income risk.
REIT Risk. Certain of the Funds invest in Real Estate Investment Trusts (“REITs”), and as a result, the Fund is subject to the risks associated with investing in real estate, which may include, but are not limited to, fluctuations in the value of underlying properties; defaults by borrowers or tenants; market saturation; changes in general and local operating expenses; and other economic, political or regulatory occurrences affecting companies in the real estate industry. In addition to risks related to investments in real estate
Additional Information (Continued)
First Trust Variable Insurance Trust
December 31, 2020 (Unaudited)
generally, investing in REITs involves certain other risks related to their structure and focus, which include, but are not limited to, dependency upon management skills, limited diversification, the risks of locating and managing financing for projects, heavy cash flow dependency, possible default by borrowers, the costs and potential losses of self-liquidation of one or more holdings, the risk of a possible lack of mortgage funds and associated interest rate risks, overbuilding, property vacancies, increases in property taxes and operating expenses, changes in zoning laws, losses due to environmental damages, changes in neighborhood values and appeal to purchases, the possibility of failing to maintain exemptions from registration under the 1940 Act and, in many cases, relatively small market capitalization, which may result in less market liquidity and greater price volatility. REITs are also subject to the risk that the real estate market may experience an economic downturn generally, which may have a material effect on the real estate in which the REITs invest and their underlying portfolio securities.
Small Fund Risk. Certain of the Funds currently have fewer assets than larger funds, and like other relatively smaller funds, large inflows and outflows may impact the Funds’ market exposure for limited periods of time. This impact may be positive or negative, depending on the direction of market movement during the period affected.
Smaller Company Risk. Certain of the Funds and certain of the ETFs in which certain of the Funds invest, invest in small- and mid-capitalization companies. Such companies may be more vulnerable to adverse general market or economic developments, and their securities may be less liquid and may experience greater price volatility than larger, more established companies as a result of several factors, including limited trading volumes, products or financial resources, management inexperience and less publicly available information. Accordingly, such companies are generally subject to greater market risk than larger, more established companies.
TIPS Risk. Certain of the Funds invest in Treasury Inflation Protected Securities (“TIPs”). TIPS are inflation-indexed fixed-income securities issued by the U.S. Department of Treasury and are subject to the same risks as other fixed income investments. In a falling inflationary environment, both interest payments and the value of the TIPS will decline.
Board of Trustees and Officers
First Trust Variable Insurance Trust
December 31, 2020 (Unaudited)
The following tables identify the Trustees and Officers of the Trust. Unless otherwise indicated, the address of all persons is 120 East Liberty Drive, Suite 400, Wheaton, IL 60187.
The Trust’s statement of additional information includes additional information about the Trustees and is available, without charge, upon request, by calling (800) 988-5891.
| Name, Year of Birth and Position with the Trust | Term of Office and Year First Elected or Appointed | Principal Occupations
During Past 5 Years | Number of Portfolios in the First Trust Fund Complex Overseen by Trustee | Other Trusteeships or Directorships Held by Trustee During Past 5 Years |
| INDEPENDENT TRUSTEES |
Richard E. Erickson, Trustee
(1951) | • Indefinite Term
• Since Trust Inception | Physician; Officer, Wheaton Orthopedics; Limited Partner, Gundersen Real Estate Limited Partnership (June 1992 to December 2016) | 190 | None |
Thomas R. Kadlec, Trustee
(1957) | • Indefinite Term
• Since Trust Inception | President, ADM Investor Services, Inc. (Futures Commission Merchant) | 190 | Director of ADM Investor Services, Inc., ADM Investor Services International, Futures Industry Association, and National Futures Association |
Robert F. Keith, Trustee
(1956) | • Indefinite Term
• Since Trust Inception | President, Hibs Enterprises (Financial and Management Consulting) | 190 | Director of Trust Company of Illinois |
Niel B. Nielson, Trustee
(1954) | • Indefinite Term
• Since Trust Inception | Senior Advisor (August 2018 to Present), Managing Director and Chief Operating Officer (January 2015 to August 2018), Pelita Harapan Educational Foundation (Educational Products and Services) | 190 | None |
| INTERESTED TRUSTEE |
James A. Bowen(1), Trustee and
Chairman of the Board
(1955) | • Indefinite Term
• Since Trust Inception | Chief Executive Officer, First Trust Advisors L.P. and First Trust Portfolios L.P.; Chairman of the Board of Directors, BondWave LLC (Software Development Company) and Stonebridge Advisors LLC (Investment Advisor) | 190 | None |
| (1) | Mr. Bowen is deemed an “interested person” of the Trust due to his position as CEO of First Trust Advisors L.P., investment advisor of the Trust. |
Board of Trustees and Officers (Continued)
First Trust Variable Insurance Trust
December 31, 2020 (Unaudited)
| Name and Year of Birth | Position and Offices with Trust | Term of Office and Length of Service | Principal Occupations
During Past 5 Years |
| OFFICERS(2) |
James M. Dykas
(1966) | President and Chief Executive Officer | • Indefinite Term
• Since January 2016 | Managing Director and Chief Financial Officer (January 2016 to Present), Controller (January 2011 to January 2016), Senior Vice President (April 2007 to January 2016), First Trust Advisors L.P. and First Trust Portfolios L.P.; Chief Financial Officer (January 2016 to Present), BondWave LLC (Software Development Company) and Stonebridge Advisors LLC (Investment Advisor) |
Donald P. Swade
(1972) | Treasurer, Chief Financial Officer and Chief Accounting Officer | • Indefinite Term
• Since January 2016 | Senior Vice President (July 2016 to Present), Vice President (April 2012 to July 2016), First Trust Advisors L.P. and First Trust Portfolios L.P. |
W. Scott Jardine
(1960) | Secretary and Chief Legal Officer | • Indefinite Term
• Since Trust Inception | General Counsel, First Trust Advisors L.P. and First Trust Portfolios L.P.; Secretary and General Counsel, BondWave LLC; Secretary, Stonebridge Advisors LLC |
Daniel J. Lindquist
(1970) | Vice President | • Indefinite Term
• Since Trust Inception | Managing Director, First Trust Advisors L.P. and First Trust Portfolios L.P. |
Kristi A. Maher
(1966) | Chief Compliance Officer and Assistant Secretary | • Indefinite Term
• Since Trust Inception | Deputy General Counsel, First Trust Advisors L.P. and First Trust Portfolios L.P. |
Roger F. Testin
(1966) | Vice President | • Indefinite Term
• Since Trust Inception | Senior Vice President, First Trust Advisors L.P. and First Trust Portfolios L.P. |
Stan Ueland
(1970) | Vice President | • Indefinite Term
• Since Trust Inception | Senior Vice President, First Trust Advisors L.P. and First Trust Portfolios L.P |
| (2) | The term “officer” means the president, vice president, secretary, treasurer, controller or any other officer who performs a policy making function. |
Privacy Policy
First Trust Variable Insurance Trust
December 31, 2020 (Unaudited)
Privacy Policy
First Trust values our relationship with you and considers your privacy an important priority in maintaining that relationship. We are committed to protecting the security and confidentiality of your personal information.
Sources of Information
We collect nonpublic personal information about you from the following sources:
| • | Information we receive from you and your broker-dealer, investment professional or financial representative through interviews, applications, agreements or other forms; |
| • | Information about your transactions with us, our affiliates or others; |
| • | Information we receive from your inquiries by mail, e-mail or telephone; and |
| • | Information we collect on our website through the use of “cookies”. For example, we may identify the pages on our website that your browser requests or visits. |
Information Collected
The type of data we collect may include your name, address, social security number, age, financial status, assets, income, tax information, retirement and estate plan information, transaction history, account balance, payment history, investment objectives, marital status, family relationships and other personal information.
Disclosure of Information
We do not disclose any nonpublic personal information about our customers or former customers to anyone, except as permitted by law. In addition to using this information to verify your identity (as required under law), the permitted uses may also include the disclosure of such information to unaffiliated companies for the following reasons:
| • | In order to provide you with products and services and to effect transactions that you request or authorize, we may disclose your personal information as described above to unaffiliated financial service providers and other companies that perform administrative or other services on our behalf, such as transfer agents, custodians and trustees, or that assist us in the distribution of investor materials such as trustees, banks, financial representatives, proxy services, solicitors and printers. |
| • | We may release information we have about you if you direct us to do so, if we are compelled by law to do so, or in other legally limited circumstances (for example to protect your account from fraud). |
In addition, in order to alert you to our other financial products and services, we may share your personal information within First Trust.
Use of Website Analytics
We currently use third party analytics tools, Google Analytics and AddThis, to gather information for purposes of improving First Trust’s website and marketing our products and services to you. These tools employ cookies, which are small pieces of text stored in a file by your web browser and sent to websites that you visit, to collect information, track website usage and viewing trends such as the number of hits, pages visited, videos and PDFs viewed and the length of user sessions in order to evaluate website performance and enhance navigation of the website. We may also collect other anonymous information, which is generally limited to technical and web navigation information such as the IP address of your device, internet browser type and operating system for purposes of analyzing the data to make First Trust’s website better and more useful to our users. The information collected does not include any personal identifiable information such as your name, address, phone number or email address unless you provide that information through the website for us to contact you in order to answer your questions or respond to your requests. To find out how to opt-out of these services click on: Google Analytics and AddThis.
Confidentiality and Security
With regard to our internal security procedures, First Trust restricts access to your nonpublic personal information to those First Trust employees who need to know that information to provide products or services to you. We maintain physical, electronic and procedural safeguards to protect your nonpublic personal information.
Policy Updates and Inquiries
As required by federal law, we will notify you of our privacy policy annually. We reserve the right to modify this policy at any time, however, if we do change it, we will tell you promptly. For questions about our policy, or for additional copies of this notice, please go to www.ftportfolios.com, or contact us at 1-800-621-1675 (First Trust Portfolios) or 1-800-222-6822 (First Trust Advisors).
March 2020
This page intentionally left blank
This page intentionally left blank
INVESTMENT ADVISOR
First Trust Advisors L.P.
120 East Liberty Drive, Suite 400
Wheaton, IL 60187
INVESTMENT SUB-ADVISORS
First Trust Multi Income Allocation Portfolio
Energy Income Partners, LLC
10 Wright Street
Westport, CT 06880
Stonebridge Advisors, LLC
10 Westport Road, Suite C101
Wilton, CT 06897
ADMINISTRATOR,
FUND ACCOUNTANT,
AND CUSTODIAN
First Trust/Dow Jones Dividend & Income Allocation Portfolio
First Trust Multi Income Allocation Portfolio
First Trust Capital Strength Portfolio
First Trust International Developed Capital Strength Portfolio
The Bank of New York Mellon
240 Greenwich Street
New York, NY 10286
First Trust Dorsey Wright Tactical Core Portfolio
Brown Brothers Harriman & Co.
50 Post Office Square
Boston, MA 02110
TRANSFER AGENT
BNY Mellon Investment Servicing (US) Inc.
301 Bellevue Parkway
Wilmington, DE 19809
INDEPENDENT REGISTERED
PUBLIC ACCOUNTING FIRM
Deloitte & Touche LLP
111 S. Wacker Drive
Chicago, IL 60606
LEGAL COUNSEL
Chapman and Cutler LLP
111 W. Monroe Street
Chicago, IL 60603
Item 2. Code of Ethics.
| (a) | The registrant, as of the end of the period covered by this report, has adopted a code of ethics that applies to the registrant’s principal executive officer, principal financial officer, principal accounting officer or controller, or persons performing similar functions, regardless of whether these individuals are employed by the registrant or a third party. |
| (c) | There have been no amendments, during the period covered by this report, to a provision of the code of ethics that applies to the registrant's principal executive officer, principal financial officer, principal accounting officer or controller, or persons performing similar functions, regardless of whether these individuals are employed by the registrant or a third party, and that relates to any element of the code of ethics description. |
| (d) | The registrant has not granted any waivers, including an implicit waiver, from a provision of the code of ethics that applies to the registrant’s principal executive officer, principal financial officer, principal accounting officer or controller, or persons performing similar functions, regardless of whether these individuals are employed by the registrant or a third party, that relates to one or more of the items set forth in paragraph (b) of this item’s instructions. |
| (f) | A copy of the code of ethics that applies to the registrant’s principal executive officer, principal financial officer, principal accounting officer or controller is filed as an exhibit pursuant to Item 13(a)(1). |
Item 3. Audit Committee Financial Expert.
As of the end of the period covered by the report, the Registrant’s board of trustees has determined that Thomas R. Kadlec and Robert F. Keith are qualified to serve as audit committee financial experts serving on its audit committee and that each is “independent,” as defined by Item 3 of Form N-CSR.
Item 4. Principal Accountant Fees and Services.
(a) Audit Fees (Registrant)— The aggregate fees billed for each of the last two fiscal years for professional services rendered by the principal accountant for the audit of the registrant’s annual financial statements or services that are normally provided by the accountant in connection with statutory and regulatory filings or engagements were $90,750 for the fiscal year ended December 31, 2019 and $122,625 for the fiscal year ended December 31, 2020.
Audit Fees (Investment Advisor)— The aggregate fees billed for each of the last two fiscal years for professional services rendered by the principal accountant for the audit of the registrant’s annual financial statements or services that are normally provided by the accountant in connection with statutory and regulatory filings or engagements were $0 for the fiscal year ended December 31, 2019 and $0 for the fiscal year ended December 31, 2020.
Audit Fees (Distributor)— The aggregate fees billed for each of the last two fiscal years for professional services rendered by the principal accountant for the audit of the registrant’s annual financial statements or services that are normally provided by the accountant in connection with statutory and regulatory filings or engagements were $0 for the fiscal year ended December 31, 2019 and $0 for the fiscal year ended December 31, 2020.
Audit Fees (Investment Sub-Advisor)— The aggregate fees billed for each of the last two fiscal years for professional services rendered by the principal accountant for the audit of the registrant’s annual financial statements or services that are normally provided by the accountant in connection with statutory and regulatory filings or engagements were $0 for the fiscal year ended December 31, 2019 and $0 for the fiscal year ended December 31, 2020.
(b) Audit-Related Fees (Registrant) — The aggregate fees billed for each of the last two fiscal years for assurance and related services by the principal accountant that are reasonably related to the performance of the audit of the registrant’s financial statements and are not reported under paragraph (a) of this Item were $0 for the fiscal year ended December 31, 2019 and $0 for the fiscal year ended December 31, 2020.
Audit-Related Fees (Investment Adviser) — The aggregate fees billed for each of the last two fiscal years for assurance and related services by the principal accountant that are reasonably related to the performance of the audit of the registrant’s financial statements and are not reported under paragraph (a) of this Item were $0 for the fiscal year ended December 31, 2019 and $0 for the fiscal year ended December 31, 2020.
Audit-Related Fees (Distributor) — The aggregate fees billed for each of the last two fiscal years for assurance and related services by the principal accountant that are reasonably related to the performance of the audit of the registrant’s financial statements and are not reported under paragraph (a) of this Item were $0 for the fiscal year ended December 31, 2019 and $0 for the fiscal year ended December 31, 2020.
Audit-Related Fees (Investment Sub-Advisor) — The aggregate fees billed for each of the last two fiscal years for assurance and related services by the principal accountant that are reasonably related to the performance of the audit of the registrant’s financial statements and are not reported under paragraph (a) of this Item were $0 for the fiscal year ended December 31, 2019 and $0 for the fiscal year ended December 31, 2020.
(c) Tax Fees (Registrant) — The aggregate fees billed for each of the last two fiscal years for professional services rendered by the principal accountant for tax compliance, tax advice, and tax planning to the registrant were $12,797 for the fiscal year ended December 31, 2019 and $20,190 for the fiscal year ended December 31, 2020. These fees were for tax consultation and/or tax return preparation and professional services rendered for PFIC (Passive Foreign Investment Company) Identification Services.
Tax Fees (Investment Adviser) — The aggregate fees billed for each of the last two fiscal years for professional services rendered by the principal accountant for tax compliance, tax advice, and tax planning were $0 for the fiscal year ended December 31, 2019 and $0 for the fiscal year ended December 31, 2020.
Tax Fees (Distributor) — The aggregate fees billed for each of the last two fiscal years for professional services rendered by the principal accountant for tax compliance, tax advice, and tax planning were $0 for the fiscal year ended December 31, 2019 and $0 for the fiscal year ended December 31, 2020.
Tax Fees (Investment Sub-Adviser) — The aggregate fees billed for each of the last two fiscal years for professional services rendered by the principal accountant for tax compliance, tax advice, and tax planning were $0 for the fiscal year ended December 31, 2019 and $0 for the fiscal year ended December 31, 2020.
(d) All Other Fees (Registrant) — The aggregate fees for each of the last two fiscal years for products and services provided by the principal accountant to the registrant, other than the services reported in paragraphs (a) through (c) of this Item were $0 for the fiscal year ended December 31, 2019 and $0 for the fiscal year ended December 31, 2020.
All Other Fees (Investment Adviser) — The aggregate fees billed for each of the last two fiscal years for products and services provided by the principal accountant, other than the services reported in paragraphs (a) through (c) of this Item were $0 for the fiscal year ended December 31, 2019 and $0 for the fiscal year ended December 31, 2020.
All Other Fees (Distributor) — The aggregate fees billed for each of the last two fiscal years for products and services provided by the principal accountant, other than the services reported in paragraphs (a) through (c) of this Item were $0 for the fiscal year ended December 31, 2019 and $0 for the fiscal year ended December 31, 2020.
All Other Fees (Investment Sub-Adviser) — The aggregate fees billed for each of the last two fiscal years for products and services provided by the principal accountant, other than the services reported in paragraphs (a) through (c) of this Item were $0 for the fiscal year ended December 31, 2019 and $0 for the fiscal year ended December 31, 2020.
| (e)(1) | Disclose the audit committee's pre-approval policies and procedures described in paragraph (c)(7) of Rule 2-01 of Regulation S-X. |
Pursuant to its charter and its Audit and Non-Audit Services Pre-Approval Policy, the Audit Committee (the “Committee”) is responsible for the pre-approval of all audit services and permitted non-audit services (including the fees and terms thereof) to be performed for the registrant by its independent auditors. The Chairman of the Committee is authorized to give such pre-approvals on behalf of the Committee up to $25,000 and report any such pre-approval to the full Committee.
The Committee is also responsible for the pre-approval of the independent auditor’s engagements for non-audit services with the registrant’s adviser (not including a sub-adviser whose role is primarily portfolio management and is sub-contracted or overseen by another investment adviser) and any entity controlling, controlled by or under common control with the investment adviser that provides ongoing services to the registrant, if the engagement relates directly to the operations and financial reporting of the registrant, subject to the de minimis exceptions for non-audit services described in Rule 2-01 of Regulation S-X. If the independent auditor has provided non-audit services to the registrant’s adviser (other than any sub-adviser whose role is primarily portfolio management and is sub-contracted with or overseen by another investment adviser) and any entity controlling, controlled by or under common control with the investment adviser that provides ongoing services to the registrant that were not pre-approved pursuant to its policies, the Committee will consider whether the provision of such non-audit services is compatible with the auditor’s independence.
| (e)(2) | The percentage of services described in each of paragraphs (b) through (d) for the registrant and the registrant’s investment adviser of this Item that were approved by the audit committee pursuant to the pre-approval exceptions included in paragraph (c)(7)(i)(c) or paragraph (c)(7)(ii) of Rule 2-01 of Regulation S-X are as follows: |
(b) 0%
(c) 0%
(d) 0%
| (f) | The percentage of hours expended on the principal accountant's engagement to audit the registrant's financial statements for the most recent fiscal year that were attributed to work performed by persons other than the principal accountant's full-time, permanent employees was less than fifty percent. |
| (g) | The aggregate non-audit fees billed by the registrant’s accountant for services rendered to the registrant, and rendered to the registrant’s investment adviser (not including any sub-adviser whose role is primarily portfolio management and is subcontracted with or overseen by another investment adviser), and any entity controlling, controlled by, or under common control with the adviser that provides ongoing services to the registrant for the fiscal year ended December 31, 2019 were $12,797 for the registrant, $75,670 for the registrant’s investment adviser, $104,730 for the registrant’s distributor and $32,500 for the registrant’s investment sub-adviser, and for the fiscal year ended December 31, 2020 were $20,190 for the registrant, $23,200 for the registrant’s investment adviser, $29,500 for the registrant’s distributor and $4,000 for the registrant’s investment sub-adviser. |
| (h) | The registrant’s audit committee of its Board of Trustees has determined that the provision of non-audit services that were rendered to the registrant’s investment adviser (not including any sub-adviser whose role is primarily portfolio management and is subcontracted with or overseen by another investment adviser), and any entity controlling, controlled by, or under common control with the investment adviser that provides ongoing services to the registrant that were not pre-approved pursuant to paragraph (c)(7)(ii) of Rule 2-01 of Regulation S-X is compatible with maintaining the principal accountant’s independence. |
Item 5. Audit Committee of Listed Registrants.
Not applicable.
Item 6. Investments.
| (a) | Schedule of Investments in securities of unaffiliated issuers as of the close of the reporting period is included as part of the report to shareholders filed under Item 1 of this form. |
Item 7. Disclosure of Proxy Voting Policies and Procedures for Closed-End Management Investment Companies.
Not applicable.
Item 8. Portfolio Managers of Closed-End Management Investment Companies.
Not applicable.
Item 9. Purchases of Equity Securities by Closed-End Management Investment Company and Affiliated Purchasers.
Not applicable.
Item 10. Submission of Matters to a Vote of Security Holders.
There have been no material changes to the procedures by which the shareholders may recommend nominees to the registrant’s board of directors, where those changes were implemented after the registrant last provided disclosure in response to the requirements of Item 407(c)(2)(iv) of Regulation S-K (17 CFR 229.407) (as required by Item 22(b)(15) of Schedule 14A (17 CFR 240.14a-101)), or this Item.
Item 11. Controls and Procedures.
| (a) | The registrant’s principal executive and principal financial officers, or persons performing similar functions, have concluded that the registrant’s disclosure controls and procedures (as defined in Rule 30a-3(c) under the Investment Company Act of 1940, as amended (the “1940 Act”) (17 CFR 270.30a-3(c))) are effective, as of a date within 90 days of the filing date of the report that includes the disclosure required by this paragraph, based on their evaluation of these controls and procedures required by Rule 30a-3(b) under the 1940 Act (17 CFR 270.30a-3(b)) and Rules 13a-15(b) or 15d-15(b) under the Securities Exchange Act of 1934, as amended (17 CFR 240.13a-15(b) or 240.15d-15(b)). |
| (b) | There were no changes in the registrant’s internal control over financial reporting (as defined in Rule 30a-3(d) under the 1940 Act (17 CFR 270.30a-3(d)) that occurred during the period covered by this report that has materially affected, or is reasonably likely to materially affect, the registrant’s internal control over financial reporting. |
Item 12. Disclosure of Securities Lending Activities for Closed-End Management Investment Companies.
Item 13. Exhibits.
SIGNATURES
Pursuant to the requirements of the Securities Exchange Act of 1934 and the Investment Company Act of 1940, the registrant has duly caused this report to be signed on its behalf by the undersigned, thereunto duly authorized.
| (registrant) | | First Trust Variable Insurance Trust |
| By (Signature and Title)* | | /s/ James M. Dykas |
| | | James M. Dykas, President and Chief Executive Officer
(principal executive officer) |
Pursuant to the requirements of the Securities Exchange Act of 1934 and the Investment Company Act of 1940, this report has been signed below by the following persons on behalf of the registrant and in the capacities and on the dates indicated.
| By (Signature and Title)* | | /s/ James M. Dykas |
| | | James M. Dykas, President and Chief Executive Officer
(principal executive officer) |
| By (Signature and Title)* | | /s/ Donald P. Swade |
| | | Donald P. Swade, Treasurer, Chief Financial Officer
and Chief Accounting Officer
(principal financial officer) |
* Print the name and title of each signing officer under his or her signature.