| OMB APPROVAL |
OMB Number: 3235-0570 Expires: January 31, 2017 Estimated average burden hours per response: 20.6 |
| Investment Company Act file number | 811-22680 |
| Ultimus Managers Trust |
| (Exact name of registrant as specified in charter) |
| 225 Pictoria Drive, Suite 450 Cincinnati, Ohio | 45246 |
| (Address of principal executive offices) | (Zip code) |
Ultimus Fund Solutions, LLC 225 Pictoria Drive, Suite 450 Cincinnati, Ohio 45246_ |
| (Name and address of agent for service) |
| Registrant's telephone number, including area code: | (513) 587-3400 |
| Date of fiscal year end: | November 30 | |
| Date of reporting period: | November 30, 2015 |
| Item 1. | Reports to Stockholders. |

GALAPAGOS PARTNERS
SELECT EQUITY FUND
(GPSIX)
Annual Report
November 30, 2015
GALAPAGOS PARTNERS SELECT EQUITY FUND | |
LETTER TO SHAREHOLDERS | December 4, 2015 |
Dear Fellow Galapagos Partners Select Equity Fund Shareholder:
I am pleased to report on our performance and investment outlook for the fiscal period ended November 30, 2015.
PERFORMANCE SUMMARY
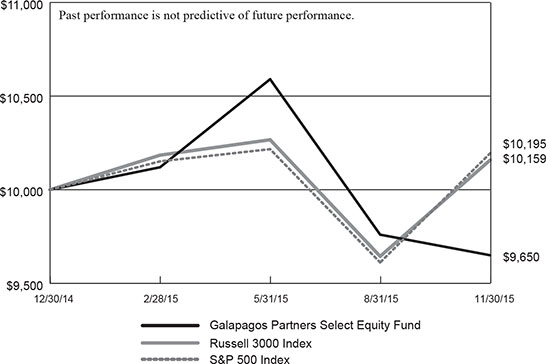
From inception on December 30, 2014 through the fiscal period ended November 30, 2015, the Galapagos Partners Select Equity Fund (the “Fund”) delivered a return of -3.50% versus a benchmark return of 1.59% for the Russell 3000 Index and 1.95% for the S&P 500 Index. The Fund’s performance was generated amongst what has been a challenging year for equity markets, with issues ranging from bear markets in China and commodities to the first equity market correction in four years.
GALAPAGOS PARTNERS’ PHILOSOPHY
The Fund seeks to outperform its benchmark by targeting investments that include a number of firms whose share prices might be influenced by high insider buying, spun-off divisions, reduced float, and activist shareholders, as well as by focusing on firms with strong valuations or growth potential, such as those companies exhibiting strong free cash flow and/or dividend growth. This is the adviser’s long-term thesis. Additionally, we will rotate into sectors or countries across the globe depending upon the adviser’s perceived opportunities.
INVESTMENT ENVIRONMENT
The current environment is mixed heading into the end of 2015. While the U.S. equity markets had strong gains following the correction and sit near all-time highs, there are still sectors that are lagging badly. Oil has contributed to the anxiety in the market as prices have continued to decline, and energy stocks have fallen accordingly.
The key economic data that led to this likelihood was a strong jobs report for October with 271,000 seasonally adjusted jobs gained versus economist’s expectations of 183,000. With the unemployment rate now at 5.0% and inflation around 1.5 to 1.8%, it is likely the Fed’s targets are largely met.
PERFORMANCE DISCUSSION
After outperforming its benchmarks through the first half of the year, the Fund’s large energy exposure that it added in the third quarter negatively affected returns with oil prices declining. The Fund positioned itself too early in these companies, and this has led to the underperformance in the latter half of the year. We perceive that the companies we invested in remain undervalued and will outperform in the long run, but we will constantly assess this perception based on the changing market environments. The majority of the Fund’s energy exposure is with pipeline companies who transport oil throughout the United States. These companies are toll takers who generate steady
1
income streams but are highly levered. We have averaged down our entry price in pipeline companies who are unlikely to face bankruptcy. These companies should benefit once oil bottoms. For now, the Fund maintains its investments in these companies in order to collect dividend yield while the adviser’s longer-term thesis evolves.
On the positive side for the latter portion of the year, the Fund’s investments in the consumer discretionary sector performed well. The adviser believes that Media companies have been assigned unfair valuations due to overstatements in the effects of cord-cutting and lower news subscriptions. The Fund invested in Gray Television and New Media Investment Group, which returned over 30% and 10%, respectively. Besides the two prior investments mentioned, Huntsman, Netease, and Amicus Therapeutics were our biggest winners late in the year.1 While we are not happy with the Fund’s performance as of late, we believe that our long-term thesis will lead to outperformance for the Fund and that Fund performance will return to the outperformance it experienced over the first half of 2015.
INVESTMENT OUTLOOK
The market is currently near all-time highs and global growth remains slow, but the overall economic picture is positive. The Fed seems to have increasing confidence in the economy for the first time in nearly 7 years. These signs point to a positive 2016, however expectations should be tempered as one of the longest bull markets in history continues.
Themes that should continue into 2016 are a rising U.S. dollar, unstable commodity prices, and increased volatility in the market. The U.S. dollar should continue to rise as the Fed tightens its monetary policy, while the European Central Bank and Bank of Japan continue quantitative easing. Oil prices could trade in a wide range given the breadth of speculation on supply versus demand by market participants. We believe increased volatility from recent years should continue and another correction is possible. We will take all of these themes into consideration and adjust the Fund’s portfolio as we deem appropriate.
While 2015 has been disappointing for the Fund, we believe in our strategy and expect to outperform the benchmark in the long run.
Sincerely,
Stephen Lack
Managing Partner/Chief Investment Officer
Galapagos Partners L.P.
1 | Please refer to the Schedule of Investments section of the Annual Report for a complete listing of the Fund’s holdings and the amount each represents of the Portfolio. Holdings are subject to change without notice. |
2
Past performance is not predictive of future performance. Investment results and principal value will fluctuate so that shares, when redeemed, may be worth more or less than their original cost. Current performance may be higher or lower than the performance data quoted. Performance data current to the most recent month end are available by calling 1-800-592-7722.
An investor should consider the investment objectives, risks, charges and expenses of the Fund carefully before investing. The Fund’s prospectus contains this and other important information. To obtain a copy of the Fund’s prospectus, please call 1-800-592-7722 and a copy will be sent to you free of charge. Please read the prospectus carefully before you invest. The Galapagos Partners Select Equity Fund is distributed by Ultimus Fund Distributors, LLC.
The Letter to Shareholders seeks to describe some of the Adviser’s current opinions and views of the financial markets. Although the Adviser believes it has a reasonable basis for any opinions or views expressed, actual results may differ, sometimes significantly so, from those expected or expressed. The securities held by the Fund that are discussed in the Letter to Shareholders were held during the period covered by this Report. They do not comprise the entire investment portfolio of the Fund, may be sold at any time and may no longer be held by the Fund. The opinions of the Adviser with respect to those securities may change at any time.
Statements in the Letter to Shareholders that reflect projections or expectations for future financial or economic performance of the Fund and the market in general and statements of the Fund’s plans and objectives for future operations are forward-looking statements. No assurance can be given that actual results or events will not differ materially from those projected, estimated, assumed, or anticipated in any such forward-looking statements. Important factors that could result in such differences, in addition to factors noted with such forward-looking statements include, without limitation, general economic conditions, such as inflation, recession, and interest rates. Past performance is not a guarantee of future results.
3
GALAPAGOS PARTNERS SELECT EQUITY FUND |
Total Returns (for period ended November 30, 2015) | |
| Since Inception(b) |
Galapagos Partners Select Equity Fund(a) | (3.50%) |
| Russell 3000 Index | 1.59% |
| S&P 500 Index | 1.95% |
(a) | The Fund’s total return does not reflect the deduction of taxes that a shareholder would pay on Fund distributions, if any, or the redemption of shares. |
(b) | The Fund commenced operations on December 30, 2014. |
4
GALAPAGOS PARTNERS SELECT EQUITY FUND
PORTFOLIO INFORMATION
November 30, 2015 (Unaudited)
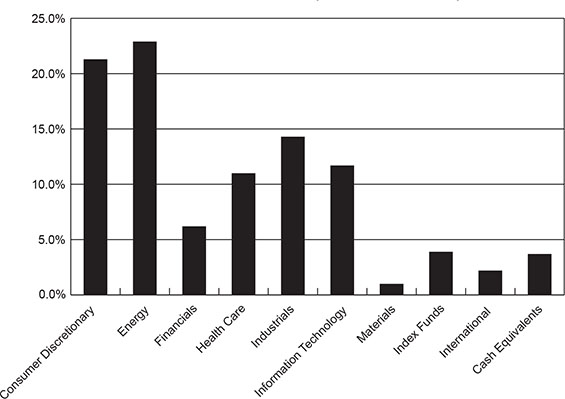
Sector Diversification (% of Net Assets)
Top 10 Equity Holdings
Security Description | % of |
New Media Investment Group, Inc. | 7.2% |
Alerian MLP ETF | 5.8% |
Enterprise Products Partners, L.P. | 5.0% |
Energy Transfer Equity, L.P. | 4.7% |
Lowe's Companies, Inc. | 4.3% |
Kinder Morgan, Inc. | 4.3% |
Cellectis S.A. - ADR | 4.1% |
PowerShares QQQ TrustSM, Series 1 | 3.9% |
Gray Television, Inc. | 3.2% |
NetEase, Inc. - ADR | 2.8% |
5
GALAPAGOS PARTNERS SELECT EQUITY FUND |
COMMON STOCKS — 80.6% | Shares | Value | ||||||
Consumer Discretionary — 21.3% | ||||||||
Automobiles — 2.0% | ||||||||
Thor Industries, Inc. | 1,461 | $ | 84,621 | |||||
Household Durables — 2.2% | ||||||||
Harman International Industries, Inc. | 875 | 90,265 | ||||||
Media — 12.8% | ||||||||
Gray Television, Inc. (a) | 7,882 | 132,023 | ||||||
New Media Investment Group, Inc. | 16,525 | 300,920 | ||||||
Walt Disney Company (The) | 880 | 99,854 | ||||||
532,797 | ||||||||
Specialty Retail — 4.3% | ||||||||
Lowe's Companies, Inc. | 2,312 | 177,099 | ||||||
Energy — 17.0% | ||||||||
Energy Equipment & Services — 0.2% | ||||||||
SAExploration Holdings, Inc. (a) | 4,006 | 9,534 | ||||||
Oil, Gas & Consumable Fuels — 16.8% | ||||||||
Energy Transfer Equity, L.P. | 10,320 | 195,461 | ||||||
Enterprise Products Partners, L.P. | 8,185 | 207,817 | ||||||
EOG Resources, Inc. | 896 | 74,753 | ||||||
Kinder Morgan, Inc. | 7,500 | 176,775 | ||||||
Plains GP Holdings, L.P. - Class A | 3,600 | 44,136 | ||||||
698,942 | ||||||||
Financials — 4.3% | ||||||||
Banks — 2.0% | ||||||||
Bank of the Ozarks, Inc. | 1,520 | 82,505 | ||||||
Insurance — 2.3% | ||||||||
MetLife, Inc. | 1,863 | 95,181 | ||||||
Health Care — 11.0% | ||||||||
Biotechnology — 6.7% | ||||||||
Amicus Therapeutics, Inc. (a) | 9,911 | 106,345 | ||||||
Cellectis S.A. - ADR (a) | 5,141 | 170,116 | ||||||
276,461 | ||||||||
Health Care Providers & Services — 1.9% | ||||||||
AMN Healthcare Services, Inc. (a) | 2,654 | 78,293 | ||||||
6
GALAPAGOS PARTNERS SELECT EQUITY FUND |
COMMON STOCKS — 80.6% (Continued) | Shares | Value | ||||||
Health Care — 11.0% (Continued) | ||||||||
Pharmaceuticals — 2.4% | ||||||||
Jazz Pharmaceuticals plc (a) | 687 | $ | 100,707 | |||||
Industrials — 14.3% | ||||||||
Aerospace & Defense — 5.0% | ||||||||
Boeing Company (The) | 717 | 104,288 | ||||||
Raytheon Company | 850 | 105,425 | ||||||
209,713 | ||||||||
Air Freight & Logistics — 2.7% | ||||||||
Park-Ohio Holdings Corporation | 2,641 | 110,922 | ||||||
Airlines — 1.9% | ||||||||
JetBlue Airways Corporation (a) | 3,213 | 79,490 | ||||||
Commercial Services & Supplies — 1.5% | ||||||||
West Corporation | 2,456 | 62,628 | ||||||
Construction & Engineering — 2.7% | ||||||||
Dycom Industries, Inc. (a) | 1,300 | 113,594 | ||||||
Marine — 0.5% | ||||||||
Pangaea Logistics Solutions Ltd. (a) | 6,700 | 20,100 | ||||||
Information Technology — 11.7% | ||||||||
Communications Equipment — 2.2% | ||||||||
Palo Alto Networks, Inc. (a) | 490 | 91,797 | ||||||
Internet Software & Services — 5.3% | ||||||||
Alphabet, Inc. - Class A (a) | 135 | 102,985 | ||||||
NetEase, Inc. - ADR | 700 | 116,662 | ||||||
219,647 | ||||||||
Semiconductor & Semiconductor Equipment — 4.2% | ||||||||
Avago Technologies Ltd. | 725 | 94,576 | ||||||
Rudolph Technologies, Inc. (a) | 5,742 | 81,709 | ||||||
176,285 | ||||||||
Materials — 1.0% | ||||||||
Metals & Mining — 1.0% | ||||||||
Hi-Crush Partners, L.P. | 5,500 | 42,625 | ||||||
Total Common Stocks (Cost $3,221,318) | $ | 3,353,206 | ||||||
7
GALAPAGOS PARTNERS SELECT EQUITY FUND |
EXCHANGE-TRADED FUNDS — 13.9% | Shares | Value | ||||||
Energy — 5.8% | ||||||||
Alerian MLP ETF | 19,715 | $ | 241,706 | |||||
Financials — 2.0% | ||||||||
SPDR® S&P® Regional Banking ETF | 1,783 | 81,394 | ||||||
Index — 3.9% | ||||||||
PowerShares QQQ TrustSM, Series 1 | 1,436 | 163,733 | ||||||
International — 2.2% | ||||||||
ProShares UltraShort MSCI Brazil Capped (a) | 1,240 | 89,937 | ||||||
Total Exchange-Traded Funds (Cost $567,996) | $ | 576,770 | ||||||
MONEY MARKET FUNDS — 3.7% | Shares | Value | ||||||
Invesco Short-Term Investments Trust - Treasury Portfolio - Institutional Shares, 0.02% (b) (Cost $153,981) | 153,981 | $ | 153,981 | |||||
Total Investments at Value — 98.2% (Cost $3,943,295) | $ | 4,083,957 | ||||||
Other Assets in Excess of Liabilities — 1.8% | 73,193 | |||||||
Net Assets — 100.0% | $ | 4,157,150 | ||||||
ADR - American Depositary Receipt |
(a) | Non-income producing security. |
(b) | The rate shown is the 7-day effective yield as of November 30, 2015. |
See accompanying notes to financial statements. |
8
GALAPAGOS PARTNERS SELECT EQUITY FUND |
ASSETS | ||||
Investments in securities: | ||||
At acquisition cost | $ | 3,943,295 | ||
At value (Note 2) | $ | 4,083,957 | ||
Dividends receivable | 1,744 | |||
Receivable for investment securities sold | 71,739 | |||
Receivable from Adviser (Note 4) | 4,382 | |||
Other assets | 5,348 | |||
Total assets | 4,167,170 | |||
LIABILITIES | ||||
Payable to administrator (Note 4) | 6,030 | |||
Other accrued expenses | 3,990 | |||
Total liabilities | 10,020 | |||
NET ASSETS | $ | 4,157,150 | ||
NET ASSETS CONSIST OF: | ||||
Paid-in capital | $ | 4,486,733 | ||
Undistributed net investment income | 12,819 | |||
Accumulated net realized losses from security transactions | (483,064 | ) | ||
Net unrealized appreciation on investments | 140,662 | |||
NET ASSETS | $ | 4,157,150 | ||
Shares of beneficial interest outstanding (unlimited number of shares authorized, no par value) | 430,650 | |||
Net asset value, offering price and redemption price per share (Note 2) | $ | 9.65 | ||
See accompanying notes to financial statements. |
9
GALAPAGOS PARTNERS SELECT EQUITY FUND |
INVESTMENT INCOME | ||||
Dividend income (Net of foreign tax of $132) | $ | 41,760 | ||
EXPENSES | ||||
Investment advisory fees (Note 4) | 27,696 | |||
Fund accounting fees (Note 4) | 22,214 | |||
Administration fees (Note 4) | 22,000 | |||
Professional fees | 16,075 | |||
Compliance fees and expenses (Note 4) | 12,176 | |||
Transfer agent fees (Note 4) | 11,000 | |||
Trustees' fees and expenses (Note 4) | 9,889 | |||
Custody and bank service fees | 8,693 | |||
Registration and filing fees | 5,933 | |||
Postage and supplies | 3,968 | |||
Printing of shareholder reports | 3,728 | |||
Insurance expense | 2,999 | |||
Other expenses | 4,841 | |||
Total expenses | 151,212 | |||
Less fee reductions and expense reimbursements by the Adviser (Note 4) | (111,977 | ) | ||
Less fee waivers by the administrator (Note 4) | (6,000 | ) | ||
Net expenses | 33,235 | |||
NET INVESTMENT INCOME | 8,525 | |||
REALIZED AND UNREALIZED GAINS (LOSSES) ON INVESTMENTS | ||||
Net realized losses from security transactions | (484,299 | ) | ||
Net change in unrealized appreciation/depreciation on investments | 140,662 | |||
NET REALIZED AND UNREALIZED LOSSES ON INVESTMENTS | (343,637 | ) | ||
NET DECREASE IN NET ASSETS RESULTING FROM OPERATIONS | $ | (335,112 | ) | |
(a) | Represents the period from the commencement of operations (December 30, 2014) through Novermber 30, 2015. |
See accompanying notes to financial statements. |
10
GALAPAGOS PARTNERS SELECT EQUITY FUND |
| Period Ended November 30, 2015 (a) | |||
FROM OPERATIONS | ||||
Net investment income | $ | 8,525 | ||
Net realized losses from security transactions | (484,299 | ) | ||
Net change in unrealized appreciation/depreciation on investments | 140,662 | |||
Net decrease in net assets resulting from operations | (335,112 | ) | ||
CAPITAL SHARE TRANSACTIONS | ||||
Proceeds from shares sold | 5,036,117 | |||
Payments for shares redeemed | (543,855 | ) | ||
Net increase in net assets resulting from capital share transactions | 4,492,262 | |||
TOTAL INCREASE IN NET ASSETS | 4,157,150 | |||
NET ASSETS | ||||
Beginning of period | — | |||
End of period | $ | 4,157,150 | ||
UNDISTRIBUTED NET INVESTMENT INCOME | $ | 12,819 | ||
CAPITAL SHARE ACTIVITY | ||||
Shares sold | 488,198 | |||
Shares redeemed | (57,548 | ) | ||
Net increase in shares outstanding | 430,650 | |||
Shares outstanding at beginning of period | — | |||
Shares outstanding at end of period | 430,650 | |||
(a) | Represents the period from the commencement of operations (December 30, 2014) through November 30, 2015. |
See accompanying notes to financial statements. |
11
GALAPAGOS PARTNERS SELECT EQUITY FUND |
Per Share Data for a Share Outstanding Throughout the Period | ||||
| Period Ended | |||
Net asset value at beginning of period | $ | 10.00 | ||
Income (loss) from investment operations: | ||||
Net investment income | 0.02 | |||
Net realized and unrealized losses on investments | (0.37 | ) | ||
Total from investment operations | (0.35 | ) | ||
Net asset value at end of period | $ | 9.65 | ||
Total return (b) | (3.50% | )(c) | ||
Net assets at end of period (000's) | $ | 4,157 | ||
Ratios/supplementary data: | ||||
Ratio of total expenses to average net assets (e) | 6.82 | %(d) | ||
Ratio of net expenses to average net assets (e) (f) | 1.50 | %(d) | ||
Ratio of net investment income to average net assets (e) (f) (g) | 0.38 | %(d) | ||
Portfolio turnover rate | 1,244 | %(c) | ||
(a) | Represents the period from the commencement of operations (December 30, 2014) through November 30, 2015. |
(b) | Total return is a measure of the change in value of an investment in the Fund over the period covered. The return shown does not reflect the deduction of taxes a shareholder would pay on Fund distributions, if any, or the redemption of Fund shares. The total return would be lower if the Adviser had not reduced advisory fees and/or reimbursed expenses. |
(c) | Not annualized. |
(d) | Annualized. |
(e) | Ratios do not reflect the Fund’s proportionate share of expenses of the underlying investment companies in which the Fund invests. |
(f) | Ratio was determined after advisory fee reductions and/or expense reimbursements (Note 4). |
(g) | Recognition of net investment income by the Fund is affected by the timing of the declaration of dividends by the underlying investment companies in which the Fund invests. |
See accompanying notes to financial statements. |
12
GALAPAGOS PARTNERS SELECT EQUITY FUND
NOTES TO FINANCIAL STATEMENTS
November 30, 2015
1. Organization
Galapagos Partners Select Equity Fund (the “Fund”) is a diversified series of Ultimus Managers Trust (the “Trust”), an open-end investment company established as an Ohio business trust under a Declaration of Trust dated February 28, 2012. Other series of the Trust are not incorporated in this report. The Fund commenced operations on December 30, 2014.
The investment objective of the Fund is capital appreciation.
2. Significant Accounting Policies
The following is a summary of the Fund’s significant accounting policies used in the preparation of its financial statements. These policies are in conformity with accounting principles generally accepted in the United States of America (“GAAP”). As an investment company, as defined in Financial Accounting Standards Board (“FASB”) Accounting Standards Update 2013-08, the Fund follows accounting and reporting guidance under FASB Accounting Standards Codification Topic 946, “Financial Services – Investment Companies.”
Securities valuation – The Fund values its portfolio securities at market value as of the close of regular trading on the New York Stock Exchange (the “NYSE”) (normally 4:00 p.m. Eastern time) on each business day the NYSE is open for business. The Fund values its listed securities on the basis of the security’s last sale price on the primary exchange, if available, otherwise at the exchange’s most recently quoted bid price. NASDAQ-listed securities are valued at the NASDAQ Official Closing Price. In the event that market quotations are not readily available or are considered unreliable due to market or other events, the Fund values its securities and other assets at fair value in accordance with procedures established by and under the general supervision of the Board of Trustees (the “Board”). Under these procedures, the securities will be classified as Level 2 or 3 within the fair value hierarchy (see below), depending on the inputs used. Unavailable or unreliable market quotes may be due to the following factors: a substantial bid-ask spread; infrequent sales resulting in stale prices; insufficient trading volume; small trade sizes; a temporary lapse in any reliable pricing source; and actions of the securities or futures markets, such as the suspension or limitation of trading. As a result, the prices of securities used to calculate the Fund’s net asset value may differ from quoted or published prices for the same securities.
GAAP establishes a single authoritative definition of fair value, sets out a framework for measuring fair value, and requires additional disclosures about fair value measurements.
Various inputs are used in determining the value of the Fund’s investments. These inputs are summarized in the three broad levels listed below:
● | Level 1 – quoted prices in active markets for identical securities |
13
GALAPAGOS PARTNERS SELECT EQUITY FUND |
● | Level 2 – other significant observable inputs |
● | Level 3 – significant unobservable inputs |
The inputs or methods used for valuing securities are not necessarily an indication of the risks associated with investing in those securities. The inputs used to measure fair value may fall into different levels of the fair value hierarchy. In such cases, for disclosure purposes, the level in the fair value hierarchy within which the fair value measurement falls in its entirety is determined based on the lowest level input that is significant to the fair value measurement.
The following is a summary of the inputs used to value the Fund’s investments as of November 30, 2015:
| Level 1 | Level 2 | Level 3 | Total | ||||||||||||
Investments in Securities: | ||||||||||||||||
Common Stocks | $ | 3,353,206 | $ | — | $ | — | $ | 3,353,206 | ||||||||
Exchange-Traded Funds | 576,770 | — | — | 576,770 | ||||||||||||
Money Market Funds | 153,981 | — | — | 153,981 | ||||||||||||
Total | $ | 4,083,957 | $ | — | $ | — | $ | 4,083,957 | ||||||||
Refer to the Fund’s Schedule of Investments for a listing of the common stocks by industry type. As of November 30, 2015, the Fund did not have any transfers into and out of any Level. In addition, the Fund did not have derivative instruments or any assets or liabilities that were measured at fair value on a recurring basis using significant unobservable inputs (Level 3) as of November 30, 2015. It is the Fund’s policy to recognize transfers into and out of any Level at the end of the reporting period.
Share valuation – The net asset value per share of the Fund is calculated daily by dividing the total value of the Fund’s assets, less liabilities, by the number of shares outstanding. The offering price and redemption price per share of the Fund is equal to the net asset value per share.
Investment income – Dividend income is recorded on the ex-dividend date. Interest income is accrued as earned.
Security transactions – Security transactions are accounted for on the trade date. Gains and losses on securities sold are determined on a specific identification basis.
Common expenses – Common expenses of the Trust are allocated among the Fund and the other series of the Trust based on the relative net assets of each series or the nature of the services performed and the relative applicability to each series.
Distributions to shareholders – The Fund will distribute to shareholders any net investment income and net realized capital gains at least once each year. The amount of such dividends and distributions are determined in accordance with federal income tax
14
GALAPAGOS PARTNERS SELECT EQUITY FUND |
regulations, which may differ from GAAP. Dividends and distributions to shareholders are recorded on the ex-dividend date. There were no distributions paid to shareholders during the period ended November 30, 2015.
Estimates – The preparation of financial statements in conformity with GAAP requires management to make estimates and assumptions that affect the reported amounts of assets and liabilities and disclosure of contingent assets and liabilities as of the date of the financial statements and the reported amounts of income and expenses during the reporting period. Actual results could differ from those estimates.
Federal income tax – The Fund intends to qualify as a regulated investment company under the Internal Revenue Code of 1986 (the “Code”). Qualification generally will relieve the Fund of liability for federal income taxes to the extent 100% of its net investment income and net realized capital gains are distributed in accordance with the Code. Accordingly, no provision for income tax has been made.
In order to avoid imposition of the excise tax applicable to regulated investment companies, it is also the Fund’s intention to declare as dividends in each calendar year at least 98% of its net investment income (earned during the calendar year) and 98.2% of its net realized capital gains (earned during the twelve months ended October 31) plus undistributed amounts from prior years.
The following information is computed on a tax basis for each item as of November 30, 2015:
Tax cost of portfolio investments | $ | 3,975,090 | ||
Gross unrealized appreciation | $ | 255,459 | ||
Gross unrealized depreciation | (146,592 | ) | ||
Net unrealized appreciation on investments | 108,867 | |||
Capital loss carryforward | (438,450 | ) | ||
Accumulated deficit | $ | (329,583 | ) |
The difference between the federal income tax cost of portfolio investments and the financial statement cost of portfolio investments is due to certain timing differences in the recognition of capital gains or losses under income tax regulations and GAAP. These “book/tax” differences are temporary in nature and are primarily due to the tax deferral of losses on wash sales and the tax treatment of income and capital gains on publicly-traded partnerships held by the Fund.
As of November 30, 2015, the Fund has a short-term capital loss carryforward of $438,450 for federal income tax purposes. This capital loss carryforward, which does not expire, may be utilized in future years to offset net realized capital gains, if any, prior to distributing such gains to shareholders.
15
GALAPAGOS PARTNERS SELECT EQUITY FUND |
For the period ended November 30, 2015, the following reclassification was made on the Statement of Assets and Liabilities as a result of permanent differences in the recognition of income under income tax regulations and GAAP:
Paid-in capital | $ | (5,529 | ) | |
Undistributed net investment income | $ | 4,294 | ||
Accumulated net realized losses from security transactions | $ | 1,235 |
These differences are primarily due to the tax treatment of income on publicly-traded partnerships held by the Fund. This reclassification, the result of permanent differences between financial statement and income tax reporting requirements, has no effect on the Fund’s net assets or net asset value per share.
The Fund recognizes the tax benefits or expenses of uncertain tax positions only when the position is “more likely than not” to be sustained assuming examination by tax authorities. Management has reviewed the Fund’s tax positions for the current tax period and has concluded that no provision for unrecognized tax benefits or expenses is required in these financial statements. The Fund identifies its major tax jurisdiction as U.S. Federal.
3. Investment Transactions
During the period ended November 30, 2015, cost of purchases and proceeds from sales of investment securities, other than short-term investments, were $30,450,632 and $26,177,019, respectively.
4. Transactions with Related Parties
INVESTMENT ADVISORY AGREEMENT
The Fund’s investments are managed by Galapagos Partners, L.P. (the “Adviser”) pursuant to the terms of an Investment Advisory Agreement. Under the Investment Advisory Agreement, the Fund pays the Adviser an advisory fee, computed and accrued daily and paid monthly, at the annual rate of 1.25% of its average daily net assets.
Pursuant to an Expense Limitation Agreement (“ELA”) between the Fund and the Adviser, the Adviser has agreed, until March 31, 2017, to reduce investment advisory fees and reimburse other operating expenses to limit total annual operating expenses of the Fund (exclusive of brokerage costs, taxes, interest, acquired fund fees and expenses, extraordinary expenses such as litigation and merger or reorganization costs, and other expenses not incurred in the ordinary course of the Fund’s business) to an amount not exceeding 1.50% of the Fund’s average daily net assets. Accordingly, during the period ended November 30, 2015, the Adviser did not collect any of its advisory fees and, in addition, reimbursed other operating expenses totaling $84,281.
16
GALAPAGOS PARTNERS SELECT EQUITY FUND |
Under the terms of the ELA, investment advisory fee reductions and expense reimbursements by the Adviser are subject to recoupment by the Adviser for a period of three years after such fees and expenses were incurred, provided the recoupments do not cause total annual operating expenses of the Fund to exceed 1.50% of the average daily net assets. As of November 30, 2015, the Adviser may seek recoupment of investment advisory fee reductions and expense reimbursements totaling $111,977 no later than November 30, 2018.
The principal executive officer of the Fund is also an officer of the Adviser.
OTHER SERVICE PROVIDERS
Ultimus Fund Solutions, LLC (“Ultimus”) provides fund administration, fund accounting, compliance and transfer agency services to the Fund. The Fund pays Ultimus fees in accordance with the agreements for such services. In addition, the Fund pays out-of-pocket expenses including but not limited to postage, supplies and costs of pricing the Fund’s portfolio securities. During the period ended November 30, 2015, Ultimus voluntarily waived fees in the amount of $6,000.
Under the terms of a Distribution Agreement with the Trust, Ultimus Fund Distributors, LLC (the “Distributor”) serves as principal underwriter to the Fund. The Distributor is a wholly-owned subsidiary of Ultimus. The Distributor is compensated by the Adviser (not the Fund) for acting as principal underwriter.
Certain officers and a Trustee of the Trust are also officers of Ultimus and the Distributor.
TRUSTEE COMPENSATION
Each Trustee who is not an “interested person” of the Trust (“Independent Trustee”) receives from the Fund a fee of $500 for each Board meeting attended plus reimbursement of travel and other meeting-related expenses. Each Independent Trustee also receives a $500 annual retainer from the Fund. Trustees affiliated with the Adviser or Ultimus are not compensated by the Fund for their services.
17
GALAPAGOS PARTNERS SELECT EQUITY FUND |
PRINCIPAL HOLDERS OF FUND SHARES
As of November 30, 2015, the following shareholders owned of record 5% or more of the outstanding shares of the Fund:
Name of Record Owner | % Ownership |
Charles Schwab & Co., Inc | 70% |
Lack Holdings, Inc. | 11% |
Clifford B. Sondock | 5% |
A beneficial owner of 25% or more of the Fund’s outstanding shares may be considered a controlling person. That shareholder’s vote could have a more significant effect on matters presented at a shareholder’s meeting.
5. Contingencies and Commitments
The Fund indemnifies the Trust’s officers and Trustees for certain liabilities that might arise from their performance of their duties to the Fund. Additionally, in the normal course of business the Fund enters into contracts that contain a variety of representations and warranties and which provide general indemnifications. The Fund’s maximum exposure under these arrangements is unknown, as this would involve future claims that may be made against the Fund that have not yet occurred. However, based on experience, the Fund expects the risk of loss to be remote.
6. Subsequent Events
The Fund is required to recognize in the financial statements the effects of all subsequent events that provide additional evidence about conditions that existed as of the date of the Statement of Assets and Liabilities. For non-recognized subsequent events that must be disclosed to keep the financial statements from being misleading, the Fund is required to disclose the nature of the event as well as an estimate of its financial effect, or a statement that such an estimate cannot be made. Management has evaluated subsequent events through the issuance of these financial statements and has noted no such events.
18
GALAPAGOS PARTNERS SELECT EQUITY FUND |
To the Board of Trustees of Ultimus Managers Trust
and the Shareholders of Galapagos Partners Select Equity Fund
We have audited the accompanying statement of assets and liabilities of Galapagos Partners Select Equity Fund, a series of shares of beneficial interest in Ultimus Managers Trust (the “Fund”), including the schedule of investments, as of November 30, 2015, and the related statements of operations and changes in net assets and the financial highlights for the period December 30, 2014 (commencement of operations) through November 30, 2015. These financial statements and financial highlights are the responsibility of the Fund’s management. Our responsibility is to express an opinion on these financial statements and financial highlights based on our audit.
We conducted our audit in accordance with the standards of the Public Company Accounting Oversight Board (United States). Those standards require that we plan and perform the audit to obtain reasonable assurance about whether the financial statements and financial highlights are free of material misstatement. An audit includes examining, on a test basis, evidence supporting the amounts and disclosures in the financial statements. Our procedures included confirmation of securities owned as of November 30, 2015 by correspondence with the custodian. An audit also includes assessing the accounting principles used and significant estimates made by management, as well as evaluating the overall financial statement presentation. We believe that our audit provides a reasonable basis for our opinion.
In our opinion, the financial statements and financial highlights referred to above present fairly, in all material respects, the financial position of Galapagos Partners Select Equity Fund as of November 30, 2015, and the results of its operations, the changes in its net assets, and its financial highlights for the period December 30, 2014 through November 30, 2015, in conformity with accounting principles generally accepted in the United States of America.
 | |
| BBD,LLP | |
Philadelphia, Pennsylvania January 26, 2016 |
19
GALAPAGOS PARTNERS SELECT EQUITY FUND |
We believe it is important for you to understand the impact of costs on your investment. As a shareholder of the Fund, you incur ongoing costs, including management fees and other operating expenses. The following examples are intended to help you understand your ongoing costs (in dollars) of investing in the Fund and to compare these costs with the ongoing costs of investing in other mutual funds.
A mutual fund’s ongoing costs are expressed as a percentage of its average net assets. This figure is known as the expense ratio. The expenses in the table below are based on an investment of $1,000 made at the beginning of the most recent period (June 1, 2015) and held until the end of the period (November 30, 2015).
The table below illustrates the Fund’s ongoing costs in two ways:
Actual fund return – This section helps you to estimate the actual expenses that you paid over the period. The “Ending Account Value” shown is derived from the Fund’s actual return, and the fourth column shows the dollar amount of operating expenses that would have been paid by an investor who started with $1,000 in the Fund. You may use the information here, together with the amount you invested, to estimate the expenses that you paid over the period.
To do so, simply divide your account value by $1,000 (for example, an $8,600 account value divided by $1,000 = 8.6), then multiply the result by the number given for the Fund under the heading “Expenses Paid During Period.”
Hypothetical 5% return – This section is intended to help you compare the Fund’s ongoing costs with those of other mutual funds. It assumes that the Fund had an annual return of 5% before expenses during the period shown, but that the expense ratio is unchanged. In this case, because the return used is not the Fund’s actual return, the results do not apply to your investment. The example is useful in making comparisons because the U.S. Securities and Exchange Comission (“SEC”) requires all mutual funds to calculate expenses based on a 5% return. You can assess the Fund’s ongoing costs by comparing this hypothetical example with the hypothetical examples that appear in shareholder reports of other funds.
Note that expenses shown in the table are meant to highlight and help you compare ongoing costs only. The Fund does not charge transaction fees, such as purchase or redemption fees, nor does it carry a “sales load.”
The calculations assume no shares were bought or sold during the period. Your actual costs may have been higher or lower, depending on the amount of your investment and the timing of any purchases or redemptions.
20
GALAPAGOS PARTNERS SELECT EQUITY FUND |
More information about the Fund’s expenses can be found in this report. For additional information on operating expenses and other shareholder costs, please refer to the Fund’s prospectus.
Beginning Account Value June 1, | Ending Account Value November 30, 2015 | Net Expense Ratio (a) | Expenses Paid During Period (b) | |
Based on Actual Fund Return | $1,000.00 | $911.20 | 1.50% | $7.19 |
Based on Hypothetical 5% Return (before expenses) | $1,000.00 | $1,017.55 | 1.50% | $7.59 |
(a) | Annualized, based on the Fund’s most recent one-half year expenses. |
(b) | Expenses are equal to the Fund’s annualized expense ratio multiplied by the average account value over the period, multiplied by 183/365 (to reflect the one-half year period). |
OTHER INFORMATION (Unaudited)
A description of the policies and procedures that the Fund uses to vote proxies relating to portfolio securities is available without charge upon request by calling toll-free 1-800-592-7722, or on the SEC’s website at http://www.sec.gov. Information regarding how the Fund voted proxies relating to portfolio securities during the most recent 12-month period ended June 30 is available without charge upon request by calling toll-free 1-800-592-7722, or on the SEC’s website at http://www.sec.gov.
The Trust files a complete listing of portfolio holdings for the Fund with the SEC as of the end of the first and third quarters of each fiscal year on Form N-Q. These filings are available upon request by calling 1-800-592-7722. Furthermore, you may obtain a copy of the filings on the SEC’s website at http://www.sec.gov. The Trust’s Forms N-Q may also be reviewed and copied at the SEC’s Public Reference Room in Washington, DC, and information on the operation of the Public Reference Room may be obtained by calling 1-800-SEC-0330.
21
GALAPAGOS PARTNERS SELECT EQUITY FUND
BOARD OF TRUSTEES AND EXECUTIVE OFFICERS
(Unaudited)
The Board has overall responsibility for management of the Trust’s affairs. The Trustees serve during the lifetime of the Trust and until its termination, or until death, resignation, retirement, or removal. The Trustees, in turn, elect the officers of the Fund to actively supervise its day-to-day operations. The officers have been elected for an annual term. Unless otherwise noted, each Trustee’s and officer’s address is 225 Pictoria Drive, Suite 450, Cincinnati, Ohio 45246. The following are the Trustees and executive officers of the Fund as of January 26, 2016:
Name and | Length of Time Served | Position(s) Held with Trust | Principal Occupation(s) | Number of Funds in Trust Overseen by Trustee | Directorships of Public Companies Held by Trustee During Past 5 Years |
Interested Trustees: | |||||
Robert G. Dorsey* Year of Birth: 1957 | Since | Trustee (February 2012 to present)
President (June 2012 to October 2013) | Managing Director of Ultimus Fund Solutions, LLC and Ultimus Fund Distributors, LLC (1999 to present) | 21 | n/a |
Independent Trustees: | |||||
Janine L. Cohen Year of Birth: 1952 | Since January 2016 | Trustee | Retired since 2013;Chief Financial Officer from 2004 to 2013 and Chief Compliance Officer from 2008 to 2013 at AER Advisors, Inc. | 21 | n/a |
John C. Davis Year of Birth: 1952 | Since | Chairman (July 2014
Trustee (June 2012 to present) | Consultant since May 2011; Retired partner of PricewaterhouseCoopers LLP (1974 to 2010) | 21 | n/a |
David M. Deptula Year of Birth: 1958 | Since | Trustee | Vice President of Legal and Special Projects at Dayton Freight Lines, Inc. since 2016; Vice President of Tax Treasury at Standard Register, Inc. (formerly The Standard Register Company) from 2011 to 2016 | 21 | n/a |
22
GALAPAGOS PARTNERS SELECT EQUITY FUND
BOARD OF TRUSTEES AND EXECUTIVE OFFICERS
(Unaudited) (Continued)
Name and | Length of Time Served | Position(s) Held with Trust | Principal Occupation(s) | Number of Funds in Trust Overseen by Trustee | Directorships of Public Companies Held by Trustee During Past 5 Years |
Independent Trustees: (Continued) | |||||
John J. Discepoli Year of Birth: 1963 | Since | Trustee | Owner of Discepoli Financial Planning, LLC (personal financial planning company) since 2004 | 21 | n/a |
* | Mr. Dorsey is considered an “interested person” of the Trust within the meaning of Section 2(a)(19) of the Investment Company Act of 1940, as amended, because of his relationship with the Trust’s administrator, transfer agent and distributor. Mr. Dorsey was President of the Trust from June 2012 to October 2013. |
Name and | Length of Time Served | Position(s) Held with Trust | Principal Occupation(s) During Past 5 Years |
Executive Officers: | |||
Stephen P. Lack | Since October 2014 | Principal | Founder, President and Chief Investment Officer of Galapagos Partners, L.P. (2007 to present) |
David R. Carson Year of Birth: 1958 | Since | President (October 2013 to present)
Vice President (April 2013 to October 2013) | Vice President and Director of Client Strategies of Ultimus Fund Solutions, LLC (2013 to present); Chief Compliance Officer, FSI LBAR Fund (2013 to present); Chief Compliance Officer, The Huntington Funds (2005 to 2013), The Flex-Funds (2006 to 2011), Meeder Financial (2007 to 2011), Huntington Strategy Shares (2012 to 2013), and Huntington Asset Advisors (2013); Vice President, Huntington National Bank (2001 to 2013) |
Jennifer L. Leamer Year of Birth: 1976 | Since | Treasurer
Assistant Treasurer (April 2014 to October 2014) | Vice President, Mutual Fund Controller of Ultimus Fund Solutions, LLC (2014 to present); Business Analyst of Ultimus Fund Solutions, LLC (2007 to 2014) |
23
GALAPAGOS PARTNERS SELECT EQUITY FUND
BOARD OF TRUSTEES AND EXECUTIVE OFFICERS
(Unaudited) (Continued)
Name and | Length of Time Served | Position(s) Held with Trust | Principal Occupation(s) During Past 5 Years |
Executive Officers: (Continued) | |||
Bo J. Howell Year of Birth: 1981 | Since | Secretary
Assistant Secretary (October 2014 to April 2015) | Vice President, Director of Fund Administration for Ultimus Fund Solutions, LLC (2014 to present); Counsel – Securities and Mutual Funds for Western & Southern Financial Group (2012 to 2014); U.S. Securities and Exchange Commission, Senior Counsel (2009 to 2012) |
Charles C. Black Year of Birth: 1979 | Since | Chief Compliance Officer
Assistant Chief | Senior Compliance Officer of Ultimus Fund Solutions, LLC (2015 to present); Senior Compliance Manager for Touchstone Mutual Funds (2013 to 2015); Senior Compliance Manager for Fund Evaluation Group (2011 to 2013); Regulatory Administration Specialist for JPMorgan Chase Bank (2006 to 2011) |
Additional information about members of the Board and executive officers is available in the Fund’s Statement of Additional Information (“SAI”). To obtain a free copy of the SAI, please call 1-800-592-7722.
24
This Page Intentionally Left Blank
LYRICAL U.S. VALUE EQUITY FUND
Institutional Class (LYRIX)
Investor Class (LYRBX)
LYRICAL U.S. HEDGED VALUE FUND
Institutional Class (LYRHX)
Investor Class (LYRDX)
Annual Report
November 30, 2015
LYRICAL FUNDS | December 9, 2015 |
Dear Fellow Shareholders,
Enclosed is the annual report to shareholders of the Lyrical U.S. Value Equity Fund (the “Value Fund”) and Lyrical U.S. Hedged Value Fund (the “Hedged Value Fund”) (collectively, the “Funds”). On behalf of the Funds and their investment adviser, Lyrical Asset Management LP, I would like to thank you for your investment.
Lyrical U.S. Value Equity Fund
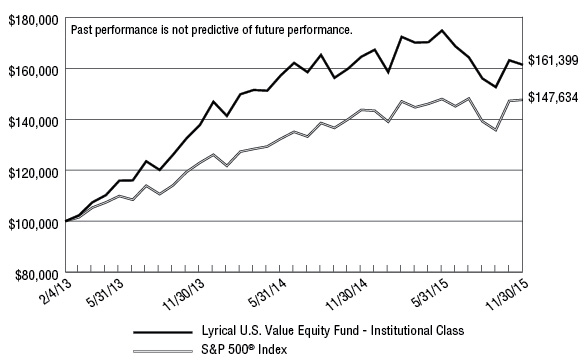
Since its launch on February 4, 2013 through November 30, 2015, the Value Fund – Institutional Class has produced a cumulative total return of +61.40%, compared to the +47.63% cumulative total return for the S&P 500 Index (the “S&P 500”). For the twelve months ended November 30, 2015, the Value Fund – Institutional Class produced a total return of -1.91% compared to the total return for the S&P 500 of 2.75%. The biggest winners for the fiscal year were Avago Technologies Ltd. (+41%), NASDAQ OMX Group, Inc. (+32%), and Assurant, Inc. (+29%). The biggest losers were National Oilwell Varco, Inc. (-42%), Avis Budget Group, Inc. (-38%) and Western Digital Corporation (-38%). While we have sold our NASDAQ OMX Group, Inc. holdings we maintain our positions in these other largest winners and detractors.
In analyzing the Fund’s portfolio’s performance attribution, we find it helpful to examine both the investment success rate and any skew in the distribution of returns. Our success rate has been high over the life of the Value Fund, as 80% of the Fund’s investments posted gains, and 64% outperformed the S&P 500. Skew has also been a positive factor, as the Fund’s outperformers have outperformed by 47%, while our underperformers have underperformed by 34%. For the fiscal year ended November 30, 2015, our underperformance is explained by a lower success rate, as only 49% of the Fund’s investments posted gains, and only 46% outperformed the S&P 500. Skew has been a negative factor as the Fund’s outperformers have outperformed by 15%, while our underperformers have underperformed by 19%.
During the life of the Value Fund we have sold twelve positions, as three companies announced they were being acquired, eight approached our estimates of fair value, and for one we lost conviction in our thesis. For each sale we added a new position from our pipeline of opportunities. We are still finding attractive stock opportunities to add to the portfolio, even as some of our existing positions begin to approach our estimates of fair value.
As of November 30, 2015, the valuation of our portfolio is 13.1x next twelve months consensus earnings. The S&P 500 has a valuation of 16.1x on this same basis, a premium of 22%.
1
Lyrical U.S. Hedged Value Fund
In July 2014, we launched the Hedged Value Fund as a liquid alternatives product that employs the same long portfolio as the Value Fund. Sector ETF hedges are used on the short side to create a portfolio that aims to maintain net long exposures of 50%. This provides a hedged option for those wishing exposure to the long portfolio but unwilling to accept unhedged equity market exposure.
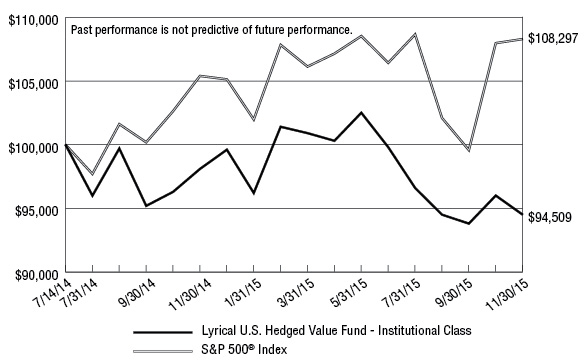
Since its launch on July 14, 2014 through November 30, 2015, the Hedged Value Fund – Institutional Class has produced a cumulative total return of -5.49%, compared to the +8.30% cumulative total return for the S&P 500. For the twelve months ended November 30, 2015, the Hedged Value Fund – Institutional Class produced a total return of -3.66% compared to the total return for the S&P 500 of 2.75%. In rising equity markets one should expect Hedged Value Fund’s performance to lag that of the Value Fund, as it did for both the above periods, as our hedges detract from total return.
Lyrical Asset Management’s Investment Philosophy and Portfolio Construction
As there have been a significant number of new investors since our previous year-end letter to the Funds’ shareholders, we’d like to briefly outline our investment philosophy and portfolio construction approach.
We believe our strategy and approach to investing differentiates us from other investment managers, even those that share a value approach to investing. We are deep value investors and by this we mean that we look to invest in companies that trade significantly below intrinsic value. This separates us from other value managers who focus on relative value or core value approaches and whose portfolio characteristics have higher Price/Earnings, Price/Book and Price/Cash Flow multiples. We assess valuation based on current price relative to long-term normalized earnings, which contrasts us to those that rely on Price/Book or dividend yield. We only invest in what we consider to be quality businesses that we believe should earn good returns on invested capital, and avoid volatile businesses and companies with excessive leverage. Other value investors may consider owning any business regardless of quality if they believe the price is low enough. Lastly, we only invest in businesses we can understand, and avoid those that are excessively complex or require specialized technical knowledge, even though they may appear cheap from a high-level perspective.
We construct our portfolio purely bottom up and without regard to what is or is not contained in a benchmark. We are concerned with concentration risk, and have strict limits on how much capital can be invested in any one position or any one industry. Our long portfolio is constructed to be balanced and diversified across approximately 33 positions, giving us exposure to many different types of companies and situations without sacrificing our strict investment standards.
Thank you for your continued trust and interest in Lyrical Asset Management.
Sincerely,
Andrew Wellington
Portfolio Manager
2
Past performance is not predictive of future performance. Investment results and principal value will fluctuate so that shares, when redeemed, may be worth more or less than their original cost. Current performance may be higher or lower than the performance data quoted. Performance data current to the most recent month end are available by calling 1-888-884-8099.
An investor should consider the investment objectives, risks, charges and expenses of the Funds carefully before investing. The Funds’ prospectus contains this and other important information. To obtain a copy of the Funds’ prospectus please call 1-888-884-8099 and a copy will be sent to you free of charge. Please read the prospectus carefully before you invest. The Funds are distributed by Ultimus Fund Distributors, LLC.
The Letter to Shareholders seeks to describe some of the Adviser’s current opinions and views of the financial markets. Although the Adviser believes it has a reasonable basis for any opinions or views expressed, actual results may differ, sometimes significantly so, from those expected or expressed.
The securities discussed in this letter to shareholders do not comprise the entire investment portfolio of a Fund, may be sold at any time, and may no longer be held by the Fund. For a complete list of securities held by each Fund as of November 30, 2015, please see the Schedule of Investments section of the Annual Report.
Statements in the Letter to Shareholders that reflect projections or expectations for future financial or economic performance of the Funds and the market in general and statements of the Funds’ plans and objectives for future operations are forward-looking statements. No assurance can be given that actual results or events will not differ materially from those projected, estimated, assumed, or anticipated in any such forward-looking statements. Important factors that could result in such differences, in addition to factors noted with such forward-looking statements include, without limitation, general economic conditions, such as inflation, recession, and interest rates. Past performance is not a guarantee of future results.
3
LYRICAL U.S. VALUE EQUITY FUND
PERFORMANCE INFORMATION (Unaudited)
Comparison of the Change in Value of a $100,000 Investment in
Lyrical U.S. Value Equity Fund - Institutional Class(a) versus
the S&P 500® Index
Average Annual Total Returns(b) (for the periods ended November 30, 2015) | ||
1 Year | Since | |
Lyrical U.S. Value Equity Fund - Institutional Class | (1.91%) | 18.51% |
Lyrical U.S. Value Equity Fund - Investor Class | (2.19%) | 4.68% |
S&P 500® Index(d) | 2.75% | 14.82%(e) |
(a) | The line graph above represents performance of the Institutional Class only, which will vary from the performance of the Investor Class based on the difference in fees paid by shareholders in the different classes. |
(b) | The Fund’s total returns do not reflect the deduction of taxes a shareholder would pay on Fund distributions or the redemption of Fund shares. |
(c) | Commencement of operations for Institutional Class shares was February 4, 2013. Commencement of operations for Investor Class shares was February 24, 2014. |
(d) | The S&P 500® Index is a market capitalization weighted index of 500 large companies that is widely used as a barometer of U.S. stock market performance. The index is unmanaged and shown for illustration purposes only. An investor cannot invest in an index and its returns are not indicative of the performance of any specific investment. |
(e) | Represents the period from February 4, 2013 (date of commencement of operations of Institutional Class shares) through November 30, 2015. |
4
LYRICAL U.S. HEDGED VALUE FUND
PERFORMANCE INFORMATION (Unaudited)
Comparison of the Change in Value of a $100,000 Investment in
Lyrical U.S. Hedged Value Fund - Institutional Class(a) versus
the S&P 500® Index
Average Annual Total Returns(b) (for the periods ended November 30, 2015) | ||
1 Year | Since | |
Lyrical U.S. Hedged Value Fund - Institutional Class | (3.66%) | (4.01%) |
Lyrical U.S. Hedged Value Fund - Investor Class | (3.87%) | (4.23%) |
S&P 500® Index(d) | 2.75% | 5.94% |
(a) | The line graph above represents performance of the Institutional Class only, which will vary from the performance of the Investor Class based on the difference in fees paid by shareholders in the different classes. |
(b) | The Fund’s total returns do not reflect the deduction of taxes a shareholder would pay on Fund distributions or the redemption of Fund shares. |
(c) | Commencement of operations for Institutional Class and Investor Class shares was July 14, 2014. |
(d) | The S&P 500® Index is a market capitalization weighted index of 500 large companies that is widely used as a barometer of U.S. stock market performance. The index is unmanaged and shown for illustration purposes only. An investor cannot invest in an index and its returns are not indicative of the performance of any specific investment. |
5
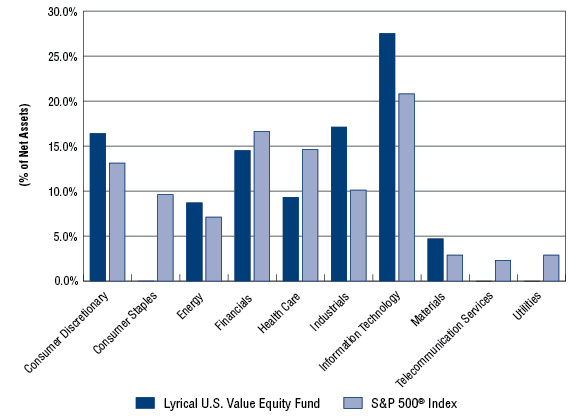
LYRICAL U.S. VALUE EQUITY FUND
PORTFOLIO INFORMATION
November 30, 2015 (Unaudited)
Lyrical U.S. Value Equity Fund vs S&P 500® Index
Sector Diversification
Top Ten Equity Holdings
Security Description | % of |
Avago Technologies Ltd. | 6.4% |
Raytheon Company | 5.2% |
Aetna, Inc. | 4.9% |
Comcast Corporation - Class A | 4.6% |
Anthem, Inc. | 4.4% |
Aflac, Inc. | 4.4% |
TE Connectivity Ltd. | 4.3% |
Liberty Interactive Corporation - Series A | 3.9% |
Johnson Controls, Inc. | 3.8% |
Ameriprise Financial, Inc. | 3.8% |
6
LYRICAL U.S. HEDGED VALUE FUND
PORTFOLIO INFORMATION
November 30, 2015 (Unaudited)
Lyrical U.S. Hedged Value Fund vs S&P 500® Index
Sector Diversification
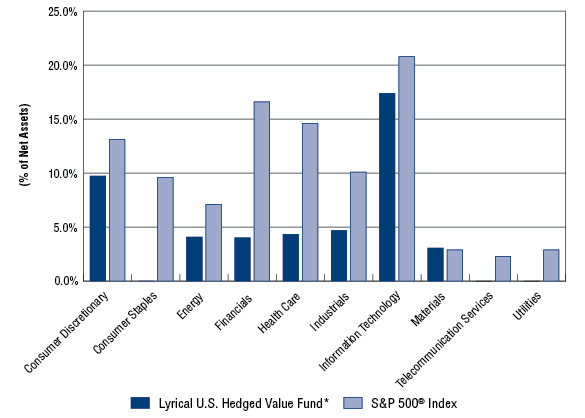
* | The percentages above for Lyrical U.S. Hedged Value Fund represent the net percentages for the Fund and are computed by taking the net dollar exposure, including short positions, and dividing by the net assets of the Fund. |
Top Ten Long Positions
Security Description | % of |
Avago Technologies Ltd. | 6.8% |
Raytheon Company | 5.3% |
Aetna, Inc. | 5.0% |
Comcast Corporation - Class A | 4.6% |
Anthem, Inc. | 4.5% |
TE Connectivity Ltd. | 4.4% |
Aflac, Inc. | 4.4% |
Liberty Interactive Corporation - Series A | 3.9% |
Johnson Controls, Inc. | 3.8% |
Ameriprise Financial, Inc. | 3.8% |
7
LYRICAL U.S. VALUE EQUITY FUND |
COMMON STOCKS — 98.2% | Shares | Value | ||||||
Consumer Discretionary — 16.4% | ||||||||
Auto Components — 7.9% | ||||||||
Goodyear Tire & Rubber Company (The) | 562,903 | $ | 19,634,057 | |||||
Johnson Controls, Inc. | 545,158 | 25,077,268 | ||||||
Tenneco, Inc. (a) | 130,195 | 7,014,906 | ||||||
51,726,231 | ||||||||
Internet & Catalog Retail — 3.9% | ||||||||
Liberty Interactive Corporation - Series A (a) | 951,477 | 25,195,111 | ||||||
Media — 4.6% | ||||||||
Comcast Corporation - Class A | 487,874 | 29,692,012 | ||||||
Energy — 8.7% | ||||||||
Energy Equipment & Services — 2.2% | ||||||||
National Oilwell Varco, Inc. | 391,373 | 14,613,868 | ||||||
Oil, Gas & Consumable Fuels — 6.5% | ||||||||
EOG Resources, Inc. | 261,482 | 21,815,443 | ||||||
Suncor Energy, Inc. | 745,899 | 20,586,812 | ||||||
42,402,255 | ||||||||
Financials — 14.5% | ||||||||
Capital Markets — 3.8% | ||||||||
Ameriprise Financial, Inc. | 217,927 | 24,614,854 | ||||||
Insurance — 10.7% | ||||||||
Aflac, Inc. | 435,819 | 28,432,832 | ||||||
AmTrust Financial Services, Inc. | 166,757 | 10,423,980 | ||||||
Assurant, Inc. | 153,354 | 13,114,834 | ||||||
Willis Group Holdings plc | 386,850 | 17,779,626 | ||||||
69,751,272 | ||||||||
Health Care — 9.3% | ||||||||
Health Care Providers & Services — 9.3% | ||||||||
Aetna, Inc. | 309,305 | 31,781,089 | ||||||
Anthem, Inc. | 222,089 | 28,955,964 | ||||||
60,737,053 | ||||||||
Industrials — 17.1% | ||||||||
Aerospace & Defense — 5.2% | ||||||||
Raytheon Company | 275,331 | 34,149,304 | ||||||
Construction & Engineering — 1.3% | ||||||||
AECOM (a) | 255,821 | 8,142,783 | ||||||
8
LYRICAL U.S. VALUE EQUITY FUND |
COMMON STOCKS — 98.2% (Continued) | Shares | Value | ||||||
Industrials — 17.1% (Continued) | ||||||||
Electrical Equipment — 3.3% | ||||||||
Eaton Corporation plc | 370,895 | $ | 21,571,253 | |||||
Road & Rail — 3.6% | ||||||||
Avis Budget Group, Inc. (a) | 228,811 | 8,555,244 | ||||||
Hertz Global Holdings, Inc. (a) | 943,098 | 14,957,534 | ||||||
23,512,778 | ||||||||
Trading Companies & Distributors — 3.7% | ||||||||
AerCap Holdings N.V. (a) | 457,637 | 20,795,025 | ||||||
MRC Global, Inc. (a) | 221,828 | 3,280,836 | ||||||
24,075,861 | ||||||||
Information Technology — 27.5% | ||||||||
Communications Equipment — 1.5% | ||||||||
ARRIS Group, Inc. (a) | 311,879 | 9,534,141 | ||||||
Electronic Equipment, Instruments & Components — 8.0% | ||||||||
Corning, Inc. | 1,252,054 | 23,450,971 | ||||||
TE Connectivity Ltd. | 422,378 | 28,337,340 | ||||||
51,788,311 | ||||||||
IT Services — 3.3% | ||||||||
Western Union Company (The) | 1,155,695 | 21,796,408 | ||||||
Semiconductors & Semiconductor Equipment — 6.4% | ||||||||
Avago Technologies Ltd. | 320,984 | 41,872,363 | ||||||
Software — 3.5% | ||||||||
Symantec Corporation | 1,156,148 | 22,637,378 | ||||||
Technology Hardware, Storage & Peripherals — 4.8% | ||||||||
Lexmark International, Inc. - Class A | 131,259 | 4,507,434 | ||||||
NCR Corporation (a) | 358,202 | 9,710,856 | ||||||
Western Digital Corporation | 277,038 | 17,289,942 | ||||||
31,508,232 | ||||||||
Materials — 4.7% | ||||||||
Chemicals — 3.6% | ||||||||
Celanese Corporation - Series A | 336,649 | 23,817,917 | ||||||
Containers & Packaging — 1.1% | ||||||||
Owens-Illinois, Inc. (a) | 357,242 | 6,891,198 | ||||||
Total Common Stocks (Cost $625,105,710) | $ | 640,030,583 | ||||||
9
LYRICAL U.S. VALUE EQUITY FUND |
MONEY MARKET FUNDS — 1.8% | Shares | Value | ||||||
Fidelity Institutional Money Market Portfolio - Class I, 0.12% (b) (Cost $11,642,472) | 11,642,472 | $ | 11,642,472 | |||||
Total Investments at Value — 100.0% (Cost $636,748,182) | $ | 651,673,055 | ||||||
Other Assets in Excess of Liabilities — 0.0% (c) | 283,785 | |||||||
Net Assets — 100.0% | $ | 651,956,840 | ||||||
(a) | Non-income producing security. |
(b) | The rate shown is the 7-day effective yield as of November 30, 2015. |
(c) | Percentage rounds to less than 0.1%. |
See accompanying notes to financial statements. |
10
LYRICAL U.S. HEDGED VALUE FUND |
COMMON STOCKS — 99.0% | Shares | Value | ||||||
Consumer Discretionary — 16.4% | ||||||||
Auto Components — 7.9% | ||||||||
Goodyear Tire & Rubber Company (The) (a) | 1,219 | $ | 42,519 | |||||
Johnson Controls, Inc. (a) | 1,160 | 53,360 | ||||||
Tenneco, Inc. (b) | 269 | 14,494 | ||||||
110,373 | ||||||||
Internet & Catalog Retail — 3.9% | ||||||||
Liberty Interactive Corporation - Series A (a) (b) | 2,027 | 53,675 | ||||||
Media — 4.6% | ||||||||
Comcast Corporation - Class A (a) | 1,055 | 64,207 | ||||||
Energy — 8.3% | ||||||||
Energy Equipment & Services — 2.1% | ||||||||
National Oilwell Varco, Inc. (a) | 779 | 29,088 | ||||||
Oil, Gas & Consumable Fuels — 6.2% | ||||||||
EOG Resources, Inc. (a) | 540 | 45,052 | ||||||
Suncor Energy, Inc. (a) | 1,528 | 42,173 | ||||||
87,225 | ||||||||
Financials — 14.6% | ||||||||
Capital Markets — 3.8% | ||||||||
Ameriprise Financial, Inc. (a) | 472 | 53,312 | ||||||
Insurance — 10.8% | ||||||||
Aflac, Inc. (a) | 935 | 61,000 | ||||||
AmTrust Financial Services, Inc. (a) | 363 | 22,691 | ||||||
Assurant, Inc. (a) | 335 | 28,649 | ||||||
Willis Group Holdings plc (a) | 843 | 38,744 | ||||||
151,084 | ||||||||
Health Care — 9.5% | ||||||||
Health Care Providers & Services — 9.5% | ||||||||
Aetna, Inc. (a) | 671 | 68,945 | ||||||
Anthem, Inc. (a) | 483 | 62,974 | ||||||
131,919 | ||||||||
Industrials — 17.3% | ||||||||
Aerospace & Defense — 5.3% | ||||||||
Raytheon Company (a) | 599 | 74,294 | ||||||
Construction & Engineering — 1.2% | ||||||||
AECOM (a) (b) | 537 | 17,093 | ||||||
11
LYRICAL U.S. HEDGED VALUE FUND |
COMMON STOCKS — 99.0% (Continued) | Shares | Value | ||||||
Industrials — 17.3% (Continued) | ||||||||
Electrical Equipment — 3.3% | ||||||||
Eaton Corporation plc (a) | 786 | $ | 45,714 | |||||
Road & Rail — 3.7% | ||||||||
Avis Budget Group, Inc. (a) (b) | 503 | 18,807 | ||||||
Hertz Global Holdings, Inc. (a) (b) | 2,050 | 32,513 | ||||||
51,320 | ||||||||
Trading Companies & Distributors — 3.8% | ||||||||
AerCap Holdings N.V. (a) (b) | 1,000 | 45,440 | ||||||
MRC Global, Inc. (a) (b) | 483 | 7,143 | ||||||
52,583 | ||||||||
Information Technology — 28.1% | ||||||||
Communications Equipment — 1.5% | ||||||||
ARRIS Group, Inc. (b) | 665 | 20,329 | ||||||
Electronic Equipment, Instruments & Components — 8.0% | ||||||||
Corning, Inc. (a) | 2,710 | 50,758 | ||||||
TE Connectivity Ltd. (a) | 919 | 61,656 | ||||||
112,414 | ||||||||
IT Services — 3.4% | ||||||||
Western Union Company (The) (a) | 2,529 | 47,697 | ||||||
Semiconductors & Semiconductor Equipment — 6.8% | ||||||||
Avago Technologies Ltd. (a) | 725 | 94,576 | ||||||
Software — 3.5% | ||||||||
Symantec Corporation (a) | 2,465 | 48,265 | ||||||
Technology Hardware, Storage & Peripherals — 4.9% | ||||||||
Lexmark International, Inc. - Class A (a) | 294 | 10,096 | ||||||
NCR Corporation (b) | 799 | 21,661 | ||||||
Western Digital Corporation (a) | 598 | 37,321 | ||||||
69,078 | ||||||||
Materials — 4.8% | ||||||||
Chemicals — 3.7% | ||||||||
Celanese Corporation - Series A (a) | 735 | 52,002 | ||||||
Containers & Packaging — 1.1% | ||||||||
Owens-Illinois, Inc. (a) (b) | 780 | 15,046 | ||||||
Total Common Stocks (Cost $1,441,612) | $ | 1,381,294 | ||||||
12
LYRICAL U.S. HEDGED VALUE FUND |
MONEY MARKET FUNDS — 3.6% | Shares | Value | ||||||
Invesco Liquid Assets Portfolio (The) - Institutional Shares, 0.17%(c) (Cost $50,872) | 50,872 | $ | 50,872 | |||||
Total Investments at Value — 102.6% (Cost $1,492,484) | $ | 1,432,166 | ||||||
Liabilities in Excess of Other Assets(d) — (2.6%) | (36,736 | ) | ||||||
Net Assets — 100.0% | $ | 1,395,430 | ||||||
(a) | All or a portion of the shares have been committed as collateral for open short positions (Note 2). |
(b) | Non-income producing security. |
(c) | The rate shown is the 7-day effective yield as of November 30, 2015. |
(d) | Includes cash held as margin deposits for open short positions. |
See accompanying notes to financial statements. |
13
LYRICAL U.S. HEDGED VALUE FUND |
EXCHANGE-TRADED FUNDS — 51.7% | Shares | Value | ||||||
Consumer Discretionary Select Sector SPDR® Fund (The) | 1,145 | $ | 92,493 | |||||
Energy Select Sector SPDR® Fund (The) | 875 | 59,517 | ||||||
Financial Select Sector SPDR® Fund (The) | 6,042 | 148,392 | ||||||
Health Care Select Sector SPDR® Fund (The) | 1,006 | 71,537 | ||||||
Industrial Select Sector SPDR® Fund (The) | 3,212 | 175,825 | ||||||
Materials Select Sector SPDR® Fund (The) | 532 | 24,328 | ||||||
Technology Select Sector SPDR® Fund (The) | 3,406 | 149,728 | ||||||
Total Securities Sold Short — 51.7% (Proceeds $707,107) | $ | 721,820 | ||||||
See accompanying notes to financial statements. |
14
LYRICAL FUNDS |
| Lyrical U.S. Value Equity Fund | Lyrical U.S. Hedged Value Fund | ||||||
ASSETS | ||||||||
Investments in securities: | ||||||||
At acquisition cost | $ | 636,748,182 | $ | 1,492,484 | ||||
At value (Note 2) | $ | 651,673,055 | $ | 1,432,166 | ||||
Deposits with brokers for securities sold short (Note 2) | — | 677,618 | ||||||
Dividends receivable | 1,064,305 | 2,290 | ||||||
Receivable for capital shares sold | 186,819 | 150 | ||||||
Receivable from Adviser (Note 4) | — | 12,148 | ||||||
Other assets | 23,774 | 5,693 | ||||||
Total assets | 652,947,953 | 2,130,065 | ||||||
LIABILITIES | ||||||||
Securities sold short, at value (Note 2) (proceeds $— and $707,107 respectively) | — | 721,820 | ||||||
Payable for capital shares redeemed | 185,380 | — | ||||||
Payable to Adviser (Note 4) | 677,750 | — | ||||||
Payable to administrator (Note 4) | 62,200 | 8,010 | ||||||
Accrued distribution fees (Note 4) | 26,354 | — | ||||||
Accrued brokerage expense on securities sold short (Note 2) | — | 561 | ||||||
Other accrued expenses | 39,429 | 4,244 | ||||||
Total liabilities | 991,113 | 734,635 | ||||||
NET ASSETS | $ | 651,956,840 | $ | 1,395,430 | ||||
NET ASSETS CONSIST OF: | ||||||||
Paid-in capital | $ | 623,248,407 | $ | 1,462,185 | ||||
Undistributed net investment income | 1,278,084 | — | ||||||
Undistributed net realized gains from security transactions | 12,505,476 | 8,276 | ||||||
Net unrealized appreciation (depreciation) on: | ||||||||
Investments | 14,924,873 | (60,318 | ) | |||||
Securities sold short | — | (14,713 | ) | |||||
NET ASSETS | $ | 651,956,840 | $ | 1,395,430 | ||||
NET ASSET VALUE PER SHARE: | ||||||||
INSTITUTIONAL CLASS | ||||||||
Net assets applicable to Institutional Class | $ | 590,581,631 | $ | 776,530 | ||||
Institutional Class shares of beneficial interest outstanding (unlimited number of shares authorized, no par value) | 37,789,018 | 82,177 | ||||||
Net asset value, offering price and redemption price per share (Note 2) | $ | 15.63 | $ | 9.45 | ||||
INVESTOR CLASS | ||||||||
Net assets applicable to Investor Class | $ | 61,375,209 | $ | 618,900 | ||||
Investor Class shares of beneficial interest outstanding (unlimited number of shares authorized, no par value) | 3,942,181 | 65,716 | ||||||
Net asset value, offering price and redemption price per share (Note 2) | $ | 15.57 | $ | 9.42 | ||||
See accompanying notes to financial statements. |
15
LYRICAL FUNDS |
| Lyrical U.S. | Lyrical U.S. Hedged Value Fund | ||||||
INVESTMENT INCOME | ||||||||
Dividend income | $ | 11,514,136 | $ | 23,289 | ||||
Foreign withholding taxes on dividends | (182,107 | ) | (354 | ) | ||||
Total investment income | 11,332,029 | 22,935 | ||||||
EXPENSES | ||||||||
Investment advisory fees (Note 4) | 8,690,662 | (a) | 21,583 | |||||
Administration fees (Note 4) | 528,108 | 25,000 | ||||||
Distribution fees - Investor Class (Note 4) | 213,950 | 1,681 | ||||||
Fund accounting fees (Note 4) | 94,551 | 31,137 | ||||||
Transfer agent fees (Note 4) | 74,725 | 24,000 | ||||||
Custody and bank service fees | 90,667 | 7,140 | ||||||
Registration and filing fees | 83,999 | 9,082 | ||||||
Compliance fees (Note 4) | 70,429 | 12,297 | ||||||
Professional fees | 36,074 | 32,524 | ||||||
Trustees' fees and expenses (Note 4) | 8,485 | 8,485 | ||||||
Postage and supplies | 13,147 | 3,109 | ||||||
Dividend expense on securities sold short (Note 2) | — | 12,331 | ||||||
Printing of shareholder reports | 8,345 | 3,150 | ||||||
Prime brokerage expense on securities sold short (Note 2) | — | 7,264 | ||||||
Insurance expense | 3,164 | 3,164 | ||||||
Other expenses | 18,087 | 8,543 | ||||||
Total expenses | 9,934,393 | 210,490 | ||||||
Fee reductions and/or expense reimbursements by Adviser (Note 4) | (43,226 | ) | (164,846 | ) | ||||
Net expenses | 9,891,167 | 45,644 | ||||||
NET INVESTMENT INCOME (LOSS) | 1,440,862 | (22,709 | ) | |||||
REALIZED AND UNREALIZED GAINS (LOSSES) ON | ||||||||
Net realized gains (losses) from: | ||||||||
Investments | 12,579,532 | 21,575 | ||||||
Securities sold short | — | (3,393 | ) | |||||
Net change in unrealized appreciation/depreciation on: | ||||||||
Investments | (31,320,202 | ) | (60,317 | ) | ||||
Securities sold short | — | 2,207 | ||||||
NET REALIZED AND UNREALIZED LOSSES ON INVESTMENTS AND SECURITIES SOLD SHORT | (18,740,670 | ) | (39,928 | ) | ||||
NET DECREASE IN NET ASSETS RESULTING FROM OPERATIONS | $ | (17,299,808 | ) | $ | (62,637 | ) | ||
(a) | Includes $182,903 of prior years’ investment advisory fee reductions and expense reimbursements recouped by the Adviser (Note 4). |
See accompanying notes to financial statements. |
16
LYRICAL U.S. VALUE EQUITY FUND |
| Year Ended 2015 | Year 2014 | ||||||
FROM OPERATIONS | ||||||||
Net investment income (loss) | $ | 1,440,862 | $ | (15,582 | ) | |||
Net realized gains from security transactions | 12,579,532 | 11,870,000 | ||||||
Net change in unrealized appreciation/depreciation on investments | (31,320,202 | ) | 37,708,433 | |||||
Net increase (decrease) in net assets resulting from operations | (17,299,808 | ) | 49,562,851 | |||||
DISTRIBUTIONS TO SHAREHOLDERS (Note 2) | ||||||||
From net investment income, Institutional Class | (168,471 | ) | (17,629 | ) | ||||
From net realized gains, Institutional Class | (11,690,275 | ) | (1,211,369 | ) | ||||
From net realized gains, Investor Class | (193,318 | ) | — | |||||
Decrease in net assets from distributions to shareholders | (12,052,064 | ) | (1,228,998 | ) | ||||
CAPITAL SHARE TRANSACTIONS | ||||||||
Institutional Class | ||||||||
Proceeds from shares sold | 339,352,309 | 460,875,190 | ||||||
Net asset value of shares issued in reinvestment of distributions to shareholders | 9,377,973 | 1,000,129 | ||||||
Payments for shares redeemed | (282,422,299 | ) | (60,859,243 | ) | ||||
Net increase in Institutional Class net assets from capital share transactions | 66,307,983 | 401,016,076 | ||||||
Investor Class | ||||||||
Proceeds from shares sold | 118,329,002 | 11,209,228 | ||||||
Net asset value of shares issued in reinvestment of distributions to shareholders | 181,114 | — | ||||||
Payments for shares redeemed | (59,563,305 | ) | (2,453,295 | ) | ||||
Net increase in Investor Class net assets from capital share transactions | 58,946,811 | 8,755,933 | ||||||
TOTAL INCREASE IN NET ASSETS | 95,902,922 | 458,105,862 | ||||||
NET ASSETS | ||||||||
Beginning of year | 556,053,918 | 97,948,056 | ||||||
End of year | $ | 651,956,840 | $ | 556,053,918 | ||||
UNDISTRIBUTED NET INVESTMENT INCOME | $ | 1,278,084 | $ | — | ||||
See accompanying notes to financial statements. |
17
LYRICAL U.S. VALUE EQUITY FUND |
| Year Ended November 30, 2015 | Year | ||||||
CAPITAL SHARE ACTIVITY | ||||||||
Institutional Class | ||||||||
Shares sold | 21,132,995 | 30,358,655 | ||||||
Shares issued in reinvestment of distributions to shareholders | 592,967 | 68,785 | ||||||
Shares redeemed | (17,510,391 | ) | (3,961,000 | ) | ||||
Net increase in shares outstanding | 4,215,571 | 26,466,440 | ||||||
Shares outstanding at beginning of year | 33,573,447 | 7,107,007 | ||||||
Shares outstanding at end of year | 37,789,018 | 33,573,447 | ||||||
Investor Class | ||||||||
Shares sold | 7,202,116 | 712,342 | ||||||
Shares issued in reinvestment of distributions to shareholders | 11,470 | — | ||||||
Shares redeemed | (3,826,599 | ) | (157,148 | ) | ||||
Net increase in shares outstanding | 3,386,987 | 555,194 | ||||||
Shares outstanding at beginning of year | 555,194 | — | ||||||
Shares outstanding at end of year | 3,942,181 | 555,194 | ||||||
See accompanying notes to financial statements. |
18
LYRICAL U.S. HEDGED VALUE FUND |
| Year 2015 | Period | ||||||
FROM OPERATIONS | ||||||||
Net investment loss | $ | (22,709 | ) | $ | (5,347 | ) | ||
Net realized gains (losses) from: | ||||||||
Investments | 21,575 | 5,822 | ||||||
Securities sold short | (3,393 | ) | (3,499 | ) | ||||
Net change in unrealized appreciation/depreciation on: | ||||||||
Investments | (60,317 | ) | (1 | ) | ||||
Securities sold short | 2,207 | (16,920 | ) | |||||
Net decrease in net assets resulting from operations | (62,637 | ) | (19,945 | ) | ||||
DISTRIBUTIONS TO SHAREHOLDERS (Note 2) | ||||||||
From net realized gains, Institutional Class | (54 | ) | — | |||||
From net realized gains, Investor Class | (57 | ) | — | |||||
Decrease in net assets from distributions to shareholders | (111 | ) | — | |||||
CAPITAL SHARE TRANSACTIONS | ||||||||
Institutional Class | ||||||||
Proceeds from shares sold | 220,000 | 600,000 | ||||||
Net asset value of shares issued in reinvestment of distributions to shareholders | 54 | — | ||||||
Net increase in Institutional Class net assets from capital share transactions | 220,054 | 600,000 | ||||||
Investor Class | ||||||||
Proceeds from shares sold | 126,747 | 668,686 | ||||||
Net asset value of shares issued in reinvestment of distributions to shareholders | 54 | — | ||||||
Payments for shares redeemed | (94,359 | ) | (43,059 | ) | ||||
Net increase in Investor Class net assets from capital share transactions | 32,442 | 625,627 | ||||||
TOTAL INCREASE IN NET ASSETS | 189,748 | 1,205,682 | ||||||
NET ASSETS | ||||||||
Beginning of period | 1,205,682 | — | ||||||
End of period | $ | 1,395,430 | $ | 1,205,682 | ||||
UNDISTRIBUTED NET INVESTMENT INCOME | $ | — | $ | — | ||||
(a) | Represents the period from the commencement of operations (July 14, 2014) through November 30, 2014. |
See accompanying notes to financial statements. |
19
LYRICAL U.S. HEDGED VALUE FUND |
| Year 2015 | Period | ||||||
CAPITAL SHARE ACTIVITY | ||||||||
Institutional Class | ||||||||
Shares sold | 21,883 | 60,288 | ||||||
Shares issued in reinvestment of distributions to shareholders | 6 | — | ||||||
Net increase in shares outstanding | 21,889 | 60,288 | ||||||
Shares outstanding at beginning of period | 60,288 | — | ||||||
Shares outstanding at end of period | 82,177 | 60,288 | ||||||
Investor Class | ||||||||
Shares sold | 12,770 | 67,265 | ||||||
Shares issued in reinvestment of distributions to shareholders | 6 | — | ||||||
Shares redeemed | (9,763 | ) | (4,562 | ) | ||||
Net increase in shares outstanding | 3,013 | 62,703 | ||||||
Shares outstanding at beginning of period | 62,703 | — | ||||||
Shares outstanding at end of period | 65,716 | 62,703 | ||||||
(a) | Represents the period from the commencement of operations (July 14, 2014) through November 30, 2014. |
See accompanying notes to financial statements. |
20
LYRICAL U.S. VALUE EQUITY FUND |
Per Share Data for a Share Outstanding Throughout Each Period: | ||||||||||||
| Year | Year | Period | |||||||||
Net asset value at beginning of period | $ | 16.29 | $ | 13.78 | $ | 10.00 | ||||||
Income (loss) from investment operations: | ||||||||||||
Net investment income (loss) | 0.04 | (0.00 | )(b) | 0.00 | (b) | |||||||
Net realized and unrealized gains (losses) on investments | (0.35 | ) | 2.66 | 3.78 | ||||||||
Total from investment operations | (0.31 | ) | 2.66 | 3.78 | ||||||||
Less distributions: | ||||||||||||
Dividends from net investment income | (0.00 | )(b) | (0.00 | )(b) | — | |||||||
Distributions from net realized gains | (0.35 | ) | (0.15 | ) | — | |||||||
Total distributions | (0.35 | ) | (0.15 | ) | — | |||||||
Net asset value at end of period | $ | 15.63 | $ | 16.29 | $ | 13.78 | ||||||
Total return (c) | (1.91 | %) | 19.41 | % | 37.80 | %(d) | ||||||
Net assets at end of period (000's) | $ | 590,582 | $ | 547,021 | $ | 97,948 | ||||||
Ratios/supplementary data: | ||||||||||||
Ratio of total expenses to average net assets | 1.42 | % | 1.45 | % | 1.93 | %(e) | ||||||
Ratio of net expenses to average net assets (f) | 1.42 | % | 1.44 | % | 1.45 | %(e) | ||||||
Ratio of net investment income (loss) to average net assets (f) | 0.24 | % | (0.00 | %)(g) | 0.01 | %(e) | ||||||
Portfolio turnover rate | 21 | % | 20 | % | 26 | %(d) | ||||||
(a) | Represents the period from the commencement of operations (February 4, 2013) through November 30, 2013. |
(b) | Amount rounds to less than $0.01 per share. |
(c) | Total return is a measure of the change in value of an investment in the Fund over the periods covered. The returns shown do not reflect the deduction of taxes a shareholder would pay on Fund distributions, if any, or the redemption of Fund shares. The total returns would be lower if the Adviser had not reduced advisory fees and reimbursed expenses (Note 4). |
(d) | Not annualized. |
(e) | Annualized. |
(f) | Ratio was determined after advisory fee reductions and expense reimbursements (Note 4). |
(g) | Amount rounds to less than 0.01%. |
See accompanying notes to financial statements. |
21
LYRICAL U.S. VALUE EQUITY FUND |
Per Share Data for a Share Outstanding Throughout Each Period: | ||||||||
| Year | Period | ||||||
Net asset value at beginning of period | $ | 16.27 | $ | 14.68 | ||||
Income (loss) from investment operations: | ||||||||
Net investment income (loss) | 0.01 | (0.01 | ) | |||||
Net realized and unrealized gains (losses) on investments | (0.36 | ) | 1.60 | |||||
Total from investment operations | (0.35 | ) | 1.59 | |||||
Less distributions: | ||||||||
Distributions from net realized gains | (0.35 | ) | — | |||||
Net asset value at end of period | $ | 15.57 | $ | 16.27 | ||||
Total return (b) | (2.19 | %) | 10.83 | %(c) | ||||
Net assets at end of period (000's) | $ | 61,375 | $ | 9,033 | ||||
Ratios/supplementary data: | ||||||||
Ratio of total expenses to average net assets | 1.72 | % | 2.39 | %(d) | ||||
Ratio of net expenses to average net assets (e) | 1.70 | % | 1.70 | %(d) | ||||
Ratio of net investment income (loss) to average net assets (e) | 0.03 | % | (0.18 | %)(d) | ||||
Portfolio turnover rate | 21 | % | 20 | %(c)(f) | ||||
(a) | Represents the period from the commencement of operations (February 24, 2014) through November 30, 2014. |
(b) | Total return is a measure of the change in value of an investment in the Fund over the periods covered. The returns shown do not reflect the deduction of taxes a shareholder would pay on Fund distributions, if any, or the redemption of Fund shares. The total returns would be lower if the Adviser had not reduced advisory fees and reimbursed expenses (Note 4). |
(c) | Not annualized. |
(d) | Annualized. |
(e) | Ratio was determined after advisory fee reductions and expense reimbursements (Note 4). |
(f) | Represents the year ended November 30, 2014. |
See accompanying notes to financial statements. |
22
LYRICAL U.S. HEDGED VALUE FUND |
Per Share Data for a Share Outstanding Throughout Each Period: | ||||||||
| Year | Period | ||||||
Net asset value at beginning of period | $ | 9.81 | $ | 10.00 | ||||
Loss from investment operations: | ||||||||
Net investment loss | (0.13 | ) | (0.04 | ) | ||||
Net realized and unrealized losses on investments and securities sold short | (0.23 | ) | (0.15 | ) | ||||
Total from investment operations | (0.36 | ) | (0.19 | ) | ||||
Less distributions: | ||||||||
Distributions from net realized gains | (0.00 | )(b) | — | |||||
Net asset value at end of period | $ | 9.45 | $ | 9.81 | ||||
Total return (c) | (3.66 | %) | (1.90% | )(d) | ||||
Net assets at end of period (000's) | $ | 777 | $ | 591 | ||||
Ratios/supplementary data: | ||||||||
Ratio of total expenses to average net assets | 14.76 | % | 16.57 | %(e) | ||||
Ratio of net expenses to average net assets (f) | 3.16 | % | 2.59 | %(e) | ||||
Ratio of net expenses to average net assets excluding dividend expense (f) | 2.27 | % | 1.99 | %(e) | ||||
Ratio of net expenses to average net assets excluding dividend expense and prime brokerage expense on securities sold short (f) | 1.75 | % | 1.75 | %(e) | ||||
Ratio of net investment loss to average net assets (f) | (1.49 | %) | (1.15 | %)(e) | ||||
Portfolio turnover rate | 7 | % | 9 | %(d) | ||||
(a) | Represents the period from the commencement of operations (July 14, 2014) through November 30, 2014. |
(b) | Amount rounds to less than $0.01 per share. |
(c) | Total return is a measure of the change in value of an investment in the Fund over the periods covered. The returns shown do not reflect the deduction of taxes a shareholder would pay on Fund distributions, if any, or the redemption of Fund shares. The total returns would be lower if the Adviser had not reduced advisory fees and reimbursed expenses (Note 4). |
(d) | Not annualized. |
(e) | Annualized. |
(f) | Ratio was determined after advisory fee reductions and expense reimbursements (Note 4). |
See accompanying notes to financial statements. |
23
LYRICAL U.S. HEDGED VALUE FUND |
Per Share Data for a Share Outstanding Throughout Each Period: | ||||||||
| Year | Period | ||||||
Net asset value at beginning of period | $ | 9.80 | $ | 10.00 | ||||
Loss from investment operations: | ||||||||
Net investment loss | (0.18 | ) | (0.05 | ) | ||||
Net realized and unrealized losses on investments and securities sold short | (0.20 | ) | (0.15 | ) | ||||
Total from investment operations | (0.38 | ) | (0.20 | ) | ||||
Less distributions: | ||||||||
Distributions from net realized gains | (0.00 | )(b) | — | |||||
Net asset value at end of period | $ | 9.42 | $ | 9.80 | ||||
Total return (c) | (3.87 | %) | (2.00% | )(d) | ||||
Net assets at end of period (000's) | $ | 619 | $ | 614 | ||||
Ratios/supplementary data: | ||||||||
Ratio of total expenses to average net assets | 15.49 | % | 16.95 | %(e) | ||||
Ratio of net expenses to average net assets (f) | 3.41 | % | 2.84 | %(e) | ||||
Ratio of net expenses to average net assets excluding dividend expense (f) | 2.52 | % | 2.24 | %(e) | ||||
Ratio of net expenses to average net assets excluding dividend expense and prime brokerage expense on securities sold short (f) | 2.00 | % | 2.00 | %(e) | ||||
Ratio of net investment loss to average net assets (f) | (1.78 | %) | (1.38 | %)(e) | ||||
Portfolio turnover rate | 7 | % | 9 | %(d) | ||||
(a) | Represents the period from the commencement of operations (July 14, 2014) through November 30, 2014. |
(b) | Amount rounds to less than $0.01 per share. |
(c) | Total return is a measure of the change in value of an investment in the Fund over the periods covered. The returns shown do not reflect the deduction of taxes a shareholder would pay on Fund distributions, if any, or the redemption of Fund shares. The total returns would be lower if the Adviser had not reduced advisory fees and reimbursed expenses (Note 4). |
(d) | Not annualized. |
(e) | Annualized. |
(f) | Ratio was determined after advisory fee reductions and expense reimbursements (Note 4). |
See accompanying notes to financial statements. |
24
LYRICAL FUNDS
NOTES TO FINANCIAL STATEMENTS
November 30, 2015
1. Organization
Lyrical U.S. Value Equity Fund and Lyrical U.S. Hedged Value Fund (individually, a “Fund” and collectively, the “Funds”) are each a diversified series of Ultimus Managers Trust (the “Trust”), an open-end investment company established as an Ohio business trust under a Declaration of Trust dated February 28, 2012. Other series of the Trust are not incorporated in this report. Lyrical U.S. Value Equity Fund commenced operations on February 4, 2013. Lyrical U.S. Hedged Value Fund commenced operations on July 14, 2014.
The investment objective of each Fund is to seek to achieve long-term capital growth.
Each Fund offers two classes of shares: Institutional Class shares (sold without any sales loads and distribution and/or shareholder service fees and require a $100,000 initial investment) and Investor Class shares (sold without any sales loads, but subject to a distribution and/or shareholder service fee of up to 0.25% of the average daily net assets attributable to Investor Class shares, and require a $2,500 initial investment). Each share class represents an ownership interest in the same investment portfolio.
2. Significant Accounting Policies
The following is a summary of the Funds’ significant accounting policies. The policies are in conformity with accounting principles generally accepted in the United States of America (“GAAP”). As an investment company, as defined in Financial Accounting Standards Board (“FASB”) Accounting Standards Update 2013-08, the Funds follow accounting and reporting guidance under FASB Accounting Standards Codification Topic 946, “Financial Services – Investment Companies.”
Securities valuation – Each Fund values its portfolio securities at market value as of the close of regular trading on the New York Stock Exchange (the “NYSE”) (normally 4:00 p.m. Eastern time) on each business day the NYSE is open for business. The Funds value their listed securities on the basis of the security’s last sale price on the security’s primary exchange, if available, otherwise at the exchange’s most recently quoted bid price. NASDAQ-listed securities are valued at the NASDAQ Official Closing Price. In the event that market quotations are not readily available or are considered unreliable due to market or other events, the Funds value their securities and other assets at fair value in accordance with procedures established by and under the general supervision of the Board of Trustees (the “Board”). Under these procedures, the securities will be classified as Level 2 or 3 within the fair value hierarchy (see below), depending on the inputs used. Unavailable or unreliable market quotes may be due to the following factors: a substantial bid-ask spread; infrequent sales resulting in stale prices; insufficient trading volume; small trade sizes; a temporary lapse in any reliable pricing source; and actions of the securities or futures markets, such as the suspension or limitation of trading. As a result, the prices of securities used to calculate each Fund’s net asset value may differ from quoted or published prices for the same securities.
25
LYRICAL FUNDS |
GAAP establishes a single authoritative definition of fair value, sets out a framework for measuring fair value, and requires additional disclosures about fair value measurements.
Various inputs are used in determining the value of each Fund’s investments. These inputs are summarized in the three broad levels listed below:
● | Level 1 – quoted prices in active markets for identical securities |
● | Level 2 – other significant observable inputs |
● | Level 3 – significant unobservable inputs |
The inputs or methods used for valuing securities are not necessarily an indication of the risks associated with investing in those securities. The inputs used to measure fair value may fall into different levels of the fair value hierarchy. In such cases, for disclosure purposes, the level in the fair value hierarchy within which the fair value measurement falls in its entirety is determined based on the lowest level input that is significant to the fair value measurement.
The following is a summary of the inputs used to value the Funds’ investments and other financial instruments as of November 30, 2015:
Lyrical U.S. Value Equity Fund | Level 1 | Level 2 | Level 3 | Total | ||||||||||||
Investments in Securities | ||||||||||||||||
Common Stocks | $ | 640,030,583 | $ | — | $ | — | $ | 640,030,583 | ||||||||
Money Market Funds | 11,642,472 | — | — | 11,642,472 | ||||||||||||
Total | $ | 651,673,055 | $ | — | $ | — | $ | 651,673,055 | ||||||||
Lyrical U.S. Hedged Value Fund | Level 1 | Level 2 | Level 3 | Total | ||||||||||||
Investments in Securities | ||||||||||||||||
Common Stocks | $ | 1,381,294 | $ | — | $ | — | $ | 1,381,294 | ||||||||
Money Market Funds | 50,872 | — | — | 50,872 | ||||||||||||
Total | $ | 1,432,166 | $ | — | $ | — | $ | 1,432,166 | ||||||||
Other Financial Instruments | ||||||||||||||||
Exchange-Traded Funds - Sold Short | $ | (721,820 | ) | $ | — | $ | — | $ | (721,820 | ) | ||||||
Refer to the Funds’ Schedules of Investments and Schedule of Securities Sold Short, as applicable, for a listing of securities by industry type. As of November 30, 2015, the Funds did not have any transfers into and out of any Level. In addition, the Funds did not hold any derivative instruments or any assets or liabilities that were measured at fair value on a recurring basis using significant unobservable inputs (Level 3) as of November 30, 2015. It is the Funds’ policy to recognize transfers into and out of any Level at the end of the reporting period.
26
LYRICAL FUNDS |
Share valuation – The net asset value per share of each class of each Fund is calculated daily by dividing the total value of the assets attributable to that class, less liabilities attributable to that class, by the number of shares outstanding of that class. The offering price and redemption price per share of each class of each Fund is equal to the net asset value per share of such class.
Investment income – Dividend income is recorded on the ex-dividend date. Interest income is accrued as earned.
Security transactions – Security transactions are accounted for on the trade date. Gains and losses on securities sold are determined on a specific identification basis.
Common expenses – Common expenses of the Trust are allocated among the Funds and the other series of the Trust based on the relative net assets of each series or the nature of the services performed and the relative applicability to each series.
Distributions to shareholders – The Funds distribute to shareholders any net investment income dividends and net realized capital gains distributions at least once each year. The amount of such dividends and distributions are determined in accordance with federal income tax regulations, which may differ from GAAP. Dividends and distributions to shareholders are recorded on the ex-dividend date. The tax character of distributions paid to shareholders by the Funds during the periods ended November 30, 2015 and November 30, 2014 was as follows:
Period Ended | Ordinary Income | Long-Term Capital Gains | Total Distributions | |
Lyrical U.S. Value Equity Fund - | 11/30/2015 | $7,662,064 | $4,196,682 | $11,858,746 |
Institutional Class | 11/30/2014 | $1,228,998 | $ — | $1,228,998 |
Lyrical U.S. Value Equity Fund - | 11/30/2015 | $123,919 | $69,399 | $193,318 |
Investor Class | 11/30/2014 | $ — | $ — | $ — |
Lyrical U.S. Hedged Value Fund - | 11/30/2015 | $34 | $20 | $54 |
Institutional Class | 11/30/2014 | $ — | $ — | $ — |
Lyrical U.S. Hedged Value Fund - | 11/30/2015 | $36 | $21 | $57 |
Investor Class | 11/30/2014 | $ — | $ — | $ — |
27
LYRICAL FUNDS |
The Funds made the following distributions subsequent to November 30, 2015, to shareholders of record on the record dates as listed below:
Record Date | Ex-Date | Per Share | ||
Ordinary Income | Long-term Capital Gain | |||
Lyrical U.S. Value Equity Fund - Institutional Class | 11/30/2015 | 12/1/2015 | $ — | $ 0.3727 |
Lyrical U.S. Value Equity Fund - Institutional Class | 12/30/2015 | 12/31/2015 | 0.0382 | — |
Lyrical U.S. Value Equity Fund - Investor Class | 11/30/2015 | 12/1/2015 | — | 0.3727 |
Lyrical U.S. Value Equity Fund - Investor Class | 12/30/2015 | 12/31/2015 | 0.0009 | — |
Lyrical U.S. Hedged Value Fund - Institutional Class | 11/30/2015 | 12/1/2015 | — | 0.0760 |
Lyrical U.S. Hedged Value Fund - Investor Class | 11/30/2015 | 12/1/2015 | — | 0.0760 |
Short Positions – Lyrical U.S. Hedged Value Fund may sell securities short. For financial statement purposes, an amount equal to the settlement amount is included in the Statements of Assets and Liabilities as an asset and an equivalent liability is then subsequently marked-to-market daily to reflect the current value of the short position. Subsequent fluctuations in the market prices of securities sold, but not yet purchased, may require purchasing the securities at prices which may differ from the market value reflected on the Statements of Assets and Liabilities. The Fund is liable for any dividends payable on securities while those securities are in a short position and will also bear other costs, such as charges for the prime brokerage accounts, in connection with the short positions. These costs are reported as dividend expense and prime brokerage expense on securities sold short, respectively, in the Statements of Operations. As collateral for its short positions, the Fund is required under the Investment Company Act of 1940 (“1940 Act”) to maintain assets consisting of cash, cash equivalents or other liquid securities equal to the market value of the securities sold short. The deposits with brokers for securities sold short are reported on the Statements of Assets and Liabilities. The amount of collateral is required to be adjusted daily to reflect changes in the value of the securities sold short. To the extent Lyrical U.S. Hedged Value Fund invests the proceeds received from selling securities short, the Fund is engaging in a form of leverage. The use of leverage by the Fund may make any change in the Fund’s net asset value greater than it would be without the use of leverage. Short sales are speculative transactions and involve special risks, including greater reliance on the ability of Lyrical Asset Management LP (the “Adviser”) to accurately anticipate the future value of a security.
28
LYRICAL FUNDS |
The Fund typically takes short positions in shares of exchange-traded funds (“ETFs”), which are subject to additional risks including premium or discount risk (when the market value of an ETF’s shares trade at a premium or discount to the ETF’s net asset value) and index-tracking risk.
Estimates – The preparation of financial statements in conformity with GAAP requires management to make estimates and assumptions that affect the reported amounts of assets and liabilities and disclosure of contingent assets and liabilities as of the date of the financial statements and the reported amounts of income and expenses during the reporting period. Actual results could differ from those estimates.
Federal income tax – Each Fund has qualified and intends to continue to qualify as a regulated investment company under the Internal Revenue Code of 1986 (the “Code”). Qualification generally will relieve each Fund of liability for federal income taxes to the extent 100% of its net investment income and net realized capital gains are distributed in accordance with the Code. Accordingly, no provision for income tax has been made.
In order to avoid imposition of the excise tax applicable to regulated investment companies, it is also each Fund’s intention to declare as dividends in each calendar year at least 98% of its net investment income (earned during the calendar year) and 98.2% of its net realized capital gains (earned during the twelve months ended October 31) plus undistributed amounts from prior years.
The following information is computed on a tax basis for each item as of November 30, 2015:
| Lyrical U.S. Value Equity Fund | Lyrical U.S. Hedged Value Fund | ||||||
Tax cost of portfolio investments | $ | 640,597,468 | $ | 1,492,484 | ||||
Gross unrealized appreciation | $ | 71,722,379 | $ | 121,615 | ||||
Gross unrealized depreciation | (60,646,792 | ) | (181,933 | ) | ||||
Net unrealized appreciation (depreciation) | 11,075,587 | (60,318 | ) | |||||
Net unrealized depreciation on securities sold short | — | (17,680 | ) | |||||
Undistributed ordinary income | 1,278,084 | — | ||||||
Undistributed long-term gains | 16,354,762 | 11,243 | ||||||
Accumulated earnings (deficit) | $ | 28,708,433 | $ | (66,755 | ) | |||
As of November 30, 2015, the proceeds of securities sold short on a tax basis is $704,140 for Lyrical U.S. Hedged Value Fund.
29
LYRICAL FUNDS |
The difference between the federal income tax cost of portfolio investments and securities sold short and the financial statement cost of portfolio investments and securities sold short is due to certain timing differences in the recognition of capital gains or losses under income tax regulations and GAAP. These “book/tax” differences are temporary in nature and are primarily due to the tax deferral of losses on wash sales.
During the year ended November 30, 2015, Lyrical U.S. Value Equity Fund reclassified $5,693 of accumulated net realized gains against accumulated net investment income and Lyrical U.S. Hedged Value Fund reclassified $15,938 and $6,771 of accumulated net investment loss to paid-in-capital and accumulated net realized gains, respectively, on the Statements of Assets and Liabilities. Such reclassifications, the result of permanent differences between financial statement and income tax reporting requirements, had no effect on each Fund’s net assets or net asset value per share.
The Funds recognize the tax benefits or expenses of uncertain tax positions only when the position is “more likely than not” of being sustained assuming examination by tax authorities. Management has reviewed the Funds’ tax positions for all open tax periods (periods ended November 30, 2013 through November 30, 2015 for Lyrical U.S. Value Equity Fund and November 30, 2014 and November 30, 2015 for Lyrical U.S. Hedged Value Fund) and has concluded that no provision for unrecognized tax benefits or expenses is required in these financial statements. The Funds indentify their major tax jurisdiction as U.S. Federal.
3. Investment Transactions
During the year ended November 30, 2015, cost of purchases and proceeds from sales of investment securities, other than short-term investments and short positions, amounted to $249,203,431 and $137,244,347, respectively, for Lyrical U.S. Value Equity Fund and $298,651 and $91,799, respectively, for Lyrical U.S. Hedged Value Fund.
4. Transactions with Related Parties
INVESTMENT ADVISORY AGREEMENT
Each Fund’s investments are managed by the Adviser pursuant to the terms of an Investment Advisory Agreement. Lyrical U.S. Value Equity Fund and Lyrical U.S. Hedged Value Fund pay the Adviser an investment advisory fee, computed and accrued daily and paid monthly, at the annual rate of 1.25% and 1.55%, respectively, of average daily net assets.
30
LYRICAL FUNDS |
Pursuant to an Expense Limitation Agreement (“ELA”) between each Fund and the Adviser, the Adviser has contractually agreed, until March 31, 2017, to reduce investment advisory fees and reimburse other operating expenses to limit total annual fund operating expenses of the Funds (exclusive of brokerage costs, taxes, borrowing costs such as interest and dividend expenses on securities sold short, interest, acquired fund fees and expenses, extraordinary expenses such as litigation and merger or reorganization costs, and other expenses not incurred in the ordinary course of each Fund’s business) to an amount not exceeding the following percentages of average daily net assets attributable to each respective class:
Institutional Class | Investor Class | |
Lyrical U.S. Value Equity Fund | 1.45% | 1.70% |
Lyrical U.S. Hedged Value Fund | 1.75% | 2.00% |
Investment Advisory Fee Reductions | Expense Reimbursements | Total | |
Lyrical U.S. Value Equity Fund | $ — | $ 43,226 | $ 43,226 |
Lyrical U.S. Hedged Value Fund | $ 21,583 | $ 143,263 | $ 164,846 |
Under the terms of the ELA, investment advisory fee reductions and expense reimbursements by the Adviser are subject to recoupment by the Adviser for a period of three years after such fees and expenses were incurred, provided the recoupments do not cause total annual fund operating expenses of the Funds to exceed the foregoing expense limitations. During the year ended November 30, 2015, the Adviser recouped $182,903 of prior years’ investment advisory fee reductions and expense reimbursements from Lyrical U.S. Value Equity Fund. As of November 30, 2015, the Adviser may seek recoupment of investment advisory fee reductions and expense reimbursements no later than the dates as stated below:
November 30, 2017 | November 30, 2018 | Total | |
Lyrical U.S. Value Equity Fund | $ 10,189 | $ 14,881 | $ 25,070 |
Lyrical U.S. Hedged Value Fund | $ 59,418 | $ 164,846 | $ 224,264 |
The Principal Executive Officer of the Funds is also an officer of the Adviser.
31
LYRICAL FUNDS |
OTHER SERVICE PROVIDERS
Ultimus Fund Solutions, LLC (“Ultimus”) provides fund administration, fund accounting, compliance and transfer agency services to the Funds. Each Fund pays Ultimus fees in accordance with the agreements for such services. In addition, each Fund pays out-of-pocket expenses including but not limited to postage, supplies and costs of pricing its portfolio securities.
Under the terms of a Distribution Agreement with the Trust, Ultimus Fund Distributors, LLC (the “Distributor”) serves as the principal underwriter to each Fund. The Distributor is a wholly-owned subsidiary of Ultimus.
Certain Trustees and officers of the Trust are also officers of Ultimus and/or the Distributor.
DISTRIBUTION PLAN
The Funds have adopted plans of distribution (the “Plan”) pursuant to Rule 12b-1 under the 1940 Act, which permits Investor Class shares of each Fund to directly incur or reimburse the Funds’ principal underwriter for certain expenses related to the distribution of its shares. The annual limitation for payment of expenses pursuant to the Plan is 0.25% of each Fund’s average daily net assets allocable to Investor Class shares. The Funds have not adopted a plan of distribution with respect to the Institutional Class shares. During the year ended November 30, 2015, the Investor Class shares of Lyrical U.S. Value Equity Fund and Lyrical U.S. Hedged Value Fund incurred $213,950 and $1,681, respectively, of distribution fees under the Plan.
TRUSTEE COMPENSATION
Each Trustee who is not an “interested person” of the Trust (“Independent Trustee”) receives from each Fund a fee of $500 for each Board meeting attended plus reimbursement of travel and other meeting-related expenses. Effective January 1, 2015, each Independent Trustee also receives a $500 annual retainer from each Fund. Trustees affiliated with the Adviser or Ultimus are not compensated by the Trust for their services.
32
LYRICAL FUNDS |
PRINCIPAL HOLDERS OF FUND SHARES
As of November 30, 2015, the following shareholders owned of record 5% or more of the outstanding shares of each class of each Fund:
NAME OF RECORD OWNER | % Ownership |
Lyrical U.S. Value Equity Fund - Institutional Class | |
Charles Schwab & Company, Inc. (for the benefit of its customers) | 33% |
Merrill Lynch, Pierce Fenner & Smith (for the benefit of its customers) | 12% |
UBS Financial Services, Inc. (for the benefit of its customers) | 8% |
Lyrical U.S. Hedged Value Fund - Institutional Class | |
Lyrical Asset Management LP | 61% |
Ann S. Riesenberg | 24% |
George Wellington | 13% |
Lyrical U.S. Hedged Value Fund - Investor Class | |
Lyrical Asset Management LP | 76% |
Oppenheimer & Company, Inc. (for the benefit of its customers) | 6% |
A beneficial owner of 25% or more of either Fund’s outstanding shares may be considered a controlling person. That shareholder’s vote could have a more significant effect on matters presented at a shareholder’s meeting.
5. Sector Risk
If a Fund has significant investments in the securities of issuers within a particular sector, any development affecting that sector will have a greater impact on the value of the net assets of the Fund than would be the case if the Fund did not have significant investments in that sector. In addition, this may increase the risk of loss in the Fund and increase the volatility of the Fund’s net asset value per share. Occasionally, market conditions, regulatory changes or other developments may negatively impact a particular sector. As of November 30, 2015, Lyrical U.S. Value Equity Fund and Lyrical U.S. Hedged Value Fund had 27.5% and 28.1%, respectively, of the value of their net assets invested in stocks within the Information Technology sector.
6. Contingencies and Commitments
The Funds indemnify the Trust’s officers and Trustees for certain liabilities that might arise from their performance of their duties to the Funds. Additionally, in the normal course of business the Funds enter into contracts that contain a variety of representations and warranties and which provide general indemnifications. The Funds’ maximum exposure under these arrangements is unknown, as this would involve future claims that may be made against the Funds that have not yet occurred. However, based on experience, the Funds expect the risk of loss to be remote.
33
LYRICAL FUNDS |
7. Subsequent Events
The Funds are required to recognize in the financial statements the effects of all subsequent events that provide additional evidence about conditions that existed as of the date of the Statements of Assets and Liabilities. For non-recognized subsequent events that must be disclosed to keep the financial statements from being misleading, the Funds are required to disclose the nature of the event as well as an estimate of its financial effect, or a statement that such an estimate cannot be made. Management has evaluated subsequent events through the issuance of these financial statements and has noted no such events except for the payment of ordinary income dividends and long-term capital gain distributions subsequent to the end of the reporting period, as disclosed in Note 2.
34
LYRICAL FUNDS |
To the Board of Trustees of Ultimus Managers Trust and the Shareholders of Lyrical U.S. Value Equity Fund and Lyrical U.S. Hedged Value Fund
We have audited the accompanying statement of assets and liabilities of Lyrical U.S. Value Equity Fund, a series of shares of beneficial interest in Ultimus Managers Trust (the “Fund”), including the schedule of investments, as of November 30, 2015, and the related statement of operations for the year then ended, the statements of changes in net assets for each of the years in the two-year period then ended, and the financial highlights for each of the years in the two-year period then ended and for the period February 4, 2013 (commencement of operations) through November 30, 2013. We have also audited the accompanying statement of assets and liabilities of Lyrical U.S. Hedged Value Fund, a series of shares of beneficial interest in Ultimus Managers Trust (the “Fund”), including the schedule of investments, as of November 30, 2015, and the related statement of operations for the year then ended, and the statements of changes in net assets and the financial highlights for the year then ended and for the period July 14, 2014 (commencement of operations) through November 30, 2014. These financial statements and financial highlights are the responsibility of the Funds’ management. Our responsibility is to express an opinion on these financial statements and financial highlights based on our audits.
We conducted our audits in accordance with the standards of the Public Company Accounting Oversight Board (United States). Those standards require that we plan and perform the audits to obtain reasonable assurance about whether the financial statements and financial highlights are free of material misstatement. An audit includes examining, on a test basis, evidence supporting the amounts and disclosures in the financial statements. Our procedures included confirmation of securities owned as of November 30, 2015 by correspondence with the custodian and broker. An audit also includes assessing the accounting principles used and significant estimates made by management, as well as evaluating the overall financial statement presentation. We believe that our audits provide a reasonable basis for our opinion.
In our opinion, the financial statements and financial highlights referred to above present fairly, in all material respects, the financial position of Lyrical U.S. Value Equity Fund and Lyrical U.S. Hedged Value Fund as of November 30, 2015, and the results of their operations, the changes in their net assets, and their financial highlights for each of the years or periods presented, in conformity with accounting principles generally accepted in the United States of America.
| |
BBD, LLP |

Philadelphia, Pennsylvania
January 26, 2016
35
LYRICAL FUNDS |
We believe it is important for you to understand the impact of costs on your investment. As a shareholder of the Funds, you incur ongoing costs, including management fees, class-specific expenses (such as distribution fees) and other operating expenses. The following examples are intended to help you understand your ongoing costs (in dollars) of investing in the Funds and to compare these costs with the ongoing costs of investing in other mutual funds.
A mutual fund’s ongoing costs are expressed as a percentage of its average net assets. This figure is known as the expense ratio. The expenses in the table below are based on an investment of $1,000 made at the beginning of the most recent period (June 1, 2015) and held until the end of the period (November 30, 2015).
The table below illustrates each Fund’s ongoing costs in two ways:
Actual fund return – This section helps you to estimate the actual expenses that you paid over the period. The “Ending Account Value” shown is derived from each Fund’s actual return, and the fourth column shows the dollar amount of operating expenses that would have been paid by an investor who started with $1,000 in the Funds. You may use the information here, together with the amount you invested, to estimate the expenses that you paid over the period.
To do so, simply divide your account value by $1,000 (for example, an $8,600 account value divided by $1,000 = 8.6), then multiply the result by the number given for the Fund under the heading “Expenses Paid During Period.”
Hypothetical 5% return – This section is intended to help you compare each Fund’s ongoing costs with those of other mutual funds. It assumes that each Fund had an annual return of 5% before expenses during the period shown, but that the expense ratio is unchanged. In this case, because the return used is not the Funds’ actual return, the results do not apply to your investment. The example is useful in making comparisons because the U.S. Securities and Exchange Commission (“SEC”) requires all mutual funds to calculate expenses based on a 5% return. You can assess each Fund’s ongoing costs by comparing this hypothetical example with the hypothetical examples that appear in shareholder reports of other funds.
Note that expenses shown in the table are meant to highlight and help you compare ongoing costs only. The Funds do not charge transaction fees, such as purchase or redemption fees, nor do they carry a “sales load.”
The calculations assume no shares were bought or sold during the period. Your actual costs may have been higher or lower, depending on the amount of your investment and the timing of any purchases or redemptions.
36
LYRICAL FUNDS
ABOUT YOUR FUNDS’ EXPENSES (Unaudited) (Continued)
More information about the Funds’ expenses can be found in this report. For additional information on operating expenses and other shareholder costs, please refer to each Fund’s prospectus.
Beginning Account Value June 1, 2015 | Ending | Net Ratio(a) | Expenses Paid During Period(b) | |
Lyrical U.S. Value Equity Fund | ||||
Institutional Class | ||||
Actual | $1,000.00 | $923.20 | 1.39% | $6.70 |
Hypothetical 5% Return (before expenses) | $1,000.00 | $1,018.10 | 1.39% | $7.03 |
Investor Class | ||||
Actual | $1,000.00 | $921.30 | 1.69% | $8.14 |
Hypothetical 5% Return (before expenses) | $1,000.00 | $1,016.60 | 1.69% | $8.54 |
Lyrical U.S. Hedged Value Fund | ||||
Institutional Class | ||||
Actual | $1,000.00 | $ 922.00 | 3.30% | $15.90 |
Hypothetical 5% Return (before expenses) | $1,000.00 | $ 1,008.52 | 3.30% | $16.62 |
Investor Class | ||||
Actual | $1,000.00 | $920.80 | 3.55% | $17.09 |
Hypothetical 5% Return (before expenses) | $1,000.00 | $1,007.27 | 3.55% | $17.86 |
(a) | Annualized, based on the Fund's most recent one-half year expenses. |
(b) | Expenses are equal to the Funds' annualized expense ratio multiplied by the average account value over the period, multiplied by 183/365 (to reflect the one-half year period). |
37
LYRICAL FUNDS
OTHER INFORMATION (Unaudited)
A description of the policies and procedures that the Funds use to vote proxies relating to portfolio securities is available without charge upon request by calling toll-free 1-888-884-8099, or on the SEC’s website at http://www.sec.gov. Information regarding how the Funds voted proxies relating to portfolio securities during the most recent 12-month period ended June 30 is available without charge upon request by calling toll-free 1-888-884-8099, or on the SEC’s website at http://www.sec.gov.
The Trust files a complete listing of portfolio holdings for the Funds with the SEC as of the end of the first and third quarters of each fiscal year on Form N-Q. These filings are available upon request by calling 1-888-884-8099. Furthermore, you may obtain a copy of the filings on the SEC’s website at http://www.sec.gov. The Trust’s Forms N-Q may also be reviewed and copied at the SEC’s Public Reference Room in Washington, DC, and information on the operation of the Public Reference Room may be obtained by calling 1-800-SEC-0330.
FEDERAL TAX INFORMATION (Unaudited)
In accordance with federal tax requirements, the following provides shareholders with information concerning distributions from ordinary income and net realized gains made by each Fund during the fiscal year ended November 30, 2015. Certain dividends paid by the Funds may be subject to a maximum tax rate of 23.8%, as provided by the Jobs and Growth Tax Relief Reconciliation Act of 2003. Lyrical U.S. Value Equity Fund and Lyrical U.S. Hedged Value Fund intend to designate up to a maximum amount of $7,785,983 and $70, respectively, as taxed at a maximum rate of 23.8%. Additionally, Lyrical U.S. Value Equity Fund and Lyrical U.S. Hedged Value Fund intend to designate up to a maximum amount of $4,266,081 and $41, respectively, as a long-term capital gain distributions. As required by federal regulations, complete information was computed and reported in conjunction with your 2014 Form 1099-DIV.
38
LYRICAL FUNDS
BOARD OF TRUSTEES AND EXECUTIVE OFFICERS
(Unaudited)
Overall responsibility for management of the Funds rests with the Board of Trustees. The Trustees serve during the lifetime of the Trust and until its termination, or until death, resignation, retirement or removal. The Trustees, in turn, elect the officers of the Funds to actively supervise its day-to-day operations. The officers have been elected for an annual term. Unless otherwise noted, each Trustee’s and officer’s address is 225 Pictoria Drive, Suite 450, Cincinatti, Ohio 45246. The following are the Trustees and executive officers of the Funds as of January 26, 2016:
Name and | Length of Time Served | Position Held with the Trust | Principal | Number of Funds in Trust Overseen by Trustee | Directorships |
Interested Trustees: |
|
|
|
|
|
Robert G. Dorsey* | Since February 2012 | Trustee
President | Managing Director of Ultimus Fund Solutions, LLC and Ultimus Fund Distributors, LLC (1999 to present) | 21 | None |
Independent Trustees: |
|
|
|
|
|
Janine L. Cohen | Since January 2016 | Trustee | Retired since 2013; Chief Financial Officer from 2004 to 2013 and Chief Compliance Officer from 2008 to 2013 at AER Advisors, Inc. | 21 | None |
John C. Davis | Since June 2012 | Chairman
Trustee | Consultant since May 2011; Retired Partner of PricewaterhouseCoopers LLP (1974-2010) | 21 | None |
39
LYRICAL FUNDS
BOARD OF TRUSTEES AND EXECUTIVE OFFICERS
(Unaudited) (Continued)
Name and | Length of Time Served | Position Held with the Trust | Principal | Number of Funds in Trust Overseen by Trustee | Directorships |
David M. Deptula | Since June 2012 | Trustee | Vice President of Legal and Special Projects at Dayton Freight Lines, Inc. since February 2016; Vice President of Tax at The Standard Register Company from 2011 to 2016; Tax Partner at Deloitte Tax LLP from 1984 to 2011 | 21 | None |
John J. Discepoli | Since June 2012 | Trustee | Owner of Discepoli Financial Planning, LLC (personal financial planning company) since November 2004 | 21 | None |
* | Mr. Dorsey is considered an “interested person” of the Trust within the meaning of Section 2(a)(19) of the 1940 Act, as amended, because of his relationship with the Trust’s administrator, transfer agent and distributor. |
Name and | Length of Time | Position Held | Principal Occupation(s) |
Executive Officers: | |||
Andrew B. Wellington 405 Park Avenue, 6th Floor, | Since January 2013 | Principal Executive Officer of Lyrical U.S. Value Equity Fund and Lyrical U.S. Hedged Value Fund | Managing Director of Lyrical Asset Management LP (2008 to present) |
40
LYRICAL FUNDS
BOARD OF TRUSTEES AND EXECUTIVE OFFICERS
(Unaudited) (Continued)
Name and | Length of Time | Position Held | Principal Occupation(s) |
David R. Carson | Since April 2013 | President
Vice President | Vice President and Director of Client Strategies of Ultimus Fund Solutions, LLC (2013 to present); Chief Compliance Officer, FSI LBAR Fund (2013 to present); Chief Compliance Officer, The Huntington Funds (2005 to 2013), The Flex-Funds (2006 to 2011), Meeder Financial (2007 to 2011), Huntington Strategy Shares (2012 to 2013), and Huntington Asset Advisors (2013); Vice President, Huntington National Bank (2001 to 2013). |
Jennifer L. Leamer | Since April 2014 | Treasurer
Assistant Treasurer | Vice President, Mutual Fund Controller of Ultimus Fund Solutions, LLC (2014 to present); Business Analyst of Ultimus Fund Solutions, LLC (2007 to 2014) |
Bo J. Howell | Since October 2014 | Secretary (April 2015 to present); Assistant Secretary (October 2014 to April 2015) | Vice President, Director of Fund Administration for Ultimus Fund Solutions, LLC (2014 to present); Counsel – Securities and Mutual Funds for Western & Southern Financial Group (2012 to 2014); U.S. Securities and Exchange Commission, Senior Counsel (2009 to 2012) |
Charles C. Black Year of Birth: 1979 | Since April 2015 | Chief Compliance Officer (January 2016 to present)
Assistant Chief Compliance Officer (April 2015 to January 2016) | Senior Compliance Officer of Ultimus Fund Solutions, LLC (2015 to present); Senior Compliance Manager for Touchstone Mutual Funds (2013 to 2015); Senior Compliance Manager for Fund Evaluation Group (2011 to 2013); Regulatory Administration Specialist for JPMorgan Chase Bank (2006 to 2011) |
Additional information about members of the Board and executive officers is available in each Fund’s Statement of Additional Information (“SAI”). To obtain a free copy of the SAI, please call 1-888-884-8099.
41
LYRICAL FUNDS
DISCLOSURE REGARDING APPROVAL OF INVESTMENT ADVISORY AGREEMENT (Unaudited)
The Board of Trustees (the “Board”), including the Independent Trustees voting separately, has reviewed and approved each Fund’s Investment Advisory Agreement with Lyrical Asset Management LP (the “Adviser”) for an additional annual term. Approval took place at an in-person meeting held on October 20, 2015, at which all of the Trustees were present.
In the course of their deliberations, the Board was advised by legal counsel. The Board received and reviewed a substantial amount of information provided by the Adviser in response to requests of the Board and its counsel.
In considering the Investment Advisory Agreement and reaching their conclusions with respect thereto, the Board reviewed and analyzed various factors that they determined were relevant, including the factors described below.
The nature, extent, and quality of the services provided by the Adviser. In this regard, the Board reviewed the services being provided by the Adviser to the Funds including, without limitation, its investment advisory services since each Fund’s inception, the Adviser’s compliance procedures and practices, and its efforts to promote the Funds, and assist in their distribution. The Board also noted that the Funds’ Principal Executive Officer is an employee of the Adviser and serves the Funds without additional compensation. After reviewing the foregoing information and further information regarding the Adviser’s business, the Board concluded that the quality, extent, and nature of the services provided by the Adviser were satisfactory and adequate for the Funds.
The investment performance of the Funds. In this regard, the Board compared the performance of each Fund with the performance of its benchmark index, custom peer group, and Morningstar categories. The Board also considered the consistency of the Adviser’s management with each Fund’s investment objective and policies. Following discussion of the investment performance of each Fund, the Adviser’s experience in managing mutual funds, private funds, and separate accounts, its historical investment performance, and other factors, the Board concluded that the investment performance of each Fund has been satisfactory.
The costs of the services provided and profits realized by the Adviser and its affiliates from its relationship with the Funds. In this regard, the Board considered the Adviser’s staffing and methods of operating; the education and experience of its personnel; its compliance program; its financial condition and the level of commitment to the Funds; the asset level of each Fund; the overall expenses of each Fund, including the advisory fee; and the differences in fees and services to the Adviser’s other similar clients. The Board discussed the Adviser’s Expense Limitation Agreement (the “ELA”) with the Funds, and considered the Adviser’s current and past fee reductions and expense reimbursements for the Funds. The Board further took into account the Adviser’s willingness to continue the ELA for the Funds until at least March 31, 2017.
42
LYRICAL FUNDS
DISCLOSURE REGARDING APPROVAL OF INVESTMENT ADVISORY AGREEMENT (Unaudited) (Continued)
The Board also considered potential benefits for the Adviser in managing the Funds, including promotion of the Adviser’s name. The Board compared each Fund’s advisory fee and overall expense ratio to the average and median advisory fees and expense ratios for its peer group and Morningstar categories and fees charged to the Adviser’s other client accounts. In considering the comparison in fees and expense ratios between the Funds and other comparable funds, the Board looked at the differences in types of funds being compared, the style of investment management, the size of the Funds, and the nature of the investment strategies. The Board noted that each Fund’s advisory fee was higher than the average advisory fee for the Fund’s peer group and Morningstar category. The Board also considered the Adviser’s commitment to limit each Fund’s expenses under the ELA. The Board further noted that the overall expense ratios for each Fund was higher than the average and median expense ratio for the Fund’s peer group and Morningstar category. The Board also compared the fees paid by each Fund to the fees paid by other clients of the Adviser, and considered the similarities and differences of services received by such other clients as compared to the services provided to the Fund. Following these comparisons and upon further consideration of the foregoing, the Board concluded that for each Fund the advisory fees paid to the Adviser by each Fund were fair and reasonable.
The extent to which economies of scale would be realized as the Funds grow and whether advisory fee levels reflect these economies of scale for the benefit of the Funds’ investors. In this regard, the Board considered that for each Fund the fee arrangements with the Adviser involve both the advisory fee and the ELA. The Board determined that while the advisory fee for each Fund remains the same as asset levels increase, the shareholders of the Lyrical U.S. Value Equity Fund have experienced benefits from the ELA and shareholders of the Lyrical U.S. Hedged Value Fund will continue to experience benefits from the ELA until the Fund’s assets grow to a level where its expenses otherwise fall below the expense limit. Following further consideration of the asset levels for each Fund, expectations for growth, and level of fees, the Board determined that the fee arrangements with the Adviser will continue to provide benefits and that each Fund’s arrangements were fair and reasonable in relation to the nature and quality of services being provided by the Adviser.
Brokerage and portfolio transactions. In this regard, the Board considered the Adviser’s policies and procedures and performance in seeking best execution for its clients, including the Funds. The Board also considered the historical portfolio turnover rate for each Fund; the process by which evaluations are made of the overall reasonableness of commissions paid; the method and basis for selecting and evaluating broker-dealers; and any anticipated allocation of portfolio business to persons affiliated with the Adviser. After further review and discussion, the Board determined that the Adviser’s practices regarding brokerage and portfolio transactions are satisfactory.
43
LYRICAL FUNDS
DISCLOSURE REGARDING APPROVAL OF INVESTMENT ADVISORY AGREEMENT (Unaudited) (Continued)
Possible conflicts of interest. In evaluating the possibility for conflicts of interest, the Board considered such matters as the experience and abilities of the advisory personnel assigned to the Funds; the Adviser’s process for allocating trades among the Funds and its other clients; and the substance and administration of the Adviser’s code of ethics. Following further consideration and discussion, the Board found that the Adviser’s standards and practices relating to the identification and mitigation of potential conflicts of interests were satisfactory.
Conclusion
After full consideration of the above factors as well as other factors, the Board unanimously concluded that approval of the continuance of the Investment Advisory Agreement was in the best interests of each Fund and its shareholders.
44
This page intentionally left blank.

RYAN LABS CORE BOND FUND
(RLCBX)
RYAN LABS LONG CREDIT FUND
(RLLCX)
Annual Report
November 30, 2015
RYAN LABS FUNDS | December 14, 2015 |
Dear Shareholders,
Following is the Annual Report to shareholders of Ryan Labs Core Bond Fund and Ryan Labs Long Credit Fund (collectively, the “Funds”) for the periods ended November 30, 2015. On behalf of the investment manager, Ryan Labs Asset Management, Inc., we would like to thank you for your continued investment.
MARKET SUMMARY
Most of the second half of 2015 was extremely volatile in both equity and credit markets. Spreads widened throughout the quarter with names in energy, metals, and mining companies trading at some of their widest spreads over the past 5 years, propelled by volatility in commodity prices. After West Texas Intermediate crude oil recovered to about $60 per barrel in the first half of 2015, the price plunged all the way to $38.24 per barrel in August. Copper, which saw highs of the year in May at $2.95 per pound, was near an annual low by November at $2.04 per pound. Commodities have continued to retest their yearly lows. There has also been pushback by credit investors on corporate fundamentals, particularly in non-financial credit. Leverage, measured a number of different ways such as Debt/EBITDA, is even higher than 2007 levels in non-financial corporates. Low all-in yields at this stage of the credit cycle have continued to attract debt issuance and debt-fueled merger and acquisition activity, while top line growth at many firms has been low. Year to date through November 30, 2015, issuance in the investment-grade corporate debt market was $1.17 trillion, with financials and health care issuers leading the debt market. The mortgage and securitized sectors came under increased pressure along with other risk sectors and actually underperformed corporate bonds with similar ratings.
RYAN LABS CORE BOND FUND
INVESTMENT PHILOSOPHY
The investment objective of Ryan Labs Core Bond Fund (the “Core Bond Fund”) is to seek total return (consisting of current income and capital appreciation) versus the Barclays U.S. Aggregate Bond Index (the “Core Bond Benchmark”). The Core Bond Fund seeks this investment objective while providing protection against interest rate risk. We attempt to accomplish this investment objective by investing at least 80% of Core Bond Fund assets in U.S. dollar-denominated, investment-grade debt securities. The portfolio’s sensitivity to interest rate changes is intended to track the market for domestic, investment-grade fixed-income securities. The modified duration of the Core Bond Fund’s investment portfolio at the end of each calendar month will typically be within half a year of the Core Bond Benchmark. The primary strategies utilized for value-add are sector rotation, issue selection, and yield curve positioning.
1
PERFORMANCE SUMMARY
From the Core Bond Fund’s inception on December 29, 2014 through November 30, 2015, the Fund returned +0.81% compared to the Core Bond Benchmark return of +1.04%, therefore underperforming the Benchmark by 0.23%. For the fiscal quarter ended November 30, 2015, the portfolio returned +0.38% versus the benchmark return of +0.43%.
PERFORMANCE DISCUSSION
The Core Bond Fund’s portfolio was overweight corporate bonds and securitized products relative to the Core Bond Benchmark. The portfolio was underweight U.S. Treasuries and government-related securities. October and November were the strongest months in the Corporate Credit market in the second half of the year, posting positive excess returns relative to duration-neutral Treasuries. The 10-year U.S. Treasury traded at a high of 2.49% in June, fell to 1.97% in October, and finally rebounded to 2.20% at the end of November. The year-to-date excess returns, versus duration-neutral U.S. Treasuries, was -1.09% for the Barclays Credit Index and -3.47% for Barclays Long Credit Index. For a historical context, investment grade, fixed income credit spreads in the Core Bond Benchmark ended 2011 at 217 basis points (“bps”), 2012 at 133bps, tightened to 111bps at the end of 2013, widened to 125 bps at the end of 2014, and were at 140 bps at the end of November 2015. Spreads on Financials sector credits ended November 2015 at 129 bps compared to 119 bps in May 2015 and 117 bps at the end of 2014. Industrials sector credit spreads widened to 170 bps in November 2015 from 141 bps at the end of May 2015. Year to date, agency mortgage-backed securities (“MBS”) underperformed duration-neutral U.S. Treasuries by -15 bps, while commercial MBS outperformed by 42 bps and asset-backed securities (“ABS”) outperformed by 55bps.
RYAN LABS LONG CREDIT FUND
INVESTMENT PHILOSOPHY
The investment objective of Ryan Labs Long Credit Fund (the “Long Credit Fund”) is to seek total return (consisting of current income and capital appreciation). The benchmark for this strategy is the Barclays U.S. Long Credit Index (the “Long Credit Benchmark”). We attempt to accomplish this investment objective by investing at least 80% of the Long Credit Fund’s assets in U.S. dollar-denominated investment-grade debt securities. The portfolio’s sensitivity to interest rate changes is intended to track the market for domestic, investment-grade fixed-income securities. The modified duration of the Long Credit Fund’s investment portfolio at the end of each calendar month will typically be within half a year of the Long Credit Benchmark. The primary strategies utilized for value-add are sector rotation, issue selection, and yield curve positioning.
PERFORMANCE SUMMARY
The inception date of the Long Credit Fund was November 13, 2015. The Long Credit Fund’s total return from inception through November 30, 2015 was 0.71% compared to the Long Credit Benchmark return of 1.08%, therefore underperforming the benchmark by 0.37%. This underperformance was due to uninvested cash in the Fund during the period from Fund launch to November 30, 2015, as the Fund’s assets were allocated to investments.
2
OUTLOOK
For both Funds, in terms of domestic and global economic growth, we could see subdued nominal and real growth worldwide as Asian, emerging, and developed market economies struggle with aging demographics, relative currency valuations, high public and private debt loads, severe declines in commodities, and imbalanced fiscal and economic policies. “Lower-for-longer” and the anticipated increase in the Federal Funds rate should lead to a modest flattening in the yield curve. This projected outcome should be supportive for the U.S. Dollar and to the detriment of those sectors and companies with a larger component of U.S. export operations. Equity valuations appear stretched on traditional fundamental metrics, but will likely remain supported by share buybacks, dividends, and merger and acquisition activity. Spreads have cheapened for the past year and a half with intermittent periods of rallies due to fundamental shifts in the corporate landscape and a solid backdrop technically. Almost $1.17 trillion in investment grade corporate debt supply has been priced in 2015 with similar expectations for next year. Net supply is forecast to be in the mid-$500 billion range, so if demand flows continue into the asset class, gross supply should be absorbed at expected spread levels. Relative value opportunity continues in the financials sector, while challenged sectors such as Basic Materials and Energy will remain an area of concern for investors. Absolute and excess return potential is expected to be lower in this rate environment. As to investment grade corporate bonds, the last twelve months have experienced a secular move wider in spreads versus Treasuries, meaning corporate credit has underperformed U.S. Treasury securities. Although this has been an across-the-board move, certainly energy and basic materials credits have performed the worst in the face of lower commodity prices. There are likely investment opportunities here but it’s futile to attempt to pick a bottom. In addition, the spread between A-rated and BBB-rated corporates are at a seven year wide. The only other times in the last 20 years that this spread was wider was the last two recessions.
For the Core Bond Fund, in the government-backed mortgage sectors, the Federal Reserve Board has continued to taper and has stopped reinvesting the cash flow and allowing the portfolio to run off. There is also increased discussion on merging Fannie Mae and Freddie Mac into one entity. We actually prefer the wider levels and higher yields prevailing in the market place today as we believe this will offset rising Treasury rates. For 2016, we could expect higher issuance in ABS and credit risk transfer mortgage debt and lower net supply in commercial MBS as bonds continue to mature. We believe the structured risk sector is poised to outperform corporate credit as we move into 2016 after having lagged in the past quarter.

Sean McShea
President, Ryan Labs Asset Management
3
Past performance is not predictive of future performance. Investment results and principal value will fluctuate so that shares, when redeemed, may be worth more or less than their original cost. Current performance may be higher or lower than the performance data quoted. Performance data current to the most recent month end are available by calling 1-866-561-3087.
An investor should consider the investment objectives, risks, charges and expenses of the Funds carefully before investing. The Funds’ prospectus contains this and other important information. To obtain a copy of the Funds’ prospectus, please visit our website at www.ryanlabsfunds.com or call 1-866-561-3087 and a copy will be sent to you free of charge. Please read the prospectus carefully before you invest. Ryan Labs Core Bond Fund and Ryan Labs Long Credit Fund are distributed by Ultimus Fund Distributors, LLC.
The Letter to Shareholders seeks to describe some of the Adviser’s current opinions and views of the financial markets. Although the Adviser believes it has a reasonable basis for any opinions or views expressed, actual results may differ, sometimes significantly so, from those expected or expressed. The securities held by the Funds that are discussed in the Letter to Shareholders were held during the period covered by this Report. They do not comprise the entire investment portfolios of the Funds, may be sold at any time and may no longer be held by the Funds. The opinions of the Funds’ Adviser with respect to those securities may change at any time.
Statements in the Letter to Shareholders that reflect projections or expectations for future financial or economic performance of the Funds and the market in general and statements of the Funds’ plans and objectives for future operations are forward-looking statements. No assurance can be given that actual results or events will not differ materially from those projected, estimated, assumed, or anticipated in any such forward-looking statements. Important factors that could result in such differences, in addition to factors noted with such forward-looking statements include, without limitation, general economic conditions, such as inflation, recession, and interest rates. Past performance is not a guarantee of future results.
4
RYAN LABS CORE BOND FUND
PERFORMANCE INFORMATION
November 30, 2015 (Unaudited)
Comparison of the Change in Value of a $10,000 Investment in
Ryan Labs Core Bond Fund versus the
Barclays U.S. Aggregate Bond Index
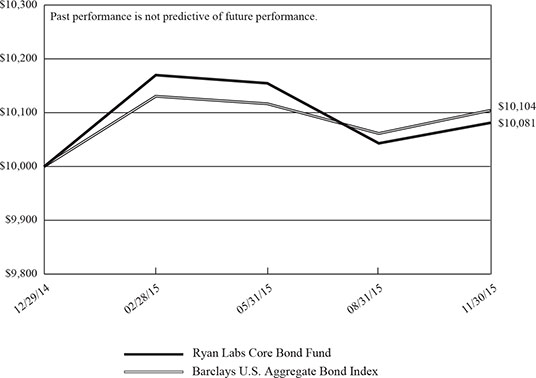
Total Returns | |
Since | |
Ryan Labs Core Bond Fund(a) | 0.81% |
Barclays U.S. Aggregate Bond Index | 1.04% |
(a) | The Fund’s total return does not reflect the deduction of taxes that a shareholder would pay on Fund distributions, if any, or the redemption of shares. |
(b) | The Fund commenced operations on December 29, 2014. |
5
RYAN LABS LONG CREDIT FUND
PERFORMANCE INFORMATION
November 30, 2015 (Unaudited)
Comparison of the Change in Value of a $10,000 Investment in
Ryan Labs Long Credit Fund versus the Barclays U.S. Long Credit Index
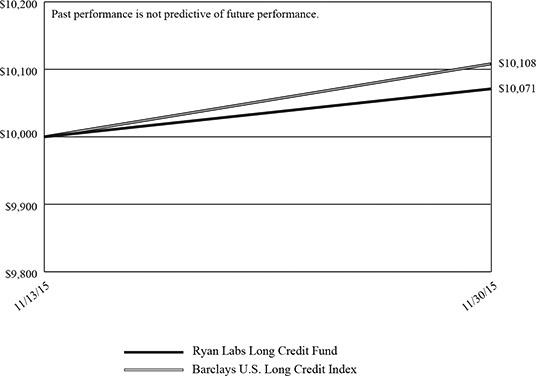
Total Returns | |
Since | |
Ryan Labs Long Credit Fund(a) | 0.71% |
Barclays U.S. Long Credit Index | 1.08% |
(a) | The Fund’s total return does not reflect the deduction of taxes that a shareholder would pay on Fund distributions, if any, or the redemption of shares. |
(b) | The Fund commenced operations on November 13, 2015. |
6
RYAN LABS CORE BOND FUND
PORTFOLIO INFORMATION
November 30, 2015 (Unaudited)
Asset Allocation (% of Net Assets)
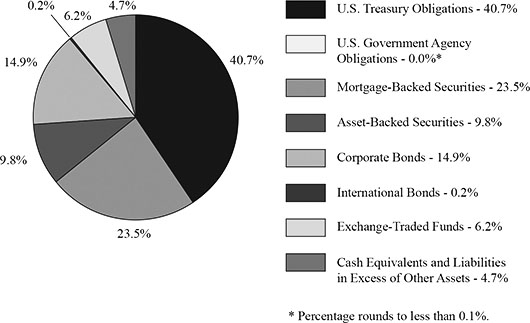
Top 10 Holdings**
Security Description | % of |
U.S. Treasury Notes, 0.750%, due 10/31/17 | 13.9% |
U.S. Treasury Notes, 1.375%, due 10/31/20 | 11.2% |
U.S. Treasury Bonds, 4.500%, due 02/15/36 | 9.6% |
iShares iBoxx $ Investment Grade Corporate Bond ETF | 6.2% |
Federal National Mortgage Association, Pool #AB5379, 3.500%, due 06/01/42 | 2.7% |
Santander Drive Auto Receivables Trust, Series 2014-4, Class D, 3.100%, due 11/16/20 | 2.2% |
U.S. Treasury Notes, 2.250%, due 11/15/25 | 1.9% |
UBS-Citigroup Commercial Mortgage Trust, Series 2011-C1, Class E, 144A, 6.084%(a), due 01/10/45 | 1.5% |
WF-RBS Commercial Mortgage Trust, Series 2011-C2, Class D, 144A, 5.468%(a), due 02/15/44 | 1.5% |
Commercial Mortgage Trust, Series 2014-KY0, Class E, 144A, 2.547%(a), due 06/11/27 | 1.5% |
** | Excludes cash equivalents. |
(a) | Variable rate security. The rate shown is the effective interest rate as of November 30, 2015. |
7
RYAN LABS LONG CREDIT FUND
PORTFOLIO INFORMATION
November 30, 2015 (Unaudited)
Asset Allocation (% of Net Assets)
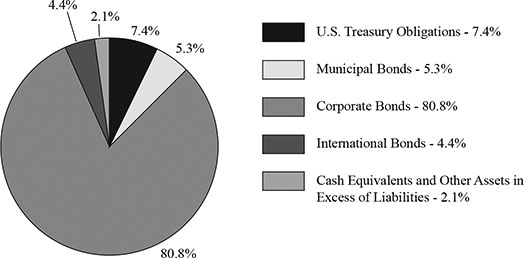
Top 10 Holdings
Security Description | % of |
U.S. Treasury Notes, 2.250%, due 11/15/25 | 6.3% |
Verizon Communications, Inc., 5.050%, due 03/15/34 | 4.0% |
GE Capital International Funding Company, 144A, 4.418%, due 11/15/35 | 3.0% |
AT&T, Inc., 4.500%, due 05/15/35 | 2.8% |
Wells Fargo & Company, 4.300%, due 07/22/27 | 2.6% |
Microsoft Corporation, 4.200%, due 11/03/35 | 2.1% |
Lockheed Martin Corporation, 4.700%, due 05/15/46 | 2.0% |
Citigroup, Inc., 4.450%, due 09/29/27 | 2.0% |
21st Century Fox America, Inc., 144A, 4.950%, due 10/15/45 | 2.0% |
Novartis Capital Corporation, 4.000%, due 11/20/45 | 2.0% |
8
RYAN LABS CORE BOND FUND |
U.S. TREASURY OBLIGATIONS — 40.7% | Coupon | Maturity | Par Value | Value | |||||||||
U.S. Treasury Notes — 30.6% | |||||||||||||
U.S. Treasury Notes | 0.750% |
| 10/31/17 | $ | 9,825,000 | $ | 9,790,838 | ||||||
U.S. Treasury Notes | 1.000% |
| 11/30/19 | 250,000 | 245,156 | ||||||||
U.S. Treasury Notes | 1.375% |
| 08/31/20 | 165,000 | 163,008 | ||||||||
U.S. Treasury Notes | 1.375% |
| 09/30/20 | 170,000 | 167,755 | ||||||||
U.S. Treasury Notes | 1.375% |
| 10/31/20 | 7,950,000 | 7,841,928 | ||||||||
U.S. Treasury Notes | 2.250% |
| 04/30/21 | 160,000 | 163,963 | ||||||||
U.S. Treasury Notes | 2.000% |
| 10/31/21 | 55,000 | 55,415 | ||||||||
U.S. Treasury Notes | 1.875% |
| 11/30/21 | 25,000 | 24,996 | ||||||||
U.S. Treasury Notes | 1.875% |
| 10/31/22 | 750,000 | 744,170 | ||||||||
U.S. Treasury Notes | 2.000% |
| 02/15/23 | 40,000 | 39,986 | ||||||||
U.S. Treasury Notes | 1.750% |
| 05/15/23 | 170,000 | 166,454 | ||||||||
U.S. Treasury Notes | 2.000% |
| 02/15/25 | 430,000 | 422,257 | ||||||||
U.S. Treasury Notes | 2.125% |
| 05/15/25 | 125,000 | 123,936 | ||||||||
U.S. Treasury Notes | 2.000% |
| 08/15/25 | 225,000 | 220,509 | ||||||||
U.S. Treasury Notes | 2.250% |
| 11/15/25 | 1,305,000 | 1,308,722 | ||||||||
21,479,093 | |||||||||||||
U.S. Treasury Bonds — 10.1% | |||||||||||||
U.S. Treasury Bonds | 4.500% |
| 02/15/36 | 5,255,000 | 6,766,837 | ||||||||
U.S. Treasury Bonds | 2.500% |
| 02/15/45 | 80,000 | 72,000 | ||||||||
U.S. Treasury Bonds | 3.000% |
| 05/15/45 | 295,000 | 294,723 | ||||||||
7,133,560 | |||||||||||||
Total U.S. Treasury Obligations (Cost $28,526,580) | $ | 28,612,653 | |||||||||||
U.S. GOVERNMENT AGENCY OBLIGATIONS — 0.0% (a) | Coupon | Maturity | Par Value | Value | |||||||||
Federal National Mortgage Association — 0.0% (a) | |||||||||||||
Federal National Mortgage Association (Cost $30,157) | 1.125% |
| 04/27/17 | $ | 30,000 | $ | 30,121 | ||||||
9
RYAN LABS CORE BOND FUND |
MORTGAGE-BACKED SECURITIES — 23.5% | Coupon | Maturity | Par Value | Value | |||||||||
Commercial — 11.4% | |||||||||||||
Commercial Mortgage Trust, | 2.196% |
| 06/11/27 | $ | 45,000 | $ | 44,530 | ||||||
Commercial Mortgage Trust, | 2.547% |
| 06/11/27 | 1,045,000 | 1,035,976 | ||||||||
Commercial Mortgage Trust, | 4.573% |
| 10/15/45 | 20,000 | 18,939 | ||||||||
Commercial Mortgage Trust, | 3.282% |
| 01/10/46 | 49,000 | 49,475 | ||||||||
Credit Suisse Mortgage Trust, | 2.500% |
| 05/25/43 | 509,855 | 486,613 | ||||||||
CSAIL Commercial Mortgage Trust, Series 2015-C3, Class C (b) | 4.362% |
| 08/15/48 | 180,000 | 171,806 | ||||||||
CSAIL Commercial Mortgage Trust, Series 2015-C3, Class D (b) | 3.362% |
| 08/15/48 | 160,000 | 121,952 | ||||||||
CSAIL Commercial Mortgage Trust, Series 2015-C1, Class C (b) | 4.301% |
| 04/15/50 | 275,000 | 266,834 | ||||||||
CSAIL Commercial Mortgage Trust, Series 2015-C2, Class D (b) | 4.212% |
| 06/15/57 | 80,000 | 65,088 | ||||||||
FREMF Mortgage Trust, Series 2015-K50, Class B (b) (c) | 3.778% |
| 08/25/25 | 1,000,000 | 867,047 | ||||||||
J.P. Morgan Chase Commercial Mortgage Securities Corporation, Series 2010-C2, Class D, 144A (b) | 5.542% |
| 11/15/43 | 25,000 | 26,149 | ||||||||
J.P. Morgan Chase Commercial Mortgage Securities Corporation, Series 2013-C13, Class C (b) | 4.055% |
| 01/15/46 | 410,000 | 403,418 | ||||||||
J.P. Morgan Chase Commercial Mortgage Securities Corporation, Series 2013-C17, Class C (b) | 4.887% |
| 01/15/47 | 390,000 | 399,490 | ||||||||
J.P. Morgan Chase Commercial Mortgage Securities Corporation, Series 2014-C19, Class C (b) | 4.676% |
| 04/15/47 | 240,000 | 240,946 | ||||||||
J.P. Morgan Chase Commercial Mortgage Securities Corporation, Series 2012-LC9, Class C, 144A (b) | 4.420% |
| 12/15/47 | 20,000 | 20,181 | ||||||||
J.P. Morgan Chase Commercial Mortgage Securities Corporation, Series 2012-LC9, Class E, 144A (b) | 4.567% |
| 12/15/47 | 711,000 | 670,685 | ||||||||
J.P. Morgan Chase Commercial Mortgage Securities Corporation, Series 2015-C28, Class C (b) | 4.240% |
| 10/15/48 | 195,000 | 176,263 | ||||||||
Starwood Retail Property Trust, Series 2014-STAR, Class C, 144A (b) | 2.695% |
| 11/15/27 | 45,000 | 44,832 | ||||||||
10
RYAN LABS CORE BOND FUND |
MORTGAGE-BACKED | Coupon | Maturity | Par Value | Value | |||||||||
Commercial — 11.4% (Continued) | |||||||||||||
UBS-Citigroup Commercial Mortgage Trust, Series 2011-C1, Class E, 144A (b) | 6.084% |
| 01/10/45 | $ | 1,000,000 | $ | 1,088,138 | ||||||
Wells Fargo Home Equity Trust, Series 2005-4, Class M1 (b) | 0.656% |
| 12/25/35 | 730,000 | 696,204 | ||||||||
WF-RBS Commercial Mortgage Trust, Series 2011-C2, Class D, 144A (b) | 5.468% |
| 02/15/44 | 1,000,000 | 1,070,271 | ||||||||
WF-RBS Commercial Mortgage Trust, Series 2012-C10, Class D, 144A (b) | 4.456% |
| 12/15/45 | 25,000 | 23,744 | ||||||||
7,988,581 | |||||||||||||
Federal Home Loan Mortgage Corporation — 3.8% | |||||||||||||
Federal Home Loan Mortgage Corporation, Pool #J19087 | 3.000% |
| 05/01/27 | 432,288 | 448,103 | ||||||||
Federal Home Loan Mortgage Corporation, Pool #G18481 | 3.000% |
| 09/01/28 | 315,993 | 327,552 | ||||||||
Federal Home Loan Mortgage Corporation, Pool #A93093 | 4.500% |
| 07/01/40 | 147,771 | 161,608 | ||||||||
Federal Home Loan Mortgage Corporation, Pool #Q19470 | 3.000% |
| 06/01/43 | 251,047 | 252,344 | ||||||||
Federal Home Loan Mortgage Corporation, Pool #Q20576 | 3.000% |
| 08/01/43 | 444,177 | 446,327 | ||||||||
Federal Home Loan Mortgage Corporation, Pool #G08572 | 3.500% |
| 02/01/44 | 192,530 | 199,192 | ||||||||
Federal Home Loan Mortgage Corporation, Pool #G08677 | 4.000% |
| 11/01/45 | 805,115 | 853,427 | ||||||||
2,688,553 | |||||||||||||
Federal National Mortgage Association — 8.0% | |||||||||||||
Federal National Mortgage Association, Series 2015-M7, Class AB2 | 2.502% |
| 12/25/24 | 80,000 | 78,959 | ||||||||
Federal National Mortgage Association, Pool #AJ7494 | 3.000% |
| 12/01/26 | 299,933 | 311,613 | ||||||||
Federal National Mortgage Association, Pool #AB5490 | 3.000% |
| 06/01/27 | 110,240 | 114,530 | ||||||||
Federal National Mortgage Association, Pool #AO7976 | 3.000% |
| 06/01/27 | 112,114 | 116,495 | ||||||||
Federal National Mortgage Association, Pool #AL3773 | 3.000% |
| 06/01/28 | 121,317 | 126,063 | ||||||||
Federal National Mortgage Association, Pool #AB5379 | 3.500% |
| 06/01/42 | 1,833,543 | 1,903,355 | ||||||||
Federal National Mortgage Association, Pool #AB6670 | 3.000% |
| 10/01/42 | 225,812 | 227,590 | ||||||||
11
RYAN LABS CORE BOND FUND |
MORTGAGE-BACKED | Coupon | Maturity | Par Value | Value | |||||||||
Federal National Mortgage Association — 8.0% (Continued) | |||||||||||||
Federal National Mortgage Association, Pool #AB9350 | 3.000% |
| 05/01/43 | $ | 200,556 | $ | 201,947 | ||||||
Federal National Mortgage Association, Pool #AB9345 | 3.000% |
| 05/01/43 | 476,001 | 479,309 | ||||||||
Federal National Mortgage Association, Pool #AB9558 | 3.000% |
| 06/01/43 | 466,740 | 469,977 | ||||||||
Federal National Mortgage Association, Pool #AE0443 | 6.500% |
| 06/01/43 | 36,103 | 41,378 | ||||||||
Federal National Mortgage Association, Pool #AT5860 | 3.500% |
| 06/01/43 | 844,259 | 876,073 | ||||||||
Federal National Mortgage Association, Pool #AL4010 | 3.500% |
| 07/01/43 | 204,065 | 212,225 | ||||||||
Federal National Mortgage Association, Pool #AL5625 | 3.500% |
| 03/01/44 | 126,355 | 131,318 | ||||||||
Federal National Mortgage Association, Pool #AL5538 | 4.000% |
| 07/01/44 | 97,585 | 104,210 | ||||||||
Federal National Mortgage Association, Pool #AS5165 | 3.000% |
| 06/01/45 | 232,764 | 234,093 | ||||||||
5,629,135 | |||||||||||||
Government National Mortgage Association — 0.3% | |||||||||||||
Government National Mortgage Association, Pool #5175 | 4.500% |
| 09/20/41 | 139,403 | 151,717 | ||||||||
Government National Mortgage Association, Series 2014-14, Class BL | 2.750% |
| 04/16/46 | 36,917 | 37,326 | ||||||||
Government National Mortgage Association, Series 2014-75, Class AC | 2.546% |
| 06/16/53 | 33,936 | 34,346 | ||||||||
223,389 | |||||||||||||
Total Mortgage-Backed Securities (Cost $16,602,136) | $ | 16,529,658 | |||||||||||
12
RYAN LABS CORE BOND FUND |
ASSET-BACKED | Coupon | Maturity | Par Value | Value | |||||||||
American Credit Acceptance Receivable Trust, Series 2014-4, Class C, 144A | 4.250% |
| 10/12/20 | $ | 1,000,000 | $ | 1,002,229 | ||||||
AmeriCredit Automobile Receivables Trust, Series 2013-5, Class D | 2.860% |
| 12/09/19 | 460,000 | 464,392 | ||||||||
AmeriCredit Automobile Receivables Trust, Series 2014-1, Class D | 2.540% |
| 06/08/20 | 75,000 | 75,122 | ||||||||
AmeriCredit Automobile Receivables Trust, Series 2014-2, Class D | 2.570% |
| 07/08/20 | 230,000 | 228,408 | ||||||||
AmeriCredit Automobile Receivables Trust, Series 2013-4, Class D | 3.310% |
| 10/08/20 | 30,000 | 30,524 | ||||||||
AmeriCredit Automobile Receivables Trust, Series 2014-3, Class D | 3.130% |
| 10/08/20 | 250,000 | 251,766 | ||||||||
AmeriCredit Automobile Receivables Trust, Series 2014-4, Class D | 3.070% |
| 11/09/20 | 240,000 | 239,227 | ||||||||
AmeriCredit Automobile Receivables Trust, Series 2015-2, Class D | 3.000% |
| 06/08/21 | 290,000 | 287,381 | ||||||||
Avis Budget Rental Car Funding Aesop, LLC, Series 2012-3A, Class B, 144A | 3.040% |
| 03/20/19 | 50,000 | 49,897 | ||||||||
Capital Auto Receivables Asset Trust, Series 2013-4, Class D | 3.220% |
| 05/20/19 | 30,000 | 30,390 | ||||||||
Capital Auto Receivables Asset Trust, Series 2014-2, Class C | 2.410% |
| 05/20/19 | 90,000 | 90,611 | ||||||||
Capital Auto Receivables Asset Trust, Series 2014-1, Class D | 3.390% |
| 07/22/19 | 330,000 | 335,539 | ||||||||
Capital Auto Receivables Asset Trust, Series 2014-2, Class D | 2.810% |
| 08/20/19 | 75,000 | 75,628 | ||||||||
Capital Auto Receivables Asset Trust, Series 2014-3, Class D | 3.140% |
| 02/20/20 | 300,000 | 299,801 | ||||||||
Cronos Containers Program Ltd., Series 2013-1A, Class A, 144A | 3.080% |
| 04/18/28 | 29,667 | 29,296 | ||||||||
Exeter Automobile Receivables Trust, Series 2014-1A, Class C, 144A | 3.570% |
| 07/15/19 | 60,000 | 60,165 | ||||||||
Exeter Automobile Receivables Trust, Series 2014-2A, Class C, 144A | 3.260% |
| 12/16/19 | 40,000 | 39,475 | ||||||||
MVW Owner Trust, Series 2013-1A, Class B, 144A | 2.740% |
| 04/22/30 | 18,945 | 18,804 | ||||||||
Santander Drive Auto Receivables Trust, Series 2014-2, Class D | 2.760% |
| 02/18/20 | 160,000 | 159,667 | ||||||||
Santander Drive Auto Receivables Trust, Series 2014-3, Class D | 2.650% |
| 08/17/20 | 240,000 | 240,039 | ||||||||
Santander Drive Auto Receivables Trust, Series 2014-4, Class D | 3.100% |
| 11/16/20 | 1,540,000 | 1,545,834 | ||||||||
Santander Drive Auto Receivables Trust, Series 2014-5, Class D | 3.210% |
| 01/15/21 | 40,000 | 40,378 | ||||||||
13
RYAN LABS CORE BOND FUND |
ASSET-BACKED | Coupon | Maturity | Par Value | Value | |||||||||
Santander Drive Auto Receivables Trust, Series 2015-1, Class D | 3.240% |
| 04/15/21 | $ | 150,000 | $ | 149,781 | ||||||
Santander Drive Auto Receivables Trust, Series 2015-2, Class D | 3.020% |
| 04/15/21 | 135,000 | 132,350 | ||||||||
Santander Drive Auto Receivables Trust, Series 2015-3, Class D | 3.490% |
| 05/17/21 | 545,000 | 543,002 | ||||||||
Santander Drive Auto Receivables Trust, Series 2015-4, Class D | 3.530% |
| 08/16/21 | 170,000 | 169,649 | ||||||||
Sierra Receivables Funding Company, LLC, Series 2013-3A, Class B, 144A | 2.700% |
| 10/20/30 | 10,178 | 10,190 | ||||||||
Structured Agency Credit Risk Debt Notes, Series 15-DN1, Class M2 (b) | 2.596% |
| 01/25/25 | 150,000 | 151,974 | ||||||||
Structured Agency Credit Risk Debt Notes, Series 15-DNA1, Class M2 (b) | 2.046% |
| 10/25/27 | 115,000 | 113,700 | ||||||||
Total Asset-Backed Securities (Cost $6,866,524) | $ | 6,865,219 | |||||||||||
CORPORATE BONDS — 14.9% | Coupon | Maturity | Par Value | Value | |||||||||
Consumer Discretionary — 2.0% | |||||||||||||
AmerisourceBergen Corporation | 3.400% |
| 05/15/24 | $ | 35,000 | $ | 34,315 | ||||||
AmerisourceBergen Corporation | 4.250% |
| 03/01/45 | 205,000 | 187,447 | ||||||||
Coach, Inc. | 4.250% |
| 04/01/25 | 115,000 | 109,241 | ||||||||
Comcast Corporation | 3.600% |
| 03/01/24 | 510,000 | 532,311 | ||||||||
Comcast Corporation | 4.200% |
| 08/15/34 | 100,000 | 99,131 | ||||||||
DIRECTV Holdings, LLC | 4.600% |
| 02/15/21 | 315,000 | 337,351 | ||||||||
Dr Pepper Snapple Group, Inc. | 3.400% |
| 11/15/25 | 20,000 | 19,735 | ||||||||
Newell Rubbermaid, Inc. | 3.900% |
| 11/01/25 | 15,000 | 14,902 | ||||||||
Penske Truck Leasing Company, L.P., 144A | 3.300% |
| 04/01/21 | 30,000 | 29,869 | ||||||||
1,364,302 | |||||||||||||
Energy — 0.5% | |||||||||||||
Ensco plc | 5.200% |
| 03/15/25 | 35,000 | 28,837 | ||||||||
Ensco plc | 5.750% |
| 10/01/44 | 90,000 | 69,647 | ||||||||
Noble Holding International Ltd. | 5.950% |
| 04/01/25 | 15,000 | 12,021 | ||||||||
Noble Holding International Ltd. | 6.950% |
| 04/01/45 | 240,000 | 173,393 | ||||||||
ONEOK Partners, L.P. | 3.375% |
| 10/01/22 | 15,000 | 12,808 | ||||||||
Rowan Companies, Inc. | 4.750% |
| 01/15/24 | 30,000 | 23,248 | ||||||||
Total Capital Canada Ltd. | 1.550% |
| 06/28/17 | 40,000 | 40,179 | ||||||||
Total Capital Canada Ltd. | 1.450% |
| 01/15/18 | 15,000 | 14,982 | ||||||||
375,115 | |||||||||||||
14
RYAN LABS CORE BOND FUND |
CORPORATE BONDS — 14.9% | Coupon | Maturity | Par Value | Value | |||||||||
Financials — 5.8% | |||||||||||||
American Express Company | 7.000% |
| 03/19/18 | $ | 35,000 | $ | 39,042 | ||||||
Bank of America Corporation | 1.650% |
| 03/26/18 | 245,000 | 244,671 | ||||||||
Bank of America Corporation | 7.625% |
| 06/01/19 | 175,000 | 205,069 | ||||||||
Bank of America Corporation | 5.875% |
| 01/05/21 | 135,000 | 153,930 | ||||||||
BB&T Corporation | 2.050% |
| 06/19/18 | 20,000 | 20,060 | ||||||||
Bear Stearns Companies, LLC | 7.250% |
| 02/01/18 | 320,000 | 356,445 | ||||||||
BNP Paribas | 2.400% |
| 12/12/18 | 230,000 | 232,600 | ||||||||
Citigroup, Inc. | 3.300% |
| 04/27/25 | 185,000 | 182,175 | ||||||||
Duke Realty, L.P. | 3.750% |
| 12/01/24 | 35,000 | 34,076 | ||||||||
Ford Motor Credit Company, LLC | 5.875% |
| 08/02/21 | 230,000 | 258,367 | ||||||||
Goldman Sachs Group, Inc. | 6.250% |
| 09/01/17 | 275,000 | 297,001 | ||||||||
Goldman Sachs Group, Inc. | 2.625% |
| 01/31/19 | 300,000 | 305,398 | ||||||||
Goldman Sachs Group, Inc. | 2.750% |
| 09/15/20 | 190,000 | 191,194 | ||||||||
Hospitality Properties Trust | 4.500% |
| 03/15/25 | 110,000 | 107,568 | ||||||||
Huntington Bancshares, Inc. | 2.600% |
| 08/02/18 | 115,000 | 115,882 | ||||||||
JPMorgan Chase & Company | 2.250% |
| 01/23/20 | 345,000 | 343,833 | ||||||||
JPMorgan Chase & Company | 4.950% |
| 06/01/45 | 230,000 | 232,636 | ||||||||
Morgan Stanley | 5.550% |
| 04/27/17 | 20,000 | 21,101 | ||||||||
Stifel Financial Corporation | 3.500% |
| 12/01/20 | 340,000 | 338,648 | ||||||||
SunTrust Banks, Inc. | 2.350% |
| 11/01/18 | 15,000 | 15,098 | ||||||||
Ventas Realty, L.P. | 2.000% |
| 02/15/18 | 10,000 | 9,991 | ||||||||
Wells Fargo & Company | 4.300% |
| 07/22/27 | 370,000 | 380,947 | ||||||||
4,085,732 | |||||||||||||
Health Care — 3.0% | |||||||||||||
AbbVie, Inc. | 4.700% |
| 05/14/45 | 245,000 | 240,757 | ||||||||
Actavis Funding SCS | 3.450% |
| 03/15/22 | 25,000 | 25,280 | ||||||||
Actavis Funding SCS | 4.750% |
| 03/15/45 | 405,000 | 403,775 | ||||||||
Actavis, Inc. | 1.875% |
| 10/01/17 | 30,000 | 30,046 | ||||||||
Amgen, Inc. | 2.200% |
| 05/22/19 | 125,000 | 124,918 | ||||||||
Amgen, Inc. | 3.125% |
| 05/01/25 | 40,000 | 38,154 | ||||||||
Amgen, Inc. | 4.400% |
| 05/01/45 | 360,000 | 334,732 | ||||||||
Biogen, Inc. | 4.050% |
| 09/15/25 | 385,000 | 388,100 | ||||||||
Celgene Corporation | 3.875% |
| 08/15/25 | 10,000 | 9,960 | ||||||||
Celgene Corporation | 5.000% |
| 08/15/45 | 185,000 | 184,985 | ||||||||
Gilead Sciences, Inc. | 3.250% |
| 09/01/22 | 15,000 | 15,188 | ||||||||
Gilead Sciences, Inc. | 3.650% |
| 03/01/26 | 45,000 | 45,423 | ||||||||
McKesson Corporation | 2.284% |
| 03/15/19 | 15,000 | 15,024 | ||||||||
Medtronic, Inc. | 2.500% |
| 03/15/20 | 30,000 | 30,382 | ||||||||
Medtronic, Inc. | 4.625% |
| 03/15/45 | 120,000 | 123,192 | ||||||||
Mylan, Inc. | 1.800% |
| 06/24/16 | 10,000 | 9,992 | ||||||||
15
RYAN LABS CORE BOND FUND |
CORPORATE BONDS — 14.9% | Coupon | Maturity | Par Value | Value | |||||||||
Health Care — 3.0% (Continued) | |||||||||||||
Mylan, Inc. | 2.550% |
| 03/28/19 | $ | 70,000 | $ | 68,635 | ||||||
UnitedHealth Group, Inc. | 1.400% |
| 12/15/17 | 10,000 | 9,993 | ||||||||
Welltower, Inc. | 2.250% |
| 03/15/18 | 25,000 | 24,987 | ||||||||
2,123,523 | |||||||||||||
Industrials — 0.5% | |||||||||||||
Glencore Funding, LLC, 144A | 2.500% |
| 01/15/19 | 55,000 | 45,100 | ||||||||
Lockheed Martin Corporation | 3.800% |
| 03/01/45 | 355,000 | 314,946 | ||||||||
360,046 | |||||||||||||
Information Technology — 0.7% | |||||||||||||
Broadcom Corporation | 2.700% |
| 11/01/18 | 15,000 | 15,173 | ||||||||
Microsoft Corporation | 3.500% |
| 02/12/35 | 355,000 | 326,536 | ||||||||
Motorola Solutions, Inc. | 3.750% |
| 05/15/22 | 120,000 | 111,043 | ||||||||
QUALCOMM, Inc. | 3.000% |
| 05/20/22 | 10,000 | 9,677 | ||||||||
QUALCOMM, Inc. | 4.650% |
| 05/20/35 | 20,000 | 17,591 | ||||||||
480,020 | |||||||||||||
Materials — 1.0% | |||||||||||||
Agrium, Inc. | 3.375% |
| 03/15/25 | 105,000 | 97,164 | ||||||||
Ecolab, Inc. | 1.450% |
| 12/08/17 | 125,000 | 124,266 | ||||||||
Freeport-McMoRan, Inc. | 2.375% |
| 03/15/18 | 200,000 | 170,086 | ||||||||
LyondellBasell Industries N.V. | 5.000% |
| 04/15/19 | 65,000 | 69,831 | ||||||||
Southern Copper Corporation | 3.875% |
| 04/23/25 | 290,000 | 262,776 | ||||||||
724,123 | |||||||||||||
Telecommunication Services — 0.8% | |||||||||||||
AT&T, Inc. | 3.400% |
| 05/15/25 | 25,000 | 24,261 | ||||||||
Verizon Communications, Inc. | 2.500% |
| 09/15/16 | 103,000 | 104,184 | ||||||||
Verizon Communications, Inc. | 6.350% |
| 04/01/19 | 10,000 | 11,364 | ||||||||
Verizon Communications, Inc. | 4.500% |
| 09/15/20 | 15,000 | 16,286 | ||||||||
Verizon Communications, Inc. | 4.150% |
| 03/15/24 | 25,000 | 26,188 | ||||||||
Verizon Communications, Inc. | 6.550% |
| 09/15/43 | 295,000 | 355,717 | ||||||||
538,000 | |||||||||||||
Utilities — 0.6% | |||||||||||||
Buckeye Partners, L.P. | 2.650% |
| 11/15/18 | 125,000 | 121,440 | ||||||||
Duke Energy Carolinas, LLC | 5.300% |
| 02/15/40 | 105,000 | 121,339 | ||||||||
Electricite de France S.A., 144A | 3.625% |
| 10/13/25 | 20,000 | 19,794 | ||||||||
Oglethorpe Power Corporation | 6.100% |
| 03/15/19 | 60,000 | 66,457 | ||||||||
PacifiCorp | 4.100% |
| 02/01/42 | 105,000 | 102,399 | ||||||||
431,429 | |||||||||||||
Total Corporate Bonds (Cost $10,593,804) | $ | 10,482,290 | |||||||||||
16
RYAN LABS CORE BOND FUND |
INTERNATIONAL BONDS — 0.2% | Coupon | Maturity | Par Value | Value | |||||||||
United Mexican States (Cost $124,847) | 4.000% |
| 10/02/23 | $ | 120,000 | $ | 122,400 | ||||||
EXCHANGE-TRADED FUNDS — 6.2% | Shares | Value | ||||||
iShares iBoxx $ Investment Grade Corporate Bond ETF (Cost $4,293,477) | 37,273 | $ | 4,320,313 | |||||
MONEY MARKET FUNDS — 12.7% | Shares | Value | ||||||
Fidelity Institutional Money Market Government Portfolio - Class I, 0.01% (d) | 5,592,210 | $ | 5,592,210 | |||||
Invesco Short-Term Investments Trust - Treasury Portfolio - Institutional Shares, 0.02% (d) | 3,346,384 | 3,346,384 | ||||||
Total Money Market Funds (Cost $8,938,594) | $ | 8,938,594 | ||||||
Total Investments at Value — 108.0% (Cost $75,976,119) | $ | 75,901,248 | ||||||
Liabilities in Excess of Other Assets — (8.0%) | (5,644,022 | ) | ||||||
Net Assets — 100.0% | $ | 70,257,226 | ||||||
144A - | This is a restricted security that was acquired in a transaction exempt from Rule 144A of the Securities Act of 1933. This security may be sold in transactions exempt from registration, normally to qualified institutional buyers. The total value of such securities is $5,834,877 at November 30, 2015, representing 8.3% of net assets. |
(a) | Percentage rounds to less than 0.1%. |
(b) | Variable rate security. The rate shown is the effective interest rate as of November 30, 2015. |
(c) | Security value has been determined in good faith by the Board of Trustees. The total value of such securities is $867,047 at November 30, 2015, representing 1.2% of net assets (Note 2). |
(d) | The rate shown is the 7-day effective yield as of November 30, 2015. |
See accompanying notes to financial statements. |
17
RYAN LABS LONG CREDIT FUND |
U.S. TREASURY OBLIGATIONS — 7.4% | Coupon | Maturity | Par Value | Value | |||||||||
U.S. Treasury Notes — 6.4% | |||||||||||||
U.S. Treasury Notes | 2.250% |
| 11/15/25 | $ | 3,140,000 | $ | 3,148,955 | ||||||
U.S. Treasury Notes | 4.750% |
| 02/15/37 | 50,000 | 66,576 | ||||||||
3,215,531 | |||||||||||||
U.S. Treasury Bonds — 1.0% | |||||||||||||
U.S. Treasury Bonds | 2.875% |
| 08/15/45 | 490,000 | 477,999 | ||||||||
Total U.S. Treasury Obligations (Cost $3,665,680) | $ | 3,693,530 | |||||||||||
MUNICIPAL BONDS — 5.3% | Coupon | Maturity | Par Value | Value | |||||||||
Bay Area, CA, Toll Authority Toll Bridge, Revenue | 6.263% |
| 04/01/49 | $ | 580,000 | $ | 774,961 | ||||||
California State, Build America Bonds, GO | 7.550% |
| 04/01/39 | 500,000 | 738,460 | ||||||||
Chicago, IL, Transit Authority Sales & Transfer Tax Receipts, Pension Funding, Series A, Revenue | 6.899% |
| 12/01/40 | 95,000 | 110,248 | ||||||||
Chicago, IL, Transit Authority Sales & Transfer Tax Receipts, Series B, Revenue | 6.899% |
| 12/01/40 | 50,000 | 58,025 | ||||||||
New York State Dormitory Authority Personal Income Tax Revenue Build America Bonds, Revenue | 5.389% |
| 03/15/40 | 750,000 | 899,625 | ||||||||
New York, NY, Build America Bonds, GO | 5.206% |
| 10/01/31 | 65,000 | 72,857 | ||||||||
Total Municipal Bonds (Cost $2,637,138) | $ | 2,654,176 | |||||||||||
CORPORATE BONDS — 80.8% | Coupon | Maturity | Par Value | Value | |||||||||
Consumer Discretionary — 6.1% | |||||||||||||
21st Century Fox America, Inc., 144A | 4.950% |
| 10/15/45 | $ | 980,000 | $ | 992,060 | ||||||
Dr Pepper Snapple Group, Inc. | 4.500% |
| 11/15/45 | 200,000 | 196,871 | ||||||||
Hasbro, Inc. | 6.350% |
| 03/15/40 | 300,000 | 332,786 | ||||||||
Time Warner, Inc. | 7.700% |
| 05/01/32 | 25,000 | 31,856 | ||||||||
Time Warner, Inc. | 6.750% |
| 06/15/39 | 200,000 | 206,411 | ||||||||
18
RYAN LABS LONG CREDIT FUND |
CORPORATE BONDS — 80.8% | Coupon | Maturity | Par Value | Value | |||||||||
Consumer Discretionary — 6.1% (Continued) | |||||||||||||
Time Warner, Inc. | 4.850% |
| 07/15/45 | $ | 1,000,000 | $ | 973,990 | ||||||
Viacom, Inc. | 5.250% |
| 04/01/44 | 400,000 | 341,090 | ||||||||
3,075,064 | |||||||||||||
Energy — 7.1% | |||||||||||||
Energy Transfer Partners, L.P. | 6.500% |
| 02/01/42 | 600,000 | 534,700 | ||||||||
EnLink Midstream Partners, L.P. | 5.050% |
| 04/01/45 | 200,000 | 154,716 | ||||||||
Enterprise Products Operating, L.P. | 5.100% |
| 02/15/45 | 500,000 | 454,287 | ||||||||
Kinder Morgan Energy Partners, L.P. | 6.500% |
| 09/01/39 | 550,000 | 471,835 | ||||||||
Noble Holding International Ltd. | 6.950% |
| 04/01/45 | 400,000 | 288,988 | ||||||||
Petroleos Mexicanos | 5.500% |
| 06/27/44 | 455,000 | 375,375 | ||||||||
Rio Tinto Finance USA Ltd. | 3.750% |
| 06/15/25 | 490,000 | 468,806 | ||||||||
Rowan Companies, Inc. | 5.850% |
| 01/15/44 | 490,000 | 342,314 | ||||||||
Williams Partners, L.P. | 4.000% |
| 09/15/25 | 575,000 | 469,609 | ||||||||
3,560,630 | |||||||||||||
Financials — 21.1% | |||||||||||||
Alleghany Corporation | 4.900% |
| 09/15/44 | 490,000 | 475,255 | ||||||||
Citigroup, Inc. | 4.450% |
| 09/29/27 | 1,000,000 | 999,411 | ||||||||
GE Capital International Funding Company, 144A | 4.418% |
| 11/15/35 | 1,460,000 | 1,497,653 | ||||||||
Goldman Sachs Group, Inc. | 4.750% |
| 10/21/45 | 780,000 | 779,911 | ||||||||
Hospitality Properties Trust | 4.650% |
| 03/15/24 | 630,000 | 622,650 | ||||||||
HSBC Bank USA | 5.875% |
| 11/01/34 | 500,000 | 583,212 | ||||||||
JPMorgan Chase & Company | 4.950% |
| 06/01/45 | 700,000 | 708,023 | ||||||||
Lincoln National Corporation | 7.000% |
| 06/15/40 | 400,000 | 503,644 | ||||||||
MetLife, Inc. | 4.875% |
| 11/13/43 | 500,000 | 525,345 | ||||||||
Protective Life Corporation | 8.450% |
| 10/15/39 | 400,000 | 529,703 | ||||||||
Santander Issuances, S.A. | 5.179% |
| 11/19/25 | 400,000 | 401,640 | ||||||||
Societe Generale, 144A | 4.750% |
| 11/24/25 | 500,000 | 493,516 | ||||||||
Teachers Insurance & Annuity Association, 144A | 4.900% |
| 09/15/44 | 675,000 | 693,178 | ||||||||
UBS Group Funding, 144A | 4.125% |
| 09/24/25 | 500,000 | 502,193 | ||||||||
Wells Fargo & Company | 4.300% |
| 07/22/27 | 1,250,000 | 1,286,984 | ||||||||
10,602,318 | |||||||||||||
Health Care — 10.3% | |||||||||||||
AbbVie, Inc. | 4.700% |
| 05/14/45 | 540,000 | 530,647 | ||||||||
Amgen, Inc. | 4.400% |
| 05/01/45 | 250,000 | 232,453 | ||||||||
Baxalta, Inc., 144A | 4.000% |
| 06/23/25 | 500,000 | 495,469 | ||||||||
Biogen, Inc. | 5.200% |
| 09/15/45 | 500,000 | 502,024 | ||||||||
Gilead Sciences, Inc. | 4.750% |
| 03/01/46 | 600,000 | 609,548 | ||||||||
Koninklijke Philips N.V. | 5.000% |
| 03/15/42 | 300,000 | 292,443 | ||||||||
19
RYAN LABS LONG CREDIT FUND |
CORPORATE BONDS — 80.8% | Coupon | Maturity | Par Value | Value | |||||||||
Health Care — 10.3% (Continued) | |||||||||||||
Laboratory Corporation of America Holdings | 4.700% |
| 02/01/45 | $ | 540,000 | $ | 493,733 | ||||||
Medtronic, Inc. | 4.625% |
| 03/15/45 | 500,000 | 513,301 | ||||||||
Novartis Capital Corporation | 4.000% |
| 11/20/45 | 1,000,000 | 985,364 | ||||||||
UnitedHealth Group, Inc. | 4.750% |
| 07/15/45 | 490,000 | 515,787 | ||||||||
5,170,769 | |||||||||||||
Industrials — 8.3% | |||||||||||||
Burlington North Santa Fe Corporation | 4.700% |
| 09/01/45 | 500,000 | 505,906 | ||||||||
Ford Motor Company | 4.750% |
| 01/15/43 | 300,000 | 287,325 | ||||||||
Ingersoll-Rand Luxembourg Finance S.A. | 4.650% |
| 11/01/44 | 400,000 | 384,884 | ||||||||
International Paper Company | 4.800% |
| 06/15/44 | 400,000 | 371,034 | ||||||||
Lockheed Martin Corporation | 4.700% |
| 05/15/46 | 1,000,000 | 1,023,943 | ||||||||
Mosaic Company | 5.625% |
| 11/15/43 | 350,000 | 354,955 | ||||||||
Norfolk Southern Corporation | 4.650% |
| 01/15/46 | 500,000 | 481,914 | ||||||||
United Technologies Corporation | 4.500% |
| 06/01/42 | 760,000 | 771,281 | ||||||||
4,181,242 | |||||||||||||
Information Technology — 7.6% | |||||||||||||
Apple, Inc. | 3.450% |
| 02/09/45 | 1,000,000 | 859,015 | ||||||||
HP Enterprise Company, 144A | 6.350% |
| 10/15/45 | 250,000 | 240,364 | ||||||||
Intel Corporation | 4.900% |
| 07/29/45 | 170,000 | 179,521 | ||||||||
KLA-Tencor Corporation | 5.650% |
| 11/01/34 | 400,000 | 397,895 | ||||||||
Lam Research Corporation | 3.800% |
| 03/15/25 | 350,000 | 332,364 | ||||||||
Microsoft Corporation | 4.200% |
| 11/03/35 | 1,025,000 | 1,035,582 | ||||||||
Oracle Corporation | 6.500% |
| 04/15/38 | 600,000 | 758,537 | ||||||||
3,803,278 | |||||||||||||
Materials — 3.1% | |||||||||||||
BHP Billiton Finance USA Ltd. | 5.000% |
| 09/30/43 | 480,000 | 459,212 | ||||||||
Burlington Resources Finance Company | 7.200% |
| 08/15/31 | 525,000 | 657,447 | ||||||||
Freeport-McMoRan, Inc. | 5.400% |
| 11/14/34 | 75,000 | 47,977 | ||||||||
Southern Copper Corporation | 5.875% |
| 04/23/45 | 500,000 | 397,680 | ||||||||
1,562,316 | |||||||||||||
Telecommunication Services — 8.2% | |||||||||||||
AT&T, Inc. | 4.500% |
| 05/15/35 | 1,500,000 | 1,407,720 | ||||||||
Comcast Corporation | 4.250% |
| 01/15/33 | 500,000 | 499,885 | ||||||||
Motorola Solutions, Inc. | 5.500% |
| 09/01/44 | 250,000 | 195,407 | ||||||||
Verizon Communications, Inc. | 5.050% |
| 03/15/34 | 1,980,000 | 2,017,917 | ||||||||
4,120,929 | |||||||||||||
20
RYAN LABS LONG CREDIT FUND |
CORPORATE BONDS — 80.8% | Coupon | Maturity | Par Value | Value | �� | ||||||||
Utilities — 9.0% | |||||||||||||
Alabama Power Company | 4.150% |
| 08/15/44 | $ | 500,000 | $ | 481,234 | ||||||
Buckeye Partners, L.P. | 5.600% |
| 10/15/44 | 350,000 | 284,438 | ||||||||
Consolidated Edison Company | 4.500% |
| 12/01/45 | 500,000 | 505,888 | ||||||||
Duke Energy Progress, Inc. | 4.375% |
| 03/30/44 | 700,000 | 715,992 | ||||||||
Electricite de France S.A., 144A | 4.950% |
| 10/13/45 | 750,000 | 735,837 | ||||||||
Exelon Generation Company, LLC | 5.600% |
| 06/15/42 | 500,000 | 481,248 | ||||||||
Pacific Gas & Electric Company | 6.050% |
| 03/01/34 | 500,000 | 599,774 | ||||||||
PacifiCorp | 6.250% |
| 10/15/37 | 100,000 | 125,443 | ||||||||
PacifiCorp | 6.350% |
| 07/15/38 | 500,000 | 626,639 | ||||||||
4,556,493 | |||||||||||||
Total Corporate Bonds (Cost $40,562,380) | $ | 40,633,039 | |||||||||||
INTERNATIONAL BONDS — 4.4% | Coupon | Maturity | Par Value | Value | |||||||||
Federal Republic of Brazil | 5.625% |
| 01/07/41 | $ | 400,000 | $ | 318,000 | ||||||
Republic of Colombia | 5.000% |
| 06/15/45 | 200,000 | 175,000 | ||||||||
Republic of Peru | 6.550% |
| 03/14/37 | 250,000 | 296,250 | ||||||||
Republic of Turkey | 4.250% |
| 04/14/26 | 500,000 | 473,750 | ||||||||
United Mexican States | 4.750% |
| 03/08/44 | 1,000,000 | 940,000 | ||||||||
Total International Bonds (Cost $2,214,492) | $ | 2,203,000 | |||||||||||
MONEY MARKET FUNDS — 1.1% | Shares | Value | ||||||
Invesco Short-Term Investments Trust - Treasury Portfolio - Institutional Shares, 0.02% (a) (Cost $577,225) | 577,225 | $ | 577,225 | |||||
Total Investments at Value — 99.0% (Cost $49,656,915) | $ | 49,760,970 | ||||||
Other Assets in Excess of Liabilities 1.0% | 517,320 | |||||||
Net Assets — 100.0% | $ | 50,278,290 | ||||||
144A - | This is a restricted security that was acquired in a transaction exempt from Rule 144A of the Securities Act of 1933. This security may be sold in transactions exempt from registration, normally to qualified institutional buyers. The total value of such securities is $5,650,270 at November 30, 2015, representing 11.2% of net assets. |
(a) | The rate shown is the 7-day effective yield as of November 30, 2015. |
See accompanying notes to financial statements. |
21
RYAN LABS FUNDS |
| Ryan Labs Core Bond Fund | Ryan Labs Long Credit Fund | ||||||
ASSETS | ||||||||
Investments in securities: | ||||||||
At acquisition cost | $ | 75,976,119 | $ | 49,656,915 | ||||
At value (Note 2) | $ | 75,901,248 | $ | 49,760,970 | ||||
Dividends and interest receivable | 244,710 | 506,095 | ||||||
Receivable from Adviser (Note 4) | 7,467 | 2,892 | ||||||
Receivable for securities sold | 457,746 | 1,488,190 | ||||||
Other assets | 4,966 | 1,700 | ||||||
TOTAL ASSETS | 76,616,137 | 51,759,847 | ||||||
LIABILITIES | ||||||||
Payable for securities purchased | 6,300,899 | 1,411,478 | ||||||
Distributions payable | 33,537 | 55,500 | ||||||
Payable to administrator (Note 4) | 8,060 | 5,670 | ||||||
Other accrued expenses | 16,415 | 8,909 | ||||||
TOTAL LIABILITIES | 6,358,911 | 1,481,557 | ||||||
NET ASSETS | $ | 70,257,226 | $ | 50,278,290 | ||||
NET ASSETS CONSIST OF: | ||||||||
Paid-in capital | $ | 70,291,941 | $ | 50,000,501 | ||||
Undistributed net investment income | 24,345 | 204 | ||||||
Accumulated net realized gains from security transactions | 15,811 | 173,530 | ||||||
Net unrealized appreciation (depreciation) on investments | (74,871 | ) | 104,055 | |||||
NET ASSETS | $ | 70,257,226 | $ | 50,278,290 | ||||
Shares of beneficial interest outstanding (unlimited number of shares authorized, no par value) | 7,115,100 | 5,000,050 | ||||||
Net asset value, offering price and redemption price per share (Note 2) | $ | 9.87 | $ | 10.06 | ||||
See accompanying notes to financial statements. |
22
| RYAN LABS FUNDS STATEMENTS OF OPERATIONS |
For the Periods Ended November 30, 2015 | ||||||||
| Ryan Labs Core Bond Fund (a) | Ryan Labs Long Credit Fund (b) | ||||||
INVESTMENT INCOME | ||||||||
Dividend income | $ | 201 | $ | 35 | ||||
Interest | 501,491 | 67,358 | ||||||
TOTAL INCOME | 501,692 | 67,393 | ||||||
EXPENSES | ||||||||
Investment advisory fees (Note 4) | 76,336 | 11,688 | ||||||
Fund accounting fees (Note 4) | 23,947 | 2,200 | ||||||
Administration fees (Note 4) | 23,660 | 2,470 | ||||||
Registration and filing fees | 16,655 | 5,810 | ||||||
Pricing costs | 19,357 | 500 | ||||||
Professional fees | 16,182 | 1,485 | ||||||
Compliance fees (Note 4) | 11,185 | 500 | ||||||
Transfer agent fees (Note 4) | 11,000 | 500 | ||||||
Trustees’ fees and expenses (Note 4) | 9,784 | — | ||||||
Custody and bank service fees | 7,773 | 1,115 | ||||||
Insurance expense | 2,999 | — | ||||||
Postage and supplies | 2,688 | — | ||||||
Printing of shareholder reports | 2,411 | — | ||||||
Other expenses | 4,250 | — | ||||||
TOTAL EXPENSES | 228,227 | 26,268 | ||||||
Less fee reductions and expense reimbursements by the Adviser (Note 4) | (151,891 | ) | (14,580 | ) | ||||
NET EXPENSES | 76,336 | 11,688 | ||||||
NET INVESTMENT INCOME | 425,356 | 55,705 | ||||||
REALIZED AND UNREALIZED GAINS (LOSSES) ON INVESTMENTS | ||||||||
Net realized gains from investment transactions | 40,150 | 173,530 | ||||||
Net change in unrealized appreciation/depreciation on investments | (74,871 | ) | 104,055 | |||||
NET REALIZED AND UNREALIZED GAINS (LOSSES) ON INVESTMENTS | (34,721 | ) | 277,585 | |||||
NET INCREASE IN NET ASSETS FROM OPERATIONS | $ | 390,635 | $ | 333,290 | ||||
(a) | Represents the period from the commencement of operations (December 29, 2014) through November 30, 2015. |
(b) | Represents the period from the commencement of operations (November 13, 2015) through November 30, 2015. |
See accompanying notes to financial statements. |
23
RYAN LABS FUNDS |
Period Ended November 30, 2015 (a) Ryan Labs Core Bond Fund | Period Ended November 30, 2015 (b) Ryan Labs Long Credit Fund | |||||||
| ||||||||
FROM OPERATIONS | ||||||||
Net investment income | $ | 425,356 | $ | 55,705 | ||||
Net realized gains from investment transactions | 40,150 | 173,530 | ||||||
Net change in unrealized appreciation/depreciation on investments | (74,871 | ) | 104,055 | |||||
Net increase in net assets from operations | 390,635 | 333,290 | ||||||
DISTRIBUTIONS TO SHAREHOLDERS | ||||||||
From net investment income | (425,350 | ) | (55,501 | ) | ||||
CAPITAL SHARE TRANSACTIONS | ||||||||
Proceeds from shares sold | 72,008,782 | 50,000,500 | ||||||
Net asset value of shares issued in reinvestment of distributions to shareholders | 283,659 | 1 | ||||||
Payments for shares redeemed | (2,000,500 | ) | — | |||||
Net increase from capital share transactions | 70,291,941 | 50,000,501 | ||||||
TOTAL INCREASE IN NET ASSETS | 70,257,226 | 50,278,290 | ||||||
NET ASSETS | ||||||||
Beginning of period | — | — | ||||||
End of period | $ | 70,257,226 | $ | 50,278,290 | ||||
UNDISTRIBUTED NET INVESTMENT INCOME | $ | 24,345 | $ | 204 | ||||
CAPITAL SHARE ACTIVITY | ||||||||
Shares sold | 7,286,856 | 5,000,050 | ||||||
Shares reinvested | 28,495 | — | (c) | |||||
Shares redeemed | (200,251 | ) | — | |||||
Increase in shares outstanding | 7,115,100 | 5,000,050 | ||||||
Shares outstanding at beginning of period | — | — | ||||||
Shares outstanding at end of period | 7,115,100 | 5,000,050 | ||||||
(a) | Represents the period from the commencement of operations (December 29, 2014) through November 30, 2015. |
(b) | Represents the period from the commencement of operations (November 13, 2015) through November 30, 2015. |
(c) | Rounds to less than 1 share. |
See accompanying notes to financial statements. |
24
RYAN LABS CORE BOND FUND |
Per Share Data for a Share Outstanding Throughout the Period | ||||
| Period Ended November 30, | |||
Net asset value at beginning of period | $ | 10.00 | ||
Income (loss) from investment operations: | ||||
Net investment income | 0.21 | |||
Net realized and unrealized losses on investments | (0.13 | ) | ||
Total from investment operations | 0.08 | |||
Less distributions from: | ||||
Net investment income | (0.21 | ) | ||
Net asset value at end of period | $ | 9.87 | ||
Total return (b) | 0.81 | %(c) | ||
Net assets at end of period (000’s) | $ | 70,257 | ||
Ratios/supplementary data: | ||||
Ratio of total expenses to average net assets (f) | 1.18 | %(d) | ||
Ratio of net expenses to average net assets (e) (f) | 0.40 | %(d) | ||
Ratio of net investment income to average net assets (e) (f) (g) | 2.21 | %(d) | ||
Portfolio turnover rate | 161 | %(c) | ||
(a) | Represents the period from the commencement of operations (December 29, 2014) through November 30, 2015. |
(b) | Total return is a measure of the change in value of an investment in the Fund over the period covered, which assumes any dividends or capital gains distributions are reinvested in shares of the Fund. The return shown does not reflect the deduction of taxes a shareholder would pay on Fund distributions or the redemption of Fund shares. The total return would be lower if the Adviser had not reduced advisory fees and reimbursed expenses (Note 4). |
(c) | Not annualized. |
(d) | Annualized. |
(e) | Ratio was determined after investment advisory fee reductions and expense reimbursements. (Note 4). |
(f) | Ratios do not reflect the Fund’s proportionate share of expenses of the underlying investment companies in which the Fund invests. |
(g) | Recognition of net investment income by the Fund is affected by the timing of the declaration of dividends by the underlying investment companies in which the Fund invests. |
See accompanying notes to financial statements. |
25
RYAN LABS LONG CREDIT FUND |
Per Share Data for a Share Outstanding Throughout the Period | ||||
| Period Ended November 30, | |||
Net asset value at beginning of period | $ | 10.00 | ||
Income from investment operations: | ||||
Net investment income | 0.01 | |||
Net realized and unrealized gains on investments | 0.06 | |||
Total from investment operations | 0.07 | |||
Less distributions from: | ||||
Net investment income | (0.01 | ) | ||
Net asset value at end of period | $ | 10.06 | ||
Total return (b) | 0.71 | %(c) | ||
Net assets at end of period (000’s) | $ | 50,278 | ||
Ratios/supplementary data: | ||||
Ratio of total expenses to average net assets | 1.12 | %(d) | ||
Ratio of net expenses to average net assets (e) | 0.50 | %(d) | ||
Ratio of net investment income to average net assets (e) | 2.38 | %(d) | ||
Portfolio turnover rate | 93 | %(c) | ||
(a) | Represents the period from the commencement of operations (November 13, 2015) through November 30, 2015. |
(b) | Total return is a measure of the change in value of an investment in the Fund over the period covered, which assumes any dividends or capital gains distributions are reinvested in shares of the Fund. The return shown does not reflect the deduction of taxes a shareholder would pay on Fund distributions or the redemption of Fund shares. The total return would be lower if the Adviser had not reduced advisory fees and reimbursed expenses (Note 4). |
(c) | Not annualized. |
(d) | Annualized. |
(e) | Ratio was determined after investment advisory fee reductions and expense reimbursements. (Note 4). |
See accompanying notes to financial statements. |
26
RYAN LABS FUNDS
NOTES TO FINANCIAL STATEMENTS
November 30, 2015
1. Organization
Ryan Labs Core Bond Fund and Ryan Labs Long Credit Fund (individually, a “Fund,” and collectively, the “Funds”) are each a diversified series of Ultimus Managers Trust (the “Trust”), an open-end investment company established as an Ohio business trust under a Declaration of Trust dated February 28, 2012. Other series of the Trust are not incorporated in this report. Ryan Labs Core Bond Fund and Ryan Labs Long Credit Fund commenced operations on December 29, 2014 and November 13, 2015, respectively.
Each Fund’s investment objective is total return, consisting of current income and capital appreciation.
2. Significant Accounting Policies
The following is a summary of the Funds’ significant accounting policies. The policies are in conformity with Generally Accepted Accounting Principals in the United States of America (“GAAP”). As an investment company, as defined in Financial Accounting Standards Board (“FASB”) Accounting Standards Update 2013-08, the Funds follow accounting and reporting guidance under FASB Accounting Standards Codification Topic 946, “Financial Services – Investment Companies.”
Securities valuation – The Funds’ fixed income securities are generally valued using prices provided by an independent pricing service approved by the Trust’s Board of Trustees (the “Board”). The independent pricing service uses information with respect to transactions in bonds, quotations from bond dealers, market transactions in comparable securities, and various relationships between securities in determining these prices. The methods used by the independent pricing service and the quality of valuations so established are reviewed by Ryan Labs, Inc. (the “Adviser”), under the general supervision of the Board. Exchange-traded funds (“ETFs”) are valued at market value as of the close of regular trading on the New York Stock Exchange (the “NYSE”) (normally 4:00 p.m. Eastern time) on each business day the NYSE is open for business. ETFs are valued at the security’s last sale price on the primary exchange, if available, otherwise at the exchange’s most recently quoted bid price. Securities for which market quotations are not readily available are valued at fair value as determined in good faith under procedures adopted by the Board.
GAAP establishes a single authoritative definition of fair value, sets out a framework for measuring fair value, and requires additional disclosures about fair value measurements.
Various inputs are used in determining the value of the Funds’ investments. These inputs are summarized in the three broad levels listed below:
● | Level 1 – quoted prices in active markets for identical securities |
● | Level 2 – other significant observable inputs |
● | Level 3 – significant unobservable inputs |
27
RYAN LABS FUNDS |
Fixed income securities held by the Funds are classified as Level 2 since values are based on prices provided by an independent pricing service that utilizes various “other significant observable inputs” including bid and ask quotations, prices of similar securities, and interest rates, among other factors.
The inputs or methods used for valuing securities are not necessarily an indication of the risks associated with investing in those securities. The inputs used to measure fair value may fall into different levels of the fair value hierarchy. In such cases, for disclosure purposes, the level in the fair value hierarchy within which the fair value measurement falls in its entirety is determined based on the lowest level input that is significant to the fair value measurement.
The following is a summary of the inputs used to value each Fund’s investments as of November 30, 2015:
Ryan Labs | Level 1 | Level 2 | Level 3 | Total | ||||||||||||
U.S. Treasury Obligations | $ | — | $ | 28,612,653 | $ | — | $ | 28,612,653 | ||||||||
U.S. Government Agency Obligations | — | 30,121 | — | 30,121 | ||||||||||||
Mortgage-Backed Securities | — | 16,529,658 | — | 16,529,658 | ||||||||||||
Asset-Backed Securities | — | 6,865,219 | — | 6,865,219 | ||||||||||||
Corporate Bonds | — | 10,482,290 | — | 10,482,290 | ||||||||||||
International Bonds | — | 122,400 | — | 122,400 | ||||||||||||
Exchange-Traded Funds | 4,320,313 | — | — | 4,320,313 | ||||||||||||
Money Market Funds | 8,938,594 | — | — | 8,938,594 | ||||||||||||
Total | $ | 13,258,907 | $ | 62,642,341 | $ | — | $ | 75,901,248 | ||||||||
Ryan Labs | Level 1 | Level 2 | Level 3 | Total | ||||||||||||
U.S. Treasury Obligations | $ | — | $ | 3,693,530 | $ | — | $ | 3,693,530 | ||||||||
Municipal Bonds | — | 2,654,176 | — | 2,654,176 | ||||||||||||
Corporate Bonds | — | 40,633,039 | — | 40,633,039 | ||||||||||||
International Bonds | — | 2,203,000 | — | 2,203,000 | ||||||||||||
Money Market Funds | 577,225 | — | — | 577,225 | ||||||||||||
Total | $ | 577,225 | $ | 49,183,745 | $ | — | $ | 49,760,970 | ||||||||
As of November 30, 2015, the Funds did not have any transfers into and out of any Level. In addition, the Funds did not hold derivative instruments or any assets or liabilities that were measured at fair value on a recurring basis using significant unobservable inputs (Level 3) as of November 30, 2015. It is the Funds’ policy to recognize transfers into and out of any Level at the end of the reporting period.
28
RYAN LABS FUNDS |
Share valuation – The net asset value per share of each Fund is calculated daily by dividing the total value of its assets, less liabilities, by the number of shares outstanding. The offering price and redemption price per share of each Fund is equal to the net asset value per share.
Investment income – Interest income is accrued as earned. Discounts and premiums on fixed income securities purchased are accreted or amortized using the effective interest method. Dividend income is recorded on the ex-dividend date.
Security transactions – Security transactions are accounted for on the trade date. Gains and losses on securities sold are determined on a specific identification basis.
Common expenses – Common expenses of the Trust are allocated among the Funds and other series of the Trust based on the relative net assets of each series or the nature of the services performed and the relative applicability to each series.
Distributions to shareholders – Dividends from net investment income are declared and paid monthly to shareholders. Net realized capital gains, if any, are distributed at least once each year. The amount of distributions from net investment income and net realized capital gains are determined in accordance with federal income tax regulations, which may differ from GAAP. Dividends and distributions to shareholders are recorded on the ex-dividend date. The tax character of distributions paid by the Funds during the periods ended November 30, 2015 was ordinary income. On December 31, 2015, Ryan Labs Core Bond Fund and Ryan Labs Long Credit Fund paid net investment income dividends of $0.0200 and $0.0354 per share, respectively, and short-term capital gains distributions of $0.0072 and $0.0347 per share, respectively, to shareholders of record on December 30, 2015.
Estimates – The preparation of financial statements in conformity with GAAP requires management to make estimates and assumptions that affect the reported amounts of assets and liabilities and disclosure of contingent assets and liabilities as of the date of the financial statements and the reported amounts of income and expenses during the reporting period. Actual results could differ from those estimates.
Federal income tax – Each Fund intends to qualify as a regulated investment company under the Internal Revenue Code of 1986 (the “Code”). Qualification generally will relieve the Funds of liability for federal income taxes to the extent 100% of its net investment income and net realized capital gains are distributed in accordance with the Code. Accordingly, no provision for income tax has been made.
In order to avoid imposition of the excise tax applicable to regulated investment companies, it is also each Fund’s intention to declare as dividends in each calendar year at least 98% of its net investment income (earned during the calendar year) and 98.2% of its net realized capital gains (earned during the twelve months ended October 31) plus undistributed amounts from prior years.
29
RYAN LABS FUNDS |
The following information is computed on a tax basis for each item as of November 30, 2015:
| Ryan Labs Core Bond Fund | Ryan Labs Fund | ||||||
Tax cost of portfolio investments | $ | 75,986,840 | $ | 49,660,406 | ||||
Gross unrealized appreciation | $ | 215,323 | $ | 269,811 | ||||
Gross unrealized depreciation | (300,915 | ) | (169,247 | ) | ||||
Net unrealized appreciation (depreciation) on investments | (85,592 | ) | 100,564 | |||||
Undistributed ordinary income | 50,877 | 177,225 | ||||||
Accumulated earnings (deficit) | $ | (34,715 | ) | $ | 277,789 | |||
The difference between the federal income tax cost of portfolio investments and the financial statement cost for Ryan Labs Core Bond Fund and Ryan Labs Long Credit Fund is due to certain timing differences in the recognition of capital gains or losses under income tax regulations and GAAP. These “book/tax” differences are temporary in nature and are primarily due to the tax deferral of losses on wash sales.
For the period ended November 30, 2015, Ryan Labs Core Bond Fund reclassified $24,339 of accumulated net investment income against accumulated net realized gains from security transactions on the Statements of Assets and Liabilities due to permanent differences in the recognition of capital gains or losses under income tax regulations and GAAP. These differences are due to the tax treatment of paydown adjustments. Such reclassifications had no effect on the Fund’s net assets or net asset value per share.
The Funds recognize the tax benefits or expenses of uncertain tax positions only when the position is “more likely than not” to be sustained assuming examination by tax authorities. Management has reviewed each Fund’s tax positions for the current period and has concluded that no provision for unrecognized tax benefits or expenses is required in these financial statements. The Funds indentify their major tax jurisdiction as U.S. Federal.
3. Investment Transactions
During the periods ended November 30, 2015 cost of purchases and proceeds from sales of investment securities, other than U.S. Government securities and short-term investments were as follows:
| Ryan Labs Fund | Ryan Labs Long Credit Fund | ||||||
Purchase of investment securities | $ | 41,865,986 | $ | 45,414,263 | ||||
Proceeds from sales of investment securities | $ | 14,309,666 | $ | — | ||||
30
RYAN LABS FUNDS |
During the periods ended November 30, 2015, cost of purchases and proceeds from sales of U.S. government long-term securities were as follows:
| Ryan Labs Core Bond Fund | Ryan Labs Fund | ||||||
Purchase of U.S. government securities | $ | 56,776,733 | $ | 49,362,965 | ||||
Proceeds from sales of U.S. government securities | $ | 20,567,478 | $ | 45,871,154 | ||||
4. Transactions with Related Parties
INVESTMENT ADVISORY AGREEMENT
The Adviser is a wholly-owned subsidiary of Sun Life Financial, Inc. Each Fund is managed by the Adviser pursuant to the terms of an Investment Advisory Agreement. Under the Investment Advisory Agreements, Ryan Labs Core Bond Fund and Ryan Labs Long Credit Fund pay the Adviser an advisory fee, computed and accrued daily and paid monthly, at the annual rate of 0.40% and 0.50%, respectively, of each Fund’s average daily net assets.
Pursuant to an Expense Limitation Agreements (“ELAs”) between each Fund and the Adviser, the Adviser has agreed until March 31, 2017 to reduce advisory fees and reimburse other expenses in order to limit total annual operating expenses of the Ryan Labs Core Bond Fund and until March 31, 2018 for the Ryan Labs Long Credit Fund (exclusive of brokerage transaction costs and commissions; taxes; interest; costs related to any securities lending program; transaction charges and interest on borrowed money; acquired fund fees and expenses; distribution and/or shareholder servicing fees, including, without limitation, any amounts, if any, payable pursuant to a plan adopted in accordance with Rule 12b-1 under the Investment Company Act of 1940; extraordinary expenses such as litigation and merger or reorganization costs; proxy solicitation and liquidation costs; indemnification payments to the Funds’ service providers, including, without limitation, the Adviser; other expenses not incurred in the ordinary course of each Fund’s business; and any other expenses the exclusion of which may from time to time be deemed appropriate as an excludable expense and specifically approved by the Trustees of the Trust) to an amount not exceeding 0.40% and 0.50%, respectively, of each Fund’s average daily net assets. Accordingly, the Adviser did not collect any of its advisory fees and, in addition, reimbursed other operating expenses totaling $75,555 and $2,892 for Ryan Labs Core Bond Fund and Ryan Labs Long Credit Fund, respectively, during the periods ended November 30, 2015.
Under the terms of the ELAs, investment advisory fee reductions and expense reimbursements by the Adviser are subject to recoupment by the Adviser for a period of three years after such fees and expenses were incurred, provided the recoupments do not cause total annual operating expenses of the Funds to exceed 0.40% and 0.50%, respectively, of each Fund’s average daily net assets. As of November 30, 2015, the Adviser may seek recoupment of
31
RYAN LABS FUNDS |
investment advisory fee reductions and expense reimbursements totaling $151,891 and $14,580 for Ryan Labs Core Bond Fund and Ryan Labs Long Credit Fund, respectively, no later than November 30, 2018.
OTHER SERVICE PROVIDERS
Ultimus Fund Solutions, LLC (“Ultimus”) provides fund administration, fund accounting, compliance and transfer agency services to the Funds. The Funds pay Ultimus fees in accordance with the agreements for such services. In addition, the Funds pay out-of-pocket expenses including, but not limited to, postage, supplies and costs of pricing the Funds’ portfolio securities.
Under the terms of a Distribution Agreement with the Trust, Ultimus Fund Distributors, LLC (the “Distributor”) serves as principal underwriter to the Funds. The Distributor is a wholly-owned subsidiary of Ultimus. The Distributor is compensated by the Adviser (not the Funds) for acting as principal underwriter.
Certain officers and a Trustee of the Trust are also officers of Ultimus and the Distributor and are not paid by the Funds for serving in such capacities.
TRUSTEE COMPENSATION
Each Trustee who is not an “interested person” of the Trust (“Independent Trustee”) receives from each Fund a fee of $500 for each Board meeting attended plus reimbursement of travel and other meeting-related expenses. In addition, each Independent Trustee receives from each Fund an annual retainer of $500. Trustees affiliated with the Adviser or Ultimus are not compensated by the Funds for their services.
PRINCIPAL HOLDERS OF FUND SHARES
As of November 30, 2015, the following shareholders owned of record 5% or more of the outstanding shares of each Fund:
NAME OF RECORD OWNER | % Ownership |
Ryan Labs Core Bond Fund | |
Citibank N.A. (for the benefit of its customers) | 71% |
U.S. Bank (for the benefit of its customers) | 24% |
Northern Trust (for the benefit of its customers) | 5% |
Ryan Labs Long Credit Fund | |
Citibank N.A. (for the benefit of its customers) | 100% |
A beneficial owner of 25% or more of a Fund’s outstanding shares may be considered a controlling person of that Fund. That shareholder’s vote could have a more significant effect on matters presented at a shareholder’s meeting.
32
RYAN LABS FUNDS |
5. Contingencies and Commitments
The Funds indemnify the Trust’s officers and Trustees for certain liabilities that might arise from their performance of their duties to the Funds. Additionally, in the normal course of business the Funds enter into contracts that contain a variety of representations and warranties and which provide general indemnifications. The Funds’ maximum exposure under these arrangements is unknown, as this would involve future claims that may be made against the Funds that have not yet occurred. However, based on experience, the Funds expect the risk of loss to be remote.
6. Subsequent Events
The Funds are required to recognize in the financial statements the effects of all subsequent events that provide additional evidence about conditions that existed as of the date of the Statements of Assets and Liabilities. For non-recognized subsequent events that must be disclosed to keep the financial statements from being misleading, the Funds are required to disclose the nature of the event as well as an estimate of its financial effect, or a statement that such an estimate cannot be made. Management has evaluated subsequent events through the issuance of these financial statements and has noted no such events.
33
RYAN LABS FUNDS |
To the Board of Trustees of Ultimus Managers Trust
and the Shareholders of Ryan Labs Core Bond Fund and Ryan Labs Long Credit Fund
We have audited the accompanying statement of assets and liabilities of Ryan Labs Core Bond Fund, a series of shares of beneficial interest in Ultimus Managers Trust (the “Fund”), including the schedule of investments, as of November 30, 2015, and the related statements of operations and changes in net assets and the financial highlights for the period December 29, 2014 (commencement of operations) through November 30, 2015. We have also audited the accompanying statement of assets and liabilities of Ryan Labs Long Credit Fund, a series of shares of beneficial interest in Ultimus Managers Trust (the “Fund”), including the schedule of investments, as of November 30, 2015, and the related statements of operations and changes in net assets and the financial highlights for the period November 13, 2015 (commencement of operations) through November 30, 2015. These financial statements and financial highlights are the responsibility of the Funds’ management. Our responsibility is to express an opinion on these financial statements and financial highlights based on our audits.
We conducted our audits in accordance with the standards of the Public Company Accounting Oversight Board (United States). Those standards require that we plan and perform the audits to obtain reasonable assurance about whether the financial statements and financial highlights are free of material misstatement. An audit includes examining, on a test basis, evidence supporting the amounts and disclosures in the financial statements. Our procedures included confirmation of securities owned as of November 30, 2015 by correspondence with the custodian and brokers, or by other appropriate procedures where confirmations were not received. An audit also includes assessing the accounting principles used and significant estimates made by management, as well as evaluating the overall financial statement presentation. We believe that our audits provide a reasonable basis for our opinion.
In our opinion, the financial statements and financial highlights referred to above present fairly, in all material respects, the financial position of Ryan Labs Core Bond Fund and Ryan Labs Long Credit Fund as of November 30, 2015, and the results of their operations, the changes in their net assets, and their financial highlights for each of the periods presented, in conformity with accounting principles generally accepted in the United States of America.
BBD, LLP |

Philadelphia, Pennsylvania
January 27, 2016
34
RYAN LABS FUNDS |
We believe it is important for you to understand the impact of costs on your investment. As a shareholder of the Funds, you incur ongoing costs, including management fees and other operating expenses. The following examples are intended to help you understand your ongoing costs (in dollars) of investing in the Funds and to compare these costs with the ongoing costs of investing in other mutual funds.
A mutual fund’s ongoing costs are expressed as a percentage of its average net assets. This figure is known as the expense ratio. The expenses in the table below are based on an investment of $1,000 made at the beginning of the most recent period (June 1, 2015 and November 13, 2015 for Ryan Labs Core Bond Fund and Ryan Labs Long Credit Fund, respectively) and held until the end of the period (November 30, 2015).
The table below illustrates each Fund’s ongoing costs in two ways:
Actual fund return – This section helps you to estimate the actual expenses that you paid over the period. The “Ending Account Value” shown is derived from each Fund’s actual return, and the third column shows the dollar amount of operating expenses that would have been paid by an investor who started with $1,000 in the Funds. You may use the information here, together with the amount you invested, to estimate the expenses that you paid over the period.
To do so, simply divide your accjount value by $1,000 (for example, an $8,600 account value divided by $1,000 = 8.6), then multiply the result by the number given for each Fund under the heading “Expenses Paid During Period.”
Hypothetical 5% return – This section is intended to help you compare each Fund’s ongoing costs with those of other mutual funds. It assumes that each Fund had an annual return of 5% before expenses during the period shown, but that the expense ratio is unchanged. In this case, because the return used is not each Fund’s actual return, the results do not apply to your investment. The example is useful in making comparisons because the SEC requires all mutual funds to calculate expenses based on a 5% return. You can assess each Fund’s ongoing costs by comparing this hypothetical example with the hypothetical examples that appear in shareholder reports of other funds.
Note that expenses shown in the table are meant to highlight and help you compare ongoing costs only. The Funds do not charge transaction fees, such as purchase or redemption fees, nor do they carry a “sales load.”
The calculations assume no shares were bought or sold during the period. Your actual costs may have been higher or lower, depending on the amount of your investment and the timing of any purchases or redemptions.
35
RYAN LABS FUNDS |
More information about each Fund’s expenses can be found in this report. For additional information on operating expenses and other shareholder costs, please refer to each Fund’s prospectus.
Ryan Labs Core Bond Fund | Beginning | Ending | Net Expense Ratio (a) | Expenses Period (b) |
Based on Actual Fund Return | $1,000.00 | $992.80 | 0.40% | $2.00 |
Based on Hypothetical 5% Return (before expenses) | $1,000.00 | $1,023.06 | 0.40% | $2.03 |
(a) | Annualized, based on Fund’s most recent one-half year expenses. |
(b) | Expenses are equal to the Fund’s annualized expense ratio multiplied by the average account value over the period, multiplied by 183/365 (to reflect the one-half year period). |
Ryan Labs Long Credit Fund | Beginning | Ending | Net Expense Ratio (b) | Expenses |
Based on Actual Fund Return | $1,000.00 | $1,007.10 | 0.50% | $0.23 |
Based on Hypothetical 5% Return (before expenses) | $1,000.00 | $1,022.56 | 0.50% | $2.54 |
(a) | Beginning Account Value is as of November 13, 2015 (date of commencement of operations) for the Actual Fund Return information. |
(b) | Annualized, based on the Fund’s expenses for the period since inception. |
(c) | Expenses are equal to the Fund’s annualized expense ratio multiplied by the average account value over the period, multiplied by 17/365 (to reflect the period since inception) and 183/365 (to reflect the one-half year period), for Actual Fund Return and Hypothetical 5% Return information, respectively. |
36
RYAN LABS FUNDS |
A description of the policies and procedures that the Funds use to vote proxies relating to portfolio securities is available without charge upon request by calling toll-free 1-866-561-3087, or on the SEC’s website at http://www.sec.gov. Information regarding how the Funds voted proxies relating to portfolio securities during the most recent 12-month period ended June 30 is available without charge upon request on or before August 31, 2016 by calling toll-free 1-866-561-3087, or on the SEC’s website at http://www.sec.gov.
The Trust files a complete listing of portfolio holdings for the Funds with the SEC as of the end of the first and third quarters of each fiscal year on Form N-Q. These filings are available upon request by calling 1-866-561-3087. Furthermore, you may obtain a copy of the filings on the SEC’s website at http://www.sec.gov. The Trust’s Forms N-Q may also be reviewed and copied at the SEC’s Public Reference Room in Washington, DC, and information on the operation of the Public Reference Room may be obtained by calling 1-800-SEC-0330.
37
RYAN LABS FUNDS (Unaudited) |
The Board has overall responsibility for management of the Trust’s affairs. The Trustees serve during the lifetime of the Trust and until its termination, or until death, resignation, retirement, or removal. The Trustees, in turn, elect the officers of the Fund to actively supervise its day-to-day operations. The officers have been elected for an annual term. Unless otherwise noted, each Trustee’s and officer’s address is 225 Pictoria Drive, Suite 450, Cincinnati, Ohio 45246. The following are the Trustees and executive officers of the Funds as of January 26, 2016:
Name and | Length of Time Served | Position(s) Held with Trust | Principal Occupation(s) | Number of Funds in Trust Overseen by Trustee | Directorships of Public Companies Held by Trustee During Past 5 Years |
Interested Trustees: | |||||
Robert G. Dorsey* Year of Birth: 1957 | Since | Trustee (February 2012 to present)
President (June 2012 to October 2013) | Managing Director of Ultimus Fund Solutions, LLC and Ultimus Fund Distributors, LLC (1999 to present) | 21 | n/a |
Independent Trustees: | |||||
Janine L. Cohen Year of Birth: 1952 | Since January | Trustee | Retired since 2013; Chief Financial Officer from 2004 to 2013 and Chief Compliance Officer from 2008 to 2013 at AER Advisors, Inc. | 21 | n/a |
John C. Davis Year of Birth: 1952 | Since | Chairman (July 2014
Trustee (June 2012 to present) | Consultant since May 2011; Retired Partner of PricewaterhouseCoopers LLP (1974 to 2010) | 21 | n/a |
* | Mr. Dorsey is considered an “interested person” of the Trust within the meaning of Section 2(a)(19) of the Investment Company Act of 1940, as amended, because of his relationship with the Trust’s administrator, transfer agent and distributor. |
38
RYAN LABS FUNDS (Unaudited) (Continued) |
Name and | Length of Time Served | Position(s) Held with Trust | Principal Occupation(s) | Number of Funds in Trust Overseen by Trustee | Directorships of Public Companies Held by Trustee During Past 5 Years |
Independent Trustees (continued): | |||||
David M. Deptula Year of Birth: 1958 | Since | Trustee | Vice President of Legal and Special Projects at Dayton Freight Lines, Inc. since February 2016; Vice President of Tax Treasury at The Standard Register Inc. (formerly The Standard Register Company) since November 2011; Tax Partner at Deloitte Tax LLP from 1984 to 2011 | 21 | n/a |
John J. Discepoli Year of Birth: 1963 | Since | Trustee | Owner of Discepoli Financial Planning, LLC (personal financial planning company) since November 2004 | 21 | n/a |
39
RYAN LABS FUNDS |
Name and | Length of Time Served | Position(s) Held with Trust | Principal Occupation(s) During Past 5 Years |
Executive Officers: | |||
David R. Carson Year of Birth: 1958 | Since | President (October 2013 to present)
Principal
Vice President (April 2013 to October 2013) | Vice President and Director of Client Strategies of Ultimus Fund Solutions, LLC (2013 to present); Chief Compliance Officer, FSI LBAR Fund (2013 to present); Chief Compliance Officer, The Huntington Funds (2005 to 2013), The Flex-Funds (2006 to 2011), Meeder Financial (2007 to 2011), Huntington Strategy Shares (2012 to 2013), and Huntington Asset Advisors (2013); Vice President, Huntington National Bank (2001 to 2013) |
Jennifer L. Leamer Year of Birth: 1976 | Since | Treasurer
Assistant Treasurer (April 2014 to October 2014) | Vice President, Mutual Fund Controller of Ultimus Fund Solutions, LLC (2014 to present); Business Analyst of Ultimus Fund Solutions, LLC (2007 to 2014) |
Bo J. Howell Year of Birth: 1981 | Since | Secretary
Assistant Secretary (October 2014 to April 2015) | Vice President, Director of Fund Administration for Ultimus Fund Solutions, LLC (2014 to present); Counsel – Securities and Mutual Funds for Western & Southern Financial Group (2012 to 2014); U.S. Securities and Exchange Commission, Senior Counsel (2009 to 2012) |
Charles C. Black Year of Birth: 1979 | Since | Chief Compliance Officer (January 2016 to present) | Senior Compliance Officer of Ultimus Fund Solutions, LLC (2015 to present); Senior Compliance Manager for Touchstone Mutual Funds (2013 to 2015); Senior Compliance Manager for Fund Evaluation Group (2011 to 2013); Regulatory Administration Specialist for JPMorgan Chase Bank (2006 to 2011) |
Additional information about members of the Board and executive officers is available in the Funds’ Statement of Additional Information (“SAI”). To obtain a free copy of the SAI, please call 1-866-561-3087.
40
RYAN LABS FUNDS |
The Board, including the Independent Trustees voting separately, has reviewed and approved the Ryan Labs Long Credit Fund’s (the “Long Credit Fund”) Investment Advisory Agreement with the Adviser for an initial two-year term. Approval of the Investment Advisory Agreement took place at an in-person meeting held on August 19, 2015, at which all of the Trustees were present.
In the course of their deliberations, the Board was advised by legal counsel. The Board received and reviewed information provided by the Adviser in response to requests of the Board and counsel.
In considering the Investment Advisory Agreement and reaching their conclusions with respect thereto, the Board reviewed and analyzed various factors that they determined were relevant, including the factors described below.
The nature, extent, and quality of the services provided by the Adviser. The Board considered the responsibilities the Adviser would have under the Investment Advisory Agreement. The Board noted that the Adviser’s responsibilities for the Long Credit Fund were the same as those under the advisory agreement for the Ryan Labs Core Bond Fund (the “Core Bond Fund”). Accordingly, the Board reviewed both the proposed services for the Long Credit Fund and the services being provided by the Adviser to the Core Bond Fund including, without limitation, the Adviser’s investment advisory services since the Core Bond Fund’s inception, the Adviser’s coordination of services for the Long Credit Fund’s service providers, the Adviser’s compliance procedures and practices, and the Adviser’s plans to promote the Long Credit Fund. After reviewing the foregoing information and the materials the Adviser provided to the Board, the Board concluded that the quality, extent, and nature of the services provided by the Adviser are satisfactory and adequate for the Long Credit Fund.
The investment performance of the Long Credit Fund and the Adviser. The Board considered the investment management experience of the Adviser and thoroughly discussed the Long Credit Fund’s investment objective and strategies. The Board also discussed the Adviser’s experience in managing similar types of strategies and its plans for implementing such strategies. The Board also considered the consistency of the Adviser’s management of the Core Bond Fund with its investment objective and policies. After consideration of these factors, as well as other factors, the Board determined that the Adviser has the requisite experience to serve as investment adviser for the Long Credit Fund.
The costs of the services to be provided and profits and benefits to be realized by the Adviser from its relationship with the Long Credit Fund. The Board considered the Adviser’s staffing, personnel, and operations; the Adviser’s compliance policies and procedures; the financial condition of the Adviser and its parent company, Sun Life Financial, Inc., and each entity’s level of commitment to the Long Credit Fund and the Adviser’s business; the Adviser’s payment of startup costs for the Long Credit Fund; and the projected overall expenses of the Long Credit Fund, including projected fee reductions and expense reimbursements by the
41
RYAN LABS FUNDS |
Adviser on behalf of the Long Credit Fund under the ELA with the Adviser. The Board also considered the aggregate fees to be charged to the Long Credit Fund under the Investment Advisory Agreement. The Board considered the Adviser’s potential profitability and benefits from managing the Long Credit Fund, including promotion of the Adviser’s name. Following these comparisons and upon further consideration of the foregoing, the Board concluded that the fees to be paid to the Adviser by the Long Credit Fund under the Investment Advisory Agreement are appropriate and within the range of fees that would have been negotiated at arm’s length.
The extent to which economies of scale would be realized as the Long Credit Fund grows and whether advisory fee levels reflect these economies of scale for the benefit of the Long Credit Fund’s investors. The Board considered that the Long Credit Fund’s fee arrangement with the Adviser involves both an advisory fee and an expense limitation agreement. The Board determined that, because the proposed advisory fee is flat and equals the expense cap under the ELA, the shareholders of the Long Credit Fund would benefit from the ELA. The Board noted that the Long Credit Fund has the potential to benefit from economies of scale under its agreements with its other service providers. Following further consideration of the Long Credit Fund’s projected asset levels, expectations for growth, and fee levels, the Board determined that the Long Credit Fund’s fee arrangement with the Adviser would provide benefits through the ELA, and that, at the Long Credit Fund’s current and projected asset levels for the next two years, the Long Credit Fund’s arrangements with the Adviser are fair and reasonable.
Brokerage and portfolio transactions. The Board considered the Adviser’s policies and procedures as it relates to seeking best execution for its clients, including the Long Credit Fund. The Board also considered the anticipated portfolio turnover rate for the Long Credit Fund; the method and basis for selecting and evaluating the broker-dealers used to complete the Long Credit Fund’s portfolio transactions; any anticipated allocation of portfolio business to persons affiliated with the Adviser; and the extent to which the Long Credit Fund’s trades may be allocated to soft-dollar arrangements. The Board determined that the Adviser’s practices regarding brokerage and portfolio transactions were satisfactory.
Possible conflicts of interest. In evaluating the possibility for conflicts of interest, the Board considered such matters as the Adviser’s process for allocating trades among its different clients, including both the Long Credit Fund and other clients with similar types of investment objectives and strategies as the Long Credit Fund. The Board also considered the substance and administration of the Adviser’s Code of Ethics. Following consideration of the foregoing, the Board determined that the Adviser’s standards and practices relating to the identification and mitigation of potential conflicts of interests were satisfactory.
Conclusion
After consideration of the above factors as well as other factors, the Board unanimously concluded that approval of the Investment Advisory Agreement was in the best interests of the Long Credit Fund and its shareholders.
42
This page intentionally left blank.
This page intentionally left blank.
This page intentionally left blank.
| (a) | Audit Fees. The aggregate fees billed for professional services rendered by the principal accountant for the audit of the registrant’s annual financial statements or for services that are normally provided by the accountant in connection with statutory and regulatory filings or engagements were $64,500 and $13,500 with respect to the registrant’s fiscal years ended November 30, 2015 and November 30, 2014, respectively. |
| (b) | Audit-Related Fees. No fees were billed in the last fiscal year for assurance and related services by the principal accountant that are reasonably related to the performance of the audit of the registrant’s financial statements and are not reported under paragraph (a) of this Item. |
| (c) | Tax Fees. The aggregate fees billed for professional services rendered by the principal accountant for tax compliance, tax advice, and tax planning were $10,000 and $2,000 with respect to the registrant’s fiscal years ended November 30, 2015 and November 30, 2014, respectively. The services comprising these fees are the preparation of the registrant’s federal income and excise tax returns. |
| (d) | All Other Fees. No fees were billed in the last fiscal year for products and services provided by the principal accountant, other than the services reported in paragraphs (a) through (c) of this Item. |
| (e)(1) | The audit committee has not adopted pre-approval policies and procedures described in paragraph (c)(7) of Rule 2-01 of Regulation S-X. |
| (e)(2) | None of the services described in paragraph (b) through (d) of this Item were approved by the audit committee pursuant to paragraph (c)(7)(i)(C) of Rule 2-01 of Regulation S-X. |
| (f) | Less than 50% of hours expended on the principal accountant’s engagement to audit the registrant’s financial statements for the most recent fiscal year were attributed to work performed by persons other than the principal accountant’s full-time, permanent employees. |
| (g) | During the fiscal years ended November 30, 2015 and 2014, aggregate non-audit fees of $10,000 and $2,000, respectively, were billed by the registrant’s principal accountant for services rendered to the registrant. No non-audit fees were billed in the last fiscal year by the registrant’s principal accountant for services rendered to the registrant’s investment adviser (not including any sub-adviser whose role is primarily portfolio management and is subcontracted with or overseen by another investment adviser), and any entity controlling, controlled by, or under common control with the adviser that provides ongoing services to the registrant. |
| (h) | The principal accountant has not provided any non-audit services to the registrant’s investment adviser (not including any sub-adviser whose role is primarily portfolio management and is subcontracted with or overseen by another investment adviser), and any entity controlling, controlled by, or under common control with the investment adviser that provides ongoing services to the registrant. |
| (a) | Not applicable [schedule filed with Item 1] |
| (b) | Not applicable |
| Exhibit 99.CODE ETH | Code of Ethics |
| Exhibit 99.CERT | Certifications required by Rule 30a-2(a) under the Act |
| Exhibit 99.906CERT | Certifications required by Rule 30a-2(b) under the Act |
| (Registrant) | Ultimus Managers Trust | ||
| By (Signature and Title)* | /s/ Frank L. Newbauer | ||
| Frank L. Newbauer, Assistant Secretary | |||
| Date | February 5, 2016 | ||
| Pursuant to the requirements of the Securities Exchange Act of 1934 and the Investment Company Act of 1940, this report has been signed below by the following persons on behalf of the registrant and in the capacities and on the dates indicated. | |||
| By (Signature and Title)* | /s/ Andrew B. Wellington | ||
| Andrew B. Wellington, Principal Executive Officer of Lyrical U.S. Value Equity Fund and Lyrical U.S. Hedged Value Fund | |||
| Date | February 5, 2016 | ||
| By (Signature and Title)* | /s/ Stephen P. Lack | ||
| Stephen P. Lack, Principal Executive Officer of Galapagos Partners Select Equity Fund | |||
| Date | February 5, 2016 | ||
| By (Signature and Title)* | /s/ David R. Carson | ||
| David R. Carson, Principal Executive Officer of Ryan Labs Core Bond Fund and Ryan Labs Long Credit Fund | |||
| Date | February 5, 2016 | ||
| By (Signature and Title)* | /s/ Jennifer L. Leamer | ||
| Jennifer L. Leamer, Treasurer and Principal Financial Officer | |||
| Date | February 5, 2016 | ||
| * | Print the name and title of each signing officer under his or her signature. |