| OMB APPROVAL |
OMB Number: 3235-0570 Expires: January 31, 2017 Estimated average burden hours per response: 20.6 |
| Investment Company Act file number | 811-22680 |
| Ultimus Managers Trust |
| (Exact name of registrant as specified in charter) |
| 225 Pictoria Drive, Suite 450 Cincinnati, Ohio | 45246 |
| (Address of principal executive offices) | (Zip code) |
| Ultimus Fund Solutions, LLC 225 Pictoria Drive, Suite 450 Cincinnati, Ohio 45246 |
| (Name and address of agent for service) |
| Registrant's telephone number, including area code: | (513) 587-3400 |
| Date of fiscal year end: | February 29, 2016 | |
| Date of reporting period: | February 29, 2016 |
| Item 1. | Reports to Stockholders. |

WAYCROSS LONG/SHORT EQUITY FUND
(WAYEX)
Annual Report
February 29, 2016
WAYCROSS LONG/SHORT EQUITY FUND LETTER TO SHAREHOLDERS | February 29, 2016 |
Dear Shareholders,
We are pleased to provide this update for the Waycross Long/Short Equity Fund (the “Fund”). At Waycross Partners, we believe that through deep comprehensive analysis a portfolio can be carefully constructed using both long and short positions that meets investors’ growth objectives while reducing short-term volatility. This belief represents a guiding principle that shapes our investment decision making process. The Fund’s investment approach is based on bottom-up company research that combines a thorough examination of a company’s fundamentals, valuation and market sentiment. The Fund is actively managed as we seek to achieve consistent, positive returns by continually researching new opportunities for profitable stock selection.
Performance Review
Since its launch on April 29, 2015 through the period ended February 29, 2016, the Fund has produced a cumulative total return of -9.0% compared to -6.5% for the S&P 500 Index and -9.9% for the Credit Suisse AllHedge Long/Short Index over the same period. Weakness in U.S. equities over the ten month period has been broad-based with significant losses in Energy, Materials, and Financials. Only Consumer Staples and Utilities stocks managed to post gains over the period as investors have sought safety in these traditionally defensive areas of the market.
A net long position in the Financials sector detracted from returns during the period. This sector includes banks and companies operating within the capital markets that are sensitive to interest rate policy. Despite the Federal Reserve’s (the “Fed”) December decision to increase short-term rates by 0.25%, longer-dated maturities have decreased. These rates, which are subject to market fluctuations, have a significant impact on the profitability of financial companies. This activity coupled with concerns regarding energy industry loans and emerging market loans has put pressure on the group.
Exposure to the Energy sector detracted value during the period. OPEC’s decision to not adjust oil production quotas despite the growing glut of oil supply and less demand for the commodity has had serious implications. WTI crude oil prices have fallen to $33 per barrel by the end of February, which compares to 2003 levels. OPEC’s above-optimal production level reflects its intention to crowd out competition from U.S. shale and offshore producers that require a much higher commodity price to achieve profitability. Long exposure to Energy detracted from returns while gains from the Fund’s short positions helped to offset losses.
1
Exposures Summary
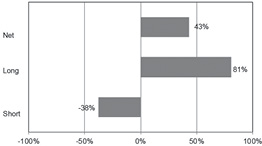
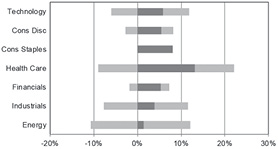
The Fund’s overall net long exposure (longs minus shorts) has ranged from +38% to +49% throughout the period and was 43% as of the end of February. Beta, also known as beta coefficient, is a measure of volatility. The Fund maintained a beta of 0.49 relative to the S&P 500 Index, which represents the market as a whole with a beta of 1. The Fund increased its short exposure to the Financials sector, but maintains a net long position to the sector of +5%. We believe these stocks are well-positioned to benefit from an expected increase in interest rates across the yield curve.
The Fund recently reduced its exposure to the Energy sector to a net long +1% position. Importantly, the Fund continues to navigate the Energy sector through the use of paired trades across industries. The Fund’s largest net long position is within the Health Care sector at +13%. Within the group we are diversified across biotech, large pharmaceuticals and medical device companies, and maintain several industry paired trades.
Fund Exposure and Attribution | |
Total Portfolio Exposures | Long/Short/Net Exposure by Sector |
|
|
Top Five Long Positions | Top Five Short Positions | |||||
Security Name | Sector | % of Portfolio | Security Name | Sector | % of Portfolio | |
Coca-Cola Co. | Cons Staples | 2.8% | Deere & Co. | Industrials | -2.7% | |
Honeywell International Inc. | Industrials | 2.8% | Davita Healthcare Partners | Health Care | -2.3% | |
Starbucks Corp. | Cons Disc | 2.8% | Accenture PLC | Health Care | -2.1% | |
Wal-Mart Stores Inc. | Cons Staples | 2.7% | NVIDIA Corp. | Technology | -2.1% | |
Allergan PLC | Health Care | 2.7% | Apache Corp. | Energy | -2.1% | |
Market Outlook
Our investment process is deeply rooted in comprehensive company analysis. This fundamental approach to stock selection helps us to identify industry winners and losers, which leads to our investment ideas and paired trades. This also tends to result in a quality bias within our strategies where we are long higher quality “winners” and short lower quality “losers”. Under normal market conditions, investors favor fundamentally sound, quality companies and strong stock selection results in our longs outperforming our shorts. At times, however, low priced and low quality stocks will rally significantly following a period of weakness. These trends tend to occur most often in bear markets and typically will mean-revert. Note that this process can sometimes overwhelm short-term results.
2
The Fed’s highly accommodative monetary policy achieved through quantitative easing and near-zero interest rates has officially ended. Looking ahead, we expect continued market volatility and an increase in dispersion among industry participants. As companies adjust to a higher cost of debt, business models will be challenged and there will be clear winners and losers. This creates an opportunity for long/short equity managers.
On behalf of Waycross Partners, LLC, thank you for investing in the Fund.
Sincerely,
Benjamin H. Thomas, CFA
Managing Partner | Portfolio Manager
Past performance is not predictive of future performance. Investment results and principal value will fluctuate so that shares, when redeemed, may be worth more or less than their original cost. Current performance may be higher or lower than the performance data quoted. Performance data current to the most recent month-end are available by calling 1-866-267-4304.
An investor should consider the investment objectives, risks, charges and expenses of the Fund carefully before investing. The Fund’s prospectus contains this and other important information. To obtain a copy of the Fund’s prospectus please visit our website at www.waycrossfunds.com or call 1-866-267-4304 and a copy will be sent to you free of charge. Please read the prospectus carefully before you invest. The Fund is distributed by Ultimus Fund Distributors, LLC.
The Letter to Shareholders seeks to describe some of the Adviser’s current opinions and views of the financial markets. Although the Adviser believes it has a reasonable basis for any opinions or views expressed, actual results may differ, sometimes significantly so, from those expected or expressed. The securities held by the Fund that are discussed in the Letter to Shareholders were held during the period covered by this Report. They do not comprise the entire investment portfolio of the Fund, may be sold at any time, and may no longer be held by the Fund. For a complete listing of securities held in the Fund as of February 29, 2016, please see the Schedule of Investments section of the Annual Report. The opinions of the Fund’s adviser with respect to those securities may change at any time.
Statements in the Letter to Shareholders that reflect projections or expectations for future financial or economic performance of the Fund and the market in general and statements of the Fund’s plans and objectives for future operations are forward-looking statements. No assurance can be given that actual results or events will not differ materially from those projected, estimated, assumed, or anticipated in any such forward-looking statements. Important factors that could result in such differences, in addition to factors noted with such forward-looking statements, include, without limitation, general economic conditions, such as inflation, recession, and interest rates. Past performance is not a guarantee of future results.
3
WAYCROSS LONG/SHORT EQUITY FUND
PERFORMANCE INFORMATION
February 29, 2016 (Unaudited)
Comparison of the Change in Value of a $100,000 Investment in
Waycross Long/Short Equity Fund versus the S&P 500® Index
and the Credit Suisse AllHedge Long/Short Equity Index
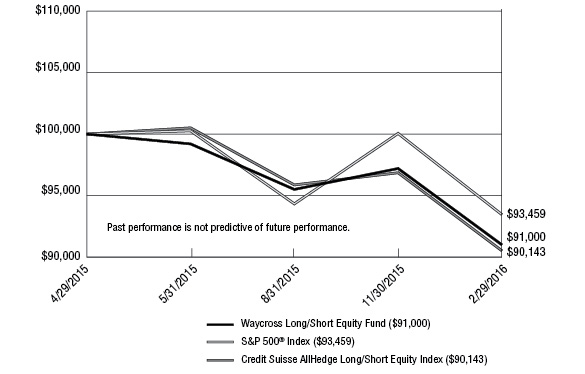
Total Returns For Period Ended February 29, 2016 | ||
Since | ||
Waycross Long/Short Equity Fund (a) | (9.00%) | |
S&P 500® Index | (6.54%) | |
Credit Suisse AllHedge Long/Short Equity Index | (9.86%) | |
(a) | The Fund's total return does not reflect the deduction of taxes a shareholder would pay on Fund distributions or the redemption of Fund shares. |
(b) | The Fund commenced operations on April 29, 2015. |
4
WAYCROSS LONG/SHORT EQUITY FUND
PORTFOLIO INFORMATION
February 29, 2016 (Unaudited)
Net Sector Exposure versus S&P 500® Index*
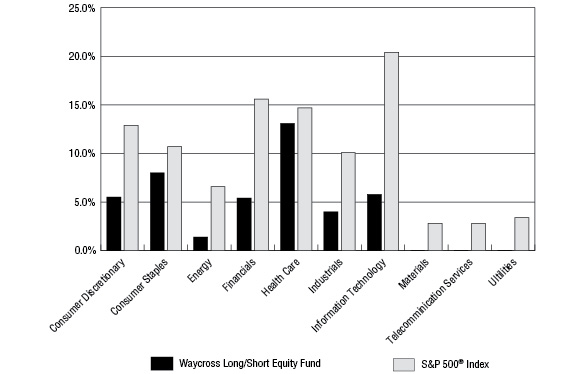
* | The net percentages are computed by taking the net dollar exposure, including short positions, and dividing by the net assets of the Fund. Consequently, the percentages will not total to 100%. |
Top 10 Long Equity Holdings | Top 10 Short Equity Holdings | |||
Security Description | % of | Security Description | % of | |
Coca-Cola Company (The) | 2.8% | Deere & Company | 2.7% | |
Honeywell International, Inc. | 2.8% | DaVita HealthCare Partners, Inc. | 2.3% | |
Starbucks Corporation | 2.8% | Accenture plc - Class A | 2.1% | |
Wal-Mart Stores, Inc. | 2.7% | NVIDIA Corporation | 2.1% | |
Allergan plc | 2.7% | Apache Corporation | 2.0% | |
Facebook, Inc. - Class A | 2.7% | United Parcel Service, Inc. - Class B | 1.9% | |
Union Pacific Corporation | 2.6% | Oracle Corporation | 1.9% | |
Kroger Company (The) | 2.5% | Progressive Corporation (The) | 1.9% | |
Ingersoll-Rand plc | 2.4% | Helmerich & Payne, Inc. | 1.9% | |
Pioneer Natural Resources Company | 2.4% | National Oilwell Varco, Inc. | 1.9% | |
5
WAYCROSS LONG/SHORT EQUITY FUND | ||||||||
COMMON STOCKS — 81.4% | Shares | Value | ||||||
Consumer Discretionary — 8.2% | ||||||||
Hotels, Restaurants & Leisure — 2.8% | ||||||||
Starbucks Corporation | 2,305 | $ | 134,174 | |||||
Media — 3.6% | ||||||||
Comcast Corporation - Class A | 1,500 | 86,595 | ||||||
Time Warner, Inc. | 1,277 | 84,537 | ||||||
171,132 | ||||||||
Specialty Retail — 1.8% | ||||||||
Home Depot, Inc. (The) | 683 | 84,774 | ||||||
Consumer Staples — 8.0% | ||||||||
Beverages — 2.8% | ||||||||
Coca-Cola Company (The) | 3,158 | 136,205 | ||||||
Food & Staples Retailing — 5.2% | ||||||||
Kroger Company (The) | 2,966 | 118,373 | ||||||
Wal-Mart Stores, Inc. | 1,950 | 129,363 | ||||||
247,736 | ||||||||
Energy — 12.1% | ||||||||
Energy Equipment & Services — 3.8% | ||||||||
Baker Hughes, Inc. | 2,062 | 88,398 | ||||||
Schlumberger Ltd. | 1,306 | 93,666 | ||||||
182,064 | ||||||||
Oil, Gas & Consumable Fuels — 8.3% | ||||||||
Cabot Oil & Gas Corporation | 4,410 | 88,773 | ||||||
Cimarex Energy Company | 1,100 | 92,433 | ||||||
Newfield Exploration Company (a) | 3,659 | 99,635 | ||||||
Pioneer Natural Resources Company | 961 | 115,829 | ||||||
396,670 | ||||||||
Financials — 7.3% | ||||||||
Banks — 4.1% | ||||||||
Bank of America Corporation | 7,516 | 94,101 | ||||||
JPMorgan Chase & Company | 1,831 | 103,085 | ||||||
197,186 | ||||||||
Capital Markets — 1.2% | ||||||||
Goldman Sachs Group, Inc. (The) | 393 | 58,765 | ||||||
Insurance — 2.0% | ||||||||
Allstate Corporation (The) | 1,464 | 92,905 | ||||||
6
WAYCROSS LONG/SHORT EQUITY FUND | ||||||||
COMMON STOCKS — 81.4% (Continued) | Shares | Value | ||||||
Health Care — 22.2% | ||||||||
Biotechnology — 5.0% | ||||||||
Biogen, Inc. (a) | 357 | $ | 92,613 | |||||
Celgene Corporation (a) | 760 | 76,631 | ||||||
Gilead Sciences, Inc. | 817 | 71,283 | ||||||
240,527 | ||||||||
Health Care Equipment & Supplies — 6.7% | ||||||||
Boston Scientific Corporation (a) | 6,724 | 114,173 | ||||||
Edwards Lifesciences Corporation (a) | 1,197 | 104,139 | ||||||
Intuitive Surgical, Inc. (a) | 178 | 100,225 | ||||||
318,537 | ||||||||
Health Care Providers & Services — 4.1% | ||||||||
Aetna, Inc. | 838 | 91,032 | ||||||
HCA Holdings, Inc. (a) | 1,508 | 104,369 | ||||||
195,401 | ||||||||
Pharmaceuticals — 6.4% | ||||||||
Allergan plc (a) | 442 | 128,228 | ||||||
Mylan N.V. (a) | 2,110 | 95,098 | ||||||
Pfizer, Inc. | 2,828 | 83,907 | ||||||
307,233 | ||||||||
Industrials — 11.7% | ||||||||
Aerospace & Defense — 2.8% | ||||||||
Honeywell International, Inc. | 1,333 | 135,100 | ||||||
Air Freight & Logistics — 1.9% | ||||||||
FedEx Corporation | 640 | 87,603 | ||||||
Machinery — 2.4% | ||||||||
Ingersoll-Rand plc | 2,088 | 116,009 | ||||||
Road & Rail — 4.6% | ||||||||
Norfolk Southern Corporation | 1,318 | 96,438 | ||||||
Union Pacific Corporation | 1,547 | 121,997 | ||||||
218,435 | ||||||||
Information Technology — 11.9% | ||||||||
Internet Software & Services — 4.7% | ||||||||
Alphabet, Inc. - Class A (a) | 135 | 96,825 | ||||||
Facebook, Inc. - Class A (a) | 1,190 | 127,235 | ||||||
224,060 | ||||||||
IT Services — 2.3% | ||||||||
Visa, Inc. - Class A | 1,520 | 110,033 | ||||||
Semiconductors & Semiconductor Equipment — 1.9% | ||||||||
Texas Instruments, Inc. | 1,716 | 90,982 | ||||||
7
WAYCROSS LONG/SHORT EQUITY FUND | ||||||||
COMMON STOCKS — 81.4% (Continued) | Shares | Value | ||||||
Information Technology — 11.9% (Continued) | ||||||||
Software — 1.8% | ||||||||
Microsoft Corporation | 1,650 | $ | 83,952 | |||||
Technology Hardware, Storage & Peripherals — 1.2% | ||||||||
Apple, Inc. | 610 | 58,981 | ||||||
Total Common Stocks (Cost $3,968,231) | $ | 3,888,464 | ||||||
| ||||||||
MONEY MARKET FUNDS — 1.2% | Shares | Value | ||||||
Fidelity Institutional Money Market Government Portfolio - Class I, 0.21% (b) (Cost $59,141) | 59,141 | $ | 59,141 | |||||
Total Investments at Value — 82.6% (Cost $4,027,372) | $ | 3,947,605 | ||||||
Other Assets in Excess of Liabilities (c) — 17.4% | 832,238 | |||||||
Net Assets — 100.0% | $ | 4,779,843 | ||||||
(a) | Non-income producing security. |
(b) | The rate shown is the 7-day effective yield as of February 29, 2016. |
(c) | Includes cash held as collateral and margin deposits for open short positions. |
See accompanying notes to financial statements. | |
8
WAYCROSS LONG/SHORT EQUITY FUND | ||||||||
COMMON STOCKS — 38.2% | Shares | Value | ||||||
Consumer Discretionary — 2.7% | ||||||||
Internet & Catalog Retail — 0.9% | ||||||||
Netflix, Inc. | 450 | $ | 42,035 | |||||
Media — 1.8% | ||||||||
Walt Disney Company (The) | 920 | 87,878 | ||||||
Energy — 10.7% | ||||||||
Energy Equipment & Services — 5.1% | ||||||||
Helmerich & Payne, Inc. | 1,700 | 90,049 | ||||||
National Oilwell Varco, Inc. | 3,049 | 89,244 | ||||||
Transocean Ltd. | 7,460 | 64,529 | ||||||
243,822 | ||||||||
Oil, Gas & Consumable Fuels — 5.6% | ||||||||
Apache Corporation | 2,530 | 96,849 | ||||||
Chevron Corporation | 1,050 | 87,612 | ||||||
EOG Resources, Inc. | 1,285 | 83,191 | ||||||
267,652 | ||||||||
Financials — 1.9% | ||||||||
Insurance — 1.9% | ||||||||
Progressive Corporation (The) | 2,860 | 91,291 | ||||||
Health Care — 9.1% | ||||||||
Biotechnology — 1.5% | ||||||||
Amgen, Inc. | 513 | 72,989 | ||||||
Health Care Equipment & Supplies — 1.7% | ||||||||
Stryker Corporation | 807 | 80,603 | ||||||
Health Care Providers & Services — 4.1% | ||||||||
DaVita HealthCare Partners, Inc. | 1,644 | 108,455 | ||||||
UnitedHealth Group, Inc. | 711 | 84,680 | ||||||
193,135 | ||||||||
Pharmaceuticals — 1.8% | ||||||||
Merck & Company, Inc. | 1,727 | 86,713 | ||||||
Industrials — 7.7% | ||||||||
Air Freight & Logistics — 1.9% | ||||||||
United Parcel Service, Inc. - Class B | 967 | 93,364 | ||||||
9
WAYCROSS LONG/SHORT EQUITY FUND | ||||||||
COMMON STOCKS — 38.2% (Continued) | Shares | Value | ||||||
Industrials — 7.7% (Continued) | ||||||||
Machinery — 4.0% | ||||||||
Deere & Company | 1,633 | $ | 130,934 | |||||
PACCAR, Inc. | 1,152 | 59,328 | ||||||
190,262 | ||||||||
Road & Rail — 1.8% | ||||||||
Werner Enterprises, Inc. | 3,190 | 84,694 | ||||||
Information Technology — 6.1% | ||||||||
IT Services — 2.1% | ||||||||
Accenture plc - Class A | 1,000 | 100,260 | ||||||
Semiconductors & Semiconductor Equipment — 2.1% | ||||||||
NVIDIA Corporation | 3,160 | 99,098 | ||||||
Software — 1.9% | ||||||||
Oracle Corporation | 2,485 | 91,398 | ||||||
Total Securities Sold Short — 38.2% (Proceeds $1,889,090) | $ | 1,825,194 | ||||||
See accompanying notes to financial statements. |
10
WAYCROSS LONG/SHORT EQUITY FUND | ||||
ASSETS | ||||
Investments in securities: | ||||
At acquisition cost | $ | 4,027,372 | ||
At value (Note 2) | $ | 3,947,605 | ||
Cash deposits for securities sold short (Note 2) | 2,682,246 | |||
Dividends receivable | 5,843 | |||
Receivable for investment securities sold | 98,730 | |||
Receivable from Adviser (Note 4) | 1,716 | |||
Other assets | 3,448 | |||
Total assets | 6,739,588 | |||
LIABILITIES | ||||
Securities sold short, at value (proceeds $1,889,090) (Note 2) | 1,825,194 | |||
Payable for investment securities purchased | 51,429 | |||
Payable for capital shares redeemed | 68,685 | |||
Dividends payable on securities sold short (Note 2) | 4,554 | |||
Payable to administrator (Note 4) | 6,039 | |||
Accrued brokerage expense on securities sold short (Note 2) | 55 | |||
Other accrued expenses | 3,789 | |||
Total liabilities | 1,959,745 | |||
NET ASSETS | $ | 4,779,843 | ||
NET ASSETS CONSIST OF: | ||||
Paid-in capital | $ | 5,084,330 | ||
Accumulated net investment loss | (16,448 | ) | ||
Accumulated net realized losses from security transactions | (272,168 | ) | ||
Net unrealized appreciation (depreciation) on: | ||||
Investments | (79,767 | ) | ||
Short positions | 63,896 | |||
NET ASSETS | $ | 4,779,843 | ||
Shares of beneficial interest outstanding (unlimited number of shares authorized, no par value) | 525,264 | |||
Net asset value, offering price and redemption price per share (Note 2) | $ | 9.10 | ||
See accompanying notes to financial statements. |
11
WAYCROSS LONG/SHORT EQUITY FUND | ||||
INVESTMENT INCOME | ||||
Dividend income | $ | 26,798 | ||
EXPENSES | ||||
Investment advisory fees (Note 4) | 56,073 | |||
Dividend expense on securities sold short (Note 2) | 29,190 | |||
Fund accounting fees (Note 4) | 20,283 | |||
Administration fees (Note 4) | 20,000 | |||
Professional fees | 15,993 | |||
Trustees' fees and expenses (Note 4) | 11,008 | |||
Compliance fees (Note 4) | 10,000 | |||
Transfer agent fees (Note 4) | 10,000 | |||
Custody and bank service fees | 7,176 | |||
Registration and filing fees | 6,818 | |||
Postage and supplies | 3,673 | |||
Brokerage expense on securities sold short (Note 2) | 3,529 | |||
Insurance expense | 3,006 | |||
Printing of shareholder reports | 2,431 | |||
Other expenses | 5,781 | |||
Total expenses | 204,961 | |||
Less fee reductions and expense reimbursements by the Adviser (Note 4) | (107,661 | ) | ||
Less fee waivers by the administrator (Note 4) | (4,000 | ) | ||
Net expenses | 93,300 | |||
NET INVESTMENT LOSS | (66,502 | ) | ||
REALIZED AND UNREALIZED GAINS (LOSSES) ON INVESTMENTS | ||||
Net realized gains (losses) from: | ||||
Investments | (407,027 | ) | ||
Securities sold short | 137,019 | |||
Net change in unrealized appreciation/depreciation on: | ||||
Investments | (79,767 | ) | ||
Securities sold short | 63,896 | |||
NET REALIZED AND UNREALIZED LOSSES ON INVESTMENTS | (285,879 | ) | ||
NET DECREASE IN NET ASSETS RESULTING FROM OPERATIONS | $ | (352,381 | ) | |
(a) | Represents the period from the commencement of operations (April 29, 2015) through February 29, 2016. |
See accompanying notes to financial statements. | |
12
WAYCROSS LONG/SHORT EQUITY FUND | ||||
| Period Ended | |||
FROM OPERATIONS | ||||
Net investment loss | $ | (66,502 | ) | |
Net realized gains (losses) from: | ||||
Investments | (407,027 | ) | ||
Securities sold short | 137,019 | |||
Net change in unrealized appreciation/depreciation on: | ||||
Investments | (79,767 | ) | ||
Securities sold short | 63,896 | |||
Net decrease in net assets resulting from operations | (352,381 | ) | ||
CAPITAL SHARE TRANSACTIONS | ||||
Proceeds from shares sold | 5,517,869 | |||
Payments for shares redeemed | (385,645 | ) | ||
Net increase in net assets from capital share transactions | 5,132,224 | |||
TOTAL INCREASE IN NET ASSETS | 4,779,843 | |||
NET ASSETS | ||||
Beginning of period | — | |||
End of period | $ | 4,779,843 | ||
ACCUMULATED NET INVESTMENT LOSS | $ | (16,448 | ) | |
CAPITAL SHARE ACTIVITY | ||||
Shares sold | 565,823 | |||
Shares redeemed | (40,559 | ) | ||
Net increase in shares outstanding | 525,264 | |||
Shares outstanding at beginning of period | — | |||
Shares outstanding at end of period | 525,264 | |||
(a) | Represents the period from the commencement of operations (April 29, 2015) through February 29, 2016. |
See accompanying notes to financial statements. | |
13
WAYCROSS LONG/SHORT EQUITY FUND | ||||
Per Share Data for a Share Outstanding Throughout the Period | ||||
| Period Ended | |||
Net asset value at beginning of period | $ | 10.00 | ||
Loss from investment operations: | ||||
Net investment loss | (0.13 | ) | ||
Net realized and unrealized losses on investments | (0.77 | ) | ||
Total from investment operations | (0.90 | ) | ||
Net asset value at end of period | $ | 9.10 | ||
Total return (b) | (9.00% | )(c) | ||
Net assets at end of period (000's) | $ | 4,780 | ||
Ratios/supplementary data: | ||||
Ratio of total expenses to average net assets | 7.25 | %(d) | ||
Ratio of net expenses to average net assets (e) | 3.30 | %(d) | ||
Ratio of net expenses to average net assets excluding dividend expense, borrowing costs and brokerage expense on securities sold short (e) | 2.15 | %(d) | ||
Ratio of net investment loss to average net assets (e) | (2.34% | )(d) | ||
Portfolio turnover rate | 134 | %(c) | ||
(a) | Represents the period from the commencement of operations (April 29, 2015) through February 29, 2016. |
(b) | Total return is a measure of the change in value of an investment in the Fund over the period covered. The return shown does not reflect the deduction of taxes a shareholder would pay on Fund distributions, if any, or the redemption of Fund shares. The total return would be lower if the Adviser and administrator had not reduced fees and reimbursed expenses (Note 4). |
(c) | Not annualized. |
(d) | Annualized. |
(e) | Ratio was determined after fee reductions and expense reimbursements (Note 4). |
See accompanying notes to financial statements. | |
14
WAYCROSS LONG/SHORT EQUITY FUND
NOTES TO FINANCIAL STATEMENTS
February 29, 2016
1. Organization
Waycross Long/Short Equity Fund (the “Fund”) is a diversified series of Ultimus Managers Trust (the “Trust”), an open-end investment company established as an Ohio business trust under a Declaration of Trust dated February 28, 2012. Other series of the Trust are not incorporated in this report. The Fund commenced operations on April 29, 2015.
The investment objective of the Fund is long-term capital appreciation with a secondary emphasis on capital preservation.
2. Significant Accounting Policies
The following is a summary of the Fund’s significant accounting policies. These policies are in conformity with accounting principles generally accepted in the United States of America (“GAAP”). As an investment company, as defined in Financial Accounting Standards Board (“FASB”) Accounting Standards Update 2013-08, the Fund follows accounting and reporting guidance under FASB Accounting Standards Codification Topic 946, “Financial Services – Investment Companies.”
Securities valuation – The Fund values its portfolio securities at market value as of the close of regular trading on the New York Stock Exchange (the “NYSE”) (normally 4:00 p.m. Eastern time) on each day the NYSE is open for business. The Fund values its listed securities on the basis of the security’s last sale price on the security’s primary exchange, if available, otherwise at the exchange’s most recently quoted bid price. NASDAQ-listed securities are valued at the NASDAQ Official Closing Price. In the event that market quotations are not readily available or are considered unreliable due to market or other events, the Fund values its securities and other assets at fair value in accordance with procedures established by and under the general supervision of the Board of Trustees (the “Board”) of the Trust. Under these procedures, the securities will be classified as Level 2 or 3 within the fair value hierarchy (see below), depending on the inputs used. Unavailable or unreliable market quotes may be due to the following factors: a substantial bid-ask spread; infrequent sales resulting in stale prices; insufficient trading volume; small trade sizes; a temporary lapse in any reliable pricing source; and actions of the securities or futures markets, such as the suspension or limitation of trading. As a result, the prices of securities used to calculate the Fund’s net asset value (“NAV”) may differ from quoted or published prices for the same securities.
GAAP establishes a single authoritative definition of fair value, sets out a framework for measuring fair value, and requires additional disclosures about fair value measurements.
Various inputs are used in determining the value of the Fund’s investments. These inputs are summarized in the three broad levels listed below:
● | Level 1 – quoted prices in active markets for identical securities |
15
WAYCROSS LONG/SHORT EQUITY FUND
NOTES TO FINANCIAL STATEMENTS (Continued)
● | Level 2 – other significant observable inputs |
● | Level 3 – significant unobservable inputs |
The inputs or methods used for valuing securities are not necessarily an indication of the risks associated with investing in those securities. The inputs used to measure fair value may fall into different levels of the fair value hierarchy. In such cases, for disclosure purposes, the level in the fair value hierarchy within which the fair value measurement falls in its entirety is determined based on the lowest level input that is significant to the fair value measurement.
The following is a summary of the inputs used to value the Fund’s investments and other financial instruments as of February 29, 2016:
| Level 1 | Level 2 | Level 3 | Total | ||||||||||||
Investments in Securities | ||||||||||||||||
Common Stocks | $ | 3,888,464 | $ | — | $ | — | $ | 3,888,464 | ||||||||
Money Market Funds | 59,141 | — | — | 59,141 | ||||||||||||
Total | $ | 3,947,605 | $ | — | $ | — | $ | 3,947,605 | ||||||||
Other Financial Instruments | ||||||||||||||||
Securities Sold Short - Common Stocks | $ | (1,825,194 | ) | $ | — | $ | — | $ | (1,825,194 | ) | ||||||
Refer to the Fund’s Schedule of Investments and Schedule of Securities Sold Short for a listing of the common stocks by industry type. As of February 29, 2016, the Fund did not have any transfers between Levels. In addition, the Fund did not hold derivative instruments or have any assets or liabilities that were measured at fair value on a recurring basis using significant unobservable inputs (Level 3) as of February 29, 2016. It is the Fund’s policy to recognize transfers between Levels at the end of the reporting period.
Share valuation – The NAV per share of the Fund is calculated daily by dividing the total value of the Fund’s assets, less liabilities, by the number of shares outstanding. The offering price and redemption price per share of the Fund is equal to the NAV per share.
Investment income – Dividend income and expense is recorded on the ex-dividend date. Interest income is accrued as earned.
Security transactions – Security transactions are accounted for on the trade date. Gains and losses on securities sold are determined on a specific identification basis.
Common expenses – Common expenses of the Trust are allocated among the Fund and the other series of the Trust based on the relative net assets of each series or the nature of the services performed and the relative applicability to each series.
16
WAYCROSS LONG/SHORT EQUITY FUND
NOTES TO FINANCIAL STATEMENTS (Continued)
Distributions to shareholders – Distributions to shareholders arising from net investment income, if any, are declared and paid annually to shareholders. Net realized capital gains, if any, are distributed at least annually. The amount of distributions from net investment income and net realized capital gains are determined in accordance with federal income tax regulations, which may differ from GAAP. Dividends and distributions to shareholders are recorded on the ex-dividend date. There were no distributions paid to shareholders during the period ended February 29, 2016.
Short sales – The Fund may sell securities short. For financial statement purposes, an amount equal to the settlement amount is included in the Statement of Assets and Liabilities as an asset and an equivalent liability is then subsequently marked-to-market daily to reflect the current value of the short position. Subsequent fluctuations in the market prices of securities sold, but not yet purchased, may require purchasing the securities at prices that may differ from the market value reflected on the Statement of Assets and Liabilities. The Fund is liable for any dividends payable on securities while those securities are in a short position and will also bear other costs, such as charges for the prime brokerage accounts, in connection with the short position. These costs are reported as dividend expense and brokerage expense on securities sold short, respectively, in the Statement of Operations. As collateral for its short positions, the Fund is required under the Investment Company Act of 1940, as amended (the “1940 Act”), to maintain assets consisting of cash, cash equivalents or other liquid securities equal to the market value of the securities sold short. The cash deposits with brokers for securities sold short are reported on the Statement of Assets and Liabilities. The amount of collateral is required to be adjusted daily to reflect changes in the value of the securities sold short. To the extent the Fund invests the proceeds received from selling securities short, it is engaging in a form of leverage. The use of leverage by the Fund may make any change in the Fund’s NAV greater than it would be without the use of leverage. Short sales are speculative transactions and involve special risks, including greater reliance on the ability of Waycross Partners, LLC (the “Adviser”) to accurately anticipate the future value of a security.
Estimates – The preparation of financial statements in conformity with GAAP requires management to make estimates and assumptions that affect the reported amounts of assets and liabilities and disclosure of contingent assets and liabilities, as of the date of the financial statements and the reported amounts of income and expenses during the reporting period. Actual results could differ from those estimates.
Federal income tax – The Fund has qualified and intends to continue to qualify as a regulated investment company under the Internal Revenue Code of 1986 (the “Code”). Qualification generally will relieve the Fund of liability for federal income taxes to the extent 100% of its net investment income and net realized capital gains are distributed in accordance with the Code. Accordingly, no provision for income tax has been made.
17
WAYCROSS LONG/SHORT EQUITY FUND
NOTES TO FINANCIAL STATEMENTS (Continued)
In order to avoid imposition of the excise tax applicable to regulated investment companies, it is also the Fund’s intention to declare as dividends in each calendar year at least 98% of its net investment income (earned during the calendar year) and 98.2% of its net realized capital gains (earned during the 12 months ended October 31) plus undistributed amounts from prior years.
The following information is computed on a tax basis for each item as of February 29, 2016:
Tax cost of investments in securities | $ | 4,061,619 | ||
Gross unrealized appreciation | $ | 125,013 | ||
Gross unrealized depreciation | (239,027 | ) | ||
Net unrealized depreciation on investment securities | (114,014 | ) | ||
Net unrealized appreciation on securities sold short | 81,920 | |||
Accumulated capital and other losses | (272,393 | ) | ||
Accumulated deficit | $ | (304,487 | ) |
As of February 29, 2016, the proceeds of securities sold short on a tax basis is $1,907,114.
The federal income tax cost of portfolio investments and securities sold short and the tax components of accumulated deficit and the financial statement cost of portfolio investments and components of net assets may be temporarily different (“book/tax difference”). These book/tax differences are due to the recognition of capital gains or losses under income tax regulations and GAAP, primarily due to the tax deferral of losses on wash sales.
Net qualified late year ordinary losses incurred after December 31, 2015 and within the taxable year are deemed to arise on the first day of the Fund’s next taxable year. For the period ended February 29, 2016, the Fund intends to defer $16,447 of late year ordinary losses to March 1, 2016 for federal income tax purposes.
As of February 29, 2016, the Fund has a short-term capital loss carryforward of $129,820 for federal income tax purposes, which does not expire. In addition, the Fund had net realized capital losses of $126,126 during the period November 1, 2015 through February 29, 2016, which are treated for federal income tax purposes as arising during the Fund’s tax year ending February 28, 2017. This capital loss carryforward and post-October losses may be utilized in future years to offset net realized capital gains, if any, prior to distribution to shareholders.
For the period ended February 29, 2016, the Fund reclassified $47,894 and $2,160 of net investment loss against paid-in capital and accumulated net realized losses from security transactions, respectively, on the Statement of Assets and Liabilities. Such reclassifications, the result of permanent differences between the financial statement and income tax reporting requirements, have no effect on the Fund’s net assets or NAV per share.
18
WAYCROSS LONG/SHORT EQUITY FUND
NOTES TO FINANCIAL STATEMENTS (Continued)
The Fund recognizes the tax benefits or expenses of uncertain tax positions only when the position is “more likely than not” to be sustained assuming examination by tax authorities. Management has reviewed the Fund’s tax positions for the tax period ended February 29, 2016 and has concluded that no provision for unrecognized tax benefits or expenses is required in these financial statements. The Fund is subject to examination by U.S. federal tax authorities for the current interim tax period.
3. Investment Transactions
During the period ended February 29, 2016, cost of purchases and proceeds from sales of investment securities, other than short-term investments and short positions, were $7,809,415 and $3,433,829, respectively.
4. Transactions with Related Parties
INVESTMENT ADVISORY AGREEMENT
The Fund’s investments are managed by the Adviser pursuant to the terms of an Investment Advisory Agreement. Under the Investment Advisory Agreement, the Fund pays the Adviser an advisory fee, computed and accrued daily and paid monthly, at the annual rate of 1.99% of its average daily net assets.
Pursuant to an Expense Limitation Agreement between the Fund and the Adviser (the “ELA”), the Adviser has contractually agreed, until March 31, 2018, to reduce investment advisory fees and reimburse other expenses to limit Total Annual Operating Expenses (exclusive of brokerage costs; taxes; borrowing costs such as interest and dividend expenses on securities sold short; interest; acquired fund fees and expenses; costs to organize the Fund; extraordinary expenses such as litigation and merger or reorganization costs and other expenses not incurred in the ordinary course of the Fund’s business), to an amount not exceeding 2.15% of the Fund’s average daily net assets. Accordingly, during the period ended February 29, 2016, the Adviser did not collect any of its advisory fees and, in addition, reimbursed other operating expenses totaling $51,588.
Under the terms of the ELA, investment advisory fee reductions and expense reimbursements by the Adviser are subject to repayment by the Fund for a period of three years after such fees and expense reimbursements were incurred, provided that the repayments do not cause Total Annual Operating Expenses to exceed (i) the expense limitations then in effect, if any, and (ii) the expense limitations in effect at the time the expenses to be repaid were incurred. As of February 29, 2016, the Adviser may seek repayment of investment advisory fee reductions and expense reimbursements totaling $107,661 no later than February 28, 2019.
An officer of the Fund is also an officer of the Adviser.
19
WAYCROSS LONG/SHORT EQUITY FUND
NOTES TO FINANCIAL STATEMENTS (Continued)
OTHER SERVICE PROVIDERS
Ultimus Fund Solutions, LLC (“Ultimus”) provides fund administration, fund accounting, compliance and transfer agency services to the Fund. The Fund pays Ultimus fees in accordance with the agreements for such services. In addition, the Fund pays out-of-pocket expenses including but not limited to postage, supplies and costs of pricing the Fund’s portfolio securities. During the period ended February 29, 2016, Ultimus voluntarily waived fees in the amount of $4,000. These voluntary waivers are not subject to recoupment by Ultimus.
DISTRIBUTION AGREEMENT
Under the terms of a Distribution Agreement with the Trust, Ultimus Fund Distributors, LLC (the “Distributor”) serves as principal underwriter to the Fund. The Distributor is a wholly-owned subsidiary of Ultimus.
Certain officers and a Trustee of the Trust are also officers of Ultimus and the Distributor.
TRUSTEE COMPENSATION
Each Independent Trustee receives from the Fund a $500 annual retainer and a fee of $500 for each Board meeting attended plus reimbursement of travel and other meeting-related expenses.
PRINCIPAL HOLDERS OF FUND SHARES
As of February 29, 2016, the following shareholders owned of record 5% or more of the outstanding shares of the Fund:
Name of Record Owner | % Ownership |
Maril & Company (for benefit of its customers) | 46% |
National Financial Services, LLC (for benefit of its customers) | 41% |
Charles Schwab & Co., Inc. (for benefit of its customers) | 5% |
A beneficial owner of 25% or more of a Fund’s outstanding shares may be considered a controlling person. That shareholder’s vote could have a more significant effect on matters presented at a shareholder’s meeting.
5. Contingencies and Commitments
The Fund indemnifies the Trust’s officers and Trustees for certain liabilities that might arise from their performance of their duties to the Fund. Additionally, in the normal course of business the Fund enters into contracts that contain a variety of representations and warranties and which provide general indemnifications. The Fund’s maximum exposure under these arrangements is unknown, as this would involve future claims that may be made against the Fund that have not yet occurred. However, based on experience, the Fund expects the risk of loss to be remote.
20
WAYCROSS LONG/SHORT EQUITY FUND
NOTES TO FINANCIAL STATEMENTS (Continued)
6. Subsequent Events
The Fund is required to recognize in the financial statements the effects of all subsequent events that provide additional evidence about conditions that existed as of the date of the Statement of Assets and Liabilities. For non-recognized subsequent events that must be disclosed to keep the financial statements from being misleading, the Fund is required to disclose the nature of the event as well as an estimate of its financial effect, or a statement that such an estimate cannot be made. Management has evaluated subsequent events through the issuance of these financial statements and has noted no such events.
21
WAYCROSS LONG/SHORT EQUITY FUND
REPORT OF INDEPENDENT REGISTERED
PUBLIC ACCOUNTING FIRM
To the Shareholders of Waycross Long/Short Equity Fund and
Board of Trustees of Ultimus Managers Trust
We have audited the accompanying statement of assets and liabilities, including the schedules of investments and securities sold short, of Waycross Long/Short Equity Fund (the “Fund”), a series of Ultimus Managers Trust, as of February 29, 2016, and the related statements of operations and changes in net assets and the financial highlights for the period April 29, 2015 (commencement of operations) through February 29, 2016. These financial statements and financial highlights are the responsibility of the Fund’s management. Our responsibility is to express an opinion on these financial statements and financial highlights based on our audit.
We conducted our audit in accordance with the standards of the Public Company Accounting Oversight Board (United States). Those standards require that we plan and perform the audit to obtain reasonable assurance about whether the financial statements and financial highlights are free of material misstatement. An audit includes examining, on a test basis, evidence supporting the amounts and disclosures in the financial statements. Our procedures included confirmation of securities owned as of February 29, 2016, by correspondence with the custodian and brokers. An audit also includes assessing the accounting principles used and significant estimates made by management, as well as evaluating the overall financial statement presentation. We believe that our audit provides a reasonable basis for our opinion.
In our opinion, the financial statements and financial highlights referred to above present fairly, in all material respects, the financial position of Waycross Long/Short Equity Fund as of February 29, 2016, the results of its operations, the changes in its net assets, and the financial highlights for the period April 29, 2015 (commencement of operations) through February 29, 2016, in conformity with accounting principles generally accepted in the United States of America.
COHEN FUND AUDIT SERVICES, LTD.
Cleveland, Ohio
April 27, 2016
22
WAYCROSS LONG/SHORT EQUITY FUND
ABOUT YOUR FUND’S EXPENSES (Unaudited)
We believe it is important for you to understand the impact of costs on your investment. As a shareholder of the Fund, you incur ongoing costs, including management fees and other operating expenses. The following examples are intended to help you understand your ongoing costs (in dollars) of investing in the Fund and to compare these costs with the ongoing costs of investing in other mutual funds.
A mutual fund’s ongoing costs are expressed as a percentage of its average net assets. This figure is known as the expense ratio. The expenses in the table below are based on an investment of $1,000 made at the beginning of the most recent period (September 1, 2015) and held until the end of the period (February 29, 2016).
The table below illustrates the Fund’s ongoing costs in two ways:
Actual fund return – This section helps you to estimate the actual expenses that you paid over the period. The “Ending Account Value” shown is derived from the Fund’s actual return, and the fourth column shows the dollar amount of operating expenses that would have been paid by an investor who started with $1,000 in the Fund. You may use the information here, together with the amount you invested, to estimate the expenses that you paid over the period.
To do so, simply divide your account value by $1,000 (for example, an $8,600 account value divided by $1,000 = 8.6), then multiply the result by the number given for the Fund under the heading “Expenses Paid During Period.”
Hypothetical 5% return – This section is intended to help you compare the Fund’s ongoing costs with those of other mutual funds. It assumes that the Fund had an annual return of 5% before expenses during the period shown, but that the expense ratio is unchanged. In this case, because the return used is not the Fund’s actual return, the results do not apply to your investment. The example is useful in making comparisons because the U.S. Securities and Exchange Commission (“SEC”) requires all mutual funds to calculate expenses based on a 5% return. You can assess the Fund’s ongoing costs by comparing this hypothetical example with the hypothetical examples that appear in shareholder reports of other funds.
Note that expenses shown in the table are meant to highlight and help you compare ongoing costs only. The Fund does not charge transaction fees, such as purchase or redemption fees, nor does it carry a “sales load.”
The calculations assume no shares were bought or sold during the period. Your actual costs may have been higher or lower, depending on the amount of your investment and the timing of any purchases or redemptions.
23
WAYCROSS LONG/SHORT EQUITY FUND
ABOUT YOUR FUND’S EXPENSES (Unaudited) (Continued)
More information about the Fund’s expenses can be found in this report. For additional information on operating expenses and other shareholder costs, please refer to the Fund’s prospectus.
| Beginning September 1, | Ending | Net | Expenses |
Based on Actual Fund Return | $1,000.00 | $ 952.90 | 2.27% | $11.02 |
Based on Hypothetical 5% Return (before expenses) | $1,000.00 | $ 1,013.58 | 2.27% | $11.36 |
(a) | Expenses are equal to the Fund's annualized expense ratio multiplied by the average account value over the period, multiplied by 182/366 (to reflect the one-half year period). |
24
WAYCROSS LONG/SHORT EQUITY FUND
OTHER INFORMATION (Unaudited)
A description of the policies and procedures that the Fund uses to vote proxies relating to portfolio securities is available without charge upon request by calling toll-free 1-866-267-4304, or on the SEC’s website at http://www.sec.gov. Information regarding how the Fund voted proxies relating to portfolio securities during the most recent period ended June 30 is also available without charge upon request by calling toll-free 1-866-267-4304, or on the SEC’s website at http://www.sec.gov.
The Trust files a complete listing of portfolio holdings for the Fund with the SEC as of the end of the first and third quarters of each fiscal year on Form N-Q. These filings are available upon request by calling 1-866-267-4304. Furthermore, you may obtain a copy of the filings on the SEC’s website at http://www.sec.gov. The Trust’s Forms N-Q may also be reviewed and copied at the SEC’s Public Reference Room in Washington, DC, and information on the operation of the Public Reference Room may be obtained by calling 1-800-SEC-0330.
25
WAYCROSS LONG/SHORT EQUITY FUND
BOARD OF TRUSTEES AND EXECUTIVE OFFICERS
(Unaudited)
The Board has overall responsibility for management of the Trust’s affairs. The Trustees serve during the lifetime of the Trust and until its termination, or until death, resignation, retirement, or removal. The Trustees, in turn, elect the officers of the Fund to actively supervise its day-to-day operations. The officers have been elected for an annual term. Unless otherwise noted, each Trustee’s and officer’s address is 225 Pictoria Drive, Suite 450, Cincinnati, Ohio 45246. The following are the Trustees and executive officers of the Fund:
Name and | Length of Time Served | Position(s) | Principal Occupation(s) | Number of Funds in Trust Overseen by Trustee | Directorships of Public Companies Held by Trustee During Past 5 Years |
Interested Trustees: | |||||
Robert G. Dorsey* Year of Birth: 1957 | Since | Trustee (February 2012 to present)
President (June 2012 to October 2013) | Managing Director of Ultimus Fund Solutions, LLC and Ultimus Fund Distributors, LLC (1999 to present) | 21 | n/a |
Independent Trustees: | |||||
Janine L. Cohen Year of Birth: 1952 | Since January 2016 | Trustee | Retired since 2013;Chief Financial Officer from 2004 to 2013 and Chief Compliance Officer from 2008 to 2013 at AER Advisors, Inc. | 21 | n/a |
John C. Davis Year of Birth: 1952 | Since | Chairman (July 2014
Trustee (June 2012 to present) | Consultant since May 2011; Retired partner of PricewaterhouseCoopers LLP (1974 to 2010) | 21 | n/a |
David M. Deptula Year of Birth: 1958 | Since | Trustee | Vice President of Legal and Special Projects at Dayton Freight Lines, Inc. since 2016; Vice President of Tax Treasury at Standard Register, Inc. (formerly The Standard Register Company) from 2011 to 2016 | 21 | n/a |
26
WAYCROSS LONG/SHORT EQUITY FUND
BOARD OF TRUSTEES AND EXECUTIVE OFFICERS
(Unaudited) (Continued)
Name and | Length of Time Served | Position(s) | Principal Occupation(s) | Number of Funds in Trust Overseen by Trustee | Directorships of Public Companies Held by Trustee During Past 5 Years |
Independent Trustees: (Continued) | |||||
John J. Discepoli Year of Birth: 1963 | Since | Trustee | Owner of Discepoli Financial Planning, LLC (personal financial planning company) since 2004 | 21 | n/a |
* | Mr. Dorsey is considered an “interested person” of the Trust within the meaning of Section 2(a)(19) of the Investment Company Act of 1940, as amended, because of his relationship with the Trust’s administrator, transfer agent and distributor. Mr. Dorsey was President of the Trust from June 2012 to October 2013. |
Name and | Length of Time Served | Position(s) | Principal Occupation(s) During Past 5 Years |
Executive Officers: | |||
Benjamin H. Thomas 401 West Main Street Suite 2100 Louisville, KY 40202 Year of Birth: 1974 | Since | Principal | Founder, Managing Partner and Portfolio Manager for Waycross Partners, LLC (2005 to present) |
David R. Carson Year of Birth: 1958 | Since | President (October 2013 to present)
Vice President October 2013) | Vice President and Director of Client Strategies of Ultimus Fund Solutions, LLC (2013 to present); Chief Compliance Officer, FSI LBAR Fund (2013 to present); Chief Compliance Officer, The Huntington Funds (2005 to 2013), The Flex-Funds (2006 to 2011), Meeder Financial (2007 to 2011), Huntington Strategy Shares (2012 to 2013), and Huntington Asset Advisors (2013); Vice President, Huntington National Bank (2001 to 2013) |
Jennifer L. Leamer Year of Birth: 1976 | Since | Treasurer
Assistant Treasurer (April 2014 to October 2014) | Vice President, Mutual Fund Controller of Ultimus Fund Solutions, LLC (2014 to present); Business Analyst of Ultimus Fund Solutions, LLC (2007 to 2014) |
27
WAYCROSS LONG/SHORT EQUITY FUND
BOARD OF TRUSTEES AND EXECUTIVE OFFICERS
(Unaudited) (Continued)
Name and | Length of Time Served | Position(s) | Principal Occupation(s) During Past 5 Years |
Executive Officers: (Continued) | |||
Bo J. Howell Year of Birth: 1981 | Since | Secretary
Assistant April 2015) | Vice President, Director of Fund Administration for Ultimus Fund Solutions, LLC (2014 to present); Counsel – Securities and Mutual Funds for Western & Southern Financial Group (2012 to 2014); U.S. Securities and Exchange Commission, Senior Counsel (2009 to 2012) |
Charles C. Black Year of Birth: 1979 | Since 2015 | Chief to present)
Assistant Chief January 2016) | Senior Compliance Officer of Ultimus Fund Solutions, LLC (2015 to present); Senior Compliance Manager for Touchstone Mutual Funds (2013 to 2015); Senior Compliance Manager for Fund Evaluation Group (2011 to 2013); Regulatory Administration Specialist for JPMorgan Chase Bank (2006 to 2011) |
Additional information about members of the Board and executive officers is available in the Fund’s Statement of Additional Information (“SAI”). To obtain a free copy of the SAI, please call 1-866-267-4304.
28
This page intentionally left blank.
| (a) | Audit Fees. The aggregate fees billed for professional services rendered by the principal accountant for the audit of the registrant’s annual financial statements or for services that are normally provided by the accountant in connection with statutory and regulatory filings or engagements were $14,000 with respect to the registrant’s fiscal year ended February 29, 2016. |
| (b) | Audit-Related Fees. No fees were billed in the last fiscal year for assurance and related services by the principal accountant that are reasonably related to the performance of the audit of the registrant’s financial statements and are not reported under paragraph (a) of this Item. |
| (c) | Tax Fees. The aggregate fees billed for professional services rendered by the principal accountant for tax compliance, tax advice, and tax planning were $3,000 with respect to the registrant’s fiscal year ended February 29, 2016. The services comprising these fees are the preparation of the registrant’s federal income and excise tax returns. |
| (d) | All Other Fees. No fees were billed in the last fiscal year for products and services provided by the principal accountant, other than the services reported in paragraphs (a) through (c) of this Item. |
| (e)(2) | None of the services described in paragraph (b) through (d) of this Item were approved by the audit committee pursuant to paragraph (c)(7)(i)(C) of Rule 2-01 of Regulation S-X. |
| (f) | Less than 50% of hours expended on the principal accountant’s engagement to audit the registrant’s financial statements for the most recent fiscal year were attributed to work performed by persons other than the principal accountant’s full-time, permanent employees. |
| (g) | During the fiscal year ended February 29, 2016, aggregate non-audit fees of $3,000 were billed by the registrant’s principal accountant for services rendered to the registrant. No non-audit fees were billed in the last fiscal year by the registrant’s principal accountant for services rendered to the registrant’s investment adviser (not including any sub-adviser whose role is primarily portfolio management and is subcontracted with or overseen by another investment adviser), and any entity controlling, controlled by, or under common control with the adviser that provides ongoing services to the registrant. |
| (h) | The principal accountant has not provided any non-audit services to the registrant’s investment adviser (not including any sub-adviser whose role is primarily portfolio management and is subcontracted with or overseen by another investment adviser), and any entity controlling, controlled by, or under common control with the investment adviser that provides ongoing services to the registrant. |
| (a) | Not applicable [schedule filed with Item 1] |
| (b) | Not applicable |
| Item 8. | Portfolio Managers of Closed-End Management Investment Companies. |
| Exhibit 99.CODE ETH | Code of Ethics |
| Exhibit 99.CERT | Certifications required by Rule 30a-2(a) under the Act |
| Exhibit 99.906CERT | Certifications required by Rule 30a-2(b) under the Act |
| (Registrant) | Ultimus Managers Trust | ||
| By (Signature and Title)* | /s/ Frank L. Newbauer | ||
| Frank L. Newbauer, Assistant Secretary | |||
| Date | May 9, 2016 | ||
| Pursuant to the requirements of the Securities Exchange Act of 1934 and the Investment Company Act of 1940, this report has been signed below by the following persons on behalf of the registrant and in the capacities and on the dates indicated. | |||
| By (Signature and Title)* | /s/ Benjamin H. Thomas | ||
| Benjamin H. Thomas, Principal Executive Officer of Waycross Long/Short Equity Fund | |||
| Date | May 9, 2016 | ||
| By (Signature and Title)* | /s/ Jennifer L. Leamer | ||
| Jennifer L. Leamer, Treasurer and Principal Accounting Officer | |||
| Date | May 9, 2016 | ||