| OMB APPROVAL |
OMB Number: 3235-0570
Expires: July 31, 2022
Estimated average burden hours per response: 20.6 |
UNITED STATES
SECURITIES AND EXCHANGE COMMISSION
Washington, D.C. 20549
FORM N-CSR
CERTIFIED SHAREHOLDER REPORT OF REGISTERED
MANAGEMENT INVESTMENT COMPANIES
| Investment Company Act file number | 811-22680 |
| Ultimus Managers Trust |
| (Exact name of registrant as specified in charter) |
| 225 Pictoria Drive, Suite 450 Cincinnati, Ohio | 45246 |
| (Address of principal executive offices) | (Zip code) |
Khimmara Greer
| Ultimus Fund Solutions, LLC 225 Pictoria Drive, Suite 450 Cincinnati, Ohio 45246_ |
| (Name and address of agent for service) |
| Registrant's telephone number, including area code: | (513) 587-3400 |
| Date of fiscal year end: | February 28 | |
| Date of reporting period: | February 28, 2022 |
Form N-CSR is to be used by management investment companies to file reports with the Commission not later than 10 days after the transmission to stockholders of any report that is required to be transmitted to stockholders under Rule 30e-1 under the Investment Company Act of 1940 (17 CFR 270.30e-1). The Commission may use the information provided on Form N-CSR in its regulatory, disclosure review, inspection, and policymaking roles.
A registrant is required to disclose the information specified by Form N-CSR, and the Commission will make this information public. A registrant is not required to respond to the collection of information contained in Form N-CSR unless the Form displays a currently valid Office of Management and Budget ("OMB") control number. Please direct comments concerning the accuracy of the information collection burden estimate and any suggestions for reducing the burden to the Secretary, Securities and Exchange Commission, 450 Fifth Street, NW, Washington, DC 20549-0609. The OMB has reviewed this collection of information under the clearance requirements of 44 U.S.C. § 3507.
| Item 1. | Reports to Stockholders. |
| (a) |

BLUEPRINT ADAPTIVE GROWTH
ALLOCATION FUND
Investor Class (BLUPX)
Institutional Class (BLUIX)
Annual Report
February 28, 2022
| BLUEPRINT ADAPTIVE GROWTH ALLOCATION FUND | |
| LETTER TO SHAREHOLDERS | March 15, 2022 |
Dear Shareholders,
Our previous letter in the third quarter of 2021 occurred amid ten consecutive positive return months. Low volatility uptrends in growth-oriented U.S. equities were the primary catalyst in driving both U.S. stocks and the Fund higher. While these trends generally continued right up until the turning of the calendar, conditions have certainly shifted as we have entered and progressed into 2022.
Multi-decade highs in inflation have necessitated stark changes in monetary policy. This pivot from dovish to hawkish policy has accelerated already entrenched downtrends among fixed income instruments while also dampening equity demand for forward-looking markets. Add into the mix significant uncertainty from the Russian invasion of Ukraine and one has a recipe for an equity market correction.
For the end of the fiscal year ended on February 28, the Institutional Class finished up 6.3% versus the Morningstar Global Allocation Total Return Index (the Fund’s benchmark) return of 2.6%. The Fund’s outperformance was driven by overweight allocations to real estate, growth, and technology-oriented U.S. equities. In addition, the Fund’s focus on price trends allowed it to sidestep declines in international equities and higher duration fixed income assets. Positions that underperformed were held to a minimum but included alternatives and volatility hedges. That said, these are precisely the allocations performing best so far in 2022.
Looking ahead, equity markets will likely struggle to gain positive footing until the uncertainty around the timing and severity of interest rate hikes is better understood. Similarly, the most significant conflict on European soil in many decades has the potential to keep investors on edge for the foreseeable future. Either of these scenarios alone pose a serious threat to the global economic picture but together they could have significantly negative consequences. On the other hand, a measure of certainty or even perceived certainty is all that is needed to support buying that would be the basis for future gains.
The Blueprint Adaptive Growth Allocation Fund benefits from its ability to quickly adjust to these changing conditions. It is not always positioned perfectly for the circumstances at hand but is very rarely out of step. This seemingly small edge in our favor is aimed to provide advisors, their clients, and other investors the foundation to achieve their financial goals.
Thank you for your continued confidence and support of the Blueprint Adaptive Growth Allocation Fund.
Best,
 |  |
| Jon Robinson | Brandon Langley |
Blueprint Fund Management, LLC
www.blueprintmutualfunds.com
1
Past performance is not predictive of future performance. Investment results and principal value will fluctuate so that shares, when redeemed, may be worth more or less than their original cost. Current performance may be higher or lower than the performance data quoted. Performance data current to the most recent month-end are available by calling 1-866-983-4525.
An investor should consider the investment objectives, risks, charges, and expenses of the Fund carefully before investing. The Fund’s prospectus contains this and other important information. To obtain a copy of the Fund’s prospectus please visit the Fund’s website at www.blueprintmutualfunds.com or call 1-866-983-4525 and a copy will be sent to you free of charge. Please read the prospectus carefully before you invest. The Fund is distributed by Ultimus Fund Distributors, LLC.
The Letter to Shareholders seeks to describe some of the Adviser’s current opinions and views of the financial markets. Although the Adviser believes it has a reasonable basis for any opinions or views expressed, actual results may differ, sometimes significantly so, from those expected or expressed. The securities held by the Fund that are discussed in the Letter to Shareholders were held during the period covered by this Report. They do not comprise the entire investment portfolio of the Fund, may be sold at any time, and may no longer be held by the Fund. For a complete list of securities held by the Fund as of February 28th, 2022, please see the Schedule of Investments section of the annual report. The opinions of the Fund’s adviser with respect to those securities may change at any time.
Statements in the Letter to Shareholders that reflect projections or expectations for future financial or economic performance of the Fund and the market in general and statements of the Fund’s plans and objectives for future operations are forward-looking statements. No assurance can be given that actual results or events will not differ materially from those projected, estimated, assumed, or anticipated in any such forward- looking statements. Important factors that could result in such differences, in addition to factors noted with such forward-looking statements include, without limitation, general economic conditions, such as inflation, recession, and interest rates.
2
| BLUEPRINT ADAPTIVE GROWTH ALLOCATION FUND |
| PORTFOLIO INFORMATION |
| February 28, 2022 (Unaudited) |
Comparison of the Change in Value of a $10,000 Investment in
Blueprint Adaptive Growth Allocation Fund - Investor Class (a) (since inception on
3/31/2020) versus the Morningstar Global Allocation Index
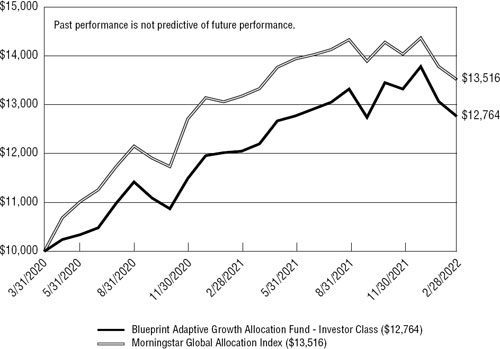
| Average Annual Total Returns (b) | ||||
| (for the periods ended February 28, 2022) | ||||
| Since | ||||
| Inception | ||||
| 1 Year | (3/31/2020) | |||
| Blueprint Adaptive Growth Allocation Fund - Investor Class | 5.95% | 13.59% | ||
| Blueprint Adaptive Growth Allocation Fund - Institutional Class | 6.29% | 13.94% | ||
| Morningstar Global Allocation Index (c) | 2.60% | 17.04% | ||
| (a) | The line graph above represents performance of the Investor Class only, which will vary from the performance of the Institutional Class based on the difference in fees paid by shareholders in the different classes. |
| (b) | The Fund’s total returns do not reflect the deduction of taxes a shareholder would pay on Fund distributions or the redemption of Fund shares. |
| (c) | The Morningstar Global Allocation Index measures the performance of a multi-asset class portfolio of global equities, global bonds and cash. This portfolio is held in a static allocation that is appropriate for investors who seek average exposure to global equity market risk and returns. |
3
| BLUEPRINT ADAPTIVE GROWTH ALLOCATION FUND |
| PORTFOLIO INFORMATION |
| February 28, 2022 (Unaudited) |
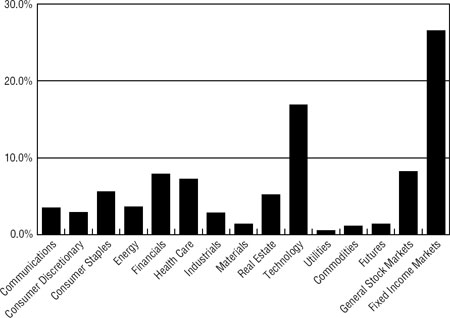
Sector Diversification (% of Net Assets)
| Top 10 Equity Holdings | |
| % of | |
| Net Assets | |
| Apple, Inc. | 8.0% |
| iShares Core S&P Total U.S. Stock Market ETF | 5.2% |
| iShares Floating Rate Bond ETF | 5.0% |
| ClearShares Ultra-Short Maturity ETF | 5.0% |
| SPDR Bloomberg 1-3 Month T-Bill ETF | 4.9% |
| iShares Short Treasury Bond ETF | 4.9% |
| PIMCO Enhanced Short Maturity Active Exchange-Traded Fund | 4.0% |
| Microsoft Corporation | 3.6% |
| JPMorgan Ultra-Short Income ETF | 2.9% |
| iShares Core MSCI Emerging Markets ETF | 2.8% |
4
| BLUEPRINT ADAPTIVE GROWTH ALLOCATION FUND |
| SCHEDULE OF INVESTMENTS |
| February 28, 2022 |
| COMMON STOCKS — 56.4% | Shares | Value | ||||||
| Communications — 3.5% | ||||||||
| Internet Media & Services — 2.9% | ||||||||
| Alphabet, Inc. - Class A (a) | 379 | $ | 1,023,732 | |||||
| Alphabet, Inc. - Class C (a) | 363 | 979,309 | ||||||
| Booking Holdings, Inc. (a) | 138 | 299,770 | ||||||
| 2,302,811 | ||||||||
| Telecommunications — 0.6% | ||||||||
| T-Mobile US, Inc. (a) | 912 | 112,368 | ||||||
| Verizon Communications, Inc. | 7,342 | 394,045 | ||||||
| 506,413 | ||||||||
| Consumer Discretionary — 2.9% | ||||||||
| Apparel & Textile Products — 0.2% | ||||||||
| LVMH Moet Hennessy Louis Vuitton S.A. - ADR | 1,040 | 151,580 | ||||||
| Automotive — 1.4% | ||||||||
| Ford Motor Company | 4,576 | 80,355 | ||||||
| Tesla, Inc. (a) | 1,032 | 898,284 | ||||||
| Toyota Motor Corporation - ADR | 833 | 152,397 | ||||||
| 1,131,036 | ||||||||
| Leisure Facilities & Services — 0.3% | ||||||||
| McDonald’s Corporation | 1,118 | 273,653 | ||||||
| Retail - Discretionary — 1.0% | ||||||||
| Home Depot, Inc. (The) | 1,722 | 543,859 | ||||||
| Lowe’s Companies, Inc. | 1,072 | 236,976 | ||||||
| 780,835 | ||||||||
| Consumer Staples — 5.6% | ||||||||
| Beverages — 2.0% | ||||||||
| Anheuser-Busch InBev S.A./N.V. - ADR | 2,448 | 151,360 | ||||||
| Coca-Cola Company (The) | 11,060 | 688,375 | ||||||
| Diageo plc - ADR | 764 | 152,563 | ||||||
| PepsiCo, Inc. | 3,922 | 642,188 | ||||||
| 1,634,486 | ||||||||
| Food — 0.5% | ||||||||
| Mondelez International, Inc. - Class A | 4,139 | 271,022 | ||||||
| Nestlé S.A. - ADR | 1,173 | 152,525 | ||||||
| 423,547 | ||||||||
5
| BLUEPRINT ADAPTIVE GROWTH ALLOCATION FUND |
| SCHEDULE OF INVESTMENTS (Continued) |
| COMMON STOCKS — 56.4% (Continued) | Shares | Value | ||||||
| Consumer Staples — 5.6% (Continued) | ||||||||
| Household Products — 1.5% | ||||||||
| Colgate-Palmolive Company | 1,467 | $ | 112,886 | |||||
| Procter & Gamble Company (The) | 7,081 | 1,103,857 | ||||||
| 1,216,743 | ||||||||
| Retail - Consumer Staples — 0.6% | ||||||||
| Costco Wholesale Corporation | 1,001 | 519,769 | ||||||
| Tobacco & Cannabis — 1.0% | ||||||||
| Altria Group, Inc. | 6,555 | 336,206 | ||||||
| Philip Morris International, Inc. | 4,505 | 455,320 | ||||||
| 791,526 | ||||||||
| Energy — 3.6% | ||||||||
| Oil & Gas Producers — 3.6% | ||||||||
| BP plc - ADR | 10,561 | 308,487 | ||||||
| Chevron Corporation | 5,200 | 748,800 | ||||||
| ConocoPhillips | 2,885 | 273,671 | ||||||
| Enbridge, Inc. | 7,147 | 308,608 | ||||||
| Exxon Mobil Corporation | 11,051 | 866,619 | ||||||
| Shell plc - ADR | 2,352 | 123,221 | ||||||
| TotalEnergies SE - ADR | 5,968 | 301,563 | ||||||
| 2,930,969 | ||||||||
| Financials — 7.9% | ||||||||
| Asset Management — 0.2% | ||||||||
| Brookfield Asset Management, Inc. - Class A | 2,821 | 154,140 | ||||||
| Banking — 4.1% | ||||||||
| Bank of America Corporation | 21,729 | 960,422 | ||||||
| Bank of Nova Scotia (The) | 4,248 | 307,300 | ||||||
| BNP Paribas S.A. - ADR | 5,176 | 150,104 | ||||||
| HSBC Holdings plc - ADR | 8,899 | 307,372 | ||||||
| Mitsubishi UFJ Financial Group, Inc. - ADR | 49,466 | 304,711 | ||||||
| Royal Bank of Canada | 2,770 | 305,863 | ||||||
| Toronto-Dominion Bank (The) | 3,778 | 304,847 | ||||||
| U.S. Bancorp | 2,287 | 129,307 | ||||||
| Wells Fargo & Company | 10,139 | 541,118 | ||||||
| 3,311,044 | ||||||||
6
| BLUEPRINT ADAPTIVE GROWTH ALLOCATION FUND |
| SCHEDULE OF INVESTMENTS (Continued) |
| COMMON STOCKS — 56.4% (Continued) | Shares | Value | ||||||
| Financials — 7.9% (Continued) | ||||||||
| Institutional Financial Services — 0.3% | ||||||||
| Bank of New York Mellon Corporation (The) | 1,207 | $ | 64,152 | |||||
| Morgan Stanley | 2,099 | 190,463 | ||||||
| 254,615 | ||||||||
| Insurance — 2.6% | ||||||||
| Allianz SE - ADR | 6,716 | 151,849 | ||||||
| American International Group, Inc. | 2,362 | 144,649 | ||||||
| Berkshire Hathaway, Inc. - Class B (a) | 5,159 | 1,658,360 | ||||||
| MetLife, Inc. | 2,263 | 152,866 | ||||||
| 2,107,724 | ||||||||
| Specialty Finance — 0.7% | ||||||||
| American Express Company | 1,688 | 328,383 | ||||||
| Capital One Financial Corporation | 1,276 | 195,573 | ||||||
| 523,956 | ||||||||
| Health Care — 7.2% | ||||||||
| Biotech & Pharma — 4.5% | ||||||||
| AbbVie, Inc. | 4,513 | 666,886 | ||||||
| Amgen, Inc. | 1,099 | 248,902 | ||||||
| AstraZeneca plc - ADR | 5,064 | 308,296 | ||||||
| Bristol-Myers Squibb Company | 6,959 | 477,875 | ||||||
| Eli Lilly & Company | 1,022 | 255,449 | ||||||
| Johnson & Johnson | 4,364 | 718,183 | ||||||
| Novo Nordisk A/S - ADR | 1,483 | 152,675 | ||||||
| Pfizer, Inc. | 7,262 | 340,878 | ||||||
| Roche Holding AG - ADR | 3,206 | 151,419 | ||||||
| Sanofi - ADR | 5,850 | 306,833 | ||||||
| 3,627,396 | ||||||||
| Health Care Facilities & Services — 1.9% | ||||||||
| CVS Health Corporation | 3,202 | 331,887 | ||||||
| UnitedHealth Group, Inc. | 2,508 | 1,193,482 | ||||||
| 1,525,369 | ||||||||
| Medical Equipment & Devices — 0.8% | ||||||||
| Abbott Laboratories | 2,965 | 357,638 | ||||||
| Thermo Fisher Scientific, Inc. | 556 | 302,464 | ||||||
| 660,102 | ||||||||
7
| BLUEPRINT ADAPTIVE GROWTH ALLOCATION FUND |
| SCHEDULE OF INVESTMENTS (Continued) |
| COMMON STOCKS — 56.4% (Continued) | Shares | Value | ||||||
| Industrials — 2.8% | ||||||||
| Aerospace & Defense — 1.2% | ||||||||
| Airbus SE - ADR (a) | 4,789 | $ | 151,764 | |||||
| General Dynamics Corporation | 640 | 150,048 | ||||||
| Lockheed Martin Corporation | 678 | 294,116 | ||||||
| Raytheon Technologies Corporation | 3,896 | 400,119 | ||||||
| 996,047 | ||||||||
| Diversified Industrials — 0.1% | ||||||||
| Emerson Electric Company | 958 | 89,017 | ||||||
| Electrical Equipment — 0.2% | ||||||||
| ABB Ltd. - ADR | 4,523 | 152,335 | ||||||
| Transportation & Logistics — 1.3% | ||||||||
| Canadian National Railway Company | 1,230 | 152,508 | ||||||
| Union Pacific Corporation | 2,037 | 501,000 | ||||||
| United Parcel Service, Inc. - Class B | 1,900 | 399,798 | ||||||
| 1,053,306 | ||||||||
| Materials — 1.4% | ||||||||
| Chemicals — 0.7% | ||||||||
| Dow, Inc. | 2,600 | 153,296 | ||||||
| DuPont de Nemours, Inc. | 1,937 | 149,866 | ||||||
| Linde plc | 844 | 247,494 | ||||||
| 550,656 | ||||||||
| Metals & Mining — 0.7% | ||||||||
| BHP Group Ltd. - ADR | 4,509 | 305,665 | ||||||
| Rio Tinto plc - ADR | 3,891 | 305,755 | ||||||
| 611,420 | ||||||||
| Real Estate — 4.1% | ||||||||
| REITs — 4.1% | ||||||||
| American Campus Communities, Inc. | 612 | 32,932 | ||||||
| AvalonBay Communities, Inc. | 669 | 159,617 | ||||||
| Boston Properties, Inc. | 1,380 | 168,788 | ||||||
| Cousins Properties, Inc. | 622 | 24,028 | ||||||
| Duke Realty Corporation | 1,978 | 104,834 | ||||||
| Equity Residential | 1,592 | 135,798 | ||||||
| Essex Property Trust, Inc. | 311 | 98,640 | ||||||
| Extra Space Storage, Inc. | 642 | 120,792 | ||||||
| Federal Realty Investment Trust | 341 | 40,095 | ||||||
| Host Hotels & Resorts, Inc. (a) | 7,590 | 138,669 | ||||||
| Invitation Homes, Inc. | 2,744 | 103,723 | ||||||
8
| BLUEPRINT ADAPTIVE GROWTH ALLOCATION FUND |
| SCHEDULE OF INVESTMENTS (Continued) |
| COMMON STOCKS — 56.4% (Continued) | Shares | Value | ||||||
| Real Estate — 4.1% (Continued) | ||||||||
| REITs — 4.1% (Continued) | ||||||||
| Kilroy Realty Corporation | 1,008 | $ | 72,193 | |||||
| Mid-America Apartment Communities, Inc. | 386 | 78,979 | ||||||
| Prologis, Inc. | 5,185 | 756,232 | ||||||
| Public Storage | 1,373 | 487,442 | ||||||
| Realty Income Corporation | 2,679 | 177,055 | ||||||
| Regency Centers Corporation | 847 | 55,809 | ||||||
| Simon Property Group, Inc. | 1,798 | 247,333 | ||||||
| Sun Communities, Inc. | 506 | 91,586 | ||||||
| UDR, Inc. | 1,310 | 71,880 | ||||||
| Welltower, Inc. | 2,022 | 168,412 | ||||||
| 3,334,837 | ||||||||
| Technology — 16.9% | ||||||||
| Semiconductors — 2.2% | ||||||||
| Broadcom, Inc. | 1,105 | 649,121 | ||||||
| NVIDIA Corporation | 2,390 | 582,802 | ||||||
| QUALCOMM, Inc. | 3,099 | 532,997 | ||||||
| 1,764,920 | ||||||||
| Software — 3.6% | ||||||||
| Microsoft Corporation | 9,886 | 2,953,838 | ||||||
| Technology Hardware — 8.7% | ||||||||
| Apple, Inc. | 39,248 | 6,480,629 | ||||||
| Cisco Systems, Inc. | 6,648 | 370,759 | ||||||
| Nintendo Company Ltd. - ADR | 2,421 | 153,903 | ||||||
| 7,005,291 | ||||||||
| Technology Services — 2.4% | ||||||||
| Accenture plc - Class A | 904 | 285,682 | ||||||
| Mastercard, Inc. - Class A | 2,905 | 1,048,182 | ||||||
| Visa, Inc. - Class A | 2,763 | 597,140 | ||||||
| 1,931,004 | ||||||||
| Utilities — 0.5% | ||||||||
| Electric Utilities — 0.5% | ||||||||
| Constellation Energy Corporation | 778 | 35,773 | ||||||
| Duke Energy Corporation | 1,209 | 121,396 | ||||||
| Exelon Corporation | 3,306 | 140,703 | ||||||
| Southern Company (The) | 1,616 | 104,668 | ||||||
| 402,540 | ||||||||
| Total Common Stocks (Cost $39,707,559) | $ | 45,672,925 | ||||||
9
| BLUEPRINT ADAPTIVE GROWTH ALLOCATION FUND |
| SCHEDULE OF INVESTMENTS (Continued) |
| EXCHANGE-TRADED FUNDS — 38.3% | Shares | Value | ||||||
| ClearShares Ultra-Short Maturity ETF | 40,136 | $ | 4,015,410 | |||||
| iShares Core MSCI Emerging Markets ETF | 39,548 | 2,263,332 | ||||||
| iShares Core S&P Total U.S. Stock Market ETF | 43,064 | 4,223,717 | ||||||
| iShares Core U.S. REIT ETF | 14,001 | 853,501 | ||||||
| iShares Floating Rate Bond ETF | 79,330 | 4,019,651 | ||||||
| iShares Gold Trust (a) | 23,975 | 870,532 | ||||||
| iShares MSCI Mexico ETF | 659 | 33,174 | ||||||
| iShares MSCI Saudi Arabia ETF | 700 | 32,613 | ||||||
| iShares MSCI South Africa ETF | 624 | 32,860 | ||||||
| iShares MSCI Taiwan ETF | 507 | 32,408 | ||||||
| iShares MSCI Thailand ETF | 404 | 32,300 | ||||||
| iShares Short Treasury Bond ETF (a) | 35,761 | 3,944,081 | ||||||
| JPMorgan Ultra-Short Income ETF | 46,258 | 2,329,784 | ||||||
| PIMCO Enhanced Short Maturity Active Exchange-Traded Fund | 31,820 | 3,215,093 | ||||||
| ProShares Ultra VIX Short-Term Futures ETF (a) | 65,000 | 1,140,100 | ||||||
| SPDR Bloomberg 1-3 Month T-Bill ETF (a) | 43,162 | 3,945,438 | ||||||
| Total Exchange-Traded Funds (Cost $28,753,592) | $ | 30,983,994 | ||||||
| MONEY MARKET FUNDS — 4.3% | Shares | Value | ||||||
| First American Government Obligations Fund - Class X, 0.03% (b) (Cost $3,459,898) | $ | 3,459,898 | $ | 3,459,898 | ||||
| Investments at Value — 99.0% (Cost $71,921,049) | $ | 80,116,817 | ||||||
| Other Assets in Excess of Liabilities — 1.0% | 773,952 | |||||||
| Net Assets — 100.0% | $ | 80,890,769 | ||||||
| (a) | Non-income producing security. |
| (b) | The rate shown is the 7-day effective yield as of February 28, 2022. |
A/S - Aktieselskab
ADR - American Depositary Receipt
AG - Aktiengesellschaft
N.V. - Naamloze Vennootschap
plc - Public Limited Company
S.A. - Societe Anonyme
SE - Societe Europaea
See accompanying notes to financial statements.
10
| BLUEPRINT ADAPTIVE GROWTH ALLOCATION FUND |
| STATEMENT OF ASSETS AND LIABILITIES |
| February 28, 2022 |
| ASSETS | ||||
| Investments: | ||||
| At cost | $ | 71,921,049 | ||
| At value (Note 2) | $ | 80,116,817 | ||
| Receivable for capital shares sold | 1,477,762 | |||
| Receivable for investment securities sold | 11,953,695 | |||
| Dividends and interest receivable | 83,644 | |||
| Tax reclaims receivable | 181 | |||
| Other assets | 15,695 | |||
| Total assets | 93,647,794 | |||
| LIABILITIES | ||||
| Payable for capital shares redeemed | 985,735 | |||
| Payable for investment securities purchased | 11,701,046 | |||
| Payable to the Adviser (Note 4) | 43,802 | |||
| Payable to administrator (Note 4) | 13,057 | |||
| Accrued distribution fees (Note 4) | 411 | |||
| Other accrued expenses and liabilities | 12,974 | |||
| Total liabilities | 12,757,025 | |||
| NET ASSETS | $ | 80,890,769 | ||
| NET ASSETS CONSIST OF: | ||||
| Paid-in capital | $ | 75,020,352 | ||
| Distributable earnings | 5,870,417 | |||
| NET ASSETS | $ | 80,890,769 | ||
| NET ASSET VALUE PER SHARE: | ||||
| INVESTOR CLASS | ||||
| Net assets applicable to Investor Class | $ | 858,330 | ||
| Investor Class shares of beneficial interest outstanding (unlimited number of shares authorized, no par value) | 67,640 | |||
| Net asset value, offering price and redemption price per share (Note 2) | $ | 12.69 | ||
| INSTITUTIONAL CLASS | ||||
| Net assets applicable to Institutional Class | $ | 80,032,439 | ||
| Institutional Class shares of beneficial interest outstanding (unlimited number of shares authorized, no par value) | 6,283,097 | |||
| Net asset value, offering price and redemption price per share (Note 2) | $ | 12.74 |
See accompanying notes to financial statements.
11
| BLUEPRINT ADAPTIVE GROWTH ALLOCATION FUND |
| STATEMENT OF OPERATIONS |
| For the Year Ended February 28, 2022 |
| INVESTMENT INCOME | ||||
| Dividend income (net of foreign withholding taxes of $7,033) | $ | 1,226,664 | ||
| Interest | 97 | |||
| Total Investment Income | $ | 1,226,761 | ||
| EXPENSES | ||||
| Investment advisory fees (Note 4) | 647,283 | |||
| Administration fees (Note 4) | 68,209 | |||
| Registration and filing fees | 46,149 | |||
| Fund accounting fees (Note 4) | 39,320 | |||
| Legal fees | 32,709 | |||
| Transfer agent fees - Institutional Class (Note 4) | 18,000 | |||
| Transfer agent fees - Investor Class (Note 4) | 12,000 | |||
| Audit and tax services fees | 17,460 | |||
| Trustees’ fees and expenses (Note 4) | 17,403 | |||
| Compliance service fees (Note 4) | 12,000 | |||
| Custodian and bank service fees | 11,717 | |||
| Offering costs (Note 2) | 9,900 | |||
| Postage and supplies | 8,678 | |||
| Printing of shareholder reports | 8,387 | |||
| Insurance expense | 3,651 | |||
| Distribution fees - Investor Class (Note 4) | 1,092 | |||
| Other expenses | 22,318 | |||
| Total Expenses | 976,276 | |||
| Fee reductions by the Adviser (Note 4) | (113,574 | ) | ||
| Net Expenses | 862,702 | |||
| NET INVESTMENT INCOME | 364,059 | |||
| REALIZED AND UNREALIZED GAINS (LOSSES) ON INVESTMENTS AND FOREIGN CURRENCIES | ||||
| Net realized losses from: | ||||
| Investments | (1,889,349 | ) | ||
| Foreign currency transactions | (351 | ) | ||
| Net change in unrealized appreciation (depreciation) on investments: | 4,250,753 | |||
| NET REALIZED AND UNREALIZED GAINS ON INVESTMENTS AND FOREIGN CURRENCIES | 2,361,053 | |||
| NET INCREASE IN NET ASSETS RESULTING FROM OPERATIONS | $ | 2,725,112 |
See accompanying notes to financial statements.
12
| BLUEPRINT ADAPTIVE GROWTH ALLOCATION FUND |
| STATEMENTS OF CHANGES IN NET ASSETS |
| Year Ended | Period Ended | |||||||
| February 28, | February 28, | |||||||
| 2022 | 2021 (a) | |||||||
| FROM OPERATIONS | ||||||||
| Net investment income | $ | 364,059 | $ | 41,476 | ||||
| Net realized losses from: | ||||||||
| Investments | (1,889,349 | ) | (408,741 | ) | ||||
| Foreign currency transactions | (351 | ) | — | |||||
| Net change in unrealized appreciation (depreciation) on investments and foreign currencies | 4,250,753 | 3,945,015 | ||||||
| Net increase in net assets resulting from operations | 2,725,112 | 3,577,750 | ||||||
| FROM DISTRIBUTIONS TO SHAREHOLDERS (Note 2) | ||||||||
| Investor Class | (2,772 | ) | (63 | ) | ||||
| Institutional Class | (365,245 | ) | (111,204 | ) | ||||
| Decrease in net assets from distributions to shareholders | (368,017 | ) | (111,267 | ) | ||||
| CAPITAL SHARE TRANSACTIONS | ||||||||
| Investor Class | ||||||||
| Proceeds from shares sold | 892,113 | 70,056 | ||||||
| Net asset value of shares issued in reinvestment of distributions to shareholders | 2,772 | 63 | ||||||
| Payments for shares redeemed | (89,685 | ) | (64 | ) | ||||
| Net increase in Investor Class net assets from capital share transactions | 805,200 | 70,055 | ||||||
| Institutional Class | ||||||||
| Proceeds from shares sold | 39,522,452 | 54,668,532 | ||||||
| Net asset value of shares issued in reinvestment of distributions to shareholders | 365,216 | 110,988 | ||||||
| Payments for shares redeemed | (15,504,692 | ) | (4,970,560 | ) | ||||
| Net increase in Institutional Class net assets from capital share transactions | 24,382,976 | 49,808,960 | ||||||
| TOTAL INCREASE IN NET ASSETS | 27,545,271 | 53,345,498 | ||||||
| NET ASSETS | ||||||||
| Beginning of period | 53,345,498 | — | ||||||
| End of period | $ | 80,890,769 | $ | 53,345,498 | ||||
| (a) | Represents the period from the commencement of operations (March 31, 2020) through February 28, 2021. |
See accompanying notes to financial statements.
13
| BLUEPRINT ADAPTIVE GROWTH ALLOCATION FUND |
| STATEMENTS OF CHANGES IN NET ASSETS (Continued) |
| Year Ended | Period Ended | |||||||
| February 28, | February 28, | |||||||
| 2022 | 2021 (a) | |||||||
| CAPITAL SHARES ACTIVITY | ||||||||
| Investor Class | ||||||||
| Shares sold | 68,431 | 6,015 | ||||||
| Shares issued in reinvestment of distributions to shareholders | 202 | 5 | ||||||
| Shares redeemed | (7,007 | ) | (6 | ) | ||||
| Net increase in shares outstanding | 61,626 | 6,014 | ||||||
| Shares outstanding at beginning of period | 6,014 | — | ||||||
| Shares outstanding at end of period | 67,640 | 6,014 | ||||||
| Institutional Class | ||||||||
| Shares sold | 3,030,556 | 4,833,392 | ||||||
| Shares issued in reinvestment of distributions to shareholders | 26,503 | 9,319 | ||||||
| Shares redeemed | (1,196,884 | ) | (419,789 | ) | ||||
| Net increase in shares outstanding | 1,860,175 | 4,422,922 | ||||||
| Shares outstanding at beginning of period | 4,422,922 | — | ||||||
| Shares outstanding at end of period | 6,283,097 | 4,422,922 | ||||||
| (a) | Represents the period from the commencement of operations (March 31, 2020) through February 28, 2021. |
See accompanying notes to financial statements.
14
| BLUEPRINT ADAPTIVE GROWTH ALLOCATION FUND |
| INVESTOR CLASS |
| FINANCIAL HIGHLIGHTS |
Per Share Data for a Share Outstanding Throughout Each Period
| Year Ended | Period Ended | |||||||
| February 28, | February 28, | |||||||
| 2022 | 2021(a) | |||||||
| Net asset value at beginning of period | $ | 12.02 | $ | 10.00 | ||||
| Income (loss) from investment operations: | ||||||||
| Net investment income (loss) (b)(c) | 0.04 | (0.02 | ) | |||||
| Net realized and unrealized gains on investments and foreign currencies | 0.68 | 2.07 | ||||||
| Total from investment operations | 0.72 | 2.05 | ||||||
| Less distributions from: | ||||||||
| Net investment income | (0.05 | ) | (0.03 | ) | ||||
| Net asset value at end of period | $ | 12.69 | $ | 12.02 | ||||
| Total return (d) | 5.95 | % | 20.48 | % (e) | ||||
| Net assets at end of period | $ | 858,330 | $ | 72,305 | ||||
| Ratios/supplementary data: | ||||||||
| Ratio of total expenses to average net assets (f) | 6.96 | % | 104.34 | % (g) | ||||
| Ratio of net expenses to average net assets (f)(h) | 1.50 | % (i) | 1.60 | % (g)(i) | ||||
| Ratio of net investment income (loss) to average net assets (c)(f)(h) | 0.30 | % | (0.16 | %) (g) | ||||
| Portfolio turnover rate | 130 | % | 95 | % (e) | ||||
| (a) | Represents the period from the commencement of operations (March 31, 2020) through February 28, 2021. |
| (b) | Per share net investment income (loss) has been determined on the basis of average number of shares outstanding during the period. |
| (c) | Recognition of net investment income (loss) by the Fund is affected by the timing of the declaration of the dividends by the underlying companies in which the Fund invests. |
| (d) | Total return is a measure of the change in value of an investment in the Fund over the periods covered. The returns shown do not reflect the deduction of taxes a shareholder would pay on Fund distributions, if any, or the redemption of Fund shares. The total returns would have been lower had the Adviser not reduced advisory fees and reimbursed expenses (Note 4). |
| (e) | Not annualized. |
| (f) | Ratio does not include expenses of the investment companies in which the Fund invests. |
| (g) | Annualized. |
| (h) | Ratio was determined after advisory fees reductions and expense reimbursements (Note 4). |
| (i) | Includes costs to organize the Fund of less than 0.005% and 0.10% for the year ended February 28, 2022 and period ended February 28, 2021, respectively, which are excluded from the Expense Limitation Agreement (Note 4). |
See accompanying notes to financial statements.
15
| BLUEPRINT ADAPTIVE GROWTH ALLOCATION FUND |
| INSTITUTIONAL CLASS |
| FINANCIAL HIGHLIGHTS |
Per Share Data for a Share Outstanding Throughout Each Period
| Year Ended | Period Ended | |||||||
| February 28, | February 28, | |||||||
| 2022 | 2021 (a) | |||||||
| Net asset value at beginning of period | $ | 12.04 | $ | 10.00 | ||||
| Income from investment operations: | ||||||||
| Net investment income (b)(c) | 0.07 | 0.02 | ||||||
| Net realized and unrealized gains on investments | 0.69 | 2.06 | ||||||
| Total from investment operations | 0.76 | 2.08 | ||||||
| Less distributions from: | ||||||||
| Net investment income | (0.06 | ) | (0.04 | ) | ||||
| Net asset value at end of period | $ | 12.74 | $ | 12.04 | ||||
| Total return (d) | 6.29 | % | 20.80 | % (e) | ||||
| Net assets at end of period (000’s) | $ | 80,032 | $ | 53,273 | ||||
| Ratios/supplementary data: | ||||||||
| Ratio of total expenses to average net assets (f) | 1.40 | % | 1.93 | % (g) | ||||
| Ratio of net expenses to average net assets (f)(h) | 1.26 | % (i) | 1.35 | % (g)(i) | ||||
| Ratio of net investment income to average net assets (c)(f)(h) | 0.54 | % | 0.20 | % (g) | ||||
| Portfolio turnover rate | 130 | % | 95 | % (e) | ||||
| (a) | Represents the period from the commencement of operations (March 31, 2020) through February 28, 2021. |
| (b) | Per share net investment income has been determined on the basis of average number of shares outstanding during the period. |
| (c) | Recognition of net investment income by the Fund is affected by the timing of the declaration of the dividends by the underlying companies in which the Fund invests. |
| (d) | Total return is a measure of the change in value of an investment in the Fund over the period covered. The returns shown do not reflect the deduction of taxes a shareholder would pay on Fund distributions, if any, or the redemption of Fund shares. The total returns would have been lower had the Adviser not reduced advisory fees and reimbursed expenses (Note 4). |
| (e) | Not annualized. |
| (f) | Ratio does not include expenses of the investment companies in which the Fund invests. |
| (g) | Annualized. |
| (h) | Ratio was determined after advisory fees reductions and expense reimbursements (Note 4). |
| (i) | Includes costs to organize the Fund of 0.01% and 0.10% for the year ended February 28, 2022 and period ended February 28, 2021, respectively, which are excluded from the Expense Limitation Agreement (Note 4). |
See accompanying notes to financial statements.
16
| BLUEPRINT ADAPTIVE GROWTH ALLOCATION FUND |
| NOTES TO FINANCIAL STATEMENTS |
| February 28, 2022 |
1. Organization
Blueprint Adaptive Growth Allocation Fund (formerly Blueprint Growth Fund) (the “Fund”) is a diversified series of Ultimus Managers Trust (the “Trust”). The Trust is an open-end management investment company established as an Ohio business trust under a Declaration of Trust dated February 28, 2012. Other series of the Trust are not incorporated in this report. The Fund commenced operations on March 31, 2020.
The investment objective of the Fund is to seek capital appreciation while managing risk.
The Fund currently offers two classes of shares: Investor Class shares (sold without any sales loads, but subject to a distribution and/or shareholder servicing fee of up to 0.25% of the average daily net assets attributable to Investor Class shares and requiring a $5,000 initial investment) and Institutional Class shares (sold without any sales loads and distribution and/or shareholder servicing fees and requiring a $15,000 initial investment). Each share class represents an ownership interest in the same investment portfolio.
2. Significant Accounting Policies
The following is a summary of the Fund’s significant accounting policies used in the preparation of its financial statements. These policies are in conformity with accounting principles generally accepted in the United States of America (“GAAP”). The Fund follows accounting and reporting guidance under Financial Accounting Standards Board Accounting Standards Codification Topic 946, “Financial Services – Investment Companies.”
Securities valuation – The Fund values its portfolio securities at fair value as of the close of regular trading on the New York Stock Exchange (the “NYSE”) (normally 4:00 p.m. Eastern time) on each business day the NYSE is open for business. The Fund values its listed securities, including common stocks and exchange-traded funds (“ETFs”), on the basis of the security’s last sale price on the security’s primary exchange, if available, otherwise at the exchange’s most recently quoted mean price. NASDAQ-listed securities are valued at the NASDAQ Official Closing Price. When using a quoted price and when the market for the security is considered active, the security will be classified as Level 1 within the fair value hierarchy (see below). In the event that market quotations are not readily available or are considered unreliable due to market or other events, the Fund values its securities and other assets at fair value in accordance with procedures established by and under the general supervision of the Board of Trustees of the Trust (the “Board”). Under these procedures, the securities will be classified as Level 2 or 3 within the fair value hierarchy, depending on the inputs used. Unavailable or unreliable market quotes may be due to the following factors: a substantial bid-ask spread; infrequent sales resulting in stale prices; insufficient trading volume; small trade sizes; a temporary lapse in any reliable pricing source; and actions of the securities or futures markets, such as the
17
| BLUEPRINT ADAPTIVE GROWTH ALLOCATION FUND |
| NOTES TO FINANCIAL STATEMENTS (Continued) |
suspension or limitation of trading. As a result, the prices of securities used to calculate the Fund’s net asset value (“NAV”) may differ from quoted or published prices for the same securities.
GAAP establishes a single authoritative definition of fair value, sets out a framework for measuring fair value, and requires additional disclosures about fair value measurements.
Various inputs are used in determining the value of the Fund’s investments. These inputs are summarized in the three broad levels listed below:
| ● | Level 1 – quoted prices in active markets for identical securities |
| ● | Level 2 – other significant observable inputs |
| ● | Level 3 – significant unobservable inputs |
The inputs or methods used for valuing securities are not necessarily an indication of the risks associated with investing in those securities. The inputs used to measure fair value may fall into different levels of the fair value hierarchy. In such cases, for disclosure purposes, the level in the fair value hierarchy within which the fair value measurement falls in its entirety is determined based on the lowest level input that is significant to the fair value measurement.
The following is a summary of the Fund’s investments and the inputs used to value the investments as of February 28, 2022:
| Level 1 | Level 2 | Level 3 | Total | |||||||||||||
| Common Stocks | $ | 45,672,925 | $ | — | $ | — | $ | 45,672,925 | ||||||||
| Exchange-Traded Funds | 30,983,994 | — | — | 30,983,994 | ||||||||||||
| Money Market Funds | 3,459,898 | — | — | 3,459,898 | ||||||||||||
| Total | $ | 80,116,817 | $ | — | $ | — | $ | 80,116,817 | ||||||||
Refer to the Fund’s Schedule of Investments for a listing of the common stocks by sector and industry type. The Fund did not hold any derivative instruments or any assets or liabilities that were measured at fair value on a recurring basis using significant unobservable inputs (Level 3) as of or during the year ended February 28, 2022.
Cash – The Fund’s cash, if any, is held in a bank account with balances which, at times, may exceed United States federally insured limits set by the Federal Deposit Insurance Corporation. The Fund maintains these balances with a high quality financial institution and may incur charges on cash overdrafts.
Share valuation – The NAV per share of each class of the Fund is calculated daily by dividing the total value of the assets attributable to that class, less liabilities attributable to that class, by the number of shares outstanding of that class. The offering price and redemption price per share of each class of the Fund is equal to the NAV per share of such class.
18
| BLUEPRINT ADAPTIVE GROWTH ALLOCATION FUND |
| NOTES TO FINANCIAL STATEMENTS (Continued) |
Investment income – Dividend income is recorded on the ex-dividend date. Non-cash dividends included in dividend income, if any, are recorded at the fair market value of the security received. Interest income is accrued as earned. Withholding taxes on foreign dividends, if any, have been recorded in accordance with the Fund’s understanding of the applicable country’s rules and tax rates.
Investment transactions – Investment transactions are accounted for on the trade date. Realized gains and losses on investments sold are determined on a specific identification basis.
Offering costs – The Adviser advanced some of the Fund’s initial offering costs and was subsequently reimbursed by the Fund. Costs of $29,700 incurred in connection with the offering and initial registration had been deferred and were subsequently amortized on a straight-line basis over the first twelve months after commencement of operations. As of February 28, 2022, there were no unamortized offering costs remaining in the Fund.
Common expenses – Common expenses of the Trust are allocated among the Fund and the other series of the Trust based on the relative net assets of each series, the number of series in the Trust, or the nature of the services performed and the relative applicability to each series.
Allocation between Classes – Investment income earned, realized capital gains and losses, and unrealized appreciation and depreciation are allocated daily to each Class of the Fund based upon its proportionate share of total net assets of the Fund. Class-specific expenses are charged directly to the Class incurring the expense. Common expenses which are not attributable to a specific Class are allocated daily to the Class of shares of the Fund based upon its proportionate share of total net assets of the Fund.
Distributions to shareholders – The Fund distributes to shareholders any net investment income dividends and net realized capital gains on an annual basis. The amount of such dividends and distributions are determined in accordance with federal income tax regulations, which may differ from GAAP. Dividends and distributions to shareholders are recorded on the ex-dividend date. The tax character of distributions paid to shareholders by the Fund during the year ended February 28, 2022 and period ended February 28, 2021, was ordinary income.
Estimates – The preparation of financial statements in conformity with GAAP requires management to make estimates and assumptions that affect the reported amounts of assets and liabilities and disclosure of contingent assets and liabilities as of the date of the financial statements and the reported amounts of increase (decrease) in net assets from operations during the reporting period. Actual results could differ from those estimates.
19
| BLUEPRINT ADAPTIVE GROWTH ALLOCATION FUND |
| NOTES TO FINANCIAL STATEMENTS (Continued) |
Federal tax – The Fund has qualified and intends to continue to qualify as a regulated investment company under the Internal Revenue Code of 1986, as amended (the “Code”). Qualification generally will relieve the Fund of liability for federal income taxes to the extent 100% of its net investment income and net realized capital gains are distributed in accordance with the Code.
In order to avoid imposition of the excise tax applicable to regulated investment companies, it is also the Fund’s intention to declare as dividends in each calendar year equal to at least 98% of its net investment income (earned during the calendar year) and 98.2% of its net realized capital gains (earned during the twelve months ended October 31) plus undistributed amounts from prior years.
The following information is computed on a tax basis for each item as of February 28, 2022:
| Cost of portfolio investments | $ | 72,274,804 | ||
| Gross unrealized appreciation | $ | 8,286,680 | ||
| Gross unrealized depreciation | (444,667 | ) | ||
| Net unrealized appreciation | 7,842,013 | |||
| Accumulated capital and other losses | (1,971,596 | ) | ||
| Distributable earnings | $ | 5,870,417 | ||
The difference between the federal income tax cost of portfolio investments and the financial statement cost of portfolio investments is due to certain timing differences in the recognition of capital gains or losses under income tax regulations and GAAP. These “book/tax” differences are temporary in nature and are primarily due to the tax deferral of losses on wash sales and adjustments to basis for grantor trusts.
Net qualified late year losses, incurred after December 31, 2021 and within the taxable year, are deemed to arise on the first day of the Fund’s next taxable year. For the year ended February 28, 2022, the Fund deferred $41,466 of late year ordinary losses to March 1, 2022 for federal tax purposes.
As of February 28, 2022, the Fund had short-term capital loss carryforwards of $1,930,130 for federal income tax purposes. These capital loss carryforwards, which do not expire, may be utilized in future years to offset net realized capital gains, if any.
For the year ended February 28, 2022, the Fund reclassified $26,701 of distributable earnings against paid-in capital on the Statement of Assets and Liabilities. Such reclassification, the result of permanent differences between the financial statement and income tax reporting requirements, had no effect on the Fund’s net assets or NAV per share.
20
| BLUEPRINT ADAPTIVE GROWTH ALLOCATION FUND |
| NOTES TO FINANCIAL STATEMENTS (Continued) |
The Fund recognizes the tax benefits or expenses of uncertain tax positions only when the position is “more likely than not” of being sustained assuming examination by tax authorities. Management has reviewed the Fund’s tax positions for all open tax years and has concluded that no provision for unrecognized tax benefits or expenses is required in these financial statements. The Fund identifies its major tax jurisdiction as U.S. Federal. The Fund recognizes interest and penalties, if any, related to unrecognized tax benefits as income tax on the Statement of Operations. During the year ended February 28, 2022, the Fund did not incur any interest of penalties.
3. Investment Transactions
During the year ended February 28, 2022, cost of purchases and proceeds from sales of investment securities, other than short-term investments, amounted to $108,189,229 and $86,544,626, respectively.
4. Transactions with Related Parties
ADVISORY AND SUB-ADVISORY AGREEMENTS
Pursuant to the terms of the Advisory Agreement, Blueprint Fund Management, LLC (the “Adviser”) serves as the investment adviser to the Fund. The Adviser provides the Fund with the selection of a sub-investment advisor and the compliance and managerial oversight of that sub-adviser and its services to the Fund. The Fund pays the Adviser an investment advisory fee, computed and accrued daily and paid monthly, at the annual rate of 0.95% of average daily net assets.
Blueprint Investment Partners, LLC (the “Sub-Adviser”) serves as the Funds sub-adviser. Pursuant to the Sub-Advisory Agreement, the Sub-Adviser provides the Fund with a continuous program of investing the Fund’s assets and determining the composition of the Fund’s portfolio. For its services, the Adviser pays the Sub-Adviser an investment sub-advisory fee computed at the annual rate of 0.20% of the Fund’s average daily net assets. The Fund does not directly pay the sub-advisory fee.
Pursuant to an Expense Limitation Agreement (“ELA”) between the Fund and the Adviser, the Adviser has agreed contractually, until June 30, 2023, to reduce its advisory fees and reimburse other expenses to the extent necessary to limit total annual fund operating expenses (excluding brokerage costs, taxes, interest, borrowing costs such as interest and dividend expenses on securities sold short, acquired fund fees and expenses, costs to organize the Fund, extraordinary expenses such as litigation and merger or reorganization costs and other expenses not incurred in the ordinary course of the Fund’s business) to 1.50% and 1.25% of average daily net assets for Investor Class and Institutional Class shares, respectively. Accordingly, during the year ended February 28, 2022, the Adviser reduced its investment advisory fees in the amount of $46,870, and, in addition, reimbursed other operating expenses of $66,704.
21
| BLUEPRINT ADAPTIVE GROWTH ALLOCATION FUND |
| NOTES TO FINANCIAL STATEMENTS (Continued) |
Advisory fee reductions and expense reimbursements by the Adviser are subject to repayment by the Fund for a period of three years after such fees and expenses were incurred, provided that the repayments do not cause total annual fund operating expenses (exclusive of such reductions and reimbursements) to exceed (i) the expense limitation then in effect, if any, and (ii) the expense limitation in effect at the time the expenses to be repaid were incurred. Prior to June 30, 2023, the agreement may not be modified or terminated without the approval of the Board. After June 30, 2023, the ELA may continue from year-to-year provided such continuance is approved by the Board. The ELA may be terminated by the Adviser, or the Board, without approval by the other party, at the end of the then current term upon not less than 90 days’ notice to the other parties as set forth in the ELA. As of February 28, 2022, the Adviser may seek repayment of expense reimbursements no later than the dates below:
| February 29, 2024 | $ | 141,841 | ||
| February 28, 2025 | 113,574 | |||
| Total | $ | 255,415 | ||
OTHER SERVICE PROVIDERS
Ultimus Fund Solutions, LLC (“Ultimus”) provides administration, fund accounting, compliance and transfer agency services to the Fund. The Fund pays Ultimus fees in accordance with the agreements for such services. In addition, the Fund pays out-of-pocket expenses including, but not limited to, postage, supplies and certain costs related to the pricing of the Fund’s portfolio securities.
Under the terms of a Distribution Agreement with the Trust, Ultimus Fund Distributors, LLC (the “Distributor”) serves as principal underwriter to the Fund. The Distributor is a wholly-owned subsidiary of Ultimus. The Distributor is compensated partially by the Adviser and partially by the Investor Class shares of the Fund for acting as principal underwriter.
A Trustee and certain officers of the Trust are also officers of Ultimus.
DISTRIBUTION PLAN
The Fund has adopted a plan of distribution (the “Plan”), pursuant to Rule 12b-1 under the Investment Company Act of 1940, as amended (the “1940 Act”) which permits Investor Class shares of the Fund to make payments to securities dealers and other financial organizations (including payments directly to the Adviser and the Distributor) for expenses related to the distribution and servicing of the Fund’s Investor Class shares. The annual limitation for payment of expenses pursuant to the Plan is 0.25% of the Fund’s average daily net assets allocable to Investor Class shares. The Fund has not adopted a plan of distribution with respect to Institutional Class shares. During the year ended February 28, 2022, Investor Class shares of the Fund incurred $1,092 of distribution fees under the Plan.
22
| BLUEPRINT ADAPTIVE GROWTH ALLOCATION FUND |
| NOTES TO FINANCIAL STATEMENTS (Continued) |
TRUSTEE COMPENSATION
Effective October 20, 2021, each member of the Board (a “Trustee”) who is not an “interested person” (as defined by the 1940 Act, as amended) of the Trust (“Independent Trustee”) receives a $1,300 annual retainer from the Fund, paid quarterly, except for the Board Chairperson who receives a $1,700 annual retainer from the Fund, paid in quarterly installments. Each Independent Trustee also receives from the Fund a fee of $550 for each Board meeting attended plus reimbursement for travel and other meeting-related expenses. Prior to October 20, 2021, each Independent Trustee received a $1,300 annual retainer from the Fund, paid quarterly, except for the Board Chairperson who received a $1,500 annual retainer from the Fund, paid in quarterly installments. Each Independent Trustee also received from the Fund a fee of $500 for each Board meeting attended plus reimbursement for travel and other meeting-related expenses.
PRINCIPAL HOLDERS OF FUND SHARES
As of February 28, 2022, the following shareholders owned of record 25% or more of the outstanding shares of the Fund:
| NAME OF RECORD OWNER | % OWNERSHIP |
| National Financial Services, LLC (for the benefit of its customers) | 48% |
| TD Ameritrade, Inc. (for the benefit of its customers) | 31% |
A beneficial owner of 25% or more of the Fund’s outstanding shares may be considered a controlling person. That shareholder’s vote could have a more significant effect on matters presented at a shareholders’ meeting.
5. Contingencies and Commitments
The Fund indemnifies the Trust’s officers and Trustees for certain liabilities that might arise from their performance of their duties to the Fund. Additionally, in the normal course of business the Fund enters into contracts that contain a variety of representations and warranties and which provide general indemnifications. The Fund’s maximum exposure under these arrangements is unknown, as this would involve future claims that may be made against the Fund that have not yet occurred. However, based on experience, the Fund expects the risk of loss to be remote.
6. Investment in Other Investment Companies
The Fund may invest a significant portion of its assets in shares of one or more investment companies, including ETFs, open-end mutual funds and money market mutual funds. The Fund will incur additional indirect expenses (acquired fund fees and expenses) to the extent it invests in shares of other investment companies. As of February 28, 2022, the Fund had 38.3% of the value of its net assets invested in ETFs.
23
| BLUEPRINT ADAPTIVE GROWTH ALLOCATION FUND |
| NOTES TO FINANCIAL STATEMENTS (Continued) |
7. Subsequent Events
The Fund is required to recognize in the financial statements the effects of all subsequent events that provide additional evidence about conditions that existed as of the date of the Statement of Assets and Liabilities. For non-recognized subsequent events that must be disclosed to keep the financial statements from being misleading, the Fund is required to disclose the nature of the event as well as an estimate of its financial effect, or a statement that such an estimate cannot be made. Management has evaluated subsequent events through the issuance of these financial statements and has noted no such events.
24
| BLUEPRINT ADAPTIVE GROWTH ALLOCATION FUND |
| REPORT OF INDEPENDENT REGISTERED PUBLIC ACCOUNTING FIRM |
To the Shareholders of Blueprint Adaptive Growth Allocation Fund and
Board of Trustees of Ultimus Managers Trust
Opinion on the Financial Statements
We have audited the accompanying statement of assets and liabilities, including the schedule of investments, of Blueprint Adaptive Growth Allocation Fund (formerly Blueprint Growth Fund) (the “Fund”), a series of Ultimus Managers Trust, as of February 28, 2022, the related statement of operations for the year then ended, the statements of changes in net assets, the related notes, and the financial highlights for each of the two periods in the period then ended (collectively referred to as the “financial statements”). In our opinion, the financial statements present fairly, in all material respects, the financial position of the Fund as of February 28, 2022, the results of its operations for the year then ended, and the changes in net assets and the financial highlights for each of the two periods in the period then ended, in conformity with accounting principles generally accepted in the United States of America.
Basis for Opinion
These financial statements are the responsibility of the Fund’s management. Our responsibility is to express an opinion on the Fund’s financial statements based on our audits. We are a public accounting firm registered with the Public Company Accounting Oversight Board (United States) (“PCAOB”) and are required to be independent with respect to the Fund in accordance with the U.S. federal securities laws and the applicable rules and regulations of the Securities and Exchange Commission and the PCAOB.
We conducted our audits in accordance with the standards of the PCAOB. Those standards require that we plan and perform the audit to obtain reasonable assurance about whether the financial statements are free of material misstatement whether due to error or fraud.
Our audits included performing procedures to assess the risks of material misstatement of the financial statements, whether due to error or fraud, and performing procedures that respond to those risks. Such procedures included examining, on a test basis, evidence regarding the amounts and disclosures in the financial statements. Our procedures included confirmation of securities owned as of February 28, 2022, by correspondence with the custodian and broker; when replies were not received from the broker, we performed other auditing procedures. Our audits also included evaluating the accounting principles used and significant estimates made by management, as well as evaluating the overall presentation of the financial statements. We believe that our audits provide a reasonable basis for our opinion.
We have served as the Fund’s auditor since 2020.
COHEN & COMPANY, LTD.
Cleveland, Ohio
April 27, 2022
25
| BLUEPRINT ADAPTIVE GROWTH ALLOCATION FUND |
| ABOUT YOUR FUND’S EXPENSES (Unaudited) |
We believe it is important for you to understand the impact of costs on your investment. As a shareholder of the Fund, you incur ongoing costs, including management fees, class-specific expenses (such as distribution fees) and other operating expenses. The following examples are intended to help you understand your ongoing costs (in dollars) of investing in the Fund and to compare these costs with the ongoing costs of investing in other mutual funds.
A mutual fund’s ongoing costs are expressed as a percentage of its average net assets. This figure is known as the expense ratio. The expenses in the table below are based on an investment of $1,000 made at the beginning of the most recent period (September 1, 2021) and held until the end of the period (February 28, 2022).
The table below illustrates the Fund’s ongoing costs in two ways:
Actual fund return – This section helps you to estimate the actual expenses that you paid over the period. The “Ending Account Value” shown is derived from the Fund’s actual return, and the fourth column shows the dollar amount of operating expenses that would have been paid by an investor who started with $1,000 in the Fund. You may use the information here, together with the amount you invested, to estimate the expenses that you paid over the period.
To do so, simply divide your account value by $1,000 (for example, an $8,600 account value divided by $1,000 = 8.6), then multiply the result by the number given for the Fund under the heading “Expenses Paid During Period.”
Hypothetical 5% return – This section is intended to help you compare the Fund’s ongoing costs with those of other mutual funds. It assumes that the Fund had an annual return of 5% before expenses during the period shown, but that the expense ratio is unchanged. In this case, because the return used is not the Fund’s actual return, the results do not apply to your investment. The example is useful in making comparisons because the U.S. Securities and Exchange Commission (the “SEC”) requires all mutual funds to calculate expenses based on a 5% return. You can assess the Fund’s ongoing costs by comparing this hypothetical example with the hypothetical examples that appear in shareholder reports of other funds.
Note that expenses shown in the table are meant to highlight and help you compare ongoing costs only. The Fund does not charge transaction fees, such as purchase or redemption fees, nor does it carry a “sales load.”
The calculations assume no shares were bought or sold during the period. Your actual costs may have been higher or lower, depending on the amount of your investment and the timing of any purchases or redemptions.
26
| BLUEPRINT ADAPTIVE GROWTH ALLOCATION FUND |
| ABOUT YOUR FUND’S EXPENSES (Unaudited) (Continued) |
More information about the Fund’s expenses can be found in this report. For additional information on operating expenses and other shareholder costs, please refer to the Fund’s prospectus.
| Beginning | Ending | |||
| Account Value | Account Value | Expenses | ||
| September 1, | February 28, | Net Expense | Paid During | |
| 2021 | 2022 | Ratio(a) | Period(b) | |
| Investor Class | ||||
| Based on Actual Fund Return | $1,000.00 | $ 958.20 | 1.50% | $7.28 |
| Based on Hypothetical 5% Return (before expenses) | $1,000.00 | $ 1,017.36 | 1.50% | $7.50 |
| Institutional Class | ||||
| Based on Actual Fund Return | $1,000.00 | $ 960.00 | 1.25% | $6.07 |
| Based on Hypothetical 5% Return (before expenses) | $1,000.00 | $ 1,018.60 | 1.25% | $6.26 |
| (a) | Annualized, based on the Fund’s most recent one-half year expenses. |
| (b) | Expenses are equal to the Fund’s annualized net expense ratio multiplied by the average account value over the period, multiplied by 181/365 (to reflect the one-half year period). |
27
| BLUEPRINT ADAPTIVE GROWTH ALLOCATION FUND |
| OTHER INFORMATION (Unaudited) |
A description of the policies and procedures that the Fund uses to vote proxies relating to portfolio securities is available without charge upon request by calling toll-free 1-866-983-4525, or on the SEC’s website at www.sec.gov. Information regarding how the Fund voted proxies relating to portfolio securities during the most recent 12-month period ended June 30 is available without charge upon request by calling toll-free 1-866-983-4525, or on the SEC’s website at www.sec.gov.
The Trust files a complete listing of portfolio holdings for the Fund with the SEC as of the end of the first and third quarters of each fiscal year as an exhibit to Form N-PORT. These filings are available upon request by calling 1-866-983-4525. Furthermore, you may obtain a copy of the filings on the SEC’s website at www.sec.gov and on the Fund’s website www.blueprintmutualfunds.com.
| FEDERAL TAX INFORMATION (Unaudited) |
Dividends Received Deduction
For corporate shareholders, 100% of ordinary income dividends paid during the period ended February 28, 2022 qualify for the corporate dividends received deduction.
Qualified Dividend Income
The Fund has designated the maximum amount allowable of their net taxable income as qualified dividend income as provided in the Jobs and Growth Tax Relief Reconciliation Act of 2003. This amount was reflected on Form 1099-DIV for the calendar year 2021.
28
| BLUEPRINT ADAPTIVE GROWTH ALLOCATION FUND |
| BOARD OF TRUSTEES AND EXECUTIVE OFFICERS (Unaudited) |
The Board has overall responsibility for management of the Trust’s affairs. The Trustees serve during the lifetime of the Trust and until its termination, or until death, resignation, retirement, or removal. The Trustees, in turn, elect the officers of the Fund to actively supervise their day-to-day operations. The officers have been elected for an annual term. Each Trustee’s and officer’s address is 225 Pictoria Drive, Suite 450, Cincinnati, Ohio 45246. The following are the Trustees and executive officers of the Fund:
| Name and Year of Birth | Length of Time Served | Position(s) Held with Trust | Principal Occupation(s) During Past 5 Years | Number of Funds in Trust Overseen by Trustee | Directorships of Public Companies Held by Trustee During Past 5 Years |
| Interested Trustees: | |||||
| David R. Carson* Year of Birth: 1958 | Trustee Since 2021 Officer Since February 2012 | Trustee (January 2021 to present) Vice President (January 2021 to present; and previously April 2013 to October 2013) President and Principal Executive Officer of each of its series (October 2013 to January 2021) | Vice President and Director of Client Strategies of Ultimus Fund Solutions, LLC (2013 to present); President of Unified Series Trust (January 2017 to present). | 26 | Interested Trustee of 21 series of the Unified Series Trust (a registered management company) (January 2017 to present). |
| Independent Trustees: | |||||
| Janine L. Cohen Year of Birth: 1952 | Since January 2016 | Chairperson (October 2019 to present) Trustee (January 2016 to present) | Retired since 2013; previously Chief Financial Officer from 2004 to 2013 and Chief Compliance Officer from 2008 to 2013 at AER Advisors, Inc. | 26 | n/a |
29
| BLUEPRINT ADAPTIVE GROWTH ALLOCATION FUND |
| BOARD OF TRUSTEES AND EXECUTIVE OFFICERS (Unaudited) (Continued) |
| Name and Year of Birth | Length of Time Served | Position(s) Held with Trust | Principal Occupation(s) During Past 5 Years | Number of Funds in Trust Overseen by Trustee | Directorships of Public Companies Held by Trustee During Past 5 Years |
| Independent Trustees (Continued): | |||||
| David M. Deptula Year of Birth: 1958 | Since June 2012 | Trustee | Vice President of Legal and Special Projects at Dayton Freight Lines, Inc. since February 2016; Vice President of Tax Treasury at The Standard Register, Inc. from November 2011 to 2016. | 26 | n/a |
| Jacqueline A. Williams Year of Birth: 1954 | Since June 2019 | Trustee | Managing Member of Custom Strategy Consulting, LLC (2017 to present); Managing Director of Global Investment Research (2005 to 2017), Cambridge Associates, LLC. | 26 | n/a |
| Clifford N. Schireson Year of Birth: 1953 | Since June 2019 | Trustee | Retired; Founder of Schireson Consulting, LLC (2017 to 2021); Director of Institutional Services for Brandes Investment Partners, LP (2004-2017). | 26 | Trustee of the San Diego City Employees’ Retirement System (August 2019 to present). |
| Robert E. Morrison Year of Birth: 1957 | Since June 2019 | Trustee | Managing Director, Midwest Trust and FCI Advisors (2022 to present); Senior Vice President and National Practice Lead for Investment, Huntington National Bank/ Huntington Private Bank (2014 to 2022); CEO, CIO, President of 5 Star Investment Management Company (2006 to 2014). | 26 | Independent Trustee and Chairman of the Ultimus Managers Trust (2012 to 2014). |
| * | Mr. Carson is considered an “interested person” of the Trust within the meaning of Section 2(a)(19) of the 1940 Act because of his relationship with the Trust’s administrator, transfer agent, and distributor. Mr. Carson was President of the Trust from October 2013 to January 2021 and Vice President of the Trust from April 2013 to October 2013. |
30
| BLUEPRINT ADAPTIVE GROWTH ALLOCATION FUND |
| BOARD OF TRUSTEES AND EXECUTIVE OFFICERS (Unaudited) (Continued) |
| Name and Year of Birth | Length of Time Served | Position(s) Held with Trust | Principal Occupation(s) During Past 5 Years |
| Executive Officers: | |||
| Todd E. Heim Year of Birth: 1967 | Since 2014 | President (January 2021 to present) Vice President (2014 to January 2021) | Relationship Management Director and Vice President of Ultimus Fund Solutions, LLC (2018 to present); Client Implementation Manager and Assistant Vice President of Ultimus Fund Solutions, LLC (2014 to 2018); Naval Flight Officer of United States Navy (May 1989 to June 2017). |
| Jennifer L. Leamer Year of Birth: 1976 | Since 2014 | Treasurer (2014 to present) Assistant Treasurer (April 2014 to October 2014) | Senior Vice President, Fund Accounting of Ultimus Fund Solutions, LLC (2014 to present). |
| Daniel D. Bauer Year of Birth: 1977 | Since 2016 | Assistant Treasurer (April 2016 to present) | Assistant Vice President, Fund Accounting (September 2015 to present); Fund Accounting Manager (March 2012 to August 2015) of Ultimus Fund Solutions, LLC. |
| Angela A. Simmons Year of Birth: 1975 | Since 2022 | Assistant Treasurer (January 2022 to present) | Vice President, Financial Administration (2022 to present) and Assistant Vice President, Financial Administration (2015 to 2022) of Ultimus Fund Solutions, LLC. |
| Khimmara Greer Year of Birth: 1983 | Since 2021 | Secretary (October 2021 to present) | Vice President and Senior Legal Counsel of Ultimus Fund Solutions, LLC (2021 to present); Vice President, Asset Servicing – Regulatory Administration of The Bank of New York Mellon (2019 to 2021); Vice President and Counsel of State Street Bank and Trust Company (2015 to 2019); and Regulatory Advisor – Fund Regulatory Services of JPMorgan Chase Bank (2014 to 2015). |
| David K. James Year of Birth: 1970 | Since 2021 | Assistant Secretary (October 2021 to present) Secretary (July 2021 to October 2021) | Executive Vice President and Chief Legal and Risk Officer of Ultimus Fund Solutions, LLC (2018 to present); Managing Director and Managing Counsel of State Street Bank and Trust Company (2009 to 2018). |
| Natalie S. Anderson Year of Birth: 1975 | Since 2016 | Assistant Secretary (April 2016 to present) | Legal Administration Manager (July 2016 to present) and Paralegal (January 2015 to June 2016) of Ultimus Fund Solutions, LLC. |
31
| BLUEPRINT ADAPTIVE GROWTH ALLOCATION FUND |
| BOARD OF TRUSTEES AND EXECUTIVE OFFICERS (Unaudited) (Continued) |
| Name and Year of Birth | Length of Time Served | Position(s) Held with Trust | Principal Occupation(s) During Past 5 Years |
| Executive Officers (Continued): | |||
| Gweneth Gosselink Year of Birth: 1955 | Since 2020 | Chief Compliance Officer (January 2020 to present) | Assistant Vice President, Compliance Officer of Ultimus Fund Solutions, LLC (December 2019 to present); CCO Consultant at GKG Consulting, LLC (December 2019 to present); Chief Operating Officer & CCO at Miles Capital, Inc. (June 2013 to December 2019). |
| Martin Dean Year of Birth: 1963 | Since 2019 | Assistant Chief Compliance Officer (January 2020 to present) Interim Chief Compliance Officer (October 2019 to January 2020) Assistant Chief Compliance Officer (January 2016 to 2017) | Senior Vice President, Head of Fund Compliance of Ultimus Fund Solutions, LLC (January 2016 to present). |
Additional information about members of the Board and executive officers is available in the Fund’s Statement of Additional Information (“SAI”). To obtain a free copy of the SAI, please call toll free 1-866-561-3087.
32
| BLUEPRINT ADAPTIVE GROWTH ALLOCATION FUND |
| DISCLOSURE REGARDING APPROVAL OF INVESTMENT ADVISORY AGREEMENT AND SUB-ADVISORY AGREEMENT (Unaudited) |
The Board of Trustees (the “Board”), including the Independent Trustees voting separately, has reviewed and approved the Fund’s Investment Advisory Agreement with Blueprint Fund Management, LLC (the “Adviser” or “Blueprint Management”) for an additional one-year term (the “Advisory Agreement”) and the Sub-Advisory Agreement between Blueprint Management and Blueprint Partners, LLC (the “Sub-Adviser” or “Blueprint Partners”), on behalf of the Fund, for an additional one-year term (the “Sub-Advisory Agreement” and together with the Advisory Agreement, the “Blueprint Advisor Agreements”)). The Board approved the Agreement at a meeting held on January 18-19, 2022, at which all of the Trustees were present.
In deciding on whether to approve the continuation of the Advisory Agreement, the Board recalled its review of the materials related to the Fund and Blueprint Management at the meeting and throughout the life of the Fund and its numerous discussions with Trust management and Blueprint Management about the operations and performance of the Fund during that period. The Board further considered those materials and discussions and other numerous factors, including the following:
The nature, extent, and quality of the services provided by the Adviser. In this regard, the Board reviewed the services being provided by Blueprint Management to the Fund including, without limitation, its providing a continuous investment program for the Fund, adhering to the Fund’s investment restrictions, complying with the Trust’s policies and procedures and voting proxies on behalf of the Fund. The Board considered the qualifications and experience of Blueprint Management’s portfolio managers who are responsible for the day-to day management of the Fund’s portfolio, as well as the qualifications of other individuals at Blueprint Management who provide services to the Fund. The Board concluded that the quality, extent, and nature of the services provided by Blueprint Management to the Fund were satisfactory.
The investment performance of the Fund. In this regard, the Board compared the performance of the Fund with the performance of its benchmark index, custom peer group, and Morningstar category. The Board concluded that the investment performance of the Fund has been satisfactory
The costs of the services provided and profits realized by the Adviser and its affiliates from their relationship with the Fund. In this regard, the Board considered the Fund’s management fee proposed to be charged to the Fund and the Fund’s expense ratio, each as compared to the Fund’s peer group. The Board considered the revenue earned from the Fund and the current and anticipated profitability of the Fund to Blueprint Management, if any. The Board also considered Blueprint Management’s past fee reductions and expense reimbursements for the Fund and the indirect benefits that Blueprint Management received from its management of the Fund. The Board concluded that the advisory fee to be paid to Blueprint Management by the Fund is reasonable in light of the nature and quality of services provided by Blueprint Management.
33
| BLUEPRINT ADAPTIVE GROWTH ALLOCATION FUND |
| DISCLOSURE REGARDING APPROVAL OF INVESTMENT ADVISORY AGREEMENT AND SUB-ADVISORY AGREEMENT (Unaudited) (Continued) |
The extent to which economics of scale would be realized as the Fund grows and whether advisory fee levels reflect these economies of scale for the benefit of the Fund’s investors. In this regard, the Board considered that the Fund’s fee arrangements with Blueprint Management involve both the advisory fee and the expense limitation agreement (the “ELA”). The Board determined that while the advisory fee rate remained the same as asset levels increased, the shareholders of the Fund have experienced benefits from the ELA and will continue to experience benefits from the ELA. The Board concluded that the advisory fee was reasonable in light of the information that was provided to the Trustees by Blueprint Management with respect to economies of scale.
In deciding on whether to approve the continuation of the Sub-Advisory Agreement, the Board recalled its review of the materials related to the Fund and Blueprint Partners at the meeting and throughout the life of the Fund and its numerous discussions with Trust management and Blueprint Partners about the operations and performance of the Fund during that period. The Board further considered those materials and discussions and numerous other factors, including:
The nature, extent, and quality of the services provided by the Sub-Adviser. In this regard, the Board reviewed the services being provided by Blueprint Partners under the Sub-Advisory Agreement to the Fund including, without limitation, its providing a continuous investment program for the Fund, adhering to the Fund’s investment restrictions, complying with the Trust’s policies and procedures and voting proxies on behalf of the Fund. The Board considered the qualifications and experience of Blueprint Partners’ portfolio managers who are responsible for the day-to day management of the Fund’s portfolio, as well as the qualifications of other individuals at Blueprint Partners who provide services to the Fund. The Board concluded that the quality, extent, and nature of the services provided by Blueprint Partner to the Fund were satisfactory.
The investment performance of the Fund. In this regard, the Board compared the performance of the Fund with the performance of its benchmark index, custom peer group, and Morningstar category. The Board concluded that the investment performance of the Fund has been satisfactory
The costs of the services provided and profits realized by the Sub-Adviser and its affiliates from its relationship with the Fund. In this regard, the Board considered that Blueprint Partners’ compensation for sub-advising the Fund is solely the responsibility of Blueprint Management, and that the Fund is not responsible for paying Blueprint Partners. The Board considered the revenue earned by Blueprint Partners under the Sub-Advisory Agreement and the common ownership and relationship with Blueprint Management. The Board concluded that the sub-advisory fee to be paid to Blueprint Partners would not increase fees paid by the Fund and is reasonable in light of the nature and quality of services provided by Blueprint Partners.
34
| BLUEPRINT ADAPTIVE GROWTH ALLOCATION FUND |
| DISCLOSURE REGARDING APPROVAL OF INVESTMENT ADVISORY AGREEMENT AND SUB-ADVISORY AGREEMENT (Unaudited) (Continued) |
The extent to which economies of scale would be realized as the Fund grows and whether advisory fee levels reflect these economies of scale for the benefit of the Fund’s investors. The Board determined that while the sub-advisory fee rate remained the same as asset levels increased, the shareholders of the Fund have experienced benefits from the ELA and will continue to experience benefits from the ELA. The Board concluded that Blueprint Management’s arrangement with Blueprint Partners was reasonable in light of the information that was provided to the Trustees by Blueprint Management and Blueprint Partners with respect to economies of scale.
After further discussion of the factors noted above and in reliance on the information provided by Blueprint Management, Blueprint Partners and Trust management, and taking into account the totality of all the factors discussed and information presented at the meeting and previous meetings, the Board indicated its agreement to approve the continuance of the Blueprint Advisory Agreements. It was noted that in the Trustees’ deliberations regarding the approval of renewal the Blueprint Advisory Agreements, the Trustees did not identify any particular information or factor that was all-important or controlling, and that each individual Trustee may have attributed different weights to the various factors listed above. After full consideration of the above factors as well as other factors, the Board unanimously concluded that approval of the continuance of the Blueprint Advisory Agreements were in the best interests of the Fund and its shareholders.
35
| BLUEPRINT ADAPTIVE GROWTH ALLOCATION FUND |
| LIQUIDITY RISK MANAGEMENT PROGRAM (Unaudited) |
The Fund has adopted and implemented a written liquidity risk management program (the “Program”) as required by Rule 22e-4 (the “Liquidity Rule”) under the Investment Company Act of 1940, as amended. The Program is reasonably designed to assess and manage the Fund’s liquidity risk, taking into consideration, among other factors, the Fund’s investment strategy and the liquidity of its portfolio investments during normal and reasonably foreseeable stressed conditions; its short- and long-term cash flow projections; and its cash holdings and access to other funding sources. The Fund’s Board of Trustees (the “Board”) approved the appointment of the Liquidity Administrator Committee, comprising of the Fund’s Adviser and certain Trust officers, to be responsible for the Program’s administration and oversight and for reporting to the Board on at least an annual basis regarding the Program’s operation and effectiveness. The annual written report assessing the Program (the “Report”) was presented to the Board at the October 18 - 19, 2021 Board meeting and covered the period from June 1, 2020 to May 31, 2021 (the “Review Period”).
During the Review Period, the Fund did not experience unusual stress or disruption to its operations related to purchase and redemption activity. Also, during the Review Period, the Fund held adequate levels of cash and highly liquid investments to meet shareholder redemption activities in accordance with applicable requirements. The Report concluded that the Program is reasonably designed to prevent violation of the Liquidity Rule and the Program has been effectively implemented.
36
This page intentionally left blank.
Blueprint-AR-22
 |
| HVIA EQUITY FUND |
| INSTITUTIONAL CLASS (HVEIX) |
| Managed by |
| Hudson Valley Investment Advisors, Inc. |
| ANNUAL REPORT |
| February 28, 2022 |
| HVIA EQUITY FUND | |
| LETTER TO SHAREHOLDERS | February 28, 2022 |
HVIA Equity Fund for One Year Period Ended February 28, 2022
The HVIA Equity Fund (“HVEIX” or the “Fund”) launched on October 31, 2016. The Fund’s focus is on using a GARP investment framework to determine suitable investments. This acronym is “Growth at a Reasonable Price” which focuses on investing in equities that are at a discount to their expected growth rate. In my experience of using this investment philosophy, we have come to realize that the process does not fit neatly into months, quarters or years but it expects to outperform over the longer term.
Investment Environment
HVEIX recorded yearly returns of +14.66% compared to +16.39% for the S&P 500 Index. The underperformance was a result of the sharp rotation out of longer duration equities over the last 3 months in the year by the Fund. The appreciation of U.S. equities was a direct reflection of the strength in U.S. GDP. As 2021 progressed the U.S. economy gained traction and benefitted from government initiatives that helped the economy maintain growth until the economy returned to being self-sustaining. This change occurred as individuals have gone back to work and learned how to live with COVID-19. The demand spike has overwhelmed supply as we saw shortages across many industries. This pushed up prices, extended the time needed to receive goods and impacted the availability of services. Over the year, inflation was first thought to be transitory, with lower pricing expected once logistic supply chains normalized. The combination of economic shocks and logistic issues are a major factor in extending the inflationary environment. We expect inflation will return to a lower level as inventories improve and a greater percentage of individuals return to work over next few quarters.
Equity appreciation was due to the strong revenue and earnings growth. Earnings growth was approximately 40% from the start of the year. Wall Street analysts consistently underestimated the strength of U.S. GDP growth. That strength flowed through to double digit revenue and earnings.
At calendar year end, the Federal Reserve’s (the “Fed”) monetary policy changed to reduce quantitative easing and moved to raise rates. Fed Chairman Powell telegraphed that it would stop purchasing bonds and reduce the monies into the U.S. economy. Interest rates were also expected to rise in conjunction with increases in the Fed Funds rate, which is expected to slow down the economic excess that was seen over the last 12 to 18 months.
HVIA believes that longer term, the availability of labor will be a major factor in future GDP growth. The COVID-19 pandemic influenced the labor supply, which contracted continually as 2021 progressed. The number of individuals who left the workforce, were sick from COVID-19 or took care of someone with COVID-19 was estimated to be close to 8 million people. The lower number of COVID-19 cases has started to help alleviate the supply issue as we write this letter and we would expect some let up in the labor supply shortage as we moved into 2022. Longer term, we believe we are in a period of perpetual labor shortages.
1
The geopolitical environment is one of the most fluid that we’ve seen. The Russia- Ukraine conflict has led to a land war that has seen the largest dislocation of individuals in Europe since World War II. We believe that the ramifications of the war and sanctions may have changed globalization and the benefits that the world received from the peace dividend benefit that came with the falling of the Berlin Wall. This may usher in a period where domestic investment for reshoring will increase. We have seen significant increase in domestic capital expenditure investment and a spike in U.S. companies that are moving manufacturing operations back onshore. HVIA believes these changes will start a period in which we will see a productivity increase to offset the limited labor shortage that will be with us for the next decade.
HVIA continues to believe that the economy has significant momentum that will keep us out of recession. The need to rebuild inventories for automobiles and housing will help to extend the economic expansion. We also believe there will be continued investments in technology to help with productivity, along with investments in warehousing and manufacturing spaces which are in short supply. We should therefore see continued positive GDP growth despite COVID-19, inflation, and war.
Over the long term, earnings are the main determinate of stock market value. On a short-term basis, the “noise” of factors such as interest rates and inflation will bring a rise in volatility. Economic growth will continue to be maintained, which will help to extend the economy’s expansion. One change in our thinking is that inflation will take longer to normalize as the supply shocks to inventories and commodities will add to short term inflation. We are comfortable with seeing a return to “normalcy” over the coming quarters, but we will continue to see these short-term issues. However, we will be moving into a longer-term growth cycle as most sectors in the economy do not appear overextended and there is not a buildup of financial excess.
Interest rate spreads, which provide a gauge for risk, have increased slightly but are behaving, which signals there is capital availability and risk is acting appropriately. We further expect to see inflation subside as we get into the back half of fiscal year 2022, as supply chains improve and more persons return to work. The expected increase in interest rates will also dampen demand putting pressure on prices. Again, HVIA continues to believe that we will see an upward bias for equities as the year progresses and war recedes. The equity markets had seen substantial growth over the past few quarters. We believe that we will continue to see volatility due to political events and the normalization of interest rates. The Fund expects some slowing to the economy but remain at levels that surprise consensus estimates. We also anticipate that margins will be better than expected and that a positive but slowing economy should help to support overall S&P 500 earnings. Valuations have been reduced and are in line with historical multiples, and are what now is considered a fair valuation on a relative basis.
Current Market Expectations
The Fund continues to see a rotation from larger cap cyclical to less expensive areas such as commodity and value sectors. Interest rates rose and the yield curve flattened contracting from approximately 120 basis points to less than 40 basis points. Longer duration (stocks that are priced based on consistent longer-term earnings) saw a revaluation. Risk increased with the anticipation of Fed action to tame rising inflation. President Biden became more
2
focused on inflation as well and requested Fed Chairman Powell to act. The Chairman Powell communicated that the Fed would take away liquidity and raise rates as we got to the end of the first quarter of ’22. The anticipation of these changes have tightened the yield curve and signaled a higher level of risk helping to dampen inflation. Inflation data has and will remain hot due to the reopening of the economy and pent-up demand of consumers, while supply remains tight. As more individuals come back to work and COVID-19 recedes further we should see an improvement in inflation numbers. Finally, we believe that in spite of the Russia/Ukraine conflict, the U.S. economy has momentum to continue to keep us out of recession as we move through a market correction.
Over the short term, risk has increased but futures markets are pricing in nine rate increases, which we believe is too aggressive. The combination of the Russian war and higher commodity prices have slightly dampened demand. We expect that the economy will remain positive depending on the length of the war. Other factors to consider in the U.S. are the pent-up demand from consumers, and the need to rebuild inventories of cars and homes while employment remains robust. The fluidness of the current environment will continue to cause heightened levels of volatility. We also believe that consumers have seen significant levels of wealth appreciation, which should lead to continued spending growth.
Finally, we are expecting the mid-term election will bring significant changes in both the House and Senate, which may change the direction of transformative social programs. We believe this would move elected officials to limit major changes and work on issues such as education, infrastructure and defense. Also, the U.S. will be forced to confront the limited amount of labor as it will force a cycle of investment to gain productivity. We’ll wait to see the potential changes and opportunities. Longer term the outlook is for sustained growth. No matter what happens we are looking at valuations that are reasonable and growth that is solid. We are long term bullish on equity markets.
Investment Philosophy and Performance
We invest with an eye for the longer term, which means over 18 months. We focus on companies that are showing improving asset utilization, margin expansion and efficient capital allocation. The net effect is a portfolio of companies that tend to trend towards an improving Return on Equity (which is a measure of how well a company uses investments to generate earnings), but are trading at a discount to their expected growth or that of the industry group.
The following three positions had the largest total return for the quarter:
| Nvidia Corp. (NVDA) | 76.32% |
| Autozone Inc. (AZO) | 59.35% |
| Prologis Inc. (PLD) | 49.63% |
Our top performer during the year was Nvidia Corp. “NVDA”, which saw strong demand, and increase in market share with its end markets seeing continued accelerated growth. The company’s largest percentage market shares include video gaming and electronic vehicles. NVDA is also expanding into other areas such as healthcare, due to the computational processing power of its chips. Autozone, Inc. benefitted from the limited number of cars that
3
are available for sale, the longer period of time individuals are holding onto their cars and the need to invest in parts and fluids. The company is well positioned over the next year as the limited car supply dynamic will continue. The Fund’s third best performer was Prologis which is a main cog in the distribution networks for companies that have on line sales. The company has seen higher levels of inventories that it held as buffer by its clients during this past period in which inventories were an issue.
The following positions had the greatest negative total return for the quarter:
| Walt Disney Company (DIS) | -23.86% |
| Southwest Airlines Co. (LUV) | -24.56% |
| Illumina Inc. (ILMN) | -26.85% |
Walt Disney Company was the Fund’s third worst performer. The company saw a slowdown in its previously strong growth from its streaming business. Availability of labor and increased costs also cut into profitability. Southwest Airlines was also impacted from continued COVID-19 concerns on travel and the company lowering its earnings outlook from increased input costs. We are still big fans of the company and believe their low cost, limited debt and gate expansion into new airports positions the company for the future. Our worst performer was Illumina Inc. which has had strong revenue and earnings numbers. They maintained a conservative outlook which may have factored into its underperformance over the past six months. The company is well positioned for future growth. Their medical technology is strong and well positioned for preventive diagnostics. These are all well run companies but on a macro basis there is a reweighting based on sectors that is fluid which we expect to continue. The Fund continues to hold these positions.
Sincerely,
 |  |
| Gustave J. Scacco | Ronald P. Mayfield |
| Portfolio Manager | Co-Portfolio Manager |
Past performance is not predictive of future performance. Investment results and principal value will fluctuate so that shares, when redeemed, may be worth more or less than their original cost. Current performance may be higher or lower than the performance data quoted. Performance data current to the most recent month-end is available by calling 1-888-209-8710.
An investor should consider the investment objectives, risks, charges, and expenses of the Fund carefully before investing. The Fund’s prospectus contains this and other important information. To obtain a copy of the Fund’s prospectus please call 1-888-209-8710 and a copy will be sent to you free of charge. Please read the prospectus carefully before you invest. The Fund is distributed by Ultimus Fund Distributors, LLC.
4
The Letter to Shareholders seeks to describe some of the Adviser’s current opinions and views of the financial markets. Although the Adviser believes it has a reasonable basis for any opinions or views expressed, actual results may differ, sometimes significantly so, from those expected or expressed. The securities held by the Fund that are discussed in the Letter to Shareholders were held during the period covered by this Report. They do not comprise the entire investment portfolio of the Fund, may be sold at any time, and may no longer be held by the Fund. For a complete list of securities held by the Fund as of February 28, 2022, please see the Schedule of Investments section of the annual report. The opinions of the Fund’s adviser with respect to those securities may change at any time.
5
| HVIA EQUITY FUND |
| PERFORMANCE INFORMATION |
| February 28, 2022 (Unaudited) |
Comparison of the Change in Value of a $25,000 Investment in
HVIA Equity Fund - Institutional Class versus the S&P 500® Index
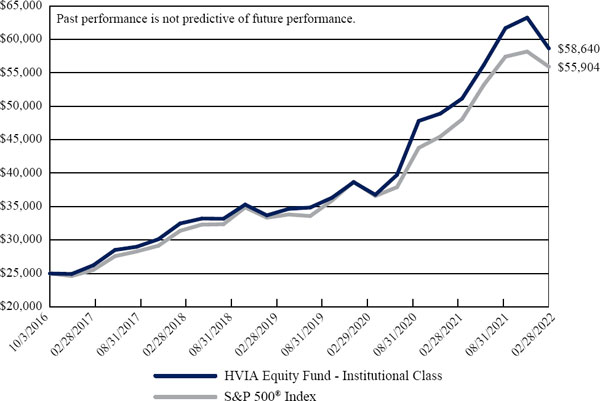
| Average Annual Total Returns | ||||||
| (for the period ended February 28, 2022) | ||||||
| Since | ||||||
| 1 Year | 5 Years | Inception(b) | ||||
| HVIA Equity Fund - Institutional Class(a) | 14.66% | 15.51% | 17.08% | |||
| S&P 500® Index(c) | 16.39% | 15.17% | 16.05% | |||
| (a) | The Fund’s total returns do not reflect the deduction of taxes a shareholder would pay on Fund distributions or the redemption of Fund shares. |
| (b) | The Fund commenced operations on October 3, 2016. |
| (c) | The S&P 500® Index is a market capitalization weighted index of 500 large companies that is widely used as a barometer of U.S. stock market performance. The index is unmanaged and shown for illustration purposes only. An investor cannot invest in an index and its returns are not indicative of the performance of any specific investment. |
6
| HVIA EQUITY FUND |
| PORTFOLIO INFORMATION |
| February 28, 2022 (Unaudited) |
Sector Diversification (% of Net Assets)
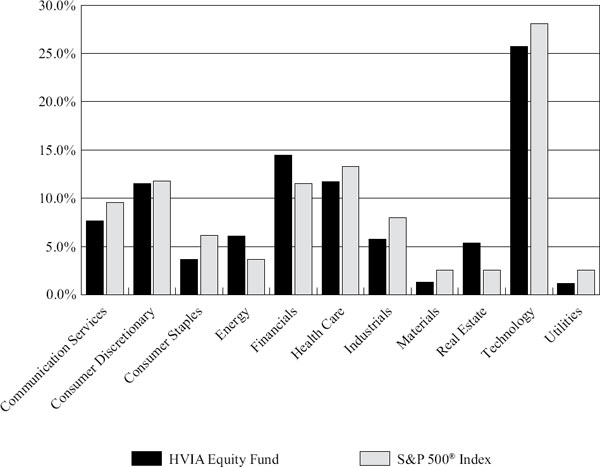
| Top 10 Equity Holdings | |
| % of | |
| Security Description | Net Assets |
| Apple, Inc. | 4.5% |
| Microsoft Corporation | 4.3% |
| Ciena Corporation | 3.9% |
| Alphabet, Inc. - Class C | 3.8% |
| NVIDIA Corporation | 3.8% |
| Bank of America Corporation | 3.7% |
| Amazon.com, Inc. | 3.7% |
| Exxon Mobil Corporation | 3.5% |
| salesforce.com, inc. | 2.9% |
| Marsh & McLennan Companies, Inc. | 2.9% |
7
| HVIA EQUITY FUND |
| SCHEDULE OF INVESTMENTS |
| February 28, 2022 |
| COMMON STOCKS — 94.6% | Shares | Value | ||||||
| Communications — 7.7% | ||||||||
| Cable & Satellite — 0.6% | ||||||||
| Comcast Corporation - Class A | 5,000 | $ | 233,800 | |||||
| Entertainment Content — 1.8% | ||||||||
| Walt Disney Company (The) (a) | 4,500 | 668,070 | ||||||
| Internet Media & Services — 4.7% | ||||||||
| Alphabet, Inc. - Class C (a) | 535 | 1,443,334 | ||||||
| Meta Platforms, Inc. - Class A (a) | 1,550 | 327,097 | ||||||
| 1,770,431 | ||||||||
| Telecommunications — 0.6% | ||||||||
| Verizon Communications, Inc. | 4,560 | 244,735 | ||||||
| Consumer Discretionary — 11.5% | ||||||||
| Apparel & Textile Products — 0.8% | ||||||||
| NIKE, Inc. - Class B | 2,300 | 314,065 | ||||||
| Automotive — 0.6% | ||||||||
| Magna International, Inc. | 3,000 | 222,810 | ||||||
| E-Commerce Discretionary — 3.7% | ||||||||
| Amazon.com, Inc. (a) | 450 | 1,382,067 | ||||||
| Home Construction — 0.2% | ||||||||
| Lennar Corporation - Class A | 800 | 71,904 | ||||||
| Leisure Facilities & Services — 3.8% | ||||||||
| Chipotle Mexican Grill, Inc. (a) | 400 | 609,340 | ||||||
| Royal Caribbean Cruises Ltd. (a) | 3,835 | 309,561 | ||||||
| Starbucks Corporation | 5,800 | 532,382 | ||||||
| 1,451,283 | ||||||||
| Retail - Discretionary — 2.4% | ||||||||
| AutoZone, Inc. (a) | 265 | 493,798 | ||||||
| CarMax, Inc. (a) | 1,200 | 131,196 | ||||||
| Home Depot, Inc. (The) | 825 | 260,560 | ||||||
| 885,554 | ||||||||
| Consumer Staples — 3.7% | ||||||||
| Beverages — 0.8% | ||||||||
| PepsiCo, Inc. | 1,900 | 311,106 | ||||||
| Food — 0.8% | ||||||||
| Mondel z International, Inc. - Class A | 4,400 | 288,112 | ||||||
8
| HVIA EQUITY FUND |
| SCHEDULE OF INVESTMENTS (Continued) |
| COMMON STOCKS — 94.6% (Continued) | Shares | Value | ||||||
| Consumer Staples — 3.7% (Continued) | ||||||||
| Household Products — 1.0% | ||||||||
| Estée Lauder Companies, Inc. (The) - Class A | 1,300 | $ | 385,229 | |||||
| Retail - Consumer Staples — 1.1% | ||||||||
| Dollar General Corporation | 2,050 | 406,597 | ||||||
| Energy — 6.1% | ||||||||
| Oil & Gas Producers — 6.1% | ||||||||
| Coterra Energy, Inc. | 22,500 | 524,925 | ||||||
| Enbridge, Inc. | 10,006 | 432,059 | ||||||
| Exxon Mobil Corporation | 17,050 | 1,337,061 | ||||||
| 2,294,045 | ||||||||
| Financials — 14.5% | ||||||||
| Banking — 6.5% | ||||||||
| Bank of America Corporation | 31,865 | 1,408,433 | ||||||
| JPMorgan Chase & Company | 7,450 | 1,056,410 | ||||||
| 2,464,843 | ||||||||
| Institutional Financial Services — 2.7% | ||||||||
| Morgan Stanley | 11,300 | 1,025,362 | ||||||
| Insurance — 2.9% | ||||||||
| Marsh & McLennan Companies, Inc. | 7,000 | 1,087,870 | ||||||
| Specialty Finance — 2.4% | ||||||||
| American Express Company | 4,550 | 885,157 | ||||||
| Health Care — 11.7% | ||||||||
| Biotech & Pharma — 2.3% | ||||||||
| Eli Lilly & Company | 1,000 | 249,950 | ||||||
| Pfizer, Inc. | 13,500 | 633,690 | ||||||
| 883,640 | ||||||||
| Health Care Facilities & Services — 1.9% | ||||||||
| UnitedHealth Group, Inc. | 1,500 | 713,805 | ||||||
| Medical Equipment & Devices — 7.5% | ||||||||
| Danaher Corporation | 3,400 | 932,994 | ||||||
| Illumina, Inc. (a) | 1,750 | 571,550 | ||||||
| Medtronic plc | 3,800 | 398,962 | ||||||
| PerkinElmer, Inc. | 2,900 | 520,869 | ||||||
| Thermo Fisher Scientific, Inc. | 750 | 408,000 | ||||||
| 2,832,375 | ||||||||
9
| HVIA EQUITY FUND |
| SCHEDULE OF INVESTMENTS (Continued) |
| COMMON STOCKS — 94.6% (Continued) | Shares | Value | ||||||
| Industrials — 5.8% | ||||||||
| Machinery — 1.3% | ||||||||
| Lincoln Electric Holdings, Inc. | 2,350 | $ | 299,531 | |||||
| Oshkosh Corporation | 1,650 | 183,216 | ||||||
| 482,747 | ||||||||
| Transportation & Logistics — 4.5% | ||||||||
| CSX Corporation | 18,000 | 610,380 | ||||||
| FedEx Corporation | 3,700 | 822,399 | ||||||
| Southwest Airlines Company (a) | 6,150 | 269,370 | ||||||
| 1,702,149 | ||||||||
| Materials — 1.3% | �� | |||||||
| Chemicals — 1.3% | ||||||||
| Sherwin-Williams Company (The) | 1,785 | 469,687 | ||||||
| Real Estate — 5.4% | ||||||||
| REITs — 5.4% | ||||||||
| American Tower Corporation | 1,200 | 272,244 | ||||||
| Prologis, Inc. | 6,000 | 875,100 | ||||||
| Simon Property Group, Inc. | 6,520 | 896,891 | ||||||
| 2,044,235 | ||||||||
| Technology — 25.7% | ||||||||
| Semiconductors — 6.6% | ||||||||
| Advanced Micro Devices, Inc. (a) | 8,617 | 1,062,821 | ||||||
| NVIDIA Corporation | 5,900 | 1,438,715 | ||||||
| 2,501,536 | ||||||||
| Software — 9.6% | ||||||||
| Adobe, Inc. (a) | 1,930 | 902,622 | ||||||
| Microsoft Corporation | 5,400 | 1,613,466 | ||||||
| salesforce.com, inc. (a) | 5,200 | 1,094,756 | ||||||
| 3,610,844 | ||||||||
| Technology Hardware — 8.4% | ||||||||
| Apple, Inc. | 10,300 | 1,700,736 | ||||||
| Ciena Corporation (a) | 21,250 | 1,453,925 | ||||||
| 3,154,661 | ||||||||
| Technology Services — 1.1% | ||||||||
| Visa, Inc. - Class A | 2,000 | 432,240 | ||||||
| Utilities — 1.2% | ||||||||
| Electric Utilities — 1.2% | ||||||||
| AES Corporation (The) | 11,400 | 242,022 | ||||||
| Duke Energy Corporation | 2,180 | 218,894 | ||||||
| 460,916 | ||||||||
| Total Common Stocks (Cost $20,421,714) | $ | 35,681,875 | ||||||
10
| HVIA EQUITY FUND |
| SCHEDULE OF INVESTMENTS (Continued) |
| MONEY MARKET FUNDS — 5.4% | Shares | Value | ||||||
| First American Government Obligations Fund - Class X, 0.03% (b) (Cost $2,030,572) | 2,030,572 | $ | 2,030,572 | |||||
| Investments at Value — 100.0% (Cost $22,452,286) | $ | 37,712,447 | ||||||
| Other Assets in Excess of Liabilities — 0.0% (c) | 19,155 | |||||||
| Net Assets — 100.0% | $ | 37,731,602 | ||||||
plc - Public Limited Company
| (a) | Non-income producing security. |
| (b) | The rate shown is the 7-day effective yield as of February 28, 2022. |
| (c) | Percentage rounds to less than 0.1%. |
See accompanying notes to financial statements.
11
| HVIA EQUITY FUND |
| STATEMENT OF ASSETS AND LIABILITIES |
| February 28, 2022 |
| ASSETS | ||||
| Investments in securities: | ||||
| At cost | $ | 22,452,286 | ||
| At value (Note 2) | $ | 37,712,447 | ||
| Dividends receivable | 38,095 | |||
| Other assets | 9,726 | |||
| TOTAL ASSETS | 37,760,268 | |||
| LIABILITIES | ||||
| Payable for capital shares redeemed | 1,388 | |||
| Payable to Adviser (Note 4) | 10,509 | |||
| Payable to administrator (Note 4) | 8,369 | |||
| Other accrued expenses | 8,400 | |||
| TOTAL LIABILITIES | 28,666 | |||
| NET ASSETS | $ | 37,731,602 | ||
| NET ASSETS CONSIST OF: | ||||
| Paid-in capital | $ | 21,557,705 | ||
| Distributable earnings | 16,173,897 | |||
| NET ASSETS | $ | 37,731,602 | ||
| PRICING OF INSTITUTIONAL SHARES (NOTE 1) | ||||
| Net assets applicable to Institutional Shares | $ | 37,731,602 | ||
| Shares of Institutional Shares outstanding (unlimited number of shares authorized, no par value) | 1,741,051 | |||
| Net asset value, offering price and redemption price per share (Note 2) | $ | 21.67 |
See accompanying notes to financial statements.
12
| HVIA EQUITY FUND |
| STATEMENT OF OPERATIONS |
| For the Year Ended February 28, 2022 |
| INVESTMENT INCOME | ||||
| Dividends | $ | 404,047 | ||
| Foreign withholding taxes on dividends | (4,511 | ) | ||
| Interest | 204 | |||
| TOTAL INVESTMENT INCOME | 399,740 | |||
| EXPENSES | ||||
| Investment advisory fees (Note 4) | 273,662 | |||
| Administration fees (Note 4) | 37,026 | |||
| Fund accounting fees (Note 4) | 34,358 | |||
| Legal fees | 26,845 | |||
| Registration and filing fees | 22,367 | |||
| Transfer agent fees (Note 4) | 18,392 | |||
| Audit and tax services fees | 17,460 | |||
| Trustees’ fees and expenses (Note 4) | 17,403 | |||
| Compliance fees (Note 4) | 12,000 | |||
| Printing of shareholder reports | 8,441 | |||
| Custody and bank service fees | 7,233 | |||
| Postage and supplies | 5,455 | |||
| Insurance expense | 3,549 | |||
| Other expenses | 16,427 | |||
| TOTAL EXPENSES | 500,618 | |||
| Less fee reductions by the Adviser (Note 4) | (134,504 | ) | ||
| NET EXPENSES | 366,114 | |||
| NET INVESTMENT INCOME | 33,626 | |||
| REALIZED AND UNREALIZED GAINS (LOSSES) ON INVESTMENTS AND FOREIGN CURRENCIES | ||||
| Net realized gains (losses) from: | ||||
| Investments | 1,530,311 | |||
| Foreign currency transactions | (326 | ) | ||
| Net change in unrealized appreciation (depreciation) on: | ||||
| Investments | 3,049,260 | |||
| Foreign currency translations | 26 | |||
| NET REALIZED AND UNREALIZED GAINS ON INVESTMENTS AND FOREIGN CURRENCIES | 4,579,271 | |||
| NET INCREASE IN NET ASSETS RESULTING FROM OPERATIONS | $ | 4,612,897 |
See accompanying notes to financial statements.
13
| HVIA EQUITY FUND |
| STATEMENTS OF CHANGES IN NET ASSETS |
| Year | Year | |||||||
| Ended | Ended | |||||||
| February 28, | February 28, | |||||||
| 2022 | 2021 | |||||||
| FROM OPERATIONS | ||||||||
| Net investment income | $ | 33,626 | $ | 32,974 | ||||
| Net realized gains (losses) from: | ||||||||
| Investments | 1,530,311 | 351,628 | ||||||
| Foreign currency transactions | (326 | ) | (709 | ) | ||||
| Net change in unrealized appreciation (depreciation) on: | ||||||||
| Investments | 3,049,260 | 8,023,634 | ||||||
| Foreign currency translation | 26 | 44 | ||||||
| Net increase in net assets resulting from operations | 4,612,897 | 8,407,571 | ||||||
| DISTRIBUTIONS TO SHAREHOLDERS (Note 2) | ||||||||
| Institutional Shares | (1,033,718 | ) | (143,520 | ) | ||||
| CAPITAL SHARE TRANSACTIONS | ||||||||
| Institutional Shares | ||||||||
| Proceeds from shares sold | 6,829,941 | 3,621,574 | ||||||
| Net asset value of shares issued in reinvestment of distributions to shareholders | 8,401 | 1,022 | ||||||
| Payments for shares redeemed | (3,095,580 | ) | (1,705,703 | ) | ||||
| Net increase in Institutional Shares net assets from capital share transactions | 3,742,762 | 1,916,893 | ||||||
| TOTAL INCREASE IN NET ASSETS | 7,321,941 | 10,180,944 | ||||||
| NET ASSETS | ||||||||
| Beginning of year | 30,409,661 | 20,228,717 | ||||||
| End of year | $ | 37,731,602 | $ | 30,409,661 | ||||
| CAPITAL SHARE ACTIVITY | ||||||||
| Institutional Shares | ||||||||
| Shares sold | 309,929 | 229,701 | ||||||
| Shares reinvested | 350 | 54 | ||||||
| Shares redeemed | (138,606 | ) | (105,450 | ) | ||||
| Net increase in shares outstanding | 171,673 | 124,305 | ||||||
| Shares outstanding at beginning of year | 1,569,378 | 1,445,073 | ||||||
| Shares outstanding at end of year | 1,741,051 | 1,569,378 | ||||||
See accompanying notes to financial statements.
14
| HVIA EQUITY FUND |
| INSTITUTIONAL SHARES |
| FINANCIAL HIGHLIGHTS |
Per Share Data for a Share Outstanding Throughout Each Year
| Year | Year | Year | Year | Year | ||||||||||||||||
| Ended | Ended | Ended | Ended | Ended | ||||||||||||||||
| February 28, | February 28, | February 29, | February 28, | February 28, | ||||||||||||||||
| 2022 | 2021 | 2020 | 2019 | 2018 | ||||||||||||||||
| Net asset value at beginning of year | $ | 19.38 | $ | 14.00 | $ | 13.28 | $ | 13.17 | $ | 11.39 | ||||||||||
| Income from investment operations: | ||||||||||||||||||||
| Net investment income | 0.02 | 0.02 | 0.06 | 0.09 | 0.06 | |||||||||||||||
| Net realized and unrealized gains on investments and foreign currencies | 2.88 | 5.45 | 0.76 | 0.43 | 1.81 | |||||||||||||||
| Total from investment operations | 2.90 | 5.47 | 0.82 | 0.52 | 1.87 | |||||||||||||||
| Less distributions from: | ||||||||||||||||||||
| Net investment income | (0.03 | ) | (0.00 | ) (a) | (0.07 | ) | (0.08 | ) | (0.06 | ) | ||||||||||
| Net realized gains | (0.58 | ) | (0.09 | ) | (0.03 | ) | (0.33 | ) | (0.03 | ) | ||||||||||
| Total distributions | (0.61 | ) | (0.09 | ) | (0.10 | ) | (0.41 | ) | (0.09 | ) | ||||||||||
| Net asset value at end of year | $ | 21.67 | $ | 19.38 | $ | 14.00 | $ | 13.28 | $ | 13.17 | ||||||||||
| Total return (b) | 14.66 | % | 39.10 | % | 6.11 | % | 4.34 | % | 16.45 | % | ||||||||||
| Net assets at end of year (000’s) | $ | 37,732 | $ | 30,410 | $ | 20,229 | $ | 17,929 | $ | 15,059 | ||||||||||
| Ratios/supplementary data: | ||||||||||||||||||||
| Ratio of total expenses to average net assets | 1.35 | % | 1.59 | % | 1.76 | % | 1.86 | % | 2.11 | % | ||||||||||
| Ratio of net expenses to average net assets (c) | 0.99 | % | 0.99 | % | 0.99 | % | 0.99 | % | 0.99 | % | ||||||||||
| Ratio of net investment income to average net assets (c) | 0.09 | % | 0.13 | % | 0.42 | % | 0.70 | % | 0.53 | % | ||||||||||
| Portfolio turnover rate | 11 | % | 11 | % | 16 | % | 29 | % | 4 | % | ||||||||||
| (a) | Amount rounds to less than $0.01 per share. |
| (b) | Total return is a measure of the change in value of an investment in the Fund over the periods covered. The returns shown do not reflect the deduction of taxes a shareholders would pay on Fund distributions, if any, or the redemption of Fund shares. The total returns would be lower if the Adviser had not reduced advisory fees and reimbursed expenses. |
| (c) | Ratio was determined after advisory fee reductions and expense reimbursements (Note 4). |
See accompanying notes to financial statements.
15
| HVIA EQUITY FUND |
| NOTES TO FINANCIAL STATEMENTS |
| February 28, 2022 |
1. Organization
HVIA Equity Fund (the “Fund”) is a diversified series of Ultimus Managers Trust (the “Trust”), an open-end investment company established as an Ohio business trust under a Declaration of Trust dated February 28, 2012. Other series of the Trust are not incorporated in this report.
The investment objective of the Fund is to seek growth at a reasonable price.
The Fund currently offers one class of shares: Institutional Class shares (sold without any sales loads or distribution fees and subject to a $25,000 initial investment requirement). As of February 28, 2022, the Investor Class shares (to be sold without any sales load, but subject to a distribution fee of up to 0.25% of the class’s average daily net assets and subject to a $2,500 initial investment requirement) are not currently offered. When both classes are offered, each share class will represent an ownership interest in the same investment portfolio.
2. Significant Accounting Policies
The following is a summary of the Fund’s significant accounting policies. The policies are in conformity with accounting principles generally accepted in the United States of America (“GAAP”). The Fund follows accounting and reporting guidance under Financial Accounting Standards Board Accounting Standards Codification Topic 946, “Financial Services – Investment Companies.”
Securities valuation – The Fund values its portfolio securities at fair value as of the close of regular trading on the New York Stock Exchange (the “NYSE”) (normally 4:00 p.m. Eastern time) on each business day the NYSE is open for business. The Fund values its common stocks on the basis of the security’s last sale price on the security’s primary exchange, if available, otherwise at the exchange’s most recently quoted mean price. NASDAQ-listed securities are valued at the NASDAQ Official Closing Price. Investments representing shares of other registered open-end investment companies that are not listed on an exchange, including money market funds, are valued at their net asset value (“NAV”) as reported by such companies. The Fund values securities traded in the over-the-counter market at the last sale price, if available, otherwise at the most recently quoted mean price. When using a quoted price and when the market is considered active, the security will be classified as Level 1 within the fair value hierarchy (see below). In the event that market quotations are not readily available or are considered unreliable due to market or other events, the Fund values its securities and other assets at fair value pursuant to procedures established by and under the direction of the Board of Trustees of the Trust (the “Board”). Under these procedures, the securities will be classified as Level 2 or 3 within the fair value hierarchy, depending on the inputs used. Unavailable or unreliable market quotes may be due to the following factors: a substantial bid-ask spread; infrequent sales resulting in stale prices; insufficient trading volume; small trade sizes; a temporary lapse in any reliable pricing source; and actions of
16
| HVIA EQUITY FUND |
| NOTES TO FINANCIAL STATEMENTS (Continued) |
the securities or futures markets, such as the suspension or limitation of trading. As a result, the prices of securities used to calculate the Fund’s NAV may differ from quoted or published prices for the same securities.
GAAP establishes a single authoritative definition of fair value, sets out a framework for measuring fair value, and requires additional disclosures about fair value measurements.
Various inputs are used in determining the value of the Fund’s investments. These inputs are summarized in the three broad levels listed below:
| ● | Level 1 – quoted prices in active markets for identical securities |
| ● | Level 2 – other significant observable inputs |
| ● | Level 3 – significant unobservable inputs |
The inputs or methods used for valuing securities are not necessarily an indication of the risks associated with investing in those securities. The inputs used to measure fair value may fall into different levels of the fair value hierarchy. In such cases, for disclosure purposes, the level in the fair value hierarchy within which the fair value measurement falls in its entirety is determined based on the lowest level input that is significant to the fair value measurement.
The following is a summary of the Fund’s investments and the level of inputs used to value the investments as of February 28, 2022:
| Level 1 | Level 2 | Level 3 | Total | |||||||||||||
| Common Stocks | $ | 35,681,875 | $ | — | $ | — | $ | 35,681,875 | ||||||||
| Money Market Funds | 2,030,572 | — | — | 2,030,572 | ||||||||||||
| Total | $ | 37,712,447 | $ | — | $ | — | $ | 37,712,447 | ||||||||
Refer to the Fund’s Schedule of Investments for a listing of the common stocks by sector and industry type. The Fund did not have any derivative instruments or any assets or liabilities that were measured at fair value on a recurring basis using significant unobservable inputs (Level 3) as of or during the year ended February 28, 2022.
Foreign currency translation – Securities and other assets and liabilities denominated in or expected to settle in foreign currencies, if any, are translated into U.S. dollars based on exchange rates on the following basis:
| A. | The fair values of investment securities and other assets and liabilities are translated as of the close of the NYSE each day. |
| B. | Purchases and sales of investment securities and income and expenses are translated at the rate of exchange prevailing as of 4:00 p.m. Eastern Time on the respective date of such transactions. |
17
| HVIA EQUITY FUND |
| NOTES TO FINANCIAL STATEMENTS (Continued) |
| C. | The Fund does not isolate that portion of the results of operations caused by changes in foreign exchange rates on investments from those caused by changes in market prices of securities held. Such fluctuations are included with the net realized and unrealized gains or losses on investments. |
Reported net realized foreign exchange gains or losses arise from 1) purchases and sales of foreign currencies, 2) currency gains or losses realized between the trade and settlement dates on securities transactions, and 3) the difference between the amounts of dividends and foreign withholding taxes recorded on the Fund’s books and the U.S. dollar equivalent of the amounts actually received or paid. Reported net unrealized foreign exchange gains and losses arise from changes in the value of assets and liabilities that result from changes in exchange rates.
Cash – The Fund’s cash, if any, is held in a bank account with balances which, at times, may exceed United States federally insured limits set by the Federal Deposit Insurance Corporation. The Fund maintains these balances with a high-quality financial institution and may incur charges on cash overdrafts.
Share valuation – The NAV per share of each class of the Fund is calculated daily by dividing the total value of its assets attributable to that class, less liabilities attributable to that class, by the number of shares outstanding of that class. The offering price and redemption price per share of each class of the Fund is equal to the NAV per share of such class.
Investment income – Dividend income is recorded on the ex-dividend date. Non-cash dividends included in dividend income, if any, are recorded at the fair market value of the security received. Interest income is accrued as earned. Withholding taxes on foreign dividends have been recorded in accordance with the Fund’s understanding of the applicable country’s tax rules and rates.
Investment transactions – Investment transactions are accounted for on the trade date. Realized gains and losses on investments sold are determined on a specific identification basis.
Common expenses – Common expenses of the Trust are allocated among the Fund and the other series of the Trust based on the relative net assets of each series, the number of series in the Trust, or the nature of the services performed and the relative applicability to each series.
18
| HVIA EQUITY FUND |
| NOTES TO FINANCIAL STATEMENTS (Continued) |
Distributions to shareholders – The Fund will distribute to shareholders any net investment income dividends and net realized capital gains distributions at least once each year. The amount of such dividends and distributions are determined in accordance with federal income tax regulations, which may differ from GAAP. Dividends and distributions to shareholders are recorded on the ex-dividend date. The tax character of the Fund’s distributions during the years ended February 28, 2022 and 2021 was as follows:
| Ordinary | Long-Term | Total | ||||||||||
| Years Ended | Income | Capital Gains | Distributions | |||||||||
| February 28, 2022 | $ | 116,306 | $ | 917,412 | $ | 1,033,718 | ||||||
| February 28, 2021 | $ | 4,185 | $ | 139,335 | $ | 143,520 | ||||||
Estimates – The preparation of financial statements in conformity with GAAP requires management to make estimates and assumptions which affect the reported amounts of assets and liabilities and disclosure of contingent assets and liabilities as of the date of the financial statements and the reported amounts of increase (decrease) in net assets from operations during the reporting period. Actual results could differ from those estimates.
Federal income tax – The Fund has qualified and intends to continue to qualify as a regulated investment company under the Internal Revenue Code of 1986, as amended (the “Code”). Qualification generally will relieve the Fund of liability for federal income taxes to the extent 100% of its net investment income and net realized capital gains are distributed in accordance with the Code.
In order to avoid imposition of the excise tax applicable to regulated investment companies, it is also the Fund’s intention to declare as dividends in each calendar year at least 98% of its net investment income (earned during the calendar year) and 98.2% of its net realized capital gains (earned during the 12 months ended October 31) plus undistributed amounts from prior years.
The following information is computed on a tax basis for each item as of February 28, 2022:
| Tax cost of portfolio investments | $ | 22,452,286 | ||
| Gross unrealized appreciation | $ | 15,759,044 | ||
| Gross unrealized depreciation | (498,883 | ) | ||
| Net unrealized appreciation | 15,260,161 | |||
| Net unrealized appreciation on foreign currency translation | 29 | |||
| Undistributed ordinary income | 11,422 | |||
| Undistributed long-term capital gains | 902,285 | |||
| Distributable earnings | $ | 16,173,897 | ||
19
| HVIA EQUITY FUND |
| NOTES TO FINANCIAL STATEMENTS (Continued) |
For the year ended February 28, 2022, the Fund reclassified $1 of distributable earnings against paid-in capital on the Statement of Assets and Liabilities. Such reclassification, the result of permanent differences between the financial statement and income tax reporting requirements, has no effect on the Fund’s net assets or NAV per share.
The Fund recognizes the tax benefits or expenses of uncertain tax positions only when the position is “more likely than not” of being sustained assuming examination by tax authorities. Management has reviewed the Fund’s tax positions for all open tax periods (generally, three years) and has concluded that no provision for unrecognized tax benefits or expenses is required in these financial statements.
The Fund identifies its major tax jurisdiction as U.S. Federal. The Fund recognizes interest and penalties, if any, related to unrecognized tax benefits as income tax on the Statement of Operations. During the year ended February 28, 2022, the Fund did not incur any interest of penalties.
3. Investment Transactions
During the year ended February 28, 2022, cost of purchases and proceeds from sales of investment securities, other than short-term investments, amounted to $5,083,704 and $3,971,429, respectively.
4. Transactions with Related Parties
INVESTMENT ADVISORY AGREEMENT
The Fund’s investments are managed by Hudson Valley Investment Advisors, Inc. (the “Adviser”) pursuant to the terms of an Investment Advisory Agreement. Under the Investment Advisory Agreement, the Fund pays the Adviser an investment advisory fee, computed and accrued daily and paid monthly, at the annual rate of 0.74% of its average daily net assets.
Pursuant to an Expense Limitation Agreement (“ELA”), the Adviser has contractually agreed, until July 1, 2022, to reduce investment advisory fees and reimburse other expenses to the extent necessary to limit total annual operating expenses (exclusive of brokerage costs, taxes, interest, borrowing costs such as interest and dividend expense on securities sold short, costs to organize the Fund, acquired fund fees and expenses, extraordinary expenses such as litigation and merger or reorganization costs and other expenses not incurred in the ordinary course of the Fund’s business) to an amount not exceeding 0.99% of average daily net assets of the Institutional Class shares and 1.24% of the average daily net assets of the Investor class shares. Accordingly, the Adviser reduced its investment advisory fees in the amount of $134,504 during the year ended February 28, 2022.
20
| HVIA EQUITY FUND |
| NOTES TO FINANCIAL STATEMENTS (Continued) |
Under the terms of the ELA, investment advisory fee reductions and expense reimbursements by the Adviser are subject to repayment by the Fund for a period of three years after such fees and expenses were incurred, provided the repayments do not cause total annual operating expenses to exceed: (i) the expense limitation then in effect, if any, and (ii) the expense limitation in effect at the time the expenses to be repaid were incurred. As of February 28, 2022, the Adviser may seek repayment of investment advisory fee reductions and expense reimbursements in the amount of $443,712 no later than the dates listed below:
| February 28, 2023 | $ | 154,552 | ||
| February 29, 2024 | 154,656 | |||
| February 28, 2025 | 134,504 | |||
| Total | $ | 443,712 | ||
OTHER SERVICE PROVIDERS
Ultimus Fund Solutions, LLC (“Ultimus”) provides administration, fund accounting, compliance and transfer agency services to the Fund. The Fund pays Ultimus fees in accordance with the agreements for such services. In addition, the Fund pays out-of-pocket expenses including, but not limited to, postage, supplies, and certain costs related to the pricing of the Fund’s portfolio securities.
Under the terms of a Distribution Agreement with the Trust, Ultimus Fund Distributors, LLC (the “Distributor”) serves as the principal underwriter to the Fund. The Distributor is a wholly-owned subsidiary of Ultimus. The Distributor is currently compensated by the Adviser (not the Fund) for acting as principal underwriter.
Certain officers and a Trustee of the Trust are also officers of Ultimus.
TRUSTEE COMPENSATION
Effective October 20, 2021, each member of the Board (a “Trustee”) who is not an “interested person” (as defined by the 1940 Act, as amended) of the Trust (“Independent Trustee”) receives a $1,300 annual retainer from the Fund, paid quarterly, except for the Board Chairperson who receives a $1,700 annual retainer from the Fund, paid in quarterly installments. Each Independent Trustee also receives from the Fund a fee of $550 for each Board meeting attended plus reimbursement for travel and other meeting-related expenses. Prior to October 20, 2021, each Independent Trustee received a $1,300 annual retainer from the Fund, paid quarterly, except for the Board Chairperson who received a $1,500 annual retainer from the Fund, paid in quarterly installments. Each Independent Trustee also received from the Fund a fee of $500 for each Board meeting attended plus reimbursement for travel and other meeting-related expenses.
21
| HVIA EQUITY FUND |
| NOTES TO FINANCIAL STATEMENTS (Continued) |
PRINCIPAL HOLDER OF FUND SHARES
As of February 28, 2022, the following shareholder owned of record more than 25% of the outstanding shares of the Fund:
| NAME OF RECORD OWNER | % Ownership |
| Pershing, LLC (for the benefit of its customers) | 99.7% |
A beneficial owner of 25% or more of the Fund’s outstanding shares may be considered a controlling person. That shareholder’s vote could have a more significant effect on matters presented at a shareholders’ meeting.
5. Sector Risk
If a Fund has significant investments in the securities of issuers in industries within a particular business sector, any development affecting that sector will have a greater impact on the value of the net assets of the Fund than would be the case if the Fund did not have significant investments in that sector. In addition, this may increase the risk of loss of an investment in the Fund and increase the volatility of the Fund’s NAV per share. From time to time, circumstances may affect a particular sector and the companies within such sector. For instance, economic or market factors, regulation or deregulation, or other developments may negatively impact all companies in a particular sector and therefore the value of a Fund’s portfolio would be adversely affected. As of February 28, 2022, the Fund had 25.7% of the value of its net assets invested in common stocks within the Technology sector.
6. Contingencies and Commitments
The Fund indemnifies the Trust’s officers and Trustees for certain liabilities that might arise from the performance of their duties to the Fund. Additionally, in the normal course of business the Fund enters into contracts that contain a variety of representations and warranties and which provide general indemnifications. The Fund’s maximum exposure under these arrangements is unknown, as this would involve future claims that may be made against the Fund that have not yet occurred. However, based on experience, the Fund expects the risk of loss to be remote.
7. Subsequent Events
The Fund is required to recognize in the financial statements the effects of all subsequent events that provide additional evidence about conditions that existed as of the date of the Statement of Assets and Liabilities. For non-recognized subsequent events that must be disclosed to keep the financial statements from being misleading, the Fund is required to disclose the nature of the event as well as an estimate of its financial effect, or a statement that such an estimate cannot be made. Management has evaluated subsequent events through the issuance of these financial statements and has noted no such events.
22
| HVIA EQUITY FUND |
| REPORT OF INDEPENDENT REGISTERED PUBLIC ACCOUNTING FIRM |
To the Shareholders of HVIA Equity Fund and
Board of Trustees of Ultimus Managers Trust
Opinion on the Financial Statements
We have audited the accompanying statement of assets and liabilities, including the schedule of investments, of HVIA Equity Fund (the “Fund”), a series of Ultimus Managers Trust, as of February 28, 2022, the related statement of operations for the year then ended, the statements of changes in net assets for each of the two years in the period then ended, the related notes, and the financial highlights for each of the five years in the period then ended (collectively referred to as the “financial statements”). In our opinion, the financial statements present fairly, in all material respects, the financial position of the Fund as of February 28, 2022, the results of its operations for the year then ended, the changes in net assets for each of the two years in the period then ended, and the financial highlights for each of the five years in the period then ended, in conformity with accounting principles generally accepted in the United States of America.
Basis for Opinion
These financial statements are the responsibility of the Fund’s management. Our responsibility is to express an opinion on the Fund’s financial statements based on our audits. We are a public accounting firm registered with the Public Company Accounting Oversight Board (United States) (“PCAOB”) and are required to be independent with respect to the Fund in accordance with the U.S. federal securities laws and the applicable rules and regulations of the Securities and Exchange Commission and the PCAOB.
We conducted our audits in accordance with the standards of the PCAOB. Those standards require that we plan and perform the audit to obtain reasonable assurance about whether the financial statements are free of material misstatement whether due to error or fraud.
Our audits included performing procedures to assess the risks of material misstatement of the financial statements, whether due to error or fraud, and performing procedures that respond to those risks. Such procedures included examining, on a test basis, evidence regarding the amounts and disclosures in the financial statements. Our procedures included confirmation of securities owned as of February 28, 2022, by correspondence with the custodian. Our audits also included evaluating the accounting principles used and significant estimates made by management, as well as evaluating the overall presentation of the financial statements. We believe that our audits provide a reasonable basis for our opinion.
We have served as the Fund’s auditor since 2016.
COHEN & COMPANY, LTD.
Cleveland, Ohio
April 27, 2022
23
| HVIA EQUITY FUND |
| ABOUT YOUR FUND’S EXPENSES (Unaudited) |
We believe it is important for you to understand the impact of costs on your investment. As a shareholder of the Fund, you incur ongoing costs, including management fees and other operating expenses. The following examples are intended to help you understand your ongoing costs (in dollars) of investing in the Fund and to compare these costs with the ongoing costs of investing in other mutual funds.
A mutual fund’s ongoing costs are expressed as a percentage of its average net assets. This figure is known as the expense ratio. The expenses in the table below are based on an investment of $1,000 made at the beginning of the most recent period (September 1, 2021) and held until the end of the period (February 28, 2022).
The table below illustrates the Fund’s ongoing costs in two ways:
Actual fund return – This section helps you to estimate the actual expenses that you paid over the period. The “Ending Account Value” shown is derived from the Fund’s actual return, and the fourth column shows the dollar amount of operating expenses that would have been paid by an investor who started with $1,000 in the Fund. You may use the information here, together with the amount you invested, to estimate the expenses that you paid over the period.
To do so, simply divide your account value by $1,000 (for example, an $8,600 account value divided by $1,000 = 8.6), then multiply the result by the number given for the Fund under the heading “Expenses Paid During Period.”
Hypothetical 5% return – This section is intended to help you compare the Fund’s ongoing costs with those of other mutual funds. It assumes that the Fund had an annual return of 5% before expenses during the period shown, but that the expense ratio is unchanged. In this case, because the return used is not the Fund’s actual return, the results do not apply to your investment. The example is useful in making comparisons because the U.S. Securities and Exchange Commission (the “SEC”) requires all mutual funds to calculate expenses based on a 5% return. You can assess the Fund’s ongoing costs by comparing this hypothetical example with the hypothetical examples that appear in shareholder reports of other funds.
Note that expenses shown in the table are meant to highlight and help you compare ongoing costs only. The Fund does not charge transaction fees, such as purchase or redemption fees, nor does it carry a “sales load.” The calculations assume no shares were bought or sold during the period. Your actual costs may have been higher or lower, depending on the amount of your investment and the timing of any purchases or redemptions.
24
| HVIA EQUITY FUND |
| ABOUT YOUR FUND’S EXPENSES (Unaudited) (Continued) |
More information about the Fund’s expenses can be found in this report. For additional information on operating expenses and other shareholder costs, please refer to the Fund’s prospectus.
| Beginning | Ending | |||
| Account Value | Account Value | Expenses | ||
| September 1, | February 28, | Net Expense | Paid During | |
| Institutional Class | 2021 | 2022 | Ratio (a) | Period (b) |
| Based on Actual Fund Return | $ 1,000.00 | $ 950.80 | 0.99% | $ 4.79 |
| Based on Hypothetical 5% Return (before expenses) | $ 1,000.00 | $ 1,019.89 | 0.99% | $ 4.96 |
| (a) | Annualized, based on the Fund’s most recent one-half year expenses. |
| (b) | Expenses are equal to the Fund’s annualized net expense ratio multiplied by the average account value over the period, multiplied by 181/365 (to reflect the one-half year period). |
25
| HVIA EQUITY FUND |
| OTHER INFORMATION (Unaudited) |
A description of the policies and procedures that the Fund uses to vote proxies relating to portfolio securities is available without charge upon request by calling toll- free 1-888-209-8710, or on the SEC’s website at www.sec.gov. Information regarding how the Fund voted proxies relating to portfolio securities during the most recent 12-month period ended June 30 is available without charge upon request by calling toll-free 1-888-209-8710, or on the SEC’s website at www.sec.gov.
The Trust files a complete listing of portfolio holdings for the Fund with the SEC as of the end of the first and third quarters of each fiscal year as an exhibit to its reports on Form N-PORT. These filings are available upon request by calling 1-888-209-8710. Furthermore, you may obtain a copy of the filings on the SEC’s website at www.sec.gov and on the Fund’s website www.hviafunds.com.
| FEDERAL TAX INFORMATION (Unaudited) |
For the fiscal year ended February 28, 2022, the Fund designated $917,412 as long-term capital gain distributions.
Qualified Dividend Income – The Fund designates 100%, or up to the maximum amount of such dividends allowable pursuant to the Internal Revenue code, as qualified dividend income eligible for the reduced tax rate.
Dividends Received Deduction – Corporate shareholders are generally entitled to take the dividends received deduction on the portion of a Fund’s dividend distribution that qualifies under tax law. For the Fund’s fiscal year 2022 ordinary income dividends, 100% qualifies for the corporate dividends received deduction.
26
| HVIA EQUITY FUND |
| BOARD OF TRUSTEES AND EXECUTIVE OFFICERS (Unaudited) |
The Board has overall responsibility for management of the Trust’s affairs. The Trustees serve during the lifetime of the Trust and until its termination, or until death, resignation, retirement, or removal. The Trustees, in turn, elect the officers of the Fund to actively supervise their day-to-day operations. The officers have been elected for an annual term. Each Trustee’s and officer’s address is 225 Pictoria Drive, Suite 450, Cincinnati, Ohio 45246. The following are the Trustees and executive officers of the Fund:
| Name and Year of Birth | Length of Time Served | Position(s) Held with Trust | Principal Occupation(s) During Past 5 Years | Number of Funds in Trust Overseen by Trustee | Directorships of Public Companies Held by Trustee During Past 5 Years |
| Interested Trustees: | |||||
| David R. Carson* Year of Birth: 1958 | Trustee Since 2021 Officer Since February 2012 | Trustee (January 2021 to present) Vice President (January 2021 to present; and previously April 2013 to October 2013) President and Principal Executive Officer of each of its series (October 2013 to January 2021) | Vice President and Director of Client Strategies of Ultimus Fund Solutions, LLC (2013 to present); President of Unified Series Trust (January 2017 to present). | 26 | Interested Trustee of 21 series of the Unified Series Trust (a registered management company) (January 2017 to present). |
| Independent Trustees: | |||||
| Janine L. Cohen Year of Birth: 1952 | Since January 2016 | Chairperson (October 2019 to present) Trustee (January 2016 to present) | Retired since 2013; previously Chief Financial Officer from 2004 to 2013 and Chief Compliance Officer from 2008 to 2013 at AER Advisors, Inc. | 26 | n/a |
27
| HVIA EQUITY FUND |
| BOARD OF TRUSTEES AND EXECUTIVE OFFICERS (Unaudited) (Continued) |
| Name and Year of Birth | Length of Time Served | Position(s) Held with Trust | Principal Occupation(s) During Past 5 Years | Number of Funds in Trust Overseen by Trustee | Directorships of Public Companies Held by Trustee During Past 5 Years |
| Independent Trustees (Continued): | |||||
| David M. Deptula Year of Birth: 1958 | Since June 2012 | Trustee | Vice President of Legal and Special Projects at Dayton Freight Lines, Inc. since February 2016; Vice President of Tax Treasury at The Standard Register, Inc. from November 2011 to 2016. | 26 | n/a |
| Jacqueline A. Williams Year of Birth: 1954 | Since June 2019 | Trustee | Managing Member of Custom Strategy Consulting, LLC (2017 to present); Managing Director of Global Investment Research (2005 to 2017), Cambridge Associates, LLC. | 26 | n/a |
| Clifford N. Schireson Year of Birth: 1953 | Since June 2019 | Trustee | Retired; Founder of Schireson Consulting, LLC (2017 to 2021); Director of Institutional Services for Brandes Investment Partners, LP (2004-2017). | 26 | Trustee of the San Diego City Employees’ Retirement System (August 2019 to present). |
| Robert E. Morrison Year of Birth: 1957 | Since June 2019 | Trustee | Managing Director, Midwest Trust and FCI Advisors (2022 to present); Senior Vice President and National Practice Lead for Investment, Huntington National Bank/ Huntington Private Bank (2014 to 2022); CEO, CIO, President of 5 Star Investment Management Company (2006 to 2014). | 26 | Independent Trustee and Chairman of the Ultimus Managers Trust (2012 to 2014). |
| * | Mr. Carson is considered an “interested person” of the Trust within the meaning of Section 2(a)(19) of the 1940 Act because of his relationship with the Trust’s administrator, transfer agent, and distributor. Mr. Carson was President of the Trust from October 2013 to January 2021 and Vice President of the Trust from April 2013 to October 2013. |
28
| HVIA EQUITY FUND |
| BOARD OF TRUSTEES AND EXECUTIVE OFFICERS (Unaudited) (Continued) |
| Name and Year of Birth | Length of Time Served | Position(s) Held with Trust | Principal Occupation(s) During Past 5 Years |
| Executive Officers: | |||
| Todd E. Heim Year of Birth: 1967 | Since 2014 | President (January 2021 to present) Vice President (2014 to January 2021) | Relationship Management Director and Vice President of Ultimus Fund Solutions, LLC (2018 to present); Client Implementation Manager and Assistant Vice President of Ultimus Fund Solutions, LLC (2014 to 2018); Naval Flight Officer of United States Navy (May 1989 to June 2017). |
| Jennifer L. Leamer Year of Birth: 1976 | Since 2014 | Treasurer (2014 to present) Assistant Treasurer (April 2014 to October 2014) | Senior Vice President, Fund Accounting of Ultimus Fund Solutions, LLC (2014 to present). |
| Daniel D. Bauer Year of Birth: 1977 | Since 2016 | Assistant Treasurer (April 2016 to present) | Assistant Vice President, Fund Accounting (September 2015 to present); Fund Accounting Manager (March 2012 to August 2015) of Ultimus Fund Solutions, LLC. |
| Angela A. Simmons Year of Birth: 1975 | Since 2022 | Assistant Treasurer (January 2022 to present) | Vice President, Financial Administration (2022 to present) and Assistant Vice President, Financial Administration (2015 to 2022) of Ultimus Fund Solutions, LLC. |
| Khimmara Greer Year of Birth: 1983 | Since 2021 | Secretary (October 2021 to present) | Vice President and Senior Legal Counsel of Ultimus Fund Solutions, LLC (2021 to present); Vice President, Asset Servicing – Regulatory Administration of The Bank of New York Mellon (2019 to 2021); Vice President and Counsel of State Street Bank and Trust Company (2015 to 2019); and Regulatory Advisor – Fund Regulatory Services of JPMorgan Chase Bank (2014 to 2015). |
| David K. James Year of Birth: 1970 | Since 2021 | Assistant Secretary (October 2021 to present) Secretary (July 2021 to October 2021) | Executive Vice President and Chief Legal and Risk Officer of Ultimus Fund Solutions, LLC (2018 to present); Managing Director and Managing Counsel of State Street Bank and Trust Company (2009 to 2018). |
| Natalie S. Anderson Year of Birth: 1975 | Since 2016 | Assistant Secretary (April 2016 to present) | Legal Administration Manager (July 2016 to present) and Paralegal (January 2015 to June 2016) of Ultimus Fund Solutions, LLC. |
29
| HVIA EQUITY FUND |
| BOARD OF TRUSTEES AND EXECUTIVE OFFICERS (Unaudited) (Continued) |
| Name and Year of Birth | Length of Time Served | Position(s) Held with Trust | Principal Occupation(s) During Past 5 Years |
| Executive Officers (Continued): | |||
| Gweneth Gosselink Year of Birth: 1955 | Since 2020 | Chief Compliance Officer (January 2020 to present) | Assistant Vice President, Compliance Officer of Ultimus Fund Solutions, LLC (December 2019 to present); CCO Consultant at GKG Consulting, LLC (December 2019 to present); Chief Operating Officer & CCO at Miles Capital, Inc. (June 2013 to December 2019). |
| Martin Dean Year of Birth: 1963 | Since 2019 | Assistant Chief Compliance Officer (January 2020 to present) Interim Chief Compliance Officer (October 2019 to January 2020) Assistant Chief Compliance Officer (January 2016 to 2017) | Senior Vice President, Head of Fund Compliance of Ultimus Fund Solutions, LLC (January 2016 to present). |
Additional information about members of the Board and executive officers is available in the Fund’s Statement of Additional Information (“SAI”). To obtain a free copy of the SAI, please call toll free 1-888-209-8710.
30
| HVIA EQUITY FUND |
| LIQUIDITY RISK MANAGEMENT PROGRAM (Unaudited) |
The Fund has adopted and implemented a written liquidity risk management program (the “Program”) as required by Rule 22e-4 (the “Liquidity Rule”) under the Investment Company Act of 1940, as amended. The Program is reasonably designed to assess and manage the Fund’s liquidity risk, taking into consideration, among other factors, the Fund’s investment strategy and the liquidity of its portfolio investments during normal and reasonably foreseeable stressed conditions; its short- and long-term cash flow projections; and its cash holdings and access to other funding sources. The Fund’s Board of Trustees (the “Board”) approved the appointment of the Liquidity Administrator Committee, comprising of the Fund’s Adviser and certain Trust officers, to be responsible for the Program’s administration and oversight and for reporting to the Board on at least an annual basis regarding the Program’s operation and effectiveness. The annual written report assessing the Program (the “Report”) was presented to the Board at the October 18 - 19, 2021 Board meeting and covered the period from June 1, 2020 to May 31, 2021 (the “Review Period”).
During the Review Period, the Fund did not experience unusual stress or disruption to its operations related to purchase and redemption activity. Also, during the Review Period, the Fund held adequate levels of cash and highly liquid investments to meet shareholder redemption activities in accordance with applicable requirements. The Report concluded that the Program is reasonably designed to prevent violation of the Liquidity Rule and the Program has been effectively implemented.
31
This page intentionally left blank.
This page intentionally left blank.
HVIA-AR-22

ANNUAL REPORT
February 28, 2022
| LEFT BRAIN COMPOUND GROWTH FUND | |
| LETTER TO SHAREHOLDERS (Unaudited) | February 2022 |
Investment Performance:
The Left Brain Compound Growth Fund (LBCGX) launched on April 27, 2021, with a NAV per share of $25.00 and ended the fiscal period on February 28, 2022 with a NAV per share of $21.38. LBCGX produced a return of (14.48%). During the period (April 27, 2021-Feb 28, 2022) the S&P 500 Index returned 5.73%.
Market & Economic Conditions:
During the period of fund operation from launch until February 28, 2022, markets were volatile. Although the S&P 500 produced positive returns, there was plenty of turmoil beneath the surface. The markets experienced a sell-off in many sectors, including those companies that benefited from the work from home trends that were present during the COVID-19 related lockdowns. Growth stocks were hit especially hard. There was a rotation from companies that benefited from the COVID-19 lockdowns to companies that suffered from them the most. Retail stocks, travel, homebuilders, energy stocks, financial services, and consumer discretionary were big winners.
The Fund was off to a good start and experienced attractive appreciation until mid-November. Starting then, markets started to treat growth stocks more harshly. Several of the Fund’s holdings sold off violently in response to weaker earnings, higher interest rates, and rotation to other sectors. Markets have been especially unforgiving toward high growth stocks that have negative profits.
Economic conditions have certainly become more uncertain for a variety of reasons: rising rates, inflation, conflict in Eastern Europe, among other concerns. It appears from our vantage point that investors are pricing in peak growth, peak earnings, and peak margins. These factors have created a more volatile backdrop for investors, especially growth securities.
Outlook for Market:
It certainly looks like the bull market has taken a pause. The markets are facing their toughest test since the COVID-19 pandemic brought the markets to a virtual halt in March of 2020. The Russia-Ukraine conflict is just one headwind. The surge in oil prices is another factor that threatens to affect consumer sentiment. The biggest obstacle for the markets to overcome may be The Federal Reserve, (the “Fed”) and their quest to raise interest rates to tame inflation. How aggressive the Fed is, with respect to rate increases, will impact all securities in the coming months. Low interest rates have previously provided a tailwind to all assets. With rates on the rise, we could see the interest rate environment turn into a headwind for both stocks and bonds.
Corporate earnings season is drawing to a close. As we assess the general tenor of earnings season, our view is that Q4 2021 earnings were solid, but certainly not spectacular. Fortunately, corporations have mostly done an admirable job trimming debts and managing their balance sheets. Corporations are in good financial shape, generally.
1
That puts many public companies in a good position to institute buybacks and dividend increases, which could be supportive of share prices in the near to medium-term. Another possibility is an increase in mergers and acquisitions (M&A), as share prices become more affordable for many companies. Falling share prices create compelling opportunities for potential acquirers, especially with corporate balance sheets are underleveraged, in many cases.
Before the most recent increase in volatility and possibly due to the Russia-Ukraine conflict, we have noticed that small companies and emerging markets were starting to exhibit leadership in the markets. This is a good sign. However, at this time, many of the traditional “risk-on” measures that we follow are flashing red on market data terminals (examples biotech, crypto assets, software, etc.)
Impact to Portfolio of Future Market Conditions:
To the extent the markets continue to exhibit risk-off characteristics, this will have a detrimental impact on risky assets. The Fund has historically owned growth stocks and high yield bonds. Both perform best during times of economic expansion, low volatility, and positive investor sentiment. These types of investments tend to struggle in economic conditions like we are facing today (high inflation, rising rates, economic contraction, decaying investor sentiment). With that in mind, the Fund currently holds a relatively high cash balance. Should the market stress continue, we expect to be opportunistic in purchasing stocks at lower valuations.
What would really excite us would be if the High Yield bond markets were to become mispriced due to a liquidity event. In times of market stress liquidity becomes scarce. The High Yield bond markets tend to feel the most profound impact in moments when liquidity evaporates in financial markets. In the past, there have been times (example: March 2020) when buyers could purchase high yield bonds at steep discounts. This happens when potential buyers disappear in times of market strife and prices temporarily disconnect from the fundamentals. We have a database of these type of bonds that we follow, track, and evaluate constantly.
Though this volatility has caused the High Yield bonds in LBCGX to decline during the period, additional future volatility could possibly provide attractively priced bonds for us to purchase at a discount to “fair value”. There are also many high-quality growth stocks that we follow that have depreciated more than 50% in the past year alone. Some have fallen more than 75% from their recent highs. We could target some of these companies to add to LBCGX and as their prices recover, we have the chance to see a nice bounce back in the portfolio. We stand ready to take advantage of opportunities when we think the time is right.
Changes to Strategy and Techniques:
We have always favored companies with accelerating fundamentals. These businesses exhibit rising sales, increasing earnings. and improving financial conditions. We look for these characteristics in any investment, regardless of the sector in which the investment lies. Over the last couple of quarters, we have noticed that the sectors showing these characteristics have changed dramatically and almost instantly. Our data now points us to Energy (specifically pipelines) and Materials as the areas with the greatest opportunity for price appreciation. What is interesting to us is that not only are business conditions improving, but the valuations of these businesses, in many cases, are below where they were years ago when fundamental conditions were deteriorating. Conversely, we think the growth and technology sectors could be challenged until the interest rate and growth outlook improves. Given this outlook, we have changed the areas of emphasis in the LBCGX portfolio. We
2
have also widened our lens in reviewing securities for purchase in accordance with the Fund’s principal investment strategies as outlined in the prospectus. There are several securities that fall into the mid cap category that we think could be attractive for inclusion the portfolio. We also think with interest rates rising and risk premiums increasing that we should be able to add investment grade bonds, or fallen angels given their recent price weakness.
Portfolio Performance:
The following securities were the top 3 performers in the portfolio during the year:
| (1) | Western Midstream (WES) |
| (2) | PBF Energy (PBF) 7.25% 2025 bonds |
| (3) | ExxonMobil (XOM) |
The following securities were the 3 worst performers in the portfolio during the year:
| (1) | DocuSign (DOCU) |
| (2) | HubSpot (HUBS) |
| (3) | Meta Networks (FB) |
We thank you for the opportunity to invest your money and for your confidence in our process and discipline. You are a valued partner of LBCGX and we greatly appreciate the relationship. We hope that your family remains safe and healthy during this challenging time. We look forward to serving as your mutual fund’s manager in the coming year.
Sincerely,
| Noland Langford | Brian Dress |
| CEO/Portfolio Manager | Assistant Portfolio Manager |
3
LEFT BRAIN COMPOUND GROWTH FUND
PERFORMANCE INFORMATION
February 28, 2022 (Unaudited)
Comparison of the Change in Value of a $10,000 Investment in
Left Brain Compound Growth Fund (since inception on 04/27/2021) versus the S&P 500® Index
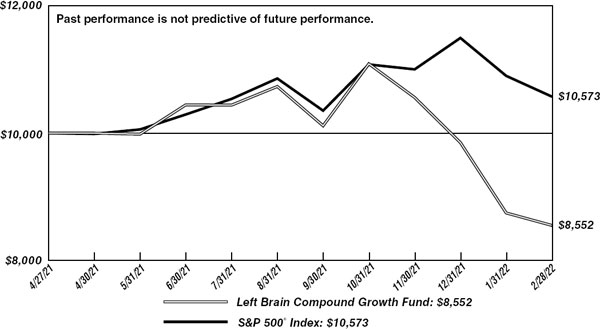
Total Returns (for the period ended February 28, 2022) | ||
| Since | ||
| Inception | ||
| (04/27/2021) | ||
| Left Brain Compound Growth Fund (a) | (14.48%) | |
| S&P 500® Index (b) | 5.73% | |
| (a) | The Fund’s total returns do not reflect the deduction of taxes a shareholder would pay on Fund distributions or the redemption of Fund shares. |
| (b) | The S&P 500® index is a market capitalization weighted index of 500 large companies that is widely used as a barometer of U.S. stock market performance. The index is unmanaged and shown for illustration purposes only. An investor cannot invest in an index and its returns are not indicative of the performance of any specific investment. |
4
LEFT BRAIN COMPOUND GROWTH FUND
PORTFOLIO INFORMATION
February 28, 2022 (Unaudited)
| Bond Portfolio (25.6% of Net Assets) | |
| % of Bond | |
| Sector Breakdown | Portfolio |
| Consumer Discretionary | 17.6% |
| Energy | 16.2% |
| Industrials | 15.4% |
| Financials | 12.9% |
| Real Estate | 11.5% |
| Communications | 6.2% |
| Materials | 6.1% |
| Health Care | 4.4% |
| Technology | 4.3% |
| International | 2.8% |
| Consumer Staples | 2.6% |
| % of | |
| Ten Largest Equity Holdings | Net Assets |
| Alphabet, Inc. - Class A | 3.6% |
| Charles Schwab Corporation (The) | 3.4% |
| Exxon Mobil Corporation | 3.2% |
| Palo Alto Networks, Inc. | 3.1% |
| Western Midstream Partners, L.P. | 2.9% |
| EOG Resources, Inc. | 2.8% |
| QUALCOMM, Inc. | 2.8% |
| Interactive Brokers Group, Inc. - Class A | 2.7% |
| Advance Mirco Devices, Inc. | 2.3% |
| Axon Enterprise, Inc. | 2.3% |
Equity Sector Concentration vs. the S&P 500 Index (48.4% of Net Assets)
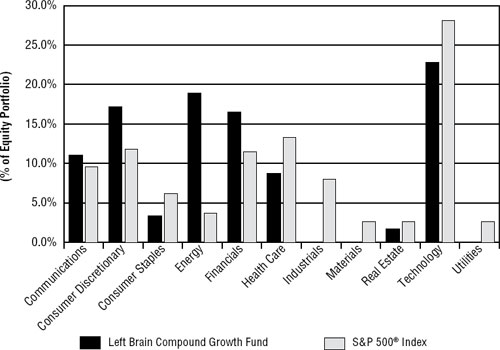
5
LEFT BRAIN COMPOUND GROWTH FUND
SCHEDULE OF INVESTMENTS
February 28, 2022
| CORPORATE BONDS — 24.9% | Coupon | Maturity | Par Value | Value | ||||||||
| Communications — 1.6% | 7.995% | 06/01/36 | $ | 100,000 | $ | 98,750 | ||||||
| Embarq Corporation | �� | |||||||||||
| Liberty Media Corporation | 8.500% | 07/15/29 | 100,000 | 98,000 | ||||||||
| 196,750 | ||||||||||||
| Consumer Discretionary — 4.4% | ||||||||||||
| AMC Entertainment Holdings, Inc., 144A (a) | 10.000% | 06/15/26 | 150,000 | 138,750 | ||||||||
| Bath & Body Works, Inc. | 6.950% | 03/01/33 | 100,000 | 105,750 | ||||||||
| Bed Bath & Beyond, Inc. | 4.915% | 08/01/34 | 150,000 | 122,249 | ||||||||
| Party City Holdings, Inc., 144A | 8.750% | 02/15/26 | 100,000 | 100,060 | ||||||||
| Royal Caribbean Cruises Ltd. | 3.700% | 03/15/28 | 100,000 | 90,654 | ||||||||
| 557,463 | ||||||||||||
| Consumer Staples — 0.7% | ||||||||||||
| Rite Aid Corporation | 7.700% | 02/15/27 | 100,000 | 83,523 | ||||||||
| Energy — 4.2% | ||||||||||||
| Callon Petroleum Company | 8.250% | 07/15/25 | 100,000 | 98,500 | ||||||||
| EnLink Midstream Partners, L.P. | 5.600% | 04/01/44 | 10,000 | 8,525 | ||||||||
| Genesis Energy, L.P. | 6.250% | 05/15/26 | 100,000 | 96,000 | ||||||||
| PBF Holdings Company, LLC | 7.250% | 06/15/25 | 250,000 | 210,000 | ||||||||
| PBF Logistics, L.P. | 6.875% | 05/15/23 | 100,000 | 99,500 | ||||||||
| 512,525 | ||||||||||||
| Financials — 3.3% | ||||||||||||
| Genworth Holdings, Inc. | 6.500% | 06/15/34 | 100,000 | 99,212 | ||||||||
| Navient Corporation | 5.625% | 08/01/33 | 250,000 | 217,557 | ||||||||
| Teva Pharmaceuticals | 3.150% | 10/01/26 | 100,000 | 90,747 | ||||||||
| 407,516 | ||||||||||||
| Health Care — 1.1% | ||||||||||||
| Community Health Systems, 144A | 6.875% | 04/01/28 | 150,000 | 138,563 | ||||||||
| Industrials — 3.9% | ||||||||||||
| American Airlines Group, Inc. | 3.750% | 03/01/25 | 100,000 | 93,139 | ||||||||
| American Airlines Group, Inc., 144A | 3.750% | 03/01/25 | 150,000 | 139,707 | ||||||||
| Gol Finance, Inc. (b) | 8.750% | 12/31/49 | 150,000 | 119,033 | ||||||||
| PennyMac Financial Services, Inc., 144A | 4.250% | 02/15/29 | 150,000 | 134,250 | ||||||||
| 486,129 | ||||||||||||
6
LEFT BRAIN COMPOUND GROWTH FUND
SCHEDULE OF INVESTMENTS (Continued)
| CORPORATE BONDS — 24.9% | ||||||||||||
| (Continued) | Coupon | Maturity | Par Value | Value | ||||||||
| Materials — 1.6% | ||||||||||||
| Cleveland-Cliffs, Inc. | 6.250% | 10/01/40 | $ | 35,000 | $ | 35,375 | ||||||
| Office Depot, Inc. | 5.000% | 03/01/30 | 70,000 | 58,800 | ||||||||
| United States Steel Corporation | 6.650% | 06/01/37 | 100,000 | 99,918 | ||||||||
| 194,093 | ||||||||||||
| Real Estate — 3.0% | ||||||||||||
| CoreCivic, Inc. | 4.750% | 10/15/27 | 100,000 | 88,500 | ||||||||
| GEO Group, Inc. (The) | 5.875% | 10/15/24 | 100,000 | 88,000 | ||||||||
| New Residential Investment Corporation, 144A | 6.250% | 10/15/25 | 100,000 | 97,847 | ||||||||
| WeWork Companies, Inc., 144A | 7.875% | 05/01/25 | 100,000 | 90,500 | ||||||||
| 364,847 | ||||||||||||
| Technology — 1.1% | ||||||||||||
| MPH Acquisition Holdings, LLC, 144A | 5.750% | 11/01/28 | 150,000 | 135,375 | ||||||||
| Total Corporate Bonds (Cost $3,274,351) | $ | 3,076,784 | ||||||||||
| INTERNATIONAL BONDS — 0.7% | Coupon | Maturity | Par Value | Value | ||||||||
| Republic of Turkey (Cost $102,447) | 6.875% | 03/17/36 | $ | 100,000 | $ | 87,280 | ||||||
| COMMON STOCKS — 48.2% | Shares | Value | ||||||||||
| Communications — 5.3% | ||||||||||||
| Advertising & Marketing — 1.7% | ||||||||||||
| Trade Desk, Inc. (The) - Class A (c) | 2,500 | $ | 213,300 | |||||||||
| Internet Media & Services — 3.6% | ||||||||||||
| Alphabet, Inc. - Class A (c) | 165 | 445,688 | ||||||||||
| Consumer Discretionary — 8.2% | ||||||||||||
| Consumer Services — 1.0% | ||||||||||||
| Chegg, Inc. (c) | 4,000 | 125,080 | ||||||||||
| E-Commerce Discretionary — 1.9% | ||||||||||||
| Amazon.com, Inc. (c) | 75 | 230,345 | ||||||||||
7
LEFT BRAIN COMPOUND GROWTH FUND
SCHEDULE OF INVESTMENTS (Continued)
| COMMON STOCKS — 48.2% (Continued) | Shares | Value | ||||||
| Consumer Discretionary — 8.2% (Continued) | ||||||||
| Leisure Products — 2.3% | ||||||||
| Axon Enterprise, Inc. (c) | 2,000 | $ | 280,500 | |||||
| Retail - Discretionary — 3.0% | ||||||||
| Bath & Body Works, Inc. | 3,500 | 186,795 | ||||||
| O’Reilly Automotive, Inc. (c) | 300 | 194,772 | ||||||
| 381,567 | ||||||||
| Consumer Staples — 1.6% | ||||||||
| Retail - Consumer Staples — 1.6% | ||||||||
| Dollar General Corporation | 1,000 | 198,340 | ||||||
| Energy — 9.0% | ||||||||
| Oil & Gas Producers — 9.0% | ||||||||
| EOG Resources, Inc. | 3,000 | 344,760 | ||||||
| Exxon Mobil Corporation | 5,000 | 392,100 | ||||||
| Western Midstream Partners, L.P. | 14,000 | 364,560 | ||||||
| 1,101,420 | ||||||||
| Financials — 8.0% | ||||||||
| Asset Management — 3.4% | ||||||||
| Charles Schwab Corporation (The) | 5,000 | 422,300 | ||||||
| Institutional Financial Services — 4.6% | ||||||||
| Interactive Brokers Group, Inc. - Class A | 5,000 | 330,900 | ||||||
| Intercontinental Exchange, Inc. | 1,800 | 230,616 | ||||||
| 561,516 | ||||||||
| Health Care — 4.2% | ||||||||
| Health Care Facilities & Services — 4.2% | ||||||||
| AmerisourceBergen Corporation | 1,900 | 270,807 | ||||||
| CVS Health Corporation | 2,400 | 248,760 | ||||||
| 519,567 | ||||||||
| Real Estate — 0.8% | ||||||||
| REITs — 0.8% | ||||||||
| Simon Property Group, Inc. | 750 | 103,170 | ||||||
| Technology — 11.1% | ||||||||
| Semiconductors — 5.2% | ||||||||
| Advanced Micro Devices, Inc. (c) | 2,318 | 285,902 | ||||||
| QUALCOMM, Inc. | 2,000 | 343,979 | ||||||
| 629,881 | ||||||||
| Software — 3.1% | ||||||||
| Palo Alto Networks, Inc. (c) | 650 | 386,263 | ||||||
| Technology Hardware — 1.2% | ||||||||
| Arista Networks, Inc. (c) | 1,200 | 147,276 | ||||||
8
LEFT BRAIN COMPOUND GROWTH FUND
SCHEDULE OF INVESTMENTS (Continued)
| COMMON STOCKS — 48.2% (Continued) | Shares | Value | ||||||
| Technology — 11.1% (Continued) | ||||||||
| Technology Services — 1.6% | ||||||||
| Morningstar, Inc. | 700 | $ | 196,455 | |||||
| Total Common Stocks (Cost $6,001,709) | $ | 5,942,668 | ||||||
| PREFERRED STOCKS — 0.2% | Shares | Value | ||||||
| Energy — 0.2% | ||||||||
| Oil & Gas Producers — 0.2% | ||||||||
| DCP Midstream, L.P., Series C, 7.95% (Cost $24,978) | 1,000 | $ | 24,110 | |||||
| MONEY MARKET FUNDS — 29.0% | Shares | Value | ||||||
| Federated Hermes Government Obligations Fund - Institutional Class, 0.03% (d) (Cost $3,575,419) | 3,575,419 | $ | 3,575,419 | |||||
| Investments at Value — 103.0% (Cost $12,978,904) | $ | 12,706,261 | ||||||
| Liabilities in Excess of Other Assets — (3.0%) | (371,898 | ) | ||||||
| Net Assets — 100.0% | $ | 12,334,363 | ||||||
| (a) | Payment-in-kind-bond. The rate shown is the coupon rate of 10.000% and has a payment-in-kind rate of 2.000%. |
| (b) | Security has a perpetual maturity date. |
| (c) | Non-income producing security. |
| (d) | The rate shown is the 7-day effective yield as of February 28, 2022. |
144A - Security was purchased in a transaction exempt from registration in compliance with Rule 144A of the Securities Act of 1933. This security may be resold in transactions exempt from registration, normally to qualified institutional buyers. The total value of such securities is $975,052 as of February 28, 2022, representing 7.9% of net assets.
See accompanying notes to financial statements.
9
LEFT BRAIN COMPOUND GROWTH FUND
STATEMENT OF ASSETS AND LIABILITIES
February 28, 2022
| ASSETS | ||||
| Investments in securities: | ||||
| At cost | $ | 12,978,904 | ||
| At value (Note 2) | $ | 12,706,261 | ||
| Receivable for capital shares sold | 100 | |||
| Dividends and interest receivable | 62,396 | |||
| Deferred offering cost (Note 2) | 2,440 | |||
| Other assets | 9,132 | |||
| Total assets | 12,780,329 | |||
| LIABILITIES | ||||
| Payable for investment securities purchased | 419,632 | |||
| Payable to Adviser (Note 4) | 11,774 | |||
| Payable to administrator (Note 4) | 5,256 | |||
| Other accrued expenses | 9,304 | |||
| Total liabilities | 445,966 | |||
| NET ASSETS | $ | 12,334,363 | ||
| NET ASSETS CONSIST OF: | ||||
| Paid-in capital | $ | 14,822,165 | ||
| Accumulated deficit | (2,487,802 | ) | ||
| NET ASSETS | $ | 12,334,363 | ||
| Shares of beneficial interest outstanding (unlimited number of shares authorized, no par value) | 576,864 | |||
| Net asset value, offering price and redemption price per share (Note 2) | $ | 21.38 | ||
See accompanying notes to financial statements.
10
LEFT BRAIN COMPOUND GROWTH FUND
STATEMENT OF OPERATIONS
For the Period Ended February 28, 2022(a)
| INVESTMENT INCOME | ||||
| Dividends | $ | 37,512 | ||
| Interest | 116,177 | |||
| Total investment income | 153,689 | |||
| EXPENSES | ||||
| Management fees (Note 4) | 202,667 | |||
| Administration fees (Note 4) | 30,400 | |||
| Legal fees | 20,483 | |||
| Registration and filing fees | 20,167 | |||
| Trustees’ fees and expenses (Note 4) | 15,728 | |||
| Transfer agent fees (Note 4) | 12,736 | |||
| Compliance fees (Note 4) | 10,133 | |||
| Offering costs (Note 2) | 9,760 | |||
| Custodian and bank service fees | 6,054 | |||
| Postage and supplies | 4,271 | |||
| Printing of shareholder reports | 3,411 | |||
| Insurance expense | 2,305 | |||
| Other expenses | 11,662 | |||
| Total expenses | 349,777 | |||
| Less fee reductions and expense reimbursements by the Adviser (Note 4) | (137,350 | ) | ||
| Net expenses | 212,427 | |||
| NET INVESTMENT LOSS | (58,738 | ) | ||
| REALIZED AND UNREALIZED LOSSES ON INVESTMENTS | ||||
| Net realized losses on investment transactions | (2,235,345 | ) | ||
| Net change in unrealized appreciation (depreciation) on investments | (272,643 | ) | ||
| NET REALIZED AND UNREALIZED LOSSES ON INVESTMENTS | (2,507,988 | ) | ||
| NET DECREASE IN NET ASSETS RESULTING FROM OPERATIONS | $ | (2,566,726 | ) | |
| (a) | Represents the period from the commencement of operations (April 27, 2021) through February 28, 2022. |
See accompanying notes to financial statements.
11
LEFT BRAIN COMPOUND GROWTH FUND
STATEMENT OF CHANGES IN NET ASSETS
| Period | ||||
| Ended | ||||
| February 28, | ||||
| 2022(a) | ||||
| FROM OPERATIONS | ||||
| Net investment loss | $ | (58,738 | ) | |
| Net realized losses from investment transactions | (2,235,345 | ) | ||
| Net change in unrealized appreciation (depreciation) on investments | (272,643 | ) | ||
| Net decrease in net assets resulting from operations | (2,566,726 | ) | ||
| FROM CAPITAL SHARE TRANSACTIONS | ||||
| Proceeds from shares sold | 15,677,208 | |||
| Payments for shares redeemed | (776,119 | ) | ||
| Net increase in net assets from capital share transactions | 14,901,089 | |||
| TOTAL INCREASE IN NET ASSETS | 12,334,363 | |||
| NET ASSETS | ||||
| Beginning of period | — | |||
| End of period | $ | 12,334,363 | ||
| CAPITAL SHARES ACTIVITY | ||||
| Shares sold | 608,798 | |||
| Shares redeemed | (31,934 | ) | ||
| Net increase in shares outstanding | 576,864 | |||
| Shares outstanding, beginning of period | — | |||
| Shares outstanding, end of period | 576,864 | |||
| (a) | Represents the period from the commencement of operations (April 27, 2021) through February 28, 2022. |
See accompanying notes to financial statements.
12
LEFT BRAIN COMPOUND GROWTH FUND
FINANCIAL HIGHLIGHTS
Per Share Data for a Share Outstanding Throughout the Period
| Period | ||||
| Ended | ||||
| February 28, | ||||
| 2022(a) | ||||
| Net asset value at beginning of period | $ | 25.00 | ||
| Loss from investment operations: | ||||
| Net investment loss | (0.10 | ) | ||
| Net realized and unrealized losses on investments | (3.52 | ) | ||
| Total from investment operations | (3.62 | ) | ||
| Net asset value at end of period | $ | 21.38 | ||
| Total return (b) | (14.48 | %) (c) | ||
| Net assets at end of period (000’s) | $ | 12,334 | ||
| Ratios/supplementary data: | ||||
| Ratio of total expenses to average net assets | 3.45 | % (d) | ||
| Ratio of net expenses to average net assets (e) | 2.10 | % (d)(f) | ||
| Ratio of net investment loss to average net assets (e) | (0.58 | %) (d) | ||
| Portfolio turnover rate | 166 | % (c) | ||
| (a) | Represents the period from the commencement of operations (April 27 , 2021) through February 28, 2022. |
| (b) | Total return is a measure of the change in value of an investment in the Fund over the period covered. The return shown does not reflect the deduction of taxes a shareholder would pay on Fund distributions, if any, or the redemption of Fund shares. The total return would be lower if the Adviser had not reduced fees and reimbursed expenses (Note 4). |
| (c) | Not annualized. |
| (d) | Annualized. |
| (e) | Ratio was determined after management fee reductions and expense reimbursements (Note 4). |
| (f) | Includes cost to organize the Fund of 0.10% which are excluded from the Expense Limitation Agreement (Note 4). |
See accompanying notes to financial statements.
13
LEFT BRAIN COMPOUND GROWTH FUND
NOTES TO FINANCIAL STATEMENTS
February 28, 2022
1. Organization
Left Brain Compound Growth Fund (the “Fund”) is a non-diversified series of Ultimus Managers Trust (the “Trust”). The Trust is an open-end management investment company established as an Ohio business trust under a Declaration of Trust dated February 28, 2012. Other series of the Trust are not incorporated in this report. The Fund commenced operations on April 27, 2021.
The investment objective of the Fund is to seek to achieve long-term capital appreciation.
2. Significant Accounting Policies
The Fund follows accounting and reporting guidance under Financial Accounting Standards Board Accounting Standards Codification Topic 946, “Financial Services – Investment Companies.” The following is a summary of the Fund’s significant accounting policies used in the preparation of its financial statements. These policies are in conformity with accounting principles generally accepted in the United States of America (“GAAP”).
Securities valuation – The Fund values its portfolio securities at fair value as of the close of regular trading on the New York Stock Exchange (the “NYSE”) (normally 4:00 p.m. Eastern time) on each business day the NYSE is open for business. The Fund values its listed securities on the basis of the security’s last sale price on the security’s primary exchange, if available, otherwise at the exchange’s most recently quoted mean price. NASDAQ-listed securities are valued at the NASDAQ Official Closing Price. Investments representing shares of other registered open-end investment companies that are not listed on an exchange, including money market funds, are valued at their net asset value (“NAV”) as reported by such companies. When using a quoted price and when the market is considered active, the security will be classified as Level 1 within the fair value hierarchy (see below). The Fund’s fixed income securities are generally valued using prices provided by an independent pricing service approved by the Board of Trustees of the Trust (the “Board”). The independent pricing service uses information with respect to transactions in bonds, quotations from bond dealers, market transactions in comparable securities, and various relationships between securities in determining these prices. In the event that market quotations are not readily available or are considered unreliable due to market or other events, the Fund values its securities and other assets at fair value in accordance with procedures established by and under the general supervision of the Board. Under these procedures, the securities will be classified as Level 2 or 3 within the fair value hierarchy, depending on the inputs used. Unavailable or unreliable market quotes may be due to the following factors: a substantial bid-ask spread; infrequent sales resulting in stale prices; insufficient trading volume; small trade sizes; a temporary lapse in any reliable pricing source; and actions of the securities or futures markets, such as the suspension or limitation of trading. As a result, the prices of securities used to calculate the Fund’s NAV may differ from quoted or published prices for the same securities.
GAAP establishes a single authoritative definition of fair value, sets out a framework for measuring fair value, and requires additional disclosures about fair value measurements.
14
LEFT BRAIN COMPOUND GROWTH FUND
NOTES TO FINANCIAL STATEMENTS (Continued)
Various inputs are used in determining the value of the Fund’s investments. These inputs are summarized in the three broad levels listed below:
| • | Level 1 – quoted prices in active markets for identical securities |
| • | Level 2 – other significant observable inputs |
| • | Level 3 – significant unobservable inputs |
Fixed income securities held by the Fund are classified as Level 2 since values are based on prices provided by an independent pricing service that utilizes various “other significant observable inputs” including bid and ask quotations, prices of similar securities, and interest rates, among other factors.
The inputs or methods used for valuing securities are not necessarily an indication of the risks associated with investing in those securities. The inputs used to measure fair value may fall into different levels of the fair value hierarchy. In such cases, for disclosure purposes, the level in the fair value hierarchy within which the fair value measurement falls in its entirety is determined based on the lowest level input that is significant to the fair value measurement.
The following is a summary of the Fund’s investments based on the inputs used to value the investments as of February 28, 2022, by security type:
| Level 1 | Level 2 | Level 3 | Total | |||||||||||||
| Corporate Bonds | $ | — | $ | 3,076,784 | $ | — | $ | 3,076,784 | ||||||||
| International Bonds | — | 87,280 | — | 87,280 | ||||||||||||
| Common Stocks | 5,942,668 | — | — | 5,942,668 | ||||||||||||
| Preferred Stocks | 24,110 | — | — | 24,110 | ||||||||||||
| Money Market Funds | 3,575,419 | — | — | 3,575,419 | ||||||||||||
| Total | $ | 9,542,197 | $ | 3,164,064 | $ | — | $ | 12,706,261 | ||||||||
Refer to the Fund’s Schedule of Investments for a listing of the corporate bonds, common stocks and preferred stocks by sector and/or industry type. The Fund did not hold any derivative instruments or any assets or liabilities that were measured at fair value on a recurring basis using significant unobservable inputs (Level 3) as of or during the period ended February 28, 2022.
Share valuation – The NAV per share of the Fund is calculated daily by dividing the total value of the Fund’s assets, less liabilities, by the number of shares outstanding. The offering price and redemption price per share of the Fund is equal to the NAV per share.
Investment income – Dividend income is recorded on the ex-dividend date. Non-cash dividends included in dividend income, if any, are recorded at the fair market value of the security received. Interest income is accrued as earned. Withholding taxes on foreign dividends, if any, have been recorded in accordance with the Fund’s understanding of the applicable country’s tax rules and rates. Interest income is accrued as earned. Discounts and premiums on fixed income securities purchased are accreted or amortized using the effective interest method.
15
LEFT BRAIN COMPOUND GROWTH FUND
NOTES TO FINANCIAL STATEMENTS (Continued)
Investment transactions – Investment transactions are accounted for on the trade date. Realized gains and losses on investments sold are determined on a specific identification basis.
Offering costs – The Adviser advanced some of the Fund’s initial offering costs and was subsequently reimbursed by the Fund. Costs of $12,200 incurred in connection with the offering and initial registration have been deferred and are being amortized on a straight-line basis over the first twelve months after commencement of operations. As of February 28, 2022, there was $2,440 in unamortized offering costs remaining in the Fund.
Common expenses – Common expenses of the Trust are allocated among the Fund and the other series of the Trust based on the relative net assets of each series, the number of series in the Trust, or the nature of the services performed and the relative applicability to each series.
Distributions to shareholders – The Fund distributes to shareholders any net investment income dividends and net realized capital gains on an annual basis. The amount of such dividends and distributions are determined in accordance with federal income tax regulations, which may differ from GAAP. Dividends and distributions to shareholders are recorded on the ex-dividend date. There were no distributions paid to shareholders by the Fund during the period ended February 28, 2022.
Estimates – The preparation of financial statements in conformity with GAAP requires management to make estimates and assumptions that affect the reported amounts of assets and liabilities and disclosure of contingent assets and liabilities as of the date of the financial statements and the reported amounts of increase (decrease) in net assets from operations during the reporting period. Actual results could differ from those estimates.
Federal income tax – The Fund has qualified and intends to continue to qualify as a regulated investment company under the Internal Revenue Code of 1986, as amended (the “Code”). Qualification generally will relieve the Fund of liability for federal income taxes to the extent 100% of its net investment income and net realized capital gains are distributed in accordance with the Code.
In order to avoid imposition of the excise tax applicable to regulated investment companies, it is also the Fund’s intention to declare as dividends in each calendar year equal to at least 98% of its net investment income (earned during the calendar year) and 98.2% of its net realized capital gains (earned during the twelve months ended October 31) plus undistributed amounts from prior years.
The following information is computed on a tax basis for each item as of February 28, 2022:
| Tax cost of portfolio investments | $ | 13,062,264 | ||
| Gross unrealized appreciation | $ | 233,358 | ||
| Gross unrealized depreciation | (589,361 | ) | ||
| Net unrealized depreciation | (356,003 | ) | ||
| Accumulated capital and other losses | (2,131,799 | ) | ||
| Accumulated deficit | $ | (2,487,802 | ) | |
16
LEFT BRAIN COMPOUND GROWTH FUND
NOTES TO FINANCIAL STATEMENTS (Continued)
The difference between the federal income tax cost of portfolio investments and the financial statement cost of portfolio investments is due to certain timing differences in the recognition of capital gains or losses under income tax regulations and GAAP. These “book/tax” differences are temporary in nature and are primarily due to the tax deferral of losses on wash sales and adjustments to basis for master limited partnerships.
As of February 28, 2022, the Fund had short-term capital loss carryforwards of $2,131,799 for federal income tax purposes. These capital loss carryforwards, which do not expire, may be utilized in future years to offset net realized capital gains, if any.
For the period ended February 28, 2022, the Fund reclassified $78,924 of accumulated deficit against paid-in capital on the Statement of Assets and Liabilities. Such reclassification, the result of permanent differences between the financial statement and income tax reporting requirements, had no effect on the Fund’s net assets or NAV per share.
The Fund recognizes the tax benefits or expenses of uncertain tax positions only when the position is “more likely than not” of being sustained assuming examination by tax authorities. Management has reviewed the Fund’s tax positions for the current tax year and has concluded that no provision for unrecognized tax benefits or expenses is required in these financial statements. The Fund identifies its major tax jurisdiction as U.S. Federal.
The Fund recognizes interest and penalties, if any, related to unrecognized tax benefits as income tax on the Statement of Operations. During the period ended February 28, 2022, the Fund did not incur any interest or penalties.
3. Investment Transactions
During the period ended February 28, 2022, cost of purchases and proceeds from sales of investment securities, other than short-term investments, amounted to $27,394,511 and $15,767,187, respectively.
4. Transactions with Related Parties
INVESTMENT ADVISORY AGREEMENT
The Fund’s investments are managed by Left Brain Wealth Management, LLC (the “Adviser”) pursuant to the terms of an Investment Advisory Agreement. The Fund pays the Adviser a management fee, computed and accrued daily and paid monthly, at the annual rate of 2.00% of average daily net assets.
Pursuant to an Expense Limitation Agreement (“ELA”) between the Fund and the Adviser, the Adviser has agreed contractually, until June 30, 2024, to reduce its management fees and reimburse other expenses to the extent necessary to limit total annual fund operating expenses (exclusive of brokerage costs, taxes, interest, borrowing costs such as interest and dividend expenses on securities sold short, costs to organize the Fund, acquired fund fees and expenses, extraordinary expenses such as litigation and merger or reorganization costs and other expenses not incurred
17
LEFT BRAIN COMPOUND GROWTH FUND
NOTES TO FINANCIAL STATEMENTS (Continued)
in the ordinary course of the Fund’s business) to an amount not exceeding 2.00% of the Fund’s average daily net assets. Accordingly, the Adviser reduced its management fees in the amount of $137,350 during the period ended February 28, 2022.
Under the terms of the ELA, management fee reductions and/or expense reimbursements by the Adviser are subject to repayment by the Fund for a period of three years after such date that fees and expenses were incurred, provided that the repayments do not cause total annual fund operating expenses to exceed (i) the expense limitation then in effect, if any, and (ii) the expense limitation in effect at the time the expenses to be repaid were incurred. Prior to June 30, 2024, this agreement may not be modified or terminated without the approval of the Fund’s Board. This agreement will terminate automatically if the Fund’s investment advisory agreement with the Adviser is terminated. As of February 28, 2022, the Adviser may seek repayment of management fee reductions in the amount of $137,350 no later than February 28, 2025.
OTHER SERVICE PROVIDERS
Ultimus Fund Solutions, LLC (“Ultimus”) provides administration, fund accounting, compliance and transfer agency services to the Fund. The Fund pays Ultimus fees in accordance with the agreements for such services. In addition, the Fund pays out-of-pocket expenses including, but not limited to, postage, supplies and certain costs related to the pricing of the Fund’s portfolio securities.
Under the terms of a Distribution Agreement with the Trust, Ultimus Fund Distributors, LLC (the “Distributor”) serves as principal underwriter to the Fund. The Distributor is a wholly-owned subsidiary of Ultimus. The Distributor is compensated by the Adviser (not the Fund) for acting as principal underwriter.
Certain officers and a Trustee of the Trust are also officers of Ultimus.
TRUSTEE COMPENSATION
Effective October 20, 2021, each member of the Board (a “Trustee”) who is not an “interested person” (as defined by the 1940 Act, as amended) of the Trust (“Independent Trustee”) receives a $1,300 annual retainer from the Fund, paid quarterly, except for the Board Chairperson who receives a $1,700 annual retainer from the Fund, paid in quarterly installments. Each Independent Trustee also receives from the Fund a fee of $550 for each Board meeting attended plus reimbursement for travel and other meeting-related expenses. Prior to October 20, 2021, each Independent Trustee received a $1,300 annual retainer from the Fund, paid quarterly, except for the Board Chairperson who received a $1,500 annual retainer from the Fund, paid in quarterly installments. Each Independent Trustee also received from the Fund a fee of $500 for each Board meeting attended plus reimbursement for travel and other meeting-related expenses.
PRINCIPAL HOLDER OF FUND SHARES
As of February 28, 2022, the following shareholder owned of record more than 25% of the outstanding shares of the Fund:
| Name of Record Owner | % Ownership |
| TD Ameritrade, Inc. (for the benefit of its customers) | 100% |
18
LEFT BRAIN COMPOUND GROWTH FUND
NOTES TO FINANCIAL STATEMENTS (Continued)
A beneficial owner of 25% or more of the Fund’s outstanding shares may be considered a controlling person. That shareholder’s vote could have a more significant effect on matters presented at a shareholders’ meeting.
5. Contingencies and Commitments
The Fund indemnifies the Trust’s officers and Trustees for certain liabilities that might arise from their performance of their duties to the Fund. Additionally, in the normal course of business the Fund enters into contracts that contain a variety of representations and warranties and which provide general indemnifications. The Fund’s maximum exposure under these arrangements is unknown, as this would involve future claims that may be made against the Fund that have not yet occurred. However, based on experience, the Fund expects the risk of loss to be remote.
6. Investments in Money Market Funds
In order to maintain sufficient liquidity to implement investment strategies, or for temporary defensive purposes, the Fund may at times invest a significant portion of its assets in shares of a money market fund. As of February 28, 2022, the Fund had 29.0% of the value of its net assets invested in shares of a money market fund registered under the 1940 Act. An investment in a money market fund is not insured or guaranteed by the Federal Deposit Insurance Corporation or any other government agency, entity or person. While investor losses in money market funds have been rare, they are possible. The Fund incurs additional indirect expenses due to acquired fund fees and expenses to the extent it invests in shares of money market funds. The financial statements for the money market fund held can be found at www.sec.gov.
7. Non-Diversification Risk
The Fund is a non-diversified Fund. As a result, the Fund’s holdings may be more concentrated in a limited number of securities and the value of its shares may be more sensitive than a diversified fund to any single economic, business, political, or regulatory occurrence.
8. Subsequent Events
The Fund is required to recognize in the financial statements the effects of all subsequent events that provide additional evidence about conditions that existed as of the date of the Statement of Assets and Liabilities. For non-recognized subsequent events that must be disclosed to keep the financial statements from being misleading, the Fund is required to disclose the nature of the event as well as an estimate of its financial effect, or a statement that such an estimate cannot be made. Management has evaluated subsequent events through the issuance of these financial statements and has noted no such events.
19
LEFT BRAIN COMPOUND GROWTH FUND
REPORT OF INDEPENDENT REGISTERED PUBLIC ACCOUNTING FIRM
To the Shareholders of Left Brain Compound Growth Fund and
Board of Trustees of Ultimus Managers Trust
Opinion on the Financial Statements
We have audited the accompanying statement of assets and liabilities, including the schedule of investments, of Left Brain Compound Growth Fund (the “Fund”), a series of Ultimus Managers Trust, as of February 28, 2022, the related statements of operations and changes in net assets, the related notes, and the financial highlights for the period from April 27, 2021 (commencement of operations) through February 28, 2022 (collectively referred to as the “financial statements”). In our opinion, the financial statements present fairly, in all material respects, the financial position of the Fund as of February 28, 2022, and the results of its operations, the changes in net assets, and the financial highlights for the period from April 27, 2021 (commencement of operations) through February 28, 2022, in conformity with accounting principles generally accepted in the United States of America.
Basis for Opinion
These financial statements are the responsibility of the Fund’s management. Our responsibility is to express an opinion on the Fund’s financial statements based on our audit. We are a public accounting firm registered with the Public Company Accounting Oversight Board (United States) (“PCAOB”) and are required to be independent with respect to the Fund in accordance with the U.S. federal securities laws and the applicable rules and regulations of the Securities and Exchange Commission and the PCAOB.
We conducted our audit in accordance with the standards of the PCAOB. Those standards require that we plan and perform the audit to obtain reasonable assurance about whether the financial statements are free of material misstatement whether due to error or fraud.
Our audit included performing procedures to assess the risks of material misstatement of the financial statements, whether due to error or fraud, and performing procedures that respond to those risks. Such procedures included examining, on a test basis, evidence regarding the amounts and disclosures in the financial statements. Our procedures included confirmation of securities owned as of February 28, 2022, by correspondence with the custodian and broker. Our audit also included evaluating the accounting principles used and significant estimates made by management, as well as evaluating the overall presentation of the financial statements. We believe that our audit provides a reasonable basis for our opinion.
We have served as the Fund’s auditor since 2021.
COHEN & COMPANY, LTD.
Cleveland, Ohio
April 27, 2022
20
LEFT BRAIN COMPOUND GROWTH FUND
BOARD OF TRUSTEES AND EXECUTIVE OFFICERS (Unaudited)
The Board has overall responsibility for management of the Trust’s affairs. The Trustees serve during the lifetime of the Trust and until its termination, or until death, resignation, retirement, or removal. The Trustees, in turn, elect the officers of the Fund to actively supervise their day-to-day operations. The officers have been elected for an annual term. Each Trustee’s and officer’s address is 225 Pictoria Drive, Suite 450, Cincinnati, Ohio 45246. The following are the Trustees and executive officers of the Fund:
| Name and Year of Birth | Length of Time Served | Position(s) Held with Trust | Principal Occupation(s) During Past 5 Years | Number of Funds in Trust Overseen by Trustee | Directorships of Public Companies Held by Trustee During Past 5 Years |
| Interested Trustees: | |||||
| David R. Carson* Year of Birth: 1958 | Trustee Since 2021 Officer Since February 2012 | Trustee (January 2021 to present) Vice President (January 2021 to present; and previously April 2013 to October 2013) President and Principal Executive Officer of each of its series (October 2013 to January 2021) | Vice President and Director of Client Strategies of Ultimus Fund Solutions, LLC (2013 to present); President of Unified Series Trust (January 2017 to present). | 26 | Interested Trustee of 21 series of the Unified Series Trust (a registered management company) (January 2017 to present). |
| Independent Trustees: | |||||
| Janine L. Cohen Year of Birth: 1952 | Since January 2016 | Chairperson (October 2019 to present) Trustee (January 2016 to present) | Retired since 2013; previously Chief Financial Officer from 2004 to 2013 and Chief Compliance Officer from 2008 to 2013 at AER Advisors, Inc. | 26 | n/a |
| David M. Deptula Year of Birth: 1958 | Since June 2012 | Trustee | Vice President of Legal and Special Projects at Dayton Freight Lines, Inc. since February 2016; Vice President of Tax Treasury at The Standard Register, Inc. from November 2011 to 2016. | 26 | n/a |
21
LEFT BRAIN COMPOUND GROWTH FUND
BOARD OF TRUSTEES AND EXECUTIVE OFFICERS (Unaudited) (Continued)
| Name and Year of Birth | Length of Time Served | Position(s) Held with Trust | Principal Occupation(s) During Past 5 Years | Number of Funds in Trust Overseen by Trustee | Directorships of Public Companies Held by Trustee During Past 5 Years |
| Independent Trustees (Continued): | |||||
| Jacqueline A. Williams Year of Birth: 1954 | Since June 2019 | Trustee | Managing Member of Custom Strategy Consulting, LLC (2017 to present); Managing Director of Global Investment Research (2005 to 2017), Cambridge Associates, LLC. | 26 | n/a |
| Clifford N. Schireson Year of Birth: 1953 | Since June 2019 | Trustee | Retired; Founder of Schireson Consulting, LLC (2017 to 2021); Director of Institutional Services for Brandes Investment Partners, LP (2004-2017). | 26 | Trustee of the San Diego City Employees’ Retirement System (August 2019 to present). |
| Robert E. Morrison Year of Birth: 1957 | Since June 2019 | Trustee | Managing Director, Midwest Trust and FCI Advisors (2022 to present); Senior Vice President and National Practice Lead for Investment, Huntington National Bank/ Huntington Private Bank (2014 to 2022); CEO, CIO, President of 5 Star Investment Management Company (2006 to 2014). | 26 | Independent Trustee and Chairman of the Ultimus Managers Trust (2012 to 2014). |
| * | Mr. Carson is considered an “interested person” of the Trust within the meaning of Section 2(a)(19) of the 1940 Act because of his relationship with the Trust’s administrator, transfer agent, and distributor. Mr. Carson was President of the Trust from October 2013 to January 2021 and Vice President of the Trust from April 2013 to October 2013. |
22
LEFT BRAIN COMPOUND GROWTH FUND
BOARD OF TRUSTEES AND EXECUTIVE OFFICERS (Unaudited) (Continued)
| Name and Year of Birth | Length of Time Served | Position(s) Held with Trust | Principal Occupation(s) During Past 5 Years |
| Executive Officers: | |||
| Todd E. Heim Year of Birth: 1967 | Since 2014 | President (January 2021 to present) Vice President (2014 to January 2021) | Relationship Management Director and Vice President of Ultimus Fund Solutions, LLC (2018 to present); Client Implementation Manager and Assistant Vice President of Ultimus Fund Solutions, LLC (2014 to 2018); Naval Flight Officer of United States Navy (May 1989 to June 2017). |
| Jennifer L. Leamer Year of Birth: 1976 | Since 2014 | Treasurer (2014 to present) Assistant Treasurer (April 2014 to October 2014) | Senior Vice President, Fund Accounting of Ultimus Fund Solutions, LLC (2014 to present). |
| Daniel D. Bauer Year of Birth: 1977 | Since 2016 | Assistant Treasurer (April 2016 to present) | Assistant Vice President, Fund Accounting (September 2015 to present); Fund Accounting Manager (March 2012 to August 2015) of Ultimus Fund Solutions, LLC. |
| Angela A. Simmons Year of Birth: 1975 | Since 2022 | Assistant Treasurer (January 2022 to present) | Vice President, Financial Administration (2022 to present) and Assistant Vice President, Financial Administration (2015 to 2022) of Ultimus Fund Solutions, LLC. |
| Khimmara Greer Year of Birth: 1983 | Since 2021 | Secretary (October 2021 to present) | Vice President and Senior Legal Counsel of Ultimus Fund Solutions, LLC (2021 to present); Vice President, Asset Servicing – Regulatory Administration of The Bank of New York Mellon (2019 to 2021); Vice President and Counsel of State Street Bank and Trust Company (2015 to 2019); and Regulatory Advisor – Fund Regulatory Services of JPMorgan Chase Bank (2014 to 2015). |
| David K. James Year of Birth: 1970 | Since 2021 | Assistant Secretary (October 2021 to present) Secretary (July 2021 to October 2021) | Executive Vice President and Chief Legal and Risk Officer of Ultimus Fund Solutions, LLC (2018 to present); Managing Director and Managing Counsel of State Street Bank and Trust Company (2009 to 2018). |
| Natalie S. Anderson Year of Birth: 1975 | Since 2016 | Assistant Secretary (April 2016 to present) | Legal Administration Manager (July 2016 to present) and Paralegal (January 2015 to June 2016) of Ultimus Fund Solutions, LLC. |
23
LEFT BRAIN COMPOUND GROWTH FUND
BOARD OF TRUSTEES AND EXECUTIVE OFFICERS (Unaudited) (Continued)
| Name and Year of Birth | Length of Time Served | Position(s) Held with Trust | Principal Occupation(s) During Past 5 Years |
| Executive Officers (Continued): | |||
| Gweneth Gosselink Year of Birth: 1955 | Since 2020 | Chief Compliance Officer (January 2020 to present) | Assistant Vice President, Compliance Officer of Ultimus Fund Solutions, LLC (December 2019 to present); CCO Consultant at GKG Consulting, LLC (December 2019 to present); Chief Operating Officer & CCO at Miles Capital, Inc. (June 2013 to December 2019). |
| Martin Dean Year of Birth: 1963 | Since 2019 | Assistant Chief Compliance Officer (January 2020 to present) Interim Chief Compliance Officer (October 2019 to January 2020) Assistant Chief Compliance Officer (January 2016 to 2017) | Senior Vice President, Head of Fund Compliance of Ultimus Fund Solutions, LLC (January 2016 to present). |
Additional information about members of the Board and executive officers is available in the Fund’s Statement of Additional Information (“SAI”). To obtain a free copy of the SAI, please call toll free 1-833-498-2238.
24
LEFT BRAIN COMPOUND GROWTH FUND
ABOUT YOUR FUND’S EXPENSES (Unaudited)
We believe it is important for you to understand the impact of costs on your investment. As a shareholder of the Fund, you incur ongoing costs, including management fees, and other operating expenses. The following examples are intended to help you understand your ongoing costs (in dollars) of investing in the Fund and to compare these costs with the ongoing costs of investing in other mutual funds.
A mutual fund’s ongoing costs are expressed as a percentage of its average net assets. This figure is known as the expense ratio. The expenses in the table below are based on an investment of $1,000 made at the beginning of the most recent period (September 1, 2021) and held until the end of the period (February 28, 2022).
The table below illustrates the Fund’s ongoing costs in two ways:
Actual fund return – This section helps you to estimate the actual expenses that you paid over the period. The “Ending Account Value” shown is derived from the Fund’s actual return, and the fourth column shows the dollar amount of operating expenses that would have been paid by an investor who started with $1,000 in the Fund. You may use the information here, together with the amount you invested, to estimate the expenses that you paid over the period.
To do so, simply divide your account value by $1,000 (for example, an $8,600 account value divided by $1,000 = 8.6), then multiply the result by the number given for the Fund under the heading “Expenses Paid During Period.”
Hypothetical 5% return – This section is intended to help you compare the Fund’s ongoing costs with those of other mutual funds. It assumes that the Fund had an annual return of 5% before expenses during the period shown, but that the expense ratio is unchanged. In this case, because the return used is not the Fund’s actual return, the results do not apply to your investment. The example is useful in making comparisons because the U.S. Securities and Exchange Commission (the “SEC”) requires all mutual funds to calculate expenses based on a 5% return. You can assess the Fund’s ongoing costs by comparing this hypothetical example with the hypothetical examples that appear in shareholder reports of other funds.
Note that expenses shown in the table are meant to highlight and help you compare ongoing costs only. The Fund does not charge transaction fees, such as purchase or redemption fees, nor does it carry a “sales load.”
The calculations assume no shares were bought or sold during the period. Your actual costs may have been higher or lower, depending on the amount of your investment and the timing of any purchases or redemptions.
More information about the Fund’s expenses can be found in this report. For additional information on operating expenses and other shareholder costs, please refer to the Fund’s prospectus.
25
LEFT BRAIN COMPOUND GROWTH FUND
ABOUT YOUR FUND’S EXPENSES (Unaudited) (Continued)
| Beginning | Ending | |||||||||||||||
| Account Value | Account Value | Net | Expenses Paid | |||||||||||||
| September 1, | February 28, | Expense | During | |||||||||||||
| 2021 | 2022 | Ratio (a) | Period (b) | |||||||||||||
| Based on Actual Fund Return | $ | 1,000.00 | $ | 796.90 | 2.13 | % | $ | 9.49 | ||||||||
| Based on Hypothetical 5% Return (before expenses) | $ | 1,000.00 | $ | 1,014.23 | 2.13 | % | $ | 10.64 | ||||||||
| (a) | Annualized, based on the Fund’s most recent one-half year expenses. |
| (b) | Expenses are equal to the Fund’s annualized net expense ratio multiplied by the average account value over the period, multiplied by 181/365 (to reflect the one-half year period). |
OTHER INFORMATION (Unaudited)
A description of the policies and procedures that the Fund uses to vote proxies relating to portfolio securities is available without charge upon request by calling toll-free 1-833-498-2238, or on the SEC’s website at www.sec.gov. Information regarding how the Fund voted proxies relating to portfolio securities during the most recent period ended June 30 is available without charge upon request by calling toll-free 1-833-498-2238, or on the SEC’s website at www.sec.gov.
The Trust files a complete listing of portfolio holdings for the Fund with the SEC as of the end of the first and third quarters of each fiscal year as an exhibit to Form N-PORT. These filings are available upon request by calling 1-833-498-2238. Furthermore, you may obtain a copy of the filings on the SEC’s website at www.sec.gov and on the Fund’s website www.leftbrainfunds.com.
26
LEFT BRAIN COMPOUND GROWTH FUND
LIQUIDITY RISK MANAGEMENT PROGRAM (Unaudited)
The Fund has adopted and implemented a written liquidity risk management program (the “Program”) as required by Rule 22e-4 (the “Liquidity Rule”) under the Investment Company Act of 1940, as amended. The Program is reasonably designed to assess and manage the Fund’s liquidity risk, taking into consideration, among other factors, the Fund’s investment strategy and the liquidity of its portfolio investments during normal and reasonably foreseeable stressed conditions; its short-and long-term cash flow projections; and its cash holdings and access to other funding sources. The Fund’s Board of Trustees (the “Board”) approved the appointment of the Liquidity Administrator Committee, comprising of the Fund’s Adviser and certain Trust officers, to be responsible for the Program’s administration and oversight and for reporting to the Board on at least an annual basis regarding the Program’s operation and effectiveness. The annual written report assessing the Program (the “Report”) was presented to the Board at the October 18 - 19, 2021 Board meeting and covered the period from June 1, 2020 to May 31, 2021 (the “Review Period”).
During the Review Period, the Fund did not experience unusual stress or disruption to its operations related to purchase and redemption activity. Also, during the Review Period, the Fund held adequate levels of cash and highly liquid investments to meet shareholder redemption activities in accordance with applicable requirements. The Report concluded that the Program is reasonably designed to prevent violation of the Liquidity Rule and the Program has been effectively implemented.
27
This page intentionally left blank.
This page intentionally left blank.
Left Brain-AR-22
| (b) | Not applicable. |
Item 2. Code of Ethics.
As of the end of the period covered by this report, the registrant has adopted a code of ethics that applies to the registrant’s principal executive officer, principal financial officer, principal accounting officer or controller, or persons performing similar functions, regardless of whether these individuals are employed by the registrant or a third party. Pursuant to Item 13(a)(1), a copy of registrant’s code of ethics is filed as an exhibit to this Form N-CSR. During the period covered by this report, the code of ethics has not been amended, and the registrant has not granted any waivers, including implicit waivers, from the provisions of the code of ethics.
Item 3. Audit Committee Financial Expert.
The registrant’s board of trustees has determined that the registrant has at least one audit committee financial expert serving on its audit committee. The name of the audit committee financial expert is Janine L. Cohen. Ms. Cohen is “independent” for purposes of this Item.
Item 4. Principal Accountant Fees and Services.
| (a) | Audit Fees. The aggregate fees billed for professional services rendered by the principal accountant for the audit of the registrant’s annual financial statements or for services that are normally provided by the accountant in connection with statutory and regulatory filings or engagements were $41,500 and $27,000 with respect to the registrant’s fiscal years ended February 28, 2022 and February 28, 2021, respectively. |
| (b) | Audit-Related Fees. No fees were billed in the last two fiscal years for assurance and related services by the principal accountant that are reasonably related to the performance of the audit of the registrant’s financial statements and are not reported under paragraph (a) of this Item. |
| (c) | Tax Fees. The aggregate fees billed for professional services rendered by the principal accountant for tax compliance, tax advice, and tax planning were $9,500 and $6,000 with respect to the registrant’s fiscal years ended February 28, 2022 and February 28, 2021, respectively. The services comprising these fees are the preparation of the registrant’s federal income and excise tax returns. |
| (d) | All Other Fees. No fees were billed in the last fiscal year for products and services provided by the principal accountant, other than the services reported in paragraphs (a) through (c) of this Item. |
| (e)(1) | The audit committee has not adopted pre-approval policies and procedures described in paragraph (c)(7) of Rule 2-01 of Regulation S-X. |
| (e)(2) | None of the services described in paragraph (b) through (d) of this Item were approved by the audit committee pursuant to paragraph (c)(7)(i)(C) of Rule 2-01 of Regulation S-X. |
| (f) | Less than 50% of hours expended on the principal accountant’s engagement to audit the registrant’s financial statements for the most recent fiscal year were attributed to work performed by persons other than the principal accountant’s full-time, permanent employees. |
| (g) | During the fiscal years ended February 28, 2022 and February 28, 2021, aggregate non-audit fees of $9,500 and $6,000, respectively, were billed by the registrant’s principal accountant for services rendered to the registrant. No non-audit fees were billed in the last two fiscal years by the registrant’s principal accountant for services rendered to the registrant’s investment adviser (not including any sub-adviser whose role is primarily portfolio management and is subcontracted with or overseen by another investment adviser), and any entity controlling, controlled by, or under common control with the adviser that provides ongoing services to the registrant. |
| (h) | The principal accountant has not provided any non-audit services to the registrant’s investment adviser (not including any sub-adviser whose role is primarily portfolio management and is subcontracted with or overseen by another investment adviser), and any entity controlling, |
controlled by, or under common control with the investment adviser that provides ongoing services to the registrant.
Item 5. Audit Committee of Listed Registrants.
Not applicable
Item 6. Schedule of Investments.
| (a) | Not applicable [schedule filed with Item 1] |
| (b) | Not applicable |
Item 7. Disclosure of Proxy Voting Policies and Procedures for Closed-End Management Investment Companies.
Not applicable
| Item 8. | Portfolio Managers of Closed-End Management Investment Companies. |
Not applicable
Item 9. Purchases of Equity Securities by Closed-End Management Investment Company and Affiliated Purchasers.
Not applicable
Item 10. Submission of Matters to a Vote of Security Holders.
The registrant’s Committee of Independent Trustees shall review shareholder recommendations to fill vacancies on the registrant’s board of trustees if such recommendations are submitted in writing, addressed to the Committee at the registrant’s offices and meet any minimum qualifications adopted by the Committee. The Committee may adopt, by resolution, a policy regarding its procedures for considering candidates for the board of trustees, including any recommended by shareholders.
Item 11. Controls and Procedures.
(a) Based on their evaluation of the registrant’s disclosure controls and procedures (as defined in Rule 30a-3(c) under the Investment Company Act of 1940) as of a date within 90 days of the filing date of this report, the registrant’s principal executive officer and principal financial officer have concluded that such disclosure controls and procedures are reasonably designed and are operating effectively to ensure that material information relating to the registrant, including its consolidated subsidiaries, is made known to them by others within those entities, particularly during the period in which this report is being prepared, and that the information required in filings on Form N-CSR is recorded, processed, summarized, and reported on a timely basis.
(b) There were no changes in the registrant’s internal control over financial reporting (as defined in Rule 30a-3(d) under the Investment Company Act of 1940) that occurred during the period covered by this report that have materially affected, or are reasonably likely to materially affect, the registrant’s internal control over financial reporting.
Item 12. Disclosure of Securities Lending Activities for Closed-End Management Investment Companies.
Not applicable
| Item 13. | Exhibits. |
File the exhibits listed below as part of this Form. Letter or number the exhibits in the sequence indicated.
(a)(1) Any code of ethics, or amendment thereto, that is the subject of the disclosure required by Item 2, to the extent that the registrant intends to satisfy the Item 2 requirements through filing of an exhibit: Attached hereto
(a)(2) A separate certification for each principal executive officer and principal financial officer of the registrant as required by Rule 30a-2(a) under the Act (17 CFR 270.30a-2(a)): Attached hereto
(a)(3) Any written solicitation to purchase securities under Rule 23c-1 under the Act (17 CFR 270.23c-1) sent or given during the period covered by the report by or on behalf of the registrant to 10 or more persons: Not applicable
(a)(4) Change in the registrant’s independent public accountants: Not applicable
(b) Certifications required by Rule 30a-2(b) under the Act (17 CFR 270.30a-2(b)): Attached hereto
Exhibit 99.CODE ETH Code of Ethics
Exhibit 99.CERT Certifications required by Rule 30a-2(a) under the Act
Exhibit 99.906CERT Certifications required by Rule 30a-2(b) under the Act
SIGNATURES
Pursuant to the requirements of the Securities Exchange Act of 1934 and the Investment Company Act of 1940, the registrant has duly caused this report to be signed on its behalf by the undersigned, thereunto duly authorized.
| (Registrant) | Ultimus Managers Trust | ||
| By (Signature and Title)* | /s/ Khimmara Greer | ||
| Khimmara Greer, Secretary | |||
| Date | May 6, 2022 | ||
| Pursuant to the requirements of the Securities Exchange Act of 1934 and the Investment Company Act of 1940, this report has been signed below by the following persons on behalf of the registrant and in the capacities and on the dates indicated. | |||
| By (Signature and Title)* | /s/ Todd E. Heim | ||
| Todd E. Hein, Principal Executive Officer | |||
| Date | May 6, 2022 | ||
| By (Signature and Title)* | /s/ Jennifer L. Leamer | ||
| Jennifer L. Leamer, Treasurer and Principal Financial Officer | |||
| Date | May 6, 2022 | ||
* Print the name and title of each signing officer under his or her signature.