| OMB APPROVAL | |
OMB Number: 3235-0570 Expires: July 31, 2022 Estimated average burden hours per response: 20.6 |
UNITED STATES
SECURITIES AND EXCHANGE COMMISSION
Washington, D.C. 20549
FORM N-CSR
CERTIFIED SHAREHOLDER REPORT OF REGISTERED
MANAGEMENT INVESTMENT COMPANIES
| Investment Company Act file number | 811-22680 |
| Ultimus Managers Trust |
| (Exact name of registrant as specified in charter) |
| 225 Pictoria Drive, Suite 450 Cincinnati, Ohio | 45246 |
| (Address of principal executive offices) | (Zip code) |
Khimmara Greer
| Ultimus Fund Solutions, LLC 225 Pictoria Drive, Suite 450 Cincinnati, Ohio 45246_ |
| (Name and address of agent for service) |
| Registrant's telephone number, including area code: | (513) 587-3400 |
| Date of fiscal year end: | May 31 | |
| Date of reporting period: | May 31, 2022 |
Form N-CSR is to be used by management investment companies to file reports with the Commission not later than 10 days after the transmission to stockholders of any report that is required to be transmitted to stockholders under Rule 30e-1 under the Investment Company Act of 1940 (17 CFR 270.30e-1). The Commission may use the information provided on Form N-CSR in its regulatory, disclosure review, inspection, and policymaking roles.
A registrant is required to disclose the information specified by Form N-CSR, and the Commission will make this information public. A registrant is not required to respond to the collection of information contained in Form N-CSR unless the Form displays a currently valid Office of Management and Budget ("OMB") control number. Please direct comments concerning the accuracy of the information collection burden estimate and any suggestions for reducing the burden to Secretary, Securities and Exchange Commission, 450 Fifth Street, NW, Washington, DC 20549-0609. The OMB has reviewed this collection of information under the clearance requirements of 44 U.S.C. § 3507.
| Item 1. | Reports to Stockholders. |
| (a) |
Institutional Class (ADLVX)
ANNUAL REPORT
May 31, 2022
Managed by
Adler Asset Management, LLC
For information or assistance in opening an account,
please call toll-free 1-800-408-4682.
| ADLER VALUE FUND | |
| LETTER TO SHAREHOLDERS (Unaudited) | June 13, 2022 |
Dear Shareholder,
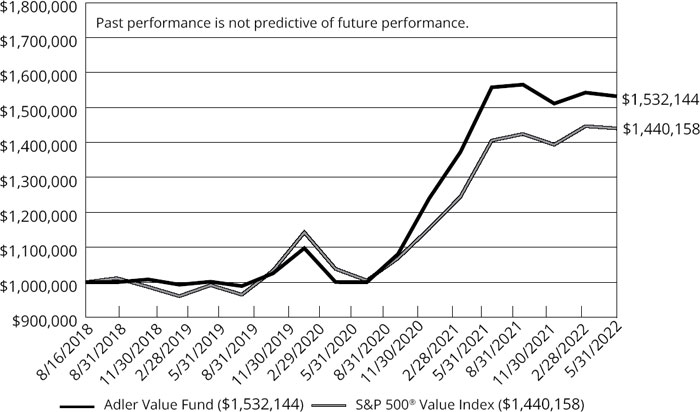
In mid-August 2018, the Adler Value Fund (the “Fund”) commenced operations. Adler Asset Management, LLC (the “Adviser”) is the Fund’s investment adviser. For the annual period ended May 31, 2022, the Fund’s total return was -1.64%. During the same period, the total return of the S&P 500 Value Index was 2.46%. During the annual period ended May 31, 2022, the Fund completed three years in operation. For the three years ended May 31, 2022, the Fund had an annualized total return of 15.71%. During the same period, the S&P 500 Value Index had an annualized total return of 14.30%
As the fiscal year progressed, equity, fixed-income, foreign exchange, and commodities markets increasingly reacted to economic data that either validated or refuted market expectations around three key themes:
| ● | Pace of Federal Reserve interest rate increases; |
| ● | Persistently high inflation; and |
| ● | Probability, timing, and severity of a potential recession. |
Investment Approach
In selecting investments for the Fund, the Adviser uses a focused-value strategy to invest in companies that, in its opinion, appear to be undervalued by the equity market but where catalysts exist, in the opinion of the Adviser, to close these valuation gaps. The Adviser seeks to exploit perceived market misjudgments in pricing by buying equity securities that appear to be undervalued because of a temporary aversion to these out-of-favor issuers.
The Adviser maintains a watch list of companies and reviews each company’s financial condition and prospects, including factors such as (but not limited to): expected future earnings, cash flow, the ability and willingness to return capital to shareholders, competitive position, quality of the business franchise, and the reputation, experience, and competence of a company’s management and board of directors. The Adviser considers these factors both while the company is on the watch list and also at the time of purchase. Not all companies, at the time of purchase, are on the Adviser’s watch list, and a company may be added to the Fund’s portfolio following a precipitating event.
When added to the Fund’s portfolio, a company will generally be trading at a significant discount to its 52-week or all-time high. The Adviser’s contrarian approach, buying what it believes are fundamentally sound companies that are out-of-favor with the market, is industry, sector and market capitalization agnostic, and typically will result in a portfolio containing the securities of fewer than thirty issuers.
1
Performance for the Annual Period
The Adviser attributes the Fund’s underperformance for the annual period to the impact of recession fears on some of the Fund’s holdings. Value stocks can and do operate in industries impacted by a potential economic slowdown with the equity market re-pricing certain stocks. The Adviser remains confident in the catalysts for the Fund’s holdings as we move through this period of economic uncertainty.
Portfolio Developments
Veoneer’s (VNE) $37.00 per share cash sale closed near the end of the annual period. VNE was the Fund’s largest holding reflecting the exercise of in-the-money call options and the purchase of additional shares to capitalize on an unusually large arbitrage spread prior to close.
Altice USA (ATUS) is one of the largest broadband communications and video services providers in the United States. ATUS has embarked on a multi-billion dollar build-out of its fiber network which is depressing free cash flow in the short-term. This impact on free cash flow has hurt the stock price which currently trades below the Fund’s cost. In addition, ATUS has a controlling shareholder. The Fund did well with another holding, Meredith Corporation, with a controlling shareholder. In this case, the Adviser has and continues to assess the degree of alignment of the controlling shareholder with minority shareholders of which the Fund is one.
In closing, I want to thank shareholders for their confidence in the Fund’s Adviser. The Adviser continues to assess companies that fit the Fund’s investment approach.
David Adler
Adler Asset Management, LLC
June 13, 2022
2
Past performance is not predictive of future performance. Investment results and principal value will fluctuate so that shares, when redeemed, may be worth more or less than their original cost. Current performance may be higher or lower than the performance data quoted. Performance data current to the most recent month-end are available by calling 1-800-408-4682.
An investor should consider the investment objectives, risks, charges and expenses of the Fund carefully before investing. The Fund’s prospectus contains this and other important information. To obtain a copy of the Fund’s prospectus please visit the Fund’s website at www.adlervaluefund.com or call 1-800-408-4682 and a copy will be sent to you free of charge. Please read the prospectus carefully before you invest. The Fund is distributed by Ultimus Fund Distributors, LLC.
The Letter to Shareholders seeks to describe some of the Adviser’s current opinions and views of the financial markets. Although the Adviser believes it has a reasonable basis for any opinions or views expressed, actual results may differ, sometimes significantly so, from those expected or expressed. The securities held by the Fund that are discussed in the Letter to Shareholders were held during the period covered by this Report. They do not comprise the entire investment portfolio of the Fund, may be sold at any time, and may no longer be held by the Fund. For a complete list of securities held by the Fund as of May 31, 2022, please see the Schedule of Investments section of the annual report. The opinions of the Fund’s adviser with respect to those securities may change at any time.
Statements in the Letter to Shareholders that reflect projections or expectations for future financial or economic performance of the Fund and the market in general and statements of the Fund’s plans and objectives for future operations are forward-looking statements. No assurance can be given that actual results or events will not differ materially from those projected, estimated, assumed, or anticipated in any such forward-looking statements. Important factors that could result in such differences, in addition to factors noted with such forward-looking statements, include, without limitation, general economic conditions, such as inflation, recession, and interest rates. Past performance is not a guarantee of future results.
3
| ADLER VALUE FUND |
| PERFORMANCE INFORMATION |
| May 31, 2022 (Unaudited) |
Comparison of the Change in Value of a $1,000,000 Investment in
Adler Value Fund - Institutional Class vs. the S&P 500® Value Index
| Average Annual Total Returns (for the periods ended May 31, 2022) | ||||||
| Since | ||||||
| 1 Year | 3 Year | Inception (b) | ||||
| Adler Value Fund - Institutional Class (a) | (1.64%) | 15.71% | 11.92% | |||
| S&P 500® Value Index (c) | 2.46% | 14.30% | 10.11% | |||
| (a) | The total returns shown do not reflect the deduction of taxes a shareholder would pay on Fund distributions, if any, or the redemption of Fund shares. |
| (b) | The Fund commenced operations on August 16, 2018. |
| (c) | The S&P 500® Value Index measures value stocks drawn from the S&P 500® Index. Value is measured using three factors: the ratios of book value, earnings, and sales to price. |
4
| ADLER VALUE FUND |
| PORTFOLIO INFORMATION |
| May 31, 2022 (Unaudited) |
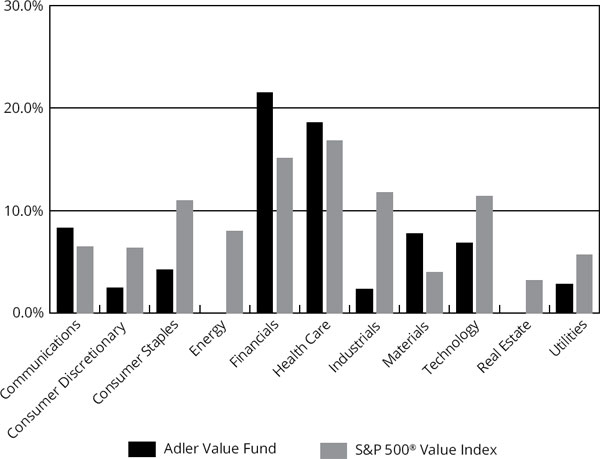
Sector Diversification
(% of Net Assets)
| Top 10 Equity Holdings | ||
| % of Net | ||
| Security Description | Assets | |
| Pfizer, Inc | 5.6% | |
| Valvoline, Inc. | 4.6% | |
| Charles Schwab Corporation (The) | 4.2% | |
| Aflac, Inc. | 3.9% | |
| Cigna Corporation | 3.8% | |
| Bayer AG - ADR | 3.5% | |
| Jackson Financial, Inc. - Class A | 3.5% | |
| Equitable Holdings, Inc. | 3.4% | |
| MultiPlan Corporation | 3.3% | |
| O-I Glass, Inc. | 3.2% | |
5
| ADLER VALUE FUND |
| SCHEDULE OF INVESTMENTS |
| May 31, 2022 |
| COMMON STOCKS — 72.6% | Shares | Value | ||||||
| Communications — 8.3% | ||||||||
| Cable & Satellite — 1.5% | ||||||||
| Altice USA, Inc. - Class A (a) | 3,100 | $ | 35,278 | |||||
| Comcast Corporation - Class A | 600 | 26,568 | ||||||
| 61,846 | ||||||||
| Entertainment Content — 3.2% | ||||||||
| Paramount Global - Class B | 3,900 | 133,887 | ||||||
| Internet Media & Services — 0.9% | ||||||||
| Twitter, Inc. (a) | 1,000 | 39,600 | ||||||
| Publishing & Broadcasting — 2.7% | ||||||||
| iHeartMedia, Inc. - Class A (a) | 9,500 | 112,100 | ||||||
| Consumer Discretionary — 2.5% | ||||||||
| Automotive — 1.9% | ||||||||
| Tenneco, Inc. - Class A (a) | 4,700 | 81,357 | ||||||
| Leisure Facilities & Services — 0.6% | ||||||||
| Starbucks Corporation | 300 | 23,550 | ||||||
| Consumer Staples — 4.2% | ||||||||
| Beverages — 1.1% | ||||||||
| Diageo plc - ADR | 250 | 46,743 | ||||||
| Household Products — 3.1% | ||||||||
| Spectrum Brands Holdings, Inc. | 1,500 | 131,610 | ||||||
| Financials — 19.3% | ||||||||
| Banking — 2.5% | ||||||||
| Citigroup, Inc. | 2,000 | 106,820 | ||||||
| Broker-Dealers — 6.0% | ||||||||
| Charles Schwab Corporation (The) | 2,500 | 175,250 | ||||||
| XP, Inc. - Class A (a) | 3,395 | 76,761 | ||||||
| 252,011 | ||||||||
| Insurance — 10.8% | ||||||||
| Aflac, Inc. | 2,700 | 163,539 | ||||||
| Equitable Holdings, Inc. | 4,700 | 142,927 | ||||||
| Jackson Financial, Inc. - Class A | 4,000 | 145,640 | ||||||
| 452,106 | ||||||||
6
| ADLER VALUE FUND |
| SCHEDULE OF INVESTMENTS (Continued) |
| COMMON STOCKS — 72.6% (Continued) | Shares | Value | ||||||
| Health Care — 18.6% | ||||||||
| Biotech & Pharma — 14.8% | ||||||||
| Bayer AG - ADR | 8,200 | $ | 146,124 | |||||
| Bristol-Myers Squibb Company | 1,500 | 113,175 | ||||||
| Pfizer, Inc. | 4,400 | 233,376 | ||||||
| Viatris, Inc. | 10,335 | 126,810 | ||||||
| 619,485 | ||||||||
| Health Care Facilities & Services — 3.8% | ||||||||
| Cigna Corporation | 600 | 160,974 | ||||||
| Industrials — 2.3% | ||||||||
| Industrial Support Services — 2.3% | ||||||||
| Grainger (W.W.), Inc. | 200 | 97,414 | ||||||
| Materials — 7.8% | ||||||||
| Chemicals — 4.6% | ||||||||
| Valvoline, Inc. | 5,800 | 194,068 | ||||||
| Containers & Packaging — 3.2% | ||||||||
| O-I Glass, Inc. (a) | 8,300 | 136,535 | ||||||
| Technology — 6.8% | ||||||||
| Technology & Electronics — 2.4% | ||||||||
| Corning, Inc. | 2,800 | 100,296 | ||||||
| Technology Hardware — 1.1% | ||||||||
| Diebold Nixdorf, Inc. (a) | 14,200 | 44,162 | ||||||
| Technology Services — 3.3% | ||||||||
| MultiPlan Corporation (a) | 28,000 | 140,000 | ||||||
| Utilities — 2.8% | ||||||||
| Electric Utilities — 2.8% | ||||||||
| PG&E Corporation (a) | 9,600 | 117,120 | ||||||
| Total Common Stocks (Cost $2,570,871) | $ | 3,051,684 | ||||||
7
| ADLER VALUE FUND |
| SCHEDULE OF INVESTMENTS (Continued) |
| PREFERRED STOCKS — 2.2% | Shares | Value | ||||||
| Financials — 2.2% | ||||||||
| Banking — 2.2% | ||||||||
| Itau Unibanco Holding S.A. - ADR ($80,145) | 16,800 | $ | 92,064 | |||||
| PURCHASED OPTION | Notional | |||||||||||||||
| CONTRACTS — 5.1% | Strike Price | Contracts | Value | Value | ||||||||||||
| Call Option Contracts — 5.1% | ||||||||||||||||
| Altice USA, Inc. - Class A, 06/17/22 | $ | 18.00 | 20 | $ | 22,760 | $ | 50 | |||||||||
| Altice USA, Inc. - Class A, 06/17/22 | 25.00 | 10 | 11,380 | 25 | ||||||||||||
| Altice USA, Inc. - Class A, 01/20/23 | 10.00 | 30 | 34,140 | 9,300 | ||||||||||||
| Altice USA, Inc. - Class A, 01/20/23 | 11.00 | 10 | 11,380 | 2,500 | ||||||||||||
| Altice USA, Inc. - Class A, 01/20/23 | 12.00 | 20 | 22,760 | 4,000 | ||||||||||||
| Bristol-Myers Squibb Company, 06/17/22 | 57.50 | 20 | 150,900 | 36,750 | ||||||||||||
| Bristol-Myers Squibb Company, 06/17/22 | 65.00 | 4 | 30,180 | 4,400 | ||||||||||||
| Corning, Inc., 01/20/23 | 32.00 | 10 | 35,820 | 6,000 | ||||||||||||
| Corning, Inc., 01/20/23 | 35.00 | 10 | 35,820 | 4,000 | ||||||||||||
| Corning, Inc., 01/20/23 | 37.00 | 30 | 107,460 | 9,300 | ||||||||||||
| Diebold Nixdorf, Inc., 11/18/22 | 5.00 | 10 | 3,110 | 430 | ||||||||||||
| Diebold Nixdorf, Inc., 11/18/22 | 7.50 | 20 | 6,220 | 260 | ||||||||||||
| Equitable Holdings, Inc., 01/20/23 | 30.00 | 40 | 121,640 | 14,000 | ||||||||||||
| iHeartmedia, Inc. - Class A, 07/15/22 | 20.00 | 25 | 29,500 | 938 | ||||||||||||
| iHeartMedia, Inc. - Class A, 01/20/23 | 12.50 | 10 | 11,800 | 2,100 | ||||||||||||
| iHeartMedia, Inc. - Class A, 01/20/23 | 15.00 | 30 | 35,400 | 3,150 | ||||||||||||
| iHeartMedia, Inc. - Class A, 01/20/23 | 17.50 | 10 | 11,800 | 575 | ||||||||||||
| iHeartmedia, Inc. - Class A, 01/20/23 | 20.00 | 30 | 35,400 | 1,875 | ||||||||||||
| Itau Unibanco Holding S.A. - ADR, 01/20/23 | 4.50 | 10 | 5,480 | 1,768 | ||||||||||||
8
| ADLER VALUE FUND |
| SCHEDULE OF INVESTMENTS (Continued) |
| PURCHASED OPTION | ||||||||||||||||
| CONTRACTS — 5.1% | Notional | |||||||||||||||
| (Continued) | Strike Price | Contracts | Value | Value | ||||||||||||
| Call Option Contracts — 5.1% | ||||||||||||||||
| (Continued) | ||||||||||||||||
| Itau Unibanco Holding S.A. - ADR, 01/20/23 | $ | 5.00 | 20 | $ | 10,960 | $ | 2,790 | |||||||||
| Jackson Financial, Inc. - Class A, 06/17/22 | 30.00 | 10 | 36,410 | 7,050 | ||||||||||||
| MultiPlan Corporation, 01/20/23 | 5.00 | 110 | 55,000 | 12,100 | ||||||||||||
| MultiPlan Corporation, 01/20/23 | 7.50 | 10 | 5,000 | 400 | ||||||||||||
| O-I Glass, Inc., 11/18/22 | 13.00 | 10 | 16,450 | 3,700 | ||||||||||||
| O-I Glass, Inc., 12/16/22 | 12.00 | 5 | 8,225 | 2,575 | ||||||||||||
| Paramount Global - Class B, 06/17/22 | 37.50 | 10 | 34,330 | 330 | ||||||||||||
| Paramount Global - Class B, 01/20/23 | 30.00 | 10 | 34,330 | 7,200 | ||||||||||||
| Pfizer, Inc., 01/20/23 | 47.00 | 20 | 106,080 | 16,450 | ||||||||||||
| Pfizer, Inc., 01/20/23 | 50.00 | 40 | 212,160 | 25,800 | ||||||||||||
| PG&E Corporation, 01/20/23 | 10.00 | 10 | 12,200 | 2,995 | ||||||||||||
| Valvoline, Inc., 12/16/22 | 30.00 | 20 | 66,920 | 11,400 | ||||||||||||
| Viatris, Inc., 01/20/23 | 10.00 | 10 | 12,270 | 2,750 | ||||||||||||
| Viatris, Inc., 01/20/23 | 12.50 | 50 | 61,350 | 7,000 | ||||||||||||
| Viatris, Inc., 01/20/23 | 15.00 | 160 | 196,320 | 9,600 | ||||||||||||
| Total Purchased Option Contracts (Cost $197,105) | $ | 1,590,955 | $ | 213,561 | ||||||||||||
| MONEY MARKET FUNDS — 19.9% | Shares | Value | ||||||
| Federated Hermes Treasury Obligations Fund – Service Shares, 0.41% (b) (Cost $836,318) | 836,318 | $ | 836,318 | |||||
| Investments at Value — 99.8% (Cost $3,684,439) | $ | 4,193,627 | ||||||
| Other Assets in Excess of Liabilities — 0.2% | 8,737 | |||||||
| Net Assets — 100.0% | $ | 4,202,364 | ||||||
| (a) | Non-income producing security. |
| (b) | The rate shown is the 7-day effective yield as of May 31, 2022. |
ADR - American Depository Receipt
AG - Aktiengesellschaft
plc - Public Limited Company
S.A. - Société anonyme
See accompanying notes to financial statements.
9
| ADLER VALUE FUND |
| STATEMENT OF ASSETS AND LIABILITIES |
| May 31, 2022 |
| ASSETS | ||||
| Investments in securities: | ||||
| At cost | $ | 3,684,439 | ||
| At value (Note 2) | $ | 4,193,627 | ||
| Receivable for capital shares sold | 750 | |||
| Receivable from Adviser (Note 4) | 8,778 | |||
| Dividends receivable | 8,200 | |||
| Tax reclaims receivable | 512 | |||
| Other assets | 3,665 | |||
| Total assets | 4,215,532 | |||
| LIABILITIES | ||||
| Payable to administrator (Note 4) | 7,030 | |||
| Other accrued expenses | 6,138 | |||
| Total liabilities | 13,168 | |||
| NET ASSETS | $ | 4,202,364 | ||
| NET ASSETS CONSIST OF: | ||||
| Paid-in capital | $ | 3,455,345 | ||
| Distributable earnings | 747,019 | |||
| NET ASSETS | $ | 4,202,364 | ||
| PRICING OF INSTITUTIONAL SHARES (Note 2) | ||||
| Net assets applicable to Institutional Shares | $ | 4,202,364 | ||
| Shares of Institutional Shares outstanding (no par value, unlimited number of shares authorized) | 151,729 | |||
| Net asset value, offering and redemption price per share (Note 2) | $ | 27.70 |
See accompanying notes to financial statements.
10
| ADLER VALUE FUND |
| STATEMENT OF OPERATIONS |
| For the Year Ended May 31, 2022 |
| INVESTMENT INCOME | ||||
| Dividends | $ | 185,134 | ||
| Foreign withholding tax on dividends | (1,598 | ) | ||
| Total investment income | 183,536 | |||
| EXPENSES | ||||
| Investment advisory fees (Note 4) | 40,980 | |||
| Fund accounting fees (Note 4) | 30,408 | |||
| Administration fees (Note 4) | 30,000 | |||
| Legal fees | 24,694 | |||
| Trustees��� fees and expenses (Note 4) | 17,817 | |||
| Audit and tax services fees | 16,995 | |||
| Registration and filing fees | 14,644 | |||
| Transfer agent fees (Note 4) | 12,000 | |||
| Compliance fees (Note 4) | 12,000 | |||
| Custodian and bank service fees | 8,976 | |||
| Printing of shareholder reports | 6,725 | |||
| Postage and supplies | 4,597 | |||
| Insurance expense | 3,344 | |||
| Other expenses | 8,298 | |||
| Total expenses | 231,478 | |||
| Less fee reductions and expense reimbursements by the Adviser (Note 4) | (180,253 | ) | ||
| Net expenses | 51,225 | |||
| NET INVESTMENT INCOME | 132,311 | |||
| REALIZED AND UNREALIZED GAINS (LOSSES) ON INVESTMENTS | ||||
| Net realized gains on investments transactions | 433,006 | |||
| Net change in unrealized appreciation (depreciation) on investments | (639,008 | ) | ||
| NET REALIZED AND UNREALIZED LOSSES ON INVESTMENTS | (206,002 | ) | ||
| NET DECREASE IN NET ASSETS RESULTING FROM OPERATIONS | $ | (73,691 | ) |
See accompanying notes to financial statements.
11
| ADLER VALUE FUND |
| STATEMENTS OF CHANGES IN NET ASSETS |
| Year Ended | Year Ended | |||||||
| May 31, | May 31, | |||||||
| 2022 | 2021 | |||||||
| FROM OPERATIONS | ||||||||
| Net investment income | $ | 132,311 | $ | 6,671 | ||||
| Net realized gains (losses) from investment transactions | 433,006 | (3,828 | ) | |||||
| Net change in unrealized appreciation (depreciation) on investments | (639,008 | ) | 1,190,419 | |||||
| Net increase (decrease) in net assets resulting from operations | (73,691 | ) | 1,193,262 | |||||
| DISTRIBUTIONS TO SHAREHOLDERS (NOTE 2) | ||||||||
| Institutional Shares | (326,422 | ) | (33,750 | ) | ||||
| FROM CAPITAL SHARE TRANSACTIONS | ||||||||
| Institutional Shares | ||||||||
| Proceeds from shares sold | 556,469 | 1,143,090 | ||||||
| Net asset value of shares issued in reinvestment of distributions to shareholders | 326,422 | 33,750 | ||||||
| Payments for shares redeemed | (75,104 | ) | (30 | ) | ||||
| Net increase in Institutional Shares net assets from capital share transactions | 807,787 | 1,176,810 | ||||||
| TOTAL INCREASE IN NET ASSETS | 407,674 | 2,336,322 | ||||||
| NET ASSETS | ||||||||
| Beginning of year | 3,794,690 | 1,458,368 | ||||||
| End of year | $ | 4,202,364 | $ | 3,794,690 | ||||
| CAPITAL SHARES ACTIVITY | ||||||||
| Institutional Shares | ||||||||
| Shares sold | 18,654 | 49,491 | ||||||
| Shares reinvested | 11,295 | 1,359 | ||||||
| Shares redeemed | (2,634 | ) | (1 | ) | ||||
| Net increase in shares outstanding | 27,315 | 50,849 | ||||||
| Shares outstanding, beginning of year | 124,414 | 73,565 | ||||||
| Shares outstanding, end of year | 151,729 | 124,414 | ||||||
See accompanying notes to financial statements.
12
| ADLER VALUE FUND |
| INSTITUTIONAL SHARES |
| FINANCIAL HIGHLIGHTS |
Per Share Data for a Share Outstanding Throughout Each Period
| Year Ended | Year Ended | Period Ended | Period Ended | |||||||||||||
| May 31, | May 31, | May 31, | July 31, | |||||||||||||
| 2022 | 2021 | 2020(a) | 2019(b) | |||||||||||||
| Net asset value at beginning of period | $ | 30.50 | $ | 19.82 | $ | 20.41 | $ | 20.00 | ||||||||
| Income (loss) from investment operations: | ||||||||||||||||
| Net investment income | 0.95 | (c) | 0.07 | (c) | 0.49 | (d) | 0.15 | |||||||||
| Net realized and unrealized gains (losses) on investments | (1.35 | ) | 10.92 | (0.88 | ) | 0.26 | ||||||||||
| Total from investment operations | (0.40 | ) | 10.99 | (0.39 | ) | 0.41 | ||||||||||
| Less distributions from: | ||||||||||||||||
| Net investment income | (2.30 | ) | (0.31 | ) | (0.20 | ) | — | |||||||||
| Net realized gains | (0.10 | ) | — | — | — | |||||||||||
| Total distributions | (2.40 | ) | (0.31 | ) | (0.20 | ) | — | |||||||||
| Net asset value at end of period | $ | 27.70 | $ | 30.50 | $ | 19.82 | $ | 20.41 | ||||||||
| Total return (e) | (1.64 | %) | 55.78 | % | (2.01 | %) (f) | 2.05 | % (f) | ||||||||
| Net assets at end of period (000’s) | $ | 4,202 | $ | 3,795 | $ | 1,458 | $ | 1,447 | ||||||||
| Ratios/supplementary data: | ||||||||||||||||
| Ratio of total expenses to average net assets | 5.65 | % | 8.42 | % | 13.01 | % (g) | 11.82 | % (g) | ||||||||
| Ratio of net expenses to average net assets (h) | 1.25 | % | 1.25 | % | 1.25 | % (g) | 1.26 | % (g)(i) | ||||||||
| Ratio of net investment income to average net assets (h) | 3.23 | % (j) | 0.27 | % | 2.93 | % (d)(g) | 0.81 | % (g) | ||||||||
| Portfolio turnover rate | 45 | % | 0 | %(k) | 4 | % (f) | 0 | % | ||||||||
| (a) | Fund changed fiscal year to May 31. |
| (b) | Represents the period from the commencement of operations (August 16, 2018) through July 31, 2019. |
| (c) | Per share net investment income has been determined on the basis of average number of shares outstanding during the period. |
| (d) | During the period ended May 31, 2020, the Fund received a large special dividend distribution from NortonLifeLock, Inc. Had the Fund not received this special dividend distribution, the net investment income per share and ratio of net investment income to average net assets would have been $0.33 and 1.97%(g) lower, respectively. |
| (e) | Total return is a measure of the change in value of an investment in the Fund over the periods covered. The returns shown do not reflect the deduction of taxes a shareholder would pay on Fund distributions, if any, or the redemption of Fund shares. The total returns would be lower if the Adviser had not reduced fees and reimbursed expenses (Note 4). |
| (f) | Not annualized. |
| (g) | Annualized. |
| (h) | Ratio was determined after advisory fee reductions and expense reimbursements (Note 4). |
| (i) | Includes federal excise taxes of 0.01% of average net assets with respect to the period ended July 31, 2019. |
| (j) | During the year ended May 31, 2022, the Fund received a large special dividend distribution from Meredith Corporation. Had the Fund not received this special dividend distribution, the net investment income per share and ratio of net investment income to average net assets would have been $0.82 and 2.79% lower, respectively. |
| (k) | Percentage rounds to less than 1%. |
See accompanying notes to financial statements.
13
| ADLER VALUE FUND |
| NOTES TO FINANCIAL STATEMENTS |
| May 31, 2022 |
1. Organization
Adler Value Fund (the “Fund”) is a non-diversified series of Ultimus Managers Trust (the “Trust”), an open-end investment company established as an Ohio business trust under a Declaration of Trust dated February 28, 2012. Other series of the Trust are not incorporated in this report.
The investment objective of the Fund is to seek to achieve long-term growth of capital.
The Fund currently offers one class of shares: Institutional Class shares (sold without any sales loads or distribution fees and subject to a $1,000,000 initial investment requirement).
2. Significant Accounting Policies
The Fund follows accounting and reporting guidance under Financial Accounting Standards Board Accounting Standards Codification Topic 946, “Financial Services – Investment Companies.” The following is a summary of the Fund’s significant accounting policies used in preparation of its financial statements. These policies are in conformity with accounting principles generally accepted in the United States of America (“GAAP”).
New accounting pronouncements – In October 2020, the U.S. Securities and Exchange Commission (the “SEC”) adopted new regulations governing the use of derivatives by registered investment companies (“Rule 18f-4”). The Funds will be required to comply with the Rule 18f-4 by August 19, 2022. Once implemented, Rule 18f-4 will impose limits on the amount of derivatives a fund can enter into, eliminate the asset segregation framework currently used by funds to comply with Section 18 of the Investment Company Act of 1940, as amended, (the “1940 Act”), treat derivatives as senior securities and require funds whose use of derivatives is more than a limited specified exposure amount to establish and maintain a comprehensive derivatives risk management program and appoint a derivatives risk manager. The Fund is currently evaluating the impact, if any, of this provision.
Securities valuation – The Fund values its portfolio securities at market value as of the close of regular trading on the New York Stock Exchange (the “NYSE”) (normally 4:00 p.m. Eastern Time) on each day the NYSE is open for business. The Fund generally values its listed securities on the basis of the security’s last sale price on the security’s primary exchange, if available, otherwise at the exchange’s most recently quoted mean price. NASDAQ-listed securities are valued at the NASDAQ Official Closing Price. Option contracts are valued at the closing price on the exchanges on which they are primarily traded; if no closing price is available at the time of valuation, the option will be valued at the mean of the closing bid and ask prices for that day. Investments representing shares of money market funds and other open-end investment companies not traded on an exchange are valued at their net asset value (“NAV”) as reported by such companies. When using a quoted price and when the market is considered active, the security will be classified as Level 1 within the fair value hierarchy (see next page). In the event that market quotations are not readily available or are considered unreliable due to market or other events, the Fund values its securities and other assets at fair value in accordance with
14
| ADLER VALUE FUND |
| NOTES TO FINANCIAL STATEMENTS (Continued) |
procedures established by and under the general supervision of the Board of Trustees of the Trust (the “Board”). Under these procedures, the securities will be classified as Level 2 or 3 within the fair value hierarchy, depending on the inputs used. Unavailable or unreliable market quotes may be due to the following factors: a substantial bid-ask spread; infrequent sales resulting in stale prices; insufficient trading volume; small trade sizes; a temporary lapse in any reliable pricing source; and actions of the securities or futures markets, such as the suspension or limitation of trading. As a result, the prices of securities used to calculate the Fund’s NAV may differ from quoted or published prices for the same securities.
GAAP establishes a single authoritative definition of fair value, sets out a framework for measuring fair value, and requires additional disclosures about fair value measurements.
Various inputs are used in determining the value of the Fund’s investments. These inputs are summarized in the three broad levels listed below:
| ● | Level 1 – quoted prices in active markets for identical securities |
| ● | Level 2 – other significant observable inputs |
| ● | Level 3 – significant unobservable inputs |
The inputs or methods used for valuing securities are not necessarily an indication of the risks associated with investing in those securities. The inputs used to measure fair value may fall into different levels of the fair value hierarchy. In such cases, for disclosure purposes, the level in the fair value hierarchy within which the fair value measurement falls in its entirety is determined based on the lowest level input that is significant to the fair value measurement.
The following is a summary of the Fund’s investments based on the inputs used to value the investments as of May 31, 2022:
| Level 1 | Level 2 | Level 3 | Total | |||||||||||||
| Common Stocks | $ | 3,051,684 | $ | — | $ | — | $ | 3,051,684 | ||||||||
| Preferred Stocks | 92,064 | — | — | 92,064 | ||||||||||||
| Purchased Option Contracts | 112,570 | 100,991 | — | 213,561 | ||||||||||||
| Money Market Funds | 836,318 | — | — | 836,318 | ||||||||||||
| Total | $ | 4,092,636 | $ | 100,991 | $ | — | $ | 4,193,627 | ||||||||
Refer to the Fund’s Schedule of Investments for a listing of the common and preferred stocks by sector and industry type. The Fund did not have any assets or liabilities that were measured at fair value on a recurring basis using significant unobservable inputs (Level 3) as of or during the year ended May 31, 2022.
Share valuation – The NAV per share of each class of the Fund is calculated daily by dividing the total value of the assets attributable to that class, less liabilities attributable to that class, by the number of shares outstanding of that class. The offering price and redemption price per share of each class of the Fund is equal to the NAV per share of such class.
15
| ADLER VALUE FUND |
| NOTES TO FINANCIAL STATEMENTS (Continued) |
Investment income – Dividend income is recorded on the ex-dividend date. Non-cash dividends included in dividend income, if any, are recorded at the fair value of the security received. Interest income is accrued as earned. Withholding taxes on foreign dividends, if any, have been recorded in accordance with the Fund’s understanding of the applicable country’s tax rules and rates.
Investment transactions – Investment transactions are accounted for on the trade date. Realized gains and losses on investments sold are determined on a specific identification basis.
Common expenses – Common expenses of the Trust are allocated among the Fund and the other series of the Trust based on the relative net assets of each series, the number of series in the Trust, or the nature of the services performed and the relative applicability to each series.
Distributions to shareholders – Distributions to shareholders arising from net investment income and realized capital gains, if any, are declared and paid annually to shareholders. The amount of distributions from net investment income and net realized capital gains are determined in accordance with federal income tax regulations, which may differ from GAAP. Dividends and distributions to shareholders are recorded on the ex-dividend date.
The tax character of distributions paid during the years ended May 31, 2022 and 2021 was as follows:
| Years | Ordinary | Long-Term | Total | |||||||||
| Ended | Income | Capital Gains | Distributions | |||||||||
| 5/31/2022 | $ | 313,110 | $ | 13,312 | $ | 326,422 | ||||||
| 5/31/2021 | 33,750 | — | 33,750 | |||||||||
Purchased option contracts – The Fund may use option contracts in any manner consistent with its investment objectives and as long as its use is consistent with relevant provisions of the 1940 Act. The Fund may use options for speculative purposes as well as for the purpose of seeking to reduce the overall investment risk that would otherwise be associated with the securities in which the Fund invests. When the Fund purchases a call or put option, an amount equal to the total premium (the premium plus the commission) paid by the Fund is recorded as an asset on the Fund’s Statement of Assets and Liabilities and is subsequently marked-to-market daily. Premiums paid in the purchase of options which expire are treated as realized losses. Premiums paid in the purchase of call options which are exercised increase the cost of the security purchased. Premiums paid in the purchase of put options which are exercised decrease the proceeds used to calculate the realized capital gain or loss on the sale of the security.
Estimates – The preparation of financial statements in conformity with GAAP requires management to make estimates and assumptions that affect the reported amounts of assets and liabilities and disclosure of contingent assets and liabilities as of the date of the financial statements and the reported amounts of increase (decrease) in net assets from operations during the reporting period. Actual results could differ from those estimates.
16
| ADLER VALUE FUND |
| NOTES TO FINANCIAL STATEMENTS (Continued) |
Federal income tax – The Fund has qualified and intends to continue to qualify as a regulated investment company under the Internal Revenue Code of 1986, as amended (the “Code”). Qualification generally will relieve the Fund of liability for federal income taxes to the extent 100% of its net investment income and net realized capital gains are distributed in accordance with the Code.
In order to avoid imposition of the excise tax applicable to regulated investment companies, it is also the Fund’s intention to declare as dividends in each calendar year amounts equal to at least 98% of its net investment income (earned during the calendar year) and 98.2% of its net realized capital gains (earned during the 12 months ended October 31) plus undistributed amounts from prior years.
The following information is computed on a tax basis for each item as of May 31, 2022:
| Tax cost of investments | $ | 3,684,442 | ||
| Gross unrealized appreciation | $ | 762,930 | ||
| Gross unrealized depreciation | (253,745 | ) | ||
| Net unrealized appreciation | 509,185 | |||
| Undistributed long-term gains | 257,372 | |||
| Accumulated capital and other losses | (19,538 | ) | ||
| Distributable earnings | $ | 747,019 |
Net qualified late year ordinary losses represent losses incurred after December 31, 2021. These losses are deemed to arise on the first day of the Fund’s next taxable year. For the year ended May 31, 2022, the Fund qualified late year ordinary losses of $19,538.
During the year ended May 31, 2022, the Fund utilized long-term capital loss carryforwards of $5,621 to offset current year capital gains.
The Fund recognizes the tax benefits or expenses of uncertain tax positions only when the position is “more likely than not” to be sustained assuming examination by tax authorities. Management has reviewed the Fund’s tax positions for the current and all open tax periods (generally, three years) and has concluded that no provision for unrecognized tax benefits or expenses is required in these financial statements. The Fund identifies its major tax jurisdiction as U.S. federal.
3. Investment Transactions
During the year ended May 31, 2022, cost of purchases and proceeds from sales of investment securities, other than short-term investments, were $1,593,037 and $1,602,687, respectively.
4. Transactions with Related Parties
INVESTMENT ADVISORY AGREEMENT
The Fund’s investments are managed by Adler Asset Management, LLC (the “Adviser”) pursuant to the terms of an Investment Advisory Agreement. Under the Investment Advisory Agreement, the Fund pays the Adviser an investment advisory fee, computed and accrued daily and paid monthly, at the annual rate of 1.00% of its average daily net assets.
17
| ADLER VALUE FUND |
| NOTES TO FINANCIAL STATEMENTS (Continued) |
Pursuant to an Expense Limitation Agreement (“ELA”) between the Fund and the Adviser, the Adviser has agreed, until December 1, 2022, to reduce its investment advisory fees and reimburse other expenses to limit total annual operating expenses (exclusive of brokerage costs; taxes; interest; borrowing costs such as interest and dividends expenses on securities sold short; costs to organize the Fund; acquired fund fees and expenses; and extraordinary expenses such as litigation and merger or reorganization costs and other expenses not incurred in the ordinary course of the Fund’s business) to an amount not exceeding 1.25% of the Fund’s average daily net assets of the Institutional Class shares. Accordingly, during the year ended May 31, 2022, the Adviser did not collect any of its investment advisory fees and reimbursed other operating expenses totaling $139,273.
Under the terms of the ELA, investment advisory fee reductions and expense reimbursements by the Adviser are subject to repayment by the Fund for a period of three years after such fees and expenses were incurred, provided that the repayments do not cause the Fund’s total annual operating expenses to exceed the lesser of (i) the expense limitation then in effect, if any, and (ii) the expense limitation in effect at the time the expenses to be repaid were incurred. As of May 31, 2022, the Adviser may seek recoupment of investment advisory fee reductions and expense reimbursements no later than the dates as stated below:
| July 31, 2022 | $ | 27,579 | ||
| May 31, 2023 | 142,930 | |||
| May 31, 2024 | 179,743 | |||
| May 31, 2025 | 180,253 | |||
| Total | $ | 530,505 |
OTHER SERVICE PROVIDERS
Ultimus Fund Solutions, LLC (“Ultimus”) provides administration, fund accounting, compliance and transfer agency services to the Fund. The Fund pays Ultimus fees in accordance with the agreements for such services. In addition, the Fund pays out-of-pocket expenses including, but not limited to, postage, supplies, and certain costs related to the pricing of the Fund’s portfolio securities.
Under the terms of a Distribution Agreement with the Trust, Ultimus Fund Distributors, LLC (the “Distributor”) serves as principal underwriter to the Fund. The Distributor is a wholly-owned subsidiary of Ultimus. The Distributor is compensated by the Adviser (not the Fund) for acting as principal underwriter.
Certain officers and a Trustee of the Trust are also officers of Ultimus and are not paid by the Fund for serving in such capacities.
TRUSTEE COMPENSATION
Effective October 20, 2021, each member of the Board (a “Trustee”) who is not an “interested person” (as defined by the 1940 Act, as amended) of the Trust (“Independent Trustee”) receives a $1,300 annual retainer from the Fund, paid quarterly, except for the Board Chairperson
18
| ADLER VALUE FUND |
| NOTES TO FINANCIAL STATEMENTS (Continued) |
who receives a $1,700 annual retainer from the Fund, paid in quarterly installments. Each Independent Trustee also receives from the Fund a fee of $550 for each Board meeting attended plus reimbursement for travel and other meeting-related expenses. Prior to October 19, 2021, each Independent Trustee received a $1,300 annual retainer from the Fund, paid quarterly, except for the Board Chairperson who received a $1,500 annual retainer from the Fund, paid in quarterly installments. Each Independent Trustee also received from the Fund a fee of $500 for each Board meeting attended plus reimbursement for travel and other meeting-related expenses.
PRINCIPAL HOLDER OF FUND SHARES
As of May 31, 2022, the following shareholder owned of record 25% or more of the outstanding shares of the Fund:
| NAME OF RECORD OWNER | % Ownership |
| David R. Adler | 61% |
A beneficial owner of 25% or more of the Fund’s outstanding shares may be considered a controlling person. That shareholder’s vote could have a more significant effect on matters presented at a shareholders’ meeting.
5. Derivative Transactions
The location on the Statement of Assets and Liabilities of the derivative positions of the Fund are as follows:
| Average | ||||||||||||||||
| Fair Value | Monthly | |||||||||||||||
| Notional Value | ||||||||||||||||
| During the | ||||||||||||||||
| Type of | Asset | Liability | Year Ended | |||||||||||||
| Derivative | Risk | Location | Derivatives | Derivatives | May 31, 2022* | |||||||||||
| Equity call options purchased | Equity | Investments in securities at value | $ | 213,561 | $ | — | $ | 1,463,544 | ||||||||
| * | The average monthly notional value generally represents the Fund’s derivative activity throughout the year. |
19
| ADLER VALUE FUND |
| NOTES TO FINANCIAL STATEMENTS (Continued) |
Realized and unrealized gains and losses associated with transactions in derivative instruments for the Fund during the year ended May 31, 2022 are recorded in the following locations on the Statement of Operations:
| Change in | ||||||||||||||
| Unrealized | ||||||||||||||
| Type of | Realized | Appreciation | ||||||||||||
| Derivative | Risk | Location | Losses | Location | (Depreciation) | |||||||||
| Equity call options purchased | Equity | Net realized gains on investment transactions | $ | (94,154 | ) | Net change in unrealized appreciation (depreciation) on investments | $ | 10,195 | ||||||
6. Contingencies and Commitments
The Fund indemnifies the Trust’s officers and Trustees for certain liabilities that might arise from their performance of their duties to the Fund. Additionally, in the normal course of business, the Fund enters into contracts that contain a variety of representations, warranties, and general indemnifications. The Fund’s maximum exposure under these arrangements is unknown, as this would involve future claims that may be made against the Fund that have not yet occurred. However, based on experience, the Fund expects the risk of loss to be remote.
7. Subsequent Events
The Fund is required to recognize in the financial statements the effects of all subsequent events that provide additional evidence about conditions that existed as of the date of the Statement of Assets and Liabilities. For non-recognized subsequent events that must be disclosed to keep the financial statements from being misleading, the Fund is required to disclose the nature of the event as well as an estimate of its financial effect, or a statement that such an estimate cannot be made. Management has evaluated subsequent events through the issuance of these financial statements and has noted no such events.
20
| ADLER VALUE FUND |
| REPORT OF INDEPENDENT REGISTERED |
| PUBLIC ACCOUNTING FIRM |
To the Board of Trustees of Ultimus Managers Trust
and the Shareholders of Adler Value Fund
Opinion on the Financial Statements
We have audited the accompanying statement of assets and liabilities of Adler Value Fund, a series of shares of beneficial interest in Ultimus Managers Trust (the “Fund”), including the schedule of investments, as of May 31, 2022, and the related statement of operations for the year then ended, the statements of changes in net assets for each of the years in the two-year period then ended and the financial highlights as noted in the table below , and the related notes (collectively referred to as the “financial statements”). In our opinion, the financial statements present fairly, in all material respects, the financial position of the Fund as of May 31, 2022, and the results of its operations for the year then ended, the changes in its net assets for each of the years in the two-year period then ended and its financial highlights as presented in the table below, in conformity with accounting principles generally accepted in the United States of America.
| Fund | Financial Highlights Presented |
| Adler Value Fund | The financial highlights for each of the years in the two-year period May 31, 2022, the period from August 1, 2019 through May 31, 2020, and the period from August 16, 2018 (commencement of operations) to July 31, 2019 |
Basis for Opinion
These financial statements are the responsibility of the Fund’s management. Our responsibility is to express an opinion on the Fund’s financial statements based on our audits. We are a public accounting firm registered with the Public Company Accounting Oversight Board (United States) (“PCAOB”) and are required to be independent with respect to the Fund in accordance with the U.S. federal securities law and the applicable rules and regulations of the Securities and Exchange Commission and the PCAOB.
We conducted our audits in accordance with the standards of the PCAOB. Those standards require that we plan and perform the audits to obtain reasonable assurance about whether the financial statements are free of material misstatement, whether due to error or fraud. The Fund is not required to have, nor were we engaged to perform, an audit of its internal control over financial reporting. As part of our audits we are required to obtain an understanding of internal control over financial reporting but not for the purpose of expressing an opinion on the effectiveness of the Fund’s internal control over financial reporting. Accordingly, we express no such opinion.
Our audits included performing procedures to assess the risk of material misstatement of the financial statements, whether due to error or fraud, and performing procedures that respond to those risks. Such procedures included examining, on a test basis, evidence regarding the
21
| ADLER VALUE FUND |
| REPORT OF INDEPENDENT REGISTERED |
| PUBLIC ACCOUNTING FIRM (Continued) |
amounts and disclosures in the financial statements. Our procedures included confirmation of securities owned as of May 31, 2022 by correspondence with the custodian and broker. Our audits also included evaluating the accounting principles used and significant estimates made by management, as well as evaluating the overall presentation of the financial statements. We believe that our audits provide a reasonable basis for our opinion.

BBD, LLP
We have served as the auditor of one or more of the Funds in the Ultimus Managers Trust since 2013.
Philadelphia, Pennsylvania
July 20, 2022
22
| ADLER VALUE FUND |
| ABOUT YOUR FUND’S EXPENSES (Unaudited) |
We believe it is important for you to understand the impact of costs on your investment. As a shareholder of the Fund, you incur ongoing costs, including management fees and other operating expenses. The following examples are intended to help you understand your ongoing costs (in dollars) of investing in the Fund and to compare these costs with the ongoing costs of investing in other mutual funds.
A mutual fund’s ongoing costs are expressed as a percentage of its average net assets. This figure is known as the expense ratio. The expenses in the table below are based on an investment of $1,000 made at the beginning of the most recent period December 1, 2021) and held until the end of the period (May 31, 2022).
The table below illustrates the Fund’s ongoing costs in two ways:
Actual fund return – This section helps you to estimate the actual expenses that you paid over the period. The “Ending Account Value” shown is derived from the Fund’s actual return, and the fourth column shows the dollar amount of operating expenses that would have been paid by an investor who started with $1,000 in the Fund. You may use the information here, together with the amount you invested, to estimate the expenses that you paid over the period.
To do so, simply divide your account value by $1,000 (for example, an $8,600 account value divided by $1,000 = 8.6), then multiply the result by the number given for the Fund under the heading “Expenses Paid During Period.”
Hypothetical 5% return – This section is intended to help you compare the Fund’s ongoing costs with those of other mutual funds. It assumes that the Fund had an annual return of 5% before expenses during the period shown, but that the expense ratio is unchanged. In this case, because the return used is not the Fund’s actual return, the results do not apply to your investment. The example is useful in making comparisons because the SEC requires all mutual funds to calculate expenses based on a 5% return. You can assess the Fund’s ongoing costs by comparing this hypothetical example with the hypothetical examples that appear in shareholder reports of other funds.
Note that expenses shown in the table are meant to highlight and help you compare ongoing costs only. The Fund does not charge sales loads.
The calculations assume no shares were bought or sold during the period. Your actual costs may have been higher or lower, depending on the amount of your investment and the timing of any purchases or redemptions.
23
| ADLER VALUE FUND |
| ABOUT YOUR FUND’S EXPENSES (Unaudited) (Continued) |
More information about the Fund’s expenses can be found in this report. For additional information on operating expenses and other shareholder costs, please refer to the Fund’s prospectus.
| Beginning | Ending | |||
| Account Value | Account Value | Expenses | ||
| December 1, | May 31, | Net Expense | Paid During | |
| Institutional Class | 2021 | 2022 | Ratio(a) | Period(b) |
| Based on Actual Fund Return | $1,000.00 | $1,013.80 | 1.25% | $6.28 |
| Based on Hypothetical 5% Return (before expenses) | $1,000.00 | $1,018.70 | 1.25% | $6.29 |
| (a) | Annualized, based on the Fund’s most recent one-half year expenses. |
| (b) | Expenses are equal to the Fund’s annualized net expense ratio multiplied by the average account value over the period, multiplied by 182/365 (to reflect the one-half year period). |
24
| ADLER VALUE FUND |
| OTHER INFORMATION (Unaudited) |
A description of the policies and procedures that the Fund uses to vote proxies relating to portfolio securities is available without charge upon request by calling 1-800-408-4682, or on the SEC’s website at www.sec.gov. Information regarding how the Fund voted proxies relating to portfolio securities during the most recent 12-month period ended June 30, 2022 is also available without charge upon request by calling 1-800-408-4682, or on the SEC’s website at www.sec.gov.
The Trust files a complete listing of portfolio holdings for the Fund with the SEC as of the end of the first and third quarters of each fiscal year as an exhibit to its reports on Form N-PORT. These filings are available upon request by calling 1-800-408-4682. Furthermore, you may obtain a copy of the filings on the SEC’s website at www.sec.gov and the Fund’s website at www.adlervaluefund.com.
25
| ADLER VALUE FUND |
| BOARD OF TRUSTEES AND EXECUTIVE OFFICERS |
| (Unaudited) |
The Board has overall responsibility for management of the Trust’s affairs. The Trustees serve during the lifetime of the Trust and until its termination, or until death, resignation, retirement, or removal. The Trustees, in turn, elect the officers of the Fund to actively supervise their day-to-day operations. The officers have been elected for an annual term. Each Trustee’s and officer’s address is 225 Pictoria Drive, Suite 450, Cincinnati, Ohio 45246. The following are the Trustees and executive officers of the Fund:
| Name and Year of Birth | Length of Time Served | Position(s) Held with Trust | Principal Occupation(s) During Past 5 Years | Number in Trust | Directorships of Public Companies Held by Trustee During Past 5 Years |
| Interested Trustees: | |||||
| David R. Carson* Year of Birth: 1958 | Trustee Since 2021
Officer Since 2013 | Trustee (2021 to present)
Vice President (2021 to present; and previously April 2013 to October 2013)
President and Principal Executive Officer of each of its series (2013 to 2021) | Vice President and Director of Client Strategies of Ultimus Fund Solutions, LLC (2013 to present); President of Unified Series Trust (2017 to present). | 26 | Interested Trustee of 21 series of the Unified Series Trust (a registered management company) (2020 to present). |
| Independent Trustees: | |||||
| Janine L. Cohen Year of Birth: 1952 | Since 2016 | Chairperson (2019 to present)
Trustee (2016 to present) | Retired since 2013; previously Chief Financial Officer from 2004 to 2013 and Chief Compliance Officer from 2008 to 2013 at AER Advisors, Inc. | 26 | none |
26
| ADLER VALUE FUND |
| BOARD OF TRUSTEES AND EXECUTIVE OFFICERS |
| (Unaudited) (Continued) |
| Name and Year of Birth | Length of Time Served | Position(s) Held with Trust | Principal Occupation(s) During Past 5 Years | Number of Funds in Trust Overseen by Trustee | Directorships of Public Companies Held by Trustee During Past 5 Years |
| Independent Trustees (Continued): | |||||
| David M. Deptula Year of Birth: 1958 | Since 2012 | Trustee | Vice President of Legal and Special Projects at Dayton Freight Lines, Inc. since February 2016 | 26 | none |
| Jacqueline A. Williams Year of Birth: 1954 | Since 2019 | Trustee | Managing Member of Custom Strategy Consulting, LLC (2017 to present); Managing Director of Global Investment Research (2005 to 2017), Cambridge Associates, LLC. | 26 | none |
| Clifford N. Schireson Year of Birth: 1953 | Since 2019 | Trustee | Retired; Founder of Schireson Consulting, LLC (2017 to present); Director of Institutional Services for Brandes Investment Partners, LP (2004-2017). | 26 | Trustee of the San Diego City Employees’ Retirement System (2019 to present). |
| Robert E. Morrison Year of Birth: 1957 | Since 2019 | Trustee | Managing Director, Midwest Trust and FCI Advisors (2022 to present); Senior Vice President and National Practice Lead for Investment, Huntington National Bank/ Huntington Private Bank (2014 to 2022); CEO, CIO, President of 5 Star Investment Management Company (2006 to 2014). | 26 | none |
| * | Mr. Carson is considered an “interested person” of the Trust within the meaning of Section 2(a)(19) of the 1940 Act because of his relationship with the Trust’s administrator, transfer agent, and distributor. Mr. Carson was President of the Trust from October 2013 to January 2021 and Vice President of the Trust from April 2013 to October 2013. |
27
| ADLER VALUE FUND |
| BOARD OF TRUSTEES AND EXECUTIVE OFFICERS |
| (Unaudited) (Continued) |
| Name and Year of Birth | Length of Time Served | Position(s) Held with Trust | Principal Occupation(s) During Past 5 Years |
| Executive Officers: | |||
| Todd E. Heim Year of Birth: 1967 | Since 2014 | President (2021 to present)
Vice President (2014 to 2021) | Vice President, Relationship Management (2018 to present) and Assistant Vice President, Client Implementation Manager of Ultimus Fund Solutions, LLC (2014 to 2018); Naval Flight Officer in United States Navy (1989 to 2017). |
| Jennifer L. Leamer Year of Birth: 1976 | Since 2014 | Treasurer (2014 to present)
Assistant Treasurer (April 2014 to October 2014) | Senior Vice President, Fund Accounting of Ultimus Fund Solutions, LLC (2014 to present). |
| Daniel D. Bauer Year of Birth: 1977 | Since 2016 | Assistant Treasurer (2016 to present) | Vice President, Fund Accounting (2022 to present) and Assistant Vice President, Fund Accounting of Ultimus Fund Solutions, LLC (2015 to 2022). |
| Angela A. Simmons Year of Birth: 1975 | Since 2022 | Assistant Treasurer (2022 to present) | Vice President, Financial Administration (2022 to present) and Assistant Vice President, Financial Administration (2015 to 2022) of Ultimus Fund Solutions, LLC. |
| Khimmara Greer Year of Birth: 1983 | Since 2021 | Secretary (2021 to present) | Vice President and Senior Legal Counsel of Ultimus Fund Solutions, LLC (2021 to present); Vice President, Asset Servicing – Regulatory Administration of The Bank of New York Mellon (2019 to 2021); Vice President and Counsel of State Street Bank and Trust Company (2015 to 2019). |
| David K. James Year of Birth: 1970 | Since 2021 | Assistant Secretary (2021 to present)
Secretary (2021 to 2021) | Executive Vice President and Chief Legal and Risk Officer of Ultimus Fund Solutions, LLC (2018 to present); Managing Director and Managing Counsel of State Street Bank and Trust Company (2009 to 2018). |
| Natalie S. Anderson Year of Birth: 1975 | Since 2016 | Assistant Secretary (2016 to present) | Legal Administration Manager (July 2016 to present) and Paralegal (January 2015 to June 2016) of Ultimus Fund Solutions, LLC. |
28
| ADLER VALUE FUND |
| BOARD OF TRUSTEES AND EXECUTIVE OFFICERS |
| (Unaudited) (Continued) |
| Name and Year of Birth | Length of Time | Position(s) Held with Trust | Principal Occupation(s) During Past 5 Years |
| Executive Officers (Continued): | |||
| Gweneth Gosselink Year of Birth: 1955 | Since 2020 | Chief Compliance Officer (2020 to present) | Assistant Vice President, Senior Compliance Officer of Ultimus Fund Solutions, LLC (December 2019 to present); CCO Consultant at GKG Consulting, LLC (December 2019 to present); Chief Operating Officer & CCO at Miles Capital, Inc. (June 2013 to December 2019). |
| Martin Dean Year of Birth: 1963 | Since 2019 | Assistant Chief Compliance Officer (2020 to present)
Interim Chief Compliance Officer (October 2019 to January 2020)
Assistant Chief Compliance Officer (2016 to 2017) | Senior Vice President, Head of Fund Compliance (February 2020 to present); Vice President & Director of Fund Compliance of Ultimus Fund Solutions, LLC (January 2016 to January 2020). |
Additional information about members of the Board and executive officers is available in the Fund’s Statement of Additional Information (“SAI”). To obtain a free copy of the SAI, please call toll free 1-800-408-4682.
29
| ADLER VALUE FUND |
| DISCLOSURE REGARDING APPROVAL OF INVESTMENT ADVISORY AGREEMENT |
| (Unaudited) |
The Board of Trustees (the “Board”), including the Independent Trustees voting separately, has reviewed and approved the continuance of the Fund’s Investment Advisory Agreement with Adler Asset Management, LLC (the “Adviser” or “Adler”) for an additional one-year term (the “Advisory Agreement”). The Board approved the continuance of the Advisory Agreement at a meeting held on January 18 and 19, 2022, at which all of the Trustees were present.
In deciding on whether to approve the continuation of the Advisory Agreement, the Board recalled its review of the materials related to the Fund and Adler at the meeting and throughout the preceding twelve months and its numerous discussions with Trust Management and Adler about the operations and performance of the Fund during that period. The Board further considered those materials and discussions and other numerous factors, including the following:
The nature, extent, and quality of the services provided by the Adviser. In this regard, the Board reviewed the services being provided by Adler to the Fund including, without limitation, its providing a continuous investment program for the Fund, adhering to the Fund’s investment restrictions, complying with the Trust’s policies and procedures and voting proxies on behalf of the Fund. The Board considered the qualifications and experience of Adler’s portfolio manager who is responsible for the day-to day management of the Fund’s portfolio. The Board concluded that the quality, extent, and nature of the services provided by Adler to the Fund were satisfactory.
The investment performance of the Fund. In this regard, the Board compared the performance of the Fund with the performance of its benchmark index, the custom peer group and Morningstar category. The Board concluded that the investment performance of the Fund has been satisfactory.
The costs of the services provided and profits realized by the Adviser and its affiliates from its relationship with the Fund. In this regard, the Board considered the Fund’s management fee proposed to be charged to the Fund and the Fund’s expense ratio, each as compared to the Fund’s peer group. The Board considered the revenue earned from the Fund and the current and anticipated profitability of the Fund to Adler, if any. The Board also considered Adler’s past fee reductions and expense reimbursements for the Fund and the indirect benefits that Adler received from its management of the Fund. The Board concluded that the advisory fee to be paid to Adler by the Fund is reasonable in light of the nature and quality of services provided by Adler.
The extent to which economies of scale would be realized as the Fund grows and whether advisory fee levels reflect these economies of scale for the benefit of the Fund’s investors. In this regard, the Board considered that the Fund’s fee arrangements with Adler involve both the advisory fee and an expense limitation agreement (the “ELA”). The Board determined that while the advisory fee rate remained the same as asset levels increased, the shareholders of the Fund
30
| ADLER VALUE FUND |
| DISCLOSURE REGARDING APPROVAL OF INVESTMENT ADVISORY AGREEMENT |
| (Unaudited) (Continued) |
have experienced benefits from the ELA and will continue to experience benefits from the ELA. The Board concluded that the advisory fee was reasonable in light of the information that was provided to the Trustees by Adler with respect to economies of scale.
After further discussion of the factors noted above and in reliance on the information provided by Adler and Trust Management, and taking into account the totality of all the factors discussed and information presented at the meeting and previous meetings, the Board indicated its agreement to approve the continuance of the Advisory Agreement. It was noted that in the Trustees’ deliberations regarding the approval of renewal the Advisory Agreement, the Trustees did not identify any particular information or factor that was all-important or controlling, and that each individual Trustee may have attributed different weights to the various factors listed above. After full consideration of the above factors as well as other factors, the Board unanimously concluded that approval of the continuance of the Advisory Agreement was in the best interests of the Fund and its shareholders.
31
This page intentionally left blank.
ADLER-AR-22

EVOLUTIONARY TREE INNOVATORS FUND
I Class Shares (INVNX)
A Class Shares (INVTX)
Annual Report
May 31, 2022
| EVOLUTIONARY TREE INNOVATORS FUND | |
| LETTER TO SHAREHOLDERS (Unaudited) | JUNE 17, 2022 |
Dear Fellow Shareholders,
We know it has been a volatile period in the markets during the first two quarters of 2022 and over the past year, particularly for growth and innovation-focused strategies. Given this environment, we felt it was important to provide our perspective on the drivers of this volatility and share why we have confidence in the portfolio and investing in quality innovative businesses.
For newer investors to the Evolutionary Tree Innovators Fund, we provide below a brief overview of our investment approach and why we focus on long-term drivers such as innovation versus trying to predict or side-step movements in the market or economy. For investors that are more familiar with our innovation-focused strategy, please jump to the sections on our perspective on the current environment and why we believe the underlying companies owned in the Fund are well positioned, as a group, to drive sustainable growth.
How Our Approach Enables Investors to Access Leading and Quality Innovative Businesses
The Evolutionary Tree Innovators Fund was launched to provide an attractive pathway for investing in important innovations and secular trends, or evolutionary shifts as we call them. The Fund and its adviser apply an innovation and evolution-focused framework to investing. We believe the development of innovation and its resultant pattern of evolutionary change is the primary engine of growth for companies, industries, and the economy—and, in turn, is the underlying driver of long-term wealth creation. While investors are currently focused on near-term macro drivers, such as the Fed, inflation, and the war in Ukraine, we believe innovation can still drive growth for leading innovators and remains critically important for long-term investors.
The Fund seeks to identify important innovations that are driving secular growth and evolutionary shifts for companies, industries, and the economy, and own the leading innovators at the forefront. The Fund defines an evolutionary shift as when an industry shifts from an old generation (of a product, service, or business model) over to a “next generation” or new offering that provides advantages versus the “old way” of doing things. The Fund invests in a focused portfolio of 25-35 quality innovative businesses.
Examples of innovations that we believe contribute to sustainable growth include technological innovation, product innovation, service or experience innovation, process or cost innovation, and/or business model innovation. In addition to contributing to sustaining growth for leading innovative businesses, new innovations may also enable innovators to take market share, create competitive advantage, and/or enhance profitability over time. Innovation is the root cause of value creation.
Perspective on Drivers of the Current Difficult Economic and Geopolitical Environment The current environment is highly unusual in that we have faced a succession of three different headwinds, which have created multiple storms affecting the markets and Fund performance. The first headwind was the Federal Reserve (“the Fed”) communicating a
1
tightening cycle of raising rates in November of 2021 in response to higher inflation. We certainly acknowledge the heightened inflation coming out of COVID as the economy has reopened and supply has not kept up with greater demand across sectors. However, a key driver of inflation is the labor shortage, and it is important to note that technology is a key solution to this issue, as it can raise worker productivity. Many of the companies in our portfolio, especially our enterprise software companies, are providing solutions to this issue and seeing strong demand as a result. A significant portion of the portfolio represents companies offering technology to improve labor productivity. We also believe that the Fed’s rate increases, which will slow the economy, coupled with supply chain improvement, will gradually ease inflation over time. Signs of that happening may stabilize the markets, though this may take some time.
The second headwind is that many digital companies that saw accelerated growth during COVID are now experiencing “tougher comparisons” with last year’s elevated results, leading to temporary deceleration in growth. We believe this is a short-term phenomenon and will ease as we move through the year, as comparisons get much easier in the second half of 2022.
Lastly, the third headwind was Putin’s War in Ukraine, which led to another leg down in the markets with substantial risk-off behavior by investors as they processed the risk of a possible wider war in Europe and even threats of nuclear war. These fears led to indiscriminate selling across the equity markets. We believe as the war likely stays limited to Ukraine, investors will lessen their focus on this headwind and re-focus on fundamentals. It is important to note that the portfolio’s exposure to Russia/Ukraine is quite low, with the typical company deriving 0-3% of revenues from these two countries. The bottom line is that this risk-off dynamic in the markets has driven valuations to attractive levels, in our opinion. Lastly, given our focus on companies with strong financial positions, their growth can typically be internally funded through their existing cash balance and free cash flow generation.
Despite these three headwinds, the underlying businesses are demonstrating solid business fundamentals, with 30-35% revenue growth and generally stable-to-improving operating margins, on a weighted-average basis over the past quarter and calendar year for the portfolio. With the pullback in prices relative to continued growth for portfolio companies, there is a growing disconnect between the underlying business results and the valuations of portfolio companies. While the timing is unknown, we believe strong business results will eventually be rewarded by the market.
Perspective on the Bear Market and Fund Performance
We are witnessing growth, technology, and innovation stocks experiencing a deep bear market (with Class I experiencing a decline of 46.09% for the fiscal year ended 5/31/22 versus the broader S&P 500 Index return of -0.30%). While the broader indexes are now down around 15-25% year to date through the end of May, there is much greater and broader pain below the surface, revealing a severe bear market for the average growth stock. In fact, through May 31st about 50% of the Russell 1000 Growth constituents (of 498 stocks in the index) are down 30% or more from 52-week highs, 41% are down 35% or more, and 34% are down 40% or more. What is insulating the broader indexes is a
2
handful of megacap companies that now comprise 25-40% of the benchmarks, and these stocks have generally held up better than the average stock, though even these companies (so-called FAANG stocks) are now under pressure. We were not immune to this backdrop.
The Fund also generally owns faster-growing companies and has flexibility to own mid-caps and even small-caps, which positions it further down the industry S-curve, a goal of the Fund to access innovators earlier in their lifecycle. However, in the current market environment, where investors are shunning fast-growing companies and ones that are earlier in their profit cycle, the Fund has been negatively impacted performance-wise. We believe as investors eventually look beyond macro headwinds, particularly if inflation starts to ease (which we acknowledge may take some time), investors may re-embrace faster-growing innovative companies, which may lead to improved performance over time. We believe we own a collection of high-quality innovative companies, ones that meet our stringent criteria that includes companies with competitive advantages, strong management teams, and robust balance sheets. We actively avoid “hype” and “concept stocks” and believe that the current market has “thrown babies out with the bathwater”.
Quality Innovators: Resilient Fundamentals in the Face of Inflation
In our view, there are two important, but distinct, effects on the portfolio resulting from rising inflation and interest rates: 1) the impact to the fundamentals of the underlying businesses, and 2) the impact on the valuations investors are willing to pay for future cash flows. We will touch briefly on each.
As it relates to business fundamentals, we believe our portfolio companies are, on average, relatively more insulated from inflationary pressure given our focus on owning leading innovators in attractive industries with competitive advantages, which for many holdings provides them with pricing power.
Essential products and services, ones that are mission critical, are least likely to be cut if budgets get squeezed, while non-essential products and services are often the most impacted. Asset-light digital offerings, like many of our Internet and software businesses, are also less impacted by rising commodity prices and input costs, which is not the case for traditional product or durable goods companies. Additionally, highly innovative companies with unique and valuable products usually have pricing power and can pass some or all of the rising costs on to customers. For example, both HubSpot and ServiceNow, software-as-a-service leaders in marketing automation and service engagement platforms, respectively, are successfully moving their client base to higher priced tiers as they add more features to their platforms. Lastly, companies where there are few substitutes or alternatives, such as life-saving biotech treatments, are more protected than companies in competitive markets where customers may shift to lower-cost alternatives.
The second impact referenced above is the effect on stock valuations investors are willing to pay for future cash flows. As rates rise, so does the discount rate in financial models, which can reduce valuations. Since the Fed started signaling the need to increase interest rates in November 2021, the 10-Year Treasury rate has moved from 1.4% to 3.3%. In response, many innovative growth stocks are now down 30% to 70%+ from their highs. We think this suggests future interest rate hikes may have largely already been discounted by the market, if not overshooting on the downside relative to their fundamentals.
3
Historically, growth stocks tend to underperform once the Fed signals the need to increase rates. However, growth stocks can perform reasonably well during the period of rising rates. This is a classic example of the market discounting the news before the rate hikes take place. In the current environment, we believe it’s likely that most of the pullback from rising rates may already be priced in by the market.
Technology: A Solution to the Labor Shortage Issue By Improving Productivity For Businesses
The recent pullback in technology stocks has led some investors to surmise that growth at these companies has slowed dramatically or that many have experienced significant business issues. Worried about the impact of inflation on the economy and tech stock valuations, many investors have sold growth and tech stocks. Although we certainly acknowledge rising inflation, spurred on by a combination of reopening economies, labor shortages, and supply chain issues, we view technology as a solution in this challenging environment.
The investment ramifications for technology stocks during the current labor crisis are potentially profound. Specific technology companies, including those in enterprise software, are seeing sustained demand as companies of all sizes use technology platforms and solutions to make up for fewer workers by relying on improving productivity of existing workers. This is the role of technology, a role that is more (not less) relevant as today’s global economy experiences a shortage of workers. Furthermore, as companies feel pressure on their margins from rising input costs, they will search for ways to gain greater efficiencies. We believe that technology is the solution to driving both worker productivity and cost efficiencies.
The 2020s are Not 1999: The Cloud Era Is Different Than The Dotcom Era
In the current market environment, what has become a true bear market for growth and technology stocks, there seems to be an assumption that this era, what we call the Cloud Era, is similar to the Dotcom Era. We share the following viewpoints:
| 1. | The Cloud Era is built on more solid ground than investor perceptions versus past eras. |
| 2. | The quality of current software businesses is actually quite healthy and on a strong path of profitability, a point that seems to be overlooked by many investors that assume a similar outcome as the dotcom bust. |
| 3. | Software valuations have potentially corrected to attractive levels. |
Let’s touch briefly on each of these observations.
We believe the 2020s are not 1999 all over again, as the Cloud Era is built on solid ground. During the Dotcom period, the underlying infrastructure was primitive and immature, with slow dial-up access, no supporting public cloud infrastructure. This in turn led to non-scalable business models and weak fundamentals. Thus, valuations for these first-generation businesses were built on sand, and 99% of them went bust. By contrast, the current Cloud Era is built on significantly more robust and reliable infrastructure (such as broadband, 5G wireless, multiple scaled public clouds, electronic payments, logistics,
4
etc). This, in turn, leads to companies with better business models, ones that both sustain above-average top-line growth and have a clear path to profitability as they scale up over time.
Want evidence? Using data analyzed by William Blair (from The State of Software: Historical Valuation Context” on May 18, 2022) on a basket of faster-growing software companies, one can see that the underlying business fundamentals for these software companies is healthy. From 2019 (pre-pandemic period) through 2021, the median fast-growth software company has more than doubled its revenues (scaling up), maintained strong growth (sustainable growth), and expanded operating margins by 600 bps (demonstrating a path to improving profitability). This is what we mean by “the Cloud Era is built on solid ground.”
Lastly, with the dramatic pullback in software stocks over the past 6-7 months since late 2021, valuations have now adjusted down to attractive levels, in our opinion. We base this on two points. First, the median Enterprise Value/Forward-Revenue multiple, at around 6X, is now 20-25% below previous lows (seen in March 2020 COVID low and in December 2018). This is despite the sustained growth in revenues and expanding margins for many leading software companies.
Second, there is a compelling case that software companies, particularly software-as-a-service/cloud companies are on stronger footing post-pandemic, given that companies are now adopting a “cloud-first” approach to their applications and leaning into digital transformation. These software applications are also a primary way for companies to deal with the staffing shortage, by improving productivity and gaining efficiencies. Taken together—adopting a cloud-first approach, improving productivity, and driving cost efficiencies—these drivers provide a healthy demand environment for software companies.
Concluding Thoughts
With portfolio companies continuing to sustain above-average growth, in aggregate, and now at depressed valuations in our opinion, we believe the portfolio can navigate through this period of inflation and add value over time. Innovative businesses typically can create their own weather and sustain growth by launching new products and services, and if they are truly innovative, show pricing power to potentially offset the impact of inflation. We are going to be patient and ride through these temporary storms, stay focused on our core investment strategy, and continue ownership of quality innovative businesses.
Thank you for your continued interest in, and support of, the Evolutionary Tree Innovators Fund.
5
Past performance is not predictive of future performance. Investment results and principal value will fluctuate so that shares, when redeemed, may be worth more or less than their original cost. Current performance may be higher or lower than the performance data quoted. Performance data current to the most recent month-end are available by calling 1-833-517-1010.
An investor should consider the investment objectives, risks, charges and expenses of the Fund carefully before investing. The Fund’s prospectus contains this and other important information. To obtain a copy of the Fund’s prospectus please visit the Fund’s website at mutualfund.evolutionarytree.com or call 1-833-517-1010 and a copy will be sent to you free of charge. Please read the prospectus carefully before you invest. The Fund is distributed by Ultimus Fund Distributors, LLC.
The Letter to Shareholders seeks to describe some of the Adviser’s current opinions and views of the financial markets. Although the Adviser believes it has a reasonable basis for any opinions or views expressed, actual results may differ, sometimes significantly so, from those expected or expressed. The securities held by the Fund that are discussed in the Letter to Shareholders were held during the period covered by this Report. They do not comprise the entire investment portfolio of the Fund, may be sold at any time, and may no longer be held by the Fund. For a complete list of securities held by the Fund as of May 31, 2022, please see the Schedule of Investments section of the annual report. The opinions of the Fund’s adviser with respect to those securities may change at any time.
Statements in the Letter to Shareholders that reflect projections or expectations for future financial or economic performance of the Fund and the market in general and statements of the Fund’s plans and objectives for future operations are forward-looking statements. No assurance can be given that actual results or events will not differ materially from those projected, estimated, assumed, or anticipated in any such forward-looking statements. Important factors that could result in such differences, in addition to factors noted with such forward-looking statements, include, without limitation, general economic conditions, such as inflation, recession, and interest rates. Past performance is not a guarantee of future results.
6
| EVOLUTIONARY TREE INNOVATORS FUND |
| PERFORMANCE INFORMATION |
| May 31, 2022 (Unaudited) |
Comparison of the Change in Value of a $50,000 Investment in
Evolutionary Tree Innovators Fund - I Class Shares(a) versus the S&P 500 Index
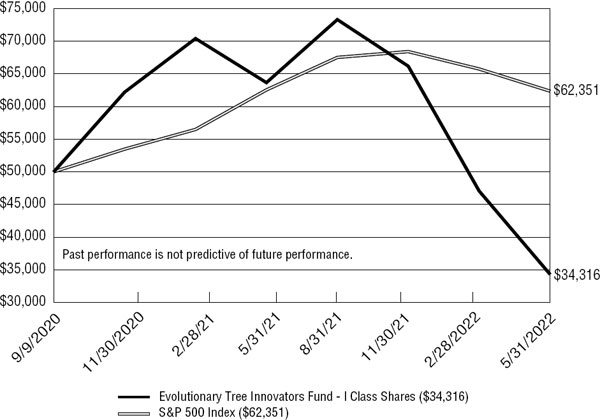
| Average Annual Total Returns (for the periods ended May 31, 2022) | ||||
| Since | ||||
| 1 Year | Inception (b) | |||
| Evolutionary Tree Innovators Fund - I Class Shares (c) | (46.09%) | (19.62%) | ||
| Evolutionary Tree Innovators Fund - A Class Shares (without load) (c) | N/A | (27.15%) | ||
| Evolutionary Tree Innovators Fund - A Class Shares (c)(d) | N/A | (31.32%) | ||
| S&P 500 Index (e) | (0.30%) | 13.67% | ||
| (a) | The line graph above represents performance of the I Class Share only, which will vary from the performance of the A Class Shares based on the differences in fees paid by shareholders in the different classes. |
| (b) | The Fund’s total returns do not reflect the deduction of taxes a shareholder would pay on Fund distributions or the redemption of Fund shares. |
| (c) | Commencement of operations for I Class Shares was September 9, 2020. Commencement of operations for A Class Shares was February 28, 2022. |
| (d) | The total return figure shown reflects the maximum sales charge applicable to A Class Shares for the Fund. A Class Shares have a maximum sales charge on purchases of 5.75%. |
| (e) | The S&P 500 Index is a market capitalization weighted index of 500 of large companies that is widely used as a barometer of U.S. stock market performance. The Index is unmanaged and shown for illustration purposes only. An investor cannot invest in an index and its returns are not indicative of the performance of any specific investment. |
7
| EVOLUTIONARY TREE INNOVATORS FUND |
| PORTFOLIO INFORMATION |
| May 31, 2022 (Unaudited) |
Sector Diversification (% of Net Assets)
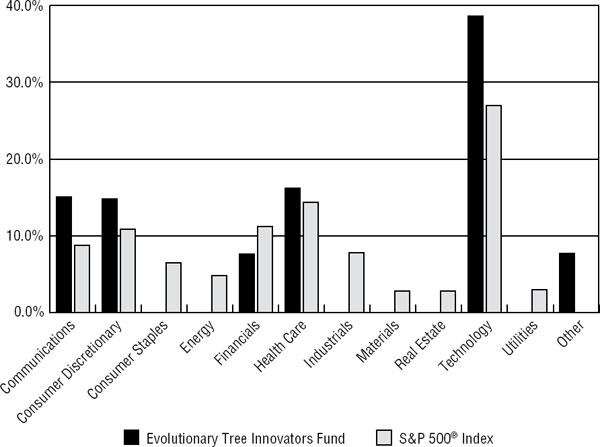
Top 10 Equity Holdings
| % of | |
| Security Description | Net Assets |
| Alphabet, Inc. - Class A | 8.9% |
| Amazon.com, Inc. | 8.0% |
| HubSpot, Inc. | 6.9% |
| ServiceNow, Inc. | 6.8% |
| Microsoft Corporation | 6.5% |
| nCino, Inc. | 5.2% |
| Charles Schwab Corporation (The) | 3.5% |
| Airbnb, Inc. - Class A | 3.5% |
| Bumble, Inc. - Class A | 3.4% |
| Sea Ltd. - ADR | 3.3% |
8
| EVOLUTIONARY TREE INNOVATORS FUND |
| SCHEDULE OF INVESTMENTS |
| May 31, 2022 |
| COMMON STOCKS — 92.3% | Shares | Value | ||||||
| Communications — 15.1% | ||||||||
| Communication Services — 6.2% | ||||||||
| Bumble, Inc. - Class A (a) | 13,580 | $ | 387,030 | |||||
| Nextdoor Holdings, Inc. (a) | 56,970 | 161,795 | ||||||
| Twilio, Inc. - Class A (a) | 1,592 | 167,431 | ||||||
| 716,256 | ||||||||
| Digital Media — 8.9% | ||||||||
| Alphabet, Inc. - Class A (a) | 447 | 1,017,032 | ||||||
| Consumer Discretionary — 14.8% | ||||||||
| Consumer Leisure — 3.5% | ||||||||
| Airbnb, Inc. - Class A (a) | 3,320 | 401,289 | ||||||
| E-Commerce — 11.3% | ||||||||
| Amazon.com, Inc. (a) | 383 | 920,805 | ||||||
| Sea Ltd. - ADR (a) | 4,563 | 377,177 | ||||||
| 1,297,982 | ||||||||
| Financials — 7.6% | ||||||||
| Financial Services — 7.6% | ||||||||
| Block, Inc. - Class A (a) | 2,760 | 241,528 | ||||||
| Charles Schwab Corporation (The) | 5,765 | 404,126 | ||||||
| Tradeweb Markets, Inc. - Class A | 3,375 | 228,184 | ||||||
| 873,838 | ||||||||
| Health Care — 16.2% | ||||||||
| Biotechnology — 7.2% | ||||||||
| argenx SE - ADR (a) | 604 | 186,817 | ||||||
| Arrowhead Pharmaceuticals, Inc. (a) | 5,279 | 176,108 | ||||||
| Beam Therapeutics, Inc. (a) | 3,255 | 114,511 | ||||||
| Sarepta Therapeutics, Inc. (a) | 4,792 | 348,953 | ||||||
| 826,389 | ||||||||
| Life Sciences Tools & Services — 2.8% | ||||||||
| 10X Genomics, Inc. - Class A (a) | 2,329 | 119,222 | ||||||
| Charles River Laboratories International, Inc. (a) | 865 | 202,479 | ||||||
| 321,701 | ||||||||
| Medical Technology — 3.4% | ||||||||
| DexCom, Inc. (a) | 698 | 207,962 | ||||||
9
| EVOLUTIONARY TREE INNOVATORS FUND |
| SCHEDULE OF INVESTMENTS (Continued) |
| COMMON STOCKS — 92.3% (Continued) | Shares | Value | ||||||
| Health Care — 16.2% (Continued) | ||||||||
| Medical Technology — 3.4% (Continued) | ||||||||
| Shockwave Medical, Inc. (a) | 1,100 | $ | 180,631 | |||||
| 388,593 | ||||||||
| Pharmaceuticals — 2.8% | ||||||||
| Ascendis Pharma A/S - ADR (a) | 2,088 | 176,457 | ||||||
| Revance Therapeutics, Inc. (a) | 10,581 | 144,748 | ||||||
| 321,205 | ||||||||
| Technology — 38.6% | ||||||||
| Application Software — 20.2% | ||||||||
| HubSpot, Inc. (a) | 2,328 | 786,142 | ||||||
| Microsoft Corporation | 2,730 | 742,205 | ||||||
| ServiceNow, Inc. (a) | 1,677 | 783,947 | ||||||
| 2,312,294 | ||||||||
| Business Services — 4.3% | ||||||||
| Avalara, Inc. (a) | 3,088 | 261,461 | ||||||
| Fiverr International Ltd. (a) | 5,400 | 228,474 | ||||||
| 489,935 | ||||||||
| Data & Analytics — 1.5% | ||||||||
| MongoDB, Inc. (a) | 740 | 175,491 | ||||||
| Defense IT & Services — 3.2% | ||||||||
| CACI International, Inc. - Class A (a) | 1,325 | 371,490 | ||||||
| Financial Services Technology — 5.2% | ||||||||
| nCino, Inc. (a) | 18,440 | 602,435 | ||||||
| IT Services — 1.5% | ||||||||
| DigitalOcean Holdings, Inc. (a) | 3,475 | 169,754 | ||||||
| Law Enforcement Technology — 2.7% | ||||||||
| Axon Enterprise, Inc. (a) | 3,020 | 306,107 | ||||||
| Total Common Stocks (Cost $13,102,077) | $ | 10,591,791 | ||||||
10
| EVOLUTIONARY TREE INNOVATORS FUND |
| SCHEDULE OF INVESTMENTS (Continued) |
| MONEY MARKET FUNDS — 6.7% | Shares | Value | ||||||
| First American Treasury Obligations Fund - Class X, 0.68% (b) | ||||||||
| (Cost $771,358) | 771,358 | $ | 771,358 | |||||
| Investments at Value — 99.0% (Cost $13,873,435) | $ | 11,363,149 | ||||||
| Other Assets in Excess of Liabilities — 1.0% | 109,809 | |||||||
| Net Assets — 100.0% | $ | 11,472,958 | ||||||
ADR - American Depositary Receipt
| (a) | Non-income producing security. |
| (b) | The rate shown is the 7-day effective yield as of May 31, 2022. |
See accompanying notes to financial statements.
11
| EVOLUTIONARY TREE INNOVATORS FUND |
| STATEMENT OF ASSETS AND LIABILITIES |
| May 31, 2022 |
| ASSETS | ||||
| Investments in securities: | ||||
| At cost | $ | 13,873,435 | ||
| At value (Note 2) | $ | 11,363,149 | ||
| Receivable for capital shares sold | 75,645 | |||
| Receivable for investment securities sold | 281,355 | |||
| Receivable from Adviser (Note 4) | 19,830 | |||
| Dividends receivable | 1,862 | |||
| Other assets | 27,024 | |||
| Total assets | 11,768,865 | |||
| LIABILITIES | ||||
| Payable for investment securities purchased | 281,025 | |||
| Payable to administrator (Note 4) | 7,933 | |||
| Accrued distribution fees (Note 4) | 1 | |||
| Other accrued expenses | 6,948 | |||
| Total liabilities | 295,907 | |||
| NET ASSETS | $ | 11,472,958 | ||
| NET ASSETS CONSIST OF: | ||||
| Paid-in capital | $ | 26,395,835 | ||
| Accumulated deficit | (14,922,877 | ) | ||
| NET ASSETS | $ | 11,472,958 | ||
| NET ASSET VALUE PER SHARE: | ||||
| I CLASS SHARES | ||||
| Net assets applicable to I Class Shares | $ | 11,472,230 | ||
| I Class Shares of beneficial interest outstanding (unlimited number of shares authorized, no par value) | 861,444 | |||
| Net asset value, offering price and redemption price per share (Note 2) | $ | 13.32 | ||
| A CLASS SHARES | ||||
| Net assets applicable to A Class Shares | $ | 728 | ||
| A Class Shares of beneficial interest outstanding (unlimited number of shares authorized, no par value) | 55 | |||
| Net asset value and redemption price per share (Note 2) | $ | 13.31 | * | |
| Maximum sales charge | 5.75 | % | ||
| Maximum offering price per share (Note 2) | $ | 14.12 |
| * | Net Assets divided by Shares do not calculate to the stated Net asset value because Net Assets and Shares are shown rounded. |
See accompanying notes to financial statements.
12
| EVOLUTIONARY TREE INNOVATORS FUND |
| STATEMENT OF OPERATIONS |
| For the Year Ended May 31, 2022 |
| INVESTMENT INCOME | ||||
| Dividends | $ | 3,158 | ||
| Foreign withholding tax on dividends | (135 | ) | ||
| Total investment income | 3,023 | |||
| EXPENSES | ||||
| Management fees (Note 4) | 259,534 | |||
| Registration and filing fees | 51,289 | |||
| Legal fees | 31,331 | |||
| Fund accounting fees (Note 4) | 30,740 | |||
| Administration fees (Note 4) | 27,886 | |||
| Transfer agent fees (Note 4) | 18,666 | |||
| Trustees’ fees and expenses (Note 4) | 17,817 | |||
| Audit and tax services fees | 16,460 | |||
| Compliance fees (Note 4) | 12,000 | |||
| Borrowing costs (Note 5) | 10,349 | |||
| Custodian and bank service fees | 10,236 | |||
| Printing of shareholder reports | 9,371 | |||
| Postage and supplies | 5,933 | |||
| Distribution fees - A Class Shares (Note 4) | 1 | |||
| Other expenses | 22,368 | |||
| Total expenses | 523,981 | |||
| Less fee reductions and expense reimbursements by the Adviser (Note 4) | (198,946 | ) | ||
| Net expenses | 325,035 | |||
| NET INVESTMENT LOSS | (322,012 | ) | ||
| REALIZED AND UNREALIZED LOSSES ON INVESTMENTS | ||||
| Net realized losses on investment transactions | (11,787,013 | ) | ||
| Net change in unrealized appreciation (depreciation) on investments | (4,408,728 | ) | ||
| NET REALIZED AND UNREALIZED LOSSES ON INVESTMENTS | (16,195,741 | ) | ||
| NET DECREASE IN NET ASSETS RESULTING FROM OPERATIONS | $ | (16,517,753 | ) |
See accompanying notes to financial statements.
13
| EVOLUTIONARY TREE INNOVATORS FUND |
| STATEMENTS OF CHANGES IN NET ASSETS |
| Year Ended | Period Ended | |||||||
| May 31, | May 31, | |||||||
| 2022 (a) | 2021 (b) | |||||||
| FROM OPERATIONS | ||||||||
| Net investment loss | $ | (322,012 | ) | $ | (154,033 | ) | ||
| Net realized gains (losses) from investment transactions | (11,787,013 | ) | 1,237,471 | |||||
| Net change in unrealized appreciation (depreciation) on investments | (4,408,728 | ) | 1,898,442 | |||||
| Net increase (decrease) in net assets resulting from operations | (16,517,753 | ) | 2,981,880 | |||||
| FROM DISTRIBUTIONS TO SHAREHOLDERS (Note 2) | ||||||||
| I Class Shares | (1,387,004 | ) | — | |||||
| CAPITAL SHARE TRANSACTIONS | ||||||||
| I Class Shares | ||||||||
| Proceeds from shares sold | 36,442,525 | 27,224,801 | ||||||
| Net asset value of shares issued in reinvestment of distributions to shareholders | 1,343,272 | — | ||||||
| Payments for shares redeemed | (36,331,845 | ) | (2,283,918 | ) | ||||
| Net increase in I Class Shares net assets from captial share transactions | 1,453,952 | 24,940,883 | ||||||
| A Class Shares | ||||||||
| Proceeds from shares sold | 1,000 | — | ||||||
| TOTAL INCREASE (DECREASE) IN NET ASSETS | (16,449,805 | ) | 27,922,763 | |||||
| NET ASSETS | ||||||||
| Beginning of period | 27,922,763 | — | ||||||
| End of period | $ | 11,472,958 | $ | 27,922,763 | ||||
| (a) | For Class A Shares, represents the period from commencement of operations (February 28, 2022) through May 31, 2022. |
| (b) | Represents the period from commencement of operations (September 9, 2020) through May 31, 2021. |
See accompanying notes to financial statements.
14
| EVOLUTIONARY TREE INNOVATORS FUND |
| STATEMENTS OF CHANGES IN NET ASSETS (Continued) |
| Year Ended | Period Ended | |||||||
| May 31, | May 31, | |||||||
| 2022 (a) | 2021 (b) | |||||||
| CAPITAL SHARES ACTIVITY | ||||||||
| I Class Shares | ||||||||
| Shares sold | 1,514,240 | 1,181,048 | ||||||
| Net asset value of shares issued in reinvestment of distributions to shareholders | 57,063 | — | ||||||
| Shares redeemed | (1,806,474 | ) | (84,433 | ) | ||||
| Net increase (decrease) in shares outstanding | (235,171 | ) | 1,096,615 | |||||
| Shares outstanding, beginning of period | 1,096,615 | — | ||||||
| Shares outstanding, end of period | 861,444 | 1,096,615 | ||||||
| A Class Shares | ||||||||
| Shares sold | 55 | — | ||||||
| Net increase in shares outstanding | 55 | — | ||||||
| Shares outstanding, beginning of period | — | — | ||||||
| Shares outstanding, end of period | 55 | — | ||||||
| (a) | For Class A Shares, represents the period from commencement of operations (February 28, 2022) through May 31, 2022. |
| (b) | Represents the period from commencement of operations (September 9, 2020) through May 31, 2021. |
See accompanying notes to financial statements.
15
| EVOLUTIONARY TREE INNOVATORS FUND |
| I CLASS SHARES |
| FINANCIAL HIGHLIGHTS |
Per Share Data for a Share Outstanding Throughout Each Period
| Year Ended | Period Ended | |||||||
| May 31, | May 31, | |||||||
| 2022 | 2021 (a) | |||||||
| Net asset value at beginning of period | $ | 25.46 | $ | 20.00 | ||||
| Income (loss) from investment operations: | ||||||||
| Net investment loss (b) | (0.24 | ) | (0.18 | ) | ||||
| Net realized and unrealized gains (losses) on investments | (11.18 | ) | 5.64 | |||||
| Total from investment operations | (11.42 | ) | 5.46 | |||||
| Less distributions from: | ||||||||
| Net realized gains | (0.72 | ) | — | |||||
| Net asset value at end of period | $ | 13.32 | $ | 25.46 | ||||
| Total return (c) | (46.09 | %) | 27.30 | % (d) | ||||
| Net assets at end of period (000’s) | $ | 11,472 | $ | 27,923 | ||||
| Ratios/supplementary data: | ||||||||
| Ratio of total expenses to average net assets | 1.59 | % | 1.65 | % (e) | ||||
| Ratio of net expenses to average net assets (f) | 1.00 | % (g) | 0.97 | % (e) | ||||
| Ratio of net investment loss to average net assets (f) | (0.99 | %) | (0.97 | %) (e) | ||||
| Portfolio turnover rate | 169 | % | 33 | % (d) | ||||
| (a) | Represents the period from the commencement of operations (September 9, 2020) through May 31, 2021. |
| (b) | Per share net investment loss has been determined on the basis of average number of shares outstanding during the period. |
| (c) | Total return is a measure of the change in value of an investment in the Fund over the period covered. The returns shown do not reflect the deduction of taxes a shareholder would pay on Fund distributions, if any, or the redemption of Fund shares. The total return would be lower if the Adviser had not reduced fees and reimbursed expenses (Note 4). |
| (d) | Not annualized. |
| (e) | Annualized. |
| (f) | Ratio was determined after advisory fee reductions and/or reimbursements (Note 4). |
| (g) | Includes 0.03% of borrowing costs (Note 5). |
See accompanying notes to financial statements.
16
| EVOLUTIONARY TREE INNOVATORS FUND |
| A CLASS SHARES |
| FINANCIAL HIGHLIGHTS |
Per Share Data for a Share Outstanding Throughout the Period
| Period Ended | ||||
| May 31, | ||||
| 2022 (a) | ||||
| Net asset value at beginning of period | $ | 18.27 | ||
| Loss from investment operations: | ||||
| Net investment loss (b) | (0.05 | ) | ||
| Net realized and unrealized losses on investments | (4.91 | ) | ||
| Total from investment operations | (4.96 | ) | ||
| Net asset value at end of period | $ | 13.31 | ||
| Total return (c) | (27.15 | %) (d) | ||
| Net assets at end of period | $ | 728 | ||
| Ratios/supplementary data: | ||||
| Ratio of total expenses to average net assets | 3706.34 | % (e) | ||
| Ratio of net expenses to average net assets (f) | 1.22 | % (e) | ||
| Ratio of net investment loss to average net assets (f) | (1.21 | %) (e) | ||
| Portfolio turnover rate | 169 | % (g) | ||
| (a) | Represents the period from the commencement of operations (February 28, 2022) through May 31, 2022. |
| (b) | Per share net investment loss has been determined on the basis of average number of shares outstanding during the period. |
| (c) | Total return is a measure of the change in value of an investment in the Fund over the period covered. The return shown does not reflect the deduction of taxes a shareholder would pay on Fund distributions, if any, or the redemption of Fund shares. The total return would be lower if the Adviser had not reduced fees and reimbursed expenses (Note 4). |
| (d) | Not annualized. |
| (e) | Annualized. |
| (f) | Ratio was determined after advisory fee reductions and/or reimbursements (Note 4). |
| (g) | Portfolio turnover rate for the year ended May 31, 2022 and is calculated at the Fund level. |
See accompanying notes to financial statements.
17
| EVOLUTIONARY TREE INNOVATORS FUND |
| NOTES TO FINANCIAL STATEMENTS |
| May 31, 2022 |
1. Organization
Evolutionary Tree Innovators Fund (the “Fund”) is a non-diversified series of Ultimus Managers Trust (the “Trust”). The Trust is an open-end management investment company established as an Ohio business trust under a Declaration of Trust dated February 28, 2012. Other series of the Trust are not incorporated in this report.
The investment objective of the Fund is to seek to achieve long-term growth of capital.
The Fund currently offers two classes of shares: I Class Shares (sold without any sales loads and distribution and/or service fees and requiring a $50,000 initial investment) and A Class Shares (sold subject to an initial maximum front end sales load of 5.75% and a distribution (12b-1) fee of up to 0.25% of the average daily net assets attributable to A Class Shares, requiring a $ 1,000 initial investment and for purchases of $1,000,000 or more, a front end sales load is not charged but a 1% contingent deferred sales charge (“CDSC”) may be charged if redeemed during the first 18 months) (each a “Class”). Each share class represents an ownership interest in the same investment portfolio.
2. Significant Accounting Policies
The Fund follows accounting and reporting guidance under Financial Accounting Standards Board Accounting Standards Codification Topic 946, “Financial Services – Investment Companies.” The following is a summary of the Fund’s significant accounting policies used in the preparation of its financial statements. These policies are in conformity with accounting principles generally accepted in the United States of America (“GAAP”).
Securities valuation – The Fund values its portfolio securities at market value as of the close of regular trading on the New York Stock Exchange (the “NYSE”) (normally 4:00 p.m. Eastern time) on each business day the NYSE is open for business. The Fund values its listed securities on the basis of the security’s last sale price on the security’s primary exchange, if available, otherwise at the exchange’s most recently quoted mean price. NASDAQ-listed securities are valued at the NASDAQ Official Closing Price. When using a quoted price and when the market for the security is considered active, the security will be classified as Level 1 within the fair value hierarchy (see below). In the event that market quotations are not readily available or are considered unreliable due to market or other events, the Fund values its securities and other assets at fair value in accordance with procedures established by and under the general supervision of the Board of Trustees (the “Board”). Under these procedures, the securities will be classified as Level 2 or 3 within the fair value hierarchy, depending on the inputs used. Unavailable or unreliable market quotes may be due to the following factors: a substantial bid-ask spread; infrequent sales resulting in stale prices; insufficient trading volume; small trade sizes; a temporary lapse in any reliable pricing source; and actions of the securities or futures markets, such as the
18
| EVOLUTIONARY TREE INNOVATORS FUND |
| NOTES TO FINANCIAL STATEMENTS (Continued) |
suspension or limitation of trading. As a result, the prices of securities used to calculate the Fund’s net asset value (“NAV”) may differ from quoted or published prices for the same securities.
GAAP establishes a single authoritative definition of fair value, sets out a framework for measuring fair value, and requires additional disclosures about fair value measurements.
Various inputs are used in determining the value of the Fund’s investments. These inputs are summarized in the three broad levels listed below:
| ● | Level 1 – quoted prices in active markets for identical securities |
| ● | Level 2 – other significant observable inputs |
| ● | Level 3 – significant unobservable inputs |
The inputs or methods used for valuing securities are not necessarily an indication of the risks associated with investing in those securities. The inputs used to measure fair value may fall into different levels of the fair value hierarchy. In such cases, for disclosure purposes, the level in the fair value hierarchy within which the fair value measurement falls in its entirety is determined based on the lowest level input that is significant to the fair value measurement.
The following is a summary of the Fund’s investments based on the inputs used to value the investments as of May 31, 2022, by security type:
| Level 1 | Level 2 | Level 3 | Total | |||||||||||||
| Common Stocks | $ | 10,591,791 | $ | — | $ | — | $ | 10,591,791 | ||||||||
| Money Market Funds | 771,358 | — | — | 771,358 | ||||||||||||
| Total | $ | 11,363,149 | $ | — | $ | — | $ | 11,363,149 | ||||||||
Refer to the Fund’s Schedule of Investments for a listing of the common stocks by sector and industry type. The Fund did not hold any derivative instruments or any assets or liabilities that were measured at fair value on a recurring basis using significant unobservable inputs (Level 3) as of or during the year ended May 31, 2022.
Share valuation – The NAV per share of each class of shares of the Fund is calculated daily by dividing the total value of the assets attributable to that class, less liabilities attributable to that class, by the number of shares outstanding of that class. The offering price and redemption price per share of I Class Shares is equal to the NAV per share. The maximum offering price per share of A Class Shares of the Fund is equal to the NAV per shares plus a sales load equal to 5.75% as a percentage of offering price. A Class Shares purchases of $1,000,000 or more, a front end sales load is not charged, but a CDSC of 1% may be charged if redeemed during the first 18 months of purchase.
19
| EVOLUTIONARY TREE INNOVATORS FUND |
| NOTES TO FINANCIAL STATEMENTS (Continued) |
Investment income – Dividend income is recorded on the ex-dividend date. Non-cash dividends included in dividend income, if any, are recorded at the fair market value of the security received. Interest income is accrued as earned. Withholding taxes on foreign dividends have been recorded in accordance with the Fund’s understanding of the applicable country’s tax rules and rates.
Investment transactions – Investment transactions are accounted for on the trade date. Realized gains and losses on investments sold are determined on a specific identification basis.
Allocation between classes – Investment income earned, realized capital gains and losses, and unrealized appreciation and depreciation are allocated daily to each class of a Fund based upon its proportionate share of total net assets of that Fund. Class-specific expenses are charged directly to the class incurring the expense. Common expenses which are not attributable to a specific class are allocated daily to each class of shares of a Fund based upon its proportionate share of total net assets of that Fund.
Common expenses – Common expenses of the Trust are allocated among the Fund and the other series of the Trust based on the relative net assets of each series, the number of series in the Trust, or the nature of the services performed and the relative applicability to each series.
Distributions to shareholders – The Fund distributes to shareholders any net investment income dividends and net realized capital gains on an annual basis. The amount of such dividends and distributions are determined in accordance with federal income tax regulations, which may differ from GAAP. Dividends and distributions to shareholders are recorded on the ex-dividend date. For the year ended May 31, 2022, the tax character of distributions paid to shareholders was ordinary income. There were no distributions paid to shareholders by the Fund during the period ended May 31, 2021.
Estimates – The preparation of financial statements in conformity with GAAP requires management to make estimates and assumptions that affect the reported amounts of assets and liabilities and disclosure of contingent assets and liabilities as of the date of the financial statements and the reported amounts of increase (decrease) in net assets from operations during the reporting period. Actual results could differ from those estimates.
Federal income tax – The Fund has qualified and intends to continue to qualify as a regulated investment company under the Internal Revenue Code of 1986, as amended (the “Code”). Qualification generally will relieve the Fund of liability for federal income taxes to the extent 100% of its net investment income and net realized capital gains are distributed in accordance with the Code.
20
| EVOLUTIONARY TREE INNOVATORS FUND |
| NOTES TO FINANCIAL STATEMENTS (Continued) |
In order to avoid imposition of the excise tax applicable to regulated investment companies, it is also the Fund’s intention to declare as dividends in each calendar year amounts equal to at least 98% of its net investment income (earned during the calendar year) and 98.2% of its net realized capital gains (earned during the twelve months ended October 31) plus undistributed amounts from prior years, if any.
The following information is computed on a tax basis for each item as of May 31, 2022:
| Cost of investments | $ | 16,195,237 | ||
| Gross unrealized appreciation | $ | 177,338 | ||
| Gross unrealized depreciation | (5,009,426 | ) | ||
| Net unrealized depreciation | (4,832,088 | ) | ||
| Accumulated capital and other losses | (10,090,789 | ) | ||
| Accumulated deficit | $ | (14,922,877 | ) |
The difference between the federal income tax cost of investments and the financial statement cost of investments is due to certain timing differences in the recognition of capital gains or losses under income tax regulations and GAAP. These “book/tax” differences are temporary in nature and are primarily due to the tax deferral of losses on wash sales.
Post-October losses, incurred after October 31, 2021 and net qualified late year losses, incurred after December 31, 2021, and within the current taxable year are deemed to arise on the first day of a Fund’s next taxable year. For the year ended May 31, 2022, the Fund deferred $10,012,886 and $77,903 of post-October and qualified late year losses, respectively, to June 1, 2022 for federal income tax purposes.
The Fund recognizes the tax benefits or expenses of uncertain tax positions only when the position is “more likely than not” of being sustained assuming examination by tax authorities. Management has reviewed the Fund’s tax positions for all open tax years (open tax years since inception) and has concluded that no provision for unrecognized tax benefits or expenses is required in these financial statements. The Fund identifies its major tax jurisdiction as U.S. Federal.
3. Investment Transactions
During the year ended May 31, 2022, cost of purchases and proceeds from sales of investment securities, other than short-term investments, amounted to $52,470,339 and $53,003,087, respectively.
21
| EVOLUTIONARY TREE INNOVATORS FUND |
| NOTES TO FINANCIAL STATEMENTS (Continued) |
4. Transactions with Related Parties
INVESTMENT ADVISORY AGREEMENT
The Fund’s investments are managed by Evolutionary Tree Capital Management, LLC (the “Adviser”) pursuant to the terms of an Investment Advisory Agreement. The Fund pays the Adviser a management fee, computed and accrued daily and paid monthly, at the annual rate of 0.80% of average daily net assets.
Pursuant to an Expense Limitation Agreement (“ELA”) between the Fund and the Adviser, the Adviser has agreed contractually, until October 31, 2024, to reduce its management fees and reimburse other expenses to the extent necessary to limit total annual fund operating expenses (exclusive of brokerage costs, taxes, interest, borrowing costs such as interest and dividend expenses on securities sold short, costs to organize the Fund, acquired fund fees and expenses, extraordinary expenses such as litigation and merger or reorganization costs and other expenses not incurred in the ordinary course of the Fund’s business) to an amount not to exceed 0.97% of average daily net assets attributable to I Class Shares and 1.22% of average daily net assets attributable to A Class Shares. Accordingly, during the year ended May 31, 2022, the Adviser reduced its management fees in the amount of $198,946.
Under the terms of the ELA, management fee reductions and/or expense reimbursements by the Adviser are subject to repayment by the Fund for a period of three years after such date that fees and expenses were incurred, provided that the repayments do not cause total annual fund operating expenses to exceed (i) the expense limitation then in effect, if any, and (ii) the expense limitation in effect at the time the expenses to be repaid were incurred. Prior to October 31, 2024, this agreement may not be modified or terminated without the approval of the Fund’s Board of Trustees. This agreement will terminate automatically if the Fund’s investment advisory agreement with the Adviser is terminated. As of May 31, 2022, the Adviser may seek repayment of management fee reductions no later than the dates as stated below:
| May 31, 2024 | $ | 108,771 | ||
| May 31, 2025 | 198,946 | |||
| Total | $ | 307,717 |
OTHER SERVICE PROVIDERS
Ultimus Fund Solutions, LLC (“Ultimus”) provides administration, fund accounting, compliance and transfer agency services to the Fund. The Fund pays Ultimus fees in accordance with the agreements for such services. In addition, the Fund pays out-of-pocket expenses including, but not limited to, postage, supplies and certain costs related to the pricing of the Fund’s portfolio securities.
22
| EVOLUTIONARY TREE INNOVATORS FUND |
| NOTES TO FINANCIAL STATEMENTS (Continued) |
Under the terms of a Distribution Agreement with the Trust, Ultimus Fund Distributors, LLC (the “Distributor”) serves as principal underwriter to the Fund. The Distributor is a wholly-owned subsidiary of Ultimus. The Distributor is compensated by the Adviser (not the Fund) for acting as principal underwriter. As of May 31, 2022, the Distributor did not collect any fees related to CDSC fees on redemptions of A Class Shares.
Certain officers and a Trustee of the Trust are also officers of Ultimus.
DISTRIBUTION PLAN
The Fund has adopted a plan of distribution (the “Plan”) pursuant to Rule 12b-1 under the Investment Company Act of 1940, as amended (the “1940 Act”), which permits A Class Shares of the Fund to directly incur or reimburse the Fund’s principal underwriter for certain expenses related to the distribution of its shares. The annual limitation for payment of expenses pursuant to the Plan is 0.25% of the Fund’s average daily net assets allocable to A Class Shares. The Fund has not adopted a plan of distribution with respect to the I Class Shares. During the period ended May 31, 2022, the A Class Shares incurred $1 of distribution fees under the Plan.
TRUSTEE COMPENSATION
Effective October 20, 2021, each member of the Board (a “Trustee”) who is not an “interested person” (as defined by the 1940 Act, as amended) of the Trust (“Independent Trustee”) receives a $1,300 annual retainer from the Fund, paid quarterly, except for the Board Chairperson who receives a $1,700 annual retainer from the Fund, paid in quarterly installments. Each Independent Trustee also receives from the Fund a fee of $550 for each Board meeting attended plus reimbursement for travel and other meeting-related expenses. Prior to October 20, 2021, each Independent Trustee received a $1,300 annual retainer from the Fund, paid quarterly, except for the Board Chairperson who received a $1,500 annual retainer from the Fund, paid in quarterly installments. Each Independent Trustee also received from the Fund a fee of $500 for each Board meeting attended plus reimbursement for travel and other meeting-related expenses.
PRINCIPAL HOLDER OF FUND SHARES
As of May 31, 2022, the following shareholder owned of record more than 25% of the outstanding shares of the Fund:
| NAME OF RECORD OWNERS | % Ownership |
| Evolutionary Tree Innovators Fund - I Class Shares | |
| Charles Schwab & Company (for the benefit of its customers) | 74% |
| Evolutionary Tree Innovators Fund - A Class Shares | |
| Thomas M. Ricketts | 100% |
A beneficial owner of 25% or more of the Fund’s outstanding shares may be considered a controlling person. That shareholder’s vote could have a more significant effect on matters presented at a shareholders’ meeting.
23
| EVOLUTIONARY TREE INNOVATORS FUND |
| NOTES TO FINANCIAL STATEMENTS (Continued) |
5. Borrowing Costs
From time to time, the Fund may have an overdrawn cash balance at the custodian due to redemptions or market movements. When this occurs, the Fund will incur borrowing costs charged by the custodian. Accordingly, during the year ended May 31, 2022, the Fund incurred $10,349 of borrowing costs charged by the custodian.
6. Contingencies and Commitments
The Fund indemnifies the Trust’s officers and Trustees for certain liabilities that might arise from their performance of their duties to the Fund. Additionally, in the normal course of business the Fund enters into contracts that contain a variety of representations and warranties and which provide general indemnifications. The Fund’s maximum exposure under these arrangements is unknown, as this would involve future claims that may be made against the Fund that have not yet occurred. However, based on experience, the Fund expects the risk of loss to be remote.
7. Non-Diversification Risk
The Fund is a non-diversified Fund. As a result, the Fund’s holdings may be more concentrated in a limited number of securities and the value of its shares may be more sensitive than a diversified fund to any single economic, business, political, or regulatory occurrence.
8. Sector Risk
If a Fund has significant investments in the securities of issuers within a particular sector, any development affecting that sector will have a greater impact on the value of the net assets of the Fund than would be the case if the Fund did not have significant investments in that sector. In addition, this may increase the risk of loss in the Fund and increase the volatility of the Fund’s NAV per share. Occasionally, market conditions, regulatory changes or other developments may negatively impact a particular sector. As of May 31, 2022, the Fund had 38.6% of the value of its net assets invested in stocks within the Technology sector.
9. Subsequent Events
The Fund is required to recognize in the financial statements the effects of all subsequent events that provide additional evidence about conditions that existed as of the date of the Statement of Assets and Liabilities. For non-recognized subsequent events that must be disclosed to keep the financial statements from being misleading, the Fund is required to disclose the nature of the event as well as an estimate of its financial effect, or a statement that such an estimate cannot be made. Management has evaluated subsequent events through the issuance of these financial statements and has noted no such events.
24
| EVOLUTIONARY TREE INNOVATORS FUND |
| REPORT OF INDEPENDENT REGISTERED |
| PUBLIC ACCOUNTING FIRM |
To the Board of Trustees of Ultimus Managers Trust
and the Shareholders of Evolutionary Tree Innovators Fund
Opinion on the Financial Statements
We have audited the accompanying statement of assets and liabilities of Evolutionary Tree Innovators Fund, a series of shares of beneficial interest in Ultimus Managers Trust (the “Fund”), including the schedule of investments, as of May 31, 2022, and the related statement of operations for the year then ended, and the statements of changes in net assets and financial highlights as noted in the table below and the related notes (collectively referred to as the “financial statements”). In our opinion, the financial statements present fairly, in all material respects, the financial position of the Fund as of May 31, 2022, and the results of its operations for the year then ended, and the changes in its net assets and its financial highlights as noted in the table below, in conformity with accounting principles generally accepted in the United States of America.
| Statements of Changes in Net Assets and | |
| Fund | Financial Highlights Presented |
| Evolutionary Tree Innovators Fund | The statements of changes in net assets for the year ended May 31, 2022, and the period September 9, 2020 (commencement of operations) through May 31, 2021.
The financial highlights for Class I: the year ended May 31, 2022, and the period from September 9, 2020 (commencement of operations) through May 31, 2021. The financial highlights for Class A: the period February 28, 2022 (commencement of operations) through May 31, 2022. |
Basis for Opinion
These financial statements are the responsibility of the Fund’s management. Our responsibility is to express an opinion on the Fund’s financial statements based on our audits. We are a public accounting firm registered with the Public Company Accounting Oversight Board (United States) (“PCAOB”) and are required to be independent with respect to the Fund in accordance with the U.S. federal securities law and the applicable rules and regulations of the Securities and Exchange Commission and the PCAOB.
We conducted our audits in accordance with the standards of the PCAOB. Those standards require that we plan and perform the audits to obtain reasonable assurance about whether the financial statements are free of material misstatement, whether due to error or fraud. The Fund is not required to have, nor were we engaged to perform, an audit
25
| EVOLUTIONARY TREE INNOVATORS FUND |
| REPORT OF INDEPENDENT REGISTERED |
| PUBLIC ACCOUNTING FIRM (Continued) |
of its internal control over financial reporting. As part of our audits, we are required to obtain an understanding of internal control over financial reporting but not for the purpose of expressing an opinion on the effectiveness of the Fund’s internal control over financial reporting. Accordingly, we express no such opinion.
Our audits included performing procedures to assess the risk of material misstatement of the financial statements, whether due to error or fraud, and performing procedures that respond to those risks. Such procedures included examining, on a test basis, evidence regarding the amounts and disclosures in the financial statements. Our procedures included confirmation of securities owned as of May 31, 2022 by correspondence with the custodian and broker. Our audits also included evaluating the accounting principles used and significant estimates made by management, as well as evaluating the overall presentation of the financial statements. We believe that our audits provide a reasonable basis for our opinion.

BBD, LLP
We have served as the auditor of one or more of the Funds in the Ultimus Managers Trust since 2013.
Philadelphia, Pennsylvania
July 20, 2022
26
| EVOLUTIONARY TREE INNOVATORS FUND |
| ABOUT YOUR FUND’S EXPENSES (Unaudited) |
We believe it is important for you to understand the impact of costs on your investment. As a shareholder of the Fund, you incur two types of costs: (1) transaction costs, possibly including front-end and CDSC loads, and (2) ongoing costs, including management fees, Rule 12b-1 distribution fees (if applicable to your class) and other operating expenses. The following examples are intended to help you understand your ongoing costs (in dollars) of investing in the Fund and to compare these costs with the ongoing costs of investing in other mutual funds.
A mutual fund’s ongoing costs are expressed as a percentage of its average net assets. This figure is known as the expense ratio. The expenses in the table below are based on an investment of $1,000 made at the beginning of the most recent period (December 1, 2021) and held until the end of the period (May 31, 2022), except for A Class Shares, the ongoing costs reflected in the table below are based on an investment of $1,000 made at the commencement of operations (February 28, 2022) and held until the end of the period (May 31, 2022).
The table below illustrates the Fund’s ongoing costs in two ways:
Actual fund return – This section helps you to estimate the actual expenses that you paid over the period. The “Ending Account Value” shown is derived from the Fund’s actual return, and the fourth column shows the dollar amount of operating expenses that would have been paid by an investor who started with $1,000 in the Fund. You may use the information here, together with the amount you invested, to estimate the expenses that you paid over the period.
To do so, simply divide your account value by $1,000 (for example, an $8,600 account value divided by $1,000 = 8.6), then multiply the result by the number given for the Fund under the heading “Expenses Paid During Period.”
Hypothetical 5% return – This section is intended to help you compare the Fund’s ongoing costs with those of other mutual funds. It assumes that the Fund had an annual return of 5% before expenses during the period shown, but that the expense ratio is unchanged. In this case, because the return used is not the Fund’s actual return, the results do not apply to your investment. The example is useful in making comparisons because the U.S. Securities and Exchange Commission (the “SEC”) requires all mutual funds to calculate expenses based on a 5% return. You can assess the Fund’s ongoing costs by comparing this hypothetical example with the hypothetical examples that appear in shareholder reports of other funds.
Note that expenses shown in the table are meant to highlight and help you compare ongoing costs only.
The calculations assume no shares were bought or sold during the period. Your actual costs may have been higher or lower, depending on the amount of your investment and the timing of any purchases or redemptions.
27
| EVOLUTIONARY TREE INNOVATORS FUND |
| ABOUT YOUR FUND’S EXPENSES (Unaudited) (Continued) |
More information about the Fund’s expenses can be found in this report. For additional information on operating expenses and other shareholder costs, please refer to the Fund’s prospectus.
| Beginning | Ending | |||
| Account Value | Account Value | Expenses | ||
| December 1, | May 31 | Net Expense | Paid During | |
| 2021(a) | 2022 | Ratio(b) | Period(c) | |
| I Class Shares | ||||
| Based on Actual Fund Return | $1,000.00 | $ 518.60 | 1.07% | $ 4.05 |
| Based on Hypothetical 5% Return (before expenses) | $1,000.00 | $ 1,019.60 | 1.07% | $ 5.39 |
| A Class Shares | ||||
| Based on Actual Fund Return | $1,000.00 | $ 728.50 | 1.22% | $ 2.69 |
| Based on Hypothetical 5% Return (before expenses) | $1,000.00 | $ 1,018.85 | 1.22% | $ 6.14 |
| (a) | For A Class Shares, Beginning Account Value is as of February 28, 2022 (date of commencement of operations) for the Actual Fund Return information. |
| (b) | Annualized, based on the most recent one-half year expenses, except for A Class Shares which is annualized, based on the expense during the period since the commencement of operations. |
| (c) | Expenses are equal to the Class’s annualized net expense ratio multiplied by the average account value over the period, multiplied by 182/365 (to reflect the one-half year period), except for A Class Shares, which is equal to the annualized net expense ratio multiplied by the average account value over the period, multiplied by 93/365 (to reflect the period since commencement of operations) and 182/365 (to reflect the one-half year period), for Actual Fund Return and Hypothetical 5% Return information, respectively. |
28
| EVOLUTIONARY TREE INNOVATORS FUND |
| OTHER INFORMATION (Unaudited) |
A description of the policies and procedures that the Fund uses to vote proxies relating to portfolio securities is available without charge upon request by calling toll-free 1-833-517-1010, or on the SEC’s website at www.sec.gov. Information regarding how the Fund voted proxies relating to portfolio securities during the most recent 12-month period ended June 30 is available without charge upon request by calling toll-free 1-833-517-1010, or on the SEC’s website at www.sec.gov.
The Trust files a complete listing of portfolio holdings for the Fund with the SEC as of the end of the first and third quarters of each fiscal year as an exhibit to Form N-PORT. These filings are available upon request by calling 1-833-517-1010. Furthermore, you may obtain a copy of the filings on the SEC’s website at www.sec.gov and the Fund’s website at www.mutualfund.evolutionarytree.com.
29
| EVOLUTIONARY TREE INNOVATORS FUND |
| BOARD OF TRUSTEES AND EXECUTIVE OFFICERS |
| (Unaudited) |
The Board has overall responsibility for management of the Trust’s affairs. The Trustees serve during the lifetime of the Trust and until its termination, or until death, resignation, retirement, or removal. The Trustees, in turn, elect the officers of the Fund to actively supervise their day-to-day operations. The officers have been elected for an annual term. Each Trustee’s and officer’s address is 225 Pictoria Drive, Suite 450, Cincinnati, Ohio 45246. The following are the Trustees and executive officers of the Fund:
| Name and Year of Birth | Length of Time Served | Position(s) Held with Trust | Principal Occupation(s) During Past 5 Years | Number | Directorships of Public Companies Held by Trustee During Past 5 Years |
| Interested Trustees: | |||||
| David R. Carson* Year of Birth: 1958 | Trustee Since 2021
Officer Since 2013 | Trustee (2021 to present)
Vice President (2021 to present; and previously April 2013 to October 2013)
President and Principal Executive Officer of each of its series (2013 to 2021) | Vice President and Director of Client Strategies of Ultimus Fund Solutions, LLC (2013 to present); President of Unified Series Trust (2017 to present). | 26 | Interested Trustee of 21 series of the Unified Series Trust (a registered management company) (2020 to present). |
| Independent Trustees: | |||||
| Janine L. Cohen Year of Birth: 1952 | Since 2016 | Chairperson (2019 to present)
Trustee (2016 to present) | Retired since 2013; previously Chief Financial Officer from 2004 to 2013 and Chief Compliance Officer from 2008 to 2013 at AER Advisors, Inc. | 26 | None |
30
| EVOLUTIONARY TREE INNOVATORS FUND |
| BOARD OF TRUSTEES AND EXECUTIVE OFFICERS |
| (Unaudited) (Continued) |
| Name and Year of Birth | Length of Time Served | Position(s) Held with Trust | Principal Occupation(s) During Past 5 Years | Number | Directorships of Public Companies Held by Trustee During Past 5 Years |
| Independent Trustees (Continued): | |||||
| David M. Deptula Year of Birth: 1958 | Since 2012 | Trustee | Vice President of Legal and Special Projects at Dayton Freight Lines, Inc. since February 2016. | 26 | None |
| Jacqueline A. Williams Year of Birth: 1954 | Since 2019 | Trustee | Managing Member of Custom Strategy Consulting, LLC (2017 to present); Managing Director of Global Investment Research (2005 to 2017), Cambridge Associates, LLC. | 26 | None |
| Clifford N. Schireson Year of Birth: 1953 | Since 2019 | Trustee | Retired; Founder of Schireson Consulting, LLC (2017 to 2022); Director of Institutional Services for Brandes Investment Partners, LP (2004-2017). | 26 | Trustee of the San Diego City Employees’ Retirement System (2019 to present). |
| Robert E. Morrison Year of Birth: 1957 | Since 2019 | Trustee | Managing Director, Midwest Trust and FCI Advisors (2022 to present); Senior Vice President and National Practice Lead for Investment, Huntington National Bank/ Huntington Private Bank (2014 to 2022); CEO, CIO, President of 5 Star Investment Management Company (2006 to 2014). | 26 | None |
| * | Mr. Carson is considered an “interested person” of the Trust within the meaning of Section 2(a)(19) of the 1940 Act because of his relationship with the Trust’s administrator, transfer agent, and distributor. Mr. Carson was President of the Trust from October 2013 to January 2021 and Vice President of the Trust from April 2013 to October 2013. |
31
| EVOLUTIONARY TREE INNOVATORS FUND |
| BOARD OF TRUSTEES AND EXECUTIVE OFFICERS |
| (Unaudited) (Continued) |
| Name and Year of Birth | Length of Time Served | Position(s) Held with Trust | Principal Occupation(s) During Past 5 Years |
| Executive Officers: | |||
| Todd E. Heim Year of Birth: 1967 | Since 2014 | President (2021 to present)
Vice President (2014 to 2021) | Vice President, Relationship Management (2018 to present) and Assistant Vice President, Client Implementation Manager of Ultimus Fund Solutions, LLC (2014 to 2018); Naval Flight Officer in United States Navy (1989 to 2017). |
| Jennifer L. Leamer Year of Birth: 1976 | Since 2014 | Treasurer (2014 to present)
Assistant Treasurer (April 2014 to October 2014) | Senior Vice President, Fund Accounting of Ultimus Fund Solutions, LLC (2014 to present). |
| Daniel D. Bauer Year of Birth: 1977 | Since 2016 | Assistant Treasurer (2016 to present) | Vice President, Fund Accounting (2022 to present) and Assistant Vice President, Fund Accounting of Ultimus Fund Solutions, LLC (2015 to 2022). |
| Angela A. Simmons Year of Birth: 1975 | Since 2022 | Assistant Treasurer (2022 to present) | Vice President, Financial Administration (2022 to present) and Assistant Vice President, Financial Administration (2015 to 2022) of Ultimus Fund Solutions, LLC. |
| Khimmara Greer Year of Birth: 1983 | Since 2021 | Secretary (2021 to present) | Vice President and Senior Legal Counsel of Ultimus Fund Solutions, LLC (2021 to present); Vice President, Asset Servicing – Regulatory Administration of The Bank of New York Mellon (2019 to 2021); Vice President and Counsel of State Street Bank and Trust Company (2015 to 2019). |
| David K. James Year of Birth: 1970 | Since 2021 | Assistant Secretary (2021 to present)
Secretary (2021 to 2021) | Executive Vice President and Chief Legal and Risk Officer of Ultimus Fund Solutions, LLC (2018 to present); Managing Director and Managing Counsel of State Street Bank and Trust Company (2009 to 2018). |
| Natalie S. Anderson Year of Birth: 1975 | Since 2016 | Assistant Secretary (2016 to present) | Legal Administration Manager (July 2016 to present) and Paralegal (January 2015 to June 2016) of Ultimus Fund Solutions, LLC. |
32
| EVOLUTIONARY TREE INNOVATORS FUND |
| BOARD OF TRUSTEES AND EXECUTIVE OFFICERS |
| (Unaudited) (Continued) |
| Name and Year of Birth | Length of Time | Position(s) Held with Trust | Principal Occupation(s) During Past 5 Years |
| Executive Officers (Continued): | |||
| Gweneth Gosselink Year of Birth: 1955 | Since 2020 | Chief Compliance Officer (2020 to present) | Assistant Vice President, Senior Compliance Officer of Ultimus Fund Solutions, LLC (December 2019 to present); CCO Consultant at GKG Consulting, LLC (December 2019 to present); Chief Operating Officer & CCO at Miles Capital, Inc. (June 2013 to December 2019). |
| Martin Dean Year of Birth: 1963 | Since 2019 | Assistant Chief Compliance Officer (2020 to present)
Interim Chief Compliance Officer (October 2019 to January 2020)
Assistant Chief Compliance Officer (2016 to 2017) | Senior Vice President, Head of Fund Compliance (February 2020 to present); Vice President & Director of Fund Compliance of Ultimus Fund Solutions, LLC (January 2016 to January 2020). |
Additional information about members of the Board and executive officers is available in the Fund’s Statement of Additional Information (“SAI”). To obtain a free copy of the SAI, please call toll free 1-833-517-1010.
33
EVOLUTIONARY-AR-22

KARNER BLUE BIODIVERSITY IMPACT FUND
ButterflyTM Class (KAIBX)
Annual Report
May 31, 2022
| KARNER BLUE BIODIVERSITY IMPACT FUND | |
| LETTER TO SHAREHOLDERS (Unaudited) | June 23, 2022 |
Dear Shareholder,
“Building a shared future for all life” was the theme of this year’s International Day for Biological Diversity, which was celebrated on May 22.1 The theme was selected to focus attention on, and continue building momentum and support for, the post-2020 global biodiversity framework (GBF) to be adopted this year by the United Nations Convention on Biological Diversity (CBD) at the convening of the Fifteenth Conference of Parties (COP 15). While that meeting was originally scheduled to be held in Kunming, China, it has been relocated due to China’s zero-tolerance Covid policy and will now be held this December in Montreal, Canada.
The theme serves as a reminder that humans are an integral component of, and not distinct from, Earth’s biodiversity. Humans depend upon healthy and vibrant ecosystems for basic needs, including water, food, medicines, clothes, fuel, shelter and energy. As explained by WeConservePA:
Each species has a specific niche, a specific role and function in an ecosystem. These roles include capturing and storing energy, providing food, predation, decomposing organic matter, cycling water and nutrients, controlling erosion, controlling pests and climate regulation. Species support biological production and regulation throughout the food chain in a variety of ways, such as adding to soil fertility, pollination, plant growth, predation and waste decomposition. The more diverse an ecosystem is, the more stable it is, the more productive it tends to be, and the better it is able to withstand environmental stress. Biodiversity is essential for sustaining the natural ecosystems on which humans, and all life, depend.2
The web of organisms, ecosystems and genes that form the basis of life on Earth is a global asset that humanity is drawing down at an unsustainable rate, and as that web shrinks the options for future generations, and the long-term viability of our planet, diminish. An extractive rather than regenerative human mindset has fueled habitat conversion and species exploitation, which are the key drivers of an ongoing mass extinction of species across our planet, sometimes referred to as the Anthropocene. Approximately “77% of land (excluding Antarctica) and 87% of the area of the ocean have been modified by the direct effects of human activities. These changes are associated with the loss of 83% of wild mammal biomass, and half that of plants. Livestock and humans now account for nearly 96% of all mammal biomass on Earth, and more species are
| 1 | United Nations Environment Programme. UN Day – International Day for Biodiversity. Retrieved from: https://www.unep.org/events/un-day/international-day-biological-diversity-2022. |
| 2 | WeConservePA. Economic Benefits of Biodiversity. Retrieved from: https://conservationtools.org/guides/95-economic-benefits-of-biodiversity. |
1
threatened with extinction than ever before in human history.”3 These statistics leave no doubt that humans have thus far failed to build a shared future for all life – and that failure is destabilizing all life on Earth.
It is very likely that COP 15 represents humanity’s best, and perhaps last, chance “to implement broad-based action to bring about a transformation in society’s relationship with biodiversity and to ensure that, by 2050, the shared vision of living in harmony with nature is fulfilled.”4 On one hand the simplicity of this year’s theme hones in on this vitally important overarching COP 15 goal, but on the other hand it belies the very complex scientific and political issues that negotiators must resolve in order to achieve that outcome.
In mid-March CBD negotiators met in person in Geneva for the first time in two years. Unfortunately, the progress of the negotiations was slowed by a North-South global divide as poorer countries called out wealthy countries for failing to provide adequate financial resources to bridge the nature funding gap, a concern that was fueled by the ongoing failure of those wealthy countries to meet their financial commitments to poorer countries with respect to climate change mitigation and adaptation. In the final plenary session of the negotiations, developing countries, supported by China, called for developed countries to provide biodiversity financial support from public and private sources, starting at $100 billion this year and increasing to $700 billion by 2030. Delegates from the North and South also sparred over access and benefit sharing related to digital sequence information connected to physical genetic resources, but they at least managed to agree on a pathway for future negotiations and a schedule of intersessional work related to these very challenging topics.
As the pace of negotiations bogged down, a group of major conservation organizations issued a press release to spur further progress. The World Wildlife Fund, Nature Conservancy, Nature4Climate, BirdLife and the Royal Society for the Protection of Birds joined forces to make the point that COP 15 failure is simply not an option. They wrote:
Nowhere near enough progress is being made ahead of the high-level summit scheduled to take place in Kunming, China later this year. Unless things change, the success of that summit is in jeopardy. The pace of the Geneva talks has been glacial. There is a yawning gap between the deal we need to secure a nature-positive world and the current text on the table. We desperately need to see progress now. As a first step, negotiators must agree on a mission to reverse the loss of nature
| 3 | Pörtner, H.O., Scholes, R.J., Agard, J., Archer, E., Arneth, A., Bai, X., Barnes, D., Burrows, M., Chan, L., Cheung, W.L., Diamond, S., Donatti, C., Duarte, C., Eisenhauer, N., Foden, W., Gasalla, M. A., Handa, C., Hickler, T., Hoegh-Guldberg, O., Ichii, K., Jacob, U., Insarov, G., Kiessling, W., Leadley, P., Leemans, R., Levin, L., Lim, M., Maharaj, S., Managi, S., Marquet, P. A., McElwee, P., Midgley, G., Oberdorff, T., Obura, D., Osman, E., Pandit, R., Pascual, U., Pires, A. P. F., Popp, A., ReyesGarcía, V., Sankaran, M., Settele, J., Shin, Y. J., Sintayehu, D. W., Smith, P., Steiner, N., Strassburg, B., Sukumar, R., Trisos, C., Val, A.L., Wu, J., Aldrian, E., Parmesan, C., Pichs-Madruga, R., Roberts, D.C., Rogers, A.D., Díaz, S., Fischer, M., Hashimoto, S., Lavorel, S., Wu, N., Ngo, H.T. 2021. IPBES-IPCC co-sponsored workshop report on biodiversity and climate change; IPBES and IPCC. DOI:10.5281/zenodo.4782538. Retrieved from https://www.ipbes.net/sites/default/ files/2021-06/20210609_workshop_report_embargo_3pm_CEST_10_june_0.pdf |
| 4 | United Nations Environment Programme. UN Biodiversity Conference (COP 15). Retrieved from: https://www. unep.org/events/conference/un-biodiversity-conference-cop-15. |
2
by 2030. This would provide a guiding light and clear destination for the rest of the biodiversity framework. We also need a clear work plan to be agreed by the end of the talks, showing how negotiators will resolve the large number of issues that are still outstanding. In light of the tremendous challenges ahead, it will take both an injection of urgency, and extremely careful planning, if COP15 is to achieve the deal we all need: quite literally a plan to save life on earth…[The GBF] is a once-in-a-decade opportunity to secure an ambitious and transformative agreement that sets nature on the path to recovery – essential for climate action, the delivery of the Sustainable Development Goals, and the future of life on our planet. We know nature is in crisis and we cannot afford to squander this crucial moment. Delay further and it will be too late. Already precious and irreplaceable ecosystems like the Amazon may be on the verge of collapse…We are deeply concerned that we are yet to see governments act with any urgency and show that they are fully committed to closing the enormous gap between the unambitious draft Global Biodiversity Framework and commitments already made, such as the Leaders Pledge for Nature, to secure a nature-positive future. Currently, words are not translating into action and progress inside the negotiations…is essential to help secure an equitable, nature positive, net-zero emissions world…In the face of the catastrophic loss of nature that is devastating people’s lives around the world, we urgently need governments to step up to the enormous challenges at hand. It is essential that we finish this meeting able to point to successes and a renewed momentum for tackling the crisis taking place in our natural world.5
Ultimately, by the end of the Geneva meeting, progress was made in some key areas by each of the three simultaneous negotiating bodies – the Open-ended Working Group on the post-2020 global biodiversity framework (WG2020), the Subsidiary Body on Scientific, Technical and Technological Advice (SBSTTA), and the Subsidiary Body on Implementation (SBI). Significant progress was achieved by WG2020 to establish indicators for the goals and targets that will comprise the GBF. SBSTTA adopted 11 recommendations to be taken up by COP 15 regarding scientific and technical advice to support the review of goals, targets, indicators and baselines included in the draft framework text, including the incorporation of scientific conclusions set forth in the fifth edition of the Global Biodiversity Outlook prepared by the Intergovernmental Science-Policy Platform on Biodiversity and Ecosystem Services (IPBES). SBI adopted 20 recommendations and decisions focused on required elements of the GBF, including financial resources, means of implementation, capacity building and development, review of effectiveness procedures, resource mobilization, and communication.6 Importantly, Indigenous Peoples and local communities (IPLCs), who are the most direct guardians of biodiversity and most adversely affected by biodiversity loss, were explicitly added throughout the GBF text. As such, IPLCs will be an integral part of the GBF and countries
| 5 | Nature4Climate. Joint NGO statement on state of play in the UN Convention on Biological Diversity (CBD) negotiations. Retrieved from: https://nature4climate.org/news/joint-ngo-statement-on-state-of-play-in-the-un-convention-on-biological-diversity-cbd-negotiations/. |
| 6 | Earth Negotiations Bulletin. Summary Report, 14-29 March 2022. Retrieved at: https://enb.iisd.org/ cbd-sbstta24-sbi3-global-biodiversity-framework-summary?utm_medium=email&utm_campaign=ENB%20 Update%20-%201%20April%202022&utm_content=ENB%20Update%20-%201%20April%202022+CID_ cfebec2600738a7bd790a3b7fcbdbf6b&utm_source=cm&utm_term=Read. |
3
will have to be accountable to those populations. Furthermore, the CBD’s Gender Plan of Action was finalized. Women are vitally important stewards of biodiversity and ensuring their involvement in GBF actions is crucial to mainstreaming biodiversity conservation across societies. Finally, the Business for Nature coalition and a number of forward-thinking companies played an active role in the negotiations urging governments to (i) adopt mandatory requirements that will require businesses and financial institutions to transform their business operations, (ii) eliminate subsidies that harm nature, and (iii) utilize those resources to instead fill the nature funding gap and build a nature-positive world. Business for Nature also worked to make the case that “policy ambition is needed to spur business action…by creating a positive policy feedback-loop that levels the playing field and encourages further business action.”7
This week the CBD negotiators resumed their work at a meeting in Nairobi, Kenya. Karner Blue Capital wishes them Godspeed in their vitally important efforts to build a shared future for all life.
PERFORMANCE
The Fund seeks to achieve long-term total returns by investing in companies that lead their industries in animal welfare performance. KBC’s strategy to achieve the Fund’s investment objective involves peer-relative evaluations of companies that operate in 19 industries with significant exposure to the five key drivers of biodiversity loss, which are (i) irresponsible land and ocean use, (ii) exploitation and over-use of species, (iii) climate change, (iv) pollution and (v) invasive and introduced species. The Fund’s holdings of companies operating in these industries together comprise at least 65 percent of the Fund’s assets. KBC also assesses companies that operate in other industries and that, in KBC’s opinion, have made significant contributions to the advancement of biodiversity and animal welfare outside of their normal business operations. The companies in this group are referred to as Opportunity Companies and may comprise up to 35 percent of the Fund’s holdings at the time of purchase.
On a net basis, the ButterflyTM Class underperformed its benchmark, the Morningstar Developed Markets (NR) USD Index (the “Morningstar Index”), by 299 basis points during the one-year period ended May 31, 2022 (the “Reporting Period”) and by 22 basis points on an annualized basis since inception. The net performance of the Butterfly Class in comparison to the Morningstar Index is shown in the following chart.
Performance Total Return Percentage as of 05.31.2022
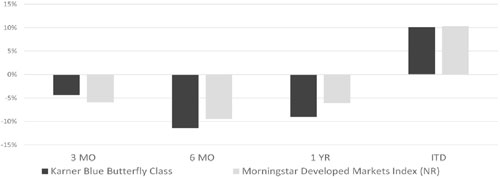
| 7 | Business for Nature. Retrieved at: https://www.businessfornature.org/. |
4
| ITD | ||||
| Total Return Percentage as of 5.31.2022 | 3 MO | 6 MO | 1 YR | 9.17.19^ |
| Karner Blue Biodiversity Impact Fund ButterflyTM Class | -4.39 | -11.46 | -9.07 | 10.08 |
| Morningstar Developed Markets (NR) USD Index | -5.93 | -9.49 | -6.08 | 10.30 |
Returns for periods over one year are annualized.
| ^ | ITD is the inception-to-date return from 9.17.2019 through 5.31.2022. |
Source: Ultimus Fund Solutions, LLC
As of March 31, 2022, the Fund’s one-year and since-inception returns were 5.91% and 14.90%, respectively.
Past performance is not predictive of future performance. Investment results and principal value will fluctuate so that shares, when redeemed, may be worth less than their original cost. An investor should consider the investment objectives, risks, charges, and expenses of the Fund carefully before investing. The Fund’s prospectus contains this and other important information, and it should be read carefully before investing. Current performance may be lower or higher than the performance data quoted. For most recent month-end performance information or to obtain a prospectus, visit www.biodiversityimpactfund.com or call 1-855-KBANIML (855-522-6465).
The Fund’s underperformance relative to the Morningstar Index during the Reporting Period was attributable to weak stock selection in the Consumer Cyclical sector as well as the lack of any exposure to the oil, gas and coal Energy subsector as prices for those commodities doubled in response to Russia’s hostilities, which accounted for the vast majority of the Fund’s performance differential on a net of fees basis. Notably strong stock selection in the Healthcare sector helped to offset some of the underperformance. From a geographic perspective the Fund’s underperformance during the Reporting Period was primarily attributable to weak stock selection in the U.S. and Canada. As the solar and electric vehicle industries continue to rapidly evolve, it is noteworthy that five of the six companies identified in the charts below as top Fund contributors and detractors operate in, or are strongly connected to, those industries. As of May 31, 2022, approximately one-fifth of the Fund’s portfolio, in the aggregate, was allocated to the solar and electric vehicle industries, which we see as having strong upside potential within the new energy world order that has emerged as a result of the war in Ukraine.
The three stocks that most positively impacted Fund performance during the Reporting Period were as follows:
| Contribution | |
| to the Fund’s | |
| Return During | |
| the Fiscal | |
| Holding | Year |
| Enphase Energy Inc. | 0.81% |
| NVIDIA Corp. | 0.60% |
| Livent Corp. | 0.58% |
5
The three stocks that most negatively impacted Fund performance during the Reporting Period were as follows:
| Contribution | |
| to the Fund’s | |
| Return During | |
| the Fiscal | |
| Holding | Year |
| Lightning eMotors Inc. | -0.95% |
| ChargePoint Holdings, Inc. | -0.93% |
| Shoals Technologies Group Inc. | -0.69% |
Our outlook for NVIDIA Corp. and Lightning eMotors, Inc. has not materially changed since we last reported on each company. For a discussion of our views regarding these companies please see the Fund’s Semi-Annual Report for the period ended November 30, 2021. Those discussions are incorporated herein by reference. The other four companies listed in the charts above are discussed below.
Enphase Energy Inc. (“Enphase”) was the largest contributor to Fund performance during the Reporting Period fueled by record Q1 FY 2022 quarterly revenue of $441.3 million, which helped to grow quarterly non-GAAP diluted earnings 41.0% YOY to $0.79 per share. Management also guided Q2 revenue higher to an estimated $505 million, which was well above consensus expectations of approximately $446 million. Enphase is a global energy technology company that provides solutions spanning solar generation, home energy storage and web-based monitoring and control. The company primarily engages in the design, development, manufacture, and sale of micro inverter systems for the solar photovoltaic industry. These microinverters convert direct current power (DC) into alternating current (AC) at the individual solar panel level and provide advanced energy monitoring and control when combined with Enphase’s proprietary networking and software technologies. By comparison, a central inverter system uses string modules (with or without an optimizer) to convert energy of the entire solar panel array using a single high voltage electrical unit that lacks intelligence about the energy producing capacity of the solar array, which makes microinverters a much more effective and efficient solution. Robust demand for Enphase products, coupled with improvements in component availability, contributed to an impressive non-GAAP gross margin of 41.0% during Q1 FY 2022. Enphase also reported minimal impact from a U.S. Commerce Department investigation into whether solar product manufacturers used factories in Southeast Asia to circumvent American tariffs on imports from China (the “Tariff Investigation”), and forecast very strong demand for its products in Europe as the continent pivots strongly away from Russian oil and gas toward renewable energy.
Livent Corp., a Fund holding within the Basic Materials sector, was a top performer during the Reporting Period as Q1 FY 2022 earnings and revenue exceeded analyst expectations due primarily to a surge in realized prices for its lithium products, which are essential for the global adoption of rechargeable electric vehicle batteries and stationary storage systems. The higher realized prices also enabled management to guide full year 2022 revenue and adjusted EBITDA significantly higher even though anticipated sales
6
volumes remained unchanged. At the midpoint of the applicable ranges, 2022 revenue and adjusted EBITDA were raised 89 percent and 360 percent, respectively. In 2021, Livent announced a set of new sustainability goals, having successfully achieved nearly all of its prior sustainability goals five years ahead of schedule. The new goals, which will be measured against a 2019 baseline, include (i) reducing greenhouse gas emissions by 30 percent by 2030 and achieving carbon neutrality by 2040, (ii) transitioning 30 percent of the company’s energy mix to renewable sources by 2030, (iii) reducing water and waste intensity by 30 percent by 2030, (iv) enhancing research and development of green technologies, processes and products, and (v) formalizing involvement in industry initiatives to advance zero emission transportation and lithium battery recycling. Livent’s CEO recently indicated that Livent has been investing primarily in technology to reduce its water usage, which could massively reduce and possibly eliminate the company’s use of evaporation ponds.8 Earlier this year, Livent announced that it had initiated a voluntary, third-party assessment of its Fenix lithium brine extraction and manufacturing operations at the Salar del Hombre Muerto salt pan in Catamarca, Argentina. This independent assessment of the company’s Fenix site is the next step in a multi-stage review pursuant to the Initiative for Responsible Mining Assurance (IRMA) Standard, which is widely considered to be the most comprehensive and rigorous set of operating requirements for mining companies. Among other things, it includes a multi-stakeholder approach for defining robust criteria and evaluating performance in environmental management, labor practices, human rights, health & safety and community interests. Livent began the IRMA self-assessment of its Fenix site in February of 2021, becoming the first company in Argentina to begin the process and one of the first in the global lithium industry. With the commencement of the third-party assessment, Livent is now a full member of IRMA, joining other leading companies and organizations around the world working to advance responsible mining practices.
ChargePoint Holdings, Inc. was the second largest detractor from Fund performance during the Reporting Period as uncertainty mounted regarding the governmental support that would be provided to the EV market after negotiations related to President Biden’s Build Back Better plan collapsed. On May 31, 2022, ChargePoint demonstrated continued strong growth in its operations with Q1 FY 2023 revenue increasing 102% YOY to $81.6 million resulting in diluted EPS of -$0.27, which missed analyst expectations. The company’s FY 2023 guidance foresees a near doubling of revenue to between $450 and $500 million as well as margin expansion, although gross margins for the quarter were sharply lower due to the addition of several lower margin products. Management explained that gross margins are expected to recover during the remainder of the year due to three main factors: (i) fewer supply constraints for mature products; (ii) continued technology-driven margin improvements for newer products; and (iii) continued efforts to pass on higher component costs. ChargePoint is a key enabler of the electric mobility market, which is essential to reducing greenhouse gas emissions and building a sustainable economy that is not reliant on fossil fuels. The company has invested in, developed, and deployed one of the world’s leading EV charging networks in the U.S. and
| 8 | Innovation News Network. Sustainability is at the forefront of lithium extraction thanks to new technologies (October 11, 2021). Retrieved from: https://www.innovationnewsnetwork.com/sustainability-at-forefront-of-lithium-extraction-thanks-to-new-technologies/14906/. |
7
Europe serving passenger cars, city buses, heavy duty trucks and delivery vans, and the company’s commercial and residential charging stations are the first on the market to be ENERGY STAR® certified. ChargePoint also works to facilitate the adoption of EV fleets by providing its business clients with real-time access to actionable environmental impact data that enables businesses, fleet managers, multifamily property owners and drivers to plan, measure, and understand an organization’s environmental impact and achieve its sustainability goals. In March 2022, ChargePoint was included on Fast Company’s list of the World’s Most Innovative Companies for 2022 with the release noting that “ChargePoint’s solution portfolio includes everything needed to electrify and optimize fueling, regardless of the size, use or type of vehicle. ChargePoint’s significant software capabilities and range of AC and DC fast charging solutions balance charging costs with operational readiness, making ChargePoint a key partner in the efficient and rapid electrification of transportation.”9
Shoals Technologies Group, Inc. was the third largest detractor from Fund performance during the Reporting Period as the aforementioned Tariff Investigation weighed on investor sentiment regarding the company’s sales and growth prospects. Shoals is a leading provider of electrical balance of system (“EBOS”) solutions for utility-scale solar energy projects, primarily in the United States, and this year the company also entered the vehicle charging market. EBOS components are mission-critical products that have a high consequence of failure, including lost revenue, equipment damage, fire damage, and even serious injury or death. Shoals holds 20 patents that enable it to integrate the functionality of cable assemblies, combiner boxes and fusing into a single product using simple push connectors that improve reliability and safety and reduce installation costs by not requiring licensed electricians. The company believes its “system solutions are unique in [the solar] industry because they integrate design and engineering support, proprietary components and innovative installation methods into a single offering that would otherwise be challenging for a customer to obtain from a single provider or at all.”10 On May 16, 2022, the company disappointed when it reported Q1 FY 2022 EPS of $0.05 on revenue of $68 million and lowered its previous FY 2022 revenue, EBITDA, and net income guidance due to solar component shortages stemming from the Tariff Investigation. However, on June 6, the Biden administration intervened in the Tariff Investigation, asserting that certain tariffs would not be imposed for at least 24 months, regardless of the outcome of the Tariff Investigation. The removal of this sword of Damocles is expected to induce Southeast Asian solar component suppliers to restart shipments to the US in the short-term. We maintain a constructive outlook for this company due to the recent resolution to the Tariff Investigation and Shoals’ gross margins, sales growth, US market dominance, and expectations for product adoption in Europe, Latin America and Australia.
| 9 | ChargePoint Holdings, Inc. Press Release. ChargePoint named to Fast Company’s World’s Most Innovative Companies for 2022. Retrieved from: https://investors.chargepoint.com/news/news-details/2022/ ChargePoint-named-to-Fast-Companys-Worlds-Most-Innovative-Companies-for-2022/default.aspx. |
| 10 | Shoals Technologies Group, Inc. Form S-3 as filed with the Securities and Exchange Commission on January 25, 2021. Retrieved from: https://www.sec.gov/Archives/edgar/data/1831651/000119312521015486/ d801436ds1a.htm. |
8
OUTLOOK
The Reporting Period was dominated by the same 3 i’s – inflation, infrastructure and imbalances – that we noted in the most recent Semi-Annual Report, but with some new twists. Inflation persisted at historic levels, while negotiations around President Biden’s Build Back Better plan completely collapsed. Concerns over commodity imbalances grew throughout the Reporting Period as Russia amassed a military presence on Ukraine’s border starting in December and then invaded the country on February 24, 2022. The resulting sanctions on the Russian economy coupled with Europe’s bold action to reduce its reliance on Russian oil and natural gas have thrown global energy markets into turmoil and driven commodity prices higher. With the European Union relying on Russia for approximately 45 percent of its gas imports and 40 percent of its gas consumption, the economic impacts of the war will be disproportionately borne by Europe. The war in Ukraine has also led to a significant increase in agricultural commodity prices, which is exacerbating food insecurity and extreme poverty in many emerging market and developing economies. These higher energy and food prices immediately lower real incomes, raise production costs, produce tighter financial conditions, and add further fuel to the inflationary fire. Amid all of this, the world also had to deal with the impacts of the Omicron Covid wave, which was the largest infection wave of the entire pandemic and produced a record 1.35 million new Covid cases in the U.S. on January 10, 2022 alone. Although the wave declined sharply into the end of January, new more virulent Omicron subvariants have emerged causing daily new cases in the U.S. to average roughly 100,000 over the past few months. Accordingly, at the start of this year, the International Monetary Fund slashed one-half of a percentage point from its October 2021 forecast for global economic growth in 2022, citing the rapid spread of the Omicron variant, higher energy prices, supply chain constraints, rising inflation, and a deteriorating outlook for the world’s two biggest economies – the United States and China. Expectations that the war in Ukraine will weigh on investment and global trade in the near term coupled with the anticipated withdrawal of fiscal and monetary stimulus prompted the IMF to again slash anticipated growth rates in April. After a recovery-fueled 6.1% spurt of global economic growth in 2021, the IMF now forecasts global economic growth of 3.6% in 2022 and 2023. Currently, the IMF expects the United States, the Euro Area, and China to grow 3.7%, 2.8% and 4.4%, respectively, in 2022. The longer-term outlook is even worse for advanced economies in general with the IMF expecting the group, as a whole, to grow only 2.3% in 2023. It therefore appears that the disruptions to global commodity flows triggered by the war in Ukraine have perched the global economy on the precipice of a stagflationary period.
It is also increasingly apparent that a global labor force in transition is contributing to global labor shortages that are exacerbating both supply chain constraints and inflationary pressures. The combined impact of early retirements, altered personal priorities amid the pandemic, Covid-related deaths, employee exhaustion, and volatile shifts in consumer demand in response to multiple Covid waves have caused labor market upheaval. Factory workers, truck drivers, warehouse workers, dock workers, hospitality workers and travel/ tourism workers are in especially short supply, and companies of all stripes are scrambling to make adjustments to their hiring and retention practices, compensation packages, and work/life balance for employees. According to the U.S. Chamber of Commerce “member companies of every size and industry, across nearly every state,…are facing
9
unprecedented challenges trying to find enough workers to fill open jobs.”11 The Chamber also reported that, as of early June 2022, the U.S. had 11.4 million job openings, but only 6.0 million unemployed workers, and countries across the globe were facing comparable labor shortages. Worse still, many countries are experiencing a mismatch between the skills workers offer and those that employers need, which can only be addressed through the implementation of longer-term policy changes that promote retraining and geographic mobility. Therefore, if central banks fail to expeditiously dampen consumer demand by driving interest rates higher quickly enough, the labor market tightness will likely remain unresolved and produce persistently upward pressure on corporate expenses. In this environment, companies with pricing power will likely pass along those increased costs, fueling further inflation, and companies without pricing power will likely experience earnings compression, making careful stock selection even more important.
The Federal Reserve’s sudden about-face late last year in favor of a more hawkish monetary policy put to bed the notion that the inflationary pressures in the economy would be transitory and implemented a course correction with respect to the Federal Reserve’s implementation of its “dual mandate” by placing greater emphasis on stable prices over full employment. In December the U.S. central bank decided to taper its bond purchases more rapidly than originally announced and, on March 16, 2022, it raised the Fed Funds rate by 0.25%, moving that key rate to a 0.25% to 0.50% range. At that time, the Federal Reserve signaled a steadfast focus on combatting inflation by indicating that it expects the Fed Fund’s rate will be increased at each of the six remaining meetings in 2022, leading to a Fed Fund’s rate of nearly 2% by year end. In reality, the Fed Funds rate arrived at that level much earlier as a result of a 50 basis point hike in early May and an additional 75 basis point hike in mid-June after the U.S. Consumer Price Index for May jumped 8.6% on an annualized basis, the largest increase in more than 40 years. As a result, in just three months, the Fed Funds rate moved from nearly zero to a range of 1.50 percent to 1.75 percent even though consumer sentiment in June, as measured by the University of Michigan, fell to lowest level ever recorded since the start of the survey in the late 1940s. At the same time, the Federal Reserve is continuing the process of significantly reducing its balance sheet to unwind some of the quantitative easing that has supported markets since the Great Recession, which may remove a key support for the housing market and introduce additional liquidity risk for the financial markets as the central bank attempts to successfully execute a maneuver that it has never before performed. In June, Chairman Powell explained that, while there are pathways to achieving the Federal Reserve’s goal of “two percent inflation consistent with a strong labor market…, those pathways have become much more challenging due to factors that are not under our control…[T]he fallout from the war in Ukraine…has brought a spike in prices of energy, food, fertilizer and industrial chemicals, and also just the supply chain [problems] more broadly…[have]…been larger and longer-lasting than anticipated.”12 In May, President Lagarde confirmed that the European Central Bank is also seeking to achieve a two percent inflation rate over the medium-term but adopted a more dovish perspective in light of the
| 11 | U.S. Chamber of Commerce. Understanding America’s Labor Shortage (June 3, 2022). Retrieved at: https:// www.uschamber.com/workforce/understanding-americas-labor-shortage. |
| 12 | Powell, Chairman Jerome. Transcript of Chair Powell’s Press Conference (June 15, 2022). Retrieved at: https://www.federalreserve.gov/mediacenter/files/FOMCpresconf20220615.pdf. |
10
numerous economic cross-currents buffeting Europe, including manufacturing sector retrenchment, broad-based consumer pessimism, and an uncertain outlook for private consumption. She explained that “the environment facing monetary policy today has changed significantly from that which we confronted before the pandemic. The tools we were deploying at that time, aimed at combating persistent too-low inflation, are no longer appropriate. But we are also not facing a straightforward situation of excess aggregate demand: in fact, supply shocks are raising inflation and slowing growth in the near term. This means that policy normalisation has to be carefully calibrated to the conditions we face...[T]he speed of policy adjustment, and its end point, will depend on how the shocks develop and how the medium-term inflation outlook evolves as we move forward.”13
Ultimately, the global economy appears to be in a fragile state as a result of the back-to-back supply shocks caused by Covid and Ukraine. The inflationary pressures from higher oil, gas and food prices, coupled with the aforementioned tight labor markets, gives rise to a not insignificant risk that central bank tightening will come too little, too late to prevent an inflationary spiral that could choke off growth and result in 1970’s-like stagflation. Moreover, as “central banks…deliver contractionary shocks to an economy that’s already set to disappoint, there’s a heightened risk that central banks discover that they’ve pushed the economy below the stall speed.”14 While an end to the war in Ukraine could mitigate some of the global economic stress, that would not likely cause the recent realignment of the global energy markets to be unwound. As such, it seems reasonable to expect high energy prices to persist until new investment can bring more non-Russian energy supplies online. Accordingly, the likelihood and depth of recessions in certain countries or regions would now appear to be largely dependent upon the future availability of energy supplies to meet demand, especially during the winter months in the Northern Hemisphere, and how effectively and precisely monetary authorities and government officials respond to the exigencies of the day with monetary and fiscal policy tools.
A potential silver lining to emerge from the Russian hostilities is the momentum that is building to accelerate the European Green Deal, which is the European Union’s sustainable economic growth strategy and transition plan. While the European Union sourced 22.1% of its energy needs from renewables in 2020, Europeans strongly support increasing that share with significant investments in solar, wind and hydrogen projects in order to reduce the EU’s dependency on Russian oil, gas and coal.15 To that end, Germany’s Economy Ministry expedited parliament’s passage of amendments to the Renewable Energy Sources Act (the “Act”) to enable them to come into force by July 1, 2022.16 As revised, the Act will suspend cuts to subsidies for new solar panels on roofs this year,
| 13 | Lagarde, President Christine. The ECB Blog: Monetary policy normalisation in the euro area. Retrieved from: https://www.ecb.europa.eu/press/blog/date/2022/html/ecb.blog220523~1f44a9e916.en.html .. |
| 14 | Goldman Sachs. Top of Mind: Stagflation Risk (Issue 107, March 14, 2022). Interview with Jan Hatzius, Goldman Sachs’ Head of Global Investment Research and Chief Economist. Retrieved from: https://www.goldmansachs.com/insights/pages/gs-research/top-of-mind-stagflation-risk/report.pdf. |
| 15 | European Environment Agency. Share of energy consumption from renewable sources in Europe (March 4, 2022). Retrieved from: https://www.eea.europa.eu/ims/share-of-energy-consumption-from. |
| 16 | Lewis, Michelle. Germany boosts clean energy target to 80% from 65% by 2030 (April 6, 2022). Electrek. Retrieved from: https://electrek.co/2022/04/06/germany-boosts-clean-energy-target-to-80-from-65-by-2030/. |
11
quintuple investments in wind projects by 2027 (from about 2 gigawatts (GW) per year now to about 10 GW), and quadruple investments in solar projects by 2028 (from about 5 GW per year now to about 20 GW). These steps, if achieved, would enable renewable sources to account for 80 percent of Germany’s electricity needs by 2030 and 100 percent by 2035, with offshore wind energy capacity reaching 30 GW, onshore wind energy capacity doubling to 110 GW, and solar energy capacity tripling to 200 GW. At the same time, Germany has also done an about-face earlier this year and now fully supports the European Union’s proposed moratorium on the sale of cars and vans powered by internal combustion engines after 2035. In contrast to the government’s prior position, Germany will not even seek a post-2035 exemption for cars powered by e-fuels, which are synthetic fuels that are chemically similar to fossil fuels. These trends, especially if they spill over into the U.S., will likely provide a tailwind to the Fund, which currently holds solar and electric vehicle positions that account for about one-fifth of the portfolio.
CONCLUSION
On behalf of the entire Karner Blue Capital team we thank you for your investment in the Karner Blue Biodiversity Impact Fund and look forward to continuing to work with you to build a shared future for all life.
Sincerely,
| Vicki L. Benjamin | Andrew K. Niebler |
| President & Co-Founder | Executive Vice President & Co-Founder |
| Karner Blue Capital, LLC | Karner Blue Capital, LLC |
Past performance is not predictive of future performance. Investment results and principal value will fluctuate so that shares, when redeemed, may be worth more or less than their original cost. Current performance may be higher or lower than the performance data quoted. Performance data current to the most recent month end are available by calling 1-855-KBANIML (855-522-6465).
An investor should consider the investment objectives, risks, charges, and expenses of the Fund carefully before investing. The Fund’s prospectus contains this and other important information. To obtain a copy of the Fund’s prospectus please visit our website at www.biodiversityimpactfund.com or call 1-855-KBANIML (855-522-6465) and a copy will be sent to you free of charge. Please read the prospectus carefully before you invest. The Karner Blue Biodiversity Impact Fund is distributed by Ultimus Fund Distributors, LLC.
The Letter to Shareholders seeks to describe some of the Adviser’s current opinions and views of the financial markets. Although the Adviser believes it has a reasonable basis for any opinions or views expressed, actual results may differ, sometimes significantly so, from those expected or expressed. The securities held by the Fund that are discussed in the Letter to Shareholders were held during the period covered by this Report. They do not comprise the entire investment portfolio of the Fund, may be sold at any time and may no longer be held by the Fund. For a complete list of securities held by the Fund as of May 31, 2022, please see the Schedule of Investments section of the Annual Report. The opinions of the Adviser with respect to those securities may change at any time.
12
Statements in the Letter to Shareholders that reflect projections or expectations for future financial or economic performance of the Fund and the market in general and statements of the Fund’s plans and objectives for future operations are forward-looking statements. No assurance can be given that actual results or events will not differ materially from those projected, estimated, assumed, or anticipated in any such forward- looking statements. Important factors that could result in such differences, in addition to factors noted with such forward-looking statements include, without limitation, general economic conditions, such as inflation, recession, and interest rates. Past performance is not a guarantee of future results.
13
| KARNER BLUE BIODIVERSITY IMPACT FUND |
| PERFORMANCE INFORMATION |
| May 31, 2022 (Unaudited) |
Comparison of the Change in Value of a $10,000 Investment in
Karner Blue Biodiversity Impact Fund - Butterfly™ Class (since inception on
09/17/2019) versus the Morningstar Developed Markets NR USD Index
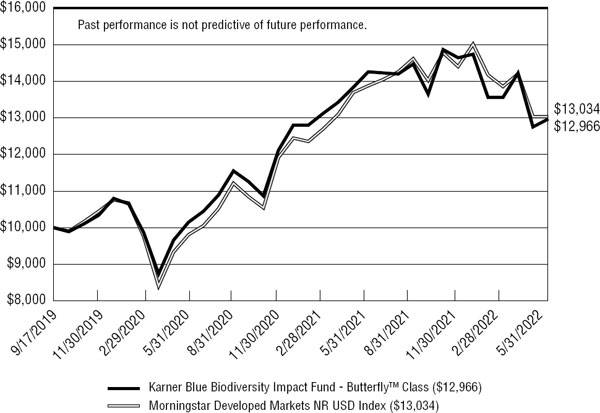
| Average Annual Total Returns (for the periods ended May 31, 2022) | ||||
| Since Inception | ||||
| 1 Year | (09/17/2019) | |||
| Karner Blue Biodiversity Impact Fund - Butterfly™ Class (a) | (9.07%) | 10.08% | ||
| Morningstar Developed Markets NR USD Index (b) | (6.08%) | 10.30% | ||
| (a) | The Fund’s total returns do not reflect the deduction of taxes a shareholder would pay on Fund distributions or the redemption of Fund shares. |
| (b) | The Morningstar Developed Markets NR USD Index measures the performance of developed regional markets targeting the top 97% of stocks by market capitalization. This index does not incorporate Environmental, Social, or Governance (ESG) criteria. The Index is unmanaged and shown for illustration purposes only. An investor cannot invest in an index and its return is not indicative of the performance of any specific investment. |
Karner Blue Biodiversity Impact Fund (the “Fund”) is not sponsored, endorsed, sold or promoted by Morningstar, Inc. or any of its affiliates (all such entities, collectively, “Morningstar Entities”). The Morningstar Entities make no representation or warranty, express or implied, to the owners of the Fund or any member of the public regarding the advisability of investing in equity securities generally or in the Fund in particular or the ability of the Fund to track general equity market performance. THE MORNINGSTAR ENTITIES DO NOT GUARANTEE THE ACCURACY AND/OR THE COMPLETENESS OF THE FUND OR ANY DATA INCLUDED THEREIN AND MORNINGSTAR ENTITIES SHALL HAVE NO LIABILITY FOR ANY ERRORS, OMISSIONS, OR INTERRUPTIONS THEREIN.
14
| KARNER BLUE BIODIVERSITY IMPACT FUND |
| PORTFOLIO INFORMATION |
| May 31, 2022 (Unaudited) |
Portfolio Allocation (% of Net Assets)
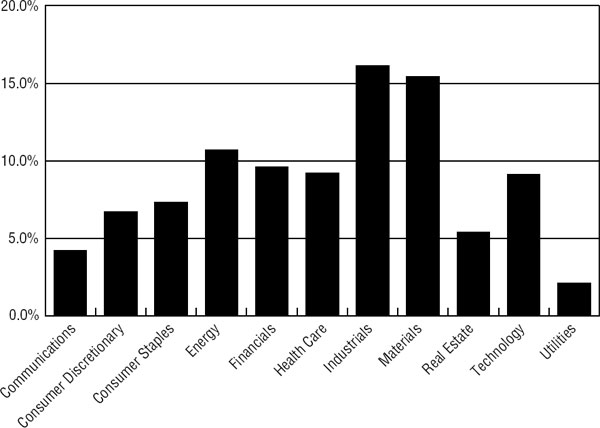
Top 10 Equity Holdings
| % of | |
| Security Description | Net Assets |
| Enphase Energy, Inc. | 3.4% |
| Livent Corporation | 2.9% |
| SolarEdge Technologies, Inc. | 2.1% |
| Microsoft Corporation | 2.0% |
| BNP Paribas S.A. - ADR | 1.9% |
| McCormick & Company, Inc. | 1.9% |
| Hershey Company (The) | 1.9% |
| Proctor & Gamble Company (The) | 1.9% |
| Sanofi - ADR | 1.8% |
| Goldman Sachs Group, Inc. (The) | 1.7% |
15
| KARNER BLUE BIODIVERSITY IMPACT FUND |
| SCHEDULE OF INVESTMENTS |
| May 31, 2022 |
| COMMON STOCKS — 95.7% | Shares | Value | ||||||
| Communications — 4.2% | ||||||||
| Entertainment Content — 1.1% | ||||||||
| Walt Disney Company (The) (a) | 935 | $ | 103,262 | |||||
| Internet Media & Services — 1.6% | ||||||||
| Alphabet, Inc. - Class A (a) | 64 | 145,615 | ||||||
| Telecommunications — 1.5% | ||||||||
| Iridium Communications, Inc. (a) | 3,756 | 139,385 | ||||||
| Consumer Discretionary — 6.7% | ||||||||
| Apparel & Textile Products — 2.0% | ||||||||
| Levi Strauss & Company - Class A | 7,675 | 139,378 | ||||||
| NIKE, Inc. - Class B | 410 | 48,729 | ||||||
| 188,107 | ||||||||
| Automotive — 3.1% | ||||||||
| Cie Generale des Etablissements Michelin - ADR | 2,630 | 68,459 | ||||||
| Lightning eMotors, Inc. (a) | 21,341 | 85,577 | ||||||
| Proterra, Inc. (a) | 14,775 | 95,299 | ||||||
| Tesla, Inc. (a) | 55 | 41,704 | ||||||
| 291,039 | ||||||||
| Home & Office Products — 1.6% | ||||||||
| Panasonic Holdings Corporation - ADR | 15,605 | 143,254 | ||||||
| Consumer Staples — 7.3% | ||||||||
| Food — 3.8% | ||||||||
| Hershey Company (The) | 825 | 174,661 | ||||||
| McCormick & Company, Inc. | 1,900 | 176,168 | ||||||
| 350,829 | ||||||||
| Household Products — 1.9% | ||||||||
| Procter & Gamble Company (The) | 1,163 | 171,984 | ||||||
| Retail - Consumer Staples — 1.6% | ||||||||
| Kroger Company (The) | 1,055 | 55,883 | ||||||
| Target Corporation | 585 | 94,700 | ||||||
| 150,583 | ||||||||
16
| KARNER BLUE BIODIVERSITY IMPACT FUND |
| SCHEDULE OF INVESTMENTS (Continued) |
| COMMON STOCKS — 95.7% (Continued) | Shares | Value | ||||||
| Energy — 10.7% | ||||||||
| Renewable Energy — 10.7% | ||||||||
| Array Technologies, Inc. (a) | 6,475 | $ | 71,743 | |||||
| Enphase Energy, Inc. (a) | 1,665 | 310,006 | ||||||
| First Solar, Inc. (a) | 1,295 | 91,440 | ||||||
| Plug Power, Inc. (a) | 4,620 | 85,378 | ||||||
| Shoals Technologies Group, Inc. - Class A (a) | 6,340 | 98,904 | ||||||
| SolarEdge Technologies, Inc. (a) | 715 | 195,045 | ||||||
| Stem, Inc. (a) | 9,380 | 81,043 | ||||||
| Vestas Wind Systems A/S - ADR | 6,675 | 56,270 | ||||||
| 989,829 | ||||||||
| Financials — 9.6% | ||||||||
| Asset Management — 1.1% | ||||||||
| UBS Group AG | 5,325 | 100,483 | ||||||
| Banking — 5.9% | ||||||||
| Bank of Montreal | 1,330 | 144,823 | ||||||
| BNP Paribas S.A. - ADR | 6,142 | 176,398 | ||||||
| Citigroup, Inc. | 1,475 | 78,780 | ||||||
| ING Groep N.V. - ADR | 12,653 | 143,232 | ||||||
| 543,233 | ||||||||
| Institutional Financial Services — 1.7% | ||||||||
| Goldman Sachs Group, Inc. (The) | 480 | 156,888 | ||||||
| Insurance — 0.9% | ||||||||
| AXA S.A. - ADR | 3,475 | 87,883 | ||||||
| Health Care — 9.2% | ||||||||
| Biotech & Pharma — 9.2% | ||||||||
| AstraZeneca plc - ADR | 2,325 | 154,566 | ||||||
| Bristol-Myers Squibb Company | 1,375 | 103,744 | ||||||
| Merck & Company, Inc. | 1,400 | 128,842 | ||||||
| Novartis AG - ADR | 1,025 | 93,213 | ||||||
| Novo Nordisk A/S - ADR | 1,015 | 112,056 | ||||||
| Roche Holding AG - ADR | 2,044 | 86,952 | ||||||
| Sanofi - ADR | 3,190 | 169,867 | ||||||
| 849,240 | ||||||||
17
| KARNER BLUE BIODIVERSITY IMPACT FUND |
| SCHEDULE OF INVESTMENTS (Continued) |
| COMMON STOCKS — 95.7% (Continued) | Shares | Value | ||||||
| Industrials — 16.0% | ||||||||
| Commercial Support Services — 2.5% | ||||||||
| Schnitzer Steel Industries, Inc. - Class A | 3,090 | $ | 125,516 | |||||
| Waste Management, Inc. | 695 | 110,164 | ||||||
| 235,680 | ||||||||
| Electrical Equipment — 3.1% | ||||||||
| ChargePoint Holdings, Inc. (a) | 11,187 | 143,081 | ||||||
| Daikin Industrials, Ltd. - ADR | 3,000 | 48,600 | ||||||
| Trimble, Inc. (a) | 1,415 | 96,291 | ||||||
| 287,972 | ||||||||
| Engineering & Construction — 2.1% | ||||||||
| NV5 Global, Inc. (a) | 765 | 94,233 | ||||||
| Quanta Services, Inc. | 815 | 96,985 | ||||||
| 191,218 | ||||||||
| Machinery — 4.8% | ||||||||
| AGCO Corporation | 785 | 100,582 | ||||||
| CNH Industrial N.V. | 9,005 | 134,445 | ||||||
| Deere & Company | 225 | 80,500 | ||||||
| GrafTech International Ltd. | 14,825 | 128,681 | ||||||
| 444,208 | ||||||||
| Transportation & Logistics — 2.7% | ||||||||
| A.P. Moller-Maersk A/S - B Shares - ADR | 5,620 | 82,108 | ||||||
| Kuehne & Nagel International AG - ADR | 1,535 | 81,447 | ||||||
| ZIM Integrated Shipping Services Ltd. | 1,300 | 82,771 | ||||||
| 246,326 | ||||||||
| Transportation Equipment — 0.8% | ||||||||
| Lion Electric Company (The) (a) | 11,003 | 63,488 | ||||||
| Materials — 15.4% | ||||||||
| Chemicals — 1.1% | ||||||||
| Air Products & Chemicals, Inc. | 190 | 46,771 | ||||||
| Koninklijke DSM N.V. - ADR | 1,210 | 51,352 | ||||||
| 98,123 | ||||||||
| Construction Materials — 4.2% | ||||||||
| CRH plc - ADR | 2,255 | 93,560 | ||||||
| Holcim Ltd. - ADR | 14,852 | 146,738 | ||||||
| Owens Corning | 1,585 | 151,494 | ||||||
| 391,792 | ||||||||
18
| KARNER BLUE BIODIVERSITY IMPACT FUND |
| SCHEDULE OF INVESTMENTS (Continued) |
| COMMON STOCKS — 95.7% (Continued) | Shares | Value | ||||||
| Materials — 15.4% (Continued) | ||||||||
| Forestry, Paper & Wood Products — 1.1% | ||||||||
| Trex Company, Inc. (a) | 1,536 | $ | 97,874 | |||||
| Metals & Mining — 7.8% | ||||||||
| Fortescue Metals Group Ltd. - ADR | 3,115 | 90,023 | ||||||
| Freeport-McMoRan, Inc. | 3,021 | 118,061 | ||||||
| Livent Corporation (a) | 8,410 | 267,354 | ||||||
| MP Materials Corporation (a) | 3,505 | 138,202 | ||||||
| Newmont Corporation | 1,652 | 112,088 | ||||||
| 725,728 | ||||||||
| Steel — 1.2% | ||||||||
| Commercial Metals Company | 2,765 | 109,854 | ||||||
| Real Estate — 5.4% | ||||||||
| REITs — 5.4% | ||||||||
| Gladstone Land Corporation | 4,000 | 107,360 | ||||||
| Hannon Armstrong Sustainable Infrastructure Capital, Inc. | 2,985 | 113,639 | ||||||
| Prologis, Inc. | 985 | 125,568 | ||||||
| Weyerhaeuser Company | 3,940 | 155,709 | ||||||
| 502,276 | ||||||||
| Technology — 9.1% | ||||||||
| Semiconductors — 4.8% | ||||||||
| Analog Devices, Inc. | 490 | 82,516 | ||||||
| Intel Corporation | 2,010 | 89,284 | ||||||
| NVIDIA Corporation | 815 | 152,177 | ||||||
| Semtech Corporation (a) | 1,840 | 117,926 | ||||||
| 441,903 | ||||||||
| Software — 3.9% | ||||||||
| Autodesk, Inc. (a) | 230 | 47,783 | ||||||
| Microsoft Corporation | 670 | 182,153 | ||||||
| Synopsys, Inc. (a) | 412 | 131,510 | ||||||
| 361,446 | ||||||||
| Technology Hardware — 0.4% | ||||||||
| Sony Group Corporation - ADR | 435 | 40,920 | ||||||
| Utilities — 2.1% | ||||||||
| Electric & Gas Marketing & Trading — 1.0% | ||||||||
| Orsted A/S - ADR | 2,600 | 96,460 | ||||||
19
| KARNER BLUE BIODIVERSITY IMPACT FUND |
| SCHEDULE OF INVESTMENTS (Continued) |
| COMMON STOCKS — 95.7% (Continued) | Shares | Value | ||||||
| Utilities — 2.1% (Continued) | ||||||||
| Electric Utilities — 1.1% | ||||||||
| Avangrid, Inc. | 1,025 | $ | 48,780 | |||||
| PG&E Corporation (a) | 3,975 | 48,495 | ||||||
| 97,275 | ||||||||
| Total Common Stocks (Cost $8,432,840) | $ | 8,844,157 | ||||||
| MONEY MARKET FUNDS — 3.5% | Shares | Value | ||||||
| First American Government Obligations Fund - Class X, 0.66% (b) | ||||||||
| (Cost $326,362) | 326,362 | $ | 326,362 | |||||
| Investments at Value — 99.2% (Cost $8,759,202) | $ | 9,170,519 | ||||||
| Other Assets in Excess of Liabilities — 0.8% | 77,723 | |||||||
| Net Assets — 100.0% | $ | 9,248,242 | ||||||
A/S - Aktieselskab
ADR - American Depositary Receipt
AG - Aktiengesellschaft
N.V. - Naamloze Vennootschap
plc - Public Limited Company
S.A. - Societe Anonyme
| (a) | Non-income producing security. |
| (b) | The rate shown is the 7-day effective yield as of May 31, 2022. |
See accompanying notes to financial statements.
20
| KARNER BLUE BIODIVERSITY IMPACT FUND |
| STATEMENT OF ASSETS AND LIABILITIES |
| May 31, 2022 |
| ASSETS | ||||
| Investments in securities: | ||||
| At cost | $ | 8,759,202 | ||
| At value (Note 2) | $ | 9,170,519 | ||
| Receivable for capital shares sold | 350 | |||
| Receivable for investment securities sold | 125,146 | |||
| Receivable from Adviser (Note 4) | 1,790 | |||
| Dividend and income receivable | 40,774 | |||
| Other assets | 5,189 | |||
| Total assets | 9,343,768 | |||
| LIABILITIES | ||||
| Payable for investment securities purchased | 80,928 | |||
| Payable to administrator (Note 4) | 7,576 | |||
| Accrued administrative services fee (Note 4) | 30 | |||
| Other accrued expenses | 6,992 | |||
| Total liabilities | 95,526 | |||
| NET ASSETS | $ | 9,248,242 | ||
| NET ASSETS CONSIST OF: | ||||
| Paid-in capital | $ | 8,659,135 | ||
| Distributable earnings | 589,107 | |||
| NET ASSETS | $ | 9,248,242 | ||
| NET ASSET VALUE PER SHARE: | ||||
| BUTTERFLY™ CLASS | ||||
| Net assets applicable to Butterfly™ Class | $ | 9,248,242 | ||
| Butterfly™ Class shares of beneficial interest outstanding (unlimited number of shares authorized, no par value) | 801,059 | |||
| Net asset value, offering price and redemption price per share (Note 2) | $ | 11.55 |
See accompanying notes to financial statements.
21
| KARNER BLUE BIODIVERSITY IMPACT FUND |
| STATEMENT OF OPERATIONS |
| Year Ended May 31, 2022 |
| INVESTMENT INCOME | ||||
| Dividend income | $ | 241,725 | ||
| Foreign witholding taxes on dividends | (31,652 | ) | ||
| Total investment income | 210,073 | |||
| EXPENSES | ||||
| Investment advisory fees (Note 4) | 83,124 | |||
| Fund accounting fees (Note 4) | 30,289 | |||
| Administration fees (Note 4) | 29,250 | |||
| Legal fees | 22,864 | |||
| Registration and filing fees | 20,877 | |||
| Transfer agent fees (Note 4) | 18,000 | |||
| Trustees’ fees and expenses (Note 4) | 17,817 | |||
| Audit and tax services fees | 16,460 | |||
| Compliance fees (Note 4) | 12,000 | |||
| Printing of shareholder reports | 11,089 | |||
| Custody and bank service fees | 8,232 | |||
| Postage and supplies | 7,096 | |||
| Insurance expense | 3,407 | |||
| Other expenses | 15,922 | |||
| Total expenses | 296,427 | |||
| Less fee reductions and expense reimbursements by Adviser (Note 4) | (201,382 | ) | ||
| Net expenses | 95,045 | |||
| NET INVESTMENT INCOME | 115,028 | |||
| REALIZED AND UNREALIZED GAINS (LOSSES) ON INVESTMENTS AND FOREIGN CURRENCIES | ||||
| Net realized gains from: | ||||
| Investments | 552,488 | |||
| Foreign currency transactions (Note 2) | 103 | |||
| Net change in unrealized appreciation (depreciation) on investments | (1,594,020 | ) | ||
| NET REALIZED AND UNREALIZED LOSSES ON INVESTMENTS AND FOREIGN CURRENCIES | (1,041,429 | ) | ||
| NET DECREASE IN NET ASSETS RESULTING FROM OPERATIONS | $ | (926,401 | ) |
See accompanying notes to financial statements.
22
| KARNER BLUE BIODIVERSITY IMPACT FUND |
| STATEMENTS OF CHANGES IN NET ASSETS |
| Year Ended | Year Ended | |||||||
| May 31, | May 31, | |||||||
| 2022 | 2021 | |||||||
| FROM OPERATIONS | ||||||||
| Net investment income | $ | 115,028 | $ | 93,473 | ||||
| Net realized gains from investments and foreign currency transactions | 552,591 | 695,563 | ||||||
| Net change in unrealized appreciation (depreciation) on investments | (1,594,020 | ) | 1,908,545 | |||||
| Net increase (decrease) in net assets resulting from operations | (926,401 | ) | 2,697,581 | |||||
| FROM DISTRIBUTIONS TO SHAREHOLDERS (Note 2) | ||||||||
| Investor Class | — | (4,791 | ) | |||||
| Institutional Class | — | (3,457 | ) | |||||
| Butterfly™ Class | (1,070,587 | ) | (79,509 | ) | ||||
| Decrease in net assets from distributions to shareholders | (1,070,587 | ) | (87,757 | ) | ||||
| CAPITAL SHARE TRANSACTIONS | ||||||||
| Investor Class | ||||||||
| Proceeds from shares sold | — | 233,552 | ||||||
| Net asset value of shares issued in reinvestment of distributions to shareholders | — | 4,791 | ||||||
| Payments for shares redeemed | — | (50,325 | ) | |||||
| Shares exchanged for Butterfly™ Class (Note 1) | — | (746,207 | ) | |||||
| Net decrease in Investor Class net assets from capital share transactions | — | (558,189 | ) | |||||
| Institutional Class | ||||||||
| Net asset value of shares issued in reinvestment of distributions to shareholders | — | 3,457 | ||||||
| Payments for shares redeemed | — | (685 | ) | |||||
| Shares exchanged for Butterfly™ Class (Note 1) | — | (374,058 | ) | |||||
| Net decrease in Institutional Class net assets from capital share transactions | — | (371,286 | ) | |||||
| Butterfly™ Class | ||||||||
| Proceeds from shares sold | 246,015 | 1,750,844 | ||||||
| Shares exchanged from Investor Class (Note 1) | — | 746,207 | ||||||
| Shares exchanged from Institutional Class (Note 1) | — | 374,058 | ||||||
| Net asset value of shares issued in reinvestment of distributions to shareholders | 439,792 | 28,650 | ||||||
| Payments for shares redeemed | (243,227 | ) | (217 | ) | ||||
| Net increase in Butterfly Class™ net assets from capital share transactions | 442,580 | 2,899,542 | ||||||
| TOTAL INCREASE (DECREASE) IN NET ASSETS | (1,554,408 | ) | 4,579,891 | |||||
See accompanying notes to financial statements.
23
| KARNER BLUE BIODIVERSITY IMPACT FUND |
| STATEMENTS OF CHANGES IN NET ASSETS (Continued) |
| Year Ended | Year Ended | |||||||
| May 31, | May 31, | |||||||
| 2022 | 2021 | |||||||
| NET ASSETS | ||||||||
| Beginning of year | $ | 10,802,650 | $ | 6,222,759 | ||||
| End of year | $ | 9,248,242 | $ | 10,802,650 | ||||
| CAPITAL SHARE ACTIVITY | ||||||||
| Investor Class | ||||||||
| Shares sold | — | 18,449 | ||||||
| Shares reinvested | — | 384 | ||||||
| Shares redeemed | — | (4,416 | ) | |||||
| Shares exchanged for Butterfly™ Class (Note 1) | — | (56,388 | ) | |||||
| Net decrease in shares outstanding | — | (41,971 | ) | |||||
| Shares outstanding at beginning of year | — | 41,971 | ||||||
| Shares outstanding at end of year | — | — | ||||||
| Institutional Class | ||||||||
| Shares reinvested | — | 277 | ||||||
| Shares redeemed | — | (59 | ) | |||||
| Shares exchanged for Butterfly™ Class (Note 1) | — | (28,207 | ) | |||||
| Net decrease in shares outstanding | — | (27,989 | ) | |||||
| Shares outstanding at beginning of year | — | 27,989 | ||||||
| Shares outstanding at end of year | — | — | ||||||
| Butterfly™ Class | ||||||||
| Shares sold | 18,529 | 136,601 | ||||||
| Shares issued in connection with exchange of Investor Class shares (Note 1) | — | 56,224 | ||||||
| Shares issued in connection with exchange of Institutional Class shares (Note 1) | — | 28,184 | ||||||
| Shares reinvested | 34,386 | 2,290 | ||||||
| Shares redeemed | (18,705 | ) | (16 | ) | ||||
| Net increase in shares outstanding | 34,210 | 223,283 | ||||||
| Shares outstanding at beginning of year | 766,849 | 543,566 | ||||||
| Shares outstanding at end of year | 801,059 | 766,849 | ||||||
See accompanying notes to financial statements.
24
| KARNER BLUE BIODIVERSITY IMPACT FUND |
| BUTTERFLY™ CLASS |
| FINANCIAL HIGHLIGHTS |
Per Share Data for a Share Outstanding Throughout Each Period
| Year Ended | Year Ended | Period Ended | ||||||||||
| May 31, | May 31, | May 31, | ||||||||||
| 2022 | 2021 | 2020 (a) | ||||||||||
| Net asset value at beginning of period | $ | 14.09 | $ | 10.14 | $ | 10.00 | ||||||
| Income from investment operations: | ||||||||||||
| Net investment income (b) | 0.15 | 0.15 | 0.10 | |||||||||
| Net realized and unrealized gains (losses) on investments and foreign currencies | (1.30 | ) | 3.94 | 0.05 | (c) | |||||||
| Total from investment operations | (1.15 | ) | 4.09 | 0.15 | ||||||||
| Less distributions from: | ||||||||||||
| Net investment income | (0.10 | ) | (0.14 | ) | (0.01 | ) | ||||||
| Net realized gains | (1.29 | ) | — | — | ||||||||
| Total distributions | (1.39 | ) | (0.14 | ) | (0.01 | ) | ||||||
| Net asset value at end of period | $ | 11.55 | $ | 14.09 | $ | 10.14 | ||||||
| Total return (d) | (9.07 | %) | 40.49 | % | 1.50 | % (e) | ||||||
| Net assets at end of period (000’s) | $ | 9,248 | $ | 10,803 | $ | 5,514 | ||||||
| Ratios/supplementary data: | ||||||||||||
| Ratio of total expenses to average net assets | 2.85 | % | 3.62 | % | 5.32 | % (f) | ||||||
| Ratio of net expenses to average net assets (g) | 0.92 | % | 0.85 | % | 0.85 | % (f) | ||||||
| Ratio of net investment income to average net assets (g) | 1.11 | % | 1.20 | % | 1.47 | % (f) | ||||||
| Portfolio turnover rate | 84 | % | 55 | % | 61 | % (e) | ||||||
| (a) | Represents the period from the commencement of operations (September 17, 2019) through May 31, 2020. |
| (b) | Net investment income per share has been determined on the basis of average number of shares outstanding during the period. |
| (c) | Represents a balancing figure derived from other amounts in the financial highlights table that captures all other changes affecting net asset value per share. This per share amount does not correlate to the aggregrate of the net realized and unrealized losses on the Statement of Operations for the same period. |
| (d) | Total return is a measure of the change in value of an investment in the Fund over the periods covered. The returns shown do not reflect the deduction of taxes a shareholder would pay on Fund distributions, if any, or the redemption of Fund shares. The total returns would be lower if the Adviser had not reduced advisory fees and reimbursed expenses (Note 4). |
| (e) | Not annualized. |
| (f) | Annualized. |
| (g) | Ratio was determined after fee reductions and expense reimbursements (Note 4). |
See accompanying notes to financial statements.
25
| KARNER BLUE BIODIVERSITY IMPACT FUND |
| NOTES TO FINANCIAL STATEMENTS |
| May 31, 2022 |
1. Organization
Karner Blue Biodiversity Impact Fund (the “Fund”) is a diversified series of Ultimus Managers Trust (the “Trust”), an open-end investment company established as an Ohio business trust under a Declaration of Trust dated February 28, 2012. Other series of the Trust are not incorporated in this report.
The investment objective of the Fund is to seek to achieve long-term total returns by investing in companies that lead their industries in animal welfare performance.
The Fund currently offers one class of shares: Butterfly™ Class shares (sold without any sales loads and distribution and/or shareholder service fees but subject to an administrative service fee of up to 0.10% of the average net assets, and requiring a $2,000 initial investment). Prior to March 19, 2021, the Fund offered three classes of shares, including Investor Class shares (sold without any sales loads, but subject to a distribution and/or shareholder service fee of up to 0.25% of the average daily net assets attributable to Investor Class shares, and requiring a $2,000 initial investment), Institutional Class shares (sold without any sales loads and distribution and/or shareholder service fees but subject to an administrative service fee of up to 0.10% of the average daily net assets attributable to Institutional Class shares, and requiring a $200,000 initial investment) and ButterflyTM Class shares (sold without any sales loads and distribution and/or shareholder service fees and requiring a $2,000,000 initial investment). On March 19, 2021, all existing Investor Class and Institutional Class shares were converted into Butterfly™ Class shares at the Butterfly™ Class net asset value per share as of March 18, 2021, which was $13.27. After March 19, 2021, Investor Class shares and Institutional Class shares were no longer offered by the Fund.
2. Significant Accounting Policies
The following is a summary of the Fund’s significant accounting policies. The policies are in conformity with accounting principles generally accepted in the United States of America (“GAAP”). The Fund follows accounting and reporting guidance under Financial Accounting Standards Board Accounting Standards Codification Topic 946, “Financial Services – Investment Companies.”
Securities valuation – The Fund values its portfolio securities at market value as of the close of regular trading on the New York Stock Exchange (the “NYSE”) (normally 4:00 p.m. Eastern time) on each business day the NYSE is open for business. The Fund values its listed securities on the basis of the security’s last sale price on the security’s primary exchange, if available, otherwise at the exchange’s most recently quoted mean price. NASDAQ-listed securities are valued at the NASDAQ Official Closing Price. When using a quoted price and when the market is considered active, the security will be classified as Level 1 within the fair value hierarchy (see below). In the event that market quotations
26
| KARNER BLUE BIODIVERSITY IMPACT FUND |
| NOTES TO FINANCIAL STATEMENTS (Continued) |
are not readily available or are considered unreliable due to market or other events, the Fund values its securities and other assets at fair value in accordance with procedures established by and under the general supervision of the Board of Trustees (the “Board”). Under these procedures, the securities will be classified as Level 2 or 3 within the fair value hierarchy, depending on the inputs used. Unavailable or unreliable market quotes may be due to the following factors: a substantial bid-ask spread; infrequent sales resulting in stale prices; insufficient trading volume; small trade sizes; a temporary lapse in any reliable pricing source; and actions of the securities or futures markets, such as the suspension or limitation of trading. As a result, the prices of securities used to calculate the Fund’s net asset value (“NAV”) may differ from quoted or published prices for the same securities.
GAAP establishes a single authoritative definition of fair value, sets out a framework for measuring fair value, and requires additional disclosures about fair value measurements.
Various inputs are used in determining the value of the Fund’s investments. These inputs are summarized in the three broad levels listed below:
| ● | Level 1 – quoted prices in active markets for identical securities |
| ● | Level 2 – other significant observable inputs |
| ● | Level 3 – significant unobservable inputs |
The inputs or methods used for valuing securities are not necessarily an indication of the risks associated with investing in those securities. The inputs used to measure fair value may fall into different levels of the fair value hierarchy. In such cases, for disclosure purposes, the level in the fair value hierarchy within which the fair value measurement falls in its entirety is determined based on the lowest level input that is significant to the fair value measurement.
The following is a summary of the Fund’s investments and the inputs used to value the investments as of May 31, 2022:
| Level 1 | Level 2 | Level 3 | Total | |||||||||||||
| Common Stocks | $ | 8,844,157 | $ | — | $ | — | $ | 8,844,157 | ||||||||
| Money Market Funds | 326,362 | — | — | 326,362 | ||||||||||||
| Total | $ | 9,170,519 | $ | — | $ | — | $ | 9,170,519 | ||||||||
Refer to the Fund’s Schedule of Investments for a listing of securities by sector and industry type. The Fund did not hold any derivative instruments or any assets or liabilities that were measured at fair value on a recurring basis using significant unobservable inputs (Level 3) as of or during the year ended May 31, 2022.
27
| KARNER BLUE BIODIVERSITY IMPACT FUND |
| NOTES TO FINANCIAL STATEMENTS (Continued) |
Share valuation – The NAV per share of the Fund is calculated daily by dividing the total value of the assets, less liabilities, by the number of shares outstanding. The offering price and redemption price per share of the Fund is equal to the NAV per share of the Fund.
Investment income – Dividend income is recorded on the ex-dividend date. Non-cash dividends included in dividend income, if any, are recorded at the fair market value of the security received. Interest income is accrued as earned. Withholding taxes on foreign dividends have been recorded in accordance with the Fund’s understanding of the applicable country’s rules and tax rates.
Investment transactions – Investment transactions are accounted for on the trade date. Realized gains and losses on investments sold are determined on a specific identification basis.
Foreign currency translation – Securities and other assets and liabilities denominated in or expected to settle in foreign currencies, if any, are translated into U.S. dollars based on exchange rates on the following basis:
| A. | The fair values of investment securities and other assets and liabilities are translated as of the close of the NYSE each day. |
| B. | Purchases and sales of investment securities and income and expenses are translated at the rate of exchange prevailing as of 4:00 p.m. Eastern time on the respective date of such transactions. |
| C. | The Fund does not isolate that portion of the results of operations caused by changes in foreign exchange rates on investments from those caused by changes in market prices of securities held. Such fluctuations are included with the net realized and unrealized gains or losses on investments. |
Reported net realized foreign exchange gains or losses arise from 1) purchases and sales of foreign currencies, 2) currency gains or losses realized between trade and settlement dates on securities transactions, and 3) the difference between the amounts of dividends and foreign withholding taxes recorded on the Fund’s books and the U.S. dollar equivalent of the amounts actually received or paid. Reported net unrealized foreign exchange gains and losses arise from changes in the value of assets and liabilities, other than investments in securities, that result from changes in exchange rates.
Allocation between classes – Investment income earned, realized capital gains and losses, and unrealized appreciation and depreciation were allocated daily to each class of the Fund based upon its proportionate share of total net assets of the Fund. Class-specific expenses were charged directly to the class incurring the expense. Common expenses which were not attributable to a specific class were allocated daily to each class of shares of the Fund based upon its proportionate share of total net assets of the Fund. Effective March 19, 2021, the allocation between classes no longer applies to the Fund.
28
| KARNER BLUE BIODIVERSITY IMPACT FUND |
| NOTES TO FINANCIAL STATEMENTS (Continued) |
Common expenses – Common expenses of the Trust are allocated among the Fund and the other series of the Trust based on the relative net assets of each series, the number of series in the Trust, or the nature of the services performed and the relative applicability to each series.
Distributions to shareholders – The Fund distributes to shareholders any net investment income dividends and net realized capital gains distributions at least once each year. The amount of such dividends and distributions are determined in accordance with federal income tax regulations, which may differ from GAAP. Dividends and distributions to shareholders are recorded on the ex-dividend date.
The tax character of distributions paid during the years ended May 31, 2022 and 2021 was as follows:
| Long-Term | Total | |||||||||||
| Years Ended | Ordinary Income | Capital Gains | Distributions | |||||||||
| 5/31/2022 | $ | 184,381 | $ | 886,206 | $ | 1,070,587 | ||||||
| 5/31/2021 | $ | 87,757 | $ | — | $ | 87,757 | ||||||
Estimates – The preparation of financial statements in conformity with GAAP requires management to make estimates and assumptions that affect the reported amounts of assets and liabilities and disclosure of contingent assets and liabilities as of the date of the financial statements and the reported amounts of increase (decrease) in net assets from operations during the reporting period. Actual results could differ from those estimates.
Federal income tax – The Fund has qualified and intends to continue to qualify as a regulated investment company under the Internal Revenue Code of 1986, as amended (the “Code”). Qualification generally will relieve the Fund of liability for federal income taxes to the extent 100% of its net investment income and net realized capital gains are distributed in accordance with the Code.
In order to avoid imposition of the excise tax applicable to regulated investment companies, it is also the Fund’s intention to declare as dividends in each calendar year at least 98% of its net investment income (earned during the calendar year) and 98.2% of its net realized capital gains (earned during the twelve months ended October 31) plus undistributed amounts from prior years.
29
| KARNER BLUE BIODIVERSITY IMPACT FUND |
| NOTES TO FINANCIAL STATEMENTS (Continued) |
The following information is computed on a tax basis for each item as of May 31, 2022:
| Tax cost of investments | $ | 8,793,962 | ||
| Gross unrealized appreciation | $ | 1,214,156 | ||
| Gross unrealized depreciation | (837,599 | ) | ||
| Net unrealized appreciation | 376,557 | |||
| Undistributed ordinary income | 39,594 | |||
| Undistributed long-term capital gains | 172,956 | |||
| Distributable earnings | $ | 589,107 |
The difference between the federal income tax cost of investments and the financial statement cost of investments is due to certain timing differences in the recognition of capital gains or losses under income tax regulations and GAAP. These “book/tax” differences are temporary in nature and are primarily due to the tax deferral of losses on wash sales.
For the year ended May 31, 2022, the Fund reclassified $1 of accumulated earnings against paid-in capital on the Statement of Assets and Liabilities. Such reclassification, the result of permanent differences between the financial statement and income tax reporting requirements, has no effect on the Fund’s net assets and NAV per share.
The Fund recognizes the tax benefits or expenses of uncertain tax positions only when the position is “more likely than not” of being sustained assuming examination by tax authorities. Management has reviewed the Fund’s tax positions for all open tax periods (generally, three years) and has concluded that no provision for unrecognized tax benefits or expenses is required in these financial statements. The Fund identifies its major tax jurisdiction as U.S. Federal.
3. Investment Transactions
During the year ended May 31, 2022, cost of purchases and proceeds from sales of investment securities, other than short-term investments, amounted to $8,540,278 and $9,347,280, respectively.
4. Transactions with Related Parties
INVESTMENT ADVISORY AGREEMENT
The Fund’s investments are managed by Karner Blue Capital, LLC (the “Adviser”) pursuant to the terms of an Investment Advisory Agreement. The Fund pays the Adviser an investment advisory fee, computed and accrued daily and paid monthly, at the annual rate of 0.80% of average daily net assets.
Effective October 1, 2021, pursuant to an Expense Limitation Agreement (“ELA”) between the Fund and the Adviser, the Adviser has contractually agreed, until September 30, 2022, to reduce investment advisory fees and reimburse other operating expenses to limit total
30
| KARNER BLUE BIODIVERSITY IMPACT FUND |
| NOTES TO FINANCIAL STATEMENTS (Continued) |
annual operating expenses of the Fund (exclusive of brokerage costs; taxes; interest; borrowing costs such as interest and dividend expenses on securities sold short; costs to organize the Fund; acquired fund fees and expenses; extraordinary expenses such as litigation and merger or reorganization costs; and other expenses not incurred in the ordinary course of the Fund’s business) to an amount not exceeding 0.95% of its average daily net assets. Prior to October 1, 2021, the Adviser had contractually agreed to limit total annual operating expenses of the Fund (exclusive of brokerage costs; taxes; interest; borrowing costs such as interest and dividend expenses on securities sold short; costs to organize the Fund; acquired fund fees and expenses; extraordinary expenses such as litigation and merger or reorganization costs; and other expenses not incurred in the ordinary course of the Fund’s business) to an amount not exceeding 0.85% of its average daily net assets.
Accordingly, during the year ended May 31, 2022, the Adviser did not collect any of its investment advisory fees and reimbursed other operating expenses of $118,258.
Under the terms of the ELA, investment advisory fee reductions and expense reimbursements by the Adviser are subject to repayment by the Fund for a period of three years after such fees and expenses were incurred, provided that the repayments do not cause total annual fund operating expenses to exceed the lesser of (i) the expense limitation then in effect, if any, and (ii) the expense limitation in effect at the time the expenses to be repaid were incurred. As of May 31, 2022, the Adviser may in the future seek repayment of investment advisory fee reductions and expense reimbursements in the amount of $564,110 no later than the dates listed below:
| May 31, 2023 | $ | 144,782 | ||
| May 31, 2024 | 217,946 | |||
| May 31, 2025 | 201,382 | |||
| Total | $ | 564,110 |
OTHER SERVICE PROVIDERS
Ultimus Fund Solutions, LLC (“Ultimus”) provides administration, fund accounting, compliance and transfer agency services to the Fund. The Fund pays Ultimus fees in accordance with the agreements for such services. In addition, the Fund pays out-of-pocket expenses including, but not limited to, postage, supplies and certain costs related to the pricing of its portfolio securities.
Under the terms of a Distribution Agreement with the Trust, Ultimus Fund Distributors, LLC (the “Distributor”) serves as the principal underwriter to the Fund. The Distributor is a wholly-owned subsidiary of Ultimus. The Distributor is compensated by the Adviser, not the Fund.
Certain officers and a Trustee of the Trust are also officers of Ultimus and are not paid by the Fund for serving in such capacities.
31
| KARNER BLUE BIODIVERSITY IMPACT FUND |
| NOTES TO FINANCIAL STATEMENTS (Continued) |
ADMINISTRATIVE SERVICES PLAN
The Fund has adopted an Administrative Services Plan (the “Administrative Services Plan”), for the Butterfly™ Class shares of the Fund. The Administrative Services Plan allows the Fund to use the net assets of the Butterfly™ Class shares to pay financial intermediaries that provide services relating to Butterfly™ Class shares. The Administrative Services Plan permits payments for the provision of certain administrative, recordkeeping and other non-distribution related services to Butterfly™ Class shareholders. The Administrative Services Plan permits the Fund to make service fee payments at an annual rate of up to 0.10% of the Fund’s average daily net assets attributable to its Butterfly™ Class shares. During the year ended May 31, 2022, the Fund did not incur any fees under the Administrative Services Plan.
TRUSTEE COMPENSATION
Effective October 20, 2021, each member of the Board (a “Trustee”) who is not an “interested person” (as defined by the 1940 Act, as amended) of the Trust (“Independent Trustee”) receives a $1,300 annual retainer from the Fund, paid quarterly, except for the Board Chairperson who receives a $1,700 annual retainer from the Fund, paid in quarterly installments. Each Independent Trustee also receives from the Fund a fee of $550 for each Board meeting attended plus reimbursement for travel and other meeting-related expenses. Prior to October 20, 2021, each Independent Trustee received a $1,300 annual retainer from the Fund, paid quarterly, except for the Board Chairperson who received a $1,500 annual retainer from the Fund, paid in quarterly installments. Each Independent Trustee also received from the Fund a fee of $500 for each Board meeting attended plus reimbursement for travel and other meeting-related expenses.
PRINCIPAL HOLDERS OF FUND SHARES
As of May 31, 2022, the following shareholders owned of record 25% or more of the outstanding shares of the Fund:
| Name of Record Owners | % Ownership |
| Butterfly™ Class | |
| SEI Private Trust Company (for the benefit of its customers) | 56% |
A beneficial owner of 25% or more of the Fund’s outstanding shares may be considered a controlling person of the Fund. That shareholder’s vote could have a more significant effect on matters presented at a shareholders’ meeting.
32
| KARNER BLUE BIODIVERSITY IMPACT FUND |
| NOTES TO FINANCIAL STATEMENTS (Continued) |
5. Foreign Securities Risk
The Fund may invest in American Depositary Receipts (“ADRs”). Investments in ADRs provide exposure to foreign securities that may involve different risks than those of U.S. securities. Foreign securities are subject to individual country risk, less favorable reporting and disclosure risk, currency exchange risk and greater price volatility, and may have higher liquidity risk than U.S. registered securities. As of May 31, 2022, the Fund had 21.9% of its net assets invested in ADRs.
6. Contingencies and Commitments
The Fund indemnifies the Trust’s officers and Trustees for certain liabilities that might arise from their performance of their duties to the Fund. Additionally, in the normal course of business the Fund enters into contracts that contain a variety of representations and warranties and which provide general indemnifications. The Fund’s maximum exposure under these arrangements is unknown, as this would involve future claims that may be made against the Fund that have not yet occurred. However, based on experience, the Fund expects the risk of loss to be remote.
7. Subsequent Events
The Fund is required to recognize in the financial statements the effects of all subsequent events that provide additional evidence about conditions that existed as of the date of the Statement of Assets and Liabilities. For non-recognized subsequent events that must be disclosed to keep the financial statements from being misleading, the Fund is required to disclose the nature of the event as well as an estimate of its financial effect, or a statement that such an estimate cannot be made. Management has evaluated subsequent events through the issuance of these financial statements and has noted no such events.
33
| KARNER BLUE BIODIVERSITY IMPACT FUND |
| REPORT OF INDEPENDENT REGISTERED |
| PUBLIC ACCOUNTING FIRM |
To the Board of Trustees of Ultimus Managers Trust
and the Shareholders of Karner Blue Biodiversity Impact Fund
Opinion on the Financial Statements
We have audited the accompanying statement of assets and liabilities of Karner Blue Biodiversity Impact Fund, a series of shares of beneficial interest in Ultimus Managers Trust (the “Fund”), including the schedule of investments, as of May 31, 2022, and the related statement of operations for the year then ended, the statements of changes in net assets for each of the years in the two-year period ended May 31, 2022 and the financial highlights for each of the years in the two-year period then ended and for the period from September 17, 2019 (commencement of operations) through May 31, 2020, and the related notes (collectively referred to as the “financial statements”). In our opinion, the financial statements present fairly, in all material respects, the financial position of the Fund as of May 31, 2022, and the results of its operations for the year then ended, the changes in its net assets for each of the years in the two-year period ended May 31, 2022 and its financial highlights for each of the years in the two-year period then ended and for the period from September 17, 2019 to May 31, 2020, in conformity with accounting principles generally accepted in the United States of America.
Basis for Opinion
These financial statements are the responsibility of the Fund’s management. Our responsibility is to express an opinion on the Fund’s financial statements based on our audits. We are a public accounting firm registered with the Public Company Accounting Oversight Board (United States) (“PCAOB”) and are required to be independent with respect to the Fund in accordance with the U.S. federal securities law and the applicable rules and regulations of the Securities and Exchange Commission and the PCAOB.
We conducted our audits in accordance with the standards of the PCAOB. Those standards require that we plan and perform the audits to obtain reasonable assurance about whether the financial statements are free of material misstatement, whether due to error or fraud. The Fund is not required to have, nor were we engaged to perform, an audit of its internal control over financial reporting. As part of our audits we are required to obtain an understanding of internal control over financial reporting but not for the purpose of expressing an opinion on the effectiveness of the Fund’s internal control over financial reporting. Accordingly, we express no such opinion.
Our audits included performing procedures to assess the risk of material misstatement of the financial statements, whether due to error or fraud, and performing procedures that respond to those risks. Such procedures included examining, on a test basis, evidence regarding the amounts and disclosures in the financial statements. Our procedures included confirmation of securities owned as of May 31, 2022 by correspondence with the custodian and broker. Our audits also included evaluating the accounting principles
34
| KARNER BLUE BIODIVERSITY IMPACT FUND |
| REPORT OF INDEPENDENT REGISTERED |
| PUBLIC ACCOUNTING FIRM (Continued) |
used and significant estimates made by management, as well as evaluating the overall presentation of the financial statements. We believe that our audits provide a reasonable basis for our opinion.
BBD, LLP
We have served as the auditor of one or more of the Funds in the Ultimus Managers Trust since 2013.
Philadelphia, Pennsylvania
July 20, 2022
35
| KARNER BLUE BIODIVERSITY IMPACT FUND |
| ABOUT YOUR FUND’S EXPENSES (Unaudited) |
We believe it is important for you to understand the impact of costs on your investment. As a shareholder of the Fund, you incur ongoing costs, including management fees, class-specific expenses (such as distribution fees and administrative services fees) and other operating expenses. The following examples are intended to help you understand your ongoing costs (in dollars) of investing in the Fund and to compare these costs with the ongoing costs of investing in other mutual funds.
A mutual fund’s ongoing costs are expressed as a percentage of its average net assets. This figure is known as the expense ratio. The expenses in the table below are based on an investment of $1,000 made at the beginning of the most recent semi-annual period (December 1, 2021) and held until the end of the period (May 31, 2022).
The table below illustrates the Fund’s ongoing costs in two ways:
Actual fund return – This section helps you to estimate the actual expenses that you paid over the period. The “Ending Account Value” shown is derived from the Fund’s actual return, and the fourth column shows the dollar amount of operating expenses that would have been paid by an investor who started with $1,000 in the Fund. You may use the information here, together with the amount you invested, to estimate the expenses that you paid over the period.
To do so, simply divide your account value by $1,000 (for example, an $8,600 account value divided by $1,000 = 8.6), then multiply the result by the number given for the Fund under the heading “Expenses Paid During Period.”
Hypothetical 5% return – This section is intended to help you compare the Fund’s ongoing costs with those of other mutual funds. It assumes that the Fund had an annual return of 5% before expenses during the period shown, but that the expense ratio is unchanged. In this case, because the return used is not the Fund’s actual return, the results do not apply to your investment. The example is useful in making comparisons because the U.S. Securities and Exchange Commission (the “SEC”) requires all mutual funds to calculate expenses based on a 5% return. You can assess the Fund’s ongoing costs by comparing this hypothetical example with the hypothetical examples that appear in shareholder reports of other funds.
Note that expenses shown in the table are meant to highlight and help you compare ongoing costs only. The Fund does not charge transaction fees, such as purchase or redemption fees, nor does it carry a “sales load.”
The calculations assume no shares were bought or sold during the period. Your actual costs may have been higher or lower, depending on the amount of your investment and the timing of any purchases or redemptions.
36
| KARNER BLUE BIODIVERSITY IMPACT FUND |
| ABOUT YOUR FUND’S EXPENSES (Unaudited) (Continued) |
More information about the Fund’s expenses can be found in this report. For additional information on operating expenses and other shareholder costs, please refer to the Fund’s prospectus.
| Beginning | Ending | |||
| Account Value | Account Value | Net | Expenses | |
| December 1, | May 31, | Expense | Paid During | |
| 2021 | 2022 | Ratio (a) | Period (b) | |
| Butterfly™ Class | ||||
| Based on Actual Fund Return | $1,000.00 | $ 885.40 | 0.91% | $4.28 |
| Based on Hypothetical 5% Return (before expenses) | $1,000.00 | $1,020.39 | 0.91% | $4.58 |
| (a) | Annualized, based on the most recent one-half year expenses. |
| (b) | Expenses are equal to the annualized expense ratio, multiplied by the average account value over the period, multiplied by 182/365 (to reflect the one-half year period). |
| OTHER INFORMATION (Unaudited) |
A description of the policies and procedures that the Fund uses to vote proxies relating to portfolio securities is available without charge upon request by calling toll-free 1-855-KBANIML (855-522-6465), or on the SEC’s website at www.sec.gov. Information regarding how the Fund voted proxies relating to portfolio securities during the most recent 12-month period ended June 30 is also available without charge upon request by calling toll-free 1-855-KBANIML (855-522-6465), or on the SEC’s website at www.sec.gov.
The Trust files a complete listing of portfolio holdings for the Fund with the SEC as of the end of the first and third quarters of each fiscal year as an exhibit to its reports on Form N-PORT. These filings are available upon request by calling 1-855-KBANIML (855-522-6465). Furthermore, you may obtain a copy of the filings on the SEC’s website at www.sec.gov and the Fund’s website at www.biodiversityimpactfund.com.
| FEDERAL TAX INFORMATION (Unaudited) |
For the year ended May 31, 2022, the Fund designated $886,206 as long-term capital gain distribution.
Qualified Dividend Income – The Fund designates 100% of its ordinary income dividends, or up to the maximum amount of such dividends allowable pursuant to the Internal Revenue Code, as qualified dividend income eligible for the reduced tax rate.
Dividends Received Deduction – Corporate shareholders are generally entitled to take the dividends received deduction on the portion of a Fund’s dividend distribution that qualifies under tax law. For the year ended May 31, 2022, 49.22% of ordinary income dividends qualifies for the corporate dividends received deduction.
37
| KARNER BLUE BIODIVERSITY IMPACT FUND |
| BOARD OF TRUSTEES AND EXECUTIVE OFFICERS |
| (Unaudited) |
The Board has overall responsibility for management of the Trust’s affairs. The Trustees serve during the lifetime of the Trust and until its termination, or until death, resignation, retirement, or removal. The Trustees, in turn, elect the officers of the Fund to actively supervise their day-to-day operations. The officers have been elected for an annual term. Each Trustee’s and officer’s address is 225 Pictoria Drive, Suite 450, Cincinnati, Ohio 45246. The following are the Trustees and executive officers of the Fund:
| Name and Year of Birth | Length of Time Served | Position(s) Held with Trust | Principal Occupation(s) During Past 5 Years | Number in Trust | Directorships of Public Companies Held by Trustee During Past 5 Years |
| Interested Trustees: | |||||
| David R. Carson* Year of Birth: 1958 | Trustee Since 2021
Officer Since 2013 | Trustee (2021 to present)
Vice President (2021 to present; and previously April 2013 to October 2013)
President and Principal Executive Officer of each of its series (2013 to 2021) | Vice President and Director of Client Strategies of Ultimus Fund Solutions, LLC (2013 to present); President of Unified Series Trust (2017 to present). | 26 | Interested Trustee of 21 series of the Unified Series Trust (a registered management company) (2020 to present). |
| Independent Trustees: | |||||
| Janine L. Cohen Year of Birth: 1952 | Since 2016 | Chairperson (2019 to present)
Trustee (2016 to present) | Retired since 2013; previously Chief Financial Officer from 2004 to 2013 and Chief Compliance Officer from 2008 to 2013 at AER Advisors, Inc. | 26 | None |
38
| KARNER BLUE BIODIVERSITY IMPACT FUND |
| BOARD OF TRUSTEES AND EXECUTIVE OFFICERS (Unaudited) |
| (Continued) |
| Name and Year of Birth | Length of Time Served | Position(s) Held with Trust | Principal Occupation(s) During Past 5 Years | Number in Trust | Directorships of Public Companies Held by Trustee During Past 5 Years |
| Independent Trustees (Continued): | |||||
| David M. Deptula Year of Birth: 1958 | Since 2012 | Trustee | Vice President of Legal and Special Projects at Dayton Freight Lines, Inc. since February 2016 | 26 | None |
| Jacqueline A. Williams Year of Birth: 1954 | Since 2019 | Trustee | Managing Member of Custom Strategy Consulting, LLC (2017 to present); Managing Director of Global Investment Research (2005 to 2017), Cambridge Associates, LLC. | 26 | None |
| Clifford N. Schireson Year of Birth: 1953 | Since 2019 | Trustee | Retired; Founder of Schireson Consulting, LLC (2017 to 2022); Director of Institutional Services for Brandes Investment Partners, LP (2004-2017). | 26 | Trustee of the San Diego City Employees’ Retirement System (2019 to present). |
| Robert E. Morrison Year of Birth: 1957 | Since 2019 | Trustee | Managing Director, Midwest Trust and FCI Advisors (2022 to present); Senior Vice President and National Practice Lead for Investment, Huntington National Bank/ Huntington Private Bank (2014 to 2022); CEO, CIO, President of 5 Star Investment Management Company (2006 to 2014). | 26 | None |
| * | Mr. Carson is considered an “interested person” of the Trust within the meaning of Section 2(a)(19) of the 1940 Act because of his relationship with the Trust’s administrator, transfer agent, and distributor. Mr. Carson was President of the Trust from October 2013 to January 2021 and Vice President of the Trust from April 2013 to October 2013. |
39
| KARNER BLUE BIODIVERSITY IMPACT FUND |
| BOARD OF TRUSTEES AND EXECUTIVE OFFICERS (Unaudited) |
| (Continued) |
| Name and Year of Birth | Length of Time Served | Position(s) Held with Trust | Principal Occupation(s) During Past 5 Years |
| Executive Officers: | |||
| Todd E. Heim Year of Birth: 1967 | Since 2014 | President (2021 to present)
Vice President (2014 to 2021) | Vice President, Relationship Management (2018 to present) and Assistant Vice President, Client Implementation Manager of Ultimus Fund Solutions, LLC (2014 to 2018); Naval Flight Officer in United States Navy (1989 to 2017). |
| Jennifer L. Leamer Year of Birth: 1976 | Since 2014 | Treasurer (2014 to present)
Assistant Treasurer (April 2014 to October 2014) | Senior Vice President, Fund Accounting of Ultimus Fund Solutions, LLC (2014 to present). |
| Daniel D. Bauer Year of Birth: 1977 | Since 2016 | Assistant Treasurer (2016 to present) | Vice President, Fund Accounting (2022 to present) and Assistant Vice President, Fund Accounting of Ultimus Fund Solutions, LLC (2015 to 2022). |
| Angela A. Simmons Year of Birth: 1975 | Since 2022 | Assistant Treasurer (2022 to present) | Vice President, Financial Administration (2022 to present) and Assistant Vice President, Financial Administration (2015 to 2022) of Ultimus Fund Solutions, LLC. |
| Khimmara Greer Year of Birth: 1983 | Since 2021 | Secretary (2021 to present) | Vice President and Senior Legal Counsel of Ultimus Fund Solutions, LLC (2021 to present); Vice President, Asset Servicing – Regulatory Administration of The Bank of New York Mellon (2019 to 2021); Vice President and Counsel of State Street Bank and Trust Company (2015 to 2019). |
| David K. James Year of Birth: 1970 | Since 2021 | Assistant Secretary (2021 to present)
Secretary (2021 to 2021) | Executive Vice President and Chief Legal and Risk Officer of Ultimus Fund Solutions, LLC (2018 to present); Managing Director and Managing Counsel of State Street Bank and Trust Company (2009 to 2018). |
| Natalie S. Anderson Year of Birth: 1975 | Since 2016 | Assistant Secretary (2016 to present) | Legal Administration Manager (July 2016 to present) and Paralegal (January 2015 to June 2016) of Ultimus Fund Solutions, LLC. |
40
| KARNER BLUE BIODIVERSITY IMPACT FUND |
| BOARD OF TRUSTEES AND EXECUTIVE OFFICERS (Unaudited) |
| (Continued) |
| Name and Year of Birth | Length of Time | Position(s) Held with Trust | Principal Occupation(s) During Past 5 Years |
| Executive Officers (Continued): | |||
| Gweneth Gosselink Year of Birth: 1955 | Since 2020 | Chief Compliance Officer (2020 to present) | Assistant Vice President, Senior Compliance Officer of Ultimus Fund Solutions, LLC (December 2019 to present); CCO Consultant at GKG Consulting, LLC (December 2019 to present); Chief Operating Officer & CCO at Miles Capital, Inc. (June 2013 to December 2019). |
| Martin Dean Year of Birth: 1963 | Since 2019 | Assistant Chief Compliance Officer (2020 to present)
Interim Chief Compliance Officer (October 2019 to January 2020)
Assistant Chief Compliance Officer (2016 to 2017) | Senior Vice President, Head of Fund Compliance (February 2020 to present); Vice President & Director of Fund Compliance of Ultimus Fund Solutions, LLC (January 2016 to January 2020). |
Additional information about members of the Board and executive officers is available in the Fund’s Statement of Additional Information (“SAI”). To obtain a free copy of the SAI, please call toll free 1-855-KBANIML (855-522-6465).
41
| KARNER BLUE BIODIVERSITY IMPACT FUND |
| DISCLOSURE REGARDING APPROVAL OF THE INVESTMENT |
| ADVISORY AGREEMENT (Unaudited) |
The Board of Trustees (the “Board”), including the Independent Trustees voting separately, has reviewed and approved the Fund’s Investment Advisory Agreement with Karner Blue Capital, LLC (the “Adviser” or “Karner Blue”) for an additional one-year term (the “Agreement”). The Board approved the Agreement at a meeting held on April 19-20, 2022, at which all of the Trustees were present.
In deciding whether to approve the continuation of the Agreement, the Board recalled its review of the materials related to the Fund and the Adviser throughout the preceding twelve months and its numerous discussions with Trust management and the Adviser about the operations and performance of the Fund during that period. The Board further considered those materials and discussions and other numerous factors, including the following:
The nature, extent, and quality of the services provided by the Adviser. In this regard, the Board reviewed the services being provided by the Adviser to the Fund including, without limitation, its providing a continuous investment program for the Fund, adhering to the Fund’s investment restrictions, complying with the Trust’s policies and procedures and voting proxies on behalf of the Fund. The Board considered the qualifications and experience of the portfolio managers who are responsible for the day-to day management of the Fund’s portfolio, as well as the qualifications of other individuals at the Adviser who provide services to the Fund. The Board concluded that the quality, extent, and nature of the services provided by the Adviser to the Fund were satisfactory.
The investment performance of the Fund. In this regard, the Board compared the performance of the Fund with the performance of its benchmark index, custom peer group, and Morningstar category. The Board concluded that the investment performance of the Fund had been satisfactory.
The costs of the services provided and profits realized by the Adviser and its affiliates from their relationship with the Fund. In this regard, the Board considered the Fund’s management fee proposed to be charged to the Fund and the Fund’s expense ratio, each as compared to the Fund’s peer group and to the fees charged by the Adviser to other similar clients. The Board considered the revenue earned by the Adviser from the Fund and the current and anticipated profitability of the Fund to the Adviser, if any. The Board considered the Adviser’s past fee reductions and expense reimbursements for the Fund and the indirect benefits that the Adviser received from its management of the Fund. The Board concluded that the advisory fee to be paid to the Adviser by the Fund is reasonable in light of the nature and quality of services provided by the Adviser.
The extent to which economics of scale would be realized as the Fund grows and whether advisory fee levels reflect these economies of scale for the benefit of the Fund’s investors. In this regard, the Board considered that the Fund’s fee arrangements with the Adviser involve both the advisory fee and the expense limitation agreement (the “ELA”). The Board determined that while the advisory fee rate remained the same as asset levels increased,
42
| KARNER BLUE BIODIVERSITY IMPACT FUND |
| DISCLOSURE REGARDING APPROVAL OF THE INVESTMENT |
| ADVISORY AGREEMENT (Unaudited) (Continued) |
the shareholders of the Fund have experienced benefits from the ELA and will continue to experience benefits from the ELA. The Board concluded that the advisory fee was reasonable in light of the information that was provided to the Trustees by the Adviser with respect to economies of scale.
After further discussion of the factors noted above, as well as other factors, and in reliance on the information provided by the Adviser and Trust management, and taking into account the totality of all factors discussed and information presented at the meeting and previous meetings, the Board indicated its agreement to approve the continuance of the Agreement and the Fund’s ELA. It was noted that in the Trustees’ deliberations regarding the approval of the continuance of the Agreement, the Trustees did not identify any particular information or factor that was all-important or controlling, and that each individual Trustee may have attributed different weights to various factors listed above. After full consideration of the above factors as well as other factors, the Board unanimously concluded that approval of the continuance of the Agreement was in the best interests of the Fund and its shareholders.
43
This page intentionally left blank.
This page intentionally left blank.
KARNER-AR-22
KEMPNER MULTI-CAP DEEP VALUE FUND
Institutional Class (FIKDX)
Investor Class (FAKDX)
Annual Report
May 31, 2022
| KEMPNER MULTI-CAP DEEP VALUE FUND | |
| LETTER TO SHAREHOLDERS (Unaudited) | June 14, 2022 |
Fund Objective
The Kempner Multi-Cap Deep Value Fund seeks to generate a total pre-tax return, including capital growth and dividends, greater than the rate of inflation over a minimum three- to five-year period. For the twelve months ended May 31, 2022, the Fund produced a total return of -2.61% (Institutional Class Shares) and -2.79% (Investor Class Shares), both net of fees. For the trailing three years ended May 31, 2022, the Fund produced a total return of 12.69% annualized (Institutional Class Shares) and 12.42% annualized (Investor Class Shares), both net of fees. The Headline CPI inflation rates over the periods were 8.52% for one year and 4.51% for three years annualized. Comparatively, over the same time periods the Lipper Multi-Cap Value Funds Classification Index returned 0.49% for one year and 13.26% for three years annualized; and the S&P 500 Value Index returned 2.46% for one year and 14.30% for three years annualized.
U.S. Economic Commentary
We continue to believe there will be no recession for the U.S. economy in calendar 2022. Much of our investment approach is based on that assumption. Despite the Ukraine situation, continuing inflation, oil shocks, divisive U.S. politics and Omicron, the basic strength of the U.S. economy will prevail in our opinion and be positive for the year. Most particularly, strength in jobs. We have created more jobs in the last calendar year than ever in the history of the U.S. economy. This increase continues with unemployment recently announced at 3.6% or near historic lows. As a consumer-based economy, this is the most important factor affecting economic strength and counters many recessionary factors. In addition, for the first time this year China is beginning to re-open from the Covid lockdowns. This will have an extremely positive influence on the U.S. manufacturing economy as well. However, there are also factors that will keep this growth relatively low, when compared to 2021.
| 1. | The Fed is now tightening significantly to combat inflation, which will result in the growth rate of the economy cooling down from last year’s torrid growth. |
| 2. | Goods are moving from scarcity to surplus as supply chains open up and demand slackens some. This means some discontinuities and lower profits in certain industries along the chain and will have a net effect of reducing corporate activity. However, note that this also means that the rate of goods inflation will be coming down some. |
| 3. | Government fiscal stimulus is gradually lowering, though the effects of new infrastructure programs will be a boost toward the end of this year. |
All in, despite the first quarter of 2022 being a negative due to major trade imbalances, we believe that the economy will end the year with approximately 2% real growth, no consecutive quarterly declines in GDP, and a 6 ½% - 7% nominal growth due to inflation.
Portfolio Strategy
Our investment approach continues to be one of investing in deeply undervalued companies and selling when the underlying value becomes realized by other market participants and reflected in the current price. The past year has therefore resulted in a greater number of buy opportunities than sell opportunities. Cash is always considered a buying reserve.
1
For the fiscal year of June 1, 2021 thru May 31, 2022, we established and/or added to positions in Adidas AG Spon ADR (ADDYY), Amgen Inc. (AMGN), Caterpillar Inc. (CAT), Citizens Financial Group (CFG), Crane Company (CR), Cisco Systems Inc. (CSCO), Continental AG (CTTAY), Disney (Walt) Company (DIS), Deutsche Telekom AG ADR (DTEGY), eBay Incorporated (EBAY), Equitable Holdings, Inc. (EQH), FedEx Corporation (FDX), Fidelity National Information Services (FIS), Kinross Gold Corporation (KGC), Leidos Holdings Inc. (LDOS), Lennar Corp. Cl B (LEN/B), Lockheed Martin Corporation (LMT), LyondellBasell Inc. NV (LYB), Michelin Compagne (MGGDY), Merck & Company inc. (MRK), Micron Technology (MU), Newmont Corporation (NEM), Organon & Company (OGN), Skyworks Solutions Inc. (SWKS), Truist Financial Corp. (TFC), Taiwan Semiconductor (TSM), ViacomCBS Inc. CL B (VIAC), Viatris Incorporated (VTRS), and Williams-Sonoma Inc. (WSM).
We reduced the Fund’s positions in Acuity Brands, Inc. (AYI), Bristol-Myers Squibb Co. (BMY), Cardinal Health Inc. (CAH), Cisco Systems Inc. (CSCO), DuPont de Nemours, Inc. (DD), Dow Incorporated (DOW), Johnson Controls Intl. PLC (JCI), McKesson Corporation (MCK), Merck & Company (MRK), Organon & Company (OGN), Occidental Warrants (OXY.WS), Roche Holdings LTD (RHHBY), Schlumberger LTD (SLB), Valero Energy Corp. (VLO), and Walgreens Boots alliance (WBA).
We sold entirely out of A T & T Inc. (T), Credit Suisse AG (CS), Honda Motor Co. LTD (HMC), Leidos Holdings, Inc. (LDOS), Lockheed Martin (LMT), McKesson Corporation (MCK), Newmont Corporation (NEM), Occidental Warrants (OXY.WS), Pfizer Incorporated (PFE), Valero Energy Corp. (VLO), and Verizon Communications (VZ).
The three securities with the most significant price increases during the last twelve-month period were represented by the industrial and consumer discretionary sectors. They are as follows:
| Contribution to Return | Total Return | |
| McKesson Corp. | +0.93 | +62.40 |
| Schlumberger Ltd. | +0.73 | +41.79 |
| Valero Energy Corp. | +0.67 | +41.44 |
The three securities with the worst performance in the portfolio during the 12-month period were an eclectic group with individual stock circumstances. They are as follows:
| General Motors Co. | -2.29 | -35.16 |
| Citigroup Inc. | -1.48 | -30.78 |
| The Walt Disney Co. | -1.46 | -38.25 |
We continue to scour the equity universe to locate stocks which meet our investment criteria of: 1) a relatively low forecast P/E multiple, usually 15x or less, 2) a dividend being paid, or expected to be, 3) public debt, if any, is investment grade, 4) a minimum of $500 million market capitalization, and 5) current stock price is within 20% of the 52-week low price. In addition to meeting these criteria, stocks are quantitatively and qualitatively analyzed to determine company prospects and reasonableness of valuation.
2
We maintain our long-term focus in the Kempner Multi-Cap Deep Value Fund on areas which are overlooked by the market. Harris L. Kempner, Jr. and M. Shawn Gault are the portfolio managers for the Kempner Multi-Cap Deep Value Fund.
Past performance is not predictive of future performance. Investment results and principal value will fluctuate so that shares, when redeemed, may be worth more or less than their original cost. Current performance may be higher or lower than the performance data quoted. Performance data current to the most recent month end are available by calling 1-800-665-9778.
An investor should consider the investment objectives, risks, charges, and expenses of the Fund carefully before investing. The Fund’s prospectus contains this and other important information. To obtain a copy of the Fund’s prospectus please call 1-800-665-9778 and a copy will be sent to you free of charge. Please read the prospectus carefully before you invest. Kempner Multi-Cap Deep Value Fund is distributed by Ultimus Fund Distributors, LLC.
This Letter to Shareholders seeks to describe some of the Adviser’s current opinions and views of the financial markets. Although the Adviser believes it has a reasonable basis for any opinions or views expressed, actual results may differ, sometimes significantly so, from those expected or expressed. The securities held by the Fund that are discussed in the Letter to Shareholders were held during the period covered by this Report. They do not comprise the entire investment portfolio of the Fund, may be sold at any time and may no longer be held by the Fund. For a complete list of securities held by the Fund as of May 31, 2022, please see the Schedule of Investments section of the annual report. The opinions of the Adviser with respect to those securities may change at any time.
Statements in the Letter to Shareholders that reflect projections or expectations for future financial or economic performance of the Fund and the market in general and statements of the Fund’s plans and objectives for future operations are forward-looking statements. No assurance can be given that actual results or events will not differ materially from those projected, estimated, assumed, or anticipated in any such forward-looking statements. Important factors that could result in such differences, in addition to factors noted with such forward-looking statements include, without limitation, general economic conditions, such as inflation, recession, and interest rates. Past performance is not a guarantee of future results.
3
KEMPNER MULTI-CAP DEEP VALUE FUND
PERFORMANCE INFORMATION
May 31, 2022 (Unaudited)
Comparison of the Change in Value of a $500,000 Investment
in Kempner Multi-Cap Deep Value Fund - Institutional Class versus the
S&P 500® Value Index*
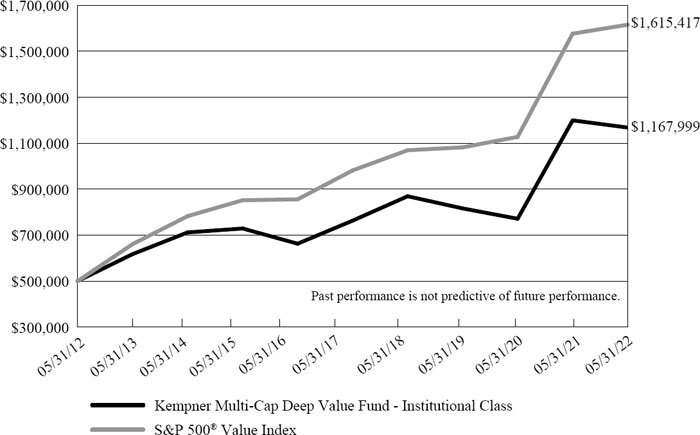
| Average Annual Total Returns | ||||||
| (for the years ended May 31, 2022) | ||||||
| 1 Year | 5 Years | 10 Years | ||||
| Kempner Multi-Cap Deep Value Fund - Institutional Class (a) | (2.61%) | 8.89% | 8.85% | |||
| Kempner Multi-Cap Deep Value Fund - Investor Class (a)(b) | (2.79%) | 8.63% | 8.60% | |||
| S&P 500® Value Index (c) | 2.46% | 10.48% | 12.44% | |||
| * | The graph is based on the performance of Institutional Class only; performance for Investor Class varies due to differences in fees paid by shareholders in the different classes. |
| (a) | The total returns shown do not reflect the deduction of taxes that a shareholder would pay on Fund distributions or the redemption of Fund shares. |
| (b) | Effective March 31, 2015, Class A Shares were re-designated as Investor Class. Prior to March 31, 2015, shareholders were charged a sales charge on purchases and redemptions of Class A Shares. The performance information provided for the period prior to March 31, 2015 represents the performance of Investor Class when they were called Class A Shares. The share class change had no impact on the Fund’s operations or investment policy. |
| (c) | The S&P 500® Value Index measure value stocks using three factors: the ratios of book value, earnings, and sales to price. Constituents are drawn from the S&P 500® Index. The Index is unmanaged and shown for illustration purposes only. An investor cannot invest in an index and its returns are not indicative of the performance of any specific investment. |
4
KEMPNER MULTI-CAP DEEP VALUE FUND
PORTFOLIO INFORMATION
May 31, 2022 (Unaudited)
Sector Diversification (% of Net Assets)
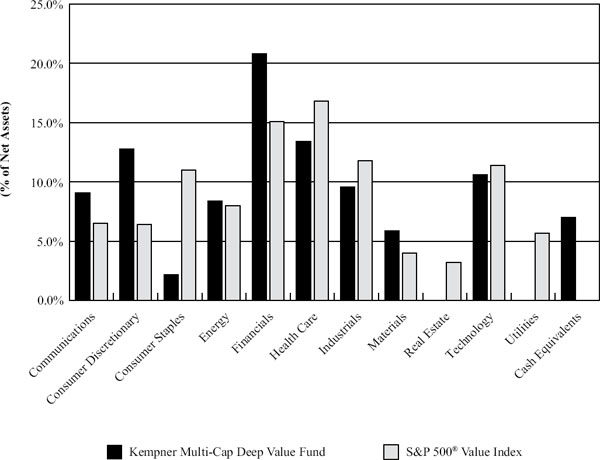
Top 10 Equity Investments
| Security Description | % of Net Assets | |
| Lincoln National Corporation | 5.2% | |
| General Motors Company | 4.3% | |
| Bank of America Corporation | 3.7% | |
| Citigroup, Inc. | 3.5% | |
| BP plc - ADR | 3.5% | |
| Viatris, Inc. | 3.5% | |
| Continental AG - ADR | 3.2% | |
| Walt Disney Company (The) | 3.1% | |
| Paramount Global - Class B | 3.1% | |
| Shell plc - ADR | 2.8% | |
5
| KEMPNER MULTI-CAP DEEP VALUE FUND |
| SCHEDULE OF INVESTMENTS |
| May 31, 2022 |
| COMMON STOCKS — 92.0% | Shares | Value | ||||||
| Communications — 8.3% | ||||||||
| Entertainment Content — 6.2% | ||||||||
| Paramount Global - Class B | 74,110 | $ | 2,544,196 | |||||
| Walt Disney Company (The) (a) | 23,500 | 2,595,340 | ||||||
| 5,139,536 | ||||||||
| Telecommunications — 2.1% | ||||||||
| Deutsche Telekom AG - ADR | 84,869 | 1,745,756 | ||||||
| Consumer Discretionary — 12.8% | ||||||||
| Apparel & Textile Products — 0.5% | ||||||||
| adidas AG - ADR | 4,300 | 426,302 | ||||||
| Automotive — 8.5% | ||||||||
| Cie Generale des Etablissements Michelin - ADR | 26,590 | 692,138 | ||||||
| Continental AG - ADR | 346,600 | 2,672,286 | ||||||
| General Motors Company (a) | 92,720 | 3,586,410 | ||||||
| Vitesco Technologies Group AG - ADR (a) | 10,090 | 91,314 | ||||||
| 7,042,148 | ||||||||
| E-Commerce Discretionary — 1.1% | ||||||||
| eBay, Inc. | 19,500 | 949,065 | ||||||
| Home Construction — 1.7% | ||||||||
| Lennar Corporation - Class B | 20,300 | 1,363,551 | ||||||
| Retail - Discretionary — 1.0% | ||||||||
| Williams-Sonoma, Inc. | 6,150 | 786,708 | ||||||
| Consumer Staples — 2.2% | ||||||||
| Food — 1.1% | ||||||||
| Ingredion, Inc. | 9,800 | 927,962 | ||||||
| Retail - Consumer Staples — 1.1% | ||||||||
| Walgreen Boots Alliance, Inc. | 19,450 | 852,494 | ||||||
| Energy — 8.4% | ||||||||
| Oil & Gas Producers — 6.3% | ||||||||
| BP plc - ADR | 89,120 | 2,884,814 | ||||||
| Shell plc - ADR | 39,454 | 2,336,466 | ||||||
| 5,221,280 | ||||||||
| Oil & Gas Services & Equipment — 2.1% | ||||||||
| Schlumberger Ltd. | 38,055 | 1,749,008 | ||||||
6
| KEMPNER MULTI-CAP DEEP VALUE FUND |
| SCHEDULE OF INVESTMENTS (Continued) |
| COMMON STOCKS — 92.0% (Continued) | Shares | Value | ||||||
| Financials — 20.8% | ||||||||
| Banking — 10.2% | ||||||||
| Bank of America Corporation | 81,720 | $ | 3,039,984 | |||||
| Citigroup, Inc. | 54,100 | 2,889,481 | ||||||
| Citizens Financial Group, Inc. | 20,600 | 852,428 | ||||||
| Truist Financial Corporation | 32,300 | 1,606,602 | ||||||
| 8,388,495 | ||||||||
| Insurance — 10.6% | ||||||||
| Equitable Holdings, Inc. | 60,150 | 1,829,161 | ||||||
| Everest Re Group Ltd. | 6,200 | 1,751,500 | ||||||
| Hartford Financial Services Group, Inc. (The) | 11,650 | 844,741 | ||||||
| Lincoln National Corporation | 74,850 | 4,336,061 | ||||||
| 8,761,463 | ||||||||
| Health Care — 13.4% | ||||||||
| Biotech & Pharma — 10.6% | ||||||||
| Amgen, Inc. | 4,300 | 1,103,982 | ||||||
| Bristol-Myers Squibb Company | 12,850 | 969,532 | ||||||
| Merck & Company, Inc. | 17,630 | 1,622,489 | ||||||
| Organon & Company | 38,643 | 1,466,888 | ||||||
| Roche Holding AG - ADR | 16,150 | 687,021 | ||||||
| Viatris, Inc. | 233,485 | 2,864,861 | ||||||
| 8,714,773 | ||||||||
| Health Care Facilities & Services — 2.8% | ||||||||
| Cardinal Health, Inc. | 41,265 | 2,324,045 | ||||||
| Industrials — 9.6% | ||||||||
| Electrical Equipment — 4.4% | ||||||||
| Acuity Brands, Inc. | 11,085 | 1,940,097 | ||||||
| Johnson Controls International plc | 31,549 | 1,719,736 | ||||||
| 3,659,833 | ||||||||
| Machinery — 3.0% | ||||||||
| Caterpillar, Inc. | 7,100 | 1,532,535 | ||||||
| Crane Holdings Company | 9,600 | 918,336 | ||||||
| 2,450,871 | ||||||||
| Transportation & Logistics — 2.2% | ||||||||
| FedEx Corporation | 8,100 | 1,819,098 | ||||||
| Materials — 5.9% | ||||||||
| Chemicals — 5.0% | ||||||||
| Corteva, Inc. | 25,499 | 1,596,747 | ||||||
| Dow, Inc. | 7,249 | 492,787 | ||||||
| DuPont de Nemours, Inc. | 9,700 | 658,145 | ||||||
| LyondellBasell Industries N.V. - Class A | 12,500 | 1,428,125 | ||||||
| 4,175,804 | ||||||||
7
| KEMPNER MULTI-CAP DEEP VALUE FUND |
| SCHEDULE OF INVESTMENTS (Continued) |
| COMMON STOCKS — 92.0% (Continued) | Shares | Value | ||||||
| Materials — 5.9% (Continued) | ||||||||
| Metals & Mining — 0.9% | ||||||||
| Kinross Gold Corporation | 160,600 | $ | 722,700 | |||||
| Technology — 10.6% | ||||||||
| Semiconductors — 6.6% | ||||||||
| Micron Technology, Inc. | 20,800 | 1,535,872 | ||||||
| Skyworks Solutions, Inc. | 20,400 | 2,220,948 | ||||||
| Taiwan Semiconductor Manufacturing Company Ltd. - ADR | 17,700 | 1,686,810 | ||||||
| 5,443,630 | ||||||||
| Technology Hardware — 2.0% | ||||||||
| Cisco Systems, Inc. | 37,320 | 1,681,266 | ||||||
| Technology Services — 2.0% | ||||||||
| Fidelity National Information Services, Inc. | 15,400 | 1,609,300 | ||||||
| Total Common Stocks (Cost $68,218,031) | $ | 75,955,088 | ||||||
| PREFERRED STOCKS — 0.8% | Shares | Value | ||||||
| Communications — 0.8% | ||||||||
| Entertainment Content — 0.8% | ||||||||
| Paramount Global, Series A, 5.75% (Cost $860,830) | 13,500 | $ | 686,340 | |||||
8
KEMPNER MULTI-CAP DEEP VALUE FUND |
| SCHEDULE OF INVESTMENTS (Continued) |
| MONEY MARKET FUNDS — 7.0% | Shares | Value | ||||||
| First American Treasury Obligations Fund - Class X, 0.68% (b) (Cost $5,816,222) | 5,816,222 | $ | 5,816,222 | |||||
| Investments at Value — 99.8% (Cost $74,895,083) | $ | 82,457,650 | ||||||
| Other Assets in Excess of Liabilities — 0.2% | 163,779 | |||||||
| Net Assets — 100.0% | $ | 82,621,429 | ||||||
ADR – American Depositary Receipt
AG – Aktiengesellschaft
N.V. – Naamloze Vennootschap
plc – Public Limited Company
| (a) | Non-income producing security. |
| (b) | The rate shown is the 7-day effective yield as of May 31, 2022. |
See accompanying notes to financial statements.
9
| KEMPNER MULTI-CAP DEEP VALUE FUND |
| STATEMENT OF ASSETS AND LIABILITIES |
| May 31, 2022 |
| ASSETS | ||||
| Investments: | ||||
| At cost | $ | 74,895,083 | ||
| At value (Note 2) | $ | 82,457,650 | ||
| Receivable for capital shares sold | 78 | |||
| Dividends receivable | 209,201 | |||
| Tax reclaims receivable | 31,049 | |||
| Other assets | 7,098 | |||
| Total assets | 82,705,076 | |||
| LIABILITIES | ||||
| Payable to Adviser (Note 4) | 39,696 | |||
| Payable to administrator (Note 4) | 13,745 | |||
| Accrued distribution fees (Note 4) | 6,208 | |||
| Other accrued expenses | 23,998 | |||
| Total liabilities | 83,647 | |||
| NET ASSETS | $ | 82,621,429 | ||
| NET ASSETS CONSIST OF: | ||||
| Paid-in capital | $ | 70,934,980 | ||
| Distributable earnings | 11,686,449 | |||
| NET ASSETS | $ | 82,621,429 | ||
| NET ASSET VALUE PER SHARE: | ||||
| INSTITUTIONAL CLASS | ||||
| Net assets applicable to Institutional Class | $ | 64,995,427 | ||
| Institutional Class shares of beneficial interest outstanding (unlimited number of shares authorized, no par value) | 5,662,279 | |||
| Net asset value, offering price and redemption price per share (Note 2) | $ | 11.48 | ||
| INVESTOR CLASS | ||||
| Net assets applicable to Investor Class | $ | 17,626,002 | ||
| Investor Class shares of beneficial interest outstanding (unlimited number of shares authorized, no par value) | 1,537,013 | |||
| Net asset value, offering price and redemption price per share (Note 2) | $ | 11.47 | ||
See accompanying notes to financial statements.
10
| KEMPNER MULTI-CAP DEEP VALUE FUND |
| STATEMENT OF OPERATIONS |
| For the Year Ended May 31, 2022 |
| INVESTMENT INCOME | ||||
| Dividend income | $ | 2,045,982 | ||
| Foreign withholding taxes on dividends | (67,435 | ) | ||
| Total investment income | 1,978,547 | |||
| EXPENSES | ||||
| Investment advisory fees (Note 4) | 502,273 | |||
| Administration fees (Note 4) | 85,065 | |||
| Fund accounting fees (Note 4) | 45,541 | |||
| Distribution fees - Investor Class (Note 4) | 45,366 | |||
| Transfer agent fees (Note 4) | 27,778 | |||
| Legal fees | 27,485 | |||
| Registration and filing fees | 19,701 | |||
| Trustees’ fees and expenses (Note 4) | 17,817 | |||
| Audit and tax services fees | 16,960 | |||
| Compliance service fees (Note 4) | 12,000 | |||
| Custodian and bank service fees | 11,589 | |||
| Printing of shareholder reports | 6,435 | |||
| Postage and supplies | 5,475 | |||
| Insurance expense | 4,101 | |||
| Other expenses | 14,932 | |||
| Total expenses | 842,518 | |||
| NET INVESTMENT INCOME | 1,136,029 | |||
| REALIZED AND UNREALIZED GAINS (LOSSES) ON INVESTMENTS | ||||
| Net realized gains from investment transactions | 3,990,397 | |||
| Net change in unrealized appreciation (depreciation) on investments | (7,413,345 | ) | ||
| NET REALIZED AND UNREALIZED LOSSES ON INVESTMENTS | (3,422,948 | ) | ||
| NET DECREASE IN NET ASSETS RESULTING FROM OPERATIONS | $ | (2,286,919 | ) | |
See accompanying notes to financial statements.
11
| KEMPNER MULTI-CAP DEEP VALUE FUND |
| STATEMENTS OF CHANGES IN NET ASSETS |
| Year | Year | |||||||
| Ended | Ended | |||||||
| May 31, | May 31, | |||||||
| 2022 | 2021 | |||||||
| FROM OPERATIONS | ||||||||
| Net investment income | $ | 1,136,029 | $ | 1,000,156 | ||||
| Net realized gains from investment transactions | 3,990,397 | 5,555,621 | ||||||
| Net change in unrealized appreciation (depreciation) on investments | (7,413,345 | ) | 25,309,541 | |||||
| Net increase (decrease) in net assets resulting from operations | (2,286,919 | ) | 31,865,318 | |||||
| FROM DISTRIBUTIONS TO SHAREHOLDERS (Note 2) | ||||||||
| Institutional Class | (5,383,280 | ) | (3,496,009 | ) | ||||
| Investor Class | (1,382,525 | ) | (887,811 | ) | ||||
| Decrease in net assets from distributions to shareholders | (6,765,805 | ) | (4,383,820 | ) | ||||
| CAPITAL SHARE TRANSACTIONS | ||||||||
| Institutional Class | ||||||||
| Proceeds from shares sold | 3,393,328 | 1,250,001 | ||||||
| Net asset value of shares issued in reinvestment of distributions to shareholders | 439,322 | 186,356 | ||||||
| Payments for shares redeemed | (851,453 | ) | (2,484,949 | ) | ||||
| Net increase (decrease) in Institutional Class net assets from capital share transactions | 2,981,197 | (1,048,592 | ) | |||||
| Investor Class | ||||||||
| Proceeds from shares sold | 578,111 | 983,556 | ||||||
| Net asset value of shares issued in reinvestment of distributions to shareholders | 1,142,088 | 877,593 | ||||||
| Payments for shares redeemed | (1,295,529 | ) | (783,555 | ) | ||||
| Net increase in Investor Class net assets from capital share transactions | 424,670 | 1,077,594 | ||||||
| TOTAL INCREASE (DECREASE) IN NET ASSETS | (5,646,857 | ) | 27,510,500 | |||||
| NET ASSETS | ||||||||
| Beginning of year | 88,268,286 | 60,757,786 | ||||||
| End of year | $ | 82,621,429 | $ | 88,268,286 | ||||
See accompanying notes to financial statements.
12
| KEMPNER MULTI-CAP DEEP VALUE FUND |
| STATEMENTS OF CHANGES IN NET ASSETS (Continued) |
| Year | Year | |||||||
| Ended | Ended | |||||||
| May 31, | May 31, | |||||||
| 2022 | 2021 | |||||||
| CAPITAL SHARES ACTIVITY | ||||||||
| Institutional Class | ||||||||
| Shares sold | 289,165 | 123,603 | ||||||
| Shares issued in reinvestment of distributions to shareholders | 37,216 | 18,589 | ||||||
| Shares redeemed | (71,509 | ) | (268,667 | ) | ||||
| Net increase (decrease) in shares outstanding | 254,872 | (126,475 | ) | |||||
| Shares outstanding at beginning of year | 5,407,407 | 5,533,882 | ||||||
| Shares outstanding at end of year | 5,662,279 | 5,407,407 | ||||||
| Investor Class | ||||||||
| Shares sold | 47,703 | 94,988 | ||||||
| Shares issued in reinvestment of distributions to shareholders | 97,283 | 87,550 | ||||||
| Shares redeemed | (105,117 | ) | (78,176 | ) | ||||
| Net increase in shares outstanding | 39,869 | 104,362 | ||||||
| Shares outstanding at beginning of year | 1,497,144 | 1,392,782 | ||||||
| Shares outstanding at end of year | 1,537,013 | 1,497,144 | ||||||
See accompanying notes to financial statements.
13
KEMPNER MULTI-CAP DEEP VALUE FUND
INSTITUTIONAL CLASS
FINANCIAL HIGHLIGHTS
Per Share Data for a Share Outstanding Throughout Each Period
| Ten | ||||||||||||||||||||||||
| Year | Year | Months | Year | Year | Year | |||||||||||||||||||
| Ended | Ended | Ended | Ended | Ended | Ended | |||||||||||||||||||
| May 31, | May 31, | May 31, | July 31, | July 31, | July 31, | |||||||||||||||||||
| 2022 | 2021 | 2020 (a) | 2019 | 2018 | 2017 | |||||||||||||||||||
| Net asset value at beginning of period | $ | 12.79 | $ | 8.77 | $ | 10.70 | $ | 11.01 | $ | 10.47 | $ | 9.18 | ||||||||||||
| Income (loss) from investment operations: | ||||||||||||||||||||||||
| Net investment income | 0.17 | (b) | 0.15 | (b) | 0.20 | 0.21 | 0.19 | 0.19 | ||||||||||||||||
| Net realized and unrealized gains (losses) on investments | (0.49 | ) | 4.53 | (1.62 | ) | (0.19 | ) | 1.00 | 1.29 | |||||||||||||||
| Total from investment operations | (0.32 | ) | 4.68 | (1.42 | ) | 0.02 | 1.19 | 1.48 | ||||||||||||||||
| Less distributions from: | ||||||||||||||||||||||||
| Net investment income | (0.15 | ) | (0.16 | ) | (0.17 | ) | (0.23 | ) | (0.17 | ) | (0.19 | ) | ||||||||||||
| Net realized gains | (0.84 | ) | (0.50 | ) | (0.34 | ) | (0.10 | ) | (0.48 | ) | — | |||||||||||||
| Total distributions | (0.99 | ) | (0.66 | ) | (0.51 | ) | (0.33 | ) | (0.65 | ) | (0.19 | ) | ||||||||||||
| Net asset value at end of period | $ | 11.48 | $ | 12.79 | $ | 8.77 | $ | 10.70 | $ | 11.01 | $ | 10.47 | ||||||||||||
| Total return (c) | (2.61 | %) | 55.52 | % | (13.99 | %) (d) | 0.43 | % | 11.79 | % | 16.30 | % | ||||||||||||
| Net assets at end of period (000’s) | $ | 64,995 | $ | 69,143 | $ | 48,552 | $ | 60,228 | $ | 67,725 | $ | 67,863 | ||||||||||||
| Ratios/supplementary data: | ||||||||||||||||||||||||
| Ratio of total expenses to average net assets | 0.94 | % | 0.97 | % | 0.99 | % (e) | 0.95 | % | 0.94 | % | 0.84 | % | ||||||||||||
| Ratio of net investment income to average net assets | 1.39 | % | 1.46 | % | 2.37 | % (e) | 2.13 | % | 1.74 | % | 1.98 | % | ||||||||||||
| Portfolio turnover rate | 33 | % | 21 | % | 27 | % (d) | 17 | % | 25 | % | 18 | % | ||||||||||||
| (a) | Fund changed fiscal year to May 31. |
| (b) | Per share net investment income has been determined on the basis of average number of shares outstanding during the period. |
| (c) | Total return is a measure of the change in value of an investment in the Fund over the periods covered. The returns shown do not reflect the deduction of taxes a shareholder would pay on Fund distributions, if any, or the redemption of Fund shares. |
| (d) | Not annualized. |
| (e) | Annualized. |
See accompanying notes to financial statements.
14
KEMPNER MULTI-CAP DEEP VALUE FUND
INVESTOR CLASS
FINANCIAL HIGHLIGHTS
Per Share Data for a Share Outstanding Throughout Each Period
| Ten | ||||||||||||||||||||||||
| Year | Year | Months | Year | Year | Year | |||||||||||||||||||
| Ended | Ended | Ended | Ended | Ended | Ended | |||||||||||||||||||
| May 31, | May 31, | May 31, | July 31, | July 31, | July 31, | |||||||||||||||||||
| 2022 | 2021 | 2020 (a) | 2019 | 2018 | 2017 | |||||||||||||||||||
| Net asset value at beginning of period | $ | 12.77 | $ | 8.76 | $ | 10.69 | $ | 11.00 | $ | 10.46 | $ | 9.17 | ||||||||||||
| Income (loss) from investment operations: | ||||||||||||||||||||||||
| Net investment income | 0.14 | (b) | 0.13 | (b) | 0.18 | 0.18 | 0.17 | 0.17 | ||||||||||||||||
| Net realized and unrealized gains (losses) on investments | (0.48 | ) | 4.51 | (1.62 | ) | (0.19 | ) | 1.00 | 1.29 | |||||||||||||||
| Total from investment operations | (0.34 | ) | 4.64 | (1.44 | ) | (0.01 | ) | 1.17 | 1.46 | |||||||||||||||
| Less distributions from: | ||||||||||||||||||||||||
| Net investment income | (0.12 | ) | (0.13 | ) | (0.15 | ) | (0.20 | ) | (0.15 | ) | (0.17 | ) | ||||||||||||
| Net realized gains | (0.84 | ) | (0.50 | ) | (0.34 | ) | (0.10 | ) | (0.48 | ) | — | |||||||||||||
| Total distributions | (0.96 | ) | (0.63 | ) | (0.49 | ) | (0.30 | ) | (0.63 | ) | (0.17 | ) | ||||||||||||
| Net asset value at end of period | $ | 11.47 | $ | 12.77 | $ | 8.76 | $ | 10.69 | $ | 11.00 | $ | 10.46 | ||||||||||||
| Total return (c) | (2.79 | %) | 55.09 | % | (14.18 | %) (d) | 0.18 | % | 11.55 | % | 16.06 | % | ||||||||||||
| Net assets at end of period (000’s) | $ | 17,626 | $ | 19,125 | $ | 12,206 | $ | 14,495 | $ | 14,803 | $ | 15,321 | ||||||||||||
| Ratios/supplementary data: | ||||||||||||||||||||||||
| Ratio of total expenses to average net assets | 1.19 | % | 1.22 | % | 1.24 | % (e) | 1.20 | % | 1.19 | % | 1.09 | % | ||||||||||||
| Ratio of net investment income to average net assets | 1.14 | % | 1.21 | % | 2.12 | % (e) | 1.88 | % | 1.49 | % | 1.70 | % | ||||||||||||
| Portfolio turnover rate | 33 | % | 21 | % | 27 | % (d) | 17 | % | 25 | % | 18 | % | ||||||||||||
| (a) | Fund changed fiscal year to May 31. |
| (b) | Per share net investment income has been determined on the basis of average number of shares outstanding during the period. |
| (c) | Total return is a measure of the change in value of an investment in the Fund over the periods covered. The returns shown do not reflect the deduction of taxes a shareholder would pay on Fund distributions, if any, or the redemption of Fund shares. |
| (d) | Not annualized. |
| (e) | Annualized. |
See accompanying notes to financial statements.
15
| KEMPNER MULTI-CAP DEEP VALUE FUND |
| NOTES TO FINANCIAL STATEMENTS |
| May 31, 2022 |
1. Organization
Kempner Multi-Cap Deep Value Fund (the “Fund”) is a diversified series of Ultimus Managers Trust (the “Trust”). The Trust is an open-end management investment company registered under the Investment Company Act of 1940, as amended (the “1940 Act”). The Fund was reorganized into the Trust on April 28, 2017.
The investment objective of the Fund is to seek to generate a total pre-tax return, including capital growth and dividends, that is greater than the rate of inflation over a three-to-five-year period.
The Fund currently offers two classes of shares: Institutional Class shares (sold without any sales loads and distribution and/or shareholder servicing fees and requiring a $500,000 initial investment) and Investor Class shares (sold without any sales loads, but subject to a distribution and/or shareholder servicing fee of up to 0.25% of the average daily net assets attributable to Investor Class shares and requiring a $500 initial investment). Each share class represents an ownership interest in the same investment portfolio.
2. Significant Accounting Policies
The Fund follows accounting and reporting guidance under Financial Accounting Standards Board Accounting Standards Codification Topic 946, “Financial Services – Investment Companies.” The following is a summary of the Fund’s significant accounting policies used in the preparation of its financial statements. These policies are in conformity with accounting principles generally accepted in the United States of America (“GAAP”).
Securities valuation – The Fund values its portfolio securities at market value as of the close of regular trading on the New York Stock Exchange (the “NYSE”) (normally 4:00 p.m. Eastern time) on each business day the NYSE is open for business. The Fund values its listed securities on the basis of the security’s last sale price on the security’s primary exchange, if available, otherwise at the exchange’s most recently quoted mean price. NASDAQ-listed securities are valued at the NASDAQ Official Closing Price. Investments representing shares of money market funds and other open-end investment companies are valued at their net asset value (“NAV”) as reported by such companies. When using a quoted price and when the market for the security is considered active, the security will be classified as Level 1 within the fair value hierarchy (see below). In the event that market quotations are not readily available or are considered unreliable due to market or other events, the Fund values its securities and other assets at fair value in accordance with procedures established by and under the general supervision of the Board of Trustees (the “Board”). Under these procedures, the securities will be classified as Level 2 or 3 within the fair value hierarchy, depending on the inputs used. Unavailable or unreliable market quotes may be due to the following factors: a substantial bid-ask spread; infrequent sales resulting in stale prices; insufficient trading volume; small trade sizes; a temporary lapse in any reliable pricing source; and actions of the securities or futures markets, such as the suspension or limitation of trading. As a result, the prices of securities used to calculate the Fund’s NAV may differ from quoted or published prices for the same securities.
16
| KEMPNER MULTI-CAP DEEP VALUE FUND |
| NOTES TO FINANCIAL STATEMENTS (Continued) |
GAAP establishes a single authoritative definition of fair value, sets out a framework for measuring fair value, and requires additional disclosures about fair value measurements.
Various inputs are used in determining the value of the Fund’s investments. These inputs are summarized in the three broad levels listed below:
| ● | Level 1 – quoted prices in active markets for identical securities |
| ● | Level 2 – other significant observable inputs |
| ● | Level 3 – significant unobservable inputs |
The inputs or methods used for valuing securities are not necessarily an indication of the risks associated with investing in those securities. The inputs used to measure fair value may fall into different levels of the fair value hierarchy. In such cases, for disclosure purposes, the level in the fair value hierarchy within which the fair value measurement falls in its entirety is determined based on the lowest level input that is significant to the fair value measurement.
The following is a summary of the Fund’s investments based on the inputs used to value the investments as of May 31, 2022 by security type:
| Level 1 | Level 2 | Level 3 | Total | |||||||||||||
| Common Stocks | $ | 75,955,088 | $ | — | $ | — | $ | 75,955,088 | ||||||||
| Preferred Stocks | 686,340 | — | — | 686,340 | ||||||||||||
| Money Market Funds | 5,816,222 | — | — | 5,816,222 | ||||||||||||
| Total | $ | 82,457,650 | $ | — | $ | — | $ | 82,457,650 | ||||||||
Refer to the Fund’s Schedule of Investments for a listing of securities by sector and industry type. The Fund did not hold any derivative instruments or any assets or liabilities that were measured at fair value on a recurring basis using significant unobservable inputs (Level 3) as of or during year ended May 31, 2022.
Share valuation – The NAV per share of each class of the Fund is calculated daily by dividing the total value of the assets attributable to that class, less liabilities attributable to that class, by the number of shares outstanding of that class. The offering price and redemption price per share of each class of the Fund is equal to the NAV per share of such class.
Investment income – Dividend income is recorded on the ex-dividend date. Non-cash dividends included in dividend income, if any, are recorded at the fair market value of the security received. Interest income is accrued as earned. Withholding taxes on foreign dividends have been recorded in accordance with the Fund’s understanding of the applicable country’s rules and tax rates.
Investment transactions – Investment transactions are accounted for on the trade date. Realized gains and losses on investments sold are determined on a specific identification basis.
17
| KEMPNER MULTI-CAP DEEP VALUE FUND |
| NOTES TO FINANCIAL STATEMENTS (Continued) |
Allocation between classes – Investment income earned, realized capital gains and losses, and unrealized appreciation and depreciation are allocated daily to each class of the Fund based upon its proportionate share of total net assets of the Fund. Class-specific expenses are charged directly to the class incurring the expense. Common expenses which are not attributable to a specific class are allocated daily to each class of shares of the Fund based upon its proportionate share of total net assets of the Fund.
Common expenses – Common expenses of the Trust are allocated among the Fund and the other series of the Trust based on the relative net assets of each series, the number of series in the Trust, or the nature of the services performed and the relative applicability to each series.
Distributions to shareholders – The Fund intends to declare and distribute net investment income dividends on a quarterly basis. In addition, the Fund will declare and distribute net realized capital gains, if any, on an annual basis. The amount of such dividends and distributions are determined in accordance with federal income tax regulations, which may differ from GAAP. Dividends and distributions to shareholders are recorded on the ex-dividend date. The tax character of distributions paid to shareholders by the Fund during the years ended May 31, 2022 and 2021 were as follows:
| Year | Ordinary | Long-Term | Total | |||
| Ended | Income | Capital Gains | Distributions | |||
| 5/31/2022 | $ 2,778,664 | $ 3,987,141 | $ 6,765,805 | |||
| 5/31/2021 | $ 2,014,446 | $ 2,369,374 | $ 4,383,820 |
Estimates – The preparation of financial statements in conformity with GAAP requires management to make estimates and assumptions that affect the reported amounts of assets and liabilities and disclosure of contingent assets and liabilities as of the date of the financial statements and the reported amounts of increase (decrease) in net assets from operations during the reporting period. Actual results could differ from those estimates.
Federal income tax – The Fund has qualified and intends to continue to qualify as a regulated investment company under the Internal Revenue Code of 1986 (the “Code”). Qualification generally will relieve the Fund of liability for federal income taxes to the extent 100% of its net investment income and net realized capital gains are distributed in accordance with the Code.
In order to avoid imposition of the excise tax applicable to regulated investment companies, it is also the Fund’s intention to declare as dividends in each calendar year amounts equal to at least 98% of its net investment income (earned during the calendar year) and 98.2% of its net realized capital gains (earned during the twelve months ended October 31) plus undistributed amounts from prior years.
18
| KEMPNER MULTI-CAP DEEP VALUE FUND |
| NOTES TO FINANCIAL STATEMENTS (Continued) |
The following information is computed on a tax basis for each item as of May 31, 2022:
| Tax cost of investments | $ | 74,895,092 | ||
| Gross unrealized appreciation | $ | 12,253,975 | ||
| Gross unrealized depreciation | (4,691,417 | ) | ||
| Net unrealized appreciation | 7,562,558 | |||
| Undistributed ordinary income | 766,774 | |||
| Undistributed long-term gains | 3,357,117 | |||
| Distributable earnings | $ | 11,686,449 | ||
The value of the federal income tax cost of investments may temporarily differ from the financial statement cost. This book/tax difference is due to the recognition of capital gains or losses under income tax regulations and GAAP, primarily due to the tax deferral of losses on wash sales.
The Fund recognizes the tax benefits or expenses of uncertain tax positions only when the position is “more likely than not” of being sustained assuming examination by tax authorities. Management has reviewed the Fund’s tax positions for all open tax years (generally, three years) and has concluded that no provision for unrecognized tax benefits or expenses is required in these financial statements. The Fund identifies its major tax jurisdiction as U.S. Federal.
3. Investment Transactions
During year ended May 31, 2022, cost of purchases and proceeds from sales of investment securities, other than short-term investments, amounted to $31,999,691 and $24,588,998, respectively.
4. Transactions with Related Parties
INVESTMENT ADVISORY AGREEMENT
The Fund’s investments are managed by Kempner Capital Management, Inc. (the “Adviser”) pursuant to the terms of an Investment Advisory Agreement. The Fund pays the Adviser an investment advisory fee, computed and accrued daily and paid monthly, at the annual rate of 0.59% of average daily net assets.
The Adviser has agreed contractually, until at least December 1, 2022, to reduce its advisory fees and reimburse other expenses to the extent necessary to limit total annual fund operating expenses (exclusive of brokerage costs; taxes; interest; borrowing costs such as interest and dividend expenses on securities sold short; costs to organize the Fund; acquired fund fees and expenses; extraordinary expenses such as litigation and merger or reorganization costs and other expenses not incurred in the ordinary course of the Fund’s business) to an amount not exceeding 1.05% and 1.30% of average daily net assets for Institutional Class and Investor Class shares, respectively.
19
| KEMPNER MULTI-CAP DEEP VALUE FUND |
| NOTES TO FINANCIAL STATEMENTS (Continued) |
Advisory fee reductions and expense reimbursements by the Adviser are subject to repayment by the Fund for a period of three years after such fees and expenses were incurred, provided that the repayments do not cause the Fund’s total annual fund operating expenses to exceed the lesser of (i) the expense limitation then in effect, if any, and (ii) the expense limitation in effect at the time the expenses to be repaid were incurred. This agreement will terminate automatically if the Investment Advisory Agreement is terminated. During the year ended May 31, 2022, the Adviser did not reduce its advisory fees or reimburse other expenses of the Fund.
OTHER SERVICE PROVIDERS
Ultimus Fund Solutions, LLC (“Ultimus”) provides administration, fund accounting, compliance and transfer agency services to the Fund. The Fund pays Ultimus fees in accordance with the agreements for such services. In addition, the Fund pays out-of-pocket expenses including, but not limited to, postage, supplies and certain costs related to the pricing of the Fund’s portfolio securities.
Under the terms of a Distribution Agreement with the Trust, Ultimus Fund Distributors, LLC (the “Distributor”) serves as principal underwriter to the Fund. The Distributor is a wholly-owned subsidiary of Ultimus. The Distributor is compensated partially by the Adviser and partially by the Investor Class shares of the Fund for acting as principal underwriter.
A Trustee and certain officers of the Trust are also officers of Ultimus.
DISTRIBUTION PLAN
The Fund has adopted a plan of distribution (the “Plan”), pursuant to Rule 12b-1 under the 1940 Act, which permits Investor Class shares of the Fund to directly incur or reimburse the Fund’s principal underwriter for certain expenses related to the distribution of Investor Class shares. The annual limitation for payment of expenses pursuant to the Plan is 0.25% of the Fund’s average daily net assets allocable to Investor Class shares. The Fund has not adopted a plan of distribution with respect to Institutional Class shares. During the year ended May 31, 2022, Investor Class shares of the Fund incurred $45,366 of distribution fees under the Plan.
TRUSTEE COMPENSATION
Effective October 20, 2021, each member of the Board (a “Trustee”) who is not an “interested person” (as defined by the 1940 Act, as amended) of the Trust (“Independent Trustee”) receives a $1,300 annual retainer from the Fund, paid quarterly, except for the Board Chairperson who receives a $1,700 annual retainer from the Fund, paid in quarterly installments. Each Independent Trustee also receives from the Fund a fee of $550 for each Board meeting attended plus reimbursement for travel and other meeting-related expenses. Prior to October 20, 2021, each Independent Trustee received a $1,300 annual retainer from the Fund, paid quarterly, except for the Board Chairperson who received a $1,500 annual retainer from the Fund, paid in quarterly installments. Each Independent Trustee also received from the Fund a fee of $500 for each Board meeting attended plus reimbursement for travel and other meeting-related expenses.
20
| KEMPNER MULTI-CAP DEEP VALUE FUND |
| NOTES TO FINANCIAL STATEMENTS (Continued) |
PRINCIPAL HOLDERS OF FUND SHARES
As of May 31, 2022, the following shareholders owned of record 25% or more of the outstanding shares of each class of the Fund:
| NAME OF RECORD OWNERS | % Ownership | |
| Institutional Class | ||
| Muir & Company (for the benefit of its customers) | 98% | |
| Investor Class | ||
| Morgan Stanley Smith Barney, LLC (for the benefit of its customers) | 41% | |
| Muir & Company (for the benefit of its customers) | 32% |
A beneficial owner of 25% or more of the Fund’s outstanding shares may be considered a controlling person. That shareholder’s vote could have a more significant effect on matters presented at a shareholders’ meeting.
5. Contingencies and Commitments
The Fund indemnifies the Trust’s officers and Trustees for certain liabilities that might arise from their performance of their duties to the Fund. Additionally, in the normal course of business the Fund enters into contracts that contain a variety of representations and warranties and which provide general indemnifications. The Fund’s maximum exposure under these arrangements is unknown, as this would involve future claims that may be made against the Fund that have not yet occurred. However, based on experience, the Fund expects the risk of loss to be remote.
6. Subsequent Events
The Fund is required to recognize in the financial statements the effects of all subsequent events that provide additional evidence about conditions that existed as of the date of the Statement of Assets and Liabilities. For non-recognized subsequent events that must be disclosed to keep the financial statements from being misleading, the Fund is required to disclose the nature of the event as well as an estimate of its financial effect, or a statement that such an estimate cannot be made. Management has evaluated subsequent events through the issuance of these financial statements and has noted no such events except for the following:
The Fund paid the following distributions to shareholders subsequent to May 31, 2022:
| Per Share | ||||||||
| Record | Ordinary | |||||||
| Date | Ex-Date | Income | ||||||
| Institutional Class | 06/28/2022 | 06/29/2022 | $ | 0.0635 | ||||
| Investor Class | 06/28/2022 | 06/29/2022 | $ | 0.0565 | ||||
21
| KEMPNER MULTI-CAP DEEP VALUE FUND |
| REPORT OF INDEPENDENT REGISTERED |
| PUBLIC ACCOUNTING FIRM |
To the Board of Trustees of Ultimus Managers Trust
and the Shareholders of Kempner Multi-Cap Deep Value Fund
Opinion on the Financial Statements
We have audited the accompanying statement of assets and liabilities of Kempner Multi-Cap Deep Value Fund, a series of shares of beneficial interest in Ultimus Managers Trust (the “Fund”), including the schedule of investments, as of May 31, 2022, and the related statement of operations for the year then ended, the statements of changes in net assets for each of the years in the two-year period then ended and the financial highlights as presented in the table below, and the related notes (collectively referred to as the “financial statements”). In our opinion, the financial statements present fairly, in all material respects, the financial position of the Fund as of May 31, 2022, and the results of its operations for the year then ended, the changes in its net assets for each of the years in the two-year period then ended and its financial highlights as presented in the table below, in conformity with accounting principles generally accepted in the United States of America.
| Fund | Financial Highlights Presented |
| Kempner Multi-Cap Deep Value Fund | The financial highlights for each of the years in the two-year period ended May 31, 2022, the period from August 1, 2019 through May 31, 2020, and for each of the years in the three- year period ended July 31, 2019 |
Basis for Opinion
These financial statements are the responsibility of the Fund’s management. Our responsibility is to express an opinion on the Fund’s financial statements based on our audits. We are a public accounting firm registered with the Public Company Accounting Oversight Board (United States) (“PCAOB”) and are required to be independent with respect to the Fund in accordance with the U.S. federal securities law and the applicable rules and regulations of the Securities and Exchange Commission and the PCAOB.
We conducted our audits in accordance with the standards of the PCAOB. Those standards require that we plan and perform the audits to obtain reasonable assurance about whether the financial statements are free of material misstatement, whether due to error or fraud. The Fund is not required to have, nor were we engaged to perform, an audit of its internal control over financial reporting. As part of our audits we are required to obtain an understanding of internal control over financial reporting but not for the purpose of expressing an opinion on the effectiveness of the Fund’s internal control over financial reporting. Accordingly, we express no such opinion.
Our audits included performing procedures to assess the risk of material misstatement of the financial statements, whether due to error or fraud, and performing procedures that respond to those risks. Such procedures included examining, on a test basis, evidence regarding the amounts and disclosures in the financial statements. Our procedures included confirmation
22
| KEMPNER MULTI-CAP DEEP VALUE FUND |
| REPORT OF INDEPENDENT REGISTERED |
| PUBLIC ACCOUNTING FIRM (Continued) |
of securities owned as of May 31, 2022 by correspondence with the custodian. Our audits also included evaluating the accounting principles used and significant estimates made by management, as well as evaluating the overall presentation of the financial statements. We believe that our audits provide a reasonable basis for our opinion.
BBD, LLP
We have served as the auditor of one or more of the Funds in the Ultimus Managers Trust since 2013.
Philadelphia, Pennsylvania
July 20, 2022
23
| KEMPNER MULTI-CAP DEEP VALUE FUND |
| ABOUT YOUR FUND’S EXPENSES (Unaudited) |
We believe it is important for you to understand the impact of costs on your investment. As a shareholder of the Fund, you incur ongoing costs, including management fees, class-specific expenses (such as distribution fees) and other operating expenses. The following examples are intended to help you understand your ongoing costs (in dollars) of investing in the Fund and to compare these costs with the ongoing costs of investing in other mutual funds.
A mutual fund’s ongoing costs are expressed as a percentage of its average net assets. This figure is known as the expense ratio. The expenses in the table below are based on an investment of $1,000 made at the beginning of the most recent period (December 1, 2021) and held until the end of the period (May 31, 2022).
The table below illustrates the Fund’s ongoing costs in two ways:
Actual fund return – This section helps you to estimate the actual expenses that you paid over the period. The “Ending Account Value” shown is derived from the Fund’s actual return, and the fourth column shows the dollar amount of operating expenses that would have been paid by an investor who started with $1,000 in the Fund. You may use the information here, together with the amount you invested, to estimate the expenses that you paid over the period.
To do so, simply divide your account value by $1,000 (for example, an $8,600 account value divided by $1,000 = 8.6), then multiply the result by the number given for the Fund under the heading “Expenses Paid During Period.”
Hypothetical 5% return – This section is intended to help you compare the Fund’s ongoing costs with those of other mutual funds. It assumes that the Fund had an annual return of 5% before expenses during the period shown, but that the expense ratio is unchanged. In this case, because the return used is not the Fund’s actual return, the results do not apply to your investment. The example is useful in making comparisons because the U.S. Securities and Exchange Commission (the “SEC”) requires all mutual funds to calculate expenses based on a 5% return. You can assess the Fund’s ongoing costs by comparing this hypothetical example with the hypothetical examples that appear in shareholder reports of other funds.
Note that expenses shown in the table are meant to highlight and help you compare ongoing costs only. The Fund does not charge transaction fees, such as purchase or redemption fees, nor does it carry a “sales load.”
The calculations assume no shares were bought or sold during the period. Your actual costs may have been higher or lower, depending on the amount of your investment and the timing of any purchases or redemptions.
24
| KEMPNER MULTI-CAP DEEP VALUE FUND |
| ABOUT YOUR FUND’S EXPENSES (Unaudited) (Continued) |
More information about the Fund’s expenses can be found in this report. For additional information on operating expenses and other shareholder costs, please refer to the Fund’s prospectus.
| Beginning | Ending | Net | Expenses | |||||
| Account Value | Account Value | Expense | Paid During | |||||
| December 1, 2021 | May 31, 2022 | Ratio(a) | Period(b) | |||||
| Institutional Class | ||||||||
| Base on Actual Fund Return | $1,000.00 | $1,028.70 | 0.95% | $4.80 | ||||
| Based on Hypothetical 5% Return (before expenses) | $1,000.00 | $1,020.19 | 0.95% | $4.78 | ||||
| Investor Class | ||||||||
| Base on Actual Fund Return | $1,000.00 | $1,028.30 | 1.20% | $6.07 | ||||
| Based on Hypothetical 5% Return (before expenses) | $1,000.00 | $1,018.95 | 1.20% | $6.04 |
| (a) | Annualized, based on the Class’s most recent one-half year expenses. |
| (b) | Expenses are equal to the Class’s annualized net expense ratio multiplied by the average account value over the period, multiplied by 182/365 (to reflect the one-half year period). |
25
| KEMPNER MULTI-CAP DEEP VALUE FUND |
| OTHER INFORMATION (Unaudited) |
A description of the policies and procedures that the Fund uses to vote proxies relating to portfolio securities is available without charge upon request by calling toll- free 1-800-665-9778, or on the SEC’s website at www.sec.gov. Information regarding how the Fund voted proxies relating to portfolio securities during the most recent 12-month period ended June 30 is available without charge upon request by calling toll-free 1-800-665-9778, or on the SEC’s website at www.sec.gov.
The Trust files a complete listing of portfolio holdings for the Fund with the SEC as of the end of the first and third quarters of each fiscal year as an exhibit to its reports on Form N-PORT. These filings are available upon request by calling 1-800-665-9778. Furthermore, you may obtain a copy of the filings on the SEC’s website at www.sec.gov.
| FEDERAL TAX INFORMATION (Unaudited) |
For the year ended May 31, 2022, the Fund designated $3,987,141 as long-term capital gain distribution.
Qualified Dividend Income – The Fund designates 71.48% of its ordinary income dividends, or up to the maximum amount of such dividends allowable pursuant to the Internal Revenue Code, as qualified dividend income eligible for the reduced tax rate.
Dividends Received Deduction – Corporate shareholders are generally entitled to take the dividends received deduction on the portion of a Fund’s dividend distribution that qualifies under tax law. For the year ended May 31, 2022, 61.05% of ordinary income dividends qualifies for the corporate dividends received deduction.
26
| KEMPNER MULTI-CAP DEEP VALUE FUND |
| BOARD OF TRUSTEES AND EXECUTIVE OFFICERS (Unaudited) |
The Board has overall responsibility for management of the Trust’s affairs. The Trustees serve during the lifetime of the Trust and until its termination, or until death, resignation, retirement, or removal. The Trustees, in turn, elect the officers of the Fund to actively supervise their day-to-day operations. The officers have been elected for an annual term. Each Trustee’s and officer’s address is 225 Pictoria Drive, Suite 450, Cincinnati, Ohio 45246. The following are the Trustees and executive officers of the Fund:
| Name and Year of Birth | Length of Time Served | Position(s) Held with Trust | Principal Occupation(s) During Past 5 Years | Number in Trust | Directorships of Public Companies Held by Trustee During Past 5 Years |
| Interested Trustees: | |||||
| David R. Carson* Year of Birth: 1958 | Trustee Since 2021
Officer Since 2013 | Trustee and (2021 to present)
Vice President (2021 to present; and previously April 2013 to October 2013)
President and Principal Executive Officer of each of its series (2013-2021) | Vice President and Director of Client Strategies of Ultimus Fund Solutions, LLC (2013 to present); President of Unified Series Trust (2017 to present). | 26 | Interested Trustee of 21 series of the Unified Series Trust (a registered management company) (2020 to present). |
| Independent Trustees: | |||||
| Janine L. Cohen Year of Birth: 1952 | Since 2016 | Chairperson (2019 to present)
Trustee (2016 to present) | Retired since 2013; previously Chief Financial Officer from 2004 to 2013 and Chief Compliance Officer from 2008 to 2013 at AER Advisors, Inc. | 26 | None |
27
| KEMPNER MULTI-CAP DEEP VALUE FUND |
| BOARD OF TRUSTEES AND EXECUTIVE OFFICERS (Unaudited) (Continued) |
| Name and Year of Birth | Length of Time Served | Position(s) Held with Trust | Principal Occupation(s) During Past 5 Years | Number of Funds in Trust Overseen by Trustee | Directorships of Public Companies Held by Trustee During Past 5 Years |
| Independent Trustees (Continued) | |||||
| David M. Deptula Year of Birth: 1958 | Since 2012 | Trustee | Vice President of Legal and Special Projects at Dayton Freight Lines, Inc. since February 2016. | 26 | None |
| Jacqueline A. Williams Year of Birth: 1954 | Since 2019 | Trustee | Managing Member of Custom Strategy Consulting, LLC (2017 to present); Managing Director of Global Investment Research (2005 to 2017), Cambridge Associates, LLC. | 26 | None |
| Clifford N. Schireson Year of Birth: 1953 | Since 2019 | Trustee | Retired; Founder of Schireson Consulting, LLC (2017 to 2022); Director of Institutional Services for Brandes Investment Partners, LP (2004-2017). | 26 | Trustee of the San Diego City Employees’ Retirement System (2019 to present) |
| Robert E. Morrison Year of Birth: 1957 | Since 2019 | Trustee | Managing Director, Midwest Trust and FCI Advisors (2022 to present); Senior Vice President and National Practice Lead for Investment, Huntington National Bank/ Huntington Private Bank (2014 to 2022); CEO, CIO, President of 5 Star Investment Management Company (2006 to 2014). | 26 | None |
| * | Mr. Carson is considered an “interested person” of the Trust within the meaning of Section 2(a)(19) of the 1940 Act because of his relationship with the Trust’s administrator, transfer agent, and distributor. Mr. Carson was President of the Trust from October 2013 to January 2021 and Vice President of the Trust from April 2013 to October 2013. |
28
| KEMPNER MULTI-CAP DEEP VALUE FUND |
| BOARD OF TRUSTEES AND EXECUTIVE OFFICERS (Unaudited) (Continued) |
| Name and Year of Birth | Length of Time Served | Position(s) Held with Trust | Principal Occupation(s) During Past 5 Years |
| Executive Officers: | |||
| Todd E. Heim Year of Birth: 1967 | Since 2014 | President (2021 to present)
Vice President (2014-2021) | Vice President, Relationship Management (2018 to present) and Assistant Vice President, Client Implementation Manager of Ultimus Fund Solutions, LLC (2014 to 2018); Naval Flight Officer in United States Navy (1989 to 2017). |
| Jennifer L. Leamer Year of Birth: 1976 | Since 2014 | Treasurer (2014 to present)
Assistant Treasurer (April 2014 to October 2014) | Senior Vice President, Fund Accounting of Ultimus Fund Solutions, LLC (2014 to present). |
| Daniel D. Bauer Year of Birth: 1977 | Since 2016 | Assistant Treasurer (2016 to present) | Vice President, Fund Accounting (2022 to present) and Assistant Vice President, Fund Accounting of Ultimus Fund Solutions, LLC (2015 to 2022). |
| Angela A. Simmons Year of Birth: 1975 | Since 2022 | Assistant Treasurer (2022 to present) | Vice President, Financial Administration (2022 to present) and Assistant Vice President, Financial Administration (2015 to 2022) of Ultimus Fund Solutions, LLC. |
| Khimmara Greer Year of Birth: 1983 | Since 2021 | Secretary (2021 to present) | Vice President and Senior Legal Counsel of Ultimus Fund Solutions, LLC (2021 to present); Vice President, Asset Servicing – Regulatory Administration of The Bank of New York Mellon (2019 to 2021); Vice President and Counsel of State Street Bank and Trust Company (2015 to 2019). |
| David K. James Year of Birth: 1970 | Since 2021 | Assistant Secretary (2021 to present)
Secretary (2021 to 2021) | Executive Vice President and Chief Legal and Risk Officer of Ultimus Fund Solutions, LLC (2018 to present); Managing Director and Managing Counsel of State Street Bank and Trust Company (2009 to 2018). |
| Natalie S. Anderson Year of Birth: 1975 | Since 2016 | Assistant Secretary (2016 to present) | Legal Administration Manager (July 2016 to present) and Paralegal (January 2015 to June 2016) of Ultimus Fund Solutions, LLC. |
| Gweneth Gosselink Year of Birth: 1955 | Since 2020 | Chief Compliance Officer (2020 to present) | Assistant Vice President, Senior Compliance Officer of Ultimus Fund Solutions, LLC (December 2019 to present); CCO Consultant at GKG Consulting, LLC (December 2019 to present); Chief Operating Officer & CCO at Miles Capital, Inc. (June 2013 to December 2019). |
29
| KEMPNER MULTI-CAP DEEP VALUE FUND |
| BOARD OF TRUSTEES AND EXECUTIVE OFFICERS (Unaudited) (Continued) |
| Name and Year of Birth | Length of Time | Position(s) Held with Trust | Principal Occupation(s) During Past 5 Years |
| Executive Officers (Continued): | |||
| Martin Dean Year of Birth: 1963 | Since 2016 | Assistant Chief Compliance Officer (2020 to present)
Interim Chief Compliance Officer (October 2019 to January 2020)
Assistant Chief Compliance Officer (2016 to 2017) | Senior Vice President, Head of Fund Compliance (February 2020 to present); Vice President & Director of Fund Compliance of Ultimus Fund Solutions, LLC (January 2016 to January 2020). |
Additional information about members of the Board and executive officers is available in the Fund’s Statement of Additional Information (“SAI”). To obtain a free copy of the SAI, please call toll-free 1-800-665-9778.
30
This page intentionally left blank.
This page intentionally left blank.
This page intentionally left blank.
KEMPNER-AR-22
| WAVELENGTH INTEREST RATE NEUTRAL FUND | |
| LETTER TO SHAREHOLDERS (Unaudited) | July 2022 |
Dear Fellow Shareholders:
Since our last annual letter, the landscape for economic activity shifted meaningfully, creating challenges for central bank policies and frictions in markets across the globe. The spending boom coming out of the pandemic drove increased demand directly into supply constraints that were exacerbated by lockdowns in China and the war in Ukraine. The inflationary backdrop complicated an already precarious dynamic for central banks and created uncertainty around the trajectory of economies. In this environment, we sought to manage oncoming risks actively by adapting to the new economic paradigm while maintaining our core investment principles through heightened levels of market stress.
What follows is designed to provide a context for our returns that fosters a deeper understanding of the investment process that supports them. By doing so we hope to build on the partnership your investment creates.
PERFORMANCE SUMMARY
For the twelve months ended May 31, 2021, the Wavelength Interest Rate Neutral Fund (the “Fund”) delivered a return of -6.53% versus a benchmark return of +0.13% for the S&P U.S. Treasury Bill 0-3 Month Index (which seeks to represent the return from not taking risk in financial markets). While these results were negative, they remained within targeted risk parameters as markets came under stress and the Fund maintained its balance to economic conditions in line with investment objectives.
WAVELENGTH PHILOSOPHY
We believe that macroeconomic conditions drive asset prices and central banks use interest rates to manage macroeconomic conditions. Based on this fundamental logic, we seek to build a portfolio that is hedged to changes in interest rates by balancing investment exposure between instruments we expect to outperform in rising and falling macroeconomic conditions.
INVESTMENT ENVIRONMENT
As an extension of our investment philosophy, we believe that changing expectations for growth and inflation drive investment decisions, which in turn drive market prices. Since our last letter, a confluence of pandemic-driven imbalances came to a head and put sustained upward pressure on prices. Recognition that these forces were not transitory in nature drove a widescale policy pivot for central banks across the globe.
The period began with a meaningful uptick in inflation and growth figures that failed to meet high expectations due to issues across supply chains and trepidation around the rise of COVID’s delta variant. This situation reflected an economy in transition and moving quickly where strategies that rely on making specific forecasts were challenged.
The second quarter of 2021 came to a close with increasing concerns over rising prices as evidenced by the US Consumer Price Index which showed substantial increases, though not on a uniform basis. The Fed continued to explain these pressures away as transitory due
1
to their weighting toward sectors most sensitive to reopening. Enthusiasm around the US economy also overshadowed concerns over COVID variants elsewhere, and corporate assets benefited from this dynamic despite stretched valuations.
Economies across the globe then prepared for a summer takeoff despite meaningful risks emerging on the horizon. Breakthrough infections, vaccine hesitancy, and new variants came into view, extending the public health crisis and complicating the ongoing rebound in growth. At the same time, labor shortages and inflation pressures continued to impede the recalibration of supply and demand. With this, central banks endeavored to manage the uneven economic liftoff by setting the groundwork for an eventual tapering as new frictions emerged through the policies they enacted. These long-term structural pressures combined with persistent headwinds from the ongoing pandemic to create an uncertain forward path for both growth and inflation.
Heading into the fall, economies experienced an acceleration of both growth and inflation as reopening dynamics led to increased spending. This occurred as concerns over COVID’s delta variant gave way to the new omicron variant. The third quarter came to a close with central banks facing challenges to their policies designed to suppress interest rates. With the impact of rising debt service costs complicating their ability to manage growth and inflation, it became clear that the coordination of fiscal and monetary policy would become critically important as economies emerged from the pandemic.
Entering the fourth quarter, the prospect for policy tightening began disrupting markets and shifted the forward path of interest rates toward a tighter monetary stance. While some supply-demand imbalances were set to improve, the outlook for other, stickier components of inflation looked more persistent, which brought about changing expectations and increased levels of volatility in markets.
Winter brought further trepidation around COVID’s omicron variant, which was followed by a rebound in activity as data was released indicating lower levels of severity. Amidst persistently high inflation, geopolitical tensions continued to increase as the Russia-Ukraine conflict gathered momentum, culminating with the most significant military invasion on the European continent in decades.
Spring continued this theme, and the destructive impact of the military campaign spread beyond the battlefield in conjunction with corresponding sanctions from the West. In addition to its tragic human costs, the war in Ukraine exacerbated economic frictions that were already in place, particularly through inflation where supply chains from energy to agricultural products have been disrupted. The situation increased pressure on central banks across the globe and led to fears of policy errors that drove investors out of markets into cash. These dynamics led to selling pressure across many financial assets which persisted over the period.
Following the Federal Reserve increasing its target for the Federal Funds Rate in March, market prices continued to adjust over the month of April as the expected path for monetary policy grew steeper. Higher yields along the US Treasury curve reverberated across other assets, and the ongoing war in Ukraine combined with lockdowns in China to add to levels of fear in markets. In this environment, the risk of stagflationary dynamics became more pronounced, particularly for European countries where economic linkages to Russia are more direct.
2
The period came to a close with increasing investor concerns over the potential for monetary policy to drive the economy into a recession. While inflation data remained elevated, apprehension around growth took center stage in markets and the year-to-date rise in US Treasury yields began to lose momentum. With this dynamic in place, corporate assets suffered and began to reflect instability in the business environment despite unemployment near cyclical lows.
PERFORMANCE DISCUSSION
The Fund faced increasingly volatile conditions over the past year and ultimately suffered losses as financial assets across the globe came under meaningful pressure. In this context, mixed results were experienced across the fund’s holdings, including futures contracts, and this ultimately led to negative performance in a challenging environment. Persistently elevated levels of inflation were eventually met by fear over policy errors and their potential impact on growth. Risk management processes proved increasingly critical, particularly in the context of accounting for the potential for stagflation which increased meaningfully.
The period began with consistent positive returns for the portfolio throughout the summer months. Amidst a bumpy economic reopening, early profits came from both corporate assets, such as convertible and emerging market bonds, as well as US Treasuries as the yield curve exhibited a bull flattening dynamic. Inflation-linked bonds also contributed to outperformance as early signs of price pressures to come manifested themselves in returns.
Heading into the fall, portfolio results grew more volatile, with negative returns in September followed by positive results in October only to dip back negative once again in November. Emerging market debt positions suffered from fear of contagion as Chinese property giant Evergrande missed debt payments, and continued bottlenecks across supply chains added to inflationary pressures. In this context, profits during the period were driven by inflation-linked bonds and US Treasury exposures also contributed positively as fear over COVID’s omicron variant bid up the prices of safe haven assets.
The portfolio had a strong close to the year, with profits driven by emerging market debt, bank loans, high yield credit, and inflation-linked bonds. This was followed by negative results in January and February, as selling pressure from expectations for tighter policy conditions was exacerbated by uncertainty around Russia’s invasion of Ukraine and the potential geopolitical fallout. A widescale selling of assets continued through March as the impact of Russia’s military campaign spread and corresponding sanctions put downward pressure on emerging market debt and upward pressure on already tight commodity markets.
In April, global bond markets suffered their strongest headwinds in decades. The expected path for interest rates in the US and elsewhere steepened meaningfully with the recognition by the Fed and other central banks that inflation was more than transitory. In this context, risk was reduced across the portfolio while seeking to manage downside exposure. In May, the portfolio adapted further to the rising risk of stagflationary conditions, benefitting most from positions in short-term TIPS which provided the most direct link to this dynamic. Through extensive bouts of selling pressure, the portfolio maintained its core balance to economic environments, with particular attention to stagflation risk from geopolitical tensions and central bank policies that continued to drive market sentiment as the period came to a close.
3
OUTLOOK
Financial assets across the spectrum were disrupted over the past year as the path for monetary policy collided with forces at play outside of any central bank mandate. Geopolitical tensions and supply chain disruptions exacerbated pressures on already fragile economies as they emerged from the pandemic, and as a result, the rising risk of policy errors became increasingly reflected in market pricing.
While these dynamics have proven painful over the short-term, they have in turn created dislocations within and between markets that we believe expand the opportunity set over the long-term for systematic investing. In this context, we are positioned to actively monetize a meaningfully wide set of opportunities across fixed income while maintaining a balance to potential economic outcomes with a particular focus on the growing risk of stagflation as we enter a new paradigm for the economy.
Thank you for your trust and commitment through investment.
Sincerely,

Andrew Dassori
Founding Partner & Chief Investment Officer
Wavelength Capital Management
Past performance is not predictive of future performance. Investment results and principal value will fluctuate so that shares, when redeemed, may be worth more or less than their original cost. Current performance may be higher or lower than the performance data quoted. Performance data current to the most recent month end are available by calling 1-866-896-9292.
An investor should consider the investment objectives, risks, charges and expenses of the Fund carefully before investing. The Fund’s prospectus contains this and other important information. To obtain a copy of the Fund’s prospectus please visit our website at www.wavelengthfunds.com or call 1-866-896-9292 and a copy will be sent to you free of charge. Please read the prospectus carefully before you invest. The Wavelength Interest Rate Neutral Fund is distributed by Ultimus Fund Distributors, LLC.
The Letter to Shareholders seeks to describe some of the Adviser’s current opinions and views of the financial markets. Although the Adviser believes it has a reasonable basis for any opinions or views expressed, actual results may differ, sometimes significantly so, from those expected or expressed. The securities held by the Fund that are discussed in the Letter to Shareholders were held during the period covered by this Report. They do not comprise the entire investment portfolio of the Fund, may be sold at any time and may no longer be held by the Fund. For a complete list of securities held by the Fund as of May 31, 2022, please see the Schedule of Investments section of the Annual Report. The opinions of the Adviser with respect to those securities may change at any time.
4
Statements in the Letter to Shareholders that reflect projections or expectations for future financial or economic performance of the Fund and the market in general and statements of the Fund’s plans and objectives for future operations are forward-looking statements. No assurance can be given that actual results or events will not differ materially from those projected, estimated, assumed, or anticipated in any such forward-looking statements. Important factors that could result in such differences, in addition to factors noted with such forward-looking statements include, without limitation, general economic conditions, such as inflation, recession, and interest rates. Past performance is not a guarantee of future results.
5
WAVELENGTH INTEREST RATE NEUTRAL FUND
PERFORMANCE INFORMATION
May 31, 2022 (Unaudited)
Comparison of the Change in Value of a $10,000 Investment in
Wavelength Interest Rate Neutral Fund versus the
S&P U.S. Treasury Bill 0-3 Month Index
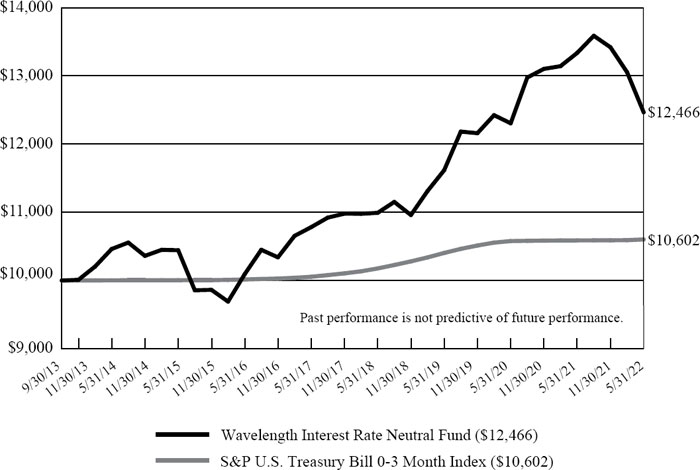
Average Annual Total Returns For Periods Ended May 31, 2022 | ||||||||
| Since | ||||||||
| 1 Year | 3 Years | 5 Years | Inception(b) | |||||
| Wavelength Interest Rate Neutral Fund(a) | (6.53%) | 2.38% | 2.95% | 2.58% | ||||
| S&P U.S. Treasury Bill 0-3 Month Index | 0.13% | 0.63% | 1.07% | 0.68% | ||||
| (a) | The Fund’s total return does not reflect the deduction of taxes a shareholder would pay on Fund distributions or the redemption of Fund shares. |
| (b) | The Fund commenced operations on September 30, 2013. |
6
WAVELENGTH INTEREST RATE NEUTRAL FUND
PORTFOLIO INFORMATION
May 31, 2022 (Unaudited)
Portfolio Allocation (% of Net Assets)
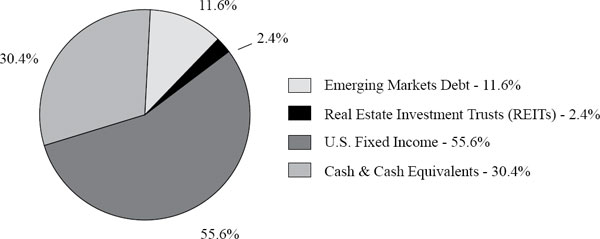
| Top 10 Equity Holdings | ||||||
| % of Net | ||||||
| Security Description | Assets | |||||
| iShares TIPS Bond ETF | 13.0 | % | ||||
| Invesco Senior Loan ETF | 10.7 | % | ||||
| Vanguard Short-Term Inflation-Protected Securities ETF | 7.5 | % | ||||
| iShares National Muni Bond ETF | 6.9 | % | ||||
| Vanguard Emerging Markets Government Bond ETF | 5.2 | % | ||||
| Vanguard Mortgage-Backed Securities ETF | 5.2 | % | ||||
| SPDR Bloomberg Short Term High Yield Bond ETF | 4.9 | % | ||||
| SPDR Bloomberg Convertible Securities ETF | 3.5 | % | ||||
| VanEck Vectors Emerging Markets High Yield Bond ETF | 3.4 | % | ||||
| iShares J.P. Morgan USD Emerging Markets Bond ETF | 3.0 | % | ||||
7
| WAVELENGTH INTEREST RATE NEUTRAL FUND |
| SCHEDULE OF INVESTMENTS |
| May 31, 2022 |
| EXCHANGE-TRADED FUNDS — 69.6% | Shares | Value | ||||||
| Emerging Markets Debt — 11.6% | ||||||||
| iShares J.P. Morgan USD Emerging Markets Bond ETF (a) | 52,500 | $ | 4,790,625 | |||||
| VanEck Emerging Markets High Yield Bond ETF (a) | 287,000 | 5,455,870 | ||||||
| Vanguard Emerging Markets Government Bond ETF | 128,056 | 8,388,948 | ||||||
| 18,635,443 | ||||||||
| Real Estate Investment Trusts (REITs) — 2.4% | ||||||||
| Vanguard Real Estate ETF (a) | 38,000 | 3,764,660 | ||||||
| U.S. Fixed Income — 55.6% | ||||||||
| Invesco Senior Loan ETF (a) | 811,000 | 17,087,770 | ||||||
| iShares iBoxx $High Yield Corporate Bond ETF (a) | 41,900 | 3,331,050 | ||||||
| iShares National Muni Bond ETF | 102,000 | 11,026,200 | ||||||
| iShares TIPS Bond ETF (a) | 174,300 | 20,731,242 | ||||||
| SPDR Bloomberg Convertible Securities ETF (a) | 82,600 | 5,677,098 | ||||||
| SPDR Bloomberg High Yield Bond ETF (a) | 28,634 | 2,823,885 | ||||||
| SPDR Bloomberg Short Term High Yield Bond ETF (a) | 309,000 | 7,916,580 | ||||||
| Vanguard Mortgage-Backed Securities ETF | 172,000 | 8,359,200 | ||||||
| Vanguard Short-Term Inflation-Protected Securities ETF (a) | 235,000 | 11,970,900 | ||||||
| 88,923,925 | ||||||||
| Total Exchange-Traded Funds (Cost $119,136,552) | $ | 111,324,028 | ||||||
8
| WAVELENGTH INTEREST RATE NEUTRAL FUND |
| SCHEDULE OF INVESTMENTS (Continued) |
| MONEY MARKET FUNDS — 17.7% | Shares | Value | ||||||
| Fidelity Institutional Money Market Government Portfolio - Class I, 0.60% (b) | 14,181,972 | $ | 14,181,972 | |||||
| Invesco Short-Term Investments Trust - Institutional Class, 0.55% (b) | 14,181,972 | 14,181,972 | ||||||
| Total Money Market Funds (Cost $28,363,944) | $ | 28,363,944 | ||||||
| COLLATERAL FOR SECURITIES LOANED — 27.5% | Value | Value | ||||||
| Mount Vernon Liquid Assets Portfolio, LLC, 0.92% (Cost $44,019,094) (b)(c) | 44,019,094 | $ | 44,019,094 | |||||
| Investments at Value — 114.8% (Cost $191,519,590) | $ | 183,707,066 | ||||||
| Liabilities in Excess of Other Assets — (14.8%) | (23,721,854 | ) | ||||||
| Net Assets — 100.0% | $ | 159,985,212 | ||||||
| (a) | All or a portion of the security is on loan. The total value of the securities on loan as of May 31, 2022 was $42,656,342 (Note 6). |
| (b) | The rate shown is the 7-day effective yield as of May 31, 2022. |
| (c) | This security was purchased with cash collateral held from securities on loan (Note 6). |
See accompanying notes to financial statements.
9
| WAVELENGTH INTEREST RATE NEUTRAL FUND |
| SCHEDULE OF FUTURES CONTRACTS |
| May 31, 2022 |
| Expiration | Notional | Value/Unrealized | ||||||||||||||
| FUTURES CONTRACTS | Contracts | Date | Value | Depreciation | ||||||||||||
| Commodities Futures | ||||||||||||||||
| E-Mini Gold Future | 41 | 7/27/2022 | $ | 3,789,220 | $ | (43,671 | ) | |||||||||
| Index Futures | ||||||||||||||||
| E-Mini Dow CBOT DJIA Future | 14 | 6/17/2022 | 2,307,970 | (46,405 | ) | |||||||||||
| E-Mini NASDAQ 100 Future | 6 | 6/17/2022 | 1,517,580 | (45,643 | ) | |||||||||||
| E-Mini S&P 500 Future | 10 | 6/17/2022 | 2,065,625 | (31,922 | ) | |||||||||||
| Total Index Futures | 5,891,175 | (123,970 | ) | |||||||||||||
| Treasury Futures | ||||||||||||||||
| 10-Year U.S. Treasury Note Future | 58 | 9/21/2022 | 6,928,274 | (37,648 | ) | |||||||||||
| 5-Year U.S. Treasury Note Future | 90 | 9/30/2022 | 10,165,770 | (49,508 | ) | |||||||||||
| U.S. Treasury Long Bond Future | 15 | 9/21/2022 | 2,091,570 | (22,205 | ) | |||||||||||
| Total Treasury Futures | 19,185,614 | (109,361 | ) | |||||||||||||
| Total Futures Contracts | $ | 28,866,009 | $ | (277,002 | ) | |||||||||||
The average monthly notional value of futures contracts during the year ended May 31, 2022 was $49,086,282.
See accompanying notes to financial statements.
10
| WAVELENGTH INTEREST RATE NEUTRAL FUND |
| STATEMENT OF ASSETS AND LIABILITIES |
| May 31, 2022 |
| ASSETS | ||||
| Investments in securities: | ||||
| At cost | $ | 191,519,590 | ||
| At value* (Note 2) | $ | 183,707,066 | ||
| Cash (Note 2) | 18,573,890 | |||
| Margin deposits for futures contracts (Note 2) | 1,775,645 | |||
| Receivable for capital shares sold | 179,297 | |||
| Receivable for investment securities sold | 78,794 | |||
| Dividends and interest receivable | 97,434 | |||
| Other assets | 18,233 | |||
| Total assets | 204,430,359 | |||
| LIABILITIES | ||||
| Variation margin payable (Notes 2 and 5) | 143,301 | |||
| Payable for return of collateral received for securities on loan (Note 6) | 44,019,094 | |||
| Payable for capital shares redeemed | 114,427 | |||
| Payable for investment securities purchased | 25,456 | |||
| Payable to Adviser (Note 4) | 106,726 | |||
| Payable to administrator (Note 4) | 23,690 | |||
| Other accrued expenses | 12,453 | |||
| Total liabilities | 44,445,147 | |||
| NET ASSETS | $ | 159,985,212 | ||
| NET ASSETS CONSIST OF: | ||||
| Paid-in capital | $ | 173,338,589 | ||
| Accumulated deficit | (13,353,377 | ) | ||
| NET ASSETS | $ | 159,985,212 | ||
| Shares of beneficial interest outstanding (unlimited number of shares authorized, no par value) | 16,035,814 | |||
| Net asset value, offering price and redemption price per share (Note 2) | $ | 9.98 | ||
| * Includes value of securities on loan (Note 6) | $ | 42,656,342 | ||
See accompanying notes to financial statements.
11
| WAVELENGTH INTEREST RATE NEUTRAL FUND |
| STATEMENT OF OPERATIONS |
| For the Year Ended May 31, 2022 |
| INVESTMENT INCOME | ||||
| Dividends | $ | 4,450,220 | ||
| Securities lending income (Note 6) | 518,584 | |||
| Total investment income | 4,968,804 | |||
| EXPENSES | ||||
| Investment advisory fees (Note 4) | 1,739,963 | |||
| Administration fees (Note 4) | 183,426 | |||
| Fund accounting fees (Note 4) | 49,212 | |||
| Registration and filing fees | 45,976 | |||
| Legal fees | 32,768 | |||
| Transfer agent fees (Note 4) | 28,907 | |||
| Postage and supplies | 25,123 | |||
| Networking fees | 24,491 | |||
| Compliance fees (Note 4) | 20,347 | |||
| Custody and bank service fees | 19,715 | |||
| Trustees’ fees and expenses (Note 4) | 17,817 | |||
| Audit and tax services fees | 17,560 | |||
| Insurance expense | 4,726 | |||
| Other expenses | 18,380 | |||
| Total expenses | 2,228,411 | |||
| Less fee reductions by the Adviser (Note 4) | (415,183 | ) | ||
| Net expenses | 1,813,228 | |||
| NET INVESTMENT INCOME | 3,155,576 | |||
| REALIZED AND UNREALIZED GAINS (LOSSES) ON INVESTMENTS AND FUTURES CONTRACTS | ||||
| Net realized gains (losses) from: | ||||
| Investments | (332,027 | ) | ||
| Futures contracts (Note 5) | (2,843,020 | ) | ||
| Long-term capital gain distributions from regulated investment companies | 10,873 | |||
| Net change in unrealized appreciation (depreciation) on: | ||||
| Investments | (13,259,966 | ) | ||
| Futures contracts (Note 5) | (555,090 | ) | ||
| NET REALIZED AND UNREALIZED LOSSES ON INVESTMENTS AND FUTURES CONTRACTS | (16,979,230 | ) | ||
| NET DECREASE IN NET ASSETS RESULTING FROM OPERATIONS | $ | (13,823,654 | ) | |
See accompanying notes to financial statements.
12
| WAVELENGTH INTEREST RATE NEUTRAL FUND |
| STATEMENTS OF CHANGES IN NET ASSETS |
| Year | Year | |||||||
| Ended | Ended | |||||||
| May 31, | May 31, | |||||||
| 2022 | 2021 | |||||||
| FROM OPERATIONS | ||||||||
| Net investment income | $ | 3,155,576 | $ | 1,247,639 | ||||
| Net realized gains (losses) from: | ||||||||
| Investments | (332,027 | ) | 1,548,518 | |||||
| Futures contracts (Note 5) | (2,843,020 | ) | 2,092,167 | |||||
| Long-term capital gain distributions from regulated investment companies | 10,873 | — | ||||||
| Net change in unrealized appreciation (depreciation) on: | ||||||||
| Investments | (13,259,966 | ) | 3,628,529 | |||||
| Futures contracts (Note 5) | (555,090 | ) | (63,386 | ) | ||||
| Net increase (decrease) in net assets resulting from operations | (13,823,654 | ) | 8,453,467 | |||||
| DISTRIBUTIONS TO SHAREHOLDERS (Note 2) | (5,539,959 | ) | (2,499,049 | ) | ||||
| CAPITAL SHARE TRANSACTIONS | ||||||||
| Proceeds from shares sold | 102,973,904 | 102,097,480 | ||||||
| Net asset value of shares issued in reinvestment of distributions to shareholders | 4,160,165 | 1,871,694 | ||||||
| Payments for shares redeemed | (83,647,047 | ) | (35,834,717 | ) | ||||
| Net increase in net assets from capital share transactions | 23,487,022 | 68,134,457 | ||||||
| TOTAL INCREASE IN NET ASSETS | 4,123,409 | 74,088,875 | ||||||
| NET ASSETS | ||||||||
| Beginning of year | 155,861,803 | 81,772,928 | ||||||
| End of year | $ | 159,985,212 | $ | 155,861,803 | ||||
| CAPITAL SHARE ACTIVITY | ||||||||
| Shares sold | 9,528,065 | 9,408,498 | ||||||
| Shares issued in reinvestment of distributions to | ||||||||
| shareholders | 383,239 | 171,595 | ||||||
| Shares redeemed | (8,058,384 | ) | (3,295,214 | ) | ||||
| Net increase in shares outstanding | 1,852,920 | 6,284,879 | ||||||
| Shares outstanding at beginning of year | 14,182,894 | 7,898,015 | ||||||
| Shares outstanding at end of year | 16,035,814 | 14,182,894 | ||||||
See accompanying notes to financial statements.
13
| WAVELENGTH INTEREST RATE NEUTRAL FUND |
| FINANCIAL HIGHLIGHTS |
| Per Share Data for a Share Outstanding Throughout Each Year | ||||||||||||||||||||
| Year | Year | Year | Year | Year | ||||||||||||||||
| Ended | Ended | Ended | Ended | Ended | ||||||||||||||||
| May 31, | May 31, | May 31, | May 31, | May 31, | ||||||||||||||||
| 2022 | 2021 | 2020 | 2019 | 2018 | ||||||||||||||||
| Net asset value at beginning of year | $ | 10.99 | $ | 10.35 | $ | 10.26 | $ | 9.97 | $ | 9.99 | ||||||||||
| Income (loss) from investment operations: | ||||||||||||||||||||
| Net investment income (a) | 0.19 | 0.11 | 0.22 | 0.27 | 0.22 | |||||||||||||||
| Net realized and unrealized gains (losses) on investments and futures contracts | (0.88 | ) | 0.75 | 0.38 | 0.28 | (0.03 | ) | |||||||||||||
| Total from investment operations | (0.69 | ) | 0.86 | 0.60 | 0.55 | 0.19 | ||||||||||||||
| Less distributions from: | ||||||||||||||||||||
| Net investment income | (0.16 | ) | (0.10 | ) | (0.23 | ) | (0.26 | ) | (0.21 | ) | ||||||||||
| Net realized gains | (0.16 | ) | (0.12 | ) | (0.28 | ) | — | — | ||||||||||||
| Total distributions | (0.32 | ) | (0.22 | ) | (0.51 | ) | (0.26 | ) | (0.21 | ) | ||||||||||
| Net asset value at end of year | $ | 9.98 | $ | 10.99 | $ | 10.35 | $ | 10.26 | $ | 9.97 | ||||||||||
| Total return (b) | (6.53 | %) | 8.39 | % | 5.92 | % | 5.68 | % | 1.95 | % | ||||||||||
| Net assets at end of year (000’s) | $ | 159,985 | $ | 155,862 | $ | 81,773 | $ | 53,268 | $ | 48,434 | ||||||||||
| Ratios/supplementary data: | ||||||||||||||||||||
| Ratio of total expenses to average net assets (c) | 1.22 | % | 1.25 | % | 1.34 | % | 1.41 | % | 1.55 | % | ||||||||||
| Ratio of net expenses to average net assets (c)(d) | 0.99 | % | 0.99 | % | 0.99 | % | 0.99 | % | 0.99 | % | ||||||||||
| Ratio of net investment income to average net assets (a)(c)(d) | 1.72 | % | 1.02 | % | 2.07 | % | 2.65 | % | 2.17 | % | ||||||||||
| Portfolio turnover rate | 18 | % | 12 | % | 52 | % | 20 | % | 9 | % | ||||||||||
| (a) | Recognition of net investment income by the Fund is affected by the timing of the declarations of dividends by the underlying investment companies in which the Fund invests. |
| (b) | Total return is a measure of the change in value of an investment in the Fund over the periods covered. The returns shown do not reflect the deduction of taxes a shareholder would pay on Fund distributions, if any, or the redemption of Fund shares. The total returns would be lower if the Adviser had not reduced advisory fees and/or reimbursed expenses. |
| (c) | The ratios of expenses and net investment income to average net assets do not reflect the Fund’s proportionate share of expenses of the underlying investment companies in which the Fund invests. |
| (d) | Ratio was determined after advisory fee reductions and/or expense reimbursements (Note 4). |
See accompanying notes to financial statements.
14
| WAVELENGTH INTEREST RATE NEUTRAL FUND |
| NOTES TO FINANCIAL STATEMENTS |
| May 31, 2022 |
1. Organization
Wavelength Interest Rate Neutral Fund (the “Fund”) is a diversified series of Ultimus Managers Trust (the “Trust”), an open-end investment company established as an Ohio business trust under a Declaration of Trust dated February 28, 2012. Other series of the Trust are not incorporated in this report.
The investment objective of the Fund is to seek total return.
2. Significant Accounting Policies
The Fund follows accounting and reporting guidance under Financial Accounting Standards Board Accounting Standards Codification Topic 946, “Financial Services – Investment Companies.” The following is a summary of the Fund’s significant accounting policies used in the preparation of its financial statements. These policies are in conformity with accounting principles generally accepted in the United States of America (“GAAP”).
New accounting pronouncement - In October 2020, the U.S. Securities and Exchange Commission (the “SEC”) adopted new regulations governing the use of derivatives by registered investment companies (“Rule 18f-4”). The Fund will be required to comply with Rule 18f-4 by August 19, 2022. Once implemented, Rule 18f-4 will impose limits on the amount of derivatives a fund can enter into, eliminate the asset segregation framework currently used by funds to comply with Section 18 of the Investment Company Act of 1940, as amended (the “1940 Act”), treat derivatives as senior securities and require funds whose use of derivatives is more than a limited specified exposure amount to establish and maintain a comprehensive derivatives risk management program and appoint a derivatives risk manager. The Fund is currently evaluating the impact, if any, of this provision.
Securities and futures valuation – The Fund values its portfolio securities at market value as of the close of regular trading on the New York Stock Exchange (the “NYSE”) (normally 4:00 p.m. Eastern time) on each business day the NYSE is open. Exchange-traded funds (“ETFs”) are valued at the security’s last sale price on the security’s primary exchange, if available, otherwise at the exchange’s most recently quoted mean price. Investments representing shares of money market funds and other open-end investment companies, except for ETFs, are valued at their net asset value (“NAV”) as reported by such companies. NASDAQ-listed securities are valued at the NASDAQ Official Closing Price. The Fund values its exchange-traded futures contracts at their last sale price as of the close of regular trading on the NYSE. Prices for these futures contracts are monitored daily by Wavelength Capital Management, LLC (the “Adviser”) until the close of regular trading to determine if fair valuation is required.
When using a quoted price and when the market for the security is considered active, a security will be classified as Level 1 within the fair value hierarchy (see below). In the event that market quotations are not readily available or are considered unreliable due to market or other events, the Fund values its securities and other assets at fair value pursuant to the procedures adopted by and under the general supervision of the Trust’s Board of Trustees
15
| WAVELENGTH INTEREST RATE NEUTRAL FUND |
| NOTES TO FINANCIAL STATEMENTS (Continued) |
(the “Board”). Under these procedures, the securities will be classified as Level 2 or 3 within the fair value hierarchy, depending on the inputs used. Unavailable or unreliable market quotes may be due to the following factors: a substantial bid-ask spread; infrequent sales resulting in stale prices; insufficient trading volume; small trade sizes; a temporary lapse in any reliable pricing source; and actions of the securities or futures markets, such as the suspension or limitation of trading.
GAAP establishes a single authoritative definition of fair value, sets out a framework for measuring fair value, and requires additional disclosures about fair value measurements.
Various inputs are used in determining the value of the Fund’s investments. These inputs are summarized in the three broad levels listed below:
| ● | Level 1 – quoted prices in active markets for identical securities |
| ● | Level 2 – other significant observable inputs |
| ● | Level 3 – significant unobservable inputs |
The inputs or methods used for valuing securities are not necessarily an indication of the risks associated with investing in those securities. The inputs used to measure fair value may fall into different levels of the fair value hierarchy. In such cases, for disclosure purposes, the level in the fair value hierarchy within which the fair value measurement falls in its entirety is determined based on the lowest level input that is significant to the fair value measurement.
The following is a summary of the Fund’s investments and other financial instruments and the inputs used to value the investments and other financial instruments as of May 31, 2022:
| Level 1 | Level 2 | Level 3 | Total | |||||||||||||
| Investments in Securities | ||||||||||||||||
| Exchange-Traded Funds | $ | 111,324,028 | $ | — | $ | — | $ | 111,324,028 | ||||||||
| Money Market Funds | 28,363,944 | — | — | 28,363,944 | ||||||||||||
| Collateral for Securities Loaned * | — | — | — | 44,019,094 | ||||||||||||
| Total | $ | 139,687,972 | $ | — | $ | — | $ | 183,707,066 | ||||||||
| Other Financial Instruments | ||||||||||||||||
| Futures Contracts | $ | (277,002 | ) | $ | — | $ | — | $ | (277,002 | ) | ||||||
| Total | $ | (277,002 | ) | $ | — | $ | — | $ | (277,002 | ) | ||||||
| * | Certain investments that are measured at fair value using the NAV per share (or its equivalent) practical expedient have not been categorized in the fair value hierarchy. The fair value amounts presented in the table are intended to permit reconciliation of the fair value hierarchy to the amounts presented on the Statement of Assets and Liabilities. |
The Fund did not have any assets or liabilities that were measured at fair value on a recurring basis using significant unobservable inputs (Level 3) as of or during the year ended May 31, 2022. Other Financial Instruments are future contracts which are valued at the unrealized appreciation (depreciation) as of May 31, 2022.
16
| WAVELENGTH INTEREST RATE NEUTRAL FUND |
| NOTES TO FINANCIAL STATEMENTS (Continued) |
Cash account – The Fund’s cash is held in a bank account with balances which, at times, may exceed United States federally insured limits by the Federal Deposit Insurance Corporation (“FDIC”). Cash held with a Broker, if any, is not FDIC insured. The Fund maintains these balances with a high-quality financial institution and may incur charges on cash overdrafts.
Share valuation – The NAV per share of the Fund is calculated daily by dividing the total value of the Fund’s assets, less liabilities, by the number of shares outstanding. The offering price and redemption price per share of the Fund is equal to the NAV per share.
Investment income – Dividend income is recorded on the ex-dividend date. Interest income, if any, is accrued as earned. Non-cash dividends included in dividend income, if any, are recorded at the fair value of the security received.
Investment transactions – Investment transactions are accounted for on the trade date. Realized gains and losses on investments sold are determined on a specific identification basis.
Common expenses – Common expenses of the Trust are allocated among the Fund and the other series of the Trust based on the relative net assets of each series, the number of series in the Trust, or the nature of the services performed and the relative applicability to each series.
Distributions to shareholders – The Fund distributes to shareholders any net investment income on a quarterly basis and any net realized capital gains at least annually. The amount of such dividends and distributions are determined in accordance with federal income tax regulations, which may differ from GAAP. Dividends and distributions to shareholders are recorded on the ex-dividend date. The tax character of distributions paid during the years ended May 31, 2022 and 2021 was as follows:
| Year | Ordinary | Tax-Exempt | Long-Term | Total | ||||||||||||
| Ended | Income | Distributions | Capital Gains | Distributions | ||||||||||||
| 5/31/2022 | $ | 3,482,354 | $ | 144,199 | $ | 1,913,406 | $ | 5,539,959 | ||||||||
| 5/31/2021 | $ | 1,980,645 | $ | 108,171 | $ | 410,233 | $ | 2,499,049 | ||||||||
Futures contracts – The Fund uses futures contracts to gain exposure to or to hedge against changes in the value of equities, real estate, interest rates or commodities. A futures contract represents a commitment for the future purchase or sale of an asset at a specified price on a specified date. When the Fund purchases or sells a futures contract, no price is paid to or received by the Fund. Instead, the Fund is required to deposit in a segregated asset account an amount of cash or qualifying securities currently ranging from 2% to 10% of the contract amount. This is called the “initial margin deposit.” Subsequent payments, known as “variation margin,” are made or received by the Fund each day, depending on the daily fluctuations in the fair value of the underlying asset. The Fund recognizes an unrealized gain or loss equal to the daily variation margin. If market conditions move unexpectedly, the Fund
17
| WAVELENGTH INTEREST RATE NEUTRAL FUND |
| NOTES TO FINANCIAL STATEMENTS (Continued) |
may not achieve the anticipated benefits of the futures contracts and may realize a loss. The margin deposits for futures contracts and the variation receivable/payable are reported on the Statement of Assets and Liabilities.
Estimates – The preparation of financial statements in conformity with GAAP requires management to make estimates and assumptions that affect the reported amounts of assets and liabilities and disclosure of contingent assets and liabilities as of the date of the financial statements and the reported amounts of increase (decrease) in net assets from operations during the reporting period. Actual results could differ from those estimates.
Federal income tax – The Fund has qualified and intends to continue to qualify as a regulated investment company under the Internal Revenue Code of 1986, as amended (the “Code”). Qualification generally will relieve the Fund of liability for federal income taxes to the extent 100% of its net investment income and net realized capital gains are distributed in accordance with the Code.
In order to avoid imposition of the excise tax applicable to regulated investment companies, it is also the Fund’s intention to declare as dividends in each calendar year amounts equal to at least 98% of its net investment income (earned during the calendar year) and 98.2% of its net realized capital gains (earned during the twelve months ended October 31) plus undistributed amounts from prior years.
The following information is computed on a tax basis for each item as of May 31, 2022:
| Tax cost of investments | $ | 192,452,784 | ||
| Gross unrealized appreciation | $ | 530,574 | ||
| Gross unrealized depreciation | (9,276,292 | ) | ||
| Net unrealized depreciation | (8,745,718 | ) | ||
| Undistributed ordinary income | 696,956 | |||
| Accumulated capital and other losses | (5,304,615 | ) | ||
| Total accumulated deficit | $ | (13,353,377 | ) | |
The value of the federal income tax cost of investments may temporarily differ from the financial statement cost. This book/tax difference is due to the recognition of capital gains or losses under income tax regulations and GAAP, primarily the tax deferral of losses on wash sales, the tax treatment of realized and unrealized gains and losses on futures contracts and adjustments to basis on publicly traded partnerships.
Post-October losses, incurred after October 31, 2021 and within the current taxable year, are deemed to arise on the first day of the Fund’s next taxable year. For the year ended May 31, 2022, the Fund deferred $5,304,615 of post-October losses to June 1, 2022 for federal income tax purposes.
18
| WAVELENGTH INTEREST RATE NEUTRAL FUND |
| NOTES TO FINANCIAL STATEMENTS (Continued) |
For the year ended May 31, 2022, the Fund reclassified $1 of accumulated deficit against paid-in capital on the Statement of Assets and Liabilities. Such reclassification, the result of permanent differences between the financial statement and income tax reporting had no effect on the Fund’s net assets or its NAV per share.
The Fund recognizes the tax benefits or expenses of uncertain tax positions only when the position is “more likely than not” to be sustained assuming examination by tax authorities. Management has reviewed the Fund’s tax positions for all open tax years (generally, three years) and has concluded that no provision for unrecognized tax benefits or expenses is required in these financial statements. The Fund identifies its major tax jurisdiction as U.S. Federal.
3. Investment Transactions
During the year ended May 31, 2022, cost of purchases and proceeds from sales of investment securities, other than short-term investments, were $45,278,593 and $21,175,492, respectively.
4. Transactions with Related Parties
Wavelength Capital Management, LLC (the “Adviser”), which has served as the investment adviser to the Fund since the Fund’s inception, redeemed MANG Investments LLC’s (“MANG”) ownership interest in the Adviser in a transaction that closed on August 13, 2021 (the “Transaction”).
The closing of the Transaction was considered an “assignment” under the 1940 Act, of the Fund’s then existing investment advisory agreement (the “Previous Advisory Agreement”) and resulted in its automatic termination. At a meeting held prior to the closing of the Transaction on August 13, 2021, the Board of Trustees (the “Board”) reviewed and approved the Fund’s interim investment advisory agreement (the “Interim Advisory Agreement”) and a new investment advisory agreement (the “Current Advisory Agreement”), each with the Adviser and each with substantially the same terms as the Previous Advisory Agreement, except for the start and end date of the agreement and, in the case of the Interim Advisory Agreement, various terms related to compliance with Rule 15a-4 of the 1940 Act. The Current Advisory Agreement became effective upon approval by the Fund’s shareholders on December 8, 2021.
PREVIOUS INVESTMENT ADVISORY AGREEMENT
Prior to August 13, 2021, the Fund’s investments were managed by the Adviser pursuant to the terms of the Previous Advisory Agreement. Under the Previous Advisory Agreement, the Fund paid the Adviser an investment advisory fee, computed and accrued daily and paid monthly, at the annual rate of 0.95% of its average daily net assets.
Pursuant to an Expense Limitation Agreement between the Fund and the Adviser (the “Previous ELA”), the Adviser agreed, until October 1, 2025, to reduce its investment advisory fees and reimburse other expenses to limit total annual operating expenses (exclusive of brokerage costs; taxes; interest; borrowing costs such as interest and dividends
19
| WAVELENGTH INTEREST RATE NEUTRAL FUND |
| NOTES TO FINANCIAL STATEMENTS (Continued) |
expenses on securities sold short; acquired fund fees and expenses; extraordinary expenses such as litigation and merger or reorganization costs and other expenses not incurred in the ordinary course of the Fund’s business) to an amount not exceeding 0.99% of the Fund’s average daily net assets.
INTERIM INVESTMENT ADVISORY AGREEMENT
From August 13, 2021 through December 8, 2021, the Fund’s investments were managed by the Adviser pursuant to the terms of the Interim Advisory Agreement. Under the Interim Advisory Agreement, the Fund paid the Adviser an investment advisory fee, computed and accrued daily and paid monthly, at the annual rate of 0.95% of its average daily net assets.
Pursuant to an interim Expense Limitation Agreement between the Fund and the Adviser (the “Interim ELA”), the Adviser agreed, until October 1, 2025, to reduce its investment advisory fees and reimburse other expenses to limit total annual operating expenses (exclusive of brokerage costs; taxes; interest; borrowing costs such as interest and dividends expenses on securities sold short; acquired fund fees and expenses; extraordinary expenses such as litigation and merger or reorganization costs and other expenses not incurred in the ordinary course of the Fund’s business) to an amount not exceeding 0.99% of the Fund’s average daily net assets.
CURRENT INVESTMENT ADVISORY AGREEMENT
Since December 8, 2021, the Fund’s investments are managed by the Adviser pursuant to the terms of the Current Advisory Agreement. Under the Current Advisory Agreement, the Fund pays the Adviser an investment advisory fee, computed and accrued daily and paid monthly, at the annual rate of 0.95% of its average daily net assets.
Pursuant to a new Expense Limitation Agreement between the Fund and the Adviser (the “Current ELA”), the Adviser has agreed, until October 1, 2025, to reduce its investment advisory fees and reimburse other expenses to limit total annual operating expenses (exclusive of brokerage costs; taxes; interest; borrowing costs such as interest and dividends expenses on securities sold short; acquired fund fees and expenses; extraordinary expenses such as litigation and merger or reorganization costs and other expenses not incurred in the ordinary course of the Fund’s business) to an amount not exceeding 0.99% of the Fund’s average daily net assets.
Accordingly, under each of the Previous ELA, the Interim ELA, and the Current ELA, the Adviser, reduced its investment advisory fees in the aggregate amount of $415,183 during the year ended May 31, 2022.
Under the terms of the Previous ELA, the Interim ELA, and the Current ELA, investment advisory fee reductions and expense reimbursements by the Adviser are subject to recoupment by the Adviser for a period of three years after such fees and expenses were incurred, provided that the recoupments do not cause total annual operating expenses of the Fund to exceed the lesser of (i) the expense limitation then in effect, if any, and (ii)
20
| WAVELENGTH INTEREST RATE NEUTRAL FUND |
| NOTES TO FINANCIAL STATEMENTS (Continued) |
the expense limitation in effect at the time the expenses to be repaid were incurred. As of May 31, 2022, the Adviser may seek recoupment of investment advisory fee reductions and expense reimbursements in the amount of $987,725 no later than the dates as stated below:
| May 31, 2023 | May 31, 2024 | May 31, 2025 | Total | |||
| $251,041 | $321,501 | $415,183 | $987,725 |
OTHER SERVICE PROVIDERS
Ultimus Fund Solutions, LLC (“Ultimus”) provides administration, fund accounting, compliance and transfer agency services to the Fund. The Fund pays Ultimus fees in accordance with the agreements for such services. In addition, the Fund pays out-of-pocket expenses including, but not limited to, postage, supplies and certain costs related to the pricing of the Fund’s portfolio securities.
Under the terms of a Distribution Agreement with the Trust, Ultimus Fund Distributors, LLC (the “Distributor”) serves as the principal underwriter to the Fund. The Distributor is a wholly-owned subsidiary of Ultimus. The Distributor is compensated by the Adviser (not the Fund) for acting as principal underwriter.
Certain officers and a Trustee of the Trust are also officers of Ultimus.
TRUSTEE COMPENSATION
Effective October 20, 2021, each member of the Board (a “Trustee”) who is not an “interested person” (as defined by the 1940 Act, as amended) of the Trust (“Independent Trustee”) receives a $1,300 annual retainer from the Fund, paid quarterly, except for the Board Chairperson who receives a $1,700 annual retainer from the Fund, paid in quarterly installments. Each Independent Trustee also receives from the Fund a fee of $550 for each Board meeting attended plus reimbursement for travel and other meeting-related expenses. Prior to October 20, 2021, each Independent Trustee received a $1,300 annual retainer from the Fund, paid quarterly, except for the Board Chairperson who received a $1,500 annual retainer from the Fund, paid in quarterly installments. Each Independent Trustee also received from the Fund a fee of $500 for each Board meeting attended plus reimbursement for travel and other meeting-related expenses.
PRINCIPAL HOLDER OF FUND SHARES
As of May 31, 2022, the following shareholder owned of record 25% or more of the outstanding shares of the Fund:
| Name of Record Owner | % Ownership | |
| National Financial Services, LLC (for the benefit of its customers) | 45% |
A shareholder owning of record or beneficially 25% or more of the Fund’s outstanding shares may be considered a controlling person. That shareholder’s vote could have a more significant effect on matters presented at a shareholders’ meeting.
21
| WAVELENGTH INTEREST RATE NEUTRAL FUND |
| NOTES TO FINANCIAL STATEMENTS (Continued) |
5. Derivatives Transactions
The Fund’s positions in derivative instruments as of May 31, 2022 are recorded in the following location on the Statement of Assets and Liabilities:
| Derivative Investment Type | Location | |
| Futures contracts | Variation margin payable |
The following table sets forth the values of variation margin of the Fund as of May 31, 2022:
| Variation Margin | ||||||||||||
| Type of Derivative and Risk | Receivable | (Payable) | Total | |||||||||
| Asset Derivatives | ||||||||||||
| Futures contracts | ||||||||||||
| Commodity | $ | — | $ | (18,245 | ) | $ | (18,245 | ) | ||||
| Index | — | (29,622 | ) | (29,622 | ) | |||||||
| Treasury | — | (95,434 | ) | (95,434 | ) | |||||||
| Total | $ | — | $ | (143,301 | ) | $ | (143,301 | ) | ||||
The Fund’s transactions in derivative instruments during the year ended May 31, 2022 are recorded in the following locations on the Statement of Operations:
| Derivative Investment Type | Location | |
| Futures contracts | Net realized gains (losses) from futures contracts | |
| Net change in unrealized appreciation (depreciation) on futures contracts |
The following is a summary of the Fund’s net realized gains (losses) and net change in unrealized appreciation (depreciation) on derivative instruments recognized on the Statement of Operations during the year ended May 31, 2022:
| Net Change | ||||||||
| in Unrealized | ||||||||
| Net Realized | Appreciation | |||||||
| Type of Derivative and Risk | Gains (Losses) | (Depreciation) | ||||||
| Futures contracts | ||||||||
| Commodity | $ | (72,029 | ) | $ | (58,261 | ) | ||
| Index | 142,398 | (409,632 | ) | |||||
| Treasury | (2,913,389 | ) | (87,197 | ) | ||||
| Total | $ | (2,843,020 | ) | $ | (555,090 | ) | ||
22
| WAVELENGTH INTEREST RATE NEUTRAL FUND |
| NOTES TO FINANCIAL STATEMENTS (Continued) |
In the ordinary course of business, the Fund may enter into transactions subject to enforceable netting agreements or other similar arrangements (“netting agreements”). Generally, the right to offset in netting agreements allows the Fund to offset any exposure to a specific counterparty with any collateral received or delivered to that counterparty based on the terms of the agreements. Generally, the Fund manages its cash collateral securities and securities collateral on a counterparty basis.
As of May 31, 2022, the offsetting of financial assets and derivative assets is as follows:
| Gross | Gross | |||||||||||||||||||||||
| Amounts of | Amounts of | |||||||||||||||||||||||
| Recognized | Recognized | |||||||||||||||||||||||
| Assets not | Liabilities | Net Amounts | ||||||||||||||||||||||
| Offset on | not Offset on | Presented on | ||||||||||||||||||||||
| Statement of | Statement of | Derivatives | Statement of | |||||||||||||||||||||
| Assets and | Assets and | Available for | Assets and | Collateral | ||||||||||||||||||||
| Description | Liabilities | Liabilities | Offset | Liabilities | Pledged* | Net Amount | ||||||||||||||||||
| Variation margin receivable - futures contracts | $ | — | $ | — | $ | — | $ | — | $ | — | $ | — | ||||||||||||
| Variation margin payable - futures contracts | — | (143,301 | ) | — | (143,301 | ) | 143,301 | — | ||||||||||||||||
| Total subject to a master netting or similar arrangement | $ | — | $ | (143,301 | ) | $ | — | $ | (143,301 | ) | $ | 143,301 | $ | — | ||||||||||
| * | The amount is limited to the net amounts of financial assets and accordingly does not include excess collateral pledged. |
6. Securities Lending
Under the terms of the securities lending agreement with U.S. Bank National Association (“U.S. Bank”), U.S. Bank is authorized to loan securities on behalf of the Fund to approved borrowers. The contractual maturity of securities lending transactions are on an overnight and continuous basis. In exchange, the Fund receives cash collateral in the amount of at least 102% of the value of the securities loaned. Any collateral shortfalls due to changes in security market prices are adjusted the next business day. The cash collateral is invested in a short-term investment instrument as noted on the Fund’s Schedule of Investments. As of May 31, 2022, the Fund had 27.5% of its net assets invested in this short-term investment instrument for securities lending purposes. Although risk is mitigated by the collateral, the Fund could experience a delay in recovering its securities and possible loss of income or value if the borrower fails to return them. The agreement provides that after predetermined rebates to borrowers, the Fund retains a portion of its net securities lending income and pays U.S. Bank the remaining portion. The Fund manages credit exposure arising from these lending transactions by, in appropriate circumstances, entering into a Securities Lending Agreement with U.S. Bank that provides the Fund, in the event of default (such as
23
| WAVELENGTH INTEREST RATE NEUTRAL FUND |
| NOTES TO FINANCIAL STATEMENTS (Continued) |
bankruptcy or borrower’s failure to pay or perform), the right to net rights and obligations under such agreements and liquidate and set off collateral against the net amount owed to the Fund. The Fund’s collateral is invested in the Mount Vernon Liquid Assets Portfolio, LLC (“Mount Vernon”) of which the investment objective is to seek to maximize current income to the extent with the preservation of capital and liquidity and maintain a stable NAV of $1.00 per unit. Additional information regarding Mount Vernon can be found at www.sec.gov. As of May 31, 2022, the fair value of securities on loan and the collateral held were $42,656,342 and $44,019,094, respectively.
7. Certain Investments and Risks
The securities in which the Fund invests, as well as the risks associated with these securities, are described in the Fund’s prospectus. Among these risks are those associated with investments in shares of ETFs. ETFs issue their shares to authorized participants in return for a specific basket of securities. The authorized participants then sell the ETF’s shares on the secondary market. In other words, ETF shares are traded on a securities exchange based on their market value. Investments in ETFs are subject to the risk that the ETF’s shares may trade at a premium (creating the risk that the Fund pays more than NAV for an ETF when making a purchase) or discount (creating the risk that the Fund receives less than NAV when selling an ETF) to the ETF’s NAV. Investments in ETFs are also subject to index-tracking risk because the total return generated by the securities will be reduced by transaction costs and expenses not incurred by the indices. Certain securities comprising the index tracked by an ETF may, from time to time, temporarily be unavailable, which may further impede the ETF’s ability to track its applicable index or match the index’s performance. To the extent that the Fund invests in an ETF, the Fund incurs additional expenses because the Fund bears its pro-rata portion of such ETF’s advisory fees and operational expenses. Finally, ETF shares are also subject to the risks applicable to the underlying basket of securities. As of May 31, 2022, the Fund had 69.6% of the value of its net assets invested in ETFs.
8. Contingencies and Commitments
The Fund indemnifies the Trust’s officers and Trustees for certain liabilities that might arise from their performance of their duties to the Fund. Additionally, in the normal course of business, the Fund enters into contracts that contain a variety of representations and warranties and which provide general indemnifications. The Fund’s maximum exposure under these arrangements is unknown, as this would involve future claims that may be made against the Fund that have not yet occurred. However, based on experience, the Fund expects the risk of loss to be remote.
9. Subsequent Events
The Fund is required to recognize in the financial statements the effects of all subsequent events that provide additional evidence about conditions that existed as of the date of the Statement of Assets and Liabilities. For non-recognized subsequent events that must be disclosed to keep the financial statements from being misleading, the Fund is required to disclose the nature of the event as well as an estimate of its financial effect, or a statement
24
| WAVELENGTH INTEREST RATE NEUTRAL FUND |
| NOTES TO FINANCIAL STATEMENTS (Continued) |
that such an estimate cannot be made. Management has evaluated subsequent events through the issuance of these financial statements and has noted no such events except for the following:
On June 30, 2022, the Fund paid an ordinary income dividend of $0.0734 per share to shareholders of record on June 29, 2022.
Effective July 10, 2022, the Fund’s principal investment strategy was revised to, among other things, allow for investments in fixed-income securities (both U.S. Dollar-denominated and local currency-denominated), municipal securities, collateralized debt, mortgage-backed securities, including collateralized mortgage obligations, senior loans, preferred securities and stock index futures.
25
| WAVELENGTH INTEREST RATE NEUTRAL FUND |
| REPORT OF INDEPENDENT REGISTERED |
| PUBLIC ACCOUNTING FIRM |
To the Board of Trustees of Ultimus Managers Trust
and the Shareholders of Wavelength Interest Rate Neutral Fund
Opinion on the Financial Statements
We have audited the accompanying statement of assets and liabilities of Wavelength Interest Rate Neutral Fund, a series of shares of beneficial interest in Ultimus Managers Trust (the “Fund”), including the schedule of investments, as of May 31, 2022, and the related statement of operations for the year then ended, the statements of changes in net assets for each of the years in the two-year period then ended and the financial highlights for each of the years in the five-year period then ended, and the related notes (collectively referred to as the “financial statements”). In our opinion, the financial statements present fairly, in all material respects, the financial position of the Fund as of May 31, 2022, and the results of its operations for the year then ended, the changes in its net assets for each of the years in the two-year period then ended and its financial highlights for each of the years in the five-year period then ended, in conformity with accounting principles generally accepted in the United States of America.
Basis for Opinion
These financial statements are the responsibility of the Fund’s management. Our responsibility is to express an opinion on the Fund’s financial statements based on our audits. We are a public accounting firm registered with the Public Company Accounting Oversight Board (United States) (“PCAOB”) and are required to be independent with respect to the Fund in accordance with the U.S. federal securities law and the applicable rules and regulations of the Securities and Exchange Commission and the PCAOB.
We conducted our audits in accordance with the standards of the PCAOB. Those standards require that we plan and perform the audits to obtain reasonable assurance about whether the financial statements are free of material misstatement, whether due to error or fraud. The Fund is not required to have, nor were we engaged to perform, an audit of its internal control over financial reporting. As part of our audits we are required to obtain an understanding of internal control over financial reporting but not for the purpose of expressing an opinion on the effectiveness of the Fund’s internal control over financial reporting. Accordingly, we express no such opinion.
Our audits included performing procedures to assess the risk of material misstatement of the financial statements, whether due to error or fraud, and performing procedures that respond to those risks. Such procedures included examining, on a test basis, evidence regarding the amounts and disclosures in the financial statements. Our procedures included confirmation of securities owned as of May 31, 2022 by correspondence with the custodian and broker. Our
26
| WAVELENGTH INTEREST RATE NEUTRAL FUND |
| REPORT OF INDEPENDENT REGISTERED |
| PUBLIC ACCOUNTING FIRM (Continued) |
audits also included evaluating the accounting principles used and significant estimates made by management, as well as evaluating the overall presentation of the financial statements. We believe that our audits provide a reasonable basis for our opinion.
BBD, LLP
We have served as the auditor of one or more of the Funds in the Ultimus Managers Trust since 2013.
Philadelphia, Pennsylvania
July 20, 2022
27
| WAVELENGTH INTEREST RATE NEUTRAL FUND |
| ABOUT YOUR FUND’S EXPENSES (Unaudited) |
We believe it is important for you to understand the impact of costs on your investment. As a shareholder of the Fund, you incur ongoing costs, including management fees and other operating expenses. The following examples are intended to help you understand your ongoing costs (in dollars) of investing in the Fund and to compare these costs with the ongoing costs of investing in other mutual funds.
A mutual fund’s ongoing costs are expressed as a percentage of its average net assets. This figure is known as the expense ratio. The expenses in the table below are based on an investment of $1,000 made at the beginning of the most recent period (December 1, 2021) and held until the end of the period (May 31, 2022).
The table below illustrates the Fund’s ongoing costs in two ways:
Actual fund return – This section helps you to estimate the actual expenses that you paid over the period. The “Ending Account Value” shown is derived from the Fund’s actual return, and the third column shows the dollar amount of operating expenses that would have been paid by an investor who started with $1,000 in the Fund. You may use the information here, together with the amount you invested, to estimate the expenses that you paid over the period.
To do so, simply divide your account value by $1,000 (for example, an $8,600 account value divided by $1,000 = 8.6), then multiply the result by the number given for the Fund under the heading “Expenses Paid During Period.”
Hypothetical 5% return – This section is intended to help you compare the Fund’s ongoing costs with those of other mutual funds. It assumes that the Fund had an annual return of 5% before expenses during the period shown, but that the expense ratio is unchanged. In this case, because the return used is not the Fund’s actual return, the results do not apply to your investment. The example is useful in making comparisons because the SEC requires all mutual funds to calculate expenses based on a 5% return. You can assess the Fund’s ongoing costs by comparing this hypothetical example with the hypothetical examples that appear in shareholder reports of other funds.
Note that expenses shown in the table are meant to highlight and help you compare ongoing costs only. The Fund does not charge transaction fees, such as purchase or redemption fees, nor does it carry a “sales load.”
The calculations assume no shares were bought or sold during the period. Your actual costs may have been higher or lower, depending on the amount of your investment and the timing of any purchases or redemptions.
28
| WAVELENGTH INTEREST RATE NEUTRAL FUND |
| ABOUT YOUR FUND’S EXPENSES (Unaudited) |
More information about the Fund’s expenses can be found in this report. For additional information on operating expenses and other shareholder costs, please refer to the Fund’s prospectus.
| Beginning | Ending | Expenses | ||||
| Account Value | Account Value | Paid During | ||||
| December 1, 2021 | May 31, 2022 | Period* | ||||
| Based on Actual Fund Return | $1,000.00 | $929.00 | $4.76 | |||
| Based on Hypothetical 5% Return (before expenses) | $1,000.00 | $1,020.00 | $4.99 |
| * | Expenses are equal to the Fund’s annualized net expense ratio of 0.99% for the period, multiplied by the average account value over the period, multiplied by 182/365 (to reflect the one-half year period). |
| OTHER INFORMATION (Unaudited) |
A description of the policies and procedures that the Fund uses to vote proxies relating to portfolio securities is available without charge upon request by calling toll- free 1-866-896-9292, or on the SEC’s website at www.sec.gov. Information regarding how the Fund voted proxies relating to portfolio securities during the most recent 12-month period ended June 30 is available without charge upon request by calling toll-free 1-866-896-9292, or on the SEC’s website at www.sec.gov. The Trust files a complete listing of portfolio holdings for the Fund with the SEC as of the end of the first and third quarters of each fiscal year as an exhibit to its reports on Form N-PORT. These filings are available upon request by calling 1-866-896-9292. Furthermore, you may obtain a copy of the filings on the SEC’s website at www.sec.gov and the Fund’s website at www.wavelengthcapital.com.
| FEDERAL TAX INFORMATION (Unaudited) |
For the fiscal year ended May 31, 2022, the Fund designated $1,913,406 as long-term capital gain distributions and $144,199 as tax-exempt income distributions.
29
| WAVELENGTH INTEREST RATE NEUTRAL FUND |
| BOARD OF TRUSTEES AND EXECUTIVE OFFICERS (Unaudited) |
The Board has overall responsibility for management of the Trust’s affairs. The Trustees serve during the lifetime of the Trust and until its termination, or until death, resignation, retirement, or removal. The Trustees, in turn, elect the officers of the Fund to actively supervise their day-to-day operations. The officers have been elected for an annual term. Each Trustee’s and officer’s address is 225 Pictoria Drive, Suite 450, Cincinnati, Ohio 45246. The following are the Trustees and executive officers of the Fund:
| Name and Year of Birth | Length of Time Served | Position(s) Held with Trust | Principal Occupation(s) During Past 5 Years | Number in Trust | Directorships of Public Companies Held by Trustee During Past 5 Years |
| Interested Trustees: | |||||
| David R. Carson* Year of Birth: 1958 | Trustee Since 2021
Officer Since 2013 | Trustee (2021 to present)
Vice President (2021 to present; and previously April 2013 to October 2013)
President and Principal Executive Officer of each of its series (2013 to 2021) | Vice President and Director of Client Strategies of Ultimus Fund Solutions, LLC (2013 to present); President of Unified Series Trust (2017 to present). | 26 | Interested Trustee of 21 series of the Unified Series Trust (a registered management company) (2020 to present). |
| Independent Trustees: | |||||
| Janine L. Cohen Year of Birth: 1952 | Since 2016 | Chairperson (2019 to present)
Trustee (2016 to present) | Retired since 2013; previously Chief Financial Officer from 2004 to 2013 and Chief Compliance Officer from 2008 to 2013 at AER Advisors, Inc. | 26 | None |
30
| WAVELENGTH INTEREST RATE NEUTRAL FUND |
| BOARD OF TRUSTEES AND EXECUTIVE OFFICERS (Unaudited) (Continued) |
| Name and Year of Birth | Length of Time Served | Position(s) Held with Trust | Principal Occupation(s) During Past 5 Years | Number of Funds in Trust Overseen by Trustee | Directorships of Public Companies Held by Trustee During Past 5 Years |
| Independent Trustees (Continued): | |||||
| David M. Deptula Year of Birth: 1958 | Since 2012 | Trustee | Vice President of Legal and Special Projects at Dayton Freight Lines, Inc. since February 2016 | 26 | None |
| Jacqueline A. Williams Year of Birth: 1954 | Since 2019 | Trustee | Managing Member of Custom Strategy Consulting, LLC (2017 to present); Managing Director of Global Investment Research (2005 to 2017), Cambridge Associates, LLC. | 26 | None |
| Clifford N. Schireson Year of Birth: 1953 | Since 2019 | Trustee | Retired; Founder of Schireson Consulting, LLC (2017 to 2022); Director of Institutional Services for Brandes Investment Partners, LP (2004-2017). | 26 | Trustee of the San Diego City Employees’ Retirement System (2019 to present). |
| Robert E. Morrison Year of Birth: 1957 | Since 2019 | Trustee | Managing Director, Midwest Trust and FCI Advisors (2022 to present); Senior Vice President and National Practice Lead for Investment, Huntington National Bank/ Huntington Private Bank (2014 to 2022); CEO, CIO, President of 5 Star Investment Management Company (2006 to 2014). | 26 | None |
| * | Mr. Carson is considered an “interested person” of the Trust within the meaning of Section 2(a)(19) of the 1940 Act because of his relationship with the Trust’s administrator, transfer agent, and distributor. Mr. Carson was President of the Trust from October 2013 to January 2021 and Vice President of the Trust from April 2013 to October 2013. |
31
| WAVELENGTH INTEREST RATE NEUTRAL FUND |
| BOARD OF TRUSTEES AND EXECUTIVE OFFICERS (Unaudited) (Continued) |
| Name and Year of Birth | Length of Time Served | Position(s) Held with Trust | Principal Occupation(s) During Past 5 Years |
| Executive Officers: | |||
| Todd E. Heim Year of Birth: 1967 | Since 2014 | President (2021 to present)
Vice President (2014 to 2021) | Vice President, Relationship Management (2018 to present) and Assistant Vice President, Client Implementation Manager of Ultimus Fund Solutions, LLC (2014 to 2018); Naval Flight Officer in United States Navy (1989 to 2017). |
| Jennifer L. Leamer Year of Birth: 1976 | Since 2014 | Treasurer (2014 to present)
Assistant Treasurer (April 2014 to October 2014) | Senior Vice President, Fund Accounting of Ultimus Fund Solutions, LLC (2014 to present). |
| Daniel D. Bauer Year of Birth: 1977 | Since 2016 | Assistant Treasurer (2016 to present) | Vice President, Fund Accounting (2022 to present) and Assistant Vice President, Fund Accounting of Ultimus Fund Solutions, LLC (2015 to 2022). |
| Angela A. Simmons Year of Birth: 1975 | Since 2022 | Assistant Treasurer (2022 to present) | Vice President, Financial Administration (2022 to present) and Assistant Vice President, Financial Administration (2015 to 2022) of Ultimus Fund Solutions, LLC. |
| Khimmara Greer Year of Birth: 1983 | Since 2021 | Secretary (2021 to present) | Vice President and Senior Legal Counsel of Ultimus Fund Solutions, LLC (2021 to present); Vice President, Asset Servicing – Regulatory Administration of The Bank of New York Mellon (2019 to 2021); Vice President and Counsel of State Street Bank and Trust Company (2015 to 2019). |
| David K. James Year of Birth: 1970 | Since 2021 | Assistant Secretary (2021 to present)
Secretary (2021 to 2021) | Executive Vice President and Chief Legal and Risk Officer of Ultimus Fund Solutions, LLC (2018 to present); Managing Director and Managing Counsel of State Street Bank and Trust Company (2009 to 2018). |
| Natalie S. Anderson Year of Birth: 1975 | Since 2016 | Assistant Secretary (2016 to present) | Legal Administration Manager (July 2016 to present) and Paralegal (January 2015 to June 2016) of Ultimus Fund Solutions, LLC. |
32
WAVELENGTH INTEREST RATE NEUTRAL FUND
BOARD OF TRUSTEES AND EXECUTIVE OFFICERS (Unaudited) (Continued)
| Name and Year of Birth | Length of Time | Position(s) Held with Trust | Principal Occupation(s) During Past 5 Years |
| Executive Officers (Continued): | |||
| Gweneth Gosselink Year of Birth: 1955 | Since 2020 | Chief Compliance Officer (2020 to present) | Assistant Vice President, Senior Compliance Officer of Ultimus Fund Solutions, LLC (December 2019 to present); CCO Consultant at GKG Consulting, LLC (December 2019 to present); Chief Operating Officer & CCO at Miles Capital, Inc. (June 2013 to December 2019). |
| Martin Dean Year of Birth: 1963 | Since 2019 | Assistant Chief Compliance Officer (2020 to present)
Interim Chief Compliance Officer (October 2019 to January 2020)
Assistant Chief Compliance Officer (2016 to 2017) | Senior Vice President, Head of Fund Compliance (February 2020 to present); Vice President & Director of Fund Compliance of Ultimus Fund Solutions, LLC (January 2016 to January 2020). |
Additional information about members of the Board and executive officers is available in the Fund’s Statement of Additional Information (“SAI”). To obtain a free copy of the SAI, please call toll free 1-866-896-9292.
33
WAVELENGTH-AR-22
| (b) | Not applicable |
| Item 2. | Code of Ethics. |
As of the end of the period covered by this report, the registrant has adopted a code of ethics that applies to the registrant’s principal executive officer, principal financial officer, principal accounting officer or controller, or persons performing similar functions, regardless of whether these individuals are employed by the registrant or a third party. Pursuant to Item 12(a)(1), a copy of registrant’s code of ethics is filed as an exhibit to this Form N-CSR. During the period covered by this report, the code of ethics has not been amended, and the registrant has not granted any waivers, including implicit waivers, from the provisions of the code of ethics.
| Item 3. | Audit Committee Financial Expert. |
The registrant’s board of trustees has determined that the registrant has at least one audit committee financial expert serving on its audit committee. The name of the audit committee financial expert is Janine L. Cohen. Ms. Cohen is “independent” for purposes of this Item.
| Item 4. | Principal Accountant Fees and Services. |
| (a) | Audit Fees. The aggregate fees billed for professional services rendered by the principal accountant for the audit of the registrant’s annual financial statements or for services that are normally provided by the accountant in connection with statutory and regulatory filings or engagements were $64,500 and $64,500 with respect to the registrant’s fiscal years ended May 31, 2022 and 2021, respectively. |
| (b) | Audit-Related Fees. No fees were billed in either of the last two fiscal years for assurance and related services by the principal accountant that are reasonably related to the performance of the audit of the registrant’s financial statements and are not reported under paragraph (a) of this Item. |
| (c) | Tax Fees. The aggregate fees billed for professional services rendered by the principal accountant for tax compliance, tax advice, and tax planning were $15,000 and $15,000 with respect to the registrant’s fiscal years ended May 31, 2022 and 2021, respectively. The services comprising these fees are the preparation of the registrant’s federal income and excise tax returns. |
| (d) | All Other Fees. No fees were billed in either of the last two fiscal years for products and services provided by the principal accountant, other than the services reported in paragraphs (a) through (c) of this Item. |
| (e)(1) | The audit committee has not adopted pre-approval policies and procedures described in paragraph (c)(7) of Rule 2-01 of Regulation S-X. |
| (e)(2) | None of the services described in paragraph (b) through (d) of this Item were approved by the audit committee pursuant to paragraph (c)(7)(i)(C) of Rule 2-01 of Regulation S-X. |
| (f) | Less than 50% of hours expended on the principal accountant’s engagement to audit the registrant’s financial statements for the most recent fiscal year were attributed to work performed by persons other than the principal accountant’s full-time, permanent employees. |
| (g) | During the fiscal years ended May 31, 2022 and 2021, aggregate non-audit fees of $15,000 and $15,000, respectively, were billed by the registrant’s accountant for services rendered to the registrant. No non-audit fees were billed in either of the last two fiscal years by the registrant’s accountant for services rendered to the registrant’s investment adviser (not including any sub-adviser whose role is primarily portfolio management and is subcontracted with or overseen by another investment adviser), and any entity controlling, controlled by, or under common control with the adviser that provides ongoing services to the registrant. |
| (h) | The principal accountant has not provided any non-audit services to the registrant’s investment adviser (not including any sub-adviser whose role is primarily portfolio management and is subcontracted with or overseen by another investment adviser), and any entity controlling, controlled by, or under common control with the investment adviser that provides ongoing services to the registrant. |
| Item 5. | Audit Committee of Listed Registrants. |
Not applicable
| Item 6. | Schedule of Investments. |
| (a) | Not applicable [schedule filed with Item 1] |
| (b) | Not applicable |
| Item 7. | Disclosure of Proxy Voting Policies and Procedures for Closed-End Management Investment Companies. |
Not applicable
| Item 8. | Portfolio Managers of Closed-End Management Investment Companies. |
Not applicable
| Item 9. | Purchases of Equity Securities by Closed-End Management Investment Company and Affiliated Purchasers. |
Not applicable
Item 10. Submission of Matters to a Vote of Security Holders.
There has been no material changes to the manner in which shareholders may recommend nominees to the Registrant's Board of Trustees or the Nominations & Governance Committee (the “Committee”). The Registrant does not have formal procedures by which shareholders may recommend nominees to the Registrant's Board of Trustees. While the Registrant does not have formal procedure, the Committee shall to the extent required under applicable law, when identifying potential candidates for the position of Independent Trustee, consider any such candidate recommended by a shareholder.
| Item 11. | Controls and Procedures. |
(a) Based on their evaluation of the registrant’s disclosure controls and procedures (as defined in Rule 30a-3(c) under the Investment Company Act of 1940) as of a date within 90 days of the filing date of this report, the registrant’s principal executive officer and principal financial officer have concluded that such disclosure controls and procedures are reasonably designed and are operating effectively to ensure that material information relating to the registrant, including its consolidated subsidiaries, is made known to them by others within those entities, particularly during the period in which this report is being prepared, and that the information required in filings on Form N-CSR is recorded, processed, summarized, and reported on a timely basis.
(b) There were no changes in the registrant’s internal control over financial reporting (as defined in Rule 30a-3(d) under the Investment Company Act of 1940) that occurred during the period covered by this report that have materially affected, or are reasonably likely to materially affect, the registrant’s internal control over financial reporting.
Item 12. Disclosure of Securities Lending Activities for Closed-End Management Investment Companies.
Not applicable
| Item 13. | Exhibits. |
File the exhibits listed below as part of this Form. Letter or number the exhibits in the sequence indicated.
(a)(1) Any code of ethics, or amendment thereto, that is the subject of the disclosure required by Item 2, to the extent that the registrant intends to satisfy the Item 2 requirements through filing of an exhibit: Attached hereto
(a)(2) A separate certification for each principal executive officer and principal financial officer of the registrant as required by Rule 30a-2(a) under the Act (17 CFR 270.30a-2(a)): Attached hereto
(a)(3) Any written solicitation to purchase securities under Rule 23c-1 under the Act (17 CFR 270.23c-1) sent or given during the period covered by the report by or on behalf of the registrant to 10 or more persons: Not applicable
(a)(4) Change in the registrant’s independent public accountants: Not applicable
(b) Certifications required by Rule 30a-2(b) under the Act (17 CFR 270.30a-2(b)): Attached hereto
Exhibit 99.CODE ETH Code of Ethics
Exhibit 99.CERT Certifications required by Rule 30a-2(a) under the Act
Exhibit 99.906CERT Certifications required by Rule 30a-2(b) under the Act
SIGNATURES
Pursuant to the requirements of the Securities Exchange Act of 1934 and the Investment Company Act of 1940, the registrant has duly caused this report to be signed on its behalf by the undersigned, thereunto duly authorized.
| (Registrant) | Ultimus Managers Trust | |||
| By (Signature and Title)* | /s/ Todd E. Heim | |||
| Todd E. Heim, President | ||||
| Date | August 1, 2022 | |||
| Pursuant to the requirements of the Securities Exchange Act of 1934 and the Investment Company Act of 1940, this report has been signed below by the following persons on behalf of the registrant and in the capacities and on the dates indicated. | ||||
| By (Signature and Title)* | /s/ Todd E. Heim | |||
| Todd E. Heim, Principal Executive Officer | ||||
| Date | August 1, 2022 | |||
| By (Signature and Title)* | /s/ Jennifer L. Leamer | |||
| Jennifer L. Leamer, Treasurer and Principal Financial Officer | ||||
| Date | August 1, 2022 | |||
* Print the name and title of each signing officer under his or her signature.