UNITED STATES
SECURITIES AND EXCHANGE COMMISSION
Washington, D.C. 20549
FORM N-CSR
CERTIFIED SHAREHOLDER REPORT OF REGISTERED
MANAGEMENT INVESTMENT COMPANIES
| Investment Company Act file number | 811-22680 |
| Ultimus Managers Trust |
| (Exact name of registrant as specified in charter) |
| 225 Pictoria Drive, Suite 450 Cincinnati, Ohio | 45246 |
| (Address of principal executive offices) | (Zip code) |
Karen Jacoppo-Wood
| Ultimus Fund Solutions, LLC 225 Pictoria Drive, Suite 450 Cincinnati, Ohio 45246_ |
| (Name and address of agent for service) |
| Registrant's telephone number, including area code: | (513) 587-3400 |
| Date of fiscal year end: | May 31 | |
| Date of reporting period: | May 31, 2023 |
Form N-CSR is to be used by management investment companies to file reports with the Commission not later than 10 days after the transmission to stockholders of any report that is required to be transmitted to stockholders under Rule 30e-1 under the Investment Company Act of 1940 (17 CFR 270.30e-1). The Commission may use the information provided on Form N-CSR in its regulatory, disclosure review, inspection, and policymaking roles.
A registrant is required to disclose the information specified by Form N-CSR, and the Commission will make this information public. A registrant is not required to respond to the collection of information contained in Form N-CSR unless the Form displays a currently valid Office of Management and Budget ("OMB") control number. Please direct comments concerning the accuracy of the information collection burden estimate and any suggestions for reducing the burden to Secretary, Securities and Exchange Commission, 450 Fifth Street, NW, Washington, DC 20549-0609. The OMB has reviewed this collection of information under the clearance requirements of 44 U.S.C. § 3507.
| Item 1. | Reports to Stockholders. |
| (a) |
 |
| Institutional Class (ADLVX) |
| ANNUAL REPORT |
| May 31, 2023 |
| Managed by |
| Adler Asset Management, LLC |
| For information or assistance in opening an account, |
| please call toll-free 1-800-408-4682. |
| ADLER VALUE FUND | |
| LETTER TO SHAREHOLDERS (Unaudited) | June 16, 2023 |
Dear Shareholder,
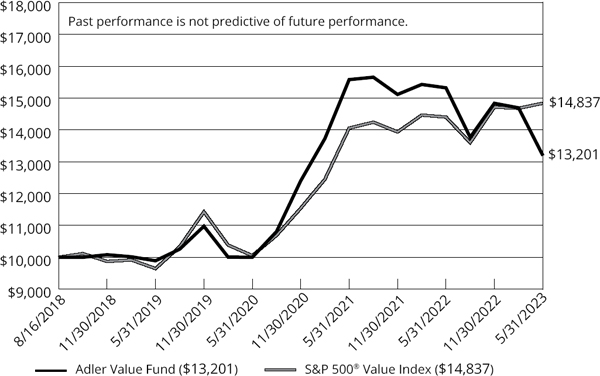
In mid-August 2018, the Adler Value Fund (the “Fund”) commenced operations. Adler Asset Management, LLC (the “Adviser”) is the Fund’s investment adviser. For the annual period ended May 31, 2023, the Fund’s total return was -13.84%. During the same period, the total return of the S&P 500 Value Index was 3.02%.
Investment Approach
In selecting investments for the Fund, the Adviser uses a focused-value strategy to invest in companies that, in its opinion, appear to be undervalued by the equity market but where catalysts exist, in the opinion of the Adviser, to close these valuation gaps. The Adviser seeks to exploit perceived market misjudgments in pricing by buying equity securities that appear to be undervalued because of a temporary aversion to these out-of-favor issuers.
The Adviser’s contrarian approach, buying what it believes are fundamentally sound companies that are out-of-favor with the market, is industry, sector and market capitalization agnostic, and typically will result in a portfolio containing the securities of fewer than thirty issuers.
Performance for the Annual Period
The Adviser attributes the Fund’s underperformance for the annual period to the impact of recession fears on of some of the Fund’s holdings. Value stocks can and do operate in industries impacted by a potential economic slowdown with the equity market re-pricing certain Fund holdings.
Portfolio Developments
Valvoline (VVV) operates and franchises nearly 1,800 service center locations delivering oil changes and related services. VVV completed the sale of its Global Products Business to Saudi Aramco. The Adviser had previously identified this transaction as a key catalyst for VVV’s re-valuation.
iHeartMedia (IHRT) is an audio media company operating in broadcast and digital streaming radio as well as podcasting and audio tech. The Fund exited its position in IHRT as softness in advertising coupled with a slowdown in growth in IHRT’s podcasting business prevented the company from realizing the catalysts identified by the Adviser.
The Adviser continues to assess companies that fit the Fund’s investment approach.
David Adler
Adler Asset Management, LLC
1
Past performance is not predictive of future performance. Investment results and principal value will fluctuate so that shares, when redeemed, may be worth more or less than their original cost. Current performance may be higher or lower than the performance data quoted. Performance data current to the most recent month-end are available by calling 1-800-408-4682.
An investor should consider the investment objectives, risks, charges and expenses of the Fund carefully before investing. The Fund’s prospectus contains this and other important information. To obtain a copy of the Fund’s prospectus please visit the Fund’s website at www.adlervaluefund.com or call 1-800-408-4682 and a copy will be sent to you free of charge. Please read the prospectus carefully before you invest. The Fund is distributed by Ultimus Fund Distributors, LLC.
The Letter to Shareholders seeks to describe some of the Adviser’s current opinions and views of the financial markets. Although the Adviser believes it has a reasonable basis for any opinions or views expressed, actual results may differ, sometimes significantly so, from those expected or expressed. The securities held by the Fund that are discussed in the Letter to Shareholders were held during the period covered by this Report. They do not comprise the entire investment portfolio of the Fund, may be sold at any time, and may no longer be held by the Fund. For a complete list of securities held by the Fund as of May 31, 2023, please see the Schedule of Investments section of the annual report. The opinions of the Fund’s adviser with respect to those securities may change at any time.
Statements in the Letter to Shareholders that reflect projections or expectations for future financial or economic performance of the Fund and the market in general and statements of the Fund’s plans and objectives for future operations are forward-looking statements. No assurance can be given that actual results or events will not differ materially from those projected, estimated, assumed, or anticipated in any such forward-looking statements. Important factors that could result in such differences, in addition to factors noted with such forward-looking statements, include, without limitation, general economic conditions, such as inflation, recession, and interest rates. Past performance is not a guarantee of future results.
2
| ADLER VALUE FUND |
| PERFORMANCE INFORMATION |
| May 31, 2023 (Unaudited) |
Comparison of the Change in Value of a $10,000 Investment in Adler
Value Fund - Institutional Class vs. the S&P 500® Value Index
| Average Annual Total Returns (for the periods ended May 31, 2023) | |||||||
| Since | |||||||
| 1 Year | 3 Year | Inception(b) | |||||
| Adler Value Fund - Institutional Class (a) | -13.84% | 9.70% | 5.97% | ||||
| S&P 500® Value Index (c) | 3.02% | 13.86% | 8.59% | ||||
| (a) | The total returns shown do not reflect the deduction of taxes a shareholder would pay on Fund distributions, if any, or the redemption of Fund shares. |
| (b) | The Fund commenced operations on August 16, 2018. |
| (c) | The S&P 500® Index is a market capitalization weighted index of 500 large companies that is widely used as a barometer of U.S. stock market performance. Both indices are unmanaged and shown for illustration purposes only. An investor cannot invest in an index and their returns are not indicative of the performance of any specific investment. |
3
| ADLER VALUE FUND |
| PORTFOLIO INFORMATION |
| May 31, 2023 (Unaudited) |
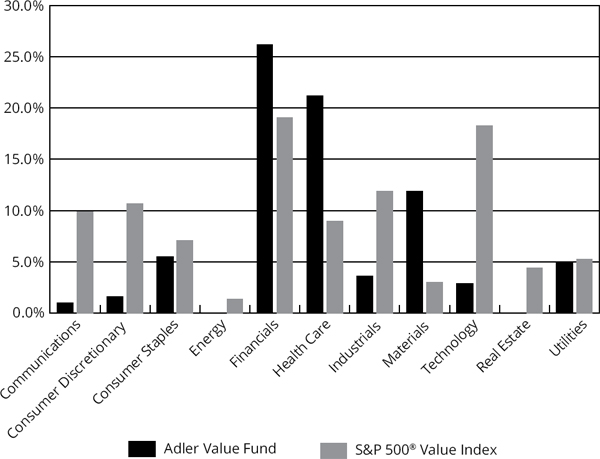
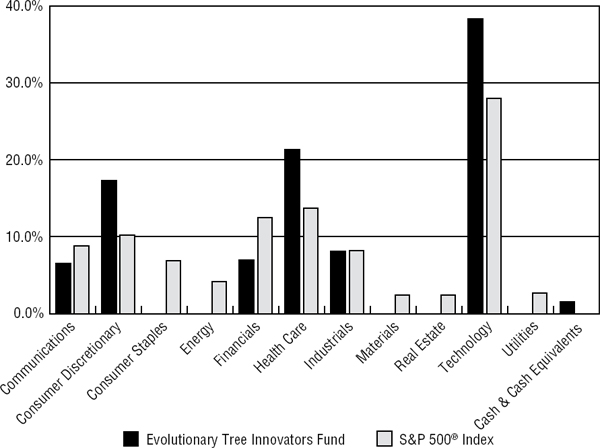
Sector Diversification
(% of Net Assets)
| Top 10 Equity Holdings | ||
| % of Net | ||
| Security Description | Assets | |
| O-I Glass, Inc. | 6.2% | |
| Bristol-Myers Squibb Company | 6.2% | |
| PG&E Corporation | 4.9% | |
| Aflac, Inc. | 4.7% | |
| Pfizer, Inc | 4.6% | |
| Spectrum Brands Holdings, Inc. | 4.4% | |
| Cigna Group (The) | 4.1% | |
| Jackson Financial, Inc. - Class A | 4.0% | |
| Charles Schwab Corporation (The) | 3.9% | |
| Berry Global Group, Inc. | 3.6% | |
4
| ADLER VALUE FUND |
| SCHEDULE OF INVESTMENTS |
| May 31, 2023 |
| COMMON STOCKS — 75.5% | Shares | Value | ||||||
| Communications — 1.0% | ||||||||
| Cable & Satellite — 1.0% | ||||||||
| Altice USA, Inc. - Class A (a) | 4,400 | $ | 11,264 | |||||
| Comcast Corporation - Class A | 600 | 23,610 | ||||||
| 34,874 | ||||||||
| Consumer Discretionary — 1.6% | ||||||||
| Leisure Facilities & Services — 1.6% | ||||||||
| Domino’s Pizza, Inc. | 200 | 57,970 | ||||||
| Consumer Staples — 5.5% | ||||||||
| Beverages — 1.1% | ||||||||
| Diageo plc - ADR | 250 | 42,005 | ||||||
| Household Products — 4.4% | ||||||||
| Spectrum Brands Holdings, Inc. | 2,200 | 158,862 | ||||||
| Financials — 22.9% | ||||||||
| Banking — 4.3% | ||||||||
| Citigroup, Inc. | 2,000 | 88,640 | ||||||
| Citizens Financial Group, Inc. | 2,700 | 69,606 | ||||||
| 158,246 | ||||||||
| Broker-Dealers — 6.3% | ||||||||
| Charles Schwab Corporation (The) | 2,700 | 142,263 | ||||||
| XP, Inc. - Class A (a) | 5,015 | 88,515 | ||||||
| 230,778 | ||||||||
| Insurance — 12.3% | ||||||||
| Aflac, Inc. | 2,700 | 173,367 | ||||||
| Equitable Holdings, Inc. | 5,200 | 127,608 | ||||||
| Jackson Financial, Inc. - Class A | 5,300 | 146,810 | ||||||
| 447,785 | ||||||||
| Health Care — 21.2% | ||||||||
| Biotech & Pharma — 17.1% | ||||||||
| Bayer AG - ADR | 9,100 | 127,218 | ||||||
| Bristol-Myers Squibb Company | 3,500 | 225,540 | ||||||
| Pfizer, Inc. | 4,400 | 167,288 | ||||||
| Viatris, Inc. | 11,435 | 104,630 | ||||||
| 624,676 | ||||||||
| Health Care Facilities & Services — 4.1% | ||||||||
| Cigna Group (The) | 600 | 148,446 | ||||||
5
| ADLER VALUE FUND |
| SCHEDULE OF INVESTMENTS (Continued) |
| COMMON STOCKS — 75.5% (Continued) | Shares | Value | ||||||
| Industrials — 3.6% | ||||||||
| Industrial Support Services — 3.6% | ||||||||
| Grainger (W.W.), Inc. | 200 | $ | 129,804 | |||||
| Materials — 11.9% | ||||||||
| Chemicals — 2.1% | ||||||||
| Valvoline, Inc. | 2,000 | 77,000 | ||||||
| Containers & Packaging — 9.8% | ||||||||
| Berry Global Group, Inc. | 2,300 | 131,583 | ||||||
| O-I Glass, Inc. (a) | 10,900 | 225,848 | ||||||
| 357,431 | ||||||||
| Technology — 2.9% | ||||||||
| Technology & Electronics — 2.9% | ||||||||
| Corning, Inc. | 3,500 | 107,835 | ||||||
| Utilities — 4.9% | ||||||||
| Electric Utilities — 4.9% | ||||||||
| PG&E Corporation (a) | 10,600 | 179,564 | ||||||
| Total Common Stocks (Cost $2,467,900) | $ | 2,755,276 | ||||||
6
| ADLER VALUE FUND |
| SCHEDULE OF INVESTMENTS (Continued) |
| PREFERRED STOCKS — 3.3% | Shares | Value | ||||||
| Financials — 3.3% | ||||||||
| Banking — 2.6% | ||||||||
| Itau Unibanco Holding S.A. - ADR | 18,300 | $ | 94,062 | |||||
| Insurance — 0.7% | ||||||||
| Jackson Financial, Inc. - Series A, 8.00%, 03/30/28 | 1,100 | 26,697 | ||||||
| Total Preferred Stocks (Cost $112,927) | $ | 120,759 | ||||||
| PURCHASED OPTION | Notional | |||||||||||||||
| CONTRACTS — 1.1% | Strike Price | Contracts* | Value | Value | ||||||||||||
| Call Option Contracts — 1.1% | ||||||||||||||||
| Altice USA, Inc. - Class A, 01/19/24 | $ | 5.00 | 10 | $ | 2,560 | $ | 225 | |||||||||
| Bristol-Myers Squibb Company, 06/16/23 | 72.50 | 10 | 64,440 | 20 | ||||||||||||
| Bristol-Myers Squibb Company, 09/15/23 | 67.50 | 10 | 64,440 | 1,630 | ||||||||||||
| Charles Schwab Corporation (The), 09/15/23 | 65.00 | 10 | 52,690 | 1,050 | ||||||||||||
| Charles Schwab Corporation (The), 01/19/24 | 60.00 | 5 | 26,345 | 2,175 | ||||||||||||
| Cigna Group (The), 07/21/23 | 300.00 | 5 | 123,705 | 250 | ||||||||||||
| Citizens Financial Group, Inc., 01/19/24 | 25.00 | 5 | 12,890 | 2,100 | ||||||||||||
| Citizens Financial Group, Inc., 01/19/24 | 32.50 | 10 | 25,780 | 1,275 | ||||||||||||
| Citizens Financial Group, Inc., 01/19/24 | 35.00 | 10 | 25,780 | 750 | ||||||||||||
| Equitable Holdings, Inc., 09/15/23 | 25.00 | 21 | 51,534 | 3,360 | ||||||||||||
| Equitable Holdings, Inc., 09/15/23 | 30.00 | 10 | 24,540 | 350 | ||||||||||||
| Jackson Financial, Inc. - Class A, 01/19/24 | 30.00 | 10 | 27,700 | 3,300 | ||||||||||||
| O-I Glass, Inc., 08/18/23 | 21.00 | 55 | 113,960 | 8,937 | ||||||||||||
| Pfizer, Inc., 09/15/23 | 45.00 | 10 | 38,020 | 240 | ||||||||||||
| PG&E Corporation, 01/19/24 | 17.00 | 10 | 16,940 | 1,685 | ||||||||||||
| Viatris, Inc., 01/19/24 | 10.00 | 10 | 9,150 | 625 | ||||||||||||
| Viatris, Inc., 01/19/24 | 12.00 | 30 | 27,450 | 600 | ||||||||||||
| XP, Inc. - Class A, 08/18/23 | 14.00 | 10 | 17,650 | 4,250 | ||||||||||||
| XP, Inc. - Class A, 01/19/24 | 13.00 | 10 | 17,650 | 6,100 | ||||||||||||
| Total Purchased Option Contracts (Cost $75,640) | $ | 743,224 | $ | 38,922 | ||||||||||||
7
| ADLER VALUE FUND |
| SCHEDULE OF INVESTMENTS (Continued) |
| MONEY MARKET FUNDS — 19.7% | Shares | Value | ||||||
| Federated Hermes Treasury Obligations Fund - Service Shares, 4.70% (b) (Cost $720,182) | 720,182 | $ | 720,182 | |||||
| Investments at Value — 99.6% (Cost $3,376,649) | $ | 3,635,139 | ||||||
| Other Assets in Excess of Liabilities — 0.4% | 15,844 | |||||||
| Net Assets — 100.0% | $ | 3,650,983 | ||||||
| (a) | Non-income producing security. |
| (b) | The rate shown is the 7-day effective yield as of May 31, 2023. |
| * | Each option contract has a multiplier of 100 shares. |
ADR - American Depository Receipt
AG - Aktiengesellschaft
plc - Public Limited Company
S.A. - Société anonyme
See accompanying notes to financial statements.
8
| ADLER VALUE FUND |
| STATEMENT OF ASSETS AND LIABILITIES |
| May 31, 2023 |
| ASSETS | ||||
| Investments in securities: | ||||
| At cost | $ | 3,376,649 | ||
| At value (Note 2) | $ | 3,635,139 | ||
| Receivable for capital shares sold | 500 | |||
| Receivable from Adviser (Note 4) | 14,335 | |||
| Dividends receivable | 14,565 | |||
| Other assets | 2,796 | |||
| Total assets | 3,667,335 | |||
| LIABILITIES | ||||
| Payable for investment securities purchased | 3,828 | |||
| Payable to administrator (Note 4) | 7,030 | |||
| Other accrued expenses | 5,494 | |||
| Total liabilities | 16,352 | |||
| NET ASSETS | $ | 3,650,983 | ||
| NET ASSETS CONSIST OF: | ||||
| Paid-in capital | $ | 3,735,512 | ||
| Accumulated deficit | (84,529 | ) | ||
| NET ASSETS | $ | 3,650,983 | ||
| PRICING OF INSTITUTIONAL SHARES (Note 2) | ||||
| Net assets applicable to Institutional Shares | $ | 3,650,983 | ||
| Shares of Institutional Shares outstanding (no par value, unlimited number of shares authorized) | 163,599 | |||
| Net asset value, offering and redemption price per share (Note 2) | $ | 22.32 |
See accompanying notes to financial statements.
9
| ADLER VALUE FUND |
| STATEMENT OF OPERATIONS |
| For the Year Ended May 31, 2023 |
| INVESTMENT INCOME | ||||
| Dividends | $ | 100,662 | ||
| Foreign withholding tax on dividends | (3,122 | ) | ||
| Total investment income | 97,540 | |||
| EXPENSES | ||||
| Management fees (Note 4) | 39,035 | |||
| Fund accounting fees (Note 4) | 30,393 | |||
| Administration fees (Note 4) | 30,000 | |||
| Legal fees | 23,522 | |||
| Trustees’ fees and expenses (Note 4) | 19,567 | |||
| Audit and tax services fees | 16,311 | |||
| Registration and filing fees | 12,882 | |||
| Transfer agent fees (Note 4) | 12,000 | |||
| Compliance fees (Note 4) | 12,000 | |||
| Custodian and bank service fees | 9,538 | |||
| Shareholder reporting expenses | 8,568 | |||
| Insurance expense | 3,177 | |||
| Postage and supplies | 3,078 | |||
| Other expenses | 9,437 | |||
| Total expenses | 229,508 | |||
| Less fee reductions and expense reimbursements by the Adviser (Note 4) | (180,714 | ) | ||
| Net expenses | 48,794 | |||
| NET INVESTMENT INCOME | 48,746 | |||
| REALIZED AND UNREALIZED LOSSES ON INVESTMENTS | ||||
| Net realized losses on investments transactions | (372,214 | ) | ||
| Net change in unrealized appreciation (depreciation) on investments | (250,698 | ) | ||
| NET REALIZED AND UNREALIZED LOSSES ON INVESTMENTS | (622,912 | ) | ||
| NET DECREASE IN NET ASSETS RESULTING FROM OPERATIONS | $ | (574,166 | ) |
See accompanying notes to financial statements.
10
| ADLER VALUE FUND |
| STATEMENTS OF CHANGES IN NET ASSETS |
| Year Ended | Year Ended | |||||||
| May 31, | May 31, | |||||||
| 2023 | 2022 | |||||||
| FROM OPERATIONS | ||||||||
| Net investment income | $ | 48,746 | $ | 132,311 | ||||
| Net realized gains (losses) from investment transactions | (372,214 | ) | 433,006 | |||||
| Net change in unrealized appreciation (depreciation) on investments | (250,698 | ) | (639,008 | ) | ||||
| Net decrease in net assets resulting from operations | (574,166 | ) | (73,691 | ) | ||||
| DISTRIBUTIONS TO SHAREHOLDERS (NOTE 2) | ||||||||
| Institutional Shares | (257,382 | ) | (326,422 | ) | ||||
| FROM CAPITAL SHARE TRANSACTIONS | ||||||||
| Institutional Shares | ||||||||
| Proceeds from shares sold | 216,250 | 556,469 | ||||||
| Net asset value of shares issued in reinvestment of distributions to shareholders | 234,404 | 326,422 | ||||||
| Payments for shares redeemed | (170,487 | ) | (75,104 | ) | ||||
| Net increase in Institutional Shares net assets from capital share transactions | 280,167 | 807,787 | ||||||
| TOTAL INCREASE (DECREASE) IN NET ASSETS | (551,381 | ) | 407,674 | |||||
| NET ASSETS | ||||||||
| Beginning of year | 4,202,364 | 3,794,690 | ||||||
| End of year | $ | 3,650,983 | $ | 4,202,364 | ||||
| CAPITAL SHARES ACTIVITY | ||||||||
| Institutional Shares | ||||||||
| Shares sold | 8,738 | 18,654 | ||||||
| Shares reinvested | 9,775 | 11,295 | ||||||
| Shares redeemed | (6,643 | ) | (2,634 | ) | ||||
| Net increase in shares outstanding | 11,870 | 27,315 | ||||||
| Shares outstanding, beginning of year | 151,729 | 124,414 | ||||||
| Shares outstanding, end of year | 163,599 | 151,729 | ||||||
See accompanying notes to financial statements.
11
| ADLER VALUE FUND |
| INSTITUTIONAL SHARES |
| FINANCIAL HIGHLIGHTS |
Per Share Data for a Share Outstanding Throughout Each Period
| Year Ended | Year Ended | Year Ended | Period Ended | Period Ended | ||||||||||||||||
| May 31, | May 31, | May 31, | May 31, | July 31, | ||||||||||||||||
| 2023 | 2022 | 2021 | 2020(a) | 2019(b) | ||||||||||||||||
| Net asset value at beginning of period | $ | 27.70 | $ | 30.50 | $ | 19.82 | $ | 20.41 | $ | 20.00 | ||||||||||
| Income (loss) from investment operations: | ||||||||||||||||||||
| Net investment income | 0.31 | (c) | 0.95 | (c)(d) | 0.07 | (c) | 0.49 | (e) | 0.15 | |||||||||||
| Net realized and unrealized gains (losses) on investments | (4.03 | ) | (1.35 | ) | 10.92 | (0.88 | ) | 0.26 | ||||||||||||
| Total from investment operations | (3.72 | ) | (0.40 | ) | 10.99 | (0.39 | ) | 0.41 | ||||||||||||
| Less distributions from: | ||||||||||||||||||||
| Net investment income | — | (2.30 | ) | (0.31 | ) | (0.20 | ) | — | ||||||||||||
| Net realized gains | (1.66 | ) | (0.10 | ) | — | — | — | |||||||||||||
| Total distributions | (1.66 | ) | (2.40 | ) | (0.31 | ) | (0.20 | ) | — | |||||||||||
| Net asset value at end of period | $ | 22.32 | $ | 27.70 | $ | 30.50 | $ | 19.82 | $ | 20.41 | ||||||||||
| Total return (f) | (13.84 | %) | (1.64 | %) | 55.78 | % | (2.01 | %) (g) | 2.05 | % (g) | ||||||||||
| Net assets at end of period (000’s) | $ | 3,651 | $ | 4,202 | $ | 3,795 | $ | 1,458 | $ | 1,447 | ||||||||||
| Ratios/supplementary data: | ||||||||||||||||||||
| Ratio of total expenses to average net assets | 5.88 | % | 5.65 | % | 8.42 | % | 13.01 | % (h) | 11.82 | % (h) | ||||||||||
| Ratio of net expenses to average net assets (i) | 1.25 | % | 1.25 | % | 1.25 | % | 1.25 | % (h) | 1.26 | % (h)(j) | ||||||||||
| Ratio of net investment income to average net assets (i) | 1.25 | % | 3.23 | % (d) | 0.27 | % | 2.93 | % (e)(h) | 0.81 | % (h) | ||||||||||
| Portfolio turnover rate | 23 | % | 45 | % | 0 | % (k) | 4 | % (g) | 0 | % | ||||||||||
| (a) | Fund changed fiscal year to May 31. |
| (b) | Represents the period from the commencement of operations (August 16, 2018) through July 31, 2019. |
| (c) | Per share net investment income has been determined on the basis of average number of shares outstanding during the period. |
| (d) | During the year ended May 31, 2022, the Fund received a large special dividend distribution from Meredith Corporation. Had the Fund not received this special dividend distribution, the net investment income per share and ratio of net investment income to average net assets would have been $0.82 and 2.79% lower, respectively. |
| (e) | During the period ended May 31, 2020, the Fund received a large special dividend distribution from NortonLifeLock, Inc. Had the Fund not received this special dividend distribution, the net investment income per share and ratio of net investment income to average net assets would have been $0.33 and 1.97%(h) lower, respectively. |
| (f) | Total return is a measure of the change in value of an investment in the Fund over the periods covered. The returns shown do not reflect the deduction of taxes a shareholder would pay on Fund distributions, if any, or the redemption of Fund shares. The total returns would be lower if the Adviser had not reduced fees and reimbursed expenses (Note 4). |
| (g) | Not annualized. |
| (h) | Annualized. |
| (i) | Ratio was determined after management fee reductions and expense reimbursements (Note 4). |
| (j) | Includes federal excise taxes of 0.01% of average net assets with respect to the period ended July 31, 2019. |
| (k) | Percentage rounds to less than 1%. |
See accompanying notes to financial statements.
12
| ADLER VALUE FUND |
| NOTES TO FINANCIAL STATEMENTS |
| May 31, 2023 |
1. Organization
Adler Value Fund (the “Fund”) is a non-diversified series of Ultimus Managers Trust (the “Trust”), an open-end investment company established as an Ohio business trust under a Declaration of Trust dated February 28, 2012. Other series of the Trust are not incorporated in this report.
The investment objective of the Fund is to seek to achieve long-term growth of capital.
The Fund currently offers one class of shares: Institutional Class shares (sold without any sales loads or distribution fees and subject to a $2,500 initial investment for all accounts, except for an IRA for which the minimum initial investment is $1,000).
2. Significant Accounting Policies
The Fund follows accounting and reporting guidance under Financial Accounting Standards Board Accounting Standards Codification Topic 946, “Financial Services – Investment Companies.” The following is a summary of the Fund’s significant accounting policies used in preparation of its financial statements. These policies are in conformity with accounting principles generally accepted in the United States of America (“GAAP”).
Regulatory update – In October 2020, the Securities and Exchange Commission (the “SEC”) adopted new regulations governing the use of derivatives by registered investment companies (“Rule 18f-4”). The Fund was required to comply with Rule 18f-4 by August 19, 2022. Rule 18f-4 imposes limits on the amount of derivatives a fund can enter into, eliminates the asset segregation framework previously used by funds to comply with Section 18 of the Investment Company Act of 1940, as amended, (the “1940 Act”), tracks derivatives as senior securities and requires funds whose use of derivatives is more than a limited specified exposure amount to establish and maintain a comprehensive derivatives risk management program and appoint a derivatives risk manager. The Fund adopted and is currently complying with Rule 18f-4.
Securities valuation – The Fund values its portfolio securities at market value as of the close of regular trading on the New York Stock Exchange (the “NYSE”) (normally 4:00 p.m. Eastern Time) on each day the NYSE is open for business. The Fund generally values its listed securities on the basis of the security’s last sale price on the security’s primary exchange, if available, otherwise at the exchange’s most recently quoted mean price. NASDAQ-listed securities are valued at the NASDAQ Official Closing Price. Option contracts are valued at the closing price on the exchanges on which they are primarily traded; if no closing price is available at the time of valuation, the option will be valued at the mean of the closing bid and ask prices for that day. Investments representing shares of money market funds and other open-end investment companies not traded on an exchange are valued at their net asset value (“NAV”) as reported by such companies. When using a quoted price and when the market is considered active, the security will be classified as Level 1 within the fair value hierarchy (see next page). In the event that market quotations are not readily available or are considered unreliable due to market or other events, the Fund values its securities and other assets at fair value in accordance with
13
| ADLER VALUE FUND |
| NOTES TO FINANCIAL STATEMENTS (Continued) |
procedures established by and under the general supervision of the Board of Trustees of the Trust (the “Board”). Under these procedures, the securities will be classified as Level 2 or 3 within the fair value hierarchy, depending on the inputs used. Unavailable or unreliable market quotes may be due to the following factors: a substantial bid-ask spread; infrequent sales resulting in stale prices; insufficient trading volume; small trade sizes; a temporary lapse in any reliable pricing source; and actions of the securities or futures markets, such as the suspension or limitation of trading. As a result, the prices of securities used to calculate the Fund’s NAV may differ from quoted or published prices for the same securities.
GAAP establishes a single authoritative definition of fair value, sets out a framework for measuring fair value, and requires additional disclosures about fair value measurements.
Various inputs are used in determining the value of the Fund’s investments. These inputs are summarized in the three broad levels listed below:
| ● | Level 1 – quoted prices in active markets for identical securities |
| ● | Level 2 – other significant observable inputs |
| ● | Level 3 – significant unobservable inputs |
The inputs or methods used for valuing securities are not necessarily an indication of the risks associated with investing in those securities. The inputs used to measure fair value may fall into different levels of the fair value hierarchy. In such cases, for disclosure purposes, the level in the fair value hierarchy within which the fair value measurement falls in its entirety is determined based on the lowest level input that is significant to the fair value measurement.
The following is a summary of the Fund’s investments based on the inputs used to value the investments as of May 31, 2023:
| Level 1 | Level 2 | Level 3 | Total | |||||||||||||
| Common Stocks | $ | 2,755,276 | $ | — | $ | — | $ | 2,755,276 | ||||||||
| Preferred Stocks | 120,759 | — | — | 120,759 | ||||||||||||
| Purchased Option Contracts | 11,115 | 27,807 | — | 38,922 | ||||||||||||
| Money Market Funds | 720,182 | — | — | 720,182 | ||||||||||||
| Total | $ | 3,607,332 | $ | 27,807 | $ | — | $ | 3,635,139 | ||||||||
Refer to the Fund’s Schedule of Investments for a listing of the common and preferred stocks by sector and industry type. The Fund did not have any assets or liabilities that were measured at fair value on a recurring basis using significant unobservable inputs (Level 3) as of or during the year ended May 31, 2023.
Share valuation – The NAV per share of each class of the Fund is calculated daily by dividing the total value of the assets attributable to that class, less liabilities attributable to that class, by the number of shares outstanding of that class. The offering price and redemption price per share of each class of the Fund is equal to the NAV per share of such class.
14
| ADLER VALUE FUND |
| NOTES TO FINANCIAL STATEMENTS (Continued) |
Investment income – Dividend income is recorded on the ex-dividend date. Non-cash dividends included in dividend income, if any, are recorded at the fair value of the security received. Interest income is accrued as earned. Withholding taxes on foreign dividends, if any, have been recorded in accordance with the Fund’s understanding of the applicable country’s tax rules and rates.
Investment transactions – Investment transactions are accounted for on the trade date. Realized gains and losses on investments sold are determined on a specific identification basis.
Common expenses – Common expenses of the Trust are allocated among the Fund and the other series of the Trust based on the relative net assets of each series, the number of series in the Trust, or the nature of the services performed and the relative applicability to each series.
Distributions to shareholders – Distributions to shareholders arising from net investment income and realized capital gains, if any, are declared and paid annually to shareholders. The amount of distributions from net investment income and net realized capital gains are determined in accordance with federal income tax regulations, which may differ from GAAP. Dividends and distributions to shareholders are recorded on the ex-dividend date.
For the years ended May 31, 2023 and 2022, the tax character of distributions paid to shareholders was as follows:
| Years | Ordinary | Long-Term | Total | |||||||||
| Ended | income | Capital Gains | Distributions | |||||||||
| 5/31/2023 | $ | — | $ | 257,382 | $ | 257,382 | ||||||
| 5/31/2022 | $ | 313,110 | $ | 13,312 | $ | 326,422 | ||||||
Purchased option contracts – The Fund may use option contracts in any manner consistent with its investment objectives and as long as its use is consistent with relevant provisions of the 1940 Act. The Fund may use options for speculative purposes as well as for the purpose of seeking to reduce the overall investment risk that would otherwise be associated with the securities in which the Fund invests. When the Fund purchases a call or put option, an amount equal to the total premium (the premium plus the commission) paid by the Fund is recorded as an asset on the Fund’s Statement of Assets and Liabilities and is subsequently marked-to-market daily. Premiums paid in the purchase of options which expire are treated as realized losses. Premiums paid in the purchase of call options which are exercised increase the cost of the security purchased. Premiums paid in the purchase of put options which are exercised decrease the proceeds used to calculate the realized capital gain or loss on the sale of the security.
Estimates – The preparation of financial statements in conformity with GAAP requires management to make estimates and assumptions that affect the reported amounts of assets and liabilities and disclosure of contingent assets and liabilities as of the date of the financial statements and the reported amounts of increase (decrease) in net assets from operations during the reporting period. Actual results could differ from those estimates.
15
| ADLER VALUE FUND |
| NOTES TO FINANCIAL STATEMENTS (Continued) |
Federal income tax – The Fund has qualified and intends to continue to qualify as a regulated investment company under the Internal Revenue Code of 1986, as amended (the “Code”). Qualification generally will relieve the Fund of liability for federal income taxes to the extent 100% of its net investment income and net realized capital gains are distributed in accordance with the Code.
In order to avoid imposition of the excise tax applicable to regulated investment companies, it is also the Fund’s intention to declare as dividends in each calendar year amounts equal to at least 98% of its net investment income (earned during the calendar year) and 98.2% of its net realized capital gains (earned during the 12 months ended October 31) plus undistributed amounts from prior years.
The following information is computed on a tax basis for each item as of May 31, 2023:
| Tax cost of investments | $ | 3,376,652 | ||
| Gross unrealized appreciation | $ | 556,856 | ||
| Gross unrealized depreciation | (298,369 | ) | ||
| Net unrealized appreciation | 258,487 | |||
| Undistributed ordinary income | 29,198 | |||
| Accumulated capital and other losses | (372,214 | ) | ||
| Accumulated deficit | $ | (84,529 | ) | |
The difference between the federal income tax cost of investments and the financial statement cost of investments is due to certain timing differences in the recognition of capital gains or losses under income tax regulations and GAAP. These “book/tax” differences are temporary in nature and are due to the tax deferral of losses on wash sales.
As of May 31, 2023, the Fund had short-term capital loss carryforwards and long-term capital loss carryforwards (“CLCF”) of $125,193 and $247,021, respectively, for federal income tax purposes. These CLCFs, which do not expire, may be utilized in future years to offset net realized capital gains, if any.
The Fund recognizes the tax benefits or expenses of uncertain tax positions only when the position is “more likely than not” to be sustained assuming examination by tax authorities. Management has reviewed the Fund’s tax positions for all open tax periods (generally, three years) and has concluded that no provision for unrecognized tax benefits or expenses is required in these financial statements. The Fund identifies its major tax jurisdiction as U.S. federal.
The Fund recognizes interest and penalties, if any, related to unrecognized tax benefits as income tax expenses on the Statement of Operations. During the year ended May 31, 2023, the Fund did not incur any interest or penalties.
16
| ADLER VALUE FUND |
| NOTES TO FINANCIAL STATEMENTS (Continued) |
3. Investment Transactions
During the year ended May 31, 2023, cost of purchases and proceeds from sales of investment securities, other than short-term investments, were $794,740 and $702,904, respectively.
4. Transactions with Related Parties
INVESTMENT ADVISORY AGREEMENT
The Fund’s investments are managed by Adler Asset Management, LLC (the “Adviser”) pursuant to the terms of an Investment Advisory Agreement. Under the Investment Advisory Agreement, the Fund pays the Adviser a management fee, computed and accrued daily and paid monthly, at the annual rate of 1.00% of its average daily net assets.
Pursuant to an Expense Limitation Agreement (“ELA”) between the Fund and the Adviser, the Adviser has agreed, until December 1, 2023, to reduce its management fees and reimburse other expenses to limit total annual operating expenses (exclusive of brokerage costs; taxes; interest; borrowing costs such as interest and dividends expenses on securities sold short; costs to organize the Fund; acquired fund fees and expenses; and extraordinary expenses such as litigation and merger or reorganization costs and other expenses not incurred in the ordinary course of the Fund’s business) to an amount not exceeding 1.25% of the Fund’s average daily net assets of the Institutional Class shares. Accordingly, during the year ended May 31, 2023, the Adviser did not collect any of its management fees in the amount of $39,035 and reimbursed other operating expenses totaling $141,679.
Under the terms of the ELA, management fee reductions and expense reimbursements by the Adviser are subject to repayment by the Fund for a period of 36 months after such fees and expenses were incurred, provided that the repayments do not cause the Fund’s total annual operating expenses to exceed the lesser of: (i) the expense limitation then in effect, if any, and (ii) the expense limitation in effect at the time the expenses to be repaid were incurred. As of May 31, 2023, the Adviser may seek recoupment of management fee reductions and expense reimbursements no later than the dates as stated below:
| May 31, 2024 | $ | 179,743 | ||
| May 31, 2025 | 180,253 | |||
| May 31, 2026 | 180,714 | |||
| Total | $ | 540,710 | ||
OTHER SERVICE PROVIDERS
Ultimus Fund Solutions, LLC (“Ultimus”) provides administration, fund accounting, compliance and transfer agency services to the Fund. The Fund pays Ultimus fees in accordance with the agreements for such services. In addition, the Fund pays out-of-pocket expenses including, but not limited to, postage, supplies, and certain costs related to the pricing of the Fund’s portfolio securities.
17
| ADLER VALUE FUND |
| NOTES TO FINANCIAL STATEMENTS (Continued) |
Under the terms of a Distribution Agreement with the Trust, Ultimus Fund Distributors, LLC (the “Distributor”) serves as principal underwriter to the Fund. The Distributor is a wholly-owned subsidiary of Ultimus. The Distributor is compensated by the Adviser (not the Fund) for acting as principal underwriter.
Certain officers and a Trustee of the Trust are also officers of Ultimus and are not paid by the Fund for serving in such capacities.
TRUSTEE COMPENSATION
Effective October 17, 2022, each member of the Board (a “Trustee”) who is not an “interested person” (as defined by the 1940 Act, as amended) of the Trust (“Independent Trustee”) receives a $1,300 annual retainer from the Fund, except for the Board Chairperson who receives a $1,700 annual retainer from the Fund and the Audit Committee Chairperson who receives a $1,500 annual retainer from the Fund, paid in quarterly installments. Each Independent Trustee also receives from the Fund a fee of $550 for each Board meeting attended plus reimbursement for travel and other meeting-related expenses. Prior to October 17, 2022, no additional retainer was specifically designated for the Audit Committee Chairperson.
PRINCIPAL HOLDER OF FUND SHARES
As of May 31, 2023, the following shareholder owned of record 25% or more of the outstanding shares of the Fund:
| NAME OF RECORD OWNER | % Ownership |
| David R. Adler | 61% |
A beneficial owner of 25% or more of the Fund’s outstanding shares may be considered a controlling person. That shareholder’s vote could have a more significant effect on matters presented at a shareholders’ meeting.
5. Derivative Transactions
The location on the Statement of Assets and Liabilities of the derivative positions of the Fund are as follows:
| Average | ||||||||||||||||
| Monthly | ||||||||||||||||
| Fair Value | Notional Value | |||||||||||||||
| Type of | Asset | Liability | Year Ended | |||||||||||||
| Derivative | Risk | Location | Derivatives | Derivatives | May 31, 2023* | |||||||||||
| Equity call options purchased | Equity | Investments in securities at value | $ | 38,922 | $ | — | $ | 1,180,147 | ||||||||
| * | The average monthly notional value generally represents the Fund’s derivative activity throughout the year. |
18
| ADLER VALUE FUND |
| NOTES TO FINANCIAL STATEMENTS (Continued) |
Realized and unrealized gains and losses associated with transactions in derivative instruments for the Fund during the year ended May 31, 2023 are recorded in the following locations on the Statement of Operations:
| Type of Derivative | Risk | Location | Realized Losses | Location | Change in Unrealized Appreciation (Depreciation) | |||||||||
| Equity call options purchased | Equity | Net realized losses on investment transactions | $ | (190,488 | ) | Net change in unrealized appreciation (depreciation) on investments | $ | (53,174 | ) | |||||
6. Sector Risk
If the Fund has significant investments in the securities of issuers in industries within a particular sector, any development affecting that sector will have a greater impact on the value of the net assets of the Fund than would be the case if the Fund did not have significant investments in that sector. In addition, this may increase the risk of loss of an investment in the Fund and increase the volatility of the Fund’s net asset value per share. From time to time, a particular set of circumstances may affect this sector or companies within the sector. For instance, economic or market factors, regulation or deregulation, or other developments may negatively impact all companies in a particular sector and therefore the value of the Fund’s portfolio will be adversely affected. As of May 31, 2023, the Fund had 26.2% of the value of its net assets invested in stocks within the Financials sector.
7. Contingencies and Commitments
The Fund indemnifies the Trust’s officers and Trustees for certain liabilities that might arise from their performance of their duties to the Fund. Additionally, in the normal course of business, the Fund enters into contracts that contain a variety of representations, warranties, and general indemnifications. The Fund’s maximum exposure under these arrangements is unknown, as this would involve future claims that may be made against the Fund that have not yet occurred. However, based on experience, the Fund expects the risk of loss to be remote.
8. Subsequent Events
The Fund is required to recognize in the financial statements the effects of all subsequent events that provide additional evidence about conditions that existed as of the date of the Statement of Assets and Liabilities. For non-recognized subsequent events that must be disclosed to keep the financial statements from being misleading, the Fund is required to disclose the nature of the event as well as an estimate of its financial effect, or a statement that such an estimate cannot be made. Management has evaluated subsequent events through the issuance of these financial statements and has noted no such events.
19
| ADLER VALUE FUND |
| REPORT OF INDEPENDENT REGISTERED |
| PUBLIC ACCOUNTING FIRM |
To the Shareholders of Adler Value Fund and
Board of Trustees of Ultimus Managers Trust
Opinion on the Financial Statements
We have audited the accompanying statement of assets and liabilities, including the schedule of investments, of Adler Value Fund (the “Fund”), a series of Ultimus Managers Trust, as of May 31, 2023, the related statements of operations and changes in net assets for the year then ended, the related notes, and the financial highlights the year then ended (collectively referred to as the “financial statements”). In our opinion, the financial statements present fairly, in all material respects, the financial position of the Fund as of May 31, 2023, the results of its operations, the changes in net assets, and the financial highlights for the year then ended, in conformity with accounting principles generally accepted in the United States of America.
The Fund’s financial statements and financial highlights for the years and periods ended May 31, 2022, and prior, were audited by another auditor whose report dated July 20, 2022, expressed an unqualified opinion on those financial statements and financial highlights.
Basis for Opinion
These financial statements are the responsibility of the Fund’s management. Our responsibility is to express an opinion on the Fund’s financial statements based on our audit. We are a public accounting firm registered with the Public Company Accounting Oversight Board (United States) (“PCAOB”) and are required to be independent with respect to the Fund in accordance with the U.S. federal securities laws and the applicable rules and regulations of the Securities and Exchange Commission and the PCAOB.
We conducted our audit in accordance with the standards of the PCAOB. Those standards require that we plan and perform the audit to obtain reasonable assurance about whether the financial statements are free of material misstatement whether due to error or fraud.
Our audit included performing procedures to assess the risks of material misstatement of the financial statements, whether due to error or fraud, and performing procedures that respond to those risks. Such procedures included examining, on a test basis, evidence regarding the amounts and disclosures in the financial statements. Our procedures included confirmation of securities owned as of May 31, 2023, by correspondence with the custodian and brokers. Our
20
| ADLER VALUE FUND |
| REPORT OF INDEPENDENT REGISTERED |
| PUBLIC ACCOUNTING FIRM (Continued) |
audit also included evaluating the accounting principles used and significant estimates made by management, as well as evaluating the overall presentation of the financial statements. We believe that our audit provides a reasonable basis for our opinion.
We have served as the Fund’s auditor since 2023.

COHEN & COMPANY, LTD.
Philadelphia, Pennsylvania
July 27, 2023
21
| ADLER VALUE FUND |
| ABOUT YOUR FUND’S EXPENSES (Unaudited) |
We believe it is important for you to understand the impact of costs on your investment. As a shareholder of the Fund, you incur ongoing costs, including management fees and other operating expenses. The following examples are intended to help you understand your ongoing costs (in dollars) of investing in the Fund and to compare these costs with the ongoing costs of investing in other mutual funds.
A mutual fund’s ongoing costs are expressed as a percentage of its average net assets. This figure is known as the expense ratio. The expenses in the table below are based on an investment of $1,000 made at the beginning of the most recent period (December 1, 2022) and held until the end of the period (May 31, 2023).
The table below illustrates the Fund’s ongoing costs in two ways:
Actual fund return – This section helps you to estimate the actual expenses that you paid over the period. The “Ending Account Value” shown is derived from the Fund’s actual return, and the fourth column shows the dollar amount of operating expenses that would have been paid by an investor who started with $1,000 in the Fund. You may use the information here, together with the amount you invested, to estimate the expenses that you paid over the period.
To do so, simply divide your account value by $1,000 (for example, an $8,600 account value divided by $1,000 = 8.6), then multiply the result by the number given for the Fund under the heading “Expenses Paid During Period.”
Hypothetical 5% return – This section is intended to help you compare the Fund’s ongoing costs with those of other mutual funds. It assumes that the Fund had an annual return of 5% before expenses during the period shown, but that the expense ratio is unchanged. In this case, because the return used is not the Fund’s actual return, the results do not apply to your investment. The example is useful in making comparisons because the SEC requires all mutual funds to calculate expenses based on a 5% return. You can assess the Fund’s ongoing costs by comparing this hypothetical example with the hypothetical examples that appear in shareholder reports of other funds.
Note that expenses shown in the table are meant to highlight and help you compare ongoing costs only. The Fund does not charge sales loads.
The calculations assume no shares were bought or sold during the period. Your actual costs may have been higher or lower, depending on the amount of your investment and the timing of any purchases or redemptions.
22
| ADLER VALUE FUND |
| ABOUT YOUR FUND’S EXPENSES (Unaudited) (Continued) |
More information about the Fund’s expenses can be found in this report. For additional information on operating expenses and other shareholder costs, please refer to the Fund’s prospectus.
| Beginning | Ending | |||
| Account Value | Account Value | Expenses | ||
| December 1, | May 31, | Net Expense | Paid During | |
| Institutional Class | 2022 | 2023 | Ratio(a) | Period(b) |
| Based on Actual Fund Return | $1,000.00 | $ 889.90 | 1.25% | $5.89 |
| Based on Hypothetical 5% Return (before expenses) | $1,000.00 | $1,018.70 | 1.25% | $6.29 |
| (a) | Annualized, based on the Fund’s most recent one-half year expenses. |
| (b) | Expenses are equal to the Fund’s annualized net expense ratio multiplied by the average account value over the period, multiplied by 182/365 (to reflect the one-half year period). |
23
| ADLER VALUE FUND |
| OTHER INFORMATION (Unaudited) |
A description of the policies and procedures that the Fund uses to vote proxies relating to portfolio securities is available without charge upon request by calling 1-800-408-4682, or on the SEC’s website at www.sec.gov. Information regarding how the Fund voted proxies relating to portfolio securities during the most recent 12-month period ended June 30, 2023 is also available without charge upon request by calling 1-800-408-4682, or on the SEC’s website at www.sec.gov.
The Trust files a complete listing of portfolio holdings for the Fund with the SEC as of the end of the first and third quarters of each fiscal year as an exhibit to its reports on Form N-PORT. These filings are available upon request by calling 1-800-408-4682. Furthermore, you may obtain a copy of the filings on the SEC’s website at www.sec.gov and the Fund’s website at www.adlervaluefund.com.
| FEDERAL TAX INFORMATION (Unaudited) |
For the year ended May 31, 2023, the Fund designated $257,382 as a long-term capital gain distribution.
24
| ADLER VALUE FUND |
| BOARD OF TRUSTEES AND EXECUTIVE OFFICERS (Unaudited) |
The Board has overall responsibility for management of the Trust’s affairs. The Trustees serve during the lifetime of the Trust and until its termination, or until death, resignation, retirement, or removal. The Trustees, in turn, elect the officers of the Fund to actively supervise their day-to-day operations. The officers have been elected for an annual term. Each Trustee’s and officer’s address is 225 Pictoria Drive, Suite 450, Cincinnati, Ohio 45246. The following are the Trustees and executive officers of the Fund:
| Name and Year of Birth | Length of Time Served | Position(s) held with Trust | Principal Occupation(s) During Past 5 Years | Number of Funds in the Trust Overseen By Trustee | Directorship(s) of Public Companies Held By Trustee During Past 5 Years |
| Interested Trustees: | |||||
| David K. James* Year of Birth: 1970 | April 2023 to present October 2022 to April 2023 July 2021 to October 2022 | Trustee (April 2023 to present) Assistant Secretary Secretary | Executive Vice President and Chief Legal and Risk Officer of Ultimus Fund Solutions, LLC (“Ultimus”) and a member of the board of managers of Ultimus Fund Distributors, LLC, Northern Lights Distributors, LLC and Northern Lights Compliance Services, LLC, each an affiliate of Ultimus (2018 to present); Managing Director and Managing Counsel of State Street Bank and Trust Company (2009 to 2018) | 32 | Interested Trustee of 12 series of the Capitol Series Trust (a registered management company) (2021 to present) |
| Independent Trustees: | |||||
| Janine L. Cohen Year of Birth: 1952 | Since 2016 | Chairperson (2019 to present) Trustee (2016 to present) | Retired since 2013; previously Chief Financial Officer from 2004 to 2013 and Chief Compliance Officer from 2008 to 2013 at AER Advisors, Inc. | 32 | n/a |
25
| ADLER VALUE FUND |
| BOARD OF TRUSTEES AND EXECUTIVE OFFICERS (Unaudited) (Continued) |
| Name and Year of Birth | Length of Time Served | Position(s) held with Trust | Principal Occupation(s) During Past 5 Years | Number of Funds in the Trust Overseen By Trustee | Directorship(s) of Public Companies Held By Trustee During Past 5 Years |
| Independent Trustees (Continued): | |||||
| David M. Deptula Year of Birth: 1958 | Since 2012 | Trustee (2012 to present) | Vice President of Legal and Special Projects at Dayton Freight Lines, Inc. since 2016 | 32 | n/a |
| Robert E. Morrison Year of Birth: 1957 | Since 2019 | Trustee (2019 to present; and previously 2012 to 2012) | Managing Director at Midwest Trust and FCI Advisors (2022 to present); Senior Vice President and National Practice Lead for Investment, Huntington National Bank/Huntington Private Bank (2014 to 2022); CEO, CIO, President of 5 Star Investment Management Company (2006 to 2014) | 32 | n/a |
| Clifford N. Schireson Year of Birth: 1953 | Since 2019 | Trustee (2019 to present) | Retired; Founder of Schireson Consulting, LLC (2017 to 2022); Director of Institutional Services for Brandes Investment Partners, LP (2004 to 2017) | 32 | Trustee of the San Diego City Employees’ Retirement System (2019 to present) |
| Jacqueline A. Williams Year of Birth: 1954 | Since 2019 | Trustee (2019 to present) | Managing Member of Custom Strategy Consulting, LLC (2017 to present); Managing Director of Global Investment Research (2005 to 2017), Cambridge Associates, LLC | 32 | n/a |
| * | Mr. James is considered an “interested person” of the Trust within the meaning of Section (2) (a)(19) of the Investment Company Act of 1940, as amended, because of his relationship with the Trust’s Administrator, Transfer Agent, and Distributor. Mr. James was Assistant Secretary of the Trust from October 2022 to April 2023 and Secretary of the Trust from July 2021 to October 2022. |
26
| ADLER VALUE FUND |
| BOARD OF TRUSTEES AND EXECUTIVE OFFICERS (Unaudited) (Continued) |
| Name and Year of Birth | Length of Time Served | Position(s) held with Trust | Principal Occupation(s) During Past 5 Years |
| Executive Officers: | |||
| Todd E. Heim Year of Birth: 1967 | 2021 to present 2014 to 2021 | President Vice President | Vice President, Relationship Management (2018 to present) and Assistant Vice President, Client Implementation Manager with Ultimus Fund Solutions, LLC (2014 to 2018) |
| Shannon Thibeaux- Burgess Year of Birth: 1970 | April 2023 to present | Vice President | Senior Vice President, Relationship Management with Ultimus Fund Solutions, LLC (2022 to present); Head of Regulatory Service with J.P. Morgan Chase & Co. (2020 to 2022); Chief Administrative Officer of State Street Bank (2013 to 2020) |
| Jennifer L. Leamer Year of Birth: 1976 | 2014 to present April 2014 to October 2014 | Treasurer Assistant Treasurer | Senior Vice President of Fund Accounting (2020 to present) and Mutual Fund Controller of Ultimus Fund Solutions, LLC (2014 to 2020) |
| Daniel D. Bauer Year of Birth: 1977 | 2016 to present | Assistant Treasurer | Vice President of Fund Accounting (2022 to present), Assistant Vice President of Fund Accounting (2020 to 2022), and AVP, Assistant Mutual Fund Controller (2015 to 2020) of Ultimus Fund Solutions, LLC |
| Angela A. Simmons Year of Birth: 1975 | January 2022 to present | Assistant Treasurer | Vice President of Financial Administration (2022 to present) and Assistant Vice President, Financial Administration (2015 to 2022) of Ultimus Fund Solutions, LLC |
| Karen Jacoppo-Wood Year of Birth: 1966 | April 2023 to present | Secretary | Vice President and Senior Legal Counsel of Ultimus Fund Solutions, LLC (2021 to present); Vice President, Asset Servicing – Regulatory Administration of The Bank of New York Mellon (2019 to 2021); Vice President and Counsel of State Street Bank and Trust Company (2015 to 2019) |
| Natalie S. Anderson Year of Birth:1975 | 2016 to present | Assistant Secretary | Legal Administration Manager (2016 to present) and Paralegal (2015 to 2016) of Ultimus Fund Solutions, LLC |
27
| ADLER VALUE FUND |
| BOARD OF TRUSTEES AND EXECUTIVE OFFICERS (Unaudited) (Continued) |
| Name and Year of Birth | Length of Time Served | Position(s) held with Trust | Principal Occupation(s) During Past 5 Years |
| Executive Officers (Continued): | |||
| Jesse Hallee Year of Birth: 1976 | April 2023 to present | Assistant Secretary | Senior Vice President and Associate General Counsel of Ultimus Fund Solutions, LLC (June 2019 to present); Vice President and Managing Counsel, State Street Bank and Trust Company (2013 to 2019) |
| Gweneth K. Gosselink Year of Birth: 1955 | 2020 to present | Chief Compliance Officer | Assistant Vice President, Compliance Officer at Ultimus Fund Solutions, LLC (2019 to present); CCO Consultant at GKG Consulting, LLC (2019 to 2021); Chief Operating Officer & CCO at Miles Capital, Inc. (2013 to 2019) |
| Martin Dean Year of Birth: 1963 | 2020 to present 2019 to 2020 2016 to 2017 | Assistant Chief Compliance Officer Interim Chief Compliance Officer Assistant Chief Compliance Officer | President of Northern Lights Compliance Services, LLC (February 2023 to present); Senior Vice President, Head of Fund Compliance (2020 to January 2023) and Vice President & Director of Fund Compliance of Ultimus Fund Solutions, LLC (2016 to 2020) |
Additional information about members of the Board and executive officers is available in the Fund’s Statement of Additional Information (“SAI”). To obtain a free copy of the SAI, please call toll free 1-800-408-4682.
28
| ADLER VALUE FUND |
| DISCLOSURE REGARDING APPROVAL OF INVESTMENT ADVISORY AGREEMENT (Unaudited) |
The Board of Trustees (the “Board”), including the Independent Trustees voting separately, has reviewed and approved the continuance of the Fund’s Investment Advisory Agreement with Adler Asset Management, LLC (the “Adviser” or “Adler”) for an additional one-year term (the “Advisory Agreement”). The Board approved the continuance of the Advisory Agreement at a meeting held on January 17-18, 2023, at which all of the Trustees were present.
Prior to the Board meeting, the Adviser provided a response to a letter sent by the counsel to the Independent Trustees, on their behalf, requesting various information relevant to the Independent Trustees’ consideration of the renewal of the Advisory Agreement with respect to the Fund. In approving the continuance of the Advisory Agreement, the Independent Trustees considered all information they deemed reasonably necessary to evaluate the terms of the Agreement. The principal areas of review by the Independent Trustees were (i) the nature, extent and quality of the services provided by the Adviser, (ii) the investment performance of the Fund, (iii) the costs of the services provided and profits realized by the Adviser and its affiliates from the Adviser’s relationship with the Fund, (iv) the other “fall-out” benefits derived by Adviser and its affiliates from the Adviser’s relationship with the Fund and (v) the extent to which economies of scale would be realized as the Fund grows and whether management fee levels reflect those economies of scale for the benefit of the Fund’s investors. The Independent Trustees’ evaluation of the quality of the Adviser’s services also took into consideration their knowledge gained through presentations and reports from the Adviser over the course of the preceding year. The Independent Trustees’ analysis of these factors is set forth below.
The nature, extent, and quality of the services provided by Adler. In this regard, the Board reviewed the services being provided by Adler to the Fund including, without limitation, its providing a continuous investment program for the Fund, adhering to the Fund’s investment restrictions, complying with the Trust’s policies and procedures and voting proxies on behalf of the Fund. The Board considered the qualifications and experience of Adler’s portfolio manager who is responsible for the day-to day management of the Fund’s portfolio. The Board concluded that the quality, extent, and nature of the services provided by Adler to the Fund were satisfactory.
The investment performance of the Fund. In this regard, the Board compared the performance of the Fund with the performance of its benchmark index, the custom peer groups and Morningstar category. The Board concluded that the investment performance of the Fund has been satisfactory.
The costs of the services provided and profits realized by Adler and its affiliates from its relationship with the Fund. In this regard, the Board considered the Fund’s management fee charged to the Fund and the Fund’s expense ratio, each as compared to the Fund’s peer groups and Morningstar category. The Board considered the revenue earned from the Fund and the current and anticipated profitability of the Fund to Adler, if any. The Board also considered Adler’s past fee reductions and expense reimbursements for the Fund and the indirect benefits
29
| ADLER VALUE FUND |
| DISCLOSURE REGARDING APPROVAL OF INVESTMENT ADVISORY AGREEMENT (Unaudited) (Continued) |
that Adler received from its management of the Fund. The Board concluded that the advisory fee to be paid to Adler by the Fund is reasonable in light of the nature and quality of services provided by Adler.
The extent to which economies of scale would be realized as the Fund grows and whether advisory fee levels reflect these economies of scale for the benefit of the Fund’s investors. In this regard, the Board considered that the Fund’s fee arrangements with Adler involve both the management fee and an expense limitation agreement (the “ELA”). The Board determined that while the advisory fee rate remained the same as asset levels increased, the shareholders of the Fund have experienced benefits from the ELA and will continue to experience benefits from the ELA. The Board concluded that the management fee was reasonable in light of the information that was provided to the Trustees by Adler with respect to economies of scale.
After further discussion of the factors noted above and in reliance on the information provided by Adler and Trust Management, and taking into account the totality of all the factors discussed and information presented at the meeting and previous meetings, the Board indicated its agreement to approve the continuance of the Advisory Agreement and to approve the continuance of the ELA. It was noted that in the Trustees’ deliberations regarding the approval of renewal the Advisory Agreement, the Trustees did not identify any particular information or factor that was all-important or controlling, and that each individual Trustee may have attributed different weights to the various factors listed above. After full consideration of the above factors as well as other factors, the Board unanimously concluded that approval of the continuance of the Advisory Agreement was in the best interests of the Fund and its shareholders.
30
This page intentionally left blank.
This page intentionally left blank.
ADLER-AR-23
 |
| EVOLUTIONARY TREE INNOVATORS FUND |
| I Class Shares (INVNX) |
| A Class Shares (INVTX) |
| Annual Report |
| May 31, 2023 |
| EVOLUTIONARY TREE INNOVATORS FUND | |
| LETTER TO SHAREHOLDERS (Unaudited) | June 9, 2023 |
Dear Fellow Shareholders,
Following one of the most significant bear markets on record for growth stocks in 2022, we are now starting to see growth stocks experience a rebound in 2023. In this letter, we discuss the drivers of this improvement and what gives us confidence over the longer term.
We believe positive recent investment results are generally being driven by broad-based resilience and strength (i.e., revenue growth and margin expansion) across the businesses we own in the Fund, along with new innovations (new products) that are starting to be rewarded in the markets. This is a positive new dynamic, where investors in the markets are shifting away from being solely focused on macro events (inflation/rates) and are now rewarding progress at the business level. This reconnection of returns with the strength of the business fundamentals is potentially an important foundation as we move through the year and look for an eventual recovery for the portfolio.
That said, the markets continue to grapple with a collection of macro and geopolitical headwinds—starting with inflation, the Fed’s tightening response, Putin’s Ukraine war, a recessionary-like environment, and recently a banking crisis. That is quite a list of stressors to the economy, the markets, and businesses. And yet, as noted, we continue to see signs of stabilization for quality innovators, both as businesses and stocks. Despite all of these macro headwinds, Fund holdings are, in aggregate, continuing to grow at above-average rates. In short, they are “powering through” these storms. Specifically, on a weighted-average basis, the businesses in the Fund delivered 25% revenue growth year-over-year, with expanding margins in the most recently reported quarter before fiscal year end.
The Fund Experienced Improved Results as Macro Headwinds Eased and Investors Re-embrace Growth
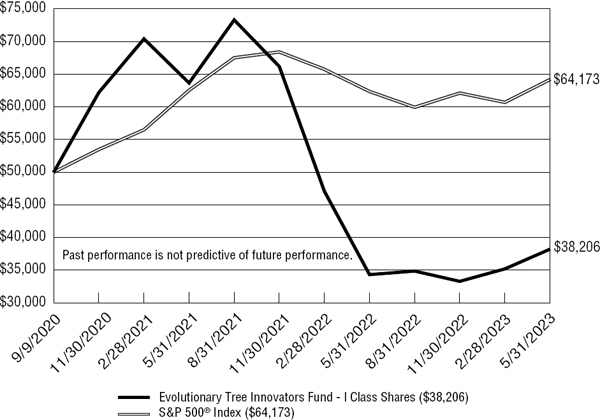
While day-to-day volatility continues in the markets, the Fund experienced significantly improved investment results for the fiscal year ending May 31, 2023 relative to the difficult prior year. During the recent fiscal year, the I Class of the Fund was up 11.34% versus the broader S&P 500 Index return of 2.92%.
Economists have suggested that the economy may experience a recession or a slowdown in the near term—what some are calling a “slowcession”—but substantial progress is being made on bringing down inflation. Overall inflation is down significantly from elevated levels last year as the Fed’s tightening cycle slows the economy and Covid-era subsidies end.
1
Technology Companies Are Undergoing a “Profit Push” and Leaders Are Now Being Rewarded For It
The technology sector was very much out of favor last year as investors shifted away from growth stocks and those perceived as “growing at all costs” and lacking in near-term profitability. And yet, we know that the largest tech companies, such as Microsoft and Google can be highly profitable businesses. Despite this, in the face of rising interest rates and higher hurdles for access to capital, investors simply shunned tech stocks last year. Now they are returning to tech stocks, particularly those that have profitability and are considered the dominant leaders in their specific segments of the sector.
Furthermore, we are now seeing this re-embracing of tech broadening beyond the megacap tech stocks. Why? In essence, this past earnings season has demonstrated that quality technology innovators of all sizes can accelerate their profitability or expand margins through a concerted “profit push.” Management teams are creating new initiatives that are now producing “efficient growth,” which emphasizes the importance of expanding margins and driving profitable growth.
In the most recently reported quarter before fiscal year end, on a weighted-average basis, Fund holdings delivered operating margin expansion of 274 bps—which is significantly higher than the 97 bps of margin expansion over the past year. The driver? We calculated that over 50% of the holdings have now put in place a new initiative to reduce costs and enhance margins (beyond what they were doing a year ago), further expanding profitability on a go-forward basis.
In addition, for the handful of companies we own that are not yet profitable, this push for efficient growth is accelerating their path to profitability, and we have seen certain holdings flip to profitability in recent quarters. We are now seeing investors wake up to this hidden growth driver.
We remain steadfast in focusing on the long-term prospects for the innovative businesses we own.
Thank you for your continued interest in, and support of, the Evolutionary Tree Innovators Fund.
2
Past performance is not predictive of future performance. Investment results and principal value will fluctuate so that shares, when redeemed, may be worth more or less than their original cost. Current performance may be higher or lower than the performance data quoted. Performance data current to the most recent month-end are available by calling 1-833-517-1010.
An investor should consider the investment objectives, risks, charges and expenses of the Fund carefully before investing. The Fund’s prospectus contains this and other important information. To obtain a copy of the Fund’s prospectus please visit the Fund’s website at mutualfund.evolutionarytree.com or call 1-833-517-1010 and a copy will be sent to you free of charge. Please read the prospectus carefully before you invest. The Fund is distributed by Ultimus Fund Distributors, LLC.
The Letter to Shareholders seeks to describe some of the Adviser’s current opinions and views of the financial markets. Although the Adviser believes it has a reasonable basis for any opinions or views expressed, actual results may differ, sometimes significantly so, from those expected or expressed. The securities held by the Fund that are discussed in the Letter to Shareholders were held during the period covered by this Report. They do not comprise the entire investment portfolio of the Fund, may be sold at any time, and may no longer be held by the Fund. For a complete list of securities held by the Fund as of May 31, 2023, please see the Schedule of Investments section of the semi-annual report. The opinions of the Adviser with respect to those securities may change at any time.
Statements in the Letter to Shareholders that reflect projections or expectations for future financial or economic performance of the Fund and the market in general and statements of the Fund’s plans and objectives for future operations are forward-looking statements. No assurance can be given that actual results or events will not differ materially from those projected, estimated, assumed, or anticipated in any such forward-looking statements. Important factors that could result in such differences, in addition to factors noted with such forward-looking statements, include, without limitation, general economic conditions, such as inflation, recession, and interest rates. Past performance is not a guarantee of future results.
3
| EVOLUTIONARY TREE INNOVATORS FUND |
| PERFORMANCE INFORMATION |
| May 31, 2023 (Unaudited) |
Comparison of the Change in Value of a $50,000 Investment in
Evolutionary Tree Innovators Fund - I Class Shares(a) versus the S&P 500® Index
| Average Annual Total Returns (for the periods ended May 31, 2023) | |||||
| Since | |||||
| 1 Year | Inception (b) | ||||
| Evolutionary Tree Innovators Fund - I Class Shares (c) | 11.34% | -9.41% | |||
| Evolutionary Tree Innovators Fund - A Class Shares (without load) (c) | 11.04% | -15.58% | |||
| Evolutionary Tree Innovators Fund - A Class Shares (c) | 4.67% | -19.46% | |||
| S&P 500® Index (d) | 2.92% | 9.60% | |||
| (a) | The line graph above represents performance of the I Class Share only, which will vary from the performance of the A Class Shares based on the differences in fees paid by shareholders in the different classes. |
| (b) | The Fund’s total returns do not reflect the deduction of taxes a shareholder would pay on Fund distributions or the redemption of Fund shares. |
| (c) | Commencement of operations for I Class Shares was September 9, 2020. Commencement of operations for A Class Shares was February 28, 2022. |
| (d) | The S&P 500® Index is a market capitalization weighted index of 500 of large companies that is widely used as a barometer of U.S. stock market performance. The Index is unmanaged and shown for illustration purposes only. An investor cannot invest in an index and its returns are not indicative of the performance of any specific investment. |
4
| EVOLUTIONARY TREE INNOVATORS FUND |
| PORTFOLIO INFORMATION |
| May 31, 2023 (Unaudited) |
Sector Diversification (% of Net Assets)
| Top 10 Equity Holdings | |
| % of | |
| Security Description | Net Assets |
| Microsoft Corporation | 10.0% |
| ServiceNow, Inc. | 8.1% |
| Amazon.com, Inc. | 7.9% |
| HubSpot, Inc. | 7.2% |
| Inspire Medical Systems, Inc. | 4.8% |
| Visa, Inc. - Class A | 4.4% |
| Uber Technologies, Inc. | 4.0% |
| nCino, Inc. | 3.9% |
| Airbnb, Inc. - Class A | 3.3% |
| Alphabet, Inc. - Class A | 3.1% |
5
| EVOLUTIONARY TREE INNOVATORS FUND |
| SCHEDULE OF INVESTMENTS |
| May 31, 2023 |
| COMMON STOCKS — 98.5% | Shares | Value | ||||||
| Communications — 6.5% | ||||||||
| Digital Media — 6.5% | ||||||||
| Alphabet, Inc. - Class A (a) | 5,770 | $ | 708,960 | |||||
| Bumble, Inc. - Class A (a) | 12,106 | 185,222 | ||||||
| Trade Desk, Inc. (The) - Class A (a) | 8,194 | 574,235 | ||||||
| 1,468,417 | ||||||||
| Consumer Discretionary — 17.3% | ||||||||
| Consumer Leisure — 3.3% | ||||||||
| Airbnb, Inc. - Class A (a) | 6,705 | 736,008 | ||||||
| E-Commerce — 12.2% | ||||||||
| Amazon.com, Inc. (a) | 14,795 | 1,783,981 | ||||||
| MercadoLibre, Inc. (a) | 513 | 635,607 | ||||||
| Sea Ltd. - ADR (a) | 6,188 | 355,253 | ||||||
| 2,774,841 | ||||||||
| Home Improvement Retail — 1.8% | ||||||||
| Floor & Decor Holdings, Inc. - Class A (a) | 4,470 | 408,156 | ||||||
| Financials — 7.0% | ||||||||
| Financial Services — 7.0% | ||||||||
| Block, Inc. - Class A (a) | 5,196 | 313,786 | ||||||
| Tradeweb Markets, Inc. - Class A | 4,295 | 287,550 | ||||||
| Visa, Inc. - Class A | 4,530 | 1,001,266 | ||||||
| 1,602,602 | ||||||||
| Health Care — 21.3% | ||||||||
| Biotechnology — 6.8% | ||||||||
| argenx SE - ADR (a) | 1,114 | 433,012 | ||||||
| Arrowhead Pharmaceuticals, Inc. (a) | 14,163 | 487,349 | ||||||
| Sarepta Therapeutics, Inc. (a) | 4,977 | 615,157 | ||||||
| 1,535,518 | ||||||||
| Life Sciences Tools & Services — 1.4% | ||||||||
| Charles River Laboratories International, Inc. (a) | 1,590 | 307,474 | ||||||
| Medical Technology — 9.1% | ||||||||
| Abbott Laboratories | 3,500 | 357,000 | ||||||
| Inspire Medical Systems, Inc. (a) | 3,751 | 1,097,130 | ||||||
| PROCEPT BioRobotics Corporation (a) | 11,635 | 389,191 | ||||||
| Stryker Corporation | 825 | 227,353 | ||||||
| 2,070,674 | ||||||||
6
| EVOLUTIONARY TREE INNOVATORS FUND |
| SCHEDULE OF INVESTMENTS (Continued) |
| COMMON STOCKS — 98.5% (Continued) | Shares | Value | ||||||
| Health Care — 21.3% (Continued) | ||||||||
| Pharmaceuticals — 4.0% | ||||||||
| Ascendis Pharma A/S - ADR (a) | 4,833 | $ | 420,326 | |||||
| Revance Therapeutics, Inc. (a) | 16,292 | 497,884 | ||||||
| 918,210 | ||||||||
| Industrials — 8.1% | ||||||||
| Defense IT & Services — 1.0% | ||||||||
| CACI International, Inc. - Class A (a) | 749 | 224,116 | ||||||
| Law Enforcement Technology — 3.1% | ||||||||
| Axon Enterprise, Inc. (a) | 3,605 | 695,441 | ||||||
| Mobility & Delivery Services — 4.0% | ||||||||
| Uber Technologies, Inc. (a) | 24,210 | 918,285 | ||||||
| Technology — 38.3% | ||||||||
| Application Software — 16.7% | ||||||||
| HubSpot, Inc. (a) | 3,155 | 1,634,259 | ||||||
| Monday.com Ltd. (a) | 1,775 | 319,855 | ||||||
| ServiceNow, Inc. (a) | 3,363 | 1,832,095 | ||||||
| 3,786,209 | ||||||||
| Data & Analytics — 3.6% | ||||||||
| MongoDB, Inc. (a) | 1,016 | 298,491 | ||||||
| Snowflake, Inc. - Class A (a) | 3,111 | 514,435 | ||||||
| 812,926 | ||||||||
| Financial Services Technology — 3.9% | ||||||||
| nCino, Inc. (a) | 31,876 | 876,271 | ||||||
| Infrastructure Software — 10.0% | ||||||||
| Microsoft Corporation | 6,922 | 2,273,115 | ||||||
| IT Security — 2.2% | ||||||||
| Palo Alto Networks, Inc. (a) | 2,400 | 512,136 | ||||||
| Networking Equipment — 1.9% | ||||||||
| Arista Networks, Inc. (a) | 2,600 | 432,484 | ||||||
| Total Common Stocks (Cost $19,488,397) | $ | 22,352,883 | ||||||
7
| EVOLUTIONARY TREE INNOVATORS FUND |
| SCHEDULE OF INVESTMENTS (Continued) |
| MONEY MARKET FUNDS — 1.4% | Shares | Value | ||||||
| First American Treasury Obligations Fund - Class X, 5.02% (b) (Cost $325,945) | 325,945 | $ | 325,945 | |||||
| Investments at Value — 99.9% (Cost $19,814,342) | $ | 22,678,828 | ||||||
| Other Assets in Excess of Liabilities — 0.1% | 11,718 | |||||||
| Net Assets — 100.0% | $ | 22,690,546 | ||||||
A/S - Aktieselskab
ADR - American Depositary Receipt
SE - Societe Europaea
| (a) | Non-income producing security. |
| (b) | The rate shown is the 7-day effective yield as of May 31, 2023. |
See accompanying notes to financial statements.
8
| EVOLUTIONARY TREE INNOVATORS FUND |
| STATEMENT OF ASSETS AND LIABILITIES |
| May 31, 2023 |
| ASSETS | ||||
| Investments in securities: | ||||
| At cost | $ | 19,814,342 | ||
| At value (Note 2) | $ | 22,678,828 | ||
| Receivable for investment securities sold | 502,881 | |||
| Receivable for capital shares sold | 1,475 | |||
| Receivable from Adviser (Note 4) | 2,830 | |||
| Dividends receivable | 10,421 | |||
| Other assets | 18,360 | |||
| Total assets | 23,214,795 | |||
| LIABILITIES | ||||
| Payable for investment securities purchased | 508,279 | |||
| Payable to administrator (Note 4) | 9,023 | |||
| Accrued distribution fees (Note 4) | 543 | |||
| Other accrued expenses | 6,404 | |||
| Total liabilities | 524,249 | |||
| NET ASSETS | $ | 22,690,546 | ||
| NET ASSETS CONSIST OF: | ||||
| Paid-in capital | $ | 35,169,722 | ||
| Accumulated deficit | (12,479,176 | ) | ||
| NET ASSETS | $ | 22,690,546 | ||
| NET ASSET VALUE PER SHARE: | ||||
| I CLASS SHARES | ||||
| Net assets applicable to I Class Shares | $ | 19,711,177 | ||
| I Class Shares of beneficial interest outstanding (unlimited number of shares authorized, no par value) | 1,328,742 | |||
| Net asset value, offering price and redemption price per share (Note 2) | $ | 14.83 | ||
| A CLASS SHARES | ||||
| Net assets applicable to A Class Shares | $ | 2,979,369 | ||
| A Class Shares of beneficial interest outstanding (unlimited number of shares authorized, no par value) | 201,526 | |||
| Net asset value and redemption price per share (Note 2) | $ | 14.78 | ||
| Maximum sales charge | 5.75 | % | ||
| Maximum offering price per share (Note 2) | $ | 15.68 |
See accompanying notes to financial statements.
9
| EVOLUTIONARY TREE INNOVATORS FUND |
| STATEMENT OF OPERATIONS |
| For the Year Ended May 31, 2023 |
| INVESTMENT INCOME | ||||
| Dividends | $ | 61,579 | ||
| Foreign withholding tax on dividends | (129 | ) | ||
| Total investment income | 61,450 | |||
| EXPENSES | ||||
| Management fees (Note 4) | 155,969 | |||
| Registration and filing fees | 20,245 | |||
| Registration fees - I Class Shares | 13,347 | |||
| Registration fees - A Class Shares | 23,678 | |||
| Fund accounting fees (Note 4) | 36,780 | |||
| Administration fees (Note 4) | 28,935 | |||
| Legal fees | 28,887 | |||
| Transfer agent fees - I Class Shares (Note 4) | 15,997 | |||
| Transfer agent fees - A Class Shares (Note 4) | 12,000 | |||
| Trustees’ fees and expenses (Note 4) | 19,567 | |||
| Audit and tax services fees | 15,911 | |||
| Shareholder reporting expenses | 13,478 | |||
| Compliance fees and expenses (Note 4) | 12,346 | |||
| Custodian and bank service fees | 9,061 | |||
| Postage and supplies | 7,649 | |||
| Networking fees | 6,059 | |||
| Distribution fees - A Class Shares (Note 4) | 4,397 | |||
| Insurance expense | 3,273 | |||
| Other expenses | 14,769 | |||
| Total expenses | 442,348 | |||
| Less fee reductions and expense reimbursements by the Adviser (Note 4) | (248,883 | ) | ||
| Net expenses | 193,465 | |||
| NET INVESTMENT LOSS | (132,015 | ) | ||
| REALIZED AND UNREALIZED GAINS (LOSSES) ON INVESTMENTS | ||||
| Net realized losses on investment transactions | (2,952,081 | ) | ||
| Net change in unrealized appreciation (depreciation) on investments | 5,374,772 | |||
| NET REALIZED AND UNREALIZED GAINS ON INVESTMENTS | 2,422,691 | |||
| NET INCREASE IN NET ASSETS RESULTING FROM OPERATIONS | $ | 2,290,676 |
See accompanying notes to financial statements.
10
| EVOLUTIONARY TREE INNOVATORS FUND |
| STATEMENTS OF CHANGES IN NET ASSETS |
| Year Ended | Year Ended | |||||||
| May 31, | May 31, | |||||||
| 2023 | 2022 (a) | |||||||
| FROM OPERATIONS | ||||||||
| Net investment loss | $ | (132,015 | ) | $ | (322,012 | ) | ||
| Net realized losses from investment transactions | (2,952,081 | ) | (11,787,013 | ) | ||||
| Net change in unrealized appreciation (depreciation) on investments | 5,374,772 | (4,408,728 | ) | |||||
| Net increase (decrease) in net assets resulting from operations | 2,290,676 | (16,517,753 | ) | |||||
| FROM DISTRIBUTIONS TO SHAREHOLDERS (Note 2) | ||||||||
| I Class Shares | — | (1,387,004 | ) | |||||
| CAPITAL SHARE TRANSACTIONS | ||||||||
| I Class Shares | ||||||||
| Proceeds from shares sold | 16,088,964 | 36,442,525 | ||||||
| Net asset value of shares issued in reinvestment of distributions to shareholders | — | 1,343,272 | ||||||
| Payments for shares redeemed | (9,805,321 | ) | (36,331,845 | ) | ||||
| Net increase in I Class Shares net assets from capital share transactions | 6,283,643 | 1,453,952 | ||||||
| A Class Shares | ||||||||
| Proceeds from shares sold | 2,798,500 | 1,000 | ||||||
| Payments for shares redeemed | (155,231 | ) | — | |||||
| Net increase in A Class Shares net assets from capital share transactions | 2,643,269 | 1,000 | ||||||
| TOTAL INCREASE (DECREASE) IN NET ASSETS | 11,217,588 | (16,449,805 | ) | |||||
| NET ASSETS | ||||||||
| Beginning of year | 11,472,958 | 27,922,763 | ||||||
| End of year | $ | 22,690,546 | $ | 11,472,958 | ||||
| (a) | For Class A Shares, represents the period from commencement of operations (February 28, 2022) through May 31, 2022. |
See accompanying notes to financial statements.
11
| EVOLUTIONARY TREE INNOVATORS FUND |
| STATEMENTS OF CHANGES IN NET ASSETS (Continued) |
| Year Ended | Year Ended | |||||||
| May 31, | May 31, | |||||||
| 2023 | 2022 (a) | |||||||
| CAPITAL SHARES ACTIVITY | ||||||||
| I Class Shares | ||||||||
| Shares sold | 1,201,050 | 1,514,240 | ||||||
| Net asset value of shares issued in reinvestment of distributions to shareholders | — | 57,063 | ||||||
| Shares redeemed | (733,752 | ) | (1,806,474 | ) | ||||
| Net increase (decrease) in shares outstanding | 467,298 | (235,171 | ) | |||||
| Shares outstanding, beginning of year | 861,444 | 1,096,615 | ||||||
| Shares outstanding, end of year | 1,328,742 | 861,444 | ||||||
| A Class Shares | ||||||||
| Shares sold | 213,071 | 55 | ||||||
| Shares redeemed | (11,600 | ) | — | |||||
| Net increase in shares outstanding | 201,471 | 55 | ||||||
| Shares outstanding, beginning of year | 55 | — | ||||||
| Shares outstanding, end of year | 201,526 | 55 | ||||||
| (a) | For Class A Shares, represents the period from commencement of operations (February 28, 2022) through May 31, 2022. |
See accompanying notes to financial statements.
12
| EVOLUTIONARY TREE INNOVATORS FUND |
| I CLASS SHARES |
| FINANCIAL HIGHLIGHTS |
Per Share Data for a Share Outstanding Throughout Each Period
| Year Ended | Year Ended | Period Ended | ||||||||||
| May 31, | May 31, | May 31, | ||||||||||
| 2023 | 2022 | 2021 (a) | ||||||||||
| Net asset value at beginning of period | $ | 13.32 | $ | 25.46 | $ | 20.00 | ||||||
| Income (loss) from investment operations: | ||||||||||||
| Net investment loss (b) | (0.09 | ) | (0.24 | ) | (0.18 | ) | ||||||
| Net realized and unrealized gains (losses) on investments | 1.60 | (11.18 | ) | 5.64 | ||||||||
| Total from investment operations | 1.51 | (11.42 | ) | 5.46 | ||||||||
| Less distributions from: | ||||||||||||
| Net realized gains | — | (0.72 | ) | — | ||||||||
| Net asset value at end of period | $ | 14.83 | $ | 13.32 | $ | 25.46 | ||||||
| Total return (c) | 11.34 | % | (46.09 | %) | 27.30 | % (d) | ||||||
| Net assets at end of period (000’s) | $ | 19,711 | $ | 11,472 | $ | 27,923 | ||||||
| Ratios/supplementary data: | ||||||||||||
| Ratio of total expenses to average net assets | 2.08 | % | 1.59 | % | 1.65 | % (e) | ||||||
| Ratio of net expenses to average net assets (f) | 0.97 | % | 1.00 | % (g) | 0.97 | % (e) | ||||||
| Ratio of net investment loss to average net assets (f) | (0.66 | %) | (0.99 | %) | (0.97 | %) (e) | ||||||
| Portfolio turnover rate | 84 | % | 169 | % | 33 | % (d) | ||||||
| (a) | Represents the period from the commencement of operations (September 9, 2020) through May 31, 2021. |
| (b) | Per share net investment loss has been determined on the basis of average number of shares outstanding during the period. |
| (c) | Total return is a measure of the change in value of an investment in the Fund over the period covered. The returns shown do not reflect the deduction of taxes a shareholder would pay on Fund distributions, if any, or the redemption of Fund shares. The total return would be lower if the Adviser had not reduced fees and reimbursed expenses (Note 4). |
| (d) | Not annualized. |
| (e) | Annualized. |
| (f) | Ratio was determined after management fee reductions and expense reimbursements (Note 4). |
| (g) | Includes 0.03% of borrowing costs (Note 5). |
See accompanying notes to financial statements.
13
| EVOLUTIONARY TREE INNOVATORS FUND |
| A CLASS SHARES |
| FINANCIAL HIGHLIGHTS |
Per Share Data for a Share Outstanding Throughout Each Period
| Year Ended | Period Ended | |||||||
| May 31, | May 31, | |||||||
| 2023 | 2022 (a) | |||||||
| Net asset value at beginning of period | $ | 13.31 | $ | 18.27 | ||||
| Income (loss) from investment operations: | ||||||||
| Net investment loss (b) | (0.12 | ) | (0.05 | ) | ||||
| Net realized and unrealized gains (losses) on investments | 1.59 | (4.91 | ) | |||||
| Total from investment operations | 1.47 | (4.96 | ) | |||||
| Net asset value at end of period | $ | 14.78 | $ | 13.31 | ||||
| Total return (c) | 11.04 | % | (27.15 | %) (d) | ||||
| Net assets at end of period (000’s) | $ | 2,979 | $ | 1 | ||||
| Ratios/supplementary data: | ||||||||
| Ratio of total expenses to average net assets | 4.18 | % | 3706.34 | % (e) | ||||
| Ratio of net expenses to average net assets (f) | 1.22 | % | 1.22 | % (e) | ||||
| Ratio of net investment loss to average net assets (f) | (0.87 | %) | (1.21 | %) (e) | ||||
| Portfolio turnover rate | 84 | % | 169 | % (g) | ||||
| (a) | Represents the period from the commencement of operations (February 28, 2022) through May 31, 2022. |
| (b) | Per share net investment loss has been determined on the basis of average number of shares outstanding during the period. |
| (c) | Total return is a measure of the change in value of an investment in the Fund over the period covered. The returns shown do not reflect the deduction of taxes a shareholder would pay on Fund distributions, if any, or the redemption of Fund shares. The total return would be lower if the Adviser had not reduced fees and reimbursed expenses (Note 4). |
| (d) | Not annualized. |
| (e) | Annualized. |
| (f) | Ratio was determined after management fee reductions and expense reimbursements (Note 4). |
| (g) | Portfolio turnover rate for the period ended May 31, 2022 and is calculated at the Fund level. |
See accompanying notes to financial statements.
14
| EVOLUTIONARY TREE INNOVATORS FUND |
| NOTES TO FINANCIAL STATEMENTS |
| May 31, 2023 |
1. Organization
Evolutionary Tree Innovators Fund (the “Fund”) is a non-diversified series of Ultimus Managers Trust (the “Trust”). The Trust is an open-end management investment company established as an Ohio business trust under a Declaration of Trust dated February 28, 2012. Other series of the Trust are not incorporated in this report.
The investment objective of the Fund is to seek to achieve long-term growth of capital.
The Fund currently offers two classes of shares: I Class Shares (sold without any sales loads and distribution and/or service fees and requiring a $50,000 initial investment) and A Class Shares (sold subject to an initial maximum front end sales load of 5.75% and a distribution (12b-1) fee of up to 0.25% of the average daily net assets attributable to A Class Shares, requiring a $ 1,000 initial investment and for purchases of $1,000,000 or more, a front end sales load is not charged but a 1% contingent deferred sales charge (“CDSC”) may be charged if redeemed during the first 18 months) (each a “Class”). Each share class represents an ownership interest in the same investment portfolio.
2. Significant Accounting Policies
The Fund follows accounting and reporting guidance under Financial Accounting Standards Board Accounting Standards Codification Topic 946, “Financial Services – Investment Companies.” The following is a summary of the Fund’s significant accounting policies used in the preparation of its financial statements. These policies are in conformity with accounting principles generally accepted in the United States of America (“GAAP”).
Securities valuation – The Fund values its portfolio securities at market value as of the close of regular trading on the New York Stock Exchange (the “NYSE”) (normally 4:00 p.m. Eastern time) on each business day the NYSE is open for business. The Fund values its listed securities on the basis of the security’s last sale price on the security’s primary exchange, if available, otherwise at the exchange’s most recently quoted mean price. NASDAQ-listed securities are valued at the NASDAQ Official Closing Price. Investments representing shares of other open-end investment companies, other than exchange-traded funds, if any, but including money market funds, are valued at their net asset value (“NAV”) as reported by such companies. When using a quoted price and when the market for the security is considered active, the security will be classified as Level 1 within the fair value hierarchy (see below). In the event that market quotations are not readily available or are considered unreliable due to market or other events, the Fund values its securities and other assets at fair value as determined by Evolutionary Capital Management, LLC (the “Adviser”), as the Fund’s valuation designee, in accordance with procedures adopted by the Board of Trustees (the “Board”) pursuant to Rule 2a-5 under the Investment Company Act of 1940, as amended (the “1940 Act”). Under these procedures, the securities will be classified as Level 2 or 3 within the fair value hierarchy, depending on the inputs used. Unavailable or unreliable market quotes may be due to the following factors: a
15
| EVOLUTIONARY TREE INNOVATORS FUND |
| NOTES TO FINANCIAL STATEMENTS (Continued) |
substantial bid-ask spread; infrequent sales resulting in stale prices; insufficient trading volume; small trade sizes; a temporary lapse in any reliable pricing source; and actions of the securities or futures markets, such as the suspension or limitation of trading. As a result, the prices of securities used to calculate the Fund’s NAV may differ from quoted or published prices for the same securities.
GAAP establishes a single authoritative definition of fair value, sets out a framework for measuring fair value, and requires additional disclosures about fair value measurements.
Various inputs are used in determining the value of the Fund’s investments. These inputs are summarized in the three broad levels listed below:
| ● | Level 1 – quoted prices in active markets for identical securities |
| ● | Level 2 – other significant observable inputs |
| ● | Level 3 – significant unobservable inputs |
The inputs or methods used for valuing securities are not necessarily an indication of the risks associated with investing in those securities. The inputs used to measure fair value may fall into different levels of the fair value hierarchy. In such cases, for disclosure purposes, the level in the fair value hierarchy within which the fair value measurement falls in its entirety is determined based on the lowest level input that is significant to the fair value measurement.
The following is a summary of the Fund’s investments based on the inputs used to value the investments as of May 31, 2023, by security type:
| Level 1 | Level 2 | Level 3 | Total | |||||||||||||
| Common Stocks | $ | 22,352,883 | $ | — | $ | — | $ | 22,352,883 | ||||||||
| Money Market Funds | 325,945 | — | — | 325,945 | ||||||||||||
| Total | $ | 22,678,828 | $ | — | $ | — | $ | 22,678,828 | ||||||||
Refer to the Fund’s Schedule of Investments for a listing of the common stocks by sector and industry type. The Fund did not hold any derivative instruments or any assets or liabilities that were measured at fair value on a recurring basis using significant unobservable inputs (Level 3) as of or during the year ended May 31, 2023.
Share valuation – The NAV per share of each class of shares of the Fund is calculated daily by dividing the total value of the assets attributable to that class, less liabilities attributable to that class, by the number of shares outstanding of that class. The offering price and redemption price per share of I Class Shares is equal to the NAV per share. The maximum offering price per share of A Class Shares of the Fund is equal to the NAV per shares plus a sales load equal to 5.75% as a percentage of offering price. A Class Shares purchases of $1,000,000 or more, a front end sales load is not charged, but a CDSC of 1% may be charged if redeemed during the first 18 months of purchase.
16
| EVOLUTIONARY TREE INNOVATORS FUND |
| NOTES TO FINANCIAL STATEMENTS (Continued) |
Investment income – Dividend income is recorded on the ex-dividend date. Non-cash dividends included in dividend income, if any, are recorded at the fair market value of the security received. Interest income is accrued as earned. Withholding taxes on foreign dividends have been recorded in accordance with the Fund’s understanding of the applicable country’s tax rules and rates.
Investment transactions – Investment transactions are accounted for on the trade date. Realized gains and losses on investments sold are determined on a specific identification basis.
Allocation between classes – Investment income earned, realized capital gains and losses, and unrealized appreciation and depreciation are allocated daily to each class of a Fund based upon its proportionate share of total net assets of that Fund. Class-specific expenses are charged directly to the class incurring the expense. Common expenses which are not attributable to a specific class are allocated daily to each class of shares of a Fund based upon its proportionate share of total net assets of that Fund. Distribution fees, registration and filing fees and transfer agent fees are class specific expenses.
Common expenses – Common expenses of the Trust are allocated among the Fund and the other series of the Trust based on the relative net assets of each series, the number of series in the Trust, or the nature of the services performed and the relative applicability to each series.
Distributions to shareholders – The Fund distributes to shareholders any net investment income dividends and net realized capital gains on an annual basis. The amount of such dividends and distributions are determined in accordance with federal income tax regulations, which may differ from GAAP. Dividends and distributions to shareholders are recorded on the ex-dividend date. There were no distributions paid to shareholders by the Fund during the year ended May 31, 2023. For the year ended May 31, 2022, the tax character of distributions paid to shareholders was ordinary income.
Estimates – The preparation of financial statements in conformity with GAAP requires management to make estimates and assumptions that affect the reported amounts of assets and liabilities and disclosure of contingent assets and liabilities as of the date of the financial statements and the reported amounts of increase (decrease) in net assets from operations during the reporting period. Actual results could differ from those estimates.
Federal income tax – The Fund has qualified and intends to continue to qualify as a regulated investment company under the Internal Revenue Code of 1986, as amended (the “Code”). Qualification generally will relieve the Fund of liability for federal income taxes to the extent 100% of its net investment income and net realized capital gains are distributed in accordance with the Code.
17
| EVOLUTIONARY TREE INNOVATORS FUND |
| NOTES TO FINANCIAL STATEMENTS (Continued) |
In order to avoid imposition of the excise tax applicable to regulated investment companies, it is also the Fund’s intention to declare as dividends in each calendar year amounts equal to at least 98% of its net investment income (earned during the calendar year) and 98.2% of its net realized capital gains (earned during the twelve months ended October 31) plus undistributed amounts from prior years, if any.
The following information is computed on a tax basis for each item as of May 31, 2023:
| Cost of investments | $ | 22,031,412 | ||
| Gross unrealized appreciation | 2,889,142 | |||
| Gross unrealized depreciation | (2,241,726 | ) | ||
| Net unrealized appreciation | 647,416 | |||
| Accumulated capital and other losses | (13,126,592 | ) | ||
| Accumulated deficit | $ | (12,479,176 | ) | |
The difference between the federal income tax cost of investments and the financial statement cost of investments is due to certain timing differences in the recognition of capital gains or losses under income tax regulations and GAAP. These “book/tax” differences are temporary in nature and are primarily due to the tax deferral of losses on wash sales.
Net qualified late year losses, incurred after December 31, 2022, and within the current taxable year are deemed to arise on the first day of the Fund’s next taxable year. For the year ended May 31, 2023, the Fund deferred $56,893 of qualified late year losses to June 1, 2023.
As of May 31, 2023, the Fund had short-term and long-term capital loss carryforwards (“CLCF”) of $8,695,811 and $4,373,888, respectively, for federal income tax purposes. These CLCFs, which do not expire, may be utilized in future years to offset net realized capital gains, if any.
For the year ended May 31, 2023, the Fund reclassified $153,025 of accumulated deficit against paid-in capital on the Statement of Assets and Liabilities due to net operating loss. Such reclassification, the result of permanent differences between the financial statement and income tax reporting requirements, has no effect on the Fund’s net assets or NAV per share.
The Fund recognizes the tax benefits or expenses of uncertain tax positions only when the position is “more likely than not” of being sustained assuming examination by tax authorities. Management has reviewed the Fund’s tax positions for all open tax years (generally, three years) and has concluded that no provision for unrecognized tax benefits or expenses is required in these financial statements. The Fund identifies its major tax jurisdiction as U.S. Federal.
The Fund recognizes interest and penalties, if any, related to unrecognized tax benefits as income tax expense on the Statement of Operations. During the year ended May 31, 2023, the Fund did not incur any interest or penalties.
18
| EVOLUTIONARY TREE INNOVATORS FUND |
| NOTES TO FINANCIAL STATEMENTS (Continued) |
3. Investment Transactions
During the year ended May 31, 2023, cost of purchases and proceeds from sales of investment securities, other than short-term investments, amounted to $24,785,515 and $15,447,114, respectively.
4. Transactions with Related Parties
INVESTMENT ADVISORY AGREEMENT
The Fund’s investments are managed by the Adviser pursuant to the terms of an Investment Advisory Agreement. The Fund pays the Adviser a management fee, computed and accrued daily and paid monthly, at the annual rate of 0.80% of average daily net assets.
Pursuant to an Expense Limitation Agreement (“ELA”) between the Fund and the Adviser, the Adviser has agreed contractually, until October 31, 2024, to reduce its management fees and reimburse other expenses to the extent necessary to limit total annual fund operating expenses (exclusive of brokerage costs, taxes, interest, borrowing costs such as interest and dividend expenses on securities sold short, costs to organize the Fund, acquired fund fees and expenses, extraordinary expenses such as litigation and merger or reorganization costs and other expenses not incurred in the ordinary course of the Fund’s business) to an amount not to exceed 0.97% of average daily net assets attributable to I Class Shares and 1.22% of average daily net assets attributable to A Class Shares. Accordingly, during the year ended May 31, 2023, the Adviser did not collect any of its management fees in the amount of $155,969 and reimbursed other expenses in the amount of $92,914.
Under the terms of the ELA, management fee reductions and/or expense reimbursements by the Adviser are subject to repayment by the Fund for a period of 36 months after such date that fees and expenses were incurred, provided that the repayments do not cause total annual fund operating expenses to exceed: (i) the expense limitation then in effect, if any, and (ii) the expense limitation in effect at the time the expenses to be repaid were incurred. Prior to October 31, 2024, this agreement may not be modified or terminated without the approval of the Fund’s Board of Trustees. This agreement will terminate automatically if the Fund’s investment advisory agreement with the Adviser is terminated. As of May 31, 2023, the Adviser may seek repayment of management fee reductions no later than the dates as stated below:
| May 31, 2024 | $ | 108,771 | ||
| May 31, 2025 | 198,946 | |||
| May 31, 2026 | 248,883 | |||
| Total | $ | 556,600 | ||
19
| EVOLUTIONARY TREE INNOVATORS FUND |
| NOTES TO FINANCIAL STATEMENTS (Continued) |
OTHER SERVICE PROVIDERS
Ultimus Fund Solutions, LLC (“Ultimus”) provides administration, fund accounting, compliance and transfer agency services to the Fund. The Fund pays Ultimus fees in accordance with the agreements for such services. In addition, the Fund pays out-of-pocket expenses including, but not limited to, postage, supplies and certain costs related to the pricing of the Fund’s portfolio securities.
Under the terms of a Distribution Agreement with the Trust, Ultimus Fund Distributors, LLC (the “Distributor”) serves as principal underwriter to the Fund. The Distributor is a wholly-owned subsidiary of Ultimus. The Distributor is compensated by the Adviser (not the Fund) for acting as principal underwriter. As of May 31, 2023, the Distributor did not collect any fees related to CDSC fees on redemptions of A Class Shares.
Certain officers and a Trustee of the Trust are also officers of Ultimus and are not paid by the Fund for serving in such capacities.
DISTRIBUTION PLAN
The Fund has adopted a plan of distribution (the “Plan”) pursuant to Rule 12b-1 under the 1940 Act, which permits A Class Shares of the Fund to directly incur or reimburse the Fund’s principal underwriter for certain expenses related to the distribution of its shares. The annual limitation for payment of expenses pursuant to the Plan is 0.25% of the Fund’s average daily net assets allocable to A Class Shares. The Fund has not adopted a plan of distribution with respect to the I Class Shares. During the year ended May 31, 2023, the A Class Shares incurred $4,397 of distribution fees under the Plan.
TRUSTEE COMPENSATION
Effective October 17, 2022, each member of the Board (a “Trustee”) who is not an “interested person” (as defined by the 1940 Act, as amended) of the Trust (“Independent Trustee”) receives a $1,300 annual retainer from the Fund, except for the Board Chairperson who receives a $1,700 annual retainer from the Fund and the Audit Committee Chairperson who receives a $1,500 annual retainer from the Fund, paid in quarterly installments. Each Independent Trustee also receives from the Fund a fee of $550 for each Board meeting attended plus reimbursement for travel and other meeting-related expenses. Prior to October 17, 2022, no additional annual retainer was specifically designated for the Audit Committee Chairperson.
PRINCIPAL HOLDER OF FUND SHARES
As of May 31, 2023, the following shareholder owned of record more than 25% of the outstanding shares of the Fund:
| NAME OF RECORD OWNERS | % Ownership |
| Charles Schwab & Company (for the benefit of its customers) | 86% |
20
| EVOLUTIONARY TREE INNOVATORS FUND |
| NOTES TO FINANCIAL STATEMENTS (Continued) |
A beneficial owner of 25% or more of the Fund’s outstanding shares may be considered a controlling person. That shareholder’s vote could have a more significant effect on matters presented at a shareholders’ meeting.
5. Borrowing Costs
From time to time, the Fund may have an overdrawn cash balance at the custodian due to redemptions or market movements. When this occurs, the Fund will incur borrowing costs charged by the custodian. During the year ended May 31, 2023, the Fund did not incur any borrowing costs.
6. Contingencies and Commitments
The Fund indemnifies the Trust’s officers and Trustees for certain liabilities that might arise from their performance of their duties to the Fund. Additionally, in the normal course of business the Fund enters into contracts that contain a variety of representations and warranties and which provide general indemnifications. The Fund’s maximum exposure under these arrangements is unknown, as this would involve future claims that may be made against the Fund that have not yet occurred. However, based on experience, the Fund expects the risk of loss to be remote.
7. Non-Diversification Risk
The Fund is a non-diversified fund. As a result, the Fund’s holdings may be more concentrated in a limited number of securities and the value of its shares may be more sensitive than a diversified fund to any single economic, business, political, or regulatory occurrence.
8. Sector Risk
If a Fund has significant investments in the securities of issuers within a particular sector, any development affecting that sector will have a greater impact on the value of the net assets of the Fund than would be the case if the Fund did not have significant investments in that sector. In addition, this may increase the risk of loss in the Fund and increase the volatility of the Fund’s NAV per share. Occasionally, market conditions, regulatory changes or other developments may negatively impact a particular sector. As of May 31, 2023, the Fund had 38.3% of the value of its net assets invested in stocks within the Technology sector.
9. Subsequent Events
The Fund is required to recognize in the financial statements the effects of all subsequent events that provide additional evidence about conditions that existed as of the date of the Statement of Assets and Liabilities. For non-recognized subsequent events that must be disclosed to keep the financial statements from being misleading, the Fund is required to disclose the nature of the event as well as an estimate of its financial effect, or a statement that such an estimate cannot be made. Management has evaluated subsequent events through the issuance of these financial statements and has noted no such events.
21
| EVOLUTIONARY TREE INNOVATORS FUND |
| CHANGE IN INDEPENDENT REGISTERED PUBLIC ACCOUNTING FIRM (Unaudited) |
On March 13, 2023, BBD LLP (“BBD”) ceased to serve as the independent registered public accounting firm of Evolutionary Tree Innovators Fund (the “Fund”), a series of Ultimus Managers Trust. The Audit Committee of the Board of Trustees approved the replacement of BBD as a result of Cohen & Company, Ltd.’s (“Cohen”) acquisition of BBD’s Investment Management Group.
The report of BBD on the financial statements of the Fund as of and for the fiscal years ended 2022 and 2021 did not contain an adverse opinion or a disclaimer of opinion, and were not qualified or modified as to uncertainties, audit scope or accounting principles. During the fiscal years ended 2022 and 2021, and during the subsequent interim period through March 13, 2023: (i) there were no disagreements between the registrant and BBD on any matter of accounting principles or practices, financial statement disclosure, or auditing scope or procedure, which disagreements, if not resolved to the satisfaction of BBD, would have caused it to make reference to the subject matter of the disagreements in its report on the financial statements of the Fund for such years or interim period; and (ii) there were no “reportable events,” as defined in Item 304(a)(1)(v) of Regulation S-K under the Securities Exchange Act of 1934, as amended.
On April 21, 2023, the Audit Committee of the Board of Trustees also recommended and approved the appointment of Cohen as the Fund’s independent registered public accounting firm for the fiscal year ending May 31, 2023.
During the fiscal years ended 2022 and 2021, and during the subsequent interim period through March 13, 2023, neither the registrant, nor anyone acting on its behalf, consulted with Cohen on behalf of the Fund regarding the application of accounting principles to a specified transaction (either completed or proposed), the type of audit opinion that might be rendered on the Fund’s financial statements, or any matter that was either: (i) the subject of a “disagreement,” as defined in Item 304(a)(1)(iv) of Regulation S-K and the instructions thereto; or (ii) “reportable events,” as defined in Item 304(a)(1)(v) of Regulation S-K.
22
| EVOLUTIONARY TREE INNOVATORS FUND |
| REPORT OF INDEPENDENT REGISTERED |
| PUBLIC ACCOUNTING FIRM |
To the Shareholders of Evolutionary Tree Innovators Fund and
Board of Trustees of Ultimus Managers Trust
Opinion on the Financial Statements
We have audited the accompanying statement of assets and liabilities, including the schedule of investments, of Evolutionary Tree Innovators Fund (the “Fund”), a series of Ultimus Managers Trust, as of May 31, 2023, the related statements of operations and changes in net assets for the year then ended, the related notes, and the financial highlights for the year then ended (collectively referred to as the “financial statements”). In our opinion, the financial statements present fairly, in all material respects, the financial position of the Fund as of May 31, 2023, the results of its operations, the changes in net assets and the financial highlights for the year then ended, in conformity with accounting principles generally accepted in the United States of America.
The Fund’s financial statements and financial highlights for the years and periods ended May 31, 2022, and prior, were audited by another auditor whose report dated July 20, 2022, expressed an unqualified opinion on those financial statements and financial highlights.
Basis for Opinion
These financial statements are the responsibility of the Fund’s management. Our responsibility is to express an opinion on the Fund’s financial statements based on our audit. We are a public accounting firm registered with the Public Company Accounting Oversight Board (United States) (“PCAOB”) and are required to be independent with respect to the Fund in accordance with the U.S. federal securities laws and the applicable rules and regulations of the Securities and Exchange Commission and the PCAOB.
We conducted our audit in accordance with the standards of the PCAOB. Those standards require that we plan and perform the audit to obtain reasonable assurance about whether the financial statements are free of material misstatement whether due to error or fraud.
Our audit included performing procedures to assess the risks of material misstatement of the financial statements, whether due to error or fraud, and performing procedures that respond to those risks. Such procedures included examining, on a test basis, evidence regarding the amounts and disclosures in the financial statements. Our procedures included confirmation of securities owned as of May 31, 2023, by correspondence with the custodian and brokers; when replies were not received from brokers, we performed other auditing procedures. Our audit also included evaluating the accounting principles
23
| EVOLUTIONARY TREE INNOVATORS FUND |
| REPORT OF INDEPENDENT REGISTERED |
| PUBLIC ACCOUNTING FIRM (Continued) |
used and significant estimates made by management, as well as evaluating the overall presentation of the financial statements. We believe that our audit provides a reasonable basis for our opinion.
We have served as the Fund’s auditor since 2023.
COHEN & COMPANY, LTD.
Philadelphia, Pennsylvania
July 27, 2023
24
| EVOLUTIONARY TREE INNOVATORS FUND |
| ABOUT YOUR FUND’S EXPENSES (Unaudited) |
We believe it is important for you to understand the impact of costs on your investment. As a shareholder of the Fund, you incur two types of costs: (1) transaction costs, possibly including front-end and CDSC loads, and (2) ongoing costs, including management fees, Rule 12b-1 distribution fees (if applicable to your class) and other operating expenses. The following examples are intended to help you understand your ongoing costs (in dollars) of investing in the Fund and to compare these costs with the ongoing costs of investing in other mutual funds.
A mutual fund’s ongoing costs are expressed as a percentage of its average net assets. This figure is known as the expense ratio. The expenses in the table below are based on an investment of $1,000 made at the beginning of the most recent period (December 1, 2022) and held until the end of the period (May 31, 2023).
The table below illustrates the Fund’s ongoing costs in two ways:
Actual fund return – The first line for each share class helps you to estimate the actual expenses that you paid over the period. The “Ending Account Value” shown is derived from the Fund’s actual return, and the fourth column shows the dollar amount of operating expenses that would have been paid by an investor who started with $1,000 in the Fund. You may use the information here, together with the amount you invested, to estimate the expenses that you paid over the period.
To do so, simply divide your account value by $1,000 (for example, an $8,600 account value divided by $1,000 = 8.6), then multiply the result by the number given for the Fund under the heading “Expenses Paid During Period.”
Hypothetical 5% return – The second line for each share class is intended to help you compare the Fund’s ongoing costs with those of other mutual funds. It assumes that the Fund had an annual return of 5% before expenses during the period shown, but that the expense ratio is unchanged. In this case, because the return used is not the Fund’s actual return, the results do not apply to your investment. The example is useful in making comparisons because the U.S. Securities and Exchange Commission (the “SEC”) requires all mutual funds to calculate expenses based on a 5% return. You can assess the Fund’s ongoing costs by comparing this hypothetical example with the hypothetical examples that appear in shareholder reports of other funds.
Note that expenses shown in the table are meant to highlight and help you compare ongoing costs only.
The calculations assume no shares were bought or sold during the period. Your actual costs may have been higher or lower, depending on the amount of your investment and the timing of any purchases or redemptions.
25
| EVOLUTIONARY TREE INNOVATORS FUND |
| ABOUT YOUR FUND’S EXPENSES (Unaudited) (Continued) |
More information about the Fund’s expenses can be found in this report. For additional information on operating expenses and other shareholder costs, please refer to the Fund’s prospectus.
| Beginning | Ending | |||
| Account Value | Account Value | Expenses | ||
| December 1, | May 31, | Net Expense | Paid During | |
| 2022 | 2023 | Ratio(a) | Period(b) | |
| I Class Shares | ||||
| Based on Actual Fund Return | $1,000.00 | $1,147.80 | 0.97% | $5.19 |
| Based on Hypothetical 5% Return (before expenses) | $1,000.00 | $1,020.09 | 0.97% | $4.89 |
| A Class Shares | ||||
| Based on Actual Fund Return | $1,000.00 | $1,146.60 | 1.22% | $6.53 |
| Based on Hypothetical 5% Return (before expenses) | $1,000.00 | $1,018.85 | 1.22% | $6.14 |
| (a) | Annualized, based on each Class’s most recent one-half year expenses. |
| (b) | Expenses are equal to each Class’s annualized net expense ratio multiplied by the average account value over the period, multiplied by 182/365 (to reflect the one-half year period). |
26
| EVOLUTIONARY TREE INNOVATORS FUND |
| OTHER INFORMATION (Unaudited) |
A description of the policies and procedures that the Fund uses to vote proxies relating to portfolio securities is available without charge upon request by calling toll-free 1-833-517-1010, or on the SEC’s website at www.sec.gov. Information regarding how the Fund voted proxies relating to portfolio securities during the most recent 12-month period ended June 30 is available without charge upon request by calling toll-free 1-833-517-1010, or on the SEC’s website at www.sec.gov.
The Trust files a complete listing of portfolio holdings for the Fund with the SEC as of the end of the first and third quarters of each fiscal year as an exhibit to Form N-PORT. These filings are available upon request by calling 1-833-517-1010. Furthermore, you may obtain a copy of the filings on the SEC’s website at www.sec.gov and the Fund’s website at www.mutualfund.evolutionarytree.com.
27
| EVOLUTIONARY TREE INNOVATORS FUND |
| BOARD OF TRUSTEES AND EXECUTIVE OFFICERS (Unaudited) |
The Board has overall responsibility for management of the Trust’s affairs. The Trustees serve during the lifetime of the Trust and until its termination, or until death, resignation, retirement, or removal. The Trustees, in turn, elect the officers of the Fund to actively supervise their day-to-day operations. The officers have been elected for an annual term. Each Trustee’s and officer’s address is 225 Pictoria Drive, Suite 450, Cincinnati, Ohio 45246. The following are the Trustees and executive officers of the Fund:
| Name and Year of Birth | Length of Time Served | Position(s) held with Trust | Principal Occupation(s) During Past 5 Years | Number of Funds in the Trust Overseen By Trustee | Directorship(s) of Public Companies Held By Trustee During Past 5 Years |
| Interested Trustees: | |||||
| David K. James* Year of Birth: 1970 | April 2023 to present October 2022 to April 2023 July 2021 to October 2022 | Trustee (April 2023 to present) Assistant Secretary Secretary | Executive Vice President and Chief Legal and Risk Officer of Ultimus Fund Solutions, LLC (“Ultimus”) and a member of the board of managers of Ultimus Fund Distributors, LLC, Northern Lights Distributors, LLC and Northern Lights Compliance Services, LLC, each an affiliate of Ultimus (2018 to present); Managing Director and Managing Counsel of State Street Bank and Trust Company (2009 to 2018) | 32 | Interested Trustee of 12 series of the Capitol Series Trust (a registered management company) (2021 to present) |
| Independent Trustees: | |||||
| Janine L. Cohen Year of Birth: 1952 | Since 2016 | Chairperson (2019 to present) Trustee (2016 to present) | Retired since 2013; previously Chief Financial Officer from 2004 to 2013 and Chief Compliance Officer from 2008 to 2013 at AER Advisors, Inc. | 32 | n/a |
28
| EVOLUTIONARY TREE INNOVATORS FUND |
| BOARD OF TRUSTEES AND EXECUTIVE OFFICERS (Unaudited) (Continued) |
| Name and Year of Birth | Length of Time Served | Position(s) held with Trust | Principal Occupation(s) During Past 5 Years | Number of Funds in the Trust Overseen By Trustee | Directorship(s) of Public Companies Held By Trustee During Past 5 Years |
| Independent Trustees (Continued): | |||||
| David M. Deptula Year of Birth: 1958 | Since 2012 | Trustee (2012 to present) | Vice President of Legal and Special Projects at Dayton Freight Lines, Inc. since 2016 | 32 | n/a |
| Robert E. Morrison Year of Birth: 1957 | Since 2019 | Trustee (2019 to present; and previously 2012 to 2012) | Managing Director at Midwest Trust and FCI Advisors (2022 to present); Senior Vice President and National Practice Lead for Investment, Huntington National Bank/Huntington Private Bank (2014 to 2022); CEO, CIO, President of 5 Star Investment Management Company (2006 to 2014) | 32 | n/a |
| Clifford N. Schireson Year of Birth: 1953 | Since 2019 | Trustee (2019 to present) | Retired; Founder of Schireson Consulting, LLC (2017 to 2022); Director of Institutional Services for Brandes Investment Partners, LP (2004 to 2017) | 32 | Trustee of the San Diego City Employees’ Retirement System (2019 to present) |
| Jacqueline A. Williams Year of Birth: 1954 | Since 2019 | Trustee (2019 to present) | Managing Member of Custom Strategy Consulting, LLC (2017 to present); Managing Director of Global Investment Research (2005 to 2017), Cambridge Associates, LLC | 32 | n/a |
| * | Mr. James is considered an “interested person” of the Trust within the meaning of Section (2)(a)(19) of the 1940 Act, as amended, because of his relationship with the Trust’s Administrator, Transfer Agent, and Distributor. Mr. James was Assistant Secretary of the Trust from October 2022 to April 2023 and Secretary of the Trust from July 2021 to October 2022. |
29
| EVOLUTIONARY TREE INNOVATORS FUND |
| BOARD OF TRUSTEES AND EXECUTIVE OFFICERS (Unaudited) (Continued) |
| Name and Year of Birth | Length of Time Served | Position(s) held with Trust | Principal Occupation(s) During Past 5 Years |
| Executive Officers: | |||
| Todd E. Heim Year of Birth: 1967 | 2021 to present 2014 to 2021 | President Vice President | Vice President, Relationship Management (2018 to present) and Assistant Vice President, Client Implementation Manager with Ultimus Fund Solutions, LLC (2014 to 2018) |
| Shannon Thibeaux- Burgess Year of Birth: 1970 | April 2023 to present | Vice President | Senior Vice President, Relationship Management with Ultimus Fund Solutions, LLC (2022 to present); Head of Regulatory Service with J.P. Morgan Chase & Co. (2020 to 2022); Chief Administrative Officer of State Street Bank (2013 to 2020) |
| Jennifer L. Leamer Year of Birth: 1976 | 2014 to present April 2014 to October 2014 | Treasurer Assistant Treasurer | Senior Vice President of Fund Accounting (2020 to present) and Mutual Fund Controller of Ultimus Fund Solutions, LLC (2014 to 2020) |
| Daniel D. Bauer Year of Birth: 1977 | 2016 to present | Assistant Treasurer | Vice President of Fund Accounting (2022 to present), Assistant Vice President of Fund Accounting (2020 to 2022), and AVP, Assistant Mutual Fund Controller (2015 to 2020) of Ultimus Fund Solutions, LLC |
| Angela A. Simmons Year of Birth: 1975 | January 2022 to present | Assistant Treasurer | Vice President of Financial Administration (2022 to present) and Assistant Vice President, Financial Administration (2015 to 2022) of Ultimus Fund Solutions, LLC |
| Karen Jacoppo-Wood Year of Birth: 1966 | April 2023 to present | Secretary | Vice President and Senior Legal Counsel of Ultimus Fund Solutions, LLC (2021 to present); Vice President, Asset Servicing – Regulatory Administration of The Bank of New York Mellon (2019 to 2021); Vice President and Counsel of State Street Bank and Trust Company (2015 to 2019) |
| Natalie S. Anderson Year of Birth: 1975 | 2016 to present | Assistant Secretary | Legal Administration Manager (2016 to present) and Paralegal (2015 to 2016) of Ultimus Fund Solutions, LLC |
| Jesse Hallee Year of Birth: 1976 | April 2023 to present | Assistant Secretary | Senior Vice President and Associate General Counsel of Ultimus Fund Solutions, LLC (June 2019 to present); Vice President and Managing Counsel, State Street Bank and Trust Company (2013 to 2019) |
30
| EVOLUTIONARY TREE INNOVATORS FUND |
| BOARD OF TRUSTEES AND EXECUTIVE OFFICERS (Unaudited) (Continued) |
| Name and Year of Birth | Length of Time Served | Position(s) held with Trust | Principal Occupation(s) During Past 5 Years |
| Executive Officers (Continued): | |||
| Gweneth K. Gosselink Year of Birth: 1955 | 2020 to present | Chief Compliance Officer | Assistant Vice President, Compliance Officer at Ultimus Fund Solutions, LLC (2019 to present); CCO Consultant at GKG Consulting, LLC (2019 to 2021); Chief Operating Officer & CCO at Miles Capital, Inc. (2013 to 2019) |
| Martin Dean Year of Birth: 1963 | 2020 to present 2019 to 2020 2016 to 2017 | Assistant Chief Compliance Officer Interim Chief Compliance Officer Assistant Chief Compliance Officer | President of Northern Lights Compliance Services, LLC (February 2023 to present); Senior Vice President, Head of Fund Compliance (2020 to January 2023) and Vice President & Director of Fund Compliance of Ultimus Fund Solutions, LLC (2016 to 2020) |
Additional information about members of the Board and executive officers is available in the Fund’s Statement of Additional Information (“SAI”). To obtain a free copy of the SAI, please call toll free 1-833-517-1010.
31
This page intentionally left blank.
This page intentionally left blank.
EVOLUTIONARY-AR-23
 |
| KARNER BLUE BIODIVERSITY IMPACT FUND |
| ButterflyTM Class (KAIBX) |
| Annual Report |
| May 31, 2023 |
| KARNER BLUE BIODIVERSITY IMPACT FUND | |
| LETTER TO SHAREHOLDERS (Unaudited) | July 11, 2023 |
Dear Shareholder,
Our planet rests on a three-legged stool. All of human progress is dependent on a stable climate, robust biodiversity and a stewardship society that lives in harmony with nature, enabling species and ecosystems to continue to provide the services upon which humanity relies. Ecosystem services are commonly viewed as falling into one of four categories – provisioning, regulating, cultural or supporting – as shown in the chart below. More diverse ecosystems are generally more resilient and better able to withstand stress. The presence of a greater number of organisms in an ecosystem increases the potential for a wider array of responses to disturbances and that, in turn, enhances the ability of species to adapt to changing environmental conditions. The attainment of these types of robust ecosystems on a global scale can be facilitated through genuine and supportive partnerships with Indigenous People who comprise approximately 5% of the world’s population but live on lands that account for approximately 80% of the planet’s biodiversity.1
| OVERVIEW OF ECOSYSTEM SERVICES2 | ||
| Service Category | Service Description | Service Provided |
| PROVISIONING | Tangible goods that people harvest from the environment such as food, wood and fibre, water and fuel | Food and drink Natural Medicines Water Supply Basic Materials Renewable and Non-Renewable Energy |
| REGULATING | Ecosystem processes that generate benefits such as climate regulation, flood management, and water filtration | Clean Air Carbon Storage Flood Management Erosion Control Water purification Disease and Natural Pest Control Pollination |
| CULTURAL | The manner in which nature impacts people’s health and wellbeing through recreational and educational benefits as well as improving mental health and building spiritual connections | Physical Health and Mental Wellbeing Tourism Knowledge and Learning Recreation Sense of Place Inspiration Spiritual and Religious Connections |
| SUPPORTING | Foundational services, such as the nutrient cycle, soil formation and habitat provision for biodiversity, which form the basis for the other three types of services | Healthy Soils Photosynthesis Nutrient Cycling Space for Wildlife |
| 1 | Sena, K. (2020), Recognizing Indigenous Peoples’ Land Interests is Critical for People and Nature. (Washington, D.C.: World Wildlife Fund). Accessed at: https://www.worldwildlife.org/stories/recognizing-indigenous-peoples-land-interests-is-critical-for-people-and-nature#:~:text=Although%20they%20 comprise%20less%20than,they%20have%20lived%20for%20centuries. |
| 2 | NatureScot, Ecosystem Services – Nature’s Benefits. (Inverness: NatureScot). Accessed at: https:// www.nature.scot/scotlands-biodiversity/scottish-biodiversity-strategy-and-cop15/ecosystem-approach/ ecosystem-services-natures-benefits. |
1
The legs of the stool that supports our planet are wobbly, primarily because our global economic system has historically not valued the environment. Humanity is often viewed as being separate from and superior to nature rather than as an integral part of nature – a view that causes humans to treat nature as an “other” and encourages conduct that weakens the foundation of life on Earth. Human activity has pushed planetary temperatures steadily higher, though the oceans have insulated most of humanity from the worst effects of climate change by absorbing approximately 90 percent of that heat.3 This, in turn, has resulted in unprecedented ocean surface temperatures, which has increased the risk of changing and intensifying climate conditions and habitat destruction.4 Human activity has caused the conversion of so much land that the populations of mammals, birds, fish, reptiles and amphibians have declined by nearly 70 percent on average since 1970, a figure which does not address the estimated one million species at risk of extinction over the next few decades or the loss of microbial diversity without which humanity cannot survive.5,6 Human activity has spurred such an extractive mindset and so thoroughly embraced consumerism that scientists now estimate the natural resources of approximately 1.7 Earths are needed just to maintain humanity’s current standard of living. This immense stress on nature, in turn, threatens the livelihoods of 1 billion people who are reliant on forests and 3 billion people who are directly dependent upon marine and coastal biodiversity.7,8,9 It is against this backdrop that the Intergovernmental Panel on Climate Change issued its Climate Change 2023: Synthesis Report in
| 3 | Shaftel, H., Callery, S., Jackson, R., and Bailey, D. (Eds.) (2023), Global Climate Change: Vital Signs of the Planet. (Pasadena, CA: National Aeronautics and Space Administration Jet Propulsion Laboratory). Accessed at: https://climate.nasa.gov/vital-signs/ocean-warming/#:~:text=Covering%20more%20than%2070%25%20 of,heat%20as%20Earth’s%20entire%20atmosphere. |
| 4 | Birkel, S.D. (2023), Daily Sea Surface Temperature, Climate Reanalyzer. (Climate Change Institute, University of Maine, USA). Accessed at: https://climatereanalyzer.org/clim/sst_daily/ |
| 5 | Almond, R.E.A., Grooten, M., Juffe Bignoli, D. & Petersen, T. (Eds.) (2022), Living Planet Report 2022 – Building a Nature Positive Society. (Gland, Switzerland: World Wildlife Fund). Accessed at: https://wwflpr. awsassets.panda.org/downloads/lpr_2022_full_report.pdf. |
| 6 | Lawton, G. (2023), The shocking decline of Earth’s microbiome – and how to save it. (New Scientist). Accessed at: https://www.newscientist.com/article/mg25834344-900-the-shocking-decline-of-earths-microbiome-and-how-to-save-it/. |
| 7 | Global Footprint Network (2023), Earth Overshoot Day. Accessed at: https://www.overshootday.org/. Earth Overshoot Day is hosted and calculated by the Global Footprint Network (“GFN”), an international research organization that provides decision-makers with a menu of tools to help the human economy operate within Earth’s ecological limits. According to GFN, Earth Overshoot Day marks the date when humanity’s demand for ecological resources and services in a given year exceeds what Earth can regenerate in that year. This deficit arises from the liquidation of ecological resources and the accumulation of waste, primarily carbon dioxide in the atmosphere. To determine the date of Earth Overshoot Day for each year, GFN calculates the number of days of that year that Earth’s biocapacity suffices to provide for humanity’s ecological footprint. The remainder of the year corresponds to global overshoot. Earth Overshoot Day is computed by dividing the planet’s biocapacity (the amount of ecological resources Earth is able to generate that year), by humanity’s ecological footprint (humanity’s demand for that year), and multiplying by 365, the number of days in a year. This year Earth Overshoot Day is August 2, 2023. |
| 8 | United Nations (2023), Biodiversity – our strongest natural defense against climate change. Accessed at: https://www.un.org/en/climatechange/science/climate-issues/biodiversity#:~:text=Biodiversity%20 forms%20the%20web%20of,on%20forests%20for%20their%20livelihoods. |
| 9 | Pedder, K. and Wood, K. (2022), COP 15 – An opportunity for a healthier ocean. Accessed at: https://www.wri. org/insights/cop15-opportunity-healthier-ocean#:~:text=This%20marine%20biodiversity%20provides%20 countless,coastal%20biodiversity%20for%20their%20livelihoods. |
2
March, which United Nations Secretary-General António Guterres described as “a how-to guide to defuse the climate time-bomb; a survival guide for humanity.”10 Like numerous reports that have come before it, this report reiterates that systemic change is required across all sectors of the economy and notes that the changes that are currently being implemented are insufficient in terms of both their speed and scale. Simply put, humanity must rapidly escalate its efforts to develop a reciprocal relationship with nature.
In that regard, the Reporting Period was a watershed year for global policy changes and new international frameworks that we believe will spur corporate action to address biodiversity loss. In December 2022, delegates to the Convention on Biological Diversity Fifteenth Conference of the Parties (COP15) in Montreal adopted a landmark Global Biodiversity Framework (GBF) that established four goals for 2050, and 23 targets for 2030, to protect the world’s lands and oceans. Those goals and targets, which serve as a North Star for companies with respect to the integration of biodiversity considerations into their business operations and supply chains, were discussed in detail in the Fund’s most recent Semi-Annual Report. The GBF was followed, in March, by the approval of the Biodiversity Beyond National Jurisdiction (BBNJ) Agreement – commonly referred to as the High Seas Treaty – by delegates to the UN Convention on the Law of the Sea. Although the oceans account for two-thirds of the planet’s surface and 95% of the Earth’s total habitat by volume, prior to this landmark agreement only 39% of the oceans fell within the national jurisdiction of individual countries and protection protocols extended to only 1% of the high seas.11 The High Seas Treaty, which is 20 years in the making, allows for the designation of marine protected areas and thereby creates a vital pathway for realizing GBF Targets 2 and 3, which, among other things, seek to implement effective conservation and management measures across at least 30% of the world’s inland waters, coastal areas and oceans and to restore at least 30% of degraded inland waters and coastal and marine ecosystems. The High Seas Treaty also creates new ground rules for conducting environmental impact assessments of planned commercial activities on the high seas, provides for the equitable sharing of marine genetic resources among countries, and promotes capacity building by having wealthy nations share scientific knowledge and technologies with poorer countries.
Also, in March, the Task Force for Nature-Related Financial Disclosures (TNFD) released its final beta version framework, which introduced more specific guidance on metrics and risk management considerations for particular sectors and biomes. TNFD seeks to encourage early action by companies and financial institutions to report on their nature-related dependencies, impacts, risks and opportunities. The International Sustainability Standards Board (“ISSB”) is, in turn, working to operationalize the GBF and TNFD through the creation of an entirely new corporate disclosure landscape. It is expected that ISSB’s S1 Standard will require companies to disclose material information about their sustainability-related risks and opportunities. Importantly, current versions of the Standard incorporate the same definition of “material” that is used in the Accounting
| 10 | United Nations Environment Programme (2023), Time running out to defuse climate “time bomb”. Accessed at: https://www.unep.org/news-and-stories/story/time-running-out-defuse-climate-time-bomb. |
| 11 | World Economic Forum (2023), How the ‘Wild Wet West’ was won: why the UN High Seas Treaty is big news. Accessed at: https://cn.weforum.org/podcasts/radio-davos/episodes/high-seas-treaty. |
3
Standards promulgated by the International Financial Reporting Standards (IFRS) – that is, companies would be required to disclose sustainability information that could be reasonably expected to influence an investor’s decision if that information were absent, obscured, or misstated. ISSB’s S1 Standard is also expected to emphasize the need for consistency and connections between financial statements and sustainability disclosures by requiring financial statements and sustainability disclosures to be published at the same time. ISSB’s S2 Standard focuses on the disclosure of material information about climate-related risks and opportunities, including disclosure about physical risks (such as flood risk), transition risk (such as regulatory change), climate-related opportunities (such as new technologies), natural ecosystem dependencies and impacts, and the human aspects of the climate resilience transition, i.e. information relating to the attainment of a “just transition”. As part of its work to support the adoption of high-quality disclosures, the ISSB expects to issue guidance to support the initial use of the Standards with the goal of enabling companies at all stages of sustainability disclosure to scale up their use of them over time.
Finally, in May, the Science-Based Targets Network (SBTN) closed out the Reporting Period with its release of the first corporate science-based targets for nature. These initial targets cover freshwater quality (specific to nitrogen and phosphorus) and quantity as well as the protection and restoration of terrestrial ecosystems. The release, which forms part of a multi-year plan that will eventually include biodiversity and ocean targets, seeks to enable companies to take the right actions, in the right places and at the right time, to do their part to address nature loss.
Together these various agreements and frameworks have sharpened the focus on the importance of nature to humanity. Significant progress has now been made to develop a new nature-centric vernacular that should enable more productive conversations around the true value of nature. For the private sector, the conversation about nature is shifting to one that is more about competitiveness and less about being “green” or acting morally. Central banks and financial supervisors across the globe have also recognized that nature loss poses a significant threat to financial stability.12 All of which suggests that the foundation has now been laid for companies to become better guardians of the global commons and that the era of environmental free riding appears to be coming to an end.
PERFORMANCE
The Fund seeks to achieve long-term total returns by investing in companies that lead their industries in animal welfare performance. KBC’s strategy to achieve the Fund’s investment objective involves peer-relative evaluations of companies that operate in 19 industries with significant exposure to the five key drivers of biodiversity loss, which are (i) irresponsible land and ocean use, (ii) exploitation and over-use of species, (iii) climate change, (iv) pollution and (v) invasive and introduced species. The Fund’s holdings of companies operating in these industries together comprise at least 65 percent of the Fund’s assets. KBC also assesses companies that operate in other industries and that,
| 12 | Network for Greening the Financial System (NGFS) and International Network for Sustainable Financial Policy Insights, Research and Exchange (INSPIRE) Study Group on Biodiversity and Financial Stability (2022), Central banking and supervision in the biosphere: An agenda for action on biodiversity loss, financial risk and system stability. |
4
in KBC’s opinion, have made significant contributions to the advancement of biodiversity and animal welfare outside of their normal business operations. The companies in this group are referred to as Opportunity Companies and may comprise up to 35 percent of the Fund’s holdings at the time of purchase.
On a net basis, the ButterflyTM Class of the Fund outperformed its benchmark, the Morningstar Developed Markets (NR) Index (the “Morningstar Index”), by 332 basis points during the one-year period ended May 31, 2023 (the “Reporting Period”) and by 78 basis points on an annualized basis since inception. The net performance of the Butterfly Class in comparison to the Morningstar Index is shown in the following chart.
Performance Total Return % as of 05.31.23
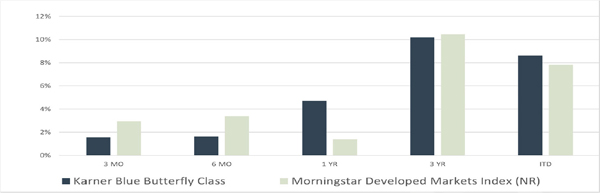
| ITD | |||||
| Total Return Percentage as of 05.31.2023 | 3 MO | 6 MO | 1 YR | 3 YR | 9.17.19 |
| Karner Blue Biodiversity Impact Fund ButterflyTM Class | 1.55 | 1.62 | 4.70 | 10.18 | 8.60 |
| Morningstar Developed Markets Index (NR) | 2.95 | 3.40 | 1.38 | 10.45 | 7.82 |
Returns for periods over one year are annualized.
ITD is the inception-to-date return from 9.17.2019 through 5.31.2023.
Source: Ultimus Fund Solutions, LLC
Past performance is not predictive of future performance. Investment results and principal value will fluctuate so that shares, when redeemed, may be worth less than their original cost. An investor should consider the investment objectives, risks, charges, and expenses of the Fund carefully before investing. The Fund’s prospectus contains this and other important information, and it should be read carefully before investing. Current performance may be lower or higher than the performance data quoted. For most recent month-end performance information or to obtain a prospectus, visit www.biodiversityimpactfund.com or call 1-855-KBANIML (855-522-6465).
The Fund’s outperformance during the Reporting Period was attributable to strong stock selection, particularly in the Industrials and Healthcare sectors, as well as the Fund’s overweight allocation to the Technology sector and the absence of any exposure to the oil and gas Energy sector. Stock selection in the Financial Services, Consumer Cyclical and Communication Services sectors also contributed significantly to the Fund’s
5
outperformance, but that was mostly offset by notably weak stock selection in the Technology sector. From a geographic perspective the Fund’s outperformance during the Reporting Period was primarily attributable to strong stock selection in the U.S., Germany and Japan and the Fund’s overweight allocations to France, Denmark and Italy.
The three stocks that most positively impacted Fund performance during the Reporting Period were as follows:
| Contribution | |
| to the Fund’s | |
| Return During | |
| the Fiscal | |
| Holding | Year |
| Blue Bird Corp. | 2.55% |
| Preformed Line Products Co. | 1.41% |
| First Solar Inc. | 1.04% |
The three stocks that most negatively impacted Fund performance during the Reporting Period were as follows:
| Contribution | |
| to the Fund’s | |
| Return During | |
| the Fiscal | |
| Holding | Year |
| Proterra Inc. | -1.06% |
| MP Materials Corp. | -0.93% |
| Lightning eMotors Inc. | -0.69% |
Proterra Inc. and Lightning eMotors Inc. were liquidated during the Reporting Period. The remaining four companies included in the charts above are discussed below.
Blue Bird Corporation (“Blue Bird”), a leader in electric and low-emission school bus design and production, was the leading contributor to Fund Performance during the Reporting Period. It delivered strong performance in Q2 FY 2023, reporting revenue of $299.8 million, exceeding FactSet estimates of $249.5 million and representing a significant increase from the same period in the previous year. Adjusted EBITDA for the quarter was $19.8 million, also surpassing FactSet estimates of $10.1 million. The strong results were driven by Blue Bird’s focus on enhancing operational efficiency, reducing fixed costs, and improving economics through pricing, all of which contributed to Blue Bird’s FY 2023 free cash flow guidance of $30 to $40 million. Blue Bird’s market demand for its best-in-class school buses remained strong, with nearly 5,800 units in backlog, and the company continued to expand its market share and leadership position in the zero-emission school bus category. It reported exceptional growth in electric school bus bookings, up 176%, and its firm order backlog of more than 620 electric school buses as of the end of April 2023 continued to grow. The company is also benefiting from the EPA’s Clean School Bus Rebate Program, which awarded nearly $1 billion in funding and
6
is expected to generate orders for an estimated 500 to 700 electric buses, translating into a minimum of $200 million of additional expected revenue. For all these reasons, we maintain a constructive outlook on Blue Bird.
Preformed Line Products Company (“PLP”), a maker of helical solutions, connectors, fiber optic and copper splice closures, solar hardware mounting applications, and electric vehicle charging station foundations, was the second largest contributor to Fund performance during the Reporting Period. For Q1 2023, the company reported revenues of $182 million, up 32% year over year, and earnings per share (“EPS”) of $4.28, up 72% year over year. The quarterly growth was driven by volume and price increases, and falling costs for shipping and raw materials (primarily resins, aluminum, and sand). The company also increased capacity, leading to lower lead times and a reduced backlog. PLP’s products support, protect, connect, terminate, and secure cables and wires used in overhead and underground networks for the energy, telecommunication, cable operator, and information (data communication) industries. PLP has benefited from the build-out of infrastructure that supports electrical transmission, electric vehicle charging and solar power, which, we believe, are important components of the transition away from fossil fuels. We maintain a constructive outlook for PLP in large part due to our expectation that significant investment will be required to modernize electrical grids across the globe. In addition, the company produces a range of products that enhance the visibility of power lines to birds, especially birds of prey, and reduce animal electrocutions, both of which also improve the resilience of the power grid. Furthermore, the company provides power line inspection services using drones that enable utilities to better manage vegetation and reduce the risk of forest fires.
First Solar, Inc. (“First Solar”), a leading global provider of photovoltaic (“PV”) solar panels, was the third largest contributor to Fund performance during the Reporting Period, largely driven by its Q4 2022 results. During the quarter, revenue of $1 billion was up 10% year over year, beating FactSet’s estimate of $944 million to $1.04 billion. EPS was -$0.07, down from $1.96 last year, but higher than consensus expectations of -$0.17. The company’s EPS guidance dramatically exceeded expectations due to the company’s inclusion of IRA tax incentives in its accounting beginning in the quarter. We maintain a constructive outlook on First Solar based, in part, on our view that the company’s unique cadmium-telluride technology sets it apart from its polysilicon-based competitors as well as our expectation that the build out of additional production capacity will enable it to meet the strong demand for its products and that the currently elevated shipping costs for those products will moderate over time. First Solar’s commitment to responsible solar energy is reflected in its efforts to reduce greenhouse gas emissions and water consumption, as well as its use of sustainable materials in its products. Additionally, the company has a recycling program for end-of-life solar panels, and it participates in various initiatives to promote renewable energy and combat climate change.
MP Materials Corporation (“MP Materials”), a rare earth materials supplier, was the second largest detractor to the Fund’s performance during the Reporting Period. In Q1 2023, the company reported non-GAAP EPS of $0.27 on revenue of $95.7 million resulting in adjusted EBITDA of $58.7 million, all above consensus estimates. Nevertheless, falling prices for the rare earth materials neodymium and praseodymium (NdPr) drove negative stock price performance. We maintain a constructive outlook for MP Materials based, in
7
part, on our view that MP Materials is well-positioned as the only sustainable rare earth materials supplier in the West and that rare earth materials are essential building-blocks for high strength magnets critical to carbon-reducing technologies like electric vehicles and wind turbines. MP Materials also recently entered into a strategic relationship with Sumitomo Corporation in Japan (a key magnet market) and is working to restore the U.S. rare earth magnetics supply chain with the construction of a magnet recycling plant in Texas and the first processing and separation facility for heavy rare earth elements in the United States. Additionally, at its Mountain Pass site, MP Materials operates a closed-loop, zero-discharge rare earth facility with a dry tailings process that enables the company to recirculate more than 90% of its process water while avoiding the need for high-risk wet tailings ponds.
OUTLOOK
The Reporting Period was characterized by the gradual emergence of “cautious optimism” – both for the improving prospects of a soft landing for the global economy, where inflation returns to normal levels without the onset of a significant economic downturn, and the significant global policy progress that has been made to protect the web of organisms, ecosystems and genes that form the basis of life on Earth.
On the economic front, the first third of the Reporting Period began on a notably dour note. The risk that the global economy could slip into a stagflationary cycle loomed large amid fears of oil and gas shortages and persistent supply chain constraints fueled by the war in Ukraine and China’s ongoing Covid-related shutdown. In an effort to keep inflation expectations anchored, the Federal Reserve tightened U.S. monetary policy at an unprecedented rate at the start of the Reporting Period by implementing four consecutive 75 basis point Fed Funds rate hikes. Other central banks across the globe also acted to tame rising prices in their countries resulting in a degree of monetary policy synchronicity not seen over the past five decades. As the calendar rolled into the second third of the Reporting Period, evidence slowly emerged that the central bank interventions and falling commodity prices – especially prices for oil and natural gas – were beginning to dampen inflation. However, inflation rates remained stubbornly elevated, which prompted the Federal Reserve to maintain a hawkish stance and push through four more interest rate hikes during the Reporting Period totaling 125 basis points. Nevertheless, persistently strong consumer spending, fueled by historically low unemployment, pent-up Covid-related demand, and unusually high household savings as a result of reduced activity during the pandemic, resulted in an unexpectedly resilient global economy. Stock markets were also bolstered by the proliferation of artificial intelligence (AI), specifically Large Language Models. While the Fund holds positions in significant developers and beneficiaries of AI (such as Microsoft and Salesforce) it remains underweight traditional Technology, with most of its Technology exposure coming from the Renewable Energy sector.
At the start of 2023, reports of surprisingly strong global GDP growth together with moderating inflation and easing supply chain constraints renewed hopes for a soft landing. Recession fears spiked following the sudden emergence of a banking crisis headlined by the closures of Silicon Valley Bank and Signature Bank in the U.S. and the shotgun marriage of Credit Suisse and UBS, both of which presaged tighter lending
8
standards with essentially the same effect as tighter monetary policy. However, banking regulators appear to have skillfully navigated that storm as global central banks made adjustments to their monetary policy outlooks in recognition of the potential drag on growth from the crisis. Nevertheless, some banking sector concerns persist. First, the commercial real estate market remains fragile as the work-from-home phenomenon has cut into office building occupancy rates and higher interest rates have made it much harder to refinance maturing loans. That combination has prompted some analysts to anticipate a significant decline of office and retail property valuations, which could provide the spark for another banking crisis. Second, the recent U.S. Supreme Court decision that the Biden Administration does not have the authority to forgive student debt and the resumption of student loan repayments in the U.S. at the end of the summer will affect approximately 43 million American adults.13 The concomitant drag on discretionary income and drawdown of savings is expected to shave approximately one-quarter of a percentage point off of annual U.S. GDP growth and may prompt the Federal Reserve to reconsider the wisdom of future rate hikes.14
From a global perspective, the Chinese Communist Party’s about-face in December with regard to its stringent Covid lockdown was a welcome policy shift, but the country’s growth has not rebounded as quickly as some analysts had expected. The world’s second largest economy grew a paltry 3.0% in 2022, which was the lowest growth rate since 1976 (other than 2020 when Covid struck) and far below the government’s target growth rate of 5.5%.15 While that sluggishness weighed on global sales across many sectors in 2022, this year’s growth rate is expected to be much closer to the government’s target which would enable China to buttress global growth if other major economies falter. Although many global supply chain issues have been resolved, pockets of scarcity still remain, and China’s reopening could help to bring those markets back into balance. Geopolitically, tensions between the U.S. and China have flared regularly during the Reporting Period as both countries vie for economic and cultural dominance, acting through trade restrictions, public commentary, and periodic military provocations. The US is determined to limit Chinese access to advanced microchips in its effort to retain a technological edge, while China controls much of the renewable energy and battery supply chain, which is integral to US renewable energy goals. For that reason, in signing the Inflation Reduction Act, President Biden offered generous incentives for renewable energy equipment manufacturers to build new plants in the US, rather than China, which they have begun to do.
| 13 | Hahn, A. and Tarver, J. (2023), 2023 Student Loan Debt Statistics: Average Student Loan Debt. (Forbes). Accessed at: https://www.forbes.com/advisor/student-loans/average-student-loan-debt-statistics/#:~:text=The%20federal%20student%20loan%20portfolio,breaks%20down%20by%20loan%20type. |
| 14 | Davidson, P. (2023), As recession threatens, Supreme Court student loan forgiveness ruling may hurt the economy. (USA Today). Accessed at: https://www.usatoday.com/story/money/2023/06/30/supreme-court-student-loan-economy/70374412007/. |
| 15 | Trading Economics (2023), China Full-Year GDP Growth. Accessed at: https://tradingeconomics.com/china/full-year-gdp-growth. |
9
China also continues to pose a threat to global economic stability as the key lender to many developing countries. Many of these countries borrowed heavily over the past decade while interest rates were low and that borrowing accelerated sharply during the pandemic as governments lacked funds to support social spending during the lockdown. The sudden shift in interest rates has not only increased the borrowing costs for those countries but has also fueled currency depreciation, which has added further inflationary pressure at a time when purchasing power in many of those countries is already rapidly declining. As a result, approximately three in five low-income countries are now struggling to pay their debts or are at risk of defaulting.16 Some countries are at a point where they can only pay their debt by implementing harsh austerity measures that reduces funding for vital social programs, health care, education and farmer assistance, among other things. Nevertheless, according to an Associated Press analysis, China is resisting loan forgiveness in order to avoid incurring large losses and is maintaining secrecy regarding the amount and terms of the loans it has outstanding, which has caused other creditor countries to refrain from unilaterally extending aid packages.17 Tensions are now growing between China and the U.S. and its Western allies as finance officials grow increasingly frustrated by China’s hardline approach, which is squeezing countries and exacerbating poverty.
Finally, it is important to note the very significant progress that was made during the Reporting Period with respect to the renewable energy transition. According to the International Energy Agency’s (IEA) World Energy Investment 2023 report released in May, “[t]he recovery from the Covid-19 pandemic and the response to the global energy crisis have provided a major boost to global clean energy investment.”18 Of the $2.8 trillion that the IEA projects will be invested in energy in 2023, more than $1.7 trillion will be allocated to “clean energy, including renewable power, nuclear, grids, storage, low-emission fuels, efficiency improvements and end-use renewables and electrification.” Unfortunately, that leaves approximately $1 trillion that will be invested in “unabated fossil fuel supply and power,” but that means that for every $1 spent on fossil fuels in 2023, $1.70 will be spent on clean energy, a significant improvement from the 1:1 ratio just five years ago.
| 16 | Behsudi, A. (2023), The ‘rift is there’: China vs. the World on global debt. (Politico). Accessed at: https://www.politico.com/news/2023/04/11/china-lending-imf-world-bank-00090588. |
| 17 | Condon, B. (2023), China’s loans pushing world’s poorest countries to the brink of collapse. (Associated Press). Accessed at: https://leads.ap.org/best-of-the-week/chinas-loans. |
| 18 | International Energy Agency (2023), World Energy Investment 2023. Accessed at: https://www.iea.org/ reports/world-energy-investment-2023/overview-and-key-findings. |
10
CONCLUSION
On behalf of the entire Karner Blue Capital team we thank you for your investment in the Karner Blue Biodiversity Impact Fund and look forward to continuing to work with you to build a shared future for all life.
Sincerely,
| Vicki L. Benjamin | Andrew K. Niebler |
| President & Co-Founder | Executive Vice President & Co-Founder |
| Karner Blue Capital, LLC | Karner Blue Capital, LLC |
Past performance is not predictive of future performance. Investment results and principal value will fluctuate so that shares, when redeemed, may be worth more or less than their original cost. Current performance may be higher or lower than the performance data quoted. Performance data current to the most recent month end are available by calling 1-855-KBANIML (855-522-6465).
An investor should consider the investment objectives, risks, charges, and expenses of the Fund carefully before investing. The Fund’s prospectus contains this and other important information. To obtain a copy of the Fund’s prospectus please visit our website at www.biodiversityimpactfund.com or call 1-855-KBANIML (855-522-6465) and a copy will be sent to you free of charge. Please read the prospectus carefully before you invest. The Karner Blue Biodiversity Impact Fund is distributed by Ultimus Fund Distributors, LLC.
The Letter to Shareholders seeks to describe some of the Adviser’s current opinions and views of the financial markets. Although the Adviser believes it has a reasonable basis for any opinions or views expressed, actual results may differ, sometimes significantly so, from those expected or expressed. The securities held by the Fund that are discussed in the Letter to Shareholders were held during the period covered by this Report. They do not comprise the entire investment portfolio of the Fund, may be sold at any time and may no longer be held by the Fund. For a complete list of securities held by the Fund as of May 31, 2023, please see the Schedule of Investments section of the Annual Report. The opinions of the Adviser with respect to those securities may change at any time.
Statements in the Letter to Shareholders that reflect projections or expectations for future financial or economic performance of the Fund and the market in general and statements of the Fund’s plans and objectives for future operations are forward-looking statements. No assurance can be given that actual results or events will not differ materially from those projected, estimated, assumed, or anticipated in any such forward- looking statements. Important factors that could result in such differences, in addition to factors noted with such forward-looking statements include, without limitation, general economic conditions, such as inflation, recession, and interest rates. Past performance is not a guarantee of future results.
11
| KARNER BLUE BIODIVERSITY IMPACT FUND |
| PERFORMANCE INFORMATION |
| May 31, 2023 (Unaudited) |
Comparison of the Change in Value of a $10,000 Investment in
Karner Blue Biodiversity Impact Fund - Butterfly™ Class (since inception on
09/17/2019) versus the Morningstar Developed Markets NR USD Index
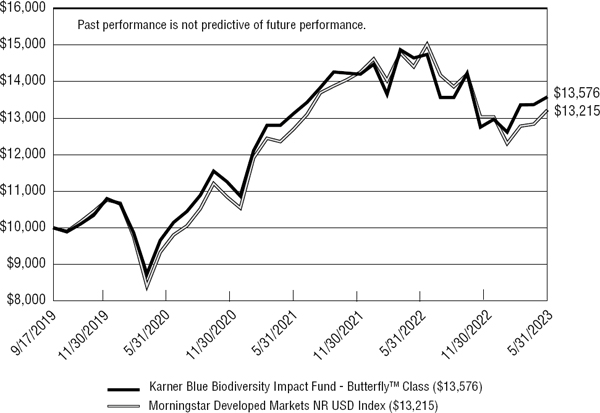
| Average Annual Total Returns (for the periods ended May 31, 2023) | |||||||
| Since Inception | |||||||
| 1 Year | 3 Years | (09/17/2019) | |||||
| Karner Blue Biodiversity Impact Fund -Butterfly™ Class (a) | 4.70% | 10.18% | 8.60% | ||||
| Morningstar Developed Markets NR USD Index (b) | 1.38% | 10.45% | 7.82% | ||||
| (a) | The Fund’s total returns do not reflect the deduction of taxes a shareholder would pay on Fund distributions or the redemption of Fund shares. |
| (b) | The Morningstar Developed Markets NR USD Index measures the performance of developed regional markets targeting the top 97% of stocks by market capitalization. This index does not incorporate Environmental, Social, or Governance (ESG) criteria. The Index is unmanaged and shown for illustration purposes only. An investor cannot invest in an index and its return is not indicative of the performance of any specific investment. |
Karner Blue Biodiversity Impact Fund (the “Fund”) is not sponsored, endorsed, sold or promoted by Morningstar, Inc. or any of its affiliates (all such entities, collectively, “Morningstar Entities”). The Morningstar Entities make no representation or warranty, express or implied, to the owners of the Fund or any member of the public regarding the advisability of investing in equity securities generally or in the Fund in particular
12
| KARNER BLUE BIODIVERSITY IMPACT FUND |
| PERFORMANCE INFORMATION |
| May 31, 2023 (Unaudited) (Continued) |
or the ability of the Fund to track general equity market performance. THE MORNINGSTAR ENTITIES DO NOT GUARANTEE THE ACCURACY AND/OR THE COMPLETENESS OF THE FUND OR ANY DATA INCLUDED THEREIN AND MORNINGSTAR ENTITIES SHALL HAVE NO LIABILITY FOR ANY ERRORS, OMISSIONS, OR INTERRUPTIONS THEREIN.
13
| KARNER BLUE BIODIVERSITY IMPACT FUND |
| PORTFOLIO INFORMATION |
| May 31, 2023 (Unaudited) |
Portfolio Allocation (% of Net Assets)
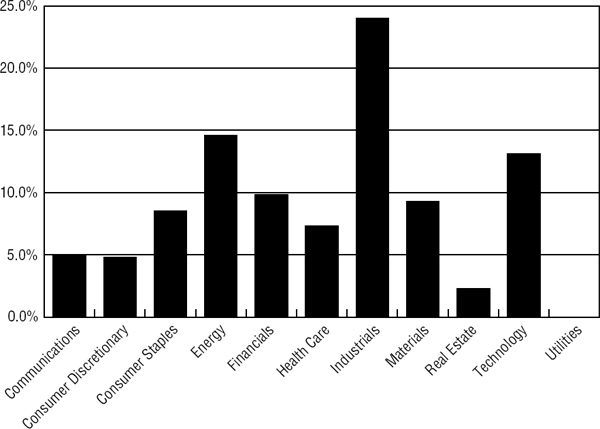
Top 10 Equity Holdings
| % of | |
| Security Description | Net Assets |
| Preformed Line Products Company | 3.4% |
| Enphase Energy, Inc. | 3.4% |
| Microsoft Corporation | 3.3% |
| SolarEdge Technologies, Inc. | 2.4% |
| Blue Bird Corporation | 2.3% |
| Alphabet, Inc. - Class A | 2.3% |
| Eaton Corporation plc | 2.2% |
| EnerSys | 2.2% |
| Panasonic Holdings Corporation - ADR | 2.1% |
| Schneider Electric SE - ADR | 2.1% |
14
| KARNER BLUE BIODIVERSITY IMPACT FUND |
| SCHEDULE OF INVESTMENTS |
| May 31, 2023 |
| COMMON STOCKS — 98.7% | Shares | Value | ||||||
| Communications — 5.0% | ||||||||
| Entertainment Content — 1.2% | ||||||||
| Walt Disney Company (The) (a) | 1,440 | $ | 126,662 | |||||
| Internet Media & Services — 2.3% | ||||||||
| Alphabet, Inc. — Class A (a) | 1,885 | 231,610 | ||||||
| Telecommunications — 1.5% | ||||||||
| Iridium Communications, Inc. | 2,571 | 154,363 | ||||||
| Consumer Discretionary — 4.8% | ||||||||
| Automotive — 1.7% | ||||||||
| Bayerische Moteren Werke AG — ADR | 4,790 | 174,260 | ||||||
| Home & Office Products — 2.1% | ||||||||
| Panasonic Holdings Corporation — ADR | 20,590 | 214,136 | ||||||
| Leisure Facilities & Services — 1.0% | ||||||||
| Sweetgreen, Inc. — Class A (a) | 10,700 | 101,971 | ||||||
| Consumer Staples — 8.5% | ||||||||
| Beverages — 1.4% | ||||||||
| PepsiCo, Inc. | 805 | 146,792 | ||||||
| Food — 2.8% | ||||||||
| Associated British Foods plc — ADR | 4,950 | 112,464 | ||||||
| TreeHouse Foods, Inc. (a) | 3,655 | 173,064 | ||||||
| 285,528 | ||||||||
| Household Products — 0.9% | ||||||||
| Unilever plc — ADR | 1,956 | 97,683 | ||||||
| Retail — Consumer Staples — 3.4% | ||||||||
| Kroger Company (The) | 3,545 | 160,695 | ||||||
| Walmart, Inc. | 1,270 | 186,525 | ||||||
| 347,220 | ||||||||
15
| KARNER BLUE BIODIVERSITY IMPACT FUND |
| SCHEDULE OF INVESTMENTS (Continued) |
| COMMON STOCKS — 98.7% (Continued) | Shares | Value | ||||||
| Energy — 14.6% | ||||||||
| Renewable Energy — 14.6% | ||||||||
| Array Technologies, Inc. (a) | 9,245 | $ | 204,962 | |||||
| EnerSys | 2,311 | 224,791 | ||||||
| Enphase Energy, Inc. (a) | 1,987 | 345,500 | ||||||
| First Solar, Inc. (a) | 470 | 95,391 | ||||||
| Shoals Technologies Group, Inc. — Class A (a) | 7,840 | 184,162 | ||||||
| SolarEdge Technologies, Inc. (a) | 881 | 250,935 | ||||||
| Stem, Inc. (a) | 15,420 | 85,118 | ||||||
| Vestas Wind Systems A/S — ADR (a) | 11,300 | 107,124 | ||||||
| 1,497,983 | ||||||||
| Financials — 9.8% | ||||||||
| Asset Management — 1.6% | ||||||||
| UBS Group AG | 8,500 | 160,735 | ||||||
| Banking — 6.0% | ||||||||
| Bank of Montreal | 1,330 | 110,935 | ||||||
| BNP Paribas S.A. — ADR | 6,182 | 179,402 | ||||||
| Citigroup, Inc. | 3,460 | 153,347 | ||||||
| ING Groep N.V. — ADR | 14,253 | 174,884 | ||||||
| 618,568 | ||||||||
| Institutional Financial Services — 0.9% | ||||||||
| Goldman Sachs Group, Inc. (The) | 290 | 93,931 | ||||||
| Insurance — 1.3% | ||||||||
| AXA S.A. — ADR | 4,610 | 130,417 | ||||||
| Health Care — 7.3% | ||||||||
| Biotech & Pharma — 7.3% | ||||||||
| AstraZeneca plc — ADR | 2,430 | 177,585 | ||||||
| Bristol-Myers Squibb Company | 1,805 | 116,314 | ||||||
| Merck & Company, Inc. | 875 | 96,609 | ||||||
| Novo Nordisk A/S — ADR | 1,240 | 198,970 | ||||||
| Sanofi — ADR | 3,195 | 163,009 | ||||||
| 752,487 | ||||||||
16
| KARNER BLUE BIODIVERSITY IMPACT FUND |
| SCHEDULE OF INVESTMENTS (Continued) |
| COMMON STOCKS — 98.7% (Continued) | Shares | Value | ||||||
| Industrials — 24.0% | ||||||||
| Commercial Support Services — 1.7% | ||||||||
| Heritage-Crystal Clean, Inc. (a) | 5,190 | $ | 172,100 | |||||
| Diversified Industrials — 2.2% | ||||||||
| Eaton Corporation plc | 1,300 | 228,670 | ||||||
| Electrical Equipment — 13.8% | ||||||||
| ABB Ltd. — ADR | 4,200 | 153,090 | ||||||
| Carrier Global Corporation | 4,535 | 185,482 | ||||||
| Daikin Industrials Ltd. — ADR | 10,380 | 196,701 | ||||||
| Preformed Line Products Company | 2,297 | 353,072 | ||||||
| Prysmian S.p.A. — ADR | 10,010 | 186,086 | ||||||
| Schneider Electric SE — ADR | 6,163 | 212,315 | ||||||
| Trimble, Inc. (a) | 2,720 | 126,942 | ||||||
| 1,413,688 | ||||||||
| Engineering & Construction — 1.8% | ||||||||
| Quanta Services, Inc. | 1,065 | 189,123 | ||||||
| Machinery — 2.2% | ||||||||
| AGCO Corporation | 1,030 | 113,588 | ||||||
| CNH Industrial N.V. | 9,050 | 116,112 | ||||||
| 229,700 | ||||||||
| Transportation Equipment — 2.3% | ||||||||
| Blue Bird Corporation (a) | 9,320 | 236,355 | ||||||
| Materials — 9.3% | ||||||||
| Chemicals — 1.0% | ||||||||
| Air Products & Chemicals, Inc. | 380 | 102,273 | ||||||
| Construction Materials — 1.4% | ||||||||
| CRH plc — ADR | 3,105 | 147,612 | ||||||
17
| KARNER BLUE BIODIVERSITY IMPACT FUND |
| SCHEDULE OF INVESTMENTS (Continued) |
| COMMON STOCKS — 98.7% (Continued) | Shares | Value | ||||||
| Materials — 9.3% (Continued) | ||||||||
| Metals & Mining — 6.9% | ||||||||
| Heidelberg Materials AG — ADR | 8,103 | $ | 116,035 | |||||
| Livent Corporation (a) | 9,120 | 210,216 | ||||||
| MP Materials Corporation (a) | 7,072 | 146,532 | ||||||
| Newmont Corporation | 3,477 | 140,992 | ||||||
| Sibanye Stillwater Ltd. — ADR | 13,825 | 98,711 | ||||||
| 712,486 | ||||||||
| Real Estate — 2.3% | ||||||||
| REITs — 2.3% | ||||||||
| Gladstone Land Corporation | 8,160 | 129,010 | ||||||
| Prologis, Inc. | 830 | 103,376 | ||||||
| 232,386 | ||||||||
| Technology — 13.1% | ||||||||
| Semiconductors — 3.2% | ||||||||
| Analog Devices, Inc. | 875 | 155,479 | ||||||
| Infineon Technologies AG — ADR | 4,780 | 177,338 | ||||||
| 332,817 | ||||||||
| Software — 6.2% | ||||||||
| Autodesk, Inc. (a) | 593 | 118,238 | ||||||
| Microsoft Corporation | 1,019 | 334,629 | ||||||
| Salesforce, Inc. (a) | 820 | 183,172 | ||||||
| 636,039 | ||||||||
| Technology Hardware — 3.7% | ||||||||
| Cisco Systems, Inc. | 2,190 | 108,777 | ||||||
| FUJIFILM Holdings Corporation — ADR | 2,750 | 167,613 | ||||||
| Murata Manufacturing Company Ltd. — ADR | 7,230 | 105,630 | ||||||
| 382,020 | ||||||||
| Total Common Stocks (Cost $8,931,636) | $ | 10,149,615 | ||||||
18
| KARNER BLUE BIODIVERSITY IMPACT FUND |
| SCHEDULE OF INVESTMENTS (Continued) |
| MONEY MARKET FUNDS — 2.2% | Shares | Value | ||||||
| First American Government Obligations Fund - Class X, 4.97% (b) (Cost $223,287) | 223,287 | $ | 223,287 | |||||
| Investments at Value — 100.9% (Cost $9,154,923) | $ | 10,372,902 | ||||||
| Liabilities in Excess of Other Assets — (0.9%) | (89,135 | ) | ||||||
| Net Assets — 100.0% | $ | 10,283,767 | ||||||
A/S - Aktieselskab
ADR - American Depositary Receipt
AG - Aktiengesellschaft
N.V. - Naamloze Vennootschap
plc - Public Limited Company
S.A. - Societe Anonyme
SE - Societe Europaea
S.p.A. - Societa per Azioni
| (a) | Non-income producing security. |
| (b) | The rate shown is the 7-day effective yield as of May 31, 2023. |
See accompanying notes to financial statements.
19
| KARNER BLUE BIODIVERSITY IMPACT FUND |
| STATEMENT OF ASSETS AND LIABILITIES |
| May 31, 2023 |
| ASSETS | ||||
| Investments in securities: | ||||
| At cost | $ | 9,154,923 | ||
| At value (Note 2) | $ | 10,372,902 | ||
| Receivable for capital shares sold | 350 | |||
| Receivable for investment securities sold | 28,395 | |||
| Receivable from Adviser (Note 4) | 20,054 | |||
| Dividend receivable | 34,515 | |||
| Tax reclaims receivable | 50 | |||
| Other assets | 4,579 | |||
| Total assets | 10,460,845 | |||
| LIABILITIES | ||||
| Payable for investment securities purchased | 158,778 | |||
| Payable to administrator (Note 4) | 7,589 | |||
| Accrued administrative services fee (Note 4) | 317 | |||
| Other accrued expenses | 10,394 | |||
| Total liabilities | 177,078 | |||
| NET ASSETS | $ | 10,283,767 | ||
| NET ASSETS CONSIST OF: | ||||
| Paid-in capital | $ | 9,438,366 | ||
| Distributable earnings | 845,401 | |||
| NET ASSETS | $ | 10,283,767 | ||
| NET ASSET VALUE PER SHARE: | ||||
| BUTTERFLYTM CLASS | ||||
| Net assets applicable to ButterflyTM Class | $ | 10,283,767 | ||
| ButterflyTM Class shares of beneficial interest outstanding (unlimited number of shares authorized, no par value) | 870,798 | |||
| Net asset value, offering price and redemption price per share (Note 2) | $ | 11.81 |
See accompanying notes to financial statements.
20
| KARNER BLUE BIODIVERSITY IMPACT FUND |
| STATEMENT OF OPERATIONS |
| Year Ended May 31, 2023 |
| INVESTMENT INCOME | ||||
| Dividend income | $ | 186,449 | ||
| Foreign witholding taxes on dividends | (19,806 | ) | ||
| Total investment income | 166,643 | |||
| EXPENSES | ||||
| Management fees (Note 4) | 75,255 | |||
| Fund accounting fees (Note 4) | 30,942 | |||
| Administration fees (Note 4) | 30,000 | |||
| Legal fees | 23,638 | |||
| Trustees’ fees and expenses (Note 4) | 19,183 | |||
| Transfer agent fees (Note 4) | 18,000 | |||
| Audit and tax services fees | 15,911 | |||
| Registration and filing fees | 15,658 | |||
| Compliance fees and expenses (Note 4) | 12,349 | |||
| Shareholder reporting expenses | 11,097 | |||
| Custody and bank service fees | 7,886 | |||
| Postage and supplies | 3,681 | |||
| Insurance expense | 3,234 | |||
| Administrative services fees (Note 4) | 418 | |||
| Other expenses | 20,002 | |||
| Total expenses | 287,254 | |||
| Less fee reductions and expense reimbursements by Adviser (Note 4) | (197,888 | ) | ||
| Net expenses | 89,366 | |||
| NET INVESTMENT INCOME | 77,277 | |||
| REALIZED AND UNREALIZED GAINS (LOSSES) ON INVESTMENTS AND FOREIGN CURRENCIES | ||||
| Net realized losses from: | ||||
| Investments | (414,971 | ) | ||
| Foreign currency transactions (Note 2) | (45 | ) | ||
| Net change in unrealized appreciation (depreciation) on: | ||||
| Investments | 806,662 | |||
| NET REALIZED AND UNREALIZED GAINS ON INVESTMENTS AND FOREIGN CURRENCIES | 391,646 | |||
| NET INCREASE IN NET ASSETS RESULTING FROM OPERATIONS | $ | 468,923 |
See accompanying notes to financial statements.
21
| KARNER BLUE BIODIVERSITY IMPACT FUND |
| STATEMENTS OF CHANGES IN NET ASSETS |
| Year Ended | Year Ended | |||||||
| May 31, | May 31, | |||||||
| 2023 | 2022 | |||||||
| FROM OPERATIONS | ||||||||
| Net investment income | $ | 77,277 | $ | 115,028 | ||||
| Net realized gains (losses) from investment and foreign currency translations | (415,016 | ) | 552,591 | |||||
| Net change in unrealized appreciation (depreciation) on investments and currency translation | 806,662 | (1,594,020 | ) | |||||
| Net increase (decrease) in net assets resulting from operations | 468,923 | (926,401 | ) | |||||
| FROM DISTRIBUTIONS TO SHAREHOLDERS (Note 2) | ||||||||
| Butterfly Class | (212,629 | ) | (1,070,587 | ) | ||||
| CAPITAL SHARE TRANSACTIONS | ||||||||
| ButterflyTM Class | ||||||||
| Proceeds from shares sold | 961,745 | 246,015 | ||||||
| Net asset value of shares issued in reinvestment of distributions to shareholders | 93,610 | 439,792 | ||||||
| Payments for shares redeemed | (276,124 | ) | (243,227 | ) | ||||
| Net increase in ButterflyTM Class net assets from capital share transactions | 779,231 | 442,580 | ||||||
| TOTAL INCREASE (DECREASE) IN NET ASSETS | 1,035,525 | (1,554,408 | ) | |||||
| NET ASSETS | ||||||||
| Beginning of year | 9,248,242 | 10,802,650 | ||||||
| End of year | $ | 10,283,767 | $ | 9,248,242 | ||||
| CAPITAL SHARE ACTIVITY | ||||||||
| ButterflyTM Class | ||||||||
| Shares sold | 84,772 | 18,529 | ||||||
| Shares reinvested | 8,502 | 34,386 | ||||||
| Shares redeemed | (23,535 | ) | (18,705 | ) | ||||
| Net increase in shares outstanding | 69,739 | 34,210 | ||||||
| Shares outstanding at beginning of year | 801,059 | 766,849 | ||||||
| Shares outstanding at end of year | 870,798 | 801,059 | ||||||
See accompanying notes to financial statements.
22
| KARNER BLUE BIODIVERSITY IMPACT FUND |
| BUTTERFLYTM CLASS |
| FINANCIAL HIGHLIGHTS |
Per Share Data for a Share Outstanding Throughout Each Period:
| Year Ended | Year Ended | Year Ended | Period Ended | |||||||||||||
| May 31, | May 31, | May 31, | May 31, | |||||||||||||
| 2023 | 2022 | 2021 | 2020 (a) | |||||||||||||
| Net asset value at beginning of period | $ | 11.55 | $ | 14.09 | $ | 10.14 | $ | 10.00 | ||||||||
| Income (loss) from investment operations: | ||||||||||||||||
| Net investment income (b) | 0.09 | 0.15 | 0.15 | 0.10 | ||||||||||||
| Net realized and unrealized gains (losses) on investments and foreign currencies | 0.43 | (1.30 | ) | 3.94 | 0.05 | (c) | ||||||||||
| Total from investment operations | 0.52 | (1.15 | ) | 4.09 | 0.15 | |||||||||||
| Less distributions from: | ||||||||||||||||
| Net investment income | (0.05 | ) | (0.10 | ) | (0.14 | ) | (0.01 | ) | ||||||||
| Net realized gains | (0.21 | ) | (1.29 | ) | — | — | ||||||||||
| Total distributions | (0.26 | ) | (1.39 | ) | (0.14 | ) | (0.01 | ) | ||||||||
| Net asset value at end of period | $ | 11.81 | $ | 11.55 | $ | 14.09 | $ | 10.14 | ||||||||
| Total return (d) | 4.70 | % | (9.07 | %) | 40.49 | % | 1.50 | % (e) | ||||||||
| Net assets at end of period (000’s) | $ | 10,284 | $ | 9,248 | $ | 10,803 | $ | 5,514 | ||||||||
| Ratios/supplementary data: | ||||||||||||||||
| Ratio of total expenses to average net assets | 3.05 | % | 2.85 | % | 3.62 | % | 5.32 | % (f) | ||||||||
| Ratio of net expenses to average net assets (g) | 0.95 | % | 0.92 | % | 0.85 | % | 0.85 | % (f) | ||||||||
| Ratio of net investment income to average net assets (g) | 0.82 | % | 1.11 | % | 1.20 | % | 1.47 | % (f) | ||||||||
| Portfolio turnover rate | 77 | % | 84 | % | 55 | % | 61 | % (e) | ||||||||
| (a) | Represents the period from the commencement of operations (September 17, 2019) through May 31, 2020. |
| (b) | Net investment income per share has been determined on the basis of average number of shares outstanding during the period. |
| (c) | Represents a balancing figure derived from other amounts in the financial highlights table that captures all other changes affecting net asset value per share. This per share amount does not correlate to the aggregrate of the net realized and unrealized losses on the Statement of Operations for the same period. |
| (d) | Total return is a measure of the change in value of an investment in the Fund over the periods covered. The returns shown do not reflect the deduction of taxes a shareholder would pay on Fund distributions, if any, or the redemption of Fund shares. The total returns would be lower if the Adviser had not reduced management fees and reimbursed expenses (Note 4). |
| (e) | Not annualized. |
| (f) | Annualized. |
| (g) | Ratio was determined after management fee reductions and expense reimbursements (Note 4). |
See accompanying notes to financial statements.
23
| KARNER BLUE BIODIVERSITY IMPACT FUND |
| NOTES TO FINANCIAL STATEMENTS |
| May 31, 2023 |
1. Organization
Karner Blue Biodiversity Impact Fund (the “Fund”) is a diversified series of Ultimus Managers Trust (the “Trust”), an open-end investment company established as an Ohio business trust under a Declaration of Trust dated February 28, 2012. Other series of the Trust are not incorporated in this report.
The investment objective of the Fund is to seek to achieve long-term total returns by investing in companies that lead their industries in animal welfare performance.
The Fund currently offers one class of shares: Butterfly™ Class shares (sold without any sales loads and distribution and/or shareholder service fees but subject to an administrative service fee of up to 0.10% of the average net assets, and requiring a $2,000 initial investment).
2. Significant Accounting Policies
The following is a summary of the Fund’s significant accounting policies. The policies are in conformity with accounting principles generally accepted in the United States of America (“GAAP”). The Fund follows accounting and reporting guidance under Financial Accounting Standards Board Accounting Standards Codification Topic 946, “Financial Services – Investment Companies.”
Securities valuation – The Fund values its portfolio securities at market value as of the close of regular trading on the New York Stock Exchange (the “NYSE”) (normally 4:00 p.m. Eastern time) on each business day the NYSE is open for business. The Fund values its listed securities on the basis of the security’s last sale price on the security’s primary exchange, if available, otherwise at the exchange’s most recently quoted mean price. NASDAQ-listed securities are valued at the NASDAQ Official Closing Price. Investments representing shares of other open-end investment companies, other than exchange-traded funds, if any, but including money market funds, are valued at their net asset value (“NAV”) as reported by such companies. When using a quoted price and when the market is considered active, the security will be classified as Level 1 within the fair value hierarchy (see below). In the event that market quotations are not readily available or are considered unreliable due to market or other events, the Fund values its securities and other assets at fair value as determined by Karner Blue Capital, LLC (the “Adviser”), as the Fund’s valuation designee, in accordance with procedures adopted by the Board of Trustees (the “Board”) pursuant to Rule 2a-5 under the Investment Company Act of 1940, as amended (the “1940 Act”). Under these procedures, the securities will be classified as Level 2 or 3 within the fair value hierarchy, depending on the inputs used. Unavailable or unreliable market quotes may be due to the following factors: a substantial bid-ask spread; infrequent sales resulting in stale prices; insufficient trading volume; small trade sizes; a temporary lapse in any reliable pricing source; and actions of the securities or
24
| KARNER BLUE BIODIVERSITY IMPACT FUND |
| NOTES TO FINANCIAL STATEMENTS (Continued) |
futures markets, such as the suspension or limitation of trading. As a result, the prices of securities used to calculate the Fund’s NAV may differ from quoted or published prices for the same securities.
GAAP establishes a single authoritative definition of fair value, sets out a framework for measuring fair value, and requires additional disclosures about fair value measurements.
Various inputs are used in determining the value of the Fund’s investments. These inputs are summarized in the three broad levels listed below:
| ● | Level 1 – quoted prices in active markets for identical securities |
| ● | Level 2 – other significant observable inputs |
| ● | Level 3 – significant unobservable inputs |
The inputs or methods used for valuing securities are not necessarily an indication of the risks associated with investing in those securities. The inputs used to measure fair value may fall into different levels of the fair value hierarchy. In such cases, for disclosure purposes, the level in the fair value hierarchy within which the fair value measurement falls in its entirety is determined based on the lowest level input that is significant to the fair value measurement.
The following is a summary of the Fund’s investments and the inputs used to value the investments as of May 31, 2023:
| Level 1 | Level 2 | Level 3 | Total | |||||||||||||
| Common Stocks | $ | 10,149,615 | $ | — | $ | — | $ | 10,149,615 | ||||||||
| Money Market Funds | 223,287 | — | — | 223,287 | ||||||||||||
| Total | $ | 10,372,902 | $ | — | $ | — | $ | 10,372,902 | ||||||||
Refer to the Fund’s Schedule of Investments for a listing of securities by sector and industry type. The Fund did not hold any derivative instruments or any assets or liabilities that were measured at fair value on a recurring basis using significant unobservable inputs (Level 3) as of or during the year ended May 31, 2023.
Share valuation – The NAV per share of the Fund is calculated daily by dividing the total value of the assets, less liabilities, by the number of shares outstanding. The offering price and redemption price per share of the Fund is equal to the NAV per share of the Fund.
Investment income – Dividend income is recorded on the ex-dividend date. Non-cash dividends included in dividend income, if any, are recorded at the fair market value of the security received. Interest income is accrued as earned. Withholding taxes on foreign dividends have been recorded in accordance with the Fund’s understanding of the applicable country’s rules and tax rates.
25
| KARNER BLUE BIODIVERSITY IMPACT FUND |
| NOTES TO FINANCIAL STATEMENTS (Continued) |
Investment transactions – Investment transactions are accounted for on the trade date. Realized gains and losses on investments sold are determined on a specific identification basis.
Foreign currency translation – Securities and other assets and liabilities denominated in or expected to settle in foreign currencies, if any, are translated into U.S. dollars based on exchange rates on the following basis:
| A. | The fair values of investment securities and other assets and liabilities are translated as of the close of the NYSE each day. |
| B. | Purchases and sales of investment securities and income and expenses are translated at the rate of exchange prevailing as of 4:00 p.m. Eastern time on the respective date of such transactions. |
| C. | The Fund does not isolate that portion of the results of operations caused by changes in foreign exchange rates on investments from those caused by changes in market prices of securities held. Such fluctuations are included with the net realized and unrealized gains or losses on investments. |
Reported net realized foreign exchange gains or losses arise from 1) purchases and sales of foreign currencies, 2) currency gains or losses realized between trade and settlement dates on securities transactions, and 3) the difference between the amounts of dividends and foreign withholding taxes recorded on the Fund’s books and the U.S. dollar equivalent of the amounts actually received or paid. Reported net unrealized foreign exchange gains and losses arise from changes in the value of assets and liabilities, other than investments in securities, that result from changes in exchange rates.
Common expenses – Common expenses of the Trust are allocated among the Fund and the other series of the Trust based on the relative net assets of each series, the number of series in the Trust, or the nature of the services performed and the relative applicability to each series.
Distributions to shareholders – The Fund distributes to shareholders any net investment income dividends and net realized capital gains distributions at least once each year. The amount of such dividends and distributions are determined in accordance with federal income tax regulations, which may differ from GAAP. Dividends and distributions to shareholders are recorded on the ex-dividend date.
The tax character of distributions paid during the years ended May 31, 2023 and 2022 was as follows:
| Long-Term | Total | |||||||||||
| Years Ended | Ordinary Income | Capital Gains | Distributions | |||||||||
| 5/31/2023 | $ | 39,671 | $ | 172,958 | $ | 212,629 | ||||||
| 5/31/2022 | $ | 184,381 | $ | 886,206 | $ | 1,070,587 | ||||||
26
| KARNER BLUE BIODIVERSITY IMPACT FUND |
| NOTES TO FINANCIAL STATEMENTS (Continued) |
Estimates – The preparation of financial statements in conformity with GAAP requires management to make estimates and assumptions that affect the reported amounts of assets and liabilities and disclosure of contingent assets and liabilities as of the date of the financial statements and the reported amounts of increase (decrease) in net assets from operations during the reporting period. Actual results could differ from those estimates.
Federal income tax – The Fund has qualified and intends to continue to qualify as a regulated investment company under the Internal Revenue Code of 1986, as amended (the “Code”). Qualification generally will relieve the Fund of liability for federal income taxes to the extent 100% of its net investment income and net realized capital gains are distributed in accordance with the Code.
In order to avoid imposition of the excise tax applicable to regulated investment companies, it is also the Fund’s intention to declare as dividends in each calendar year at least 98% of its net investment income (earned during the calendar year) and 98.2% of its net realized capital gains (earned during the twelve months ended October 31) plus undistributed amounts from prior years.
The following information is computed on a tax basis for each item as of May 31, 2023:
| Tax cost of investments | $ | 9,233,321 | ||
| Gross unrealized appreciation | $ | 1,671,950 | ||
| Gross unrealized depreciation | (532,369 | ) | ||
| Net unrealized appreciation | 1,139,581 | |||
| Undistributed ordinary income | 77,153 | |||
| Accumulated capital and other losses | (371,333 | ) | ||
| Distributable earnings | $ | 845,401 | ||
The difference between the federal income tax cost of investments and the financial statement cost of investments is due to certain timing differences in the recognition of capital gains or losses under income tax regulations and GAAP. These “book/tax” differences are temporary in nature and are primarily due to the tax deferral of losses on wash sales.
As of May 31, 2023, the Fund had short-term capital loss carryforwards (“CLCF”) of $371,333 for federal income tax purposes. These CLCFs, which do not expire, may be utilized in future years to offset net realized capital gains, if any.
The Fund recognizes the tax benefits or expenses of uncertain tax positions only when the position is “more likely than not” of being sustained assuming examination by tax authorities. Management has reviewed the Fund’s tax positions for all open tax periods (generally, three years) and has concluded that no provision for unrecognized tax benefits or expenses is required in these financial statements. The Fund identifies its major tax jurisdiction as U.S. Federal.
27
| KARNER BLUE BIODIVERSITY IMPACT FUND |
| NOTES TO FINANCIAL STATEMENTS (Continued) |
The Fund recognizes interest and penalties, if any, related to unrecognized tax benefits as income tax expense on the Statement of Operations. During the year ended May 31, 2023, the Fund did not incur any interest or penalties.
3. Investment Transactions
During the year ended May 31, 2023, cost of purchases and proceeds from sales of investment securities, other than short-term investments, amounted to $7,973,795 and $7,063,361, respectively.
4. Transactions with Related Parties
INVESTMENT ADVISORY AGREEMENT
The Fund’s investments are managed by the Adviser pursuant to the terms of an Investment Advisory Agreement. The Fund pays the Adviser a management fee, computed and accrued daily and paid monthly, at the annual rate of 0.80% of average daily net assets.
Pursuant to an Expense Limitation Agreement (“ELA”) between the Fund and the Adviser, the Adviser has contractually agreed, until September 30, 2023, to reduce management fees and reimburse other operating expenses to limit total annual operating expenses of the Fund (exclusive of brokerage costs; taxes; interest; borrowing costs such as interest and dividend expenses on securities sold short; costs to organize the Fund; acquired fund fees and expenses; extraordinary expenses such as litigation and merger or reorganization costs; and other expenses not incurred in the ordinary course of the Fund’s business) to an amount not exceeding 0.95% of its average daily net assets.
Accordingly, during the year ended May 31, 2023, the Adviser did not collect any of its management fees in the amount of $75,255 and reimbursed other operating expenses of $122,633.
Under the terms of the ELA, management fee reductions and expense reimbursements by the Adviser are subject to repayment by the Fund for a period of 36 months after such fees and expenses were incurred, provided that the repayments do not cause total annual fund operating expenses to exceed the lesser of: (i) the expense limitation then in effect, if any, and (ii) the expense limitation in effect at the time the expenses to be repaid were incurred. As of May 31, 2023, the Adviser may in the future seek repayment of management fee reductions and expense reimbursements in the amount of $617,216 no later than the dates listed below:
| May 31, 2024 | $ | 217,946 | ||
| May 31, 2025 | 201,382 | |||
| May 31, 2026 | 197,888 | |||
| Total | $ | 617,216 | ||
28
| KARNER BLUE BIODIVERSITY IMPACT FUND |
| NOTES TO FINANCIAL STATEMENTS (Continued) |
OTHER SERVICE PROVIDERS
Ultimus Fund Solutions, LLC (“Ultimus”) provides administration, fund accounting, compliance and transfer agency services to the Fund. The Fund pays Ultimus fees in accordance with the agreements for such services. In addition, the Fund pays out-of-pocket expenses including, but not limited to, postage, supplies and certain costs related to the pricing of its portfolio securities.
Under the terms of a Distribution Agreement with the Trust, Ultimus Fund Distributors, LLC (the “Distributor”) serves as the principal underwriter to the Fund. The Distributor is a wholly-owned subsidiary of Ultimus. The Distributor is compensated by the Adviser, not the Fund.
Certain officers and a Trustee of the Trust are also officers of Ultimus and are not paid by the Fund for serving in such capacities.
ADMINISTRATIVE SERVICES PLAN
The Fund has adopted an Administrative Services Plan (the “Administrative Services Plan”), for the Butterfly™ Class shares of the Fund. The Administrative Services Plan allows the Fund to use the net assets of the Butterfly™ Class shares to pay financial intermediaries that provide services relating to Butterfly™ Class shares. The Administrative Services Plan permits payments for the provision of certain administrative, recordkeeping and other non-distribution related services to Butterfly™ Class shareholders. The Administrative Services Plan permits the Fund to make service fee payments at an annual rate of up to 0.10% of the Fund’s average daily net assets attributable to its Butterfly™ Class shares. During the year ended May 31, 2023, the Fund incurred $418 of fees under the Administrative Services Plan.
TRUSTEE COMPENSATION
Effective October 17, 2022, each member of the Board (a “Trustee”) who is not an “interested person” (as defined by the 1940 Act, as amended) of the Trust (“Independent Trustee”) receives a $1,300 annual retainer from the Fund, except for the Board Chairperson who receives a $1,700 annual retainer from the Fund and the Audit Committee Chairperson who receives a $1,500 annual retainer from the Fund, paid in quarterly installments. Each Independent Trustee also receives from the Fund a fee of $550 for each Board meeting attended plus reimbursement for travel and other meeting-related expenses. Prior to October 17, 2022, no additional annual retainer was specifically designated for the Audit Committee Chairperson.
29
| KARNER BLUE BIODIVERSITY IMPACT FUND |
| NOTES TO FINANCIAL STATEMENTS (Continued) |
PRINCIPAL HOLDERS OF FUND SHARES
As of May 31, 2023, the following shareholders owned of record 25% or more of the outstanding shares of the Fund:
| NAME OF RECORD OWNER | % Ownership |
| Butterfly™ Class | |
| SEI Private Trust Company (for the benefit of its customers) | 52% |
A beneficial owner of 25% or more of the Fund’s outstanding shares may be considered a controlling person of the Fund. That shareholder’s vote could have a more significant effect on matters presented at a shareholders’ meeting.
5. Foreign Securities Risk
The Fund may invest in American Depositary Receipts (“ADRs”). Investments in ADRs provide exposure to foreign securities that may involve different risks than those of U.S. securities. Foreign securities are subject to individual country risk, less favorable reporting and disclosure risk, currency exchange risk and greater price volatility, and may have higher liquidity risk than U.S. registered securities. As of May 31, 2023, the Fund had 32.0% of its net assets invested in ADRs.
6. Contingencies and Commitments
The Fund indemnifies the Trust’s officers and Trustees for certain liabilities that might arise from their performance of their duties to the Fund. Additionally, in the normal course of business the Fund enters into contracts that contain a variety of representations and warranties and which provide general indemnifications. The Fund’s maximum exposure under these arrangements is unknown, as this would involve future claims that may be made against the Fund that have not yet occurred. However, based on experience, the Fund expects the risk of loss to be remote.
7. Subsequent Events
The Fund is required to recognize in the financial statements the effects of all subsequent events that provide additional evidence about conditions that existed as of the date of the Statement of Assets and Liabilities. For non-recognized subsequent events that must be disclosed to keep the financial statements from being misleading, the Fund is required to disclose the nature of the event as well as an estimate of its financial effect, or a statement that such an estimate cannot be made. Management has evaluated subsequent events through the issuance of these financial statements and has noted no such events.
30
| KARNER BLUE BIODIVERSITY IMPACT FUND |
| Change in Independent Registered Public Accounting Firm (Unaudited) |
On March 13, 2023, BBD LLP (“BBD”) ceased to serve as the independent registered public accounting firm of Karner Blue Biodiversity Impact Fund (the “Fund”), a series of Ultimus Managers Trust. The Audit Committee of the Board of Trustees approved the replacement of BBD as a result of Cohen & Company, Ltd.’s (“Cohen”) acquisition of BBD’s Investment Management Group.
The report of BBD on the financial statements of the Fund as of and for the fiscal years ended 2022 and 2021 did not contain an adverse opinion or a disclaimer of opinion, and were not qualified or modified as to uncertainties, audit scope or accounting principles. During the fiscal years ended 2022 and 2021, and during the subsequent interim period through March 13, 2023: (i) there were no disagreements between the registrant and BBD on any matter of accounting principles or practices, financial statement disclosure, or auditing scope or procedure, which disagreements, if not resolved to the satisfaction of BBD, would have caused it to make reference to the subject matter of the disagreements in its report on the financial statements of the Fund for such years or interim period; and (ii) there were no “reportable events,” as defined in Item 304(a)(1)(v) of Regulation S-K under the Securities Exchange Act of 1934, as amended.
On April 21, 2023, the Audit Committee of the Board of Trustees also recommended and approved the appointment of Cohen as the Fund’s independent registered public accounting firm for the fiscal year ending May 31, 2023.
During the fiscal years ended 2022 and 2021, and during the subsequent interim period through March 13, 2023, neither the registrant, nor anyone acting on its behalf, consulted with Cohen on behalf of the Fund regarding the application of accounting principles to a specified transaction (either completed or proposed), the type of audit opinion that might be rendered on the Fund’s financial statements, or any matter that was either: (i) the subject of a “disagreement,” as defined in Item 304(a)(1)(iv) of Regulation S-K and the instructions thereto; or (ii) “reportable events,” as defined in Item 304(a)(1)(v) of Regulation S-K.
31
| KARNER BLUE BIODIVERSITY IMPACT FUND |
| REPORT OF INDEPENDENT REGISTERED PUBLIC ACCOUNTING FIRM |
To the Shareholders of Karner Blue Biodiversity Impact Fund
and Board of Trustees of Ultimus Managers Trust
Opinion on the Financial Statements
We have audited the accompanying statement of assets and liabilities, including the schedule of investments, of Karner Blue Biodiversity Impact Fund (the “Fund”), a series of Ultimus Managers Trust, as of May 31, 2023, the related statements of operations and changes in net assets for the year then ended, the related notes, and the financial highlights for the year then ended (collectively referred to as the “financial statements”). In our opinion, the financial statements present fairly, in all material respects, the financial position of the Fund as of May 31, 2023, the results of its operations, changes in net assets and the financial highlights for the year then ended, in conformity with accounting principles generally accepted in the United States of America.
The Fund’s financial statements and financial highlights for the years and periods ended May 31, 2022, and prior, were audited by another auditor whose report dated July 20, 2022, expressed an unqualified opinion on those financial statements and financial highlights.
Basis for Opinion
These financial statements are the responsibility of the Fund’s management. Our responsibility is to express an opinion on the Fund’s financial statements based on our audit. We are a public accounting firm registered with the Public Company Accounting Oversight Board (United States) (“PCAOB”) and are required to be independent with respect to the Fund in accordance with the U.S. federal securities laws and the applicable rules and regulations of the Securities and Exchange Commission and the PCAOB.
We conducted our audit in accordance with the standards of the PCAOB. Those standards require that we plan and perform the audit to obtain reasonable assurance about whether the financial statements are free of material misstatement whether due to error or fraud.
Our audit included performing procedures to assess the risks of material misstatement of the financial statements, whether due to error or fraud, and performing procedures that respond to those risks. Such procedures included examining, on a test basis, evidence regarding the amounts and disclosures in the financial statements. Our procedures included confirmation of securities owned as of May 31, 2023, by correspondence with the custodian and broker. Our audit also included evaluating the accounting principles
32
| KARNER BLUE BIODIVERSITY IMPACT FUND |
| REPORT OF INDEPENDENT REGISTERED PUBLIC ACCOUNTING FIRM (Continued) |
used and significant estimates made by management, as well as evaluating the overall presentation of the financial statements. We believe that our audit provides a reasonable basis for our opinion.
We have served as the Fund’s auditor since 2023.
COHEN & COMPANY, LTD.
Philadelphia, Pennsylvania
July 27, 2023
33
| KARNER BLUE BIODIVERSITY IMPACT FUND |
| ABOUT YOUR FUND’S EXPENSES (Unaudited) |
We believe it is important for you to understand the impact of costs on your investment. As a shareholder of the Fund, you incur ongoing costs, including management fees, class-specific expenses (such as distribution fees and administrative services fees) and other operating expenses. The following examples are intended to help you understand your ongoing costs (in dollars) of investing in the Fund and to compare these costs with the ongoing costs of investing in other mutual funds.
A mutual fund’s ongoing costs are expressed as a percentage of its average net assets. This figure is known as the expense ratio. The expenses in the table below are based on an investment of $1,000 made at the beginning of the most recent semi-annual period (December 1, 2022) and held until the end of the period (May 31, 2023).
The table below illustrates the Fund’s ongoing costs in two ways:
Actual fund return – This section helps you to estimate the actual expenses that you paid over the period. The “Ending Account Value” shown is derived from the Fund’s actual return, and the fourth column shows the dollar amount of operating expenses that would have been paid by an investor who started with $1,000 in the Fund. You may use the information here, together with the amount you invested, to estimate the expenses that you paid over the period.
To do so, simply divide your account value by $1,000 (for example, an $8,600 account value divided by $1,000 = 8.6), then multiply the result by the number given for the Fund under the heading “Expenses Paid During Period.”
Hypothetical 5% return – This section is intended to help you compare the Fund’s ongoing costs with those of other mutual funds. It assumes that the Fund had an annual return of 5% before expenses during the period shown, but that the expense ratio is unchanged. In this case, because the return used is not the Fund’s actual return, the results do not apply to your investment. The example is useful in making comparisons because the U.S. Securities and Exchange Commission (the “SEC”) requires all mutual funds to calculate expenses based on a 5% return. You can assess the Fund’s ongoing costs by comparing this hypothetical example with the hypothetical examples that appear in shareholder reports of other funds.
Note that expenses shown in the table are meant to highlight and help you compare ongoing costs only. The Fund does not charge transaction fees, such as purchase or redemption fees, nor does it charge a “sales load.”
The calculations assume no shares were bought or sold during the period. Your actual costs may have been higher or lower, depending on the amount of your investment and the timing of any purchases or redemptions.
34
| KARNER BLUE BIODIVERSITY IMPACT FUND |
| ABOUT YOUR FUND’S EXPENSES (Unaudited) (Continued) |
More information about the Fund’s expenses can be found in this report. For additional information on operating expenses and other shareholder costs, please refer to the Fund’s prospectus.
| Beginning | ||||
| Account Value | Ending | Net | Expenses | |
| December 1, | Account Value | Expense | Paid During | |
| 2022 | May 31, 2023 | Ratio (a) | Period (b) | |
| Butterfly™ Class | ||||
| Based on Actual Fund Return | $1,000.00 | $1,016.20 | 0.95% | $4.78 |
| Based on Hypothetical 5% Return (before expenses) | $1,000.00 | $1,020.19 | 0.95% | $4.78 |
| (a) | Annualized, based on the most recent one-half year expenses. |
| (b) | Expenses are equal to the annualized expense ratio, multiplied by the average account value over the period, multiplied by 182/365 (to reflect the one-half year period). |
| OTHER INFORMATION (Unaudited) |
A description of the policies and procedures that the Fund uses to vote proxies relating to portfolio securities is available without charge upon request by calling toll-free 1-855-KBANIML (855-522-6465), or on the SEC’s website at www.sec.gov. Information regarding how the Fund voted proxies relating to portfolio securities during the most recent 12-month period ended June 30 is also available without charge upon request by calling toll-free 1-855-KBANIML (855-522-6465), or on the SEC’s website at www.sec.gov.
The Trust files a complete listing of portfolio holdings for the Fund with the SEC as of the end of the first and third quarters of each fiscal year as an exhibit to its reports on Form N-PORT. These filings are available upon request by calling 1-855-KBANIML (855-522-6465). Furthermore, you may obtain a copy of the filings on the SEC’s website at www.sec.gov and the Fund’s website at www.biodiversityimpactfund.com.
| FEDERAL TAX INFORMATION (Unaudited) |
For the year ended May 31, 2023, the Fund designated $172,958 as long-term capital gain distribution.
Qualified Dividend Income – The Fund designates 100% of its ordinary income dividends, or up to the maximum amount of such dividends allowable pursuant to the Internal Revenue Code, as qualified dividend income eligible for the reduced tax rate.
Dividends Received Deduction – Corporate shareholders are generally entitled to take the dividends received deduction on the portion of a Fund’s dividend distribution that qualifies under tax law. For the year ended May 31, 2023, 59.87% of ordinary income dividends qualifies for the corporate dividends received deduction.
35
| KARNER BLUE BIODIVERSITY IMPACT FUND |
| BOARD OF TRUSTEES AND EXECUTIVE OFFICERS (Unaudited) |
The Board has overall responsibility for management of the Trust’s affairs. The Trustees serve during the lifetime of the Trust and until its termination, or until death, resignation, retirement, or removal. The Trustees, in turn, elect the officers of the Fund to actively supervise their day-to-day operations. The officers have been elected for an annual term. Each Trustee’s and officer’s address is 225 Pictoria Drive, Suite 450, Cincinnati, Ohio 45246. The following are the Trustees and executive officers of the Fund:
| Name and Year of Birth | Length of Time Served | Position(s) held with Trust | Principal Occupation(s) During Past 5 Years | Number of Funds in the Trust Overseen By Trustee | Directorship(s) of Public Companies Held By Trustee During Past 5 Years |
| Interested Trustees: | |||||
| David K. James* Year of Birth: 1970 | April 2023 to present October 2022 to April 2023 July 2021 to October 2022 | Trustee (April 2023 to present) Assistant Secretary Secretary | Executive Vice President and Chief Legal and Risk Officer of Ultimus Fund Solutions, LLC (“Ultimus”) and a member of the board of managers of Ultimus Fund Distributors, LLC, Northern Lights Distributors, LLC and Northern Lights Compliance Services, LLC, each an affiliate of Ultimus (2018 to present); Managing Director and Managing Counsel of State Street Bank and Trust Company (2009 to 2018) | 32 | Interested Trustee of 12 series of the Capitol Series Trust (a registered management company) (2021 to present) |
| Independent Trustees: | |||||
| Janine L. Cohen Year of Birth: 1952 | Since 2016 | Chairperson (2019 to present) Trustee (2016 to present) | Retired since 2013; previously Chief Financial Officer from 2004 to 2013 and Chief Compliance Officer from 2008 to 2013 at AER Advisors, Inc. | 32 | n/a |
36
| KARNER BLUE BIODIVERSITY IMPACT FUND |
| BOARD OF TRUSTEES AND EXECUTIVE OFFICERS (Unaudited) (Continued) |
| Name and Year of Birth | Length of Time Served | Position(s) held with Trust | Principal Occupation(s) During Past 5 Years | Number of Funds in the Trust Overseen By Trustee | Directorship(s) of Public Companies Held By Trustee During Past 5 Years |
| Independent Trustees (Continued): | |||||
| David M. Deptula Year of Birth: 1958 | Since 2012 | Trustee (2012 to present) | Vice President of Legal and Special Projects at Dayton Freight Lines, Inc. since 2016 | 32 | n/a |
| Robert E. Morrison Year of Birth: 1957 | Since 2019 | Trustee (2019 to present; and previously 2012 to 2012) | Managing Director at Midwest Trust and FCI Advisors (2022 to present); Senior Vice President and National Practice Lead for Investment, Huntington National Bank/Huntington Private Bank (2014 to 2022); CEO, CIO, President of 5 Star Investment Management Company (2006 to 2014) | 32 | n/a |
| Clifford N. Schireson Year of Birth: 1953 | Since 2019 | Trustee (2019 to present) | Retired; Founder of Schireson Consulting, LLC (2017 to 2022); Director of Institutional Services for Brandes Investment Partners, LP (2004 to 2017) | 32 | Trustee of the San Diego City Employees’ Retirement System (2019 to present) |
| Jacqueline A. Williams Year of Birth: 1954 | Since 2019 | Trustee (2019 to present) | Managing Member of Custom Strategy Consulting, LLC (2017 to present); Managing Director of Global Investment Research (2005 to 2017), Cambridge Associates, LLC | 32 | n/a |
| * | Mr. James is considered an “interested person” of the Trust within the meaning of Section (2)(a)(19) of the Investment Company Act of 1940, as amended, because of his relationship with the Trust’s Administrator, Transfer Agent, and Distributor. Mr. James was Assistant Secretary of the Trust from October 2022 to April 2023 and Secretary of the Trust from July 2021 to October 2022. |
37
| KARNER BLUE BIODIVERSITY IMPACT FUND |
| BOARD OF TRUSTEES AND EXECUTIVE OFFICERS (Unaudited) (Continued) |
| Name and Year of Birth | Length of Time Served | Position(s) held with Trust | Principal Occupation(s) During Past 5 Years |
| Todd E. Heim Year of Birth: 1967 | 2021 to present 2014 to 2021 | President Vice President | Vice President, Relationship Management (2018 to present) and Assistant Vice President, Client Implementation Manager with Ultimus Fund Solutions, LLC (2014 to 2018) |
| Shannon Thibeaux- Burgess Year of Birth: 1970 | April 2023 to present | Vice President | Senior Vice President, Relationship Management with Ultimus Fund Solutions, LLC (2022 to present); Head of Regulatory Service with J.P. Morgan Chase & Co. (2020 to 2022); Chief Administrative Officer of State Street Bank (2013 to 2020) |
| Jennifer L. Leamer Year of Birth: 1976 | 2014 to present April 2014 to October 2014 | Treasurer Assistant Treasurer | Senior Vice President of Fund Accounting (2020 to present) and Mutual Fund Controller of Ultimus Fund Solutions, LLC (2014 to 2020) |
| Daniel D. Bauer Year of Birth: 1977 | 2016 to present | Assistant Treasurer | Vice President of Fund Accounting (2022 to present), Assistant Vice President of Fund Accounting (2020 to 2022), and AVP, Assistant Mutual Fund Controller (2015 to 2020) of Ultimus Fund Solutions, LLC |
| Angela A. Simmons Year of Birth: 1975 | January 2022 to present | Assistant Treasurer | Vice President of Financial Administration (2022 to present) and Assistant Vice President, Financial Administration (2015 to 2022) of Ultimus Fund Solutions, LLC |
| Karen Jacoppo-Wood Year of Birth: 1966 | April 2023 to present | Secretary | Vice President and Senior Legal Counsel of Ultimus Fund Solutions, LLC (2021 to present); Vice President, Asset Servicing – Regulatory Administration of The Bank of New York Mellon (2019 to 2021); Vice President and Counsel of State Street Bank and Trust Company (2015 to 2019) |
| Natalie S. Anderson Year of Birth:1975 | 2016 to present | Assistant Secretary | Legal Administration Manager (2016 to present) and Paralegal (2015 to 2016) of Ultimus Fund Solutions, LLC |
38
| KARNER BLUE BIODIVERSITY IMPACT FUND |
| BOARD OF TRUSTEES AND EXECUTIVE OFFICERS (Unaudited) (Continued) |
| Name and Year of Birth | Length of Time Served | Position(s) held with Trust | Principal Occupation(s) During Past 5 Years |
| Jesse Hallee Year of Birth: 1976 | April 2023 to present | Assistant Secretary | Senior Vice President and Associate General Counsel of Ultimus Fund Solutions, LLC (June 2019 to present); Vice President and Managing Counsel, State Street Bank and Trust Company (2013 to 2019) |
| Gweneth K. Gosselink Year of Birth: 1955 | 2020 to present | Chief Compliance Officer | Assistant Vice President, Compliance Officer at Ultimus Fund Solutions, LLC (2019 to present); CCO Consultant at GKG Consulting, LLC (2019 to 2021); Chief Operating Officer & CCO at Miles Capital, Inc. (2013 to 2019) |
| Martin Dean Year of Birth: 1963 | 2020 to present 2019 to 2020 2016 to 2017 | Assistant Chief Compliance Officer Interim Chief Compliance Officer Assistant Chief Compliance Officer | President of Northern Lights Compliance Services, LLC (February 2023 to present); Senior Vice President, Head of Fund Compliance (2020 to January 2023) and Vice President & Director of Fund Compliance of Ultimus Fund Solutions, LLC (2016 to 2020) |
Additional information about members of the Board and executive officers is available in the Fund’s Statement of Additional Information (“SAI”). To obtain a free copy of the SAI, please call toll free 1-855-KBANIML (855-522-6465).
39
| KARNER BLUE BIODIVERSITY IMPACT FUND |
| DISCLOSURE REGARDING APPROVAL OF THE INVESTMENT ADVISORY AGREEMENT (Unaudited) |
The Board of Trustees (the “Board”), including the Independent Trustees voting separately, has reviewed and approved the Fund’s Investment Advisory Agreement with Karner Blue Capital, LLC (the “Adviser” or “Karner Blue”) for an additional one-year term (the “Advisory Agreement”). The Board approved the Advisory Agreement at a meeting held on January 17-18, 2023, at which all of the Trustees were present.
Prior to the Board meeting, the Adviser provided a response to a letter sent by the counsel to the Independent Trustees, on their behalf, requesting various information relevant to the Independent Trustees’ consideration of the renewal of the Advisory Agreements with respect to the Fund. In approving the continuance of the Advisory Agreement, the Independent Trustees considered all information they deemed reasonably necessary to evaluate the terms of the Agreement. The principal areas of review by the Independent Trustees were (i) the nature, extent and quality of the services provided by the Adviser, (ii) the investment performance of the Fund, (iii) the costs of the services provided and profits realized by the Adviser and its affiliates from the Adviser’s relationship with the Fund, (iv) the other “fall-out” benefits derived by Adviser and its affiliates from the Adviser’s relationship with the Fund and (v) the extent to which economies of scale would be realized as the Fund grows and whether advisory fee levels reflect those economies of scale for the benefit of the Fund’s investors. The Independent Trustees’ evaluation of the quality of the Adviser’s services also took into consideration their knowledge gained through presentations and reports from the Adviser over the course of the preceding year. The Independent Trustees’ analysis of these factors is set forth below.
The nature, extent, and quality of the services provided by Karner Blue. In this regard, the Board reviewed the services being provided by Karner Blue to the Fund including, without limitation, its providing a continuous investment program for the Fund, adhering to the Fund’s investment restrictions, complying with the Trust’s policies and procedures and voting proxies on behalf of the Fund. The Board considered the qualifications and experience of Karner Blue’s portfolio managers who are responsible for the day-to day management of the Fund’s portfolio. The Board concluded that the quality, extent, and nature of the services provided by Karner Blue to the Fund were satisfactory.
The investment performance of the Fund. In this regard, the Board compared the performance of the Fund with the performance of its benchmark index, the custom peer group and Morningstar category. The Board concluded that the investment performance of the Fund has been satisfactory.
The costs of the services provided and profits realized by Karner Blue and its affiliates from its relationship with the Fund. In this regard, the Board considered the Fund’s management fee and expense ratio, each as compared to the Fund’s peer group and Morningstar category, and to the fees charged by Karner Blue to other similar clients. The Board considered the revenue earned from the Fund and the current and anticipated profitability of the Fund to Karner Blue, if any. The Board also considered Karner Blue’s
40
| KARNER BLUE BIODIVERSITY IMPACT FUND |
| DISCLOSURE REGARDING APPROVAL OF THE INVESTMENT ADVISORY AGREEMENT (Unaudited) (Continued) |
past fee reductions and expense reimbursements for the Fund and the indirect benefits that Karner Blue received from its management of the Fund. The Board concluded that the advisory fee to be paid to Karner Blue by the Fund is reasonable in light of the nature and quality of services provided by Karner Blue.
The extent to which economies of scale would be realized as the Fund grows and whether advisory fee levels reflect these economies of scale for the benefit of the Fund’s investors. In this regard, the Board considered that the Fund’s fee arrangements with Karner Blue involve both the advisory fee and the expense limitation agreement (the “ELA”). The Board determined that while the advisory fee rate remained the same as asset levels increased, the shareholders of the Fund have experienced benefits from the ELA and will continue to experience benefits from the ELA. The Board concluded that the advisory fee was reasonable in light of the information that was provided to the Trustees by Karner Blue with respect to economies of scale.
After further discussion of the factors noted above and in reliance on the information provided by Karner Blue and Trust Management, and taking into account the totality of all the factors discussed and information presented at the meeting and previous meetings, the Board indicated its agreement to approve the continuance of the Advisory Agreement. It was noted that in the Trustees’ deliberations regarding the approval of renewal the Advisory Agreement, the Trustees did not identify any particular information or factor that was all-important or controlling, and that each individual Trustee may have attributed different weights to the various factors listed above. After full consideration of the above factors as well as other factors, the Board unanimously concluded that approval of the continuance of the Advisory Agreement was in the best interests of the Fund and its shareholders.
41
KARNER-AR-23
| KEMPNER MULTI-CAP DEEP VALUE FUND |
| Institutional Class (FIKDX) |
| Investor Class (FAKDX) |
| Annual Report |
| May 31, 2023 |
| KEMPNER MULTI-CAP DEEP VALUE FUND | |
| LETTER TO SHAREHOLDERS (Unaudited) | June 13, 2023 |
Fund Objective
The Kempner Multi-Cap Deep Value Fund seeks to generate a total pre-tax return, including capital growth and dividends, greater than the rate of inflation over a minimum three- to five-year period. For the twelve months ended May 31, 2023, the Fund produced a total return of -9.97% (Institutional Class Shares) and -10.22% (Investor Class Shares), both net of fees. For the trailing three years ended May 31, 2023, the Fund produced a total return of 10.89% annualized (Institutional Class Shares) and 10.62% annualized (Investor Class Shares), both net of fees. The Headline CPI inflation rates over the periods were 4.13% for one year and 5.83% for three years annualized. Comparatively, over the same time periods the Lipper Multi-Cap Value Funds Classification Index returned -4.06% for one year and 13.86% for three years annualized; and the Fund’s benchmark, the S&P 500 Value Index, returned 3.02% for one year and 13.86% for three years annualized.
Portfolio Strategy
Our investment approach continues to be one of investing in deeply undervalued companies and selling when the underlying value becomes realized by other market participants and reflected in the current price. The past year has therefore resulted in a greater number of buy opportunities than sell opportunities.
For the fiscal year of June 1, 2022 thru May 31, 2023, we established and/or added to positions in Adidas AG Sponsored ADR (ADDYY), BHP Billiton Limited (BHP), Citizens Financial Group (CFG), Comcast Corp. CL A (CMCSA), Cisco Systems Inc. (CSCO), Dow Incorporated (DOW), eBay Incorporated (EBAY), Equitable Holdings, Inc. (EQH), FedEx Corporation (FDX), Fidelity National Info Services (FIS), Lennar Corp CL B (LEN.B), LVMH Moet Hennessy ADR (LVMUY), Michelin Compagnie Generale (MGDDY), Micron Technology (MU), Organon & Company (OGN), Pioneer Natural Resources (PXD), Rio Tinto PLC (RIO), Skyworks Solutions Inc. (SWKS), Teradyne Incorporated (TER), Truist Financial Corp. (TFC), Taiwan Semiconductor (TSM), Tyson Foods Incorporated (TSN), V. F. Corporation (VFC) and Viatris Incorporated (VTRS).
We reduced the Fund’s positions in Adidas AG Sponsored ADR (ADDYY), Acuity Brands Incorporated (AYI), Caterpillar Incorporated (CAT), Continental AG (CTTAY), DuPont de Nemours (DD), FedEx Corporation (FDX), Ingredion Incorporated (INGR), Paramount Global (PARA), and Everest Re Group Ltd. (RE).
We sold entirely out of Bristol-Myers Squibb Co. (BMY), Cardinal Health Incorporated (CAH), Corteva Incorporated (CTVA), Dow Incorporated (DOW), Deutsche Telekom AG ADR (DTEGY), Lennar Corp CL B (LEN.B), LVMH Moet Hennessy ADR (LVMUY), Michelin Compagnie Generale (MGDDY), Merck & Company Inc. (MRK), Paramount Global 5.75% Conv Pfd (PARAP), Roche Holdings Ltd. (RHHBY), Skyworks Solutions Inc. (SWKS), Viatris Incorporated (VTRS), Vitesco Technologies Group (VTSCY), Walgreens Boots Alliance (WBA) and Williams-Sonoma Inc. (WSM).
1
The three securities with the most significant price increases that contributed the most to Fund performance during the last twelve-month period were represented by the housing, healthcare supply chain, and communication sectors. They are as follows:
| Contribution to Return | Total Return | |
| Cardinal Health Inc | +0.91 | +39.26 |
| Lennar Corp CL B | +0.89 | +49.70 |
| Comcast Corp | +0.54 | +37.41 |
The three securities with the worst performance in the portfolio during the 12-month period were an eclectic group with individual stock circumstances. They are as follows:
| Lincoln National Corp | -3.37 | -61.12 |
| Paramount Global | -1.41 | -50.83 |
| Fidelity National Info Svcs | -1.40 | -45.76 |
We continue to scour the equity universe to locate stocks which meet our investment criteria of: 1) a relatively low forecast P/E multiple, usually 15x or less, 2) a dividend being paid, or expected to be, 3) public debt, if any, is investment grade, 4) a minimum of $500 million market capitalization, and 5) current stock price is within 20% of the 52-week low price. In addition to meeting these criteria, stocks are quantitatively and qualitatively analyzed to determine company prospects and reasonableness of valuation.
We maintain our long-term focus in the Kempner Multi-Cap Deep Value Fund on areas which are overlooked by the market. Harris L. Kempner, Jr. and M. Shawn Gault are the portfolio managers for the Kempner Multi-Cap Deep Value Fund.
Past performance is not predictive of future performance. Investment results and principal value will fluctuate so that shares, when redeemed, may be worth more or less than their original cost. Current performance may be higher or lower than the performance data quoted. Performance data current to the most recent month end are available by calling 1-800-665-9778.
An investor should consider the investment objectives, risks, charges, and expenses of the Fund carefully before investing. The Fund’s prospectus contains this and other important information. To obtain a copy of the Fund’s prospectus please call 1-800-665-9778 and a copy will be sent to you free of charge. Please read the prospectus carefully before you invest. Kempner Multi-Cap Deep Value Fund is distributed by Ultimus Fund Distributors, LLC.
This Letter to Shareholders seeks to describe some of the Adviser’s current opinions and views of the financial markets. Although the Adviser believes it has a reasonable basis for any opinions or views expressed, actual results may differ, sometimes significantly so, from those expected or expressed. The securities held by the Fund that are discussed in the Letter to Shareholders were held during the period covered by this Report. They do not comprise the entire investment portfolio of the Fund, may be sold at any time and may no longer be held by the Fund. For a complete list of securities held by the Fund as of May 31, 2023, please see the Schedule of Investments section of the annual report. The opinions of the Adviser with respect to those securities may change at any time.
2
Statements in the Letter to Shareholders that reflect projections or expectations for future financial or economic performance of the Fund and the market in general and statements of the Fund’s plans and objectives for future operations are forward-looking statements. No assurance can be given that actual results or events will not differ materially from those projected, estimated, assumed, or anticipated in any such forward-looking statements. Important factors that could result in such differences, in addition to factors noted with such forward-looking statements include, without limitation, general economic conditions, such as inflation, recession, and interest rates. Past performance is not a guarantee of future results.
3
| KEMPNER MULTI-CAP DEEP VALUE FUND |
| PERFORMANCE INFORMATION |
| May 31, 2023 (Unaudited) |
Comparison of the Change in Value of a $500,000 Investment
in Kempner Multi-Cap Deep Value Fund - Institutional Class versus the
S&P 500® Value Index*
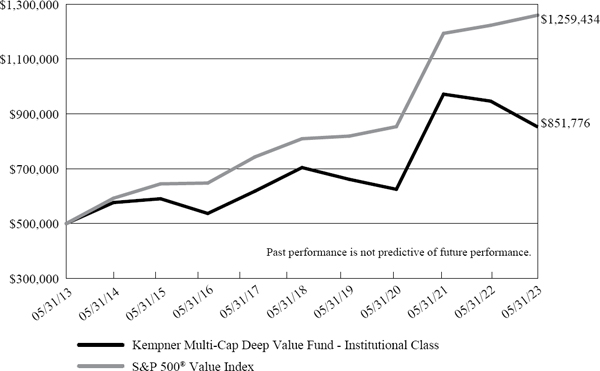
| Average Annual Total Returns | |||||||
| (for the years ended May 31, 2023) | |||||||
| 1 Year | 5 Years | 10 Years | |||||
| Kempner Multi-Cap Deep Value Fund - Institutional Class (a) | -9.97% | 3.89% | 5.47% | ||||
| Kempner Multi-Cap Deep Value Fund - Investor Class (a)(b) | -10.22% | 3.64% | 5.22% | ||||
| S&P 500® Value Index (c) | 3.02% | 9.25% | 9.68% | ||||
| * | The graph is based on the performance of Institutional Class only; performance for Investor Class varies due to differences in fees paid by shareholders in the different classes. |
| (a) | The total returns shown do not reflect the deduction of taxes that a shareholder would pay on Fund distributions or the redemption of Fund shares. |
| (b) | Effective March 31, 2015, Class A Shares were re-designated as Investor Class. Prior to March 31, 2015, shareholders were charged a sales charge on purchases and redemptions of Class A Shares. The performance information provided for the period prior to March 31, 2015 represents the performance of Investor Class when they were called Class A Shares. The share class change had no impact on the Fund’s operations or investment policy. |
| (c) | The S&P 500® Value Index measure value stocks using three factors: the ratios of book value, earnings, and sales to price. Constituents are drawn from the S&P 500® Index. The Index is unmanaged and shown for illustration purposes only. An investor cannot invest in an index and its returns are not indicative of the performance of any specific investment. |
4
| KEMPNER MULTI-CAP DEEP VALUE FUND |
| PORTFOLIO INFORMATION |
| May 31, 2023 (Unaudited) |
Sector Diversification (% of Net Assets)
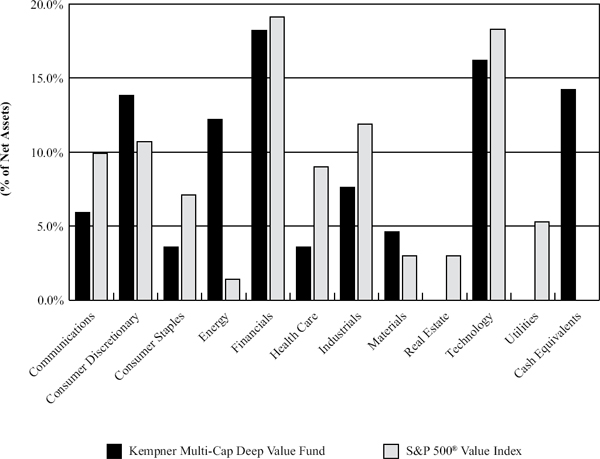
Top 10 Equity Investments
| Security Description | % of Net Assets | |
| Micron Technology, Inc. | 4.1% | |
| General Motors Company | 4.1% | |
| BP plc - ADR | 4.1% | |
| Taiwan Semiconductor Manufacturing Company Ltd. - ADR | 3.8% | |
| Citigroup, Inc. | 3.3% | |
| Bank of America Corporation | 3.1% | |
| Cisco Systems, Inc. | 3.0% | |
| Shell plc - ADR | 3.0% | |
| Tyson Foods, Inc. - Class A | 2.9% | |
| Pioneer Natural Resources Company | 2.9% | |
5
| KEMPNER MULTI-CAP DEEP VALUE FUND |
| SCHEDULE OF INVESTMENTS |
| May 31, 2023 |
| COMMON STOCKS — 85.8% | Shares | Value | ||||||
| Communications — 5.9% | ||||||||
| Cable & Satellite — 2.3% | ||||||||
| Comcast Corporation - Class A | 42,300 | $ | 1,664,505 | |||||
| Entertainment Content — 3.6% | ||||||||
| Paramount Global - Class B | 37,010 | 562,922 | ||||||
| Walt Disney Company (The) (a) | 23,500 | 2,067,060 | ||||||
| 2,629,982 | ||||||||
| Consumer Discretionary — 13.8% | ||||||||
| Apparel & Textile Products — 4.6% | ||||||||
| adidas AG - ADR | 20,550 | 1,673,797 | ||||||
| VF Corporation | 95,900 | 1,651,398 | ||||||
| 3,325,195 | ||||||||
| Automotive — 6.8% | ||||||||
| Continental AG - ADR | 296,600 | 1,978,322 | ||||||
| General Motors Company | 92,720 | 3,005,055 | ||||||
| 4,983,377 | ||||||||
| E-Commerce Discretionary — 2.4% | ||||||||
| eBay, Inc. | 42,100 | 1,790,934 | ||||||
| Consumer Staples — 3.6% | ||||||||
| Food — 3.6% | ||||||||
| Ingredion, Inc. | 4,900 | 512,540 | ||||||
| Tyson Foods, Inc. - Class A | 41,200 | 2,086,368 | ||||||
| 2,598,908 | ||||||||
| Energy — 12.2% | ||||||||
| Oil & Gas Producers — 10.0% | ||||||||
| BP plc - ADR | 89,120 | 3,004,235 | ||||||
| Pioneer Natural Resources Company | 10,425 | 2,079,162 | ||||||
| Shell plc - ADR | 39,454 | 2,209,424 | ||||||
| 7,292,821 | ||||||||
| Oil & Gas Services & Equipment — 2.2% | ||||||||
| Schlumberger Ltd. | 38,055 | 1,629,896 | ||||||
| Financials — 18.2% | ||||||||
| Banking — 11.0% | ||||||||
| Bank of America Corporation | 81,720 | 2,270,999 | ||||||
| Citigroup, Inc. | 54,100 | 2,397,712 | ||||||
| Citizens Financial Group, Inc. | 61,400 | 1,582,892 | ||||||
| Truist Financial Corporation | 58,100 | 1,770,307 | ||||||
| 8,021,910 | ||||||||
6
| KEMPNER MULTI-CAP DEEP VALUE FUND |
| SCHEDULE OF INVESTMENTS (Continued) |
| COMMON STOCKS — 85.8% (Continued) | Shares | Value | ||||||
| Financials — 18.2% (Continued) | ||||||||
| Insurance — 7.2% | ||||||||
| Equitable Holdings, Inc. | 73,750 | $ | 1,809,825 | |||||
| Everest Re Group Ltd. | 3,100 | 1,054,062 | ||||||
| Hartford Financial Services Group, Inc. (The) | 11,650 | 798,258 | ||||||
| Lincoln National Corporation | 74,850 | 1,565,862 | ||||||
| 5,228,007 | ||||||||
| Health Care — 3.6% | ||||||||
| Biotech & Pharma — 3.6% | ||||||||
| Amgen, Inc. | 2,150 | 474,397 | ||||||
| Organon & Company | 52,843 | 1,024,626 | ||||||
| Viatris, Inc. | 124,100 | 1,135,515 | ||||||
| 2,634,538 | ||||||||
| Industrials — 7.6% | ||||||||
| Electrical Equipment — 3.7% | ||||||||
| Acuity Brands, Inc. | 5,585 | 841,604 | ||||||
| Johnson Controls International plc | 31,549 | 1,883,475 | ||||||
| 2,725,079 | ||||||||
| Machinery — 2.7% | ||||||||
| Caterpillar, Inc. | 3,550 | 730,413 | ||||||
| Crane Company | 9,600 | 697,536 | ||||||
| Crane NXT Company | 9,600 | 505,248 | ||||||
| 1,933,197 | ||||||||
| Transportation & Logistics — 1.2% | ||||||||
| FedEx Corporation | 4,000 | 871,920 | ||||||
| Materials — 4.7% | ||||||||
| Chemicals — 1.9% | ||||||||
| DuPont de Nemours, Inc. | 4,800 | 322,512 | ||||||
| LyondellBasell Industries N.V. - Class A | 12,500 | 1,069,250 | ||||||
| 1,391,762 | ||||||||
| Metals & Mining — 2.8% | ||||||||
| BHP Group Ltd. - ADR | 6,900 | 378,810 | ||||||
| Kinross Gold Corporation | 160,600 | 756,426 | ||||||
| Rio Tinto plc - ADR | 15,100 | 891,655 | ||||||
| 2,026,891 | ||||||||
| Technology — 16.2% | ||||||||
| Semiconductors — 10.4% | ||||||||
| Micron Technology, Inc. | 44,400 | 3,028,080 | ||||||
| Taiwan Semiconductor Manufacturing Company Ltd. - ADR | 28,100 | 2,770,379 | ||||||
| Teradyne, Inc. | 18,000 | 1,803,420 | ||||||
| 7,601,879 | ||||||||
7
| KEMPNER MULTI-CAP DEEP VALUE FUND |
| SCHEDULE OF INVESTMENTS (Continued) |
| COMMON STOCKS — 85.8% (Continued) | Shares | Value | ||||||
| Technology — 16.2% (Continued) | ||||||||
| Technology Hardware — 3.0% | ||||||||
| Cisco Systems, Inc. | 44,520 | $ | 2,211,308 | |||||
| Technology Services — 2.8% | ||||||||
| Fidelity National Information Services, Inc. | 37,400 | 2,040,918 | ||||||
| Total Common Stocks (Cost $67,234,085) | $ | 62,603,027 | ||||||
| Other Assets in Excess of Liabilities — 14.2% | 10,371,367 | |||||||
| Net Assets — 100.0% | $ | 72,974,394 | ||||||
ADR – American Depositary Receipt
AG – Aktiengesellschaft
N.V. – Naamloze Vennootschap
plc – Public Limited Company
| (a) | Non-income producing security. |
See accompanying notes to financial statements.
8
| KEMPNER MULTI-CAP DEEP VALUE FUND |
| STATEMENT OF ASSETS AND LIABILITIES |
| May 31, 2023 |
| ASSETS | ||||
| Investments in securities: | ||||
| At cost | $ | 67,234,085 | ||
| At value (Note 2) | $ | 62,603,027 | ||
| Cash (Note 2) | 10,143,307 | |||
| Dividends and interest receivable | 253,881 | |||
| Tax reclaims receivable | 47,418 | |||
| Other assets | 5,678 | |||
| Total assets | 73,053,311 | |||
| LIABILITIES | ||||
| Payable to Adviser (Note 4) | 37,401 | |||
| Payable to administrator (Note 4) | 13,255 | |||
| Accrued distribution fees (Note 4) | 5,572 | |||
| Other accrued expenses | 22,689 | |||
| Total liabilities | 78,917 | |||
| NET ASSETS | $ | 72,974,394 | ||
| NET ASSETS CONSIST OF: | ||||
| Paid-in capital | $ | 74,909,906 | ||
| Accumulated deficit | (1,935,512 | ) | ||
| NET ASSETS | $ | 72,974,394 | ||
| NET ASSET VALUE PER SHARE: | ||||
| INSTITUTIONAL CLASS | ||||
| Net assets applicable to Institutional Class | $ | 57,776,811 | ||
| Institutional Class shares of beneficial interest outstanding (unlimited number of shares authorized, no par value) | 6,018,392 | |||
| Net asset value, offering price and redemption price per share (Note 2) | $ | 9.60 | ||
| INVESTOR CLASS | ||||
| Net assets applicable to Investor Class | $ | 15,197,583 | ||
| Investor Class shares of beneficial interest outstanding (unlimited number of shares authorized, no par value) | 1,584,429 | |||
| Net asset value, offering price and redemption price per share (Note 2) | $ | 9.59 |
See accompanying notes to financial statements.
9
| KEMPNER MULTI-CAP DEEP VALUE FUND |
| STATEMENT OF OPERATIONS |
| For the Year Ended May 31, 2023 |
| INVESTMENT INCOME | ||||
| Dividend income | $ | 2,184,563 | ||
| Foreign withholding taxes on dividends | (17,182 | ) | ||
| Interest income | 123,969 | |||
| Total investment income | 2,291,350 | |||
| EXPENSES | ||||
| Management fees (Note 4) | 448,711 | |||
| Administration fees (Note 4) | 76,089 | |||
| Fund accounting fees (Note 4) | 45,770 | |||
| Distribution fees - Investor Class (Note 4) | 40,148 | |||
| Legal fees | 28,137 | |||
| Transfer agent fees (Note 4) | 27,819 | |||
| Trustees’ fees and expenses (Note 4) | 19,622 | |||
| Registration and filing fees | 16,957 | |||
| Audit and tax services fees | 16,511 | |||
| Compliance fees and expenses (Note 4) | 12,118 | |||
| Custodian and bank service fees | 11,306 | |||
| Shareholder reporting expenses | 8,586 | |||
| Insurance expense | 3,801 | |||
| Postage and supplies | 3,147 | |||
| Other expenses | 18,049 | |||
| Total expenses | 776,771 | |||
| NET INVESTMENT INCOME | 1,514,579 | |||
| REALIZED AND UNREALIZED GAINS (LOSSES) ON INVESTMENTS | ||||
| Net realized gains from investment transactions | 2,372,124 | |||
| Net change in unrealized appreciation (depreciation) on investments | (12,193,625 | ) | ||
| NET REALIZED AND UNREALIZED LOSSES ON INVESTMENTS | (9,821,501 | ) | ||
| NET DECREASE IN NET ASSETS RESULTING FROM OPERATIONS | $ | (8,306,922 | ) |
See accompanying notes to financial statements.
10
| KEMPNER MULTI-CAP DEEP VALUE FUND |
| STATEMENTS OF CHANGES IN NET ASSETS |
| Year | Year | |||||||
| Ended | Ended | |||||||
| May 31, | May 31, | |||||||
| 2023 | 2022 | |||||||
| FROM OPERATIONS | ||||||||
| Net investment income | $ | 1,514,579 | $ | 1,136,029 | ||||
| Net realized gains from investment transactions | 2,372,124 | 3,990,397 | ||||||
| Net change in unrealized appreciation (depreciation) on investments | (12,193,625 | ) | (7,413,345 | ) | ||||
| Net decrease in net assets resulting from operations | (8,306,922 | ) | (2,286,919 | ) | ||||
| FROM DISTRIBUTIONS TO SHAREHOLDERS (Note 2) | ||||||||
| Institutional Class | (4,228,940 | ) | (5,383,280 | ) | ||||
| Investor Class | (1,086,099 | ) | (1,382,525 | ) | ||||
| Decrease in net assets from distributions to shareholders | (5,315,039 | ) | (6,765,805 | ) | ||||
| CAPITAL SHARE TRANSACTIONS | ||||||||
| Institutional Class | ||||||||
| Proceeds from shares sold | 2,094,494 | 3,393,328 | ||||||
| Net asset value of shares issued in reinvestment of distributions to shareholders | 2,892,857 | 439,322 | ||||||
| Payments for shares redeemed | (1,447,832 | ) | (851,453 | ) | ||||
| Net increase in Institutional Class net assets from captial share transactions | 3,539,519 | 2,981,197 | ||||||
| Investor Class | ||||||||
| Proceeds from shares sold | 80,269 | 578,111 | ||||||
| Net asset value of shares issued in reinvestment of distributions to shareholders | 907,885 | 1,142,088 | ||||||
| Payments for shares redeemed | (552,747 | ) | (1,295,529 | ) | ||||
| Net increase in Investor Class net assets from captial share transactions | 435,407 | 424,670 | ||||||
| TOTAL DECREASE IN NET ASSETS | (9,647,035 | ) | (5,646,857 | ) | ||||
| NET ASSETS | ||||||||
| Beginning of year | 82,621,429 | 88,268,286 | ||||||
| End of year | $ | 72,974,394 | $ | 82,621,429 | ||||
See accompanying notes to financial statements.
11
| KEMPNER MULTI-CAP DEEP VALUE FUND |
| STATEMENTS OF CHANGES IN NET ASSETS (Continued) |
| Year | Year | |||||||
| Ended | Ended | |||||||
| May 31, | May 31, | |||||||
| 2023 | 2022 | |||||||
| CAPITAL SHARES ACTIVITY | ||||||||
| Institutional Class | ||||||||
| Shares sold | 202,180 | 289,165 | ||||||
| Shares issued in reinvestment of distributions to shareholders | 295,046 | 37,216 | ||||||
| Shares redeemed | (141,113 | ) | (71,509 | ) | ||||
| Net increase in shares outstanding | 356,113 | 254,872 | ||||||
| Shares outstanding at beginning of year | 5,662,279 | 5,407,407 | ||||||
| Shares outstanding at end of year | 6,018,392 | 5,662,279 | ||||||
| Investor Class | ||||||||
| Shares sold | 7,823 | 47,703 | ||||||
| Shares issued in reinvestment of distributions to shareholders | 92,712 | 97,283 | ||||||
| Shares redeemed | (53,119 | ) | (105,117 | ) | ||||
| Net increase in shares outstanding | 47,416 | 39,869 | ||||||
| Shares outstanding at beginning of year | 1,537,013 | 1,497,144 | ||||||
| Shares outstanding at end of year | 1,584,429 | 1,537,013 | ||||||
See accompanying notes to financial statements.
12
| KEMPNER MULTI-CAP DEEP VALUE FUND |
| INSTITUTIONAL CLASS |
| FINANCIAL HIGHLIGHTS |
Per Share Data for a Share Outstanding Throughout Each Period
| For the | For the | For the | Ten | For the | For the | |||||||||||||||||||
| Year | Year | Year | Months | Year | Year | |||||||||||||||||||
| Ended | Ended | Ended | Ended | Ended | Ended | |||||||||||||||||||
| May 31, | May 31, | May 31, | May 31, | July 31, | July 31, | |||||||||||||||||||
| 2023 | 2022 | 2021 | 2020 (a) | 2019 | 2018 | |||||||||||||||||||
| Net asset value at beginning of period | $ | 11.48 | $ | 12.79 | $ | 8.77 | $ | 10.70 | $ | 11.01 | $ | 10.47 | ||||||||||||
| Income (loss) from investment operations: | ||||||||||||||||||||||||
| Net investment income | 0.21 | (b) | 0.17 | (b) | 0.15 | (b) | 0.20 | 0.21 | 0.19 | |||||||||||||||
| Net realized and unrealized gains (losses) on investments | (1.35 | ) | (0.49 | ) | 4.53 | (1.62 | ) | (0.19 | ) | 1.00 | ||||||||||||||
| Total from investment operations | (1.14 | ) | (0.32 | ) | 4.68 | (1.42 | ) | 0.02 | 1.19 | |||||||||||||||
| Less distributions from: | ||||||||||||||||||||||||
| Net investment income | (0.21 | ) | (0.15 | ) | (0.16 | ) | (0.17 | ) | (0.23 | ) | (0.17 | ) | ||||||||||||
| Net realized gains | (0.53 | ) | (0.84 | ) | (0.50 | ) | (0.34 | ) | (0.10 | ) | (0.48 | ) | ||||||||||||
| Total distributions | (0.74 | ) | (0.99 | ) | (0.66 | ) | (0.51 | ) | (0.33 | ) | (0.65 | ) | ||||||||||||
| Net asset value at end of period | $ | 9.60 | $ | 11.48 | $ | 12.79 | $ | 8.77 | $ | 10.70 | $ | 11.01 | ||||||||||||
| Total return (c) | (9.97 | %) | (2.61 | %) | 55.52 | % | (13.99 | %) (d) | 0.43 | % | 11.79 | % | ||||||||||||
| Net assets at end of period (000’s) | $ | 57,777 | $ | 64,995 | $ | 69,143 | $ | 48,552 | $ | 60,228 | $ | 67,725 | ||||||||||||
| Ratios/supplementary data: | ||||||||||||||||||||||||
| Ratio of total expenses to average net assets | 0.97 | % | 0.94 | % | 0.97 | % | 0.99 | % (e) | 0.95 | % | 0.94 | % | ||||||||||||
| Ratio of net investment income to average net assets | 2.05 | % | 1.39 | % | 1.46 | % | 2.37 | % (e) | 2.13 | % | 1.74 | % | ||||||||||||
| Portfolio turnover rate | 34 | % | 33 | % | 21 | % | 27 | % (d) | 17 | % | 25 | % | ||||||||||||
| (a) | Fund changed fiscal year to May 31. |
| (b) | Per share net income has been determined on the basis of average number of shares outstanding during the period. |
| (c) | Total return is a measure of the change in value of an investment in the Fund over the periods covered. The returns shown do not reflect the deduction of taxes a shareholder would pay on Fund distributions, if any, or the redemption of Fund shares. |
| (d) | Not annualized. |
| (e) | Annualized. |
See accompanying notes to financial statements.
13
| KEMPNER MULTI-CAP DEEP VALUE FUND |
| INVESTOR CLASS |
| FINANCIAL HIGHLIGHTS |
Per Share Data for a Share Outstanding Throughout Each Period
| For the | For the | For the | Ten | For the | For the | |||||||||||||||||||
| Year | Year | Year | Months | Year | Year | |||||||||||||||||||
| Ended | Ended | Ended | Ended | Ended | Ended | |||||||||||||||||||
| May 31, | May 31, | May 31, | May 31, | July 31, | July 31, | |||||||||||||||||||
| 2023 | 2022 | 2021 | 2020 (a) | 2019 | 2018 | |||||||||||||||||||
| Net asset value at beginning of period | $ | 11.47 | $ | 12.77 | $ | 8.76 | $ | 10.69 | $ | 11.00 | $ | 10.46 | ||||||||||||
| Income (loss) from investment operations: | ||||||||||||||||||||||||
| Net investment income | 0.19 | (b) | 0.14 | (b) | 0.13 | (b) | 0.18 | 0.18 | 0.17 | |||||||||||||||
| Net realized and unrealized gains (losses) on investments | (1.35 | ) | (0.48 | ) | 4.51 | (1.62 | ) | (0.19 | ) | 1.00 | ||||||||||||||
| Total from investment operations | (1.16 | ) | (0.34 | ) | 4.64 | (1.44 | ) | (0.01 | ) | 1.17 | ||||||||||||||
| Less distributions from: | ||||||||||||||||||||||||
| Net investment income | (0.19 | ) | (0.12 | ) | (0.13 | ) | (0.15 | ) | (0.20 | ) | (0.15 | ) | ||||||||||||
| Net realized gains | (0.53 | ) | (0.84 | ) | (0.50 | ) | (0.34 | ) | (0.10 | ) | (0.48 | ) | ||||||||||||
| Total distributions | (0.72 | ) | (0.96 | ) | (0.63 | ) | (0.49 | ) | (0.30 | ) | (0.63 | ) | ||||||||||||
| Net asset value at end of period | $ | 9.59 | $ | 11.47 | $ | 12.77 | $ | 8.76 | $ | 10.69 | $ | 11.00 | ||||||||||||
| Total return (c) | (10.22 | %) | (2.79 | %) | 55.09 | % | (14.18 | %) (d) | 0.18 | % | 11.55 | % | ||||||||||||
| Net assets at end of period (000’s) | $ | 15,198 | $ | 17,626 | $ | 19,125 | $ | 12,206 | $ | 14,495 | $ | 14,803 | ||||||||||||
| Ratios/supplementary data: | ||||||||||||||||||||||||
| Ratio of total expenses to average net assets | 1.22 | % | 1.19 | % | 1.22 | % | 1.24 | % (e) | 1.20 | % | 1.19 | % | ||||||||||||
| Ratio of net investment income to average net assets | 1.79 | % | 1.14 | % | 1.21 | % | 2.12 | % (e) | 1.88 | % | 1.49 | % | ||||||||||||
| Portfolio turnover rate | 34 | % | 33 | % | 21 | % | 27 | % (d) | 17 | % | 25 | % | ||||||||||||
| (a) | Fund changed fiscal year to May 31. |
| (b) | Per share net income has been determined on the basis of average number of shares outstanding during the period. |
| (c) | Total return is a measure of the change in value of an investment in the Fund over the periods covered. The returns shown do not reflect the deduction of taxes a shareholder would pay on Fund distributions, if any, or the redemption of Fund shares. |
| (d) | Not annualized. |
| (e) | Annualized. |
See accompanying notes to financial statements.
14
| KEMPNER MULTI-CAP DEEP VALUE FUND |
| NOTES TO FINANCIAL STATEMENTS |
| May 31, 2023 |
1. Organization
Kempner Multi-Cap Deep Value Fund (the “Fund”) is a diversified series of Ultimus Managers Trust (the “Trust”). The Trust is an open-end management investment company registered under the Investment Company Act of 1940, as amended (the “1940 Act”). The Fund was reorganized into the Trust on April 28, 2017. Other series of the Trust are not incorporated in this report.
The investment objective of the Fund is to seek to generate a total pre-tax return, including capital growth and dividends, that is greater than the rate of inflation over a three-to-five-year period.
The Fund currently offers two classes of shares: Institutional Class shares (sold without any sales loads and distribution and/or shareholder servicing fees and requiring a $500,000 initial investment) and Investor Class shares (sold without any sales loads, but subject to a distribution and/or shareholder servicing fee of up to 0.25% of the average daily net assets attributable to Investor Class shares and requiring a $500 initial investment). Each share class represents an ownership interest in the same investment portfolio.
2. Significant Accounting Policies
The Fund follows accounting and reporting guidance under Financial Accounting Standards Board Accounting Standards Codification Topic 946, “Financial Services – Investment Companies.” The following is a summary of the Fund’s significant accounting policies used in the preparation of its financial statements. These policies are in conformity with accounting principles generally accepted in the United States of America (“GAAP”).
Securities valuation – The Fund values its portfolio securities at market value as of the close of regular trading on the New York Stock Exchange (the “NYSE”) (normally 4:00 p.m. Eastern time) on each business day the NYSE is open for business. The Fund values its listed securities on the basis of the security’s last sale price on the security’s primary exchange, if available, otherwise at the exchange’s most recently quoted mean price. NASDAQ-listed securities are valued at the NASDAQ Official Closing Price. Investments representing shares of money market funds and other open-end investment companies are valued at their net asset value (“NAV”) as reported by such companies. When using a quoted price and when the market for the security is considered active, the security will be classified as Level 1 within the fair value hierarchy (see below). In the event that market quotations are not readily available or are considered unreliable due to market or other events, the Fund values its securities and other assets at fair value as determined by Kempner Capital Management, Inc. (the “Adviser”) as the valuation designee, in accordance with procedures adopted by the Board of Trustees (the “Board”) pursuant to Rule 2a-5 under the 1940 Act. Under these procedures, the securities will be classified as Level 2 or 3 within the fair value hierarchy, depending on the inputs used. Unavailable or unreliable market quotes may be due to the following factors: a substantial bid-ask spread; infrequent sales resulting in stale prices; insufficient trading volume; small trade sizes; a temporary lapse in any reliable pricing
15
| KEMPNER MULTI-CAP DEEP VALUE FUND |
| NOTES TO FINANCIAL STATEMENTS (Continued) |
source; and actions of the securities or futures markets, such as the suspension or limitation of trading. As a result, the prices of securities used to calculate the Fund’s NAV may differ from quoted or published prices for the same securities.
GAAP establishes a single authoritative definition of fair value, sets out a framework for measuring fair value, and requires additional disclosures about fair value measurements.
Various inputs are used in determining the value of the Fund’s investments. These inputs are summarized in the three broad levels listed below:
| ● | Level 1 – quoted prices in active markets for identical securities |
| ● | Level 2 – other significant observable inputs |
| ● | Level 3 – significant unobservable inputs |
The inputs or methods used for valuing securities are not necessarily an indication of the risks associated with investing in those securities. The inputs used to measure fair value may fall into different levels of the fair value hierarchy. In such cases, for disclosure purposes, the level in the fair value hierarchy within which the fair value measurement falls in its entirety is determined based on the lowest level input that is significant to the fair value measurement.
The following is a summary of the Fund’s investments based on the inputs used to value the investments as of May 31, 2023 by security type:
| Level 1 | Level 2 | Level 3 | Total | |||||||||||||
| Common Stocks | $ | 62,603,027 | $ | — | $ | — | $ | 62,603,027 | ||||||||
| Total | $ | 62,603,027 | $ | — | $ | — | $ | 62,603,027 | ||||||||
Refer to the Fund’s Schedule of Investments for a listing of securities by sector and industry type. The Fund did not hold any derivative instruments or any assets or liabilities that were measured at fair value on a recurring basis using significant unobservable inputs (Level 3) as of or during year ended May 31, 2023.
Cash – The Fund’s cash, if any, is held in a bank account with balances which may exceed the Federal Deposit Insurance Corporation (FDIC) limit of $250,000. As of May 31, 2023, the cash balance reflected on the Statement of Assets and Liabilities for the Fund represents the amount held in a deposit sweep account.
Share valuation – The NAV per share of each class of the Fund is calculated daily by dividing the total value of the assets attributable to that class, less liabilities attributable to that class, by the number of shares outstanding of that class. The offering price and redemption price per share of each class of the Fund is equal to the NAV per share of such class.
16
| KEMPNER MULTI-CAP DEEP VALUE FUND |
| NOTES TO FINANCIAL STATEMENTS (Continued) |
Investment income – Dividend income is recorded on the ex-dividend date. Non-cash dividends included in dividend income, if any, are recorded at the fair market value of the security received. Interest income is accrued as earned. Withholding taxes on foreign dividends have been recorded in accordance with the Fund’s understanding of the applicable country’s rules and tax rates.
Investment transactions – Investment transactions are accounted for on the trade date. Realized gains and losses on investments sold are determined on a specific identification basis.
Allocation between classes – Investment income earned, realized capital gains and losses, and unrealized appreciation and depreciation are allocated daily to each class of the Fund based upon its proportionate share of total net assets of the Fund. Class-specific expenses are charged directly to the class incurring the expense. Common expenses which are not attributable to a specific class are allocated daily to each class of shares of the Fund based upon its proportionate share of total net assets of the Fund. Distribution fees are class specific expenses.
Common expenses – Common expenses of the Trust are allocated among the Fund and the other series of the Trust based on the relative net assets of each series, the number of series in the Trust, or the nature of the services performed and the relative applicability to each series.
Distributions to shareholders – The Fund intends to declare and distribute net investment income dividends on a quarterly basis. In addition, the Fund will declare and distribute net realized capital gains, if any, on an annual basis. The amount of such dividends and distributions are determined in accordance with federal income tax regulations, which may differ from GAAP. Dividends and distributions to shareholders are recorded on the ex-dividend date. The tax character of distributions paid to shareholders by the Fund during the years ended May 31, 2023 and 2022 were as follows:
| Year | Ordinary | Long-Term | Total | |||||||||
| Ended | Income | Capital Gains | Distributions | |||||||||
| 5/31/2023 | $ | 1,957,768 | $ | 3,357,271 | $ | 5,315,039 | ||||||
| 5/31/2022 | $ | 2,778,664 | $ | 3,987,141 | $ | 6,765,805 | ||||||
Estimates – The preparation of financial statements in conformity with GAAP requires management to make estimates and assumptions that affect the reported amounts of assets and liabilities and disclosure of contingent assets and liabilities as of the date of the financial statements and the reported amounts of increase (decrease) in net assets from operations during the reporting period. Actual results could differ from those estimates.
Federal income tax – The Fund has qualified and intends to continue to qualify as a regulated investment company under the Internal Revenue Code of 1986 (the “Code”). Qualification generally will relieve the Fund of liability for federal income taxes to the extent 100% of its net investment income and net realized capital gains are distributed in accordance with the Code.
17
| KEMPNER MULTI-CAP DEEP VALUE FUND |
| NOTES TO FINANCIAL STATEMENTS (Continued) |
In order to avoid imposition of the excise tax applicable to regulated investment companies, it is also the Fund’s intention to declare as dividends in each calendar year amounts equal to at least 98% of its net investment income (earned during the calendar year) and 98.2% of its net realized capital gains (earned during the twelve months ended October 31) plus undistributed amounts from prior years.
The following information is computed on a tax basis for each item as of May 31, 2023:
| Tax cost of investments | $ | 67,234,085 | ||
| Gross unrealized appreciation | $ | 5,902,322 | ||
| Gross unrealized depreciation | (10,533,380 | ) | ||
| Net unrealized depreciation | (4,631,058 | ) | ||
| Undistributed ordinary income | 1,652,948 | |||
| Undistributed long-term gains | 1,042,598 | |||
| Accumulated deficit | $ | (1,935,512 | ) | |
The Fund recognizes the tax benefits or expenses of uncertain tax positions only when the position is “more likely than not” of being sustained assuming examination by tax authorities. Management has reviewed the Fund’s tax positions for the current and all open tax years (generally, three years) and has concluded that no provision for unrecognized tax benefits or expenses is required in these financial statements. The Fund identifies its major tax jurisdiction as U.S. Federal.
The Fund recognizes interest and penalties, if any, related to unrecognized tax benefits as income tax expense on the Statement of Operations. During the year ended May 31, 2023, the Fund did not incur any interest or penalties.
3. Investment Transactions
During the year ended May 31, 2023, cost of purchases and proceeds from sales of investment securities, other than short-term investments, amounted to $23,770,105 and $27,986,146, respectively.
4. Transactions with Related Parties
INVESTMENT ADVISORY AGREEMENT
The Fund’s investments are managed by the Adviser pursuant to the terms of an Investment Advisory Agreement. The Fund pays the Adviser a management fee, computed and accrued daily and paid monthly, at the annual rate of 0.59% of average daily net assets.
The Adviser has agreed contractually, until at least December 1, 2023, to reduce its management fees and reimburse other expenses to the extent necessary to limit total annual fund operating expenses (exclusive of brokerage costs; taxes; interest; borrowing costs such as interest and dividend expenses on securities sold short; costs to organize the Fund; acquired fund fees and expenses; extraordinary expenses such as litigation and merger or
18
| KEMPNER MULTI-CAP DEEP VALUE FUND |
| NOTES TO FINANCIAL STATEMENTS (Continued) |
reorganization costs and other expenses not incurred in the ordinary course of the Fund’s business) to an amount not exceeding 1.05% and 1.30% of average daily net assets for Institutional Class and Investor Class shares, respectively.
Management fee reductions and expense reimbursements by the Adviser are subject to repayment by the Fund for a period of 36 months after such fees and expenses were incurred, provided that the repayments do not cause the Fund’s total annual fund operating expenses to exceed the lesser of: (i) the expense limitation then in effect, if any, and (ii) the expense limitation in effect at the time the expenses to be repaid were incurred. This agreement will terminate automatically if the Investment Advisory Agreement is terminated. During the year ended May 31, 2023, the Adviser did not reduce its management fees or reimburse other expenses of the Fund.
OTHER SERVICE PROVIDERS
Ultimus Fund Solutions, LLC (“Ultimus”) provides administration, fund accounting, compliance and transfer agency services to the Fund. The Fund pays Ultimus fees in accordance with the agreements for such services. In addition, the Fund pays out-of-pocket expenses including, but not limited to, postage, supplies and certain costs related to the pricing of the Fund’s portfolio securities.
Under the terms of a Distribution Agreement with the Trust, Ultimus Fund Distributors, LLC (the “Distributor”) serves as principal underwriter to the Fund. The Distributor is a wholly-owned subsidiary of Ultimus. The Distributor is compensated partially by the Adviser and partially by the Investor Class shares of the Fund for acting as principal underwriter.
A Trustee and certain officers of the Trust are also officers of Ultimus and are not paid by the Fund for serving in such capacities.
DISTRIBUTION PLAN
The Fund has adopted a plan of distribution (the “Plan”), pursuant to Rule 12b-1 under the 1940 Act, which permits Investor Class shares of the Fund to directly incur or reimburse the Fund’s principal underwriter for certain expenses related to the distribution of Investor Class shares. The annual limitation for payment of expenses pursuant to the Plan is 0.25% of the Fund’s average daily net assets allocable to Investor Class shares. The Fund has not adopted a plan of distribution with respect to Institutional Class shares. During the year ended May 31, 2023, Investor Class shares of the Fund incurred $40,148 of distribution fees under the Plan.
TRUSTEE COMPENSATION
Effective October 17, 2022, each member of the Board (a “Trustee”) who is not an “interested person” (as defined by the 1940 Act, as amended) of the Trust (“Independent Trustee”) receives a $1,300 annual retainer from the Fund, except for the Board Chairperson who receives a $1,700 annual retainer from each Fund and the Audit Committee Chairperson who receives a $1,500 annual retainer from the Fund, paid in quarterly installments. Each Independent Trustee also receives from the Fund a fee of $550 for each Board meeting attended plus reimbursement for travel and other meeting-related expenses. Prior to October 17, 2022, no additional annual retainer was specifically designated for the Audit Committee Chairperson.
19
| KEMPNER MULTI-CAP DEEP VALUE FUND |
| NOTES TO FINANCIAL STATEMENTS (Continued) |
PRINCIPAL HOLDERS OF FUND SHARES
As of May 31, 2023, the following shareholders owned of record 25% or more of the outstanding shares of the Fund:
| NAME OF RECORD OWNERS | % Ownership |
| Muir & Company (for the benefit of its customers) | 85% |
A beneficial owner of 25% or more of the Fund’s outstanding shares may be considered a controlling person. That shareholder’s vote could have a more significant effect on matters presented at a shareholders’ meeting.
5. Contingencies and Commitments
The Fund indemnifies the Trust’s officers and Trustees for certain liabilities that might arise from their performance of their duties to the Fund. Additionally, in the normal course of business the Fund enters into contracts that contain a variety of representations and warranties and which provide general indemnifications. The Fund’s maximum exposure under these arrangements is unknown, as this would involve future claims that may be made against the Fund that have not yet occurred. However, based on experience, the Fund expects the risk of loss to be remote.
6. Subsequent Events
The Fund is required to recognize in the financial statements the effects of all subsequent events that provide additional evidence about conditions that existed as of the date of the Statement of Assets and Liabilities. For non-recognized subsequent events that must be disclosed to keep the financial statements from being misleading, the Fund is required to disclose the nature of the event as well as an estimate of its financial effect, or a statement that such an estimate cannot be made. Management has evaluated subsequent events through the issuance of these financial statements and has noted no such events except for the following:
The Fund paid the following distributions to shareholders subsequent to May 31, 2023:
| Per Share | ||||||||
| Record | Ordinary | |||||||
| Date | Ex-Date | Income | ||||||
| Institutional Class | 06/28/2023 | 06/29/2023 | $ | 0.0589 | ||||
| Investor Class | 06/28/2023 | 06/29/2023 | $ | 0.0526 | ||||
20
| KEMPNER MULTI-CAP DEEP VALUE FUND |
| CHANGE IN INDEPENDENT REGISTERED |
| PUBLIC ACCOUNTING FIRM (Unaudited) |
On March 13, 2023, BBD LLP (“BBD”) ceased to serve as the independent registered public accounting firm of Kempner Multi-Cap Deep Value Fund (the “Fund”), a series of Ultimus Managers Trust. The Audit Committee of the Board of Trustees approved the replacement of BBD as a result of Cohen & Company, Ltd.’s (“Cohen”) acquisition of BBD’s Investment Management Group.
The report of BBD on the financial statements of the Fund as of and for the fiscal years ended 2022 and 2021 did not contain an adverse opinion or a disclaimer of opinion, and were not qualified or modified as to uncertainties, audit scope or accounting principles. During the fiscal years ended 2022 and 2021, and during the subsequent interim period through March 13, 2023: (i) there were no disagreements between the registrant and BBD on any matter of accounting principles or practices, financial statement disclosure, or auditing scope or procedure, which disagreements, if not resolved to the satisfaction of BBD, would have caused it to make reference to the subject matter of the disagreements in its report on the financial statements of the Fund for such years or interim period; and (ii) there were no “reportable events,” as defined in Item 304(a)(1)(v) of Regulation S-K under the Securities Exchange Act of 1934, as amended.
On April 21, 2023, the Audit Committee of the Board of Trustees also recommended and approved the appointment of Cohen as the Fund’s independent registered public accounting firm for the fiscal year ending May 31, 2023.
During the fiscal years ended 2022 and 2021, and during the subsequent interim period through March 13, 2023, neither the registrant, nor anyone acting on its behalf, consulted with Cohen on behalf of the Fund regarding the application of accounting principles to a specified transaction (either completed or proposed), the type of audit opinion that might be rendered on the Fund’s financial statements, or any matter that was either: (i) the subject of a “disagreement,” as defined in Item 304(a)(1)(iv) of Regulation S-K and the instructions thereto; or (ii) “reportable events,” as defined in Item 304(a)(1)(v) of Regulation S-K.
21
| KEMPNER MULTI-CAP DEEP VALUE FUND |
| REPORT OF INDEPENDENT REGISTERED |
| PUBLIC ACCOUNTING FIRM |
To the Shareholders of Kempner Multi-Cap Deep Value Fund and
Board of Trustees of Ultimus Managers Trust
Opinion on the Financial Statements
We have audited the accompanying statement of assets and liabilities, including the schedule of investments, of Kempner Multi-Cap Deep Value Fund (the “Fund”), a series of Ultimus Managers Trust, as of May 31, 2023, the related statements of operations and changes in net assets for the year then ended, the related notes, and the financial highlights for the year then ended (collectively referred to as the “financial statements”). In our opinion, the financial statements present fairly, in all material respects, the financial position of the Fund as of May 31, 2023, the results of its operations, the changes in net assets and the financial highlights for the year then ended, in conformity with accounting principles generally accepted in the United States of America.
The Fund’s financial statements and financial highlights for the years and periods ended May 31, 2022, and prior, were audited by another auditor whose report dated July 20, 2022, expressed an unqualified opinion on those financial statements and financial highlights.
Basis for Opinion
These financial statements are the responsibility of the Fund’s management. Our responsibility is to express an opinion on the Fund’s financial statements based on our audit. We are a public accounting firm registered with the Public Company Accounting Oversight Board (United States) (“PCAOB”) and are required to be independent with respect to the Fund in accordance with the U.S. federal securities laws and the applicable rules and regulations of the Securities and Exchange Commission and the PCAOB.
We conducted our audit in accordance with the standards of the PCAOB. Those standards require that we plan and perform the audit to obtain reasonable assurance about whether the financial statements are free of material misstatement whether due to error or fraud.
Our audit included performing procedures to assess the risks of material misstatement of the financial statements, whether due to error or fraud, and performing procedures that respond to those risks. Such procedures included examining, on a test basis, evidence regarding the amounts and disclosures in the financial statements. Our procedures included confirmation of securities owned as of May 31, 2023, by correspondence with the custodian. Our audit
22
| KEMPNER MULTI-CAP DEEP VALUE FUND |
| REPORT OF INDEPENDENT REGISTERED |
| PUBLIC ACCOUNTING FIRM (Continued) |
also included evaluating the accounting principles used and significant estimates made by management, as well as evaluating the overall presentation of the financial statements. We believe that our audit provides a reasonable basis for our opinion.
We have served as the Fund’s auditor since 2023.
COHEN & COMPANY, LTD.
Philadelphia, Pennsylvania
July 27, 2023
23
| KEMPNER MULTI-CAP DEEP VALUE FUND |
| ABOUT YOUR FUND’S EXPENSES (Unaudited) |
We believe it is important for you to understand the impact of costs on your investment. As a shareholder of the Fund, you incur ongoing costs, including management fees, class-specific expenses (such as distribution fees) and other operating expenses. The following examples are intended to help you understand your ongoing costs (in dollars) of investing in the Fund and to compare these costs with the ongoing costs of investing in other mutual funds.
A mutual fund’s ongoing costs are expressed as a percentage of its average net assets. This figure is known as the expense ratio. The expenses in the table below are based on an investment of $1,000 made at the beginning of the most recent period (December 1, 2022) and held until the end of the period (May 31, 2023).
The table below illustrates the Fund’s ongoing costs in two ways:
Actual fund return – The first line for each share class helps you to estimate the actual expenses that you paid over the period. The “Ending Account Value” shown is derived from the Fund’s actual return, and the fourth column shows the dollar amount of operating expenses that would have been paid by an investor who started with $1,000 in the Fund. You may use the information here, together with the amount you invested, to estimate the expenses that you paid over the period.
To do so, simply divide your account value by $1,000 (for example, an $8,600 account value divided by $1,000 = 8.6), then multiply the result by the number given for the Fund under the heading “Expenses Paid During Period.”
Hypothetical 5% return – The second line for each share class is intended to help you compare the Fund’s ongoing costs with those of other mutual funds. It assumes that the Fund had an annual return of 5% before expenses during the period shown, but that the expense ratio is unchanged. In this case, because the return used is not the Fund’s actual return, the results do not apply to your investment. The example is useful in making comparisons because the U.S. Securities and Exchange Commission (the “SEC”) requires all mutual funds to calculate expenses based on a 5% return. You can assess the Fund’s ongoing costs by comparing this hypothetical example with the hypothetical examples that appear in shareholder reports of other funds.
Note that expenses shown in the table are meant to highlight and help you compare ongoing costs only. The Fund does not charge transaction fees, such as purchase or redemption fees, nor does it charge a “sales load.”
The calculations assume no shares were bought or sold during the period. Your actual costs may have been higher or lower, depending on the amount of your investment and the timing of any purchases or redemptions.
24
| KEMPNER MULTI-CAP DEEP VALUE FUND |
| ABOUT YOUR FUND’S EXPENSES (Unaudited) (Continued) |
More information about the Fund’s expenses can be found in this report. For additional information on operating expenses and other shareholder costs, please refer to the Fund’s prospectus.
| Beginning | Ending | Net | Expenses | |
| Account Value | Account Value | Expense | Paid During | |
| December 1, 2022 | May 31, 2023 | Ratio(a) | Period(b) | |
| Institutional Class | ||||
| Base on Actual Fund Return | $1,000.00 | $ 934.60 | 0.96% | $4.63 |
| Based on Hypothetical 5% Return (before expenses) | $1,000.00 | $1,020.14 | 0.96% | $4.84 |
| Investor Class | ||||
| Base on Actual Fund Return | $1,000.00 | $ 932.50 | 1.21% | $5.83 |
| Based on Hypothetical 5% Return (before expenses) | $1,000.00 | $1,018.90 | 1.21% | $6.09 |
| (a) | Annualized, based on each Class’s most recent one-half year expenses. |
| (b) | Expenses are equal to each Class’s annualized net expense ratio multiplied by the average account value over the period, multiplied by 182/365 (to reflect the one-half year period). |
25
| KEMPNER MULTI-CAP DEEP VALUE FUND |
| OTHER INFORMATION (Unaudited) |
A description of the policies and procedures that the Fund uses to vote proxies relating to portfolio securities is available without charge upon request by calling toll- free 1-800-665-9778, or on the SEC’s website at www.sec.gov. Information regarding how the Fund voted proxies relating to portfolio securities during the most recent 12-month period ended June 30 is available without charge upon request by calling toll-free 1-800-665-9778, or on the SEC’s website at www.sec.gov.
The Trust files a complete listing of portfolio holdings for the Fund with the SEC as of the end of the first and third quarters of each fiscal year as an exhibit to its reports on Form N-PORT. These filings are available upon request by calling 1-800-665-9778. Furthermore, you may obtain a copy of the filings on the SEC’s website at www.sec.gov.
| FEDERAL TAX INFORMATION (Unaudited) |
For the year ended May 31, 2023, the Fund designated $3,357,271 as a long-term capital gain distribution.
Qualified Dividend Income – The Fund designates 78.00% of its ordinary income dividends, or up to the maximum amount of such dividends allowable pursuant to the Internal Revenue Code, as qualified dividend income eligible for the reduced tax rate.
Dividends Received Deduction – Corporate shareholders are generally entitled to take the dividends received deduction on the portion of a Fund’s dividend distribution that qualifies under tax law. For the year ended May 31, 2023, 66.75% of ordinary income dividends qualifies for the corporate dividends received deduction.
26
| KEMPNER MULTI-CAP DEEP VALUE FUND |
| BOARD OF TRUSTEES AND EXECUTIVE OFFICERS (Unaudited) |
The Board has overall responsibility for management of the Trust’s affairs. The Trustees serve during the lifetime of the Trust and until its termination, or until death, resignation, retirement, or removal. The Trustees, in turn, elect the officers of the Fund to actively supervise their day-to-day operations. The officers have been elected for an annual term. Each Trustee’s and officer’s address is 225 Pictoria Drive, Suite 450, Cincinnati, Ohio 45246. The following are the Trustees and executive officers of the Fund:
| Name and Year of Birth | Length of Time Served | Position(s) held with Trust | Principal Occupation(s) During Past 5 Years | Number of Funds in the Trust Overseen By Trustee | Directorship(s) of Public Companies Held By Trustee During Past 5 Years |
| Interested Trustees: | |||||
| David K. James* Year of Birth: 1970 | April 2023 to present October 2022 to April 2023 July 2021 to October 2022 | Trustee (April 2023 to present) Assistant Secretary Secretary | Executive Vice President and Chief Legal and Risk Officer of Ultimus Fund Solutions, LLC (“Ultimus”) and a member of the board of managers of Ultimus Fund Distributors, LLC, Northern Lights Distributors, LLC and Northern Lights Compliance Services, LLC, each an affiliate of Ultimus (2018 to present); Managing Director and Managing Counsel of State Street Bank and Trust Company (2009 to 2018) | 32 | Interested Trustee of 12 series of the Capitol Series Trust (a registered management company) (2021 to present) |
| Independent Trustees: | |||||
| Janine L. Cohen Year of Birth: 1952 | Since 2016 | Chairperson (2019 to present) Trustee (2016 to present) | Retired since 2013; previously Chief Financial Officer from 2004 to 2013 and Chief Compliance Officer from 2008 to 2013 at AER Advisors, Inc. | 32 | n/a |
27
| KEMPNER MULTI-CAP DEEP VALUE FUND |
| BOARD OF TRUSTEES AND EXECUTIVE OFFICERS (Unaudited) (Continued) |
| Name and Year of Birth | Length of Time Served | Position(s) held with Trust | Principal Occupation(s) During Past 5 Years | Number of Funds in the Trust Overseen By Trustee | Directorship(s) of Public Companies Held By Trustee During Past 5 Years |
| Independent Trustees (Continued) | |||||
| David M. Deptula Year of Birth: 1958 | Since 2012 | Trustee (2012 to present) | Vice President of Legal and Special Projects at Dayton Freight Lines, Inc. since 2016 | 32 | n/a |
| Robert E. Morrison Year of Birth: 1957 | Since 2019 | Trustee (2019 to present; and previously 2012 to 2012) | Managing Director at Midwest Trust and FCI Advisors (2022 to present); Senior Vice President and National Practice Lead for Investment, Huntington National Bank/Huntington Private Bank (2014 to 2022); CEO, CIO, President of 5 Star Investment Management Company (2006 to 2014) | 32 | n/a |
| Clifford N. Schireson Year of Birth: 1953 | Since 2019 | Trustee (2019 to present) | Retired; Founder of Schireson Consulting, LLC (2017 to 2022); Director of Institutional Services for Brandes Investment Partners, LP (2004 to 2017) | 32 | Trustee of the San Diego City Employees’ Retirement System (2019 to present) |
| Jacqueline A. Williams Year of Birth: 1954 | Since 2019 | Trustee (2019 to present) | Managing Member of Custom Strategy Consulting, LLC (2017 to present); Managing Director of Global Investment Research (2005 to 2017), Cambridge Associates, LLC | 32 | n/a |
| * | Mr. James is considered an “interested person” of the Trust within the meaning of Section (2)(a)(19) of the 1940 Act, as amended, because of his relationship with the Trust’s Administrator, Transfer Agent, and Distributor. Mr. James was Assistant Secretary of the Trust from October 2022 to April 2023 and Secretary of the Trust from July 2021 to October 2022. |
28
| KEMPNER MULTI-CAP DEEP VALUE FUND |
| BOARD OF TRUSTEES AND EXECUTIVE OFFICERS (Unaudited) (Continued) |
| Name and Year of Birth | Length of Time Served | Position(s) held with Trust | Principal Occupation(s) During Past 5 Years |
| Executive Officers: | |||
| Todd E. Heim Year of Birth: 1967 | 2021 to present 2014 to 2021 | President Vice President | Vice President, Relationship Management (2018 to present) and Assistant Vice President, Client Implementation Manager with Ultimus Fund Solutions, LLC (2014 to 2018) |
| Shannon Thibeaux- Burgess Year of Birth: 1970 | April 2023 to present | Vice President | Senior Vice President, Relationship Management with Ultimus Fund Solutions, LLC (2022 to present); Head of Regulatory Service with J.P. Morgan Chase & Co. (2020 to 2022); Chief Administrative Officer of State Street Bank (2013 to 2020) |
| Jennifer L. Leamer Year of Birth: 1976 | 2014 to present April 2014 to October 2014 | Treasurer Assistant Treasurer | Senior Vice President of Fund Accounting (2020 to present) and Mutual Fund Controller of Ultimus Fund Solutions, LLC (2014 to 2020) |
| Daniel D. Bauer Year of Birth: 1977 | 2016 to present | Assistant Treasurer | Vice President of Fund Accounting (2022 to present), Assistant Vice President of Fund Accounting (2020 to 2022), and AVP, Assistant Mutual Fund Controller (2015 to 2020) of Ultimus Fund Solutions, LLC |
| Angela A. Simmons Year of Birth: 1975 | January 2022 to present | Assistant Treasurer | Vice President of Financial Administration (2022 to present) and Assistant Vice President, Financial Administration (2015 to 2022) of Ultimus Fund Solutions, LLC |
| Karen Jacoppo-Wood Year of Birth: 1966 | April 2023 to present | Secretary | Vice President and Senior Legal Counsel of Ultimus Fund Solutions, LLC (2021 to present); Vice President, Asset Servicing – Regulatory Administration of The Bank of New York Mellon (2019 to 2021); Vice President and Counsel of State Street Bank and Trust Company (2015 to 2019) |
| Natalie S. Anderson Year of Birth: 1975 | 2016 to present | Assistant Secretary | Legal Administration Manager (2016 to present) and Paralegal (2015 to 2016) of Ultimus Fund Solutions, LLC |
| Jesse Hallee Year of Birth: 1976 | April 2023 to present | Assistant Secretary | Senior Vice President and Associate General Counsel of Ultimus Fund Solutions, LLC (June 2019 to present); Vice President and Managing Counsel, State Street Bank and Trust Company (2013 to 2019) |
29
| KEMPNER MULTI-CAP DEEP VALUE FUND |
| BOARD OF TRUSTEES AND EXECUTIVE OFFICERS (Unaudited) (Continued) |
| Name and Year of Birth | Length of Time Served | Position(s) held with Trust | Principal Occupation(s) During Past 5 Years |
| Executive Officers (Continued): | |||
| Gweneth K. Gosselink Year of Birth: 1955 | 2020 to present | Chief Compliance Officer | Assistant Vice President, Compliance Officer at Ultimus Fund Solutions, LLC (2019 to present); CCO Consultant at GKG Consulting, LLC (2019 to 2021); Chief Operating Officer & CCO at Miles Capital, Inc. (2013 to 2019) |
| Martin Dean Year of Birth: 1963 | 2020 to present 2019 to 2020 2016 to 2017 | Assistant Chief Compliance Officer Interim Chief Compliance Officer Assistant Chief Compliance Officer | President of Northern Lights Compliance Services, LLC (February 2023 to present); Senior Vice President, Head of Fund Compliance (2020 to January 2023) and Vice President & Director of Fund Compliance of Ultimus Fund Solutions, LLC (2016 to 2020) |
Additional information about members of the Board and executive officers is available in the Fund’s Statement of Additional Information (“SAI”). To obtain a free copy of the SAI, please call toll free 1-800-665-9778.
30
This page intentionally left blank.
This page intentionally left blank.
This page intentionally left blank.
KEMPNER-AR-23
| WAVELENGTH FUND | |
| LETTER TO SHAREHOLDERS (Unaudited) | July 2023 |
Dear Fellow Shareholders:
Since our last annual letter, central banks across the globe continued to move in the same direction, amplifying the impact of their policies from one economic bloc to the next. The sharpest monetary tightening in decades forcefully changed the trajectory of inflation – which reached a cyclical peak in June of 2022 with the US Consumer Price Index’s annual rise exceeding 9% – but given their lagged nature, the full impact of these policies remains on the horizon. The acute rise in rates and resulting uncertainty around potential economic outcomes formed a cloud of selling pressure over financial assets during the period. In this environment, we sought to limit the downside by actively managing risks and adapting to a new opportunity set amidst higher rates while maintaining our core balance to factors driving changes in the economy.
What follows is designed to provide a context for our returns that fosters a deeper understanding of the investment process that supports them. By doing so we hope to build on the partnership your investment creates.
PERFORMANCE SUMMARY
For the twelve months ended May 31, 2023, the Wavelength Fund (the “Fund”) delivered a return of -2.12% versus a benchmark return of +3.33% for the S&P US Treasury Bill o-3 Month Index (which seeks to represent the return from not taking risk in financial markets). While the Fund’s results were negative, they remained within targeted risk parameters through a period of selling pressure across financial assets and the Fund maintained its balance to economic conditions in line with long-term investment objectives.
INVESTMENT ENVIRONMENT
Since our last letter, central banks have maintained an overwhelming focus on inflation which, despite reversing course after peaking in June, remains elevated above long-term targets. This dynamic has led to a further tightening of conditions and additional downward pressure on financial assets amidst heightened uncertainty as policies flow through to underlying economies.
The period began with a broad-based selloff across markets as the persistence of high inflation resulted in a repricing of policy expectations. As the summer months continued and price pressure showed signs of moderation, however, investors reassessed conditions and redeployed capital accordingly. This initial recovery proved only temporary as market frictions resurfaced in August and September, but it served as a preview of changes to the landscape for financial assets to come in the fourth quarter.
Amidst a deteriorating backdrop for growth, geopolitical factors rose to the fore in October. China’s 20th Party Congress showcased updated strategic priorities, while the fallout from pipeline explosions highlighted key risks with Europe adapting to a new energy landscape. Elsewhere on the continent, the UK’s proposed fiscal easing into a balance of payments crisis – a situation more often seen in emerging economies – was met by a swift market response,
1
setting a precedent for other developed nations facing such imbalances. The quarter came to a close with additional rate increases from the Federal Reserve and other central banks alongside data releases that showed progress being made in the effort to bring down inflation.
Markets across the globe had a strong start to 2023 as they recalibrated broadly, with stocks rallying on hopes of a softer landing and fixed income bouncing back after months of dislocation. Higher yields helped support bonds structurally in this context, and the prevalence of real yields in positive territory across a growing number of maturities was indicative of the new regime for central banks. In March, meaningful pressures built over the course of the tightening cycle came to a head with the fall of three regional lenders and a large global bank over a tumultuous 11-day period. The rise in banking sector stress drove concerns around contagion along with the additional tightening that could result, and this rapidly reset the expected path for rates to a new trajectory.
The second quarter got off to a similar start with First Republic falling into FDIC receivership, adding to the pullback in lending across financial institutions. Tighter conditions already in place from prior policy decisions were exacerbated, and a broad range of leading indicators began showing the bite of central bank actions in the economy. This confluence of factors ultimately led to an inflection point at the Federal Reserve’s meeting in May, where the central bank opened the door to pausing its hiking cycle while assessing the impact of decisions to date. While policymakers have made their intentions for additional interest rate hikes clear, the departure from all-out tightening marks a key transition as the impact of significantly higher borrowing costs flows through to the economy.
PERFORMANCE DISCUSSION
After years of low rates and relatively muted central bank activity, a shift toward the most aggressive monetary tightening in decades brought rates to levels far above policymakers’ own expectations and put pressure on financial assets across the globe. In this context, the Fund suffered losses, then began to rebound over the period while actively managing oncoming risks and adapting to a new environment of higher rates with a meaningfully different opportunity set.
The period began with mixed performance through the summer months whereby risk management proved critical through bouts of selling pressure and opportunities were sought actively from the resulting market dislocations. In an environment where monetary tightening overwhelmed many relationships between growth, inflation and financial assets, longstanding principles of diversification became a less effective tool for mitigating risks. As a result, exposures were reduced while maintaining the Fund’s long-term strategic balance.
Following a disruptive reset in expectations for the path for interest rates that impacted assets across fixed income, markets began recalibrating toward a new set of conditions in the fourth quarter and the Fund actively monetized these changes. Balance to potential economic conditions regained its effectiveness as a strategic source of diversification for the portfolio, and opportunities from months of dislocation were monetized through the end of the fourth quarter.
The new year began with a widescale redeployment of capital among investors, and the Fund actively took advantage of this market dynamic amidst a backdrop of structural support from higher yields. Government bond positions across the US yield curve were profitable, alongside corporate credit and emerging market debt exposures as price pressures continued
2
to moderate. This recalibration of expectations was not without volatility, however, as markets ultimately faced an acute rise in banking sector stress in March. In this context, the portfolio’s strategic balance was effective at managing related risks, and profits were ultimately generated through US Treasuries and other safe-haven exposures.
In the wake of the largest bank failures since 2008, the Fund monetized opportunities in corporate credit and emerging market debt, benefiting from changing expectations for the timeframe of an economic slowdown. As the period came to a close, hawkishness among central banks resurfaced, leading to losses in government bond positions that were partially offset by convertible bonds – particularly those tied to the technology sector which offered upside as investors began to recognize how generative artificial intelligence and other developments may transform the economic landscape.
The impact of tightening from both monetary policy and bank lending is now starting to bite in the economy, and as a result, markets are exhibiting late-cycle instability as they adapt to a new set of conditions. After a period of significant stress, this dynamic is producing a notably wide and deep opportunity set across fixed income where markets offer the potential for upside with greater yields, lower volatility and downside protection versus equities as the economy slows.
Thank you for your trust and support as investors.
Sincerely,

Andrew Dassori
Founding Partner & Chief Investment Officer
Wavelength Capital Management
Past performance is not predictive of future performance. Investment results and principal value will fluctuate so that shares, when redeemed, may be worth more or less than their original cost. Current performance may be higher or lower than the performance data quoted. Performance data current to the most recent month end are available by calling 1-866-896-9292.
An investor should consider the investment objectives, risks, charges and expenses of the Fund carefully before investing. The Fund’s prospectus contains this and other important information. To obtain a copy of the Fund’s prospectus please visit our website at www.wavelengthfunds.com or call 1-866-896-9292 and a copy will be sent to you free of charge. Please read the prospectus carefully before you invest. The Wavelength Fund is distributed by Ultimus Fund Distributors, LLC.
The Letter to Shareholders seeks to describe some of the Adviser’s current opinions and views of the financial markets. Although the Adviser believes it has a reasonable basis for any opinions or views expressed, actual results may differ, sometimes significantly so, from those expected or expressed. The securities held by the Fund that are discussed in the Letter to Shareholders were held during the period covered by this Report. They do not comprise the entire investment portfolio of the Fund, may be sold at any time and may no longer be
3
held by the Fund. For a complete list of securities held by the Fund as of May 31, 2023, please see the Schedule of Investments section of the Annual Report. The opinions of the Adviser with respect to those securities may change at any time.
Statements in the Letter to Shareholders that reflect projections or expectations for future financial or economic performance of the Fund and the market in general and statements of the Fund’s plans and objectives for future operations are forward-looking statements. No assurance can be given that actual results or events will not differ materially from those projected, estimated, assumed, or anticipated in any such forward-looking statements. Important factors that could result in such differences, in addition to factors noted with such forward-looking statements include, without limitation, general economic conditions, such as inflation, recession, and interest rates. Past performance is not a guarantee of future results.
4
| WAVELENGTH INTEREST RATE NEUTRAL FUND |
| PERFORMANCE INFORMATION |
| May 31, 2023 (Unaudited) |
Comparison of the Change in Value of a $10,000 Investment in
Wavelength Interest Rate Neutral Fund versus the
S&P U.S. Treasury Bill 0-3 Month Index
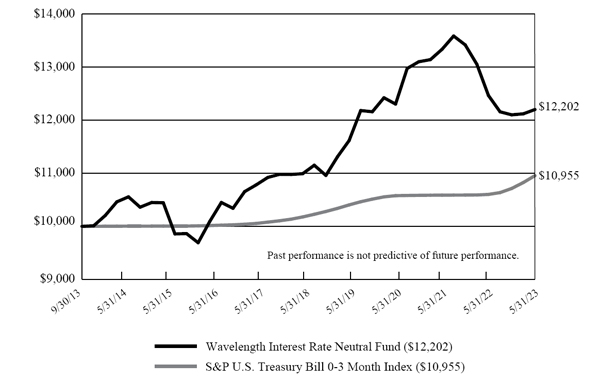
| Average Annual Total Returns For Periods Ended May 31, 2023 | |||||||||
| Since | |||||||||
| 1 Year | 3 Years | 5 Years | Inception(b) | ||||||
| Wavelength Interest Rate Neutral Fund(a) | -2.12% | -0.28% | 2.11% | 2.08% | |||||
| S&P U.S. Treasury Bill 0-3 Month Index | 3.33% | 1.17% | 1.49% | 0.95% | |||||
| (a) | The Fund’s total return does not reflect the deduction of taxes a shareholder would pay on Fund distributions or the redemption of Fund shares. |
| (b) | The Fund commenced operations on September 30, 2013. |
5
| WAVELENGTH FUND |
| PORTFOLIO INFORMATION |
| May 31, 2023 (Unaudited) |
Portfolio Allocation (% of Net Assets)
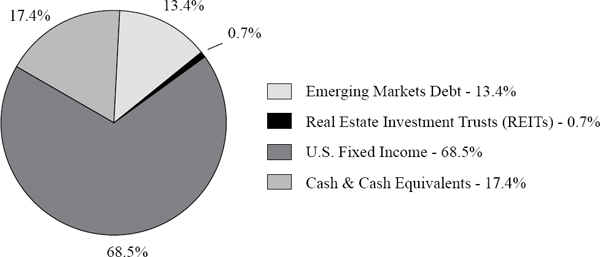
Top 10 Equity Holdings
| % of Net | ||
| Security Description | Assets | |
| Invesco Senior Loan ETF | 13.6% | |
| Vanguard Short-Term Inflation-Protected Securities ETF | 11.3% | |
| iShares TIPS Bond ETF | 9.8% | |
| iShares National Muni Bond ETF | 9.5% | |
| SPDR Bloomberg Short Term High Yield Bond ETF | 8.4% | |
| Vanguard Mortgage-Backed Securities ETF | 8.0% | |
| iShares Broad USD High Yield Corporate Bond ETF | 5.2% | |
| VanEck Emerging Markets High Yield Bond ETF | 4.9% | |
| Vanguard Emerging Markets Government Bond ETF | 4.8% | |
| iShares J.P. Morgan USD Emerging Markets Bond ETF | 3.7% | |
6
WAVELENGTH FUND |
| SCHEDULE OF INVESTMENTS |
| May 31, 2023 |
| EXCHANGE-TRADED FUNDS — 82.6% | Shares | Value | ||||||
| Emerging Markets Debt — 13.4% | ||||||||
| iShares J.P. Morgan USD Emerging Markets Bond ETF | 47,700 | $ | 4,044,006 | |||||
| VanEck Emerging Markets High Yield Bond ETF | 304,621 | 5,434,439 | ||||||
| Vanguard Emerging Markets Government Bond ETF | 85,573 | 5,230,222 | ||||||
| 14,708,667 | ||||||||
| Real Estate Investment Trusts (REITs) — 0.7% | ||||||||
| Vanguard Real Estate ETF | 9,887 | 790,960 | ||||||
| U.S. Fixed Income — 68.5% | ||||||||
| Invesco Senior Loan ETF | 723,660 | 14,907,396 | ||||||
| iShares Broad USD High Yield Corporate Bond ETF | 163,415 | 5,696,647 | ||||||
| iShares National Muni Bond ETF | 98,033 | 10,427,770 | ||||||
| iShares Preferred & Income Securities ETF | 32,600 | 992,996 | ||||||
| iShares TIPS Bond ETF | 99,322 | 10,756,573 | ||||||
| SPDR Bloomberg Convertible Securities ETF | 28,693 | 1,918,414 | ||||||
| SPDR Bloomberg Short Term High Yield Bond ETF | 376,000 | 9,185,680 | ||||||
| Vanguard Mortgage-Backed Securities ETF | 188,955 | 8,731,610 | ||||||
| Vanguard Short-Term Inflation-Protected Securities ETF | 260,380 | 12,375,861 | ||||||
| 74,992,947 | ||||||||
| Total Exchange-Traded Funds (Cost $98,446,788) | $ | 90,492,574 | ||||||
7
| WAVELENGTH FUND |
| SCHEDULE OF INVESTMENTS (Continued) |
| MONEY MARKET FUNDS — 16.4% | Shares | Value | ||||||
| DWS Government Money Market Series - Institutional Class, 5.04% (a) | 4,486,157 | $ | 4,486,157 | |||||
| Fidelity Institutional Money Market Government Portfolio - Class I, 4.98% (a) | 4,486,157 | 4,486,157 | ||||||
| Goldman Sachs Financial Square Treasury Obligations Fund - Institutional Class, 4.97% (a) | 4,486,157 | 4,486,157 | ||||||
| Invesco Treasury Portfolio - Institutional Class, 5.04% (a) | 4,486,157 | 4,486,157 | ||||||
| Total Money Market Funds (Cost $17,944,628) | $ | 17,944,628 | ||||||
| Investments at Value — 99.0% (Cost $116,391,416) | $ | 108,437,202 | ||||||
| Other Assets in Excess of Liabilities — 1.0% | 1,150,154 | |||||||
| Net Assets — 100.0% | $ | 109,587,356 | ||||||
| (a) | The rate shown is the 7-day effective yield as of May 31, 2023. |
See accompanying notes to financial statements.
8
| WAVELENGTH FUND |
| SCHEDULE OF FUTURES CONTRACTS |
| May 31, 2023 |
| Value/Unrealized | ||||||||||||||||
| Expiration | Notional | Appreciation | ||||||||||||||
| FUTURES CONTRACTS | Contracts | Date | Value | (Depreciation) | ||||||||||||
| Commodities Futures | ||||||||||||||||
| E-Mini Gold Future | 27 | 7/27/2023 | $ | 2,675,835 | $ | (13,609 | ) | |||||||||
| Index Futures | ||||||||||||||||
| Bloomberg Commodity Index Future | 79 | 6/21/2023 | 773,884 | (51,904 | ) | |||||||||||
| E-Mini Dow CBOT DJIA Future | 4 | 6/16/2023 | 659,580 | (9,044 | ) | |||||||||||
| E-Mini S&P 500 Future | 5 | 6/16/2023 | 1,047,625 | 8,477 | ||||||||||||
| MSCI Emerging Markets Future | 44 | 6/16/2023 | 2,104,960 | (20,051 | ) | |||||||||||
| Total Index Futures | 4,586,049 | (72,522 | ) | |||||||||||||
| Treasury Futures | ||||||||||||||||
| 10-Year U.S. Treasury Note Future | 29 | 9/20/2023 | 3,319,601 | 7,974 | ||||||||||||
| 2-Year U.S. Treasury Note Future | 65 | 9/29/2023 | 13,378,820 | (8,966 | ) | |||||||||||
| 5-Year U.S. Treasury Note Future | 66 | 9/29/2023 | 7,199,148 | 4,071 | ||||||||||||
| U.S. Treasury Long Bond Future | 33 | 9/20/2023 | 4,235,352 | 49,826 | ||||||||||||
| Total Treasury Futures | 28,132,921 | 52,905 | ||||||||||||||
| Total Futures Contracts | $ | 35,394,805 | $ | (33,226 | ) | |||||||||||
The average monthly notional value of futures contracts during the year ended May 31, 2023 was $24,005,084.
See accompanying notes to financial statements.
9
| WAVELENGTH FUND |
| STATEMENT OF ASSETS AND LIABILITIES |
| May 31, 2023 |
| ASSETS | ||||
| Investments in securities: | ||||
| At cost | $ | 116,391,416 | ||
| At value (Note 2) | $ | 108,437,202 | ||
| Margin deposits for futures contracts (Note 2) | 1,615,757 | |||
| Variation margin receivable (Notes 2 and 5) | 88,610 | |||
| Receivable for capital shares sold | 30,528 | |||
| Receivable for investment securities sold | 140,682 | |||
| Dividends and interest receivable | 78,802 | |||
| Other assets | 13,954 | |||
| Total assets | 110,405,535 | |||
| LIABILITIES | ||||
| Variation margin payable (Notes 2 and 5) | 33,005 | |||
| Payable for capital shares redeemed | 338,806 | |||
| Payable for investment securities purchased | 357,548 | |||
| Payable to Adviser (Note 4) | 64,751 | |||
| Payable to administrator (Note 4) | 16,700 | |||
| Other accrued expenses | 7,369 | |||
| Total liabilities | 818,179 | |||
| NET ASSETS | $ | 109,587,356 | ||
| NET ASSETS CONSIST OF: | ||||
| Paid-in capital | $ | 132,151,452 | ||
| Accumulated deficit | (22,564,096 | ) | ||
| NET ASSETS | $ | 109,587,356 | ||
| Shares of beneficial interest outstanding (unlimited number of shares authorized, no par value) | 11,698,941 | |||
| Net asset value, offering price and redemption price per share (Note 2) | $ | 9.37 |
See accompanying notes to financial statements.
10
| WAVELENGTH FUND |
| STATEMENT OF OPERATIONS |
| For the Year Ended May 31, 2023 |
| INVESTMENT INCOME | ||||
| Dividends | $ | 5,707,687 | ||
| Securities lending income (Note 6) | 333,319 | |||
| Interest | 5,815 | |||
| Total investment income | 6,046,821 | |||
| EXPENSES | ||||
| Management fees (Note 4) | 1,180,340 | |||
| Administration fees (Note 4) | 129,484 | |||
| Legal fees | 52,823 | |||
| Fund accounting fees (Note 4) | 44,336 | |||
| Registration and filing fees | 36,331 | |||
| Transfer agent fees (Note 4) | 29,688 | |||
| Networking fees | 24,490 | |||
| Trustees’ fees and expenses (Note 4) | 22,317 | |||
| Audit and tax services fees | 17,311 | |||
| Custody and bank service fees | 16,096 | |||
| Shareholder reporting expense | 15,548 | |||
| Compliance fees and expenses (Note 4) | 14,536 | |||
| Postage and supplies | 13,152 | |||
| Insurance expense | 4,457 | |||
| Other expenses | 11,271 | |||
| Total expenses | 1,612,180 | |||
| Less fee reductions by the Adviser (Note 4) | (382,131 | ) | ||
| Voluntary Adviser refund of past management fees (Note 4) | (289,118 | ) | ||
| Net expenses | 940,931 | |||
| NET INVESTMENT INCOME | 5,105,890 | |||
| REALIZED AND UNREALIZED GAINS (LOSSES) ON INVESTMENTS AND FUTURES CONTRACTS | ||||
| Net realized gains (losses) from: | ||||
| Investments | (6,897,308 | ) | ||
| Futures contracts (Note 5) | (2,418,561 | ) | ||
| Long-term capital gain distributions from regulated investment companies | 16,958 | |||
| Net change in unrealized appreciation (depreciation) on: | ||||
| Investments | (141,690 | ) | ||
| Futures contracts (Note 5) | 243,776 | |||
| NET REALIZED AND UNREALIZED LOSSES ON INVESTMENTS AND FUTURES CONTRACTS | (9,196,825 | ) | ||
| NET DECREASE IN NET ASSETS RESULTING FROM OPERATIONS | $ | (4,090,935 | ) |
See accompanying notes to financial statements.
11
| WAVELENGTH FUND |
| STATEMENTS OF CHANGES IN NET ASSETS |
| Year | Year | |||||||
| Ended | Ended | |||||||
| May 31, | May 31, | |||||||
| 2023 | 2022 | |||||||
| FROM OPERATIONS | ||||||||
| Net investment income | $ | 5,105,890 | $ | 3,155,576 | ||||
| Net realized gains (losses) from: | ||||||||
| Investments | (6,897,308 | ) | (332,027 | ) | ||||
| Futures contracts (Note 5) | (2,418,561 | ) | (2,843,020 | ) | ||||
| Long-term capital gain distributions from regulated investment companies | 16,958 | 10,873 | ||||||
| Net change in unrealized appreciation (depreciation) on: | ||||||||
| Investments | (141,690 | ) | (13,259,966 | ) | ||||
| Futures contracts (Note 5) | 243,776 | (555,090 | ) | |||||
| Net decrease in net assets resulting from operations | (4,090,935 | ) | (13,823,654 | ) | ||||
| DISTRIBUTIONS TO SHAREHOLDERS (Note 2) | (5,119,784 | ) | (5,539,959 | ) | ||||
| CAPITAL SHARE TRANSACTIONS | ||||||||
| Proceeds from shares sold | 36,472,949 | 102,973,904 | ||||||
| Net asset value of shares issued in reinvestment of distributions to shareholders | 3,314,082 | 4,160,165 | ||||||
| Payments for shares redeemed | (80,974,168 | ) | (83,647,047 | ) | ||||
| Net increase (decrease) in net assets from capital share transactions | (41,187,137 | ) | 23,487,022 | |||||
| TOTAL INCREASE (DECREASE) IN NET ASSETS | (50,397,856 | ) | 4,123,409 | |||||
| NET ASSETS | ||||||||
| Beginning of year | 159,985,212 | 155,861,803 | ||||||
| End of year | $ | 109,587,356 | $ | 159,985,212 | ||||
| CAPITAL SHARE ACTIVITY | ||||||||
| Shares sold | 3,854,543 | 9,528,065 | ||||||
| Shares issued in reinvestment of distributions to shareholders | 354,175 | 383,239 | ||||||
| Shares redeemed | (8,545,591 | ) | (8,058,384 | ) | ||||
| Net increase (decrease) in shares outstanding | (4,336,873 | ) | 1,852,920 | |||||
| Shares outstanding at beginning of year | 16,035,814 | 14,182,894 | ||||||
| Shares outstanding at end of year | 11,698,941 | 16,035,814 | ||||||
See accompanying notes to financial statements.
12
| WAVELENGTH FUND |
| FINANCIAL HIGHLIGHTS |
Per Share Data for a Share Outstanding Throughout Each Year
| Year | Year | Year | Year | Year | ||||||||||||||||
| Ended | Ended | Ended | Ended | Ended | ||||||||||||||||
| May 31, | May 31, | May 31, | May 31, | May 31, | ||||||||||||||||
| 2023 | 2022 | 2021 | 2020 | 2019 | ||||||||||||||||
| Net asset value at beginning of year | $ | 9.98 | $ | 10.99 | $ | 10.35 | $ | 10.26 | $ | 9.97 | ||||||||||
| Income (loss) from investment operations: | ||||||||||||||||||||
| Net investment income (a) | 0.41 | 0.19 | 0.11 | 0.22 | 0.27 | |||||||||||||||
| Net realized and unrealized gains (losses) on investments and futures contracts | (0.63 | ) | (0.88 | ) | 0.75 | 0.38 | 0.28 | |||||||||||||
| Total from investment operations | (0.22 | ) | (0.69 | ) | 0.86 | 0.60 | 0.55 | |||||||||||||
| Less distributions from: | ||||||||||||||||||||
| Net investment income | (0.39 | ) | (0.16 | ) | (0.10 | ) | (0.23 | ) | (0.26 | ) | ||||||||||
| Net realized gains | — | (0.16 | ) | (0.12 | ) | (0.28 | ) | — | ||||||||||||
| Total distributions | (0.39 | ) | (0.32 | ) | (0.22 | ) | (0.51 | ) | (0.26 | ) | ||||||||||
| Net asset value at end of year | $ | 9.37 | $ | 9.98 | $ | 10.99 | $ | 10.35 | $ | 10.26 | ||||||||||
| Total return (b) | (2.12 | %) (c) | (6.53 | %) | 8.39 | % | 5.92 | % | 5.68 | % | ||||||||||
| Net assets at end of year (000’s) | $ | 109,587 | $ | 159,985 | $ | 155,862 | $ | 81,773 | $ | 53,268 | ||||||||||
| Ratios/supplementary data: | ||||||||||||||||||||
| Ratio of total expenses to average net assets (d) | 1.30 | % | 1.22 | % | 1.25 | % | 1.34 | % | 1.41 | % | ||||||||||
| Ratio of net expenses to average net assets (d)(e) | 0.99 | % (f) | 0.99 | % | 0.99 | % | 0.99 | % | 0.99 | % | ||||||||||
| Ratio of net investment income to average net assets (a)(d)(e) | 3.88 | % (f) | 1.72 | % | 1.02 | % | 2.07 | % | 2.65 | % | ||||||||||
| Portfolio turnover rate | 44 | % | 18 | % | 12 | % | 52 | % | 20 | % | ||||||||||
| (a) | Recognition of net investment income by the Fund is affected by the timing of the declarations of dividends by the underlying investment companies in which the Fund invests. |
| (b) | Total return is a measure of the change in value of an investment in the Fund over the periods covered. The returns shown do not reflect the deduction of taxes a shareholder would pay on Fund distributions, if any, or the redemption of Fund shares. The total returns would be lower if the Adviser had not reduced management fees and/or reimbursed expenses. |
| (c) | During the year ended May 31, 2023, the Adviser has voluntarily refunded to the Fund all management fees paid in the amount of $289,118 for changes concerning the corporate ownership structure of the Adviser for the period from May 14, 2021 until August 12, 2021, which otherwise would have reduced the total return by 0.21% (Note 4). |
| (d) | The ratios of expenses and net investment income to average net assets do not reflect the Fund’s proportionate share of expenses of the underlying investment companies in which the Fund invests. |
| (e) | Ratio was determined after management fee reductions and/or expense reimbursements (Note 4). |
| (f) | Ratio excludes the voluntary refund from the Adviser in the amount of $289,118, otherwise the net expenses and the net investment income to average net assets would have been 0.76% and 4.11%, respectively (Note 4). |
See accompanying notes to financial statements.
13
| WAVELENGTH FUND |
| NOTES TO FINANCIAL STATEMENTS |
| May 31, 2023 |
1. Organization
Wavelength Fund (formerly, Wavelength Interest Rate Neutral Fund) (the “Fund”) is a diversified series of Ultimus Managers Trust (the “Trust”), an open-end investment company established as an Ohio business trust under a Declaration of Trust dated February 28, 2012. Other series of the Trust are not incorporated in this report.
The investment objective of the Fund is to seek total return.
2. Significant Accounting Policies
The Fund follows accounting and reporting guidance under Financial Accounting Standards Board Accounting Standards Codification Topic 946, “Financial Services – Investment Companies.” The following is a summary of the Fund’s significant accounting policies used in the preparation of its financial statements. These policies are in conformity with accounting principles generally accepted in the United States of America (“GAAP”).
Regulatory Update – In October 2020, the U.S. Securities and Exchange Commission (the “SEC”) adopted new regulations governing the use of derivatives by registered investment companies (“Rule 18f-4”). The Fund was required to comply with Rule 18f-4 by August 19, 2022. Rule 18f-4 imposes limits on the amount of derivatives a fund can enter into, eliminates the asset segregation framework previously used by funds to comply with Section 18 of the Investment Company Act of 1940, as amended (the “1940 Act”), treats derivatives as senior securities and requires funds whose use of derivatives is more than a limited specified exposure amount to establish and maintain a comprehensive derivatives risk management program and appoint a derivatives risk manager. The Fund adopted and is currently adhering to the requirements under Rule 18f-4.
Securities and futures valuation – The Fund values its portfolio securities at market value as of the close of regular trading on the New York Stock Exchange (the “NYSE”) (normally 4:00 p.m. Eastern time) on each business day the NYSE is open. Exchange-traded funds (“ETFs”) are valued at the security’s last sale price on the security’s primary exchange, if available, otherwise at the exchange’s most recently quoted mean price. Investments representing shares of money market funds and other open-end investment companies, except for ETFs, are valued at their net asset value (“NAV”) as reported by such companies. NASDAQ-listed securities are valued at the NASDAQ Official Closing Price. The Fund values its exchange-traded futures contracts at their last sale price as of the close of regular trading on the NYSE. Prices for these futures contracts are monitored daily by Wavelength Capital Management, LLC (the “Adviser”), as the Fund’s valuation designee, until the close of regular trading to determine if fair valuation is required.
When using a quoted price and when the market for the security is considered active, a security will be classified as Level 1 within the fair value hierarchy (see below). In the event that market quotations are not readily available or are considered unreliable due to market or other events, the Fund values its securities and other assets at fair value determined by the valuation designee, in accordance with procedures adopted by the Trust’s Board of Trustees
14
| WAVELENGTH FUND |
| NOTES TO FINANCIAL STATEMENTS (Continued) |
(the “Board”) pursuant to the Rule 2a-5 under the 1940 Act. Under these procedures, the securities will be classified as Level 2 or 3 within the fair value hierarchy, depending on the inputs used. Unavailable or unreliable market quotes may be due to the following factors: a substantial bid-ask spread; infrequent sales resulting in stale prices; insufficient trading volume; small trade sizes; a temporary lapse in any reliable pricing source; and actions of the securities or futures markets, such as the suspension or limitation of trading.
GAAP establishes a single authoritative definition of fair value, sets out a framework for measuring fair value, and requires additional disclosures about fair value measurements.
Various inputs are used in determining the value of the Fund’s investments. These inputs are summarized in the three broad levels listed below:
| ● | Level 1 – quoted prices in active markets for identical securities |
| ● | Level 2 – other significant observable inputs |
| ● | Level 3 – significant unobservable inputs |
The inputs or methods used for valuing securities are not necessarily an indication of the risks associated with investing in those securities. The inputs used to measure fair value may fall into different levels of the fair value hierarchy. In such cases, for disclosure purposes, the level in the fair value hierarchy within which the fair value measurement falls in its entirety is determined based on the lowest level input that is significant to the fair value measurement.
The following is a summary of the Fund’s investments and other financial instruments and the inputs used to value the investments and other financial instruments as of May 31, 2023:
| Level 1 | Level 2 | Level 3 | Total | |||||||||||||
| Investments in Securities | ||||||||||||||||
| Exchange-Traded Funds | $ | 90,492,574 | $ | — | $ | — | $ | 90,492,574 | ||||||||
| Money Market Funds | 17,944,628 | — | — | 17,944,628 | ||||||||||||
| Total | $ | 108,437,202 | $ | — | $ | — | $ | 108,437,202 | ||||||||
| Other Financial Instruments | ||||||||||||||||
| Futures Contracts | $ | (33,226 | ) | $ | — | $ | — | $ | (33,226 | ) | ||||||
| Total | $ | (33,226 | ) | $ | — | $ | — | $ | (33,226 | ) | ||||||
The Fund did not have any assets or liabilities that were measured at fair value on a recurring basis using significant unobservable inputs (Level 3) as of or during the year ended May 31, 2023. Other Financial Instruments are future contracts which are valued at the unrealized appreciation (depreciation) as of May 31, 2023.
Cash account – The Fund’s cash is held in a bank account with balances which, at times, may exceed United States federally insured limits by the Federal Deposit Insurance Corporation (“FDIC”). Cash held with a Broker, if any, is not FDIC insured. The Fund maintains these balances with a high-quality financial institution and may incur charges on cash overdrafts.
15
| WAVELENGTH FUND |
| NOTES TO FINANCIAL STATEMENTS (Continued) |
Share valuation – The NAV per share of the Fund is calculated daily by dividing the total value of the Fund’s assets, less liabilities, by the number of shares outstanding. The offering price and redemption price per share of the Fund is equal to the NAV per share.
Investment income – Dividend income is recorded on the ex-dividend date. Interest income, if any, is accrued as earned. Non-cash dividends included in dividend income, if any, are recorded at the fair value of the security received.
Investment transactions – Investment transactions are accounted for on the trade date. Realized gains and losses on investments sold are determined on a specific identification basis.
Common expenses – Common expenses of the Trust are allocated among the Fund and the other series of the Trust based on the relative net assets of each series, the number of series in the Trust, or the nature of the services performed and the relative applicability to each series.
Distributions to shareholders – The Fund distributes to shareholders any net investment income on a quarterly basis and any net realized capital gains at least annually. The amount of such dividends and distributions are determined in accordance with federal income tax regulations, which may differ from GAAP. Dividends and distributions to shareholders are recorded on the ex-dividend date. The tax character of distributions paid during the years ended May 31, 2023 and 2022 was as follows:
| Year | Ordinary | Tax-Exempt | Long-Term | Total | ||||||||||||
| Ended | Income | Distributions | Capital Gains | Distributions | ||||||||||||
| 5/31/2023 | $ | 4,915,777 | $ | 204,007 | $ | — | $ | 5,119,784 | ||||||||
| 5/31/2022 | $ | 3,482,354 | $ | 144,199 | $ | 1,913,406 | $ | 5,539,959 | ||||||||
Futures contracts – The Fund uses futures contracts to gain exposure to or to hedge against changes in the value of equities, real estate, interest rates or commodities. A futures contract represents a commitment for the future purchase or sale of an asset at a specified price on a specified date. When the Fund purchases or sells a futures contract, no price is paid to or received by the Fund. Instead, the Fund is required to deposit in a segregated asset account an amount of cash or qualifying securities currently ranging from 2% to 10% of the contract amount. This is called the “initial margin deposit.” Subsequent payments, known as “variation margin,” are made or received by the Fund each day, depending on the daily fluctuations in the fair value of the underlying asset. The Fund recognizes an unrealized gain or loss equal to the daily variation margin. If market conditions move unexpectedly, the Fund may not achieve the anticipated benefits of the futures contracts and may realize a loss. The margin deposits for futures contracts and the variation receivable/payable are reported on the Statement of Assets and Liabilities.
16
| WAVELENGTH FUND |
| NOTES TO FINANCIAL STATEMENTS (Continued) |
Estimates – The preparation of financial statements in conformity with GAAP requires management to make estimates and assumptions that affect the reported amounts of assets and liabilities and disclosure of contingent assets and liabilities as of the date of the financial statements and the reported amounts of increase (decrease) in net assets from operations during the reporting period. Actual results could differ from those estimates.
Federal income tax – The Fund has qualified and intends to continue to qualify as a regulated investment company under the Internal Revenue Code of 1986, as amended (the “Code”). Qualification generally will relieve the Fund of liability for federal income taxes to the extent 100% of its net investment income and net realized capital gains are distributed in accordance with the Code.
In order to avoid imposition of the excise tax applicable to regulated investment companies, it is also the Fund’s intention to declare as dividends in each calendar year amounts equal to at least 98% of its net investment income (earned during the calendar year) and 98.2% of its net realized capital gains (earned during the twelve months ended October 31) plus undistributed amounts from prior years.
The following information is computed on a tax basis for each item as of May 31, 2023:
| Tax cost of investments | $ | 118,955,951 | ||
| Gross unrealized appreciation | $ | 47,290 | ||
| Gross unrealized depreciation | (10,566,039 | ) | ||
| Net unrealized depreciation | (10,518,749 | ) | ||
| Undistributed ordinary income | 757,754 | |||
| Accumulated capital and other losses | (12,803,101 | ) | ||
| Total accumulated deficit | $ | (22,564,096 | ) | |
The value of the federal income tax cost of investments may temporarily differ from the financial statement cost. This book/tax difference is due to the recognition of capital gains or losses under income tax regulations and GAAP, primarily the tax deferral of losses on wash sales, the tax treatment of realized and unrealized gains and losses on futures contracts and adjustments to basis on publicly traded partnerships.
As of May 31, 2023, the Fund had short-term capital loss carryforwards and long-term capital loss carryforwards (“CLCF”) of $3,152,110 and $9,650,991, respectively, for federal income tax purposes. These CLCFs, which do not expire, may be utilized in future years to offset net realized capital gains, if any.
The Fund recognizes the tax benefits or expenses of uncertain tax positions only when the position is “more likely than not” to be sustained assuming examination by tax authorities. Management has reviewed the Fund’s tax positions for all open tax years (generally, three years) and has concluded that no provision for unrecognized tax benefits or expenses is required in these financial statements. The Fund identifies its major tax jurisdiction as U.S. Federal.
17
| WAVELENGTH FUND |
| NOTES TO FINANCIAL STATEMENTS (Continued) |
The Fund recognizes interest and penalties, if any, related to unrecognized tax benefits as income tax expense on the Statement of Operations. During the year ended May 31, 2023, the Fund did not incur any interest or penalties.
3. Investment Transactions
During the year ended May 31, 2023, cost of purchases and proceeds from sales of investment securities, other than short-term investments, were $40,516,369 and $54,299,916, respectively.
4. Transactions with Related Parties
INVESTMENT ADVISORY AGREEMENT
The Fund’s investments are managed by the Adviser pursuant to the terms of an Advisory Agreement. Under the Advisory Agreement, the Fund pays the Adviser a management fee, computed and accrued daily and paid monthly, at the annual rate of 0.95% of its average daily net assets.
Pursuant to a new Expense Limitation Agreement between the Fund and the Adviser (the “ELA”), the Adviser has agreed, until October 1, 2025, to reduce its management fees and reimburse other expenses to limit total annual operating expenses (exclusive of brokerage costs; taxes; interest; borrowing costs such as interest and dividends expenses on securities sold short; acquired fund fees and expenses; extraordinary expenses such as litigation and merger or reorganization costs and other expenses not incurred in the ordinary course of the Fund’s business) to an amount not exceeding 0.99% of the Fund’s average daily net assets.
Accordingly, under the ELA, the Adviser, reduced its management fees in the amount of $382,131 during the year ended May 31, 2023.
Under the terms of the ELA, management fee reductions and expense reimbursements by the Adviser are subject to recoupment by the Adviser for a period of three years after such fees and expenses were incurred, provided that the recoupments do not cause total annual operating expenses of the Fund to exceed the lesser of (i) the expense limitation then in effect, if any, and (ii) the expense limitation in effect at the time the expenses to be repaid were incurred. As of May 31, 2023, the Adviser may seek recoupment of management fee reductions and expense reimbursements in the amount of $1,118,815 no later than the dates as stated below:
| May 31, 2024 | May 31, 2025 | May 31, 2026 | Total |
| $321,501 | $415,183 | $382,131 | $1,118,815 |
In response to changes concerning the corporate ownership structure of the Adviser during the period from May 14, 2021 until August 12, 2021, the Adviser has voluntarily refunded all management fees paid by the Fund during that period. The repayment was made on February 22, 2023 and totaled $289,118.
18
| WAVELENGTH FUND |
| NOTES TO FINANCIAL STATEMENTS (Continued) |
OTHER SERVICE PROVIDERS
Ultimus Fund Solutions, LLC (“Ultimus”) provides administration, fund accounting, compliance and transfer agency services to the Fund. The Fund pays Ultimus fees in accordance with the agreements for such services. In addition, the Fund pays out-of-pocket expenses including, but not limited to, postage, supplies and certain costs related to the pricing of the Fund’s portfolio securities.
Under the terms of a Distribution Agreement with the Trust, Ultimus Fund Distributors, LLC (the “Distributor”) serves as the principal underwriter to the Fund. The Distributor is a wholly-owned subsidiary of Ultimus. The Distributor is compensated by the Adviser (not the Fund) for acting as principal underwriter.
Certain officers and a Trustee of the Trust are also officers of Ultimus and are not paid by the Fund for serving in such capacities.
TRUSTEE COMPENSATION
Effective October 17, 2022, each member of the Board (a “Trustee”) who is not an “interested person” (as defined by the 1940 Act, as amended) of the Trust (“Independent Trustee”) receives a $1,300 annual retainer from the Fund, except for the Board Chairperson who receives a $1,700 annual retainer from the Fund and the Audit Committee Chairperson who receives a $1,500 annual retainer from the Fund, paid in quarterly installments. Each Independent Trustee also receives from the Fund a fee of $550 for each Board meeting attended plus reimbursement for travel and other meeting-related expenses. Prior to October 17, 2022, no additional annual retainer was specifically designated for the Audit Committee Chairperson.
PRINCIPAL HOLDER OF FUND SHARES
As of May 31, 2023, the following shareholder owned of record 25% or more of the outstanding shares of the Fund:
| Name of Record Owner | % Ownership |
| National Financial Services, LLC (for the benefit of its customers) | 47% |
A shareholder owning of record or beneficially 25% or more of the Fund’s outstanding shares may be considered a controlling person. That shareholder’s vote could have a more significant effect on matters presented at a shareholders’ meeting.
19
| WAVELENGTH FUND |
| NOTES TO FINANCIAL STATEMENTS (Continued) |
5. Derivatives Transactions
The Fund’s positions in derivative instruments as of May 31, 2023 are recorded in the following location on the Statement of Assets and Liabilities:
| Derivative Investment Type | Location |
| Futures contracts | Variation margin receivable (payable) |
The following table sets forth the values of variation margin of the Fund as of May 31, 2023:
| Variation Margin | ||||||||||||
| Type of Derivative and Risk | Receivable | (Payable) | Total | |||||||||
| Asset Derivatives | ||||||||||||
| Futures contracts | ||||||||||||
| Commodity | $ | 6,981 | $ | — | $ | 6,981 | ||||||
| Index | — | (33,005 | ) | (33,005 | ) | |||||||
| Treasury | 81,629 | — | 81,629 | |||||||||
| Total | $ | 88,610 | $ | (33,005 | ) | $ | 55,605 | |||||
The Fund’s transactions in derivative instruments during the year ended May 31, 2023 are recorded in the following locations on the Statement of Operations:
| Derivative Investment Type | Location |
| Futures contracts | Net realized gains (losses) from futures contracts |
| Net change in unrealized appreciation (depreciation) on futures contracts |
The following is a summary of the Fund’s net realized losses and net change in unrealized appreciation (depreciation) on derivative instruments recognized on the Statement of Operations during the year ended May 31, 2023:
| Net Change | ||||||||
| in Unrealized | ||||||||
| Net Realized | Appreciation | |||||||
| Type of Derivative and Risk | Losses | (Depreciation) | ||||||
| Futures contracts | ||||||||
| Commodity | $ | (380,787 | ) | $ | 30,063 | |||
| Index | (719,982 | ) | 51,447 | |||||
| Treasury | (1,317,792 | ) | 162,266 | |||||
| Total | $ | (2,418,561 | ) | $ | 243,776 | |||
20
| WAVELENGTH FUND |
| NOTES TO FINANCIAL STATEMENTS (Continued) |
In the ordinary course of business, the Fund may enter into transactions subject to enforceable netting agreements or other similar arrangements (“netting agreements”). Generally, the right to offset in netting agreements allows the Fund to offset any exposure to a specific counterparty with any collateral received or delivered to that counterparty based on the terms of the agreements. Generally, the Fund manages its cash collateral securities and securities collateral on a counterparty basis.
As of May 31, 2023, the offsetting of financial assets and derivative assets is as follows:
| Gross | ||||||||||||||||||||||||
| Gross | Amounts of | |||||||||||||||||||||||
| Amounts of | Recognized | |||||||||||||||||||||||
| Recognized | Liabilities | Net | ||||||||||||||||||||||
| Assets not | not | Amounts | ||||||||||||||||||||||
| Offset on | Offset on | Presented on | ||||||||||||||||||||||
| Statement of | Statement of | Derivatives | Statement of | |||||||||||||||||||||
| Assets and | Assets and | Available for | Assets and | Collateral | ||||||||||||||||||||
| Description | Liabilities | Liabilities | Offset | Liabilities | Pledged | Net Amount | ||||||||||||||||||
| Variation margin receivable - futures contracts | $ | 88,610 | $ | — | $ | (33,005 | ) | $ | 55,605 | $ | — | $ | 55,605 | |||||||||||
| Variation margin payable - futures contracts | — | (33,005 | ) | 33,005 | — | — | — | |||||||||||||||||
| Total subject to a master netting or similar arrangement | $ | 88,610 | $ | (33,005 | ) | $ | — | $ | 55,605 | $ | — | $ | 55,605 | |||||||||||
6. Securities Lending
Under the terms of the Securities Lending Agreement (the “SLA”) with U.S. Bank National Association (“U.S. Bank”), U.S. Bank is authorized to loan securities on behalf of the Fund to approved borrowers. The contractual maturity of securities lending transactions are on an overnight and continuous basis. In exchange, the Fund receives cash collateral in the amount of at least 102% of the value of the securities loaned. Any collateral shortfalls due to changes in security market prices are adjusted the next business day. The cash collateral is invested in a short-term investment instrument as noted on the Fund’s Schedule of Investments. Although risk is mitigated by the collateral, the Fund could experience a delay in recovering its securities and possible loss of income or value if the borrower fails to return them. The SLA provides that after predetermined rebates to borrowers, the Fund retains a portion of its net securities lending income and pays U.S. Bank the remaining portion. The Fund manages credit exposure arising from these lending transactions by, in appropriate circumstances, entering into a SLA with U.S. Bank that provides the Fund, in the event of default (such as bankruptcy or borrower’s failure to pay or perform), the right to net rights and obligations under such agreements and liquidate and set off collateral against the net amount owed to the
21
| WAVELENGTH FUND |
| NOTES TO FINANCIAL STATEMENTS (Continued) |
Fund. The Fund’s collateral was invested in the Mount Vernon Liquid Assets Portfolio, LLC (“Mount Vernon”) of which the investment objective is to seek to maximize current income to the extent with the preservation of capital and liquidity and maintain a stable NAV of $1.00 per unit. Additional information regarding Mount Vernon can be found at www.sec.gov. As of May 31, 2023, the Fund is currently not participating in securities lending.
7. Certain Investments and Risks
The securities in which the Fund invests, as well as the risks associated with these securities, are described in the Fund’s prospectus. Among these risks are those associated with investments in shares of ETFs. ETFs issue their shares to authorized participants in return for a specific basket of securities. The authorized participants then sell the ETF’s shares on the secondary market. In other words, ETF shares are traded on a securities exchange based on their market value. Investments in ETFs are subject to the risk that the ETF’s shares may trade at a premium (creating the risk that the Fund pays more than NAV for an ETF when making a purchase) or discount (creating the risk that the Fund receives less than NAV when selling an ETF) to the ETF’s NAV. Investments in ETFs are also subject to index-tracking risk because the total return generated by the securities will be reduced by transaction costs and expenses not incurred by the indices. Certain securities comprising the index tracked by an ETF may, from time to time, temporarily be unavailable, which may further impede the ETF’s ability to track its applicable index or match the index’s performance. To the extent that the Fund invests in an ETF, the Fund incurs additional expenses because the Fund bears its pro-rata portion of such ETF’s advisory fees and operational expenses. Finally, ETF shares are also subject to the risks applicable to the underlying basket of securities. As of May 31, 2023, the Fund had 82.6% of the value of its net assets invested in ETFs.
8. Contingencies and Commitments
The Fund indemnifies the Trust’s officers and Trustees for certain liabilities that might arise from their performance of their duties to the Fund. Additionally, in the normal course of business, the Fund enters into contracts that contain a variety of representations and warranties and which provide general indemnifications. The Fund’s maximum exposure under these arrangements is unknown, as this would involve future claims that may be made against the Fund that have not yet occurred. However, based on experience, the Fund expects the risk of loss to be remote.
22
| WAVELENGTH FUND |
| NOTES TO FINANCIAL STATEMENTS (Continued) |
9. Subsequent Events
The Fund is required to recognize in the financial statements the effects of all subsequent events that provide additional evidence about conditions that existed as of the date of the Statement of Assets and Liabilities. For non-recognized subsequent events that must be disclosed to keep the financial statements from being misleading, the Fund is required to disclose the nature of the event as well as an estimate of its financial effect, or a statement that such an estimate cannot be made. Management has evaluated subsequent events through the issuance of these financial statements and has noted no such events except for the following:
On June 30, 2023, the Fund paid an ordinary income dividend of $0.0968 per share to the shareholders of record on June 29, 2023.
23
| WAVELENGTH INTEREST RATE NEUTRAL FUND |
| REPORT OF INDEPENDENT REGISTERED |
| PUBLIC ACCOUNTING FIRM |
To the Shareholders of Wavelength Fund and
Board of Trustees of Ultimus Managers Trust
Opinion on the Financial Statements
We have audited the accompanying statement of assets and liabilities, including the schedules of investments and futures contracts, of Wavelength Fund (formerly the Wavelength Interest Rate Neutral Fund) (the “Fund”), a series of Ultimus Managers Trust, as of May 31, 2023, the related statements of operations and changes in net assets for the year then ended, the related notes, and the financial highlights for the year then ended (collectively referred to as the “financial statements”). In our opinion, the financial statements present fairly, in all material respects, the financial position of the Fund as of May 31, 2023, the results of its operations, the changes in net assets and the financial highlights for the year then ended, in conformity with accounting principles generally accepted in the United States of America.
The Fund’s financial statements and financial highlights for the years ended May 31, 2022 and prior, were audited by another auditor whose report dated July 20, 2022m expressed an unqualified opinion on those financial statements and financial highlights.
Basis for Opinion
These financial statements are the responsibility of the Fund’s management. Our responsibility is to express an opinion on the Fund’s financial statements based on our audit. We are a public accounting firm registered with the Public Company Accounting Oversight Board (United States) (“PCAOB”) and are required to be independent with respect to the Fund in accordance with the U.S. federal securities laws and the applicable rules and regulations of the Securities and Exchange Commission and the PCAOB.
We conducted our audit in accordance with the standards of the PCAOB. Those standards require that we plan and perform the audit to obtain reasonable assurance about whether the financial statements are free of material misstatement whether due to error or fraud.
Our audit included performing procedures to assess the risks of material misstatement of the financial statements, whether due to error or fraud, and performing procedures that respond to those risks. Such procedures included examining, on a test basis, evidence regarding the amounts and disclosures in the financial statements. Our procedures included confirmation of securities owned as of May 31, 2023, by correspondence with the custodian and brokers. Our
24
| WAVELENGTH INTEREST RATE NEUTRAL FUND |
| REPORT OF INDEPENDENT REGISTERED |
| PUBLIC ACCOUNTING FIRM (Continued) |
audit also included evaluating the accounting principles used and significant estimates made by management, as well as evaluating the overall presentation of the financial statements. We believe that our audit provides a reasonable basis for our opinion.
We have served as the Fund’s auditor since 2023.
COHEN & COMPANY, LTD.
Philadelphia, Pennsylvania
July 27, 2023
25
| WAVELENGTH INTEREST RATE NEUTRAL FUND |
| CHANGE IN INDEPENDENT REGISTERED PUBLIC |
| ACCOUNTING FIRM (Unaudited) |
On March 13, 2023, BBD LLP (“BBD”) ceased to serve as the independent registered public accounting firm of Wavelength Fund (the “Fund”), a series of Ultimus Managers Trust. The Audit Committee of the Board of Trustees approved the replacement of BBD as a result of Cohen & Company, Ltd.’s (“Cohen”) acquisition of BBD’s Investment Management Group.
The report of BBD on the financial statements of the Fund as of and for the fiscal years ended 2022 and 2021 did not contain an adverse opinion or a disclaimer of opinion, and were not qualified or modified as to uncertainties, audit scope or accounting principles. During the fiscal years ended 2022 and 2021, and during the subsequent interim period through March 13, 2023: (i) there were no disagreements between the registrant and BBD on any matter of accounting principles or practices, financial statement disclosure, or auditing scope or procedure, which disagreements, if not resolved to the satisfaction of BBD, would have caused it to make reference to the subject matter of the disagreements in its report on the financial statements of the Fund for such years or interim period; and (ii) there were no “reportable events,” as defined in Item 304(a)(1)(v) of Regulation S-K under the Securities Exchange Act of 1934, as amended.
On April 21, 2023, the Audit Committee of the Board of Trustees also recommended and approved the appointment of Cohen as the Fund’s independent registered public accounting firm for the fiscal year ending May 31, 2023.
During the fiscal years ended 2022 and 2021, and during the subsequent interim period through March 13, 2023, neither the registrant, nor anyone acting on its behalf, consulted with Cohen on behalf of the Fund regarding the application of accounting principles to a specified transaction (either completed or proposed), the type of audit opinion that might be rendered on the Fund’s financial statements, or any matter that was either: (i) the subject of a “disagreement,” as defined in Item 304(a)(1)(iv) of Regulation S-K and the instructions thereto; or (ii) “reportable events,” as defined in Item 304(a)(1)(v) of Regulation S-K.
26
| WAVELENGTH FUND |
| ABOUT YOUR FUND’S EXPENSES (Unaudited) |
We believe it is important for you to understand the impact of costs on your investment. As a shareholder of the Fund, you incur ongoing costs, including management fees and other operating expenses. The following examples are intended to help you understand your ongoing costs (in dollars) of investing in the Fund and to compare these costs with the ongoing costs of investing in other mutual funds.
A mutual fund’s ongoing costs are expressed as a percentage of its average net assets. This figure is known as the expense ratio. The expenses in the table below are based on an investment of $1,000 made at the beginning of the most recent period (December 1, 2022) and held until the end of the period (May 31, 2023).
The table below illustrates the Fund’s ongoing costs in two ways:
Actual fund return – This section helps you to estimate the actual expenses that you paid over the period. The “Ending Account Value” shown is derived from the Fund’s actual return, and the third column shows the dollar amount of operating expenses that would have been paid by an investor who started with $1,000 in the Fund. You may use the information here, together with the amount you invested, to estimate the expenses that you paid over the period.
To do so, simply divide your account value by $1,000 (for example, an $8,600 account value divided by $1,000 = 8.6), then multiply the result by the number given for the Fund under the heading “Expenses Paid During Period.”
Hypothetical 5% return – This section is intended to help you compare the Fund’s ongoing costs with those of other mutual funds. It assumes that the Fund had an annual return of 5% before expenses during the period shown, but that the expense ratio is unchanged. In this case, because the return used is not the Fund’s actual return, the results do not apply to your investment. The example is useful in making comparisons because the SEC requires all mutual funds to calculate expenses based on a 5% return. You can assess the Fund’s ongoing costs by comparing this hypothetical example with the hypothetical examples that appear in shareholder reports of other funds.
Note that expenses shown in the table are meant to highlight and help you compare ongoing costs only. The Fund does not charge transaction fees, such as purchase or redemption fees, nor does it charge a “sales load.”
The calculations assume no shares were bought or sold during the period. Your actual costs may have been higher or lower, depending on the amount of your investment and the timing of any purchases or redemptions.
27
| WAVELENGTH FUND |
| ABOUT YOUR FUND’S EXPENSES (Unaudited) (Continued) |
More information about the Fund’s expenses can be found in this report. For additional information on operating expenses and other shareholder costs, please refer to the Fund’s prospectus.
| Beginning | Ending | Expenses Paid | |
| Account Value | Account Value | During | |
| December 1, 2022 | May 31, 2023 | Period* | |
| Based on Actual Fund Return | $1,000.00 | $1,008.30 | $4.96 |
| Based on Hypothetical 5% Return (before expenses) | $1,000.00 | $1,020.00 | $4.99 |
| * | Expenses are equal to the Fund’s annualized net expense ratio of 0.99% for the period, multiplied by the average account value over the period, multiplied by 182/365 (to reflect the one-half year period). |
| OTHER INFORMATION (Unaudited) |
A description of the policies and procedures that the Fund uses to vote proxies relating to portfolio securities is available without charge upon request by calling toll- free 1-866-896-9292, or on the SEC’s website at www.sec.gov. Information regarding how the Fund voted proxies relating to portfolio securities during the most recent 12-month period ended June 30 is available without charge upon request by calling toll-free 1-866-896-9292, or on the SEC’s website at www.sec.gov. The Trust files a complete listing of portfolio holdings for the Fund with the SEC as of the end of the first and third quarters of each fiscal year as an exhibit to its reports on Form N-PORT. These filings are available upon request by calling 1-866-896-9292. Furthermore, you may obtain a copy of the filings on the SEC’s website at www.sec.gov and the Fund’s website at www.wavelengthcapital.com.
| FEDERAL TAX INFORMATION (Unaudited) |
For the fiscal year ended May 31, 2023, the Fund designated $204,007 as tax-exempt income distributions.
28
| WAVELENGTH INTEREST RATE NEUTRAL FUND |
| BOARD OF TRUSTEES AND EXECUTIVE OFFICERS (Unaudited) |
The Board has overall responsibility for management of the Trust’s affairs. The Trustees serve during the lifetime of the Trust and until its termination, or until death, resignation, retirement, or removal. The Trustees, in turn, elect the officers of the Fund to actively supervise their day-to-day operations. The officers have been elected for an annual term. Each Trustee’s and officer’s address is 225 Pictoria Drive, Suite 450, Cincinnati, Ohio 45246. The following are the Trustees and executive officers of the Fund:
| Name and Year of Birth | Length of Time Served | Position(s) held with Trust | Principal Occupation(s) During Past 5 Years | Number of Funds in The Trust Overseen By Trustee | Directorship(s) of Public Companies Held By Trustee During Past 5 Years |
| Interested Trustees: | |||||
| David K. James* Year of Birth: 1970 | April 2023 to present October 2022 to April 2023 July 2021 to October 2022 | Trustee (April 2023 to present) Assistant Secretary Secretary | Executive Vice President and Chief Legal and Risk Officer of Ultimus Fund Solutions, LLC (“Ultimus”) and a member of the board of managers of Ultimus Fund Distributors, LLC, Northern Lights Distributors, LLC and Northern Lights Compliance Services, LLC, each an affiliate of Ultimus (2018 to present); Managing Director and Managing Counsel of State Street Bank and Trust Company (2009 to 2018) | 32 | Interested Trustee of 12 series of the Capitol Series Trust (a registered management company) (2021 to present). |
| Independent Trustees: | |||||
| Janine L. Cohen Year of Birth: 1952 | Since 2016 | Chairperson (2019 to present) Trustee (2016 to present) | Retired since 2013; previously Chief Financial Officer from 2004 to 2013 and Chief Compliance Officer from 2008 to 2013 at AER Advisors, Inc | 32 | n/a |
29
| WAVELENGTH INTEREST RATE NEUTRAL FUND |
| BOARD OF TRUSTEES AND EXECUTIVE OFFICERS (Unaudited) (Continued) |
| Name and Year of Birth | Length of Time Served | Position(s) held with Trust | Principal Occupation(s) During Past 5 Years | Number of Funds in The Trust Overseen By Trustee | Directorship(s) of Public Companies Held By Trustee During Past 5 Years |
| Independent Trustees (Continued): | |||||
| David M. Deptula Year of Birth: 1958 | Since 2012 | Trustee (2012 to present) | Vice President of Legal and Special Projects at Dayton Freight Lines, Inc. since 2016 | 32 | n/a |
| Robert E. Morrison Year of Birth: 1957 | Since 2019 | Trustee (2019 to present; and previously 2012 to 2012) | Managing Director at Midwest Trust and FCI Advisors (2022 to present); Senior Vice President and National Practice Lead for Investment, Huntington National Bank/Huntington Private Bank (2014 to 2022); CEO, CIO, President of 5 Star Investment Management Company (2006 to 2014) | 32 | n/a |
| Clifford N. Schireson Year of Birth: 1953 | Since 2019 | Trustee (2019 to present) | Retired; Founder of Schireson Consulting, LLC (2017 to 2022); Director of Institutional Services for Brandes Investment Partners, LP (2004 to 2017) | 32 | Trustee of the San Diego City Employees’ Retirement System (2019 to present). |
| Jacqueline A. Williams Year of Birth: 1954 | Since 2019 | Trustee (2019 to present) | Managing Member of Custom Strategy Consulting, LLC (2017 to present); Managing Director of Global Investment Research (2005 to 2017), Cambridge Associates, LLC | 32 | n/a |
| * | Mr. James is considered an “interested person” of the Trust within the meaning of Section (2)(a)(19) of the Investment Company Act of 1940, as amended, because of his relationship with the Trust’s Administrator, Transfer Agent, and Distributor. Mr. James was Assistant Secretary of the Trust from October 2022 to April 2023 and Secretary of the Trust from July 2021 to October 2022. |
30
| WAVELENGTH INTEREST RATE NEUTRAL FUND |
| BOARD OF TRUSTEES AND EXECUTIVE OFFICERS (Unaudited) (Continued) |
| Name and Year of Birth | Length of Time Served | Position(s) held with Trust | Principal Occupation(s) During Past 5 Years |
| Todd E. Heim Year of Birth: 1967 | 2021 to present 2014 to 2021 | President Vice President | Vice President, Relationship Management (2018 to present) and Assistant Vice President, Client Implementation Manager with Ultimus Fund Solutions, LLC (2014 to 2018) |
| Shannon Thibeaux- Burgess Year of Birth: 1970 | April 2023 to present | Vice President | Senior Vice President, Relationship Management with Ultimus Fund Solutions, LLC (2022 to present); Head of Regulatory Service with J.P. Morgan Chase & Co. (2020 to 2022); Chief Administrative Officer of State Street Bank (2013 to 2020) |
| Jennifer L. Leamer Year of Birth: 1976 | 2014 to present April 2014 to October 2014 | Treasurer Assistant Treasurer | Senior Vice President of Fund Accounting (2020 to present) and Mutual Fund Controller of Ultimus Fund Solutions, LLC (2014 to 2020) |
| Daniel D. Bauer Year of Birth: 1977 | 2016 to present | Assistant Treasurer | Vice President of Fund Accounting (2022 to present), Assistant Vice President of Fund Accounting (2020 to 2022), and AVP, Assistant Mutual Fund Controller (2015 to 2020) of Ultimus Fund Solutions, LLC |
| Angela A. Simmons Year of Birth: 1975 | January 2022 to present | Assistant Treasurer | Vice President of Financial Administration (2022 to present) and Assistant Vice President, Financial Administration (2015 to 2022) of Ultimus Fund Solutions, LLC. |
| Karen Jacoppo-Wood Year of Birth: 1966 | April 2023 to present | Secretary | Vice President and Senior Legal Counsel of Ultimus Fund Solutions, LLC (2021 to present); Vice President, Asset Servicing – Regulatory Administration of The Bank of New York Mellon (2019 to 2021); Vice President and Counsel of State Street Bank and Trust Company (2015 to 2019). |
| Natalie S. Anderson Year of Birth:1975 | 2016 to present | Assistant Secretary | Legal Administration Manager (2016 to present) and Paralegal (2015 to 2016) of Ultimus Fund Solutions, LLC |
| Jesse Hallee Year of Birth: 1976 | April 2023 to present | Assistant Secretary | Senior Vice President and Associate General Counsel of Ultimus Fund Solutions, LLC (June 2019 to present); Vice President and Managing Counsel, State Street Bank and Trust Company (2013 to 2019). |
31
| WAVELENGTH INTEREST RATE NEUTRAL FUND |
| BOARD OF TRUSTEES AND EXECUTIVE OFFICERS (Unaudited) (Continued) |
| Name and Year of Birth | Length of Time Served | Position(s) held with Trust | Principal Occupation(s) During Past 5 Years |
| Gweneth K. Gosselink Year of Birth: 1955 | 2020 to present | Chief Compliance Officer | Assistant Vice President, Compliance Officer at Ultimus Fund Solutions, LLC (2019 to present); CCO Consultant at GKG Consulting, LLC (2019 to 2021); Chief Operating Officer & CCO at Miles Capital, Inc. (2013 to 2019) |
| Martin Dean Year of Birth: 1963 | 2020 to present 2019 to 2020 2016 to 2017 | Assistant Chief Compliance Officer Interim Chief Compliance Officer Assistant Chief Compliance Officer | President of Northern Lights Compliance Services, LLC (February 2023 to present); Senior Vice President, Head of Fund Compliance (2020 to January 2023) and Vice President & Director of Fund Compliance of Ultimus Fund Solutions, LLC (2016 to 2020) |
Additional information about members of the Board and executive officers is available in the Fund’s Statement of Additional Information (“SAI”). To obtain a free copy of the SAI, please call toll free 1-866-896-9292.
32
This page intentionally left blank.
WAVELENGTH-AR-23
| (b) | Not applicable |
| Item 2. | Code of Ethics. |
As of the end of the period covered by this report, the registrant has adopted a code of ethics that applies to the registrant’s principal executive officer, principal financial officer, principal accounting officer or controller, or persons performing similar functions, regardless of whether these individuals are employed by the registrant or a third party. Pursuant to Item 12(a)(1), a copy of registrant’s code of ethics is filed as an exhibit to this Form N-CSR. During the period covered by this report, the code of ethics has not been amended, and the registrant has not granted any waivers, including implicit waivers, from the provisions of the code of ethics.
| Item 3. | Audit Committee Financial Expert. |
The registrant’s board of trustees has determined that the registrant has at least one audit committee financial expert serving on its audit committee. The name of the audit committee financial expert is Janine L. Cohen. Ms. Cohen is “independent” for purposes of this Item.
| Item 4. | Principal Accountant Fees and Services. |
| (a) | Audit Fees. The aggregate fees billed for professional services rendered by the principal accountant for the audit of the registrant’s annual financial statements or for services that are normally provided by the accountant in connection with statutory and regulatory filings or engagements were $66,000 and $64,500 with respect to the registrant’s fiscal years ended May 31, 2023 and 2022, respectively. |
| (b) | Audit-Related Fees. No fees were billed in either of the last two fiscal years for assurance and related services by the principal accountant that are reasonably related to the performance of the audit of the registrant’s financial statements and are not reported under paragraph (a) of this Item. |
| (c) | Tax Fees. The aggregate fees billed for professional services rendered by the principal accountant for tax compliance, tax advice, and tax planning were $15,500 and $15,000 with respect to the registrant’s fiscal years ended May 31, 2023 and 2022, respectively. The services comprising these fees are the preparation of the registrant’s federal income and excise tax returns. |
| (d) | All Other Fees. No fees were billed in either of the last two fiscal years for products and services provided by the principal accountant, other than the services reported in paragraphs (a) through (c) of this Item. |
| (e)(1) | The audit committee has not adopted pre-approval policies and procedures described in paragraph (c)(7) of Rule 2-01 of Regulation S-X. |
| (e)(2) | None of the services described in paragraph (b) through (d) of this Item were approved by the audit committee pursuant to paragraph (c)(7)(i)(C) of Rule 2-01 of Regulation S-X. |
| (f) | Less than 50% of hours expended on the principal accountant’s engagement to audit the registrant’s financial statements for the most recent fiscal year were attributed to work performed by persons other than the principal accountant’s full-time, permanent employees. |
| (g) | During the fiscal years ended May 31, 2023 and 2022, aggregate non-audit fees of $15,500 and $15,000, respectively, were billed by the registrant’s accountant for services rendered to the registrant. No non-audit fees were billed in either of the last two fiscal years by the registrant’s accountant for services rendered to the registrant’s investment adviser (not including any sub-adviser whose role is primarily portfolio management and is subcontracted with or overseen by another investment adviser), and any entity controlling, controlled by, or under common control with the adviser that provides ongoing services to the registrant. |
| (h) | The principal accountant has not provided any non-audit services to the registrant’s investment adviser (not including any sub-adviser whose role is primarily portfolio management and is subcontracted with or overseen by another investment adviser), and any entity controlling, controlled by, or under common control with the investment adviser that provides ongoing services to the registrant. |
| (i) | Not applicable |
| (j) | Not applicable |
| Item 5. | Audit Committee of Listed Registrants. |
Not applicable
| Item 6. | Schedule of Investments. |
| (a) | Not applicable [schedule filed with Item 1] |
| (b) | Not applicable |
| Item 7. | Disclosure of Proxy Voting Policies and Procedures for Closed-End Management Investment Companies. |
Not applicable
| Item 8. | Portfolio Managers of Closed-End Management Investment Companies. |
Not applicable
| Item 9. | Purchases of Equity Securities by Closed-End Management Investment Company and Affiliated Purchasers. |
Not applicable
Item 10. Submission of Matters to a Vote of Security Holders.
There has been no material changes to the manner in which shareholders may recommend nominees to the Registrant’s Board of Trustees or the Nominations & Governance Committee (the “Committee”). The Registrant does not have formal procedures by which shareholders may recommend nominees to the Registrant’s Board of Trustees. While the Registrant does not have formal procedure, the Committee shall to the extent required under applicable law, when identifying potential candidates for the position of Independent Trustee, consider any such candidate recommended by a shareholder.
| Item 11. | Controls and Procedures. |
| (a) | Based on their evaluation of the registrant’s disclosure controls and procedures (as defined in Rule 30a-3(c) under the Investment Company Act of 1940) as of a date within 90 days of the filing date of this report, the registrant’s principal executive officer and principal financial officer have concluded that such disclosure controls and procedures are reasonably designed and are operating effectively to ensure that material information relating to the registrant, including its consolidated subsidiaries, is made known to them by others within those entities, particularly during the period in which this report is being prepared, and that the information required in filings on Form N-CSR is recorded, processed, summarized, and reported on a timely basis. |
(b) There were no changes in the registrant’s internal control over financial reporting (as defined in Rule 30a-3(d) under the Investment Company Act of 1940) that occurred during the period covered by this report that have materially affected, or are reasonably likely to materially affect, the registrant’s internal control over financial reporting.
Item 12. Disclosure of Securities Lending Activities for Closed-End Management Investment Companies.
Not applicable
| Item 13. | Exhibits. |
File the exhibits listed below as part of this Form. Letter or number the exhibits in the sequence indicated.
(a)(1) Any code of ethics, or amendment thereto, that is the subject of the disclosure required by Item 2, to the extent that the registrant intends to satisfy the Item 2 requirements through filing of an exhibit: Attached hereto
(a)(2) A separate certification for each principal executive officer and principal financial officer of the registrant as required by Rule 30a-2(a) under the Act (17 CFR 270.30a-2(a)): Attached hereto
(1) Not applicable
(2) Change in the registrant’s independent public accountants. Attached hereto
(b) Certifications required by Rule 30a-2(b) under the Act (17 CFR 270.30a-2(b)): Attached hereto
Exhibit 99.CODE ETH Code of Ethics
Exhibit 99.CERT Certifications required by Rule 30a-2(a) under the Act
Exhibit 99.906CERT Certifications required by Rule 30a-2(b) under the Act
Exhibit 99.IND PUB ACCT Change in registrant’s independent public accounting
SIGNATURES
Pursuant to the requirements of the Securities Exchange Act of 1934 and the Investment Company Act of 1940, the registrant has duly caused this report to be signed on its behalf by the undersigned, thereunto duly authorized.
| (Registrant) | Ultimus Managers Trust | |||
| By (Signature and Title)* | /s/ Todd E. Heim | |||
| Todd E. Heim, President | ||||
| Date | August 3, 2023 | |||
| Pursuant to the requirements of the Securities Exchange Act of 1934 and the Investment Company Act of 1940, this report has been signed below by the following persons on behalf of the registrant and in the capacities and on the dates indicated. | ||||
| By (Signature and Title)* | /s/ Todd E. Heim | |||
| Todd E. Heim, Principal Executive Officer | ||||
| Date | August 3, 2023 | |||
| By (Signature and Title)* | /s/ Jennifer L. Leamer | |||
| Jennifer L. Leamer, Treasurer and Principal Financial Officer | ||||
| Date | August 3, 2023 | |||
* Print the name and title of each signing officer under his or her signature.