UNITED STATES
SECURITIES AND EXCHANGE COMMISSION
Washington, D.C. 20549
FORM N-CSR
CERTIFIED SHAREHOLDER REPORT OF REGISTERED
MANAGEMENT INVESTMENT COMPANIES
| Investment Company Act file number | 811-22680 |
| Ultimus Managers Trust |
| (Exact name of registrant as specified in charter) |
| 225 Pictoria Drive, Suite 450 Cincinnati, Ohio | 45246 |
| (Address of principal executive offices) | (Zip code) |
Khimmara Greer
| Ultimus Fund Solutions, LLC 225 Pictoria Drive, Suite 450 | Cincinnati, Ohio 45246 |
| (Name and address of agent for service) | |
| Registrant's telephone number, including area code: | (513) 587-3400 |
| Date of fiscal year end: | December 31 | |
| Date of reporting period: | December 31, 2022 |
Form N-CSR is to be used by management investment companies to file reports with the Commission not later than 10 days after the transmission to stockholders of any report that is required to be transmitted to stockholders under Rule 30e-1 under the Investment Company Act of 1940 (17 CFR 270.30e-1). The Commission may use the information provided on Form N-CSR in its regulatory, disclosure review, inspection, and policymaking roles.
A registrant is required to disclose the information specified by Form N-CSR, and the Commission will make this information public. A registrant is not required to respond to the collection of information contained in Form N-CSR unless the Form displays a currently valid Office of Management and Budget ("OMB") control number. Please direct comments concerning the accuracy of the information collection burden estimate and any suggestions for reducing the burden to the Secretary, Securities and Exchange Commission, 450 Fifth Street, NW, Washington, DC 20549-0609. The OMB has reviewed this collection of information under the clearance requirements of 44 U.S.C. § 3507.
| Item 1. | Reports to Stockholders. |
| (a) |

Westwood Salient Global Real Estate Fund
Westwood Salient Select Income Fund
Westwood Broadmark Tactical Growth Fund
Westwood Salient MLP & Energy Infrastructure Fund
Westwood Broadmark Tactical Plus Fund
| Annual Report | December 31, 2022 |
| Investment Advisor: | |
| Westwood Management Corp. | |
WESTWOOD FUNDS
| TABLE OF CONTENTS |
| Shareholder Letter | 1 |
| Schedules of Investments | |
| Westwood Salient Global Real Estate Fund | 20 |
| Westwood Salient Select Income Fund | 22 |
| Westwood Broadmark Tactical Growth Fund | 24 |
| Westwood Salient MLP & Energy Infrastructure Fund | 25 |
| Westwood Broadmark Tactical Plus Fund | 27 |
| Statements of Assets and Liabilities | 28 |
| Statements of Operations | 30 |
| Statements of Changes in Net Assets | 32 |
| Financial Highlights | 36 |
| Notes to Financial Statements | 46 |
| Report of Independent Registered Public Accounting Firm | 67 |
| Change in Auditor | 69 |
| About Your Funds’ Expenses | 70 |
| Proxy Disclosure | 74 |
| Disclosure Regarding Approval of Investment Advisory Agreement | 76 |
| Trustees and Officers of Ultimus Managers Trust | 79 |
| Other Information | 81 |
| Other Federal Tax Information | 81 |
WESTWOOD FUNDS (Unaudited)
December 31, 2022
Dear Shareholders,
The previous 12 months can be summed up in three words: “massive economic change.” Over the last year, both the stock and bond markets as well as shareholders’ psyches have all executed an about-face. At the same time, the American economy went from ultra-low interest rates and a healthy economic backdrop to investors gauging just how deep a potential recession will be in 2023. The Federal Reserve (Fed) remains in the driver’s seat, but the car (economic growth) may be running low on fuel as roads are expected to remain bumpy over the next 12 months. The good news is that consumers have remained resilient, and this environment is where Westwood strategies typically seek to outperform, given our emphasis on bottom-up portfolio construction, focus on quality within our Value products, and tactical approach across our Multi-Asset suite.
As for Westwood Management Corp., we have also gone through change. On November 18, we completed the acquisition of the asset management business of Salient Partners, LP. As part of this transaction, we received shareholder approval to reorganize the funds below into the corresponding Westwood Funds.
| Salient MF Trust/Forward Funds Trust | Ultimus Managers Trust | |
| Pre-November 18, 2022 | Post November 18, 2022 | |
| Salient MLP & Energy Infrastructure Fund | à | Westwood Salient MLP & Energy Infrastructure Fund |
| Salient Global Real Estate Fund | à | Westwood Salient Global Real Estate Fund |
| Salient Select Income Fund | à | Westwood Salient Select Income Fund |
| Salient Tactical Growth Fund | à | Westwood Broadmark Tactical Growth Fund |
| Salient Tactical Plus Fund | à | Westwood Broadmark Tactical Plus Fund |
The newly acquired funds are now marketed under the Westwood Salient and Westwood Broadmark names and are managed by the same investment teams as before with no change to the stated investment objectives. We believe the strategies and teams, however, will benefit from increased scale, and broadened distribution, as well as additional risk oversight and performance analytics that Westwood provides to its current investment teams.
Westwood is excited for the future of the broader Westwood Funds family and thanks you for your trust in our abilities to provide world-class investment capabilities.
Where Are We Now?
This time last year, risk was on and the rising inflation risks were deemed almost necessary to keep the economy firing as most believed above-trend price pressures were transitory and would fade along with pandemic supply chain pressures. Unfortunately, that post-pandemic bullish momentum was stifled abruptly by a series of near-simultaneous events that flipped the risk switch quickly to “off.” As stocks began their wide-ranging selloff soon after the start of the year, Russia’s invasion of Ukraine not only introduced a grey swan into the mix but also added stress to an already fragile supply chain and quickly worsened global inflation as critical commodity prices, namely food and energy, soared. Growing inflation, abnormally strong consumer data and a resilient labor market have also forced the Fed to enact one of the most aggressive rate hike trajectories in history, driving the Fed funds rate from nearly 0% in January to 3.8% in November.
This series of events and quick-shifting investor sentiment battered the S&P 500 early in the year. High-valuation growth stocks, largely tech names, took the worst of the blow, but all major stock indexes had breached the widely accepted, deep correction level of 20% or more by mid-summer. Equities were able to recover more than half of that correction by mid-August, only to fall again by mid-October. Above-average market volatility persisted throughout the last 12 months.
1
WESTWOOD FUNDS (Unaudited)
In 2022, the stock market notched its 14th bear market since World War II and the fourth worst year since 1945, behind 2008 (-38.5%), 1974 (-29.7%) and 2002 (-23.4%)*. One of the major factors contributing to the stock market’s weakness was the Fed’s continued tight monetary policy and rising interest rates. The U.S. Treasury 10-year Note yield more than doubled during the year. The 10-year Note began the year with a 1.63% yield and ended at 3.88%. The U.S. Treasury 3-Month Bill yield soared from 0.08% at the beginning of the year to a 4.42% yield at the end of the year.
| * | Source: MacroTrends |
Stocks, Bonds and Commodities
Investors continued to exit riskier interest rate sensitive securities and moved into more safe-haven investments such as utilities, value stocks and short-term money market funds. The surging U.S. dollar is also contributing to earnings stress as a large portion of S&P 500 revenues are derived outside our borders. This means that foreign earnings reported domestically will be worth less, further reducing earnings growth potential.
Stocks have again recovered some of their ground since October, but it’s critical that investors acknowledge the headwinds that America faces and adjust their approach to the markets with a different set of tactics that may have been applied over the last decade or so.
There is no doubt the current environment is certainly atypical and, in many ways, unprecedented. The effects of the Fed’s hawkish actions are being felt across the economy, from a (quiet) housing correction to swaths of layoffs now beginning in what’s been a relatively resilient labor market. Corporate earnings in the most recent third quarter showed a continued deterioration of growth, with the earnings expansion rate just around 2%, the lowest reported by the S&P 500 since Q3 2020. The forward 12-month P/E ratio for the S&P 500 is 16.6, which is below the five-year average (18.5) but near the 10-year average (17.1).
In fixed income, government bond yields across all time periods trended higher (prices fell) for much of the year. From a global perspective, the losses in government bonds during the first half of 2022 were some of the deepest in history; corporate bond prices also logged losses not seen in decades while yields soared. Though the early portion of the third quarter offered some reprieve, corporate bond prices continued their march lower as the period ended. We believe there are opportunities in corporate bonds but keep a neutral allocation with a focus on higher-quality and investment grade selections in our multi-asset funds.
One inflationary respite could come from materials as traders continued to sell wide swaths of commodities such as gold, silver, lumber, metals and more as demand fears and a strengthening dollar added pressure. We see these trends continuing, except for oil and natural gas, which are likely to remain elevated and volatile due to complex logistical challenges related to the Russia-Ukraine war and demand for heat and electricity going into winter. As the world shifts its focus towards energy security we believe that hydrocarbons from politically friendly geographies like the U.S. will gain market share as governments work to reduce their reliance on Russia and other potentially riskier suppliers.
Global Markets: Risk Off
In Europe, many of the same headwinds as seen in the U.S. are mounting, such as supply chain disruptions and rising prices from energy to food and more, plus the region is facing an energy crisis related to the Russia-Ukraine conflict. The European Central Bank has also been raising its key borrowing rates but is slowing its pace as the bloc’s economies have weakened sharply. Asian markets are dealing with their own set of unique, varied challenges that add a level of murkiness to global growth estimates for the coming year.
Domestically, the Fed has some tough decisions to make as data still shows near-record-low unemployment and 40-year highs in inflation. The reality is that a greater level of uncertainty prevails, and investors continue to scour data,
2
WESTWOOD FUNDS (Unaudited)
seeking hard-to-find clues on where the economy and markets are headed from here. Increased chatter and the growing probability of a current or coming recession increased dramatically during the back half of the year as data continues to support above-trend inflation. The latest comments and forward guidance from the Fed and Chairman Powell specifically, also suggested that a recession will be necessary to get inflation back to the Fed’s target of 2%.
For investors, the main market stressor is not just inflation, but also the actions being taken to control it, which have already severely affected and will continue to impact consumers and corporate earnings. The Consumer Price Index has begun to slow, but still remains extremely high. Energy price declines in the back half of the year contributed heavily to the reductions, but food and other even more durable prices remain elevated.
The Russia-Ukraine war remains a wildcard that continues to complicate the task and effectiveness of central banks’ actions. The war’s effects add to logistical troubles, corporate earnings (as many western companies have withdrawn from doing business in Russia) and food supply and costs. We believe that the conflict is likely to be drawn out, driving headline risk and continued disturbances, both temporary and permanent, in global trade and logistics.
The Road Ahead
The current market environment continues to produce dislocations with respect to valuation and increased levels of fundamental skepticism that play to our strength. Now, more than ever, highly tactical and active investment approaches, with high conviction active selections and tactical balanced allocations, will be needed to help reduce volatility and produce alpha. As it has for over 30 years, our investment process continues to seek out mispriced opportunities where fundamental analysis can uncover value while maintaining a strong culture of risk management and a focus on limiting potential downside risks.
Investors will need to re-evaluate their strategy and tactics to best capture alpha in what’s likely to be more of a range-bound broad market in equities and bonds. Washington has few arrows in its quiver to address current market risks as any further stimulus is likely to stoke inflation, which is the one thing that must be quelled. We see a continued slowdown in earnings growth for the S&P 500 and expect continued volatility for both equities and fixed income in the coming months as effects of the Fed’s bellicose stance toward inflation and subsequent economy-slowing actions are realized, along with an increased number of market participants adjusting forecasts to account for those effects.
We believe that interest rates are in the process of peaking and bonds are beginning to find a bottom, providing attractive opportunities across our investment suite. Following the September meeting, the Fed supported our interest rate targets. The median Federal Open Market Committee (FOMC) member thinks the Fed’s target policy rate range will still be 4.50% to 4.75% (terminal rate) by the end of next year (2023), implying that the Fed doesn’t plan to deliver any rate cuts until 2024. With that, we see two- to five -year yields rising, while the longer duration 10-year is likely to remain range bound, effectively flattening the curve as tightening impacts growth outlooks.
As economic growth decelerates and the probability of a recession increases, high quality characteristics, which are a key feature across our mutual fund complex, are likely to be an important driver of excess returns. We also continue to like companies that maintain pricing power to manage through an inflationary environment and have the ability to reduce the impact of input costs or to pass those costs on to their customers. In summary, we continue to stick to our knitting, serving our investors during challenging market periods like we are in today.
Thank you for your trust.
Sincerely,
The Investment Team
The Westwood Funds
3
WESTWOOD FUNDS (Unaudited)
The information contained herein represents the views of the manager at a specific point in time and is based on information believed to be reliable. No representation or warranty is made concerning the accuracy or completeness of any data compiled herein. Any statements non-factual in nature constitute only current opinion, which is subject to change. Any statements concerning financial market trends are based on current market conditions, which will fluctuate. Past performance is not indicative of future results. All information provided herein is for informational purposes only and is not intended to be, and should not be interpreted as, an offer, solicitation, or recommendation to buy or sell or otherwise invest in any of the securities/sectors/countries that may be mentioned. Investing involves risk, including possible loss of principal. A discussion of each fund’s performance during the periods ended December 31, 2022, is presented below.
Westwood Salient Global Real Estate
The performance of the Westwood Salient Global Real Estate Fund for the periods ended December 31, 2022, was as follows:
| 2022 | ||
| 6 Months | Fiscal Year | |
| Westwood Salient Global Real Estate Fund – Institutional Shares (KIRYX) | -4.63% | -21.61% |
| Westwood Salient Global Real Estate Fund Fund – A Shares (KIRAX)* | -4.74% | -21.91% |
| Westwood Salient Global Real Estate Fund – C Shares (KIRCX) | -5.02% | -22.33% |
| FTSE EPRA Nareit Developed Index | -5.52% | -25.09% |
| MSCI World Index | 3.20% | -17.73% |
| * | Without sales charge |
The performance data quoted represents past performance. Past performance does not guarantee future results. The investment return and principal value of an investment will fluctuate so that an investor’s shares, when redeemed, may be worth more or less than their original cost and current performance may be lower or higher than the performance quoted. The Adviser has contractually agreed to waive fees and reimburse expenses until April 30, 2024. In the absence of current fee waivers, total return and yield would have been reduced.
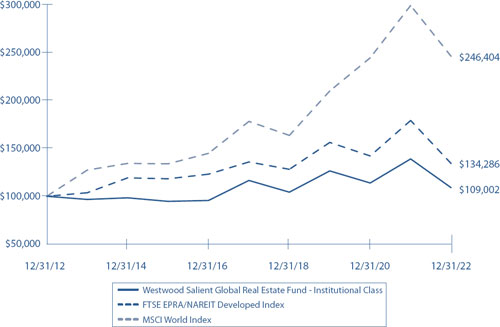
For the year ended December 31, 2022, Westwood Salient Global Real Estate Fund’s Institutional shares (the Fund) returned -21.61%, outperforming the Fund’s benchmark, the FTSE EPRA Nareit Developed Index, which returned -25.09%. The Fund, however, underperformed its secondary benchmark, the MSCI World Index, which returned -17.73%.
Despite ending on a somewhat positive note during the fourth quarter, 2022 will go down as one of the worst years for global investors in recent memory. In a dramatic reversal, investor sentiment shifted rapidly in the early part of 2022 as numerous economic signals presented a challenged economic climate. Chiefly among these was the elevated levels of inflation witnessed around the globe. In response, central banks, led by the Federal Reserve, ushered in a nearly unprecedented level of monetary tightening by rapidly increasing nominal interest rates throughout the year, which placed tremendous pressure on risk assets including on global REIT equities. On the geo -political front, Russia’s invasion of Ukraine in February and its related secondary effects impacting global trade and energy prices, added further uncertainty to the macro picture. As a result, most geographies and most property sectors experienced double-digit performance declines in 2022.
Investments in U.S. REITs suffered for the same reasons mentioned in the global macro section above. Additionally, slowing rent growth in multi-family, concerns around the return-to-office and tech downsizing in office, and tech weakness in data centers all contributed to negative performance. Our holdings in UK REITs were relatively diversified; however, all suffered for similar reasons as their U.S. peers. In domestic currency terms, Japanese REITs fared better
4
WESTWOOD FUNDS (Unaudited)
than those in most other territories; however, the material devaluing of the Japanese yen relative to the U.S. dollar heavily impacted the Fund’s performance, which is calculated in U.S. dollar terms.
Westwood Salient Select Income
The performance of the Westwood Salient Select Income Fund for the periods ended December 31, 2022, was as follows:
| 2022 | ||
| 6 Months | Fiscal Year | |
| Westwood Salient Select Income Fund – Institutional Shares (KIFYX) | -4.95% | -14.10% |
| Westwood Salient Select Income Fund – A Shares (KIFAX)* | -5.18% | -14.45% |
| Westwood Salient Select Income Fund – C Shares (KIFCX) | -5.38% | -14.92% |
| ICE BofA Fixed Rate Preferred Securities Index | -0.77% | -14.59% |
| * | Without sales charge |
The performance data quoted represents past performance. Past performance does not guarantee future results. The investment return and principal value of an investment will fluctuate so that an investor’s shares, when redeemed, may be worth more or less than their original cost and current performance may be lower or higher than the performance quoted. The Adviser has contractually agreed to waive fees and reimburse expenses until April 30, 2024. In the absence of current fee waivers, total return and yield would have been reduced.
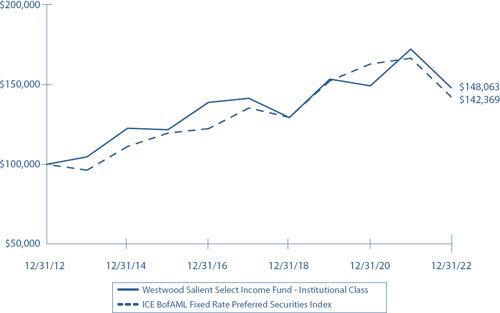
For the year ended December 31, 2022, Westwood Salient Select Income Fund’s Institutional shares (the Fund) returned -14.10%, outperforming the Fund’s benchmark, the ICE BofA Fixed Rate Preferred Securities Index, which returned -14.59%.
Despite ending on a somewhat positive note during the fourth quarter, 2022 will go down as one of the worst years for investors in recent memory. In a rather stunning reversal from the near euphoric investor sentiment the year prior, negative news emerged early in 2022 and essentially did not stop confounding investors. From Russia’s invasion of Ukraine in February and its resulting secondary effects impacting global trade and energy prices, to the hangover effect of the COVID-19 pandemic and the related elevated levels of inflation, investors struggled to position their portfolios for the deluge of difficult market signals. In nearly unprecedented fashion, the Fed hiked interest rates seven times in 2022, increasing the federal funds rate by 425 basis points (bps) over the course of the year, which placed significant pressure on REITs and REIT preferred securities. Due to uncertainty surrounding the economy and nominal interest rates, debt markets became materially constrained and the M&A market effectively halted, reducing the market’s ability to adequately value assets. Finally, there were effectively no new issuances of REIT preferred securities during the year, which normally provide price discovery and enhance liquidity in the REIT preferred markets.
Our Retail investments suffered primarily due to rising interest rates, which decreased the value of our preferred holdings. Additionally, a change of control event for the issuer of one of our securities resulted in a meaningful decline in the security’s credit quality. A class of preferred holders attempted to argue that the change of control event required a full calling of the security at par but were ultimately ruled against. Our Lodging investments were primarily impacted by rising interest rates as the underlying issuers reported strong performance throughout the year. Investments in the common equity of multi-family REITs were the largest detractor of performance in this sector. Slowing rent growth and leasing volumes led to downward adjustments in guidance by the REIT management teams, lowering valuations.
5
WESTWOOD FUNDS (Unaudited)
Westwood Broadmark Tactical Growth
The performance of the Westwood Broadmark Tactical Growth Fund for the periods ended December 31, 2022, was as follows:
| 2022 | ||
| 6 Months | Fiscal Year | |
| Westwood Broadmark Tactical Growth Fund – Institutional Shares (FTGWX) | -2.08% | -7.90% |
| Westwood Broadmark Tactical Growth Fund – A Shares (FTAGX)* | -2.30% | -8.27% |
| Westwood Broadmark Tactical Growth Fund – C Shares (FTGOX) | -2.53% | -8.75% |
| HFRX Equity Hedge Index | 1.61% | -3.18% |
| S&P 500 Index | 2.31% | -18.11% |
| * | Without sales charge |
The performance data quoted represents past performance. Past performance does not guarantee future results. The investment return and principal value of an investment will fluctuate so that an investor’s shares, when redeemed, may be worth more or less than their original cost and current performance may be lower or higher than the performance quoted.
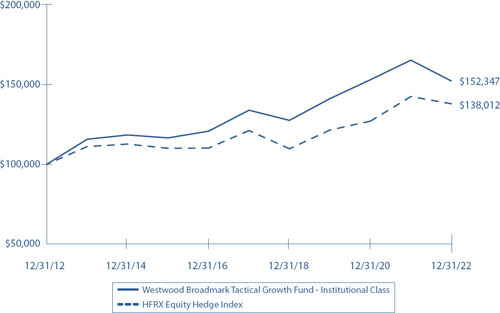
For the year ended December 31, 2022, Westwood Broadmark Tactical Growth Fund’s Institutional Class shares returned -7.90%, underperforming the Fund’s primary benchmark, the HFRX Equity Hedge Index, which returned -3.18%. The Fund, however, outperformed its secondary benchmark, the S&P 500 Index, which declined -18.11%.
In 2022, the stock market notched its 14th bear market since World War II and the fourth worst year since 1945, behind 2008 (-38.5%), 1974 (-29.7%) and 2002 (-23.4%). One of the major factors contributing to the stock market’s weakness was the Fed’s continued tight monetary policy and rising interest rates. The U.S. Treasury 10-year Note yield more than doubled during the year. The 10-year Note began the year with a 1.63% yield and ended at 3.88%. The U.S. Treasury 3-Month Bill yield soared from 0.08% at the beginning of the year to a 4.42% yield at the end of the year.
Equity valuations have improved in the last year but are still high when adjusted for inflation. In addition, inflation fears have begun to shift to fears over earnings and the economy as we enter 2023. A tightening Fed into a slowing economy and continued high inflation is not a healthy environment for stocks. On the monetary front, while yields at the long end of the yield curve declined at the end of 2022, short-term interest rates rose while longer-term rates declined. The 3-month/10-year U.S. Treasury yield curve at the end of 2022 was the most negative since the 2008-2009 financial crisis. Historically, while timing is always uncertain, this inversion has often been a leading indicator of a future recession. In addition, since 1962, the market has shown a negative return during the periods when the 3-month/10-year yield curve was inverted. At the end of the year, the Fund’s investment team’s volume and breadth momentum models were negative across the board with short-term momentum also having turned negative.
The Fund employed derivative instruments during the year primarily to cushion the portfolio from declining stock prices. Futures contracts were used to help offset risk during these times. The use of futures detracted -0.91% from the Fund’s return for the year.
In accordance with the prospectus, you’ll note the sizeable cash position. The fund’s models are geared towards measuring market risk. Cash is utilized as a defensive measure when market risk is high.
6
WESTWOOD FUNDS (Unaudited)
As the Westwood Broadmark Tactical Growth Fund’s investment team looks ahead to 2023, there are several factors within its “Four Pillar Process” that the team will be watching:
| 1. | Valuation: Price earnings ratios adjusted for inflation (defined as the year-to-year change in the Consumer Price index) have declined from their lofty levels of a year ago, but they are still in overvalued territory. A decline in earnings and profits and potential recession in 2023 would be negative for equity valuations. Thus, it looks like this readjustment process has further to go before equities become more fairly valued. |
| 2. | Monetary factors and credit conditions: The yield curve comparing the 3-Month U.S. Treasury Bill yield with the 10-Year U.S. Treasury yield at the end of 2022 was at its greatest inversion since the 2008-2009 financial crisis. December was also the second consecutive month that short-term yields rose while longer-term yields declined. This inversion has occurred less than 12% of the time since 1962. Historical statistics show that during the time these inversions persisted, the S&P 500 has declined at an annual rate of -1.99%. Evidence that the yield curve is returning to normal would be a positive sign for the equity markets. |
| 3. | Sentiment: Investor sentiment became more pessimistic toward the end of 2022 as the stock market declined. This is positive from a contrary point of view. We note that investor sentiment is a condition and is not a trigger until it reaches an extreme. Nonetheless, the return of investor pessimism is a positive sign and the team will be watching for an extreme reading on this indicator in 2023 in order to provide the environment for a solid market low point. |
| 4. | Momentum: The team’s breadth momentum model, which measures the breadth of Standard & Poor’s industry groups, declined into negative territory at the end of 2022 and was negative a good part of the year. The team’s volume momentum model, which compares upside volume with downside volume, also remains in negative territory. The team would begin to raise market exposure if and when these momentum models return to positive territory. |
Westwood Salient MLP & Energy Infrastructure
The performance of the Westwood Salient MLP & Energy Infrastructure Fund for the periods ended December 31, 2022, was as follows:
| 2022 | ||
| 6 Months | Fiscal Year | |
| Westwood Salient MLP & Energy Infrastructure Fund – Institutional Shares (SMLPX) | 10.59% | 17.22% |
| Westwood Salient MLP & Energy Infrastructure Fund – A Shares (SMAPX)* | 10.52% | 17.00% |
| Westwood Salient MLP & Energy Infrastructure Fund – C Shares (SMFPX) | 10.08% | 15.98% |
| Westwood Salient MLP & Energy Infrastructure Fund – Ultra Shares (SMRPX) | 10.62% | 17.12% |
| Alerian Midstream Energy Select Index | 8.35% | 19.15% |
| * | Without sales charge |
The performance data quoted represents past performance. Past performance does not guarantee future results. The investment return and principal value of an investment will fluctuate so that an investor’s shares, when redeemed, may be worth more or less than their original cost and current performance may be lower or higher than the performance quoted. The Adviser has contractually agreed to waive fees and reimburse expenses until April 30, 2024. In the absence of current fee waivers, total return and yield would have been reduced. Certain Funds may invest in MLPs taxed as partnerships. Due to a variety of factors, including significant non-cash deductions such as depreciation and depletion, MLPs have historically made cash distributions to limited partners that exceed the amount of taxable income allocable to such limited partners
7
WESTWOOD FUNDS (Unaudited)
or members. These excess cash distributions would not be treated as income to a Fund but rather would be treated as a return of capital to the extent of the Fund’s basis in the MLP. As a consequence, a Fund may make distributions that exceed its earnings and profits, which would be characterized as a return of capital to shareholders. A return of capital distribution will generally not be taxable, but will reduce each shareholder’s cost basis in Fund shares and result in a higher capital gain or lower capital loss when the Fund shares are sold. After a shareholder’s basis in Fund shares has been reduced to zero, distributions in excess of earnings and profits in respect of those Fund shares will be treated as gain from the sale of the Fund shares. As of 12/31/2022, the Westwood MLP and Energy Infrastructure Fund paid a minimum of $0.08/share in distributions per quarter.
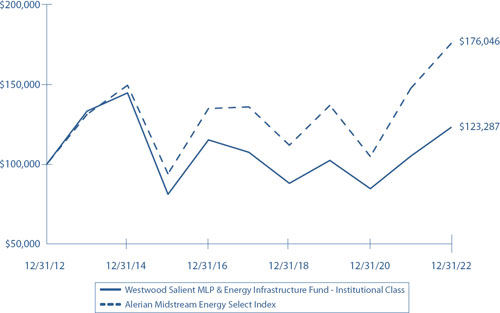
For the year ended December 31, 2022, Westwood Salient MLP & Energy Infrastructure Fund’s Institutional shares (the Fund) returned 17.22%, underperforming the Fund’s benchmark, the Alerian Midstream Energy Select Total Return Index (AMEIX), which returned 19.15%.
2022 provided a positive market environment for master limited partnerships and midstream energy companies (businesses involved with the processing, storing, transporting and marketing of oil, natural gas and natural gas liquids). The year began with Russia’s march toward war with Ukraine and commodity prices responded strongly with oil moving up above $120 per barrel and natural gas reaching nearly $10/Mcf during the first half of the year. As the year progressed, worries of a slowdown in global growth brought volatility to the markets and uncertainty to energy demand. Increased uncertainty led to a choppier second half of the year for midstream equities. During the second half of the year, the U.S. government passed the Inflation Reduction Act (IRA) that accelerated investments in renewables and helped propel performance for the Fund’s renewable allocation. Ultimately, the favorable backdrop combined with continued capital discipline from the midstream industry led to healthy investment returns for the year.
The first quarter was marked by the Russian invasion of Ukraine. The invasion brought “energy security” back to the top of governments’ minds and caused oil prices to rise over 33% as measured by the West Texas Intermediate (WTI) benchmark and natural gas prices to increase over 50% during the quarter. Russia’s invasion of Ukraine is a massive geopolitical event that we believe will have long-term reverberations throughout the global energy landscape. Russia was the second largest producer globally of both crude oil and natural gas in 2020, with oil production of more than 10 million bpd (mmbpd) and natural gas production of almost 62 billion cubic feet per day (Bcf/d). It was also the fourth largest exporter of liquefied natural gas (LNG) at 3.9 Bcf/d. On the crude front, Russia exported north of 5 mmbpd with roughly half of those exports going to Europe. Natural gas exports are roughly 40% of Russia’s production, with Europe receiving 72% of those exports. Midstream providers, particularly natural gas and LNG focused businesses fared well during this period.
Another development during the first quarter was the de -correlation between the midstream industry and high yield spreads. Historically, there has been a close long-term relationship between high yield spreads (not rates) and midstream returns, but thankfully the two decoupled in early 2022. High yield spreads ended 2021 at 283 basis points (bps) and began to widen almost immediately in early January as inflation readings came in higher than expected and Federal Reserve governors espoused their intentions to aggressively raise rates. By late January, spreads reached 345 bps and continued to widen through mid-March — ultimately hitting 411 bps. The S&P 500 was down over 10% during this period, and in the not-too-distant past, the midstream space underperformed the broad market as spreads widened and that did not happen in 2022. Our thesis is that the breakdown in correlation to high yield spreads is an indication the midstream industry is now a net generator of capital through free cash flow. Without a need to raise capital today, companies should not be beholden to fluctuations in high yield spreads. We expect capital discipline to continue to favor the midstream space and for continued, substantial free cash flow generation to drive the long-term investment opportunity in the industry. For the quarter, the AMEIX index was up 21.5%.
As the year progressed, inflation became a much bigger concern and interest rate increases by the Fed Reserve began to drive markets. Higher than expected inflation caused a sharp correction in the broad market that resulted in a correction in the midstream industry as well. In early June, news started making the rounds that the Fed would
8
WESTWOOD FUNDS (Unaudited)
almost certainly raise rates by 75 basis points at their upcoming FOMC meeting to combat inflation, and markets fell sharply. The quarterly return for the AMEIX flipped from an 8.7% gain as of June 7 to a 9.5% loss by June 30 as investors began to fear that the Fed would overtighten and send the U.S. economy into recession, thus reducing energy demand.
By the start of the third quarter, investor focus shifted from the war in Ukraine to a potential recession in the United States. Concerns about a decline in energy demand due to recession caused oil prices to retreat throughout the quarter from their Ukraine war high above $120/bbl in early June to below $80/bbl by Sept. 30. Despite the sharp correction in oil prices, midstream companies held up well and the AMEIX index was down only 1% during the quarter. By October, the precipitous decline in oil prices was met with concern by OPEC and the cartel cut quotas by 2 million barrels per day to shore up the market and stabilize oil prices. OPEC’s cut coupled with inflation data beginning to trend softer resulted in a sharp rally during the fourth quarter with the AMEIX up 9.5% during the quarter.
While traditional energy companies had a healthy 2022, renewable energy infrastructure had a mixed year. January saw a strong shift away from growth stocks into value stocks, negatively impacting the Fund’s renewable allocation. The shift to value stocks led to a sharp decline in renewable companies’ stock prices through early May, with several of the Fund’s holdings down by over 25% at that point. Fortunately, earnings showed continued strength in the businesses, and the industry finally bottomed out in early June. During the summer, two developments helped to accelerate growth for the renewables industry which resulted in several companies returning to their 2021 highs. First, the Biden administration enacted a two-year moratorium on import tariffs for certain East Asian manufactured solar modules, which is expected to benefit utility scale solar installations, and second, the U.S. Government enacted the 2022 Inflation Reduction Act, which provides over $400 billion in subsidies for low carbon energy through 2032. We continue to believe that renewables play an integral part of the energy value chain and see significant long-term, secular opportunity owning companies that help bring that energy to market.
As previously stated, the Fund returned 17.2% in 2022 with several holdings driving performance throughout the year. The top contributors were predominantly within the gathering and processing, natural gas liquids (NGL) infrastructure and liquefied natural gas (LNG) sectors. The Fund’s top contributor to performance was Cheniere Energy, Inc. (Cheniere). Cheniere is the largest LNG exporter in the United States and is transitioning from a heavy capital investment cycle to a more sustained cash flow generation cycle. The company was instrumental in providing incremental natural gas cargoes to Europe as the continent disentangled itself from Russian natural gas this year. We continue to see favorable long-term growth opportunities for expanding Cheniere’s existing export facilities to handle more LNG, growing cash flows and earnings in coming years. The company’s growing cash flow stream gives management the ability to both reduce debt and repurchase stock, which could potentially generate more value to shareholders over time. Our investment in Cheniere is a testament to the total return approach the Fund employs to maximize long-term shareholder value rather than stretching for yield. Cheniere comprised an average portfolio weight of 8.7% and was up 48.2% for the year, contributing 456 basis points to the Fund’s overall performance.
The Fund’s second largest contributor to performance was Energy Transfer (ET). ET is a large integrated MLP that is transitioning from a debt reduction story to a growth, buyback and yield opportunity. Management guided to returning the distribution to its pre-pandemic crisis level of $1.22/unit implying over a 10% yield on the security as of the stock’s year end closing price. Additionally, ET is generating significant free cash flow above the current distribution giving management the flexibility to repurchase shares or raise the distribution further in the future. The company continues to grow through incremental investments in their existing footprint and offers, in our opinion, one of the cheapest and best ways to access the midstream industry at this juncture. ET was a 9.2% average weight in the portfolio, was up 56.0% for the year and contributed 438 bps to Fund performance.
Finally, our third largest portfolio contributor was Targa Resources Corp. (Targa). Targa is a fully integrated provider of natural gas and NGL services. The company gathers and processes natural gas and provides NGL transportation, storage, fractionation and export services. The company completed a large capital investment program and simplified
9
WESTWOOD FUNDS (Unaudited)
its corporate structure via several asset consolidations and dispositions during the year. Targa saw an acceleration of free cash flow generation in 2022 as production volumes grew throughout the year. With higher free cash flow, the company was able to reduce debt and buy back stock while still growing earnings meaningfully as compared to 2021. Targa comprised a 9.3% average weight in the portfolio during the year. The company was up 43.1% for 2022 and contributed 406 basis points to Fund performance.
While the Fund had good returns for the year, some holdings did detract from performance. The largest detractor for the year was Equitrans Midstream Corp. (ETRN). ETRN has had multiple legal setbacks for its Mountain Valley Pipeline (MVP) and continues to have difficulty securing all the permits for the pipeline. While we expect a resolution of the permitting process, the timeline continues to move further into the future. The company was an average weight of 3.4% in the portfolio and was down 30.3% for the year resulting in a negative contribution to the Fund of 159 basis points.
The second largest detractor for the year was the Fund’s investment in Heliogen. Heliogen is a concentrated solar company that is ramping up production over the coming three-year time frame. We believe the rotation from growth to value in the market negatively impacted the company’s stock performance along with delays on their project timeline. Heliogen had an average weight of 0.1% in the Fund and was down 75.9% during the year. The position detracted 128 basis points from Fund performance.
Finally, the third largest detractor for the year was the Fund’s investment in Keyera Corp. (Keyera). Keyera is an NGL infrastructure company in Canada with significant commodity sensitivity and a large project that has gone over budget and has experienced delays. We expect most of the delays to normalize in 2023 and 2024. The Fund owned an average of 2.4% of the position and detracted 71 basis points from Fund performance.
The Fund employed derivatives in 2022 in a limited way by writing calls on existing Fund positions. The call writing strategy generated $1.2 million in income for the Fund for the year, which amounts to 14 bps to overall performance.
2022 was a solid year for midstream equities despite the equity volatility toward the second half of the year. The year witnessed improvement in energy production in the United States, management teams staying capital disciplined and free cash flow growth above most analysts’ expectations. As we begin 2023, we see much of the same for the industry, with companies in the energy infrastructure space starting to provide preliminary 2023 guidance. So far the majority of companies are indicating healthier year-over-year cash flows in 2023. Furthermore, companies have already signaled their desire to continue returning capital to shareholders over increasing capital spending. The healthy growth in energy volumes, continued improvement in balance sheets and continued focus on capital discipline are anticipated to create a backdrop for continued success in 2023.
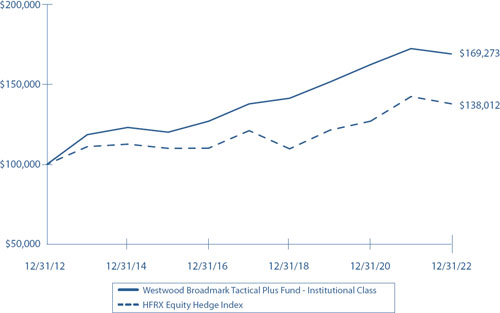
Westwood Broadmark Tactical Plus
The performance of the Westwood Broadmark Tactical Plus Fund for the periods ended December 31, 2022, was as follows:
| 2022 | ||
| 6 Months | Fiscal Year | |
| Westwood Broadmark Tactical Plus Fund – Institutional Shares (SBTIX) | 1.67% | -1.95% |
| Westwood Broadmark Tactical Plus Fund – A Shares (SBTAX)* | 1.48% | -2.18% |
| Westwood Broadmark Tactical Plus Fund – C Shares (SBTCX) | 1.22% | -2.82% |
| Westwood Broadmark Tactical Plus Fund – F Shares (BTPIX) | 1.81% | -1.65% |
| HFRX Equity Hedge Index | 1.61% | -3.18% |
| S&P 500 Index | 2.31% | -18.11% |
| * | Without sales charge |
10
WESTWOOD FUNDS (Unaudited)
The performance data quoted represents past performance. Past performance does not guarantee future results. The investment return and principal value of an investment will fluctuate so that an investor’s shares, when redeemed, may be worth more or less than their original cost and current performance may be lower or higher than the performance quoted. The Adviser has contractually agreed to waive fees and reimburse expenses until April 30, 2024. In the absence of current fee waivers, total return and yield would have been reduced.
For the year ended December 31, 2022, Westwood Broadmark Tactical Plus Fund’s Institutional Class shares returned -1.95%, outperforming the Fund’s primary benchmark, the HFRX Equity Hedge Index, which returned -3.18%. The Fund also outperformed its secondary benchmark, the S&P 500, which declined -18.11%.
In 2022, the stock market notched its 14th bear market since World War II and the fourth worst year since 1945, behind 2008 (-38.5%), 1974 (-29.7%) and 2002 (-23.4%). One of the major factors contributing to the stock market’s weakness was the Fed’s continued tight monetary policy and rising interest rates. The U.S. Treasury 10-year Note yield more than doubled during the year. The 10-year Note began the year with a 1.63% yield and ended at 3.88%. The U.S. Treasury 3-Month Bill yield soared from 0.08% at the beginning of the year to a 4.42% yield at the end of the year.
Equity valuations have improved in the last year but are still high when adjusted for inflation. In addition, inflation fears have begun to shift to fears over earnings and the economy as we enter 2023. A tightening Fed into a slowing economy and continued high inflation is not a healthy environment for stocks. On the monetary front, while yields at the long end of the yield curve declined at the end of 2022, short-term interest rates rose while longer-term rates declined. The 3-month/10-year U.S. Treasury yield curve at the end of 2022 was the most negative since the 2008-2009 financial crisis. Historically, while timing is always uncertain, this inversion has often been a leading indicator of a future recession. In addition, since 1962, the market has shown a negative return during the periods when the 3-month/10-year yield curve was inverted. At the end of the year, the team’s volume and breadth momentum models were negative across the board with short-term momentum also having turned negative.
The Fund regularly used options and futures during the year. A meaningful portion of the Fund’s return can be attributed to these derivative instruments.
In accordance with the prospectus, you’ll note the sizeable cash position. The fund’s models are geared towards measuring market risk. Cash is utilized as a defensive measure when market risk is high.
As the Westwood Broadmark Tactical Plus Fund’s investment team looks ahead to 2023, there are several factors within its “Four Pillar Process” that the team will be watching:
| 1. | Valuation: Price earnings ratios adjusted for inflation (defined as the year-to-year change in the Consumer Price Index) have declined from their lofty levels of a year ago, but they are still in overvalued territory. A decline in earnings and profits and potential recession in 2023 would be negative for equity valuations. Thus, it looks like this readjustment process has further to go before equities become more fairly valued. |
| 2. | Monetary factors and credit conditions: The yield curve comparing the 3-Month U.S. Treasury Bill yield with the 10-Year U.S. Treasury yield at the end of 2022 was at its greatest inversion since the 2008-2009 financial crisis. December 2022 was also the second consecutive month that short-term yields rose while longer-term yields declined. This inversion has occurred less than 12% of the time since 1962. Historical statistics show that during the time these inversions persisted, the S&P 500 has declined at an annual rate of -1.99%. Evidence that the yield curve is returning to normal would be a positive sign for the equity markets. |
| 3. | Sentiment: Investor sentiment became more pessimistic toward the end of 2022 as the stock market declined. This is positive from a contrary point of view. We note that investor sentiment is a condition and is not a trigger until it reaches an extreme. Nonetheless, the return of investor pessimism is a positive sign, |
11
WESTWOOD FUNDS (Unaudited)
and the team will be watching for an extreme reading on this indicator in 2023 in order to provide the environment for a solid market low point.
| 4. | Momentum: The team’s breadth momentum model, which measures the breadth of Standard & Poor’s industry groups, declined into negative territory at the end of 2022 and was negative a good part of the year. The team’s volume momentum model, which compares upside volume with downside volume, also remains in negative territory. The team would begin to raise market exposure if and when these momentum models return to positive territory. |
To determine if this Fund is an appropriate investment for you, carefully consider the Fund’s investment objectives, risk factors, charges and expenses before investing. This and other information can be found in the Fund’s prospectus, which may be obtained by calling 1.877.386.3944. Read the prospectus carefully before investing or sending money.
Past performance is not predictive of future performance. Investment results and principal value will fluctuate so that shares, when redeemed, may be worth more or less than their original cost. Current performance may be higher or lower than the performance data quoted. Performance data current to the most recent month end are available by calling 1.877.386.3944.
An investor should consider the investment objectives, risks, charges and expenses of each Fund carefully before investing. The Funds’ prospectus contains this and other important information. To obtain a copy of the Funds’ prospectus, please visit the Funds’ website at www.westwoodfunds.com or call 1.877.386.3944 and a copy will be sent to you free of charge. Please read the prospectus carefully before you invest. The Funds are distributed by Ultimus Fund Distributors, LLC.
The Letter to Shareholders seeks to describe some of the Funds’ adviser’s current opinions and views of the financial markets. Although the Funds’ advisers believe it has a reasonable basis for any opinions or views expressed, actual results may differ, sometimes significantly so, from those expected or expressed. The securities held by the Funds that are discussed in the Letter to Shareholders were held during the period covered by this Report. They do not comprise the entire investment portfolios of the Funds, may be sold at any time, and may no longer be held by the Funds. For a complete list of securities held by the Funds as of December 31, 2022, see the Schedules of Investments section of this Report. The opinions of the Funds’ advisers with respect to those securities may change at any time.
Statements in the Letter to Shareholders that reflect projections or expectations for future financial or economic performance of the Funds and the market in general and statements of the Funds’ plans and objectives for future operations are forward-looking statements. No assurance can be given that actual results or events will not differ materially from those projected, estimated, assumed, or anticipated in any such forward-looking statements. Important factors that could result in such differences, in addition to factors noted with such forward-looking statements include, without limitation, general economic conditions, such as inflation, recession, and interest rates. Past performance is not a guarantee of future results.
12
WESTWOOD FUNDS (Unaudited)
Definition of the Comparative Indices & Key Terms
2022 Inflation Reduction Act covers new and reinstated tax laws that will affect individuals and businesses, including a number of credits and deductions. One provision changes the eligibility rules to claim a tax credit for clean vehicles. This took effect as soon as the law was signed.
Alerian Midstream Energy Select Index (AMEIX) is a composite of North American midstream energy infrastructure companies that are engaged in activities involving energy commodities. The capped, float-adjusted, capitalization-weighted index is disseminated in real time on a price-return basis.
Alpha is the measure of risk-adjusted performance.
FTSE EPRA Nareit Developed Index is designed to track the performance of listed real estate companies and REITs worldwide.
HFRX Equity Hedge Index comprises private funds with strategies that maintain both long and short positions primarily in equity securities and equity derivatives.
ICE BofA Fixed Rate Preferred Securities Index consists of investment-grade, fixed and fixed-to-floating rate U.S. dollar-denominated preferred securities.
MSCI World Index is a free float-adjusted market capitalization index designed to measure equity market performance in the global developed markets.
S&P 500 Index is an unmanaged capitalization-weighted index of 500 stocks designed to measure performance of the broad domestic stock market through changes in the aggregate market value of 500 stocks representing all major industries.
13
WESTWOOD SALIENT GLOBAL REAL ESTATE FUND (UNAUDITED)
Comparison of the Change in Value of a $100,000 Investment in Westwood Salient Global Real Estate
Fund - Institutional Class (a) versus the FTSE EPRA/NAREIT Developed Index and the MSCI World Index
Average Annual Total Returns (b) (for the periods ended December 31, 2022) | |||
| 1 Year | 5 Year | 10 Year | |
| Institutional Shares | -21.61% | -1.33% | 0.87% |
| A Class Shares with sales charge | -26.38% | -2.86% | -0.12% |
| A Class Shares without sales charge | -21.91% | -1.70% | 0.47% |
| C Class Shares with CDSC | -23.09% | -2.28% | -0.10% |
| C Class Shares without CDSC | -22.33% | -2.28% | -0.10% |
| FTSE EPRA/NAREIT Developed Index | -25.09% | -0.23% | 2.99% |
| MSCI World Index | -17.73% | 6.69% | 9.44% |
| (a) | The graph is based on Institutional Shares. Performance for A Class Shares would have been lower because it is subject to a maximum front-end sales charge of 3.00% and additional annual distribution expenses of 0.25%. Performance for C Class Shares would vary due to differences in fee structures. |
| (b) | The Fund’s total returns do not reflect the deduction of taxes a shareholder would pay on Fund distributions or the redemption of Fund shares. If the Adviser had not limited certain expenses, the Fund’s total return would have been lower. |
The performance data quoted herein represents past performance and the return and value of an investment in the Fund will fluctuate so that, when redeemed, may be worth less than its original cost. Past performance is no guarantee of future performance and should not be considered as a representation of the future results of the Fund. There are no assurances that the Fund will meet its stated objectives. The Fund’s holdings and allocations are subject to change because it is actively managed and should not be considered recommendations to buy individual securities. The Fund’s performance assumes the reinvestment of all dividends and all capital gains. Index returns assume reinvestment of dividends and, unlike the Fund’s returns, do not reflect any fees or expenses. If such fees and expenses were included in the index returns, the performance would have been lower. Please note that one cannot invest directly in an unmanaged index.
14
WESTWOOD SALIENT SELECT INCOME FUND (UNAUDITED)
Comparison of the Change in Value of a $100,000 Investment in Westwood Salient Select Income
Fund - Institutional Class (a) versus the ICE BofAML Fixed Rate Preferred Securities Index
Average Annual Total Returns (b) (for the periods ended December 31, 2022) | |||
| 1 Year | 5 Year | 10 Year | |
| Institutional Shares | -14.10% | 0.91% | 4.00% |
| A Class Shares with sales charge | -19.37% | -0.66% | 2.98% |
| A Class Shares without sales charge | -14.45% | 0.52% | 3.59% |
| C Class Shares with CDSC | -15.72% | -0.07% | 3.00% |
| C Class Shares without CDSC | -14.92% | -0.07% | 3.00% |
| ICE BofAML Fixed Rate Preferred Securities Index | -14.59% | 1.01% | 3.60% |
| (a) | The graph is based on Institutional Shares. Performance for A Class Shares would have been lower because it is subject to a maximum front-end sales charge of 3.00% and additional annual distribution expenses of 0.25%. Performance for C Class Shares would vary due to differences in fee structures. |
| (b) | The Fund’s total returns do not reflect the deduction of taxes a shareholder would pay on Fund distributions or the redemption of Fund shares. If the Adviser had not limited certain expenses, the Fund’s total return would have been lower. |
The performance data quoted herein represents past performance and the return and value of an investment in the Fund will fluctuate so that, when redeemed, may be worth less than its original cost. Past performance is no guarantee of future performance and should not be considered as a representation of the future results of the Fund. There are no assurances that the Fund will meet its stated objectives. The Fund’s holdings and allocations are subject to change because it is actively managed and should not be considered recommendations to buy individual securities. The Fund’s performance assumes the reinvestment of all dividends and all capital gains. Index returns assume reinvestment of dividends and, unlike the Fund’s returns, do not reflect any fees or expenses. If such fees and expenses were included in the index returns, the performance would have been lower. Please note that one cannot invest directly in an unmanaged index.
15
WESTWOOD BROADMARK TACTICAL GROWTH FUND (UNAUDITED)
Comparison of the Change in Value of a $100,000 Investment in Westwood Broadmark
Tactical Growth Fund - Institutional Class (a) versus the HFRX Equity Hedge Index
Average Annual Total Returns (b) (for the periods ended December 31, 2022) | |||
| 1 Year | 5 Year | 10 Year | |
| Institutional Shares | -7.90% | 2.60% | 4.30% |
| A Class Shares with sales charge | -13.55% | 0.97% | 3.21% |
| A Class Shares without sales charge | -8.27% | 2.18% | 3.82% |
| C Class Shares with CDSC | -9.63% | 1.59% | 3.30% |
| C Class Shares without CDSC | -8.75% | 1.59% | 3.30% |
| HFRX Equity Hedge Index | -3.18% | 2.63% | 3.27% |
| S&P 500 Index | -18.11% | 9.42% | 12.56% |
| (a) | The graph is based on Institutional Shares. Performance for A Class Shares would have been lower because it is subject to a maximum front-end sales charge of 3.00% and additional annual distribution expenses of 0.25%. Performance for C Class Shares would vary due to differences in fee structures. |
| (b) | The Fund’s total returns do not reflect the deduction of taxes a shareholder would pay on Fund distributions or the redemption of Fund shares. If the Adviser had not limited certain expenses, the Fund’s total return would have been lower. |
The performance data quoted herein represents past performance and the return and value of an investment in the Fund will fluctuate so that, when redeemed, may be worth less than its original cost. Past performance is no guarantee of future performance and should not be considered as a representation of the future results of the Fund. There are no assurances that the Fund will meet its stated objectives. The Fund’s holdings and allocations are subject to change because it is actively managed and should not be considered recommendations to buy individual securities. The Fund’s performance assumes the reinvestment of all dividends and all capital gains. Index returns assume reinvestment of dividends and, unlike the Fund’s returns, do not reflect any fees or expenses. If such fees and expenses were included in the index returns, the performance would have been lower. Please note that one cannot invest directly in an unmanaged index.
16
WESTWOOD SALIENT MLP & ENERGY INFRASTRUCTURE FUND (UNAUDITED)
Comparison of the Change in Value of a $100,000 Investment in Westwood Salient MLP & Energy
Infrastructure Fund - Institutional Class (a) versus the Alerian Midstream Energy Select Index
Average Annual Total Returns (b) (for the periods ended December 31, 2022) | |||||
| Since Inception | Since Inception | ||||
| 1 Year | 5 Year | 10 Year | (1/7/2013) | (1/4/2016) | |
| Institutional Shares | 17.22% | 2.76% | 2.12% | N/A | N/A |
| A Class Shares with sales charge | 10.57% | 1.36% | 1.32% | N/A | N/A |
| A Class Shares without sales charge | 17.00% | 2.53% | 1.90% | N/A | N/A |
| C Class Shares with CDSC | 14.98% | 1.73% | N/A | 0.71% | N/A |
| C Class Shares without CDSC | 15.98% | 1.73% | N/A | 0.71% | N/A |
| Ultra Shares | 17.12% | 2.84% | N/A | N/A | 6.12% |
| Alerian Midstream Energy Select Index | 19.15% | 5.28% | 5.82% | 5.45% | 9.27% |
| (a) | The graph is based on Institutional Shares. Performance for A Class Shares would have been lower because it is subject to a maximum front-end sales charge of 3.00% and additional annual distribution expenses of 0.25%. Performance for C Class Shares and Ultra Shares would vary due to differences in fee structures. |
| (b) | The Fund’s total returns do not reflect the deduction of taxes a shareholder would pay on Fund distributions or the redemption of Fund shares. If the Adviser had not limited certain expenses, the Fund’s total return would have been lower. |
The performance data quoted herein represents past performance and the return and value of an investment in the Fund will fluctuate so that, when redeemed, may be worth less than its original cost. Past performance is no guarantee of future performance and should not be considered as a representation of the future results of the Fund. There are no assurances that the Fund will meet its stated objectives. The Fund’s holdings and allocations are subject to change because it is actively managed and should not be considered recommendations to buy individual securities. The Fund’s performance assumes the reinvestment of all dividends and all capital gains. Index returns assume reinvestment of dividends and, unlike the Fund’s returns, do not reflect any fees or expenses. If such fees and expenses were included in the index returns, the performance would have been lower. Please note that one cannot invest directly in an unmanaged index.
17
WESTWOOD BROADMARK TACTICAL PLUS FUND (UNAUDITED)
Comparison of the Change in Value of a $100,000 Investment in Westwood Broadmark
Tactical Plus Fund - Institutional Class (a) versus the HFRX Equity Hedge Index
Average Annual Total Returns (b) (for the periods ended December 31, 2022) | |||
| 1 Year | 5 Year | 10 Year | |
| Institutional Shares | -1.95% | 4.17% | 5.40% |
| A Class Shares with sales charge | -7.57% | 2.75% | 4.57% |
| A Class Shares without sales charge | -2.18% | 3.91% | 5.16% |
| C Class Shares with CDSC | -3.72% | 3.14% | 4.37% |
| C Class Shares without CDSC | -2.82% | 3.14% | 4.37% |
| F Class Shares | -1.65% | 4.49% | 5.73% |
| HFRX Equity Hedge Index | -3.18% | 2.63% | 3.27% |
| S&P 500 Index | -18.11% | 9.42% | 12.56% |
| (a) | The graph is based on Institutional Shares. Performance for A Class Shares would have been lower because it is subject to a maximum front-end sales charge of 3.00% and additional annual distribution expenses of 0.25%. Performance for C Class Shares and F Class Shares would vary due to differences in fee structures. |
| (b) | The Fund’s total returns do not reflect the deduction of taxes a shareholder would pay on Fund distributions or the redemption of Fund shares. If the Adviser had not limited certain expenses, the Fund’s total return would have been lower. |
Institutional, A Class and C Class Shares of the Fund commenced operations on December 15, 2014. The returns prior to that date are those of an earlier iteration of the Fund, named Broadmark Tactical Plus Fund, which commenced operations on December 31, 2012. Performance for the period from December 31, 2012, to December 14, 2014, reflects the gross performance of the Investor Class shares of the predecessor fund adjusted to apply the fees and anticipated expenses of Institutional, A Class and C Class Shares of the Fund. All share classes of the Fund are invested in the same portfolio of
18
WESTWOOD BROADMARK TACTICAL PLUS FUND (UNAUDITED)
securities and returns only differ to the extent that fees and expenses of the classes are different. In the reorganization, Investor Class and Institutional Class Shares of the Broadmark Tactical Fund were exchanged for Class F Shares of the Salient Tactical Plus Fund.
The performance data quoted herein represents past performance and the return and value of an investment in the Fund will fluctuate so that, when redeemed, may be worth less than its original cost. Past performance is no guarantee of future performance and should not be considered as a representation of the future results of the Fund. There are no assurances that the Fund will meet its stated objectives. The Fund’s holdings and allocations are subject to change because it is actively managed and should not be considered recommendations to buy individual securities. The Fund’s performance assumes the reinvestment of all dividends and all capital gains. Index returns assume reinvestment of dividends and, unlike the Fund’s returns, do not reflect any fees or expenses. If such fees and expenses were included in the index returns, the performance would have been lower. Please note that one cannot invest directly in an unmanaged index.
19
| WESTWOOD SALIENT GLOBAL REAL ESTATE FUND |
| DECEMBER 31, 2022 |
| Sector Weightings (Unaudited)† |
| † | Percentages are based on total investments. |
| SCHEDULE OF INVESTMENTS |
| COMMON STOCKS — 95.5% |
| Shares | Value | |||||||
| United States — 46.1% | ||||||||
| Alexandria Real Estate Equities, Inc. | 4,700 | $ | 684,649 | |||||
| American Tower Corp. | 2,000 | 423,720 | ||||||
| Americold Realty Trust, Inc. | 24,200 | 685,102 | ||||||
| Apple Hospitality REIT, Inc. | 45,000 | 710,100 | ||||||
| CubeSmart | 13,000 | 523,250 | ||||||
| DiamondRock Hospitality Co. | 20,000 | 163,800 | ||||||
| Digital Realty Trust, Inc. | 4,000 | 401,080 | ||||||
| Equinix, Inc. | 1,000 | 655,030 | ||||||
| Farmland Partners, Inc. | 30,000 | 373,800 | ||||||
| Federal Realty Investment Trust | 7,000 | 707,280 | ||||||
| Gaming and Leisure Properties, Inc. | 11,500 | 599,035 | ||||||
| Independence Realty Trust, Inc. | 25,000 | 421,500 | ||||||
| National Storage Affiliates Trust | 12,000 | 433,440 | ||||||
| PotlatchDeltic Corp. | 7,800 | 343,122 | ||||||
| Prologis, Inc. | 5,500 | 620,015 | ||||||
| Retail Opportunity Investments Corp. | 55,000 | 826,650 | ||||||
| Ventas, Inc. | 7,500 | 337,875 | ||||||
| VICI Properties, Inc. | 10,000 | 324,000 | ||||||
| 9,233,448 | ||||||||
| Singapore — 4.6% | ||||||||
| CapitaLand Integrated Commercial Trust | 60,786 | 92,712 | ||||||
| CapitaLand Investment, Ltd. | 300,000 | 829,108 | ||||||
| 921,820 | ||||||||
| France — 3.3% | ||||||||
| Gecina S.A. | 6,500 | 662,423 | ||||||
| COMMON STOCKS — continued |
| Shares | Value | |||||||
| Australia — 4.2% | ||||||||
| GPT Group (The) | 190,000 | $ | 541,828 | |||||
| Scentre Group | 154,000 | 299,740 | ||||||
| 841,568 | ||||||||
| Canada — 6.9% | ||||||||
| Granite Real Estate Investment Trust | 11,300 | 576,538 | ||||||
| Summit Industrial Income REIT | 47,500 | 796,023 | ||||||
| 1,372,561 | ||||||||
| United Kingdom — 2.8% | ||||||||
| Great Portland Estates Ltd. | 43,500 | 259,240 | ||||||
| Segro PLC | 32,700 | 301,142 | ||||||
| 560,382 | ||||||||
| Hong Kong — 5.7% | ||||||||
| Henderson Land Development Co., Ltd. | 63,000 | 219,312 | ||||||
| Link REIT | 43,000 | 314,641 | ||||||
| Sun Hung Kai Properties, Ltd. | 30,000 | 409,775 | ||||||
| Swire Properties, Ltd. | 76,000 | 192,497 | ||||||
| 1,136,225 | ||||||||
| Sweden — 1.3% | ||||||||
| Hufvudstaden AB - Class A | 18,300 | 260,538 | ||||||
| Spain — 6.1% | ||||||||
| Inmobiliaria Colonial S.A. | 95,000 | 611,250 | ||||||
| Merlin Properties Socimi S.A. | 65,000 | 609,816 | ||||||
| 1,221,066 | ||||||||
| Japan — 12.9% | ||||||||
| Mitsubishi Estate Co., Ltd. | 50,600 | 655,346 | ||||||
| Mitsui Fudosan Co., Ltd. | 38,000 | 694,414 | ||||||
| Sumitomo Realty & Development Co., Ltd. | 27,000 | 636,233 | ||||||
| Tokyo Tatemono Co., Ltd. | 49,500 | 599,168 | ||||||
| 2,585,161 | ||||||||
| Germany — 1.6% | ||||||||
| Vonovia SE | 14,000 | 329,891 | ||||||
| Total Common Stocks | ||||||||
| (Cost $20,401,432) | $ | 19,125,083 | ||||||
The accompanying notes are an integral part of the financial statements.
20
| WESTWOOD SALIENT GLOBAL REAL ESTATE FUND |
| DECEMBER 31, 2022 |
| MONEY MARKET FUNDS — 4.0% |
| Shares | Value | |||||||
| First American Government Obligations Fund - Class X, 4.09% (a) (Cost $800,067) | 800,067 | $ | 800,067 | |||||
| Investments at Value — 99.5% | ||||||||
| (Cost $21,201,499) | $ | 19,925,150 | ||||||
| Other Assets in Excess of Liabilities — 0.5% | 102,240 | |||||||
| Net Assets — 100.0% | $ | 20,027,390 | ||||||
| (a) | The rate shown is the 7-day effective yield as of December 31, 2022. |
AB - Aktiebolag
S.A. - Societe Anonyme
SE - Societe Europaea
The accompanying notes are an integral part of the financial statements.
21
| WESTWOOD SALIENT SELECT INCOME FUND |
| DECEMBER 31, 2022 |
| Sector Weightings (Unaudited)† |
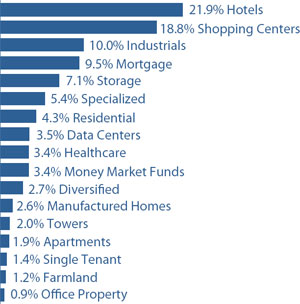
| † | Percentages are based on total investments. |
| SCHEDULE OF INVESTMENTS |
| COMMON STOCKS — 21.9% |
| Shares | Value | |||||||
| Real Estate Investment Trusts (REITs) — 21.9% | ||||||||
| Farmland — 1.2% | ||||||||
| Farmland Partners, Inc. | 200,000 | $ | 2,492,000 | |||||
| �� | ||||||||
| Hotels — 4.7% | ||||||||
| Apple Hospitality REIT, Inc. | 320,000 | 5,049,600 | ||||||
| Gaming and Leisure Properties, Inc. | 100,100 | 5,214,209 | ||||||
| 10,263,809 | ||||||||
| Industrial — 4.2% | ||||||||
| Americold Realty Trust, Inc. | 145,000 | 4,104,950 | ||||||
| Prologis, Inc. | 45,000 | 5,072,850 | ||||||
| 9,177,800 | ||||||||
| Manufactured Homes — 2.1% | ||||||||
| Sun Communities, Inc. | 32,000 | 4,576,000 | ||||||
| Shopping Centers — 3.9% | ||||||||
| Phillips Edison & Co., Inc. | 80,000 | 2,547,200 | ||||||
| Retail Opportunity Investments Corp. | 397,000 | 5,966,910 | ||||||
| 8,514,110 | ||||||||
| Specialized — 1.0% | ||||||||
| Outfront Media, Inc. | 136,000 | 2,254,880 | ||||||
| Storage — 2.9% | ||||||||
| CubeSmart | 110,000 | 4,427,500 | ||||||
| National Storage Affiliates Trust | 50,000 | 1,806,000 | ||||||
| 6,233,500 | ||||||||
| COMMON STOCKS — continued |
| Shares | Value | |||||||
| Real Estate Investment Trusts (REITs) — continued | ||||||||
| Towers — 1.9% | ||||||||
| American Tower Corp. | 20,000 | $ | 4,237,200 | |||||
| Total Common Stocks | ||||||||
| (Cost $50,012,573) | $ | 47,749,299 | ||||||
| PREFERRED STOCKS — 72.7% | ||||||||
| Real Estate Investment Trusts (REITs) — 72.7% | ||||||||
| Apartments — 1.8% | ||||||||
| Centerspace - Series C, 6.63% | 158,980 | $ | 4,014,245 | |||||
| Data Centers — 3.4% | ||||||||
| DigitalBridge Group, Inc. - Series H, 7.13% | 240,000 | 4,535,976 | ||||||
| DigitalBridge Group, Inc. - Series I, 7.15% | 160,000 | 3,001,600 | ||||||
| 7,537,576 | ||||||||
| Diversified — 2.7% | ||||||||
| Armada Hoffler Properties, Inc. - Series A, 6.75% | 150,000 | 3,148,500 | ||||||
| CTO Realty Growth, Inc. - Series A, 6.38% | 133,683 | 2,733,817 | ||||||
| 5,882,317 | ||||||||
| Healthcare — 3.3% | ||||||||
| Global Medical REIT, Inc. - Series A, 7.50% | 290,000 | 7,284,800 | ||||||
| Hotels — 16.7% | ||||||||
| Chatham Lodging Trust - Series A, 6.63% | 190,000 | 3,807,600 | ||||||
| DiamondRock Hospitality Co. - Series A, 8.25% | 15,096 | 375,589 | ||||||
| Hersha Hospitality Trust - Series C, 6.88% | 260,000 | 5,190,900 | ||||||
| Hersha Hospitality Trust - Series D, 6.50% | 50,000 | 935,250 | ||||||
| Hersha Hospitality Trust - Series E, 6.50% | 275,000 | 5,087,500 | ||||||
| Pebblebrook Hotel Trust - Series G, 6.38% | 205,000 | 3,731,000 | ||||||
| Pebblebrook Hotel Trust - Series H, 5.70% | 90,148 | 1,487,442 | ||||||
| RLJ Lodging Trust - Series A, 1.95% | 390,000 | 9,278,100 | ||||||
| Summit Hotel Properties, Inc. - Series E, 6.250% | 222,386 | 4,065,216 | ||||||
| Summit Hotel Properties, Inc. - Series F, 5.875% | 151,000 | 2,586,630 | ||||||
| 36,545,227 | ||||||||
The accompanying notes are an integral part of the financial statements.
22
| WESTWOOD SALIENT SELECT INCOME FUND |
| DECEMBER 31, 2022 |
| PREFERRED STOCKS — continued |
| Shares | Value | |||||||
| Real Estate Investment Trusts (REITs) — continued | ||||||||
| Industrial — 5.6% | ||||||||
| LXP Industrial Trust - Series C, 6.50% | 205,514 | $ | 9,761,915 | |||||
| Plymouth Industrial REIT, Inc. - Series A, 7.50% | 100,000 | 2,498,000 | ||||||
| 12,259,915 | ||||||||
| Manufactured Homes — 0.5% | ||||||||
| UMH Properties, Inc. - Series D, 6.38% | 48,692 | 1,083,397 | ||||||
| Mortgage — 9.3% | ||||||||
| iStar, Inc. - Series D, 8.00% | 27,100 | 671,809 | ||||||
| iStar, Inc. - Series G, 7.65% | 400,000 | 9,812,000 | ||||||
| iStar, Inc. - Series I, 7.50% | 300,200 | 7,342,892 | ||||||
| KKR Real Estate Finance Trust, Inc. - Series A, 6.50% | 150,000 | 2,475,000 | ||||||
| 20,301,701 | ||||||||
| Office Property — 0.9% | ||||||||
| Hudson Pacific Properties - Series C, 4.80% | 42,625 | 534,091 | ||||||
| Vornado Realty Trust - Series M, 5.25% | 25,000 | 401,500 | ||||||
| Vornado Realty Trust - Series N, 5.25% | 60,500 | 982,520 | ||||||
| 1,918,111 | ||||||||
| Residential — 4.3% | ||||||||
| American Homes 4 Rent - Series G, 5.88% | 345,000 | 7,645,200 | ||||||
| American Homes 4 Rent - Series H, 6.25% | 71,000 | 1,649,039 | ||||||
| 9,294,239 | ||||||||
| Shopping Centers — 14.5% | ||||||||
| RPT Realty - Series D, 7.25% | 185,000 | 9,246,300 | ||||||
| Saul Centers, Inc. - Series D, 6.13% | 380,000 | 7,942,000 | ||||||
| Saul Centers, Inc. - Series E, 6.00% | 125,000 | 2,461,250 | ||||||
| Site Centers Corporation - Series A, 6.60% | 25,000 | 555,000 | ||||||
| Urstadt Biddle Properties, Inc. - Series H, 6.25% | 345,000 | 7,534,800 | ||||||
| Urstadt Biddle Properties, Inc. - Series K, 5.88% | 190,000 | 3,891,200 | ||||||
| 31,630,550 | ||||||||
| Single Tenant — 1.3% | ||||||||
| Spirit Realty Capital, Inc. - Series A, 6.00% | 130,000 | 2,892,500 | ||||||
| PREFERRED STOCKS — continued |
| Shares | Value | |||||||
| Real Estate Investment Trusts (REITs) — continued | ||||||||
| Specialized — 4.3% | ||||||||
| CorEnergy Infrastructure Trust, Inc. - Series A, 7.38% | 141,481 | $ | 1,612,884 | |||||
| EPR Properties - Series C, 5.75% | 31,000 | 557,070 | ||||||
| EPR Properties - Series E, 9.00% | 280,000 | 7,204,400 | ||||||
| 9,374,354 | ||||||||
| Storage — 4.1% | ||||||||
| National Storage Affiliates Trust - Series A, 6.00% | 400,000 | 8,942,000 | ||||||
| Total Preferred Stocks | ||||||||
| (Cost $155,660,808) | $ | 158,960,932 | ||||||
| MONEY MARKET FUNDS — 3.3% | ||||||||
| First American Government Obligations Fund - Class X, 4.09% (a) (Cost $7,218,880) | 7,218,880 | $ | 7,218,880 | |||||
| Investments at Value — 97.9% | ||||||||
| (Cost $212,892,261) | $ | 213,929,111 | ||||||
| Other Assets in Excess of Liabilities — 2.1% | 4,552,519 | |||||||
| Net Assets — 100.0% | $ | 218,481,630 | ||||||
| (a) | The rate shown is the 7-day effective yield as of December 31, 2022. |
REIT - Real Estate Investment Trust
The accompanying notes are an integral part of the financial statements.
23
| WESTWOOD BROADMARK TACTICAL GROWTH FUND |
| DECEMBER 31, 2022 |
| SCHEDULE OF INVESTMENTS |
| EXCHANGE-TRADED FUNDS — 20.1% |
| Shares | Value | |||||||
| Consumer Staples Select Sector SPDR® Fund (The) | 183,084 | $ | 13,648,912 | |||||
| Health Care Select Sector SPDR® Fund (The) | 101,697 | 13,815,538 | ||||||
| SPDR® Dow Jones Industrial Average ETF Trust | 39,992 | 13,250,549 | ||||||
| Utilities Select Sector SPDR® Fund (The) | 197,011 | 13,889,276 | ||||||
| Total Exchange-Traded Funds | ||||||||
| (Cost $53,420,648) | $ | 54,604,275 | ||||||
| MONEY MARKET FUNDS — 79.0% |
| Shares | Value | |||||||
| First American Government Obligations Fund - Class X, 4.09% (a) (Cost $214,244,298) | 214,244,298 | $ | 214,244,298 | |||||
| Investments at Value — 99.1% | ||||||||
| (Cost $267,664,946) | $ | 268,848,573 | ||||||
| Other Assets in Excess of Liabilities — 0.9% | 2,275,508 | |||||||
| Net Assets — 100.0% | $ | 271,124,081 | ||||||
| (a) | The rate shown is the 7-day effective yield as of December 31, 2022. |
ETF - Exchange-Traded Funds
S&P - Standard & Poor
SPDR - Standard and Poor’s Depository Receipts
| SCHEDULE OF FUTURES CONTRACTS SOLD SHORT |
| Value/ | ||||||||||||
| Expiration | Notional | Unrealized | ||||||||||
| FUTURES CONTRACTS SOLD SHORT ^ | Contracts | Date | Value | Depreciation* | ||||||||
| Index Futures | ||||||||||||
| E-Mini S&P® 500 Futures | 213 | 03/17/23 | $ | 41,119,650 | $ | (628,238 | ) | |||||
| * | Includes cumulative appreciation (depreciation) of futures contracts from the date that contracts were opened through December 31, 2022. Only current day variation margin is reported on the Statements of Assets and Liabilities. |
| ^ | Cash has been pledged as collateral for futures contracts held by the Fund. |
The accompanying notes are an integral part of the financial statements.
24
| WESTWOOD SALIENT MLP & ENERGY INFRASTRUCTURE FUND |
| DECEMBER 31, 2022 |
| Sector Weightings (Unaudited)† |
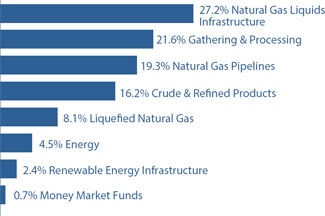
| † | Percentages are based on total investments. |
| SCHEDULE OF INVESTMENTS |
| MASTER LIMITED PARTNERSHIPS — 24.8% (a) |
| Shares | Value | |||||||
| Crude & Refined Products — 5.1% | ||||||||
| Genesis Energy LP | 907,055 | $ | 9,261,032 | |||||
| Magellan Midstream Partners LP | 186,412 | 9,359,746 | ||||||
| MPLX LP | 944,855 | 31,029,038 | ||||||
| 49,649,816 | ||||||||
| Gathering & Processing — 4.0% | ||||||||
| Crestwood Equity Partners LP | 361,053 | 9,455,978 | ||||||
| Western Midstream Partners LP | 1,105,695 | 29,687,911 | ||||||
| 39,143,889 | ||||||||
| Natural Gas Liquids Infrastructure — 15.7% | ||||||||
| Energy Transfer LP | 7,899,997 | 93,772,965 | ||||||
| Enterprise Products Partners LP | 2,480,601 | 59,832,096 | ||||||
| 153,605,061 | ||||||||
| Total Master Limited Partnerships | ||||||||
| (Cost $170,911,038) | $ | 242,398,766 | ||||||
| MLP RELATED COMPANIES — 74.3% | ||||||||
| Crude & Refined Products — 11.1% | ||||||||
| Enbridge, Inc. | 1,058,750 | $ | 41,397,125 | |||||
| Gibson Energy, Inc. | 786,425 | 13,730,999 | ||||||
| Plains GP Holdings LP - Class A | 4,294,627 | 53,425,160 | ||||||
| 108,553,284 | ||||||||
| Energy — 4.5% | ||||||||
| Array Technologies, Inc. (b) | 88,622 | 1,713,063 | ||||||
| DT Midstream, Inc. | 512,467 | 28,318,927 | ||||||
| Excelerate Energy, Inc. | 200,380 | 5,019,519 | ||||||
| EMG Utica I Offshore Co - Investment, LP (b)(c)(d)(e) | 16,000,000 | 9,092,368 | ||||||
| 44,143,877 | ||||||||
| MLP RELATED COMPANIES — continued |
| Shares | Value | |||||||
| Gathering & Processing — 17.6% | ||||||||
| Antero Midstream Corp. | 2,797,819 | $ | 30,188,467 | |||||
| EnLink Midstream, LLC (b) | 3,365,464 | 41,395,207 | ||||||
| Hess Midstream LP - Class A | 207,329 | 6,203,284 | ||||||
| Targa Resources Corp. | 1,280,564 | 94,121,454 | ||||||
| 171,908,412 | ||||||||
| Liquefied Natural Gas — 8.1% | ||||||||
| Cheniere Energy, Inc. | 502,318 | 75,327,607 | ||||||
| Tellurian, Inc. (b) | 2,106,360 | 3,538,685 | ||||||
| 78,866,292 | ||||||||
| Natural Gas Liquids Infrastructure — 11.4% | ||||||||
| Keyera Corp. | 1,117,246 | 24,416,935 | ||||||
| ONEOK, Inc. | 623,204 | 40,944,503 | ||||||
| Pembina Pipeline Corp. | 1,355,771 | 46,021,814 | ||||||
| 111,383,252 | ||||||||
| Natural Gas Pipelines — 19.3% | ||||||||
| Equitrans Midstream Corp. | 5,093,047 | 34,123,415 | ||||||
| Kinder Morgan, Inc. | 2,203,274 | 39,835,194 | ||||||
| TC Energy Corp. | 907,342 | 36,166,652 | ||||||
| Williams Cos., Inc. (The) | 2,384,619 | 78,453,965 | ||||||
| 188,579,226 | ||||||||
| Renewable Energy Infrastructure — 2.3% | ||||||||
| Bloom Energy Corp. - Class A (b) | 48,065 | 919,003 | ||||||
| First Solar, Inc. (b) | 14,471 | 2,167,611 | ||||||
| Plug Power, Inc. (b) | 330,071 | 4,082,978 | ||||||
| SolarEdge Technologies, Inc. (b) | 37,423 | 10,600,813 | ||||||
| Srunrun, Inc. (b) | 210,680 | 5,060,534 | ||||||
| 22,830,939 | ||||||||
| Total MLP Related Companies | ||||||||
| (Cost $542,667,800) | $ | 726,265,282 | ||||||
| SPECIAL PURPOSE ACQUISITION COMPANIES — 0.0%(f) | ||||||||
| Renewable Energy Infrastructure — 0.0% (f) | ||||||||
| TortoiseEcofin Acquisition Corp. III - Founder Shares (b)(c)(d)(e) | 104,850 | $ | 315 | |||||
| Total Special Purpose Acquisition Companies | ||||||||
| (Cost $315) | $ | 315 | ||||||
The accompanying notes are an integral part of the financial statements.
25
| WESTWOOD SALIENT MLP & ENERGY INFRASTRUCTURE FUND |
| DECEMBER 31, 2022 |
| MONEY MARKET FUNDS — 0.7% | ||||||||
| First American Government Obligations Fund - Class X, 4.09% (g) (Cost $6,829,088) | 6,829,088 | $ | 6,829,088 | |||||
| Investments at Value — 99.8% | ||||||||
| (Cost $720,408,241) | $ | 975,493,451 | ||||||
| Other Assets in Excess of Liabilities — 0.2% | 2,107,179 | |||||||
| Net Assets — 100.0% | $ | 977,600,629 | ||||||
| (a) | The security is considered a non-income producing security as any distributions received during the last 12 months (if applicable) are treated as return of capital per Generally Accepted Accounting Principles. |
| (b) | Non-income producing security. |
| (c) | Security determined to be illiquid under the procedures approved by the Fund’s Board of Trustees and represents 0.9% of net assets. |
| (d) | Level 3 security in accordance with fair value hierarchy. |
| (e) | These securities are exempt from registration under the Securities Act of 1933 and are subject to legal restrictions on resale. These securities generally may be resold in transactions exempt from registration, normally to qualified institutional buyers, or to the public if the securities are subsequently registered. |
| (f) | Percentage rounds to less than 0.1%. |
| (g) | The rate shown is the 7-day effective yield as of December 31, 2022. |
The accompanying notes are an integral part of the financial statements.
26
| WESTWOOD BROADMARK TACTICAL PLUS FUND |
| DECEMBER 31, 2022 |
| SCHEDULE OF INVESTMENTS |
| PURCHASED OPTION CONTRACTS — 0.1% |
| Strike | Notional | |||||||||||||||
| Price | Contracts | Value | Value | |||||||||||||
| Call Option Contracts — 0.1% | ||||||||||||||||
| S&P E-Mini 500 European Style Weekly Future Option, 01/06/23 | 3,950 | 105 | $ | 20,270,250 | $ | 45,938 | ||||||||||
| S&P E-Mini 500 European Style Weekly Future Option, 01/09/23 | 4,000 | 105 | 20,270,250 | 12,600 | ||||||||||||
| Total Purchased Option Contracts | ||||||||||||||||
| (Cost $99,265) | $ | 40,540,500 | $ | 58,538 | ||||||||||||
| MONEY MARKET FUNDS — 99.7% | ||||||||||||||||
| Shares | Value | |||||||
| First American Government Obligations Fund - Class X, 4.09% (a) (Cost $72,277,924) | 72,277,924 | $ | 72,277,924 | |||||
| Investments at Value — 99.8% | ||||||||
| (Cost $72,377,189) | $ | 72,336,462 | ||||||
| Other Assets in Excess of Liabilities — 0.2% | 128,221 | |||||||
| Net Assets — 100.0% | $ | 72,464,683 | ||||||
| (a) | The rate shown is the 7-day effective yield as of December 31, 2022. |
The accompanying notes are an integral part of the financial statements.
27
| WESTWOOD FUNDS |
| DECEMBER 31, 2022 |
| STATEMENTS OF ASSETS AND LIABILITIES |
| Westwood | ||||||||||||||||||||
| Westwood | Salient | Westwood | ||||||||||||||||||
| Westwood | Westwood | Broadmark | MLP & Energy | Broadmark | ||||||||||||||||
| Salient Global | Salient Select | Tactical | Infrastructure | Tactical | ||||||||||||||||
| Real Estate Fund | Income Fund | Growth Fund | Fund | Plus Fund | ||||||||||||||||
| ASSETS | ||||||||||||||||||||
| Investments in securities: | ||||||||||||||||||||
| At cost | $ | 21,201,499 | $ | 212,892,261 | $ | 267,664,946 | $ | 720,408,241 | $ | 72,377,189 | ||||||||||
| At value (Note 2) | $ | 19,925,150 | $ | 213,929,111 | $ | 268,848,573 | $ | 975,493,451 | $ | 72,336,462 | ||||||||||
| Foreign currency at value (Cost $8,567, $—, $—, $—, $—) | 8,567 | — | — | — | — | |||||||||||||||
| Cash collateral for futures short | — | — | 1,858,562 | — | — | |||||||||||||||
| Variation margin receivable | — | — | 114,487 | — | — | |||||||||||||||
| Receivable for capital shares sold | 686 | 24,184 | 654,371 | 4,811,689 | 1,919 | |||||||||||||||
| Receivable for investment securities sold | — | 2,895,998 | — | 9,664,694 | — | |||||||||||||||
| Dividends and interest receivable | 103,205 | 1,867,224 | 711,061 | 1,135,249 | 231,562 | |||||||||||||||
| Reclaims receivable | 23,948 | — | — | — | — | |||||||||||||||
| Other assets | 10,044 | 82,019 | 93,780 | 360,573 | 46,943 | |||||||||||||||
| Total assets | 20,071,600 | 218,798,536 | 272,280,834 | 991,465,656 | 72,616,886 | |||||||||||||||
| LIABILITIES | ||||||||||||||||||||
| Due to broker on options purchased | — | — | — | — | 13,576 | |||||||||||||||
| Payable for capital shares redeemed | 1,224 | 60,573 | 824,736 | 5,024,252 | — | |||||||||||||||
| Payable for investment securities purchased | — | — | — | 7,795,769 | 47,905 | |||||||||||||||
| Payable to Advisor, net of waivers (Note 4) | 7,654 | 131,994 | 252,021 | 757,298 | 60,349 | |||||||||||||||
| Payable to Administrator | 4,534 | 16,756 | 16,131 | 44,726 | 5,517 | |||||||||||||||
| Accrued administrative servicing fees — Institutional | ||||||||||||||||||||
| Shares | 220 | 9,313 | 19,749 | 83,839 | 3,296 | |||||||||||||||
| Accrued administrative servicing fees — Class A | 5,779 | 34,834 | 9,077 | 15,477 | 3,189 | |||||||||||||||
| Accrued administrative servicing fees — Class C | 462 | 2,663 | 3,274 | 5,329 | 123 | |||||||||||||||
| Payable for distribution fees — A Class Shares | 6,267 | 38,667 | 11,243 | 57,070 | 1,333 | |||||||||||||||
| Payable for distribution fees — C Class Shares | 1,142 | 6,882 | 9,367 | 19,780 | 739 | |||||||||||||||
| Other accrued expenses | 16,928 | 15,224 | 11,155 | 61,487 | 16,176 | |||||||||||||||
| Total liabilities | 44,210 | 316,906 | 1,156,753 | 13,865,027 | 152,203 | |||||||||||||||
| NET ASSETS | $ | 20,027,390 | $ | 218,481,630 | $ | 271,124,081 | $ | 977,600,629 | $ | 72,464,683 | ||||||||||
| NET ASSETS CONSIST OF: | ||||||||||||||||||||
| Paid-in capital | 45,477,285 | 220,090,967 | 270,985,081 | 1,460,112,426 | 73,165,292 | |||||||||||||||
| Distributable earnings (accumulated deficit) | (25,449,895 | ) | (1,609,337 | ) | 139,000 | (482,511,797 | ) | (700,609 | ) | |||||||||||
| NET ASSETS | $ | 20,027,390 | $ | 218,481,630 | $ | 271,124,081 | $ | 977,600,629 | $ | 72,464,683 | ||||||||||
| NET ASSET VALUE PER SHARE: | ||||||||||||||||||||
| INSTITUTIONAL SHARES | ||||||||||||||||||||
| Net assets applicable to Institutional Shares | $ | 2,630,763 | $ | 108,852,817 | $ | 236,180,663 | $ | 779,842,993 | $ | 34,426,662 | ||||||||||
| Institutional Shares of beneficial interest outstanding | 226,258 | 6,260,069 | 9,060,272 | 106,856,009 | 3,048,356 | |||||||||||||||
| Net asset value, offering price and redemption price per share (Note 1) | $ | 11.63 | $ | 17.39 | $ | 26.07 | $ | 7.30 | $ | 11.29 | ||||||||||
| A CLASS SHARES | ||||||||||||||||||||
| Net assets applicable to A Class Shares | $ | 16,335,140 | $ | 103,949,605 | $ | 27,116,541 | $ | 151,353,255 | $ | 584,008 | ||||||||||
| A Class Shares of beneficial interest outstanding | 1,399,115 | 5,955,467 | 1,115,305 | 20,630,522 | 52,687 | |||||||||||||||
| Net asset value, offering price and redemption price per share (Note 1) | $ | 11.68 | $ | 17.45 | $ | 24.31 | $ | 7.34 | $ | 11.08 | ||||||||||
| Maximum sales charge | 3.00 | % | 3.00 | % | 3.00 | % | 3.00 | % | 3.00 | % | ||||||||||
| Maximum offering price per share | $ | 12.04 | $ | 17.99 | $ | 25.06 | $ | 7.57 | $ | 11.42 | ||||||||||
The accompanying notes are an integral part of the financial statements.
28
| WESTWOOD FUNDS |
| DECEMBER 31, 2022 |
| STATEMENTS OF ASSETS AND LIABILITIES (CONTINUED) |
| Westwood | ||||||||||||||||||||
| Westwood | Salient | Westwood | ||||||||||||||||||
| Westwood | Westwood | Broadmark | MLP & Energy | Broadmark | ||||||||||||||||
| Salient Global | Salient Select | Tactical | Infrastructure | Tactical | ||||||||||||||||
| Real Estate Fund | Income Fund | Growth Fund | Fund | Plus Fund | ||||||||||||||||
| C CLASS SHARES | ||||||||||||||||||||
| Net assets applicable to C Class Shares | $ | 1,061,487 | $ | 5,679,208 | $ | 7,826,877 | $ | 15,694,113 | $ | 414,275 | ||||||||||
| C Class Shares of beneficial interest outstanding | 91,227 | 336,710 | 349,418 | 2,149,086 | 39,999 | |||||||||||||||
| Net asset value, offering price and redemption price per share (Note 1) | $ | 11.64 | $ | 16.87 | $ | 22.40 | $ | 7.30 | $ | 10.36 | ||||||||||
| F CLASS SHARES | ||||||||||||||||||||
| Net assets applicable to F Class Shares | N/A | N/A | N/A | N/A | $ | 37,039,738 | ||||||||||||||
| F Class Shares of beneficial interest outstanding | N/A | N/A | N/A | N/A | 3,205,631 | |||||||||||||||
| Net asset value, offering price and redemption price per share (Note 1) | N/A | N/A | N/A | N/A | $ | 11.55 | ||||||||||||||
| ULTRA CLASS SHARES | ||||||||||||||||||||
| Net assets applicable to Ultra Class Shares | N/A | N/A | N/A | $ | 30,710,268 | N/A | ||||||||||||||
| Ultra Class Shares of beneficial interest outstanding | N/A | N/A | N/A | 4,206,138 | N/A | |||||||||||||||
| Net asset value, offering price and redemption price per share (Note 1) | N/A | N/A | N/A | $ | 7.30 | N/A | ||||||||||||||
Amounts designated as “—” are either $0 or have been rounded to $0.
N/A — Not Applicable
The accompanying notes are an integral part of the financial statements.
29
| WESTWOOD FUNDS |
| YEAR ENDED DECEMBER 31, 2022 |
| STATEMENTS OF OPERATIONS |
| Westwood | ||||||||||||||||||||
| Westwood | Salient | Westwood | ||||||||||||||||||
| Westwood | Westwood | Broadmark | MLP & Energy | Broadmark | ||||||||||||||||
| Salient Global | Salient Select | Tactical | Infrastructure | Tactical | ||||||||||||||||
| Real Estate Fund | Income Fund | Growth Fund | Fund | Plus Fund | ||||||||||||||||
| INVESTMENT INCOME | ||||||||||||||||||||
| Dividend income (net of foreign withholding tax of $37,130, $8,414, $—, $—, and $—, respectively) | $ | 810,835 | $ | 12,220,714 | $ | 1,624,952 | $ | — | $ | 717,141 | ||||||||||
| Distributions from master limited partnerships | — | — | — | 17,269,489 | — | |||||||||||||||
| Less return of capital on distributions | — | — | — | (17,269,489 | ) | — | ||||||||||||||
| Dividends from master limited partnership related companies (net of foreign withholding tax of $1,516,735) | — | — | — | 28,970,620 | — | |||||||||||||||
| Less return on capital on dividends | — | — | — | (11,926,108 | ) | — | ||||||||||||||
| Interest income | 95 | 894 | 2,176,678 | 1,176 | 497,919 | |||||||||||||||
| Other income | 2,714 | 31,600 | 30,068 | — | 582 | |||||||||||||||
| Total investment income | 813,644 | 12,253,208 | 3,831,698 | 17,045,688 | 1,215,642 | |||||||||||||||
| EXPENSES | ||||||||||||||||||||
| Investment management fees (Note 4) | 244,911 | 2,545,225 | 3,345,788 | 8,625,959 | 1,050,299 | |||||||||||||||
| Administration fees (Note 4) | 23,765 | 175,860 | 196,474 | 613,844 | 55,032 | |||||||||||||||
| Administrative service plan fees-Institutional (Note 4) | 1,682 | 68,168 | 134,656 | 507,752 | 29,718 | |||||||||||||||
| Administrative service plan fees-A Class (Note 4) | 39,557 | 224,509 | 44,257 | 79,553 | 425 | |||||||||||||||
| Administrative service plan fees-C Class (Note 4) | 3,678 | 22,554 | 20,730 | 51,969 | 1,555 | |||||||||||||||
| Administrative service plan fees-F Class (Note 4) | — | — | — | — | 38,433 | |||||||||||||||
| Administrative service plan fees-Investor Class | 823 | 12,639 | 13,493 | — | — | |||||||||||||||
| Distribution fees-A Class (Note 4) | 48,765 | 276,524 | 54,046 | 329,528 | 1,433 | |||||||||||||||
| Distribution fees-C Class (Note 4) | 10,609 | 64,177 | 61,090 | 137,082 | 3,766 | |||||||||||||||
| Distribution fees - Investor Class | 1,293 | 20,473 | 22,008 | — | — | |||||||||||||||
| Reorganization expenses (Note 8) | — | — | — | 830,218 | — | |||||||||||||||
| Legal fees | 14,163 | 154,555 | 220,698 | 182,952 | 37,228 | |||||||||||||||
| Trustees’ fees and expenses (Note 4) | 8,983 | 92,870 | 104,219 | 311,680 | 25,554 | |||||||||||||||
| Shareholder reporting services | 13,347 | 79,116 | 24,067 | 415,958 | 3,796 | |||||||||||||||
| Registration and filing fees | 61,212 | 81,282 | 80,456 | 141,603 | 66,448 | |||||||||||||||
| Compliance fees (Note 4) | 7,073 | 72,942 | 83,960 | 147,035 | 11,629 | |||||||||||||||
| Insurance expense | 6,027 | 61,972 | 71,147 | 167,546 | 15,523 | |||||||||||||||
| Borrowing costs (Note 2) | — | 229,396 | — | — | — | |||||||||||||||
| Postage and supplies | 24,613 | 83,021 | 27,479 | 69,338 | 15,098 | |||||||||||||||
| Transfer agent fees (Note 4) | 11,680 | 48,097 | 37,597 | 60,843 | 4,952 | |||||||||||||||
| Custody fees | 4,389 | 8,136 | 1,676 | 50,607 | 5,256 | |||||||||||||||
| Audit and tax service fees | 10,074 | 17,428 | 13,284 | — | 17,111 | |||||||||||||||
| ReFlow (Note 2) | — | — | — | 51,873 | — | |||||||||||||||
| Tax expense | — | — | — | 22,070 | — | |||||||||||||||
| Other expenses | 69,678 | 58,849 | 48,502 | 55,385 | 14,922 | |||||||||||||||
| Total expenses | 606,322 | 4,397,793 | 4,605,627 | 12,852,795 | 1,398,178 | |||||||||||||||
| Investment management fees reduced and expense reimbursements by the Advisor (Note 4) | (232,015 | ) | (986,426 | ) | — | — | (513,949 | ) | ||||||||||||
| Net expenses | 374,307 | 3,411,367 | 4,605,627 | 12,852,795 | 884,229 | |||||||||||||||
| NET INVESTMENT INCOME (LOSS) | 439,337 | 8,841,841 | (773,929 | ) | 4,192,893 | 331,413 | ||||||||||||||
The accompanying notes are an integral part of the financial statements.
30
| WESTWOOD FUNDS |
| YEAR ENDED DECEMBER 31, 2022 |
| STATEMENTS OF OPERATIONS (CONTINUED) |
| Westwood | ||||||||||||||||||||
| Westwood | Salient | Westwood | ||||||||||||||||||
| Westwood | Westwood | Broadmark | MLP & Energy | Broadmark | ||||||||||||||||
| Salient Global | Salient Select | Tactical | Infrastructure | Tactical | ||||||||||||||||
| Real Estate Fund | Income Fund | Growth Fund | Fund | Plus Fund | ||||||||||||||||
| REALIZED AND UNREALIZED GAINS (LOSSES) ON INVESTMENTS | ||||||||||||||||||||
| Net realized gains (losses) from investment transactions and foreign translations | $ | (1,273,203 | ) | $ | (2,566,542 | ) | $ | 17,763,599 | $ | 2,148,265 | $ | (387,072 | ) | |||||||
| Net realized gains from options purchased | — | — | — | — | 2,042,238 | |||||||||||||||
| Net realized gains (losses) from options written | — | — | — | 1,283,377 | (212,296 | ) | ||||||||||||||
| Net realized losses from long futures contracts | — | — | — | — | (5,619,531 | ) | ||||||||||||||
| Net realized gains (losses) from short futures contracts | — | — | (3,384,975 | ) | — | 13,156,845 | ||||||||||||||
| Net change in unrealized appreciation (depreciation) on investment transactions and foreign currency translations | (5,505,436 | ) | (46,688,258 | ) | (39,614,284 | ) | 106,655,035 | (10,537,055 | ) | |||||||||||
| Net change in unrealized appreciation on options purchased | — | — | — | — | 40,727 | |||||||||||||||
| Net change in unrealized depreciation on long futures contracts | — | — | 628,238 | — | — | |||||||||||||||
| Net change in unrealized depreciation on short futures contracts | — | — | — | — | (26,183 | ) | ||||||||||||||
| NET REALIZED AND UNREALIZED GAINS (LOSSES) ON INVESTMENTS | (6,778,639 | ) | (49,254,800 | ) | (24,607,422 | ) | 110,086,677 | (1,542,327 | ) | |||||||||||
| NET INCREASE (DECREASE) IN NET ASSETS RESULTING FROM OPERATIONS | $ | (6,339,302 | ) | $ | (40,412,959 | ) | $ | (25,381,351 | ) | $ | 114,279,570 | $ | (1,210,914 | ) | ||||||
Amounts designated as “—” are either $0 or have been rounded to $0.
The accompanying notes are an integral part of the financial statements.
31
| WESTWOOD FUNDS |
| STATEMENTS OF CHANGES IN NET ASSETS |
| Westwood Salient | Westwood Salient | Westwood Broadmark | ||||||||||||||||||||||
| Global Real Estate Fund | Select Income Fund | Tactical Growth Fund | ||||||||||||||||||||||
| Year Ended | Year Ended | Year Ended | Year Ended | Year Ended | Year Ended | |||||||||||||||||||
| December 31, | December 31, | December 31, | December 31, | December 31, | December 31, | |||||||||||||||||||
| 2022 | 2021 | 2022 | 2021 | 2022 | 2021 | |||||||||||||||||||
| FROM OPERATIONS | ||||||||||||||||||||||||
| Net investment income (loss) | $ | 439,337 | $ | 240,771 | $ | 8,841,841 | $ | 6,427,292 | $ | (773,929 | ) | $ | (2,855,140 | ) | ||||||||||
| Net realized gains (losses) from investments and foreign currency transactions | (1,273,203 | ) | 174,473 | (2,566,542 | ) | 24,820,465 | 14,378,624 | 16,348,249 | ||||||||||||||||
| Net change in unrealized appreciation (depreciation) on investments and foreign currency translations | (5,505,436 | ) | 5,125,236 | (46,688,258 | ) | 14,135,538 | (38,986,046 | ) | 10,734,590 | |||||||||||||||
| Net increase (decrease) in net assets resulting from operations | (6,339,302 | ) | 5,540,480 | (40,412,959 | ) | 45,383,295 | (25,381,351 | ) | 24,227,699 | |||||||||||||||
| DISTRIBUTIONS TO SHAREHOLDERS | ||||||||||||||||||||||||
| From distributable earnings | ||||||||||||||||||||||||
| Institutional Shares | (65,104 | ) | (108,043 | ) | (4,587,481 | ) | (3,428,866 | ) | (6,735,312 | ) | (10,496,224 | ) | ||||||||||||
| A Class Shares | (339,643 | ) | (610,288 | ) | (3,780,834 | ) | (2,483,810 | ) | (818,486 | ) | (814,205 | ) | ||||||||||||
| C Class Shares | (18,838 | ) | (40,167 | ) | (246,967 | ) | (286,856 | ) | (259,189 | ) | (374,154 | ) | ||||||||||||
| Investor Shares | (8,930 | ) | (20,156 | ) | (226,733 | ) | (184,886 | ) | — | (177,353 | ) | |||||||||||||
| From return of capital | ||||||||||||||||||||||||
| Institutional Shares | (9,386 | ) | — | (2,929,176 | ) | (5,123,177 | ) | — | — | |||||||||||||||
| A Class Shares | (50,743 | ) | — | (2,414,128 | ) | (3,711,472 | ) | — | — | |||||||||||||||
| C Class Shares | (2,716 | ) | — | (157,692 | ) | (428,613 | ) | — | — | |||||||||||||||
| Investor Shares | — | — | (144,772 | ) | (276,252 | ) | — | — | ||||||||||||||||
| Total distributions | (495,360 | ) | (778,654 | ) | (14,487,783 | ) | (15,923,932 | ) | (7,812,987 | ) | (11,861,936 | ) | ||||||||||||
| CAPITAL SHARE TRANSACTIONS | ||||||||||||||||||||||||
| Institutional Class | ||||||||||||||||||||||||
| Issued | 473,444 | 414,944 | 39,575,329 | 43,271,792 | 86,724,446 | 96,155,344 | ||||||||||||||||||
| Reinvestment of dividends | 70,414 | 104,585 | 7,217,721 | 8,154,990 | 6,717,078 | 10,465,590 | ||||||||||||||||||
| Redeemed | (736,257 | ) | (761,028 | ) | (54,098,954 | ) | (83,181,120 | ) | (129,638,672 | ) | (71,483,992 | ) | ||||||||||||
| Net increase (decrease) from Institutional Shares capital share transactions | (192,399 | ) | (241,499 | ) | (7,305,904 | ) | (31,754,338 | ) | (36,197,148 | ) | 35,136,942 | |||||||||||||
| A Class Class | ||||||||||||||||||||||||
| Issued | 1,082,573 | 1,291,792 | 5,804,611 | 18,328,003 | 5,969,905 | 8,716,333 | ||||||||||||||||||
| Shares exchanged from Investor Class | 375,371 | — | 7,912,733 | — | 7,335,253 | — | ||||||||||||||||||
| Reinvestment of dividends | 364,099 | 564,285 | 4,946,000 | 4,838,092 | 772,858 | 773,116 | ||||||||||||||||||
| Redeemed | (3,395,911 | ) | (2,570,791 | ) | (17,663,523 | ) | (33,400,624 | ) | (6,388,881 | ) | (6,065,762 | ) | ||||||||||||
| Net increase (decrease) from A Class Shares capital share transactions | (1,573,868 | ) | (714,714 | ) | 999,821 | (10,234,529 | ) | 7,689,135 | 3,423,687 | |||||||||||||||
| C Class Class | ||||||||||||||||||||||||
| Issued | 302,955 | 106,188 | 382,301 | 514,009 | 2,036,277 | 2,550,113 | ||||||||||||||||||
| Reinvestment of dividends | 17,334 | 33,904 | 367,092 | 646,337 | 254,902 | 368,966 | ||||||||||||||||||
| Redeemed | (440,370 | ) | (1,525,360 | ) | (4,470,668 | ) | (21,139,784 | ) | (2,514,488 | ) | (6,059,263 | ) | ||||||||||||
| Net decrease from C Class Shares capital share transactions | (120,081 | ) | (1,385,268 | ) | (3,721,275 | ) | (19,979,438 | ) | (223,309 | ) | (3,140,184 | ) | ||||||||||||
| Investor Class | ||||||||||||||||||||||||
| Issued | 135,493 | 156,900 | 2,676,209 | 2,773,196 | 22,511,744 | 1,820,343 | ||||||||||||||||||
| Reinvestment of dividends | 8,318 | 19,694 | 365,958 | 454,320 | — | 173,502 | ||||||||||||||||||
| Redeemed | (342,437 | ) | (258,683 | ) | (3,295,504 | ) | (3,209,882 | ) | (19,381,817 | ) | (5,449,827 | ) | ||||||||||||
| Shares exchanged to A Class | (375,371 | ) | — | (7,912,733 | ) | — | (7,335,253 | ) | — | |||||||||||||||
| Net increase (decrease) from Investor Shares capital share transactions | (573,997 | ) | (82,089 | ) | (8,166,070 | ) | 17,634 | (4,205,326 | ) | (3,455,982 | ) | |||||||||||||
| Net increase (decrease) in net assets from capital share transactions | (2,460,345 | ) | (2,423,570 | ) | (18,193,428 | ) | (61,950,671 | ) | (32,936,648 | ) | 31,964,463 | |||||||||||||
| TOTAL INCREASE (DECREASE) IN NET ASSETS | (9,295,007 | ) | 2,338,256 | (73,094,170 | ) | (32,491,308 | ) | (66,130,986 | ) | 44,330,226 | ||||||||||||||
Amounts designated as “—” are either $0 or have been rounded to $0.
The accompanying notes are an integral part of the financial statements.
32
| WESTWOOD FUNDS |
| STATEMENTS OF CHANGES IN NET ASSETS (CONTINUED) |
| Westwood Salient | Westwood Salient | Westwood Broadmark | ||||||||||||||||||||||
| Global Real Estate Fund | Select Income Fund | Tactical Growth Fund | ||||||||||||||||||||||
| Year Ended | Year Ended | Year Ended | Year Ended | Year Ended | Year Ended | |||||||||||||||||||
| December 31, | December 31, | December 31, | December 31, | December 31, | December 31, | |||||||||||||||||||
| 2022 | 2021 | 2022 | 2021 | 2022 | 2021 | |||||||||||||||||||
| NET ASSETS | ||||||||||||||||||||||||
| Beginning of year | $ | 29,322,397 | $ | 26,984,141 | $ | 291,575,800 | $ | 324,067,108 | $ | 337,255,067 | $ | 292,924,841 | ||||||||||||
| End of year | $ | 20,027,390 | $ | 29,322,397 | $ | 218,481,630 | $ | 291,575,800 | $ | 271,124,081 | $ | 337,255,067 | ||||||||||||
| CAPITAL SHARES ACTIVITY | ||||||||||||||||||||||||
| Institutional Shares | ||||||||||||||||||||||||
| Sold | 37,995 | 28,202 | 1,999,336 | 2,089,167 | 3,163,746 | 3,273,057 | ||||||||||||||||||
| Issued in reinvestment of dividends to shareholders | 5,798 | 7,120 | 393,116 | 388,814 | 257,656 | 360,385 | ||||||||||||||||||
| Redeemed | (59,582 | ) | (54,522 | ) | (2,798,890 | ) | (3,968,257 | ) | (4,698,546 | ) | (2,420,142 | ) | ||||||||||||
| Net increase (decrease) in shares outstanding | (15,789 | ) | (19,200 | ) | (406,438 | ) | (1,490,276 | ) | (1,277,144 | ) | 1,213,300 | |||||||||||||
| Shares outstanding at beginning of year | 242,047 | 261,247 | 6,666,507 | 8,156,783 | 10,337,416 | 9,124,116 | ||||||||||||||||||
| Shares outstanding at end of year | 226,258 | 242,047 | 6,260,069 | 6,666,507 | 9,060,272 | 10,337,416 | ||||||||||||||||||
| A Class Shares | ||||||||||||||||||||||||
| Sold | 83,390 | 88,662 | 293,830 | 875,778 | 238,306 | 314,725 | ||||||||||||||||||
| Issued in reinvestment of dividends to shareholders | 30,062 | 38,237 | 269,441 | 229,533 | 31,778 | 28,361 | ||||||||||||||||||
| Redeemed | (270,148 | ) | (177,337 | ) | (909,441 | ) | (1,593,127 | ) | (253,164 | ) | (218,561 | ) | ||||||||||||
| Shares issued in connection with exchange of Investor Class | 31,545 | — | 448,845 | — | 293,979 | — | ||||||||||||||||||
| Net increase (decrease) in shares outstanding | (125,151 | ) | (50,438 | ) | 102,675 | (487,816 | ) | 310,899 | 124,525 | |||||||||||||||
| Shares outstanding at beginning of year | 1,524,266 | 1,574,704 | 5,852,792 | 6,340,608 | 804,406 | 679,881 | ||||||||||||||||||
| Shares outstanding at end of year | 1,399,115 | 1,524,266 | 5,955,467 | 5,852,792 | 1,115,305 | 804,406 | ||||||||||||||||||
| C Class Shares | ||||||||||||||||||||||||
| Sold | 21,373 | 7,606 | 21,541 | 25,075 | 85,819 | 98,148 | ||||||||||||||||||
| Issued in reinvestment of dividends to shareholders | 1,441 | 2,334 | 20,451 | 31,900 | 11,369 | 14,572 | ||||||||||||||||||
| Redeemed | (35,931 | ) | (106,308 | ) | (241,088 | ) | (1,046,298 | ) | (105,134 | ) | (233,849 | ) | ||||||||||||
| Net decrease in shares outstanding | (13,117 | ) | (96,368 | ) | (199,096 | ) | (989,323 | ) | (7,946 | ) | (121,129 | ) | ||||||||||||
| Shares outstanding at beginning of year | 104,344 | 200,712 | 535,806 | 1,525,129 | 357,364 | 478,493 | ||||||||||||||||||
| Shares outstanding at end of year | 91,227 | 104,344 | 336,710 | 535,806 | 349,418 | 357,364 | ||||||||||||||||||
| Investor Shares | ||||||||||||||||||||||||
| Sold | 9,405 | 10,264 | 135,787 | 133,760 | 861,114 | 64,592 | ||||||||||||||||||
| Issued in reinvestment of dividends to shareholders | 662 | 1,329 | 19,397 | 21,628 | — | 6,228 | ||||||||||||||||||
| Redeemed | (26,474 | ) | (17,624 | ) | (169,323 | ) | (156,790 | ) | (750,528 | ) | (192,643 | ) | ||||||||||||
| Shares exchanged for Class A Shares | (31,415 | ) | — | (450,660 | ) | — | (287,438 | ) | — | |||||||||||||||
| Net decrease in shares outstanding | (47,822 | ) | (6,031 | ) | (464,799 | ) | (1,402 | ) | (176,852 | ) | (121,823 | ) | ||||||||||||
| Shares outstanding at beginning of year | 47,822 | 53,853 | 464,799 | 466,201 | 176,852 | 298,675 | ||||||||||||||||||
| Shares outstanding at end of year | — | 47,822 | — | 464,799 | — | 176,852 | ||||||||||||||||||
Amounts designated as “—” are either $0 or have been rounded to $0.
The accompanying notes are an integral part of the financial statements.
33
| WESTWOOD FUNDS |
| STATEMENTS OF CHANGES IN NET ASSETS |
| Westwood Salient MLP & | Westwood Broadmark | |||||||||||||||
| Energy Infrastructure Fund | Tactical Plus Fund | |||||||||||||||
| Year Ended | Year Ended | Year Ended | Year Ended | |||||||||||||
| December 31, | December 31, | December 31, | December 31, | |||||||||||||
| 2022 | 2021 | 2022 | 2021 | |||||||||||||
| FROM OPERATIONS | ||||||||||||||||
| Net investment income (loss) | $ | 4,192,893 | $ | (2,133,086 | ) | $ | 331,413 | $ | (373,466 | ) | ||||||
| Net realized gains (losses) from investments and foreign currency transactions | 3,431,642 | 96,406,987 | 8,980,184 | (3,900,661 | ) | |||||||||||
| Net change in unrealized appreciation (depreciation) on investments and foreign currency translations | 106,655,035 | 28,969,212 | (10,522,511 | ) | 8,693,219 | |||||||||||
| Net increase (decrease) in net assets resulting from operations | 114,279,570 | 123,243,113 | (1,210,914 | ) | 4,419,092 | |||||||||||
| DISTRIBUTIONS TO SHAREHOLDERS | ||||||||||||||||
| From distributable earnings | ||||||||||||||||
| Institutional Shares | — | — | (2,385,920 | ) | — | |||||||||||
| A Class Shares | — | — | (40,913 | ) | — | |||||||||||
| C Class Shares | — | — | (30,908 | ) | — | |||||||||||
| Class F | — | — | (2,661,204 | ) | — | |||||||||||
| Ultra Shares | — | — | — | — | ||||||||||||
| From return of capital | ||||||||||||||||
| Institutional Shares | (32,026,521 | ) | (26,260,802 | ) | — | — | ||||||||||
| A Class Shares | (5,015,402 | ) | (4,040,628 | ) | — | — | ||||||||||
| C Class Shares | (573,190 | ) | (847,143 | ) | — | — | ||||||||||
| Ultra Shares | (1,453,169 | ) | (1,793,160 | ) | — | — | ||||||||||
| Total distributions | (39,068,282 | ) | (32,941,733 | ) | (5,118,945 | ) | — | |||||||||
| CAPITAL SHARE TRANSACTIONS | ||||||||||||||||
| Institutional Class (Class I) | ||||||||||||||||
| Issued | 326,083,981 | 224,048,662 | 8,068,184 | 4,305,694 | ||||||||||||
| Reinvestment of dividends | 28,139,077 | 24,435,455 | 2,385,919 | — | ||||||||||||
| Redeemed | (207,307,366 | ) | (145,032,539 | ) | (3,820,145 | ) | (5,625,426 | ) | ||||||||
| Net increase (decrease) from Institutional Shares capital share transactions | 146,915,692 | 103,451,578 | 6,633,958 | (1,319,732 | ) | |||||||||||
| A Class Shares | ||||||||||||||||
| Issued | 27,097,263 | 33,865,388 | 70,960 | 1,435 | ||||||||||||
| Proceeds from shares issued in connection with acquisition from Plan of Reorganization (Note 8) | 161,677,813 | — | — | — | ||||||||||||
| Reinvestment of dividends | 4,811,951 | 3,909,770 | 40,913 | — | ||||||||||||
| Redeemed | (137,702,835 | ) | (20,257,543 | ) | (53,076 | ) | (122,563 | ) | ||||||||
| Net increase (decrease) from A Class Shares capital share transactions | 55,884,192 | 17,517,615 | 58,797 | (121,128 | ) | |||||||||||
| C Class Shares | ||||||||||||||||
| Issued | 1,630,960 | 1,571,774 | 15 | — | ||||||||||||
| Reinvestment of dividends | 564,938 | 835,117 | 30,908 | — | ||||||||||||
| Redeemed | (6,447,136 | ) | (8,949,517 | ) | (123,653 | ) | (50,171 | ) | ||||||||
| Net decrease from C Class Shares capital share transactions | (4,251,238 | ) | (6,542,626 | ) | (92,730 | ) | (50,171 | ) | ||||||||
| F Class Shares | ||||||||||||||||
| Issued | N/A | N/A | 5,280,910 | 3,523,366 | ||||||||||||
| Reinvestment of dividends | N/A | N/A | 2,661,204 | — | ||||||||||||
| Redeemed | N/A | N/A | (7,164,813 | ) | (4,743,179 | ) | ||||||||||
| Net increase (decrease) from Ultra Shares capital share transactions | N/A | N/A | 777,301 | (1,219,813 | ) | |||||||||||
| Ultra Class (R6) | ||||||||||||||||
| Issued | 1,425,412 | 609,019 | N/A | N/A | ||||||||||||
| Reinvestment of dividends | 572,600 | 654,281 | N/A | N/A | ||||||||||||
| Redeemed | (4,533,909 | ) | (10,455,713 | ) | N/A | N/A | ||||||||||
| Net decrease from Ultra Shares capital share transactions | (2,535,897 | ) | (9,192,413 | ) | N/A | N/A | ||||||||||
| Net increase (decrease) in net assets from capital share transactions | 196,012,749 | 105,234,154 | 7,377,326 | (2,710,844 | ) | |||||||||||
| TOTAL INCREASE IN NET ASSETS | 271,224,037 | 195,535,534 | 1,047,467 | 1,708,248 | ||||||||||||
Amounts designated as “—” are either $0 or have been rounded to $0.
N/A — Not Applicable.
The accompanying notes are an integral part of the financial statements.
34
| WESTWOOD FUNDS |
| STATEMENTS OF CHANGES IN NET ASSETS (CONTINUED) |
| Westwood Salient MLP & | Westwood Broadmark | |||||||||||||||
| Energy Infrastructure Fund | Tactical Plus Fund | |||||||||||||||
| Year Ended | Year Ended | Year Ended | Year Ended | |||||||||||||
| December 31, | December 31, | December 31, | December 31, | |||||||||||||
| 2022 | 2021 | 2022 | 2021 | |||||||||||||
| NET ASSETS | ||||||||||||||||
| Beginning of year | $ | 706,376,592 | $ | 510,841,058 | $ | 71,417,216 | $ | 69,708,968 | ||||||||
| End of year | $ | 977,600,629 | $ | 706,376,592 | $ | 72,464,683 | $ | 71,417,216 | ||||||||
| CAPITAL SHARES ACTIVITY | ||||||||||||||||
| Institutional Shares (Class I) | ||||||||||||||||
| Sold | 44,603,290 | 34,386,843 | 659,284 | 361,232 | ||||||||||||
| Issued in reinvestment of dividends to shareholders | 3,777,997 | 3,752,896 | 211,143 | — | ||||||||||||
| Redeemed | (28,712,439 | ) | (22,514,866 | ) | (317,193 | ) | (466,880 | ) | ||||||||
| Net increase (decrease) in shares outstanding | 19,668,848 | 15,624,873 | 553,234 | (105,648 | ) | |||||||||||
| Shares outstanding at beginning of year | 87,187,161 | 71,562,288 | 2,495,122 | 2,600,770 | ||||||||||||
| Shares outstanding at end of year | 106,856,009 | 87,187,161 | 3,048,356 | 2,495,122 | ||||||||||||
| A Class Shares | ||||||||||||||||
| Sold | 3,635,503 | 5,106,023 | 5,931 | 121 | ||||||||||||
| Proceeds from shares issued in connection with acquisition from Plan of Reorganization (Note 8) | 21,251,027 | — | — | — | ||||||||||||
| Issued in reinvestment of dividends to shareholders | 641,659 | 598,854 | 3,689 | — | ||||||||||||
| Redeemed | (18,980,423 | ) | (3,140,571 | ) | (4,490 | ) | (10,644 | ) | ||||||||
| Net increase (decrease) in shares outstanding | 6,547,766 | 2,564,306 | 5,130 | (10,523 | ) | |||||||||||
| Shares outstanding at beginning of year | 14,082,756 | 11,518,450 | 47,557 | 58,080 | ||||||||||||
| Shares outstanding at end of year | 20,630,522 | 14,082,756 | 52,687 | 47,557 | ||||||||||||
| C Class Shares | ||||||||||||||||
| Sold | 225,461 | 246,162 | 1 | — | ||||||||||||
| Issued in reinvestment of dividends to shareholders | 76,445 | 129,072 | 2,983 | — | ||||||||||||
| Redeemed | (878,720 | ) | (1,368,593 | ) | (10,994 | ) | (4,432 | ) | ||||||||
| Net decrease in shares outstanding | (576,814 | ) | (993,359 | ) | (8,010 | ) | (4,432 | ) | ||||||||
| Shares outstanding at beginning of year | 2,725,900 | 3,719,259 | 48,009 | 52,441 | ||||||||||||
| Shares outstanding at end of year | 2,149,086 | 2,725,900 | 39,999 | 48,009 | ||||||||||||
| Class F | ||||||||||||||||
| Sold | N/A | N/A | 435,032 | 290,371 | ||||||||||||
| Issued in reinvestment of dividends to shareholders | N/A | N/A | 230,208 | — | ||||||||||||
| Redeemed | N/A | N/A | (577,435 | ) | (384,268 | ) | ||||||||||
| Net increase (decrease) in shares outstanding | N/A | N/A | 87,805 | (93,897 | ) | |||||||||||
| Shares outstanding at beginning of year | N/A | N/A | 3,117,826 | 3,211,723 | ||||||||||||
| Shares outstanding at end of year | N/A | N/A | 3,205,631 | 3,117,826 | ||||||||||||
| Ultra Shares (R6) | ||||||||||||||||
| Sold | 199,506 | 94,653 | N/A | N/A | ||||||||||||
| Issued in reinvestment of dividends to shareholders | 77,005 | 101,122 | N/A | N/A | ||||||||||||
| Redeemed | (627,149 | ) | (1,626,029 | ) | N/A | N/A | ||||||||||
| Net decrease in shares outstanding | (350,638 | ) | (1,430,254 | ) | N/A | N/A | ||||||||||
| Shares outstanding at beginning of year | 4,556,776 | 5,987,030 | N/A | N/A | ||||||||||||
| Shares outstanding at end of year | 4,206,138 | 4,556,776 | N/A | N/A | ||||||||||||
The accompanying notes are an integral part of the financial statements.
35
| WESTWOOD FUNDS |
| FINANCIAL HIGHLIGHTS |
| SELECTED PER SHARE DATA & RATIOS |
| FOR A SHARE OUTSTANDING THROUGHOUT THE YEAR |
| Net asset value, beginning of year | Net investment income(a) | Net realized and unrealized gains (losses) on investments | Total from investment operations | Dividends from net investment income | Distributions from net realized capital gains | Return of capital | ||||||||||||||||||||||
| Westwood Salient Global Real Estate Fund (1) | ||||||||||||||||||||||||||||
| Institutional Shares | ||||||||||||||||||||||||||||
| Year Ended December 31, 2022 | $ | 15.22 | 0.28 | (3.56 | ) | (3.28 | ) | (0.27 | ) | — | (0.04 | ) | ||||||||||||||||
| Year Ended December 31, 2021 | $ | 12.86 | 0.18 | 2.64 | 2.82 | (0.46 | ) | — | — | |||||||||||||||||||
| Year Ended December 31, 2020 | $ | 14.59 | 0.16 | (1.66 | ) | (1.50 | ) | (0.23 | ) | — | — | |||||||||||||||||
| Year Ended December 31, 2019 | $ | 12.33 | 0.22 | 2.40 | 2.62 | (0.36 | ) | — | — | |||||||||||||||||||
| Year Ended December 31, 2018 | $ | 14.68 | 0.28 | (1.72 | ) | (1.44 | ) | (0.79 | ) | — | (0.12 | ) | ||||||||||||||||
| A Class Shares | ||||||||||||||||||||||||||||
| Year Ended December 31, 2022 | $ | 15.29 | 0.23 | (3.57 | ) | (3.34 | ) | (0.24 | ) | — | (0.03 | ) | ||||||||||||||||
| Year Ended December 31, 2021 | $ | 12.92 | 0.12 | 2.65 | 2.77 | (0.40 | ) | — | — | |||||||||||||||||||
| Year Ended December 31, 2020 | $ | 14.65 | 0.12 | (1.68 | ) | (1.56 | ) | (0.17 | ) | — | — | |||||||||||||||||
| Year Ended December 31, 2019 | $ | 12.38 | 0.17 | 2.40 | 2.57 | (0.30 | ) | — | — | |||||||||||||||||||
| Year Ended December 31, 2018 | $ | 14.75 | 0.23 | (1.73 | ) | (1.50 | ) | (0.76 | ) | — | (0.11 | ) | ||||||||||||||||
| C Class Shares | ||||||||||||||||||||||||||||
| Year Ended December 31, 2022 | $ | 15.25 | 0.16 | (3.56 | ) | (3.40 | ) | (0.18 | ) | — | (0.03 | ) | ||||||||||||||||
| Year Ended December 31, 2021 | $ | 12.88 | 0.03 | 2.66 | 2.69 | (0.32 | ) | — | — | |||||||||||||||||||
| Year Ended December 31, 2020 | $ | 14.59 | 0.05 | (1.65 | ) | (1.60 | ) | (0.11 | ) | — | — | |||||||||||||||||
| Year Ended December 31, 2019 | $ | 12.31 | 0.07 | 2.41 | 2.48 | (0.20 | ) | — | — | |||||||||||||||||||
| Year Ended December 31, 2018 | $ | 14.73 | 0.13 | (1.73 | ) | (1.60 | ) | (0.71 | ) | — | (0.11 | ) | ||||||||||||||||
Amounts designated as “—” are $0 or rounded to $0.
| (a) | Per share net income has been determined on the basis of average number of shares outstanding during the period. |
| (b) | Total return is a measure of the change in value of an investment in the Fund over the period covered. The returns shown do not reflect the deduction of taxes a shareholder would pay on Fund distributions, if any or the redemption of Fund shares. The total returns would be lower if the Adviser had not reduced investment management fees and/or reimbursed expenses (Note 4). |
| (c) | Ratio was determined after investment management fee reductions and/or reimbursed expenses (Note 4). |
| (d) | Portfolio turnover rate is calculated on the basis of the Fund as a whole without distinguishing between classes of shares issued. |
| (e) | Effective August 21, 2018, the Advisor agreed to limit expenses to 1.15%. |
| (f) | Effective August 21, 2018, the Advisor agreed to limit expenses to 1.55%. |
| (g) | Effective August 21, 2018, the Advisor agreed to limit expenses to 2.10%. |
| (1) | Prior to November 18, 2022, Westwood Salient Global Real Estate Fund was known as Salient Global Real Estate Fund. Prior to August 14, 2018 Salient Global Estate Fund was known as Salient International Real Estate Fund. |
The accompanying notes are an integral part of the financial statements.
36
| WESTWOOD FUNDS |
| FINANCIAL HIGHLIGHTS |
| SELECTED PER SHARE DATA & RATIOS |
| FOR A SHARE OUTSTANDING THROUGHOUT THE YEAR |
| Total distributions | Net asset value, end of year | Total return(b) | Net assets, end of year (000’s) | Ratio of total net expenses to average net assets(c) | Ratio of total gross expenses to average net assets | Ratio of net investment income to average net assets(c) | Portfolio turnover rate(d) | |||||||||||||||||||||||
| (0.31 | ) | $ | 11.63 | (21.61 | )% | $ | 2,631 | 1.14 | % | 2.09 | % | 2.17 | % | 29 | % | |||||||||||||||
| (0.46 | ) | $ | 15.22 | 22.09 | % | $ | 3,685 | 1.15 | % | 1.96 | % | 1.23 | % | 49 | % | |||||||||||||||
| (0.23 | ) | $ | 12.86 | (9.98 | )% | $ | 3,360 | 1.15 | % | 2.03 | % | 1.38 | % | 29 | % | |||||||||||||||
| (0.36 | ) | $ | 14.59 | 21.31 | % | $ | 6,793 | 1.15 | % | 1.71 | % | 1.54 | % | 21 | % | |||||||||||||||
| (0.91 | ) | $ | 12.33 | (10.51 | )% | $ | 8,600 | 1.65 | % (e) | 2.57 | % | 2.01 | % | 101 | % | |||||||||||||||
| (0.27 | ) | $ | 11.68 | (21.91 | )% | $ | 16,335 | 1.54 | % | 2.49 | % | 1.76 | % | 29 | % | |||||||||||||||
| (0.40 | ) | $ | 15.29 | 21.58 | % | $ | 23,312 | 1.55 | % | 2.36 | % | 0.83 | % | 49 | % | |||||||||||||||
| (0.17 | ) | $ | 12.92 | (10.36 | )% | $ | 20,341 | 1.55 | % | 2.43 | % | 1.02 | % | 29 | % | |||||||||||||||
| (0.30 | ) | $ | 14.65 | 20.82 | % | $ | 26,859 | 1.55 | % | 2.11 | % | 1.21 | % | 21 | % | |||||||||||||||
| (0.87 | ) | $ | 12.38 | (10.74 | )% | $ | 19,377 | 1.87 | % (f) | 3.04 | % | 1.66 | % | 101 | % | |||||||||||||||
| (0.21 | ) | $ | 11.64 | (22.33 | )% | $ | 1,061 | 2.09 | % | 3.04 | % | 1.22 | % | 29 | % | |||||||||||||||
| (0.32 | ) | $ | 15.25 | 20.95 | % | $ | 1,591 | 2.10 | % | 2.94 | % | 0.22 | % | 49 | % | |||||||||||||||
| (0.11 | ) | $ | 12.88 | (10.81 | )% | $ | 2,585 | 2.10 | % | 2.98 | % | 0.41 | % | 29 | % | |||||||||||||||
| (0.20 | ) | $ | 14.59 | 20.19 | % | $ | 4,614 | 2.10 | % | 2.67 | % | 0.51 | % | 21 | % | |||||||||||||||
| (0.82 | ) | $ | 12.31 | (11.51 | )% | $ | 11,888 | 2.51 | % (g) | 3.64 | % | 0.96 | % | 101 | % | |||||||||||||||
The accompanying notes are an integral part of the financial statements.
37
| WESTWOOD FUNDS |
| FINANCIAL HIGHLIGHTS |
| SELECTED PER SHARE DATA & RATIOS |
| FOR A SHARE OUTSTANDING THROUGHOUT THE YEAR |
| Net asset value, beginning of year | Net investment income(a) | Net realized and unrealized gains (losses) on investments | Total from investment operations | Dividends from net investment income | Distributions from net realized capital gains | Return of capital | Total distributions | |||||||||||||||||||||||||
| Westwood Salient Select Income Fund (1) | ||||||||||||||||||||||||||||||||
| Institutional Shares | ||||||||||||||||||||||||||||||||
| Year Ended December 31, 2022 | $ | 21.56 | 0.70 | (3.71 | ) | (3.01 | ) | (0.71 | ) | — | (0.45 | ) | (1.16 | ) | ||||||||||||||||||
| Year Ended December 31, 2021 | $ | 19.68 | 0.46 | 3.19 | 3.65 | (1.11 | ) | — | (0.66 | ) | (1.77 | ) | ||||||||||||||||||||
| Year Ended December 31, 2020 | $ | 21.42 | 0.49 | (1.24 | ) | (0.75 | ) | (0.46 | ) | — | (0.53 | ) | (0.99 | ) | ||||||||||||||||||
| Year Ended December 31, 2019 | $ | 19.07 | 0.57 | 2.95 | 3.52 | (0.51 | ) | — | (0.66 | ) | (1.17 | ) | ||||||||||||||||||||
| Year Ended December 31, 2018 | $ | 22.13 | 0.66 | (2.50 | ) | (1.84 | ) | (0.70 | ) | (0.51 | ) | (0.01 | ) | (1.22 | ) | |||||||||||||||||
| A Class Shares | ||||||||||||||||||||||||||||||||
| Year Ended December 31, 2022 | $ | 21.63 | 0.71 | (3.80 | ) | (3.09 | ) | (0.67 | ) | — | (0.42 | ) | (1.09 | ) | ||||||||||||||||||
| Year Ended December 31, 2021 | $ | 19.74 | 0.38 | 3.14 | 3.52 | (1.02 | ) | — | (0.61 | ) | (1.63 | ) | ||||||||||||||||||||
| Year Ended December 31, 2020 | $ | 21.48 | 0.43 | (1.26 | ) | (0.83 | ) | (0.43 | ) | — | (0.48 | ) | (0.91 | ) | ||||||||||||||||||
| Year Ended December 31, 2019 | $ | 19.13 | 0.49 | 2.94 | 3.43 | (0.47 | ) | — | (0.61 | ) | (1.08 | ) | ||||||||||||||||||||
| Year Ended December 31, 2018 | $ | 22.18 | 0.56 | (2.46 | ) | (1.90 | ) | (0.66 | ) | (0.48 | ) | (0.01 | ) | (1.15 | ) | |||||||||||||||||
| C Class Shares | ||||||||||||||||||||||||||||||||
| Year Ended December 31, 2022 | $ | 20.94 | 0.47 | (3.56 | ) | (3.09 | ) | (0.60 | ) | — | (0.38 | ) | (0.98 | ) | ||||||||||||||||||
| Year Ended December 31, 2021 | $ | 19.13 | 0.21 | 3.04 | 3.25 | (0.90 | ) | — | (0.54 | ) | (1.44 | ) | ||||||||||||||||||||
| Year Ended December 31, 2020 | $ | 20.84 | 0.30 | (1.20 | ) | (0.90 | ) | (0.38 | ) | — | (0.43 | ) | (0.81 | ) | ||||||||||||||||||
| Year Ended December 31, 2019 | $ | 18.56 | 0.31 | 2.91 | 3.22 | (0.41 | ) | — | (0.53 | ) | (0.94 | ) | ||||||||||||||||||||
| Year Ended December 31, 2018 | $ | 21.55 | 0.41 | (2.42 | ) | (2.01 | ) | (0.52 | ) | (0.45 | ) | (0.01 | ) | (0.98 | ) | |||||||||||||||||
Amounts designated as “—” are $0 or rounded to $0.
| (a) | Per share net income has been determined on the basis of average number of shares outstanding during the period. |
| (b) | Total return is a measure of the change in value of an investment in the Fund over the period covered. The returns shown do not reflect the deduction of taxes a shareholder would pay on Fund distributions, if any or the redemption of Fund shares. The total returns would be lower if the Adviser had not reduced investment management fees and/or reimbursed expenses (Note 4). |
| (c) | Ratio was determined after investment management fee reductions and/or reimbursed expenses (Note 4). |
| (d) | Portfolio turnover rate is calculated on the basis of the Fund as a whole without distinguishing between classes of shares issued. |
| (e) | Effective July 1, 2018, the Advisor agreed to limit expenses to 1.15%. |
| (f) | Effective July 1, 2018, the Advisor agreed to limit expenses to 1.55%. |
| (g) | Effective July 1, 2018, the Advisor agreed to limit expenses to 2.10%. |
| (1) | Prior to November 18, 2022, Westwood Salient Select Income Fund was known as Salient Select Income Fund. |
The accompanying notes are an integral part of the financial statements.
38
| WESTWOOD FUNDS |
| FINANCIAL HIGHLIGHTS |
| SELECTED PER SHARE DATA & RATIOS |
| FOR A SHARE OUTSTANDING THROUGHOUT THE YEAR |
| Excluding interest and dividends on | Including interest and dividends on | |||||||||||||||||||||||||||||||||||||
| short sales expense | short sales expense | |||||||||||||||||||||||||||||||||||||
| Net asset value, end of year | Total return(b) | Net assets, end of year (000’s) | Ratio of total net expenses to average net assets(c) | Ratio of total gross expenses to average net assets | Ratio of net investment income to average net assets(c) | Ratio of total net expenses to average net assets(c) | Ratio of total gross expenses to average net assets | Ratio of net investment income to average net assets(c) | Portfolio turnover rate(d) | |||||||||||||||||||||||||||||
| $ | 17.39 | (14.10 | )% | $ | 108,853 | 1.03 | % | 1.42 | % | 3.67 | % | 1.12 | % | 1.51 | % | 3.58 | % | 72 | % | |||||||||||||||||||
| $ | 21.56 | 15.44 | % | $ | 143,721 | 1.10 | % | 1.37 | % | 2.26 | % | 1.15 | % | 1.42 | % | 2.21 | % | 82 | % | |||||||||||||||||||
| $ | 19.68 | (2.75 | )% | $ | 160,526 | 1.10 | % | 1.37 | % | 2.73 | % | 1.15 | % | 1.42 | % | 2.68 | % | 55 | % | |||||||||||||||||||
| $ | 21.42 | 18.64 | % | $ | 232,707 | 1.06 | % | 1.31 | % | 2.76 | % | 1.10 | % | 1.35 | % | 2.72 | % | 49 | % | |||||||||||||||||||
| $ | 19.07 | (8.52 | )% | $ | 198,762 | 1.25 | % (e) | 1.37 | % | 3.37 | % | 1.48 | % (e) | 1.60 | % | 3.14 | % | 24 | % | |||||||||||||||||||
| $ | 17.45 | (14.45 | )% | $ | 103,950 | 1.53 | % | 1.95 | % | 3.73 | % | 1.62 | % | 2.04 | % | 3.64 | % | 72 | % | |||||||||||||||||||
| $ | 21.63 | 14.98 | % | $ | 126,620 | 1.50 | % | 1.77 | % | 1.87 | % | 1.55 | % | 1.82 | % | 1.82 | % | 82 | % | |||||||||||||||||||
| $ | 19.74 | (3.17 | )% | $ | 125,194 | 1.50 | % | 1.77 | % | 2.38 | % | 1.55 | % | 1.82 | % | 2.33 | % | 55 | % | |||||||||||||||||||
| $ | 21.48 | 18.12 | % | $ | 160,277 | 1.46 | % | 1.71 | % | 2.37 | % | 1.50 | % | 1.75 | % | 2.33 | % | 49 | % | |||||||||||||||||||
| $ | 19.13 | (8.78 | )% | $ | 122,484 | 1.60 | % (f) | 1.72 | % | 2.91 | % | 1.83 | % (f) | 1.95 | % | 2.68 | % | 24 | % | |||||||||||||||||||
| $ | 16.87 | (14.92 | )% | $ | 5,679 | 1.98 | % | 2.38 | % | 2.57 | % | 2.07 | % | 2.47 | % | 2.48 | % | 72 | % | |||||||||||||||||||
| $ | 20.94 | 14.35 | % | $ | 11,219 | 2.05 | % | 2.33 | % | 1.11 | % | 2.10 | % | 2.38 | % | 1.06 | % | 82 | % | |||||||||||||||||||
| $ | 19.13 | (3.69 | )% | $ | 29,178 | 2.05 | % | 2.32 | % | 1.75 | % | 2.10 | % | 2.37 | % | 1.70 | % | 55 | % | |||||||||||||||||||
| $ | 20.84 | 17.51 | % | $ | 51,214 | 2.03 | % | 2.28 | % | 1.58 | % | 2.07 | % | 2.32 | % | 1.54 | % | 49 | % | |||||||||||||||||||
| $ | 18.56 | (9.51 | )% | $ | 100,706 | 2.23 | % (g) | 2.35 | % | 2.23 | % | 2.46 | % (g) | 2.58 | % | 2.00 | % | 24 | % | |||||||||||||||||||
The accompanying notes are an integral part of the financial statements.
39
| WESTWOOD FUNDS |
| FINANCIAL HIGHLIGHTS |
| SELECTED PER SHARE DATA & RATIOS |
| FOR A SHARE OUTSTANDING THROUGHOUT THE YEAR |
| Net asset value, beginning of year | Net investment income (loss)(a) | Net realized and unrealized gains (losses) on investments | Total from investment operations | Dividends from net investment income | Distributions from net realized capital gains | Return of capital | ||||||||||||||||||||||
| Westwood Broadmark Tactical Growth Fund (1) | ||||||||||||||||||||||||||||
| Institutional Shares | ||||||||||||||||||||||||||||
| Year Ended December 31, 2022 | $ | 29.14 | (0.06 | ) | (2.24 | ) | (2.30 | ) | — | (0.77 | ) | — | ||||||||||||||||
| Year Ended December 31, 2021 | $ | 27.96 | (0.24 | ) | 2.48 | 2.24 | — | (1.06 | ) | — | ||||||||||||||||||
| Year Ended December 31, 2020 | $ | 26.81 | (0.16 | ) | 2.40 | 2.24 | (0.03 | ) | (1.06 | ) | — | |||||||||||||||||
| Year Ended December 31, 2019 | $ | 25.43 | 0.16 | 2.53 | 2.69 | (0.14 | ) | (1.17 | ) | — | ||||||||||||||||||
| Year Ended December 31, 2018 | $ | 27.41 | 0.14 | (1.44 | ) | (1.30 | ) | (0.11 | ) | (0.57 | ) | — | ||||||||||||||||
| A Class Shares | ||||||||||||||||||||||||||||
| Year Ended December 31, 2022 | $ | 27.34 | (0.13 | ) | (2.13 | ) | (2.26 | ) | — | (0.77 | ) | — | ||||||||||||||||
| Year Ended December 31, 2021 | $ | 26.40 | (0.34 | ) | 2.34 | 2.00 | — | (1.06 | ) | — | ||||||||||||||||||
| Year Ended December 31, 2020 | $ | 25.45 | (0.26 | ) | 2.27 | 2.01 | — | (1.06 | ) | — | ||||||||||||||||||
| Year Ended December 31, 2019 | $ | 24.24 | 0.05 | 2.39 | 2.44 | (0.06 | ) | (1.17 | ) | — | ||||||||||||||||||
| Year Ended December 31, 2018 | $ | 26.15 | (0.07 | )(e) | (1.27 | ) | (1.34 | ) | — | (0.57 | ) | |||||||||||||||||
| C Class Shares | ||||||||||||||||||||||||||||
| Year Ended December 31, 2022 | $ | 25.39 | (0.27 | ) | (1.95 | ) | (2.22 | ) | — | (0.77 | ) | — | ||||||||||||||||
| Year Ended December 31, 2021 | $ | 24.72 | (0.46 | ) | 2.19 | 1.73 | — | (1.06 | ) | — | ||||||||||||||||||
| Year Ended December 31, 2020 | $ | 24.03 | (0.39 | ) | 2.14 | 1.75 | — | (1.06 | ) | — | ||||||||||||||||||
| Year Ended December 31, 2019 | $ | 23.01 | (0.09 | )(e) | 2.28 | 2.19 | — | (1.17 | ) | — | ||||||||||||||||||
| Year Ended December 31, 2018 | $ | 25.04 | (0.16 | )(e) | (1.30 | ) | (1.46 | ) | — | (0.57 | ) | |||||||||||||||||
Amounts designated as “—” are $0 or rounded to $0.
| (a) | Per share net income has been determined on the basis of average number of shares outstanding during the period. |
| (b) | Total return is a measure of the change in value of an investment in the Fund over the period covered. The returns shown do not reflect the deduction of taxes a shareholder would pay on Fund distributions, if any or the redemption of Fund shares. |
| (c) | Ratio was determined after investment management fee reductions and/or reimbursed expenses (Note 4). |
| (d) | Portfolio turnover rate is calculated on the basis of the Fund as a whole without distinguishing between classes of shares issued. |
| (e) | The amount shown for a share outstanding throughout the period may not correlate with the Statement of Operations for the period due to the timing of sales and redemptions of Fund shares in relation to income earned and/or fluctuating market value of the investments of the Fund. |
| (1) | Prior to November 18, 2022, Westwood Broadmark Tactical Growth Fund was known as Salient Tactical Growth Fund. |
The accompanying notes are an integral part of the financial statements.
40
| WESTWOOD FUNDS |
| FINANCIAL HIGHLIGHTS |
| SELECTED PER SHARE DATA & RATIOS |
| FOR A SHARE OUTSTANDING THROUGHOUT THE YEAR |
| Total distributions | Net asset value, end of year | Total return(b) | Net assets, end of year (000’s) | Ratio of total net expenses to average net assets(c) | Ratio of net investment income (loss) to average net assets(c) | Portfolio turnover rate(d) | ||||||||||||||||||||
| (0.77 | ) | $ | 26.07 | (7.90 | )% | $ | 236,181 | 1.51 | % | (0.21 | )% | 1037 | % | |||||||||||||
| (1.06 | ) | $ | 29.14 | 8.02 | % | $ | 301,241 | 1.46 | % | (0.82 | )% | 201 | % | |||||||||||||
| (1.09 | ) | $ | 27.96 | 8.40 | % | $ | 255,095 | 1.47 | % | (0.58 | )% | 626 | % | |||||||||||||
| (1.31 | ) | $ | 26.81 | 10.69 | % | $ | 250,153 | 1.43 | % | 0.62 | % | 435 | % | |||||||||||||
| (0.68 | ) | $ | 25.43 | (4.76 | )% | $ | 275,669 | 1.47 | % | 0.53 | % | 531 | % | |||||||||||||
| (0.77 | ) | $ | 24.31 | (8.27 | )% | $ | 27,117 | 1.91 | % | (0.49 | )% | 1037 | % | |||||||||||||
| (1.06 | ) | $ | 27.34 | 7.59 | % | $ | 21,995 | 1.86 | % | (1.21 | )% | 201 | % | |||||||||||||
| (1.06 | ) | $ | 26.40 | 7.95 | % | $ | 17,949 | 1.88 | % | (0.99 | )% | 626 | % | |||||||||||||
| (1.23 | ) | $ | 25.45 | 10.20 | % | $ | 17,273 | 1.85 | % | 0.21 | % | 435 | % | |||||||||||||
| (0.57 | ) | $ | 24.24 | (5.13 | )% | $ | 11,718 | 1.92 | % | (0.28 | )% | 531 | % | |||||||||||||
| (0.77 | ) | $ | 22.40 | (8.75 | )% | $ | 7,827 | 2.46 | % | (1.14 | )% | 1037 | % | |||||||||||||
| (1.06 | ) | $ | 25.39 | 7.01 | % | $ | 9,075 | 2.41 | % | (1.80 | )% | 201 | % | |||||||||||||
| (1.06 | ) | $ | 24.72 | 7.33 | % | $ | 11,830 | 2.42 | % | (1.60 | )% | 626 | % | |||||||||||||
| (1.17 | ) | $ | 24.03 | 9.67 | % | $ | 16,505 | 2.40 | % | (0.36 | )% | 435 | % | |||||||||||||
| (0.57 | ) | $ | 23.01 | (5.84 | )% | $ | 27,915 | 2.45 | % | (0.64 | )% | 531 | % | |||||||||||||
The accompanying notes are an integral part of the financial statements.
41
| WESTWOOD FUNDS |
| FINANCIAL HIGHLIGHTS |
| SELECTED PER SHARE DATA & RATIOS |
| FOR A SHARE OUTSTANDING THROUGHOUT THE YEAR |
| Net asset value, beginning of year | Net investment income (loss)(a) | Net realized and unrealized gains (losses) on investments | Total from investment operations | Dividends from net investment income | Distributions from net realized capital gains | Return of capital | ||||||||||||||||||||||
| Westwood Salient MLP & Energy Infrastructure Fund (1) | ||||||||||||||||||||||||||||
| Institutional Shares (2) | ||||||||||||||||||||||||||||
| Year Ended December 31, 2022 | $ | 6.50 | 0.04 | 1.08 | 1.12 | — | — | (0.32 | ) | |||||||||||||||||||
| Year Ended December 31, 2021 | $ | 5.50 | (0.02 | ) | 1.34 | 1.32 | — | — | (0.32 | ) | ||||||||||||||||||
| Year Ended December 31, 2020 | $ | 7.05 | 0.08 | (1.31 | ) | (1.23 | ) | — | — | (0.32 | ) | |||||||||||||||||
| Year Ended December 31, 2019 | $ | 6.34 | 0.04 | 0.99 | 1.03 | (0.18 | ) | — | (0.14 | ) | ||||||||||||||||||
| Year Ended December 31, 2018 | $ | 8.15 | 0.07 | (1.49 | ) | (1.42 | ) | (0.07 | ) | — | (0.32 | ) | ||||||||||||||||
| A Class Shares | ||||||||||||||||||||||||||||
| Year Ended December 31, 2022 | $ | 6.53 | 0.02 | 1.09 | 1.11 | — | — | (0.30 | ) | |||||||||||||||||||
| Year Ended December 31, 2021 | $ | 5.53 | (0.03 | ) | 1.34 | 1.31 | — | — | (0.31 | ) | ||||||||||||||||||
| Year Ended December 31, 2020 | $ | 7.07 | 0.07 | (1.31 | ) | (1.24 | ) | — | — | (0.30 | ) | |||||||||||||||||
| Year Ended December 31, 2019 | $ | 6.36 | 0.02 | 1.00 | 1.02 | (0.17 | ) | — | (0.14 | ) | ||||||||||||||||||
| Year Ended December 31, 2018 | $ | 8.18 | 0.06 | (1.50 | ) | (1.44 | ) | (0.07 | ) | — | (0.31 | ) | ||||||||||||||||
| C Class Shares | ||||||||||||||||||||||||||||
| Year Ended December 31, 2022 | $ | 6.50 | (0.03 | ) | 1.07 | 1.04 | — | — | (0.24 | ) | ||||||||||||||||||
| Year Ended December 31, 2021 | $ | 5.50 | (0.08 | ) | 1.34 | 1.26 | — | — | (0.26 | ) | ||||||||||||||||||
| Year Ended December 31, 2020 | $ | 7.02 | 0.03 | (1.31 | ) | (1.28 | ) | — | — | (0.24 | ) | |||||||||||||||||
| Year Ended December 31, 2019 | $ | 6.32 | (0.03 | ) (e) | 0.98 | 0.95 | (0.14 | ) | — | (0.11 | ) | |||||||||||||||||
| Year Ended December 31, 2018 | $ | 8.13 | (0.00 | ) (e) | (1.49 | ) | (1.49 | ) | (0.06 | ) | — | (0.26 | ) | |||||||||||||||
| Ultra Shares (2) | ||||||||||||||||||||||||||||
| Year Ended December 31, 2022 | $ | 6.51 | 0.04 | 1.08 | 1.12 | — | — | (0.33 | ) | |||||||||||||||||||
| Year Ended December 31, 2021 | $ | 5.50 | (0.01 | ) | 1.35 | 1.34 | — | — | (0.33 | ) | ||||||||||||||||||
| Year Ended December 31, 2020 | $ | 7.05 | 0.08 | (1.31 | ) | (1.23 | ) | — | — | (0.32 | ) | |||||||||||||||||
| Year Ended December 31, 2019 | $ | 6.34 | 0.04 | 0.99 | 1.03 | (0.18 | ) | — | (0.14 | ) | ||||||||||||||||||
| Year Ended December 31, 2018 | $ | 8.15 | 0.09 | (1.50 | ) | (1.41 | ) | (0.07 | ) | — | (0.33 | ) | ||||||||||||||||
Amounts designated as “—” are $0 or rounded to $0.
| (a) | Per share net income has been determined on the basis of average number of shares outstanding during the period. |
| (b) | Total return is a measure of the change in value of an investment in the Fund over the period covered. The returns shown do not reflect the deduction of taxes a shareholder would pay on Fund distributions, if any or the redemption of Fund shares. The total returns would be lower if the Adviser had not reduced investment management fees and/or reimbursed expenses (Note 4). |
| (c) | Ratio was determined after investment management fee reductions and/or reimbursed expenses (Note 4). |
| (d) | Portfolio turnover rate is calculated on the basis of the Fund as a whole without distinguishing between classes of shares issued. |
| (e) | The amount shown for a share outstanding throughout the period may not correlate with the Statement of Operations for the period due to the timing of sales and redemptions of Fund shares in relation to income earned and/or fluctuating market value of the investments of the Fund. |
| (f) | Net expense ratio exceeded the expense limitation during the year ended December 31, 2022 due to reorganization expenses (Note 8). |
| (1) | Prior to November 18, 2022, Westwood Salient MLP & Energy Infrastructure Fund was known as Salient MLP & Energy Infrastructure Fund |
| (2) | Prior to November 18, 2022, Institutional Share Class was I Share Class and Ultra Share Class was R6 Share Class. |
The accompanying notes are an integral part of the financial statements.
42
| WESTWOOD FUNDS |
| FINANCIAL HIGHLIGHTS |
| SELECTED PER SHARE DATA & RATIOS |
| FOR A SHARE OUTSTANDING THROUGHOUT THE YEAR |
| Total distributions | Net asset value, end of year | Total return(b) | Net assets, end of year (000’s) | Ratio of total net expenses to average net assets (including tax expense/ benefit)(c) | Ratio of total net expenses to average net assets (excluding tax expense/ benefit)(c) | Ratio of total gross expenses to average net assets (including tax expense/ benefit) | Ratio of net investment income (loss) to average net assets(c) | Portfolio turnover rate(d) | ||||||||||||||||||||||||||
| (0.32 | ) | $ | 7.30 | 17.22 | % | $ | 779,843 | 1.35 | % (f) | 1.35 | % (f) | 1.35 | % | 0.52 | % | 86 | % | |||||||||||||||||
| (0.32 | ) | $ | 6.50 | 24.11 | % | $ | 566,980 | 1.29 | % | 1.29 | % | 1.27 | % | (0.27 | )% | 248 | % | |||||||||||||||||
| (0.32 | ) | $ | 5.50 | (17.32 | )% | $ | 393,743 | 1.30 | % | 1.30 | % | 1.33 | % | 1.55 | % | 260 | % | |||||||||||||||||
| (0.32 | ) | $ | 7.05 | 16.33 | % | $ | 617,790 | 1.26 | % | 1.24 | % | 1.24 | % | 0.50 | % | 66 | % | |||||||||||||||||
| (0.39 | ) | $ | 6.34 | (18.10 | )% | $ | 730,427 | 1.17 | % | 1.23 | % | 1.17 | % | 0.95 | % | 48 | % | |||||||||||||||||
| (0.30 | ) | $ | 7.34 | 17.00 | % | $ | 151,353 | 1.61 | % (f) | 1.61 | % (f) | 1.61 | % | 0.23 | % | 86 | % | |||||||||||||||||
| (0.31 | ) | $ | 6.53 | 23.74 | % | $ | 92,027 | 1.50 | % | 1.50 | % | 1.50 | % | (0.42 | )% | 248 | % | |||||||||||||||||
| (0.30 | ) | $ | 5.53 | (17.43 | )% | $ | 63,681 | 1.55 | % | 1.55 | % | 1.56 | % | 1.29 | % | 260 | % | |||||||||||||||||
| (0.31 | ) | $ | 7.07 | 16.03 | % | $ | 110,549 | 1.47 | % | 1.49 | % | 1.47 | % | 0.24 | % | 66 | % | |||||||||||||||||
| (0.38 | ) | $ | 6.36 | (18.33 | )% | $ | 86,552 | 1.40 | % | 1.46 | % | 1.40 | % | 0.77 | % | 48 | % | |||||||||||||||||
| (0.24 | ) | $ | 7.30 | 15.98 | % | $ | 15,694 | 2.34 | % (f) | 2.34 | % (f) | 2.34 | % | (0.47 | )% | 86 | % | |||||||||||||||||
| (0.26 | ) | $ | 6.50 | 22.91 | % | $ | 17,726 | 2.29 | % | 2.29 | % | 2.26 | % | (1.26 | )% | 248 | % | |||||||||||||||||
| (0.24 | ) | $ | 5.50 | (18.16 | )% | $ | 20,468 | 2.30 | % | 2.30 | % | 2.32 | % | 0.57 | % | 260 | % | |||||||||||||||||
| (0.25 | ) | $ | 7.02 | 15.15 | % | $ | 37,346 | 2.22 | % | 2.24 | % | 2.22 | % | (0.48 | )% | 66 | % | |||||||||||||||||
| (0.32 | ) | $ | 6.32 | (18.89 | )% | $ | 44,247 | 2.15 | % | 2.21 | % | 2.15 | % | (0.01 | )% | 48 | % | |||||||||||||||||
| (0.33 | ) | $ | 7.30 | 17.12 | % | $ | 30,710 | 1.27 | % | 1.27 | % | 1.27 | % | 0.59 | % | 86 | % | |||||||||||||||||
| (0.33 | ) | $ | 6.51 | 24.41 | % | $ | 29,645 | 1.20 | % | 1.20 | % | 1.20 | % | (0.19 | )% | 248 | % | |||||||||||||||||
| (0.32 | ) | $ | 5.50 | (17.27 | )% | $ | 32,949 | 1.26 | % | 1.26 | % | 1.26 | % | 1.62 | % | 260 | % | |||||||||||||||||
| (0.32 | ) | $ | 7.05 | 16.42 | % | $ | 23,879 | 1.16 | % | 1.18 | % | 1.16 | % | 0.59 | % | 66 | % | |||||||||||||||||
| (0.40 | ) | $ | 6.34 | (18.04 | )% | $ | 20,907 | 1.09 | % | 1.15 | % | 1.09 | % | 1.24 | % | 48 | % | |||||||||||||||||
The accompanying notes are an integral part of the financial statements.
43
| WESTWOOD FUNDS |
| FINANCIAL HIGHLIGHTS |
| SELECTED PER SHARE DATA & RATIOS |
| FOR A SHARE OUTSTANDING THROUGHOUT THE YEAR |
| Net asset value, beginning of year | Net investment income (loss)(a) | Net realized and unrealized gains (losses) on investments | Total from investment operations | Dividends from net investment income | Distributions from net realized capital gains | Return of capital | ||||||||||||||||||||||
| Westwodd Broadmark Tactical Plus Fund (1) | ||||||||||||||||||||||||||||
| Institutional Shares (2) | ||||||||||||||||||||||||||||
| Year Ended December 31, 2022 | $ | 12.37 | 0.04 | (0.28 | ) | (0.24 | ) | — | (0.84 | ) | — | |||||||||||||||||
| Year Ended December 31, 2021 | $ | 11.65 | (0.08 | ) | 0.80 | 0.72 | — | — | — | |||||||||||||||||||
| Year Ended December 31, 2020 | $ | 11.55 | (0.09 | ) | 0.91 | 0.82 | — | (0.72 | ) | — | ||||||||||||||||||
| Year Ended December 31, 2019 | $ | 11.41 | 0.07 | 0.76 | 0.83 | (0.12 | ) | (0.57 | ) | — | ||||||||||||||||||
| Year Ended December 31, 2018 | $ | 11.47 | 0.06 | 0.24 | 0.30 | (0.01 | ) | (0.35 | ) | — | ||||||||||||||||||
| A Class Shares | ||||||||||||||||||||||||||||
| Year Ended December 31, 2022 | $ | 12.18 | — | (0.26 | ) | (0.26 | ) | — | (0.84 | ) | — | |||||||||||||||||
| Year Ended December 31, 2021 | $ | 11.51 | (0.11 | ) | 0.78 | 0.67 | — | — | — | |||||||||||||||||||
| Year Ended December 31, 2020 | $ | 11.44 | (0.12 | ) | 0.91 | 0.79 | — | (0.72 | ) | — | ||||||||||||||||||
| Year Ended December 31, 2019 | $ | 11.31 | 0.04 | 0.75 | 0.79 | (0.09 | ) | (0.57 | ) | — | ||||||||||||||||||
| Year Ended December 31, 2018 | $ | 11.40 | (0.02 | ) (f) | 0.28 | 0.26 | — | (0.35 | ) | — | ||||||||||||||||||
| C Class Shares | ||||||||||||||||||||||||||||
| Year Ended December 31, 2022 | $ | 11.52 | (0.09 | ) | (0.23 | ) | (0.32 | ) | — | (0.84 | ) | — | ||||||||||||||||
| Year Ended December 31, 2021 | $ | 10.97 | (0.19 | ) | 0.74 | 0.55 | — | — | — | |||||||||||||||||||
| Year Ended December 31, 2020 | $ | 11.02 | (0.20 | ) | 0.87 | 0.67 | — | (0.72 | ) | — | ||||||||||||||||||
| Year Ended December 31, 2019 | $ | 10.92 | (0.03 | ) (f) | 0.70 | 0.67 | — | (0.57 | ) | — | ||||||||||||||||||
| Year Ended December 31, 2018 | $ | 11.10 | (0.08 | ) (f) | 0.25 | 0.17 | — | (0.35 | ) | — | ||||||||||||||||||
| F Class Shares | ||||||||||||||||||||||||||||
| Year Ended December 31, 2022 | $ | 12.65 | 0.07 | (0.27 | ) | (0.20 | ) | (0.06 | ) | (0.84 | ) | — | ||||||||||||||||
| Year Ended December 31, 2021 | $ | 11.88 | (0.05 | ) | 0.82 | 0.77 | — | — | — | |||||||||||||||||||
| Year Ended December 31, 2020 | $ | 11.73 | (0.05 | ) | 0.92 | 0.87 | — | (0.72 | ) | — | ||||||||||||||||||
| Year Ended December 31, 2019 | $ | 11.58 | 0.11 | 0.77 | 0.88 | (0.16 | ) | (0.57 | ) | — | ||||||||||||||||||
| Year Ended December 31, 2018 | $ | 11.60 | 0.07 | 0.27 | 0.34 | (0.01 | ) | (0.35 | ) | — | ||||||||||||||||||
Amounts designated as “—” are $0 or rounded to $0.
| (a) | Per share net income has been determined on the basis of average number of shares outstanding during the period. |
| (b) | Total return is a measure of the change in value of an investment in the Fund over the period covered. The returns shown do not reflect the deduction of taxes a shareholder would pay on Fund distributions, if any or the redemption of Fund shares. The total returns would be lower if the Adviser had not reduced investment management fees and/or reimbursed expenses (Note 4). |
| (c) | Ratio was determined after investment management fee reductions and/or reimbursed expenses (Note 4). |
| (d) | Portfolio turnover rate is calculated on the basis of the Fund as a whole without distinguishing between classes of shares issued. |
| (e) | Effective February 1, 2018, the annual expense limitation rate changed from 1.80% to 1.40%. |
| (f) | The amount shown for a share outstanding throughout the period may not correlate with the Statement of Operations for the period due to the timing of sales and redemptions of Fund shares in relation to income earned, class specific expenses and/or fluctuating market value of the investments of the Fund. |
| (g) | Effective February 1, 2018, the annual expense limitation rate changed from 2.05% to 1.65%. |
| (h) | Effective February 1, 2018, the annual expense limitation rate changed from 2.80% to 2.40%. |
| (i) | Effective February 1, 2018, the annual expense limitation rate changed from 1.49% to 1.09%. |
| (1) | Prior to November 18, 2022, Westwood Broadmark Tactical Plus Fund was known as Salient Tactical Plus Fund. |
| (2) | Prior to November 18, 2022, Institutional Share Class was I Share Class. |
The accompanying notes are an integral part of the financial statements.
44
| WESTWOOD FUNDS |
| FINANCIAL HIGHLIGHTS |
| SELECTED PER SHARE DATA & RATIOS |
| FOR A SHARE OUTSTANDING THROUGHOUT THE YEAR |
| Total distributions | Net asset value, end of year | Total return(b) | Net assets, end of year (000’s) | Ratio of total net expenses to average net assets(c) | Ratio of total gross expenses to average net assets | Ratio of net investment income (loss) to average net assets(c) | Portfolio turnover rate(d) | |||||||||||||||||||||||
| (0.84 | ) | $ | 11.29 | (1.95 | )% | $ | 34,427 | 1.39 | % | 1.93 | % | 0.31 | % | 827 | % | |||||||||||||||
| — | $ | 12.37 | 6.18 | % | $ | 30,855 | 1.40 | % | 1.94 | % | (0.68 | )% | 62 | % | ||||||||||||||||
| (0.72 | ) | $ | 11.65 | 7.15 | % | $ | 30,308 | 1.40 | % | 1.99 | % | (0.77 | )% | 5,029 | % | |||||||||||||||
| (0.69 | ) | $ | 11.55 | 7.24 | % | $ | 24,882 | 1.40 | % | 1.94 | % | 0.61 | % | 9,813 | % | |||||||||||||||
| (0.36 | ) | $ | 11.41 | 2.56 | % | $ | 18,502 | 1.40 | % (e) | 2.38 | % | 0.51 | % | 5,067 | % | |||||||||||||||
| (0.84 | ) | $ | 11.08 | (2.18 | )% | $ | 584 | 1.64 | % | 2.16 | % | 0.02 | % | 827 | % | |||||||||||||||
| — | $ | 12.18 | 5.82 | % | $ | 579 | 1.65 | % | 2.19 | % | (0.95 | )% | 62 | % | ||||||||||||||||
| (0.72 | ) | $ | 11.51 | 6.95 | % | $ | 668 | 1.65 | % | 2.23 | % | (1.04 | )% | 5,029 | % | |||||||||||||||
| (0.66 | ) | $ | 11.44 | 6.96 | % | $ | 743 | 1.65 | % | 2.17 | % | 0.33 | % | 9,813 | % | |||||||||||||||
| (0.35 | ) | $ | 11.31 | 2.29 | % | $ | 616 | 1.65 | % (g) | 2.72 | % | (0.15 | )% | 5,067 | % | |||||||||||||||
| (0.84 | ) | $ | 10.36 | (2.82 | )% | $ | 414 | 2.39 | % | 2.93 | % | (0.77 | )% | 827 | % | |||||||||||||||
| — | $ | 11.52 | 5.01 | % | $ | 553 | 2.40 | % | 2.94 | % | (1.68 | )% | 62 | % | ||||||||||||||||
| (0.72 | ) | $ | 10.97 | 6.13 | % | $ | 575 | 2.40 | % | 2.99 | % | (1.77 | )% | 5,029 | % | |||||||||||||||
| (0.57 | ) | $ | 11.02 | 6.15 | % | $ | 488 | 2.40 | % | 2.89 | % | (0.30 | )% | 9,813 | % | |||||||||||||||
| (0.35 | ) | $ | 10.92 | 1.50 | % | $ | 629 | 2.40 | % (h) | 5.32 | % | (0.72 | )% | 5,067 | % | |||||||||||||||
| (0.90 | ) | $ | 11.55 | (1.65 | )% | $ | 37,040 | 1.08 | % | 1.93 | % | 0.59 | % | 827 | % | |||||||||||||||
| — | $ | 12.65 | 6.48 | % | $ | 39,430 | 1.09 | % | 1.94 | % | (0.37 | )% | 62 | % | ||||||||||||||||
| (0.72 | ) | $ | 11.88 | 7.46 | % | $ | 38,158 | 1.09 | % | 1.99 | % | (0.46 | )% | 5,029 | % | |||||||||||||||
| (0.73 | ) | $ | 11.73 | 7.54 | % | $ | 34,334 | 1.09 | % | 1.95 | % | 0.93 | % | 9,813 | % | |||||||||||||||
| (0.36 | ) | $ | 11.58 | 2.91 | % | $ | 27,688 | 1.09 | % (i) | 2.24 | % | 0.63 | % | 5,067 | % | |||||||||||||||
The accompanying notes are an integral part of the financial statements.
45
| WESTWOOD FUNDS |
| NOTES TO FINANCIAL STATEMENTS |
1. Organization
Westwood Salient Global Real Estate Fund (“Global Real Estate Fund”), Westwood Salient Select Income Fund (“Select Income Fund”), Westwood Broadmark Tactical Growth Fund (“Broadmark Tactical Growth Fund”), Westwood Salient MLP & Energy Infrastructure Fund (“MLP & Energy Infrastructure Fund”), and Westwood Broadmark Tactical Plus Fund (“Broadmark Tactical Plus Fund”), (individually, a “Fund” and collectively, the “Funds”) are each a series of Ultimus Managers Trust (the “Trust”), an open-end investment company established as an Ohio business trust under a Declaration of Trust dated February 28, 2012. The Trust is registered under the Investment Company Act of 1940, as amended, (the “1940 Act”).
The Global Real Estate Fund, Select Income Fund, and Tactical Growth Funds (“Predecessor Forward Funds”) were formerly part of Forward Funds, were the sole remaining series of Forward Funds, and were acquired by, and reorganized into, the Trust on November 18, 2022, pursuant to an Agreement and Plan of Reorganization dated June 27, 2022.
MLP & Energy Infrastructure Fund and Broadmark Tactical Plus Funds (“Predecessor Salient MF Trust”) were formerly part of Salient MF Trust, were the sole remaining series of Salient MF Trust, and were reorganized into, the Trust on November 18, 2022, pursuant to an Agreement and Plan of Reorganization dated June 27, 2022.
Global Real Estate Fund, Select Income Fund, Broadmark Tactical Growth Fund and Broadmark Tactical Plus Fund are open-end diversified funds. MLP & Energy Infrastructure Fund is an open-end non-diversified fund.
The investment objective of the Global Real Estate Fund seeks total return from both capital appreciation and current income.
The investment objective of Select Income Fund seeks high current income and potential for modest long-term growth of capital.
The investment objective of Broadmark Tactical Growth Fund is to produce above-average, risk-adjusted returns, in any market environment, while exhibiting less downside volatility than the S&P 500 Index.
MLP & Energy Infrastructure Fund seeks to maximize total return (capital appreciation and income).
Broadmark Tactical Plus Fund seeks to produce in any market environment above-average risk-adjusted returns and less downside volatility than the S&P 500 fund.
As of December 31, 2022, all of the Funds offer Institutional Shares, A Class Shares and C Class Shares. Broadmark Tactical Plus Fund has a fourth class, F Class Shares. MLP & Infrastructure Fund has a fourth class, Ultra Shares. On November 18, 2022, Investor Class shares of the Predecessor Forward Funds were exchanged for A Class Shares; and Class R6 shares and Class I shares of the Predecessor Salient MF Trust were exchanged for and renamed Ultra Class Shares and Institutional Shares, respectively.
Institutional Shares are sold without any sales loads, but subject to an administrative services plan fee of up to 0.05% of the average daily net assets attributable to Institutional Shares in Global Real Estate Fund, Select Income Fund and Tactical Growth Fund; up to 0.10% in MLP & Energy Infrastructure Fund; up to 0.10% Broadmark Tactical Plus Fund, requiring a $100,000 minimum investment and offered exclusively to certain retirement plans established for the benefit of employees of the Westwood Management Corporation (the “Advisor”) or its affiliates; defined benefit retirement plans, endowments or foundations; banks and trust companies or law firms acting as trustee or
46
| WESTWOOD FUNDS |
manager for trust accounts; investors who purchase through asset-based fee programs available through financial intermediaries; and insurance companies).
A Class Shares are sold with a maximum sales charge of 3.00% and a 12b-1 services plan fee up to 0.25% of the average daily net assets attributable to A Class Shares), requiring a $1,000 minimum investment. A Class Shares are also subject to an administrative services plan fee of up to 0.20% of the average daily net assets attributable to A Class Shares in Global Real Estate Fund, Select Income Fund and Tactical Growth Fund; and up to 0.10% in MLP & Energy Infrastructure Fund and Broadmark Tactical Plus Fund. Class A Shares purchases of $250,000 or more may be subject to a contingent deferred sales charge (“CDSC”) of 1.00% if redeemed within 18 months of purchase.
C Class Shares are sold without any sales loads, but subject to a 12b-1 services plan fee (up to 0.75% of the average daily net assets of the Global Real Estate Fund, Salient Select Income Fund and Broadmark Tactical Growth Fund’s C Class Shares, and up to 1.00% of the the average daily net assets of the Salient MLP & Energy Infrastructure Fund’s and Broadmark Tactical Plus Fund’s C Class Shares), requiring a $1,000 minimum investment. C Class Shares are also subject to an administrative services plan fee of up to 0.25% of the average daily net assets attributable to C Class Shares in Global Real Estate Fund, Select Income Fund and Tactical Growth Fund; and up to 0.10% in MLP & Energy Infrastructure Fund and Broadmark Tactical Plus Fund. C Class Shares may be subject to a CDSC fee of 1.00% if redeemed within 12 months of purchase. C Class Shares automatically convert to A Class Shares after being held for 10 years.
Ultra Shares are sold without any sales loads and distribution and/or administrative services fees, requiring a $20,000,000 initial investment and offered exclusively to employer retirement plans; health savings accounts under section 223 of the Internal Revenue Code of 1986, as amended, if such accounts are maintained by the Fund at an omnibus level; endowments and foundations and local, city and state agencies; unaffiliated registered investment companies; collective investment trusts; banks and trust companies or law firms acting as trustee or manager for trust accounts; and insurance companies.
Each share class represents an ownership interest in the same investment portfolio of the Fund.
Westwood Management Corp., (“Westwood” or an “Advisor”) serves as investment advisor to Global Real Estate Fund, Select income Fund, Broadmark Tactical Growth Fund and Salient MLP & Energy Infrastructure Fund. Salient Advisors, L.P. (“Salient Advisors”) and together with Westwood serve as investment advisor to the Broadmark Tactical Plus Fund. Salient Advisors is a wholly owned subsidiary of Westwood Holdings. Broadmark Asset Management LLC (“Sub-Advisor” or “Broadmark”) is the Sub-Advisor to Broadmark Tactical Growth Fund and Broadmark Tactical Plus Fund. Westwood Holdings is a majority owner of Broadmark.
2. Significant Accounting Policies
The following is a summary of the Funds’ significant accounting policies. The policies are in conformity with accounting principles generally accepted in the United States of America (“GAAP”). The Funds follow accounting and reporting guidance under Financial Accounting Standards Board (“FASB”) Accounting Standards Codification Topic 946, “Financial Services – Investment Companies.”
New accounting pronouncements – In March 2020, FASB issued Accounting Standards Update No. 2020-04 (“ASU 2020-04”), “Reference Rate Reform (Topic 848): Facilitation of the Effects of Reference Rate Reform on Financial Reporting.” ASU 2020-04 provides entities with optional guidance to ease potential accounting burden associated with transitioning away from the reference rates (e.g., LIBOR) that are expected to be discontinued. ASU 2020-04 allows, among other things, certain contract modifications to be accounted as a continuation of the existing contract. This ASU was effective upon the issuance and its optional relief can be applied through December 31, 2022. The Funds will consider this optional guidance prospectively, if applicable. Management is also currently actively
47
| WESTWOOD FUNDS |
working with other financial institutions and counterparties to modify contracts as required by appliable regulation and within the regulatory deadlines.
Regulatory Update – In October 2020, the Securities and Exchange Commission (the “SEC”) adopted new regulations governing the use of derivatives by registered investment companies (“Rule 18f-4”). The Funds were required to comply with Rule 18f-4 by August 19, 2022. Rule 18f-4 imposes limits on the amount of derivatives a fund can enter into, eliminates the asset segregation framework currently used by funds to comply with Section 18 of the 1940 Act, treats derivatives as senior securities and requires funds whose use of derivatives is more than a limited specified exposure amount to establish and maintain a comprehensive derivatives risk management program and appoint a derivatives risk manager. The Broadmark Tactical Growth Fund, MLP & Energy Infrastructure Fund and Broadmark Tactical Plus Fund are currently complying with Rule 18f-4.
Securities valuation – Each Fund values its portfolio securities at market value as of the close of regular trading on the New York Stock Exchange (the “NYSE”) (normally 4:00 p.m. Eastern time) on each business day the NYSE is open for business. The Funds value their listed securities on the basis of the security’s last sale price on the security’s primary exchange, if available, otherwise at the exchange’s most recently quoted mean price. NASDAQ-listed securities are valued at the NASDAQ Official Closing Price. Investments representing shares of other open-end investment companies, other than exchange-traded funds (“ETFs”), if any, but including money market funds, are valued at their net asset value (“NAV”) as reported by such companies. Option contracts are valued at the closing price on the exchange on which they are primarily traded; if no closing price is available at the time of valuation, the option will be valued at the mean of the closing bid and ask prices for that day. Future contracts are valued at the final settlement price, or, if a settled price is not available, at the last sale price as of the close of regular trading on the primary exchange on which they are traded. When using a quoted price and when the market is considered active, these securities will be classified as Level 1 within the fair value hierarchy (see below). In the event that market quotations are not readily available or are considered unreliable due to market or other events, the Funds value their securities and other assets at fair value pursuant to procedures adopted by Board of Trustees of the Trust (the “Board”). Under these procedures, the securities will be classified as Level 2 or 3 within the fair value hierarchy, depending on the inputs used. Unavailable or unreliable market quotes may be due to the following factors: a substantial bid-ask spread; infrequent sales resulting in stale prices; insufficient trading volume; small trade sizes; a temporary lapse in any reliable pricing source; and actions of the securities or futures markets, such as the suspension or limitation of trading. As a result, the prices of securities used to calculate each Fund’s NAV may differ from quoted or published prices for the same securities. Securities traded on foreign exchanges, if any, are fair valued by an independent pricing service and translated from the local currency into U.S. dollars using currency exchange rates supplied by an independent pricing service.
GAAP establishes a single authoritative definition of fair value, sets out a framework for measuring fair value, and requires additional disclosures about fair value measurements.
Various inputs are used in determining the value of each Fund’s investments. These inputs are summarized in the three broad levels listed below:
| ● | Level 1 – quoted prices in active markets for identical securities |
| ● | Level 2 – other significant observable inputs |
| ● | Level 3 – significant unobservable inputs |
Fixed income securities held by the Funds are classified as Level 2 since values are based on prices provided by an independent pricing service that utilizes various “other significant observable inputs” including bid and ask quotations, prices of similar securities, and interest rates, among other factors.
48
| WESTWOOD FUNDS |
For most securities, both the latest transaction prices and adjustments are furnished by independent pricing services. On August 23, 2022, the Board approved, effective at close of business on November 18, 2022, the Advisor and Salient Advisor as the fund’s valuation designee to be responsible for carrying out pricing and valuation duties in accordance with the Advisor’s Valuation Procedures (the “Procedures”) and adopted other updates pursuant to Rule 2a-5 under the Investment Company Act of 1940, as amended. The Funds value all other securities and assets for which market quotations are unavailable or unreliable at their fair value determined in good faith.
The inputs or methods used for valuing securities are not necessarily an indication of the risks associated with investing in those securities. The inputs used to measure fair value may fall into different levels of the fair value hierarchy. In such cases, for disclosure purposes, the level in the fair value hierarchy within which the fair value measurement falls in its entirety is determined based on the lowest level input that is significant to the fair value measurement.
The following is a summary of each Fund’s investments and the inputs used to value the investments as of December 31, 2022:
| Global Real Estate Fund | Level 1 | Level 2 | Level 3 | Total | ||||||||||||
| Common Stocks | $ | 10,606,009 | $ | 8,519,074 | * | $ | — | $ | 19,125,083 | |||||||
| Money Market Funds | 800,067 | — | — | 800,067 | ||||||||||||
| Total Investment Securities | $ | 11,406,076 | $ | 8,519,074 | $ | — | $ | 19,925,150 | ||||||||
| Select Income Fund | ||||||||||||||||
| Common Stocks | $ | 47,749,299 | $ | — | $ | — | $ | 47,749,299 | ||||||||
| Preferred Stocks | 158,960,932 | — | — | 158,960,932 | ||||||||||||
| Money Market Funds | 7,218,880 | — | — | 7,218,880 | ||||||||||||
| Total Investment Securities | $ | 213,929,111 | $ | — | $ | — | $ | 213,929,111 | ||||||||
| Broadmark Tactical Growth Fund | ||||||||||||||||
| Exchange-Traded Funds | $ | 54,604,275 | $ | — | $ | — | $ | 54,604,275 | ||||||||
| Money Market Funds | 214,244,298 | — | — | 214,244,298 | ||||||||||||
| Total Investment Securities | $ | 268,848,573 | $ | — | $ | — | $ | 268,848,573 | ||||||||
| Other Financial Instruments** | ||||||||||||||||
| Futures Contracts (liabilities) | (628,238 | ) | — | — | (628,238 | ) | ||||||||||
| Total | $ | 268,220,335 | $ | — | $ | — | $ | 268,220,335 | ||||||||
| MLP & Energy Infrastructure Fund | ||||||||||||||||
| Master Limited Partnerships | $ | 242,398,766 | $ | — | $ | — | $ | 242,398,766 | ||||||||
| MLP Related Companies | 717,172,914 | — | 9,092,368 | 726,265,282 | ||||||||||||
| Special Purpose Acquisition Companies | — | — | 315 | 315 | ||||||||||||
| Money Market Funds | 6,829,088 | — | — | 6,829,088 | ||||||||||||
| Total Investment Securities | $ | 966,400,768 | $ | — | $ | 9,092,683 | $ | 975,493,451 | ||||||||
49
| WESTWOOD FUNDS |
| Broadmark Tactical Plus Fund | ||||||||||||||||
| Purchased Option Contracts | $ | 58,538 | $ | — | $ | — | $ | 58,538 | ||||||||
| Money Market Funds | 72,277,924 | — | — | 72,277,924 | ||||||||||||
| Total Investment Securities | $ | 72,336,462 | $ | — | $ | — | $ | 72,336,462 | ||||||||
Amounts designated as “—” are $0 or have been rounded to $0.
| * | With respect to foreign equity securities that are principally traded on a market outside the United States, the Fund utilizes an independent fair value pricing service to evaluate the effect of market fluctuations on these securities after the close of trading in that foreign market. To the extent that securities are valued using this service, they will be classified as Level 2 securities. |
| ** | Other financial instruments are derivative instruments not reflected in the Schedule of Investments such as future contracts. These instruments are valued at the unrealized appreciation (depreciation) on the instrument. |
MLP & Energy Infrastructure Fund
| Change in | ||||||||||||||||||||||||||||||||
| Balance as of | Net | Unrealized | Transfer | Transfer | Balance as of | |||||||||||||||||||||||||||
| December 31, | Purchases/ | Realized | Appreciation | Into | Out of | December 31, | ||||||||||||||||||||||||||
| Asset Type | 2021 | Acqusitions | Net Sales | Losses | (Depreciation) | Level 3 | Level 3 | 2022 | ||||||||||||||||||||||||
| MLP Related Companies | $ | — | $ | 9,092,368 | $ | — | $ | — | $ | — | $ | — | $ | — | $ | 9,092,368 | ||||||||||||||||
| Special Purpose Acquisition Companies | — | 315 | — | — | — | — | — | 315 | ||||||||||||||||||||||||
MLP & Energy Infrastructure Fund
| Impact to | ||||||||||||
| Fair Value as of | Valuation from | |||||||||||
| December 31, | Valuation | Unobservable | Input Value/ | an Increase in | ||||||||
| 2022 | Technique | Input | Range | Input | ||||||||
| MLP Related Companies | $ | 9,092,368 | Discounted Cash Flow | Discount Rate | 14% | Decrease | ||||||
| Terminal Cash Flow Growth Rate | 2% | Increase | ||||||||||
| Special Purpose | ||||||||||||
| Acquisition Companies | 315 | Recent Transaction | Recent Transaction | $0.003 | Increase | |||||||
The restricted securities held by the MLP & Energy Infrastruture Fund at December 31, 2022 are identified below and are also presented in the Fund’s Schedule of Investments.
| % of | Acquisition | |||||||||||||||
| Net Assets | Date | Shares/Units | Cost | Fair Value | ||||||||||||
| EMG Utica I Offshore Co-Investment, LP | 0.09% | 2/22/13* | 16,000,000 | 16,000,000 | $ | 9,092,368 | ||||||||||
| TortoiseEconfin Acauistion Corp III - Founder Shares | 0.00% | 7/21/21* | 104,850 | 315 | 315 | |||||||||||
| 16,000,315 | 9,092,683 | |||||||||||||||
| * | Original purchase date by acquired fund prior to merger. |
50
| WESTWOOD FUNDS |
Share valuation – The NAV per share of each class of each Fund is calculated daily by dividing the total value of the assets attributable to that class, less liabilities attributable to that class, by the number of shares outstanding of that class. The offering price and redemption price per share of each class of each Fund is equal to the NAV per share of such class except for A Class Shares. A Class Shares have a front-end sales charge, which is deducted from your purchased price when you buy your shares.
Investment income – Dividend income is recorded on the ex-dividend date. Non-cash dividends included in dividend income, if any, are recorded at the fair value of the security received. Interest income is accrued as earned. Withholding taxes on foreign dividends, if any, have been recorded in accordance with the Funds’ understanding of the applicable country’s tax rules and rates. The Funds may invest in real estate investment trusts (“REITs”) that pay distributions to their shareholders based on available funds from operations. It is common for these distributions to exceed the REIT’s taxable earnings and profits resulting in the excess portion of such distribution to be designated as return of capital. Distributions received from REITs are generally recorded as dividend income and, if necessary, are reclassified annually in accordance with tax information provided by the underlying REITs. Distributions received from each Fund’s investments in Master Limited Partnerships (“MLPs”) may be comprised of both income and return of capital. Each Fund records investment income and return of capital based on estimates made at the time such distributions are received. Such estimates are based on historical information available from each MLP and other industry sources. These estimates may subsequently be revised based on information received from MLPs after their tax reporting periods are concluded. Discounts and premiums on fixed income securities, if any, are amortized using the interest method.
Investment transactions – Investment transactions are accounted for on the trade date. Realized gains and losses on investments sold are determined on a specific identification basis.
Allocation between Classes – Investment income earned, realized capital gains and losses, and unrealized appreciation and depreciation are allocated daily to each Class of a Fund based upon its proportionate share of total net assets of that Fund. Class-specific expenses are charged directly to the Class incurring the expense. Common expenses which are not attributable to a specific Class are allocated daily to each Class of shares of a Fund based upon its proportionate share of total net assets of that Fund.
Common expenses – Common expenses of the Trust are allocated among the Funds and the other series of the Trust based on the relative net assets of each series, the number of series in the Trust, or the nature of the services performed and the relative applicability to each series.
Futures contracts – A Fund may use futures contracts for tactical hedging purposes as well as to enhance a Fund’s returns. A futures contract represents a commitment for the future purchase or sale of an asset at a specified price on a specified date. When a Fund purchases or sells a futures contract, no price is paid to or received by a Fund. Instead, a Fund is required to deposit in a segregated asset account an amount of cash or qualifying securities. This is called the “initial margin deposit.” Subsequent payments, known as “variation margin,” are made or received by a Fund each day, depending on the daily fluctuations in the fair value of the underlying asset. A Fund recognizes an unrealized gain or loss equal to the daily valuation margin. If market conditions move unexpectedly, a Fund may not achieve the anticipated benefits of the futures contracts and may realize a loss. The margin deposits for futures contracts and the variation receivable/payable are reported on the Statements of Assets and Liabilities.
Options written/purchased – The Funds may utilize longer maturity options for stock replacement when and as price and volatility relationships become more favorable for options versus underlying stocks or for tax and liquidity management purposes. The Funds are authorized to write (sell) and purchase put and call options. The risk in writing a call option is that the Funds give up the opportunity to profit if the market price of the security increases. The risk in writing a put option is that the Funds may incur a loss if the market price of the security decreases and the option is exercised. The risk in purchasing an option is that the Funds pay a premium whether or not the option is exercised. The Funds also have the additional risk of being unable to enter into a closing transaction at an acceptable price if
51
| WESTWOOD FUNDS |
a liquid secondary market does not exist. Option contracts also involve the risk that they may not work as intended due to unanticipated developments in market conditions or other causes.
Foreign currency translation – Securities and other assets and liabilities denominated in or expected to settle in foreign currencies are translated into U.S. dollars based on exchange rates on the following basis:
| A. | The fair values of investment securities and other assets and liabilities are translated as of the close of the NYSE each day. |
| B. | Purchases and sales of investment securities and income and expenses are translated at the rate of exchange prevailing as of 4:00 p.m. Eastern Time on the respective date of such transactions. |
| C. | The Funds do not isolate that portion of the results of operations caused by changes in foreign exchange rates on investments from those caused by changes in market prices of securities held. Such fluctuations are included with the net realized and unrealized gains or losses on investments. |
Reported net realized foreign exchange gains or losses arise from 1) purchases and sales of foreign currencies, 2) currency gains or losses realized between the trade and settlement dates on securities transactions and 3) the difference between the amounts of dividends and foreign withholding taxes recorded on a Fund’s books and the U.S. dollar equivalent of the amounts actually received or paid. Reported net unrealized foreign exchange gains and losses arise from changes in the value of assets and liabilities other than investments in securities that result from changes in exchange rates.
The Funds may be subject to foreign taxes related to foreign income received, capital gain on the sale of securities and certain foreign currency transactions (a portion of which may be reclaimable). All foreign taxes are recorded in accordance with the applicable regulations and rates that exist in the foreign jurisdictions in which a Fund invests.
Borrowing costs – Prior to November 18, 2022, the Predecessor Select Income Fund had an open-ended line of credit for up to $200,000,000 with Société Générale. For borrowings under this agreement, the Fund was charged interest of 1.315% above the one-month Term SOFR (Secured Overnight Financing Rate). Borrowing costs that were incurred by the Fund during the year ended December 31, 2022, are recorded in the Statement of Operations. For the period January 1, 2022 through November 18, 2022, the maximum and average borrowing amount was $5,000,000 at an average interest rate of 2.155%. There was no line of credit agreement in place after November 18, 2022.
ReFlow transactions – Certain Funds may participate in ReFlow, a program designed to provide an alternative liquidity source for mutual funds experiencing redemptions of their shares. In order to pay cash to shareholders who redeem their shares on a given day, a mutual fund typically must hold cash in its portfolio, liquidate portfolio securities, or borrow money,all of which impose certain costs on the fund. ReFlow provides participating mutual funds with another source of cash by standing ready to purchase shares from a fund equal to the amount of the fund’s net redemptions on a given day. ReFlow then generally redeems those shares when the fund experiences net sales. In return for this service, the fund will pay a fee to ReFlow at a rate determined by a daily auction with other participating mutual funds. The costs to a Fund for participating in ReFlow are generally expected to be influenced by and comparable to the cost of other sources of liquidity, such as the Fund’s short-term lending arrangements or the costs of selling portfolio securities to meet redemptions. ReFlow is prohibited from acquiring more than 2.95% of the total net assets of any Fund. The Predecessor Board had adopted certain procedures to govern the Funds’ participation in ReFlow. ReFlow fees that were incurred by the Funds during the year ended December 31, 2022, are recorded in the Statement of Operations, if applicable.
Estimates – The preparation of financial statements in conformity with GAAP requires management to make estimates and assumptions that affect the reported amounts of assets and liabilities and disclosure of contingent assets and liabilities as of the date of the financial statements and the reported amounts of increase (decrease) in net assets from operations during the reporting period. Actual results could differ from those estimates.
52
| WESTWOOD FUNDS |
Distributions to shareholders – Global Real Estate Fund, Select Income Fund and MLP & Energy Infrastructure Fund distribute substantially all of their net income to shareholders on a quarterly basis and their net capital gains to shareholders at least annually in December. Tactical Growth Fund and Tactical Plus Fund are normally declared and paid annually in December. The amount of such dividends and distributions are determined in accordance with federal income tax regulations, which may differ from GAAP. Dividends and distributions to shareholders are recorded on the ex-dividend date. The character of dividends paid to shareholders of the Funds for federal income tax purposes during the periods ended December 31, 2022 and 2021 was as follows:
| Ordinary | Long-Term | Return of | Total | |||||||||||||
| Period Ended | Income | Capital Gains | Capital | Distributions | ||||||||||||
| Global Real Estate Fund | ||||||||||||||||
| December 31, 2022 | $ | 432,515 | $ | — | $ | 62,845 | $ | 495,360 | ||||||||
| December 31, 2021 | $ | 778,654 | $ | — | $ | — | $ | 778,654 | ||||||||
| Select Income Fund | ||||||||||||||||
| December 31, 2022 | $ | 8,842,015 | $ | — | $ | 5,645,768 | $ | 14,487,783 | ||||||||
| December 31, 2021 | $ | 6,384,418 | $ | 9,539,514 | $ | — | $ | 15,923,932 | ||||||||
| Broadmark Tactical Growth Fund | ||||||||||||||||
| December 31, 2022 | $ | — | $ | 7,812,987 | $ | — | $ | 7,812,987 | ||||||||
| December 31, 2021 | $ | 11,861,936 | $ | — | $ | — | $ | 11,861,936 | ||||||||
| MLP & Energy Infrastructure Fund | ||||||||||||||||
| December 31, 2022 | $ | — | $ | — | $ | 39,068,282 | $ | 39,068,282 | ||||||||
| December 31, 2021 | $ | — | $ | — | $ | 32,941,733 | $ | 32,941,733 | ||||||||
| Broadmark Tactical Plus Fund | ||||||||||||||||
| December 31, 2022 | $ | 1,681,010 | $ | 3,437,935 | $ | — | $ | 5,118,945 | ||||||||
| December 31, 2021 | $ | — | $ | — | $ | — | $ | — | ||||||||
Federal income tax – Each Fund has qualified and intends to continue to qualify as a regulated investment company under the Internal Revenue Code of 1986, as amended (the “Code”). Qualification generally will relieve the Funds of liability for federal income taxes to the extent 100% of their net investment income and net realized capital gains are distributed in accordance with the Code.
In order to avoid imposition of the excise tax applicable to regulated investment companies, it is also each Fund’s intention to declare as dividends in each calendar year at least 98% of its net investment income (earned during the calendar year) and 98.2% of its net realized capital gains (earned during the twelve months ended October 31) plus undistributed amounts from prior years.
53
| WESTWOOD FUNDS |
The following information is computed on a tax basis for each item as of December 31, 2022:
| Broadmark | ||||||||||||
| Global Real | Select Income | Tactical Growth | ||||||||||
| Estate Fund | Fund | Fund | ||||||||||
| Federal income tax cost | $ | 22,172,355 | $ | 213,057,765 | $ | 267,664,946 | ||||||
| Gross unrealized appreciation | $ | 598,100 | $ | 24,216,153 | $ | 1,183,627 | ||||||
| Gross unrealized depreciation | (2,844,924 | ) | (23,344,807 | ) | — | |||||||
| Net unrealized appreciation (depreciation) | (2,246,824 | ) | 871,346 | 1,183,627 | ||||||||
| Capital loss carryforward | (23,203,071 | ) | (2,480,683 | ) | — | |||||||
| Post October capital loss deferral | — | — | (1,044,627 | ) | ||||||||
| Total distributable earnings (accumulated deficit) | $ | (25,449,895 | ) | $ | (1,609,337 | ) | $ | 139,000 | ||||
Capital losses and specified gains realized after October 31, and net investment losses realized after December 31 of a Fund’s fiscal year may be deferred and treated as occurring on the first business day of the following fiscal year for tax purposes. For the year ended December 31, 2022, the Broadmark Tactical Growth Fund deferred $1,044,627 of capital losses.
The following information is computed on a tax basis for each item as of November 30, 2022. These funds have a tax year end of November 30, 2022 which is different than the fiscal year end of December 31, 2022.
| MLP & Energy | Broadmark | |||||||
| Infrastructure | Tactical Plus | |||||||
| Fund | Fund | |||||||
| Federal income tax cost | $ | 844,272,176 | $ | 74,046,942 | ||||
| Gross unrealized appreciation | $ | 224,742,483 | $ | — | ||||
| Gross unrealized depreciation | (11,061,429 | ) | — | |||||
| Net unrealized appreciation | 213,681,054 | — | ||||||
| Undistributed ordinary income | — | 1,497,772 | ||||||
| Undistributed long-term capital gains | — | 3,437,482 | ||||||
| Accumulated capital and other losses | (960,407,467 | ) | — | |||||
| Total distributable earnings (accumulated deficit) | $ | (746,726,413 | ) | $ | 4,935,254 | |||
The following information is provided on a tax basis as of December 31, 2022 and includes investments and excludes derivatives:
| MLP & Energy | Broadmark | |||||||
| Infrastructure | Tactical Plus | |||||||
| Fund | Fund | |||||||
| Federal income tax cost | $ | 789,835,482 | $ | 72,336,462 | ||||
| Gross unrealized appreciation | $ | 207,140,075 | $ | — | ||||
| Gross unrealized depreciation | (21,482,106 | ) | — | |||||
| Net unrealized appreciation | $ | 185,657,969 | $ | — | ||||
54
| WESTWOOD FUNDS |
The difference between the federal income tax cost of portfolio investments and the financial statement cost of portfolio investments are due to certain timing differences in the recognition of capital gains or losses under income tax regulations and GAAP. These “book/tax” differences are temporary in nature and are primarily due to the tax deferral of losses on wash sales, constructive dividend income and partnership adjustments.
For the year ended December 31, 2022, Select Income Fund utilized long-term capital loss carryover $36,872.
As of December 31, 2022, the following Funds had short term and long term capital loss carryforwards for federal income tax purposes, which may be carried forward indefinitely. These capital loss carryforwards are available to offset net realized capital gains in the current and future years, thereby reducing future taxable gains distributions, if any.
| Capital Loss Carryovers | ||||||||||||
| Fund | Short- term | Long- term | Total | |||||||||
| Global Real Estate Fund | $ | 13,710,405 | $ | 9,492,666 | $ | 23,203,071 | ||||||
| Select Income Fund | 2,480,683 | — | 2,480,683 | |||||||||
As of the tax year ended November 30, 2022 the following Fund had short term and long term capital loss carryforwards for federal income tax purposes, which may be carried forward indefinitely. These capital loss carryforwards are available to offset net realized capital gains in the current and future years, thereby reducing future taxable gains distributions, if any.
| Capital Loss Carryovers | ||||||||||||
| Fund | Short- term | Long- term | Total | |||||||||
| MLP & Energy Infrastructure Fund | $ | 301,052,704 | $ | 659,354,763 | $ | 960,407,467 | ||||||
| Capital Loss Carryover Utilized in Current Year | ||||||||||||
| Fund | Short- term | Long- term | Total | |||||||||
| Broadmark Tactical Plus Fund | $ | 1,006,313 | $ | 1,229,881 | $ | 2,236,194 | ||||||
For MLP & Energy Infrastructure Fund, included in the $960,407,467 is short-term available carry forward losses of $133,857,047 and long-term of $54,167,702 for a total of $188,024,749 from the merged Salient Midstream & MLP Fund with an annual limitation of $4,106,607.
The Funds recognize the tax benefits or expenses of uncertain tax positions only when the position is “more likely than not” of being sustained assuming examination by tax authorities. Management has reviewed each Fund’s tax positions for the current tax year and has concluded that no provision for unrecognized tax benefits or expenses is required in these financial statements. The Funds identify their major tax jurisdiction as U.S. Federal.
55
| WESTWOOD FUNDS |
The permanent differences primarily consist of foreign currency translations, reclassification of long term capital gain distribution on REITs, investments in publicly traded partnerships, deemed distributions, net operating loss, perpetual bond adjustments, investments in swaps, pay-down gain (loss), contingent debt adjustment and distribution reclassification. The permanent differences that are credited or charged to Paid in Capital and distributable earnings as of December 31, 2022 are primarily related to utilization of earnings and profits on shareholder redemptions, in-kind redemption gain/loss, equalization, and non-deductible partnership expenses. As of December 31, 2022 the following adjustments were made:
| Distributable | ||||||||
| earnings/(loss) | Paid in capital | |||||||
| Global Real Estate Fund | $ | (11,020 | ) | $ | 11,020 | |||
| Select Income Fund | (1 | ) | 1 | |||||
| Broadmark Tactical Growth Fund | (7,464,572 | ) | 7,464,572 | |||||
As of the tax year ended November 30, 2022 the following adjustments were made:
| Distributable | ||||||||
| earnings/(loss) | Paid in capital | |||||||
| MLP & Energy Infrastructure Fund | $ | (226,506,133 | ) | $ | 226,506,133 | |||
| Broadmark Tactical Plus Fund | (80,546 | ) | 80,546 | |||||
3. Investment Transactions
The cost of security purchases and proceeds from sales and maturities of securities (excluding short-term debt securities having maturities one year or less) for the period ended December 31, 2022 were as follows:
| MLP & | ||||||||||||||||||||
| Broadmark | Energy | Broadmark | ||||||||||||||||||
| Global Real | Select Income | Tactical Growth | Infrastructure | Tactical Plus | ||||||||||||||||
| Estate Fund | Fund | Fund | Fund | Fund | ||||||||||||||||
| Purchases of investment securities | $ | 6,707,206 | $ | 182,431,225 | $ | 520,327,504 | $ | 925,326,540 | $ | 228,113,856 | ||||||||||
| Proceeds from sales of investment securities | $ | 8,885,961 | $ | 203,915,278 | $ | 565,753,930 | $ | 766,258,536 | $ | 258,819,891 | ||||||||||
4. Transactions with Related Parties
INVESTMENT MANAGEMENT AGREEMENT
On November 18, 2022 Westwood signed an agreement with the Trust as investment advisor of the Global Real Estate Fund, Select Income Fund, Broadmark Tactical Growth Fund and MLP & Energy Infrastructure Fund pursuant to the terms of an Investment Management Agreement. Each Fund pays the Advisor an investment management fee, based on the average net assets of each Fund, computed, and accrued daily and paid monthly, at the annual rate shown on the following page.
On November 18, 2022 Salient Advisors, L.P. signed an agreement with the Trust as investment advisor for Broadmark Tactical Plus Fund. The Funds will pay Salient Advisors 1.40% as a percent of average daily net assets.
On November 18, 2022 Broadmark signed an agreement as the sub-advisor for Broadmark Tactical Growth Fund and Broadmark Tactical Plus Fund. The Advisor will pay to the Sub-Advisor as compensation for the Sub-Advisor’s services rendered, a Fee, computed and accrued daily and paid monthly in arrears at an annual rate of 0.60% up to and including $1,000,000,000 of each Fund’s average daily net assets and 0.55% over $1,000,000,000 of the Fund’s average daily net assets.
56
| WESTWOOD FUNDS |
Prior to November 18, 2022, the Predecessor Forward Funds and Predecessor Salient MF Trust had entered into an investment advisory agreement with Salient Advisors. Additionally, Salient Advisors had entered into an investment sub-advisory agreement with Broadmark Asset Management for Tactical Growth Fund and Tactical Plus Fund.
The amounts presented on the Statement of Operations reflect the combined management agreements for the year ended December 31, 2022.
Pursuant to an Expense Limitation Agreement (“ELA”) between each Fund and the Advisor, the Advisor has contractually agreed, until April 30, 2024, to reduce investment management fees and reimburse other expenses to the extent necessary to limit total annual fund operating expenses of each Fund (excluding interest, taxes, brokerage commissions, borrowing expenses such as dividend and interest expenses on securities sold short, Acquired Fund fees and expenses, costs to organize the Fund, other expenditures which are capitalized in accordance with generally accepted accounting principles, and extraordinary expenses) to an amount exceeding the following percentages of average daily net assets attributable to each respective class. Westwood has contractually agreed to waive its management fee at an annual rate in the amount of 0.25% of the Salient Global Real Estate Fund and Salient Income Fund’s average daily net assets.
| Institutional | A Class | C Class | Ultra Class | F Class | ||||||||
| Management | Class Expense | Expense | Expense | Expense | Expense | |||||||
| Fund | Fee | Limitation | Limitation | Limitation | Limitation | Limitation | ||||||
| Global Real Estate Fund | 0.95% | 1.10% | 1.50% | 2.05% | n/a | n/a | ||||||
| Select Income Fund | 0.95% | 1.10% | 1.50% | 2.05% | n/a | n/a | ||||||
| Broadmark Tactical Growth Fund | 1.10% | n/a | n/a | n/a | n/a | n/a | ||||||
| MLP & Energy Infrastructure Fund | 0.90% | 1.25% | 1.50% | 2.25% | n/a | n/a | ||||||
| Broadmark Tactical Plus Fund | 1.40% | 1.35% | 1.60% | 2.35% | n/a | 1.04% |
The table below reflects the Funds’ management fee rates and expense limitations in place prior to November 18, 2022:
| Institutional | A Class | C Class | Investor Class | Ultra Class | F Class | |||||||||
| Management | Class Expense | Expense | Expense | Expense | Expense | Expense | ||||||||
| Fund | Fee | Limitation | Limitation | Limitation | Limitation | Limitation | Limitation | |||||||
| Global Real Estate Fund | 1.00%* | 1.15% | 1.55% | 2.10% | 1.50% | n/a | n/a | |||||||
| Select Income Fund | 1.00%* | 1.15% | 1.55% | 2.10% | 1.50% | n/a | n/a | |||||||
| Broadmark Tactical Growth Fund | 1.15%(a) | n/a | n/a | n/a | n/a | n/a | n/a | |||||||
| MLP & Energy Infrastructure Fund | 0.95% | 1.30% | 1.55% | 2.30% | n/a | n/a | n/a |
57
| WESTWOOD FUNDS |
| Institutional | A Class | C Class | Investor Class | Ultra Class | F Class | |||||||||
| Management | Class Expense | Expense | Expense | Expense | Expense | Expense | ||||||||
| Fund | Fee | Limitation | Limitation | Limitation | Limitation | Limitation | Limitation | |||||||
| Broadmark Tactical Plus Fund | 1.45% | 1.40% | 1.65% | 2.40% | n/a | n/a | 1.09% |
| * | Salient Advisors had contractually waived 0.25% of the Fund’s management fee so that Fund’s management fee was 0.75%. |
| (a) | Advisory fee rate 1.15% up to and including $1 billion and 1.05% over $1 billion. |
Broadmark Tactical Growth Fund had an investment sub-advisory fee of 0.60% up to and including $1 billion and 0.55% over $1 billion Broadmark Tactical Plus Fund had an investment sub-advisory fee of 0.725%.
Under the terms of the ELA, investment management fee reductions and expense reimbursements by the Advisor are subject to repayment by the Funds for a period of three years after the date on which such fees and expenses were incurred or waived, provided that the repayments do not cause total annual fund operating expenses (exclusive of such reductions and reimbursements) to exceed (i) the expense limitation then in effect, if any, and (ii) the expense limitation in effect at the time the expenses to be repaid were incurred. The 0.25% contractual management fee waiver for Salient Global Real Estate Fund and Salient Select Income Fund is not subject to recoupment. As of December 31, 2022, the Advisor may seek repayment of investment management fee reductions and expense reimbursements no later than the dates below:
| MLP & | ||||||||||||||||||||
| Broadmark | Energy | Broadmark | ||||||||||||||||||
| Global Real | Select Income | Tactical | Infrastructure | Tactical Plus | ||||||||||||||||
| Estate Fund | Fund | Growth Fund | Fund | Fund | ||||||||||||||||
| December 31, 2023 | 180,275 | 62,039 | — | — | 499,052 | |||||||||||||||
| December 31, 2024 | 161,957 | 61,878 | — | — | 508,303 | |||||||||||||||
| December 31, 2025 | 170,572 | 347,433 | — | — | 513,949 | |||||||||||||||
| $ | 512,804 | $ | 471,350 | $ | — | $ | — | $ | 1,521,304 | |||||||||||
OTHER SERVICE PROVIDERS
Ultimus Fund Solutions, LLC (“Ultimus”) provides administration, fund accounting, compliance and transfer agency services to the Funds. The Funds pay Ultimus fees in accordance with the agreements for such services. In addition, the Funds pay out-of-pocket expenses including, but not limited to, postage, supplies, and certain costs related to the pricing of the Funds’ portfolio securities.
Under the terms of a Distribution Agreement with the Trust, Ultimus Fund Distributors, LLC (the “Distributor”) serves as the principal underwriter to the Funds. The Distributor is a wholly-owned subsidiary of Ultimus. The Distributor is compensated by the Advisor for acting as principal underwriter.
A Trustee and certain officers of the Trust are also officers of Ultimus.
ADMINISTRATIVE SERVICES PLAN
For the year ended December 31, 2022, the Funds have adopted an administrative services plan (the “Plan”) that provides that the applicable class of each Fund may pay financial intermediaries for shareholder services in an amount not to exceed the rate shown in the table below based on the average daily net assets of each Fund’s share
58
| WESTWOOD FUNDS |
class. During the year ended December 31, 2022, the Funds incurred the following administrative services plan fees under the Plan.
| Maximum | Expense | |||||||
| Fund/Class | Rate | Incurred | ||||||
| Global Real Estate Fund | ||||||||
| Institutional Class Shares | 0.05 | % | $ | 1,682 | ||||
| A Class Shares | 0.20 | % | 39,557 | |||||
| C Class Shares | 0.25 | % | 3,678 | |||||
| Investor Class Shares | 0.15 | % | 823 | |||||
| Select Income Fund | ||||||||
| Institutional Class Shares | 0.05 | % | 68,168 | |||||
| A Class Shares | 0.20 | % | 224,509 | |||||
| C Class Shares | 0.25 | % | 22,554 | |||||
| Investor Class Shares | 0.15 | % | 12,639 | |||||
| Broadmark Tactical Growth Fund | ||||||||
| Institutional Class Shares | 0.05 | % | 134,656 | |||||
| A Class Shares | 0.20 | % | 44,257 | |||||
| C Class Shares | 0.25 | % | 20,730 | |||||
| Investor Class Shares | 0.15 | % | 13,493 | |||||
| MLP & Energy Infrastructure Fund | ||||||||
| Institutional Class Shares | 0.10 | % | 507,752 | |||||
| A Class Shares | 0.10 | % | 79,553 | |||||
| C Class Shares | 0.10 | % | 51,969 | |||||
| Broadmark Tactical Plus Fund | ||||||||
| Institutional Class Shares | 0.10 | % | 29,718 | |||||
| A Class Shares | 0.10 | % | 425 | |||||
| C Class Shares | 0.10 | % | 1,555 | |||||
| F Class Shares | 0.10 | % | 38,433 | |||||
DISTRIBUTION PLAN
The Funds have adopted a distribution plan under Rule 12b-1 of the 1940 Act (the “Plan”) for A Class Shares, C Class Shares and Investor Class Shares that allows the Funds to pay distribution and/or service fees for the sale and distribution of Fund shares, and for services provided to shareholders in an amount not to exceed 0.25% based on average daily net assets of each Fund’s A Class Shares and Investor Class Shares, up to 0.75% of the average daily net assets of the Global Real Estate Fund, Salient Select Income Fund and Broadmark Tactical Growth Fund’s C Class Shares, and 1.00% based on the average daily net assets of the Salient MLP & Energy Infrastructure Fund’s and
59
| WESTWOOD FUNDS |
Broadmark Tactical Plus Fund’s C Class Shares as compensation for distribution and shareholder services. During the period ended December 31, 2022, the Funds incurred the following distribution fees under the Plan:
| Distribution fee | ||||
| Global Real Estate Fund | ||||
| A Class Shares | $ | 48,765 | ||
| C Class Shares | 10,609 | |||
| Investor Class Shares | 1,293 | |||
| Select Income Fund | ||||
| A Class Shares | 276,524 | |||
| C Class Shares | 64,177 | |||
| Investor Class Shares | 20,473 | |||
| Broadmark Tactical Growth Fund | ||||
| A Class Shares | 54,046 | |||
| C Class Shares | 61,090 | |||
| Investor Class Shares | 22,008 | |||
| MLP & Energy Infrastructure Fund | ||||
| A Class Shares | 329,528 | |||
| C Class Shares | 137,082 | |||
| Broadmark Tactical Plus Fund | ||||
| A Class Shares | 1,433 | |||
| C Class Shares | 3,766 |
TRUSTEE COMPENSATION
Effective October 17, 2022 Each member of the Board (a “Trustee”) who is not an “interested person” (as defined by the 1940 Act, as amended) of the Trust (“Independent Trustee”) receives a $1,300 annual retainer from each Fund, paid quarterly, except for the Board Chairperson who receives a $1,700 annual retainer from each Fund and Audit Committee Chairperson who receives a $1,500 annual retainer, paid in quarterly installments. Each Independent Trustee also receives from each Fund a fee of $550 for each Board meeting attended plus reimbursement for travel and other meeting-related expenses.
PRINCIPAL HOLDERS OF FUND SHARES
As of December 31, 2022, the following shareholders owned of record 25% or more of the outstanding shares of the Funds:
| NAME OF RECORD OWNER | % Ownership | |
| Global Real Estate Fund | ||
| Institutional Shares | ||
| Pershing, LLC (for the benefit of its customers) | 28% | |
| Select Income Fund | ||
| Institutional Shares | ||
| Pershing, LLC (for the benefit of its customers) | 28% |
60
| WESTWOOD FUNDS |
| NAME OF RECORD OWNER | % Ownership | |
| Broadmark Tactical Growth Fund | ||
| Institutional Shares | ||
| Morgan Stanley Smith Barney, LLC (for the benefit of its customers) | 54% | |
| A Class Shares | ||
| Morgan Stanley Smith Barney, LLC (for the benefit of its customers) | 37% | |
| C Class Shares | ||
| Morgan Stanley Smith Barney, LLC (for the benefit of its customers) | 47% | |
| Wells Fargo Clearing Services, LLC (for the benefit of its customers) | 25% | |
| MLP & Energy Infrastructure Fund | ||
| Institutional Class | ||
| Morgan Stanley Smith Barney, LLC (for the benefit of its customers) | 36% | |
| A Class Shares | ||
| Morgan Stanley Smith Barney, LLC (for the benefit of its customers) | 61% | |
| C Class Shares | ||
| Morgan Stanley Smith Barney, LLC (for the benefit of its customers) | 57% | |
| Ultra Shares | ||
| National Financial Services, LLC (for the benefit of its customers) | 38% | |
| SEI Private Trust Co. (for the benefit of its customers) | 62% | |
| Broadmark Tactical Plus Fund | ||
| Institutional Shares | ||
| National Financial Services, LLC (for the benefit of its customers) | 90% | |
| Ultra Shares | ||
| National Financial Services, LLC (for the benefit of its customers) | 91% |
A beneficial owner of 25% or more of a Fund’s outstanding shares may be considered a controlling person of the Fund. That shareholder’s vote could have a more significant effect on matters presented at a shareholders’ meeting.
61
| WESTWOOD FUNDS |
5. Derivative Transactions
The following is a summary of the fair value of derivative instruments held by the Broadmark Tactical Growth Fund and Broadmark Tactical Plus Fund as of December 31, 2022 presented on the Statements of Assets and Liabilities.
| Investments, | ||||||||
| at value for | Unrealized | |||||||
| purchased | depreciation for | |||||||
| Type of Derivative | options | future contracts | ||||||
| Broadmark Tactical Growth Fund | ||||||||
| Equity Risk Exposure | $ | — | $ | (628,238 | ) | |||
| Broadmark Tactical Plus Fund | ||||||||
| Equity Risk Exposure | $ | 58,538 | $ | — | ||||
Amounts designated as “—” are $0 or have been rounded to $0.
| * | Total fair value is presented by Primary Risk Exposure. For future contracts, the amounts represents their cumulative appreciation/depreciation, which includes movements of variation margin. |
The following is a summary of the effect of derivatives instruments for Broadmark Tactical Growth Fund, MLP Energy & Infrastructure Fund and Broadmark Tactical Plus Fund on the Statements of Operations for the period ended December 31, 2022:
| Realized Gain (Loss) on Derivatives Recognized as Result of Operations | ||||||||||||||||
| Net realized | Net realized | Net realized | Net realized | |||||||||||||
| gains on | gains (losses) | losses on | gains (losses) | |||||||||||||
| purchased | on written | long futures | on short futures | |||||||||||||
| Equity Risk Exposure: | options | options | contracts | contracts | ||||||||||||
| Broadmark Tactical Growth Fund | $ | — | $ | — | $ | — | $ | (3,384,975 | ) | |||||||
| MLP & Energy Infrastructure Fund | — | 1,283,377 | — | — | ||||||||||||
| Broadmark Tactical Plus Fund | 2,042,238 | (212,296 | ) | (5,619,531 | ) | 13,156,845 | ||||||||||
| Change in Unrealized Appreciation | ||||||||||||||||
| (Depreciation) on Derivatives Recognized as a | ||||||||||||||||
| Result of Operations | ||||||||||||||||
| Net Change | ||||||||||||||||
| in Unrealized | Net Change | Net Change | ||||||||||||||
| Appreciation | in Unrealized | in Unrealized | ||||||||||||||
| on Purchased | Depreciation on | Depreciation on | ||||||||||||||
| Equity Risk Exposure: | Options | Long Futures | Short Futures | |||||||||||||
| Broadmark Tactical Growth | $ | — | $ | 628,238 | $ | — | ||||||||||
| Broadmark Tactical Plus Fund | 40,727 | — | (26,183 | ) | ||||||||||||
Amounts designated as “—” are $0 or have been rounded to $0.
62
| WESTWOOD FUNDS |
Offsetting Assets and Liabilities:
The Funds are required to disclose the impact of offsetting assets and liabilities represented in the Statements of Assets and Liabilities to enable users of the financial statements to evaluate the effect or potential effect of netting arrangements on its financial position for recognized assets and liabilities. These recognized assets and liabilities are financial instruments and derivative instruments that are either subject to an enforceable master netting arrangement or similar agreement or meet the following right of setoff criteria: the amounts owed by the Tactical Growth Fund and Tactical Plus Fund to another party are determinable, the Fund has the right to set off the amounts owed with the amounts owed by the other party, the Tactical Growth Fund and Tactical Plus Fund intend to set off, and the Fund’s right of setoff is enforceable at law.
A Fund is subject to various netting arrangements with select counterparties (“Master Agreements”). Master Agreements govern the terms of certain transactions, and reduce the counterparty risk associated with relevant transactions by specifying credit protection mechanisms and providing standardization that improves legal certainty. Since different types of transactions have different mechanics and are sometimes traded out of different legal entities of a particular counterparty organization, each type of transaction may be covered by a different Master Agreement, resulting in the need for multiple agreements with a single counterparty. As the Master Agreements are specific to unique operations of different asset types, they allow a Fund to close out and net its total exposure to a specific counterparty entity in the event of a default with respect to all the transactions governed under a single agreement with a specific counterparty entity.
Master Agreements can also help limit counterparty risk by specifying collateral posting arrangements at pre-arranged exposure levels. Under the Master Agreements, collateral is routinely transferred if the total net exposure to certain transactions (net of existing collateral already in place) governed under the relevant Master Agreement with a counterparty in a given account exceeds a specified threshold, which typically ranges from zero to $250,000 depending on the counterparty and the type of Master Agreement. United States Treasury Securities and U.S. dollar cash are generally the preferred forms of collateral. Securities and cash pledged as collateral are reflected as assets in the Statements of Assets and Liabilities as either a component of investments at value (securities) or deposits due from counterparties (cash). Cash collateral received is not typically held in a segregated account and as such is reflected as a liability in the Statements of Assets and Liabilities as deposits due to counterparties. The market value of any securities received as collateral is not reflected as a component of net asset value. A Fund’s overall exposure to counterparty risk can change substantially within a short period, as it is affected by each transaction subject to the relevant Master Agreement.
Customer account agreements and related addendums govern cleared derivatives transactions such as futures, options on futures, and cleared Over The Counter (“OTC”) derivatives. Cleared derivative transactions require posting of initial margin as determined by each relevant clearing agency which is segregated at a broker account registered with the Commodities Futures Trading Commission (“CFTC”), or the applicable regulator. In the U.S., counterparty risk is believed to be reduced as creditors of the futures broker do not have claim to Fund assets in the segregated account. Additionally, portability of exposure in the event of default further reduces risk to the Funds. Variation margin, or changes in market value, are exchanged daily, but generally may not be netted between futures and cleared OTC derivatives.
International Swaps and Derivatives Association, Inc. Master Agreements and Credit Support Annexes (“ISDA Master Agreements”) govern OTC financial derivative transactions entered into by a Fund and select counterparties. ISDA Master Agreements maintain provisions for general obligations, representations, agreements, collateral and events of default or termination. Events of termination include conditions that may entitle counterparties to elect to terminate early and cause settlement of all outstanding transactions under the applicable ISDA Master Agreement. Any election to terminate early could be material to the financial statements. In limited circumstances, the ISDA Master Agreement may contain additional provisions that add additional counterparty protection beyond coverage of existing daily exposure if the counterparty has a decline in credit quality below a predefined level. These amounts, if any, may be segregated with a third party custodian.
63
| WESTWOOD FUNDS |
The following table provides a summary of offsetting financial liabilities and derivatives and the effect of derivative instruments on the Statements of Assets and Liabilities as of December 31, 2022:
| Gross Asset | ||||||||||||||||
| (Liability) as | ||||||||||||||||
| Presented in | Financial | |||||||||||||||
| the Statement | Instruments | Cash Collateral | ||||||||||||||
| of Assets and | (Received) | (Received) | ||||||||||||||
| Liabilities | Pledged* | Pledged | Net Amount | |||||||||||||
| Broadmark Tactical Growth Fund | ||||||||||||||||
| Variation Margin on Futures Contracts | $ | 114,487 | $ | — | $ | — | * | $ | — | |||||||
| * | Any over-collateralization of total financial instruments is not shown. Collateral amounts can be found on the Statements of Assets and Liabilities as Cash collateral for futures short. |
The following is a summary of the average monthly notional value of futures contracts and options purchased and sold by the Funds for the year ended December 31, 2022, as well as the respective notional amount outstanding as of December 31, 2022:
| Notional Value | ||||||||
| Average | outstanding at | |||||||
| Monthly | December 31, | |||||||
| Notional Value | 2022 | |||||||
| Broadmark Tactical Growth Fund | ||||||||
| Futures contracts sold | $ | 3,546,688 | $ | 41,119,650 | ||||
| MLP & Energy Infrastructure Fund | ||||||||
| Written call options | $ | 15,032,748 | $ | — | ||||
| Broadmark Tactical Plus Fund | ||||||||
| Futures contracts purchased | $ | 7,831,410 | $ | — | ||||
| Futures contracts sold | 26,473,537 | — | ||||||
| Written put options | 1,698,813 | — | ||||||
| Purchased put options | 43,790,724 | — | ||||||
| Purchased call options | 21,529,156 | 40,540,500 | ||||||
Certain derivative contracts are executed under either standardized netting agreements or, for exchange-traded derivatives, the relevant contracts for a particular exchange that contain enforceable netting provisions. A derivative netting arrangement creates an enforceable right of set-off that becomes effective and affects the realization of settlement on individual assets, liabilities and collateral amounts, only following a specified event of default or early termination. Default events may include the failure to make payments or deliver securities timely, material adverse changes in financial condition or insolvency, the breach of minimum regulatory capital requirements, or loss of license, charter or other legal authorization necessary to perform under the contract.
64
| WESTWOOD FUNDS |
6. Investments in Money Market Funds
In order to maintain sufficient liquidity to implement investment strategies, or for temporary defensive purposes, the Funds may at times invest a significant portion of their assets in shares of money market funds. As of December 31, 2022 Broadmark Tactical Growth Fund and Broadmark Tactical Plus Fund had 79.0% and 99.7%, respectively, of the value of its net assets invested in shares of a money market fund registered under the 1940 Act. The annual report, along with the report of the independent registered public accounting firm is included in the money market fund’s N-CSR available at www.sec.gov. An investment in a money market fund is not insured or guaranteed by the Federal Deposit Insurance Corporation or any other governmental agency, entity or person. While investor losses in money market funds have been rare, they are possible. The Fund, as investors in money market funds, indirectly bear the fees and expenses of those funds, which are in addition to the fees and expenses of the Fund.
7. Contingencies and Commitments
The Funds indemnify the Trust’s officers and Trustees for certain liabilities that might arise from their performance of their duties to the Funds. Additionally, in the normal course of business the Funds enter into contracts that contain a variety of representations and warranties and which provide general indemnifications. The Funds’ maximum exposure under these arrangements is unknown, as this would involve future claims that may be made against the Funds that have not yet occurred. However, based on experience, the Funds expect the risk of loss to be remote.
8. Reorganization Event
On September 14, 2022, Salient Midstream & MLP Fund reorganized into Predecessor Salient MLP & Energy Infrastructure Fund, a series of Predecessor Salient MF Trust. During the reorganization, shareholders of the Salient Midstream & MLP Fund received Class A shares of Predecessor Salient MLP & Energy Infrastructure Fund equal to the aggregate net asset value of their holdings of Salient Midstream & MLP Fund, a statutory trust registered as a non-diversified, closed-end management investment company.
The reorganization was accomplished by a tax free exchange of 17,755,671 shares of Salient Midstream & MLP Fund (valued at $161,677,813) for 21,251,027 Class A shares of the Predecessor Salient MLP & Energy Infrastructure Fund. The investment portfolio of Salient Midstream & MLP Fund with a fair value of $101,405,538 and an unadjusted cost basis of $74,010,049 (cost basis of $70,627,425, adjusted for cumulative return of capital) was the principal asset acquired by the Predecessor Salient MLP & Energy Infrastructure Fund. For financial reporting purposes, assets received and shares issued by Predecessor Salient MLP & Energy Infrastructure Fund were recorded at fair value; however, the cost basis of the investments received from Salient Midstream MLP Fund was carried forward to align ongoing reporting of Predecessor MLP & Energy Infrastructure Fund’s realized and unrealized gains and losses with amounts distributable to shareholders for tax purposes. Salient Midstream MLP Fund’s net assets at that date ($161,677,813), including unadjusted unrealized appreciation of $27,395,489 (unrealized appreciation of $30,778,113, adjusted for cumulative return of capital), were combined with those of Predecessor MLP & Energy Infrastructure Fund. The aggregate net assets of Predecessor MLP & Energy Infrastructure Fund immediately before the acquisition were $967,862,476. 70% of the costs associated with the Reorganization were paid by Salient Midstream MLP Fund, and 30% of the costs associated with the Reorganization were paid by Predecessor Salient MLP & Energy Infrastructure Fund.
The Salient MLP & Energy Infrastructure Fund incurred extraordinary legal fees during the fiscal year ended December 31, 2022 that were related to the reorganization of Salient Midstream & MLP Fund into Predecessor Salient MLP & Energy Infrastructure Fund and the reorganizations into Ultimus Manager Trust. The amount of these legal fees is $830,218.
65
| WESTWOOD FUNDS |
9. Subsequent Events
The Funds are required to recognize in the financial statements the effects of all subsequent events that provide additional evidence about conditions that existed as of the date of the Statements of Assets and Liabilities. For non-recognized subsequent events that must be disclosed to keep the financial statements from being misleading, the Funds are required to disclose the nature of the event as well as an estimate of its financial effect, or a statement that such an estimate cannot be made. Management has evaluated subsequent events through the issuance of these financial statements and has noted no such events.
66
| WESTWOOD FUNDS |
| REPORT OF INDEPENDENT REGISTERED PUBLIC ACCOUNTING FIRM |
To the Board of Trustees of Ultimus Managers Trust
and the Shareholders of Westwood Salient Global Real Estate Fund, Westwood Salient
Select Income Fund, Westwood Broadmark Tactical Growth Fund, Westwood Salient MLP
& Energy Infrastructure Fund, and Westwood Broadmark Tactical Plus Fund
Opinion on the Financial Statements
We have audited the accompanying statements of assets and liabilities of Westwood Salient Global Real Estate Fund (formerly, Salient Global Real Estate Fund, a series of Forward Funds), Westwood Salient Select Income Fund (formerly Salient Select Income Fund, a series of Forward Funds), Westwood Broadmark Tactical Growth Fund (formerly, Salient Tactical Growth Fund, a series of Forward Funds), Westwood Salient MLP & Energy Infrastructure Fund (formerly Salient MLP & Energy Infrastructure Fund, a series of Salient MF Trust), and Westwood Broadmark Tactical Plus Fund (formerly Salient Tactical Plus Fund, a series of Salient MF Trust), each a series of shares of beneficial interest in Ultimus Managers Trust (the “Funds”), including the schedules of investments, as of December 31, 2022, and the related statements of operations and changes in net assets, and the financial highlights for the year then ended, and the related notes (collectively referred to as the “financial statements”). In our opinion, the financial statements present fairly, in all material respects, the financial position of the Funds as of December 31, 2022, and the results of their operations, the changes in their net assets and their financial highlights for the year then ended, in conformity with accounting principles generally accepted in the United States of America. The statements of changes in net assets for the year ended December 31, 2021 and the financial highlights for each of the years in the four-year period ended December 31, 2021 were audited by other auditors, whose reports dated February 24, 2022 expressed unqualified opinions on such financial statements and financial highlights.
Basis for Opinion
These financial statements are the responsibility of the Funds’ management. Our responsibility is to express an opinion on the Funds’ financial statements based on our audits. We are a public accounting firm registered with the Public Company Accounting Oversight Board (United States) (“PCAOB”) and are required to be independent with respect to the Funds in accordance with the U.S. federal securities law and the applicable rules and regulations of the Securities and Exchange Commission and the PCAOB.
We conducted our audits in accordance with the standards of the PCAOB. Those standards require that we plan and perform the audits to obtain reasonable assurance about whether the financial statements are free of material misstatement, whether due to error or fraud. The Funds are not required to have, nor were we engaged to perform, an audit of their internal control over financial reporting. As part of our audits we are required to obtain an understanding of internal control over financial reporting but not for the purpose of expressing an opinion on the effectiveness of the Funds’ internal control over financial reporting. Accordingly, we express no such opinion.
67
| WESTWOOD FUNDS |
Our audits included performing procedures to assess the risk of material misstatement of the financial statements, whether due to error or fraud, and performing procedures that respond to those risks. Such procedures included examining, on a test basis, evidence regarding the amounts and disclosures in the financial statements. Our procedures included confirmation of securities owned as of December 31, 2022 by correspondence with the custodian, issuer, brokers, or by other appropriate auditing procedures where replies from brokers were not received. Our audits also included evaluating the accounting principles used and significant estimates made by management, as well as evaluating the overall presentation of the financial statements. We believe that our audits provide a reasonable basis for our opinion.

BBD, LLP
We have served as the auditor of one or more of the Funds in the Ultimus Managers Trust since 2013.
Philadelphia, Pennsylvania
March 1, 2023
68
| WESTWOOD FUNDS |
| CHANGE IN AUDITOR (Unaudited) |
Prior to November 18 2022, KPMG, LLP (“KPMG”) served as independent registered public accounting firm for the Predecessor Forward Funds and Predecessor Salient MF Funds. The financial statements and notes thereto incorporated by reference for the Predecessor have been audited by KPMG, as indicated in their report with respect thereto, and are incorporated by reference in reliance on the authority of their report as experts in accounting and auditing. For the fiscal years ended December 31, 2021 and December 31, 2020, KPMG audit reports concerning the Funds contained no adverse opinion or disclaimer of opinion; nor were its reports qualified or modified as to uncertainty, audit scope, or accounting principles.
In connection with its audits for the fiscal years ended December 31, 2021 and December 31, 2020, there were no disagreements between Forward Funds and Salient MF Funds and KPMG on any matter of accounting principles or practices, financial statement disclosure or auditing scope or procedure which, if not resolved to the satisfaction of KPMG, would have caused it to make reference to the disagreements in its report on the financial statements for such periods. In addition, there were no reportable events of the kind described in Item 304(a)(1)(v) of Regulation S-K under the Securities Exchange Act of 1934, as amended.
BBD, LLP (“BBD”), located at 1835 Market Street, 3rd Floor, Philadelphia, PA, 19103, serves as the independent registered public accounting firm for the Funds. During the Funds’ fiscal years ended December 31, 2021 and December 31, 2020, neither the Registrant nor anyone on its behalf consulted BBD concerning (i) the application of accounting principles to a specified transaction, either completed or proposed, or the type of audit opinion that might be rendered on the Registrant’s financial statements or (ii) the subject of a disagreement (as defined in paragraph (a) (1) (iv) of Item 304 of Regulation S-K) or reportable events (as described in paragraph (a) (1) (v) of said Item 304).
69
| WESTWOOD FUNDS |
| ABOUT YOUR FUNDS’ EXPENSES (Unaudited) |
We believe it is important for you to understand the impact of costs on your investment. As a shareholder of the Funds, you incur two types of costs: (1) transaction costs, possibly including sales charges (loads) and redemption fees, and (2) ongoing costs, including management fees, class-specific expenses (such as administrative services fees and/or Rule 12b-1 fees) and other operating expenses. The following examples are intended to help you understand your ongoing costs (in dollars) of investing in the Funds and to compare these costs with the ongoing costs of investing in other mutual funds.
A mutual fund’s ongoing costs are expressed as a percentage of its average net assets. This figure is known as the expense ratio. The expenses in the table below are based on an investment of $1,000 made at the beginning of the most recent period (July 1, 2022) and held until the end of the period (December 31, 2022).
The table below illustrates each Fund’s ongoing costs in two ways:
Actual fund return – This section helps you to estimate the actual expenses that you paid over the period. The “Ending Account Value” shown is derived from each Fund’s actual return, and the fourth column shows the dollar amount of operating expenses that would have been paid by an investor who started with $1,000 in the Funds. You may use the information here, together with the amount you invested, to estimate the expenses that you paid over the period.
To do so, simply divide your account value by $1,000 (for example, an $8,600 account value divided by $1,000 = 8.6), then multiply the result by the number given for the Funds under the heading “Expenses Paid During Period.”
Hypothetical 5% return – This section is intended to help you compare each Fund’s ongoing costs with those of other mutual funds. It assumes that the Funds had an annual return of 5% before expenses during the period shown, but that the expense ratio is unchanged. In this case, because the return used is not each Fund’s actual return, the results do not apply to your investment. The example is useful in making comparisons because the SEC requires all mutual funds to calculate expenses based on a 5% return. You can assess each Fund’s ongoing costs by comparing this hypothetical example with the hypothetical examples that appear in shareholder reports of other funds.
Note that expenses shown in the table are meant to highlight and help you compare ongoing costs only. The Funds do not charge transaction fees, such as purchase or redemption fees, nor do they carry a “sales load.”
The calculations assume no shares were bought or sold during the period. Your actual costs may have been higher or lower, depending on the amount of your investment and the timing of any purchases or redemptions.
More information about each Fund’s expenses can be found in this report. For additional information on operating expenses and other shareholder costs, please refer to each Fund’s prospectus.
70
| WESTWOOD FUNDS |
| Ending | ||||||||
| Beginning | Account Value | Expenses Paid | ||||||
| Account Value | December 31, | Net Expense | During | |||||
| July 1, 2022 | 2022 | Ratio (a) | Period (b) | |||||
| Global Real Estate Fund | ||||||||
| Institutional Shares | ||||||||
| Based on Actual Fund Return | $1,000.00 | $953.70 | 1.14% | $5.61 | ||||
| Based on Hypothetical 5% Return (before expenses) | $1,000.00 | $1,019.46 | 1.14% | $5.80 | ||||
| A Class Shares | ||||||||
| Based on Actual Fund Return | $1,000.00 | $952.60 | 1.53% | $7.53 | ||||
| Based on Hypothetical 5% Return (before expenses) | $1,000.00 | $1,017.49 | 1.53% | $7.78 | ||||
| C Class Shares | ||||||||
| Based on Actual Fund Return | $1,000.00 | $949.80 | 2.09% | $10.27 | ||||
| Based on Hypothetical 5% Return (before expenses) | $1,000.00 | $1,014.67 | 2.09% | $10.61 | ||||
| Select Income Fund | ||||||||
| Institutional Shares | ||||||||
| Based on Actual Fund Return | $1,000.00 | $950.50 | 1.09% | $5.36 | ||||
| Based on Hypothetical 5% Return (before expenses) | $1,000.00 | $1,019.71 | 1.09% | $5.55 | ||||
| A Class Shares | ||||||||
| Based on Actual Fund Return | $1,000.00 | $948.20 | 1.48% | $7.27 | ||||
| Based on Hypothetical 5% Return (before expenses) | $1,000.00 | $1,017.74 | 1.48% | $7.53 | ||||
| C Class Shares | ||||||||
| Based on Actual Fund Return | $1,000.00 | $946.20 | 2.05% | $10.06 | ||||
| Based on Hypothetical 5% Return (before expenses) | $1,000.00 | $1,014.87 | 2.05% | $10.41 |
71
| WESTWOOD FUNDS |
| Ending | ||||||||
| Beginning | Account Value | Expenses Paid | ||||||
| Account Value | December 31, | Net Expense | During | |||||
| July 1, 2022 | 2022 | Ratio (a) | Period (b) | |||||
| Broadmark Tactical Growth Fund | ||||||||
| Institutional Shares | ||||||||
| Based on Actual Fund Return | $1,000.00 | $979.20 | 1.48% | $7.38 | ||||
| Based on Hypothetical 5% Return (before expenses) | $1,000.00 | $1,017.74 | 1.48% | $7.53 | ||||
| A Class Shares | ||||||||
| Based on Actual Fund Return | $1,000.00 | $977.00 | 1.86% | $9.27 | ||||
| Based on Hypothetical 5% Return (before expenses) | $1,000.00 | $1,015.83 | 1.86% | $9.45 | ||||
| C Class Shares | ||||||||
| Based on Actual Fund Return | $1,000.00 | $974.70 | 2.43% | $12.09 | ||||
| Based on Hypothetical 5% Return (before expenses) | $1,000.00 | $1,012.96 | 2.43% | $12.33 | ||||
| MLP & Energy Infrastructure Fund | ||||||||
| Institutional Shares | ||||||||
| Based on Actual Fund Return | $1,000.00 | $1,105.90 | 1.45% | $7.70 | ||||
| Based on Hypothetical 5% Return (before expenses) | $1,000.00 | $1,017.90 | 1.45% | $7.37 | ||||
| A Class Shares | ||||||||
| Based on Actual Fund Return | $1,000.00 | $1,105.20 | 1.69% | $8.97 | ||||
| Based on Hypothetical 5% Return (before expenses) | $1,000.00 | $1,016.69 | 1.69% | $8.59 | ||||
| C Class Shares | ||||||||
| Based on Actual Fund Return | $1,000.00 | $1,100.80 | 2.44% | $12.92 | ||||
| Based on Hypothetical 5% Return (before expenses) | $1,000.00 | $1,012.91 | 2.44% | $12.38 | ||||
| Ultra Shares | ||||||||
| Based on Actual Fund Return | $1,000.00 | $1,106.20 | 1.37% | $7.27 | ||||
| Based on Hypothetical 5% Return (before expenses) | $1,000.00 | $1,018.30 | 1.37% | $6.97 |
72
| WESTWOOD FUNDS |
| Ending | ||||||||
| Beginning | Account Value | Expenses Paid | ||||||
| Account Value | December 31, | Net Expense | During | |||||
| July 1, 2022 | 2022 | Ratio (a) | Period (b) | |||||
| Broadmark Tactical Plus Fund | ||||||||
| Institutional Shares | ||||||||
| Based on Actual Fund Return | $1,000.00 | $1,016.70 | 1.39% | $7.07 | ||||
| Based on Hypothetical 5% Return (before expenses) | $1,000.00 | $1,018.20 | 1.39% | $7.07 | ||||
| A Class Shares | ||||||||
| Based on Actual Fund Return | $1,000.00 | $1,014.80 | 1.64% | $8.33 | ||||
| Based on Hypothetical 5% Return (before expenses) | $1,000.00 | $1,016.94 | 1.64% | $8.34 | ||||
| C Class Shares | ||||||||
| Based on Actual Fund Return | $1,000.00 | $1,012.20 | 2.39% | $12.12 | ||||
| Based on Hypothetical 5% Return (before expenses) | $1,000.00 | $1,013.16 | 2.39% | $12.13 | ||||
| F Class Shares | ||||||||
| Based on Actual Fund Return | $1,000.00 | $1,018.10 | 1.08% | $5.49 | ||||
| Based on Hypothetical 5% Return (before expenses) | $1,000.00 | $1,019.76 | 1.08% | $5.50 |
| (a) | Annualized, based on each Fund’s most recent one-half year expenses. |
| (b) | Expenses are equal to each Fund’s annualized net expense ratio multiplied by the average account value over the period, multiplied by 184/365 (to reflect the one-half year period), for Actual and Hypothetical Return information, respectively. |
73
| WESTWOOD FUNDS |
| PROXY DISCLOSURE (Unaudited) |
A joint special meeting of the shareholders of the Funds was held on November 4, 2022 for a Proxy Statement dated October 4, 2022.
Proposal 1: To approve the Agreement and Plan of Reorganization, which provides for the reorganization of the Salient Global Real Estate Fund into the Westwood Salient Global Real Estate Fund, a newly created series of Ultimus Managers Trust.
| Shares represent for quorum purposes: | 925,097 | 50.26% | ||
| For: | 710,942 | 76.9% | ||
| Against: | 23,637 | 2.6% | ||
| Abstain: | 190,518 | 20.6% |
Proposal 1: To approve the Agreement and Plan of Reorganization, which provides for the reorganization of the Salient Tactical Growth Fund into the Westwood Broadmark Tactical Growth Fund, a newly created series of Ultimus Managers Trust.
| Shares represent for quorum purposes: | 7,170,054 | 67.32% | ||
| For: | 7,140,842 | 99.6% | ||
| Against: | 8,608 | 0.1% | ||
| Abstain: | 20,604 | 0.3% |
Proposal 1: To approve the Agreement and Plan of Reorganization, which provides for the reorganization of the Salient MPL Energy & Infrastructure Fund into the Westwood Salient MPL Energy & Infrastructure Fund, a newly created series of Ultimus Managers Trust.
| Shares represent for quorum purposes: | 81,223,247 | 55.27% | ||
| For: | 80,457,384 | 99.1% | ||
| Against: | 188,767 | 0.2% | ||
| Abstain: | 577,096 | 0.7% |
Proposal 1: To approve the Agreement and Plan of Reorganization, which provides for the reorganization of the Salient Tactical Plus Fund into the Westwood Broadmark Tactical Plus Fund, a newly created series of Ultimus Managers Trust.
| Shares represent for quorum purposes: | 5,001,982 | 82.28% | ||
| For: | 5,001,982 | 100.0% | ||
| Against: | 0 | 0.0% | ||
| Abstain: | 0 | 0.0% |
74
| WESTWOOD FUNDS |
A joint special meeting was held original on November 4, 2022 postponed to November 11, 2022 for a Proxy Statement dated October 4, 2022.
Proposal 1: To approve the Agreement and Plan of Reorganization, which provides for the reorganization of the Salient Select Income Fund into the Westwood Salient Select Income Fund, a newly created series of Ultimus Managers Trust.
| Shares represent for quorum purposes: | 6,747,883 | 52.43% | ||
| For: | 5,262,862 | 78.0% | ||
| Against: | 158,598 | 2.4% | ||
| Abstain: | 1,326,524 | 19.7% |
75
| WESTWOOD FUNDS |
| DISCLOSURE REGARDING APPROVAL OF INVESTMENT ADVISORY AGREEMENT (Unaudited) |
The Board of Trustees (the “Board”) of Ultimus Managers Trust (the “Trust”), including the Independent Trustees voting separately, has reviewed and approved the Investment Advisory Agreement with Westwood Management Corp. (the “Westwood Agreement”) on behalf of the Westwood Salient Global Real Estate Fund, the Westwood Salient Select Income Fund, the Westwood Salient MLP & Energy Infrastructure Fund and the Westwood Broadmark Tactical Growth Fund and the Investment Advisory Agreement with Salient Partners, L.P. (“Salient”, and collectively with Westwood, the “Advisers”) on behalf of the Westwood Broadmark Tactical Plus Fund (collectively, the “Advisory Agreements”) and the Sub-Advisory Agreement between Broadmark Asset Management LLC (the “Sub-Adviser” or “Broadmark”), the Trust and Westwood, on behalf of the Westwood Broadmark Tactical Growth Fund and the Sub-Advisory Agreement between Broadmark, the Trust and Salient, on behalf of the Westwood Broadmark Tactical Plus Fund (collectively, the “Sub-Advisory Agreements”), each for an initial term of two years. The Board approved the Advisory Agreements and the Sub-Advisory Agreements at a meeting held on August 23, 2022 (the “Meeting”), at which all of the Trustees were present.
In deciding whether to approve the Advisory Agreements and Sub-Advisory Agreements, the Board recalled its discussion with representatives of Westwood, Salient and Broadmark during the meeting and prior meetings and its review of the various materials related to the Advisers, the Sub-Adviser and the reorganization. The Board further considered those materials and discussions and numerous other factors, including:
The nature, extent, and quality of the services to be provided by the Advisers and Sub-Adviser. In this regard, the Board considered the responsibilities the Advisers and Sub-Adviser, as applicable, would have under the respective Advisory Agreements and Sub-Advisory Agreements and the scope of services that the Advisers and Sub-Adviser, as applicable, would provide to the Westwood Salient Global Real Estate Fund, Westwood Salient Select Income Fund, Westwood Salient MLP & Energy Infrastructure Fund, Westwood Broadmark Tactical Growth Fund and Westwood Broadmark Tactical Plus Fund (collectively, the “Westwood Salient Funds”) including, without limitation, providing a continuous investment program, adhering to the applicable Westwood Salient Fund’s investment restrictions, complying with the Trust’s policies and procedures, and voting proxies on behalf of the Westwood Salient Funds. The Board considered the qualifications and experience of the individuals who will provide services to the Westwood Salient Funds. The Board considered its discussion with representatives of the Advisers and Sub-Adviser regarding the investment objective and strategies for each Westwood Salient Fund and their plans for implementing such strategies and the fact that each of the foregoing was expected to be the same as each Westwood Salient Fund’s respective Predecessor Salient Fund (as defined below). The Board considered the information from the Advisers and Sub-Adviser regarding prior experience of certain personnel in managing the predecessor funds, Salient MLP & Energy Infrastructure Fund and Salient Tactical Plus Fund, each a series of Salient MF Trust and Salient Global Real Estate Fund, Salient Select Income Fund, and Salient Tactical Growth Fund, each a series of the Forward Funds (the five funds collectively, the “Predecessor Salient Funds”). In addition, the Board considered the Advisers’ and Sub-Adviser’s approach to risk management and general oversight of the Westwood Salient Funds’ investment program. The Board concluded that the quality, extent, and nature of the services to be provided by the Advisers and Sub-Adviser were satisfactory.
The investment performance of Advisers, Sub-Adviser and the Predecessor Salient Funds. The Board considered the historical performance of Salient and Broadmark in management of the Predecessor Salient Funds. The Board recalled the information provided by the Advisers regarding the Predecessor Salient Fund’s performance and explaining their expectations and strategies for the future. The Board determined that the Predecessor Salient Funds’ historical performance was satisfactory, or, where the Predecessor Salient Funds’ performance was materially below their benchmarks and/or peer groups, the Board was satisfied by the reasons for the underperformance and/or the steps to be taken by the Advisers and Sub-Adviser, as applicable, in an effort to improve the performance of the Westwood Salient Funds.
76
| WESTWOOD FUNDS |
The costs of the services to be provided and profits to be realized by the Advisers and Sub-adviser and their respective affiliates from the relationship with the Westwood Salient Funds. In this regard, the Board considered the proposed management fee and proposed overall expense ratio for each Westwood Salient Fund, each as compared to its respective Predecessor Salient Fund and as compared to other funds in its custom peer group and Morningstar category. It was noted that the Advisers had proposed a reduction in the management fee for each Westwood Salient Fund as compared to the respective Predecessor Salient Funds. The Board also reviewed and considered the advisory fees charged by the Advisers to other clients with comparable mandates to Westwood Salient Funds and considered any differences in management fees and took into account the respective demands, resources and complexity associated with each. The Board considered the anticipated profitability of the Advisers from the Westwood Salient Funds and the potential indirect benefits that the Advisers would receive from their management of the Westwood Salient Funds. The Board discussed the Advisers’ financial condition, and that of its (or anticipated) parent company, and their ability to satisfy their financial commitments to the Westwood Salient Funds. The Board also considered potential benefits for the Advisers in managing the Westwood Salient Funds, including, reputational benefits and the potential for growth of the Advisers’ separate account business or other business lines through association with the Westwood Salient Funds, and concluded that such benefits are reasonable and typical of those potentially enjoyed by managers of publicly offered mutual funds. The Board concluded that the proposed management fee and total expense limit for each Westwood Salient Fund were reasonable in light of the nature and quality of the services to be provided to the Westwood Salient Fund.
With respect to the advisory fee to be paid to the Sub-Adviser, the Board considered that the Sub-Adviser’s sub-advisory fee for sub-advising the Westwood Broadmark Tactical Growth Fund and Westwood Broadmark Tactical Plus Fund is solely the responsibility of the applicable Adviser and that the Westwood Broadmark Tactical Growth Fund and Westwood Broadmark Tactical Plus Fund are not responsible for paying the Sub-Adviser. The Board also considered information regarding the advisory fees charged by the Sub-Adviser to its other clients. The Board also considered potential benefits for the Sub -Adviser in managing the relevant Westwood Salient Funds, including, reputational benefits and the potential for growth of the Sub-Adviser’s separate account business or other business lines through association with the Westwood Salient Funds, and concluded that such benefits are reasonable and typical of those potentially enjoyed by managers of publicly offered mutual funds. The Board considered the financial information the Sub-Adviser had provided and based on the information provided, the Board determined that it was reasonable to conclude that the Sub-Adviser’s profitability with respect to each relevant Westwood Salient Fund was not excessive and that the sub -advisory fee to be received by the Sub-Adviser out of the management fee for each Westwood Broadmark Tactical Growth Fund and Westwood Broadmark Tactical Plus Fund was reasonable in light of the nature and quality of services to be provided to such fund by the Sub-Adviser.
The extent to which the Westwood Salient Funds and their investors would benefit from economies of scale. The Board considered economies of scale in connection with the Westwood Salient Funds and the extent to which the benefits of any such economies of scale may be shared with the Westwood Salient Funds and fund shareholders. The Board recognized that economies of scale are difficult to identify and quantify and are rarely identifiable on a fund-by-fund basis. The Board considered the reduction in the management and expense cap for each Westwood Salient Fund as compared to its respective Predecessor Salient Fund. The Board noted the Advisers’ proposed expense limitation agreements and that the Advisers, and not the relevant Westwood Salient Funds, would pay the sub-advisory fees. The Board noted that it will have the opportunity to periodically re-examine whether the Westwood Salient Funds have achieved economies of scale, as well as the appropriateness of management fees and sub-advisory fees payable to the Advisers and Sub-Adviser, respectively. Based on this evaluation, the Board concluded that the proposed advisory and sub-advisory fee, as applicable, for each Westwood Salient Fund were reasonable in light of the information that was provided to the Board with respect to economies of scale.
After further discussion of the factors noted above and in reliance of the information provided by Westwood, Broadmark, Salient and Trust Management and taking into account the totality of all factors discussed and information presented, the Board indicated its desire to approve the Advisory Agreements and Sub-Advisory Agreements. It was noted that in the Trustees’ deliberations regarding the approval of the Advisory Agreements and Sub-Advisory
77
| WESTWOOD FUNDS |
Agreements, the Trustees did not identify any particular information or factor that was all-important or controlling, and that each individual Trustee may have attributed different weights to the various factors listed above. After full consideration of the above factors as well as other factors, the Board unanimously approved the applicable Investment Advisory Agreement and Sub-Advisory Agreement, if any, for each of the Funds.
78
| WESTWOOD FUNDS |
| TRUSTEES AND OFFICERS OF ULTIMUS MANAGERS TRUST (Unaudited) |
Name and Year of Birth | Length of Time Served | Position(s) held with Trust | Principal Occupation(s) During Past 5 Years | Number of Funds in the Trust Overseen By Trustee | Directorship(s) of Public Companies Held By Trustee During Past 5 Years |
| Interested Trustees: | |||||
| David R. Carson*^ Year of Birth: 1958 | 2021 to present | Trustee (2021 to present) | Senior Vice President and Director of Client Strategies of Ultimus Fund Solutions, LLC (2013 to present); and President of Unified Series Trust (2017 to 2020) | 33 | Interested Trustee of 31 series of the Unified Series Trust (a registered management company) (2020 to present) |
| 2021 to present and April 2013 to October 2013 | Vice President | ||||
| 2013 to 2021 | President and Principal Executive Officer | ||||
| Independent Trustees: | |||||
| Janine L. Cohen^ Year of Birth: 1952 | Since 2016 | Chairperson (2019 to present)
Trustee (2016 to present) | Retired since 2013; previously Chief Financial Officer from 2004 to 2013 and Chief Compliance Officer from 2008 to 2013 at AER Advisors, Inc. | 33 | n/a |
| David M. Deptula^ Year of Birth: 1958 | Since 2012 | Trustee (2012 to present) | Vice President of Legal and Special Projects at Dayton Freight Lines, Inc. since 2016 | 33 | n/a |
| Robert E. Morrison^ Year of Birth: 1957 | Since 2019 | Trustee (2019 to present; and previously 2012 to 2012) | Managing Director at Midwest Trust and FCI Advisors (2022 to present); Senior Vice President and National Practice Lead for Investment, Huntington National Bank/ Huntington Private Bank (2014 to 2022); CEO, CIO, President of 5 Star Investment Management Company (2006 to 2014) | 33 | n/a |
| Clifford N. Schireson^ Year of Birth: 1953 | Since 2019 | Trustee (2019 to present) | Retired; Founder of Schireson Consulting, LLC (2017 to 2022); Director of Institutional Services for Brandes Investment Partners, LP (2004 to 2017) | 33 | Trustee of the San Diego City Employees’ Retirement System (2019 to present) |
| Jacqueline A. Williams^ Year of Birth: 1954 | Since 2019 | Trustee (2019 to present) | Managing Member of Custom Strategy Consulting, LLC (2017 to present); Managing Director of Global Investment Research (2005 to 2017), Cambridge Associates, LLC | 33 | n/a |
| ^ | Address is 225 Pictoria Drive, Suite 450, Cincinnati, Ohio 45246 |
| * | Mr. Carson is considered an “interested person” of the Trust within the meaning of Section (2)(a)(19) of the Investment Company Act of 1940, as amended, because of his relationship with the Trust’s Administrator, Transfer Agent, and Distributor. Mr. Carson was President of the Trust from October 2013 to January 2021 and Vice President of the Trust from April 2013 to October 2013. |
79
| WESTWOOD FUNDS |
| TRUSTEES AND OFFICERS OF ULTIMUS MANAGERS TRUST (Unaudited) |
| Name and Year of Birth | Length of Time Served | Position(s) held with Trust | Principal Occupation(s) During Past 5 Years |
| Executive Officers: | |||
| Todd E. Heim^ Year of Birth: 1967 | 2021 to present
2014 to 2021 | President
Vice President | Vice President , Relationship Management (2018 to present) and Assistant Vice President, Client Implementation Manager with Ultimus Fund Solutions, LLC (2014 to 2018); Naval Flight Officer in United States Navy (1989 to 2017) |
| Jennifer L. Leamer^ Year of Birth: 1976 | 2014 to present
April 2014 to October 2014 | Treasurer
Assistant Treasurer | Senior Vice President of Fund Accounting (2020 to present) and Mutual Fund Controller of Ultimus Fund Solutions, LLC (2014 to 2020) |
| Daniel D. Bauer^ Year of Birth: 1977 | 2016 to present | Assistant Treasurer | Vice President of Fund Accounting (2022 to present), Assistant Vice President of Fund Accounting (2020 to 2022), and Assistant Mutual Fund Controller (2015 to 2020) of Ultimus Fund Solutions, LLC |
| Angela A. Simmons^ Year of Birth: 1975 | January 2022 to present | Assistant Treasurer | Vice President of Financial Administration (2022 to present) and Assistant Vice President, Financial Administration (2015 to 2022) of Ultimus Fund Solutions, LLC |
| Khimmara Greer^ Year of Birth: 1983 | October 2021 to present | Secretary | Vice President and Senior Legal Counsel of Ultimus Fund Solutions, LLC (2021 to present); Vice President, Asset Servicing – Regulatory Administration of The Bank of New York Mellon (2019 to 2021); Vice President and Counsel of State Street Bank and Trust Company (2015 to 2019) |
| David K. James^ Year of Birth: 1970 | October 2021 to present
July 2021 to October 2022 | Assistant Secretary
Secretary | Executive Vice President and Chief Legal and Risk Officer of Ultimus Fund Solutions, LLC (2018 to present); Managing Director and Managing Counsel of State Street Bank and Trust Company (2009 to 2018) |
| Natalie S. Anderson^ Year of Birth: 1975 | 2016 to present | Assistant Secretary | Legal Administration Manager (2016 to present) and Paralegal (2015 to 2016) of Ultimus Fund Solutions, LLC |
| Gweneth K. Gosselink^ Year of Birth: 1955 | 2020 to present | Chief Compliance Officer | Assistant Vice President, Compliance Officer at Ultimus Fund Solutions, LLC (2019 to present); CCO Consultant at GKG Consulting, LLC (2019 to 2021); Chief Operating Officer & CCO at Miles Capital, Inc. (2013 to 2019) |
| Martin Dean^ Year of Birth: 1963 | 2020 to present | Assistant Chief Compliance Officer | Senior Vice President, Head of Fund Compliance (2020 to present) and Vice President & Director of Fund Compliance of Ultimus Fund Solutions, LLC (2016 to 2020) |
| 2019 to 2020 | Interim Chief Compliance Officer | ||
| 2016 to 2017 | Assistant Chief Compliance Officer | ||
| ^ | Address is 225 Pictoria Drive, Suite 450, Cincinnati, Ohio 45246 |
80
| WESTWOOD FUNDS |
| OTHER INFORMATION (Unaudited) |
The Trust files a complete listing of portfolio holdings for the Funds with the U.S. Securities and Exchange Commission (“SEC”) as of the end of the first and third quarters of each fiscal year as an exhibit to its report on Form N-PORT. The filings are available upon request, by calling 1-877-386-3944. Furthermore, you may obtain a copy of these filings on the SEC’s website at www.sec.gov.
A description of the policies and procedures that the Funds use to vote proxies relating to portfolio securities is available without charge upon request by calling toll-free 1-877-386-3944, or on the SEC’s website at www.sec.gov. Information regarding how the Funds voted proxies relating to portfolio securities during the period ended June 30, 2022 will be available on or about August 31, 2022 without charge upon request by calling 1-877-386-3944, or on the SEC’s website at www.sec.gov.
| OTHER FEDERAL TAX INFORMATION (Unaudited) |
For the fiscal year ended December 31, 2022, Broadmark Tactical Growth Fund has designated $16,051,488 and as of tax year ended November 30, 2022 Broadmark Tactical Plus Fund $82,636 as long-term capital gain distributions.
Qualified Dividend Income – The Fund has designated the following of its ordinary income dividends, or up to the maximum amount of such dividends allowable pursuant to the Internal Revenue Code, as qualified dividend income eligible for the reduced tax rate of 15%. For the year ended December 31, 2022, Global Real Estate Fund 13.69% and Select Income Fund 59.65%, respectively. Global Real Estate Fund and Select Income Fund had Qualified Dividend Income of 71.21% and 40.35%, respectively.
Dividends Received Deduction – Corporate shareholders are generally entitled to take the dividends received deduction on the portion of the Fund’s dividend distributions that qualifies under tax law. For the fiscal year ended December 31, 2022 the following Funds had the following ordinary income dividends qualified for the corporate dividends received deduction.
| Dividend Received | ||
| Fund | Deduction | |
| MLP & Energy Infrastructure Fund | 0.00% | |
| Broadmark Tactical Plus Fund | 0.00% | |
| Global Real Estate Fund | 0.00% | |
| Select Income Fund | 42.81% | |
| Broadmark Tactical Growth Fund | 0.00% |
81
[This Page Intentionally Left Blank]
[This Page Intentionally Left Blank]
[This Page Intentionally Left Blank]
The Westwood Funds
P.O. Box 541150
Omaha, NE 68154
1-877-FUND-WHG
www.westwoodfunds.com
Advisor:
Westwood Management Corp.
200 Crescent Court, Suite 1200
Dallas, TX 75201
Distributor:
Ultimus Fund Distributors, LLC
225 Pictoria Drive
Suite 450
Cincinnati, OH 45246
Administrator:
Ultimus Fund Solutions, LLC
225 Pictoria Drive
Suite 450
Cincinnati, OH 45246
Legal Counsel:
Kilpatrick Townsend & Stockton LLP
4208 Six Forks Road
Suite 1400
Raleigh, NC 27609
Independent Registered Public Accounting Firm:
BBD, LLP
1835 Market Street, 3rd Floor
Philadelphia, PA 19103
This information must be preceded or accompanied by a current
prospectus for the Funds.
Westwood-AR-22
| (b) | Not applicable. |
| Item 2. | Code of Ethics. |
As of the end of the period covered by this report, the registrant has adopted a code of ethics that applies to the registrant’s principal executive officer, principal financial officer, principal accounting officer or controller, or persons performing similar functions, regardless of whether these individuals are employed by the registrant or a third party. Pursuant to Item 13(a)(1), a copy of registrant’s code of ethics is filed as an exhibit to this Form N-CSR. During the period covered by this report, the code of ethics has not been amended, and the registrant has not granted any waivers, including implicit waivers, from the provisions of the code of ethics.
| Item 3. | Audit Committee Financial Expert. |
The registrant’s board of trustees has determined that the registrant has at least one audit committee financial expert serving on its audit committee. The name of the audit committee financial expert is Janine L. Cohen. Ms. Cohen is “independent” for purposes of this Item.
| Item 4. | Principal Accountant Fees and Services. |
| (a) | Audit Fees. The aggregate fees billed for professional services rendered by the principal accountant for the audit of the registrant’s annual financial statements or for services that are normally provided by the accountant in connection with statutory and regulatory filings or engagements. |
Fiscal year ended 2022: $ 90,000
Fiscal year ended 2021: $189,200
| (b) | Audit-Related Fees. The aggregate fees billed in each of the last two fiscal years for assurance and related services by the principal accountant that are reasonably related to the performance of the audit of the Funds’ financial statements and are not reported under paragraph (a) of this Item on behalf of the Funds. |
Fiscal year ended 2022: $0
Fiscal year ended 2021: $9,765
| (c) | Tax Fees. The aggregate fees billed for professional services rendered by the principal accountant for tax compliance, tax advice, and tax planning are listed below. The services comprising these fees relate to tax preparation of the registrant’s federal income and excise tax returns. |
Fiscal year ended 2022: $20,000
Fiscal year ended 2021: $29,304
| (d) | All Other Fees. No fees were billed in the last fiscal year for products and services provided by the principal accountant, other than the services reported in paragraphs (a) through (c) of this Item. |
(e)(1) The audit committee has not adopted pre-approval policies and procedures described in paragraph (c)(7) of Rule 2-01 of Regulation S-X.
| (e)(2) | None of the services described in paragraph (b) through (d) of this Item were approved by the audit committee pursuant to paragraph (c)(7)(i)(C) of Rule 2-01 of Regulation S-X. |
| (f) | Less than 50% of hours expended on the principal accountant’s engagement to audit the registrant’s financial statements for the most recent fiscal year were attributed to work performed by persons other than the principal accountant’s full-time, permanent employees. |
(g) During the fiscal years ended December 31, 2022 and December 31, 2021, aggregate non-audit fees of $20,000 and $39,069, respectively, were billed by the registrant’s principal accountant for services rendered to the registrant. No non-audit fees were billed in the last fiscal year by the registrant’s principal accountant for services rendered to the registrant’s investment adviser (not including any sub-adviser whose role is primarily portfolio management and is subcontracted with or overseen by another investment adviser), and any entity controlling, controlled by, or under common control with the adviser that provides ongoing services to the registrant.
| (h) | The principal accountant has not provided any non-audit services to the registrant’s investment adviser (not including any sub-adviser whose role is primarily portfolio management and is subcontracted with or overseen by another investment adviser), and any entity controlling, controlled by, or under common control with the investment adviser that provides ongoing services to the registrant. |
| (i) | Not applicable |
| (j) | Not applicable |
Item 5. |
Audit Committee of Listed Registrants. |
Not applicable
| Item 6. | Schedule of Investments. |
(a) Not applicable [schedule filed with Item 1]
(b) Not applicable
| Item 7. | Disclosure of Proxy Voting Policies and Procedures for Closed-End Management Investment Companies. |
Not applicable
| Item 8. | Portfolio Managers of Closed-End Management Investment Companies. |
Not applicable
| Item 9. | Purchases of Equity Securities by Closed-End Management Investment Company and Affiliated Purchasers. |
Not applicable
| Item 10. | Submission of Matters to a Vote of Security Holders. |
There has been no material changes to the manner in which shareholders may recommend nominees to the Registrant’s Board of Trustees or the Nominations & Governance Committee (the “Committee”). The Registrant does not have formal procedures by which shareholders may recommend nominees to the Registrant’s Board of Trustees. While the Registrant does not have formal procedure, the Committee shall to the extent required under applicable law, when identifying potential candidates for the position of Independent Trustee, consider any such candidate recommended by a shareholder.
Item 11. Controls and Procedures.
(a) Based on their evaluation of the registrant’s disclosure controls and procedures (as defined in Rule 30a-3(c) under the Investment Company Act of 1940) as of a date within 90 days of the filing date of this report, the registrant’s principal executive officer and principal financial officer have concluded that such disclosure controls and procedures are reasonably designed and are operating effectively to ensure that material information relating to the registrant, including its consolidated subsidiaries, is made known to them by others within those entities, particularly during the period in which this report is being prepared, and that the information required in filings on Form N-CSR is recorded, processed, summarized, and reported on a timely basis.
(b) There were no changes in the registrant’s internal control over financial reporting (as defined in Rule 30a-3(d) under the Investment Company Act of 1940) that occurred during the period covered by this report that have materially affected, or are reasonably likely to materially affect, the registrant’s internal control over financial reporting.
Item 12. Disclosure of Securities Lending Activities for Closed-End Management Investment Companies.
Not applicable
| Item 13. | Exhibits. |
File the exhibits listed below as part of this Form. Letter or number the exhibits in the sequence indicated.
(1) Any written solicitation to purchase securities under Rule 23c-1 under the Act (17 CFR 270.23c-1) sent or given during the period covered by the report by or on behalf of the registrant to 10 or more persons: Not applicable
(2) Change in the registrant’s independent public accountants: Attached hereto
(b) Certifications required by Rule 30a-2(b) under the Act (17 CFR 270.30a-2(b)): Attached hereto
Exhibit 99.CODE ETH Code of Ethics
Exhibit 99.CERT Certifications required by Rule 30a-2(a) under the Act
Exhibit 99.906CERT Certifications required by Rule 30a-2(b) under the Act
Exhibit 99.IND PUB ACCT Change in the registrant’s independent public accountant
SIGNATURES
Pursuant to the requirements of the Securities Exchange Act of 1934 and the Investment Company Act of 1940, the registrant has duly caused this report to be signed on its behalf by the undersigned, thereunto duly authorized.
| (Registrant) | Ultimus Managers Trust | ||
| By (Signature and Title)* | /s/ Todd E. Heim | ||
| Todd E. Heim, President | |||
| Date | March 9, 2023 | ||
| Pursuant to the requirements of the Securities Exchange Act of 1934 and the Investment Company Act of 1940, this report has been signed below by the following persons on behalf of the registrant and in the capacities and on the dates indicated. | |||
| By (Signature and Title)* | /s/ Todd E. Heim | ||
| Todd E. Heim, Principal Executive Officer | |||
| Date | March 9, 2023 | ||
| By (Signature and Title)* | /s/ Jennifer L. Leamer | ||
| Jennifer L. Leamer, Treasurer and Principal Financial Officer | |||
| Date | March 9, 2023 | ||
* Print the name and title of each signing officer under his or her signature.