UNITED STATES
SECURITIES AND EXCHANGE COMMISSION
Washington, D.C. 20549
FORM N-CSR
CERTIFIED SHAREHOLDER REPORT OF REGISTERED
MANAGEMENT INVESTMENT COMPANY
| Investment Company Act file number | 811-22680 |
| Ultimus Managers Trust |
| (Exact name of registrant as specified in charter) |
| 225 Pictoria Drive, Suite 450 Cincinnati, Ohio | 45246 |
| (Address of principal executive offices) | (Zip code) |
Karen Jacoppo-Wood
| Ultimus Fund Solutions, LLC 225 Pictoria Drive, Suite 450 Cincinnati, Ohio 45246_ |
| (Name and address of agent for service) |
| Registrant's telephone number, including area code: | (513) 587-3400 |
| Date of fiscal year end: | August 31 | |
| Date of reporting period: | August 31, 2023 |
Form N-CSR is to be used by management investment companies to file reports with the Commission not later than 10 days after the transmission to stockholders of any report that is required to be transmitted to stockholders under Rule 30e-1 under the Investment Company Act of 1940 (17 CFR 270.30e-1). The Commission may use the information provided on Form N-CSR in its regulatory, disclosure review, inspection, and policymaking roles.
A registrant is required to disclose the information specified by Form N-CSR, and the Commission will make this information public. A registrant is not required to respond to the collection of information contained in Form N-CSR unless the Form displays a currently valid Office of Management and Budget ("OMB") control number. Please direct comments concerning the accuracy of the information collection burden estimate and any suggestions for reducing the burden to Secretary, Securities and Exchange Commission, 450 Fifth Street, NW, Washington, DC 20549-0609. The OMB has reviewed this collection of information under the clearance requirements of 44 U.S.C. § 3507.
| Item 1. | Reports to Stockholders. |
| (a) |
 |
| BLUE CURRENT GLOBAL DIVIDEND FUND |
| INSTITUTIONAL CLASS (BCGDX) |
| Annual Report |
| August 31, 2023 |
| BLUE CURRENT GLOBAL DIVIDEND FUND LETTER TO SHAREHOLDERS | August 31, 2023 |
Dear Shareholders,
PERFORMANCE SUMMARY
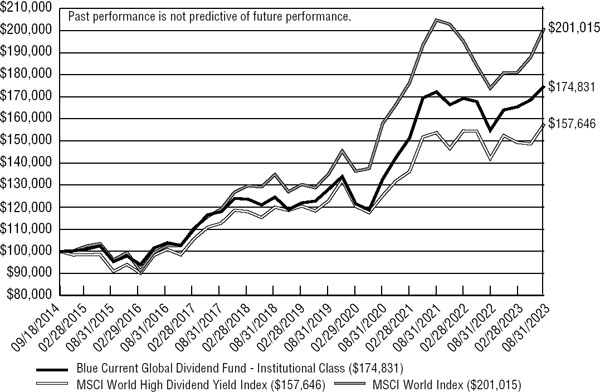
The Blue Current Global Dividend Fund (the “Fund”) returned +12.94% over the last twelve months ended August 31, 2023. The Fund’s benchmark, the MSCI World High Dividend Yield Index, returned +10.95% over the same period. Since inception, the Fund has returned +6.85% annually, which compares to a +5.55% annualized return for the MSCI World High Dividend Yield Index. The MSCI World High Dividend Yield Index most accurately reflects the Fund’s investment objective to invest in high quality, dividend paying stocks globally. However, we are not managing the Fund to track or beat an index. We do not select securities to align with an index, or the underlying sector and country holdings, but rather we aim to construct a portfolio of high quality companies that are committed to dividend growth and offer an attractive yield.
| Total Returns for period ended August 31, 2023 | |||||
| Trailing 1 | Trailing 3 | Trailing 5 | Since | ||
| Fund Name | QTD (Since | Year (Since | Year (Since | Year (Since | Inception |
| (Institutional Share Class) | 05/31/23) | 8/31/22) | 8/31/20) | 8/31/18) | (9/18/14) |
| Blue Current Global Dividend | 3.73% | 12.94% | 9.66% | 7.02% | 6.44% |
| MSCI World High Div Yield Index | 6.08% | 10.95% | 8.00% | 5.61% | 5.21% |
| MSCI World Index | 6.99% | 15.60% | 8.41% | 8.33% | 8.11% |
Source: Bloomberg
Past performance is not predictive of future performance. Investment results and principal value will fluctuate so that shares, when redeemed, may be worth more or less than their original cost. Current performance may be higher or lower than the performance data quoted. Performance data current to the most recent month end are available by calling 1-800-514-3583.
For the full year, the Fund returned +12.94%, which compares to the strategy’s primary benchmark return of +10.95%. The trailing 12-month period ending in August was volatile, encapsulating the Q3 2022 selloff and the eventual recovery that started in October 2022 and persisted through the end of the fund’s fiscal year in August 2023. The Information Technology sector represented an average allocation of 12.4% over the period and returned 33.9%. As compared to the Nasdaq 100 Index’s return of 27.4% over the same period, we feel good about our stock selection but the allocation size to the Information Technology sector created underperformance relative to the broad indices such as the MSCI World Index or S&P 500 Index. In addition to Information Technology sector, the Energy and Healthcare sectors also performed well, returning +29.7% and +22.6%, respectively.
Given the direction of interest rates over the period, it is not surprising that the Utility and Real Estate sectors were laggards during the period, returning -19.5% and -9.8%, respectively. The silver lining was that the Fund’s portfolio had a combined weight of just
1
over 4% to these two sectors. Lastly, the Communication Services sector rounds out the top 3 underperforming sectors, returning +0.1% over the year but represented 3% of the Fund’s portfolio. While we found some interesting ideas across these three sectors over the period, we were fortunate to keep the Fund’s overall allocation small with only a minor impact to performance.
The best performing stock over the one-year period was BE Semiconductor, a Netherlands-based semcap equipment provider that specializes in advanced packaging for semiconductors. We made the investment in September of 2022 and the share price more than doubled over the one-year period. At the time of our purchase, BE Semiconductor was yielding close to 6.0%. A longer standing position, Broadcom, was another top performing position over the period and has been one of the Fund’s top ten holdings for several years. Broadcom’s valuation has benefitted from investor’s heightened focus on Artificial Intelligence (AI) as the company manufactures networking semiconductors that connect the Graphic Processing Units (GPUs) that perform the high-speed analytical calculations supporting AI models. We trimmed this position in recent months. Rounding out the top five performers during the one-year period, Novo-Nordisk, Schlumberger, and BNP Paribas also contributed meaningfully to the Fund’s performance.
Nextera Energy was one of the main detractors from Fund performance. The company’s share price was impacted by higher interest rates and elevated costs associated with their renewable project deployment.
Target Corp was also a detractor over the period due to a broader slowdown in consumer spending on capital goods and the mismanagement of inventory following the pandemic recovery. Other detractors during the period include Reckitt Benckiser, Honeywell International, and Qualcomm.
We are excited to have initiated a new position in Hitachi Ltd over the period. Due to its legacy consumer electronics business, Hitachi is likely a familiar name to many; however, in recent years the company has divested non-core assets to become more focused on fewer end markets, including green energy systems and digital connectivity and automation. We believe the turnaround is still in its infancy but recent growth rates within the core segments are encouraging and should lead to continued margin expansion at the corporate level. The company has a strong balance sheet and initiated a ¥100 billion share repurchase. Based on our forecasts, our entry multiple for the business was close to 14x forward earnings. During the Fund’s fiscal fourth quarter, we initiated a position in Porsche AG. With the decision by Volkswagen to list a minority interest in this iconic car manufacturer, investors finally have the ability to invest directly in Porsche and not via a holding company. We view Porsche as a luxury brand capable of commanding a premium valuation well above its competitors and closer to the luxury goods producers. We believe the brand also has the staying power to compete with the local incumbents in China that are quickly gaining share from Volkswagen and other North America competitors. The company is expected to initiate a dividend in 2024.
2
OUTLOOK SUMMARY
Developed market economies (and Central Banks) have been moving in lockstep with one another over the last several years, however, there is mounting evidence that economic trends in the US may begin to deviate from other major economies. With the interest rates likely peaking and inflation continuing its downward trend, the US Federal Reserve may have orchestrated the white swan soft-landing that was previously considered unthinkable. It is too early to spike the ball as inflation could accelerate again, but core-Consumer Price Index (CPI) has declined for nine of the prior ten months and stands at 4.3% today – August reading. If the US policy makers can curb inflation to levels deemed appropriate (closer to 2%) with the broader economy still intact, then we remain confident that stocks can, at a minimum, hold their gains and potentially advance to prior highs as we approach 2024.
Across the pond, the outlook is not as optimistic as recent economic indicators suggest that Europe is teetering on the brink of a possible recession. A resilient consumer is being more than offset by a manufacturing slowdown in Germany and slower government spending across many regions. Inflation is heading in a supportive direction but remains well above the European Central Bank’s (ECB) goal of 2% and higher than what is being experienced in the US. Europe’s increased dependence on trade relations with China is also hurting economic growth as China struggles with declining growth and a debt-laden property sector. We suspect that the ECB may be closer to lowering rates in order to stimulate growth as compared to the US.
Despite each region’s economic successes (or challenges), the outlook for corporate earnings growth remains upbeat with consensus calling for growth in 2023, and again in 2024 for most of the major regions. In light of the current interest rate environment, the resiliency of corporate profits may be surprising but many large-cap multinationals continue to benefit from economic normalization post the COVID-pandemic. European and Asian economies were well behind the US in their economic reopenings and supply chains continue to normalize contributing to restocking efforts, especially for sectors that were well depleted. Also contributing to their financial successes, public company balance sheets are flush with cash (earning higher yields and offsetting interest expense) and generating enough free cash flow. For these reasons, public companies are thriving while Main Street, privately-owned businesses are struggling as they are more exposed to higher interest rates due to their dependence on bank lending and alternative forms of financing.
Specific to the Fund, we expect our portfolio of global multi-nationals will continue to grow earnings over the next few years as companies benefit from secular tailwinds and continued fundamental improvements in areas still under recovery. Our process highlights companies with strong or improving profit growth, healthy balance sheets, and growing dividend yields which can only be satisfied if the business has ample free cash flow growth. Lastly, we are valuation conscious and seek to invest in businesses when we feel the valuation versus expected earnings growth is compelling. This objective results
3
in a portfolio that can own companies that are momentarily out of favor but we believe have a catalyst or initiative to change the trajectory of the business and surprise investors to the upside.
Sincerely,
 |  |
| Henry “Harry” M. T. Jones | Dennis Sabo, CFA |
| Co-Portfolio Manager | Co-Portfolio Manager |
Disclosure and Risk Summary
The Letter to Shareholders seeks to describe some of the current opinions and views of the financial markets of Edge Capital Group, LLC (the “Adviser”). Although the Adviser believes it has a reasonable basis for any opinions or views expressed, actual results may differ, sometimes significantly so, from those expected or expressed. The securities held by the Fund that are discussed in the Letter to Shareholders were held during the period covered by this Report. They do not comprise the entire investment portfolio of the Fund, may be sold at any time and may no longer be held by the Fund. For a complete list of securities held in the Fund as of August 31, 2023, please see the Schedule of Investments section of the annual report. The opinions of the Adviser with respect to those securities may change at any time.
The opinions expressed herein are those of the Adviser, and the report is not meant as legal, tax, or financial advice. You should consult your own professional advisors as to the legal, tax, financial, or other matters relevant to the suitability of investing. The external data presented in this report have been obtained from independent sources (as noted) and are believed to be accurate, but no independent verification has been made and accuracy is not guaranteed. The information contained in this report is not intended to address the needs of any particular investor.
The information contained in this document does not constitute an offer to sell any securities nor a solicitation to purchase any securities. Index returns reflect the reinvestment of dividends. An investor should consider the investment objectives, risks, charges and expenses of the Fund carefully before investing. The Fund’s prospectus contains this and other important information. To obtain a copy of the Fund’s prospectus please visit our website at www.bluecurrentfunds.com or call 1-800-514-3583 and a copy will be sent to you free of charge. Please read the prospectus carefully before you invest. The Blue Current Global Dividend Fund is distributed by Ultimus Fund Distributors, LLC.
Statements in the Letter to Shareholders that reflect projections or expectations for future financial or economic performance of the Fund and the market in general and statements of the Fund’s plans and objectives for future operations are forward-looking statements.
4
No assurance can be given that actual results or events will not differ materially from those projected, estimated, assumed, or anticipated in any such forward- looking statements. Important factors that could result in such differences, in addition to factors noted with such forward-looking statements include, without limitation, general economic conditions, such as inflation, recession, and interest rates.
PAST PERFORMANCE CANNOT BE CONSTRUED AS AN INDICATOR OF FUTURE RESULTS BECAUSE OF, AMONG OTHER THINGS, POSSIBLE DIFFERENCES IN MARKET CONDITIONS, INVESTMENT STRATEGY, AND REGULATORY CLIMATE. THERE IS NO ASSURANCE THAT THE FUND WILL ACHIEVE ITS INVESTMENT OBJECTIVE. INVESTMENT RESULTS AND PRINCIPAL VALUE WILL FLUCTUATE SO THAT SHARES, WHEN REDEEMED, MAY BE WORTH MORE OR LESS THAN THEIR ORIGINAL COST. CURRENT PERFORMANCE MAY BE HIGHER OR LOWER THAN THE PERFORMANCE DATA QUOTED. PERFORMANCE DATA CURRENT TO THE MOST RECENT MONTH END IS AVAILABLE BY CALLING 1-800-514-3583. THE FUND INVESTS PRIMARILY IN DIVIDEND PAYING COMPANIES AND IT IS POSSIBLE THESE COMPANIES MAY ELIMINATE OR REDUCE THEIR DIVIDEND PAYMENTS. INDEX INFORMATION (I) IS INCLUDED MERELY TO SHOW THE GENERAL TREND IN THE EQUITY MARKETS FOR THE PERIOD INDICATED AND IS NOT INTENDED TO IMPLY THAT THE FUND’S PORTFOLIO WILL BE SIMILAR TO THE INDICES EITHER IN COMPOSITION OR RISK AND (II) HAS BEEN OBTAINED FROM SOURCES BELIEVED TO BE ACCURATE.
5
| BLUE CURRENT GLOBAL DIVIDEND FUND |
| PERFORMANCE INFORMATION |
| August 31, 2023 (Unaudited) |
Comparison of the Change in Value of a $100,000 Investment in
Blue Current Global Dividend Fund -
Institutional Class vs. the MSCI World High Dividend Yield Index
and the MSCI World Index
| Average Annual Total Returns (for the periods ended August 31, 2023) | |||||||||
| Since | |||||||||
| 1 Year | 3 Years | 5 Years | Inception(b) | ||||||
| Blue Current Global Dividend Fund - Institutional Class(a) | 12.94% | 9.66% | 7.02% | 6.44% | |||||
| MSCI World High Dividend Yield Index | 10.95% | 8.00% | 5.61% | 5.21% | |||||
| MSCI World Index | 15.60% | 8.41% | 8.33% | 8.11% | |||||
| (a) | The Fund’s total returns do not reflect the deduction of taxes a shareholder would pay on Fund distributions or the redemption of Fund shares. |
| (b) | The Fund commenced operations on September 18, 2014. |
6
| BLUE CURRENT GLOBAL DIVIDEND FUND |
| PORTFOLIO INFORMATION |
| August 31, 2023 (Unaudited) |
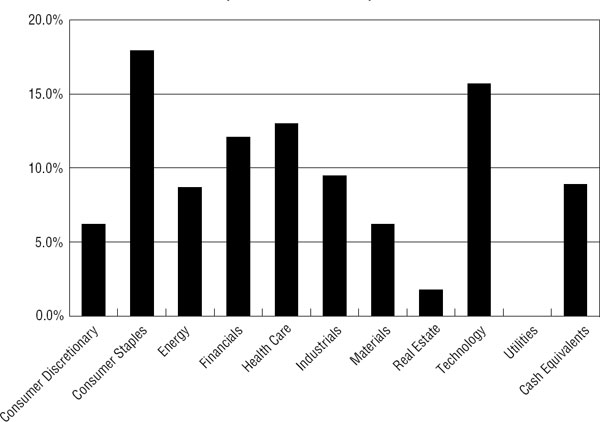
Sector Diversification
(% of Net Assets)
| Top Ten Equity Holdings | ||
| Security Description | % of Net Assets | |
| Microsoft Corporation | 3.9% | |
| Broadcom, Inc. | 3.6% | |
| Morgan Stanley | 3.3% | |
| Walmart, Inc. | 3.1% | |
| Coca-Cola Europacific Partners plc | 2.9% | |
| Koninklijke Ahold Delhaize N.V. | 2.9% | |
| AstraZeneca plc - ADR | 2.8% | |
| Merck & Company, Inc. | 2.7% | |
| Air Liquide S.A. | 2.7% | |
| BNP Paribas S.A. | 2.6% | |
7
| BLUE CURRENT GLOBAL DIVIDEND FUND |
| SCHEDULE OF INVESTMENTS |
| August 31, 2023 |
| COMMON STOCKS — 91.1% | Shares | Value | ||||||
| Consumer Discretionary — 6.2% | ||||||||
| Automotive — 4.7% | ||||||||
| Cie Generale des Etablissements Michelin | 36,600 | $ | 1,145,702 | |||||
| Dr. Ing. h.c. F. Porsche AG | 7,300 | 805,562 | ||||||
| Stellantis N.V. | 53,000 | 983,150 | ||||||
| 2,934,414 | ||||||||
| Retail - Discretionary — 1.5% | ||||||||
| Dick’s Sporting Goods, Inc. | 8,000 | 930,720 | ||||||
| Consumer Staples — 17.9% | ||||||||
| Beverages — 7.5% | ||||||||
| Coca-Cola Company (The) | 22,935 | 1,372,201 | ||||||
| Coca-Cola Europacific Partners plc | 28,730 | 1,841,880 | ||||||
| Diageo plc - ADR | 9,126 | 1,511,722 | ||||||
| 4,725,803 | ||||||||
| Food — 2.7% | ||||||||
| Danone S.A. - ADR | 31,000 | 362,080 | ||||||
| Danone S.A. | 22,500 | 1,312,316 | ||||||
| 1,674,396 | ||||||||
| Retail - Consumer Staples — 7.7% | ||||||||
| Albertsons Companies, Inc. - Class A | 48,000 | 1,075,200 | ||||||
| Koninklijke Ahold Delhaize N.V. (a) | 55,400 | 1,813,139 | ||||||
| Walmart, Inc. | 11,850 | 1,926,929 | ||||||
| 4,815,268 | ||||||||
| Energy — 8.7% | ||||||||
| Oil & Gas Producers — 6.4% | ||||||||
| BP plc | 267,000 | 1,649,829 | ||||||
| Shell plc - ADR | 15,180 | 942,526 | ||||||
| Targa Resources Corporation | 16,560 | 1,428,300 | ||||||
| 4,020,655 | ||||||||
| Oil & Gas Services & Equipment — 2.3% | ||||||||
| Schlumberger Ltd. | 24,350 | 1,435,676 | ||||||
| Financials — 12.1% | ||||||||
| Banking — 7.1% | ||||||||
| BNP Paribas S.A. | 25,600 | 1,656,410 | ||||||
| DBS Group Holdings Ltd. - ADR | 9,859 | 970,520 | ||||||
| National Bank of Canada | 15,400 | 1,073,099 | ||||||
| Truist Financial Corporation | 26,000 | 794,300 | ||||||
| 4,494,329 | ||||||||
| Institutional Financial Services — 3.3% | ||||||||
| Morgan Stanley | 24,400 | 2,077,660 | ||||||
8
| BLUE CURRENT GLOBAL DIVIDEND FUND |
| SCHEDULE OF INVESTMENTS (Continued) |
| COMMON STOCKS — 91.1% (Continued) | Shares | Value | ||||||
| Financials — 12.1% (Continued) | ||||||||
| Insurance — 1.7% | ||||||||
| Allianz SE - ADR | 14,000 | $ | 340,060 | |||||
| Allianz SE | 2,900 | 705,321 | ||||||
| 1,045,381 | ||||||||
| Health Care — 13.0% | ||||||||
| Biotech & Pharma — 11.3% | ||||||||
| AstraZeneca plc - ADR | 26,300 | 1,783,666 | ||||||
| Johnson & Johnson | 5,362 | 866,928 | ||||||
| Merck & Company, Inc. | 15,800 | 1,721,884 | ||||||
| Novo Nordisk A/S - ADR | 5,900 | 1,095,158 | ||||||
| Sanofi - ADR | 30,500 | 1,621,990 | ||||||
| 7,089,626 | ||||||||
| Medical Equipment & Devices — 1.7% | ||||||||
| Medtronic plc | 13,500 | 1,100,250 | ||||||
| Industrials — 9.5% | ||||||||
| Aerospace & Defense — 2.4% | ||||||||
| RTX Corporation | 17,795 | 1,531,082 | ||||||
| Diversified Industrials — 2.4% | ||||||||
| Hitachi Ltd. - ADR | 11,500 | 1,529,960 | ||||||
| Electrical Equipment — 0.4% | ||||||||
| Daikin Industries Ltd. | 1,500 | 259,349 | ||||||
| Transportation & Logistics — 4.3% | ||||||||
| DHL Group | 25,200 | 1,175,804 | ||||||
| Norfolk Southern Corporation | 7,290 | 1,494,523 | ||||||
| 2,670,327 | ||||||||
| Materials — 6.2% | ||||||||
| Chemicals — 6.2% | ||||||||
| Air Liquide S.A. | 9,268 | 1,675,436 | ||||||
| OCI N.V. | 44,000 | 1,113,433 | ||||||
| Yara International A.S.A. | 30,800 | 1,122,836 | ||||||
| 3,911,705 | ||||||||
| Real Estate — 1.8% | ||||||||
| REITs — 1.8% | ||||||||
| Prologis, Inc. | 8,900 | 1,105,380 | ||||||
| Technology — 15.7% | ||||||||
| Semiconductors — 9.2% | ||||||||
| BE Semiconductor Industries N.V. | 10,260 | 1,178,347 | ||||||
| Broadcom, Inc. | 2,420 | 2,233,394 | ||||||
9
| BLUE CURRENT GLOBAL DIVIDEND FUND |
| SCHEDULE OF INVESTMENTS (Continued) |
| COMMON STOCKS — 91.1% (Continued) | Shares | Value | ||||||
| Technology — 15.7% (Continued) | ||||||||
| Semiconductors — 9.2% (Continued) | ||||||||
| QUALCOMM, Inc. | 13,284 | $ | 1,521,417 | |||||
| Taiwan Semiconductor Manufacturing Company Ltd. - ADR | 9,000 | 842,130 | ||||||
| 5,775,288 | ||||||||
| Software — 3.9% | ||||||||
| Microsoft Corporation | 7,520 | 2,464,755 | ||||||
| Technology Services — 2.6% | ||||||||
| RELX plc - ADR | 49,500 | 1,610,235 | ||||||
| Total Common Stocks (Cost $45,480,486) | $ | 57,202,259 | ||||||
| MONEY MARKET FUNDS — 8.3% | Shares | Value | ||||||
| First American Government Obligations Fund - Class Z, 5.21% (a) (Cost $5,206,317) | 5,206,317 | $ | 5,206,317 | |||||
| Investments at Value — 99.4% (Cost $50,686,803) | $ | 62,408,576 | ||||||
| Other Assets in Excess of Liabilities — 0.6% | 395,892 | |||||||
| Net Assets — 100.0% | $ | 62,804,468 | ||||||
A/S - Aktieselskab
ADR - American Depositary Receipt
AG - Aktiengesellschaft
A.S.A. - Akieselskop
N.V. - Naamloze Vennootschap
plc - Public Limited Company
S.A. - Societe Anonyme
SE - Societe Europaea
| (a) | The rate shown is the 7-day effective yield as of August 31, 2023. |
See accompanying notes to financial statements.
10
| BLUE CURRENT GLOBAL DIVIDEND FUND |
| SUMMARY OF COMMON STOCKS BY COUNTRY |
| August 31, 2023 (Unaudited) |
| % of Net | ||||||||
| Country | Value | Assets | ||||||
| United States | $ | 23,980,349 | 38.2 | % | ||||
| United Kingdom | 9,339,858 | 14.9 | % | |||||
| France | 7,773,934 | 12.4 | % | |||||
| Netherlands | 5,088,069 | 8.1 | % | |||||
| Germany | 3,026,747 | 4.8 | % | |||||
| Japan | 1,789,309 | 2.9 | % | |||||
| Norway | 1,122,836 | 1.8 | % | |||||
| Ireland | 1,100,250 | 1.7 | % | |||||
| Denmark | 1,095,158 | 1.7 | % | |||||
| Canada | 1,073,099 | 1.7 | % | |||||
| Singapore | 970,520 | 1.6 | % | |||||
| Taiwan Province of China | 842,130 | 1.3 | % | |||||
| $ | 57,202,259 | 91.1 | % | |||||
See accompanying notes to financial statements.
11
| BLUE CURRENT GLOBAL DIVIDEND FUND |
| STATEMENT OF ASSETS AND LIABILITIES |
| August 31, 2023 |
| ASSETS | ||||
| Investments in securities: | ||||
| At cost | $ | 50,686,803 | ||
| At value (Note 2) | $ | 62,408,576 | ||
| Cash denominated in foreign currency (Cost $511,693) | 519,743 | |||
| Dividends receivable | 191,846 | |||
| Reclaims receivable | 1,588 | |||
| Other assets | 9,090 | |||
| Total assets | 63,130,843 | |||
| LIABILITIES | ||||
| Payable for investment securities purchased | 260,187 | |||
| Payable to Adviser (Note 4) | 42,151 | |||
| Payable to administrator (Note 4) | 11,680 | |||
| Other accrued expenses | 12,357 | |||
| Total liabilities | 326,375 | |||
| Contingencies and commitments (Note 6) | — | |||
| NET ASSETS | $ | 62,804,468 | ||
| NET ASSETS CONSIST OF: | ||||
| Paid-in capital | $ | 51,730,703 | ||
| Distributable earnings | 11,073,765 | |||
| NET ASSETS | $ | 62,804,468 | ||
| PRICING OF INSTITUTIONAL SHARES (Note 1) | ||||
| Net assets applicable to Institutional Shares | $ | 62,804,468 | ||
| Shares of Institutional Shares outstanding (unlimited number of shares authorized, no par value) | 4,726,518 | |||
| Net asset value, offering and redemption price per share (a) (Note 2) | $ | 13.29 |
| (a) | Redemption fee may apply to redemptions of shares held for 7 days or less. |
See accompanying notes to financial statements.
12
| BLUE CURRENT GLOBAL DIVIDEND FUND |
| STATEMENT OF OPERATIONS |
| For the Year Ended August 31, 2023 |
| INVESTMENT INCOME | ||||
| Dividends | $ | 2,017,780 | ||
| Foreign withholding taxes on dividends | (205,546 | ) | ||
| Total investment income | 1,812,234 | |||
| EXPENSES | ||||
| Management fees (Note 4) | 559,357 | |||
| Administration fees (Note 4) | 56,509 | |||
| Fund accounting fees (Note 4) | 42,762 | |||
| Legal fees | 24,285 | |||
| Registration and filing fees | 25,118 | |||
| Trustees’ fees and expenses (Note 4) | 19,344 | |||
| Transfer agent fees (Note 4) | 18,665 | |||
| Audit and tax services fees | 18,326 | |||
| Custodian and bank service fees | 17,666 | |||
| Compliance fees and expenses (Note 4) | 12,420 | |||
| Shareholder reporting expenses | 11,758 | |||
| Networking Fees | 6,138 | |||
| Postage and supplies | 5,934 | |||
| Insurance expense | 3,487 | |||
| Pricing fees | 3,375 | |||
| Other expenses | 11,789 | |||
| Total expenses | 836,933 | |||
| Fee reductions by the Adviser (Note 4) | (277,576 | ) | ||
| Net expenses | 559,357 | |||
| NET INVESTMENT INCOME | 1,252,877 | |||
| REALIZED AND UNREALIZED GAINS (LOSSES) ON INVESTMENTS AND FOREIGN CURRENCIES | ||||
| Net realized losses from: | ||||
| Investments | (830,014 | ) | ||
| Foreign currency transactions (Note 2) | (19,754 | ) | ||
| Net change in unrealized appreciation (depreciation) on: | ||||
| Investments | 6,482,263 | |||
| Foreign currency translation (Note 2) | 9,714 | |||
| NET REALIZED AND UNREALIZED GAINS ON INVESTMENTS AND FOREIGN CURRENCIES | 5,642,209 | |||
| NET INCREASE IN NET ASSETS RESULTING FROM OPERATIONS | $ | 6,895,086 |
See accompanying notes to financial statements.
13
| BLUE CURRENT GLOBAL DIVIDEND FUND |
| STATEMENTS OF CHANGES IN NET ASSETS |
| Year | Year | |||||||
| Ended | Ended | |||||||
| August 31, | August 31, | |||||||
| 2023 | 2022 | |||||||
| FROM OPERATIONS | ||||||||
| Net investment income | $ | 1,252,877 | $ | 1,765,272 | ||||
| Net realized gains (losses) from: | ||||||||
| Investments | (830,014 | ) | 1,813,407 | |||||
| Foreign currency transactions | (19,754 | ) | (7,345 | ) | ||||
| Net change in unrealized appreciation (depreciation) on: | ||||||||
| Investments | 6,482,263 | (9,140,880 | ) | |||||
| Foreign currency translations | 9,714 | (1,530 | ) | |||||
| Net increase (decrease) in net assets from operations | 6,895,086 | (5,571,076 | ) | |||||
| DISTRIBUTIONS TO SHAREHOLDERS | ||||||||
| Institutional Shares | (2,877,521 | ) | (4,412,904 | ) | ||||
| FROM CAPITAL SHARE TRANSACTIONS | ||||||||
| Institutional Shares | ||||||||
| Proceeds from shares sold | 13,681,146 | 9,311,947 | ||||||
| Net asset value of shares issued in reinvestment of distributions to shareholders | 1,931,129 | 3,147,040 | ||||||
| Proceeds from redemption fees collected (Note 2) | 2,099 | 1,100 | ||||||
| Payments for shares redeemed | (8,113,526 | ) | (3,220,647 | ) | ||||
| Net increase in Institutional Shares net assets from capital share transactions | 7,500,848 | 9,239,440 | ||||||
| TOTAL INCREASE (DECREASE) IN NET ASSETS | 11,518,413 | (744,540 | ) | |||||
| NET ASSETS | ||||||||
| Beginning of year | 51,286,055 | 52,030,595 | ||||||
| End of year | $ | 62,804,468 | $ | 51,286,055 | ||||
| CAPITAL SHARES ACTIVITY | ||||||||
| Shares sold | 1,067,000 | 689,896 | ||||||
| Shares reinvested | 154,015 | 224,361 | ||||||
| Shares redeemed | (631,425 | ) | (232,351 | ) | ||||
| Net increase in shares outstanding | 589,590 | 681,906 | ||||||
| Shares outstanding, beginning of year | 4,136,928 | 3,455,022 | ||||||
| Shares outstanding, end of year | 4,726,518 | 4,136,928 | ||||||
See accompanying notes to financial statements.
14
| BLUE CURRENT GLOBAL DIVIDEND FUND |
| INSTITUTIONAL SHARES |
| FINANCIAL HIGHLIGHTS |
Per Share Data for a Share Outstanding Throughout Each Year
| Year | Year | Year | Year | Year | ||||||||||||||||
| Ended | Ended | Ended | Ended | Ended | ||||||||||||||||
| August 31, | August 31, | August 31, | August 31, | August 31, | ||||||||||||||||
| 2023 | 2022 | 2021 | 2020 | 2019 | ||||||||||||||||
| Net asset value at beginning of year | $ | 12.40 | $ | 15.06 | $ | 11.74 | $ | 11.62 | $ | 11.47 | ||||||||||
| Income (loss) from investment operations: | ||||||||||||||||||||
| Net investment income | 0.28 | 0.48 | 0.17 | 0.24 | 0.22 | |||||||||||||||
| Net realized and unrealized gains (losses) on investments and foreign currencies | 1.28 | (1.88 | ) | 3.32 | 0.16 | (a) | 0.11 | |||||||||||||
| Total from investment operations | 1.56 | (1.40 | ) | 3.49 | 0.40 | 0.33 | ||||||||||||||
| Less distributions from: | ||||||||||||||||||||
| Net investment income | (0.28 | ) | (0.49 | ) | (0.17 | ) | (0.20 | ) | (0.18 | ) | ||||||||||
| Net realized gains | (0.39 | ) | (0.77 | ) | — | (0.08 | ) | — | ||||||||||||
| Total distributions | (0.67 | ) | (1.26 | ) | (0.17 | ) | (0.28 | ) | (0.18 | ) | ||||||||||
| Proceeds from redemption fees collected (Note 2) | 0.00 | (b) | 0.00 | (b) | — | 0.00 | (b) | 0.00 | (b) | |||||||||||
| Net asset value at end of year | $ | 13.29 | $ | 12.40 | $ | 15.06 | $ | 11.74 | $ | 11.62 | ||||||||||
| Total return (c) | 12.94 | % | (10.12 | %) | 29.91 | % | 3.46 | % | 2.91 | % | ||||||||||
| Net assets at end of year (000’s) | $ | 62,804 | $ | 51,286 | $ | 52,031 | $ | 42,039 | $ | 62,302 | ||||||||||
| Ratios/supplementary data: | ||||||||||||||||||||
| Ratio of total expenses to average net assets | 1.48 | % | 1.49 | % | 1.48 | % | 1.48 | % | 1.43 | % | ||||||||||
| Ratio of net expenses to average net assets (d) | 0.99 | % | 0.99 | % | 0.99 | % | 0.99 | % | 0.99 | % | ||||||||||
| Ratio of net investment income to average net assets (d) | 2.18 | % | 3.43 | % | 1.27 | % | 1.94 | % | 1.87 | % | ||||||||||
| Portfolio turnover rate | 60 | % | 60 | % | 53 | % | 66 | % | 46 | % | ||||||||||
| (a) | Represents a balancing figure from other amounts in the financial highlights table that captures all other changes affecting net asset value per share. This per share amount does not correlate to the aggregate of net realized and unrealized losses on the Statement of Operations for the same period. |
| (b) | Amount rounds to less than $0.01 per share. |
| (c) | Total return is a measure of the change in value of an investment in the Fund over periods covered, which assumes any dividends and capital gain distributions are reinvested in shares of the Fund. The returns shown do not reflect the deduction of taxes a shareholder would pay on Fund distributions or the redemption of Fund shares. The total returns would be lower if the Adviser had not reduced management fees (Note 4). |
| (d) | Ratio was determined after management fee reductions by the Adviser (Note 4). |
See accompanying notes to financial statements.
15
| BLUE CURRENT GLOBAL DIVIDEND FUND |
| NOTES TO FINANCIAL STATEMENTS |
| August 31, 2023 |
1. Organization
Blue Current Global Dividend Fund (the “Fund”) is a diversified series of Ultimus Managers Trust (the “Trust”), an open-end investment company established as an Ohio business trust under a Declaration of Trust dated February 28, 2012. Other series of the Trust are not incorporated in this report.
The investment objective of the Fund is to seek current income and capital appreciation.
The Fund currently offers one class of shares: Institutional Class shares (sold without any sales loads or distribution fees and subject to a $100,000 initial investment requirement).
2. Significant Accounting Policies
The following is a summary of the Fund’s significant accounting policies. The policies are in conformity with accounting principles generally accepted in the United States of America (“GAAP”). The Fund follows accounting and reporting guidance under Financial Accounting Standards Board Accounting Standards Codification Topic 946, “Financial Services – Investment Companies.”
Regulatory update – Tailored Shareholder Reports for Mutual Funds and Exchange-Traded Funds (“ETFs”) – Effective January 24, 2023, the Securities and Exchange Commission (the “SEC”) adopted rule and form amendments to require mutual funds and ETFs to transmit concise and visually engaging streamlined annual and semiannual reports to shareholders that highlight key information. Other information, including financial statements, will no longer appear in a streamlined shareholder report but must be available online, delivered free of charge upon request, and filed on a semiannual basis on Form N-CSR. The rule and form amendments have a compliance date of July 24, 2024. At this time, management is evaluating the impact of these amendments on the shareholder reports for the Fund.
Securities valuation – The Fund values its portfolio securities including common stocks at fair value as of the close of regular trading on the New York Stock Exchange (the “NYSE”) (normally 4:00 p.m. Eastern Time) on each day the NYSE is open for business. The Fund generally values its listed securities on the basis of the security’s last sale price on the security’s primary exchange, if available, otherwise at the exchange’s most recently quoted mean price. NASDAQ-listed securities are valued at the NASDAQ Official Closing Price. Investments representing shares of other open-end investment companies, other than exchange-traded funds, if any, but including money market funds, are valued at their net asset value (“NAV”) as reported by such companies. When using a quoted price and when the market is considered active, the security will be classified as Level 1 within the fair value hierarchy (see below). In the event that market quotations are not readily available or are considered unreliable due to market or other events, the Fund values its securities and other assets at fair value as determined by Edge Capital Group, LLC (the “Adviser”),
16
| BLUE CURRENT GLOBAL DIVIDEND FUND |
| NOTES TO FINANCIAL STATEMENTS (Continued) |
as the Fund’s valuation designee, in accordance with procedures adopted by the Board of Trustees (the “Board”) pursuant to Rule 2a-5 under the Investment Company Act of 1940, as amended (the “1940 Act”). Under these procedures, the securities will be classified as Level 2 or 3 within the fair value hierarchy, depending on the inputs used. Unavailable or unreliable market quotes may be due to the following factors: a substantial bid-ask spread; infrequent sales resulting in stale prices; insufficient trading volume; small trade sizes; a temporary lapse in any reliable pricing source; and actions of the securities or futures markets, such as the suspension or limitation of trading. As a result, the prices of securities used to calculate the Fund’s NAV may differ from quoted or published prices for the same securities. Securities traded on foreign exchanges are typically fair valued by an independent pricing service and translated from the local currency into U.S. dollars using currency exchange rates supplied by an independent pricing service. GAAP establishes a single authoritative definition of fair value, sets out a framework for measuring fair value, and requires additional disclosures about fair value measurements.
Various inputs are used in determining the value of the Fund’s investments. These inputs are summarized in the three broad levels listed below:
| ● | Level 1 – quoted prices in active markets for identical securities |
| ● | Level 2 – other significant observable inputs |
| ● | Level 3 – significant unobservable inputs |
The inputs or methods used for valuing securities are not necessarily an indication of the risks associated with investing in those securities. The inputs used to measure fair value may fall into different levels of the fair value hierarchy. In such cases, for disclosure purposes, the level in the fair value hierarchy within which the fair value measurement falls in its entirety is determined based on the lowest level input that is significant to the fair value measurement.
The Fund’s foreign equity securities actively traded in foreign markets may be classified as Level 2 despite the availability of closing prices because such securities are typically fair valued by an independent pricing service. The Board has authorized the Fund to retain an independent pricing service to determine the fair value of its foreign securities because the value of such securities may be materially affected by events occurring before the Fund’s pricing time but after the close of the primary markets or exchanges on which such foreign securities are traded. These intervening events might be country-specific (e.g., natural disaster, economic or political developments, interest rate change); issuer specific (e.g., earnings report or merger announcement); or U.S. market-specific (such as a significant movement in the U.S. market that is deemed to affect the value of foreign securities). The pricing service uses an automated system that incorporates a model based on multiple parameters, including a security’s local closing price, relevant general
17
| BLUE CURRENT GLOBAL DIVIDEND FUND |
| NOTES TO FINANCIAL STATEMENTS (Continued) |
and sector indices, currency fluctuations, trading in depositary receipts and futures, if applicable, and/or research valuations by its staff, in determining what it believes is the fair value of the securities.
The following is a summary of the Fund’s investments based on the inputs used to value the investments as of August 31, 2023:
| Investments in Securities: | Level 1 | Level 2 | Level 3 | Total | ||||||||||||
| Common Stocks | $ | 41,588,775 | $ | 15,613,484 | $ | — | $ | 57,202,259 | ||||||||
| Money Market Funds | 5,206,317 | — | — | 5,206,317 | ||||||||||||
| Total | $ | 46,795,092 | $ | 15,613,484 | $ | — | $ | 62,408,576 | ||||||||
Refer to the Fund’s Schedule of Investments for a listing of the common stocks by sector and industry type. The Fund did not have any assets or liabilities that were measured at fair value on a recurring basis using significant unobservable inputs (Level 3) as of or during the year ended August 31, 2023.
Foreign currency translation – Securities and other assets and liabilities denominated in or expected to settle in foreign currencies are translated into U.S. dollars based on exchange rates on the following basis:
| A. | The fair values of investment securities and other assets and liabilities are translated as of the close of the NYSE each day. |
| B. | Purchases and sales of investment securities and income and expenses are translated at the rate of exchange prevailing as of 4:00 p.m. Eastern Time on the respective date of such transactions. |
| C. | The Fund does not isolate that portion of the results of operations caused by changes in foreign exchange rates on investments from those caused by changes in market prices of securities held. Such fluctuations are included with the net realized and unrealized gains or losses on investments. |
Reported net realized foreign exchange gains or losses arise from 1) purchases and sales of foreign currencies, 2) currency gains or losses realized between the trade and settlement dates on securities transactions and 3) the difference between the amounts of dividends and foreign withholding taxes recorded on the Fund’s books and the U.S. dollar equivalent of the amounts actually received or paid. Reported net unrealized foreign exchange gains and losses arise from changes in the value of assets and liabilities that result from changes in exchange rates.
The Fund may be subject to foreign taxes related to foreign income received, capital gain on the sale of securities and certain foreign currency transactions (a portion of which may be reclaimable). All foreign taxes are recorded in accordance with the applicable regulations and rates that exist in the foreign jurisdictions in which the Fund invests.
18
| BLUE CURRENT GLOBAL DIVIDEND FUND |
| NOTES TO FINANCIAL STATEMENTS (Continued) |
Share valuation – The NAV per share of the Fund is calculated daily by dividing the total value of the assets, less liabilities, by the number of shares outstanding. The offering price and redemption price per share of the Fund is equal to the NAV per share, except that shareholders of the Fund are subject to a redemption fee equal to 2.00% of the value of Fund shares redeemed within 7 days of purchase, excluding involuntary redemptions of accounts that fall below the minimum investment amount or the redemption of Fund shares representing reinvested dividends, capital gain distributions, or capital appreciation. During the years ended August 31, 2023 and 2022, proceeds from redemption fees, recorded in capital, totaled $2,099 and $1,100, respectively.
Investment income – Dividend income is recorded on the ex-dividend date. Non-cash dividends included in dividend income, if any, are recorded at the fair value of the security received. Interest income is accrued as earned. The Fund may invest in real estate investment trusts (“REITs”) that pay distributions to their shareholders based on available funds from operations. It is common for these distributions to exceed the REIT’s taxable earnings and profits resulting in the excess portion of such distribution to be designated as return of capital. Distributions received from REITs are generally recorded as dividend income and, if necessary, are reclassified annually in accordance with tax information provided by the underlying REITs. The Fund may also invest in master limited partnerships (“MLPs”) whose distributions generally are comprised of ordinary income, capital gains and return of capital from the MLP. For financial statement purposes, the Fund records all income received as ordinary income. This amount may be subsequently revised based on information received from the MLPs after their tax reporting periods are concluded, as the actual character of these distributions is not known until after the fiscal year end of the Fund. Withholding taxes on foreign dividends have been recorded for in accordance with the Fund’s understanding of the applicable country’s tax rules and rates.
Investment transactions – Investment transactions are accounted for on the trade date. Realized gains and losses on investments sold are determined on a specific identification basis.
Common expenses – Common expenses of the Trust are allocated among the Fund and the other series of the Trust based on the relative net assets of each series, the number of series in the Trust, or the nature of the services performed and the relative applicability to each series.
Distributions to shareholders – Distributions to shareholders arising from net investment income are declared and paid quarterly to shareholders. Net realized capital gains, if any, are distributed at least annually. The amount of distributions from net investment income and net realized capital gains are determined in accordance with federal income tax
19
| BLUE CURRENT GLOBAL DIVIDEND FUND |
| NOTES TO FINANCIAL STATEMENTS (Continued) |
regulations, which may differ from GAAP. Dividends and distributions to shareholders are recorded on the ex-dividend date. The tax character of distributions paid during the years ended August 31, 2023 and 2022 was as follows:
| Ordinary | Long-Term | Total | ||||||||||
| Year Ended | Income | Capital Gains | Distributions | |||||||||
| August 31, 2023 | $ | 1,231,192 | $ | 1,646,329 | $ | 2,877,521 | ||||||
| August 31, 2022 | $ | 1,741,919 | $ | 2,670,985 | $ | 4,412,904 | ||||||
On September 29, 2023, the Fund paid an ordinary income dividend of $0.0491 per share to shareholders of record on September 28, 2023.
Estimates – The preparation of financial statements in conformity with GAAP requires management to make estimates and assumptions that affect the reported amounts of assets and liabilities and disclosure of contingent assets and liabilities, each as of the date of the financial statements, and the reported amounts of increase (decrease) in net assets from operations during the reporting period. Actual results could differ from those estimates.
Federal income tax – The Fund has qualified and intends to continue to qualify as a regulated investment company under the Internal Revenue Code of 1986, as amended (the “Code”). Qualification generally will relieve the Fund of liability for federal income taxes to the extent 100% of its net investment income and net realized capital gains are distributed in accordance with the Code.
In order to avoid imposition of the excise tax applicable to regulated investment companies, it is also the Fund’s intention to declare as dividends in each calendar year at least 98% of its net investment income (earned during the calendar year) and 98.2% of its net realized capital gains (earned during the 12 months ended October 31) plus undistributed amounts from prior years.
The following information is computed on a tax basis for each item as of August 31, 2023:
| Tax cost of portfolio investments | $ | 50,685,146 | ||
| Gross unrealized appreciation | $ | 12,450,627 | ||
| Gross unrealized depreciation | (727,197 | ) | ||
| Net unrealized appreciation on investments | 11,723,430 | |||
| Net unrealized appreciation on foreign currency translation | 8,033 | |||
| Undistributed ordinary income | 172,272 | |||
| Accumulated capital and other losses | (829,970 | ) | ||
| Distributable earnings | $ | 11,073,765 | ||
20
| BLUE CURRENT GLOBAL DIVIDEND FUND |
| NOTES TO FINANCIAL STATEMENTS (Continued) |
The difference between the federal income tax cost of investments and the financial cost is due to certain timing differences in the recognition of capital gains or losses under income tax regulations and GAAP. These “book/tax” differences are temporary in nature and are primarily due to the tax deferral of losses on wash sales and the tax treatment of the cost of securities received as in-kind subscriptions at the inception of the Fund.
As of August 31, 2023, the Fund had short-term capital loss carryforward of $829,970 for federal income tax purposes. These capital loss carryforwards, which do not expire, may utilized in future years to offset net realized capital gains, if any.
The Fund recognizes the tax benefits or expenses of uncertain tax positions only when the position is “more likely than not” to be sustained assuming examination by tax authorities. Management has reviewed the Fund’s tax positions for all open tax years (generally, three years) and has concluded that no provision for unrecognized tax benefits or expenses is required in these financial statements. The Fund identifies its major tax jurisdiction as U.S. federal. The Fund recognizes interest and penalties, if any, related to unrecognized tax benefits as income tax on the Statement of Operations. During the year ended August 31, 2023, the Fund did not incur any interest or penalties.
3. Investment Transactions
During the year ended August 31, 2023, cost of purchases and proceeds from sales of investment securities, other than short-term investments, were $35,920,808 and $31,461,063, respectively.
4. Transactions with Related Parties
INVESTMENT ADVISORY AGREEMENT
The Fund’s investments are managed by the Adviser pursuant to the terms of an Investment Advisory Agreement. Under the Investment Advisory Agreement, the Fund pays the Adviser a management fee, computed and accrued daily and paid monthly, at the annual rate of 0.99% of its average daily net assets.
Pursuant to an Expense Limitation Agreement between the Fund and the Adviser (the “ELA”), the Adviser had agreed, until April 30, 2024, to reduce its management fees and reimburse other expenses to limit total annual operating expenses (exclusive of brokerage costs; taxes; interest; borrowing costs such as interest and dividends expenses on securities sold short; costs to organize the Fund; acquired fund fees and expenses; and extraordinary expenses such as litigation and merger or reorganization costs and other expenses not incurred in the ordinary course of the Fund’s business) to an amount not exceeding 0.99% of the average daily net assets of the Institutional Class shares. Accordingly, under the ELA, the Adviser reduced its management fees in the amount of $277,576 during the year ended August 31, 2023.
21
| BLUE CURRENT GLOBAL DIVIDEND FUND |
| NOTES TO FINANCIAL STATEMENTS (Continued) |
Under the terms of the ELA, management fee reductions and expense reimbursements by the Adviser are subject to repayment by the Fund for a period of three years after such fees and expenses were incurred, provided that the repayments do not cause the Fund’s total annual operating expenses to exceed the lesser of (i) the expense limitation then in effect, if any, and (ii) the expense limitation in effect at the time the expenses to be repaid were incurred. As of August 31, 2023, the Adviser may seek recoupment of investment advisory fee reductions in the amount of $766,499 no later than the dates stated below:
| August 31, 2024 | $ | 229,000 | ||
| August 31, 2025 | 259,923 | |||
| August 31, 2026 | 277,576 | |||
| Total | $ | 766,499 | ||
OTHER SERVICE PROVIDERS
Ultimus Fund Solutions, LLC (“Ultimus”) provides administration, fund accounting, compliance and transfer agency services to the Fund. The Fund pays Ultimus fees in accordance with the agreements for such services. In addition, the Fund pays out-of-pocket expenses including, but not limited to, postage, supplies, and certain costs related to the pricing of the Fund’s portfolio securities.
Under the terms of a Distribution Agreement with the Trust, Ultimus Fund Distributors, LLC (the “Distributor”) serves as principal underwriter to the Fund. The Distributor is a wholly-owned subsidiary of Ultimus. The Distributor is compensated by the Adviser (not the Fund) for acting as principal underwriter.
Certain officers and a Trustee of the Trust are also officers of Ultimus and are not paid by the Fund for serving in such capacities.
TRUSTEE COMPENSATION
Effective October 17, 2022, each member of the Board (a “Trustee”) who is not an “interested person” (as defined by the 1940 Act) of the Trust (“Independent Trustee”) receives a $1,300 annual retainer from the Fund, paid quarterly, except for the Board Chairperson who receives a $1,700 annual retainer from the Fund, paid quarterly, and the Audit Committee Chairperson who receives a $1,500 annual retainer from the Fund, paid in quarterly. Each Independent Trustee also receives from the Fund a fee of $550 for each Board meeting attended plus reimbursement for travel and other meeting-related expenses. Prior to October 17, 2022, no additional annual retainer was designated specifically for the Audit Committee Chairperson.
22
| BLUE CURRENT GLOBAL DIVIDEND FUND |
| NOTES TO FINANCIAL STATEMENTS (Continued) |
PRINCIPAL HOLDER OF FUND SHARES
As of February 28, 2023, the following shareholder owned of record 25% or more of the outstanding shares of the Fund:
| Name of Record Owner | % Ownership |
| Pershing, LLC (for the benefit of multiple shareholders) | 69% |
A beneficial owner of 25% or more of the Fund’s outstanding shares may be considered a controlling person. The shareholder’s vote could have a more significant effect on matters presented at a shareholders’ meeting.
5. Foreign Investment Risk
Compared with investing in the U.S., investing in foreign markets involves a greater degree and variety of risk. Investors in foreign markets may face delayed settlements, currency controls, and adverse economic developments as well as higher overall transaction costs. In addition, fluctuations in the U.S. dollar’s value versus other currencies may erode or reverse gains or increase losses from investments denominated in foreign currencies. Foreign governments may expropriate assets, impose capital or currency controls, impose punitive taxes, impose limits on ownership or nationalize a company or industry. Any of these actions could have a severe effect on security prices and impair an investor’s ability to bring its capital or income back to the U.S. The value of foreign securities may be affected by incomplete, less frequent, or inaccurate financial information about their issuers, social upheavals, or political actions ranging from tax code changes to government collapse. Foreign companies may also receive less coverage by market analysts than U.S. companies and may be subject to different reporting standards or regulatory requirements than those applicable to U.S. companies.
6. Contingencies and Commitments
The Fund indemnifies the Trust’s officers and Trustees for certain liabilities that might arise from their performance of their duties to the Fund. Additionally, in the normal course of business, the Fund enters into contracts that contain a variety of representations, warranties, and general indemnifications. The Fund’s maximum exposure under these arrangements is unknown, as this would involve future claims that may be made against the Fund that have not yet occurred. However, based on experience, the Fund expects the risk of loss to be remote.
7. Subsequent Events
The Fund is required to recognize in the financial statements the effects of all subsequent events that provide additional evidence about conditions that existed as of the date of the Statement of Assets and Liabilities. For non-recognized subsequent events that must be
23
| BLUE CURRENT GLOBAL DIVIDEND FUND |
| NOTES TO FINANCIAL STATEMENTS (Continued) |
disclosed to keep the financial statements from being misleading, the Fund is required to disclose the nature of the event as well as an estimate of its financial effect, or a statement that such an estimate cannot be made. Management has evaluated subsequent events through the issuance of these financial statements and has noted no such events other than the ordinary income dividend paid on September 29, 2023, as discussed in Note 2 and the following:
Change in Control
Focus Financial Partners Inc., the ultimate parent company of the Adviser, was acquired by Clayton, Dubilier & Rice (the “Transaction”). The Transaction, which closed on August 31, 2023, was deemed to be a change in control, and therefore an “assignment” under the 1940 Act, of the Fund’s existing investment advisory agreement with the Adviser and resulted in its automatic termination. An interim investment advisory agreement and a new investment advisory agreement, each with substantially the same terms as the existing investment advisory agreement, except for the start and end date of the agreement and other provisions applicable to the interim investment advisory agreement as required under the 1940 Act, were presented to, and approved by, the Trust’s Board of Trustees at a meeting held on May 31, 2023. The new investment advisory agreement was submitted to the Fund’s shareholders for approval at a special meeting of shareholders held on September 8, 2023 (the “Special Shareholder Meeting”). As described under “Shareholder Voting Results,” the Fund’s shareholders approved the new investment advisory agreement at the Special Shareholder Meeting.
24
| BLUE CURRENT GLOBAL DIVIDEND FUND |
| REPORT OF INDEPENDENT REGISTERED |
| PUBLIC ACCOUNTING FIRM |
To the Shareholders of Blue Current Global Dividend Fund and
Board of Trustees of Ultimus Managers Trust
Opinion on the Financial Statements
We have audited the accompanying statement of assets and liabilities, including the schedule of investments, of Blue Current Global Dividend Fund (the “Fund”), a series of Ultimus Managers Trust, as of August 31, 2023, and the related statement of operations for the year then ended, the statements of changes in net assets for each of the two years in the period then ended, the related notes, and the financial highlights for each of the five years in the period then ended (collectively referred to as the “financial statements”). In our opinion, the financial statements present fairly, in all material respects, the financial position of the Fund as of August 31, 2023, the results of its operations for the year then ended, the changes in net assets for each of the two years in the period then ended, and the financial highlights for each of the five years in the period then ended, in conformity with accounting principles generally accepted in the United States of America.
Basis for Opinion
These financial statements are the responsibility of the Fund’s management. Our responsibility is to express an opinion on the Fund’s financial statements based on our audits. We are a public accounting firm registered with the Public Company Accounting Oversight Board (United States) (“PCAOB”) and are required to be independent with respect to the Fund in accordance with the U.S. federal securities laws and the applicable rules and regulations of the Securities and Exchange Commission and the PCAOB.
We conducted our audits in accordance with the standards of the PCAOB. Those standards require that we plan and perform the audit to obtain reasonable assurance about whether the financial statements are free of material misstatement whether due to error or fraud.
Our audits included performing procedures to assess the risks of material misstatement of the financial statements, whether due to error or fraud, and performing procedures that respond to those risks. Such procedures included examining, on a test basis, evidence regarding the amounts and disclosures in the financial statements. Our procedures included confirmation of securities owned as of August 31, 2023, by correspondence with the custodian and broker; when replies were not received from the broker, we performed other auditing procedures. Our audits also included evaluating the accounting principles used and significant estimates made by management, as well as evaluating the overall presentation of the financial statements. We believe that our audits provide a reasonable basis for our opinion.
25
| BLUE CURRENT GLOBAL DIVIDEND FUND |
| REPORT OF INDEPENDENT REGISTERED |
| PUBLIC ACCOUNTING FIRM |
We have served as the Fund’s auditor since 2014.

COHEN & COMPANY, LTD.
Philadelphia, Pennsylvania
October 30, 2023
26
| BLUE CURRENT GLOBAL DIVIDEND FUND |
| ABOUT YOUR FUND’S EXPENSES (Unaudited) |
We believe it is important for you to understand the impact of costs on your investment. As a shareholder of the Fund, you incur ongoing costs, including management fees and other operating expenses. The following examples are intended to help you understand your ongoing costs (in dollars) of investing in the Fund and to compare these costs with the ongoing costs of investing in other mutual funds.
A mutual fund’s ongoing costs are expressed as a percentage of its average net assets. This figure is known as the expense ratio. The expenses in the table below are based on an investment of $1,000 made at the beginning of the most recent period (March 1, 2023) and held until the end of the period (August 31, 2023).
The table below illustrates the Fund’s ongoing costs in two ways:
Actual fund return – This section helps you to estimate the actual expenses that you paid over the period. The “Ending Account Value” shown is derived from the Fund’s actual return, and the fourth column shows the dollar amount of operating expenses that would have been paid by an investor who started with $1,000 in the Fund. You may use the information here, together with the amount you invested, to estimate the expenses that you paid over the period.
To do so, simply divide your account value by $1,000 (for example, an $8,600 account value divided by $1,000 = 8.6), then multiply the result by the number given for the Fund under the heading “Expenses Paid During Period.”
Hypothetical 5% return – This section is intended to help you compare the Fund’s ongoing costs with those of other mutual funds. It assumes that the Fund had an annual return of 5% before expenses during the period shown, but that the expense ratio is unchanged. In this case, because the return used is not the Fund’s actual return, the results do not apply to your investment. The example is useful in making comparisons because the U.S. Securities and Exchange Commission (the “SEC”) requires all mutual funds to calculate expenses based on a 5% return. You can assess the Fund’s ongoing costs by comparing this hypothetical example with the hypothetical examples that appear in shareholder reports of other funds.
Note that expenses shown in the table are meant to highlight and help you compare ongoing costs only. The Fund does not charge sales loads. However, a redemption fee of 2% is applied on the sale of shares held for less than 7 days.
The calculations assume no shares were bought or sold during the period. Your actual costs may have been higher or lower, depending on the amount of your investment and the timing of any purchases or redemptions.
27
| BLUE CURRENT GLOBAL DIVIDEND FUND |
| ABOUT YOUR FUND’S EXPENSES (Unaudited) (Continued) |
More information about the Fund’s expenses can be found in this report. For additional information on operating expenses and other shareholder costs, please refer to the Fund’s prospectus.
| Beginning | Ending | |||||||
| Account Value | Account Value | Expenses | ||||||
| March 1, | August 31, | Net Expense | Paid During | |||||
| Institutional Class | 2023 | 2023 | Ratio(a) | Period(b) | ||||
| Based on Actual Fund Return | $ 1,000.00 | $ 1,057.00 | 0.99% | $5.13 | ||||
| Based on Hypothetical 5% Return (before expenses) | $ 1,000.00 | $ 1,020.21 | 0.99% | $5.04 |
| (a) | Annualized, based on the Fund’s expenses for the previous six month period. |
| (b) | Expenses are equal to the Fund’s annualized net expense ratio multiplied by the average account value over the period, multiplied by 184/365 (to reflect the one-half year period). |
28
| BLUE CURRENT GLOBAL DIVIDEND FUND |
| OTHER INFORMATION (Unaudited) |
A description of the policies and procedures that the Fund uses to vote proxies relating to portfolio securities is available without charge upon request by calling 1-800-514-3583, or on the SEC’s website at www.sec.gov. Information regarding how the Fund voted proxies relating to portfolio securities during the most recent 12-month period ended June 30 is also available without charge upon request by calling 1-800-514-3583, or on the SEC’s website at www.sec.gov.
The Trust files a complete listing of portfolio holdings for the Fund with the SEC as of the end of the first and third quarters of each fiscal year an exhibit to Form N-PORT. These filings are available upon request by calling 1-800-514-3583. Furthermore, you may obtain a copy of the filings on the SEC’s website at www.sec.gov and on the Fund’s website www.bluecurrentfunds.com.
| OTHER FEDERAL TAX INFORMATION (Unaudited) |
For the fiscal year ended August 31, 2023, the Fund designated $1,646,329 as long-term capital gain distributions.
Qualified Dividend Income – The Fund designates 100% of its ordinary income dividends, or up to the maximum amount of such dividends allowable pursuant to the Internal Revenue code, as qualified dividend income eligible for the reduced tax rate of 15%.
Dividends Received Deduction – Corporate shareholders are generally entitled to take the dividends received deduction on the portion of the Fund’s dividend distributions that qualifies under tax law. For the fiscal year ended August 31, 2023, 41.19% of ordinary income dividends qualified for the corporate dividends received deduction.
29
| BLUE CURRENT GLOBAL DIVIDEND FUND |
| SHAREHOLDER VOTING RESULTS (Unaudited) |
At a Special Shareholder Meeting held on September 8, 2023, Fund shareholders of record as of the close of business on July 6, 2023 voted to approve the following proposal:
Proposal 1: To approve a new Investment Advisory Agreement between the Trust, on behalf of the Fund, and Edge Capital Group, LLC.
| Shares Voted in Favor | Shares Voted Against or Abstain |
| 2,354,050 (51.81%*) | 0 (0%*) |
| * | as a percentage of the total voting securities of the Fund voted at the Meeting at which a quorum was present. |
30
| BLUE CURRENT GLOBAL DIVIDEND FUND |
| BOARD OF TRUSTEES AND EXECUTIVE OFFICERS (Unaudited) |
The Board has overall responsibility for management of the Trust’s affairs. The Trustees serve during the lifetime of the Trust and until its termination, or until death, resignation, retirement, or removal. The Trustees, in turn, elect the officers of the Fund to actively supervise their day-to-day operations. The officers have been elected for an annual term. Each Trustee’s and officer’s address is 225 Pictoria Drive, Suite 450, Cincinnati, Ohio 45246. The following are the Trustees and executive officers of the Fund:
| Name and Year of Birth | Length of Time Served | Position(s) Held with Trust | Principal Occupation(s) During Past 5 Years | Number of Funds in the Trust Overseen By Trustee | Directorship(s) of Public Companies Held By Trustee During Past 5 Years |
| Interested Trustees: | |||||
| David K. James* Year of Birth: 1970 | April 2023 to present
October 2022 to April 2023
July 2021 to October 2022 | Trustee (April 2023 to present)
Assistant Secretary
Secretary | Executive Vice President and Chief Legal and Risk Officer of Ultimus Fund Solutions, LLC (“Ultimus”) and a member of the board of managers of Ultimus Fund Distributors, LLC, Northern Lights Distributors, LLC and Northern Lights Compliance Services, LLC, each an affiliate of Ultimus (2018 to present); Managing Director and Managing Counsel of State Street Bank and Trust Company (2009 to 2018) | 31 | Interested Trustee of 12 series of the Capitol Series Trust (a registered management company) (2021 to present) |
| Independent Trustees: | |||||
| Janine L. Cohen Year of Birth: 1952 | Since 2016 | Chairperson (2019 to present)
Trustee (2016 to present) | Retired since 2013; previously Chief Financial Officer from 2004 to 2013 and Chief Compliance Officer from 2008 to 2013 at AER Advisors, Inc. | 31 | n/a |
| David M. Deptula Year of Birth: 1958 | Since 2012 | Trustee (2012 to present) | Vice President of Legal and Special Projects at Dayton Freight Lines, Inc. since 2016 | 31 | n/a |
31
| BLUE CURRENT GLOBAL DIVIDEND FUND |
| BOARD OF TRUSTEES AND EXECUTIVE OFFICERS (Unaudited) (Continued) |
| Name and Year of Birth | Length of Time Served | Position(s) Held with Trust | Principal Occupation(s) During Past 5 Years | Number of Funds in the Trust Overseen By Trustee | Directorship(s) of Public Companies Held By Trustee During Past 5 Years |
| Independent Trustees (Continued): | |||||
| Robert E. Morrison Year of Birth: 1957 | Since 2019 | Trustee (2019 to present; and previously 2012 to 2014) | Managing Director at Midwest Trust and FCI Advisors (2022 to present); Senior Vice President and National Practice Lead for Investment, Huntington National Bank/Huntington Private Bank (2014 to 2022); CEO, CIO, President of 5 Star Investment Management Company (2006 to 2014) | 31 | n/a |
| Clifford N. Schireson Year of Birth: 1953 | Since 2019 | Trustee (2019 to present) | Retired; Founder of Schireson Consulting, LLC (2017 to 2022); Director of Institutional Services for Brandes Investment Partners, LP (2004 to 2017) | 31 | Trustee of the San Diego City Employees’ Retirement System (2019 to present) |
| Jacqueline A. Williams Year of Birth: 1954 | Since 2019 | Trustee (2019 to present) | Managing Member of Custom Strategy Consulting, LLC (2017 to present); Managing Director of Global Investment Research (2005 to 2017), Cambridge Associates, LLC | 31 | n/a |
| * | Mr. James is considered an “interested person” of the Trust within the meaning of Section (2)(a)(19) of the Investment Company Act of 1940, as amended, because of his relationship with the Trust’s Administrator, Transfer Agent, and Distributor. |
32
| BLUE CURRENT GLOBAL DIVIDEND FUND |
| BOARD OF TRUSTEES AND EXECUTIVE OFFICERS (Unaudited) (Continued) |
| Name and Year of Birth | Length of Time Served | Position(s) Held with Trust | Principal Occupation(s) During Past 5 Years |
| Executive Officers: | |||
| Todd E. Heim Year of Birth: 1967 | 2021 to present
2014 to 2021 | President
Vice President | Vice President, Relationship Management (2018 to present) and Assistant Vice President, Client Implementation Manager with Ultimus Fund Solutions, LLC (2014 to 2018) |
| Shannon Thibeaux- Burgess Year of Birth: 1970 | April 2023 to present | Vice President | Senior Vice President, Relationship Management with Ultimus Fund Solutions, LLC (2022 to present); Head of Regulatory Service with J.P. Morgan Chase & Co. (2020 to 2022); Chief Administrative Officer of State Street Bank (2013 to 2020) |
| Jennifer L. Leamer Year of Birth: 1976 | 2014 to present
April 2014 to October 2014 | Treasurer
Assistant Treasurer | Senior Vice President of Fund Accounting (2020 to present) and Mutual Fund Controller of Ultimus Fund Solutions, LLC (2014 to 2020) |
| Daniel D. Bauer Year of Birth: 1977 | 2016 to present | Assistant Treasurer | Vice President of Fund Accounting (2022 to present), Assistant Vice President of Fund Accounting (2020 to 2022), and AVP, Assistant Mutual Fund Controller (2015 to 2020) of Ultimus Fund Solutions, LLC |
| Angela A. Simmons Year of Birth: 1975 | January 2022 to present | Assistant Treasurer | Vice President of Financial Administration (2022 to present) and Assistant Vice President, Financial Administration (2015 to 2022) of Ultimus Fund Solutions, LLC |
| Karen Jacoppo-Wood Year of Birth: 1966 | April 2023 to present | Secretary | Senior Vice President and Associate General Counsel of Ultimus Fund Solutions, LLC (2022 to present); Managing Director and Managing Counsel (2019 to 2022) and Vice President and Counsel (2014 to 2019) of State Street Bank and Trust Company |
| Natalie S. Anderson Year of Birth: 1975 | 2016 to present | Assistant Secretary | Legal Administration Manager (2016 to present) and Paralegal (2015 to 2016) of Ultimus Fund Solutions, LLC |
| Jesse Hallee Year of Birth: 1976 | April 2023 to present | Assistant Secretary | Senior Vice President and Associate General Counsel of Ultimus Fund Solutions, LLC (June 2019 to present); Vice President and Managing Counsel, State Street Bank and Trust Company (2013 to 2019) |
33
| BLUE CURRENT GLOBAL DIVIDEND FUND |
| BOARD OF TRUSTEES AND EXECUTIVE OFFICERS (Unaudited) (Continued) |
| Name and Year of Birth | Length of Time Served | Position(s) Held with Trust | Principal Occupation(s) During Past 5 Years |
| Executive Officers (Continued): | |||
| Gweneth K. Gosselink Year of Birth: 1955 | 2020 to present | Chief Compliance Officer | Assistant Vice President, Compliance Officer at Ultimus Fund Solutions, LLC (2019 to present); CCO Consultant at GKG Consulting, LLC (2019 to 2021); Chief Operating Officer & CCO at Miles Capital, Inc. (2013 to 2019) |
| Martin Dean Year of Birth: 1963 | 2020 to present
2019 to 2020
2016 to 2017 | Assistant Chief Compliance Officer
Interim Chief Compliance Officer
Assistant Chief Compliance Officer | President of Northern Lights Compliance Services, LLC (February 2023 to present); Senior Vice President, Head of Fund Compliance (2020 to January 2023) and Vice President & Director of Fund Compliance of Ultimus Fund Solutions, LLC (2016 to 2020) |
Additional information about members of the Board and executive officers is available in the Fund’s Statement of Additional Information (“SAI”). To obtain a free copy of the SAI, please call toll free 1-800-514-3583.
34
| BLUE CURRENT GLOBAL DIVIDEND FUND |
| DISCLOSURE REGARDING APPROVAL OF PREVIOUS INVESTMENT |
| ADVISORY AGREEMENT (Annual Report – Unaudited) |
The Board of Trustees (the “Board”), including the Independent Trustees voting separately, has reviewed and approved the Fund’s Investment Advisory Agreement with Edge Advisors, LLC (the “Adviser” or “Edge”) for an additional one-year term (the “Agreement”). The Board approved the Agreement at a meeting held on April 19-20, 2023, at which all of the Trustees were present.
In deciding on whether to approve the continuation of the Agreement, the Board recalled its review of the materials related to the Fund and Edge at the meeting and throughout the preceding twelve months and its numerous discussions with Trust Management and Edge about the operations and performance of the Fund during that period. The Board further considered those materials and discussions and other numerous factors, including the following:
The nature, extent, and quality of the services provided by the Adviser. In this regard, the Board reviewed the services being provided by Edge to the Fund including, without limitation, its providing a continuous investment program for the Fund, adhering to the Fund’s investment restrictions, complying with the Trust’s policies and procedures and voting proxies on behalf of the Fund. The Board considered the qualifications and experience of Edge’s portfolio managers who are responsible for the day-to day management of the Fund’s portfolio, as well as the qualifications of other individuals at Edge who provide services to the Fund. The Board concluded that the quality, extent, and nature of the services provided by Edge to the Fund were satisfactory.
The investment performance of the Fund. In this regard, the Board compared the performance of the Fund with the performance of its benchmark index, custom peer group, and Morningstar category. The Board concluded that the investment performance of the Fund has been satisfactory.
The costs of the services provided and profits realized by the Adviser and its affiliates from their relationship with the Fund. In this regard, the Board considered the Fund’s management fee proposed to be charged to the Fund and the Fund’s expense ratio, each as compared to the Fund’s custom peer group. The Board considered the revenue earned by Edge from the Fund and the current and anticipated profitability of the Fund to Edge, if any. The Board also considered Edge’s past fee reductions and expense reimbursements for the Fund and the indirect benefits that Edge received from its management of the Fund. The Board concluded that the advisory fee to be paid to Edge by the Fund is reasonable in light of the nature and quality of services provided by Edge.
The extent to which economics of scale would be realized as the Fund grows and whether advisory fee levels reflect these economies of scale for the benefit of the Fund’s investors. In this regard, the Board considered that the Fund’s fee arrangements with Edge involve both the advisory fee and the expense limitation agreement (the “ELA”). The Board determined that while the advisory fee rate remained the same as asset levels increased, the shareholders of the Fund have experienced benefits from the ELA and will continue
35
| BLUE CURRENT GLOBAL DIVIDEND FUND |
| DISCLOSURE REGARDING APPROVAL OF PREVIOUS INVESTMENT |
| ADVISORY AGREEMENT (Annual Report – Unaudited) (Continued) |
to experience benefits from the ELA. The Board concluded that the advisory fee was reasonable in light of the information that was provided to the Trustees by Edge with respect to economies of scale.
After further discussion of the factors noted above, as well as other factors, and in reliance on the information provided by the Adviser and Trust management, and taking into account the totality of all factors discussed and information presented at the meeting and previous meetings, the Board indicated its agreement to approve the continuance of the Agreement and the ELA. It was noted that in the Trustees’ deliberations regarding the approval of the continuance of the Agreement, the Trustees did not identify any particular information or factor that was all-important or controlling, and that each individual Trustee may have attributed different weights to various factors listed above. After full consideration of the above factors as well as other factors, the Board unanimously concluded that approval of the continuance of the Agreement was in the best interests of the Fund and its shareholders.
36
| BLUE CURRENT GLOBAL DIVIDEND FUND |
| DISCLOSURE REGARDING APPROVAL OF INTERIM AND NEW INVESTMENT |
| ADVISORY AGREEMENTS (Annual Report – Unaudited) |
The Board of Trustees (the “Board”), including the Independent Trustees voting separately, has reviewed and approved an Interim Investment Advisory Agreement (“Interim Advisory Agreement”) for a period not to exceed 150 days from the date of termination of the existing Investment Advisory Agreement (the “Previous Advisory Agreement”), and a new Investment Advisory Agreement (“New Advisory Agreement” and together with the Interim Advisory Agreement, the “Advisory Agreements”)) , each with Edge Advisors, LLC (the “Adviser” or “Edge”) on behalf of the Blue Current Global Dividend Fund (the “Fund”). The Board approved the New Agreements at a special meeting held on May 31, 2023, at which all of the Trustees were present, prior to the termination of the Previous Advisory Agreement in connection with an anticipated indirect change in control of Edge (the “Transaction”). The New Advisory Agreement became effective upon approval by the Fund’s shareholders on September 8, 2023.
In determining whether to approve the New Agreements, including the New Advisory Agreement and Interim Advisory Agreement, the Board recalled its review of the materials presented at this meeting and the April 19-21, 2023 Board Meeting, materials related to the Fund and Edge throughout the last several months and its various discussions with Trust Management and Edge about the operations and performance of the Fund during that period. The Board also considered (i) that Edge represented that the Transaction should not materially affect the Fund’s operation or the level or quality of advisory services provided to the Fund; (ii) that Edge represented that the same portfolio managers who currently provides services to the Fund are anticipated to continue to do so upon the closing of the Transaction; and (iii) Edge’s and Focus Financial Partners Inc.’s agreement to pay for the Fund’s costs and expenses incurred in connection with the Transaction, including the costs and expenses of preparing the Proxy Statement. The Board further considered numerous factors, including, among other things:
The nature, extent, and quality of the services provided by Edge. In this regard, the Board reviewed the services being provided by Edge to the Fund including, without limitation, providing a continuous investment program for the Fund, adhering to the Fund’s investment restrictions, complying with the Trust’s policies and procedures, and voting proxies on behalf of the Fund. The Board considered that there were no anticipated changes in the portfolio managers for the Fund as a result of the Transaction and there would be no anticipated reduction in services. The Board also considered Edge’s financial condition in light of the Transaction and noted that there were no anticipated financial conditions involving the Transaction that would likely impair Edge’s ability to fulfill its commitment to the Fund under the New Advisory Agreement and the Interim Advisory Agreement. The Board concluded that the quality, extent, and nature of the services provided by Edge to the Fund were satisfactory.
The investment performance of the Fund. In this regard, the Board reviewed the Fund’s past performance, including comparisons to peer funds and its benchmark. The Board concluded that the investment performance of the Fund has been satisfactory.
37
| BLUE CURRENT GLOBAL DIVIDEND FUND |
| DISCLOSURE REGARDING APPROVAL OF INTERIM AND NEW INVESTMENT |
| ADVISORY AGREEMENTS (Annual Report – Unaudited) (Continued) |
The costs of the services provided and profits realized by Edge and its affiliates from their relationship with the Fund. In this regard, the Board considered the advisory fees proposed to be charged to the Fund, and the Fund’s total expense ratios, as compared to the Fund’s peer group. The Board considered the terms and conditions of each of the New Advisory Agreement and Interim Advisory Agreement, including the advisory fee rate and the services to be provided by Edge thereunder, and considered that these were the same as under the Previous Advisory Agreement. The Board considered the current and anticipated profitability of the Fund to Edge, if any, and the indirect benefits that Edge receives, including promotion of Edge’s name. The Board concluded that the advisory fee to be paid to Edge by the Fund is reasonable in light of the nature and quality of services provided by Edge.
The extent to which economics of scale would be realized as the Fund grows and whether advisory fee levels reflect these economies of scale for the benefit of the Fund’s investors. In this regard, the Board considered that the Fund’s fee arrangements with Edge will continue to involve both the advisory fee and the expense limitation agreement (“ELA”). The Board determined that while the advisory fee rate remained the same as asset levels increased, the shareholders of the Fund have experienced in the past, and will experience in the future, benefits from the ELA. The Board considered Edge’s willingness to agree to keep the term of the new ELA for a period of at least two years from the closing of the Transaction. The Board concluded that the advisory fee was reasonable in light of the information that was provided to the Board by Edge with respect to economies of scale.
After further discussion of the factors noted above and in reliance on the information provided by Edge and Trust Management, and taking into account the totality of all factors discussed and information presented at this meeting and previous meetings, the Board indicated its agreement to approve the New Agreements. It was noted that in the Board’s deliberations regarding the approval of the New Advisory Agreement and Interim Advisory Agreement, the Board did not identify any particular information or factor that was all-important or controlling, and that each individual Trustee may have attributed different weights to various factors listed above. After full consideration of the above factors as well as other factors, the Board unanimously concluded that approval of the New Agreements and ELA were in the best interests of the Fund and its shareholders.
38
This page intentionally left blank.
This page intentionally left blank.
This page intentionally left blank.
Blue-AR-23

Annual Report
August 31, 2023
| MARSHFIELD CONCENTRATED OPPORTUNITY FUND | |
| LETTER TO SHAREHOLDERS (Unaudited) | September 2023 |
During the fiscal year ending August 31, 2023, the Marshfield Concentrated Opportunity Fund was up 21.46%, compared to the S&P 500 Index which was up 15.94%.
The US economy in the fiscal year ending August 31, 2023 continued to produce mixed signals. The recession, which so many prognosticators assumed was inevitable, has yet to arrive. Unemployment levels remain at historic lows but the economy continues to feel the effects of inflation, even if those effects are more muted on an absolute basis than they were a year ago. However, the Federal Reserve has raised the fed funds target range rate to 5.25% - 5.50% at a rapid pace, creating unforeseen challenges for both businesses and market participants. Even with that near-term history, we continue to be agnostic about the future direction of the economy, but attuned to the current domestic and global economic environment to seek to understand how the companies in which the Fund invests perform in different sets of circumstances.
As we have said in prior years, in the absence of good, actionable information about significant trends in parts of the economy and in specific industries we believe it is in the interest of the Fund and its shareholders to make our investment decisions on a bottom-up basis. Making decisions on such a bottom-up basis means that, regardless of the external economic climate, we buy a stock only after we ask ourselves if it is cheap, has a moat around its business that cannot be easily undermined by competitors, and has a robust corporate culture that is appropriate to its business. As investors, we feel comfortable making a judgment about each of those aspects of a business, and thereby satisfying ourselves that our investments can withstand shocks and not only survive but thrive in any type of external environment.
The Fund’s fiscal year can fairly be characterized as a tale of two halves. In the first half of the year, rising rates and higher inflation created bear market conditions, especially for companies lacking near-term profitability or positive cash flows. During this period, many of the market darlings from the previous year became market pariahs. In the second half, however, as rates and inflation stabilized somewhat and the economy remained healthy, refusing to enter the recession so many had predicted, those same areas of the markets resurged. Given the Fund’s idiosyncratic holdings and lack of exposure to sectors and industries that have a disproportionate impact on the S&P 500 Index, the Fund’s performance was better than the market’s during the first half of the fiscal year, but lagged in the second half.
The Fund’s absolute performance, for the most part, was the result of the market embracing our stock picking, with some of the Fund’s largest holdings producing its best performance. Arch Capital, the Fund’s largest position outside of cash, fared particularly well this year, capitalizing on a hard insurance market to write more business at higher prices, and additionally benefitting from rising interest rates, resulting in generation of more income in its investment portfolio. The Fund’s retail stocks generally performed well, as discount retailers Ross Stores and TJX Companies produced outsized returns with consumers hunting for value in an
1
inflationary environment. AutoZone and O’Reilly Automotive continued their multi-year track record of outstanding performance, excelling with both their store “do it yourself” customers as well as their professional “do it for me” segment, as the prices of both new and used cars remained elevated and many people continued to put more money into their existing cars rather than buying new ones.
Though most stocks in the portfolio performed better than the market as a whole, some did not have a banner year. Railroad company Union Pacific faced declining volumes on its network and was hurt by the perception of unsafe practices in the railroad industry. Goldman Sachs experienced significant declines due to a slower environment in investment banking, and its ill-fated foray into consumer banking. The dynamics that helped drive O’Reilly and AutoZone to success — namely, the increasing cost of car parts and repairs — created challenges for insurer Progressive Corporation, which also continued to struggle in its efforts to achieve profitability in its homeowners’ business.
Our historical track record is one of limited turnover, and that was true again this year, notwithstanding the volatility in the market and greater than normal selling activity. For the year ending August 31, 2023, the Fund’s portfolio turnover rate was 0.0%, reflecting our buy and hold investment strategy.
Our approach in any economic environment is to stick to our discipline and bottom-up investment process, despite the uncertainty that inspires fear in the rest of the market. We buy with conviction those companies that meet our price targets and which we believe possess the attributes necessary for long-term profit generation and outperformance over a cycle. For us, sticking to our discipline means: 1) understanding what’s real and what’s fantasy; 2) acting with equanimity to exploit the misjudgments of the crowd; and 3) being patient and not pulling the trigger before our buy or sell price has been reached (and, conversely, having the grit to pull the trigger when those prices are reached, notwithstanding adverse atmospherics). These things won’t change. Process and discipline are why we believe investors choose to invest in the Fund, and we take our mandate to preserve capital and generate risk-adjusted returns very seriously.
We thank you for the opportunity to invest your money.
Sincerely,
| Elise J. Hoffmann | Christopher M. Niemczewski | Chad Goldberg |
| Portfolio Manager | Portfolio Manager | Portfolio Manager |
Past performance is not predictive of future performance. Investment results and principal value will fluctuate so that shares, when redeemed, may be worth more or less than their original cost. Current performance may be higher or lower than the performance data quoted. Performance data current to the most recent month-end are available by calling 1-855-691-5288.
An investor should consider the investment objectives, risks, charges and expenses of the Fund carefully before investing. The Fund’s prospectus contains this and other important information. To obtain a copy of the Fund’s prospectus please visit
2
our website at www.MarshfieldFunds.com or call 1-855-691-5288 and a copy will be sent to you free of charge. Please read the prospectus carefully before you invest. The Fund is distributed by Ultimus Fund Distributors, LLC.
The Letter to Shareholders seeks to describe some of the Adviser’s current opinions and views of the financial markets. Although the Adviser believes it has a reasonable basis for any opinions or views expressed, actual results may differ, sometimes significantly so, from those expected or expressed. The securities held by the Fund that are discussed in the Letter to Shareholders were held during the period covered by this Report. They do not comprise the entire investment portfolio of the Fund, may be sold at any time, and may no longer be held by the Fund. For a complete list of securities held by the Fund as of August 31, 2023, please see the Schedule of Investments section of the annual report. The opinions of the Fund’s adviser with respect to those securities may change at any time.
Statements in the Letter to Shareholders that reflect projections or expectations for future financial or economic performance of the Fund and the market in general and statements of the Fund’s plans and objectives for future operations are forward-looking statements. No assurance can be given that actual results or events will not differ materially from those projected, estimated, assumed, or anticipated in any such forward-looking statements. Important factors that could result in such differences, in addition to factors noted with such forward-looking statements, include, without limitation, general economic conditions, such as inflation, recession, and interest rates. Past performance is not a guarantee of future results.
3
| MARSHFIELD CONCENTRATED OPPORTUNITY FUND PERFORMANCE INFORMATION (Unaudited) |
Comparison of the Change in Value of a $10,000 Investment in
Marshfield Concentrated Opportunity Fund versus
the S&P 500® Index
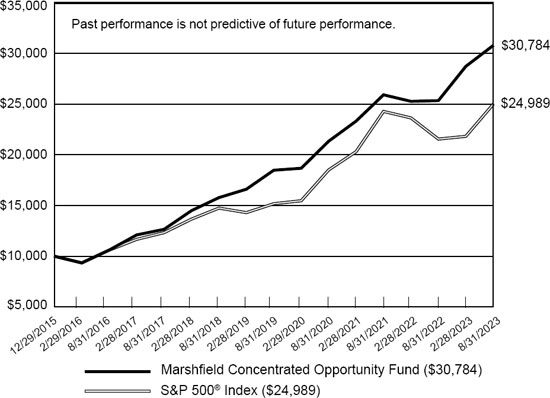
| Average Annual Total Returns | ||||||||
| (for the periods ended August 31, 2023) | ||||||||
| 1 Year | 5 Years | Since Inception(a) | ||||||
| Marshfield Concentrated Opportunity Fund(b) | 21.46% | 14.30% | 15.78% | |||||
| S&P 500® Index(c) | 15.94% | 11.12% | 12.68% | |||||
| (a) | The Fund commenced operations on December 29, 2015. |
| (b) | The total returns shown do not reflect the deduction of taxes a shareholder would pay on Fund distributions, if any, or the redemption of Fund shares. |
| (c) | The S&P 500® Index is a market capitalization weighted index of 500 large companies that is widely used as a barometer of U.S. stock market performance. The index is unmanaged and shown for illustration purposes only. An investor cannot invest in an index and its returns are not indicative of the performance of any specific investment. |
4
| MARSHFIELD CONCENTRATED OPPORTUNITY FUND |
| PORTFOLIO INFORMATION |
| August 31, 2023 (Unaudited) |
| Portfolio Allocation (% of Net Assets) |
| Sector Allocation | % of Net Assets | |||
| Retail Trade | 30.9 | % | ||
| Finance and Insurance | 29.9 | % | ||
| Transportation and Warehousing | 5.7 | % | ||
| Accommodation and Food Services | 4.9 | % | ||
| Manufacturing | 4.8 | % | ||
| Construction | 3.8 | % | ||
| Administrative and Support and Waste Management and Remediation Services | 3.3 | % | ||
| Educational Services | 3.3 | % | ||
| Wholesale Trade | 2.5 | % | ||
| Information | 2.3 | % | ||
| Money Market Funds | 9.5 | % | ||
| Net Other Assets (Liabilities) | (0.9 | %) | ||
| 100.0 | % | |||
| Top 10 Equity Holdings |
| Security Description | % of Net Assets | |||
| Arch Capital Group Ltd. | 10.3 | % | ||
| Ross Stores, Inc. | 9.3 | % | ||
| AutoZone, Inc. | 9.1 | % | ||
| O’Reilly Automotive, Inc. | 6.3 | % | ||
| TJX Companies, Inc. (The) | 6.2 | % | ||
| Goldman Sachs Group, Inc. (The) | 5.0 | % | ||
| Mastercard, Inc. - Class A | 4.9 | % | ||
| Domino’s Pizza, Inc. | 4.9 | % | ||
| Cummins, Inc. | 4.8 | % | ||
| Visa, Inc. - Class A | 4.5 | % | ||
5
| MARSHFIELD CONCENTRATED OPPORTUNITY FUND |
| SCHEDULE OF INVESTMENTS |
| August 31, 2023 |
| COMMON STOCKS — 91.4% | Shares | Value | ||||||
| Accommodation and Food Services — 4.9% | ||||||||
| Restaurants and Other Eating Places — 4.9% | ||||||||
| Domino’s Pizza, Inc. | 67,325 | $ | 26,081,705 | |||||
| Administrative and Support and Waste Management and Remediation Services — 3.3% | ||||||||
| Credit Bureaus — 3.3% | ||||||||
| Moody’s Corporation | 51,822 | 17,453,649 | ||||||
| Construction — 3.8% | ||||||||
| Residential Building Construction — 3.8% | ||||||||
| NVR, Inc. (a) | 3,215 | 20,503,116 | ||||||
| Educational Services — 3.3% | ||||||||
| Colleges, Universities, and Professional Schools — 3.3% | ||||||||
| Strategic Education, Inc. | 223,622 | 17,330,705 | ||||||
| Finance and Insurance — 29.9% | ||||||||
| Credit Card Issuing — 2.0% | ||||||||
| Discover Financial Services | 120,304 | 10,835,781 | ||||||
| Direct Insurance (except Life, Health, and Medical) Carriers — 13.5% | ||||||||
| Arch Capital Group Ltd. (a) | 717,085 | 55,115,153 | ||||||
| Progressive Corporation (The) | 127,964 | 17,079,355 | ||||||
| 72,194,508 | ||||||||
| Financial Transactions Processing, Reserve, and Clearinghouse Activities — 9.4% | ||||||||
| Mastercard, Inc. - Class A | 63,314 | 26,125,889 | ||||||
| Visa, Inc. - Class A | 97,302 | 23,905,155 | ||||||
| 50,031,044 | ||||||||
| Investment Banking and Securities Intermediation — 5.0% | ||||||||
| Goldman Sachs Group, Inc. (The) | 80,764 | 26,467,171 | ||||||
| Information — 2.3% | ||||||||
| Motion Picture and Video Production — 2.3% | ||||||||
| Walt Disney Company (The) (a) | 148,526 | 12,428,656 | ||||||
| Manufacturing — 4.8% | ||||||||
| Engine, Turbine, and Power Transmission Equipment — 4.8% | ||||||||
| Cummins, Inc. | 111,601 | 25,672,694 | ||||||
6
| MARSHFIELD CONCENTRATED OPPORTUNITY FUND |
| SCHEDULE OF INVESTMENTS (Continued) |
| COMMON STOCKS — 91.4% (Continued) | Shares | Value | ||||||
| Retail Trade — 30.9% | ||||||||
| Automotive Parts and Accessories Retailers — 15.4% | ||||||||
| AutoZone, Inc. (a) | 19,257 | $ | 48,745,822 | |||||
| O’Reilly Automotive, Inc. (a) | 35,692 | 33,539,772 | ||||||
| 82,285,594 | ||||||||
| Clothing and Clothing Accessories Retailers — 15.5% | ||||||||
| Ross Stores, Inc. | 404,428 | 49,263,375 | ||||||
| TJX Companies, Inc. (The) | 358,919 | 33,192,829 | ||||||
| 82,456,204 | ||||||||
| Transportation and Warehousing — 5.7% | ||||||||
| Freight Transportation Arrangement — 4.0% | ||||||||
| Expeditors International of Washington, Inc. | 184,221 | 21,500,433 | ||||||
| Rail Transportation — 1.7% | ||||||||
| Union Pacific Corporation | 39,805 | 8,779,789 | ||||||
| Wholesale Trade — 2.5% | ||||||||
| Industrial Supplies Merchant Wholesalers — 2.5% | ||||||||
| Fastenal Company | 234,795 | 13,519,496 | ||||||
| Total Common Stocks (Cost $365,580,400) | $ | 487,540,545 | ||||||
| MONEY MARKET FUNDS — 9.5% | Shares | Value | ||||||
| Goldman Sachs Financial Square Funds - Treasury Instruments Fund - Institutional Shares, 5.15% (b) | 19,235,179 | $ | 19,235,179 | |||||
| Vanguard Treasury Money Market Fund - Investor Shares, 5.20% (b) | 31,162,170 | 31,162,170 | ||||||
| Total Money Market Funds (Cost $50,397,349) | $ | 50,397,349 | ||||||
| Investments at Value — 100.9% (Cost $415,977,749) | $ | 537,937,894 | ||||||
| Liabilities in Excess of Other Assets — (0.9%) | (4,897,350 | ) | ||||||
| Net Assets — 100.0% | $ | 533,040,544 | ||||||
| (a) | Non-income producing security. |
| (b) | The rate shown is the 7-day effective yield as of August 31, 2023. |
See accompanying notes to financial statements.
7
| MARSHFIELD CONCENTRATED OPPORTUNITY FUND |
| STATEMENT OF ASSETS AND LIABILITIES |
| August 31, 2023 |
| ASSETS | ||||
| Investments in securities: | ||||
| At cost | $ | 415,977,749 | ||
| At value (Note 2) | $ | 537,937,894 | ||
| Receivable for capital shares sold | 505,625 | |||
| Dividends receivable | 1,000,414 | |||
| Other assets | 31,887 | |||
| Total assets | 539,475,820 | |||
| LIABILITIES | ||||
| Payable for capital shares redeemed | 579,693 | |||
| Payable for investment securities purchased | 5,391,815 | |||
| Payable to Adviser (Note 4) | 380,539 | |||
| Payable to administrator (Note 4) | 45,250 | |||
| Other accrued expenses | 37,979 | |||
| Total liabilities | 6,435,276 | |||
| CONTINGENCIES AND COMMITMENTS (NOTE 5) | — | |||
| NET ASSETS | $ | 533,040,544 | ||
| NET ASSETS CONSIST OF: | ||||
| Paid-in capital | $ | 409,089,475 | ||
| Distributable earnings | 123,951,069 | |||
| NET ASSETS | $ | 533,040,544 | ||
| Shares of beneficial interest outstanding (unlimited number of shares authorized, no par value) | 20,270,679 | |||
| Net asset value, offering price and redemption price per share (Note 2) | $ | 26.30 | ||
See accompanying notes to financial statements.
8
| MARSHFIELD CONCENTRATED OPPORTUNITY FUND |
| STATEMENT OF OPERATIONS |
| For the Year Ended August 31, 2023 |
| INVESTMENT INCOME | ||||
| Dividend income | $ | 6,653,984 | ||
| EXPENSES | ||||
| Management fees (Note 4) | 3,958,887 | |||
| Administration fees (Note 4) | 296,096 | |||
| Fund accounting fees (Note 4) | 73,690 | |||
| Registration and filing fees | 65,362 | |||
| Custody and bank service fees | 46,496 | |||
| Compliance fees and expenses (Note 4) | 44,074 | |||
| Transfer agent fees (Note 4) | 39,665 | |||
| Legal fees | 23,829 | |||
| Trustees’ fees and expenses (Note 4) | 19,346 | |||
| Shareholder reporting expenses | 18,773 | |||
| Audit and tax services fees | 17,326 | |||
| Postage and supplies | 12,351 | |||
| Insurance expense | 5,716 | |||
| Other expenses | 16,247 | |||
| Total expenses | 4,637,858 | |||
| Less fee reductions by the Adviser (Note 4) | (512,269 | ) | ||
| Net expenses | 4,125,589 | |||
| NET INVESTMENT INCOME | 2,528,395 | |||
| REALIZED AND UNREALIZED GAINS ON INVESTMENTS | ||||
| Net realized gains from investment transactions | 3,540 | |||
| Net change in unrealized appreciation (depreciation) on investments | 73,206,553 | |||
| NET REALIZED AND UNREALIZED GAINS ON INVESTMENTS | 73,210,093 | |||
| NET INCREASE IN NET ASSETS RESULTING FROM OPERATIONS | $ | 75,738,488 | ||
See accompanying notes to financial statements.
9
| MARSHFIELD CONCENTRATED OPPORTUNITY FUND |
| STATEMENTS OF CHANGES IN NET ASSETS |
| Year | Year | |||||||
| Ended | Ended | |||||||
| August 31, | August 31, | |||||||
| 2023 | 2022 | |||||||
| FROM OPERATIONS | ||||||||
| Net investment income (loss) | $ | 2,528,395 | $ | (112,294 | ) | |||
| Net realized gains from investment transactions | 3,540 | 825,908 | ||||||
| Net change in unrealized appreciation (depreciation) on investments | 73,206,553 | (7,878,746 | ) | |||||
| Net increase (decrease) in net assets resulting from operations | 75,738,488 | (7,165,132 | ) | |||||
| DISTRIBUTIONS TO SHAREHOLDERS (Note 2) | (1,316,545 | ) | (19,309,352 | ) | ||||
| CAPITAL SHARE TRANSACTIONS | ||||||||
| Proceeds from shares sold | 210,124,396 | 74,626,153 | ||||||
| Net asset value of shares issued in reinvestment of distributions to shareholders | 1,285,302 | 18,856,278 | ||||||
| Proceeds from redemption fees collected (Note 2) | 167,152 | 38,780 | ||||||
| Payments for shares redeemed | (64,534,655 | ) | (41,585,917 | ) | ||||
| Net increase in net assets from capital share transactions | 147,042,195 | 51,935,294 | ||||||
| TOTAL INCREASE IN NET ASSETS | 221,464,138 | 25,460,810 | ||||||
| NET ASSETS | ||||||||
| Beginning of year | 311,576,406 | 286,115,596 | ||||||
| End of year | $ | 533,040,544 | $ | 311,576,406 | ||||
| CAPITAL SHARES ACTIVITY | ||||||||
| Shares sold | 8,504,444 | 3,320,772 | ||||||
| Shares reinvested | 53,733 | 835,828 | ||||||
| Shares redeemed | (2,627,359 | ) | (1,857,066 | ) | ||||
| Net increase in shares outstanding | 5,930,818 | 2,299,534 | ||||||
| Shares outstanding at beginning of year | 14,339,861 | 12,040,327 | ||||||
| Shares outstanding at end of year | 20,270,679 | 14,339,861 | ||||||
See accompanying notes to financial statements.
10
| MARSHFIELD CONCENTRATED OPPORTUNITY FUND |
| FINANCIAL HIGHLIGHTS |
Per Share Data for a Share Outstanding Throughout Each Year
| Year | Year | Year | Year | Year | ||||||||||||||||
| Ended | Ended | Ended | Ended | Ended | ||||||||||||||||
| August 31, | August 31, | August 31, | August 31, | August 31, | ||||||||||||||||
| 2023 | 2022 | 2021 | 2020 | 2019 | ||||||||||||||||
| Net asset value at beginning of year | $ | 21.73 | $ | 23.76 | $ | 20.10 | $ | 17.65 | $ | 15.37 | ||||||||||
| Income (loss) from investment operations: | ||||||||||||||||||||
| Net investment income (loss) | 0.13 | (0.01 | ) | (0.06 | ) | (0.02 | ) | 0.02 | ||||||||||||
| Net realized and unrealized gains (losses) on investments | 4.51 | (0.46 | ) | 4.27 | 2.72 | 2.53 | ||||||||||||||
| Total from investment operations | 4.64 | (0.47 | ) | 4.21 | 2.70 | 2.55 | ||||||||||||||
| Less distributions from: | ||||||||||||||||||||
| Net investment income | (0.03 | ) | — | — | (0.02 | ) | (0.00 | ) (a) | ||||||||||||
| Net realized gains | (0.05 | ) | (1.56 | ) | (0.56 | ) | (0.24 | ) | (0.27 | ) | ||||||||||
| Total distributions | (0.08 | ) | (1.56 | ) | (0.56 | ) | (0.26 | ) | (0.27 | ) | ||||||||||
| Proceeds from redemption fees collected (Note 2) | 0.01 | 0.00 | (a) | 0.01 | 0.01 | 0.00 | (a) | |||||||||||||
| Net asset value at end of year | $ | 26.30 | $ | 21.73 | $ | 23.76 | $ | 20.10 | $ | 17.65 | ||||||||||
| Total return (b) | 21.46 | % | (2.21 | %) | 21.44 | % | 15.47 | % | 17.12 | % | ||||||||||
| Net assets at end of year (000’s) | $ | 533,041 | $ | 311,576 | $ | 286,116 | $ | 202,381 | $ | 88,589 | ||||||||||
| Ratios/supplementary data: | ||||||||||||||||||||
| Ratio of total expenses to average net assets | 1.11 | % | 1.14 | % | 1.15 | % | 1.23 | % | 1.48 | % | ||||||||||
| Ratio of net expenses to average net assets (c) | 0.99 | % | 0.99 | % | 1.01 | % | 1.10 | % | 1.10 | % | ||||||||||
| Ratio of net investment income (loss) to average net assets (c) | 0.61 | % | (0.04 | %) | (0.31 | %) | (0.10 | %) | 0.22 | % | ||||||||||
| Portfolio turnover rate | 0 | % | 3 | % | 24 | % | 14 | % | 14 | % | ||||||||||
| (a) | Amount rounds to less than $0.01 per share. |
| (b) | Total return is a measure of the change in value of an investment in the Fund over the periods covered. The returns shown do not reflect the deduction of taxes a shareholders would pay on Fund distributions, if any, or the redemption of Fund shares. The total returns would be lower if the Adviser had not reduced advisory fees and/or reimbursed expenses (Note 4). |
| (c) | Ratio was determined after advisory fee reductions and/or expense reimbursements (Note 4). |
See accompanying notes to financial statements.
11
| MARSHFIELD CONCENTRATED OPPORTUNITY FUND |
| NOTES TO FINANCIAL STATEMENTS |
| August 31, 2023 |
1. Organization
Marshfield Concentrated Opportunity Fund (the “Fund”) is a non-diversified series of Ultimus Managers Trust (the “Trust”), an open-end investment company established as an Ohio business trust under a Declaration of Trust dated February 28, 2012. Other series of the Trust are not incorporated in this report.
The investment objective of the Fund is to seek the dual goals of capital preservation and the long-term growth of principal, while targeting a pattern of performance at variance with that of the market.
2. Significant Accounting Policies
The Fund follows accounting and reporting guidance under Financial Accounting Standards Board Accounting Standards Codification Topic 946, “Financial Services – Investment Companies.” The following is a summary of the Fund’s significant accounting policies used in the preparation of its financial statements. These policies are in conformity with accounting principles generally accepted in the United States of America (“GAAP”).
Regulatory update – Tailored Shareholder Reports for Mutual Funds and Exchange-Traded Funds (“ETFs”) - Effective January 24, 2023, the Securities and Exchange Commission (the “SEC”) adopted rule and form amendments to require mutual funds and ETFs to transmit concise and visually engaging streamlined annual and semiannual reports to shareholders that highlight key information. Other information, including financial statements, will no longer appear in a streamlined shareholder report but must be available online, delivered free of charge upon request, and filed on a semiannual basis on Form N-CSR. The rule and form amendments have a compliance date of July 24, 2024. At this time, management is evaluating the impact of these amendments on the shareholder reports for the Fund.
Securities valuation – The Fund values its portfolio securities at fair value as of the close of regular trading on the New York Stock Exchange (the “NYSE”) (normally 4:00 p.m. Eastern time) on each business day the NYSE is open for business. The Fund values its listed securities, including common stocks, on the basis of the security’s last sale price on the security’s primary exchange, if available, otherwise at the exchange’s most recently quoted mean price. NASDAQ-listed securities are valued at the NASDAQ Official Closing Price. Investments representing shares of other registered open-end investment companies that are not listed on an exchange, including money market funds, are valued at their net asset value (“NAV”) as reported by such companies. When using a quoted price and when the market is considered active, the security will be classified as Level 1 within the fair value hierarchy (see below). Fixed income securities, if any, are generally valued using prices provided by an independent pricing service. The independent pricing service uses information with respect to transactions in bonds, quotations from bond dealers, market transactions in comparable securities, and various relationships
12
| MARSHFIELD CONCENTRATED OPPORTUNITY FUND |
| NOTES TO FINANCIAL STATEMENTS (Continued) |
between securities in determining these prices. In the event that market quotations are not readily available or are considered unreliable due to market or other events, the Fund values its securities and other assets at fair value as determined by Marshfield Associates, Inc. (the “Adviser”), as the Fund’s valuation designee, in accordance with procedures adopted by the Board of Trustees (the “Board”) pursuant to Rule 2a-5 under the Investment Company Act of 1940, as amended (the “1940 Act”). Under these procedures, the securities will be classified as Level 2 or 3 within the fair value hierarchy, depending on the inputs used. Unavailable or unreliable market quotes may be due to the following factors: a substantial bid-ask spread; infrequent sales resulting in stale prices; insufficient trading volume; small trade sizes; a temporary lapse in any reliable pricing source; and actions of the securities or futures markets, such as the suspension or limitation of trading. As a result, the prices of securities used to calculate the Fund’s NAV may differ from quoted or published prices for the same securities.
GAAP establishes a single authoritative definition of fair value, sets out a framework for measuring fair value, and requires additional disclosures about fair value measurements.
Various inputs are used in determining the value of the Fund’s investments. These inputs are summarized in the three broad levels listed below:
| ● | Level 1 – quoted prices in active markets for identical securities |
| ● | Level 2 – other significant observable inputs |
| ● | Level 3 – significant unobservable inputs |
Fixed income securities held by the Fund, if any, are classified as Level 2 since values are based on prices provided by an independent pricing service that utilizes various “other significant observable inputs” including bid and ask quotations, prices of similar securities, and interest rates, among other factors.
The inputs or methods used for valuing securities are not necessarily an indication of the risks associated with investing in those securities. The inputs used to measure fair value may fall into different levels of the fair value hierarchy. In such cases, for disclosure purposes, the level in the fair value hierarchy within which the fair value measurement falls in its entirety is determined based on the lowest level input that is significant to the fair value measurement.
The following is a summary of the Fund’s investments by the inputs used to value the investments as of August 31, 2023:
| Level 1 | Level 2 | Level 3 | Total | |||||||||||||
| Common Stocks | $ | 487,540,545 | $ | — | $ | — | $ | 487,540,545 | ||||||||
| Money Market Funds | 50,397,349 | — | — | 50,397,349 | ||||||||||||
| Total | $ | 537,937,894 | $ | — | $ | — | $ | 537,937,894 | ||||||||
13
| MARSHFIELD CONCENTRATED OPPORTUNITY FUND |
| NOTES TO FINANCIAL STATEMENTS (Continued) |
Refer to the Fund’s Schedule of Investments for a listing of the common stocks by sector and industry type. The Fund did not hold derivative instruments or any assets or liabilities that were measured at fair value on a recurring basis using significant unobservable inputs (Level 3) as of or during the year ended August 31, 2023.
Share valuation – The NAV per share of the Fund is calculated daily by dividing the total value of the Fund’s assets, less liabilities, by the number of shares outstanding. The offering price and redemption price per share of the Fund is equal to the NAV, except that shares of the Fund are subject to a redemption fee of 2% if redeemed within 90 days of the date of purchase. During the years ended August 31, 2023 and 2022, proceeds from the redemption fees, recorded in capital, totaled $167,152 and $38,780, respectively.
Investment income – Dividend income is recorded on the ex-dividend date. Non-cash dividends included in dividend income, if any, are recorded at the fair value of the security received. Interest income is accrued as earned.
Investment transactions – Investment transactions are accounted for on the trade date. Realized gains and losses on investments sold are determined on a specific identification basis.
Common expenses – Common expenses of the Trust are allocated among the Fund and the other series of the Trust based on the relative net assets of each series, the number of series in the Trust, or the nature of the services performed and the relative applicability to each series.
Distributions to shareholders – The Fund will distribute to shareholders any net investment income dividends and net realized capital gains distributions at least once each year. The amount of such dividends and distributions are determined in accordance with federal income tax regulations, which may differ from GAAP. Dividends and distributions are recorded on the ex-dividend date. The tax character of the Fund’s distributions paid to shareholders during the years ended August 31, 2023 and 2022 was as follows:
| Long-Term | ||||||||||||
| Year | Ordinary | Capital | Total | |||||||||
| Ended | Income | Gains | Distributions | |||||||||
| 8/31/2023 | $ | 533,709 | $ | 782,836 | $ | 1,316,545 | ||||||
| 8/31/2022 | $ | 3,899,532 | $ | 15,409,820 | $ | 19,309,352 | ||||||
Estimates – The preparation of financial statements in conformity with GAAP requires management to make estimates and assumptions that affect the reported amounts of assets and liabilities and disclosure of contingent assets and liabilities as of the date of the financial statements and the reported amounts of increase (decrease) in net assets from operations during the reporting period. Actual results could differ from those estimates.
14
| MARSHFIELD CONCENTRATED OPPORTUNITY FUND |
| NOTES TO FINANCIAL STATEMENTS (Continued) |
Federal income tax – The Fund has qualified and intends to continue to qualify as a regulated investment company under the Internal Revenue Code of 1986, as amended (the “Code”). Qualification generally will relieve the Fund of liability for federal income taxes to the extent 100% of its net investment income and net realized capital gains are distributed in accordance with the Code.
In order to avoid imposition of the excise tax applicable to regulated investment companies, it is also the Fund’s intention to declare as dividends in each calendar year at least 98% of its net investment income (earned during the calendar year) and 98.2% of its net realized capital gains (earned during the 12 months ended October 31) plus undistributed amounts from prior years.
The following information is computed on a tax basis for each item as of August 31, 2023:
| Tax cost of portfolio investments | $ | 415,985,051 | ||
| Gross unrealized appreciation | $ | 129,439,755 | ||
| Gross unrealized depreciation | (7,486,912 | ) | ||
| Net unrealized appreciation | 121,952,843 | |||
| Undistributed ordinary income | 1,998,226 | |||
| Distributable earnings | $ | 123,951,069 | ||
The values of the federal income tax cost of investments and the financial statement cost of investments may be temporarily different (“book/tax differences”). These book/tax differences are due to the timing of the recognition of capital gains or losses under income tax regulations and GAAP, primarily due to the tax deferral of losses on wash sales.
The Fund recognizes the tax benefits or expenses of uncertain tax positions only when the position is “more likely than not” to be sustained assuming examination by tax authorities. Management has reviewed the Fund’s tax positions for all open tax years (generally, three years) and has concluded that no provision for unrecognized tax benefits or expenses is required in these financial statements. The Fund identifies its major tax jurisdiction as U.S. Federal.
The Fund recognizes interest and penalties, if any, related to unrecognized tax benefits as income tax on the Statement of Operations. During the year ended August 31, 2023, the Fund did not incur any interest or penalties.
3. Investment Transactions
During the year ended August 31, 2023, cost of purchases and proceeds from sales of investment securities, other than short-term investments, were $164,972,232 and $0, respectively.
15
| MARSHFIELD CONCENTRATED OPPORTUNITY FUND |
| NOTES TO FINANCIAL STATEMENTS (Continued) |
4. Transactions with Related Parties
INVESTMENT ADVISORY AGREEMENT
The Fund’s investments are managed by the Adviser pursuant to the terms of an Investment Advisory Agreement. Under the Investment Advisory Agreement, the Fund pays the Adviser a management fee, computed and accrued daily and paid monthly, at the annual rate of 0.95% of its average daily net assets.
Pursuant to an Expense Limitation Agreement (“ELA”) between the Fund and the Adviser, the Adviser has contractually agreed, until January 1, 2024, to reduce its management fees and reimburse other expenses to limit total annual operating expenses (exclusive of brokerage costs; taxes; interest; borrowing costs such as interest and dividend expenses on securities sold short; costs to organize the Fund; acquired fund fees and expenses; extraordinary expenses such as litigation and merger or reorganization costs and other expenses not incurred in the ordinary course of the Fund’s business), to an amount not exceeding 0.99% of the Fund’s average daily net assets. Accordingly, during the year ended August 31, 2023, the Adviser reduced its management fees by $512,269.
Under the terms of the ELA, investment advisory fee reductions and expense reimbursements by the Adviser are subject to repayment by the Fund for a period of 36 months after such fees and expenses were incurred, provided the repayments do not cause total annual operating expenses to exceed the lesser of: (i) the expense limitation then in effect, if any, and (ii) the expense limitation in effect at the time the expenses to be repaid were incurred. As of August 31, 2023, the Adviser may seek repayment of management fee reductions and expense reimbursements in the amount of $1,304,515 no later than the dates as stated below:
| August 31, 2024 | $ | 349,624 | ||
| August 31, 2025 | 442,622 | |||
| August 31, 2026 | 512,269 | |||
| Total | $ | 1,304,515 | ||
OTHER SERVICE PROVIDERS
Ultimus Fund Solutions, LLC (“Ultimus”) provides administration, fund accounting, compliance and transfer agency services to the Fund. The Fund pays Ultimus fees in accordance with the agreements for such services. In addition, the Fund pays out-of-pocket expenses including, but not limited to, postage, supplies, and certain costs related to the pricing of the Fund’s portfolio securities.
Under the terms of a Distribution Agreement with the Trust, Ultimus Fund Distributors, LLC (the “Distributor”) serves as principal underwriter to the Fund. The Distributor is a wholly -owned subsidiary of Ultimus. The Distributor is compensated by the Adviser (not the Fund) for acting as principal underwriter.
16
| MARSHFIELD CONCENTRATED OPPORTUNITY FUND |
| NOTES TO FINANCIAL STATEMENTS (Continued) |
Certain officers and a Trustee of the Trust are also officers of Ultimus and are not paid by the Trust or the Fund for serving in such capacities.
TRUSTEE COMPENSATION
Effective October 17, 2022 each member of the Board (a “Trustee”) who is not an “interested person” (as defined by the 1940 Act, as amended) of the Trust (“Independent Trustee”) receives a $1,300 annual retainer from the Fund, paid quarterly, except for the Board Chairperson who receives a $1,700 annual retainer from the Fund, paid quarterly and the Audit Committee Chairperson who receives a $1,500 annual retainer from the Fund, paid quarterly. Each Independent Trustee also receives from the Fund a fee of $550 for each Board meeting attended plus reimbursement for travel and other meeting-related expenses. Prior to October 17, 2022, no additional annual retainer was designated specifically for the Audit Committee Chairperson.
PRINCIPAL HOLDER OF FUND SHARES
As of August 31, 2023, the following shareholder owned of record 25% or more of the outstanding shares of the Fund:
| Name of Record Owner | % Ownership |
| RBC Capital Markets, LLC (for the benefit of its customers) | 59% |
A beneficial owner of 25% or more of the Fund’s outstanding shares may be considered a controlling person. That shareholder’s vote could have a more significant effect on matters presented at a shareholders’ meeting.
5. Contingencies and Commitments
The Fund indemnifies the Trust’s officers and Trustees for certain liabilities that might arise from their performance of their duties to the Fund. Additionally, in the normal course of business the Fund enters into contracts that contain a variety of representations and warranties and which provide general indemnifications. The Fund’s maximum exposure under these arrangements is unknown, as this would involve future claims that may be made against the Fund that have not yet occurred. However, based on experience, the Fund expects the risk of loss to be remote.
6. Non-Diversified Risk
The Fund is a “non-diversified fund,” which means that it may invest more of its assets in the securities of a single issuer or a small number of issuers than a diversified fund. Non-diversification increases the risk that the Fund’s share price could decrease to a larger extent than a Fund that is diversified because of the poor performance of a single investment.
17
| MARSHFIELD CONCENTRATED OPPORTUNITY FUND |
| NOTES TO FINANCIAL STATEMENTS (Continued) |
7. Sector Risk
If a Fund has significant investments in the securities of issuers in industries within a particular business sector, any development generally affecting that sector will have a greater impact on the value of the net assets of the Fund than would be the case if the Fund did not have significant investments in that sector. This may increase the risk of loss of an investment in a Fund and increase the volatility of a Fund’s NAV per share. From time to time, circumstances may affect a particular sector and the companies within such sector. For instance, economic or market factors, regulation or deregulation, and technological or other developments, may negatively impact all companies in a particular sector and therefore the value of a Fund’s portfolio could be adversely affected if it has significant holdings of securities of issuers in that sector. As of August 31, 2023, the Fund had 30.9% of the value of its net assets invested in stocks in the Retail Trade sector and 29.9% of the value of its net assets invested in stocks in the Finance and Insurance sector.
8. Subsequent Event
The Fund is required to recognize in the financial statements the effects of all subsequent events that provide additional evidence about conditions that existed as of the date of the Statement of Assets and Liabilities. For non-recognized subsequent events that must be disclosed to keep the financial statements from being misleading, the Fund is required to disclose the nature of the event as well as an estimate of its financial effect, or a statement that such an estimate cannot be made. Management has evaluated subsequent events through the issuance of these financial statements and has noted no such events.
18
| MARSHFIELD CONCENTRATED OPPORTUNITY FUND |
| REPORT OF INDEPENDENT REGISTERED PUBLIC ACCOUNTING FIRM |
To the Shareholders of Marshfield Concentrated Opportunity Fund and
Board of Trustees of Ultimus Managers Trust
Opinion on the Financial Statements
We have audited the accompanying statement of assets and liabilities, including the schedule of investments, of Marshfield Concentrated Opportunity Fund (the “Fund”), a series of Ultimus Managers Trust, as of August 31, 2023, and the related statement of operations for the year then ended, the statements of changes in net assets for each of the two years in the period then ended, the related notes, and the financial highlights for each of the five years in the period then ended (collectively referred to as the “financial statements”). In our opinion, the financial statements present fairly, in all material respects, the financial position of the Fund as of August 31, 2023, the results of its operations for the year then ended, the changes in net assets for each of the two years in the period then ended, and the financial highlights for each of the five years in the period then ended, in conformity with accounting principles generally accepted in the United States of America.
Basis for Opinion
These financial statements are the responsibility of the Fund’s management. Our responsibility is to express an opinion on the Fund’s financial statements based on our audits. We are a public accounting firm registered with the Public Company Accounting Oversight Board (United States) (“PCAOB”) and are required to be independent with respect to the Fund in accordance with the U.S. federal securities laws and the applicable rules and regulations of the Securities and Exchange Commission and the PCAOB.
We conducted our audits in accordance with the standards of the PCAOB. Those standards require that we plan and perform the audit to obtain reasonable assurance about whether the financial statements are free of material misstatement whether due to error or fraud.
Our audits included performing procedures to assess the risks of material misstatement of the financial statements, whether due to error or fraud, and performing procedures that respond to those risks. Such procedures included examining, on a test basis, evidence regarding the amounts and disclosures in the financial statements. Our procedures included confirmation of securities owned as of August 31, 2023, by correspondence with the custodian and broker. Our audits also included evaluating the accounting principles used and significant estimates made by management, as well as evaluating the overall presentation of the financial statements. We believe that our audits provide a reasonable basis for our opinion.
We have served as the Fund’s auditor since 2016.
COHEN & COMPANY, LTD.
Philadelphia, Pennsylvania
October 30, 2023
19
| MARSHFIELD CONCENTRATED OPPORTUNITY FUND |
| ABOUT YOUR FUND’S EXPENSES (Unaudited) |
We believe it is important for you to understand the impact of costs on your investment. As a shareholder of the Fund, you incur two types of cost: (1) transaction costs, including redemption fees; and (2) ongoing costs, including management fees and other operating expenses. The following examples are intended to help you understand your ongoing costs (in dollars) of investing in the Fund and to compare these costs with the ongoing costs of investing in other mutual funds.
A mutual fund’s ongoing costs are expressed as a percentage of its average net assets. This figure is known as the expense ratio. The expenses in the table below are based on an investment of $1,000 made at the beginning of the most recent period (March 1, 2023) and held until the end of the period (August 31, 2023).
The table below illustrates the Fund’s ongoing costs in two ways:
Actual fund return – This section helps you to estimate the actual expenses that you paid over the period. The “Ending Account Value” shown is derived from the Fund’s actual return, and the fourth column shows the dollar amount of operating expenses that would have been paid by an investor who started with $1,000 in the Fund. You may use the information here, together with the amount you invested, to estimate the expenses that you paid over the period.
To do so, simply divide your account value by $1,000 (for example, an $8,600 account value divided by $1,000 = 8.6), then multiply the result by the number given for the Fund under the heading “Expenses Paid During Period.”
Hypothetical 5% return – This section is intended to help you compare the Fund’s ongoing costs with those of other mutual funds. It assumes that the Fund had an annual return of 5% before expenses during the period shown, but that the expense ratio is unchanged. In this case, because the return used is not the Fund’s actual return, the results do not apply to your investment. The example is useful in making comparisons because the U.S. Securities and Exchange Commission (“SEC”) requires all mutual funds to calculate expenses based on a 5% return. You can assess the Fund’s ongoing costs by comparing this hypothetical example with the hypothetical examples that appear in shareholder reports of other funds.
Note that expenses shown in the table are meant to highlight and help you compare ongoing costs only. The Fund does not charge sales loads. However, a redemption fee of 2% is applied on the sale of shares held for less than 90 days.
The calculations assume no shares were bought or sold during the period. Your actual costs may have been higher or lower, depending on the amount of your investment and the timing of any purchases or redemptions.
More information about the Fund’s expenses can be found in this report. For additional information on operating expenses and other shareholder costs, please refer to the Fund’s prospectus.
20
| MARSHFIELD CONCENTRATED OPPORTUNITY FUND |
| ABOUT YOUR FUND’S EXPENSES (Unaudited) (Continued) |
| Beginning | Ending | |||
| Account Value | Account Value | Net | Expenses | |
| March 1, | August 31, | Expense | Paid During | |
| 2023 | 2023 | Ratio (a) | Period (b) | |
| Based on Actual Fund Return | $1,000.00 | $1,071.70 | 0.99% | $5.17 |
| Based on Hypothetical 5% Return (before expenses) | $1,000.00 | $1,020.21 | 0.99% | $5.04 |
| (a) | Annualized, based on the Fund’s most recent one-half year expenses. |
| (b) | Expenses are equal to the Fund’s annualized net expense ratio multiplied by the average account value over the period, multiplied by 184/365 (to reflect the one-half year period). |
| OTHER INFORMATION (Unaudited) |
A description of the policies and procedures that the Fund uses to vote proxies relating to portfolio securities is available without charge upon request by calling toll-free 1-855-691-5288, or on the SEC’s website at www.sec.gov. Information regarding how the Fund voted proxies relating to portfolio securities during the most recent 12-month period ended June 30 is available without charge upon request by calling toll-free 1-855-691-5288, or on the SEC’s website at www.sec.gov.
The Trust files a complete listing of portfolio holdings for the Fund with the SEC as of the end of the first and third quarters of each fiscal year as an exhibit to its reports on Form N-PORT. These filings are available upon request by calling 1-855-691-5288. Furthermore, you may obtain a copy of the filings on the SEC’s website at www.sec.gov. and on the Fund’s website www.marshfieldfunds.com.
| FEDERAL TAX INFORMATION (Unaudited) |
For the fiscal year ended August 31, 2023, the Fund designated $782,836 as long-term capital gain distributions.
Qualified Dividend Income – The Fund designates 100.00% of its ordinary income dividends, or up to the maximum amount of such dividends allowable pursuant to the Internal Revenue Code, as qualified dividend income eligible for the reduced tax rate of 15%.
Dividends Received Deduction – Corporate shareholders are generally entitled to take the dividends received deduction on the portion of a Fund’s dividend distribution that qualifies under tax law. For the Fund’s fiscal year ended August 31, 2023, 100.00% of ordinary income dividends qualifies for the corporate dividends received deduction.
21
| MARSHFIELD CONCENTRATED OPPORTUNITY FUND |
| BOARD OF TRUSTEES AND EXECUTIVE OFFICERS |
| (Unaudited) |
The Board has overall responsibility for management of the Trust’s affairs. The Trustees serve during the lifetime of the Trust and until its termination, or until death, resignation, retirement, or removal. The Trustees, in turn, elect the officers of the Fund to actively supervise their day-to-day operations. The officers have been elected for an annual term. Each Trustee’s and officer’s address is 225 Pictoria Drive, Suite 450, Cincinnati, Ohio 45246. The following are the Trustees and executive officers of the Fund:
| Name and Year of Birth | Length of Time Served | Position(s) Held with Trust | Principal Occupation(s) During Past 5 Years | Number of Funds in the Trust Overseen By Trustee | Directorship(s) of Public Companies Held By Trustee During Past 5 Years |
| Interested Trustees: | |||||
| David K. James* Year of Birth: 1970 | April 2023 to present October 2022 to April 2023 July 2021 to October 2022 | Trustee (April 2023 to present) Assistant Secretary Secretary | Executive Vice President and Chief Legal and Risk Officer of Ultimus Fund Solutions, LLC (“Ultimus”) and a member of the board of managers of Ultimus Fund Distributors, LLC, Northern Lights Distributors, LLC and Northern Lights Compliance Services, LLC, each an affiliate of Ultimus (2018 to present); Managing Director and Managing Counsel of State Street Bank and Trust Company (2009 to 2018) | 31 | Interested Trustee of 12 series of the Capitol Series Trust (a registered management company) (2021 to present) |
22
| MARSHFIELD CONCENTRATED OPPORTUNITY FUND |
| BOARD OF TRUSTEES AND EXECUTIVE OFFICERS |
| (Unaudited) (Continued) |
| Name and Year of Birth | Length of Time Served | Position(s) Held with Trust | Principal Occupation(s) During Past 5 Years | Number of Funds in the Trust Overseen By Trustee | Directorship(s) of Public Companies Held By Trustee During Past 5 Years |
| Independent Trustees: | |||||
| Janine L. Cohen Year of Birth: 1952 | Since 2016 | Chairperson (2019 to present) Trustee (2016 to present) | Retired since 2013; previously Chief Financial Officer from 2004 to 2013 and Chief Compliance Officer from 2008 to 2013 at AER Advisors, Inc. | 31 | n/a |
| David M. Deptula Year of Birth: 1958 | Since 2012 | Trustee (2012 to present) | Vice President of Legal and Special Projects at Dayton Freight Lines, Inc. since 2016 | 31 | n/a |
| Robert E. Morrison Year of Birth: 1957 | Since 2019 | Trustee (2019 to present; and previously 2012 to 2014) | Managing Director at Midwest Trust and FCI Advisors (2022 to present); Senior Vice President and National Practice Lead for Investment, Huntington National Bank/ Huntington Private Bank (2014 to 2022); CEO, CIO, President of 5 Star Investment Management Company (2006 to 2014) | 31 | n/a |
| Clifford N. Schireson Year of Birth: 1953 | Since 2019 | Trustee (2019 to present) | Retired; Founder of Schireson Consulting, LLC (2017 to 2022); Director of Institutional Services for Brandes Investment Partners, LP (2004 to 2017). | 31 | Trustee of the San Diego City Employees’ Retirement System (2019 to present). |
| Jacqueline A. Williams Year of Birth: 1954 | Since 2019 | Trustee (2019 to present) | Managing Member of Custom Strategy Consulting, LLC (2017 to present); Managing Director of Global Investment Research (2005 to 2017), Cambridge Associates, LLC | 31 | n/a |
| * | Mr. James is considered an “interested person” of the Trust within the meaning of Section (2)(a) (19) of the Investment Company Act of 1940, as amended, because of his relationship with the Trust’s Administrator, Transfer Agent, and Distributor. |
23
| MARSHFIELD CONCENTRATED OPPORTUNITY FUND |
| BOARD OF TRUSTEES AND EXECUTIVE OFFICERS |
| (Unaudited) (Continued) |
| Name and Year of Birth | Length of Time Served | Position(s) Held with Trust | Principal Occupation(s) During Past 5 Years |
| Executive Officers: | |||
| Todd E. Heim Year of Birth: 1967 | 2021 to present 2014 to 2021 | President
Vice President | Vice President, Relationship Management (2018 to present) and Assistant Vice President, Client Implementation Manager with Ultimus Fund Solutions, LLC (2014 to 2018) |
| Shannon Thibeaux- Burgess Year of Birth: 1970 | April 2023 to present | Vice President | Senior Vice President, Relationship Management with Ultimus Fund Solutions, LLC (2022 to present); Head of Regulatory Service with J.P. Morgan Chase & Co. (2020 to 2022); Chief Administrative Officer of State Street Bank (2013 to 2020) |
| Jennifer L. Leamer Year of Birth: 1976 | 2014 to present April 2014 to October 2014 | Treasurer
Assistant | Senior Vice President of Fund Accounting (2020 to present) and Mutual Fund Controller of Ultimus Fund Solutions, LLC (2014 to 2020) |
| Daniel D. Bauer Year of Birth: 1977 | 2016 to present | Assistant Treasurer | Vice President of Fund Accounting (2022 to present), Assistant Vice President of Fund Accounting (2020 to 2022), and AVP, Assistant Mutual Fund Controller (2015 to 2020) of Ultimus Fund Solutions, LLC |
| Angela A. Simmons Year of Birth: 1975 | January 2022 to present | Assistant Treasurer | Vice President of Financial Administration (2022 to present) and Assistant Vice President, Financial Administration (2015 to 2022) of Ultimus Fund Solutions, LLC |
| Karen Jacoppo-Wood Year of Birth: 1966 | April 2023 to present | Secretary | Senior Vice President and Associate General Counsel of Ultimus Fund Solutions, LLC (2022 to present); Managing Director and Managing Counsel (2019 to 2022) and Vice President and Counsel (2014 to 2019) of State Street Bank and Trust Company |
24
| MARSHFIELD CONCENTRATED OPPORTUNITY FUND |
| BOARD OF TRUSTEES AND EXECUTIVE OFFICERS |
| (Unaudited) (Continued) |
| Name and Year of Birth | Length of Time Served | Position(s) Held with Trust | Principal Occupation(s) During Past 5 Years |
| Executive Officers (Continued): | |||
| Natalie S. Anderson Year of Birth: 1975 | 2016 to present | Assistant Secretary | Legal Administration Manager (2016 to present) and Paralegal (2015 to 2016) of Ultimus Fund Solutions, LLC |
| Jesse Hallee Year of Birth: 1976 | April 2023 to present | Assistant Secretary | Senior Vice President and Associate General Counsel of Ultimus Fund Solutions, LLC (June 2019 to present); Vice President and Managing Counsel, State Street Bank and Trust Company (2013 to 2019) |
| Gweneth K. Gosselink Year of Birth: 1955 | 2020 to present | Chief Compliance Officer | Assistant Vice President, Compliance Officer at Ultimus Fund Solutions, LLC (2019 to present); CCO Consultant at GKG Consulting, LLC (2019 to 2021); Chief Operating Officer & CCO at Miles Capital, Inc. (2013 to 2019) |
| Martin Dean Year of Birth: 1963 | 2020 to present 2019 to 2020 2016 to 2017 | Assistant Chief Compliance Officer Interim Chief Compliance Officer Assistant Chief Compliance Officer | President of Northern Lights Compliance Services, LLC (February 2023 to present); Senior Vice President, Head of Fund Compliance (2020 to January 2023) and Vice President & Director of Fund Compliance of Ultimus Fund Solutions, LLC (2016 to 2020) |
Additional information about members of the Board and executive officers is available in the Fund’s Statement of Additional Information (“SAI”). To obtain a free copy of the SAI, please call toll free 1-855-691-5288.
25
| Marshfield-AR-23 |
MEEHAN FOCUS FUND
ANNUAL REPORT
August 31, 2023
| |||
| This report is for the information of the shareholders of Meehan Focus Fund. Its use in connection with any offering of the Fund’s shares is authorized only in a case of concurrent or prior delivery of the Fund’s current prospectus. Investors should refer to the Fund’s prospectus for a description of risk factors associated with investments in the Fund. | |||
| Meehan Focus Fund | Distributor: | ||
| A Series of Ultimus Managers Trust | Ultimus Fund Distributors, LLC | ||
| 7250 Woodmont Avenue, Suite 315 | 225 Pictoria Drive, Suite 450 | ||
| Bethesda, MD 20814 | Cincinnati, OH 45246 | ||
| (866) 884-5968 | (800) 933-8413 | ||
| MEEHAN FOCUS FUND | |
| LETTER TO SHAREHOLDERS (Unaudited) | August 31, 2023 |
Dear Fellow Shareholders:
The total return for the Meehan Focus Fund for its fiscal year ended August 31, 2023, was 21.18%; the Fund’s net asset value per share on August 31, 2023, was $44.54. Over the past 12 months the Fund exceeded the returns of its benchmarks, the Standard & Poor’s 500 Total Return Index (S&P 500) (15.94%) and the Standard & Poor’s 500 Value Index (17.28%) and remains ahead of them since the Fund’s inception.
Stock investors endured a difficult 2022, with the S&P 500 declining 25% from its January high to its October bear market low before rebounding over the past year. Stocks have rallied despite facing multiple interest rate hikes, several bank failures and declining earnings.
Widely expected to slide into recession this year, the U.S. economy in 2023 has surprised many as strength in the services sector continues to offset weakness in the manufacturing sector. The Institute of Supply Management (ISM) Manufacturing Purchasing Managers Index (PMI) has contracted for 12 consecutive months, however, August’s report showed month-over-month improvement in some key areas, suggesting U.S. factory activity may be bottoming out. The ISM Services PMI, in contrast, has continued to expand and in August grew at the strongest rate in six months.
The U.S. labor market remains a bright spot, as it has throughout the post-COVID recovery. The August uptick in unemployment to a still low 3.8% was due largely to a welcome 0.2% increase in the labor participation rate; also welcome was a modest slowdown in wage growth. Recent jobs reports, rising worker productivity and declines in job openings suggest a cooling labor market which, it is hoped, will encourage the Federal Reserve (Fed) to end its aggressive tightening of monetary policy.
With the Fed funds rate now at its highest level in more than 22 years, the Fed continues to tip-toe a narrow line between raising rates just enough to bring inflation down and raising rates too much and causing a recession. The Fed has made meaningful progress on the inflation front over the past 12 months, as headline inflation has receded significantly from its June 2022 peak of 9.1% to 3.7% in August of this year. However, inflation remains above the Fed’s stated 2% target.
Outside the United States, the economic picture is less positive. Europe’s economies are broadly weakening, reversing what had been a modest acceleration in previous months. In China, a relaxation of COVID restrictions was expected to release a surge in economic activity. Instead, a real estate crisis, hesitant consumers and declining exports have dented growth.
Outlook
Looking towards 2024, we are cautiously optimistic. The S&P 500’s current forward price-to-earnings ratio is 18.8, in line with the five-year average of 18.7. Much of the increase in stock prices over the past 12 months, however, has been driven by rising valuations, not earnings growth. To sustain the rally, a return to earnings growth will be critical.
1
The Fed also will continue to loom large for investors. An end to interest rate increases would be good news for stocks, potentially enabling this year’s technology-led rally to broaden. On the other hand, a Fed decision that implies further rate increases are necessary could, instead, bring the rally to an end. The recent rise in energy prices also bears watching; if sustained, it could rekindle inflation concerns and hurt consumers, businesses and stocks.
Portfolio Review
Strong returns from long-term holdings United Rentals, Microsoft, Broadcom and others were partially offset by weak performances from CVS, Bank of America and Disney.
United Rentals, Inc.
United Rentals, the world’s largest equipment rental company, has outperformed both the market and the rental & leasing services industry over the past year by a wide margin. United Rentals announced record second-quarter results, driven by strong customer activity and margin expansion, with total revenue up 28.3% year-over-year to $3.6 billion, and adjusted earnings per share (EPS) up 25.7% from the year-ago period to $9.88. The company raised its full-year guidance, and CEO Matthew Flannery noted that this increase speaks to the strength of the current environment. United Rentals sees continued opportunity in serving its customers as they capitalize on the multi-year tailwinds across infrastructure, manufacturing, and energy and power. The company has strong growth prospects, fueled by spending on federal infrastructure programs related to the $1.2 trillion Infrastructure Investment and Jobs Act and the Inflation Reduction Act that are now moving forward.
Broadcom, Inc. and Microsoft Corp
Two of the Fund’s standout performers over the past 12 months, mega-cap technology stocks Broadcom and Microsoft, reflect investor enthusiasm in the growth potential of artificial intelligence (AI) in 2023.
Broadcom reported record fiscal third quarter revenue of $8.9 billion, a 5% increase from the prior-year period, and adjusted EPS reached $10.54, up 8% over the same period. Broadcom’s shares rose 88.5% over the past year due to increasing profit margins and expanding growth potential. An already stellar margin profile looks to become more attractive with the completed acquisition of VMWare, Inc., a cloud infrastructure and business mobility software company. Also, in May 2023, Apple announced a multiyear, multibillion-dollar agreement with Broadcom as its frequency and wireless component supplier. The fast connections in Broadcom-manufactured components are key for companies developing AI and Meta-related products.
Microsoft reported record revenue of $211.9 billion for its fiscal year ended June 30, 2023, a 7% increase from the prior-year period, and adjusted EPS of $9.81, also a 7% increase over the same period. Microsoft remains a top supplier of cloud infrastructure and services via its Azure platform, second largest in scale to Amazon’s Web Services platform (AWS), but growing at a faster rate than AWS. Although Microsoft has acknowledged that AI adoption will be a multi-year process to build scale and recognize revenue, its stock has been rewarded due to its first-mover advantage.
2
CVS Health Corp
CVS has experienced disappointing operating performance over the past year. Although CVS’s trailing twelve-month revenue increased by 10% to $339.2 billion, compared to $308 billion in the prior twelve-month period, increased costs in the company’s medical insurance and pharmacy businesses, as well as decreased COVID-19 vaccinations and diagnostics testing, caused margins and earnings to decline. The company maintained its 2023 outlook but reduced its 2024 and 2025 revenue and earnings growth goals. CVS’s strategy is shifting from transaction-based primary care to addressing healthcare more holistically, utilizing its 9,000 retail locations, more than 1,100 walk-in healthcare clinics and approximately 110 million pharmacy benefits plan members. Recent acquisitions of Signify Health and Oak Street Health increased CVS’s net debt from where it was a year ago, but the company generates ample cash flow, which it uses to pay off significant amounts of acquisition debt. Additionally, CVS developed an enterprise-wide restructuring plan intended to streamline and simplify the organization, improve efficiency, and reduce costs. The stock currently trades at a very low multiple of earnings as expectations have been reset to a lower level.
Bank of America Corp. & The Walt Disney Co.
Bank of America and Disney, two of the Fund’s weakest performers over the past 12 months, have been sold by the Fund. Bank of America was sold primarily due to concerns regarding its substantial Held to Maturity (HTM) bond portfolio. As rates continued to rise this year, Bank of America has accrued large unrealized losses on its HTM portfolio, reducing its financial flexibility and potentially diminishing earnings power going forward, in our view. At Disney, executive turnover and ongoing profitability issues in its cable and streaming operations caused us to lose confidence in the company’s long-term growth prospects.
Portfolio Changes
We made several changes to the Fund’s portfolio over the past 12 months. In addition to Bank of America, which was sold at a gain and Disney, which was sold at a small loss, we also sold Medtronic, a medical device company, at a modest gain. We added two new holdings, financial services company Charles Schwab, and healthcare diagnostics and research company Thermo-Fisher Scientific and added to existing positions in Berkshire Hathaway, Amazon, Shell and Blackstone.
3
Conclusion
We appreciate your confidence in our management of the Fund, and we look forward to continued growth and success. You can check the Fund’s NAV online at any time by typing the Fund’s ticker symbol (MEFOX) into most stock quotation services. Best wishes for a safe and healthy fall – and please do not hesitate to contact us if you have any questions regarding your investment in the Fund.
Sincerely,
 |  |
| Thomas P. Meehan | Paul P. Meehan |
| Portfolio Managers, Meehan Focus Fund |
Past performance is not predictive of future performance. Investment results and principal value will fluctuate so that shares, when redeemed, may be worth more or less than their original cost. Current performance may be higher or lower than the performance data quoted. Performance data current to the most recent month end are available by calling 1-866-884-5968.
An investor should consider the investment objectives, risks, charges and expenses of the Fund carefully before investing. The Fund’s prospectus contains this and other important information. To obtain a copy of the Fund’s prospectus call 1-866-884-5968 and a copy will be sent to you free of charge. Please read the prospectus carefully before you invest. The Meehan Focus Fund is distributed by Ultimus Fund Distributors, LLC.
This Letter to Shareholders seeks to describe some of the Adviser’s current opinions and views of the financial markets. Although the Adviser believes it has a reasonable basis for any opinions or views expressed, actual results may differ, sometimes significantly so, from those expected or expressed. The securities held by the Fund that are discussed in the Letter to Shareholders were held during the period covered by this Report. They do not comprise the entire investment portfolio of the Fund, may be sold at any time and may no longer be held by the Fund. For a complete list of securities held by the Fund as of August 31, 2023, please see the Schedule of Investments section of the annual report. The opinions of the Adviser with respect to those securities may change at any time.
Statements in the Letter to Shareholders that reflect projections or expectations for future financial or economic performance of the Fund and the market in general and statements of the Fund’s plans and objectives for future operations are forward-looking statements. No assurance can be given that actual results or events will not differ materially from those projected, estimated, assumed, or anticipated in any such forward-looking statements. Important factors that could result in such differences, in addition to factors noted with such forward-looking statements include, without limitation, general economic conditions, such as inflation, recession, and interest rates.
4
The Letter to Shareholders seeks to describe some of the Adviser’s current opinions and views of the financial markets. Although the Adviser believes it has a reasonable basis for any opinions or views expressed, actual results may differ, sometimes significantly so, from those expected or expressed. The securities held by the Fund that are discussed in the Letter to Shareholders were held during the period covered by this Report. They do not comprise the entire investment portfolio of the Fund, may be sold at any time, and may no longer be held by the Fund. For a complete list of securities held by the Fund as of August 31, 2023, please see the Schedule of Investments section of the semi-annual report. The opinions of the Fund’s investment adviser with respect to those securities may change at any time.
5
| MEEHAN FOCUS FUND |
| PERFORMANCE INFORMATION |
| August 31, 2023 (Unaudited) |
Comparison of Change in Value of a $10,000 Investment in the
Meehan Focus Fund vs. the S&P 500® Total Return Index*
and the S&P 500® Value Index*
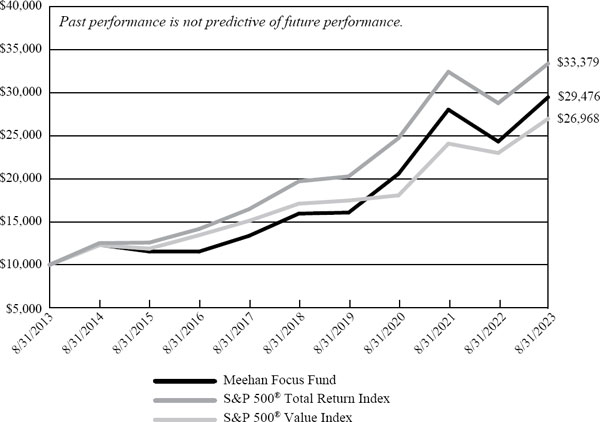
| Average Annual Total Returns (For Years Ended August 31, 2023) | ||||||||
| 1 Year | 5 Years | 10 Years | ||||||
| Meehan Focus Fund (a) | 21.18% | 13.07% | 11.42% | |||||
| S&P 500® Total Return Index | 15.94% | 11.12% | 12.81% | |||||
| S&P 500® Value Index | 17.28% | 9.53% | 10.43% | |||||
| * | The above graph depicts the performance of the Fund versus the S&P 500® Total Return Index and the S&P 500® Value Index. It is important to note that the Fund is a professionally managed mutual fund; the S&P 500® Total Return Index by Standard & Poor’s Corp. is a capitalization-weighted index comprised of 500 issues listed on various exchanges, representing the performance of the stock market generally; and the S&P 500® Value Index measures value stocks using three factors: the ratios of book value, earnings, and sales to price. Constituents are drawn from the S&P 500® Total Return Index. An index is not an investment product available for purchase. The Fund’s performance assumes the reinvestment of all dividends and all capital gains. Index returns assume reinvestment of dividends but, unlike the Fund’s returns, do not reflect any fees or expenses. |
| (a) | Performance presented represents historical data. The investment return and principal value of an investment will fluctuate so that an investor’s shares, when redeemed, may be worth more or less than their original cost. The Fund’s past performance is not indicative of future performance. The table and graph above do not reflect the deduction of taxes that a shareholder would pay on Fund distributions or the redemption of Fund shares. Current performance may be lower or higher than the performance data quoted. To obtain more current performance information, please contact (866) 884-5968. As disclosed in the Fund’s December 29, 2022 prospectus, the Fund’s total annual operating expenses are 1.01%. |
6
| MEEHAN FOCUS FUND |
| PORTFOLIO INFORMATION |
| August 31, 2023 (Unaudited) |
Sector Diversification (% of Net Assets)
| Top 10 Equity Holdings | ||||
| % of | ||||
| Security Description | Net Assets | |||
| Microsoft Corporation | 10.5 | % | ||
| Apple, Inc. | 10.3 | % | ||
| Lowe’s Companies, Inc. | 8.3 | % | ||
| Berkshire Hathaway, Inc. - Class B | 8.1 | % | ||
| Alphabet, Inc. - Classes A and C | 7.6 | % | ||
| United Rentals, Inc. | 7.0 | % | ||
| Broadcom, Inc. | 5.0 | % | ||
| Amazon.com, Inc. | 4.9 | % | ||
| Applied Materials, Inc. | 4.7 | % | ||
| Vertex Pharmaceuticals, Inc. | 4.5 | % | ||
7
| MEEHAN FOCUS FUND |
| SCHEDULE OF INVESTMENTS |
| August 31, 2023 |
| COMMON STOCKS — 95.1% | Shares | Value | ||||||
| Communications — 7.6% | ||||||||
| Internet Media & Services — 7.6% | ||||||||
| Alphabet, Inc. - Class A (a) | 29,900 | $ | 4,071,483 | |||||
| Alphabet, Inc. - Class C (a) | 34,830 | 4,783,900 | ||||||
| 8,855,383 | ||||||||
| Consumer Discretionary — 16.8% | ||||||||
| E-Commerce Discretionary — 4.9% | ||||||||
| Amazon.com, Inc. (a) | 41,435 | 5,718,444 | ||||||
| Home Construction — 1.7% | ||||||||
| Lennar Corporation - Class A | 16,000 | 1,905,440 | ||||||
| Leisure Products — 0.6% | ||||||||
| Malibu Boats, Inc. - Class A (a) | 14,850 | 721,116 | ||||||
| Retail - Discretionary — 9.6% | ||||||||
| Lowe’s Companies, Inc. | 41,630 | 9,594,883 | ||||||
| Williams-Sonoma, Inc. | 10,730 | 1,515,076 | ||||||
| 11,109,959 | ||||||||
| Energy — 2.6% | ||||||||
| Oil & Gas Producers — 2.6% | ||||||||
| Shell plc - ADR | 47,850 | 2,971,007 | ||||||
| Financials — 13.7% | ||||||||
| Asset Management — 4.9% | ||||||||
| BlackRock, Inc. | 2,925 | 2,049,079 | ||||||
| Blackstone, Inc | 12,200 | 1,297,714 | ||||||
| Charles Schwab Corporation (The) | 40,000 | 2,366,000 | ||||||
| 5,712,793 | ||||||||
| Banking — 0.7% | ||||||||
| Citigroup, Inc. | 20,000 | 825,800 | ||||||
| Insurance — 8.1% | ||||||||
| Berkshire Hathaway, Inc. - Class B (a) | 26,050 | 9,383,210 | ||||||
| Health Care — 11.1% | ||||||||
| Biotech & Pharma — 7.2% | ||||||||
| Bristol-Myers Squibb Company | 18,130 | 1,117,714 | ||||||
| Novartis AG - ADR | 20,420 | 2,051,802 | ||||||
8
| MEEHAN FOCUS FUND |
| SCHEDULE OF INVESTMENTS (Continued) |
| COMMON STOCKS — 95.1% (Continued) | Shares | Value | ||||||
| Health Care — 11.1% (Continued) | ||||||||
| Biotech & Pharma — 7.2% (Continued) | ||||||||
| Vertex Pharmaceuticals, Inc. (a) | 14,800 | $ | 5,155,432 | |||||
| 8,324,948 | ||||||||
| Health Care Facilities & Services — 2.5% | ||||||||
| CVS Health Corporation | 44,000 | 2,867,480 | ||||||
| Medical Equipment & Devices — 1.4% | ||||||||
| Thermo Fisher Scientific, Inc. | 3,000 | 1,671,300 | ||||||
| Industrials — 10.5% | ||||||||
| Electrical Equipment — 1.4% | ||||||||
| Johnson Controls International plc | 27,275 | 1,610,862 | ||||||
| Industrial Support Services — 7.0% | ||||||||
| United Rentals, Inc. | 17,050 | 8,125,007 | ||||||
| Machinery — 2.1% | ||||||||
| Deere & Company | 5,800 | 2,383,452 | ||||||
| Technology — 32.8% | ||||||||
| Semiconductors — 9.7% | ||||||||
| Applied Materials, Inc. | 35,365 | 5,402,357 | ||||||
| Broadcom, Inc. | 6,245 | 5,763,448 | ||||||
| 11,165,805 | ||||||||
| Software — 10.5% | ||||||||
| Microsoft Corporation | 37,035 | 12,138,592 | ||||||
| Technology Hardware — 10.3% | ||||||||
| Apple, Inc. | 63,695 | 11,966,380 | ||||||
| Technology Services — 2.3% | ||||||||
| Visa, Inc. - Class A | 11,000 | 2,702,480 | ||||||
| Total Common Stocks (Cost $37,866,702) | $ | 110,159,458 | ||||||
9
| MEEHAN FOCUS FUND |
| SCHEDULE OF INVESTMENTS (Continued) |
| MONEY MARKET FUNDS — 4.9% | Shares | Value | ||||||
| Allspring Heritage Money Market Fund - Institutional Class, 5.37% (b) (Cost $5,673,556) | 5,671,288 | $ | 5,673,556 | |||||
| Investments at Value — 100.0% (Cost $43,540,258) | $ | 115,833,014 | ||||||
| Other Assets in Excess of Liabilities — 0.0% (c) | 3,086 | |||||||
| Net Assets — 100.0% | $ | 115,836,100 | ||||||
ADR - American Depositary Receipt
AG - Aktiengesellschaft
plc - Public Limited Company
| (a) | Non-income producing security. |
| (b) | The rate shown is the 7-day effective yield as of August 31, 2023. |
| (c) | Percentage rounds to less than 0.1%. |
See accompanying notes to financial statements.
10
| MEEHAN FOCUS FUND |
| STATEMENT OF ASSETS AND LIABILITIES |
| August 31, 2023 |
| ASSETS | ||||
| Investments in securities: | ||||
| At cost | $ | 43,540,258 | ||
| At value (Note 2) | $ | 115,833,014 | ||
| Dividends receivable | 97,027 | |||
| Other assets | 6,770 | |||
| TOTAL ASSETS | 115,936,811 | |||
| LIABILITIES | ||||
| Payable for capital shares redeemed | 2,000 | |||
| Payable to Adviser (Note 4) | 73,087 | |||
| Payable to administrator (Note 4) | 16,281 | |||
| Other accrued expenses | 9,343 | |||
| TOTAL LIABILITIES | 100,711 | |||
| CONTINGENCIES AND COMMITMENTS (NOTE 5) | — | |||
| NET ASSETS | $ | 115,836,100 | ||
| NET ASSETS CONSIST OF: | ||||
| Paid-in capital | $ | 43,179,870 | ||
| Distributable earnings | 72,656,230 | |||
| NET ASSETS | $ | 115,836,100 | ||
| Shares of beneficial interest outstanding (unlimited number of shares authorized, no par value) | 2,600,457 | |||
| Net asset value, offering price and redemption price per share (a) (Note 2) | $ | 44.54 | ||
| (a) | Redemption price may differ from the net asset value per share depending upon the length of time held. |
See accompanying notes to financial statements.
11
| MEEHAN FOCUS FUND |
| STATEMENT OF OPERATIONS |
| For the Year Ended August 31, 2023 |
| INVESTMENT INCOME | ||||
| Dividend income | $ | 1,498,463 | ||
| Foreign withholding taxes on dividends | (25,005 | ) | ||
| TOTAL INVESTMENT INCOME | 1,473,458 | |||
| EXPENSES | ||||
| Management fees (Note 4) | 810,983 | |||
| Administration fees (Note 4) | 100,719 | |||
| Fund accounting fees (Note 4) | 42,783 | |||
| Legal fees | 23,515 | |||
| Transfer agent fees (Note 4) | 19,579 | |||
| Trustees’ fees and expenses (Note 4) | 19,344 | |||
| Audit and tax services fees | 17,326 | |||
| Registration and filing fees | 13,323 | |||
| Compliance fees and expenses (Note 4) | 12,723 | |||
| Custody and bank service fees | 11,754 | |||
| Shareholder reporting expenses | 7,561 | |||
| Postage and supplies | 5,279 | |||
| Insurance expense | 3,835 | |||
| Other expenses | 15,103 | |||
| TOTAL EXPENSES | 1,103,827 | |||
| Less fee reductions by the Adviser (Note 4) | (90,098 | ) | ||
| NET EXPENSES | 1,013,729 | |||
| NET INVESTMENT INCOME | 459,729 | |||
| REALIZED AND UNREALIZED GAINS ON INVESTMENTS | ||||
| Net realized gains from investments | 7,648 | |||
| Net realized gains from in-kind redemptions (Note 2) | 1,354,124 | |||
| Net change in unrealized appreciation (depreciation) on investments | 18,461,667 | |||
| NET REALIZED AND UNREALIZED GAINS ON INVESTMENTS | 19,823,439 | |||
| NET INCREASE IN NET ASSETS FROM OPERATIONS | $ | 20,283,168 |
See accompanying notes to financial statements.
12
| MEEHAN FOCUS FUND |
| STATEMENTS OF CHANGES IN NET ASSETS |
| Year | Year | |||||||
| Ended | Ended | |||||||
| August 31, | August 31, | |||||||
| 2023 | 2022 | |||||||
| FROM OPERATIONS | ||||||||
| Net investment income | $ | 459,729 | $ | 32,811 | ||||
| Net realized gains from investments | 7,648 | 2,009,156 | ||||||
| Net realized gains from in-kind redemptions (Note 2) | 1,354,124 | 1,239,549 | ||||||
| Net change in unrealized appreciation (depreciation) on investments | 18,461,667 | (18,000,430 | ) | |||||
| Net increase (decrease) in net assets resulting from operations | 20,283,168 | (14,718,914 | ) | |||||
| DISTRIBUTIONS TO SHAREHOLDERS (Note 2) | (735,325 | ) | (3,864,039 | ) | ||||
| CAPITAL SHARE TRANSACTIONS | ||||||||
| Proceeds from shares sold | 1,908,332 | 9,333,595 | ||||||
| Net asset value of shares issued in reinvestment of distributions to shareholders | 729,471 | 3,840,260 | ||||||
| Payments for shares redeemed | (3,331,232 | ) | (3,897,504 | ) | ||||
| Net increase (decrease) in net assets from capital share transactions | (693,429 | ) | 9,276,351 | |||||
| TOTAL INCREASE (DECREASE) IN NET ASSETS | 18,854,414 | (9,306,602 | ) | |||||
| NET ASSETS | ||||||||
| Beginning of year | 96,981,686 | 106,288,288 | ||||||
| End of year | $ | 115,836,100 | $ | 96,981,686 | ||||
| CAPITAL SHARE ACTIVITY | ||||||||
| Shares sold | 48,962 | 220,487 | ||||||
| Shares reinvested | 20,445 | 84,087 | ||||||
| Shares redeemed | (86,789 | ) | (90,956 | ) | ||||
| Net increase (decrease) in shares outstanding | (17,382 | ) | 213,618 | |||||
| Shares outstanding at beginning of year | 2,617,839 | 2,404,221 | ||||||
| Shares outstanding at end of year | 2,600,457 | 2,617,839 | ||||||
See accompanying notes to financial statements.
13
| MEEHAN FOCUS FUND |
| FINANCIAL HIGHLIGHTS |
Per Share Data for a Share Outstanding Throughout Each Period
| Ten | ||||||||||||||||||||||||
| Year | Year | Year | Months | Year | Year | |||||||||||||||||||
| Ended | Ended | Ended | Ended | Ended | Ended | |||||||||||||||||||
| August 31, | August 31, | August 31, | August 31, | Oct. 31, | Oct. 31, | |||||||||||||||||||
| 2023 | 2022 | 2021 | 2020 (a) | 2019 | 2018 | |||||||||||||||||||
| Net asset value at beginning of period | $ | 37.05 | $ | 44.21 | $ | 32.80 | $ | 27.98 | $ | 24.99 | $ | 24.13 | ||||||||||||
| Income (loss) from investment operations: | ||||||||||||||||||||||||
| Net investment income (b) | 0.18 | 0.01 | 0.03 | 0.14 | 0.21 | 0.14 | ||||||||||||||||||
| Net realized and unrealized gains (losses) on investments | 7.60 | (5.56 | ) | 11.76 | 5.71 | 3.42 | 0.86 | |||||||||||||||||
| Total from investment operations | 7.78 | (5.55 | ) | 11.79 | 5.85 | 3.63 | 1.00 | |||||||||||||||||
| Less distributions from: | ||||||||||||||||||||||||
| Net investment income | (0.05 | ) | (0.01 | ) | (0.12 | ) | (0.20 | ) | (0.15 | ) | (0.14 | ) | ||||||||||||
| Net realized gains | (0.24 | ) | (1.60 | ) | (0.26 | ) | (0.83 | ) | (0.49 | ) | — | |||||||||||||
| Total distributions | (0.29 | ) | (1.61 | ) | (0.38 | ) | (1.03 | ) | (0.64 | ) | (0.14 | ) | ||||||||||||
| Net asset value at end of period | $ | 44.54 | $ | 37.05 | $ | 44.21 | $ | 32.80 | $ | 27.98 | $ | 24.99 | ||||||||||||
| Total return (c) | 21.18 | % | (13.23 | %) | 36.25 | % | 21.38 | % (d) | 15.16 | % | 4.15 | % | ||||||||||||
| Net assets at end of period (000’s) | $ | 115,836 | $ | 96,982 | $ | 106,288 | $ | 80,538 | $ | 67,566 | $ | 65,818 | ||||||||||||
| Ratios/supplementary data: | ||||||||||||||||||||||||
| Ratio of total expenses to average net assets (e) | 1.09 | % | 1.08 | % | 1.09 | % | 1.16 | % (f) | 1.17 | % | 1.12 | % | ||||||||||||
| Ratio of net expenses to average net assets (e)(g) | 1.00 | % | 1.00 | % | 1.00 | % | 1.00 | % (f) | 1.00 | % | 1.00 | % | ||||||||||||
| Ratio of net investment income to average net assets (b)(e)(g) | 0.45 | % | 0.03 | % | 0.07 | % | 0.58 | % (f) | 0.77 | % | 0.54 | % | ||||||||||||
| Portfolio turnover rate | 6 | % | 13 | % | 4 | % | 16 | % (d) | 20 | % | 20 | % | ||||||||||||
| (a) | Fund changed fiscal year to August 31. |
| (b) | Recognition of net investment income by the Fund is affected by the timing of the declaration of dividends by the underlying investment companies, if any, in which the Fund invests. |
| (c) | Total return is a measure of the change in value of an investment in the Fund over the period covered. The returns shown do not reflect the deduction of taxes a shareholder would pay on Fund distributions, if any, or the redemption of Fund shares. Had the Adviser not reduced its fees, total returns would have been lower. |
| (d) | Not annualized. |
| (e) | The ratios of expenses and net investment income to average net assets do not reflect the Fund’s proportionate share of expenses of the underlying investments companies, if any, in which the Fund invests. |
| (f) | Annualized. |
| (g) | Ratio was determined after management fee reductions (Note 4). |
See accompanying notes to financial statements.
14
| MEEHAN FOCUS FUND |
| NOTES TO FINANCIAL STATEMENTS |
| August 31, 2023 |
1. Organization
Meehan Focus Fund (the “Fund”) is a non-diversified series of Ultimus Managers Trust (the “Trust”). The Trust is an open-end management investment company registered under the Investment Company Act of 1940, as amended (the “1940 Act”). The Fund was reorganized into the Trust on October 23, 2017. It was formerly a series of Meehan Mutual Funds, Inc.
The Fund’s investment objective is to seek long-term growth of capital.
2. Significant Accounting Policies
The Fund follows accounting and reporting guidance under Financial Accounting Standards Board Accounting Standards Codification Topic 946, “Financial Services – Investment Companies.” The following is a summary of the Fund’s significant accounting policies used in the preparation of its financial statements. These policies are in conformity with accounting principals generally accepted in the United States of America (“GAAP”).
Regulatory update – Tailored Shareholder Reports for Mutual Funds and Exchange-Traded Funds (“ETFs”) – Effective January 24, 2023, the Securities and Exchange Commission (the “SEC”) adopted rule and form amendments to require mutual funds and ETFs to transmit concise and visually engaging streamlined annual and semiannual reports to shareholders that highlight key information. Other information, including financial statements, will no longer appear in a streamlined shareholder report but must be available online, delivered free of charge upon request, and filed on a semiannual basis on Form N-CSR. The rule and form amendments have a compliance date of July 24, 2024. At this time, management is evaluating the impact of these amendments on the shareholder reports for the Fund.
Securities valuation – The Fund’s portfolio securities are valued at fair value as of the close of regular trading on the New York Stock Exchange (the “NYSE”) (normally 4:00 p.m. Eastern Time) on each business day the NYSE is open. Securities, including common stocks and exchange-traded funds (“ETFs”), if any, listed on the NYSE or other exchanges are valued on the basis of their last sale price on the exchanges on which they are primarily traded. If there are no sales on that day, the securities are valued at the closing mean price on the NYSE or other primary exchange for that day. NASDAQ listed securities are valued at the NASDAQ Official Closing Price. If there are no sales on that day, the securities are valued at the last mean price as reported by NASDAQ. Securities traded in the over-the-counter market are valued at the last reported sale price, if available, otherwise at the most recently quoted mean price. Investments representing shares of money market funds and other open-end investment companies, except for ETFs, are valued at their net asset value (“NAV”) as reported by such companies. When using a quoted price and when the market is considered active, the security will be classified as Level 1 within the fair value hierarchy (see below). In the event that market quotations are not readily available or are considered unreliable due to market or other events, the Fund values its securities and other
15
| MEEHAN FOCUS FUND |
| NOTES TO FINANCIAL STATEMENTS (Continued) |
assets at fair value as determined by Edgemoor Investment Advisors, Inc. (the “Adviser”), as the Fund’s valuation designee, in accordance with procedures adopted by the Board of Trustees (the “Board”) pursuant to Rule 2a-5 under the 1940 Act. Under these procedures, the securities will be classified as Level 2 or 3 within the fair value hierarchy, depending on the inputs used. Unavailable or unreliable market quotes may be due to the following factors: a substantial bid-ask spread; infrequent sales resulting in stale prices; insufficient trading volume; small trade sizes; a temporary lapse in any reliable pricing source; and actions of the securities or futures markets, such as suspension or limitation of trading. As a result, the prices of securities used to calculate the Fund’s NAV may differ from quoted or published prices for the same securities.
GAAP establishes a single authoritative definition of fair value, sets out a framework for measuring fair value and requires additional disclosures about fair value measurements.
Various inputs are used in determining the value of the Fund’s investments. These inputs are summarized in the three broad levels listed below:
| ● | Level 1 – quoted prices in active markets for identical securities |
| ● | Level 2 – other significant observable inputs |
| ● | Level 3 – significant unobservable inputs |
The inputs or methodology used for valuing securities are not necessarily an indication of the risks associated with investing in those securities. The inputs used to measure fair value may fall into different levels of the fair value hierarchy. In such cases, for disclosure purposes, the level in the fair value hierarchy within which the fair value measurement falls in its entirety is determined based on the lowest level input that is significant to the fair value measurement.
The following is a summary of the Fund’s investments by the inputs used to value the investments as of August 31, 2023:
| Level 1 | Level 2 | Level 3 | Total | |||||||||||||
| Common Stocks | $ | 110,159,458 | $ | — | $ | — | $ | 110,159,458 | ||||||||
| Money Market Funds | 5,673,556 | — | — | 5,673,556 | ||||||||||||
| Total | $ | 115,833,014 | $ | — | $ | — | $ | 115,833,014 | ||||||||
Refer to the Fund’s Schedule of Investments for a listing of the common stocks by sector and industry type. The Fund did not hold derivative instruments or any assets or liabilities that were measured at fair value on a recurring basis using significant unobservable inputs (Level 3) as of or during the year ended August 31, 2023.
16
| MEEHAN FOCUS FUND |
| NOTES TO FINANCIAL STATEMENTS (Continued) |
Foreign currency translation – Securities and other assets and liabilities denominated in or expected to settle in foreign currencies, if any, are translated into U.S. dollars based on exchange rates on the following basis:
| A. | The fair values of investment securities and other assets and liabilities are translated as of the close of the NYSE each day. |
| B. | Purchases and sales of investment securities and income and expenses are translated at the rate of exchange prevailing as of 4:00 p.m. Eastern Time on the respective date of such transactions. |
| C. | The Fund does not isolate that portion of the results of operations caused by changes in foreign exchange rates on investments from those caused by changes in market prices of securities held. Such fluctuations are included with the net realized and unrealized gains or losses on investments. |
Reported net realized foreign exchange gains or losses arise from 1) purchases and sales of foreign currencies and 2) the difference between the amounts of dividends and foreign withholding taxes recorded on the Fund’s books and the U.S. dollar equivalent of the amounts actually received or paid. Reported net unrealized foreign exchange gains and losses arise from changes in the value of assets and liabilities that result from changes in exchange rates.
Share valuation – The NAV per share of the Fund is calculated daily by dividing the total value of the Fund’s assets, less liabilities, by the number of shares outstanding. The offering price and redemption price per share of the Fund is equal to the NAV per share, except that shares of the Fund are subject to a redemption fee of 2% if redeemed within 7 calendar days of the date of purchase. No redemption fees were collected by the Fund during the years ended August 31, 2023 and 2022.
Investment income – Dividend income is recorded on the ex-dividend date. Non-cash dividends included in dividend income, if any, are recorded at the fair value of the security received. Interest income is accrued as earned. Withholding taxes on foreign dividends have been recorded in accordance with the Fund’s understanding of the applicable country’s rules and tax rates.
Investment transactions – Investment transactions are accounted for on the trade date. Realized gains and losses on investments sold are determined on a specific identification basis.
Common expenses – Common expenses of the Trust are allocated among the Fund and the other series of the Trust based on the relative net assets of each series, the number of series in the Trust, or the nature of the services performed and the relative applicability to each series.
Distributions to shareholders – Distributions to shareholders arising from net investment income and net realized capital gains, if any, are distributed at least once each year. Distributions to shareholders are recorded on the ex-dividend date. The amount of distributions from net investment income and net realized capital gains are determined in
17
| MEEHAN FOCUS FUND |
| NOTES TO FINANCIAL STATEMENTS (Continued) |
accordance with federal income tax regulations, which may differ from GAAP. The tax character of distributions paid during the years ended August 31, 2023 and 2022 was as follows:
| Ordinary | Long-Term | Total | ||||||||||
| Year Ended | Income | Capital Gains | Distributions | |||||||||
| August 31, 2023 | $ | 129,696 | $ | 605,629 | $ | 735,325 | ||||||
| August 31, 2022 | $ | 26,564 | $ | 3,837,475 | $ | 3,864,039 | ||||||
Estimates – The preparation of financial statements in conformity with GAAP requires management to make estimates and assumptions that affect the reported amounts of assets and liabilities and disclosure of contingent assets and liabilities as of the date of the financial statements and the reported amounts of increase (decrease) in net assets from operations during the reporting period. Actual results could differ from those estimates.
Federal income tax – The Fund has qualified and intends to continue to qualify each year as a “regulated investment company” under Subchapter M of the Internal Revenue Code of 1986, as amended (the “Code”). By so qualifying, the Fund will not be subject to federal income taxes to the extent that it distributes its net investment income and any net realized capital gains in accordance with the Code.
In order to avoid imposition of the excise tax applicable to regulated investment companies, it is also the Fund’s intention to declare as dividends in each calendar year at least 98% of its net investment income (earned during the calendar year) and 98.2% of its net realized capital gains (earned during the twelve months ended October 31) plus undistributed amounts from prior years.
The following information is computed on a tax basis for each item as of August 31, 2023:
| Tax cost of investments | $ | 43,540,258 | ||
| Gross unrealized appreciation | $ | 72,965,928 | ||
| Gross unrealized depreciation | (673,172 | ) | ||
| Net unrealized appreciation | 72,292,756 | |||
| Undistributed ordinary income | 363,474 | |||
| Distributable earnings | $ | 72,656,230 | ||
During the year ended August 31, 2023, a shareholder took delivery of securities from the Fund, rather than cash, in exchange for the redemption of shares. The total fair value of these in-kind redemptions was $1,500,000 for 39,370 shares of the Fund. The Fund realized $1,354,124 of net capital gains resulting from the in-kind redemptions. The Fund recognizes a gain on in-kind redemptions to the extent that the value of the distributed securities on the date of redemption exceeds the cost of those securities and recognizes a loss to the extent that the cost of those securities exceeds the value of the distributed securities on the date of
18
| MEEHAN FOCUS FUND |
| NOTES TO FINANCIAL STATEMENTS (Continued) |
redemption. Such net gains are not taxable to the Fund and are not required to be distributed to shareholders. The Fund has reclassified this amount against paid-in capital on the Statement of Assets and Liabilities. Such reclassification, the result of permanent differences between the financial statement and income tax reporting requirements, has no effect on the Fund’s net assets or NAV per share.
During the year ended August 31, 2022, a shareholder took delivery of securities from the Fund, rather than cash, in exchange for the redemption of shares. The total fair value of these in-kind redemptions was $1,500,000 for 34,083 shares of the Fund. The Fund realized $1,239,549 of net capital gains resulting from the in-kind redemptions. The Fund recognizes a gain on in-kind redemptions to the extent that the value of the distributed securities on the date of redemption exceeds the cost of those securities and recognizes a loss to the extent that the cost of those securities exceeds the value of the distributed securities on the date of redemption. Such net gains are not taxable to the Fund and are not required to be distributed to shareholders.
The Fund recognizes the tax benefits or expenses of uncertain tax positions only when the position is “more likely than not” to be sustained assuming examination by tax authorities. Management has reviewed the Fund’s tax positions taken on federal income tax returns for the current and all open tax years (generally, three years) and has concluded that no provision for unrecognized tax benefits or expenses is required in these financial statements and does not expect this to change over the next twelve months. The Fund identifies its major tax jurisdiction as U.S. Federal.
The Fund recognizes interest and penalties, if any, related to unrecognized tax benefits as income tax on the Statement of Operations. During the year ended August 31, 2023, the Fund did not incur any interest or penalties.
3. Investment Transactions
During the year ended August 31, 2023, cost of purchases and proceeds from sales of investment securities, other than short-term investments, were $5,948,511 and $5,425,568, respectively.
4. Transactions with Related Parties
INVESTMENT ADVISORY AGREEMENT
The Fund’s investments are managed by the Adviser pursuant to the terms of an Investment Advisory Agreement. Under the Investment Advisory Agreement, the Fund pays the Adviser a management fee, computed and accrued daily and paid monthly, at the annual rate of 0.80% of its average daily net assets.
Pursuant to an Expense Limitation Agreement (“ELA”), the Adviser has contractually agreed, until March 1, 2024, to reduce management fees and reimburse other expenses to the extent necessary to limit total annual operating expenses (exclusive of brokerage costs; taxes;
19
| MEEHAN FOCUS FUND |
| NOTES TO FINANCIAL STATEMENTS (Continued) |
interest; borrowing costs such as interest and dividend expenses on securities sold short; costs to organize the Fund; acquired fund fees and expenses; and extraordinary expenses, such as litigation and merger or reorganization costs and other expenses not incurred in the ordinary course of the Fund’s business) to an amount not exceeding 1.00% of the Fund’s average daily net assets. Accordingly, during the year ended August 31, 2023, the Adviser reduced its management fees in the amount of $90,098.
Under the terms of the ELA, management fee reductions and expense reimbursements by the Adviser are subject to repayment by the Fund for a period of 36 months after such fees and expenses were incurred, provided the repayments do not cause total annual operating expenses to exceed the lesser of: (i) the expense limitation then in effect, if any, and (ii) the expense limitation in effect at the time the expenses to be repaid were incurred. As of August 31, 2023, the Adviser may seek recoupment of management fee reductions totaling $260,795 no later than the dates listed below:
| August 31, 2024 | $ | 86,137 | ||
| August 31, 2025 | 84,560 | |||
| August 31, 2026 | 90,098 | |||
| Total | $ | 260,795 | ||
OTHER SERVICE PROVIDERS
Ultimus Fund Solutions, LLC (“Ultimus”) provides administration, fund accounting, compliance and transfer agency services to the Fund. The Fund pays Ultimus fees in accordance with the agreements for such services. In addition, the Fund pays out-of-pocket expenses including, but not limited to, postage, supplies, and certain costs related to the pricing of the Fund’s portfolio securities.
Under the terms of a Distribution Agreement with the Trust, Ultimus Fund Distributors, LLC (the “Distributor”) serves as the principal underwriter to the Fund. The Distributor is a wholly-owned subsidiary of Ultimus. The Distributor is compensated by the Adviser (not the Fund) for acting as principal underwriter.
Certain officers and a Trustee of the Trust are also officers of Ultimus and are not paid by the Trust or the Fund for serving in such capacities.
TRUSTEE COMPENSATION
Effective October 17, 2022, each member of the Board (a “Trustee”) who is not an “interested person” (as defined by the 1940 Act) of the Trust (“Independent Trustee”) receives a $1,300 annual retainer from the Fund, paid quarterly, except for the Board Chairperson who receives a $1,700 annual retainer from the Fund, paid quarterly and the Audit Committee Chairperson who receives a $1,500 annual retainer from the Fund, paid quarterly. Each Independent
20
| MEEHAN FOCUS FUND |
| NOTES TO FINANCIAL STATEMENTS (Continued) |
Trustee also receives from the Fund a fee of $550 for each Board meeting attended plus reimbursement for travel and other meeting-related expenses. Prior to October 17, 2022, no additional annual retainer was specifically designated for the Audit Committee Chairperson.
5. Contingencies and Commitments
The Fund indemnifies the Trust’s officers and Trustees for certain liabilities that might arise from their performance of their duties to the Fund. Additionally, in the normal course of business the Fund enters into contracts that contain a variety of representations and warranties and which provide general indemnifications. The Fund’s maximum exposure under these arrangements is unknown, as this would involve future claims that may be made against the Fund that have not yet occurred. However, based on experience, the Trust expects the risk of loss to be remote.
6. Non-Diversification Risk
The Fund is a non-diversified Fund. As a result, the Fund’s holdings may be more concentrated in a limited number of securities and the value of its shares may be more sensitive than a diversified fund to any single economic, business, political, or regulatory occurrence.
7. Sector Risk
If a Fund has significant investments in the securities of issuers within a particular sector, any development affecting that sector will have a greater impact on the value of the net assets of the Fund than would be the case if the Fund did not have significant investments in that sector. In addition, this may increase the risk of loss in the Fund and increase the volatility of the Fund’s NAV per share. Occasionally, market conditions, regulatory changes or other developments may negatively impact a particular sector. As of August 31, 2023, the Fund had 32.8% of the value of its net assets invested in stocks within the Technology sector.
8. Subsequent Events
The Fund is required to recognize in the financial statements the effects of all subsequent events that provide additional evidence about conditions that existed as of the date of the Statement of Assets and Liabilities. For non-recognized subsequent events that must be disclosed to keep the financial statements from being misleading, the Fund is required to disclose the nature of the event as well as an estimate of its financial effect, or a statement that such an estimate cannot be made. Management has evaluated subsequent events through the issuance of these financial statements and has noted no such events.
21
| MEEHAN FOCUS FUND |
| REPORT OF INDEPENDENT REGISTERED |
| PUBLIC ACCOUNTING FIRM |
To the Shareholders of Meehan Focus Fund and
Board of Trustees of Ultimus Managers Trust
Opinion on the Financial Statements
We have audited the accompanying statement of assets and liabilities, including the schedule of investments, of Meehan Focus Fund (the “Fund”), a series of Ultimus Managers Trust, as of August 31, 2023, and the related statement of operations, the statements of changes in net assets, the related notes, and the financial highlights for each of the periods indicated below (collectively referred to as the “financial statements”). In our opinion, the financial statements present fairly, in all material respects, the financial position of the Fund as of August 31, 2023, the results of its operations, the changes in net assets, and the financial highlights for each of the periods indicated below in conformity with accounting principles generally accepted in the United States of America.
| Statements of | |||
| Statement of | Changes in Net | Financial | |
| Fund Name | Operations | Assets | Highlights |
| Meehan Focus Fund | For the year ended August 31,2023 | For the years ended August 31, 2023 and 2022 | For the years ended August 31, 2023, 2022 and 2021, for the ten months ended August 31, 2020, and the years ended October 31, 2019, and 2018 |
Basis for Opinion
These financial statements are the responsibility of the Fund’s management. Our responsibility is to express an opinion on the Fund’s financial statements based on our audits. We are a public accounting firm registered with the Public Company Accounting Oversight Board (United States) (“PCAOB”) and are required to be independent with respect to the Fund in accordance with the U.S. federal securities laws and the applicable rules and regulations of the Securities and Exchange Commission and the PCAOB.
We conducted our audits in accordance with the standards of the PCAOB. Those standards require that we plan and perform the audit to obtain reasonable assurance about whether the financial statements are free of material misstatement whether due to error or fraud.
Our audits included performing procedures to assess the risks of material misstatement of the financial statements, whether due to error or fraud, and performing procedures that respond to those risks. Such procedures included examining, on a test basis, evidence regarding the amounts and disclosures in the financial statements. Our procedures included confirmation of securities owned as of August 31, 2023, by correspondence with the custodian. Our audits
22
| MEEHAN FOCUS FUND |
| REPORT OF INDEPENDENT REGISTERED |
| PUBLIC ACCOUNTING FIRM |
also included evaluating the accounting principles used and significant estimates made by management, as well as evaluating the overall presentation of the financial statements. We believe that our audits provide a reasonable basis for our opinion.
We have served as the Fund’s auditor since 2010.
COHEN & COMPANY, LTD.
Philadelphia, Pennsylvania
October 30, 2023
23
| MEEHAN FOCUS FUND |
| ABOUT YOUR FUND’S EXPENSES (Unaudited) |
We believe it is important for you to understand the impact of costs on your investment. As a shareholder of the Fund, you may incur two types of costs: (1) transaction costs, including redemption fees; and (2) ongoing costs, including management fees and other expenses. The following examples are intended to help you understand your ongoing costs (in dollars) of investing in the Fund and to compare these costs with the ongoing costs of investing in other mutual funds.
A mutual fund’s ongoing costs are expressed as a percentage of its average net assets. This figure is known as the expense ratio. The expenses in the table below are based on an investment of $1,000 made at the beginning of the most recent period (March 1, 2023) and held until the end of the period (August 31, 2023).
The table below illustrates the Fund’s ongoing costs in two ways:
Actual fund return – This section helps you to estimate the actual expenses that you paid over the period. The “Ending Account Value” shown is derived from the Fund’s actual return, and the third column shows the dollar amount of operating expenses that would have been paid by an investor who started with $1,000 in the Fund. You may use the information here, together with the amount you invested, to estimate the expenses that you paid over the period.
To do so, simply divide your account value by $1,000 (for example, an $8,600 account value divided by $1,000 = 8.6), then multiply the result by the number given for the Fund under the heading “Expenses Paid During Period.”
Hypothetical 5% return – This section is intended to help you compare the Fund’s ongoing costs with those of other mutual funds. It assumes that the Fund had an annual return of 5% before expenses during the period shown, but that the expense ratio is unchanged. In this case, because the return used is not the Fund’s actual return, the results do not apply to your investment. The example is useful in making comparisons because the U.S. Securities and Exchange Commission (the “SEC”) requires all mutual funds to calculate expenses based on a 5% return. You can assess the Fund’s ongoing costs by comparing this hypothetical example with the hypothetical examples that appear in shareholder reports of other funds.
Note that expenses shown in the table are meant to highlight and help you compare ongoing costs only. The Fund does not charge sales loads. However, a redemption fee of 2% is applied on the sale of shares of the Fund held for less than 7 calendar days.
The calculations assume no shares were bought or sold during the period. Your actual costs may have been higher or lower, depending on the amount of your investment and the timing of any purchases or redemptions.
More information about the Fund’s expenses, including historical annual expense ratios, can be found in this report. For additional information on operating expenses and other shareholder costs, please refer to the Fund’s prospectus.
24
| MEEHAN FOCUS FUND |
| ABOUT YOUR FUND’S EXPENSES (Unaudited) (Continued) |
| Beginning | Ending | Expenses | ||||
| Account Value | Account Value | Paid During | ||||
| March 1, 2023 | August 31, 2023 | Period * | ||||
| Based on Actual Fund Return | $ 1,000.00 | $ 1,175.80 | $ 5.48 | |||
| Based on Hypothetical 5% Return (before expenses) | $ 1,000.00 | $ 1,020.16 | $ 5.09 |
| * | Expenses are equal to the Fund’s annualized net expense ratio of 1.00% for the period, multiplied by the average account value over the period, multiplied by 184/365 (to reflect the one-half year period). |
| OTHER INFORMATION (Unaudited) |
A description of the policies and procedures that the Fund uses to vote proxies relating to portfolio securities is available without charge upon request by calling toll- free 1-866-884-5968, or on the SEC’s website at www.sec.gov. Information regarding how the Fund voted proxies relating to portfolio securities during the most recent 12-month period ended June 30 is available without charge upon request by calling toll-free 1-866-884-5968, or on the SEC’s website at www.sec.gov.
The Trust files a complete listing of portfolio holdings for the Fund with the SEC as of the end of the first and third quarters of each fiscal year as an exhibit to its reports on Form N-PORT. These filings are available upon request by calling 1-866-884-5968. Furthermore, you may obtain a copy of the filings on the SEC’s website at www.sec.gov and on the Fund’s website www.meehanmutualfunds.com
| FEDERAL TAX INFORMATION (Unaudited) |
For the year ended August 31, 2023, the Fund designated $605,629 as long-term capital gain distributions.
Qualified Dividend Income – The Fund designates 100% of its ordinary income dividends, or up to the maximum amount of such dividends allowable pursuant to the Internal Revenue Code, as qualified dividend income eligible for the reduced tax rate of 15%.
Dividends Received Deduction – Corporate shareholders are generally entitled to take the dividends received deduction on the portion of the Fund’s dividend distributions that qualifies under tax law. For the year ended August 31, 2023, 100% of ordinary income dividends qualified for the corporate dividends received deduction.
25
| MEEHAN FOCUS FUND |
| BOARD OF TRUSTEES AND EXECUTIVE OFFICERS (Unaudited) |
The Board has overall responsibility for management of the Trust’s affairs. The Trustees serve during the lifetime of the Trust and until its termination, or until death, resignation, retirement, or removal. The Trustees, in turn, elect the officers of the Fund to actively supervise their day-to-day operations. The officers have been elected for an annual term. Each Trustee’s and officer’s address is 225 Pictoria Drive, Suite 450, Cincinnati, Ohio 45246. The following are the Trustees and executive officers of the Fund:
| Name and Year of Birth | Length of Time Served | Position(s) held with Trust | Principal Occupation(s) During Past 5 Years | Number of Funds in the Trust Overseen By Trustee | Directorship(s) of Public Companies Held By Trustee During Past 5 Years |
| Interested Trustees: | |||||
| David K. James* Year of Birth: 1970 | April 2023 to present
October 2022 to April 2023
July 2021 to October 2022 | Trustee (April 2023 to present)
Assistant Secretary
Secretary | Executive Vice President and Chief Legal and Risk Officer of Ultimus Fund Solutions, LLC (“Ultimus”) and a member of the board of managers of Ultimus Fund Distributors, LLC, Northern Lights Distributors, LLC and Northern Lights Compliance Services, LLC, each an affiliate of Ultimus (2018 to present); Managing Director and Managing Counsel of State Street Bank and Trust Company (2009 to 2018) | 31 | Interested Trustee of 12 series of the Capitol Series Trust (a registered management company) (2021 to present) |
| Independent Trustees: | |||||
| Janine L. Cohen Year of Birth: 1952 | Since 2016 | Chairperson (2019 to present)
Trustee (2016 to present) | Retired since 2013; previously Chief Financial Officer from 2004 to 2013 and Chief Compliance Officer from 2008 to 2013 at AER Advisors, Inc. | 31 | n/a |
26
| MEEHAN FOCUS FUND |
| BOARD OF TRUSTEES AND EXECUTIVE OFFICERS (Unaudited) (Continued) |
| Name and Year of Birth | Length of Time Served | Position(s) held with Trust | Principal Occupation(s) During Past 5 Years | Number of Funds in the Trust Overseen By Trustee | Directorship(s) of Public Companies Held By Trustee During Past 5 Years |
| Independent Trustees (Continued): | |||||
| David M. Deptula Year of Birth: 1958 | Since 2012 | Trustee (2012 to present) | Vice President of Legal and Special Projects at Dayton Freight Lines, Inc. since 2016 | 31 | n/a |
| Robert E. Morrison Year of Birth: 1957 | Since 2019 | Trustee (2019 to present; and previously 2012 to 2014) | Managing Director at Midwest Trust and FCI Advisors (2022 to present); Senior Vice President and National Practice Lead for Investment, Huntington National Bank/Huntington Private Bank (2014 to 2022); CEO, CIO, President of 5 Star Investment Management Company (2006 to 2014) | 31 | n/a |
| Clifford N. Schireson Year of Birth: 1953 | Since 2019 | Trustee (2019 to present) | Retired; Founder of Schireson Consulting, LLC (2017 to 2022); Director of Institutional Services for Brandes Investment Partners, LP (2004 to 2017) | 31 | Trustee of the San Diego City Employees’ Retirement System (2019 to present) |
| Jacqueline A. Williams Year of Birth: 1954 | Since 2019 | Trustee (2019 to present) | Managing Member of Custom Strategy Consulting, LLC (2017 to present); Managing Director of Global Investment Research (2005 to 2017), Cambridge Associates, LLC | 31 | n/a |
| * | Mr. James is considered an “interested person” of the Trust within the meaning of Section (2)(a)(19) of the Investment Company Act of 1940, as amended, because of his relationship with the Trust’s Administrator, Transfer Agent, and Distributor. |
27
| MEEHAN FOCUS FUND |
| BOARD OF TRUSTEES AND EXECUTIVE OFFICERS (Unaudited) (Continued) |
| Name and Year of Birth | Length of Time Served | Position(s) held with Trust | Principal Occupation(s) During Past 5 Years |
| Executive Officers: | |||
| Todd E. Heim Year of Birth: 1967 | 2021 to present
2014 to 2021 | President
Vice President | Vice President, Relationship Management (2018 to present) and Assistant Vice President, Client Implementation Manager with Ultimus Fund Solutions, LLC (2014 to 2018) |
| Shannon Thibeaux- Burgess Year of Birth: 1970 | April 2023 to present | Vice President | Senior Vice President, Relationship Management with Ultimus Fund Solutions, LLC (2022 to present); Head of Regulatory Service with J.P. Morgan Chase & Co. (2020 to 2022); Chief Administrative Officer of State Street Bank (2013 to 2020) |
| Jennifer L. Leamer Year of Birth: 1976 | 2014 to present
April 2014 to October 2014 | Treasurer
Assistant Treasurer | Senior Vice President of Fund Accounting (2020 to present) and Mutual Fund Controller of Ultimus Fund Solutions, LLC (2014 to 2020) |
| Daniel D. Bauer Year of Birth: 1977 | 2016 to present | Assistant Treasurer | Vice President of Fund Accounting (2022 to present), Assistant Vice President of Fund Accounting (2020 to 2022), and AVP, Assistant Mutual Fund Controller (2015 to 2020) of Ultimus Fund Solutions, LLC |
| Angela A. Simmons Year of Birth: 1975 | January 2022 to present | Assistant Treasurer | Vice President of Financial Administration (2022 to present) and Assistant Vice President, Financial Administration (2015 to 2022) of Ultimus Fund Solutions, LLC |
| Karen Jacoppo-Wood Year of Birth: 1966 | April 2023 to present | Secretary | Senior Vice President and Associate General Counsel of Ultimus Fund Solutions, LLC (2022 to present); Managing Director and Managing Counsel (2019 to 2022) and Vice President and Counsel (2014 to 2019) of State Street Bank and Trust Company |
| Natalie S. Anderson Year of Birth: 1975 | 2016 to present | Assistant Secretary | Legal Administration Manager (2016 to present) and Paralegal (2015 to 2016) of Ultimus Fund Solutions, LLC |
| Jesse Hallee Year of Birth: 1976 | April 2023 to present | Assistant Secretary | Senior Vice President and Associate General Counsel of Ultimus Fund Solutions, LLC (June 2019 to present); Vice President and Managing Counsel, State Street Bank and Trust Company (2013 to 2019) |
28
| MEEHAN FOCUS FUND |
| BOARD OF TRUSTEES AND EXECUTIVE OFFICERS (Unaudited) (Continued) |
| Name and Year of Birth | Length of Time Served | Position(s) held with Trust | Principal Occupation(s) During Past 5 Years |
| Executive Officers (Continued): | |||
| Gweneth K. Gosselink Year of Birth: 1955 | 2020 to present | Chief Compliance Officer | Assistant Vice President, Compliance Officer at Ultimus Fund Solutions, LLC (2019 to present); CCO Consultant at GKG Consulting, LLC (2019 to 2021); Chief Operating Officer & CCO at Miles Capital, Inc. (2013 to 2019) |
| Martin Dean Year of Birth: 1963 | 2020 to present
2019 to 2020
2016 to 2017 | Assistant Chief Compliance Officer
Interim Chief Compliance Officer
Assistant Chief Compliance Officer | President of Northern Lights Compliance Services, LLC (February 2023 to present); Senior Vice President, Head of Fund Compliance (2020 to January 2023) and Vice President & Director of Fund Compliance of Ultimus Fund Solutions, LLC (2016 to 2020) |
Additional information about members of the Board and executive officers is available in the Fund’s Statement of Additional Information (“SAI”). To obtain a free copy of the SAI, please call toll free 1-866-884-5968.
29
Meehan-AR-23
| (b) | Not applicable |
| Item 2. | Code of Ethics. |
As of the end of the period covered by this report, the registrant has adopted a code of ethics that applies to the registrant’s principal executive officer, principal financial officer, principal accounting officer or controller, or persons performing similar functions, regardless of whether these individuals are employed by the registrant or a third party. Pursuant to Item 12(a)(1), a copy of registrant’s code of ethics is filed as an exhibit to this Form N-CSR. During the period covered by this report, the code of ethics has not been amended, and the registrant has not granted any waivers, including implicit waivers, from the provisions of the code of ethics.
| Item 3. | Audit Committee Financial Expert. |
The registrant’s board of trustees has determined that the registrant has at least one audit committee financial expert serving on its audit committee. The name of the audit committee financial expert is Janine L. Cohen. Ms. Cohen is “independent” for purposes of this Item.
| Item 4. | Principal Accountant Fees and Services. |
| (a) | Audit Fees. The aggregate fees billed for professional services rendered by the principal accountant for the audit of the registrant’s annual financial statements or for services that are normally provided by the accountant in connection with statutory and regulatory filings or engagements were $40,500 and $40,500 with respect to the registrant’s fiscal years ended August 31, 2023 and August 31, 2022, respectively. |
| (b) | Audit-Related Fees. No fees were billed in the first fiscal period for assurance and related services by the principal accountant that are reasonably related to the performance of the audit of the registrant’s financial statements and are not reported under paragraph (a) of this Item. |
| (c) | Tax Fees. The aggregate fees billed for professional services rendered by the principal accountant for tax compliance, tax advice, and tax planning were $10,000 and $12,000 with respect to the registrant’s fiscal years ended August 31, 2023, and August 31, 2022, respectively. The services comprising these fees are the preparation of the registrant’s federal income and excise tax returns. |
| (d) | All Other Fees. No fees were billed in the first fiscal period for products and services provided by the principal accountant, other than the services reported in paragraphs (a) through (c) of this Item. |
| (e)(1) | The audit committee has not adopted pre-approval policies and procedures described in paragraph (c)(7) of Rule 2-01 of Regulation S-X. |
| (e)(2) | None of the services described in paragraph (b) through (d) of this Item were approved by the audit committee pursuant to paragraph (c)(7)(i)(C) of Rule 2-01 of Regulation S-X. |
| (f) | Less than 50% of hours expended on the principal accountant’s engagement to audit the registrant’s financial statements for the most recent fiscal year were attributed to work performed by persons other than the principal accountant’s full-time, permanent employees. |
| (g) | During the fiscal years ended August 31, 2023 and August 31, 2022, aggregate non-audit fees of $10,000 and $12,000, respectively, were billed by the registrant’s accountant for services rendered to the registrant. No non-audit fees were billed in the last fiscal year by the registrant’s accountant for services rendered to the registrant’s investment adviser (not including any sub-adviser whose role is primarily portfolio management and is subcontracted with or overseen by another investment adviser), and any entity controlling, controlled by, or under common control with the adviser that provides ongoing services to the registrant. |
| (h) | The principal accountant has not provided any non-audit services to the registrant’s investment adviser (not including any sub-adviser whose role is primarily portfolio management and is subcontracted with or overseen by another investment adviser), and any entity controlling, controlled by, or under common control with the investment adviser that provides ongoing services to the registrant. |
| (i) | Not applicable |
(j) Not applicable
| Item 5. | Audit Committee of Listed Registrants. |
Not applicable
| Item 6. | Schedule of Investments. |
| (a) | Not applicable [schedule filed with Item 1] |
| (b) | Not applicable |
| Item 7. | Disclosure of Proxy Voting Policies and Procedures for Closed-End Management Investment Companies. |
Not applicable
| Item 8. | Portfolio Managers of Closed-End Management Investment Companies. |
Not applicable
| Item 9. | Purchases of Equity Securities by Closed-End Management Investment Company and Affiliated Purchasers. |
Not applicable
Item 10. Submission of Matters to a Vote of Security Holders.
There has been no material changes to the manner in which shareholders may recommend nominees to the Registrant’s Board of Trustees or the Nominations & Governance Committee (the “Committee”). The Registrant does not have formal procedures by which shareholders may recommend nominees to the Registrant’s Board of Trustees. While the Registrant does not have formal procedure, the Committee shall to the extent required under applicable law, when identifying potential candidates for the position of Independent Trustee, consider any such candidate recommended by a shareholder.
| Item 11. | Controls and Procedures. |
(a) Based on their evaluation of the registrant’s disclosure controls and procedures (as defined in Rule 30a-3(c) under the Investment Company Act of 1940) as of a date within 90 days of the filing date of this report, the registrant’s principal executive officer and principal financial officer have concluded that such disclosure controls and procedures are reasonably designed and are operating effectively to ensure that material information relating to the registrant, including its consolidated subsidiaries, is made known to them by others within those entities, particularly during the period in which this report is being prepared, and that the information required in filings on Form N-CSR is recorded, processed, summarized, and reported on a timely basis.
(b) There were no changes in the registrant’s internal control over financial reporting (as defined in Rule 30a-3(d) under the Investment Company Act of 1940) that occurred during the period covered by this
report that have materially affected, or are reasonably likely to materially affect, the registrant’s internal control over financial reporting.
| Item 12. | Disclosure of Securities Lending Activities for Closed-End Management Investment Companies. |
Not applicable.
| Item 13. | Exhibits. |
File the exhibits listed below as part of this Form. Letter or number the exhibits in the sequence indicated.
(a)(1) Any code of ethics, or amendment thereto, that is the subject of the disclosure required by Item 2, to the extent that the registrant intends to satisfy the Item 2 requirements through filing of an exhibit: Attached hereto
(a)(2) A separate certification for each principal executive officer and principal financial officer of the registrant as required by Rule 30a-2(a) under the Act (17 CFR 270.30a-2(a)): Attached hereto
(1) Any written solicitation to purchase securities under Rule 23c-1 under the Act (17 CFR 270.23c-1) sent or given during the period covered by the report by or on behalf of the registrant to 10 or more persons: Not applicable
(2) Change in the registrant’s independent public accountants: Not applicable.
(b) Certifications required by Rule 30a-2(b) under the Act (17 CFR 270.30a-2(b)): Attached hereto
Exhibit 99.CODE ETH Code of Ethics
Exhibit 99.CERT Certifications required by Rule 30a-2(a) under the Act
Exhibit 99.906CERT Certifications required by Rule 30a-2(b) under the Act
SIGNATURES
Pursuant to the requirements of the Securities Exchange Act of 1934 and the Investment Company Act of 1940, the registrant has duly caused this report to be signed on its behalf by the undersigned, thereunto duly authorized.
| (Registrant) | Ultimus Managers Trust | ||
| By (Signature and Title)* | /s/ Todd E. Heim | ||
| Todd E. Heim, President | |||
| Date | November 3, 2023 | ||
| Pursuant to the requirements of the Securities Exchange Act of 1934 and the Investment Company Act of 1940, this report has been signed below by the following persons on behalf of the registrant and in the capacities and on the dates indicated. | |||
| By (Signature and Title)* | /s/ Todd E. Heim | ||
| Todd E. Heim, Principal Executive Officer | |||
| Date | November 3, 2023 | ||
| By (Signature and Title)* | /s/ Jennifer L. Leamer | ||
| Jennifer L. Leamer, Treasurer and Principal Financial Officer | |||
| Date | November 3, 2023 | ||
* Print the name and title of each signing officer under his or her signature.