UNITED STATES
SECURITIES AND EXCHANGE COMMISSION
Washington, D.C. 20549
FORM N-CSR
CERTIFIED SHAREHOLDER REPORT OF REGISTERED
MANAGEMENT INVESTMENT COMPANY
| Investment Company Act file number | 811-22680 | |
| Ultimus Managers Trust |
| (Exact name of registrant as specified in charter) |
| 225 Pictoria Drive, Suite 450 Cincinnati, Ohio | 45246 |
| (Address of principal executive offices) | (Zip code) |
Karen Jacoppo-Wood
| Ultimus Fund Solutions, LLC 225 Pictoria Drive, Suite 450 Cincinnati, Ohio 45246_ |
| (Name and address of agent for service) |
| Registrant's telephone number, including area code: | (513) 587-3400 | |
| Date of fiscal year end: | December 31 | |
| | | |
| Date of reporting period: | December 31, 2023 | |
Form N-CSR is to be used by management investment companies to file reports with the Commission not later than 10 days after the transmission to stockholders of any report that is required to be transmitted to stockholders under Rule 30e-1 under the Investment Company Act of 1940 (17 CFR 270.30e-1). The Commission may use the information provided on Form N-CSR in its regulatory, disclosure review, inspection, and policymaking roles.
A registrant is required to disclose the information specified by Form N-CSR, and the Commission will make this information public. A registrant is not required to respond to the collection of information contained in Form N-CSR unless the Form displays a currently valid Office of Management and Budget ("OMB") control number. Please direct comments concerning the accuracy of the information collection burden estimate and any suggestions for reducing the burden to Secretary, Securities and Exchange Commission, 450 Fifth Street, NW, Washington, DC 20549-0609. The OMB has reviewed this collection of information under the clearance requirements of 44 U.S.C. § 3507.
| Item 1. | Reports to Stockholders. |

Westwood Salient MLP & Energy Infrastructure Fund
| Annual Report | December 31, 2023 |
| | |
| | |
| | |
| | |
| | |
| | |
| | |
| | |
| | |
| | |
| | |
| | |
| | |
| | |
| | |
| | |
| | |
| | |
| | Investment Adviser: |
| | Westwood Management Corp. |
| | |
| | |
| | |
| | |
| | |
| | |
| | |
| | |
| | |
| | |
| WESTWOOD SALIENT MLP & ENERGY INFRASTRUCTURE FUND |
| |
| |
| TABLE OF CONTENTS |
| Shareholder Letter | 1 |
| Schedules of Investments | 10 |
| Statement of Assets and Liabilities | 13 |
| Statement of Operations | 15 |
| Statements of Changes in Net Assets | 16 |
| Financial Highlights | 18 |
| Notes to Financial Statements | 22 |
| Report of Independent Registered Public Accounting Firm | 35 |
| Liquidity Risk Management Program | 36 |
| About Your Fund’s Expenses | 37 |
| Other Information | 39 |
| Trustees and Officers of Ultimus Managers Trust | 40 |
| WESTWOOD SALIENT MLP & ENERGY INFRASTRUCTURE FUND (Unaudited) |
| |
December 31, 2023
Dear Shareholders,
Fed Flips Dovish While Global and U.S. Outlook Remain Questionable
The first half of 2023 was certainly an example of equity resilience, even through a major banking liquidity event, which by many accounts, could have gone much worse. Stocks even defied the summer doldrums, pushing higher into late July. Late summer finally brought a pullback in both stocks and fixed income, leaving investors with low expectations going into the fourth quarter as both markets reached their lows for the year near the end of October as investor sentiment and confidence continued to weaken. But as better-than-feared Q3 earnings results started to flood in, sentiment shifted. Resilience in the domestic jobs market and relatively stable home prices also helped buoy consumers’ confidence, which fueled better-than-expected consumer spending and economic growth late in the year. At the same time, inflation data softened faster than expectations and an abrupt shift in the Federal Reserve’s (Fed’s) messaging and interest rate trajectory led investors quickly back into the credit and debt markets in a big way.
As the year closed, the idea of a “soft landing” or perhaps no recession at all gained momentum, with the smart money betting on the first rate cut in March or May of 2024 (we believe March may be too aggressive). The broad-based rally to close 2023 certainly indicated that investor sentiment had shifted to positive territory, as volatility fell and many stocks — not just the mega-cap growth Magnificent Seven — achieved new highs. With 2023 firmly in the rear-view mirror, we now see that S&P 500 returns for the past five years are at 15.69%, well in excess of historical norms. Investors would be wise to note that what goes up typically comes down, often much quicker than we’d like.
And despite 40-year highs in interest rates, slowing/diverging global economies (and monetary policies), ongoing and new conflict abroad, and sticky above-trend prices, domestic consumers and investors have continued to (mostly) thrive, at least according to headline data. That statement comes with a bevy of caveats, but all-in-all, the capital markets are still pricing in a goldilocks scenario complete with a reduction in rates sooner rather than later. Whether that perfect scenario materializes or not is a debate for later.
As a result, we’ve experienced one of the more substantial rallies in the normally diverging stock and bond markets in recent years. In the bond market, after causing much pain for investors in the first 10 months of the year, the yield on the 10-year U.S. Treasury ended the year roughly where it started at about 3.9%. In the stock market, after some volatility, the S&P 500 ended the year ahead by about 25%.
Investors are certainly behaving more like it’s the beginning (expansion portion) of an economic cycle versus one that may be ending. At the time of writing, traders are already pricing in a near 75% chance that rates will fall at least 50 basis points (bps) by July 2024. That would mean that the 25 bps hike the Fed made at its meeting last July would be its last. It also suggests that market participants expect economic conditions to slow enough to move the inflationary needle.
In its November meeting, the Central Bank left its benchmark interest rate unchanged at a range of 5.25% to 5.50%, which was enough to appease dovish bulls. It went a step further in its final meeting in 2023 as Chairman Powell verbalized that its “policy rate is likely at or near its peak for this tightening cycle,” prompting even more buying across major stock and bond indexes.
Given the knowledge at hand, we are taking a slightly less optimistic stance versus the consensus on rate reductions, but believe the Federal Open Market Committee (FOMC) may still be able to pull off an increasingly difficult feat. The question on our minds now centers around what it would take to motivate the Fed to reverse course so quickly with inflation still far above trend. Logic denotes a dramatic economic downturn as the most probable trigger, but that theory counters the widely held “soft-landing” belief. Perhaps now you realize our minor conundrum. The economic resilience noted in 2023 was also fed in large by consumers’ continued drawdowns of excess savings stemming from the COVID-19 pandemic. Their actions were largely justified by relatively stable home values and more favorable
| WESTWOOD SALIENT MLP & ENERGY INFRASTRUCTURE FUND (Unaudited) |
| |
home equity (loan-to-value) ratios than the typical American experienced just ahead of the Great Recession. Any pronounced destabilization or correction of housing prices or a major riff in the labor market could have potentially nasty effects on what we feel is an overly confident environment.
The Tale of the Tape
The S&P 500 has produced a positive return in 67 of the past 93 years; over those years, markets have only produced two consecutive down years 11 times. This supports the theory that stocks generally fall faster than they rise and don’t tend to have multiple consecutive down years (that theory has a 12%-win rate). Put simply, 2023 wasn’t a good year to bet bearish.
For U.S. stocks, the technology sector, centered around artificial intelligence as a catalyst, has been leading the charge for much of the year, with a narrow group of major tech companies reporting robust earnings, and thus driving their stock prices higher. But they were not completely alone, as growth companies at large surged with continued “risk-on” sentiment, as evidenced by the 42.69% (2023) return in the Russell 1000 Growth Index. Conversely, traditional sectors like utilities and real estate have experienced sluggish growth due to increasing interest rates and have thus underperformed. Overall, equity strength reflects the relatively strong earnings of a fair number of constituent companies. Market volatility remained rather tame throughout the year, also suggesting investor confidence in the longevity of the current economic expansion. We are a little less optimistic that volatility will remain low in the coming quarters.
Within the economy, U.S. consumer-price index (CPI) readings fell to the 3% range as the year closed, showing the slowest rate of increase since 2021 and leading to hope that the inflation monster may have finally been slain. Consumer sentiment continued to decline, though spending in the critical holiday season seemed to be elevated over previous years. Consumer debt levels remain elevated, though, and high interest rates on that consumer debt could spell trouble for this critical component of the economy.
The “Powell Pivot” sent bonds on a furious rally to close out the year. Bonds were looking to log a third consecutive year of negative returns until the end of October, when the Treasury decided to issue more short-term T-Bills as opposed to longer-dated bonds. This, followed by Fed Chairman Powell’s statements on November 1 that were interpreted as dovish — moving their stance from “higher for longer” to a more accommodative position — caused the bond market to rally to the end of the year.
Ten-year Treasury yields touched 5% intraday in late October, but then plunged over 100 bps to close the year at 3.88%. Two-year Treasuries fell nearly as much, as they had reached a peak of 5.19% in mid-October, falling to 4.23% to end the year. After advancing to nearly a 5% yield in the third quarter, 10-year Treasury bond yields turned sharply lower during the fourth quarter and finished 2023 in roughly the same place as they began, at 3.88%. For the quarter, most of the Treasury curve rallied with the 2-year yield down 79 bps and 30-year bonds down 67 bps. The substantial decline in real yields — the inflation-adjusted cost of borrowing — drove most of the steep drop in nominal yields, largely due to investor expectations for future Fed easing.
Corporate credit also advanced in the fourth quarter, as investment grade bonds added 8.15%, while high yield bonds gained 7.17%. The spread between corporate and Treasury yields declined in the quarter, indicating optimism about defaults and continued economic gains into the new year. Overall, the broad market Bloomberg U.S. Aggregate Bond Index gained 6.82% for the quarter, ending the year with a positive return of 5.53%.
Most global fixed-income assets lost ground over the quarter but remained above recent troughs. Volatility in the debt sector remains elevated and its future is heavily dependent on how the Fed plays its hand into 2024. Over the last three months, U.S. Treasury yields also moved higher (prices lower) across all segments of the yield curve, particularly one- and two-month bills. And though volatility may persist, there could be a tremendous intermediate-term opportunity for fixed-income investors here.
| WESTWOOD SALIENT MLP & ENERGY INFRASTRUCTURE FUND (Unaudited) |
| |
After two-quarters of a gross domestic product (GDP) contraction in mid-2023, GDP readings have remained positive, though they continue to slow as rates continue to be highly restrictive. U.S. GDP increased at an annualized rate of 2.1% in Q2, down just 0.1 percentage point from the 2.2% rise in the year’s first three months. The largest increases for the second quarter were in nonresidential fixed investment (purchases of both nonresidential structures and equipment and software), consumer spending, and state and local government spending. These gains offset reductions in exports and residential fixed investments (purchases of private residential structures and residential equipment that property owners use for rentals). The marginal decline in the GDP growth rate for the second quarter compared to the first three months of the year was due to slowdowns in consumer and federal government spending, as well as a decrease in exports.
Domestic price pressures remain, but what was a hot energy market over the summer has begun to cool (metaphorically and actually) as fall takes hold. This has helped reduce overall inflationary effects on consumers. The CPI rose 0.6% in August, following a monthly increase of 0.2% in July. The CPI was up 3.7% year-over-year, up from the 3.2% annual rise in July. September prices increased 0.4% on the month and 3.7% from a year ago, while core prices were up 0.3% for the month and 4.1% on a 12-month basis. Long-term inflationary trends have been moving lower, especially at the core, but headline CPI has been a bit more stubborn. Falling fuel and natural gas prices should help non-core readings going into 2024.
With Q3 earnings reported, 80% of S&P 500 constituents surpassed earnings per share (EPS) expectations vs. S&P Capital IQ Estimates, up 1% from Q2 (79%), up 3% from Q1 (77%) and well above Q4 2022 (68%). Year-over-year, the S&P 500 recorded an EPS growth rate of 13.9%, increasing significantly from 4.3% in Q2 and 2.6% in Q1. The strongest growth year-over-year since Q3 2022. Communication Services was the highest performing sector year-over-year, recording a 63.0% growth rate. The sector dethroned Consumer Discretionary, which had been the highest growth sector the last two quarters.
The Road Ahead
An increasingly accommodative Fed rate trajectory can certainly be considered a bullish tailwind for 2024. At this point, it’s clear that interest rates have plateaued and easing financial conditions are already making their way into the markets. Core inflation can continue to push lower, with prices for shelter/housing and energy falling as U.S. production ramps up and global demand softens — all good things at a macro level. But from a valuation perspective, we must remember that interest rate cuts have thus far been telegraphed by the FOMC and already priced (or overpriced) into the market.
Overall, consumers seem optimistic, but many have depleted savings and are increasingly levered with high-rate credit card debt. And while easing inflation is good for consumers, it reduces pricing power and margin growth for companies. Earnings growth should be accelerating into 2024 — coming off a low base in 2023 — and economic growth has been stronger than expected, driven by better real income growth and still-low unemployment. With ongoing concerns about employment and wage growth, the result may mean slower GDP growth overall in 2024 and 2025.
It appears that the earnings contraction is already behind us, with earnings likely bottoming in the third quarter of 2023. Another important milestone to note is that the S&P hit its all-time high almost two years ago, in early January 2022 (which technically marked the starting point of that year’s bear market). Two years is a long time to remain below the previous all-time high, unless we are in a recession. Looking at all bear markets historically, stocks have taken a median of 48 months (about four years) to travel back to their preceding peak. But bear markets that do not include a recession like we experienced in 2022 have historically taken only 11 months to recover. The question now will be just how accommodative the Fed will get and what impact geopolitical risks and the coming election will have on market behavior.
| WESTWOOD SALIENT MLP & ENERGY INFRASTRUCTURE FUND (Unaudited) |
| |
All in all, we remain cautiously optimistic, the same sentiment noted as we entered 2023, but current opportunities are obviously far different.
Investors must remain vigilant, agile and active. We believe that a highly tactical, vertical approach will likely yield the best returns, as we expect a continued increase in market dislocations and further divergence of the correlations that market participants have observed over the last decade or so. We still believe that recession isn’t completely off the table, but the U.S. economy has a very high probability of experiencing slower growth, increased labor market deterioration, and subsequently, lower inflation as we move into 2024. Fixed income is likely to continue to benefit, with a focus on high quality, investment-grade paper across most durations. We are still of the opinion that high-yield paper offers less advantageous risk/reward at this point and would remain underweight to that sector.
Given recent economic data and Fed commentary, markets have priced out any rate cuts later this year and data suggests a prolonged plateau in rates, with perhaps one more high of 25 bps. We are less optimistic that rates will fall sooner than later and don’t see a decline in rates occurring until the back half of 2024. Oddly enough, investors remain optimistic about riskier, high-yield debt as yield spreads remain relatively tame. That could be a trap for investors if the economy does turn more sour than expected. Our current outlook suggests investors may best benefit from eventual rate declines by moving further out on the curve (increasing duration) with a focus on high-quality corporate and government credit.
We expect U.S. growth to slow to 1.9% year-over-year in 2024 and further down to 1.4% in 2025, down from an estimated 2.4% in 2023. Higher interest rates, tighter monetary policy and a slowing labor market should continue to detract from the overall economy and financial system. Economists also expect U.S. consumer spending to begin to slow more meaningfully in 2024 and 2025, driven by a cooling labor market, which weighs on real disposable income, and elevated rates putting further pressure on debt service costs. Among the bright spots: Business investment should finally turn positive in the second half of 2024 after two years of decline.
Emerging markets present a mixed economic picture, with expansion in India, Indonesia and the Philippines offset by tepid growth in China, which has disappointed on post-pandemic reopening recovery and growth expectations. We see fairly stable but less robust growth in China, but we expect the government to respond with policies to stimulate the economy.
As economic growth decelerates and the probability of a recession increases, quality characteristics, which are a key attribute of our strategies, are likely to be an important driver of excess returns. We remained focused on stocks’ returns to shareholders in the form of dividends and stock buybacks as important factors in our analysis, especially in a difficult market environment. We continue to favor companies with pricing power to manage through an inflationary environment, either to reduce the impact of input costs or to pass those costs on to their customers.
The current market environment continues to produce dislocations concerning valuation and increased levels of fundamental skepticism that play to our strength. Now, more than ever, highly tactical and surgical investment techniques, with properly hedged and balanced allocations, will be needed to reduce volatility and produce alpha. As it has for over 30 years, our investment process continues to seek out mispriced opportunities where fundamental analysis can uncover value being missed in the current market environment while maintaining a strong culture of risk management with a focus on mitigating potential downside risks.
Thank you for your trust.
Sincerely,
The Investment Team,
Westwood Funds
| WESTWOOD SALIENT MLP & ENERGY INFRASTRUCTURE FUND (Unaudited) |
| |
Westwood Salient MLP & Energy Infrastructure Fund
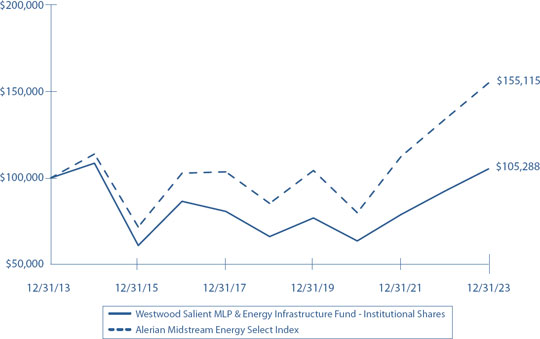
The performance of the Westwood Salient MLP & Energy Infrastructure Fund for the period ended December 31, 2023, was as follows:
| | 6 Months | Fiscal Year |
| Westwood Salient MLP & Energy Infrastructure Fund – Institutional Shares (SMLPX) | 8.19% | 13.97% |
| Westwood Salient MLP & Energy Infrastructure Fund – A Shares (SMAPX)* | 8.00% | 13.75% |
| Westwood Salient MLP & Energy Infrastructure Fund – C Shares (SMFPX) | 7.78% | 13.12% |
| Westwood Salient MLP & Energy Infrastructure Fund – Ultra Shares (SMRPX) | 8.22% | 14.22% |
| Alerian Midstream Energy Select Index | 9.10% | 15.79% |
The performance data quoted represents past performance. Past performance does not guarantee future results. The investment return and principal value of an investment will fluctuate so that an investor’s shares, when redeemed, may be worth more or less than their original cost and current performance may be lower or higher than the performance quoted. The Adviser has contractually agreed to waive fees and reimburse expenses until April 30, 2024.
The Fund underperformed the benchmark, delivering returns of 13.97% (I Shares) in the period while the benchmark returned 15.79%. The energy infrastructure industry had an eventful 2023. Consolidation and economic fears marked the first five months of the year, while growth and strong fundamentals resulted in a strong finish through fiscal year end in December.
First quarter market dynamics were driven by macro-oil expectations and the fear of an impending recession. During the past two recessions, in 2009 and 2020, oil demand declined globally. Investor fear of a recession in 2023 led to a 20%+ oil price correction peak to trough during the first quarter of the year. We would note that global demand doesn’t always decline during a U.S. recession; for example, in 2001 and 1991, global demand actually grew while the U.S. was in recession. Fortunately for the energy markets, OPEC+ continued to reiterate their commitment to keeping oil prices stable, and, on April 2, 2023, the cartel left no doubt of its commitment as it cut production by 1.15 million barrels per day (mmbpd). The move surprised many, but frankly, we believed at the time that the data was indicating the market was 1-2 mmbpd oversupplied. The 1.15 mmbpd cut, plus Russia’s extension of its 500,000-bpd cut from earlier in the year and a unilateral, additional 1.0 mmbpd cut from Saudi Arabia, led to a strong rebound in oil prices during the second quarter. Looking ahead, we believe that oil prices at $70 to $90 are very supportive of the U.S. energy industry and, at the same time, are not overly onerous for consumers.
While the first quarter was macro driven, the second quarter saw positive company-level developments, which helped the group rally through quarter-end. First, legislation to complete the long-delayed Mountain Valley Pipeline (MVP) was included in the debt ceiling bill (aka, Fiscal Responsibility Act of 2023). The legislation directed the U.S. Army Corps of Engineers to issue remaining water crossing permits within 21 days of passage. With permits issued, the MVP pipeline can complete construction by year-end. The second big development during the quarter happened on Mother’s Day, when Oneok (OKE) agreed to acquire Magellan Midstream Partners, L.P. (MMP) for a 22% premium to the prior close. Consideration for the deal was $25.00 in cash and 0.667 shares of OKE for every unit of MMP owned. This was a surprise marriage to us, as MMP operates in the crude and refined products markets while OKE is one of the major players in the natural gas liquids (NGL) value chain. Strategically, it makes sense in terms of diversifying OKE’s operations, and perhaps more importantly, it could provide the company with a long-sought entry into NGL exports since MMP has crude oil export facilities along the Gulf Coast that may be expandable to include NGLs. Investors frequently ask us if we believe this is the beginning of an M&A wave, and our answer is that we’ve been in a consolidation wave for a few years now, but it is very difficult to predict when or if large-scale transactions will take place going forward.
| WESTWOOD SALIENT MLP & ENERGY INFRASTRUCTURE FUND (Unaudited) |
| |
The third quarter was somewhat of a continuation of the second quarter, with additional acquisitions and divestiture (A&D) announcements from 1) TC Energy, 2) Crestwood & Energy Transfer, 3) Holly Energy Partners and 4) Enbridge. Some announcements were met with investor skepticism while others were viewed favorably.
| 1) | In late July, TC Energy Corp (TRP) sold a 40% stake in its Columbia Gas System for CAD $5.2 billion to fund its capital program, but the sale was viewed negatively by investors who expected a higher valuation multiple, causing the stock to fall about 7% over the next two days. About a week later, the company then announced plans to spin off its liquids business into a separate company by mid-2024, which investors again viewed skeptically as an inability to sell the assets, and the stock once again sold off 7% to 8% over the subsequent two days. |
| 2) | A mere two weeks after the TRP news, Energy Transfer LP (ET) announced an all-equity, no premium acquisition of Crestwood Equity Partners on August 16. This transaction was viewed positively by investors, as it showed ET’s management being disciplined and not overpaying, sending ET’s stock up almost 12% by the end of the quarter. ET was one of the Fund’s largest holdings throughout the year, and we continue to have confidence that ET management can continue to deliver value to shareholders as we look forward into 2024 and beyond. |
| 3) | Also on August 16, Holly Energy Partners (HEP) agreed to be acquired by parent company HF Sinclair in a taxable corporate simplification transaction. The Fund did not have a position in HEP at that time. |
| 4) | Finally, in the largest transaction of the quarter, Enbridge (ENB) announced on September 5 it would acquire three gas utilities from Dominion Energy for CAD $19 billion, expanding ENB’s utility franchise but issuing discounted shares and seeing its stock price stagnate around the offering price through quarter-end. The Fund increased its holdings in ENB during the quarter to take advantage of the decline in stock price. |
Finally, in October, we were once again reminded about the importance of energy security as the world witnessed the unspeakable acts of terrorism upon Israel by Hamas. We have already seen a significant humanitarian and geopolitical impact in the region, and it does not seem that there will be a quick resolution. We are not experts on Middle East politics, so we won’t comment on the potential long-term implications to others, but many have asked about the near-term ramifications for oil and natural gas. Natural gas production in the region is much more impacted than crude oil. There is a large natural gas basin, the Levant, in the eastern Mediterranean Sea off the coast of Israel with two meaningful zones, Tamar and Leviathan, both of which are operated by Chevron. Following the attack, Israel ordered Chevron to shut down the Tamar field, which is only about 12 miles from the Gaza Strip. This field produces roughly 1 billion cubic feet per day (Bcf/d), which is not very meaningful in the context of about 400 Bcf/d of global production. Some European markets did see price spikes in the immediate aftermath of the production halt, but natural gas prices are lower today than they were in September. Israel produces a very small amount of crude oil (~5,000 bpd), so there is not an apparent threat to global oil supply demand balances. However, if this ongoing war turns into a regional conflict that pulls in Iran, oil supply could be severely impacted.
The MLP and Energy Infrastructure Fund (SMLPX) returned 13.97% for the trailing year ending December 31, 2023. The Fund was about 1.82% below the benchmark return of 15.79%. For the period, negative attribution was driven by the Fund’s overweight to the renewables, which generated a negative 317 bps of attribution for the portfolio. The negative performance from renewables was somewhat offset by the Fund’s overweight to Gathering & Processing and LNG, and underweight to Natural Gas Pipelines. Positive attribution was 143 bps, 87 bps and 99 bps from each of those sectors, respectively.
Focusing on individual securities, the largest positive attributor was the Fund’s overweight in Equitrans Midstream (ETRN), which delivered 79 bps of positive attribution to the portfolio. ETRN is the owner of the MVP pipeline, and the stock was up 65% for the year as investors became more confident that the project would be completed.
| WESTWOOD SALIENT MLP & ENERGY INFRASTRUCTURE FUND (Unaudited) |
| |
Additionally, the Fund’s underweight to TC Energy (TRP) also generated positive attribution of 65 basis points (bps) for the portfolio. We believe that high leverage and negative free cashflow generation were the main drivers of underperformance for the company during 2023.
Performance detractors during the year were the Fund’s overweight allocation to SolarEdge and Enphase, both renewable solar companies. The solar industry experienced a significant slowdown in 2023 as higher interest rates made the funding of solar projects meaningfully more expensive and difficult. SolarEdge detracted 133 bps, and Enphase detracted 81 bps to the portfolio. While we’re disappointed by the performance of the Fund’s energy allocation in general, we continue to believe that the secular opportunities in renewable energy will remain robust in the years ahead.
As we look forward to 2024 and beyond, we remain constructive on the energy infrastructure industry as the industry remains capital disciplined, focused on shareholder returns and positioned for future oil and gas volume growth. The industry today is generating ~6% in dividend yields, growing dividends at about 5% per year and repurchasing about 1% of outstanding stock on an annual basis. We believe these metrics will allow for healthy compounded value creation in the coming years.
Disclosures
To determine if a Fund is an appropriate investment for you, carefully consider the Fund’s investment objectives, risk factors, charges and expenses before investing. This and other information can be found in the Fund’s prospectus, which may be obtained by calling 1.877.386.3944. Read the prospectus carefully before investing or sending money.
Past performance is not predictive of future performance. Investment results and principal value will fluctuate so that shares, when redeemed, may be worth more or less than their original cost. Current performance may be higher or lower than the performance data quoted. Performance data current to the most recent month end are available by calling 1.877.386.3944.
An investor should consider the investment objectives, risks, charges and expenses of the Fund carefully before investing. The Fund’s prospectus contains this and other important information. To obtain a copy of the Fund’s prospectus, visit the Fund’s website at westwoodfunds.com or call 1.877.386.3944, and a copy will be sent to you free of charge. Please read the prospectus carefully before you invest. The Fund is distributed by Ultimus Fund Distributors, LLC.
The Letter to Shareholders seeks to describe some of the Adviser’s current opinions and views of the financial markets. Although the Adviser believes it has a reasonable basis for any opinions or views expressed, actual results may differ, sometimes significantly so, from those expected or expressed. The securities held by the Fund that are discussed in the Letter to Shareholders were held during the period covered by this Report. They do not comprise the entire investment portfolios of the Fund, may be sold at any time, and may no longer be held by the Fund. For a complete list of securities held by the Fund as of December 31, 2023, please see the Schedules of Investments section of this Report. The opinions of the Fund’s adviser with respect to those securities may change at any time.
Statements in the Letter to Shareholders that reflect projections or expectations for future financial or economic performance of the Fund and the market in general and statements of the Fund’s plans and objectives for future operations are forward-looking statements. No assurance can be given that actual results or events will not differ materially from those projected, estimated, assumed, or anticipated in any such forward-looking statements. Important factors that could result in such differences, in addition to factors noted with such forward-looking statements include, without limitation, general economic conditions, such as inflation, recession, and interest rates. Past performance is not a guarantee of future results.
| WESTWOOD SALIENT MLP & ENERGY INFRASTRUCTURE FUND (Unaudited) |
| |
Alerian Midstream Energy Select Index (AMEIX) is a composite of North American midstream energy infrastructure companies that are engaged in activities involving energy commodities. The capped, float-adjusted, capitalization-weighted index is disseminated in real time on a price-return basis.
Alpha is the measure of risk-adjusted performance.
Compound Annual Growth Rate is the rate of return that would be required for an investment to grow from its beginning balance to its ending balance, assuming the profits are reinvested at the end of each year of the investment’s lifespan.
FTSE EPRA Nareit Developed Index is designed to track the performance of listed real estate companies and REITs worldwide.
HFRX Equity Hedge Index comprises private funds with strategies that maintain both long and short positions primarily in equity securities and equity derivatives.
ICE BofA Fixed Rate Preferred Securities Index consists of investment-grade, fixed and fixed-to-floating rate U.S. dollar-denominated preferred securities.
MSCI World Index is a free float-adjusted market capitalization index designed to measure equity market performance in the global developed markets.
Russell 2500 Value measures the performance of the small to mid-cap value segment of the U.S. equity universe. It includes those Russell 2500 companies with lower price-to-book ratio and lower forecasted growth values.
S&P 500 Index is an unmanaged capitalization-weighted index of 500 stocks designed to measure the performance of the broad domestic stock market through changes in the aggregate market value of 500 stocks representing all major industries.
| WESTWOOD SALIENT MLP & ENERGY INFRASTRUCTURE FUND (Unaudited) |
| |
Comparison of the Change in Value of a $100,000 Investment in Westwood Salient MLP & Energy
Infrastructure Fund - Institutional Shares (a) versus the Alerian Midstream Energy Select Index
Average Annual Total Returns (b)
(for the years ended December 31, 2023) |
| | | | | Since Inception |
| | 1 Year | 5 Year | 10 Year | (1/4/2016) |
| Institutional Shares | 13.97% | 9.78% | 0.52% | N/A |
| A Class Shares with sales charge | 10.29% | 8.32% | -0.26% | N/A |
| A Class Shares without sales charge | 13.75% | 9.55% | 0.31% | N/A |
| C Class Shares with CDSC | 12.12% | 8.73% | -0.46% | N/A |
| C Class Shares without CDSC | 13.12% | 8.73% | -0.46% | N/A |
| Ultra Shares | 14.22% | 9.90% | N/A | 7.10% |
| Alerian Midstream Energy Select Index | 15.79% | 12.71% | 4.49% | 10.07% |
| (a) | The graph is based on Institutional Shares. Performance for A Class Shares would have been lower because it is subject to a maximum front-end sales charge of 4.00% (effective December 29, 2023; prior to December 29, 2023 the maximum front-end sales charge was 3.00%) and additional annual distribution expenses of 0.25%. Performance for C Class Shares and Ultra Shares would vary due to differences in fee structures. |
| (b) | The Fund’s total returns do not reflect the deduction of taxes a shareholder would pay on Fund distributions or the redemption of Fund shares. If the Adviser had not limited certain expenses, the Fund’s total return would have been lower. |
The performance data quoted herein represents past performance and the return and value of an investment in the Fund will fluctuate so that, when redeemed, may be worth less than its original cost. Past performance is no guarantee of future performance and should not be considered as a representation of the future results of the Fund. There are no assurances that the Fund will meet its stated objectives. The Fund’s holdings and allocations are subject to change because it is actively managed and should not be considered recommendations to buy individual securities. The Fund’s performance assumes the reinvestment of all dividends and all capital gains. Index returns assume reinvestment of dividends and, unlike the Fund’s returns, do not reflect any fees or expenses. If such fees and expenses were included in the index returns, the performance would have been lower. Please note that one cannot invest directly in an unmanaged index.
| WESTWOOD SALIENT MLP & ENERGY INFRASTRUCTURE FUND |
| DECEMBER 31, 2023 |
| |
| Sector Weightings (Unaudited)† |
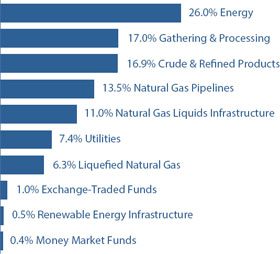
| † | Percentages are based on total investments. |
| SCHEDULE OF INVESTMENTS |
| MASTER LIMITED PARTNERSHIPS — 35.0% (a) |
| | | Shares | | | Value | |
| Crude & Refined Products — 13.2% | | | | | | | | |
| Genesis Energy, L.P. | | | 2,292,518 | | | $ | 26,547,358 | |
| MPLX, L.P. | | | 864,230 | | | | 31,734,526 | |
| Plains GP Holdings, L.P. - Class A (b) | | | 3,727,101 | | | | 59,447,261 | |
| | | | | | | | 117,729,145 | |
| Energy — 11.7% | | | | | | | | |
| EMG Utica I Offshore Co-Investment, L.P. *(c)(d)(e) | | | 16,000,000 | | | | 15,345,343 | |
| Energy Transfer, L.P. | | | 6,308,506 | | | | 87,057,383 | |
| Kimbell Royalty Partners, L.P. (b) | | | 148,200 | | | | 2,230,410 | |
| | | | | | | | 104,633,136 | |
| Gathering & Processing — 4.2% | | | | | | | | |
| Hess Midstream, L.P. - Class A | | | 613,016 | | | | 19,389,696 | |
| Western Midstream Partners, L.P. | | | 634,258 | | | | 18,558,389 | |
| | | | | | | | 37,948,085 | |
| Utilities — 5.9% | | | | | | | | |
| Enterprise Products Partners, L.P. | | | 1,631,707 | | | | 42,995,480 | |
| NextEra Energy Partners, L.P. | | | 302,569 | | | | 9,201,123 | |
| | | | | | | | 52,196,603 | |
| | | | | | | | | |
| Total Master Limited Partnerships | | | | | | | | |
| (Cost $218,242,420) | | | | | | $ | 312,506,969 | |
| | | | | | | | | |
| MLP RELATED COMPANIES — 63.6% | | | | | | | | |
| Crude & Refined Products — 3.7% | | | | | | | | |
| Enbridge, Inc. | | | 260,935 | | | | 9,398,879 | |
| Gibson Energy, Inc. | | | 1,542,531 | | | | 23,435,360 | |
| | | | | | | | 32,834,239 | |
| MLP RELATED COMPANIES — continued |
| | | Shares | | | Value | |
| Energy — 14.3% | | | | | | | | |
| Antero Resources Corporation (b) | | | 249,099 | | | $ | 5,649,565 | |
| Array Technologies, Inc. (b) | | | 235,703 | | | | 3,959,810 | |
| Atlantica Sustainable Infrastructure plc | | | 420,685 | | | | 9,044,728 | |
| Diamondback Energy, Inc. | | | 58,281 | | | | 9,038,217 | |
| DT Midstream, Inc. | | | 421,628 | | | | 23,105,214 | |
| Enphase Energy, Inc. (b) | | | 39,306 | | | | 5,193,895 | |
| EOG Resources, Inc. | | | 74,083 | | | | 8,960,339 | |
| Hess Corporation (f) | | | 63,505 | | | | 9,154,881 | |
| Kinetik Holdings, Inc. | | | 692,261 | | | | 23,121,517 | |
| NextDecade Corporation (b) | | | 382,930 | | | | 1,826,576 | |
| Pembina Pipeline Corporation | | | 623,456 | | | | 21,459,356 | |
| Shoals Technologies Group, Inc. - Class A (b) | | | 288,745 | | | | 4,487,097 | |
| Viper Energy, Inc. (b) | | | 72,161 | | | | 2,264,412 | |
| | | | | | | | 127,265,607 | |
| Gathering & Processing — 12.7% | | | | | | | | |
| Antero Midstream Corporation | | | 1,815,225 | | | | 22,744,769 | |
| EnLink Midstream, LLC (b) | | | 1,397,949 | | | | 16,999,060 | |
| Targa Resources Corporation | | | 852,426 | | | | 74,050,247 | |
| | | | | | | | 113,794,076 | |
| Liquefied Natural Gas — 6.3% | | | | | | | | |
| Cheniere Energy, Inc. | | | 328,900 | | | | 56,146,519 | |
| | | | | | | | | |
| Natural Gas Liquids Infrastructure — 11.0% | | | | | | | | |
| Keyera Corporation | | | 620,796 | | | | 15,007,205 | |
| ONEOK, Inc. | | | 888,355 | | | | 62,380,287 | |
| Pembina Pipeline Corporation | | | 602,429 | | | | 20,742,214 | |
| | | | | | | | 98,129,706 | |
| Natural Gas Pipelines — 13.5% | | | | | | | | |
| Equitrans Midstream Corporation | | | 4,051,080 | | | | 41,239,994 | |
| Kinder Morgan, Inc. (f) | | | 1,283,930 | | | | 21,343,694 | |
| TC Energy Corporation | | | 129,214 | | | | 5,050,975 | |
| Williams Companies, Inc. (The) | | | 1,530,750 | | | | 53,316,023 | |
| | | | | | | | 120,950,686 | |
| Renewable Energy Infrastructure — 0.6% | | | | | | | | |
| First Solar, Inc. (b) | | | 29,052 | | | | 5,005,079 | |
| | | | | | | | | |
| Utilities — 1.5% | | | | | | | | |
| Clearway Energy, Inc. - Class C | | | 335,248 | | | | 9,195,853 | |
| Fluence Energy, Inc. - Class A (b) | | | 184,185 | | | | 4,392,812 | |
| | | | | | | | 13,588,665 | |
| | | | | | | | | |
| Total MLP Related Companies | | | | | | | | |
| (Cost $385,176,612) | | | | | | $ | 567,714,577 | |
The accompanying notes are an integral part of the financial statements.
| WESTWOOD SALIENT MLP & ENERGY INFRASTRUCTURE FUND |
| DECEMBER 31, 2023 |
| |
| SPECIAL PURPOSE ACQUISITION COMPANIES — 0.0% (g) |
| | | Shares | | | Value | |
| Renewable Energy Infrastructure — 0.0% (g) | | | | | | | | |
TortoiseEcofin Acquisition Corporation III - Founder Shares (b)(c)(d)(e)
(Cost $315) | | | 104,850 | | | $ | 315 | |
| | | | | | | | | |
| EXCHANGE-TRADED FUNDS — 1.0% | | | | | | | | |
SPDR S&P Oil & Gas Exploration & Production ETF (b)
(Cost $8,851,354) | | | 64,070 | | | $ | 8,771,824 | |
| | | | | | | | | |
| MONEY MARKET FUNDS — 0.4% | | | | | | | | |
First American Government Obligations Fund - Class U, 5.23% (h)
(Cost $3,598,808) | | | 3,598,808 | | | $ | 3,598,808 | |
| | | | | | | | | |
| Investments at Value — 100.0% | | | | | | | | |
| (Cost $615,869,509) | | | | | | $ | 892,592,493 | |
| | | | | | | | | |
| Liabilities in Excess of Other Assets— (0.0%) (g) | | | | | | | (354,401 | ) |
| | | | | | | | | |
| Net Assets — 100.0% | | | | | | $ | 892,238,092 | |
plc - Public Limited Company
| * | EMG Utica I Offshore Co-Investment, L.P. is a Co-Investment of MarkWest Utica EMG, LLC. |
| (a) | The security is considered a non-income producing security as any distributions received during the last 12 months (if applicable) are treated as return of capital per Generally Accepted Accounting Principles. |
| (b) | Non-income producing security. |
| (c) | These securities are exempt from registration under the Securities Act of 1933 and are subject to legal restrictions on resale. These securities generally may be resold in transactions exempt from registration, normally to qualified institutional buyers, or to the public if the securities are subsequently registered. |
| (d) | Security determined to be illiquid under the procedures approved by the Fund’s Board of Trustees and represents 1.7% of net assets. |
| (e) | Level 3 security in accordance with fair value hierarchy. |
| (f) | All or a portion of the security covers a written call option. |
| (g) | Percentage rounds to less than 0.1%. |
| (h) | The rate shown is the 7-day effective yield as of December 31, 2023. |
The accompanying notes are an integral part of the financial statements.
| WESTWOOD SALIENT MLP & ENERGY INFRASTRUCTURE FUND |
| DECEMBER 31, 2023 |
| |
| SCHEDULE OF OPEN WRITTEN OPTION CONTRACTS |
| WRITTEN OPTION CONTRACTS |
| | | | | | | | | | | | Value of | |
| | | Strike Price | | | Contracts | | | Notional Value | | | Options | |
| Call Option Contracts | | | | | | | | | | | | | | | | |
| Hess Midstream, L.P., 01/19/24 | | $ | 32.00 | | | | 1,727 | | | $ | 5,462,501 | | | $ | 77,715 | |
| Kinder Morgan, Inc., 01/19/24 | | | 18.00 | | | | 11,854 | | | | 20,910,456 | | | | 177,810 | |
| Total Written Option Contracts | | | | | | | | | | | | | | | | |
| (Premiums $334,585) | | | | | | | | | | $ | 26,372,957 | | | $ | 255,525 | |
The average monthly notional value of written option contracts during the year ended December 31, 2023 was $155,836,026.
The accompanying notes are an integral part of the financial statements.
| WESTWOOD SALIENT MLP & ENERGY INFRASTRUCTURE FUND |
| DECEMBER 31, 2023 |
| |
| |
| STATEMENT OF ASSETS AND LIABILITIES |
| ASSETS | | | |
| Investments in securities: | | | | |
| At cost | | $ | 615,869,509 | |
| At value (Note 2) | | $ | 892,592,493 | |
| Cash | | | 260,358 | |
| Receivable for capital shares sold | | | 610,608 | |
| Receivable for investment securities sold | | | 1,739,687 | |
| Dividends and interest receivable | | | 966,994 | |
| Other assets | | | 293,953 | |
| Total assets | | | 896,464,093 | |
| LIABILITIES | | | | |
| Written call options, at value (Notes 1 & 4) (premiums received $334,585) | | | 255,525 | |
| Payable for capital shares redeemed | | | 310,873 | |
| Payable for investment securities purchased | | | 2,673,344 | |
| Payable to Adviser, net of waivers (Note 4) | | | 371,212 | |
| Payable to administrator (Note 4) | | | 32,594 | |
| Payable for tax expense (Note 2) | | | 300,000 | |
| Accrued administrative servicing fees — Institutional Shares (Note 4) | | | 122,149 | |
| Accrued administrative servicing fees — A Class Shares | | | 24,921 | |
| Accrued administrative servicing fees — C Class Shares | | | 2,762 | |
| Payable for distribution fees — A Class Shares (Note 4) | | | 62,219 | |
| Payable for distribution fees — C Class Shares (Note 4) | | | 33,776 | |
| Other accrued expenses | | | 36,626 | |
| Total liabilities | | | 4,226,001 | |
| | | | | |
| NET ASSETS | | $ | 892,238,092 | |
| NET ASSETS CONSIST OF: | | | | |
| Paid-in capital | | $ | 1,291,939,527 | |
| Accumulated deficit | | | (399,701,435 | ) |
| NET ASSETS | | $ | 892,238,092 | |
The accompanying notes are an integral part of the financial statements.
| WESTWOOD SALIENT MLP & ENERGY INFRASTRUCTURE FUND |
| DECEMBER 31, 2023 |
| |
| |
| STATEMENT OF ASSETS AND LIABILITIES |
| NET ASSET VALUE PER SHARE: | | | |
| INSTITUTIONAL SHARES | | | | |
| Net assets applicable to Institutional Shares | | $ | 739,541,959 | |
| Institutional Shares of beneficial interest outstanding | | | 94,397,832 | |
| Net asset value, offering price and redemption price per share (Note 1) | | $ | 7.83 | * |
| A CLASS SHARES | | | | |
| Net assets applicable to A Class Shares | | $ | 134,627,428 | |
| A Class Shares of beneficial interest outstanding | | | 17,078,256 | |
| Net asset value and redemption price per share (Note 1) | | $ | 7.88 | * |
| Maximum sales charge | | | 4.00 | % |
| Maximum offering price per share | | $ | 8.21 | * |
| C CLASS SHARES | | | | |
| Net assets applicable to C Class Shares | | $ | 13,741,178 | |
| C Class Shares of beneficial interest outstanding | | | 1,751,583 | |
| Net asset value, offering price and redemption price per share (Note 1) | | $ | 7.85 | |
| ULTRA SHARES | | | | |
| Net assets applicable to Ultra Shares | | $ | 4,327,527 | |
| Ultra Shares of beneficial interest outstanding | | | 552,254 | |
| Net asset value, offering price and redemption price per share (Note 1) | | $ | 7.84 | |
| * | Includes adjustments in accordance with accounting principals generally accepted in the United States and, consequently, the net asset values for financial reporting purposes and the returns based upon those net asset values may differ from the net asset values and returns for shareholder transactions. |
The accompanying notes are an integral part of the financial statements.
| WESTWOOD SALIENT MLP & ENERGY INFRASTRUCTURE FUND |
| FOR THE YEAR ENDED DECEMBER 31, 2023 |
| |
| |
| STATEMENT OF OPERATIONS |
| INVESTMENT INCOME | | | | |
| Distributions from master limited partnerships | | $ | 19,939,537 | |
| Less return of capital on distributions | | | (19,939,537 | ) |
| Dividends from master limited partnership related companies (net of foreign withholding tax of $1,344,029) | | | 31,102,659 | |
| Less return of capital on dividends | | | (9,165,521 | ) |
| Dividend income | | | 457,113 | |
| Interest income | | | 2 | |
| Total investment income | | | 22,394,253 | |
| | | | | |
| EXPENSES | | | | |
| Investment management fees (Note 4) | | | 8,141,323 | |
| Administrative service plan fees - Institutional Shares (Note 4) | | | 641,419 | |
| Administrative service plan fees - A Class Shares (Note 4) | | | 114,007 | |
| Administrative service plan fees - C Class Shares (Note 4) | | | 9,880 | |
| Distribution fees - A Class Shares (Note 4) | | | 347,520 | |
| Distribution fees - C Class Shares (Note 4) | | | 148,807 | |
| Administration fees (Note 4) | | | 353,870 | |
| Tax expense (Note 2) | | | 348,777 | |
| Registration and filing fees | | | 143,950 | |
| Legal fees | | | 100,967 | |
| Trustees’ fees and expenses (Note 4) | | | 71,249 | |
| Audit and tax service fees | | | 59,826 | |
| Insurance expense | | | 41,281 | |
| Custody fees | | | 33,840 | |
| Transfer agent fees (Note 4) | | | 30,590 | |
| Borrowing costs (Note 2) | | | 32,996 | |
| Compliance fees and expenses (Note 4) | | | 17,675 | |
| Other expenses | | | 239,102 | |
| Total expenses | | | 10,877,079 | |
| Tax expense reimbursements by Adviser (Note 2) | | | (332,497 | ) |
| Net expenses | | | 10,544,582 | |
| | | | | |
| NET INVESTMENT INCOME | | | 11,849,671 | |
| | | | | |
| REALIZED AND UNREALIZED GAINS ON INVESTMENTS, FOREIGN CURRENCIES AND OPTIONS | | | | |
| Net realized gains from investment transactions and foreign currency transactions | | | 74,141,222 | |
| Net realized gains from written option contracts (Note 5) | | | 8,691,149 | |
| Net change in unrealized appreciation (depreciation) on investment transactions and foreign currency translations | | | 21,636,278 | |
| Net change in unrealized appreciation (depreciation) on written option contracts | | | 79,060 | |
| NET REALIZED AND UNREALIZED GAINS ON INVESTMENTS, FOREIGN CURRENCIES AND OPTIONS | | | 104,547,709 | |
| | | | | |
| NET INCREASE IN NET ASSETS RESULTING FROM OPERATIONS | | $ | 116,397,380 | |
The accompanying notes are an integral part of the financial statements.
| WESTWOOD SALIENT MLP & ENERGY INFRASTRUCTURE FUND(a) |
| |
| |
| STATEMENTS OF CHANGES IN NET ASSETS |
| | | Year Ended | | | Year Ended | |
| | | December 31, | | | December 31, | |
| | | 2023 | | | 2022 | |
| FROM OPERATIONS | | | | | | | | |
| Net investment income | | $ | 11,849,671 | | | $ | 4,192,893 | |
| Net realized gains on investments, written options, and foreign currency transactions | | | 82,832,371 | | | | 3,431,642 | |
| Net change in unrealized appreciation (depreciation) on investments, written options, and foreign currency translations | | | 21,715,338 | | | | 106,655,035 | |
| Net increase in net assets resulting from operations | | | 116,397,380 | | | | 114,279,570 | |
| DISTRIBUTIONS TO SHAREHOLDERS | | | | | | | | |
| From distributable earnings | | | | | | | | |
| Institutional Shares | | | (27,341,988 | ) | | | — | |
| A Class Shares | | | (4,936,471 | ) | | | — | |
| C Class Shares | | | (460,833 | ) | | | — | |
| Ultra Shares | | | (847,726 | ) | | | — | |
| From return of capital | | | | | | | | |
| Institutional Shares | | | (16,281,710 | ) | | | (32,026,521 | ) |
| A Class Shares | | | (2,957,920 | ) | | | (5,015,402 | ) |
| C Class Shares | | | (277,766 | ) | | | (573,190 | ) |
| Ultra Shares | | | (488,726 | ) | | | (1,453,169 | ) |
| Total distributions | | | (53,593,140 | ) | | | (39,068,282 | ) |
| CAPITAL SHARE TRANSACTIONS | | | | | | | | |
| Institutional Shares | | | | | | | | |
| Issued | | | 119,568,014 | | | | 326,083,981 | |
| Reinvestment of dividends | | | 38,786,838 | | | | 28,139,077 | |
| Redeemed | | | (250,245,155 | ) | | | (207,307,366 | ) |
| Net increase (decrease) from Institutional Shares capital share transactions | | | (91,890,303 | ) | | | 146,915,692 | |
| A Class Shares | | | | | | | | |
| Issued | | | 7,283,399 | | | | 27,097,263 | |
| Proceeds from shares issued in connection with acquisition from Plan of Reorganization (Note 8) | | | — | | | | 161,677,813 | |
| Reinvestment of dividends | | | 7,558,882 | | | | 4,811,951 | |
| Redeemed | | | (40,811,580 | ) | | | (137,702,835 | ) |
| Net increase (decrease) from A Class Shares capital share transactions | | | (25,969,299 | ) | | | 55,884,192 | |
| C Class Shares | | | | | | | | |
| Issued | | | 361,392 | | | | 1,630,960 | |
| Reinvestment of dividends | | | 726,366 | | | | 564,938 | |
| Redeemed | | | (4,082,510 | ) | | | (6,447,136 | ) |
| Net decrease from C Class Shares capital share transactions | | | (2,994,752 | ) | | | (4,251,238 | ) |
| Ultra Shares | | | | | | | | |
| Issued | | | 53,597 | | | | 1,425,412 | |
| Reinvestment of dividends | | | 595,134 | | | | 572,600 | |
| Redeemed | | | (27,961,154 | ) | | | (4,533,909 | ) |
| Net decrease from Ultra Shares capital share transactions | | | (27,312,423 | ) | | | (2,535,897 | ) |
| Net increase (decrease) in net assets from capital share transactions | | | (148,166,777 | ) | | | 196,012,749 | |
| TOTAL INCREASE (DECREASE) IN NET ASSETS | | | (85,362,537 | ) | | | 271,224,037 | |
| | | | | | | | | |
| NET ASSETS | | | | | | | | |
| Beginning of year | | | 977,600,629 | | | | 706,376,592 | |
| End of year | | $ | 892,238,092 | | | $ | 977,600,629 | |
Amounts designated as “—” are either $0 or have been rounded to $0.
| (a) | Prior to November 18, 2022, Westwood Salient MLP & Energy Infrastructure Fund was known as Salient MLP & Energy Infrastructure Fund. |
The accompanying notes are an integral part of the financial statements.
| WESTWOOD SALIENT MLP & ENERGY INFRASTRUCTURE FUND(a) |
| |
| |
| STATEMENTS OF CHANGES IN NET ASSETS |
| | | Year Ended | | | Year Ended | |
| | | December 31, | | | December 31, | |
| | | 2023 | | | 2022 | |
| CAPITAL SHARES ACTIVITY | | | | | | | | |
| Institutional Shares | | | | | | | | |
| Sold | | | 15,987,827 | | | | 44,603,290 | |
| Issued in reinvestment of dividends to shareholders | | | 5,260,813 | | | | 3,777,997 | |
| Redeemed | | | (33,706,817 | ) | | | (28,712,439 | ) |
| Net increase (decrease) in shares outstanding | | | (12,458,177 | ) | | | 19,668,848 | |
| Shares outstanding at beginning of year | | | 106,856,009 | | | | 87,187,161 | |
| Shares outstanding at end of year | | | 94,397,832 | | | | 106,856,009 | |
| | | | | | | | | |
| A Class Shares | | | | | | | | |
| Sold | | | 967,455 | | | | 3,635,503 | |
| Proceeds from shares issued in connection with acquisition from Plan of Reorganization (Note 8) | | | — | | | | 21,251,027 | |
| Issued in reinvestment of dividends to shareholders | | | 1,018,471 | | | | 641,659 | |
| Redeemed | | | (5,538,192 | ) | | | (18,980,423 | ) |
| Net increase (decrease) in shares outstanding | | | (3,552,266 | ) | | | 6,547,766 | |
| Shares outstanding at beginning of year | | | 20,630,522 | | | | 14,082,756 | |
| Shares outstanding at end of year | | | 17,078,256 | | | | 20,630,522 | |
| | | | | | | | | |
| C Class Shares | | | | | | | | |
| Sold | | | 47,319 | | | | 225,461 | |
| Issued in reinvestment of dividends to shareholders | | | 98,343 | | | | 76,445 | |
| Redeemed | | | (543,165 | ) | | | (878,720 | ) |
| Net decrease in shares outstanding | | | (397,503 | ) | | | (576,814 | ) |
| Shares outstanding at beginning of year | | | 2,149,086 | | | | 2,725,900 | |
| Shares outstanding at end of year | | | 1,751,583 | | | | 2,149,086 | |
| | | | | | | | | |
| Ultra Shares | | | | | | | | |
| Sold | | | 7,111 | | | | 199,506 | |
| Issued in reinvestment of dividends to shareholders | | | 80,958 | | | | 77,005 | |
| Redeemed | | | (3,741,953 | ) | | | (627,149 | ) |
| Net decrease in shares outstanding | | | (3,653,884 | ) | | | (350,638 | ) |
| Shares outstanding at beginning of year | | | 4,206,138 | | | | 4,556,776 | |
| Shares outstanding at end of year | | | 552,254 | | | | 4,206,138 | |
Amounts designated as “—” are $0 or rounded to $0.
| (a) | Prior to November 18, 2022, Westwood Salient MLP & Energy Infrastructure Fund was known as Salient MLP & Energy Infrastructure Fund. |
The accompanying notes are an integral part of the financial statements.
| WESTWOOD SALIENT MLP & ENERGY INFRASTRUCTURE FUND(1) |
| |
| |
| FINANCIAL HIGHLIGHTS |
SELECTED PER SHARE DATA & RATIOS FOR A SHARE OUTSTANDING THROUGHOUT EACH YEAR
| | | Year Ended | | | Year Ended | | | Year Ended | | | Year Ended | | | Year Ended | |
| Institutional Shares (2) | | December 31, 2023* | | | December 31, 2022 | | | December 31, 2021 | | | December 31, 2020 | | | December 31, 2019 | |
| Net asset value at beginning of year | | $ | 7.30 | | | $ | 6.50 | | | $ | 5.50 | | | $ | 7.05 | | | $ | 6.34 | |
| Net investment income (loss) (a) | | | 0.10 | | | | 0.04 | | | | (0.02 | ) | | | 0.08 | | | | 0.04 | |
| Net realized and unrealized gains (losses) on investments | | | 0.88 | | | | 1.08 | | | | 1.34 | | | | (1.31 | ) | | | 0.99 | |
| Total from investment operations | | | 0.98 | | | | 1.12 | | | | 1.32 | | | | (1.23 | ) | | | 1.03 | |
| Less distributions from: | | | | | | | | | | | | | | | | | | | | |
| Net investment income | | | (0.28 | ) | | | — | | | | — | | | | — | | | | (0.18 | ) |
| Return of capital | | | (0.17 | ) | | | (0.32 | ) | | | (0.32 | ) | | | (0.32 | ) | | | (0.14 | ) |
| Total distributions | | | (0.45 | ) | | | (0.32 | ) | | | (0.32 | ) | | | (0.32 | ) | | | (0.32 | ) |
| Tax expense reimbursements by Adviser (Note 2) | | | — | (3) | | | — | | | | — | | | | — | | | | — | |
| Net asset value at end of year | | $ | 7.83 | | | $ | 7.30 | | | $ | 6.50 | | | $ | 5.50 | | | $ | 7.05 | |
| Total return (b) | | | 13.97 | % | | | 17.22 | % | | | 24.11 | % | | | (17.32 | )% | | | 16.33 | % |
| Net assets at end of year (in 000s) | | $ | 739,542 | | | $ | 779,843 | | | $ | 566,980 | | | $ | 393,743 | | | $ | 617,790 | |
| Ratio of total net expenses to average net assets (including tax expense/benefit) (c) | | | 1.11 | % | | | 1.35 | % (d) | | | 1.29 | % | | | 1.30 | % | | | 1.26 | % |
| Ratio of total net expenses to average net assets (excluding tax expense/benefit) (c) | | | 1.11 | % | | | 1.35 | % (d) | | | 1.29 | % | | | 1.30 | % | | | 1.24 | % |
| Ratio of total gross expenses to average net assets (including tax expense/benefit) | | | 1.15 | % | | | 1.35 | % | | | 1.27 | % | | | 1.33 | % | | | 1.24 | % |
| Ratio of net investment income (loss) to average net assets (c) | | | 1.36 | % | | | 0.52 | % | | | (0.27 | )% | | | 1.55 | % | | | 0.50 | % |
| Portfolio turnover rate (e) | | | 91 | % | | | 86 | % | | | 248 | % | | | 260 | % | | | 66 | % |
Amounts designated as “—” are either $0.00 or have been rounded to $0.00.
| (a) | Per share net income (loss) has been determined on the basis of average number of shares outstanding during the period. |
| (b) | Total return is a measure of the change in value of an investment in the Fund over the period covered. The returns shown do not reflect the deduction of taxes a shareholder would pay on Fund distributions, if any or the redemption of Fund shares. The total returns would be lower if the Adviser had not reduced investment management fees and/or reimbursed expenses for the year ended December 31, 2020 (Note 4). |
| (c) | Ratio was determined after investment management fee reductions and/or reimbursed expenses for the year ended December 31, 2020 (Note 4). |
| (d) | Net expense ratio exceeded the expense limitation during the year ended December 31, 2022 due to reorganization expenses (Note 8). |
| (e) | Portfolio turnover rate is calculated on the basis of the Fund as a whole without distinguishing between classes of shares issued. |
| (1) | Prior to November 18, 2022, Westwood Salient MLP & Energy Infrastructure Fund was known as Salient MLP & Energy Infrastructure Fund. |
| (2) | Prior to November 18, 2022, Institutional Shares were I Share Class. |
| (3) | The Adviser reimbursed the Fund $332,497 for losses incurred from tax expenses for the year ended December 31, 2023 the net impact to the Fund was less than $0.005 per share. |
| * | Includes adjustments in accordance with accounting principals generally accepted in the United States and, consequently, the net asset values for financial reporting purposes and the returns based upon those net asset values may differ from the net asset values and returns for shareholder transactions. |
The accompanying notes are an integral part of the financial statements.
| WESTWOOD SALIENT MLP & ENERGY INFRASTRUCTURE FUND(1) |
| |
| |
| FINANCIAL HIGHLIGHTS |
SELECTED PER SHARE DATA & RATIOS FOR A SHARE OUTSTANDING THROUGHOUT EACH YEAR
| | | Year Ended | | | Year Ended | | | Year Ended | | | Year Ended | | | Year Ended | |
| A Class Shares | | December 31, 2023* | | | December 31, 2022 | | | December 31, 2021 | | | December 31, 2020 | | | December 31, 2019 | |
| Net asset value at beginning of year | | $ | 7.34 | | | $ | 6.53 | | | $ | 5.53 | | | $ | 7.07 | | | $ | 6.36 | |
| Net investment income (loss) (a) | | | 0.08 | | | | 0.02 | | | | (0.03 | ) | | | 0.07 | | | | 0.02 | |
| Net realized and unrealized gains (losses) on investments | | | 0.89 | | | | 1.09 | | | | 1.34 | | | | (1.31 | ) | | | 1.00 | |
| Total from investment operations | | | 0.97 | | | | 1.11 | | | | 1.31 | | | | (1.24 | ) | | | 1.02 | |
| Less distributions from: | | | | | | | | | | | | | | | | | | | | |
| Net investment income | | | (0.27 | ) | | | — | | | | — | | | | — | | | | (0.17 | ) |
| Return of capital | | | (0.16 | ) | | | (0.30 | ) | | | (0.31 | ) | | | (0.30 | ) | | | (0.14 | ) |
| Total distributions | | | (0.43 | ) | | | (0.30 | ) | | | (0.31 | ) | | | (0.30 | ) | | | (0.31 | ) |
| Tax expense reimbursements by Adviser (Note 2) | | | — | (2) | | | — | | | | — | | | | — | | | | — | |
| Net asset value at end of year | | $ | 7.88 | | | $ | 7.34 | | | $ | 6.53 | | | $ | 5.53 | | | $ | 7.07 | |
| Total return (b) | | | 13.75 | % | | | 17.00 | % | | | 23.74 | % | | | (17.43 | )% | | | 16.03 | % |
| Net assets at end of year (in 000s) | | $ | 134,627 | | | $ | 151,353 | | | $ | 92,027 | | | $ | 63,681 | | | $ | 110,549 | |
| Ratio of total net expenses to average net assets (including tax expense/benefit) (c) | | | 1.36 | % | | | 1.61 | % (d) | | | 1.50 | % | | | 1.55 | % | | | 1.47 | % |
| Ratio of total net expenses to average net assets (excluding tax expense/benefit) (c) | | | 1.36 | % | | | 1.61 | % (d) | | | 1.50 | % | | | 1.55 | % | | | 1.49 | % |
| Ratio of total gross expenses to average net assets (including tax expense/benefit) | | | 1.40 | % | | | 1.61 | % | | | 1.50 | % | | | 1.56 | % | | | 1.47 | % |
| Ratio of net investment income (loss) to average net assets (c) | | | 1.12 | % | | | 0.23 | % | | | (0.42 | )% | | | 1.29 | % | | | 0.24 | % |
| Portfolio turnover rate (e) | | | 91 | % | | | 86 | % | | | 248 | % | | | 260 | % | | | 66 | % |
Amounts designated as “—” are either $0.00 or have been rounded to $0.00.
| (a) | Per share net income (loss) has been determined on the basis of average number of shares outstanding during the period. |
| (b) | Total return is a measure of the change in value of an investment in the Fund over the period covered. The returns shown do not reflect the deduction of taxes a shareholder would pay on Fund distributions, if any or the redemption of Fund shares. The total returns would be lower if the Adviser had not reduced investment management fees and/or reimbursed expenses for the year ended December 31, 2020 (Note 4). |
| (c) | Ratio was determined after investment management fee reductions and/or reimbursed expenses for the year ended December 31, 2020 (Note 4). |
| (d) | Net expense ratio exceeded the expense limitation during the year ended December 31, 2022 due to reorganization expenses (Note 8). |
| (e) | Portfolio turnover rate is calculated on the basis of the Fund as a whole without distinguishing between classes of shares issued. |
| (1) | Prior to November 18, 2022, Westwood Salient MLP & Energy Infrastructure Fund was known as Salient MLP & Energy Infrastructure Fund. |
| (2) | The Adviser reimbursed the Fund $332,497 for losses incurred from tax expenses for the year ended December 31, 2023 the net impact to the Fund was less than $0.005 per share. |
| * | Includes adjustments in accordance with accounting principals generally accepted in the United States and, consequently, the net asset values for financial reporting purposes and the returns based upon those net asset values may differ from the net asset values and returns for shareholder transactions. |
The accompanying notes are an integral part of the financial statements.
| WESTWOOD SALIENT MLP & ENERGY INFRASTRUCTURE FUND(1) |
| |
| |
| FINANCIAL HIGHLIGHTS |
SELECTED PER SHARE DATA & RATIOS FOR A SHARE OUTSTANDING THROUGHOUT EACH YEAR
| | | Year Ended | | | Year Ended | | | Year Ended | | | Year Ended | | | Year Ended | |
| C Class Shares | | December 31, 2023 | | | December 31, 2022 | | | December 31, 2021 | | | December 31, 2020 | | | December 31, 2019 | |
| Net asset value at beginning of year | | $ | 7.30 | | | $ | 6.50 | | | $ | 5.50 | | | $ | 7.02 | | | $ | 6.32 | |
| Net investment income (loss) (a) | | | 0.03 | | | | (0.03 | ) | | | (0.08 | ) | | | 0.03 | | | | (0.03 | ) (b) |
| Net realized and unrealized gains (losses) on investments | | | 0.90 | | | | 1.07 | | | | 1.34 | | | | (1.31 | ) | | | 0.98 | |
| Total from investment operations | | | 0.93 | | | | 1.04 | | | | 1.26 | | | | (1.28 | ) | | | 0.95 | |
| Less distributions from: | | | | | | | | | | | | | | | | | | | | |
| Net investment income | | | (0.24 | ) | | | — | | | | — | | | | — | | | | (0.14 | ) |
| Return of capital | | | (0.14 | ) | | | (0.24 | ) | | | (0.26 | ) | | | (0.24 | ) | | | (0.11 | ) |
| Total distributions | | | (0.38 | ) | | | (0.24 | ) | | | (0.26 | ) | | | (0.24 | ) | | | (0.25 | ) |
| Tax expense reimbursements by Adviser (Note 2) | | | — | (2) | | | — | | | | — | | | | — | | | | — | |
| Net asset value at end of year | | $ | 7.85 | | | $ | 7.30 | | | $ | 6.50 | | | $ | 5.50 | | | $ | 7.02 | |
| Total return (c) | | | 13.12 | % | | | 15.98 | % | | | 22.91 | % | | | (18.16 | )% | | | 15.15 | % |
| Net assets at end of year (in 000s) | | $ | 13,741 | | | $ | 15,694 | | | $ | 17,726 | | | $ | 20,468 | | | $ | 37,346 | |
| Ratio of total net expenses to average net assets (including tax expense/benefit) (d) | | | 2.09 | % | | | 2.34 | % (e) | | | 2.29 | % | | | 2.30 | % | | | 2.22 | % |
| Ratio of total net expenses to average net assets (excluding tax expense/benefit) (d) | | | 2.09 | % | | | 2.34 | % (e) | | | 2.29 | % | | | 2.30 | % | | | 2.24 | % |
| Ratio of total gross expenses to average net assets (including tax expense/benefit) | | | 2.13 | % | | | 2.34 | % | | | 2.26 | % | | | 2.32 | % | | | 2.22 | % |
| Ratio of net investment income (loss) to average net assets (d) | | | 0.37 | % | | | (0.47 | )% | | | (1.26 | )% | | | 0.57 | % | | | (0.48 | )% |
| Portfolio turnover rate (f) | | | 91 | % | | | 86 | % | | | 248 | % | | | 260 | % | | | 66 | % |
Amounts designated as “—” are either $0.00 or have been rounded to $0.00.
| (a) | Per share net income (loss) has been determined on the basis of average number of shares outstanding during the period. |
| (b) | The amount shown for a share outstanding throughout the period may not correlate with the Statement of Operations for the period due to the timing of sales and redemptions of Fund shares in relation to income earned and/or fluctuating market value of the investments of the Fund. |
| (c) | Total return is a measure of the change in value of an investment in the Fund over the period covered. The returns shown do not reflect the deduction of taxes a shareholder would pay on Fund distributions, if any or the redemption of Fund shares. The total returns would be lower if the Adviser had not reduced investment management fees and/or reimbursed expenses for the year ended December 31, 2020 (Note 4). |
| (d) | Ratio was determined after investment management fee reductions and/or reimbursed expenses for the year ended December 31, 2020 (Note 4). |
| (e) | Net expense ratio exceeded the expense limitation during the year ended December 31, 2022 due to reorganization expenses (Note 8). |
| (f) | Portfolio turnover rate is calculated on the basis of the Fund as a whole without distinguishing between classes of shares issued. |
| (1) | Prior to November 18, 2022, Westwood Salient MLP & Energy Infrastructure Fund was known as Salient MLP & Energy Infrastructure Fund. |
| (2) | The Adviser reimbursed the Fund $332,497 for losses incurred from tax expenses for the year ended December 31, 2023 the net impact to the Fund was less than $0.005 per share. |
The accompanying notes are an integral part of the financial statements.
| WESTWOOD SALIENT MLP & ENERGY INFRASTRUCTURE FUND(1) |
| |
| |
| FINANCIAL HIGHLIGHTS |
SELECTED PER SHARE DATA & RATIOS FOR A SHARE OUTSTANDING THROUGHOUT EACH YEAR
| | | Year Ended | | | Year Ended | | | Year Ended | | | Year Ended | | | Year Ended | |
| Ultra Shares (2) | | December 31, 2023 | | | December 31, 2022 | | | December 31, 2021 | | | December 31, 2020 | | | December 31, 2019 | |
| Net asset value at beginning of year | | $ | 7.30 | | | $ | 6.51 | | | $ | 5.50 | | | $ | 7.05 | | | $ | 6.34 | |
| Net investment income (loss) (a) | | | 0.11 | | | | 0.04 | | | | (0.01 | ) | | | 0.08 | | | | 0.04 | |
| Net realized and unrealized gains (losses) on investments | | | 0.89 | | | | 1.08 | | | | 1.35 | | | | (1.31 | ) | | | 0.99 | |
| Total from investment operations | | | 1.00 | | | | 1.12 | | | | 1.34 | | | | (1.23 | ) | | | 1.03 | |
| Less distributions from: | | | | | | | | | | | | | | | | | | | | |
| Net investment income | | | (0.29 | ) | | | — | | | | — | | | | — | | | | (0.18 | ) |
| Return of capital | | | (0.17 | ) | | | (0.33 | ) | | | (0.33 | ) | | | (0.32 | ) | | | (0.14 | ) |
| Total distributions | | | (0.46 | ) | | | (0.33 | ) | | | (0.33 | ) | | | (0.32 | ) | | | (0.32 | ) |
| Tax expense reimbursements by Adviser (Note 2) | | | — | (3) | | | — | | | | — | | | | — | | | | — | |
| Net asset value at end of year | | $ | 7.84 | | | $ | 7.30 | | | $ | 6.51 | | | $ | 5.50 | | | $ | 7.05 | |
| Total return (b) . | | | 14.22 | % | | | 17.12 | % | | | 24.41 | % | | | (17.27 | )% | | | 16.42 | % |
| Net assets at end of year (in 000s) | | $ | 4,328 | | | $ | 30,710 | | | $ | 29,645 | | | $ | 32,949 | | | $ | 23,879 | |
| Ratio of total net expenses to average net assets (including tax expense/benefit) (c) | | | 1.03 | % | | | 1.27 | % (d) | | | 1.20 | % | | | 1.26 | % | | | 1.16 | % |
| Ratio of total net expenses to average net assets (excluding tax expense/benefit) (c) | | | 1.02 | % | | | 1.27 | % (d) | | | 1.20 | % | | | 1.26 | % | | | 1.18 | % |
| Ratio of total gross expenses to average net assets (including tax expense/benefit) | | | 1.06 | % | | | 1.27 | % | | | 1.20 | % | | | 1.26 | % | | | 1.16 | % |
| Ratio of net investment income (loss) to average net assets (c) | | | 1.42 | % | | | 0.59 | % | | | (0.19 | )% | | | 1.62 | % | | | 0.59 | % |
| Portfolio turnover rate (e) | | | 91 | % | | | 86 | % | | | 248 | % | | | 260 | % | | | 66 | % |
Amounts designated as “—” are either $0.00 or have been rounded to $0.00.
| (a) | Per share net income (loss) has been determined on the basis of average number of shares outstanding during the period. |
| (b) | Total return is a measure of the change in value of an investment in the Fund over the period covered. The returns shown do not reflect the deduction of taxes a shareholder would pay on Fund distributions, if any or the redemption of Fund shares. The total returns would be lower if the Adviser had not reduced investment management fees and/or reimbursed expenses for the year ended December 31, 2020 (Note 4). |
| (c) | Ratio was determined after investment management fee reductions and/or reimbursed expenses for the year ended December 31, 2020 (Note 4). |
| (d) | Net expense ratio exceeded the expense limitation during the year ended December 31, 2022 due to reorganization expenses (Note 8). |
| (e) | Portfolio turnover rate is calculated on the basis of the Fund as a whole without distinguishing between classes of shares issued. |
| (1) | Prior to November 18, 2022, Westwood Salient MLP & Energy Infrastructure Fund was known as Salient MLP & Energy Infrastructure Fund. |
| (2) | Prior to November 18, 2022, Ultra Shares were R6 Share Class. |
| (3) | The Adviser reimbursed the Fund $332,497 for losses incurred from tax expenses for the year ended December 31, 2023 the net impact to the Fund was less than $0.005 per share. |
The accompanying notes are an integral part of the financial statements.
| WESTWOOD SALIENT MLP & ENERGY INFRASTRUCTURE FUND |
| |
| |
| NOTES TO FINANCIAL STATEMENTS |
1. Organization
Westwood Salient MLP & Energy Infrastructure Fund (the “Fund”) is a series of Ultimus Managers Trust (the “Trust”), an open-end investment company established as an Ohio business trust under a Declaration of Trust dated February 28, 2012. The Trust is registered under the Investment Company Act of 1940, as amended, (the “1940 Act”). Other series of the Trust are not included in this report.
Salient Midstream & MLP Fund, formerly a series of Salient MF Trust (“Predecessor Salient MF Trust”), was reorganized into the Fund on November 18, 2022 pursuant to an Agreement and Plan of Reorganization dated June 27, 2022.
The Fund is an open-end, non-diversified fund that seeks to maximize total return (capital appreciation and income).
As of December 31, 2023, the Fund offers Institutional Shares, A Class Shares, C Class Shares and Ultra Shares.
Institutional Shares are sold without any sales loads, but subject to an administrative services plan fee of up to 0.10% requiring a $100,000 minimum investment and offered exclusively to certain retirement plans established for the benefit of employees of the Westwood Management Corporation (the “Adviser” or “Westwood”) or its affiliates; defined benefit retirement plans, endowments or foundations; banks and trust companies or law firms acting as trustee or manager for trust accounts; investors who purchase through asset-based fee programs available through financial intermediaries; and insurance companies.
A Class Shares (sold with a maximum sales charge of 4.00% (effective December 29, 2023; prior to December 29, 2023 the maximum sale charge was 3.00%) and a 12b-1 services plan fee up to 0.25% of the average daily net assets attributable to A Class Shares), require a $1,000 minimum investment. A Class Shares are also subject to an administrative services plan fee of up to 0.10% of the average daily net assets attributable A Class Shares of the Fund. A Class Shares purchases of $250,000 or more may be subject to a contingent deferred sales charge (“CDSC”) of 1.00% if redeemed within 18 months of purchase.
C Class Shares, which are sold without any sales loads, but subject to a 12b-1 services plan fee (up to 1.00% of the average daily net assets attributable to C Class Shares), require a $1,000 minimum investment. C Class Shares are also subject to an administrative services plan fee of up to 0.10% of the average daily net assets attributable to C Class Shares. C Class Shares may be subject to a CDSC fee of 1.00% if redeemed within 12 months of purchase. C Class Shares automatically convert to A Class Shares after being held for 10 years.
Ultra Shares (sold without any sales loads and distribution and/or administrative services fees), require a $1,000,000 initial investment and offered exclusively to employer retirement plans; health savings accounts under section 223 of the Internal Revenue Code of 1986, as amended, if such accounts are maintained by the Fund at an omnibus level; endowments and foundations and local, city and state agencies; unaffiliated registered investment companies; collective investment trusts; banks and trust companies or law firms acting as trustee or manager for trust accounts; and insurance companies.
Each share class of the Fund represents an ownership interest in the same investment portfolio of the Fund.
The Adviser serves as investment adviser to other series in the Trust. Salient Advisors, L.P. (“Salient Advisors”), together with Westwood, serve as investment adviser to the Fund. Salient Advisors is a wholly owned subsidiary of Westwood Holdings.
| WESTWOOD SALIENT MLP & ENERGY INFRASTRUCTURE FUND |
| |
2. Significant Accounting Policies
The following is a summary of the Fund’s significant accounting policies. The policies are in conformity with accounting principles generally accepted in the United States of America (“GAAP”). The Fund follows accounting and reporting guidance under Financial Accounting Standards Board (“FASB”) Accounting Standards Codification Topic 946, “Financial Services – Investment Companies.”
Regulatory Updates
Tailored Shareholder Reports for Mutual Funds and Exchange-Traded Funds (“ETFs”) – Effective January 24, 2023, the Securities and Exchange Commission (the “SEC”) adopted rule and form amendments to require mutual funds and ETFs to transmit concise and visually engaging streamlined annual and semiannual reports to shareholders that highlight key information. Other information, including financial statements, will no longer appear in a streamlined shareholder report but must be available online, delivered free of charge upon request, and filed on a semiannual basis on Form N-CSR. The rule and form amendments have a compliance date of July 24, 2024. At this time, management is evaluating the impact of these amendments on the shareholder reports for the Fund.
Securities valuation – The Fund values its portfolio securities at market value as of the close of regular trading on the New York Stock Exchange (the “NYSE”) (normally 4:00 p.m. Eastern time) on each business day the NYSE is open for business. The Fund values its listed securities on the basis of the security’s last sale price on the security’s primary exchange, if available, otherwise at the exchange’s most recently quoted mean price. NASDAQ-listed securities are valued at the NASDAQ Official Closing Price. Investments representing shares of other open-end investment companies, other than exchange-traded funds (“ETFs”), if any, but including money market funds, are valued at their net asset value (“NAV”) as reported by such companies. Option contracts are valued at the closing price on the exchange on which they are primarily traded; if no closing price is available at the time of valuation, the option will be valued at the mean of the closing bid and ask prices for that day. When using a quoted price and when the market is considered active, these securities will be classified as Level 1 within the fair value hierarchy (see below). Fixed income securities are generally valued using prices provided by an independent pricing service approved by the Board of Trustees of the Trust (the “Board”). The independent pricing service uses information with respect to transactions in bonds, quotations from bond dealers, market transactions in comparable securities, and various relationships between securities in determining these prices. In the event that market quotations are not readily available or are considered unreliable due to market or other events, the Fund values its securities and other assets at fair value as determined by the Adviser and Salient Advisors, as the Fund’s valuation designee, in accordance with procedures adopted by the Board pursuant to Rule 2a-5 under the 1940 Act. Under these procedures, the securities will be classified as Level 2 or 3 within the fair value hierarchy, depending on the inputs used. Unavailable or unreliable market quotes may be due to the following factors: a substantial bid-ask spread; infrequent sales resulting in stale prices; insufficient trading volume; small trade sizes; a temporary lapse in any reliable pricing source; and actions of the securities or futures markets, such as the suspension or limitation of trading. As a result, the prices of securities used to calculate the Fund’s NAV may differ from quoted or published prices for the same securities. Securities traded on foreign exchanges, if any, are fair valued by an independent pricing service and translated from the local currency into U.S. dollars using currency exchange rates supplied by an independent pricing service.
GAAP establishes a single authoritative definition of fair value, sets out a framework for measuring fair value, and requires additional disclosures about fair value measurements.
Various inputs are used in determining the value of the Fund’s investments. These inputs are summarized in the three broad levels listed below:
| ● | Level 1 – quoted prices in active markets for identical securities |
| ● | Level 2 – other significant observable inputs |
| ● | Level 3 – significant unobservable inputs |
| WESTWOOD SALIENT MLP & ENERGY INFRASTRUCTURE FUND |
| |
Fixed income securities held by the Fund, if any, are classified as Level 2 since values are based on prices provided by an independent pricing service that utilizes various “other significant observable inputs” including bid and ask quotations, prices of similar securities, and interest rates, among other factors.
For most securities, both the latest transaction prices and adjustments are furnished by independent pricing services. The Adviser and Salient Advisor as the Fund’s valuation designees are responsible for carrying out pricing and valuation duties in accordance with the Adviser’s Valuation Procedures (the “Procedures”). The Fund values all other securities and assets for which market quotations are unavailable or unreliable at their fair value determined in good faith.
The inputs or methods used for valuing securities are not necessarily an indication of the risks associated with investing in those securities. The inputs used to measure fair value may fall into different levels of the fair value hierarchy. In such cases, for disclosure purposes, the level in the fair value hierarchy within which the fair value measurement falls in its entirety is determined based on the lowest level input that is significant to the fair value measurement.
The following is a summary of the Fund’s investments and the inputs used to value the investments as of December 31, 2023:
| | | Level 1 | | | Level 2 | | | Level 3 | | | Total | |
| Master Limited Partnerships | | $ | 297,161,626 | | | $ | — | | | $ | 15,345,343 | | | | 312,506,969 | |
| MLP Related Companies | | | 567,714,577 | | | | — | | | | — | | | | 567,714,577 | |
| Special Purpose Acquisition Companies | | | — | | | | — | | | | 315 | | | | 315 | |
| Exchange-Traded Funds | | | 8,771,824 | | | | — | | | | — | | | | 8,771,824 | |
| Money Market Funds | | | 3,598,808 | | | | — | | | | — | | | | 3,598,808 | |
| Total Investment Securities | | $ | 877,246,835 | | | $ | — | | | $ | 15,345,658 | | | $ | 892,592,493 | |
| Other Financial Instruments | | | | | | | | | | | | | | | | |
| Written Option Contracts | | $ | (255,525 | ) | | $ | — | | | $ | — | | | $ | (255,525 | ) |
| Total | | $ | 876,991,310 | | | $ | — | | | $ | 15,345,658 | | | $ | 892,336,968 | |
Amounts designated as “—” are $0 or have been rounded to $0.
Level 3 Rollforward
| | | | | | | | | | | | | | | Changes in | | | | | | | | | | |
| | | Balance as of | | | Net | | | | | | | | | Unrealized | | | Transfer | | | Transfer | | | Balance as of | |
| | | December 31, | | | Purchases/ | | | | | | Realized | | | Appreciation | | | Into | | | Out of | | | December 31, | |
| Asset Type | | 2022 | | | Acquisitions | | | Net Sales | | | Losses | | | (Depreciation) | | | Level 3 | | | Level 3 | | | 2023 | |
| MLP Related Companies | | $ | 9,092,368 | | | $ | — | | | $ | — | | | $ | — | | | $ | 6,252,975 | | | $ | — | | | $ | — | | | $ | 15,345,343 | |
| Special Purpose Acquisition Companies | | | 315 | | | | — | | | | — | | | | — | | | | — | | | | — | | | | — | | | | 315 | |
The total change in unrealized appreciation (depreciation) included on the Statement of Operations attributable to Level 3 investments still held at December 31, 2023 is $6,252,975.
| WESTWOOD SALIENT MLP & ENERGY INFRASTRUCTURE FUND |
| |
| | | Fair Value as of | | | | | | | | | Valuation from |
| | | December 31, | | | Valuation | | Unobservable | | Input Value/ | | an Increase in |
| | | 2023 | | | Technique | | Input | | Range | | Input |
| MLP Related Companies | | $ | 15,345,343 | | | Discounted Cash Flow | | Discount Rate | | 10.5% | | Decrease |
| | | | | | | | | Terminal Cash Flow Growth Rate | | 3.0% | | Increase |
| Special Purpose Acquisition Companies | | $ | 315 | | | Transaction Price | | Transaction Price | | $0.003 | | Increase |
The restricted securities held by the Fund at December 31, 2023 are identified below and are also presented in the Fund’s Schedule of Investments. As of December 31, 2023, there are no unfunded commitments related to the restricted securities.
| | | % of | | Acquisition | | | | | | | | | |
| | | Net Assets | | Date | | Shares/Units | | | Cost | | | Fair Value | |
| EMG Utica Executed Purchase Agreement | | 1.72% | | 2/22/2013* | | | 16,000,000 | | | $ | 16,000,000 | | | $ | 15,345,343 | |
| TortoiseEconfin Acquisition Corp III - Founder Shares | | 0.00% | | 7/21/2021* | | | 104,850 | | | | 315 | | | | 315 | |
| | | | | | | | | | | $ | 16,000,315 | | | $ | 15,345,658 | |
| * | Original purchase date by acquired fund prior to merger. |
Share valuation – The NAV per share of each class of the Fund is calculated daily by dividing the total value of the assets attributable to that class, less liabilities attributable to that class, by the number of shares outstanding of that class. The offering price and redemption price per share of each class of the Fund is equal to the NAV per share of such class except for A Class Shares. A Class Shares have a front-end sales charge, which is deducted from your purchase price when you buy your shares.
Investment income – Dividend income is recorded on the ex-dividend date. Non-cash dividends included in dividend income, if any, are recorded at the fair value of the security received. Interest income is accrued as earned. Withholding taxes on foreign dividends, if any, have been recorded in accordance with the Funds’ understanding of the applicable country’s tax rules and rates. The Fund may invest in real estate investment trusts (“REITs”) that pay distributions to their shareholders based on available funds from operations. It is common for these distributions to exceed the REIT’s taxable earnings and profits resulting in the excess portion of such distribution to be designated as return of capital. Distributions received from REITs are generally recorded as dividend income and, if necessary, are reclassified annually in accordance with tax information provided by the underlying REITs. Distributions received for the Fund’s investments in Master Limited Partnerships (“MLPs”) may be comprised of both income and return of capital. The Fund records investment income and return of capital based on estimates made at the time such distributions are received. Such estimates are based on historical information available from each MLP and other industry sources. These estimates may subsequently be revised based on information received from MLPs after their tax reporting periods are concluded. Discounts and premiums on fixed income securities, if any, are amortized using the effective interest method.
Investment transactions – Investment transactions are accounted for on the trade date. Realized gains and losses on investments sold are determined on a specific identification basis.
| WESTWOOD SALIENT MLP & ENERGY INFRASTRUCTURE FUND |
| |
Allocation between Classes – Investment income earned, realized capital gains and losses, and unrealized appreciation and depreciation are allocated daily to each Class of the Fund based upon its proportionate share of total net assets of that Fund. Class-specific expenses are charged directly to the Class incurring the expense. Common expenses which are not attributable to a specific Class are allocated daily to each Class of shares of the Fund based upon its proportionate share of total net assets of the Fund. Distribution fees are class specific expenses.
Common expenses – Common expenses of the Trust are allocated among the Fund and the other series of the Trust based on the relative net assets of each series, the number of series in the Trust, or the nature of the services performed and the relative applicability to each series.
Options written/purchased – The Fund may utilize longer maturity options for stock replacement when and as price and volatility relationships become more favorable for options versus underlying stocks or for tax and liquidity management purposes. The Funds are authorized to write (sell) and purchase put and call options. The risk in writing a call option is that the Funds give up the opportunity to profit if the market price of the security increases. The risk in writing a put option is that the Fund may incur a loss if the market price of the security decreases and the option is exercised. The risk in purchasing an option is that the Fund pay a premium whether or not the option is exercised. The Fund also has the additional risk of being unable to enter into a closing transaction at an acceptable price if a liquid secondary market does not exist. Option contracts also involve the risk that they may not work as intended due to unanticipated developments in market conditions or other causes.
Foreign currency translation – Securities and other assets and liabilities denominated in or expected to settle in foreign currencies are translated into U.S. dollars based on exchange rates on the following basis:
| A. | The fair values of investment securities and other assets and liabilities are translated as of the close of the NYSE each day. |
| B. | Purchases and sales of investment securities and income and expenses are translated at the rate of exchange prevailing as of 4:00 p.m. Eastern Time on the respective date of such transactions. |
| C. | The Fund does not isolate that portion of the results of operations caused by changes in foreign exchange rates on investments from those caused by changes in market prices of securities held. Such fluctuations are included with the net realized and unrealized gains or losses on investments. |
Reported net realized foreign exchange gains or losses arise from 1) purchases and sales of foreign currencies, 2) currency gains or losses realized between the trade and settlement dates on securities transactions and 3) the difference between the amounts of dividends and foreign withholding taxes recorded on the Fund’s books and the U.S. dollar equivalent of the amounts actually received or paid. Reported net unrealized foreign exchange gains and losses arise from changes in the value of assets and liabilities other than investments in securities that result from changes in exchange rates.
The Fund may be subject to foreign taxes related to foreign income received, capital gain on the sale of securities and certain foreign currency transactions (a portion of which may be reclaimable). All foreign taxes are recorded in accordance with the applicable regulations and rates that exist in the foreign jurisdictions in which the Fund invests.
Borrowing costs – From time to time, the Fund may have an overdrawn cash balance at the custodian due to redemptions or market movements. When this occurs, the Fund will incur borrowing costs charged by the custodian. Borrowing costs, if any, for the year ended December 31, 2023 can be found on the Statement of Operations.
ReFlow transactions – The Fund may participate in ReFlow, a program designed to provide an alternative liquidity source for mutual funds experiencing redemptions of their shares. In order to pay cash to shareholders who redeem their shares on a given day, a mutual fund typically must hold cash in its portfolio, liquidate portfolio securities, or borrow money, all of which impose certain costs on the fund. ReFlow provides participating mutual funds with
| WESTWOOD SALIENT MLP & ENERGY INFRASTRUCTURE FUND |
| |
another source of cash by standing ready to purchase shares from a fund equal to the amount of the fund’s net redemptions on a given day. ReFlow then generally redeems those shares when the fund experiences net sales. In return for this service, the fund will pay a fee to ReFlow at a rate determined by a daily auction with other participating mutual funds. The costs for participating in ReFlow are generally expected to be influenced by and comparable to the cost of other sources of liquidity, such as the Fund’s short-term lending arrangements or the costs of selling portfolio securities to meet redemptions. ReFlow is prohibited from acquiring more than 2.95% of the total net assets of the Fund. The Board has adopted certain procedures to govern the Fund’s participation in ReFlow. During the year ended December 31, 2023, no ReFlow fees were incurred.
Estimates – The preparation of financial statements in conformity with GAAP requires management to make estimates and assumptions that affect the reported amounts of assets and liabilities and disclosure of contingent assets and liabilities as of the date of the financial statements and the reported amounts of increase (decrease) in net assets from operations during the reporting period. Actual results could differ from those estimates.
Distributions to shareholders – The Fund distributes substantially all of its net income to shareholders on a quarterly basis and its net capital gains to shareholders at least annually in December. The amount of such dividends and distributions are determined in accordance with federal income tax regulations, which may differ from GAAP. Dividends and distributions to shareholders are recorded on the ex-dividend date.
The character of dividends paid to shareholders of the Fund for federal income tax purposes during years ended December 31, 2023 and 2022 was as follows:
| | | Ordinary | | | Long-Term | | | Return of | | | Total | |
| Years Ended | | Income | | | Capital Gains | | | Capital | | | Distributions* | |
| December 31, 2023 | | $ | 33,587,018 | | | $ | — | | | $ | 20,006,122 | | | $ | 53,593,140 | |
| December 31, 2022 | | $ | — | | | $ | — | | | $ | 39,068,282 | | | $ | 39,068,282 | |
| * | Total Distributions may not tie to the amounts listed on the Statements of Changes in Net Assets due to reclassifications of the character of the distributions as the result of permanent differences between the financial statements and income tax reporting. |
Federal income tax – The Fund has qualified and intends to continue to qualify as a regulated investment company under the Internal Revenue Code of 1986, as amended (the “Code”). Qualification generally will relieve the Fund of liability for federal income taxes to the extent 100% of their net investment income and net realized capital gains are distributed in accordance with the Code.
In order to avoid imposition of the excise tax applicable to regulated investment companies, it is also the Fund’s intention to declare as dividends in each calendar year at least 98% of its net investment income (earned during the calendar year) and 98.2% of its net realized capital gains (earned during the twelve months ended December 31) plus undistributed amounts from prior years.
The following information is computed on a tax basis for each item as of November 30, 2023. The Fund has a tax year end of November 30, 2023, which is different than the fiscal year of December 31, 2023.
| Federal income tax cost | | $ | 680,212,669 | |
| Gross unrealized appreciation | | $ | 230,667,525 | |
| Gross unrealized depreciation | | | (10,559,517 | ) |
| Net unrealized appreciation | | | 220,108,008 | |
| Accumulated capital and other losses | | | (965,958,107 | ) |
| Total accumulated deficit | | $ | (745,850,099 | ) |
| WESTWOOD SALIENT MLP & ENERGY INFRASTRUCTURE FUND |
| |
The following information is provided on a tax basis as of December 31, 2023.
| Federal income tax cost | | $ | 648,536,086 | |
| Gross unrealized appreciation | | $ | 245,155,253 | |
| Gross unrealized depreciation | | | (1,354,371 | ) |
| Net unrealized appreciation | | $ | 243,800,882 | |
The difference between the federal income tax cost of investments and the financial statement cost of investments are due to certain timing differences in the recognition of capital gains or losses under income tax regulations and GAAP. These “book/tax” differences are temporary in nature and are primarily due to the tax deferral of losses on wash sales, partnership adjustments straddle loss deferral and options mark to market adjustments.
As of November 30, 2023, the Fund had short-term and long-term capital loss carryforwards for federal income tax purposes, which may be carried forward indefinitely. These capital loss carryforwards are available to offset net realized capital gains in the current and future years, thereby reducing future taxable gains distributions, if any.
| Capital Loss Carryovers | |
| Short-term | | | Long-term | | | Total | |
| $ | 313,182,994 | | | $ | 651,309,658 | | | $ | 964,492,652 | |
For the Fund, included in the $964,492,652 is short-term available carry forward losses of $135,535,254 and long-term of $61,267,795 for a total of $196,803,049 from the merged Predecessor Fund with an annual limitation of $4,106,607.
During the tax year end ended November 30, 2023, the Fund utilized $17,213,030 of capital loss carryforwards against current year gains.
The Fund recognizes the tax benefits or expenses of uncertain tax positions only when the position is “more likely than not” of being sustained assuming examination by tax authorities. Management has reviewed the Fund’s tax positions for all open tax periods (generally, three years) and has recorded any tax related amounts on the Statements of Operations. The Fund identifies its major tax jurisdiction as U.S. Federal.
In order to meet the distribution requirements under Subchapter M of the Internal Revenue Code of 1986, as amended (the “Code”), and maintain regulated investment company status, the Fund paid a “deficiency dividend,” as such term is defined by Section 860(f) of the Code, to the Fund’s shareholders totaling $5,648,856 from ordinary income on July 12, 2023. The Adviser reimbursed the Fund in the amount of $32,497 for the amount of excise tax associated with the under-distribution. An estimated amount of $300,000 is accrued in the Fund to cover any additional interest and penalties that may still be charged. The Adviser has committed to reimbursing the Fund for this expense once the final amount is known and has $300,000 accrued in the Fund to cover the estimated amount.
As of the tax year ended November 30, 2023, the following adjustment was made:
| Accumulated deficit | | Paid-in capital |
| | 5,969,749 | | (5,969,749) |
| WESTWOOD SALIENT MLP & ENERGY INFRASTRUCTURE FUND |
| |
3. Investment Transactions
The cost of security purchases and proceeds from sales and maturities of securities (excluding short-term debt securities having maturities one year or less and U.S. Government securities) for the year ended December 31, 2023 were as follows:
| Purchases of investment securities | | $ | 814,813,173 | |
| Proceeds from sales and maturities of investment securities | | $ | 958,764,069 | |
4. Transactions with Related Parties
INVESTMENT MANAGEMENT AGREEMENT
The Fund’s investments are managed by the Adviser pursuant to the terms of an Investment Management Agreement. The Fund pays the Adviser an investment management fee, based on the average net assets of the Fund, computed and accrued daily and paid monthly, at the annual rate shown in the table below.
Pursuant to an Expense Limitation Agreement (“ELA”) between the Fund and the Adviser, the Adviser has contractually agreed, until April 30, 2024, to reduce investment management fees and reimburse other expenses to the extent necessary to limit total annual fund operating expenses of the Fund (exclusive of interest; taxes; brokerage commissions; Rule 12b-1 distribution fees (if any), administrative servicing fees (if any); borrowing expenses such as dividend and interest expenses on securities sold short; acquired fund fees and expenses; costs to organize the Fund; other expenditures which are capitalized in accordance with generally accepted accounting principle; and extraordinary expenses) to an amount not exceeding the following percentages of average daily net assets attributable to each respective class. The ratios listed are the contractual amounts which include 12b-1 distribution and administrative services fees.
| | | Institutional | | A Class | | C Class | | Ultra Shares |
| Management | | Class Expense | | Expense | | Expense | | Expense |
| Fee | | Limitation | | Limitation | | Limitation | | Limitation |
| 0.90% | | 1.25% | | 1.50% | | 2.25% | | n/a |
Under the terms of the ELA, investment management fee reductions and expense reimbursements by the Adviser are subject to repayment by the Fund for a period of three years after the date on which such fees and expenses were incurred or waived, provided that the repayments do not cause total annual fund operating expenses (exclusive of such reductions and reimbursements) to exceed (i) the expense limitation then in effect, if any, and (ii) the expense limitation in effect at the time the expenses to be repaid were incurred. During the year ended December 31, 2023, the Adviser did not reduce management fees or reimburse other expenses other than the tax expense discussed in Note 2.
OTHER SERVICE PROVIDERS
Ultimus Fund Solutions, LLC (“Ultimus”) provides administration, fund accounting, compliance and transfer agency services to the Fund. The Fund pays Ultimus fees in accordance with the agreements for such services. In addition, the Fund pays out-of-pocket expenses including, but not limited to, postage, supplies, and certain costs related to the pricing of the Funds’ portfolio securities.
Under the terms of a Distribution Agreement with the Trust, Ultimus Fund Distributors, LLC (the “Distributor”) serves as the principal underwriter to the Fund. The Distributor is a wholly-owned subsidiary of Ultimus. The Distributor is compensated by the Adviser for acting as principal underwriter.
| WESTWOOD SALIENT MLP & ENERGY INFRASTRUCTURE FUND |
| |
Certain officers of the Trust are also officers of Ultimus and are not paid by the Fund for servicing in such capacities.
ADMINISTRATIVE SERVICES PLAN
As of December 31, 2023, the Fund has adopted an administrative services plan (the “Plan”) that provides that the applicable class of the Fund may pay financial intermediaries for shareholder services in an amount not to exceed the rate shown below based on the average daily net assets of the Fund’s share class. During the year ended December 31, 2023, the Institutional Class, A Class Shares and C Class Shares of the Fund incurred the following administrative services plan fees under the Plan:
| | | | | Expense | |
| | | | | Incurred | |
| | | | | For the | |
| | | | | year ended | |
| | | | | December 31, | |
| Administrative service plan fees | | Maximum Rate | | 2023 | |
| Institutional Shares | | 0.10% | | $ | 641,419 | |
| A Class Shares | | 0.10% | | | 114,007 | |
| C Class Shares | | 0.10% | | | 9,880 | |
DISTRIBUTION PLAN
The Fund has adopted a distribution plan under Rule 12b-1 of the 1940 Act (the “Plan”) for A Class Shares and C Class Shares that allows the Fund to pay distribution and/or service fees for the sale and distribution of Fund shares, and for services provided to shareholders in an amount not to exceed 0.25% based on average daily net assets of the Fund’s A Class Shares, up to 1.00% based on the average daily net assets of the Fund’s C Class Shares. During the year ended December 31, 2023, the A Class Shares and C Class Shares of the Fund incurred the following distribution fees under the Plan:
| | | Expense | |
| | | Incurred | |
| | | For the | |
| | | year ended | |
| | | December 31, | |
| Distribution fee | | 2023 | |
| A Class Shares | | $ | 347,520 | |
| C Class Shares | | | 148,807 | |
TRUSTEE COMPENSATION
Each member of the Board (a “Trustee”) who is not an “interested person” (as defined by the 1940 Act, as amended) of the Trust (“Independent Trustee”) receives an annual retainer and meeting fees, plus reimbursement for travel and other meeting-related expenses.
| WESTWOOD SALIENT MLP & ENERGY INFRASTRUCTURE FUND |
| |
PRINCIPAL HOLDER OF FUND SHARES
As of December 31, 2023, the following shareholder owned of record 25% or more of the outstanding shares of the Fund:
| NAME OF RECORD OWNER | | % Ownership |
| Morgan Stanley Smith Barney, LLC (for the benefit of its customers) | | 47% |
A beneficial owner of 25% or more of a Fund’s outstanding shares may be considered a controlling person of the Fund. That shareholder’s vote could have a more significant effect on matters presented at a shareholders’ meeting.
5. Derivative Transactions
The following is a summary of the fair value of derivative instruments held by the Fund listed below as of December 31, 2023 presented on the Statement of Assets and Liabilities.
| | | Liabilities | |
| | | Investments, | |
| | | at value | |
| | | for written | |
| Type of Derivative | | options | |
| Equity Risk Exposure | | $ | (255,525 | ) |
The following summary of the effect of derivatives instruments for the Fund on the Statement of Operations for the year ended December 31, 2023:
| | | | | | | | | | | | Change in | |
| | | | | | | | | | | | Unrealized | |
| | | | | | | | | | | | Appreciation | |
| Type of Derivative | | Risk | | Location | | Realized Gains | | | Location | | (Depreciation) | |
| Call options written | | Equity | | Net realized gains from written option contracts | | $ | 8,691,149 | | | Net change in unrealized appreciation (depreciation) on written option contracts | | $ | 79,060 | |
Offsetting Assets and Liabilities:
The Fund is required to disclose the impact of offsetting assets and liabilities represented in the Statement of Assets and Liabilities to enable users of the financial statements to evaluate the effect or potential effect of netting arrangements on its financial position for recognized assets and liabilities. These recognized assets and liabilities are financial instruments and derivative instruments that are either subject to an enforceable master netting arrangement or similar agreement or meet the following right of setoff criteria: the amounts owed by the Fund to another party are determinable, the Fund has the right to set off the amounts owed with the amounts owed by the other party, the Fund intends to set off, and the Fund’s right of setoff is enforceable at law.
A fund is subject to various netting arrangements with select counterparties (“Master Agreements” or “MNAs”). Master Agreements govern the terms of certain transactions, and reduce the counterparty risk associated with relevant transactions by specifying credit protection mechanisms and providing standardization that improves legal certainty. Since different types of transactions have different mechanics and are sometimes traded out of different
| WESTWOOD SALIENT MLP & ENERGY INFRASTRUCTURE FUND |
| |
legal entities of a particular counterparty organization, each type of transaction may be covered by a different Master Agreement, resulting in the need for multiple agreements with a single counterparty. As the Master Agreements are specific to unique operations of different asset types, they allow a fund to close out and net its total exposure to a specific counterparty entity in the event of a default with respect to all the transactions governed under a single agreement with a specific counterparty entity.
Master Agreements can also help limit counterparty risk by specifying collateral posting arrangements at pre-arranged exposure levels. Under the Master Agreements, collateral is routinely transferred if the total net exposure to certain transactions (net of existing collateral already in place) governed under the relevant Master Agreement with a counterparty in a given account exceeds a specified threshold, which typically ranges from zero to $250,000 depending on the counterparty and the type of Master Agreement. United States Treasury Securities and U.S. dollar cash are generally the preferred forms of collateral. Securities and cash pledged as collateral are reflected as assets in the Statement of Assets and Liabilities as either a component of investments at value (securities) or deposits due from counterparties (cash). Cash collateral received is not typically held in a segregated account and as such is reflected as a liability in the Statement of Assets and Liabilities as deposits due to counterparties. The market value of any securities received as collateral is not reflected as a component of net asset value. A fund’s overall exposure to counterparty risk can change substantially within a short period, as it is affected by each transaction subject to the relevant Master Agreement.
Customer account agreements and related addendums govern cleared derivatives transactions such as futures, options on futures, and cleared Over The Counter (“OTC”) derivatives. Cleared derivative transactions require posting of initial margin as determined by each relevant clearing agency which is segregated at a broker account registered with the Commodities Futures Trading Commission (“CFTC”), or the applicable regulator. In the U.S., counterparty risk is believed to be reduced as creditors of the futures broker do not have claim to fund assets in the segregated account. Additionally, portability of exposure in the event of default further reduces risk to the fund. Variation margin, or changes in market value, are exchanged daily, but generally may not be netted between futures and cleared OTC derivatives.
International Swaps and Derivatives Association, Inc. Master Agreements and Credit Support Annexes (“ISDA Master Agreements”) govern OTC financial derivative transactions entered into by a fund and select counterparties. ISDA Master Agreements maintain provisions for general obligations, representations, agreements, collateral and events of default or termination. Events of termination include conditions that may entitle counterparties to elect to terminate early and cause settlement of all outstanding transactions under the applicable ISDA Master Agreement. Any election to terminate early could be material to the financial statements. In limited circumstances, the ISDA Master Agreement may contain additional provisions that add additional counterparty protection beyond coverage of existing daily exposure if the counterparty has a decline in credit quality below a predefined level. These amounts, if any, may be segregated with a third party custodian.
As of December 31, 2023, derivative assets and liabilities by type by the Fund is as follows:
| Descriptions | | Assets | | | Liabilities | |
| Derivatives Financial Instruments: | | | | | | | | |
| Options contract | | $ | — | | | $ | (255,525 | ) |
| Total derivative assets and liabilities on the Statement of Assets and Liabilities | | | — | | | | (255,525 | ) |
| Derivative not subject to a MNA or similar agreement | | | — | | | | 255,525 | |
| Total assets and liabilities subject to a MNA | | $ | — | | | $ | — | |
Amounts designated as “—” are $0 or have been rounded to $0.
| WESTWOOD SALIENT MLP & ENERGY INFRASTRUCTURE FUND |
| |
Certain derivative contracts are executed under either standardized netting agreements or, for exchange-traded derivatives, the relevant contracts for a particular exchange that contain enforceable netting provisions. A derivative netting arrangement creates an enforceable right of set-off that becomes effective and affects the realization of settlement on individual assets, liabilities and collateral amounts, only following a specified event of default or early termination. Default events may include the failure to make payments or deliver securities timely, material adverse changes in financial condition or insolvency, the breach of minimum regulatory capital requirements, or loss of license, charter or other legal authorization necessary to perform under the contract.
6. Investments in Money Market Funds
In order to maintain sufficient liquidity to implement investment strategies, or for temporary defensive purposes, the Fund may at times invest a significant portion of their assets in shares of money market funds. An investment in a money market fund is not insured or guaranteed by the Federal Deposit Insurance Corporation or any other governmental agency, entity or person. While investor losses in money market funds have been rare, they are possible. The Fund, as an investor in money market funds, indirectly bears the fees and expenses of those funds, which are in addition to the fees and expenses of the Fund.
7. Contingencies and Commitments
The Fund indemnifies the Trust’s officers and Trustees for certain liabilities that might arise from their performance of their duties to the Fund. Additionally, in the normal course of business the Fund enters into contracts that contain a variety of representations and warranties and which provide general indemnifications. The Fund’s maximum exposure under these arrangements is unknown, as this would involve future claims that may be made against the Fund that has not yet occurred. However, based on experience, the Fund expects the risk of loss to be remote.
8. Reorganization Event
On September 14, 2022, Salient Midstream & MLP Fund, a non-diversified closed-end investment management company formed as a Delaware statutory trust was reorganized into the Predecessor Salient MLP & Energy Infrastructure Fund, a series of Predecessor Salient MF Trust. During the reorganization, shareholders of the Salient Midstream & MLP Fund received Class A shares of Predecessor Fund equal to the aggregate net asset value of their holdings of Salient Midstream & MLP Fund.
The reorganization was accomplished by a tax-free exchange of 17,755,671 shares of Salient Midstream & MLP Fund (valued at $161,677,813) for 21,251,027 Class A shares of the Predecessor Fund. The investment portfolio of Salient Midstream & MLP Fund with a fair value of $101,405,538 and an unadjusted cost basis of $74,010,049 (cost basis of $70,627,425, adjusted for cumulative return of capital) was the principal asset acquired by the Predecessor Fund. For financial reporting purposes, assets received and shares issued by Predecessor Fund were recorded at fair value; however, the cost basis of the investments received from Salient Midstream & MLP Fund was carried forward to align ongoing reporting of Predecessor Fund’s realized and unrealized gains and losses with amounts distributable to shareholders for tax purposes. Salient Midstream & MLP Fund’s net assets at that date ($161,677,813), including unadjusted unrealized appreciation of $27,395,489 (unrealized appreciation of $30,778,113, adjusted for cumulative return of capital), were combined with those of Predecessor Fund. The aggregate net assets of Predecessor Fund immediately before the acquisition were $967,862,476. 70% of the costs associated with the Reorganization were
| WESTWOOD SALIENT MLP & ENERGY INFRASTRUCTURE FUND |
| |
paid by Salient Midstream & MLP Fund, and 30% of the costs associated with the Reorganization were paid by Predecessor Fund.
9. In-Kind Transactions
During the year ended December 31, 2023, there were no in-kind transactions for the Fund.
10. Sector Risk
If a Fund has significant investments in the securities of issuers in industries within a particular business sector, any development affecting that sector will have a greater impact on the value of the net assets of the Fund than would be the case if the Fund did not have significant investments in that sector. In addition, this may increase the risk of loss of an investment in the Fund and increase the volatility of the Fund’s NAV per share. From time to time, circumstances may affect a particular sector and the companies within such sector. For instance, economic or market factors, regulation or deregulation, or other developments may negatively impact all companies in a particular sector and therefore the value of a Fund’s portfolio would be adversely affected. As of December 31, 2023, the Fund had 26.0% of the value of its net assets invested in securities in the Energy sector.
11. Subsequent Events
The Fund is required to recognize in the financial statements the effects of all subsequent events that provide additional evidence about conditions that existed as of the date of the Statement of Assets and Liabilities. For non-recognized subsequent events that must be disclosed to keep the financial statements from being misleading, the Fund is required to disclose the nature of the event as well as an estimate of its financial effect, or a statement that such an estimate cannot be made. Management has evaluated subsequent events through the issuance of these financial statements and has noted no such events except for the following:
The Fund paid distributions subsequent to December 31, 2023:
| | | | | | | Per Share | |
| | | | | | | Ordinary | |
| | | Record Date | | Ex-Date | | Income | |
| Institutional Class | | 2/15/2024 | | 2/16/2024 | | $ | 0.1150 | |
| A Class Shares | | 2/15/2024 | | 2/16/2024 | | | 0.1100 | |
| C Class Shares | | 2/15/2024 | | 2/16/2024 | | | 0.0943 | |
| Ultra Shares | | 2/15/2024 | | 2/16/2024 | | | 0.1170 | |
| WESTWOOD SALIENT MLP & ENERGY INFRASTRUCTURE FUND |
| |
| |
| REPORT OF INDEPENDENT REGISTERED PUBLIC ACCOUNTING FIRM |
To the Shareholders of Westwood Salient MLP & Energy Infrastructure Fund and
Board of Trustees of Ultimus Managers Trust
Opinion on the Financial Statements
We have audited the accompanying statement of assets and liabilities, including the schedules of investments and open written option contracts, of Westwood Salient MLP & Energy Infrastructure Fund, (the “Fund”), a series of Ultimus Managers Trust, as of December 31, 2023, the related statements of operations and changes in net assets, and the financial highlights for the year then ended, and the related notes (collectively referred to as the “financial statements”). In our opinion, the financial statements present fairly, in all material respects, the financial position of the Fund as of December 31, 2023, and the results of its operations, the changes in net assets, and the financial highlights for the year then ended, in conformity with accounting principles generally accepted in the United States of America.
The Fund’s financial statements and financial highlights for the year ended December 31, 2022, were audited by another auditor whose report, dated March 1, 2023, expressed an unqualified opinion on those financial statements and financial highlights. The Fund’s financial highlights for the year ended December 31, 2021, and prior, were audited by other auditors, whose report dated February 24, 2022, expressed an unqualified opinion on such financial highlights.
Basis for Opinion
These financial statements are the responsibility of the Fund’s management. Our responsibility is to express an opinion on the Fund’s financial statements based on our audit. We are a public accounting firm registered with the Public Company Accounting Oversight Board (United States) (“PCAOB”) and are required to be independent with respect to the Fund in accordance with the U.S. federal securities laws and the applicable rules and regulations of the Securities and Exchange Commission and the PCAOB.
We conducted our audit in accordance with the standards of the PCAOB. Those standards require that we plan and perform the audit to obtain reasonable assurance about whether the financial statements are free of material misstatement whether due to error or fraud.
Our audit included performing procedures to assess the risks of material misstatement of the financial statements, whether due to error or fraud, and performing procedures that respond to those risks. Such procedures included examining, on a test basis, evidence regarding the amounts and disclosures in the financial statements. Our procedures included confirmation of securities owned as of December 31, 2023, by correspondence with the custodian, issuers, and broker. Our audit also included evaluating the accounting principles used and significant estimates made by management, as well as evaluating the overall presentation of the financial statements. We believe that our audit provides a reasonable basis for our opinion.
We have served as the Fund’s auditor since 2023.

COHEN & COMPANY, LTD.
Philadelphia, Pennsylvania
February 29, 2024
| WESTWOOD SALIENT MLP & ENERGY INFRASTRUCTURE FUND |
| |
| LIQUIDITY RISK MANAGEMENT PROGRAM (Unaudited) |
The Fund has adopted and implemented a written liquidity risk management program (the “Program”) as required by Rule 22e-4 (the “Liquidity Rule”) under the Investment Company Act of 1940, as amended. The Program is reasonably designed to assess and manage the Fund’s liquidity risk, taking into consideration, among other factors, the Fund’s investment strategy and the liquidity of its portfolio investments during normal and reasonably foreseeable stressed conditions; its short- and long-term cash flow projections; and its cash holdings and access to other funding sources. The Fund’s Board of Trustees (the “Board”) approved the appointment of the Liquidity Administrator Committee, comprising of the Fund’s Adviser and certain Trust officers, to be responsible for the Program’s administration and oversight and for reporting to the Board on at least an annual basis regarding the Program’s operation and effectiveness. The annual written report assessing the Program (the “Report”) was presented to the Board at the October 16-17, 2023 Board meeting and covered the period from June 1, 2022 to May 31, 2023 (the “Review Period”).
During the Review Period, the Fund did not experience unusual stress or disruption to its operations related to purchase and redemption activity. Also, during the Review Period, the Fund held adequate levels of cash and highly liquid investments to meet shareholder redemption activities in accordance with applicable requirements. The Report concluded that the Program is reasonably designed to prevent violation of the Liquidity Rule and the Program has been effectively implemented.
| WESTWOOD SALIENT MLP & ENERGY INFRASTRUCTURE FUND |
| |
| |
| ABOUT YOUR FUND’S EXPENSES (Unaudited) |
We believe it is important for you to understand the impact of costs on your investment. As a shareholder of the Fund, you incur two types of costs: (1) transaction costs, possibly including sales charges (loads) and redemption fees, and (2) ongoing costs, including management fees, class-specific expenses (such as administrative services fees and/or Rule 12b-1 fees) and other operating expenses. The following examples are intended to help you understand your ongoing costs (in dollars) of investing in the Fund and to compare these costs with the ongoing costs of investing in other mutual funds.
A mutual fund’s ongoing costs are expressed as a percentage of its average net assets. This figure is known as the expense ratio. The expenses in the table below are based on an investment of $1,000 made at the beginning of the most recent period (July 1, 2023) and held until the end of the period (December 31, 2023).
The table below illustrates the Fund’s ongoing costs in two ways:
Actual fund return – This section helps you to estimate the actual expenses that you paid over the period. The “Ending Account Value” shown is derived from the Fund’s actual return, and the fourth column shows the dollar amount of operating expenses that would have been paid by an investor who started with $1,000 in the Fund. You may use the information here, together with the amount you invested, to estimate the expenses that you paid over the period.
To do so, simply divide your account value by $1,000 (for example, an $8,600 account value divided by $1,000 = 8.6), then multiply the result by the number given for the Fund under the heading “Expenses Paid During Period.”
Hypothetical 5% return – This section is intended to help you compare the Fund’s ongoing costs with those of other mutual funds. It assumes that the Fund had an annual return of 5% before expenses during the period shown, but that the expense ratio is unchanged. In this case, because the return used is not the Fund’s actual return, the results do not apply to your investment. The example is useful in making comparisons because the SEC requires all mutual funds to calculate expenses based on a 5% return. You can assess the Fund’s ongoing costs by comparing this hypothetical example with the hypothetical examples that appear in shareholder reports of other funds.
Note that expenses shown in the table are meant to highlight and help you compare ongoing costs only. The Fund does not charge transaction fees, such as purchase or redemption fees, nor do they carry a “sales load.”
The calculations assume no shares were bought or sold during the period. Your actual costs may have been higher or lower, depending on the amount of your investment and the timing of any purchases or redemptions.
More information about the Fund’s expenses can be found in this report. For additional information on operating expenses and other shareholder costs, please refer to the Fund’s prospectus.
| WESTWOOD SALIENT MLP & ENERGY INFRASTRUCTURE FUND |
| |
| | | Beginning | | Ending | | | | |
| | | Account Value | | Account Value | | | | Expenses Paid |
| | | July 1, | | December 31, | | Net Expense | | During |
| | | 2023 | | 2023 | | Ratio (a) | | Period (b) |
| Institutional Shares | | | | | | | | |
| Based on Actual Fund Return | | $1,000.00 | | $1,081.90 | | 1.11% | | $5.82 |
| Based on Hypothetical 5% Return (before expenses) | | $1,000.00 | | $1,019.61 | | 1.11% | | $5.65 |
| A Class Shares | | | | | | | | |
| Based on Actual Fund Return | | $1,000.00 | | $1,080.00 | | 1.34% | | $7.03 |
| Based on Hypothetical 5% Return (before expenses) | | $1,000.00 | | $1,018.45 | | 1.34% | | $6.82 |
| C Class Shares | | | | | | | | |
| Based on Actual Fund Return | | $1,000.00 | | $1,077.80 | | 2.06% | | $10.79 |
| Based on Hypothetical 5% Return (before expenses) | | $1,000.00 | | $1,014.82 | | 2.06% | | $10.46 |
| Ultra Shares | | | | | | | | |
| Based on Actual Fund Return | | $1,000.00 | | $1,082.20 | | 1.10% | | $5.77 |
| Based on Hypothetical 5% Return (before expenses) | | $1,000.00 | | $1,019.66 | | 1.10% | | $5.60 |
| (a) | Annualized, based on each Class’s most recent one-half year expenses. |
| (b) | Expenses are equal to each Class’s annualized net expense ratio multiplied by the average account value over the period, multiplied by 184/365 (to reflect the one-half year period), for Actual and Hypothetical Return information, respectively. |
| OTHER INFORMATION (Unaudited) |
The Trust files a complete listing of portfolio holdings for the Fund with the U.S. Securities and Exchange Commission (“SEC”) as of the end of the first and third quarters of each fiscal year as an exhibit to its report on Form N-PORT. The filings are available upon request, by calling 1-877-386-3944. Furthermore, you may obtain a copy of these filings on the SEC’s website at www.sec.gov and the Fund’s website at www.westwoodfunds.com.
A description of the policies and procedures that the Fund uses to vote proxies relating to portfolio securities is available without charge upon request by calling toll-free 1-877-386-3944, or on the SEC’s website at www.sec.gov. Information regarding how the Fund voted proxies relating to portfolio securities during the period ended June 30, will be available on or about August 31, without charge upon request by calling 1-877-386-3944, or on the SEC’s website at www.sec.gov.
| OTHER FEDERAL TAX INFORMATION (Unaudited) |
Qualified Dividend Income – The Fund designates 65.14% of its ordinary income dividends, or up to the maximum amount of such dividends allowable pursuant to the Internal Revenue Code, as qualified dividend income eligible for the reduced tax rate.
Dividends Received Deduction – Corporate shareholders are generally entitled to take the dividends received deduction on the portion of the Fund’s dividend distributions that qualifies under tax law. For the tax year ended November 30, 2023, the Fund had 61.81% ordinary income dividends qualified for the corporate dividends received deduction.
| WESTWOOD FUNDS |
| |
| |
| TRUSTEES AND OFFICERS OF ULTIMUS MANAGERS TRUST (Unaudited) |
The Board has overall responsibility for management of the Trust’s affairs. The Trustees serve during the lifetime of the Trust and until its termination, or until death, resignation, retirement, or removal. The Trustees, in turn, elect the officers of the Fund to actively supervise their day-to-day operations. The officers have been elected for an annual term. Each Trustee’s and officer’s address is 225 Pictoria Drive, Suite 450, Cincinnati, Ohio 45246. The following are the Trustees and executive officers of the Fund:
Name and
Year of Birth | Length of Time
Served | Position(s) held
with Trust | Principal Occupation(s) During Past 5 Years | Number of
Funds in the
Trust Overseen
By Trustee | Directorship(s) of Public
Companies Held By Trustee
During Past 5 Years |
| Independent Trustees: |
Janine L. Cohen
Year of Birth: 1952 | Since 2016 | Chairperson (2019 to present)
Trustee (2016 to present) | Retired; previously Chief Financial Officer from 2004 to 2013 and Chief Compliance Officer from 2008 to 2013 at AER Advisors, Inc. | 31 | n/a |
Robert E. Morrison
Year of Birth: 1957 | Since 2019 | Trustee (2019 to present; and previously 2012 to 2014) | Managing Director at Midwest Trust and FCI Advisors (2022 to present); Senior Vice President and National Practice Lead for Investment, Huntington National Bank/ Huntington Private Bank (2014 to 2022); CEO, CIO, President of 5 Star Investment Management Company (2006 to 2014) | 31 | n/a |
Clifford N. Schireson
Year of Birth: 1953 | Since 2019 | Trustee | Retired; Founder of Schireson Consulting, LLC (2017 to 2022); Director of Institutional Services for Brandes Investment Partners, LP (2004 to 2017) | 31 | Trustee of the San Diego City Employees’ Retirement System (2019 to present) |
Keith T. Shintani
Year of Birth: 1963 | Since 2024 | Trustee | Retired; Senior Vice President of Relationship Management at U.S. Bank Global Fund Services (1998 to 2022) | 31 | Trustee of the Matrix Advisors Funds Trust (2023 to present) |
Jacqueline A. Williams
Year of Birth: 1954 | Since 2019 | Trustee | Managing Member of Custom Strategy Consulting, LLC (2017 to present); Managing Director of Global Investment Research (2005 to 2017), Cambridge Associates, LLC | 31 | n/a |
| WESTWOOD FUNDS |
| |
| |
| TRUSTEES AND OFFICERS OF ULTIMUS MANAGERS TRUST (Unaudited) |
Name and
Year of Birth | Length of Time
Served | Position(s)
held with Trust | Principal Occupation(s) During Past 5 Years |
| Executive Officers: |
Todd E. Heim
Year of Birth: 1967 | 2021 to present
2014 to 2021 | President
Vice President | Senior Vice President, Relationship Management (2023 to present), Vice President, Relationship Management (2018 to 2023), and Assistant Vice President, Client Implementation Manager with Ultimus Fund Solutions, LLC (2014 to 2018) |
Shannon Thibeaux-Burgess
Year of Birth: 1970 | 2023 to present | Vice President | Senior Vice President, Relationship Management with Ultimus Fund Solutions, LLC (2022 to present); Head of Regulatory Service with J.P. Morgan Chase & Co. (2020 to 2022); Chief Administrative Officer of State Street Bank (2013 to 2020) |
Daniel D. Bauer
Year of Birth: 1977 | 2024 to present
2016 to 2024 | Treasurer
Assistant Treasurer | Vice President of Fund Accounting (2022 to present), Assistant Vice President of Fund Accounting (2020 to 2022), and AVP, Assistant Mutual Fund Controller (2015 to 2020) of Ultimus Fund Solutions, LLC |
Angela A. Simmons
Year of Birth: 1975 | 2022 to present | Assistant Treasurer | Vice President of Financial Administration (2022 to present) and Assistant Vice President, Financial Administration (2015 to 2022) of Ultimus Fund Solutions, LLC |
Susan J. Bateman
Year of Birth: 1966 | 2024 to present | Assistant Treasurer | Assistant Vice President of Financial Administration of Ultimus Fund Solutions, LLC (2023 to present) and Assistant Vice President, Financial Administration of Citi Fund Services, Inc. (2018 to 2023) |
Karen Jacoppo-Wood
Year of Birth: 1966 | 2023 to present | Secretary | Senior Vice President and Associate General Counsel of Ultimus Fund Solutions, LLC (2022 to present); Managing Director and Managing Counsel (2019 to 2022) and Vice President and Counsel (2014 to 2019) of State Street Bank and Trust Company |
Natalie S. Anderson
Year of Birth: 1975 | 2016 to present | Assistant Secretary | Legal Administration Manager (2016 to present) and Paralegal (2015 to 2016) of Ultimus Fund Solutions, LLC |
Jesse Hallee
Year of Birth: 1976 | 2023 to present | Assistant Secretary | Senior Vice President and Associate General Counsel of Ultimus Fund Solutions, LLC (June 2019 to present); Vice President and Managing Counsel, State Street Bank and Trust Company (2013 to 2019) |
Gweneth K. Gosselink
Year of Birth: 1955 | 2020 to present | Chief Compliance Officer | Assistant Vice President, Compliance Officer at Ultimus Fund Solutions, LLC (2019 to present); CCO Consultant at GKG Consulting, LLC (2019 to 2021); Chief Operating Officer & CCO at Miles Capital, Inc. (2013 to 2019) |
Martin Dean
Year of Birth: 1963 | 2020 to present 2019 to 2020 2016 to 2017 | Assistant Chief Compliance Officer Interim Chief Compliance Officer Assistant Chief Compliance Officer | President of Northern Lights Compliance Services, LLC (February 2023 to present); Senior Vice President, Head of Fund Compliance (2020 to January 2023) and Vice President & Director of Fund Compliance of Ultimus Fund Solutions, LLC (2016 to 2020) |
Additional information about member of the Board and executive officers is available in the Fund’s Statement of Additional Information (“SAI”). To obtain a free copy of the SAI, please call toll free 1-877-FUND-WHG (1-877-386-3944).
| |
| |
| |
| |
| |
| |
| |
| The Westwood Funds |
| P.O. Box 541150 |
| Omaha, NE 68154 |
| 1-877-FUND-WHG |
| www.westwoodfunds.com |
| |
| Adviser: |
| Westwood Management Corp. |
| 200 Crescent Court, Suite 1200 |
| Dallas, TX 75201 |
| |
| Distributor: |
| Ultimus Fund Distributors, LLC |
| 225 Pictoria Drive |
| Suite 450 |
| Cincinnati, OH 45246 |
| |
| Administrator: |
| Ultimus Fund Solutions, LLC |
| 225 Pictoria Drive |
| Suite 450 |
| Cincinnati, OH 45246 |
| |
| Legal Counsel: |
| Sullivan & Worcester LLP |
| 1666 K Streeet, NW |
| Suite 700 |
| Washington, D.C. 20006 |
| |
| Independent Registered Public Accounting Firm: |
| Cohen & Company, Ltd. |
| 1835 Market Street, Suite 310 |
| Philadelphia, PA 19103 |
| |
| |
| |
| |
| This information must be preceded or accompanied by a current |
| prospectus for the Funds. |
| |
| |
| |
| |
| WestwoodMLP-AR-23 |
As of the end of the period covered by this report, the registrant has adopted a code of ethics that applies to the registrant’s principal executive officer, principal financial officer, principal accounting officer or controller, or persons performing similar functions, regardless of whether these individuals are employed by the registrant or a third party. Pursuant to Item 12(a)(1), a copy of registrant’s code of ethics is filed as an exhibit to this Form N-CSR. During the period covered by this report, the code of ethics has not been amended, and the registrant has not granted any waivers, including implicit waivers, from the provisions of the code of ethics.
| Item 3. | Audit Committee Financial Expert. |
The registrant’s board of trustees has determined that the registrant has at least one audit committee financial expert serving on its audit committee. The name of the audit committee financial expert is Janine L. Cohen. Ms. Cohen is “independent” for purposes of this Item.
| Item 4. | Principal Accountant Fees and Services. |
| (a) | Audit Fees. The aggregate fees billed for professional services rendered by the principal accountant for the audit of the registrant’s annual financial statements or for services that are normally provided by the accountant in connection with statutory and regulatory filings or engagements were $71,200 and $90,000 with respect to the registrant’s fiscal years ended December 31, 2023 and December 31, 2022, respectively. |
| (b) | Audit-Related Fees. No fees were billed in the first fiscal period for assurance and related services by the principal accountant that are reasonably related to the performance of the audit of the registrant’s financial statements and are not reported under paragraph (a) of this Item. |
| (c) | Tax Fees. The aggregate fees billed for professional services rendered by the principal accountant for tax compliance, tax advice, and tax planning were $5,700 and $20,000 with respect to the registrant’s fiscal years ended December 31, 2023, and December 31, 2022, respectively. The services comprising these fees are the preparation of the registrant’s federal income and excise tax returns. |
| (d) | All Other Fees. No fees were billed in the first fiscal period for products and services provided by the principal accountant, other than the services reported in paragraphs (a) through (c) of this Item. |
| (e)(1) | The audit committee has not adopted pre-approval policies and procedures described in paragraph (c)(7) of Rule 2-01 of Regulation S-X. |
| (e)(2) | None of the services described in paragraph (b) through (d) of this Item were approved by the audit committee pursuant to paragraph (c)(7)(i)(C) of Rule 2-01 of Regulation S-X. |
| (f) | Less than 50% of hours expended on the principal accountant’s engagement to audit the registrant’s financial statements for the most recent fiscal year were attributed to work performed by persons other than the principal accountant’s full-time, permanent employees. |
| (g) | During the fiscal years ended December 31, 2023 and December 31, 2022, aggregate non-audit fees of $5,700 and $20,000, respectively, were billed by the registrant’s accountant for services rendered to the registrant. No non-audit fees were billed in the last fiscal year by the registrant’s accountant for services rendered to the registrant’s investment adviser (not including any sub-adviser whose role is primarily portfolio management and is subcontracted with or overseen by another investment adviser), and any entity controlling, controlled by, or under common control with the adviser that provides ongoing services to the registrant. |
| (h) | The principal accountant has not provided any non-audit services to the registrant’s investment adviser (not including any sub-adviser whose role is primarily portfolio management and is subcontracted with or overseen by another investment adviser), and any entity controlling, controlled by, or under common control with the investment adviser that provides ongoing services to the registrant. |
(j) Not applicable
| Item 5. | Audit Committee of Listed Registrants. |
Not applicable
| Item 6. | Schedule of Investments. |
| (a) | Not applicable [schedule filed with Item 1] |
| Item 7. | Disclosure of Proxy Voting Policies and Procedures for Closed-End Management Investment Companies. |
Not applicable
| Item 8. | Portfolio Managers of Closed-End Management Investment Companies. |
Not applicable
| Item 9. | Purchases of Equity Securities by Closed-End Management Investment Company and Affiliated Purchasers. |
Not applicable
Item 10. Submission of Matters to a Vote of Security Holders.
There have been no material changes to the manner in which shareholders may recommend nominees to the Registrant’s Board of Trustees or the Nominations & Governance Committee (the “Committee”). The Registrant does not have formal procedures by which shareholders may recommend nominees to the Registrant’s Board of Trustees. While the Registrant does not have formal procedure, the Committee shall to the extent required under applicable law, when identifying potential candidates for the position of Independent Trustee, consider any such candidate recommended by a shareholder.
| Item 11. | Controls and Procedures. |
(a) Based on their evaluation of the registrant’s disclosure controls and procedures (as defined in Rule 30a-3(c) under the Investment Company Act of 1940) as of a date within 90 days of the filing date of this report, the registrant’s principal executive officer and principal financial officer have concluded that such disclosure controls and procedures are reasonably designed and are operating effectively to ensure that material information relating to the registrant, including its consolidated subsidiaries, is made known to them by others within those entities, particularly during the period in which this report is being prepared, and that the information required in filings on Form N-CSR is recorded, processed, summarized, and reported on a timely basis.
(b) There were no changes in the registrant’s internal control over financial reporting (as defined in Rule 30a-3(d) under the Investment Company Act of 1940) that occurred during the period covered by this
report that have materially affected, or are reasonably likely to materially affect, the registrant’s internal control over financial reporting.
| Item 12. | Disclosure of Securities Lending Activities for Closed-End Management Investment Companies. |
Not applicable.
File the exhibits listed below as part of this Form. Letter or number the exhibits in the sequence indicated.
(a)(1) Any code of ethics, or amendment thereto, that is the subject of the disclosure required by Item 2, to the extent that the registrant intends to satisfy the Item 2 requirements through filing of an exhibit: Attached hereto
(a)(2) A separate certification for each principal executive officer and principal financial officer of the registrant as required by Rule 30a-2(a) under the Act (17 CFR 270.30a-2(a)): Attached hereto
(1) Any written solicitation to purchase securities under Rule 23c-1 under the Act (17 CFR 270.23c-1) sent or given during the period covered by the report by or on behalf of the registrant to 10 or more persons: Not applicable
(2) Change in the registrant’s independent public accountants: Not applicable.
(b) Certifications required by Rule 30a-2(b) under the Act (17 CFR 270.30a-2(b)): Attached hereto
Exhibit 99.CODE ETH Code of Ethics
Exhibit 99.CERT Certifications required by Rule 30a-2(a) under the Act
Exhibit 99.906CERT Certifications required by Rule 30a-2(b) under the Act
SIGNATURES
Pursuant to the requirements of the Securities Exchange Act of 1934 and the Investment Company Act of 1940, the registrant has duly caused this report to be signed on its behalf by the undersigned, thereunto duly authorized.
| (Registrant) | Ultimus Managers Trust | | |
| | | | |
| By (Signature and Title)* | /s/ Todd E. Heim | |
| | | Todd E. Heim, President | |
| | | | |
| Date | March 6, 2024 | | |
| | | | |
| Pursuant to the requirements of the Securities Exchange Act of 1934 and the Investment Company Act of 1940, this report has been signed below by the following persons on behalf of the registrant and in the capacities and on the dates indicated. |
| | | |
| By (Signature and Title)* | /s/ Todd E. Heim |
| | | Todd E. Heim, Principal Executive Officer |
| | | |
| Date | March 6, 2024 | |
| | | |
| By (Signature and Title)* | /s/ Daniel D. Bauer |
| | | Daniel D. Bauer, Treasurer and Principal Financial Officer |
| | | |
| Date | March 6, 2024 | |
* Print the name and title of each signing officer under his or her signature.