| UNITED STATES |
| SECURITIES AND EXCHANGE COMMISSION |
| Washington, D.C. 20549 |
| FORM N-CSR |
| CERTIFIED SHAREHOLDER REPORT OF REGISTERED |
| MANAGEMENT INVESTMENT COMPANIES |
| Investment Company Act file number | 811-22680 | |
| Ultimus Managers Trust |
| (Exact name of registrant as specified in charter) |
| 225 Pictoria Drive, Suite 450 Cincinnati, Ohio | 45246 |
| (Address of principal executive offices) | (Zip code) |
Karen Jacoppo-Wood
| Ultimus Fund Solutions, LLC 225 Pictoria Drive, Suite 450 Cincinnati, Ohio 45246 |
| (Name and address of agent for service) |
| Registrant’s telephone number, including area code: | (513) 587-3400 | |
| Date of fiscal year end: | October 31 | |
| Date of reporting period: | October 31, 2024 | |
Form N-CSR is to be used by management investment companies to file reports with the Commission not later than 10 days after the transmission to stockholders of any report that is required to be transmitted to stockholders under Rule 30e-1 under the Investment Company Act of 1940 (17 CFR 270.30e-1). The Commission may use the information provided on Form N-CSR in its regulatory, disclosure review, inspection, and policymaking roles.
A registrant is required to disclose the information specified by Form N-CSR, and the Commission will make this information public. A registrant is not required to respond to the collection of information contained in Form N-CSR unless the Form displays a currently valid Office of Management and Budget (“OMB”) control number. Please direct comments concerning the accuracy of the information collection burden estimate and any suggestions for reducing the burden to Secretary, Securities and Exchange Commission, 450 Fifth Street, NW, Washington, DC 20549-0609. The OMB has reviewed this collection of information under the clearance requirements of 44 U.S.C. § 3507.
| Item 1. | Reports to Stockholders. |
| (a) | Tailored Shareholder Report |
Westwood Quality Value Fund

Institutional Shares (WHGLX)
Annual Shareholder Report - October 31, 2024
Fund Overview
This annual shareholder report contains important information about Westwood Quality Value Fund (the "Fund") for the period of November 1, 2023 to October 31, 2024. You can find additional information about the Fund at https://westwoodgroup.com/product/quality-value-fund/. You can also request this information by contacting us at (877) 386-3944.
What were the Fund’s costs for the last year?
(based on a hypothetical $10,000 investment)
| Class Name | Costs of a $10,000 investment | Costs paid as a percentage of a $10,000 investment |
|---|---|---|
| Institutional Shares | $69 | 0.62% |
How did the Fund perform during the reporting period?
During the trailing period, the Westwood Quality Value Fund gained ground in a bull market that kicked off in October 2022. The equity market was supported by strong economic growth, moderating inflation, and relatively stable employment.
Value strategies, however, were out of fashion, as the “Magnificent 7” — large-cap growth stocks, mostly in the technology sector — were the top performers, driven in large part by expected returns coming from implementation and commercialization of artificial intelligence.
Our top performing sectors for the period were the Financials and Communication Services sectors. Returns in Financials were driven by large banks, supported by rising interest rates which helped drive higher net interest income. Communication Services was helped by our allocation to Alphabet Inc. (GOOGL), one of the Magnificent 7 stocks.
The Energy and Consumer Staples sectors were the laggards, though both finished with positive returns. The Energy sector was impacted by the declining price of oil, while our Consumer Staples holdings were hindered by two stocks that performed poorly; both were sold from the portfolio.
Among our top holdings, the financials sector was well-represented by JPMorgan Chase (JPM) and Goldman Sachs Group (GS), two large banks that benefited from higher interest rates, while Goldman Sachs took market share within investment banking and trading.
Defense contractors CACI International (CACI) and Hubble Incorporated (HUBB) are both well-positioned to gain from increased spending on electronics, cyber security and aeronautics.
In the technology sector, Microsoft Corp. (MSFT) stands to benefit from the company’s Azure cloud computing platform and the potential of the AI-driven CoPilot service. And Salesforce Inc. (CRM) offers strong potential, including incorporating AI into their corporate customer relationship management software.
How has the Fund performed over the last ten years?
Total Return Based on $100,000 Investment
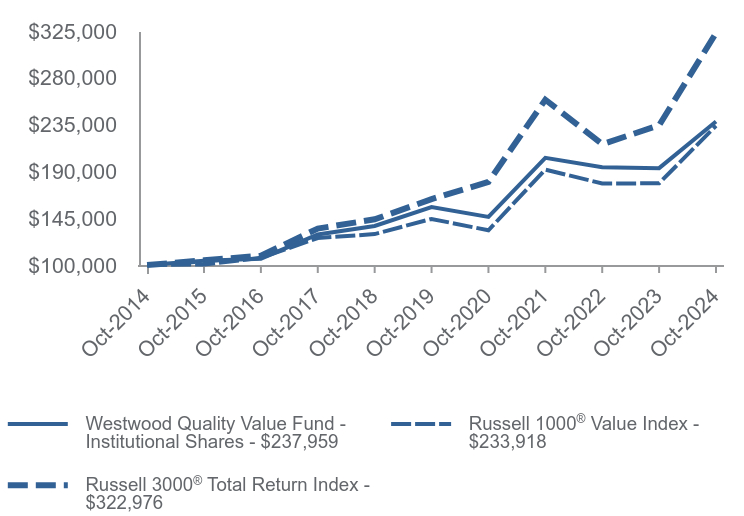
| Westwood Quality Value Fund - Institutional Shares | Russell 1000® Value Index | Russell 3000® Total Return Index | |
|---|---|---|---|
| Oct-2014 | $100,000 | $100,000 | $100,000 |
| Oct-2015 | $104,001 | $100,530 | $104,490 |
| Oct-2016 | $106,083 | $106,934 | $108,923 |
| Oct-2017 | $129,421 | $125,948 | $135,043 |
| Oct-2018 | $137,572 | $129,770 | $143,950 |
| Oct-2019 | $155,771 | $144,321 | $163,368 |
| Oct-2020 | $146,257 | $133,403 | $179,947 |
| Oct-2021 | $202,998 | $191,776 | $258,943 |
| Oct-2022 | $194,118 | $178,357 | $216,171 |
| Oct-2023 | $193,125 | $178,596 | $234,287 |
| Oct-2024 | $237,959 | $233,918 | $322,976 |
Average Annual Total Returns as of 10/31/2024
| 1 Year | 5 Years | 10 Years | |
|---|---|---|---|
| Westwood Quality Value Fund - Institutional Shares | 23.22% | 8.84% | 9.06% |
Russell 1000® Value Index | 30.98% | 10.14% | 8.87% |
Russell 3000® Total Return Index | 37.86% | 14.60% | 12.44% |
Past performance does not guarantee future results. Call (877) 386-3944 or visit https://westwoodgroup.com/product/quality-value-fund/ for current month-end performance.
Fund Statistics
- Net Assets$213,198,404
- Number of Portfolio Holdings51
- Advisory Fee (net of waivers)$898,333
- Portfolio Turnover42%
Asset Weighting (% of total investments)

| Value | Value |
|---|---|
| Common Stocks | 99.0% |
| Money Market Funds | 1.0% |
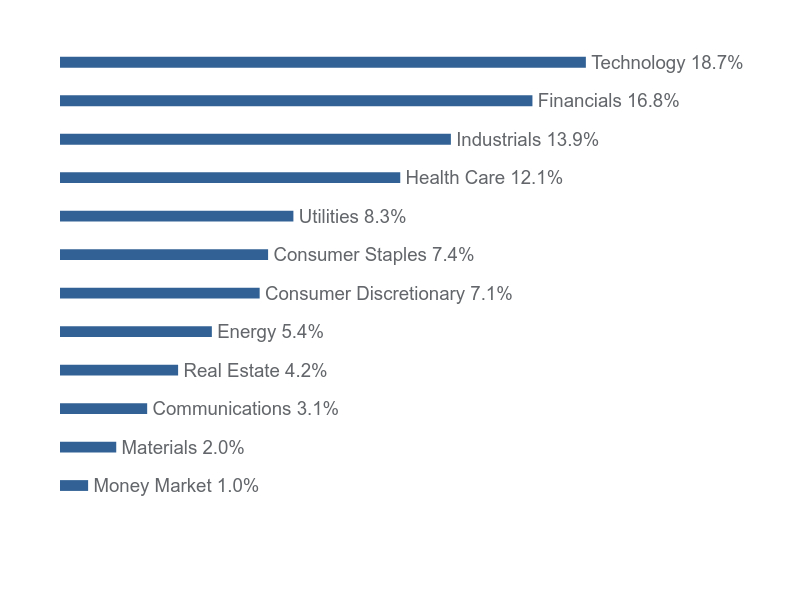
What did the Fund invest in?
Sector Weighting (% of net assets)

| Value | Value |
|---|---|
| Money Market | 1.0% |
| Materials | 2.0% |
| Communications | 3.1% |
| Real Estate | 4.2% |
| Energy | 5.4% |
| Consumer Discretionary | 7.1% |
| Consumer Staples | 7.4% |
| Utilities | 8.3% |
| Health Care | 12.1% |
| Industrials | 13.9% |
| Financials | 16.8% |
| Technology | 18.7% |
Top 10 Holdings (% of net assets)
| Holding Name | % of Net Assets |
| JPMorgan Chase & Company | 3.7% |
| UnitedHealth Group, Inc. | 3.4% |
| Microsoft Corporation | 3.1% |
| Abbott Laboratories | 3.0% |
| Union Pacific Corporation | 2.8% |
| Visa, Inc. - Class A | 2.7% |
| Goldman Sachs Group, Inc. (The) | 2.6% |
| CACI International, Inc. - Class A | 2.4% |
| Hubbell, Inc. | 2.3% |
| Salesforce, Inc. | 2.3% |
Material Fund Changes
No material changes occurred during the year ended October 31, 2024.

Westwood Quality Value Fund - Institutional Shares (WHGLX)
Annual Shareholder Report - October 31, 2024
Where can I find additional information about the Fund?
Additional information is available on the Fund's website (https://westwoodgroup.com/product/quality-value-fund/), including its:
Prospectus
Financial information
Holdings
Proxy voting information
TSR-AR 103124-WHGLX
Westwood Quality Value Fund

A Class Shares (WWLAX)
Annual Shareholder Report - October 31, 2024
Fund Overview
This annual shareholder report contains important information about Westwood Quality Value Fund (the "Fund") for the period of November 1, 2023 to October 31, 2024. You can find additional information about the Fund at https://westwoodgroup.com/product/quality-value-fund/. You can also request this information by contacting us at (877) 386-3944.
What were the Fund’s costs for the last year?
(based on a hypothetical $10,000 investment)
| Class Name | Costs of a $10,000 investment | Costs paid as a percentage of a $10,000 investment |
|---|---|---|
| A Class Shares | $89 | 0.80% |
How did the Fund perform during the reporting period?
During the trailing period, the Westwood Quality Value Fund gained ground in a bull market that kicked off in October 2022. The equity market was supported by strong economic growth, moderating inflation, and relatively stable employment.
Value strategies, however, were out of fashion, as the “Magnificent 7” — large-cap growth stocks, mostly in the technology sector — were the top performers, driven in large part by expected returns coming from implementation and commercialization of artificial intelligence.
Our top performing sectors for the period were the Financials and Communication Services sectors. Returns in Financials were driven by large banks, supported by rising interest rates which helped drive higher net interest income. Communication Services was helped by our allocation to Alphabet Inc. (GOOGL), one of the Magnificent 7 stocks.
The Energy and Consumer Staples sectors were the laggards, though both finished with positive returns. The Energy sector was impacted by the declining price of oil, while our Consumer Staples holdings were hindered by two stocks that performed poorly; both were sold from the portfolio.
Among our top holdings, the financials sector was well-represented by JPMorgan Chase (JPM) and Goldman Sachs Group (GS), two large banks that benefited from higher interest rates, while Goldman Sachs took market share within investment banking and trading.
Defense contractors CACI International (CACI) and Hubble Incorporated (HUBB) are both well-positioned to gain from increased spending on electronics, cyber security and aeronautics.
In the technology sector, Microsoft Corp. (MSFT) stands to benefit from the company’s Azure cloud computing platform and the potential of the AI-driven CoPilot service. And Salesforce Inc. (CRM) offers strong potential, including incorporating AI into their corporate customer relationship management software.
How has the Fund performed over the last ten years?
Total Return Based on $10,000 Investment
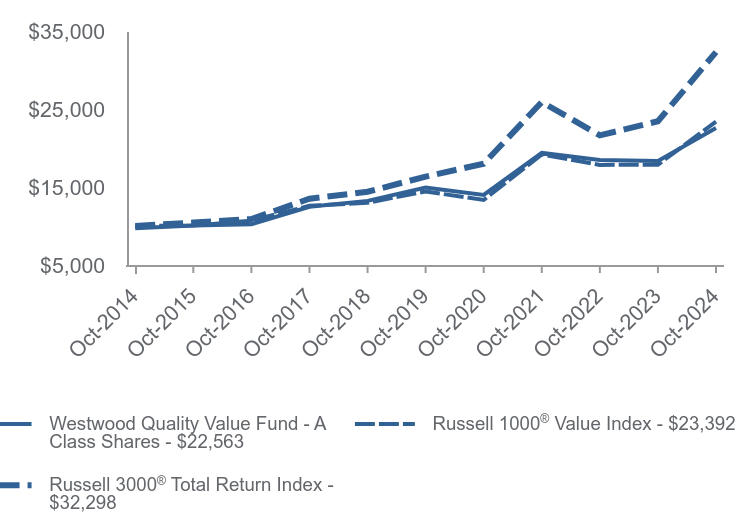
| Westwood Quality Value Fund - A Class Shares | Russell 1000® Value Index | Russell 3000® Total Return Index | |
|---|---|---|---|
| Oct-2014 | $9,702 | $10,000 | $10,000 |
| Oct-2015 | $10,064 | $10,053 | $10,449 |
| Oct-2016 | $10,240 | $10,693 | $10,892 |
| Oct-2017 | $12,475 | $12,595 | $13,504 |
| Oct-2018 | $13,225 | $12,977 | $14,395 |
| Oct-2019 | $14,934 | $14,432 | $16,337 |
| Oct-2020 | $13,990 | $13,340 | $17,995 |
| Oct-2021 | $19,371 | $19,178 | $25,894 |
| Oct-2022 | $18,471 | $17,836 | $21,617 |
| Oct-2023 | $18,333 | $17,860 | $23,429 |
| Oct-2024 | $22,563 | $23,392 | $32,298 |
Average Annual Total Returns as of 10/31/2024
| 1 Year | 5 Years | 10 Years | |
|---|---|---|---|
| Westwood Quality Value Fund - A Class Shares | |||
| Without Load | 23.07% | 8.60% | 8.81% |
| With Load* | 19.39% | 7.94% | 8.48% |
Russell 1000® Value Index | 30.98% | 10.14% | 8.87% |
Russell 3000® Total Return Index | 37.86% | 14.60% | 12.44% |
Past performance does not guarantee future results. Call (877) 386-3944 or visit https://westwoodgroup.com/product/quality-value-fund/ for current month-end performance.
* Reflects the maximum sales charge applicable to A Class Shares.
Fund Statistics
- Net Assets$213,198,404
- Number of Portfolio Holdings51
- Advisory Fee (net of waivers)$898,333
- Portfolio Turnover42%
Asset Weighting (% of total investments)

| Value | Value |
|---|---|
| Common Stocks | 99.0% |
| Money Market Funds | 1.0% |
What did the Fund invest in?
Sector Weighting (% of net assets)

| Value | Value |
|---|---|
| Money Market | 1.0% |
| Materials | 2.0% |
| Communications | 3.1% |
| Real Estate | 4.2% |
| Energy | 5.4% |
| Consumer Discretionary | 7.1% |
| Consumer Staples | 7.4% |
| Utilities | 8.3% |
| Health Care | 12.1% |
| Industrials | 13.9% |
| Financials | 16.8% |
| Technology | 18.7% |
Top 10 Holdings (% of net assets)
| Holding Name | % of Net Assets |
| JPMorgan Chase & Company | 3.7% |
| UnitedHealth Group, Inc. | 3.4% |
| Microsoft Corporation | 3.1% |
| Abbott Laboratories | 3.0% |
| Union Pacific Corporation | 2.8% |
| Visa, Inc. - Class A | 2.7% |
| Goldman Sachs Group, Inc. (The) | 2.6% |
| CACI International, Inc. - Class A | 2.4% |
| Hubbell, Inc. | 2.3% |
| Salesforce, Inc. | 2.3% |
Material Fund Changes
No material changes occurred during the year ended October 31, 2024.

Westwood Quality Value Fund - A Class Shares (WWLAX)
Annual Shareholder Report - October 31, 2024
Where can I find additional information about the Fund?
Additional information is available on the Fund's website (https://westwoodgroup.com/product/quality-value-fund/), including its:
Prospectus
Financial information
Holdings
Proxy voting information
TSR-AR 103124-WWLAX
Westwood Quality Value Fund

C Class Shares (WWLCX)
Annual Shareholder Report - October 31, 2024
Fund Overview
This annual shareholder report contains important information about Westwood Quality Value Fund (the "Fund") for the period of November 1, 2023 to October 31, 2024. You can find additional information about the Fund at https://westwoodgroup.com/product/quality-value-fund/. You can also request this information by contacting us at (877) 386-3944.
What were the Fund’s costs for the last year?
(based on a hypothetical $10,000 investment)
| Class Name | Costs of a $10,000 investment | Costs paid as a percentage of a $10,000 investment |
|---|---|---|
| C Class Shares | $172 | 1.55% |
How did the Fund perform during the reporting period?
During the trailing period, the Westwood Quality Value Fund gained ground in a bull market that kicked off in October 2022. The equity market was supported by strong economic growth, moderating inflation, and relatively stable employment.
Value strategies, however, were out of fashion, as the “Magnificent 7” — large-cap growth stocks, mostly in the technology sector — were the top performers, driven in large part by expected returns coming from implementation and commercialization of artificial intelligence.
Our top performing sectors for the period were the Financials and Communication Services sectors. Returns in Financials were driven by large banks, supported by rising interest rates which helped drive higher net interest income. Communication Services was helped by our allocation to Alphabet Inc. (GOOGL), one of the Magnificent 7 stocks.
The Energy and Consumer Staples sectors were the laggards, though both finished with positive returns. The Energy sector was impacted by the declining price of oil, while our Consumer Staples holdings were hindered by two stocks that performed poorly; both were sold from the portfolio.
Among our top holdings, the financials sector was well-represented by JPMorgan Chase (JPM) and Goldman Sachs Group (GS), two large banks that benefited from higher interest rates, while Goldman Sachs took market share within investment banking and trading.
Defense contractors CACI International (CACI) and Hubble Incorporated (HUBB) are both well-positioned to gain from increased spending on electronics, cyber security and aeronautics.
In the technology sector, Microsoft Corp. (MSFT) stands to benefit from the company’s Azure cloud computing platform and the potential of the AI-driven CoPilot service. And Salesforce Inc. (CRM) offers strong potential, including incorporating AI into their corporate customer relationship management software.
How has the Fund performed since inception?
Total Return Based on $10,000 Investment
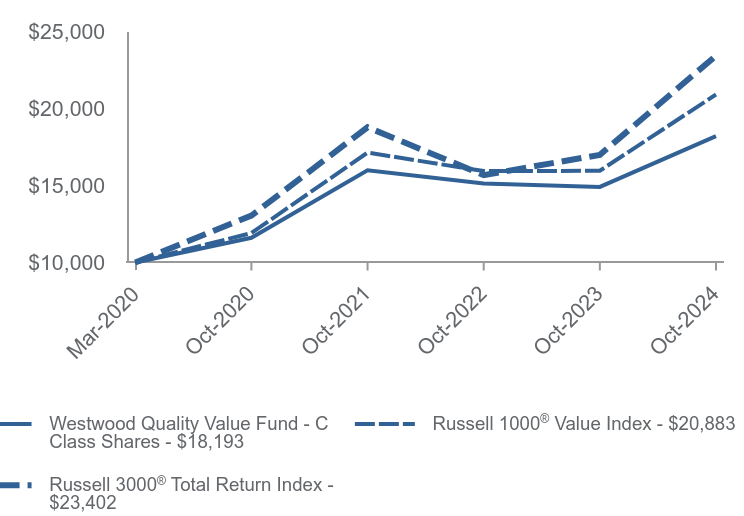
| Westwood Quality Value Fund - C Class Shares | Russell 1000® Value Index | Russell 3000® Total Return Index | |
|---|---|---|---|
| Mar-2020 | $10,000 | $10,000 | $10,000 |
| Oct-2020 | $11,603 | $11,910 | $13,039 |
| Oct-2021 | $15,978 | $17,121 | $18,763 |
| Oct-2022 | $15,122 | $15,923 | $15,663 |
| Oct-2023 | $14,896 | $15,944 | $16,976 |
| Oct-2024 | $18,193 | $20,883 | $23,402 |
Average Annual Total Returns as of 10/31/2024
| 1 Year | Since Inception (March 31, 2020) | |
|---|---|---|
| Westwood Quality Value Fund - C Class Shares | ||
| Without CDSC | 22.14% | 13.94% |
| With CDSC | 21.14% | 13.94% |
Russell 1000® Value Index | 30.98% | 17.42% |
Russell 3000® Total Return Index | 37.86% | 20.37% |
Past performance does not guarantee future results. Call (877) 386-3944 or visit https://westwoodgroup.com/product/quality-value-fund/ for current month-end performance.
Fund Statistics
- Net Assets$213,198,404
- Number of Portfolio Holdings51
- Advisory Fee (net of waivers)$898,333
- Portfolio Turnover42%
Asset Weighting (% of total investments)

| Value | Value |
|---|---|
| Common Stocks | 99.0% |
| Money Market Funds | 1.0% |
What did the Fund invest in?
Sector Weighting (% of net assets)
| Value | Value |
|---|---|
| Money Market | 1.0% |
| Materials | 2.0% |
| Communications | 3.1% |
| Real Estate | 4.2% |
| Energy | 5.4% |
| Consumer Discretionary | 7.1% |
| Consumer Staples | 7.4% |
| Utilities | 8.3% |
| Health Care | 12.1% |
| Industrials | 13.9% |
| Financials | 16.8% |
| Technology | 18.7% |
Top 10 Holdings (% of net assets)
| Holding Name | % of Net Assets |
| JPMorgan Chase & Company | 3.7% |
| UnitedHealth Group, Inc. | 3.4% |
| Microsoft Corporation | 3.1% |
| Abbott Laboratories | 3.0% |
| Union Pacific Corporation | 2.8% |
| Visa, Inc. - Class A | 2.7% |
| Goldman Sachs Group, Inc. (The) | 2.6% |
| CACI International, Inc. - Class A | 2.4% |
| Hubbell, Inc. | 2.3% |
| Salesforce, Inc. | 2.3% |
Material Fund Changes
No material changes occurred during the year ended October 31, 2024.

Westwood Quality Value Fund - C Class Shares (WWLCX)
Annual Shareholder Report - October 31, 2024
Where can I find additional information about the Fund?
Additional information is available on the Fund's website (https://westwoodgroup.com/product/quality-value-fund/), including its:
Prospectus
Financial information
Holdings
Proxy voting information
TSR-AR 103124-WWLCX
Westwood Quality Value Fund

Ultra Shares (WHGQX)
Annual Shareholder Report - October 31, 2024
Fund Overview
This annual shareholder report contains important information about Westwood Quality Value Fund (the "Fund") for the period of November 1, 2023 to October 31, 2024. You can find additional information about the Fund at https://westwoodgroup.com/product/quality-value-fund/. You can also request this information by contacting us at (877) 386-3944.
What were the Fund’s costs for the last year?
(based on a hypothetical $10,000 investment)
| Class Name | Costs of a $10,000 investment | Costs paid as a percentage of a $10,000 investment |
|---|---|---|
| Ultra Shares | $61 | 0.55% |
How did the Fund perform during the reporting period?
During the trailing period, the Westwood Quality Value Fund gained ground in a bull market that kicked off in October 2022. The equity market was supported by strong economic growth, moderating inflation, and relatively stable employment.
Value strategies, however, were out of fashion, as the “Magnificent 7” — large-cap growth stocks, mostly in the technology sector — were the top performers, driven in large part by expected returns coming from implementation and commercialization of artificial intelligence.
Our top performing sectors for the period were the Financials and Communication Services sectors. Returns in Financials were driven by large banks, supported by rising interest rates which helped drive higher net interest income. Communication Services was helped by our allocation to Alphabet Inc. (GOOGL), one of the Magnificent 7 stocks.
The Energy and Consumer Staples sectors were the laggards, though both finished with positive returns. The Energy sector was impacted by the declining price of oil, while our Consumer Staples holdings were hindered by two stocks that performed poorly; both were sold from the portfolio.
Among our top holdings, the financials sector was well-represented by JPMorgan Chase (JPM) and Goldman Sachs Group (GS), two large banks that benefited from higher interest rates, while Goldman Sachs took market share within investment banking and trading.
Defense contractors CACI International (CACI) and Hubble Incorporated (HUBB) are both well-positioned to gain from increased spending on electronics, cyber security and aeronautics.
In the technology sector, Microsoft Corp. (MSFT) stands to benefit from the company’s Azure cloud computing platform and the potential of the AI-driven CoPilot service. And Salesforce Inc. (CRM) offers strong potential, including incorporating AI into their corporate customer relationship management software.
How has the Fund performed since inception?
Total Return Based on $1,000,000 Investment
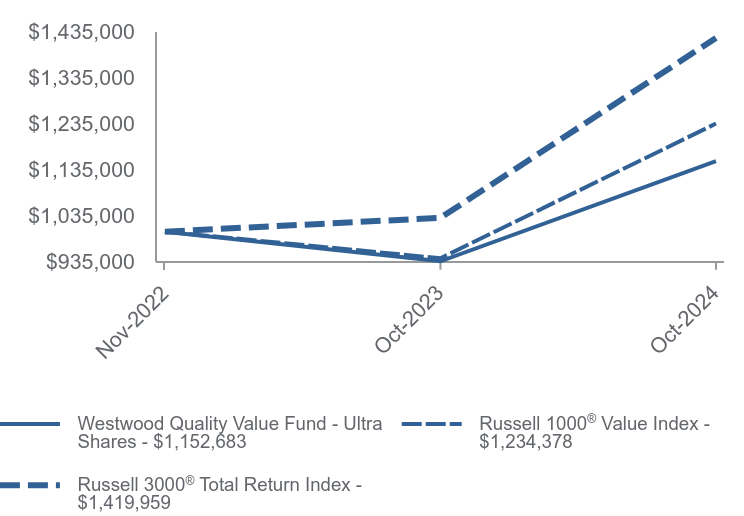
| Westwood Quality Value Fund - Ultra Shares | Russell 1000® Value Index | Russell 3000® Total Return Index | |
|---|---|---|---|
| Nov-2022 | $1,000,000 | $1,000,000 | $1,000,000 |
| Oct-2023 | $935,845 | $942,444 | $1,030,037 |
| Oct-2024 | $1,152,683 | $1,234,378 | $1,419,959 |
Average Annual Total Returns as of 10/31/2024
| 1 Year | Since Inception (November 30, 2022) | |
|---|---|---|
| Westwood Quality Value Fund - Ultra Shares | 23.17% | 7.69% |
Russell 1000® Value Index | 30.98% | 11.61% |
Russell 3000® Total Return Index | 37.86% | 20.06% |
Past performance does not guarantee future results. Call (877) 386-3944 or visit https://westwoodgroup.com/product/quality-value-fund/ for current month-end performance.
Fund Statistics
- Net Assets$213,198,404
- Number of Portfolio Holdings51
- Advisory Fee (net of waivers)$898,333
- Portfolio Turnover42%
Asset Weighting (% of total investments)
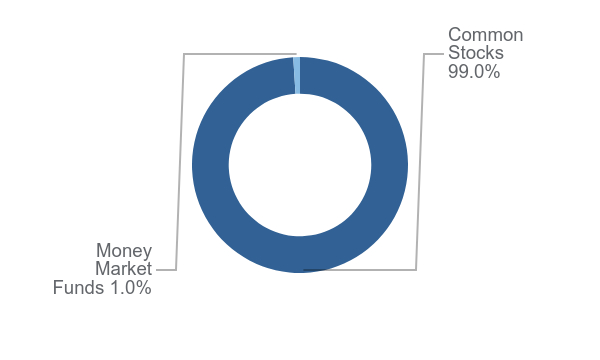
| Value | Value |
|---|---|
| Common Stocks | 99.0% |
| Money Market Funds | 1.0% |
What did the Fund invest in?
Sector Weighting (% of net assets)

| Value | Value |
|---|---|
| Money Market | 1.0% |
| Materials | 2.0% |
| Communications | 3.1% |
| Real Estate | 4.2% |
| Energy | 5.4% |
| Consumer Discretionary | 7.1% |
| Consumer Staples | 7.4% |
| Utilities | 8.3% |
| Health Care | 12.1% |
| Industrials | 13.9% |
| Financials | 16.8% |
| Technology | 18.7% |
Top 10 Holdings (% of net assets)
| Holding Name | % of Net Assets |
| JPMorgan Chase & Company | 3.7% |
| UnitedHealth Group, Inc. | 3.4% |
| Microsoft Corporation | 3.1% |
| Abbott Laboratories | 3.0% |
| Union Pacific Corporation | 2.8% |
| Visa, Inc. - Class A | 2.7% |
| Goldman Sachs Group, Inc. (The) | 2.6% |
| CACI International, Inc. - Class A | 2.4% |
| Hubbell, Inc. | 2.3% |
| Salesforce, Inc. | 2.3% |
Material Fund Changes
No material changes occurred during the year ended October 31, 2024.

Westwood Quality Value Fund - Ultra Shares (WHGQX)
Annual Shareholder Report - October 31, 2024
Where can I find additional information about the Fund?
Additional information is available on the Fund's website (https://westwoodgroup.com/product/quality-value-fund/), including its:
Prospectus
Financial information
Holdings
Proxy voting information
TSR-AR 103124-WHGQX
Westwood Quality MidCap Fund

Institutional Shares (WWMCX)
Annual Shareholder Report - October 31, 2024
Fund Overview
This annual shareholder report contains important information about Westwood Quality MidCap Fund (the "Fund") for the period of November 1, 2023 to October 31, 2024. You can find additional information about the Fund at https://westwoodgroup.com/product/quality-midcap-fund/. You can also request this information by contacting us at (877) 386-3944.
What were the Fund’s costs for the last year?
(based on a hypothetical $10,000 investment)
| Class Name | Costs of a $10,000 investment | Costs paid as a percentage of a $10,000 investment |
|---|---|---|
| Institutional Shares | $79 | 0.69% |
How did the Fund perform during the reporting period?
In a rousing year for equity investors, the Westwood Quality MidCap Fund delivered attractive absolute performance but trailed its benchmark.
Stocks were supported by strong economic growth, moderating inflation and relatively stable employment. Value strategies, however, lagged the broader market as the “Magnificent 7” — high-performing large-cap growth stocks concentrated in tech — gained ground, propelled by projected benefits from AI adoption and commercialization.
Our top-performing sectors were Materials, Financials and Industrials, also our top three sector weights. Our returns in the Industrials sector were driven in part by resurgent defense spending and increased home construction. The weakest-performing sector was Energy, though our positions gained ground for the year; three exploration and production companies declined during the period.
Two financial firms were among our top three holdings. Insurer American International Group (AIG) was our top holding; the company is a good illustration of our philosophy of quality and value, as a new management team has a strong operational plan to improve margins, while the Street is largely unaware of the improvements. Investment bank Piper Sandler Companies (PIPR) is another example of a company undergoing change that is not fully recognized by the market, as the company is tilting toward higher-margin advisory business and away from asset management.
We increased our allocation to Summit Materials (SUM) during the period, as the industrial company has seen improved pricing in cement and aggregate; they also stand to benefit from strategic acquisitions. Defense contractor CACI International (CACI) was also among our top holdings, as the Department of Defense emphasizes cyberwar capabilities and global threats increase. Senior living REIT Ventas Inc. (VTR) stands to benefit as an aging population needs their inventory of senior housing, skilled nursing facilities, hospitals and medical offices.
How has the Fund performed since inception?
Total Return Based on $100,000 Investment
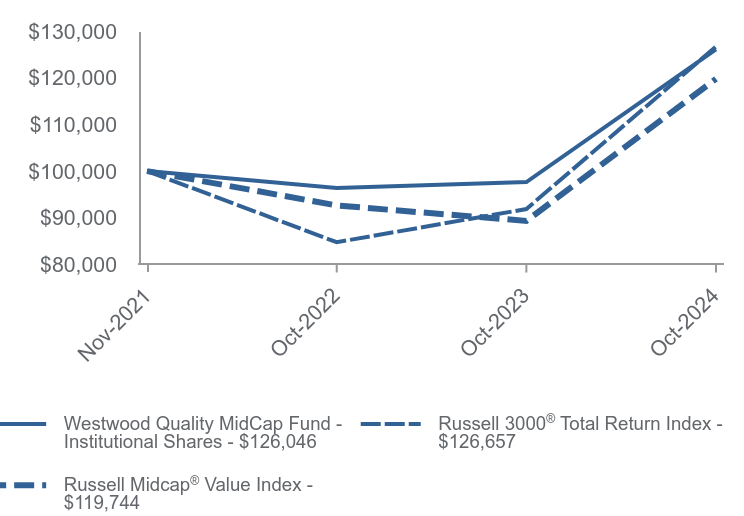
| Westwood Quality MidCap Fund - Institutional Shares | Russell 3000® Total Return Index | Russell Midcap® Value Index | |
|---|---|---|---|
| Nov-2021 | $100,000 | $100,000 | $100,000 |
| Oct-2022 | $96,400 | $84,773 | $92,640 |
| Oct-2023 | $97,641 | $91,877 | $89,339 |
| Oct-2024 | $126,046 | $126,657 | $119,744 |
Average Annual Total Returns as of 10/31/2024
| 1 Year | Since Inception (November 30, 2021) | |
|---|---|---|
| Westwood Quality MidCap Fund - Institutional Shares | 29.09% | 8.26% |
Russell 3000® Total Return Index | 37.86% | 8.44% |
Russell Midcap® Value Index | 34.03% | 6.37% |
Past performance does not guarantee future results. Call (877) 386-3944 or visit https://westwoodgroup.com/product/quality-midcap-fund/ for current month-end performance.
Fund Statistics
- Net Assets$1,991,483
- Number of Portfolio Holdings62
- Advisory Fee (net of waivers)$0
- Portfolio Turnover56%
Asset Weighting (% of total investments)
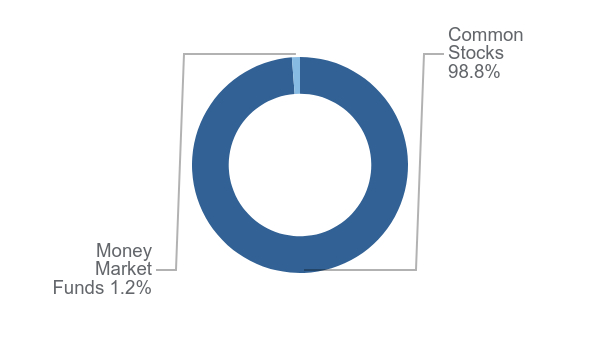
| Value | Value |
|---|---|
| Common Stocks | 98.8% |
| Money Market Funds | 1.2% |
What did the Fund invest in?
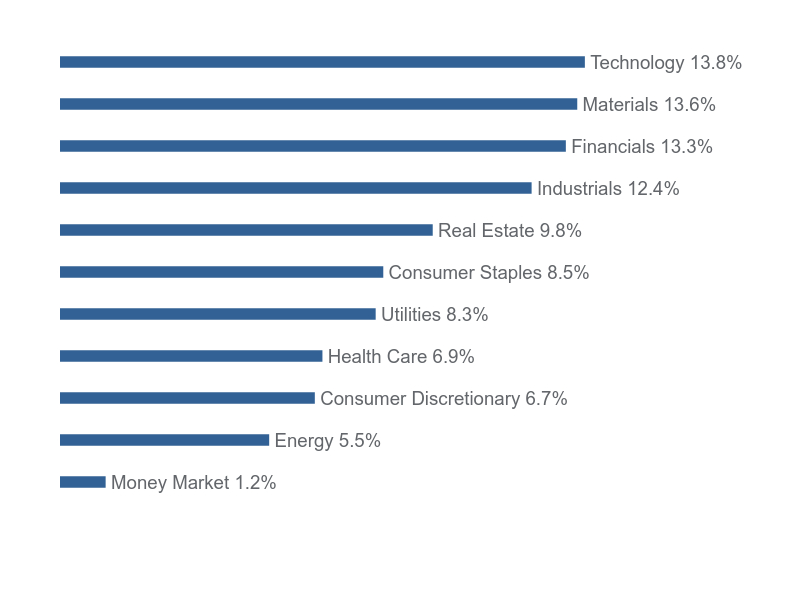
Sector Weighting (% of net assets)
| Value | Value |
|---|---|
| Money Market | 1.2% |
| Energy | 5.5% |
| Consumer Discretionary | 6.7% |
| Health Care | 6.9% |
| Utilities | 8.3% |
| Consumer Staples | 8.5% |
| Real Estate | 9.8% |
| Industrials | 12.4% |
| Financials | 13.3% |
| Materials | 13.6% |
| Technology | 13.8% |
Top 10 Holdings (% of net assets)
| Holding Name | % of Net Assets |
| American International Group, Inc. | 2.6% |
| Summit Materials, Inc. - Class A | 2.3% |
| Piper Sandler Companies | 2.2% |
| CACI International, Inc. - Class A | 2.2% |
| CMS Energy Corporation | 2.1% |
| Cooper Companies, Inc. (The) | 2.1% |
| Ventas, Inc. | 2.1% |
| Evergy, Inc. | 2.1% |
| O'Reilly Automotive, Inc. | 2.1% |
| Crown Holdings, Inc. | 2.1% |
Material Fund Changes
No material changes occurred during the year ended October 31, 2024.

Westwood Quality MidCap Fund - Institutional Shares (WWMCX)
Annual Shareholder Report - October 31, 2024
Where can I find additional information about the Fund?
Additional information is available on the Fund's website (https://westwoodgroup.com/product/quality-midcap-fund/), including its:
Prospectus
Financial information
Holdings
Proxy voting information
TSR-AR 103124-WWMCX
Westwood Quality SMidCap Fund

Institutional Shares (WHGMX)
Annual Shareholder Report - October 31, 2024
Fund Overview
This annual shareholder report contains important information about Westwood Quality SMidCap Fund (the "Fund") for the period of November 1, 2023 to October 31, 2024. You can find additional information about the Fund at https://westwoodgroup.com/product/quality-smidcap-fund/. You can also request this information by contacting us at (877) 386-3944.
What were the Fund’s costs for the last year?
(based on a hypothetical $10,000 investment)
| Class Name | Costs of a $10,000 investment | Costs paid as a percentage of a $10,000 investment |
|---|---|---|
| Institutional Shares | $103 | 0.90% |
How did the Fund perform during the reporting period?
In a stirring year for equity investors, the Westwood Quality SMidCap Fund gained nearly 30%; however, the strategy also trailed its benchmark.
Resilient economic growth, a tempering of inflation and steady labor market conditions provided a foundation for stock market strength. Despite the market’s strength, value strategies trailed as the “Magnificent 7” — top-performing large-cap growth stocks in the tech sector — surged on optimism surrounding AI-driven opportunities.
Performance was driven by the Financials and Consumer Discretionary sectors, primarily from banks and specialty retailers. Our Energy allocation provided negative returns, as falling oil prices impacted exploration and production companies.
We increased our allocation to Financials, as interest rates stabilized and banks improved profit margins. We also increased our allocation to Information Technology. We reduced our position in Materials, as a couple of positions graduated out of the portfolio, and in Consumer Discretionary, where we ended the period with more positions but a reduced allocation.
Among our top holdings, financial firms are heavily represented. Investment banker Piper Sandler Companies (PIPR) is shifting from asset management to the higher-margin advisory business. Cullen/Frost Bankers (CFR), Wintrust Financial Corp. (WTFC) and Glacier Bancorp (GBCI) are each community banks that have gained market share through acquisitions, managed costs and improved their net interest income.
We increased our allocation to Summit Materials (SUM) during the period, as the company has seen improved pricing in cement and aggregate; they also stand to benefit from strategic acquisitions.
Finally, we added to our position in Kratos Defense & Security Solutions (KTOS). The defense contractor makes unmanned combat vehicles (drones) as well as ground systems for satellites and space vehicles; it’s well-positioned to benefit from increased defense spending on next-generation munitions.
How has the Fund performed over the last ten years?
Total Return Based on $100,000 Investment
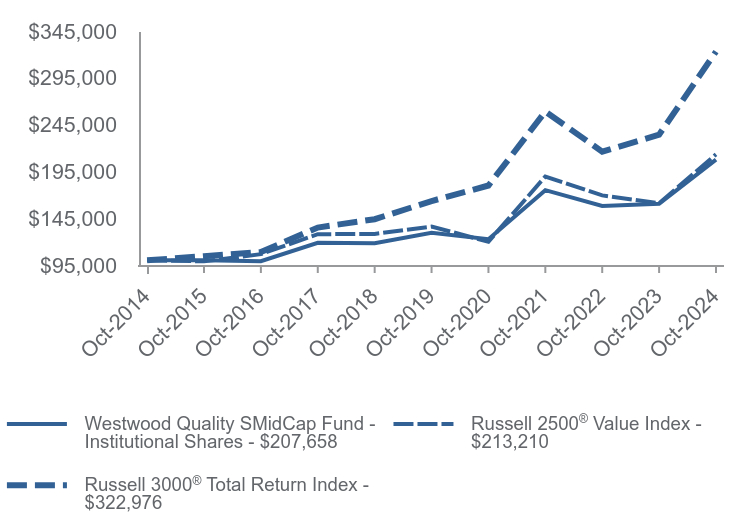
| Westwood Quality SMidCap Fund - Institutional Shares | Russell 2500® Value Index | Russell 3000® Total Return Index | |
|---|---|---|---|
| Oct-2014 | $100,000 | $100,000 | $100,000 |
| Oct-2015 | $100,139 | $98,940 | $104,490 |
| Oct-2016 | $99,056 | $106,633 | $108,923 |
| Oct-2017 | $118,698 | $127,926 | $135,043 |
| Oct-2018 | $118,300 | $128,274 | $143,950 |
| Oct-2019 | $129,492 | $136,093 | $163,368 |
| Oct-2020 | $122,508 | $119,878 | $179,947 |
| Oct-2021 | $175,006 | $189,580 | $258,943 |
| Oct-2022 | $158,128 | $169,377 | $216,171 |
| Oct-2023 | $160,369 | $161,010 | $234,287 |
| Oct-2024 | $207,658 | $213,210 | $322,976 |
Average Annual Total Returns as of 10/31/2024
| 1 Year | 5 Years | 10 Years | |
|---|---|---|---|
| Westwood Quality SMidCap Fund - Institutional Shares | 29.49% | 9.91% | 7.58% |
Russell 2500® Value Index | 32.42% | 9.39% | 7.87% |
Russell 3000® Total Return Index | 37.86% | 14.60% | 12.44% |
Past performance does not guarantee future results. Call (877) 386-3944 or visit https://westwoodgroup.com/product/quality-smidcap-fund/ for current month-end performance.
Fund Statistics
- Net Assets$104,235,884
- Number of Portfolio Holdings66
- Advisory Fee (net of waivers)$1,312,138
- Portfolio Turnover73%
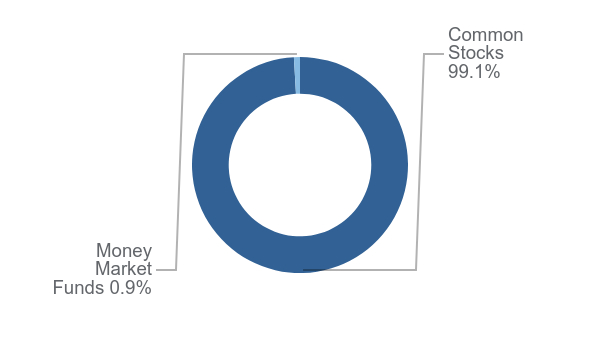
Asset Weighting (% of total investments)

| Value | Value |
|---|---|
| Common Stocks | 99.1% |
| Money Market Funds | 0.9% |
What did the Fund invest in?
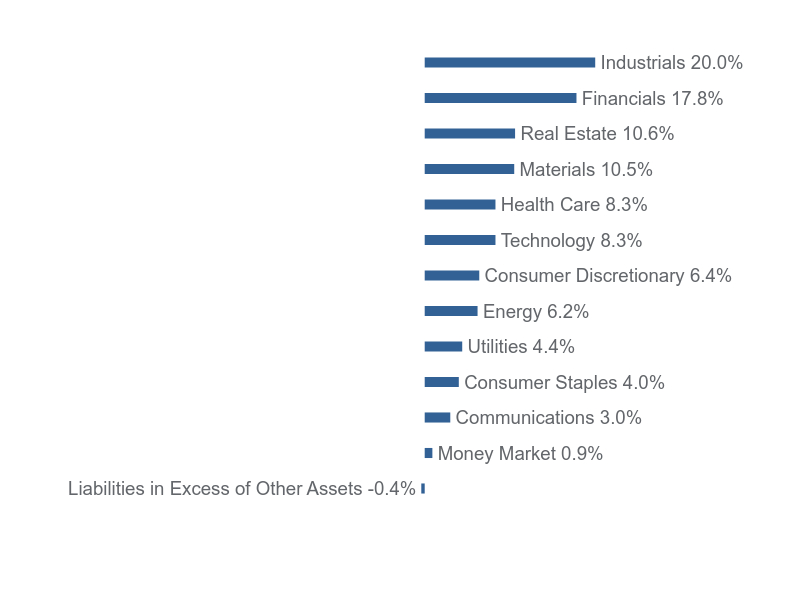
Sector Weighting (% of net assets)

| Value | Value |
|---|---|
| Liabilities in Excess of Other Assets | -0.4% |
| Money Market | 0.9% |
| Communications | 3.0% |
| Consumer Staples | 4.0% |
| Utilities | 4.4% |
| Energy | 6.2% |
| Consumer Discretionary | 6.4% |
| Technology | 8.3% |
| Health Care | 8.3% |
| Materials | 10.5% |
| Real Estate | 10.6% |
| Financials | 17.8% |
| Industrials | 20.0% |
Top 10 Holdings (% of net assets)
| Holding Name | % of Net Assets |
| Summit Materials, Inc. - Class A | 2.6% |
| IDACORP, Inc. | 2.4% |
| Cullen/Frost Bankers, Inc. | 2.4% |
| Wintrust Financial Corporation | 2.2% |
| XPO, Inc. | 2.2% |
| Piper Sandler Companies | 2.2% |
| COPT Defense Properties | 2.1% |
| Glacier Bancorp, Inc. | 2.1% |
| Kratos Defense & Security Solutions, Inc. | 2.1% |
| Rambus, Inc. | 2.1% |
Material Fund Changes
No material changes occurred during the year ended October 31, 2024.

Westwood Quality SMidCap Fund - Institutional Shares (WHGMX)
Annual Shareholder Report - October 31, 2024
Where can I find additional information about the Fund?
Additional information is available on the Fund's website (https://westwoodgroup.com/product/quality-smidcap-fund/), including its:
Prospectus
Financial information
Holdings
Proxy voting information
TSR-AR 103124-WHGMX
Westwood Quality SMidCap Fund

Ultra Shares (WWSMX)
Annual Shareholder Report - October 31, 2024
Fund Overview
This annual shareholder report contains important information about Westwood Quality SMidCap Fund (the "Fund") for the period of November 1, 2023 to October 31, 2024. You can find additional information about the Fund at https://westwoodgroup.com/product/quality-smidcap-fund/. You can also request this information by contacting us at (877) 386-3944.
What were the Fund’s costs for the last year?
(based on a hypothetical $10,000 investment)
| Class Name | Costs of a $10,000 investment | Costs paid as a percentage of a $10,000 investment |
|---|---|---|
| Ultra Shares | $80 | 0.70% |
How did the Fund perform during the reporting period?
In a stirring year for equity investors, the Westwood Quality SMidCap Fund gained nearly 30%; however, the strategy also trailed its benchmark.
Resilient economic growth, a tempering of inflation and steady labor market conditions provided a foundation for stock market strength. Despite the market’s strength, value strategies trailed as the “Magnificent 7” — top-performing large-cap growth stocks in the tech sector — surged on optimism surrounding AI-driven opportunities.
Performance was driven by the Financials and Consumer Discretionary sectors, primarily from banks and specialty retailers. Our Energy allocation provided negative returns, as falling oil prices impacted exploration and production companies.
We increased our allocation to Financials, as interest rates stabilized and banks improved profit margins. We also increased our allocation to Information Technology. We reduced our position in Materials, as a couple of positions graduated out of the portfolio, and in Consumer Discretionary, where we ended the period with more positions but a reduced allocation.
Among our top holdings, financial firms are heavily represented. Investment banker Piper Sandler Companies (PIPR) is shifting from asset management to the higher-margin advisory business. Cullen/Frost Bankers (CFR), Wintrust Financial Corp. (WTFC) and Glacier Bancorp (GBCI) are each community banks that have gained market share through acquisitions, managed costs and improved their net interest income.
We increased our allocation to Summit Materials (SUM) during the period, as the company has seen improved pricing in cement and aggregate; they also stand to benefit from strategic acquisitions.
Finally, we added to our position in Kratos Defense & Security Solutions (KTOS). The defense contractor makes unmanned combat vehicles (drones) as well as ground systems for satellites and space vehicles; it’s well-positioned to benefit from increased defense spending on next-generation munitions.
How has the Fund performed since inception?
Total Return Based on $1,000,000 Investment
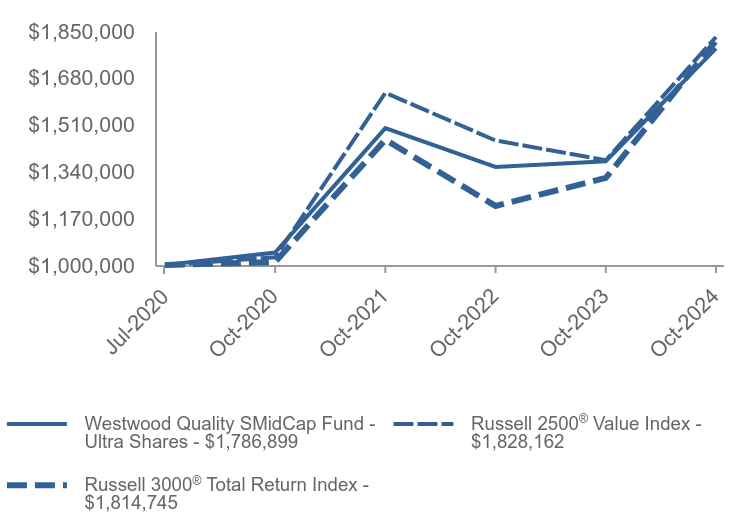
| Westwood Quality SMidCap Fund - Ultra Shares | Russell 2500® Value Index | Russell 3000® Total Return Index | |
|---|---|---|---|
| Jul-2020 | $1,000,000 | $1,000,000 | $1,000,000 |
| Oct-2020 | $1,045,455 | $1,027,886 | $1,011,091 |
| Oct-2021 | $1,497,011 | $1,625,548 | $1,454,952 |
| Oct-2022 | $1,356,077 | $1,452,319 | $1,214,627 |
| Oct-2023 | $1,376,925 | $1,380,575 | $1,316,414 |
| Oct-2024 | $1,786,899 | $1,828,162 | $1,814,745 |
Average Annual Total Returns as of 10/31/2024
| 1 Year | Since Inception (July 31, 2020) | |
|---|---|---|
| Westwood Quality SMidCap Fund - Ultra Shares | 29.77% | 14.63% |
Russell 2500® Value Index | 32.42% | 15.24% |
Russell 3000® Total Return Index | 37.86% | 15.05% |
Past performance does not guarantee future results. Call (877) 386-3944 or visit https://westwoodgroup.com/product/quality-smidcap-fund/ for current month-end performance.
Fund Statistics
- Net Assets$104,235,884
- Number of Portfolio Holdings66
- Advisory Fee (net of waivers)$1,312,138
- Portfolio Turnover73%
Asset Weighting (% of total investments)
| Value | Value |
|---|---|
| Common Stocks | 99.1% |
| Money Market Funds | 0.9% |
What did the Fund invest in?
Sector Weighting (% of net assets)
| Value | Value |
|---|---|
| Liabilities in Excess of Other Assets | -0.4% |
| Money Market | 0.9% |
| Communications | 3.0% |
| Consumer Staples | 4.0% |
| Utilities | 4.4% |
| Energy | 6.2% |
| Consumer Discretionary | 6.4% |
| Technology | 8.3% |
| Health Care | 8.3% |
| Materials | 10.5% |
| Real Estate | 10.6% |
| Financials | 17.8% |
| Industrials | 20.0% |
Top 10 Holdings (% of net assets)
| Holding Name | % of Net Assets |
| Summit Materials, Inc. - Class A | 2.6% |
| IDACORP, Inc. | 2.4% |
| Cullen/Frost Bankers, Inc. | 2.4% |
| Wintrust Financial Corporation | 2.2% |
| XPO, Inc. | 2.2% |
| Piper Sandler Companies | 2.2% |
| COPT Defense Properties | 2.1% |
| Glacier Bancorp, Inc. | 2.1% |
| Kratos Defense & Security Solutions, Inc. | 2.1% |
| Rambus, Inc. | 2.1% |
Material Fund Changes
No material changes occurred during the year ended October 31, 2024.

Westwood Quality SMidCap Fund - Ultra Shares (WWSMX)
Annual Shareholder Report - October 31, 2024
Where can I find additional information about the Fund?
Additional information is available on the Fund's website (https://westwoodgroup.com/product/quality-smidcap-fund/), including its:
Prospectus
Financial information
Holdings
Proxy voting information
TSR-AR 103124-WWSMX
Westwood Quality SmallCap Fund

Institutional Class Shares (WHGSX)
Annual Shareholder Report - October 31, 2024
Fund Overview
This annual shareholder report contains important information about Westwood Quality SmallCap Fund (the "Fund") for the period of November 1, 2023 to October 31, 2024. You can find additional information about the Fund at https://westwoodgroup.com/product/quality-smallcap-fund/. You can also request this information by contacting us at (877) 386-3944.
What were the Fund’s costs for the last year?
(based on a hypothetical $10,000 investment)
| Class Name | Costs of a $10,000 investment | Costs paid as a percentage of a $10,000 investment |
|---|---|---|
| Institutional Shares | $90 | 0.90% |
How did the Fund perform during the reporting period?
In an outstanding year for equity investors, the Westwood Quality SmallCap Fund produced a gain of over 20%, but the strategy trailed its benchmark.
The stock market was bolstered by a healthy economy, cooling inflation and steady job numbers. Despite the market’s overall strength, small-cap and value strategies trailed as the “Magnificent 7” — top-performing large-cap growth stocks in the tech sector — surged on optimism surrounding AI-driven opportunities.
The Financials sector was our top performer for the period, followed by the Industrials sector; the two sectors combined for more than three-fourths of the overall return of the fund. Information Technology and Energy were our weakest-performing sectors, both turning in negative returns.
We held five companies that were acquired by larger firms or private equity in the period. Masonite International was purchased by Owens Corning Corp in February 2024, Encore Wire Corp. was acquired by Italian firm Prysmian in April 2024, and restaurateur Chuy’s Holdings was bought out by Darden Corp. Private equity deals included aerospace technology firm Barnes Group Inc. being purchased by Apollo Global Management, while Duckhorn Portfolio Inc. was bought by Butterfly Equity. In each case, the buyout was accretive to the Fund.
Our top two holdings are in the energy sector: SM Energy Company (SM) has production primarily in the Permian Basin, while Northern Oil & Gas Inc. (NOG) has productive acreage in the Appalachians and the Williston Basin in the Dakotas and Montana.
Other top holdings include investment bank Piper Sandler Companies (PIPR) and regional banks The First Bancorp (FNLC), operating in Maine, and City Holding Company (CHCO), based in West Virginia. We also increased our exposure to Innospec Inc. (IOSP), a specialty chemical manufacturer that makes fuel additives as well as oilfield services chemicals; we believe the company’s strategic acquisitions can drive meaningful growth over the long term.
How has the Fund performed over the last ten years?
Total Return Based on $100,000 Investment
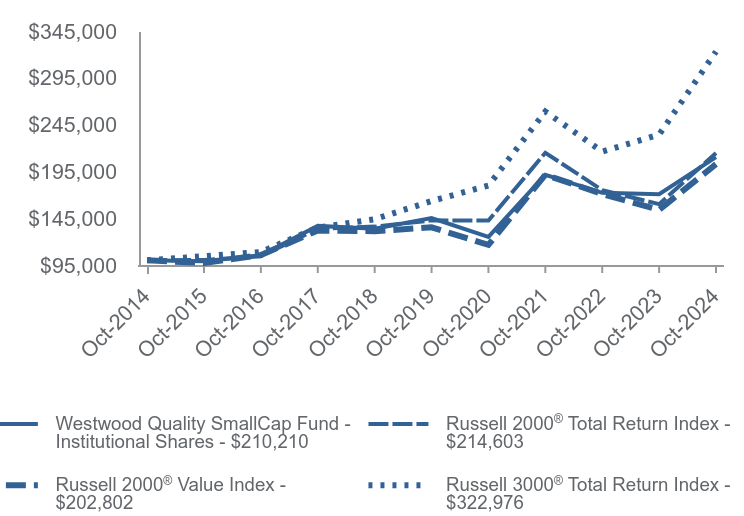
| Westwood Quality SmallCap Fund - Institutional Shares | Russell 2000® Total Return Index | Russell 2000® Value Index | Russell 3000® Total Return Index | |
|---|---|---|---|---|
| Oct-2014 | $100,000 | $100,000 | $100,000 | $100,000 |
| Oct-2015 | $99,129 | $100,336 | $97,122 | $104,490 |
| Oct-2016 | $105,469 | $104,463 | $105,680 | $108,923 |
| Oct-2017 | $136,806 | $133,554 | $131,898 | $135,043 |
| Oct-2018 | $133,691 | $136,029 | $131,119 | $143,950 |
| Oct-2019 | $145,261 | $142,701 | $135,340 | $163,368 |
| Oct-2020 | $125,069 | $142,505 | $116,500 | $179,947 |
| Oct-2021 | $191,443 | $214,900 | $191,407 | $258,943 |
| Oct-2022 | $172,155 | $175,055 | $170,874 | $216,171 |
| Oct-2023 | $170,574 | $160,062 | $153,907 | $234,287 |
| Oct-2024 | $210,210 | $214,603 | $202,802 | $322,976 |
Average Annual Total Returns as of 10/31/2024
| 1 Year | 5 Years | 10 Years | |
|---|---|---|---|
| Westwood Quality SmallCap Fund - Institutional Shares | 23.24% | 7.67% | 7.71% |
Russell 2000® Total Return Index | 34.07% | 8.50% | 7.94% |
Russell 2000® Value Index | 31.77% | 8.42% | 7.33% |
Russell 3000® Total Return Index | 37.86% | 14.60% | 12.44% |
Past performance does not guarantee future results. Call (877) 386-3944 or visit https://westwoodgroup.com/product/quality-smallcap-fund/ for current month-end performance.
Fund Statistics
- Net Assets$1,099,507,855
- Number of Portfolio Holdings62
- Advisory Fee (net of waivers)$8,427,209
- Portfolio Turnover57%
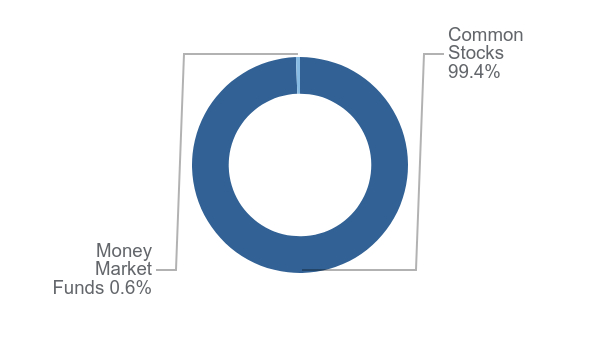
Asset Weighting (% of total investments)

| Value | Value |
|---|---|
| Common Stocks | 99.4% |
| Money Market Funds | 0.6% |
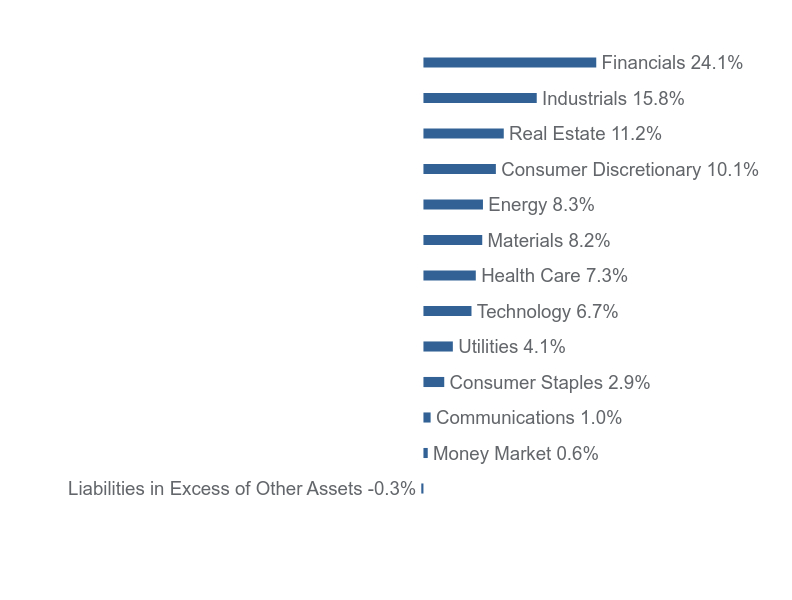
What did the Fund invest in?
Sector Weighting (% of net assets)

| Value | Value |
|---|---|
| Liabilities in Excess of Other Assets | -0.3% |
| Money Market | 0.6% |
| Communications | 1.0% |
| Consumer Staples | 2.9% |
| Utilities | 4.1% |
| Technology | 6.7% |
| Health Care | 7.3% |
| Materials | 8.2% |
| Energy | 8.3% |
| Consumer Discretionary | 10.1% |
| Real Estate | 11.2% |
| Industrials | 15.8% |
| Financials | 24.1% |
Top 10 Holdings (% of net assets)
| Holding Name | % of Net Assets |
| SM Energy Company | 2.8% |
| Northern Oil and Gas, Inc. | 2.6% |
| Urban Edge Properties | 2.2% |
| COPT Defense Properties | 2.2% |
| Piper Sandler Companies | 2.2% |
| Merit Medical Systems, Inc. | 2.2% |
| First Bancorp | 2.1% |
| City Holding Company | 2.1% |
| Innospec, Inc. | 2.1% |
| ArcBest Corporation | 2.1% |
Material Fund Changes
No material changes occurred during the year ended October 31, 2024.

Westwood Quality SmallCap Fund - Institutional Shares (WHGSX)
Annual Shareholder Report - October 31, 2024
Where can I find additional information about the Fund?
Additional information is available on the Fund's website (https://westwoodgroup.com/product/quality-smallcap-fund/), including its:
Prospectus
Financial information
Holdings
Proxy voting information
TSR-AR 103124-WHGSX
Westwood Quality SmallCap Fund

A Class Shares (WHGAX)
Annual Shareholder Report - October 31, 2024
Fund Overview
This annual shareholder report contains important information about Westwood Quality SmallCap Fund (the "Fund") for the period of November 1, 2023 to October 31, 2024. You can find additional information about the Fund at https://westwoodgroup.com/product/quality-smallcap-fund/. You can also request this information by contacting us at (877) 386-3944.
What were the Fund’s costs for the last year?
(based on a hypothetical $10,000 investment)
| Class Name | Costs of a $10,000 investment | Costs paid as a percentage of a $10,000 investment |
|---|---|---|
| A Class Shares | $104 | 1.04% |
How did the Fund perform during the reporting period?
In an outstanding year for equity investors, the Westwood Quality SmallCap Fund produced a gain of over 20%, but the strategy trailed its benchmark.
The stock market was bolstered by a healthy economy, cooling inflation and steady job numbers. Despite the market’s overall strength, small-cap and value strategies trailed as the “Magnificent 7” — top-performing large-cap growth stocks in the tech sector — surged on optimism surrounding AI-driven opportunities.
The Financials sector was our top performer for the period, followed by the Industrials sector; the two sectors combined for more than three-fourths of the overall return of the fund. Information Technology and Energy were our weakest-performing sectors, both turning in negative returns.
We held five companies that were acquired by larger firms or private equity in the period. Masonite International was purchased by Owens Corning Corp in February 2024, Encore Wire Corp. was acquired by Italian firm Prysmian in April 2024, and restaurateur Chuy’s Holdings was bought out by Darden Corp. Private equity deals included aerospace technology firm Barnes Group Inc. being purchased by Apollo Global Management, while Duckhorn Portfolio Inc. was bought by Butterfly Equity. In each case, the buyout was accretive to the Fund.
Our top two holdings are in the energy sector: SM Energy Company (SM) has production primarily in the Permian Basin, while Northern Oil & Gas Inc. (NOG) has productive acreage in the Appalachians and the Williston Basin in the Dakotas and Montana.
Other top holdings include investment bank Piper Sandler Companies (PIPR) and regional banks The First Bancorp (FNLC), operating in Maine, and City Holding Company (CHCO), based in West Virginia. We also increased our exposure to Innospec Inc. (IOSP), a specialty chemical manufacturer that makes fuel additives as well as oilfield services chemicals; we believe the company’s strategic acquisitions can drive meaningful growth over the long term.
How has the Fund performed since inception?
Total Return Based on $10,000 Investment
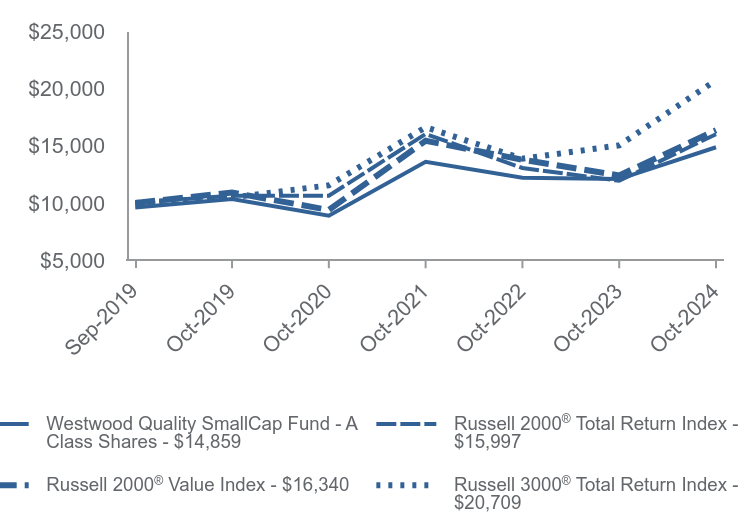
| Westwood Quality SmallCap Fund - A Class Shares | Russell 2000® Total Return Index | Russell 2000® Value Index | Russell 3000® Total Return Index | |
|---|---|---|---|---|
| Sep-2019 | $9,599 | $10,000 | $10,000 | $10,000 |
| Oct-2019 | $10,335 | $10,637 | $10,905 | $10,475 |
| Oct-2020 | $8,884 | $10,623 | $9,387 | $11,538 |
| Oct-2021 | $13,584 | $16,019 | $15,422 | $16,603 |
| Oct-2022 | $12,205 | $13,049 | $13,768 | $13,861 |
| Oct-2023 | $12,079 | $11,931 | $12,401 | $15,022 |
| Oct-2024 | $14,859 | $15,997 | $16,340 | $20,709 |
Average Annual Total Returns as of 10/31/2024
| 1 Year | 5 Years | Since Inception (September 3, 2019) | |
|---|---|---|---|
| Westwood Quality SmallCap Fund - A Class Shares | |||
| Without Load | 23.02% | 7.53% | 8.84% |
| With Load* | 18.10% | 6.66% | 7.98% |
Russell 2000® Total Return Index | 34.07% | 8.50% | 9.53% |
Russell 2000® Value Index | 31.77% | 8.42% | 9.99% |
Russell 3000® Total Return Index | 37.86% | 14.60% | 15.15% |
Past performance does not guarantee future results. Call (877) 386-3944 or visit https://westwoodgroup.com/product/quality-smallcap-fund/ for current month-end performance.
* Reflects the maximum sales charge applicable to A Class Shares.
Fund Statistics
- Net Assets$1,099,507,855
- Number of Portfolio Holdings62
- Advisory Fee (net of waivers)$8,427,209
- Portfolio Turnover57%
Asset Weighting (% of total investments)

| Value | Value |
|---|---|
| Common Stocks | 99.4% |
| Money Market Funds | 0.6% |
What did the Fund invest in?
Sector Weighting (% of net assets)

| Value | Value |
|---|---|
| Liabilities in Excess of Other Assets | -0.3% |
| Money Market | 0.6% |
| Communications | 1.0% |
| Consumer Staples | 2.9% |
| Utilities | 4.1% |
| Technology | 6.7% |
| Health Care | 7.3% |
| Materials | 8.2% |
| Energy | 8.3% |
| Consumer Discretionary | 10.1% |
| Real Estate | 11.2% |
| Industrials | 15.8% |
| Financials | 24.1% |
Top 10 Holdings (% of net assets)
| Holding Name | % of Net Assets |
| SM Energy Company | 2.8% |
| Northern Oil and Gas, Inc. | 2.6% |
| Urban Edge Properties | 2.2% |
| COPT Defense Properties | 2.2% |
| Piper Sandler Companies | 2.2% |
| Merit Medical Systems, Inc. | 2.2% |
| First Bancorp | 2.1% |
| City Holding Company | 2.1% |
| Innospec, Inc. | 2.1% |
| ArcBest Corporation | 2.1% |
Material Fund Changes
No material changes occurred during the year ended October 31, 2024.

Westwood Quality SmallCap Fund - A Class Shares (WHGAX)
Annual Shareholder Report - October 31, 2024
Where can I find additional information about the Fund?
Additional information is available on the Fund's website (https://westwoodgroup.com/product/quality-smallcap-fund/), including its:
Prospectus
Financial information
Holdings
Proxy voting information
TSR-AR 103124-WHGAX
Westwood Quality SmallCap Fund

C Class Shares (WHGCX)
Annual Shareholder Report - October 31, 2024
Fund Overview
This annual shareholder report contains important information about Westwood Quality SmallCap Fund (the "Fund") for the period of November 1, 2023 to October 31, 2024. You can find additional information about the Fund at https://westwoodgroup.com/product/quality-smallcap-fund/. You can also request this information by contacting us at (877) 386-3944.
What were the Fund’s costs for the last year?
(based on a hypothetical $10,000 investment)
| Class Name | Costs of a $10,000 investment | Costs paid as a percentage of a $10,000 investment |
|---|---|---|
| C Class Shares | $179 | 1.79% |
How did the Fund perform during the reporting period?
In an outstanding year for equity investors, the Westwood Quality SmallCap Fund produced a gain of over 20%, but the strategy trailed its benchmark.
The stock market was bolstered by a healthy economy, cooling inflation and steady job numbers. Despite the market’s overall strength, small-cap and value strategies trailed as the “Magnificent 7” — top-performing large-cap growth stocks in the tech sector — surged on optimism surrounding AI-driven opportunities.
The Financials sector was our top performer for the period, followed by the Industrials sector; the two sectors combined for more than three-fourths of the overall return of the fund. Information Technology and Energy were our weakest-performing sectors, both turning in negative returns.
We held five companies that were acquired by larger firms or private equity in the period. Masonite International was purchased by Owens Corning Corp in February 2024, Encore Wire Corp. was acquired by Italian firm Prysmian in April 2024, and restaurateur Chuy’s Holdings was bought out by Darden Corp. Private equity deals included aerospace technology firm Barnes Group Inc. being purchased by Apollo Global Management, while Duckhorn Portfolio Inc. was bought by Butterfly Equity. In each case, the buyout was accretive to the Fund.
Our top two holdings are in the energy sector: SM Energy Company (SM) has production primarily in the Permian Basin, while Northern Oil & Gas Inc. (NOG) has productive acreage in the Appalachians and the Williston Basin in the Dakotas and Montana.
Other top holdings include investment bank Piper Sandler Companies (PIPR) and regional banks The First Bancorp (FNLC), operating in Maine, and City Holding Company (CHCO), based in West Virginia. We also increased our exposure to Innospec Inc. (IOSP), a specialty chemical manufacturer that makes fuel additives as well as oilfield services chemicals; we believe the company’s strategic acquisitions can drive meaningful growth over the long term.
How has the Fund performed since inception?
Total Return Based on $10,000 Investment
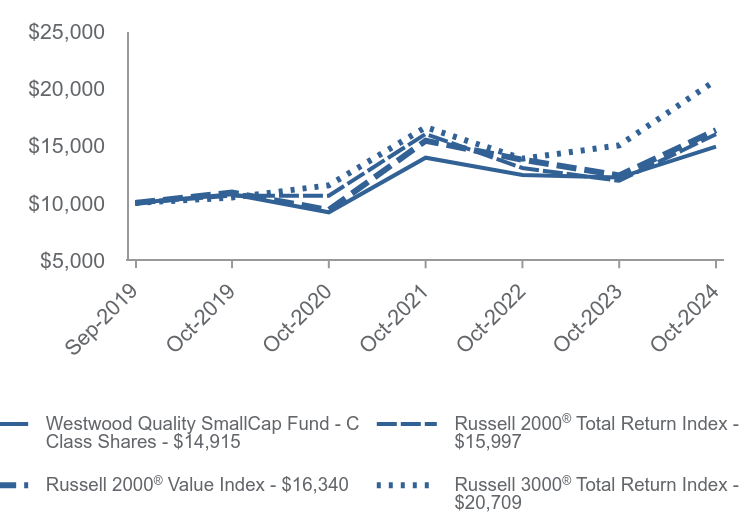
| Westwood Quality SmallCap Fund - C Class Shares | Russell 2000® Total Return Index | Russell 2000® Value Index | Russell 3000® Total Return Index | |
|---|---|---|---|---|
| Sep-2019 | $10,000 | $10,000 | $10,000 | $10,000 |
| Oct-2019 | $10,760 | $10,637 | $10,905 | $10,475 |
| Oct-2020 | $9,182 | $10,623 | $9,387 | $11,538 |
| Oct-2021 | $13,946 | $16,019 | $15,422 | $16,603 |
| Oct-2022 | $12,433 | $13,049 | $13,768 | $13,861 |
| Oct-2023 | $12,213 | $11,931 | $12,401 | $15,022 |
| Oct-2024 | $14,915 | $15,997 | $16,340 | $20,709 |
Average Annual Total Returns as of 10/31/2024
| 1 Year | 5 Years | Since Inception (September 3, 2019) | |
|---|---|---|---|
| Westwood Quality SmallCap Fund - C Class Shares | |||
| Without CDSC | 22.12% | 6.75% | 8.06% |
| With CDSC | 21.12% | 6.75% | 8.06% |
Russell 2000® Total Return Index | 34.07% | 8.50% | 9.53% |
Russell 2000® Value Index | 31.77% | 8.42% | 9.99% |
Russell 3000® Total Return Index | 37.86% | 14.60% | 15.15% |
Past performance does not guarantee future results. Call (877) 386-3944 or visit https://westwoodgroup.com/product/quality-smallcap-fund/ for current month-end performance.
Fund Statistics
- Net Assets$1,099,507,855
- Number of Portfolio Holdings62
- Advisory Fee (net of waivers)$8,427,209
- Portfolio Turnover57%
Asset Weighting (% of total investments)

| Value | Value |
|---|---|
| Common Stocks | 99.4% |
| Money Market Funds | 0.6% |
What did the Fund invest in?
Sector Weighting (% of net assets)

| Value | Value |
|---|---|
| Liabilities in Excess of Other Assets | -0.3% |
| Money Market | 0.6% |
| Communications | 1.0% |
| Consumer Staples | 2.9% |
| Utilities | 4.1% |
| Technology | 6.7% |
| Health Care | 7.3% |
| Materials | 8.2% |
| Energy | 8.3% |
| Consumer Discretionary | 10.1% |
| Real Estate | 11.2% |
| Industrials | 15.8% |
| Financials | 24.1% |
Top 10 Holdings (% of net assets)
| Holding Name | % of Net Assets |
| SM Energy Company | 2.8% |
| Northern Oil and Gas, Inc. | 2.6% |
| Urban Edge Properties | 2.2% |
| COPT Defense Properties | 2.2% |
| Piper Sandler Companies | 2.2% |
| Merit Medical Systems, Inc. | 2.2% |
| First Bancorp | 2.1% |
| City Holding Company | 2.1% |
| Innospec, Inc. | 2.1% |
| ArcBest Corporation | 2.1% |
Material Fund Changes
No material changes occurred during the year ended October 31, 2024.

Westwood Quality SmallCap Fund - C Class Shares (WHGCX)
Annual Shareholder Report - October 31, 2024
Where can I find additional information about the Fund?
Additional information is available on the Fund's website (https://westwoodgroup.com/product/quality-smallcap-fund/), including its:
Prospectus
Financial information
Holdings
Proxy voting information
TSR-AR 103124-WHGCX
Westwood Quality SmallCap Fund

Ultra Shares (WWSYX)
Annual Shareholder Report - October 31, 2024
Fund Overview
This annual shareholder report contains important information about Westwood Quality SmallCap Fund (the "Fund") for the period of November 1, 2023 to October 31, 2024. You can find additional information about the Fund at https://westwoodgroup.com/product/quality-smallcap-fund/. You can also request this information by contacting us at (877) 386-3944.
What were the Fund’s costs for the last year?
(based on a hypothetical $10,000 investment)
| Class Name | Costs of a $10,000 investment | Costs paid as a percentage of a $10,000 investment |
|---|---|---|
| Ultra Shares | $79 | 0.79% |
How did the Fund perform during the reporting period?
In an outstanding year for equity investors, the Westwood Quality SmallCap Fund produced a gain of over 20%, but the strategy trailed its benchmark.
The stock market was bolstered by a healthy economy, cooling inflation and steady job numbers. Despite the market’s overall strength, small-cap and value strategies trailed as the “Magnificent 7” — top-performing large-cap growth stocks in the tech sector — surged on optimism surrounding AI-driven opportunities.
The Financials sector was our top performer for the period, followed by the Industrials sector; the two sectors combined for more than three-fourths of the overall return of the fund. Information Technology and Energy were our weakest-performing sectors, both turning in negative returns.
We held five companies that were acquired by larger firms or private equity in the period. Masonite International was purchased by Owens Corning Corp in February 2024, Encore Wire Corp. was acquired by Italian firm Prysmian in April 2024, and restaurateur Chuy’s Holdings was bought out by Darden Corp. Private equity deals included aerospace technology firm Barnes Group Inc. being purchased by Apollo Global Management, while Duckhorn Portfolio Inc. was bought by Butterfly Equity. In each case, the buyout was accretive to the Fund.
Our top two holdings are in the energy sector: SM Energy Company (SM) has production primarily in the Permian Basin, while Northern Oil & Gas Inc. (NOG) has productive acreage in the Appalachians and the Williston Basin in the Dakotas and Montana.
Other top holdings include investment bank Piper Sandler Companies (PIPR) and regional banks The First Bancorp (FNLC), operating in Maine, and City Holding Company (CHCO), based in West Virginia. We also increased our exposure to Innospec Inc. (IOSP), a specialty chemical manufacturer that makes fuel additives as well as oilfield services chemicals; we believe the company’s strategic acquisitions can drive meaningful growth over the long term.
How has the Fund performed since inception?
Total Return Based on $1,000,000 Investment
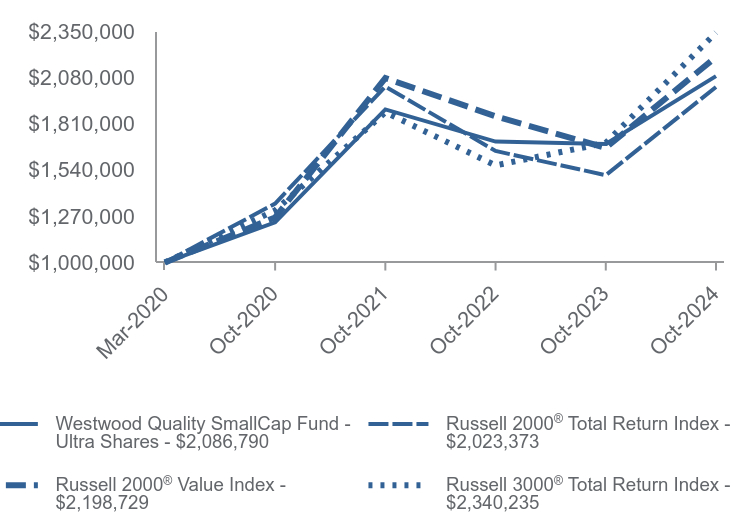
| Westwood Quality SmallCap Fund - Ultra Shares | Russell 2000® Total Return Index | Russell 2000® Value Index | Russell 3000® Total Return Index | |
|---|---|---|---|---|
| Mar-2020 | $1,000,000 | $1,000,000 | $1,000,000 | $1,000,000 |
| Oct-2020 | $1,234,642 | $1,343,605 | $1,263,060 | $1,303,870 |
| Oct-2021 | $1,892,643 | $2,026,172 | $2,075,187 | $1,876,258 |
| Oct-2022 | $1,705,007 | $1,650,500 | $1,852,574 | $1,566,342 |
| Oct-2023 | $1,690,889 | $1,509,137 | $1,668,618 | $1,697,604 |
| Oct-2024 | $2,086,790 | $2,023,373 | $2,198,729 | $2,340,235 |
Average Annual Total Returns as of 10/31/2024
| 1 Year | Since Inception (March 31, 2020) | |
|---|---|---|
| Westwood Quality SmallCap Fund - Ultra Shares | 23.41% | 17.40% |
Russell 2000® Total Return Index | 34.07% | 16.61% |
Russell 2000® Value Index | 31.77% | 18.74% |
Russell 3000® Total Return Index | 37.86% | 20.37% |
Past performance does not guarantee future results. Call (877) 386-3944 or visit https://westwoodgroup.com/product/quality-smallcap-fund/ for current month-end performance.
Fund Statistics
- Net Assets$1,099,507,855
- Number of Portfolio Holdings62
- Advisory Fee (net of waivers)$8,427,209
- Portfolio Turnover57%
Asset Weighting (% of total investments)
| Value | Value |
|---|---|
| Common Stocks | 99.4% |
| Money Market Funds | 0.6% |
What did the Fund invest in?
Sector Weighting (% of net assets)
| Value | Value |
|---|---|
| Liabilities in Excess of Other Assets | -0.3% |
| Money Market | 0.6% |
| Communications | 1.0% |
| Consumer Staples | 2.9% |
| Utilities | 4.1% |
| Technology | 6.7% |
| Health Care | 7.3% |
| Materials | 8.2% |
| Energy | 8.3% |
| Consumer Discretionary | 10.1% |
| Real Estate | 11.2% |
| Industrials | 15.8% |
| Financials | 24.1% |
Top 10 Holdings (% of net assets)
| Holding Name | % of Net Assets |
| SM Energy Company | 2.8% |
| Northern Oil and Gas, Inc. | 2.6% |
| Urban Edge Properties | 2.2% |
| COPT Defense Properties | 2.2% |
| Piper Sandler Companies | 2.2% |
| Merit Medical Systems, Inc. | 2.2% |
| First Bancorp | 2.1% |
| City Holding Company | 2.1% |
| Innospec, Inc. | 2.1% |
| ArcBest Corporation | 2.1% |
Material Fund Changes
No material changes occurred during the year ended October 31, 2024.

Westwood Quality SmallCap Fund - Ultra Shares (WWSYX)
Annual Shareholder Report - October 31, 2024
Where can I find additional information about the Fund?
Additional information is available on the Fund's website (https://westwoodgroup.com/product/quality-smallcap-fund/), including its:
Prospectus
Financial information
Holdings
Proxy voting information
TSR-AR 103124-WWSYX
Westwood Quality AllCap Fund

Institutional Shares (WQAIX)
Annual Shareholder Report - October 31, 2024
Fund Overview
This annual shareholder report contains important information about Westwood Quality AllCap Fund (the "Fund") for the period of November 1, 2023 to October 31, 2024. You can find additional information about the Fund at https://westwoodgroup.com/product/quality-allcap-fund/. You can also request this information by contacting us at (877) 386-3944.
What were the Fund’s costs for the last year?
(based on a hypothetical $10,000 investment)
| Class Name | Costs of a $10,000 investment | Costs paid as a percentage of a $10,000 investment |
|---|---|---|
| Institutional Shares | $59 | 0.53% |
How did the Fund perform during the reporting period?
During the reporting period, the Westwood Quality AllCap Value Fund participated in a bull market that kicked off in October 2022. The equity market was supported by strong economic growth, moderating inflation and relatively stable employment.
Value investing took a backseat during the period as the “Magnificent 7” — a group of top-performing, large-cap growth stocks primarily in the technology sector — surged, fueled by expected gains from advances in artificial intelligence (AI).
The top-performing sectors for the period were Financials, Communication Services and Information Technology. Insurance companies and banks were among the prominent performers in the portfolio; within Communication Services and Information Technology, we benefited from several companies developing AI solutions within their core offerings.
The Consumer Staples sector detracted from performance, while Energy and Health Care also lagged. One position in Consumer Staples caused much of the trouble; we sold the position after an expected turnaround never materialized. Energy stocks struggled as the price of oil declined, while a medical device maker and a pharmaceutical company struggled within Health Care.
Our top two holdings were large banks; Wells Fargo & Co. (WFC) and Bank of America (BAC) have high-quality deposit bases and management teams focused on managing costs. We increased our position in pharmaceutical company Johnson & Johnson (JNJ), which we believe is well-positioned to gain after resolving some overhanging legal issues.
Both Alphabet Inc. (GOOGL) and Microsoft Corp. (MSFT) are poised to gain from implementation of AI into their key products; Google has seen use of its Gemini product surge this year, while Microsoft is adding its CoPilot product to their Office 365 software suite. We increased our allocation to Summit Materials (SUM) as the industrial company has seen improved pricing in cement and aggregate; they also stand to benefit from strategic acquisitions.
How has the Fund performed since inception?
Total Return Based on $100,000 Investment
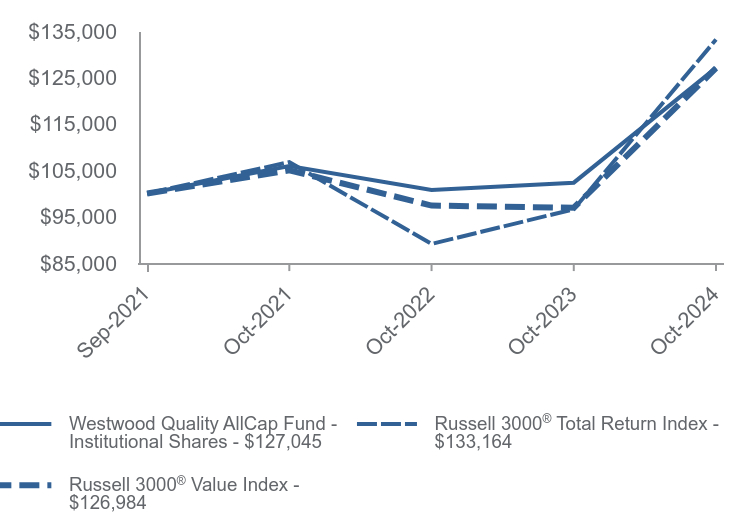
| Westwood Quality AllCap Fund - Institutional Shares | Russell 3000® Total Return Index | Russell 3000® Value Index | |
|---|---|---|---|
| Sep-2021 | $100,000 | $100,000 | $100,000 |
| Oct-2021 | $105,900 | $106,762 | $104,993 |
| Oct-2022 | $100,752 | $89,128 | $97,383 |
| Oct-2023 | $102,324 | $96,597 | $96,919 |
| Oct-2024 | $127,045 | $133,164 | $126,984 |
Average Annual Total Returns as of 10/31/2024
| 1 Year | Since Inception (September 30, 2021) | |
|---|---|---|
| Westwood Quality AllCap Fund - Institutional Shares | 24.16% | 8.07% |
Russell 3000® Total Return Index | 37.86% | 9.73% |
Russell 3000® Value Index | 31.02% | 8.05% |
Past performance does not guarantee future results. Call (877) 386-3944 or visit https://westwoodgroup.com/product/quality-allcap-fund/ for current month-end performance.
Fund Statistics
- Net Assets$22,535,981
- Number of Portfolio Holdings53
- Advisory Fee (net of waivers)$2,003
- Portfolio Turnover73%
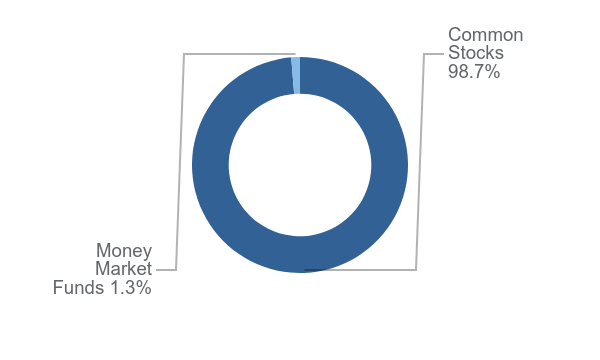
Asset Weighting (% of total investments)
| Value | Value |
|---|---|
| Common Stocks | 98.7% |
| Money Market Funds | 1.3% |
What did the Fund invest in?
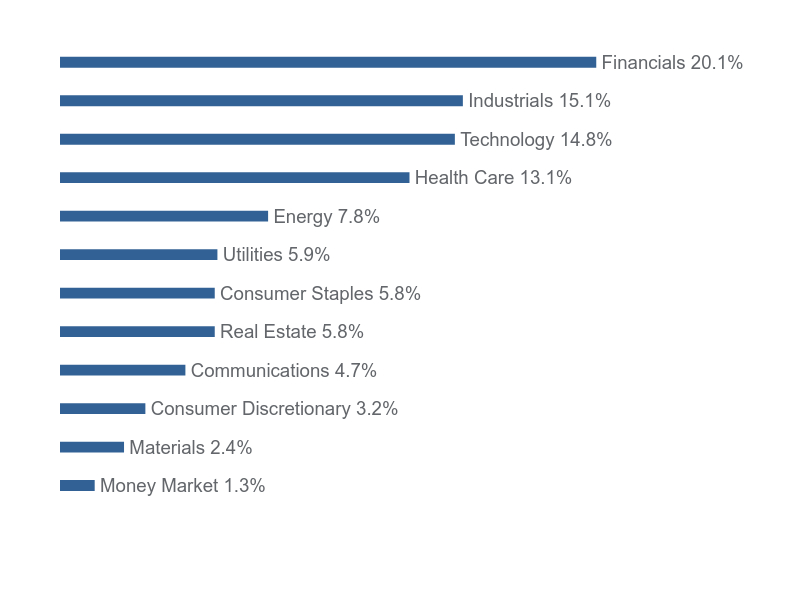
Sector Weighting (% of net assets)
| Value | Value |
|---|---|
| Money Market | 1.3% |
| Materials | 2.4% |
| Consumer Discretionary | 3.2% |
| Communications | 4.7% |
| Real Estate | 5.8% |
| Consumer Staples | 5.8% |
| Utilities | 5.9% |
| Energy | 7.8% |
| Health Care | 13.1% |
| Technology | 14.8% |
| Industrials | 15.1% |
| Financials | 20.1% |
Top 10 Holdings (% of net assets)
| Holding Name | % of Net Assets |
| Wells Fargo & Company | 3.0% |
| Bank of America Corporation | 3.0% |
| Johnson & Johnson | 2.9% |
| UnitedHealth Group, Inc. | 2.9% |
| Alphabet, Inc. - Class A | 2.7% |
| Abbott Laboratories | 2.5% |
| Microsoft Corporation | 2.4% |
| Summit Materials, Inc. - Class A | 2.4% |
| Salesforce, Inc. | 2.3% |
| Danaher Corporation | 2.3% |
Material Fund Changes
No material changes occurred during the year ended October 31, 2024.

Westwood Quality AllCap Fund - Institutional Shares (WQAIX)
Annual Shareholder Report - October 31, 2024
Where can I find additional information about the Fund?
Additional information is available on the Fund's website (https://westwoodgroup.com/product/quality-allcap-fund/), including its:
Prospectus
Financial information
Holdings
Proxy voting information
TSR-AR 103124-WQAIX
Westwood Quality AllCap Fund

Ultra Shares (WQAUX)
Annual Shareholder Report - October 31, 2024
Fund Overview
This annual shareholder report contains important information about Westwood Quality AllCap Fund (the "Fund") for the period of November 1, 2023 to October 31, 2024. You can find additional information about the Fund at https://westwoodgroup.com/product/quality-allcap-fund/. You can also request this information by contacting us at (877) 386-3944.
What were the Fund’s costs for the last year?
(based on a hypothetical $10,000 investment)
| Class Name | Costs of a $10,000 investment | Costs paid as a percentage of a $10,000 investment |
|---|---|---|
| Ultra Shares | $50 | 0.45% |
How did the Fund perform during the reporting period?
During the reporting period, the Westwood Quality AllCap Value Fund participated in a bull market that kicked off in October 2022. The equity market was supported by strong economic growth, moderating inflation and relatively stable employment.
Value investing took a backseat during the period as the “Magnificent 7” — a group of top-performing, large-cap growth stocks primarily in the technology sector — surged, fueled by expected gains from advances in artificial intelligence (AI).
The top-performing sectors for the period were Financials, Communication Services and Information Technology. Insurance companies and banks were among the prominent performers in the portfolio; within Communication Services and Information Technology, we benefited from several companies developing AI solutions within their core offerings.
The Consumer Staples sector detracted from performance, while Energy and Health Care also lagged. One position in Consumer Staples caused much of the trouble; we sold the position after an expected turnaround never materialized. Energy stocks struggled as the price of oil declined, while a medical device maker and a pharmaceutical company struggled within Health Care.
Our top two holdings were large banks; Wells Fargo & Co. (WFC) and Bank of America (BAC) have high-quality deposit bases and management teams focused on managing costs. We increased our position in pharmaceutical company Johnson & Johnson (JNJ), which we believe is well-positioned to gain after resolving some overhanging legal issues.
Both Alphabet Inc. (GOOGL) and Microsoft Corp. (MSFT) are poised to gain from implementation of AI into their key products; Google has seen use of its Gemini product surge this year, while Microsoft is adding its CoPilot product to their Office 365 software suite. We increased our allocation to Summit Materials (SUM) as the industrial company has seen improved pricing in cement and aggregate; they also stand to benefit from strategic acquisitions.
How has the Fund performed since inception?
Total Return Based on $1,000,000 Investment
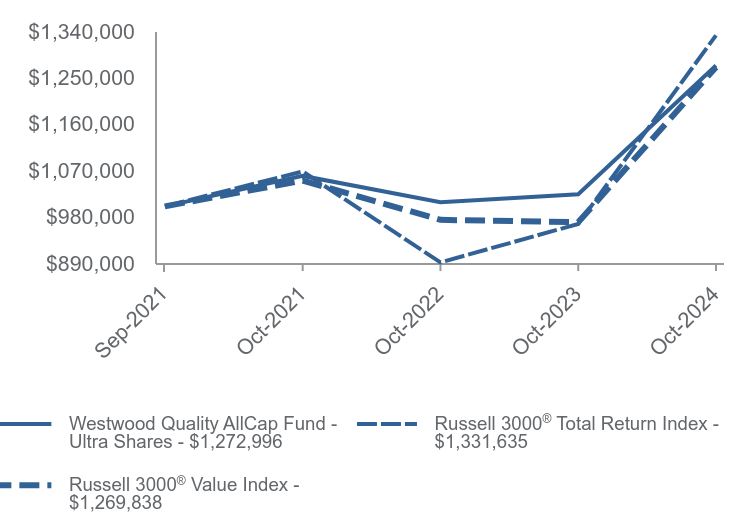
| Westwood Quality AllCap Fund - Ultra Shares | Russell 3000® Total Return Index | Russell 3000® Value Index | |
|---|---|---|---|
| Sep-2021 | $1,000,000 | $1,000,000 | $1,000,000 |
| Oct-2021 | $1,059,000 | $1,067,624 | $1,049,931 |
| Oct-2022 | $1,008,014 | $891,277 | $973,831 |
| Oct-2023 | $1,023,402 | $965,967 | $969,188 |
| Oct-2024 | $1,272,996 | $1,331,635 | $1,269,838 |
Average Annual Total Returns as of 10/31/2024
| 1 Year | Since Inception (September 30, 2021) | |
|---|---|---|
| Westwood Quality AllCap Fund - Ultra Shares | 24.39% | 8.14% |
Russell 3000® Total Return Index | 37.86% | 9.73% |
Russell 3000® Value Index | 31.02% | 8.05% |
Past performance does not guarantee future results. Call (877) 386-3944 or visit https://westwoodgroup.com/product/quality-allcap-fund/ for current month-end performance.
Fund Statistics
- Net Assets$22,535,981
- Number of Portfolio Holdings53
- Advisory Fee (net of waivers)$2,003
- Portfolio Turnover73%
Asset Weighting (% of total investments)

| Value | Value |
|---|---|
| Common Stocks | 98.7% |
| Money Market Funds | 1.3% |
What did the Fund invest in?
Sector Weighting (% of net assets)

| Value | Value |
|---|---|
| Money Market | 1.3% |
| Materials | 2.4% |
| Consumer Discretionary | 3.2% |
| Communications | 4.7% |
| Real Estate | 5.8% |
| Consumer Staples | 5.8% |
| Utilities | 5.9% |
| Energy | 7.8% |
| Health Care | 13.1% |
| Technology | 14.8% |
| Industrials | 15.1% |
| Financials | 20.1% |
Top 10 Holdings (% of net assets)
| Holding Name | % of Net Assets |
| Wells Fargo & Company | 3.0% |
| Bank of America Corporation | 3.0% |
| Johnson & Johnson | 2.9% |
| UnitedHealth Group, Inc. | 2.9% |
| Alphabet, Inc. - Class A | 2.7% |
| Abbott Laboratories | 2.5% |
| Microsoft Corporation | 2.4% |
| Summit Materials, Inc. - Class A | 2.4% |
| Salesforce, Inc. | 2.3% |
| Danaher Corporation | 2.3% |
Material Fund Changes
No material changes occurred during the year ended October 31, 2024.

Westwood Quality AllCap Fund - Ultra Shares (WQAUX)
Annual Shareholder Report - October 31, 2024
Where can I find additional information about the Fund?
Additional information is available on the Fund's website (https://westwoodgroup.com/product/quality-allcap-fund/), including its:
Prospectus
Financial information
Holdings
Proxy voting information
TSR-AR 103124-WQAUX
Westwood Income Opportunity Fund

Institutional Shares (WHGIX)
Annual Shareholder Report - October 31, 2024
Fund Overview
This annual shareholder report contains important information about Westwood Income Opportunity Fund (the "Fund") for the period of November 1, 2023 to October 31, 2024. You can find additional information about the Fund at https://westwoodgroup.com/product/income-opportunity-fund/. You can also request this information by contacting us at (877) 386-3944.
What were the Fund’s costs for the last year?
(based on a hypothetical $10,000 investment)
| Class Name | Costs of a $10,000 investment | Costs paid as a percentage of a $10,000 investment |
|---|---|---|
| Institutional Shares | $91 | 0.83% |
How did the Fund perform during the reporting period?
For the trailing 12 months, the Westwood Income Opportunity Fund underperformed its representative blended benchmark (40% S&P 500/60% Bloomberg U.S. Aggregate Bond) despite posting a strong absolute return of nearly 20%.
The equity markets continued to see strong returns for the period, driven in large part by the “Magnificent 7,” as this basket of large-cap growth names posted over a 50% return and significantly contributed to the S&P 500’s 38% return for the trailing 12 months.
During the period, the bond market was shaped by high interest rates as central banks, particularly the U.S. Federal Reserve, maintained elevated rates to control inflation. As a result, bond yields remained high, leading to lower bond prices, with investors focused on future economic growth and inflation trends.
Within the portfolio, we maintained an overweight allocation to equity securities relative to the benchmark, holding about 40% of the portfolio in stocks, with an additional 6% in convertible securities on average. While the overweight to equities was a positive contributor to performance for the period, stock selection was the primary detractor to the Fund’s performance. Our selection within fixed income was a positive contributor as both our investment grade and high yield holdings generally outperformed the bond market broadly.
How has the Fund performed over the last ten years?
Total Return Based on $100,000 Investment
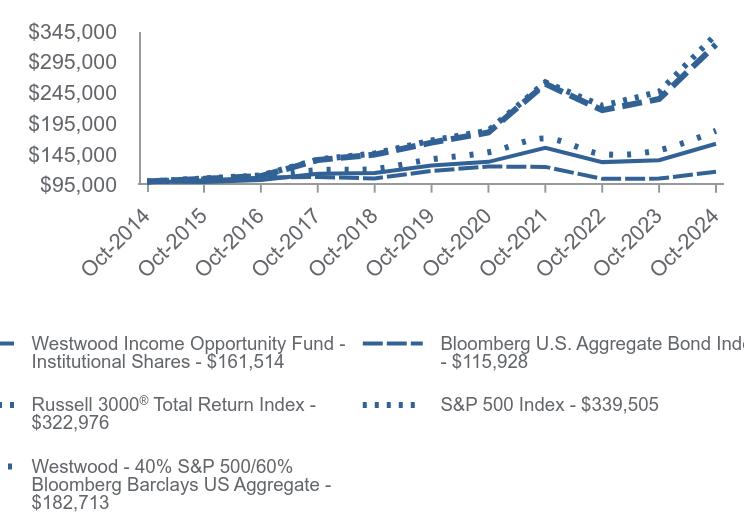
| Westwood Income Opportunity Fund - Institutional Shares | Bloomberg U.S. Aggregate Bond Index | Russell 3000® Total Return Index | S&P 500 Index | Westwood - 40% S&P 500/60% Bloomberg Barclays US Aggregate | |
|---|---|---|---|---|---|
| Oct-2014 | $100,000 | $100,000 | $100,000 | $100,000 | $100,000 |
| Oct-2015 | $99,278 | $101,956 | $104,490 | $105,200 | $103,485 |
| Oct-2016 | $102,409 | $106,412 | $108,923 | $109,943 | $108,184 |
| Oct-2017 | $112,630 | $107,372 | $135,043 | $135,925 | $118,499 |
| Oct-2018 | $113,801 | $105,167 | $143,950 | $145,911 | $120,598 |
| Oct-2019 | $126,304 | $117,272 | $163,368 | $166,814 | $136,360 |
| Oct-2020 | $132,106 | $124,527 | $179,947 | $183,012 | $147,605 |
| Oct-2021 | $154,843 | $123,932 | $258,943 | $261,550 | $170,281 |
| Oct-2022 | $131,670 | $104,496 | $216,171 | $223,335 | $144,838 |
| Oct-2023 | $134,762 | $104,868 | $234,287 | $245,988 | $151,066 |
| Oct-2024 | $161,514 | $115,928 | $322,976 | $339,505 | $182,713 |
Average Annual Total Returns as of 10/31/2024
| 1 Year | 5 Years | 10 Years | |
|---|---|---|---|
| Westwood Income Opportunity Fund - Institutional Shares | 19.85% | 5.04% | 4.91% |
| Bloomberg U.S. Aggregate Bond Index | 10.55% | -0.23% | 1.49% |
Russell 3000® Total Return Index | 37.86% | 14.60% | 12.44% |
| S&P 500 Index | 38.02% | 15.27% | 13.00% |
| Westwood - 40% S&P 500/60% Bloomberg Barclays US Aggregate | 20.95% | 6.03% | 6.21% |
Past performance does not guarantee future results. Call (877) 386-3944 or visit https://westwoodgroup.com/product/income-opportunity-fund/ for current month-end performance.
Fund Statistics
- Net Assets$521,333,310
- Number of Portfolio Holdings130
- Advisory Fee $3,393,620
- Portfolio Turnover57%
Asset Weighting (% of total investments)

| Value | Value |
|---|---|
| Collateralized Mortgage Obligations | 2.6% |
| Common Stocks | 44.1% |
| Convertible Bonds | 5.9% |
| Corporate Bonds | 29.5% |
| Exchange-Traded Funds | 3.9% |
| Money Market Funds | 0.3% |
| Preferred Stocks | 2.8% |
| U.S. Government & Agencies | 10.9% |
What did the Fund invest in?
Sector Weighting (% of net assets)

| Value | Value |
|---|---|
| Other Assets in Excess of Liabilities | 0.5% |
| Money Market | 0.3% |
| Collateralized Mortgage Obligations | 2.6% |
| Materials | 2.7% |
| Consumer Staples | 3.3% |
| Communications | 3.5% |
| Exchange-Traded Funds | 3.9% |
| Consumer Discretionary | 5.2% |
| Industrials | 5.6% |
| Utilities | 6.2% |
| Health Care | 7.2% |
| Real Estate | 7.3% |
| Energy | 8.4% |
| U.S. Government & Agencies | 10.9% |
| Technology | 11.9% |
| Financials | 20.5% |
Top 10 Holdings (% of net assets)
| Holding Name | % of Net Assets |
| JPMorgan Chase & Company | 2.3% |
| U.S. Treasury Bonds, 4.625%, due 05/15/54 | 2.1% |
| Microsoft Corporation | 2.1% |
| Energy Transfer, L.P. | 1.9% |
| Walmart, Inc. | 1.8% |
| Goldman Sachs Group, Inc. (The) | 1.8% |
| U.S. Treasury Notes, 4.375%, due 05/15/34 | 1.7% |
| Gilead Sciences, Inc. | 1.7% |
| JPMorgan Nasdaq Equity Premium Income ETF | 1.6% |
| Lowe's Companies, Inc. | 1.6% |
Material Fund Changes
No material changes occurred during the year ended October 31, 2024.

Westwood Income Opportunity Fund - Institutional Shares (WHGIX)
Annual Shareholder Report - October 31, 2024
Where can I find additional information about the Fund?
Additional information is available on the Fund's website (https://westwoodgroup.com/product/income-opportunity-fund/), including its:
Prospectus
Financial information
Holdings
Proxy voting information
TSR-AR 103124-WHGIX
Westwood Income Opportunity Fund

A Class Shares (WWIAX)
Annual Shareholder Report - October 31, 2024
Fund Overview
This annual shareholder report contains important information about Westwood Income Opportunity Fund (the "Fund") for the period of November 1, 2023 to October 31, 2024. You can find additional information about the Fund at https://westwoodgroup.com/product/income-opportunity-fund/. You can also request this information by contacting us at (877) 386-3944.
What were the Fund’s costs for the last year?
(based on a hypothetical $10,000 investment)
| Class Name | Costs of a $10,000 investment | Costs paid as a percentage of a $10,000 investment |
|---|---|---|
| A Class Shares | $110 | 1.00% |
How did the Fund perform during the reporting period?
For the trailing 12 months, the Westwood Income Opportunity Fund underperformed its representative blended benchmark (40% S&P 500/60% Bloomberg U.S. Aggregate Bond) despite posting a strong absolute return of nearly 20%.
The equity markets continued to see strong returns for the period, driven in large part by the “Magnificent 7,” as this basket of large-cap growth names posted over a 50% return and significantly contributed to the S&P 500’s 38% return for the trailing 12 months.
During the period, the bond market was shaped by high interest rates as central banks, particularly the U.S. Federal Reserve, maintained elevated rates to control inflation. As a result, bond yields remained high, leading to lower bond prices, with investors focused on future economic growth and inflation trends.
Within the portfolio, we maintained an overweight allocation to equity securities relative to the benchmark, holding about 40% of the portfolio in stocks, with an additional 6% in convertible securities on average. While the overweight to equities was a positive contributor to performance for the period, stock selection was the primary detractor to the Fund’s performance. Our selection within fixed income was a positive contributor as both our investment grade and high yield holdings generally outperformed the bond market broadly.
How has the Fund performed over the last ten years?
Total Return Based on $10,000 Investment
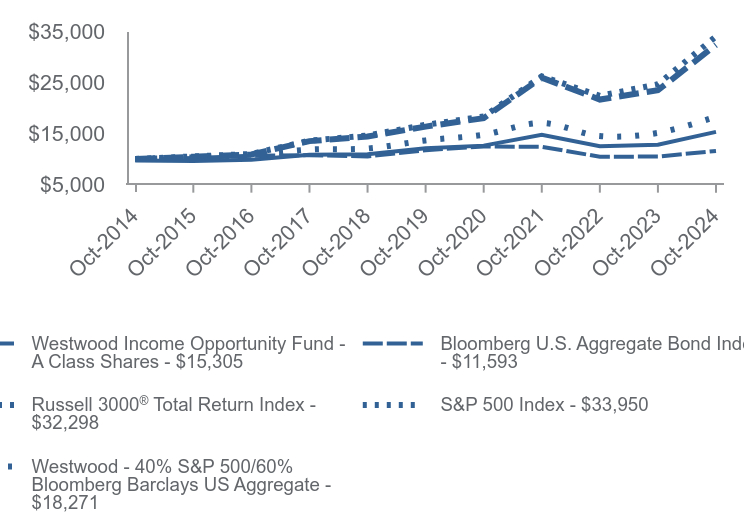
| Westwood Income Opportunity Fund - A Class Shares | Bloomberg U.S. Aggregate Bond Index | Russell 3000® Total Return Index | S&P 500 Index | Westwood - 40% S&P 500/60% Bloomberg Barclays US Aggregate | |
|---|---|---|---|---|---|
| Oct-2014 | $9,700 | $10,000 | $10,000 | $10,000 | $10,000 |
| Oct-2015 | $9,598 | $10,196 | $10,449 | $10,520 | $10,348 |
| Oct-2016 | $9,883 | $10,641 | $10,892 | $10,994 | $10,818 |
| Oct-2017 | $10,842 | $10,737 | $13,504 | $13,593 | $11,850 |
| Oct-2018 | $10,926 | $10,517 | $14,395 | $14,591 | $12,060 |
| Oct-2019 | $12,096 | $11,727 | $16,337 | $16,681 | $13,636 |
| Oct-2020 | $12,621 | $12,453 | $17,995 | $18,301 | $14,760 |
| Oct-2021 | $14,749 | $12,393 | $25,894 | $26,155 | $17,028 |
| Oct-2022 | $12,506 | $10,450 | $21,617 | $22,334 | $14,484 |
| Oct-2023 | $12,787 | $10,487 | $23,429 | $24,599 | $15,107 |
| Oct-2024 | $15,305 | $11,593 | $32,298 | $33,950 | $18,271 |
Average Annual Total Returns as of 10/31/2024
| 1 Year | 5 Years | 10 Years | |
|---|---|---|---|
| Westwood Income Opportunity Fund - A Class Shares | 19.68% | 4.82% | 4.67% |
| With Load* | 16.13% | 4.18% | 4.35% |
| Bloomberg U.S. Aggregate Bond Index | 10.55% | -0.23% | 1.49% |
Russell 3000® Total Return Index | 37.86% | 14.60% | 12.44% |
| S&P 500 Index | 38.02% | 15.27% | 13.00% |
| Westwood - 40% S&P 500/60% Bloomberg Barclays US Aggregate | 20.95% | 6.03% | 6.21% |
Past performance does not guarantee future results. Call (877) 386-3944 or visit https://westwoodgroup.com/product/income-opportunity-fund/ for current month-end performance.
* Reflects the maximum sales charge applicable to A Class Shares.
Fund Statistics
- Net Assets$521,333,310
- Number of Portfolio Holdings130
- Advisory Fee $3,393,620
- Portfolio Turnover57%
Asset Weighting (% of total investments)
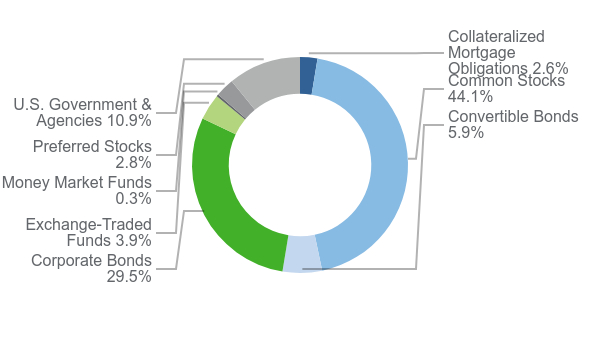
| Value | Value |
|---|---|
| Collateralized Mortgage Obligations | 2.6% |
| Common Stocks | 44.1% |
| Convertible Bonds | 5.9% |
| Corporate Bonds | 29.5% |
| Exchange-Traded Funds | 3.9% |
| Money Market Funds | 0.3% |
| Preferred Stocks | 2.8% |
| U.S. Government & Agencies | 10.9% |
What did the Fund invest in?
Sector Weighting (% of net assets)

| Value | Value |
|---|---|
| Other Assets in Excess of Liabilities | 0.5% |
| Money Market | 0.3% |
| Collateralized Mortgage Obligations | 2.6% |
| Materials | 2.7% |
| Consumer Staples | 3.3% |
| Communications | 3.5% |
| Exchange-Traded Funds | 3.9% |
| Consumer Discretionary | 5.2% |
| Industrials | 5.6% |
| Utilities | 6.2% |
| Health Care | 7.2% |
| Real Estate | 7.3% |
| Energy | 8.4% |
| U.S. Government & Agencies | 10.9% |
| Technology | 11.9% |
| Financials | 20.5% |
Top 10 Holdings (% of net assets)
| Holding Name | % of Net Assets |
| JPMorgan Chase & Company | 2.3% |
| U.S. Treasury Bonds, 4.625%, due 05/15/54 | 2.1% |
| Microsoft Corporation | 2.1% |
| Energy Transfer, L.P. | 1.9% |
| Walmart, Inc. | 1.8% |
| Goldman Sachs Group, Inc. (The) | 1.8% |
| U.S. Treasury Notes, 4.375%, due 05/15/34 | 1.7% |
| Gilead Sciences, Inc. | 1.7% |
| JPMorgan Nasdaq Equity Premium Income ETF | 1.6% |
| Lowe's Companies, Inc. | 1.6% |
Material Fund Changes
No material changes occurred during the year ended October 31, 2024.

Westwood Income Opportunity Fund - A Class Shares (WWIAX)
Annual Shareholder Report - October 31, 2024
Where can I find additional information about the Fund?
Additional information is available on the Fund's website (https://westwoodgroup.com/product/income-opportunity-fund/), including its:
Prospectus
Financial information
Holdings
Proxy voting information
TSR-AR 103124-WWIAX
Westwood Income Opportunity Fund

C Class Shares (WWICX)
Annual Shareholder Report - October 31, 2024
Fund Overview
This annual shareholder report contains important information about Westwood Income Opportunity Fund (the "Fund") for the period of November 1, 2023 to October 31, 2024. You can find additional information about the Fund at https://westwoodgroup.com/product/income-opportunity-fund/. You can also request this information by contacting us at (877) 386-3944.
What were the Fund’s costs for the last year?
(based on a hypothetical $10,000 investment)
| Class Name | Costs of a $10,000 investment | Costs paid as a percentage of a $10,000 investment |
|---|---|---|
| C Class Shares | $191 | 1.75% |
How did the Fund perform during the reporting period?
For the trailing 12 months, the Westwood Income Opportunity Fund underperformed its representative blended benchmark (40% S&P 500/60% Bloomberg U.S. Aggregate Bond) despite posting a strong absolute return of nearly 20%.
The equity markets continued to see strong returns for the period, driven in large part by the “Magnificent 7,” as this basket of large-cap growth names posted over a 50% return and significantly contributed to the S&P 500’s 38% return for the trailing 12 months.
During the period, the bond market was shaped by high interest rates as central banks, particularly the U.S. Federal Reserve, maintained elevated rates to control inflation. As a result, bond yields remained high, leading to lower bond prices, with investors focused on future economic growth and inflation trends.
Within the portfolio, we maintained an overweight allocation to equity securities relative to the benchmark, holding about 40% of the portfolio in stocks, with an additional 6% in convertible securities on average. While the overweight to equities was a positive contributor to performance for the period, stock selection was the primary detractor to the Fund’s performance. Our selection within fixed income was a positive contributor as both our investment grade and high yield holdings generally outperformed the bond market broadly.
How has the Fund performed since inception?
Total Return Based on $10,000 Investment
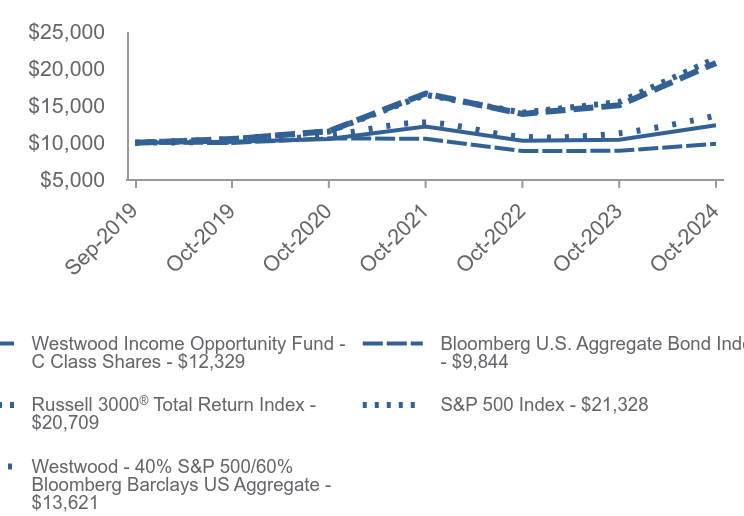
| Westwood Income Opportunity Fund - C Class Shares | Bloomberg U.S. Aggregate Bond Index | Russell 3000® Total Return Index | S&P 500 Index | Westwood - 40% S&P 500/60% Bloomberg Barclays US Aggregate | |
|---|---|---|---|---|---|
| Sep-2019 | $10,000 | $10,000 | $10,000 | $10,000 | $10,000 |
| Oct-2019 | $10,123 | $9,959 | $10,475 | $10,479 | $10,165 |
| Oct-2020 | $10,479 | $10,575 | $11,538 | $11,497 | $11,004 |
| Oct-2021 | $12,159 | $10,524 | $16,603 | $16,431 | $12,694 |
| Oct-2022 | $10,243 | $8,874 | $13,861 | $14,030 | $10,797 |
| Oct-2023 | $10,386 | $8,905 | $15,022 | $15,453 | $11,262 |
| Oct-2024 | $12,329 | $9,844 | $20,709 | $21,328 | $13,621 |
Average Annual Total Returns as of 10/31/2024
| 1 Year | 5 Years | Since Inception (September 3, 2019) | |
|---|---|---|---|
| Westwood Income Opportunity Fund - C Class Shares | |||
| Without CDSC | 18.71% | 4.02% | 4.14% |
| With CDSC | 17.71% | 4.02% | 4.14% |
| Bloomberg U.S. Aggregate Bond Index | 10.55% | -0.23% | -0.30% |
Russell 3000® Total Return Index | 37.86% | 14.60% | 15.15% |
| S&P 500 Index | 38.02% | 15.27% | 15.81% |
| Westwood - 40% S&P 500/60% Bloomberg Barclays US Aggregate | 20.95% | 6.03% | 6.14% |
Past performance does not guarantee future results. Call (877) 386-3944 or visit https://westwoodgroup.com/product/income-opportunity-fund/ for current month-end performance.
Fund Statistics
- Net Assets$521,333,310
- Number of Portfolio Holdings130
- Advisory Fee $3,393,620
- Portfolio Turnover57%
Asset Weighting (% of total investments)

| Value | Value |
|---|---|
| Collateralized Mortgage Obligations | 2.6% |
| Common Stocks | 44.1% |
| Convertible Bonds | 5.9% |
| Corporate Bonds | 29.5% |
| Exchange-Traded Funds | 3.9% |
| Money Market Funds | 0.3% |
| Preferred Stocks | 2.8% |
| U.S. Government & Agencies | 10.9% |
What did the Fund invest in?
Sector Weighting (% of net assets)
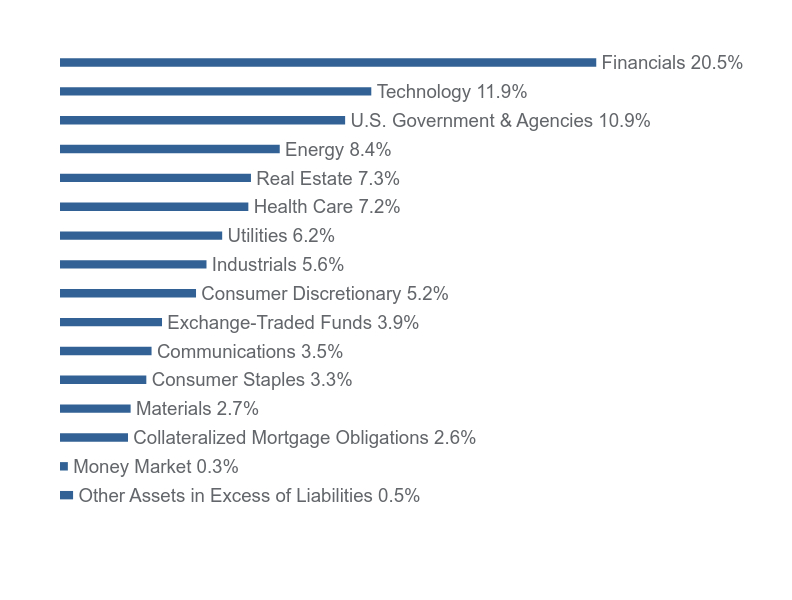
| Value | Value |
|---|---|
| Other Assets in Excess of Liabilities | 0.5% |
| Money Market | 0.3% |
| Collateralized Mortgage Obligations | 2.6% |
| Materials | 2.7% |
| Consumer Staples | 3.3% |
| Communications | 3.5% |
| Exchange-Traded Funds | 3.9% |
| Consumer Discretionary | 5.2% |
| Industrials | 5.6% |
| Utilities | 6.2% |
| Health Care | 7.2% |
| Real Estate | 7.3% |
| Energy | 8.4% |
| U.S. Government & Agencies | 10.9% |
| Technology | 11.9% |
| Financials | 20.5% |
Top 10 Holdings (% of net assets)
| Holding Name | % of Net Assets |
| JPMorgan Chase & Company | 2.3% |
| U.S. Treasury Bonds, 4.625%, due 05/15/54 | 2.1% |
| Microsoft Corporation | 2.1% |
| Energy Transfer, L.P. | 1.9% |
| Walmart, Inc. | 1.8% |
| Goldman Sachs Group, Inc. (The) | 1.8% |
| U.S. Treasury Notes, 4.375%, due 05/15/34 | 1.7% |
| Gilead Sciences, Inc. | 1.7% |
| JPMorgan Nasdaq Equity Premium Income ETF | 1.6% |
| Lowe's Companies, Inc. | 1.6% |
Material Fund Changes
No material changes occurred during the year ended October 31, 2024.

Westwood Income Opportunity Fund - C Class Shares (WWICX)
Annual Shareholder Report - October 31, 2024
Where can I find additional information about the Fund?
Additional information is available on the Fund's website (https://westwoodgroup.com/product/income-opportunity-fund/), including its:
Prospectus
Financial information
Holdings
Proxy voting information
TSR-AR 103124-WWICX
Westwood Income Opportunity Fund

Ultra Shares (WHGOX)
Annual Shareholder Report - October 31, 2024
Fund Overview
This annual shareholder report contains important information about Westwood Income Opportunity Fund (the "Fund") for the period of November 1, 2023 to October 31, 2024. You can find additional information about the Fund at https://westwoodgroup.com/product/income-opportunity-fund/. You can also request this information by contacting us at (877) 386-3944.
What were the Fund’s costs for the last year?
(based on a hypothetical $10,000 investment)
| Class Name | Costs of a $10,000 investment | Costs paid as a percentage of a $10,000 investment |
|---|---|---|
| Ultra Shares | $82 | 0.75% |
How did the Fund perform during the reporting period?
For the trailing 12 months, the Westwood Income Opportunity Fund underperformed its representative blended benchmark (40% S&P 500/60% Bloomberg U.S. Aggregate Bond) despite posting a strong absolute return of nearly 20%.
The equity markets continued to see strong returns for the period, driven in large part by the “Magnificent 7,” as this basket of large-cap growth names posted over a 50% return and significantly contributed to the S&P 500’s 38% return for the trailing 12 months.
During the period, the bond market was shaped by high interest rates as central banks, particularly the U.S. Federal Reserve, maintained elevated rates to control inflation. As a result, bond yields remained high, leading to lower bond prices, with investors focused on future economic growth and inflation trends.
Within the portfolio, we maintained an overweight allocation to equity securities relative to the benchmark, holding about 40% of the portfolio in stocks, with an additional 6% in convertible securities on average. While the overweight to equities was a positive contributor to performance for the period, stock selection was the primary detractor to the Fund’s performance. Our selection within fixed income was a positive contributor as both our investment grade and high yield holdings generally outperformed the bond market broadly.
How has the Fund performed since inception?
Total Return Based on $1,000,000 Investment
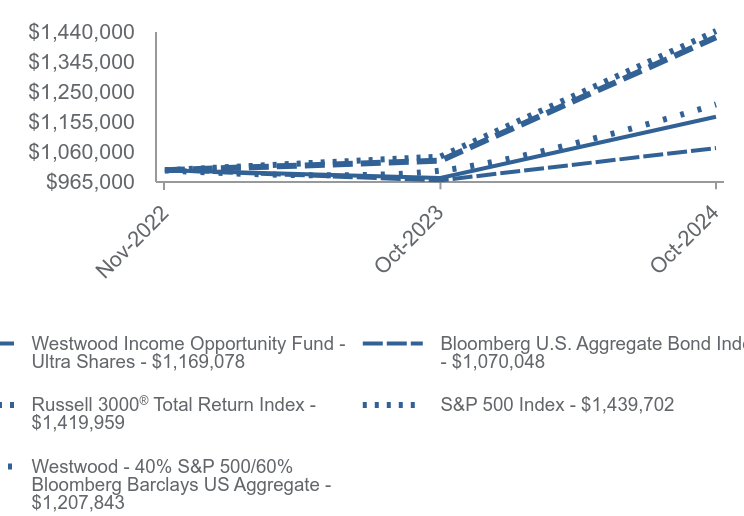
| Westwood Income Opportunity Fund - Ultra Shares | Bloomberg U.S. Aggregate Bond Index | Russell 3000® Total Return Index | S&P 500 Index | Westwood - 40% S&P 500/60% Bloomberg Barclays US Aggregate | |
|---|---|---|---|---|---|
| Nov-2022 | $1,000,000 | $1,000,000 | $1,000,000 | $1,000,000 | $1,000,000 |
| Oct-2023 | $975,331 | $967,964 | $1,030,037 | $1,043,134 | $998,636 |
| Oct-2024 | $1,169,078 | $1,070,048 | $1,419,959 | $1,439,702 | $1,207,843 |
Average Annual Total Returns as of 10/31/2024
| 1 Year | Since Inception (November 30, 2022) | |
|---|---|---|
| Westwood Income Opportunity Fund - Ultra Shares | 19.86% | 8.49% |
| Bloomberg U.S. Aggregate Bond Index | 10.55% | 3.59% |
Russell 3000® Total Return Index | 37.86% | 20.06% |
| S&P 500 Index | 38.02% | 20.93% |
| Westwood - 40% S&P 500/60% Bloomberg Barclays US Aggregate | 20.95% | 11.27% |
Past performance does not guarantee future results. Call (877) 386-3944 or visit https://westwoodgroup.com/product/income-opportunity-fund/ for current month-end performance.
Fund Statistics
- Net Assets$521,333,310
- Number of Portfolio Holdings130
- Advisory Fee $3,393,620
- Portfolio Turnover57%
Asset Weighting (% of total investments)

| Value | Value |
|---|---|
| Collateralized Mortgage Obligations | 2.6% |
| Common Stocks | 44.1% |
| Convertible Bonds | 5.9% |
| Corporate Bonds | 29.5% |
| Exchange-Traded Funds | 3.9% |
| Money Market Funds | 0.3% |
| Preferred Stocks | 2.8% |
| U.S. Government & Agencies | 10.9% |
What did the Fund invest in?
Sector Weighting (% of net assets)

| Value | Value |
|---|---|
| Other Assets in Excess of Liabilities | 0.5% |
| Money Market | 0.3% |
| Collateralized Mortgage Obligations | 2.6% |
| Materials | 2.7% |
| Consumer Staples | 3.3% |
| Communications | 3.5% |
| Exchange-Traded Funds | 3.9% |
| Consumer Discretionary | 5.2% |
| Industrials | 5.6% |
| Utilities | 6.2% |
| Health Care | 7.2% |
| Real Estate | 7.3% |
| Energy | 8.4% |
| U.S. Government & Agencies | 10.9% |
| Technology | 11.9% |
| Financials | 20.5% |
Top 10 Holdings (% of net assets)
| Holding Name | % of Net Assets |
| JPMorgan Chase & Company | 2.3% |
| U.S. Treasury Bonds, 4.625%, due 05/15/54 | 2.1% |
| Microsoft Corporation | 2.1% |
| Energy Transfer, L.P. | 1.9% |
| Walmart, Inc. | 1.8% |
| Goldman Sachs Group, Inc. (The) | 1.8% |
| U.S. Treasury Notes, 4.375%, due 05/15/34 | 1.7% |
| Gilead Sciences, Inc. | 1.7% |
| JPMorgan Nasdaq Equity Premium Income ETF | 1.6% |
| Lowe's Companies, Inc. | 1.6% |
Material Fund Changes
No material changes occurred during the year ended October 31, 2024.

Westwood Income Opportunity Fund - Ultra Shares (WHGOX)
Annual Shareholder Report - October 31, 2024
Where can I find additional information about the Fund?
Additional information is available on the Fund's website (https://westwoodgroup.com/product/income-opportunity-fund/), including its:
Prospectus
Financial information
Holdings
Proxy voting information
TSR-AR 103124-WHGOX
Westwood Multi-Asset Income Fund

Institutional Shares (WHGHX)
Annual Shareholder Report - October 31, 2024
Fund Overview
This annual shareholder report contains important information about Westwood Multi-Asset Income Fund (the "Fund") for the period of November 1, 2023 to October 31, 2024. You can find additional information about the Fund at https://westwoodgroup.com/product/multi-asset-income-fund/. You can also request this information by contacting us at (877) 386-3944. This report describes changes to the Fund that occurred during the reporting period.
What were the Fund’s costs for the last year?
(based on a hypothetical $10,000 investment)
| Class Name | Costs of a $10,000 investment | Costs paid as a percentage of a $10,000 investment |
|---|---|---|
| Institutional Shares | $96 | 0.88% |
How did the Fund perform during the reporting period?
For the trailing 12 months, the Westwood Multi-Asset Income Fund outperformed its representative blended benchmark (20% S&P 500/80% Bloomberg U.S. Aggregate Bond) by posting a strong absolute return of nearly 20%.
The equity markets continued to see strong returns for the period, driven in large part by the “Magnificent 7,” as this basket of large-cap growth names posted over a 50% return and significantly contributed to the S&P 500’s 38% return for the trailing 12 months.
During the period, the bond market was shaped by high interest rates as central banks, particularly the U.S. Federal Reserve, maintained elevated rates to control inflation. As a result, bond yields remained high, leading to lower bond prices, with investors focused on future economic growth and inflation trends.
Within the portfolio, we maintained an overweight allocation to equity securities relative to the benchmark, holding about 26% of the portfolio in stocks and convertible securities on average. While the overweight to equities was a positive contributor to performance for the period, stock selection was the primary detractor to the Fund’s performance. Our selection within fixed income was a positive contributor as both our investment grade and high yield holdings generally outperformed the bond market broadly.
How has the Fund performed over the last ten years?
Total Return Based on $100,000 Investment
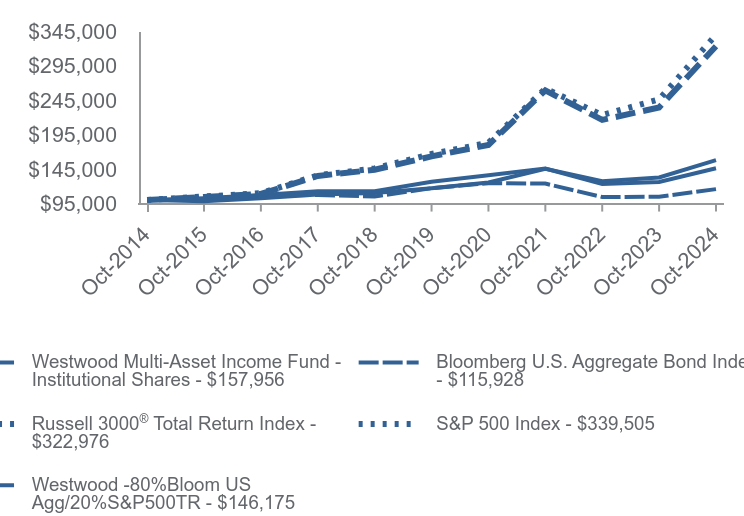
| Westwood Multi-Asset Income Fund - Institutional Shares | Bloomberg U.S. Aggregate Bond Index | Russell 3000® Total Return Index | S&P 500 Index | Westwood -80%Bloom US Agg/20%S&P500TR | |
|---|---|---|---|---|---|
| Oct-2014 | $100,000 | $100,000 | $100,000 | $100,000 | $100,000 |
| Oct-2015 | $98,167 | $101,956 | $104,490 | $105,200 | $102,774 |
| Oct-2016 | $102,830 | $106,412 | $108,923 | $109,943 | $107,373 |
| Oct-2017 | $108,254 | $107,372 | $135,043 | $135,925 | $112,897 |
| Oct-2018 | $110,334 | $105,167 | $143,950 | $145,911 | $112,750 |
| Oct-2019 | $117,233 | $117,272 | $163,368 | $166,814 | $126,684 |
| Oct-2020 | $125,606 | $124,527 | $179,947 | $183,012 | $135,957 |
| Oct-2021 | $145,317 | $123,932 | $258,943 | $261,550 | $145,752 |
| Oct-2022 | $127,326 | $104,496 | $216,171 | $223,335 | $123,511 |
| Oct-2023 | $132,769 | $104,868 | $234,287 | $245,988 | $126,390 |
| Oct-2024 | $157,956 | $115,928 | $322,976 | $339,505 | $146,175 |
Average Annual Total Returns as of 10/31/2024
| 1 Year | 5 Years | 10 Years | |
|---|---|---|---|
| Westwood Multi-Asset Income Fund - Institutional Shares | 18.97% | 6.14% | 4.68% |
| Bloomberg U.S. Aggregate Bond Index | 10.55% | -0.23% | 1.49% |
Russell 3000® Total Return Index | 37.86% | 14.60% | 12.44% |
| S&P 500 Index | 38.02% | 15.27% | 13.00% |
| Westwood -80%Bloom US Agg/20%S&P500TR | 15.65% | 2.90% | 3.87% |
Past performance does not guarantee future results. Call (877) 386-3944 or visit https://westwoodgroup.com/product/multi-asset-income-fund/ for current month-end performance.
Fund Statistics
- Net Assets$96,561,045
- Number of Portfolio Holdings136
- Advisory Fee (net of waivers)$650,199
- Portfolio Turnover65%
Asset Weighting (% of total investments)

| Value | Value |
|---|---|
| Collateralized Mortgage Obligations | 2.0% |
| Common Stocks | 24.0% |
| Corporate Bonds | 61.5% |
| Exchange-Traded Funds | 2.4% |
| Foreign Governments | 0.7% |
| Money Market Funds | 1.2% |
| Preferred Stocks | 2.3% |
| U.S. Government & Agencies | 5.8% |
| Warrant | 0.1% |
What did the Fund invest in?
Sector Weighting (% of net assets)
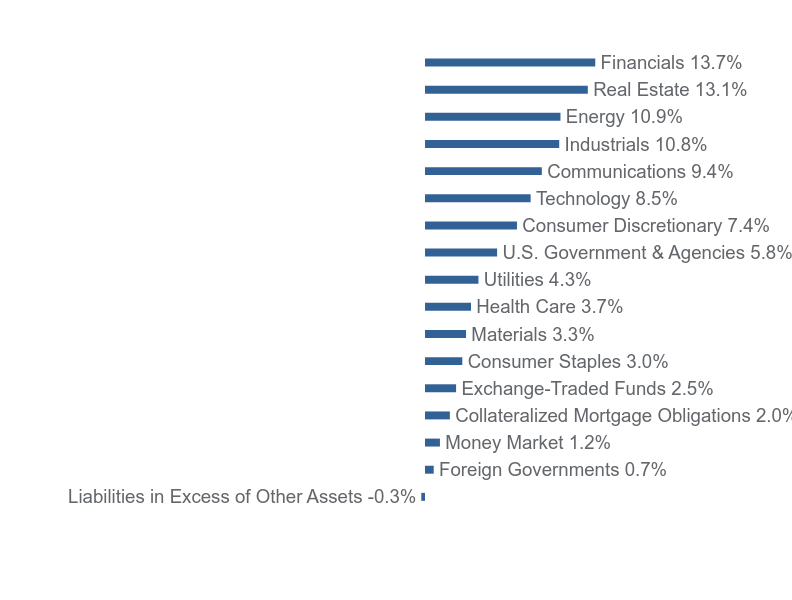
| Value | Value |
|---|---|
| Liabilities in Excess of Other Assets | -0.3% |
| Foreign Governments | 0.7% |
| Money Market | 1.2% |
| Collateralized Mortgage Obligations | 2.0% |
| Exchange-Traded Funds | 2.5% |
| Consumer Staples | 3.0% |
| Materials | 3.3% |
| Health Care | 3.7% |
| Utilities | 4.3% |
| U.S. Government & Agencies | 5.8% |
| Consumer Discretionary | 7.4% |
| Technology | 8.5% |
| Communications | 9.4% |
| Industrials | 10.8% |
| Energy | 10.9% |
| Real Estate | 13.1% |
| Financials | 13.7% |
Top 10 Holdings (% of net assets)
| Holding Name | % of Net Assets |
| U.S. Treasury Bonds, 4.250%, due 02/15/54 | 2.9% |
| U.S. Treasury Bonds, 4.750%, due 11/15/53 | 1.9% |
| Service Properties Trust, 8.875%, due 06/15/32 | 1.4% |
| Connect Finco SARL / Connect U.S. Finco, LLC, 9.000%, due 09/15/29 | 1.4% |
| JPMorgan Nasdaq Equity Premium Income ETF | 1.2% |
| Avation Capital S.A., 8.250%, due 10/31/26 | 1.2% |
| Walmart, Inc. | 1.2% |
| Level 3 Financing, Inc., 10.500%, due 05/15/30 | 1.1% |
| Martin Midstream Partners, L.P., 11.500%, due 02/15/28 | 1.1% |
| Ford Motor Credit Company, LLC, 7.450%, due 07/16/31 | 1.1% |
Material Fund Changes
Effective February 28, 2024, the Fund changed its name from the Westwood High Income Fund to the Westwood Multi-Asset Income Fund.

Westwood Multi-Asset Income Fund - Institutional Shares (WHGHX)
Annual Shareholder Report - October 31, 2024
Where can I find additional information about the Fund?
Additional information is available on the Fund's website (https://westwoodgroup.com/product/multi-asset-income-fund/), including its:
Prospectus
Financial information
Holdings
Proxy voting information
TSR-AR 103124-WHGHX
Westwood Multi-Asset Income Fund

A Class Shares (WSDAX)
Annual Shareholder Report - October 31, 2024
Fund Overview
This annual shareholder report contains important information about Westwood Multi-Asset Income Fund (the "Fund") for the period of November 1, 2023 to October 31, 2024. You can find additional information about the Fund at https://westwoodgroup.com/product/multi-asset-income-fund/. You can also request this information by contacting us at (877) 386-3944. This report describes changes to the Fund that occurred during the reporting period.
What were the Fund’s costs for the last year?
(based on a hypothetical $10,000 investment)
| Class Name | Costs of a $10,000 investment | Costs paid as a percentage of a $10,000 investment |
|---|---|---|
| A Class Shares | $122 | 1.12% |
How did the Fund perform during the reporting period?
For the trailing 12 months, the Westwood Multi-Asset Income Fund outperformed its representative blended benchmark (20% S&P 500/80% Bloomberg U.S. Aggregate Bond) by posting a strong absolute return of nearly 20%.
The equity markets continued to see strong returns for the period, driven in large part by the “Magnificent 7,” as this basket of large-cap growth names posted over a 50% return and significantly contributed to the S&P 500’s 38% return for the trailing 12 months.
During the period, the bond market was shaped by high interest rates as central banks, particularly the U.S. Federal Reserve, maintained elevated rates to control inflation. As a result, bond yields remained high, leading to lower bond prices, with investors focused on future economic growth and inflation trends.
Within the portfolio, we maintained an overweight allocation to equity securities relative to the benchmark, holding about 26% of the portfolio in stocks and convertible securities on average. While the overweight to equities was a positive contributor to performance for the period, stock selection was the primary detractor to the Fund’s performance. Our selection within fixed income was a positive contributor as both our investment grade and high yield holdings generally outperformed the bond market broadly.
How has the Fund performed over the last ten years?
Total Return Based on $10,000 Investment
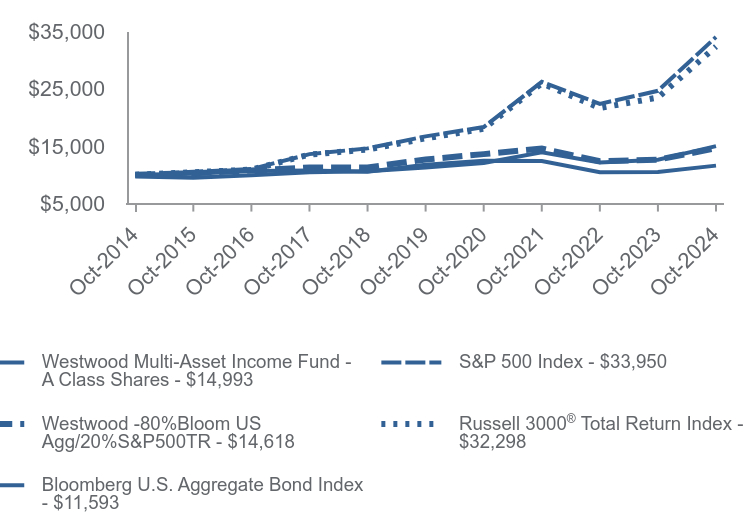
| Westwood Multi-Asset Income Fund - A Class Shares | S&P 500 Index | Westwood -80%Bloom US Agg/20%S&P500TR | Russell 3000® Total Return Index | Bloomberg U.S. Aggregate Bond Index | |
|---|---|---|---|---|---|
| Oct-2014 | $9,696 | $10,000 | $10,000 | $10,000 | $10,000 |
| Oct-2015 | $9,504 | $10,520 | $10,277 | $10,449 | $10,196 |
| Oct-2016 | $9,932 | $10,994 | $10,737 | $10,892 | $10,641 |
| Oct-2017 | $10,429 | $13,593 | $11,290 | $13,504 | $10,737 |
| Oct-2018 | $10,628 | $14,591 | $11,275 | $14,395 | $10,517 |
| Oct-2019 | $11,258 | $16,681 | $12,668 | $16,337 | $11,727 |
| Oct-2020 | $12,047 | $18,301 | $13,596 | $17,995 | $12,453 |
| Oct-2021 | $13,895 | $26,155 | $14,575 | $25,894 | $12,393 |
| Oct-2022 | $12,153 | $22,334 | $12,351 | $21,617 | $10,450 |
| Oct-2023 | $12,627 | $24,599 | $12,639 | $23,429 | $10,487 |
| Oct-2024 | $14,993 | $33,950 | $14,618 | $32,298 | $11,593 |
Average Annual Total Returns as of 10/31/2024
| 1 Year | 5 Years | 10 Years | |
|---|---|---|---|
| Westwood Multi-Asset Income Fund - A Class Shares | 18.73% | 5.90% | 4.45% |
| With Load* | 15.23% | 5.25% | 4.13% |
| Bloomberg U.S. Aggregate Bond Index | 10.55% | -0.23% | 1.49% |
Russell 3000® Total Return Index | 37.86% | 14.60% | 12.44% |
| S&P 500 Index | 38.02% | 15.27% | 13.00% |
| Westwood -80%Bloom US Agg/20%S&P500TR | 15.65% | 2.90% | 3.87% |
Past performance does not guarantee future results. Call (877) 386-3944 or visit https://westwoodgroup.com/product/multi-asset-income-fund/ for current month-end performance.
* Reflects the maximum sales charge applicable to A Class Shares.
Fund Statistics
- Net Assets$96,561,045
- Number of Portfolio Holdings136
- Advisory Fee (net of waivers)$650,199
- Portfolio Turnover65%
Asset Weighting (% of total investments)

| Value | Value |
|---|---|
| Collateralized Mortgage Obligations | 2.0% |
| Common Stocks | 24.0% |
| Corporate Bonds | 61.5% |
| Exchange-Traded Funds | 2.4% |
| Foreign Governments | 0.7% |
| Money Market Funds | 1.2% |
| Preferred Stocks | 2.3% |
| U.S. Government & Agencies | 5.8% |
| Warrant | 0.1% |
What did the Fund invest in?
Sector Weighting (% of net assets)

| Value | Value |
|---|---|
| Liabilities in Excess of Other Assets | -0.3% |
| Foreign Governments | 0.7% |
| Money Market | 1.2% |
| Collateralized Mortgage Obligations | 2.0% |
| Exchange-Traded Funds | 2.5% |
| Consumer Staples | 3.0% |
| Materials | 3.3% |
| Health Care | 3.7% |
| Utilities | 4.3% |
| U.S. Government & Agencies | 5.8% |
| Consumer Discretionary | 7.4% |
| Technology | 8.5% |
| Communications | 9.4% |
| Industrials | 10.8% |
| Energy | 10.9% |
| Real Estate | 13.1% |
| Financials | 13.7% |
Top 10 Holdings (% of net assets)
| Holding Name | % of Net Assets |
| U.S. Treasury Bonds, 4.250%, due 02/15/54 | 2.9% |
| U.S. Treasury Bonds, 4.750%, due 11/15/53 | 1.9% |
| Service Properties Trust, 8.875%, due 06/15/32 | 1.4% |
| Connect Finco SARL / Connect U.S. Finco, LLC, 9.000%, due 09/15/29 | 1.4% |
| JPMorgan Nasdaq Equity Premium Income ETF | 1.2% |
| Avation Capital S.A., 8.250%, due 10/31/26 | 1.2% |
| Walmart, Inc. | 1.2% |
| Level 3 Financing, Inc., 10.500%, due 05/15/30 | 1.1% |
| Martin Midstream Partners, L.P., 11.500%, due 02/15/28 | 1.1% |
| Ford Motor Credit Company, LLC, 7.450%, due 07/16/31 | 1.1% |
Material Fund Changes
Effective February 28, 2024, the Fund changed its name from the Westwood High Income Fund to the Westwood Multi-Asset Income Fund.

Westwood Multi-Asset Income Fund - A Class Shares (WSDAX)
Annual Shareholder Report - October 31, 2024
Where can I find additional information about the Fund?
Additional information is available on the Fund's website (https://westwoodgroup.com/product/multi-asset-income-fund/), including its:
Prospectus
Financial information
Holdings
Proxy voting information
TSR-AR 103124-WSDAX
Westwood Multi-Asset Income Fund

C Class Shares (WWHCX)
Annual Shareholder Report - October 31, 2024
Fund Overview
This annual shareholder report contains important information about Westwood Multi-Asset Income Fund (the "Fund") for the period of November 1, 2023 to October 31, 2024. You can find additional information about the Fund at https://westwoodgroup.com/product/multi-asset-income-fund/. You can also request this information by contacting us at (877) 386-3944. This report describes changes to the Fund that occurred during the reporting period.
What were the Fund’s costs for the last year?
(based on a hypothetical $10,000 investment)
| Class Name | Costs of a $10,000 investment | Costs paid as a percentage of a $10,000 investment |
|---|---|---|
| C Class Shares | $204 | 1.87% |
How did the Fund perform during the reporting period?
For the trailing 12 months, the Westwood Multi-Asset Income Fund outperformed its representative blended benchmark (20% S&P 500/80% Bloomberg U.S. Aggregate Bond) by posting a strong absolute return of nearly 20%.
The equity markets continued to see strong returns for the period, driven in large part by the “Magnificent 7,” as this basket of large-cap growth names posted over a 50% return and significantly contributed to the S&P 500’s 38% return for the trailing 12 months.
During the period, the bond market was shaped by high interest rates as central banks, particularly the U.S. Federal Reserve, maintained elevated rates to control inflation. As a result, bond yields remained high, leading to lower bond prices, with investors focused on future economic growth and inflation trends.
Within the portfolio, we maintained an overweight allocation to equity securities relative to the benchmark, holding about 26% of the portfolio in stocks and convertible securities on average. While the overweight to equities was a positive contributor to performance for the period, stock selection was the primary detractor to the Fund’s performance. Our selection within fixed income was a positive contributor as both our investment grade and high yield holdings generally outperformed the bond market broadly.
How has the Fund performed since inception?
Total Return Based on $10,000 Investment
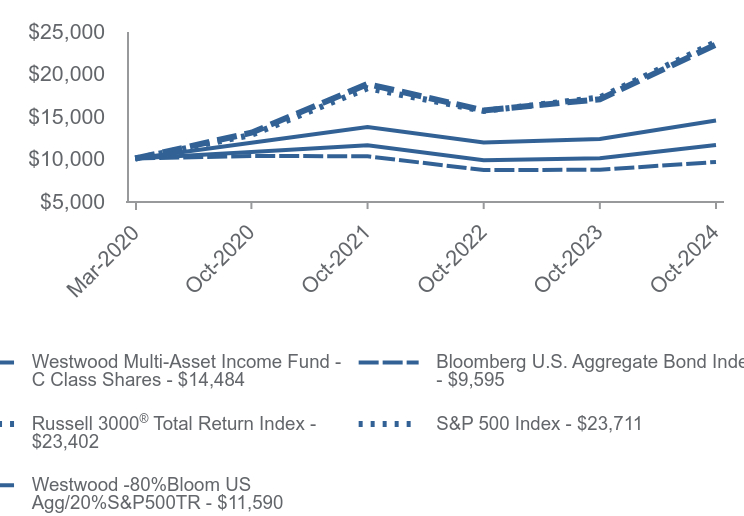
| Westwood Multi-Asset Income Fund - C Class Shares | Bloomberg U.S. Aggregate Bond Index | Russell 3000® Total Return Index | S&P 500 Index | Westwood -80%Bloom US Agg/20%S&P500TR | |
|---|---|---|---|---|---|
| Mar-2020 | $10,000 | $10,000 | $10,000 | $10,000 | $10,000 |
| Oct-2020 | $11,851 | $10,307 | $13,039 | $12,782 | $10,780 |
| Oct-2021 | $13,720 | $10,258 | $18,763 | $18,267 | $11,556 |
| Oct-2022 | $11,893 | $8,649 | $15,663 | $15,598 | $9,793 |
| Oct-2023 | $12,290 | $8,680 | $16,976 | $17,180 | $10,021 |
| Oct-2024 | $14,484 | $9,595 | $23,402 | $23,711 | $11,590 |
Average Annual Total Returns as of 10/31/2024
| 1 Year | Since Inception (March 31, 2020) | |
|---|---|---|
| Westwood Multi-Asset Income Fund - C Class Shares | ||
| Without CDSC | 17.85% | 8.41% |
| With CDSC | 16.85% | 8.41% |
| Bloomberg U.S. Aggregate Bond Index | 10.55% | -0.90% |
Russell 3000® Total Return Index | 37.86% | 20.37% |
| S&P 500 Index | 38.02% | 20.71% |
| Westwood -80%Bloom US Agg/20%S&P500TR | 15.65% | 3.18% |
Past performance does not guarantee future results. Call (877) 386-3944 or visit https://westwoodgroup.com/product/multi-asset-income-fund/ for current month-end performance.
Fund Statistics
- Net Assets$96,561,045
- Number of Portfolio Holdings136
- Advisory Fee (net of waivers)$650,199
- Portfolio Turnover65%
Asset Weighting (% of total investments)
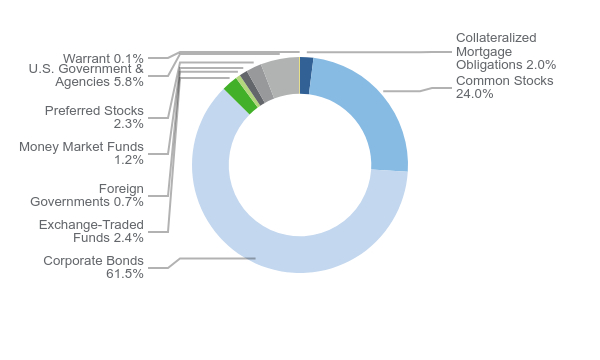
| Value | Value |
|---|---|
| Collateralized Mortgage Obligations | 2.0% |
| Common Stocks | 24.0% |
| Corporate Bonds | 61.5% |
| Exchange-Traded Funds | 2.4% |
| Foreign Governments | 0.7% |
| Money Market Funds | 1.2% |
| Preferred Stocks | 2.3% |
| U.S. Government & Agencies | 5.8% |
| Warrant | 0.1% |
What did the Fund invest in?
Sector Weighting (% of net assets)

| Value | Value |
|---|---|
| Liabilities in Excess of Other Assets | -0.3% |
| Foreign Governments | 0.7% |
| Money Market | 1.2% |
| Collateralized Mortgage Obligations | 2.0% |
| Exchange-Traded Funds | 2.5% |
| Consumer Staples | 3.0% |
| Materials | 3.3% |
| Health Care | 3.7% |
| Utilities | 4.3% |
| U.S. Government & Agencies | 5.8% |
| Consumer Discretionary | 7.4% |
| Technology | 8.5% |
| Communications | 9.4% |
| Industrials | 10.8% |
| Energy | 10.9% |
| Real Estate | 13.1% |
| Financials | 13.7% |
Top 10 Holdings (% of net assets)
| Holding Name | % of Net Assets |
| U.S. Treasury Bonds, 4.250%, due 02/15/54 | 2.9% |
| U.S. Treasury Bonds, 4.750%, due 11/15/53 | 1.9% |
| Service Properties Trust, 8.875%, due 06/15/32 | 1.4% |
| Connect Finco SARL / Connect U.S. Finco, LLC, 9.000%, due 09/15/29 | 1.4% |
| JPMorgan Nasdaq Equity Premium Income ETF | 1.2% |
| Avation Capital S.A., 8.250%, due 10/31/26 | 1.2% |
| Walmart, Inc. | 1.2% |
| Level 3 Financing, Inc., 10.500%, due 05/15/30 | 1.1% |
| Martin Midstream Partners, L.P., 11.500%, due 02/15/28 | 1.1% |
| Ford Motor Credit Company, LLC, 7.450%, due 07/16/31 | 1.1% |
Material Fund Changes
Effective February 28, 2024, the Fund changed its name from the Westwood High Income Fund to the Westwood Multi-Asset Income Fund.

Westwood Multi-Asset Income Fund - C Class Shares (WWHCX)
Annual Shareholder Report - October 31, 2024
Where can I find additional information about the Fund?
Additional information is available on the Fund's website (https://westwoodgroup.com/product/multi-asset-income-fund/), including its:
Prospectus
Financial information
Holdings
Proxy voting information
TSR-AR 103124-WWHCX
Westwood Alternative Income Fund

Institutional Shares (WMNIX)
Annual Shareholder Report - October 31, 2024
Fund Overview
This annual shareholder report contains important information about Westwood Alternative Income Fund (the "Fund") for the period of November 1, 2023 to October 31, 2024. You can find additional information about the Fund at https://westwoodgroup.com/product/alternative-income-fund/. You can also request this information by contacting us at (877) 386-3944.
What were the Fund’s costs for the last year?
(based on a hypothetical $10,000 investment)
| Class Name | Costs of a $10,000 investment | Costs paid as a percentage of a $10,000 investment |
|---|---|---|
| Institutional Shares | $104 | 0.99% |
How did the Fund perform during the reporting period?
For the trailing 12 months, the Westwood Alternative Income Fund outperformed its benchmark (FTSE 1-Month Treasury Bill) by several hundred basis points.
In the portfolio, both our Convertible Arbitrage and Yield allocations posted positive net returns for the period. Performance was driven by exposure to equity price movements and volatility as the convertible arbitrage sleeve benefited from lower interest rates, tight credit spreads, increased volatility and the outperformance of small-midcaps.
The prospect of interest rate cuts improved the market’s mood to take additional risk. Small- and mid-cap growth equities (most associated with convertibles) had strong absolute performance as the rate-cutting cycle began. The future cost of capital is declining and thus lowering the cost of funds to fuel capital-intensive growth stories.
In terms of positioning, net equity delta was increased in anticipation of Fed rate cuts. Small-cap equity performance is sensitive to changes in interest rates as the companies typically need more capital to fund their growth and expand their businesses. We feel that taking the additional equity risk is warranted in light of the Fed’s latest move and potential future reductions in rates. Our yield bucket allocation remains at below 20% both as a function of tighter credit spreads and its potential for lower risk-adjusted forward-looking returns relative to convertible arbitrage. We may experience some turbulent waters in the near term as each economic data point is released, but the Fund, as a long volatility strategy, is positioned to capitalize on this uncertainty.
How has the Fund performed since inception?
Total Return Based on $100,000 Investment
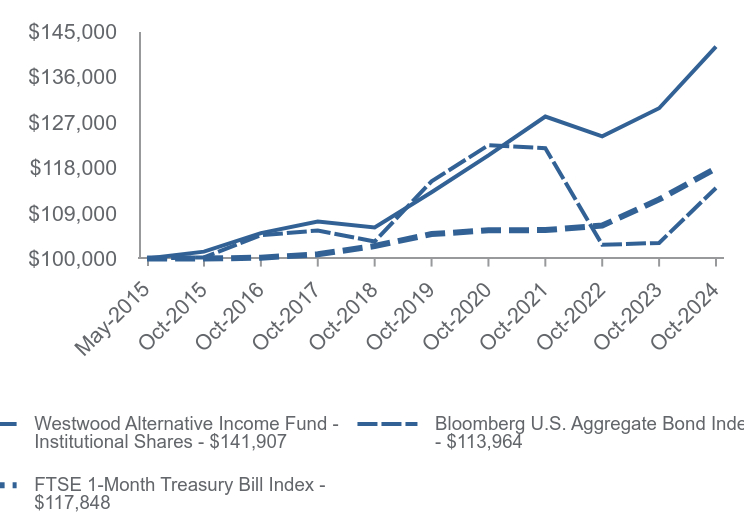
| Westwood Alternative Income Fund - Institutional Shares | Bloomberg U.S. Aggregate Bond Index | FTSE 1-Month Treasury Bill Index | |
|---|---|---|---|
| May-2015 | $100,000 | $100,000 | $100,000 |
| Oct-2015 | $101,376 | $100,229 | $100,004 |
| Oct-2016 | $105,042 | $104,609 | $100,179 |
| Oct-2017 | $107,306 | $105,553 | $100,848 |
| Oct-2018 | $106,134 | $103,386 | $102,477 |
| Oct-2019 | $113,105 | $115,285 | $104,849 |
| Oct-2020 | $120,393 | $122,417 | $105,591 |
| Oct-2021 | $128,079 | $121,832 | $105,637 |
| Oct-2022 | $124,168 | $102,726 | $106,529 |
| Oct-2023 | $129,727 | $103,092 | $111,694 |
| Oct-2024 | $141,907 | $113,964 | $117,848 |
Average Annual Total Returns as of 10/31/2024
| 1 Year | 5 Years | Since Inception (May 1, 2015) | |
|---|---|---|---|
| Westwood Alternative Income Fund - Institutional Shares | 9.39% | 4.64% | 3.75% |
| Bloomberg U.S. Aggregate Bond Index | 10.55% | -0.23% | 1.39% |
| FTSE 1-Month Treasury Bill Index | 5.51% | 2.37% | 1.74% |
Past performance does not guarantee future results. Call (877) 386-3944 or visit https://westwoodgroup.com/product/alternative-income-fund/ for current month-end performance.
Fund Statistics
- Net Assets$123,384,734
- Number of Portfolio Holdings116
- Advisory Fee (net of waivers)$741,950
- Portfolio Turnover51%
Asset Weighting (% of total investments)

| Value | Value |
|---|---|
| Common Stocks | 1.1% |
| Convertible Bonds | 81.2% |
| Corporate Bonds | 14.1% |
| Money Market Funds | 3.6% |
What did the Fund invest in?
Sector Weighting (% of net assets)

| Value | Value |
|---|---|
| Liabilities in Excess of Other Assets | -0.4% |
| Real Estate | 1.6% |
| Consumer Staples | 1.9% |
| Utilities | 2.1% |
| Materials | 3.0% |
| Money Market | 3.6% |
| Communications | 5.0% |
| Energy | 6.0% |
| Financials | 8.4% |
| Industrials | 12.7% |
| Consumer Discretionary | 14.4% |
| Health Care | 16.4% |
| Technology | 25.3% |
Top 10 Holdings (% of net assets)
| Holding Name | % of Net Assets |
| Axon Enterprise, Inc. | 3.8% |
| Royal Caribbean Cruises Ltd. | 3.4% |
| Lantheus Holdings, Inc. 144A | 3.1% |
| Northern Oil & Gas, Inc. | 2.7% |
| Merit Medical Systems, Inc. 144A | 2.6% |
| Alnylam Pharmaceuticals, Inc. | 2.3% |
| MP Materials Corporation 144A | 2.2% |
| Fluor Corporation | 2.1% |
| Live Nation Entertainment, Inc. | 2.1% |
| MongoDB, Inc. | 2.1% |
Material Fund Changes
No material changes occurred during the year ended October 31, 2024.

Westwood Alternative Income Fund - Institutional Shares (WMNIX)
Annual Shareholder Report - October 31, 2024
Where can I find additional information about the Fund?
Additional information is available on the Fund's website (https://westwoodgroup.com/product/alternative-income-fund/), including its:
Prospectus
Financial information
Holdings
Proxy voting information
TSR-AR 103124-WMNIX
Westwood Alternative Income Fund

A Class Shares (WMNAX)
Annual Shareholder Report - October 31, 2024
Fund Overview
This annual shareholder report contains important information about Westwood Alternative Income Fund (the "Fund") for the period of November 1, 2023 to October 31, 2024. You can find additional information about the Fund at https://westwoodgroup.com/product/alternative-income-fund/. You can also request this information by contacting us at (877) 386-3944.
What were the Fund’s costs for the last year?
(based on a hypothetical $10,000 investment)
| Class Name | Costs of a $10,000 investment | Costs paid as a percentage of a $10,000 investment |
|---|---|---|
| A Class Shares | $114 | 1.09% |
How did the Fund perform during the reporting period?
For the trailing 12 months, the Westwood Alternative Income Fund outperformed its benchmark (FTSE 1-Month Treasury Bill) by several hundred basis points.
In the portfolio, both our Convertible Arbitrage and Yield allocations posted positive net returns for the period. Performance was driven by exposure to equity price movements and volatility as the convertible arbitrage sleeve benefited from lower interest rates, tight credit spreads, increased volatility and the outperformance of small-midcaps.
The prospect of interest rate cuts improved the market’s mood to take additional risk. Small- and mid-cap growth equities (most associated with convertibles) had strong absolute performance as the rate-cutting cycle began. The future cost of capital is declining and thus lowering the cost of funds to fuel capital-intensive growth stories.
In terms of positioning, net equity delta was increased in anticipation of Fed rate cuts. Small-cap equity performance is sensitive to changes in interest rates as the companies typically need more capital to fund their growth and expand their businesses. We feel that taking the additional equity risk is warranted in light of the Fed’s latest move and potential future reductions in rates. Our yield bucket allocation remains at below 20% both as a function of tighter credit spreads and its potential for lower risk-adjusted forward-looking returns relative to convertible arbitrage. We may experience some turbulent waters in the near term as each economic data point is released, but the Fund, as a long volatility strategy, is positioned to capitalize on this uncertainty.
How has the Fund performed since inception?
Total Return Based on $10,000 Investment
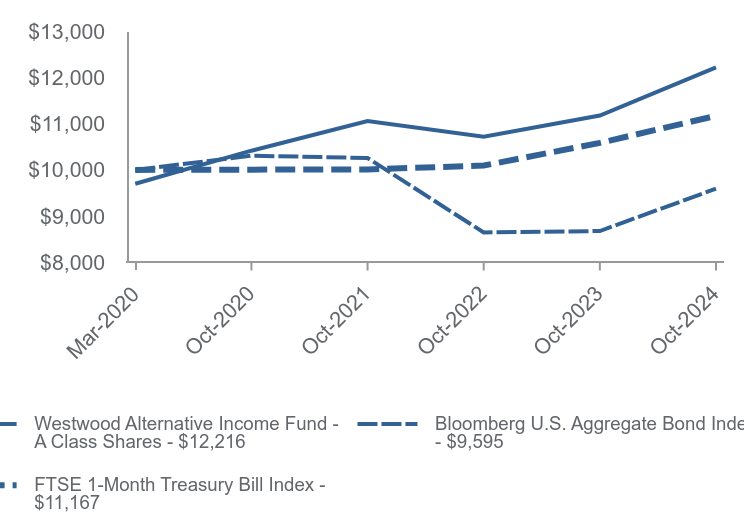
| Westwood Alternative Income Fund - A Class Shares | Bloomberg U.S. Aggregate Bond Index | FTSE 1-Month Treasury Bill Index | |
|---|---|---|---|
| Mar-2020 | $9,702 | $10,000 | $10,000 |
| Oct-2020 | $10,415 | $10,307 | $10,006 |
| Oct-2021 | $11,057 | $10,258 | $10,010 |
| Oct-2022 | $10,719 | $8,649 | $10,094 |
| Oct-2023 | $11,174 | $8,680 | $10,584 |
| Oct-2024 | $12,216 | $9,595 | $11,167 |
Average Annual Total Returns as of 10/31/2024
| 1 Year | Since Inception (March 31, 2020) | |
|---|---|---|
| Westwood Alternative Income Fund - A Class Shares | ||
| Without Load | 9.33% | 5.15% |
| With Load* | 6.07% | 4.46% |
| Bloomberg U.S. Aggregate Bond Index | 10.55% | -0.90% |
| FTSE 1-Month Treasury Bill Index | 5.51% | 2.44% |
Past performance does not guarantee future results. Call (877) 386-3944 or visit https://westwoodgroup.com/product/alternative-income-fund/ for current month-end performance.
* Reflects the maximum sales charge applicable to A Class Shares.
Fund Statistics
- Net Assets$123,384,734
- Number of Portfolio Holdings116
- Advisory Fee (net of waivers)$741,950
- Portfolio Turnover51%
Asset Weighting (% of total investments)
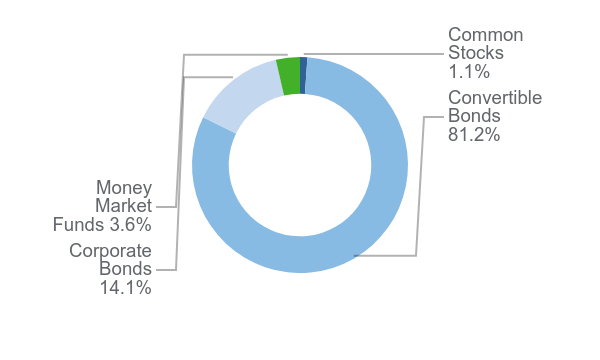
| Value | Value |
|---|---|
| Common Stocks | 1.1% |
| Convertible Bonds | 81.2% |
| Corporate Bonds | 14.1% |
| Money Market Funds | 3.6% |
What did the Fund invest in?
Sector Weighting (% of net assets)

| Value | Value |
|---|---|
| Liabilities in Excess of Other Assets | -0.4% |
| Real Estate | 1.6% |
| Consumer Staples | 1.9% |
| Utilities | 2.1% |
| Materials | 3.0% |
| Money Market | 3.6% |
| Communications | 5.0% |
| Energy | 6.0% |
| Financials | 8.4% |
| Industrials | 12.7% |
| Consumer Discretionary | 14.4% |
| Health Care | 16.4% |
| Technology | 25.3% |
Top 10 Holdings (% of net assets)
| Holding Name | % of Net Assets |
| Axon Enterprise, Inc. | 3.8% |
| Royal Caribbean Cruises Ltd. | 3.4% |
| Lantheus Holdings, Inc. 144A | 3.1% |
| Northern Oil & Gas, Inc. | 2.7% |
| Merit Medical Systems, Inc. 144A | 2.6% |
| Alnylam Pharmaceuticals, Inc. | 2.3% |
| MP Materials Corporation 144A | 2.2% |
| Fluor Corporation | 2.1% |
| Live Nation Entertainment, Inc. | 2.1% |
| MongoDB, Inc. | 2.1% |
Material Fund Changes
No material changes occurred during the year ended October 31, 2024.

Westwood Alternative Income Fund - A Class Shares (WMNAX)
Annual Shareholder Report - October 31, 2024
Where can I find additional information about the Fund?
Additional information is available on the Fund's website (https://westwoodgroup.com/product/alternative-income-fund/), including its:
Prospectus
Financial information
Holdings
Proxy voting information
TSR-AR 103124-WMNAX
Westwood Alternative Income Fund

C Class Shares (WWACX)
Annual Shareholder Report - October 31, 2024
Fund Overview
This annual shareholder report contains important information about Westwood Alternative Income Fund (the "Fund") for the period of November 1, 2023 to October 31, 2024. You can find additional information about the Fund at https://westwoodgroup.com/product/alternative-income-fund/. You can also request this information by contacting us at (877) 386-3944.
What were the Fund’s costs for the last year?
(based on a hypothetical $10,000 investment)
| Class Name | Costs of a $10,000 investment | Costs paid as a percentage of a $10,000 investment |
|---|---|---|
| C Class Shares | $193 | 1.85% |
How did the Fund perform during the reporting period?
For the trailing 12 months, the Westwood Alternative Income Fund outperformed its benchmark (FTSE 1-Month Treasury Bill) by several hundred basis points.
In the portfolio, both our Convertible Arbitrage and Yield allocations posted positive net returns for the period. Performance was driven by exposure to equity price movements and volatility as the convertible arbitrage sleeve benefited from lower interest rates, tight credit spreads, increased volatility and the outperformance of small-midcaps.
The prospect of interest rate cuts improved the market’s mood to take additional risk. Small- and mid-cap growth equities (most associated with convertibles) had strong absolute performance as the rate-cutting cycle began. The future cost of capital is declining and thus lowering the cost of funds to fuel capital-intensive growth stories.
In terms of positioning, net equity delta was increased in anticipation of Fed rate cuts. Small-cap equity performance is sensitive to changes in interest rates as the companies typically need more capital to fund their growth and expand their businesses. We feel that taking the additional equity risk is warranted in light of the Fed’s latest move and potential future reductions in rates. Our yield bucket allocation remains at below 20% both as a function of tighter credit spreads and its potential for lower risk-adjusted forward-looking returns relative to convertible arbitrage. We may experience some turbulent waters in the near term as each economic data point is released, but the Fund, as a long volatility strategy, is positioned to capitalize on this uncertainty.
How has the Fund performed since inception?
Total Return Based on $10,000 Investment
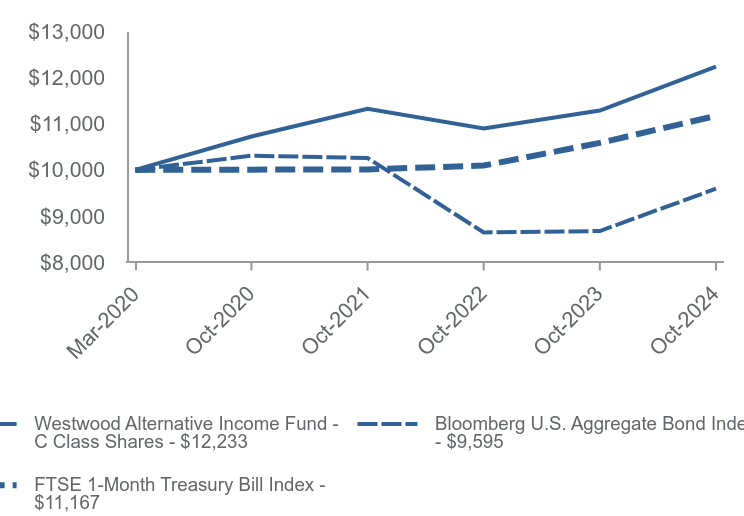
| Westwood Alternative Income Fund - C Class Shares | Bloomberg U.S. Aggregate Bond Index | FTSE 1-Month Treasury Bill Index | |
|---|---|---|---|
| Mar-2020 | $10,000 | $10,000 | $10,000 |
| Oct-2020 | $10,721 | $10,307 | $10,006 |
| Oct-2021 | $11,319 | $10,258 | $10,010 |
| Oct-2022 | $10,893 | $8,649 | $10,094 |
| Oct-2023 | $11,282 | $8,680 | $10,584 |
| Oct-2024 | $12,233 | $9,595 | $11,167 |
Average Annual Total Returns as of 10/31/2024
| 1 Year | Since Inception (March 31, 2020) | |
|---|---|---|
| Westwood Alternative Income Fund - C Class Shares | ||
| Without CDSC | 8.43% | 4.49% |
| With CDSC | 7.43% | 4.49% |
| Bloomberg U.S. Aggregate Bond Index | 10.55% | -0.90% |
| FTSE 1-Month Treasury Bill Index | 5.51% | 2.44% |
Past performance does not guarantee future results. Call (877) 386-3944 or visit https://westwoodgroup.com/product/alternative-income-fund/ for current month-end performance.
Fund Statistics
- Net Assets$123,384,734
- Number of Portfolio Holdings116
- Advisory Fee (net of waivers)$741,950
- Portfolio Turnover51%
Asset Weighting (% of total investments)

| Value | Value |
|---|---|
| Common Stocks | 1.1% |
| Convertible Bonds | 81.2% |
| Corporate Bonds | 14.1% |
| Money Market Funds | 3.6% |
What did the Fund invest in?
Sector Weighting (% of net assets)

| Value | Value |
|---|---|
| Liabilities in Excess of Other Assets | -0.4% |
| Real Estate | 1.6% |
| Consumer Staples | 1.9% |
| Utilities | 2.1% |
| Materials | 3.0% |
| Money Market | 3.6% |
| Communications | 5.0% |
| Energy | 6.0% |
| Financials | 8.4% |
| Industrials | 12.7% |
| Consumer Discretionary | 14.4% |
| Health Care | 16.4% |
| Technology | 25.3% |
Top 10 Holdings (% of net assets)
| Holding Name | % of Net Assets |
| Axon Enterprise, Inc. | 3.8% |
| Royal Caribbean Cruises Ltd. | 3.4% |
| Lantheus Holdings, Inc. 144A | 3.1% |
| Northern Oil & Gas, Inc. | 2.7% |
| Merit Medical Systems, Inc. 144A | 2.6% |
| Alnylam Pharmaceuticals, Inc. | 2.3% |
| MP Materials Corporation 144A | 2.2% |
| Fluor Corporation | 2.1% |
| Live Nation Entertainment, Inc. | 2.1% |
| MongoDB, Inc. | 2.1% |
Material Fund Changes
No material changes occurred during the year ended October 31, 2024.

Westwood Alternative Income Fund - C Class Shares (WWACX)
Annual Shareholder Report - October 31, 2024
Where can I find additional information about the Fund?
Additional information is available on the Fund's website (https://westwoodgroup.com/product/alternative-income-fund/), including its:
Prospectus
Financial information
Holdings
Proxy voting information
TSR-AR 103124-WWACX
Westwood Alternative Income Fund

Ultra Shares (WMNUX)
Annual Shareholder Report - October 31, 2024
Fund Overview
This annual shareholder report contains important information about Westwood Alternative Income Fund (the "Fund") for the period of November 1, 2023 to October 31, 2024. You can find additional information about the Fund at https://westwoodgroup.com/product/alternative-income-fund/. You can also request this information by contacting us at (877) 386-3944.
What were the Fund’s costs for the last year?
(based on a hypothetical $10,000 investment)
| Class Name | Costs of a $10,000 investment | Costs paid as a percentage of a $10,000 investment |
|---|---|---|
| Ultra Shares | $89 | 0.85% |
How did the Fund perform during the reporting period?
For the trailing 12 months, the Westwood Alternative Income Fund outperformed its benchmark (FTSE 1-Month Treasury Bill) by several hundred basis points.
In the portfolio, both our Convertible Arbitrage and Yield allocations posted positive net returns for the period. Performance was driven by exposure to equity price movements and volatility as the convertible arbitrage sleeve benefited from lower interest rates, tight credit spreads, increased volatility and the outperformance of small-midcaps.
The prospect of interest rate cuts improved the market’s mood to take additional risk. Small- and mid-cap growth equities (most associated with convertibles) had strong absolute performance as the rate-cutting cycle began. The future cost of capital is declining and thus lowering the cost of funds to fuel capital-intensive growth stories.
In terms of positioning, net equity delta was increased in anticipation of Fed rate cuts. Small-cap equity performance is sensitive to changes in interest rates as the companies typically need more capital to fund their growth and expand their businesses. We feel that taking the additional equity risk is warranted in light of the Fed’s latest move and potential future reductions in rates. Our yield bucket allocation remains at below 20% both as a function of tighter credit spreads and its potential for lower risk-adjusted forward-looking returns relative to convertible arbitrage. We may experience some turbulent waters in the near term as each economic data point is released, but the Fund, as a long volatility strategy, is positioned to capitalize on this uncertainty.
How has the Fund performed since inception?
Total Return Based on $1,000,000 Investment
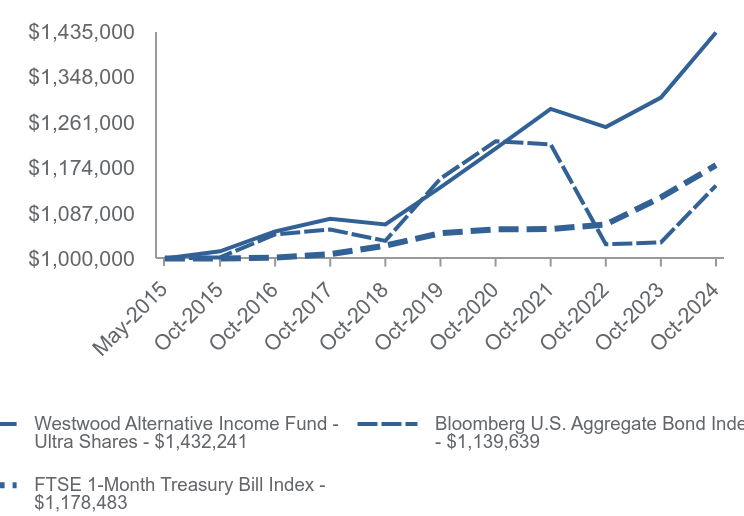
| Westwood Alternative Income Fund - Ultra Shares | Bloomberg U.S. Aggregate Bond Index | FTSE 1-Month Treasury Bill Index | |
|---|---|---|---|
| May-2015 | $1,000,000 | $1,000,000 | $1,000,000 |
| Oct-2015 | $1,013,965 | $1,002,287 | $1,000,037 |
| Oct-2016 | $1,051,826 | $1,046,089 | $1,001,791 |
| Oct-2017 | $1,076,167 | $1,055,529 | $1,008,481 |
| Oct-2018 | $1,065,233 | $1,033,855 | $1,024,767 |
| Oct-2019 | $1,135,933 | $1,152,846 | $1,048,491 |
| Oct-2020 | $1,210,223 | $1,224,174 | $1,055,912 |
| Oct-2021 | $1,285,993 | $1,218,321 | $1,056,369 |
| Oct-2022 | $1,251,405 | $1,027,257 | $1,065,289 |
| Oct-2023 | $1,307,744 | $1,030,916 | $1,116,942 |
| Oct-2024 | $1,432,241 | $1,139,639 | $1,178,483 |
Average Annual Total Returns as of 10/31/2024
| 1 Year | 5 Years | Since Inception (May 1, 2015) | |
|---|---|---|---|
| Westwood Alternative Income Fund - Ultra Shares | 9.52% | 4.74% | 3.85% |
| Bloomberg U.S. Aggregate Bond Index | 10.55% | -0.23% | 1.39% |
| FTSE 1-Month Treasury Bill Index | 5.51% | 2.37% | 1.74% |
Past performance does not guarantee future results. Call (877) 386-3944 or visit https://westwoodgroup.com/product/alternative-income-fund/ for current month-end performance.
Fund Statistics
- Net Assets$123,384,734
- Number of Portfolio Holdings116
- Advisory Fee (net of waivers)$741,950
- Portfolio Turnover51%
Asset Weighting (% of total investments)

| Value | Value |
|---|---|
| Common Stocks | 1.1% |
| Convertible Bonds | 81.2% |
| Corporate Bonds | 14.1% |
| Money Market Funds | 3.6% |
What did the Fund invest in?
Sector Weighting (% of net assets)
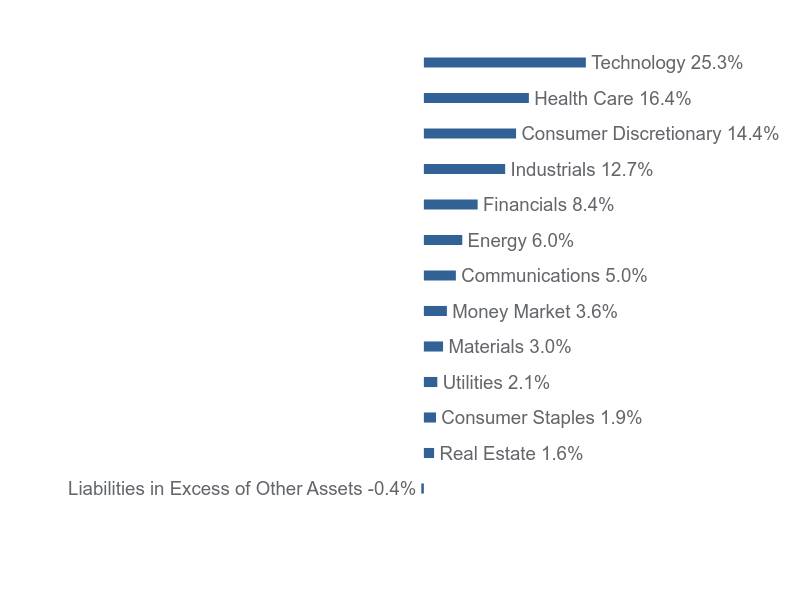
| Value | Value |
|---|---|
| Liabilities in Excess of Other Assets | -0.4% |
| Real Estate | 1.6% |
| Consumer Staples | 1.9% |
| Utilities | 2.1% |
| Materials | 3.0% |
| Money Market | 3.6% |
| Communications | 5.0% |
| Energy | 6.0% |
| Financials | 8.4% |
| Industrials | 12.7% |
| Consumer Discretionary | 14.4% |
| Health Care | 16.4% |
| Technology | 25.3% |
Top 10 Holdings (% of net assets)
| Holding Name | % of Net Assets |
| Axon Enterprise, Inc. | 3.8% |
| Royal Caribbean Cruises Ltd. | 3.4% |
| Lantheus Holdings, Inc. 144A | 3.1% |
| Northern Oil & Gas, Inc. | 2.7% |
| Merit Medical Systems, Inc. 144A | 2.6% |
| Alnylam Pharmaceuticals, Inc. | 2.3% |
| MP Materials Corporation 144A | 2.2% |
| Fluor Corporation | 2.1% |
| Live Nation Entertainment, Inc. | 2.1% |
| MongoDB, Inc. | 2.1% |
Material Fund Changes
No material changes occurred during the year ended October 31, 2024.

Westwood Alternative Income Fund - Ultra Shares (WMNUX)
Annual Shareholder Report - October 31, 2024
Where can I find additional information about the Fund?
Additional information is available on the Fund's website (https://westwoodgroup.com/product/alternative-income-fund/), including its:
Prospectus
Financial information
Holdings
Proxy voting information
TSR-AR 103124-WMNUX
Westwood Salient MLP & Energy Infrastructure Fund

Institutional Shares (SMLPX)
Semi-Annual Shareholder Report - October 31, 2024
Fund Overview
This semi-annual shareholder report contains important information about Westwood Salient MLP & Energy Infrastructure Fund (the "Fund") for the period of January 1, 2024 to October 31, 2024. You can find additional information about the Fund at https://westwoodgroup.com/product/energy-infrastructure-fund/. You can also request this information by contacting us at (877) 386-3944. This report describes changes to the Fund that occurred during the reporting period.
What were the Fund’s costs for the last 10 months?
(based on a hypothetical $10,000 investment)
| Class Name | Costs of a $10,000 investment | Costs paid as a percentage of a $10,000 investment |
|---|---|---|
| Institutional Shares | $123 | 1.07% |
How did the Fund perform during the reporting period?
For the trailing twelve months, the Westwood Salient MLP and Energy Infrastructure Fund modestly trailed its representative benchmark (Alerian Midstream Energy Select TR Index) during the period despite posting a strong absolute return of nearly 40%.
During the period, the best performing sector on an absolute basis was Natural Gas Pipelines, which significantly contributed to fund performance as the sub-sector returned over 60% for the period due to rising U.S. power demand linked to AI data centers. The Fund's limited exposure to Renewable Energy negatively impacted performance, as the sector struggled with challenges such as rising interest rates, inflation, supply chain disruptions, and uncertainties about the industry's future in light of the upcoming US Presidential Election.
On a relative basis, allocation was the main driver of underperformance during the period versus the benchmark. While allocation effects detracted, the Fund’s stock selection generated almost 300bps of positive attribution. We continue to believe that U.S. production growth in coming years will fill existing pipeline capacity and provide incremental cash flow growth to midstream businesses, which will be returned to shareholders via larger distributions and potential stock buybacks.
How has the Fund performed over the last ten years?
Total Return Based on $100,000 Investment
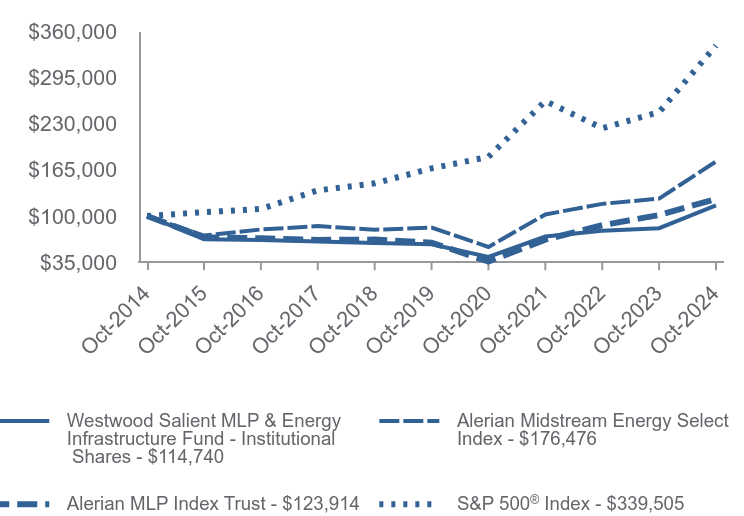
| Westwood Salient MLP & Energy Infrastructure Fund - Institutional Shares | Alerian Midstream Energy Select Index | Alerian MLP Index Trust | S&P 500® Index | |
|---|---|---|---|---|
| Oct-2014 | $100,000 | $100,000 | $100,000 | $100,000 |
| Oct-2015 | $67,409 | $72,465 | $69,919 | $105,200 |
| Oct-2016 | $66,030 | $80,974 | $68,661 | $109,943 |
| Oct-2017 | $64,153 | $85,724 | $66,336 | $135,925 |
| Oct-2018 | $61,862 | $80,542 | $66,785 | $145,911 |
| Oct-2019 | $60,161 | $83,731 | $62,539 | $166,814 |
| Oct-2020 | $42,414 | $56,382 | $35,949 | $183,012 |
| Oct-2021 | $71,019 | $102,147 | $66,755 | $261,550 |
| Oct-2022 | $79,327 | $116,974 | $86,907 | $223,335 |
| Oct-2023 | $82,780 | $124,429 | $101,334 | $245,988 |
| Oct-2024 | $114,740 | $176,476 | $123,914 | $339,505 |
Average Annual Total Returns as of 10/31/2024
| 10 months | 1 Year | 5 Years | 10 Years | |
|---|---|---|---|---|
| Westwood Salient MLP & Energy Infrastructure Fund - Institutional Shares | 30.24% | 38.61% | 13.78% | 1.38% |
S&P 500® Index | 20.97% | 38.02% | 15.27% | 13.00% |
| Alerian MLP Index Trust | 16.97% | 22.28% | 14.66% | 2.17% |
| Alerian Midstream Energy Select Index | 33.25% | 41.83% | 16.08% | 5.84% |
Past performance does not guarantee future results. Call (877) 386-3944 or visit https://westwoodgroup.com/product/energy-infrastructure-fund/ for current month-end performance.
Fund Statistics
- Net Assets$1,148,056,596
- Number of Portfolio Holdings48
- Advisory Fee (net of waivers)$7,354,550
- Portfolio Turnover74%
Asset Weighting (% of total investments)

| Value | Value |
|---|---|
| Affiliated Exchange-Traded Funds | 4.6% |
| Master Limited Partnerships | 24.2% |
| MLP Related Companies | 71.0% |
| Money Market Funds | 0.2% |
| Special Purpose Acquisition Company | 0.0% |
What did the Fund invest in?
Sector Weighting (% of net assets)

| Value | Value |
|---|---|
| Other Assets in Excess of Liabilities | 0.2% |
| Money Market | 0.2% |
| Exploration & Production | 0.5% |
| Renewable Energy Infrastructure | 1.2% |
| Affiliated Exchange-Traded Funds | 4.6% |
| Liquefied Natural Gas | 7.0% |
| Natural Gas Pipelines | 17.2% |
| Natural Gas Liquids Infrastructure | 19.2% |
| Crude & Refined Products | 19.4% |
| Gathering & Processing | 30.5% |
Top 10 Holdings (% of net assets)
| Holding Name | % of Net Assets |
| Western Midstream Partners, L.P. | 8.1% |
| Williams Companies, Inc. (The) | 7.4% |
| Cheniere Energy, Inc. | 6.5% |
| TC Energy Corporation | 6.0% |
| Plains GP Holdings, L.P. - Class A | 5.8% |
| Energy Transfer, L.P. | 5.6% |
| MPLX, L.P. | 5.0% |
| Targa Resources Corporation | 4.9% |
| ONEOK, Inc. | 4.9% |
| DT Midstream, Inc. | 4.9% |
Material Fund Changes
Effective October 25, 2024, the Fund changed its fiscal year end from December 31 to October 31.

Westwood Salient MLP & Energy Infrastructure Fund - Institutional Shares (SMLPX)
Semi-Annual Shareholder Report - October 31, 2024
Where can I find additional information about the Fund?
Additional information is available on the Fund's website (https://westwoodgroup.com/product/energy-infrastructure-fund/), including its:
Prospectus
Financial information
Holdings
Proxy voting information
TSR-SAR 103124-SMLPX
Westwood Salient MLP & Energy Infrastructure Fund

A Class Shares (SMAPX)
Semi-Annual Shareholder Report - October 31, 2024
Fund Overview
This semi-annual shareholder report contains important information about Westwood Salient MLP & Energy Infrastructure Fund (the "Fund") for the period of January 1, 2024 to October 31, 2024. You can find additional information about the Fund at https://westwoodgroup.com/product/energy-infrastructure-fund/. You can also request this information by contacting us at (877) 386-3944. This report describes changes to the Fund that occurred during the reporting period.
What were the Fund’s costs for the last 10 months?
(based on a hypothetical $10,000 investment)
| Class Name | Costs of a $10,000 investment | Costs paid as a percentage of a $10,000 investment |
|---|---|---|
| A Class Shares | $152 | 1.35% |
How did the Fund perform during the reporting period?
For the trailing twelve months, the Westwood Salient MLP and Energy Infrastructure Fund modestly trailed its representative benchmark (Alerian Midstream Energy Select TR Index) during the period despite posting a strong absolute return of nearly 40%.
During the period, the best performing sector on an absolute basis was Natural Gas Pipelines, which significantly contributed to fund performance as the sub-sector returned over 60% for the period due to rising U.S. power demand linked to AI data centers. The Fund's limited exposure to Renewable Energy negatively impacted performance, as the sector struggled with challenges such as rising interest rates, inflation, supply chain disruptions, and uncertainties about the industry's future in light of the upcoming US Presidential Election.
On a relative basis, allocation was the main driver of underperformance during the period versus the benchmark. While allocation effects detracted, the Fund’s stock selection generated almost 300bps of positive attribution. We continue to believe that U.S. production growth in coming years will fill existing pipeline capacity and provide incremental cash flow growth to midstream businesses, which will be returned to shareholders via larger distributions and potential stock buybacks.
How has the Fund performed over the last ten years?
Total Return Based on $10,000 Investment*
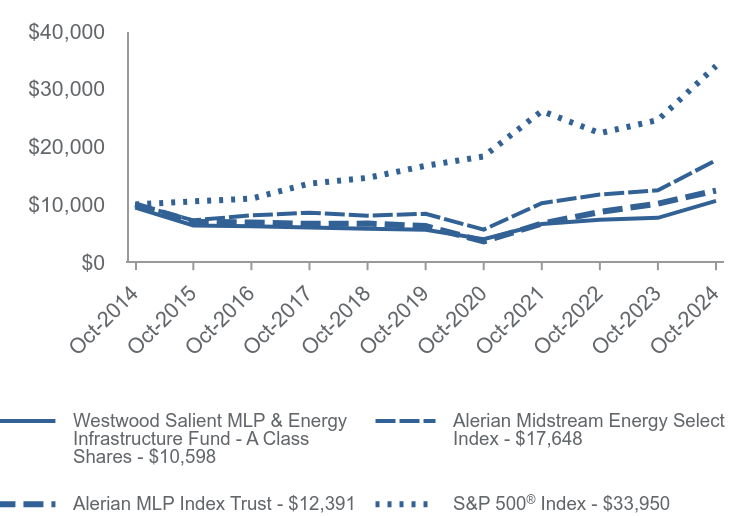
| Westwood Salient MLP & Energy Infrastructure Fund - A Class Shares | Alerian Midstream Energy Select Index | Alerian MLP Index Trust | S&P 500® Index | |
|---|---|---|---|---|
| Oct-2014 | $9,452 | $10,000 | $10,000 | $10,000 |
| Oct-2015 | $6,356 | $7,247 | $6,992 | $10,520 |
| Oct-2016 | $6,215 | $8,097 | $6,866 | $10,994 |
| Oct-2017 | $6,023 | $8,572 | $6,634 | $13,593 |
| Oct-2018 | $5,797 | $8,054 | $6,678 | $14,591 |
| Oct-2019 | $5,626 | $8,373 | $6,254 | $16,681 |
| Oct-2020 | $3,960 | $5,638 | $3,595 | $18,301 |
| Oct-2021 | $6,609 | $10,215 | $6,675 | $26,155 |
| Oct-2022 | $7,362 | $11,697 | $8,691 | $22,334 |
| Oct-2023 | $7,669 | $12,443 | $10,133 | $24,599 |
| Oct-2024 | $10,598 | $17,648 | $12,391 | $33,950 |
Average Annual Total Returns as of 10/31/2024
| 10 Months | 1 Year | 5 Years | 10 Years | |
|---|---|---|---|---|
| Westwood Salient MLP & Energy Infrastructure Fund - A Class Shares | ||||
| Without Load | 29.79% | 38.18% | 13.50% | 1.15% |
| With Load | 24.57% | 34.08% | 12.23% | 0.58% |
S&P 500® Index | 20.97% | 38.02% | 15.27% | 13.00% |
| Alerian MLP Index Trust | 16.97% | 22.28% | 14.66% | 2.17% |
| Alerian Midstream Energy Select Index | 33.25% | 41.83% | 16.08% | 5.84% |
Past performance does not guarantee future results. Call (877) 386-3944 or visit https://westwoodgroup.com/product/energy-infrastructure-fund/ for current month-end performance.
* Reflects the maximum sales charge applicable to A Class Shares.
Fund Statistics
- Net Assets$1,148,056,596
- Number of Portfolio Holdings48
- Advisory Fee (net of waivers)$7,354,550
- Portfolio Turnover74%
Asset Weighting (% of total investments)
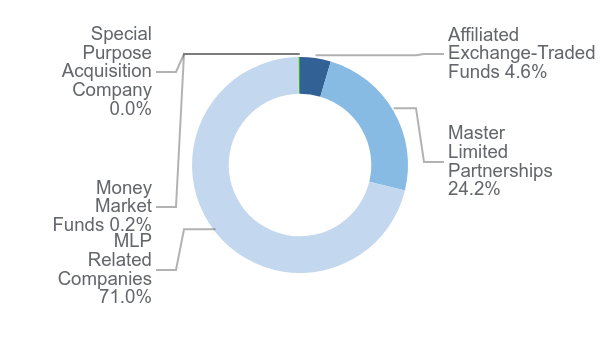
| Value | Value |
|---|---|
| Affiliated Exchange-Traded Funds | 4.6% |
| Master Limited Partnerships | 24.2% |
| MLP Related Companies | 71.0% |
| Money Market Funds | 0.2% |
| Special Purpose Acquisition Company | 0.0% |
What did the Fund invest in?
Sector Weighting (% of net assets)
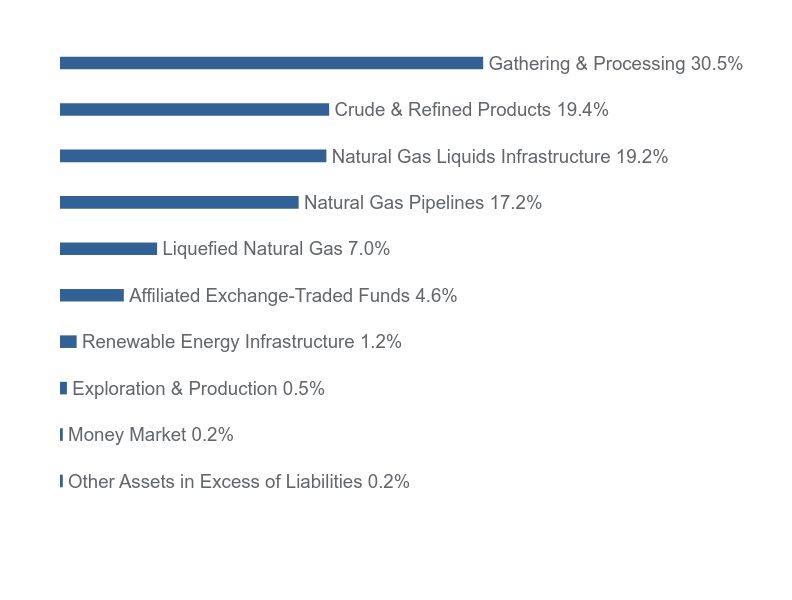
| Value | Value |
|---|---|
| Other Assets in Excess of Liabilities | 0.2% |
| Money Market | 0.2% |
| Exploration & Production | 0.5% |
| Renewable Energy Infrastructure | 1.2% |
| Affiliated Exchange-Traded Funds | 4.6% |
| Liquefied Natural Gas | 7.0% |
| Natural Gas Pipelines | 17.2% |
| Natural Gas Liquids Infrastructure | 19.2% |
| Crude & Refined Products | 19.4% |
| Gathering & Processing | 30.5% |
Top 10 Holdings (% of net assets)
| Holding Name | % of Net Assets |
| Western Midstream Partners, L.P. | 8.1% |
| Williams Companies, Inc. (The) | 7.4% |
| Cheniere Energy, Inc. | 6.5% |
| TC Energy Corporation | 6.0% |
| Plains GP Holdings, L.P. - Class A | 5.8% |
| Energy Transfer, L.P. | 5.6% |
| MPLX, L.P. | 5.0% |
| Targa Resources Corporation | 4.9% |
| ONEOK, Inc. | 4.9% |
| DT Midstream, Inc. | 4.9% |
Material Fund Changes
Effective October 25, 2024, the Fund changed its fiscal year end from December 31 to October 31.

Westwood Salient MLP & Energy Infrastructure Fund - A Class Shares (SMAPX)
Semi-Annual Shareholder Report - October 31, 2024
Where can I find additional information about the Fund?
Additional information is available on the Fund's website (https://westwoodgroup.com/product/energy-infrastructure-fund/), including its:
Prospectus
Financial information
Holdings
Proxy voting information
TSR-SAR 103124-SMAPX
Westwood Salient MLP & Energy Infrastructure Fund

C Class Shares (SMFPX)
Semi-Annual Shareholder Report - October 31, 2024
Fund Overview
This semi-annual shareholder report contains important information about Westwood Salient MLP & Energy Infrastructure Fund (the "Fund") for the period of January 1, 2024 to October 31, 2024. You can find additional information about the Fund at https://westwoodgroup.com/product/energy-infrastructure-fund/. You can also request this information by contacting us at (877) 386-3944. This report describes changes to the Fund that occurred during the reporting period.
What were the Fund’s costs for the last 10 months?
(based on a hypothetical $10,000 investment)
| Class Name | Costs of a $10,000 investment | Costs paid as a percentage of a $10,000 investment |
|---|---|---|
| C Class Shares | $240 | 2.10% |
How did the Fund perform during the reporting period?
For the trailing twelve months, the Westwood Salient MLP and Energy Infrastructure Fund modestly trailed its representative benchmark (Alerian Midstream Energy Select TR Index) during the period despite posting a strong absolute return of nearly 40%.
During the period, the best performing sector on an absolute basis was Natural Gas Pipelines, which significantly contributed to fund performance as the sub-sector returned over 60% for the period due to rising U.S. power demand linked to AI data centers. The Fund's limited exposure to Renewable Energy negatively impacted performance, as the sector struggled with challenges such as rising interest rates, inflation, supply chain disruptions, and uncertainties about the industry's future in light of the upcoming US Presidential Election.
On a relative basis, allocation was the main driver of underperformance during the period versus the benchmark. While allocation effects detracted, the Fund’s stock selection generated almost 300bps of positive attribution. We continue to believe that U.S. production growth in coming years will fill existing pipeline capacity and provide incremental cash flow growth to midstream businesses, which will be returned to shareholders via larger distributions and potential stock buybacks.
How has the Fund performed over the last ten years?
Total Return Based on $10,000 Investment
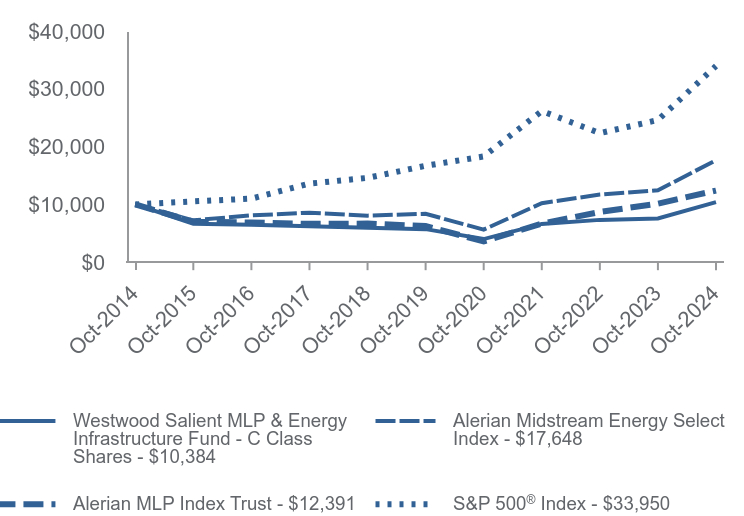
| Westwood Salient MLP & Energy Infrastructure Fund - C Class Shares | Alerian Midstream Energy Select Index | Alerian MLP Index Trust | S&P 500® Index | |
|---|---|---|---|---|
| Oct-2014 | $10,000 | $10,000 | $10,000 | $10,000 |
| Oct-2015 | $6,670 | $7,247 | $6,992 | $10,520 |
| Oct-2016 | $6,475 | $8,097 | $6,866 | $10,994 |
| Oct-2017 | $6,224 | $8,572 | $6,634 | $13,593 |
| Oct-2018 | $5,945 | $8,054 | $6,678 | $14,591 |
| Oct-2019 | $5,719 | $8,373 | $6,254 | $16,681 |
| Oct-2020 | $4,001 | $5,638 | $3,595 | $18,301 |
| Oct-2021 | $6,621 | $10,215 | $6,675 | $26,155 |
| Oct-2022 | $7,321 | $11,697 | $8,691 | $22,334 |
| Oct-2023 | $7,568 | $12,443 | $10,133 | $24,599 |
| Oct-2024 | $10,384 | $17,648 | $12,391 | $33,950 |
Average Annual Total Returns as of 10/31/2024
| 10 Months | 1 Year | 5 Years | 10 Years | |
|---|---|---|---|---|
| Westwood Salient MLP & Energy Infrastructure Fund - C Class Shares | ||||
| Without CDSC | 28.91% | 37.21% | 12.67% | 0.38% |
| With CDSC | 27.91% | 36.21% | 12.67% | 0.38% |
S&P 500® Index | 20.97% | 38.02% | 15.27% | 13.00% |
| Alerian MLP Index Trust | 16.97% | 22.28% | 14.66% | 2.17% |
| Alerian Midstream Energy Select Index | 33.25% | 41.83% | 16.08% | 5.84% |
Past performance does not guarantee future results. Call (877) 386-3944 or visit https://westwoodgroup.com/product/energy-infrastructure-fund/ for current month-end performance.
Fund Statistics
- Net Assets$1,148,056,596
- Number of Portfolio Holdings48
- Advisory Fee (net of waivers)$7,354,550
- Portfolio Turnover74%
Asset Weighting (% of total investments)

| Value | Value |
|---|---|
| Affiliated Exchange-Traded Funds | 4.6% |
| Master Limited Partnerships | 24.2% |
| MLP Related Companies | 71.0% |
| Money Market Funds | 0.2% |
| Special Purpose Acquisition Company | 0.0% |
What did the Fund invest in?
Sector Weighting (% of net assets)

| Value | Value |
|---|---|
| Other Assets in Excess of Liabilities | 0.2% |
| Money Market | 0.2% |
| Exploration & Production | 0.5% |
| Renewable Energy Infrastructure | 1.2% |
| Affiliated Exchange-Traded Funds | 4.6% |
| Liquefied Natural Gas | 7.0% |
| Natural Gas Pipelines | 17.2% |
| Natural Gas Liquids Infrastructure | 19.2% |
| Crude & Refined Products | 19.4% |
| Gathering & Processing | 30.5% |
Top 10 Holdings (% of net assets)
| Holding Name | % of Net Assets |
| Western Midstream Partners, L.P. | 8.1% |
| Williams Companies, Inc. (The) | 7.4% |
| Cheniere Energy, Inc. | 6.5% |
| TC Energy Corporation | 6.0% |
| Plains GP Holdings, L.P. - Class A | 5.8% |
| Energy Transfer, L.P. | 5.6% |
| MPLX, L.P. | 5.0% |
| Targa Resources Corporation | 4.9% |
| ONEOK, Inc. | 4.9% |
| DT Midstream, Inc. | 4.9% |
Material Fund Changes
Effective October 25, 2024, the Fund changed its fiscal year end from December 31 to October 31.

Westwood Salient MLP & Energy Infrastructure Fund - C Class Shares (SMFPX)
Semi-Annual Shareholder Report - October 31, 2024
Where can I find additional information about the Fund?
Additional information is available on the Fund's website (https://westwoodgroup.com/product/energy-infrastructure-fund/), including its:
Prospectus
Financial information
Holdings
Proxy voting information
TSR-SAR 103124-SMFPX
Westwood Salient MLP & Energy Infrastructure Fund

Ultra Shares (SMRPX)
Semi-Annual Shareholder Report - October 31, 2024
Fund Overview
This semi-annual shareholder report contains important information about Westwood Salient MLP & Energy Infrastructure Fund (the "Fund") for the period of January 1, 2024 to October 31, 2024. You can find additional information about the Fund at https://westwoodgroup.com/product/energy-infrastructure-fund/. You can also request this information by contacting us at (877) 386-3944. This report describes changes to the Fund that occurred during the reporting period.
What were the Fund’s costs for the last 10 months?
(based on a hypothetical $10,000 investment)
| Class Name | Costs of a $10,000 investment | Costs paid as a percentage of a $10,000 investment |
|---|---|---|
| Ultra Shares | $115 | 1.00% |
How did the Fund perform during the reporting period?
For the trailing twelve months, the Westwood Salient MLP and Energy Infrastructure Fund modestly trailed its representative benchmark (Alerian Midstream Energy Select TR Index) during the period despite posting a strong absolute return of nearly 40%.
During the period, the best performing sector on an absolute basis was Natural Gas Pipelines, which significantly contributed to fund performance as the sub-sector returned over 60% for the period due to rising U.S. power demand linked to AI data centers. The Fund's limited exposure to Renewable Energy negatively impacted performance, as the sector struggled with challenges such as rising interest rates, inflation, supply chain disruptions, and uncertainties about the industry's future in light of the upcoming US Presidential Election.
On a relative basis, allocation was the main driver of underperformance during the period versus the benchmark. While allocation effects detracted, the Fund’s stock selection generated almost 300bps of positive attribution. We continue to believe that U.S. production growth in coming years will fill existing pipeline capacity and provide incremental cash flow growth to midstream businesses, which will be returned to shareholders via larger distributions and potential stock buybacks.
How has the Fund performed since inception?
Total Return Based on $1,000,000 Investment
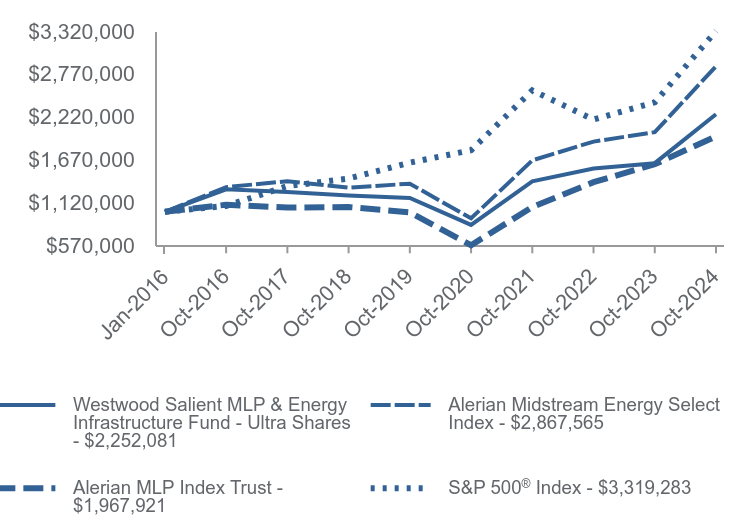
| Westwood Salient MLP & Energy Infrastructure Fund - Ultra Shares | Alerian Midstream Energy Select Index | Alerian MLP Index Trust | S&P 500® Index | |
|---|---|---|---|---|
| Jan-2016 | $1,000,000 | $1,000,000 | $1,000,000 | $1,000,000 |
| Oct-2016 | $1,288,387 | $1,315,758 | $1,090,423 | $1,074,895 |
| Oct-2017 | $1,252,457 | $1,392,935 | $1,053,510 | $1,328,918 |
| Oct-2018 | $1,208,627 | $1,308,727 | $1,060,627 | $1,426,544 |
| Oct-2019 | $1,176,266 | $1,360,544 | $993,204 | $1,630,913 |
| Oct-2020 | $831,752 | $916,151 | $570,910 | $1,789,283 |
| Oct-2021 | $1,390,665 | $1,659,790 | $1,060,154 | $2,557,135 |
| Oct-2022 | $1,554,379 | $1,900,716 | $1,380,199 | $2,183,511 |
| Oct-2023 | $1,623,516 | $2,021,854 | $1,609,321 | $2,404,980 |
| Oct-2024 | $2,252,081 | $2,867,565 | $1,967,921 | $3,319,283 |
Average Annual Total Returns as of 10/31/2024
| 10 months | 1 Year | 5 Years | Since Inception (January 4, 2016) | |
|---|---|---|---|---|
| Westwood Salient MLP & Energy Infrastructure Fund - Ultra Shares | 30.15% | 38.72% | 13.87% | 9.64% |
S&P 500® Index | 20.97% | 38.02% | 15.27% | 14.56% |
| Alerian MLP Index Trust | 16.97% | 22.28% | 14.66% | 7.97% |
| Alerian Midstream Energy Select Index | 33.25% | 41.83% | 16.08% | 12.68% |
Past performance does not guarantee future results. Call (877) 386-3944 or visit https://westwoodgroup.com/product/energy-infrastructure-fund/ for current month-end performance.
Fund Statistics
- Net Assets$1,148,056,596
- Number of Portfolio Holdings48
- Advisory Fee (net of waivers)$7,354,550
- Portfolio Turnover74%
Asset Weighting (% of total investments)

| Value | Value |
|---|---|
| Affiliated Exchange-Traded Funds | 4.6% |
| Master Limited Partnerships | 24.2% |
| MLP Related Companies | 71.0% |
| Money Market Funds | 0.2% |
| Special Purpose Acquisition Company | 0.0% |
What did the Fund invest in?
Sector Weighting (% of net assets)

| Value | Value |
|---|---|
| Other Assets in Excess of Liabilities | 0.2% |
| Money Market | 0.2% |
| Exploration & Production | 0.5% |
| Renewable Energy Infrastructure | 1.2% |
| Affiliated Exchange-Traded Funds | 4.6% |
| Liquefied Natural Gas | 7.0% |
| Natural Gas Pipelines | 17.2% |
| Natural Gas Liquids Infrastructure | 19.2% |
| Crude & Refined Products | 19.4% |
| Gathering & Processing | 30.5% |
Top 10 Holdings (% of net assets)
| Holding Name | % of Net Assets |
| Western Midstream Partners, L.P. | 8.1% |
| Williams Companies, Inc. (The) | 7.4% |
| Cheniere Energy, Inc. | 6.5% |
| TC Energy Corporation | 6.0% |
| Plains GP Holdings, L.P. - Class A | 5.8% |
| Energy Transfer, L.P. | 5.6% |
| MPLX, L.P. | 5.0% |
| Targa Resources Corporation | 4.9% |
| ONEOK, Inc. | 4.9% |
| DT Midstream, Inc. | 4.9% |
Material Fund Changes
Effective October 25, 2024, the Fund changed its fiscal year end from December 31 to October 31.

Westwood Salient MLP & Energy Infrastructure Fund - Ultra Shares (SMRPX)
Semi-Annual Shareholder Report - October 31, 2024
Where can I find additional information about the Fund?
Additional information is available on the Fund's website (https://westwoodgroup.com/product/energy-infrastructure-fund/), including its:
Prospectus
Financial information
Holdings
Proxy voting information
TSR-SAR 103124-SMRPX
Westwood Global Real Estate Fund

Institutional Shares (KIRYX)
Annual Shareholder Report - October 31, 2024
Fund Overview
This annual shareholder report contains important information about Westwood Global Real Estate Fund (the "Fund") for the period of November 1, 2023 to October 31, 2024. You can find additional information about the Fund at https://westwoodgroup.com/product/global-real-estate-fund/. You can also request this information by contacting us at (877) 386-3944. This report describes changes to the Fund that occurred during the reporting period.
What were the Fund’s costs for the last year?
(based on a hypothetical $10,000 investment)
| Class Name | Costs of a $10,000 investment | Costs paid as a percentage of a $10,000 investment |
|---|---|---|
| Institutional Shares | $122 | 1.10% |
How did the Fund perform during the reporting period?
The Westwood Global Real Estate Fund underperformed its representative benchmark (FTSE EPRA NAREIT Developed Index) during the period despite posting a strong absolute return of over 20%.
The Fund’s underweight exposure to the United States compared to the benchmark was a main contributor to the underperformance for the period. After domestic REITs were stuck in neutral for much of 2023, the Federal Reserve’s decision to cut interest rates was a tailwind for investors as REITs tend to benefit from falling rates due to decreased borrowing costs and potential earnings expansion. The Fund’s overweight allocation to, and security selection within, the Data Centers sub-sector were the main contributors to performance for the period.
Although we were underweight domestic REITs for the period, the majority of the Fund’s assets are invested in U.S.-based companies, which is consistent with the Fund’s representative benchmark. These domestic investments are well-diversified across the property sector and geography and are generating robust free cash flow. As ever, we rigorously monitor REIT balance sheets and have biased our investments toward companies with lower overall leverage profiles and limited near-term debt maturities. We complement our domestic exposure with foreign REITs possessing similar attributes. Across geographies, we continue to observe a disconnect between private and publicly traded real estate valuations as well as with other sectors of the market.
While we remain cautiously optimistic with regard to the rate outlook, our conviction on real estate fundamentals has notably strengthened. We have intentionally tilted our portfolio toward property sectors that we believe should continue to heal in this setting (office and lodging in particular) as well as thrive (grocery-anchored centers and net lease).
How has the Fund performed over the last ten years?
Total Return Based on $100,000 Investment
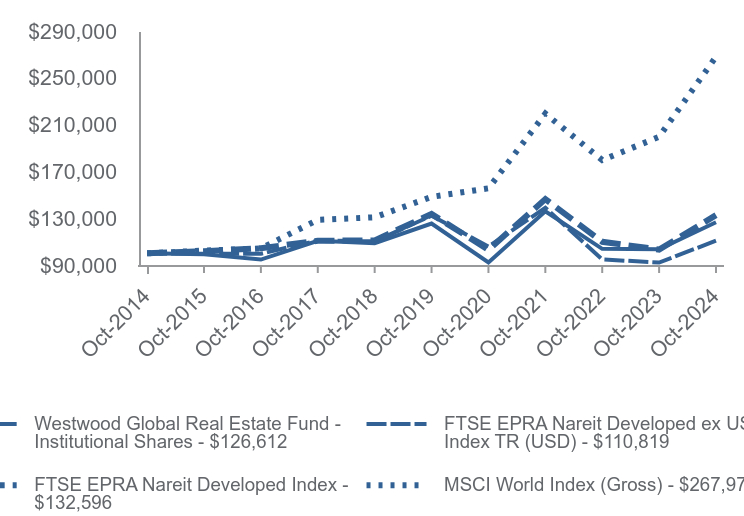
| Westwood Global Real Estate Fund - Institutional Shares | FTSE EPRA Nareit Developed ex US Index TR (USD) | FTSE EPRA Nareit Developed Index | MSCI World Index (Gross) | |
|---|---|---|---|---|
| Oct-2014 | $100,000 | $100,000 | $100,000 | $100,000 |
| Oct-2015 | $99,187 | $99,600 | $101,839 | $102,335 |
| Oct-2016 | $94,681 | $99,649 | $104,367 | $104,166 |
| Oct-2017 | $110,641 | $110,930 | $110,754 | $128,602 |
| Oct-2018 | $108,647 | $110,218 | $111,083 | $130,799 |
| Oct-2019 | $125,476 | $132,165 | $133,617 | $148,260 |
| Oct-2020 | $92,258 | $105,821 | $102,976 | $155,544 |
| Oct-2021 | $135,969 | $138,901 | $146,348 | $219,390 |
| Oct-2022 | $103,812 | $94,810 | $109,837 | $179,702 |
| Oct-2023 | $103,433 | $92,097 | $103,217 | $199,556 |
| Oct-2024 | $126,612 | $110,819 | $132,596 | $267,976 |
Average Annual Total Returns as of 10/31/2024
| 1 Year | 5 Years | 10 Years | |
|---|---|---|---|
| Westwood Global Real Estate Fund - Institutional Shares | 22.41% | 0.18% | 2.39% |
| FTSE EPRA Nareit Developed ex US Index TR (USD) | 20.33% | -3.46% | 1.03% |
| FTSE EPRA Nareit Developed Index | 28.46% | -0.15% | 2.86% |
| MSCI World Index (Gross) | 34.29% | 12.57% | 10.36% |
Past performance does not guarantee future results. Call (877) 386-3944 or visit https://westwoodgroup.com/product/global-real-estate-fund/ for current month-end performance.
Fund Statistics
- Net Assets$16,189,968
- Number of Portfolio Holdings32
- Advisory Fee (net of waivers)$7,420
- Portfolio Turnover48%
Asset Weighting (% of total investments)

| Value | Value |
|---|---|
| Common Stocks | 97.7% |
| Money Market Funds | 2.3% |
What did the Fund invest in?
Country Weighting (% of net assets)

| Value | Value |
|---|---|
| Singapore | 1.1% |
| Hong Kong | 1.5% |
| Germany | 1.7% |
| Switzerland | 2.0% |
| Spain | 2.4% |
| Australia | 2.8% |
| Canada | 3.4% |
| United Kingdom | 4.0% |
| Japan | 10.9% |
| United States | 68.0% |
Top 10 Holdings (% of net assets)
| Holding Name | % of Net Assets |
| Ventas, Inc. | 5.5% |
| Equinix, Inc. | 5.0% |
| COPT Defense Properties | 5.0% |
| Phillips Edison & Company, Inc. | 4.6% |
| Outfront Media, Inc. | 4.4% |
| Centerspace | 4.2% |
| Gaming and Leisure Properties, Inc. | 4.2% |
| Kimco Realty Corporation | 4.0% |
| Equity Residential | 3.9% |
| Federal Realty Investment Trust | 3.8% |
Material Fund Changes
Effective February 28, 2024, the Fund changed its name from the Westwood Salient Global Real Estate Fund to the Westwood Global Real Estate Fund.

Westwood Global Real Estate Fund - Institutional Shares (KIRYX)
Annual Shareholder Report - October 31, 2024
Where can I find additional information about the Fund?
Additional information is available on the Fund's website (https://westwoodgroup.com/product/global-real-estate-fund/), including its:
Prospectus
Financial information
Holdings
Proxy voting information
TSR-AR 103124-KIRYX
Westwood Global Real Estate Fund

A Class Shares (KIRAX)
Annual Shareholder Report - October 31, 2024
Fund Overview
This annual shareholder report contains important information about Westwood Global Real Estate Fund (the "Fund") for the period of November 1, 2023 to October 31, 2024. You can find additional information about the Fund at https://westwoodgroup.com/product/global-real-estate-fund/. You can also request this information by contacting us at (877) 386-3944. This report describes changes to the Fund that occurred during the reporting period.
What were the Fund’s costs for the last year?
(based on a hypothetical $10,000 investment)
| Class Name | Costs of a $10,000 investment | Costs paid as a percentage of a $10,000 investment |
|---|---|---|
| A Class Shares | $152 | 1.37% |
How did the Fund perform during the reporting period?
The Westwood Global Real Estate Fund underperformed its representative benchmark (FTSE EPRA NAREIT Developed Index) during the period despite posting a strong absolute return of over 20%.
The Fund’s underweight exposure to the United States compared to the benchmark was a main contributor to the underperformance for the period. After domestic REITs were stuck in neutral for much of 2023, the Federal Reserve’s decision to cut interest rates was a tailwind for investors as REITs tend to benefit from falling rates due to decreased borrowing costs and potential earnings expansion. The Fund’s overweight allocation to, and security selection within, the Data Centers sub-sector were the main contributors to performance for the period.
Although we were underweight domestic REITs for the period, the majority of the Fund’s assets are invested in U.S.-based companies, which is consistent with the Fund’s representative benchmark. These domestic investments are well-diversified across the property sector and geography and are generating robust free cash flow. As ever, we rigorously monitor REIT balance sheets and have biased our investments toward companies with lower overall leverage profiles and limited near-term debt maturities. We complement our domestic exposure with foreign REITs possessing similar attributes. Across geographies, we continue to observe a disconnect between private and publicly traded real estate valuations as well as with other sectors of the market.
While we remain cautiously optimistic with regard to the rate outlook, our conviction on real estate fundamentals has notably strengthened. We have intentionally tilted our portfolio toward property sectors that we believe should continue to heal in this setting (office and lodging in particular) as well as thrive (grocery-anchored centers and net lease).
How has the Fund performed over the last ten years?
Total Return Based on $10,000 Investment
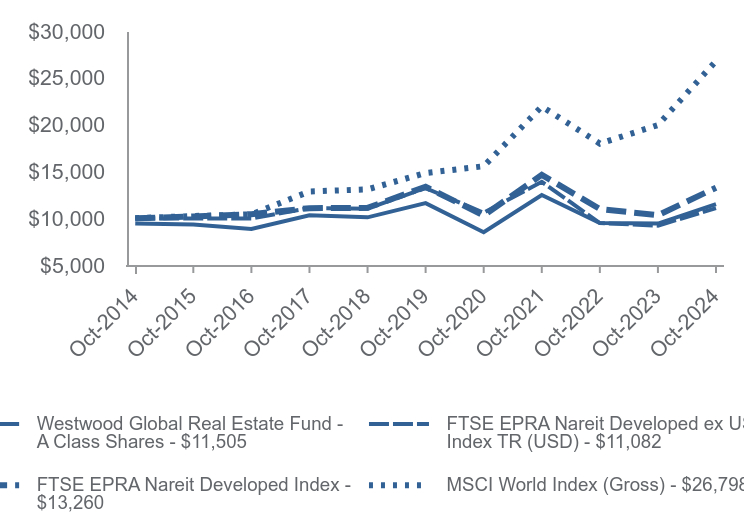
| Westwood Global Real Estate Fund - A Class Shares | FTSE EPRA Nareit Developed ex US Index TR (USD) | FTSE EPRA Nareit Developed Index | MSCI World Index (Gross) | |
|---|---|---|---|---|
| Oct-2014 | $9,426 | $10,000 | $10,000 | $10,000 |
| Oct-2015 | $9,321 | $9,960 | $10,184 | $10,233 |
| Oct-2016 | $8,852 | $9,965 | $10,437 | $10,417 |
| Oct-2017 | $10,307 | $11,093 | $11,075 | $12,860 |
| Oct-2018 | $10,093 | $11,022 | $11,108 | $13,080 |
| Oct-2019 | $11,607 | $13,217 | $13,362 | $14,826 |
| Oct-2020 | $8,498 | $10,582 | $10,298 | $15,554 |
| Oct-2021 | $12,481 | $13,890 | $14,635 | $21,939 |
| Oct-2022 | $9,486 | $9,481 | $10,984 | $17,970 |
| Oct-2023 | $9,432 | $9,210 | $10,322 | $19,956 |
| Oct-2024 | $11,505 | $11,082 | $13,260 | $26,798 |
Average Annual Total Returns as of 10/31/2024
| 1 Year | 5 Years | 10 Years | |
|---|---|---|---|
| Westwood Global Real Estate Fund - A Class Shares | |||
| Without Load | 21.98% | -0.18% | 2.01% |
| With Load* | 18.27% | -1.36% | 1.41% |
| FTSE EPRA Nareit Developed ex US Index TR (USD) | 20.33% | -3.46% | 1.03% |
| FTSE EPRA Nareit Developed Index | 28.46% | -0.15% | 2.86% |
| MSCI World Index (Gross) | 34.29% | 12.57% | 10.36% |
Past performance does not guarantee future results. Call (877) 386-3944 or visit https://westwoodgroup.com/product/global-real-estate-fund/ for current month-end performance.
* Reflects the maximum sales charge applicable to A Class Shares.
Fund Statistics
- Net Assets$16,189,968
- Number of Portfolio Holdings32
- Advisory Fee (net of waivers)$7,420
- Portfolio Turnover48%
Asset Weighting (% of total investments)

| Value | Value |
|---|---|
| Common Stocks | 97.7% |
| Money Market Funds | 2.3% |
What did the Fund invest in?
Country Weighting (% of net assets)
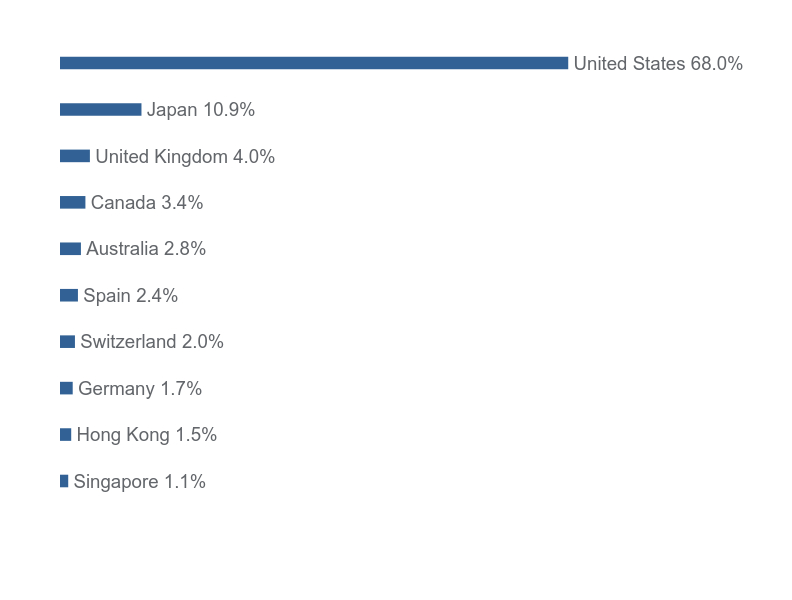
| Value | Value |
|---|---|
| Singapore | 1.1% |
| Hong Kong | 1.5% |
| Germany | 1.7% |
| Switzerland | 2.0% |
| Spain | 2.4% |
| Australia | 2.8% |
| Canada | 3.4% |
| United Kingdom | 4.0% |
| Japan | 10.9% |
| United States | 68.0% |
Top 10 Holdings (% of net assets)
| Holding Name | % of Net Assets |
| Ventas, Inc. | 5.5% |
| Equinix, Inc. | 5.0% |
| COPT Defense Properties | 5.0% |
| Phillips Edison & Company, Inc. | 4.6% |
| Outfront Media, Inc. | 4.4% |
| Centerspace | 4.2% |
| Gaming and Leisure Properties, Inc. | 4.2% |
| Kimco Realty Corporation | 4.0% |
| Equity Residential | 3.9% |
| Federal Realty Investment Trust | 3.8% |
Material Fund Changes
Effective February 28, 2024, the Fund changed its name from the Westwood Salient Global Real Estate Fund to the Westwood Global Real Estate Fund.

Westwood Global Real Estate Fund - A Class Shares (KIRAX)
Annual Shareholder Report - October 31, 2024
Where can I find additional information about the Fund?
Additional information is available on the Fund's website (https://westwoodgroup.com/product/global-real-estate-fund/), including its:
Prospectus
Financial information
Holdings
Proxy voting information
TSR-AR 103124-KIRAX
Westwood Global Real Estate Fund

C Class Shares (KIRCX)
Annual Shareholder Report - October 31, 2024
Fund Overview
This annual shareholder report contains important information about Westwood Global Real Estate Fund (the "Fund") for the period of November 1, 2023 to October 31, 2024. You can find additional information about the Fund at https://westwoodgroup.com/product/global-real-estate-fund/. You can also request this information by contacting us at (877) 386-3944. This report describes changes to the Fund that occurred during the reporting period.
What were the Fund’s costs for the last year?
(based on a hypothetical $10,000 investment)
| Class Name | Costs of a $10,000 investment | Costs paid as a percentage of a $10,000 investment |
|---|---|---|
| C Class Shares | $227 | 2.05% |
How did the Fund perform during the reporting period?
The Westwood Global Real Estate Fund underperformed its representative benchmark (FTSE EPRA NAREIT Developed Index) during the period despite posting a strong absolute return of over 20%.
The Fund’s underweight exposure to the United States compared to the benchmark was a main contributor to the underperformance for the period. After domestic REITs were stuck in neutral for much of 2023, the Federal Reserve’s decision to cut interest rates was a tailwind for investors as REITs tend to benefit from falling rates due to decreased borrowing costs and potential earnings expansion. The Fund’s overweight allocation to, and security selection within, the Data Centers sub-sector were the main contributors to performance for the period.
Although we were underweight domestic REITs for the period, the majority of the Fund’s assets are invested in U.S.-based companies, which is consistent with the Fund’s representative benchmark. These domestic investments are well-diversified across the property sector and geography and are generating robust free cash flow. As ever, we rigorously monitor REIT balance sheets and have biased our investments toward companies with lower overall leverage profiles and limited near-term debt maturities. We complement our domestic exposure with foreign REITs possessing similar attributes. Across geographies, we continue to observe a disconnect between private and publicly traded real estate valuations as well as with other sectors of the market.
While we remain cautiously optimistic with regard to the rate outlook, our conviction on real estate fundamentals has notably strengthened. We have intentionally tilted our portfolio toward property sectors that we believe should continue to heal in this setting (office and lodging in particular) as well as thrive (grocery-anchored centers and net lease).
How has the Fund performed over the last ten years?
Total Return Based on $10,000 Investment
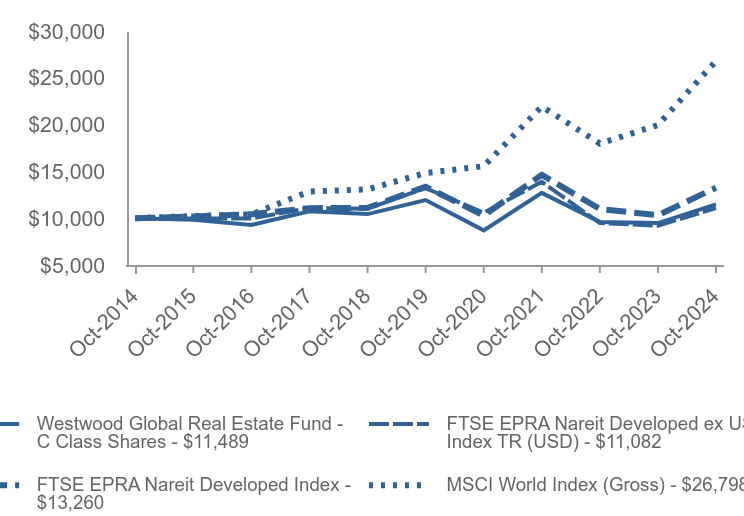
| Westwood Global Real Estate Fund - C Class Shares | FTSE EPRA Nareit Developed ex US Index TR (USD) | FTSE EPRA Nareit Developed Index | MSCI World Index (Gross) | |
|---|---|---|---|---|
| Oct-2014 | $10,000 | $10,000 | $10,000 | $10,000 |
| Oct-2015 | $9,827 | $9,960 | $10,184 | $10,233 |
| Oct-2016 | $9,284 | $9,965 | $10,437 | $10,417 |
| Oct-2017 | $10,749 | $11,093 | $11,075 | $12,860 |
| Oct-2018 | $10,440 | $11,022 | $11,108 | $13,080 |
| Oct-2019 | $11,947 | $13,217 | $13,362 | $14,826 |
| Oct-2020 | $8,704 | $10,582 | $10,298 | $15,554 |
| Oct-2021 | $12,707 | $13,890 | $14,635 | $21,939 |
| Oct-2022 | $9,607 | $9,481 | $10,984 | $17,970 |
| Oct-2023 | $9,479 | $9,210 | $10,322 | $19,956 |
| Oct-2024 | $11,489 | $11,082 | $13,260 | $26,798 |
Average Annual Total Returns as of 10/31/2024
| 1 Year | 5 Years | 10 Years | |
|---|---|---|---|
| Westwood Global Real Estate Fund - C Class Shares | |||
| Without CDSC | 21.21% | -0.78% | 1.40% |
| With CDSC | 20.21% | -0.78% | 1.40% |
| FTSE EPRA Nareit Developed ex US Index TR (USD) | 20.33% | -3.46% | 1.03% |
| FTSE EPRA Nareit Developed Index | 28.46% | -0.15% | 2.86% |
| MSCI World Index (Gross) | 34.29% | 12.57% | 10.36% |
Past performance does not guarantee future results. Call (877) 386-3944 or visit https://westwoodgroup.com/product/global-real-estate-fund/ for current month-end performance.
Fund Statistics
- Net Assets$16,189,968
- Number of Portfolio Holdings32
- Advisory Fee (net of waivers)$7,420
- Portfolio Turnover48%
Asset Weighting (% of total investments)
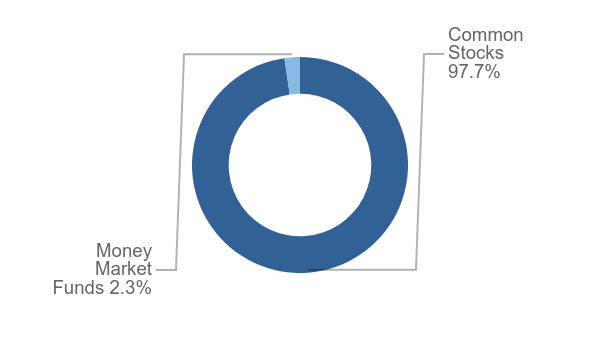
| Value | Value |
|---|---|
| Common Stocks | 97.7% |
| Money Market Funds | 2.3% |
What did the Fund invest in?
Country Weighting (% of net assets)

| Value | Value |
|---|---|
| Singapore | 1.1% |
| Hong Kong | 1.5% |
| Germany | 1.7% |
| Switzerland | 2.0% |
| Spain | 2.4% |
| Australia | 2.8% |
| Canada | 3.4% |
| United Kingdom | 4.0% |
| Japan | 10.9% |
| United States | 68.0% |
Top 10 Holdings (% of net assets)
| Holding Name | % of Net Assets |
| Ventas, Inc. | 5.5% |
| Equinix, Inc. | 5.0% |
| COPT Defense Properties | 5.0% |
| Phillips Edison & Company, Inc. | 4.6% |
| Outfront Media, Inc. | 4.4% |
| Centerspace | 4.2% |
| Gaming and Leisure Properties, Inc. | 4.2% |
| Kimco Realty Corporation | 4.0% |
| Equity Residential | 3.9% |
| Federal Realty Investment Trust | 3.8% |
Material Fund Changes
Effective February 28, 2024, the Fund changed its name from the Westwood Salient Global Real Estate Fund to the Westwood Global Real Estate Fund.

Westwood Global Real Estate Fund - C Class Shares (KIRCX)
Annual Shareholder Report - October 31, 2024
Where can I find additional information about the Fund?
Additional information is available on the Fund's website (https://westwoodgroup.com/product/global-real-estate-fund/), including its:
Prospectus
Financial information
Holdings
Proxy voting information
TSR-AR 103124-KIRCX
Westwood Real Estate Income Fund

Institutional Shares (KIFYX)
Annual Shareholder Report - October 31, 2024
Fund Overview
This annual shareholder report contains important information about Westwood Real Estate Income Fund (the "Fund") for the period of November 1, 2023 to October 31, 2024. You can find additional information about the Fund at https://westwoodgroup.com/product/real-estate-income-fund/. You can also request this information by contacting us at (877) 386-3944. This report describes changes to the Fund that occurred during the reporting period.
What were the Fund’s costs for the last year?
(based on a hypothetical $10,000 investment)
| Class Name | Costs of a $10,000 investment | Costs paid as a percentage of a $10,000 investment |
|---|---|---|
| Institutional Shares | $105 | 0.93% |
How did the Fund perform during the reporting period?
The Westwood Real Estate Income Fund outperformed its benchmark (the ICE BofA Fixed Rate Preferred Securities Index) by several hundred basis points during the period.
The Fund’s common equity portfolio returned 31.8%, contributing 8.6% to the total portfolio return. After REITs were stuck in neutral for much of 2023, the Federal Reserve’s decision to cut interest rates was a tailwind for investors as REITs tend to benefit from falling rates due to decreased borrowing costs and potential earnings expansion. The Fund’s allocation to the Data Centers and Residential REIT sub-sectors were the main contributors to performance for the period.
The Fund’s preferred equity portfolio returned 25.7%, contributing 17.7% to the total portfolio return. Allocation and selection within the Fund’s preferred equity sleeve were the main contributors to performance with Health Care and Lodging leading the way from a sub-sector perspective.
While we remain cautiously optimistic with regard to the rate outlook, our conviction on real estate fundamentals has notably strengthened. We have intentionally tilted our portfolio toward property sectors that we believe should continue to heal in this setting (office and lodging in particular) as well as thrive (grocery-anchored centers and net lease).
How has the Fund performed over the last ten years?
Total Return Based on $100,000 Investment
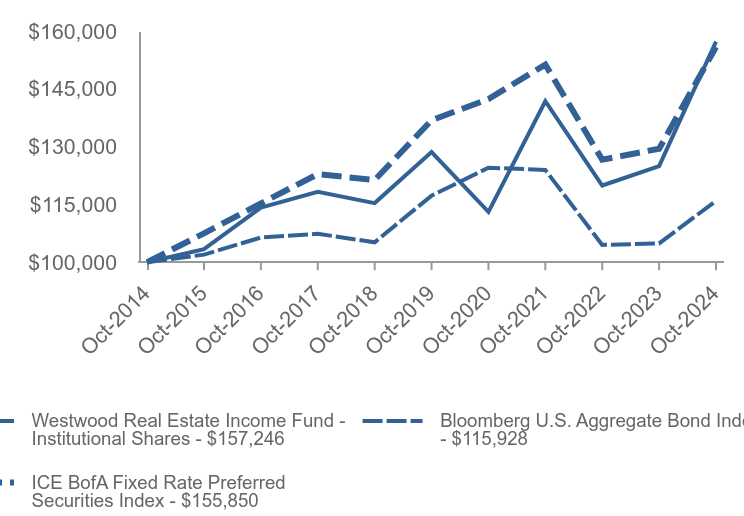
| Westwood Real Estate Income Fund - Institutional Shares | Bloomberg U.S. Aggregate Bond Index | ICE BofA Fixed Rate Preferred Securities Index | |
|---|---|---|---|
| Oct-2014 | $100,000 | $100,000 | $100,000 |
| Oct-2015 | $103,389 | $101,956 | $107,496 |
| Oct-2016 | $114,162 | $106,412 | $115,269 |
| Oct-2017 | $118,272 | $107,372 | $122,849 |
| Oct-2018 | $115,338 | $105,167 | $121,333 |
| Oct-2019 | $128,598 | $117,272 | $136,826 |
| Oct-2020 | $113,054 | $124,527 | $142,342 |
| Oct-2021 | $141,769 | $123,932 | $151,278 |
| Oct-2022 | $119,900 | $104,496 | $126,612 |
| Oct-2023 | $124,918 | $104,868 | $129,445 |
| Oct-2024 | $157,246 | $115,928 | $155,850 |
Average Annual Total Returns as of 10/31/2024
| 1 Year | 5 Years | 10 Years | |
|---|---|---|---|
| Westwood Real Estate Income Fund - Institutional Shares | 25.88% | 4.10% | 4.63% |
| Bloomberg U.S. Aggregate Bond Index | 10.55% | -0.23% | 1.49% |
| ICE BofA Fixed Rate Preferred Securities Index | 20.40% | 2.64% | 4.54% |
Past performance does not guarantee future results. Call (877) 386-3944 or visit https://westwoodgroup.com/product/real-estate-income-fund/ for current month-end performance.
Fund Statistics
- Net Assets$277,237,649
- Number of Portfolio Holdings49
- Advisory Fee (net of recoupments)$1,936,246
- Portfolio Turnover94%
Asset Weighting (% of total investments)
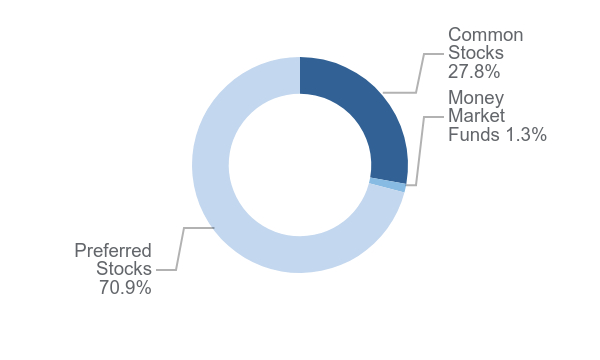
| Value | Value |
|---|---|
| Common Stocks | 27.8% |
| Money Market Funds | 1.3% |
| Preferred Stocks | 70.9% |
What did the Fund invest in?
Industry Weighting (% of net assets)

| Value | Value |
|---|---|
| Liabilities in Excess of Other Assets | -0.3% |
| Other Industries | 5.0% |
| Apartments | 1.6% |
| Specialty Finance | 2.5% |
| Healthcare | 2.9% |
| Storage | 3.1% |
| Home Construction | 3.2% |
| Mortgage | 3.9% |
| Data Centers | 4.1% |
| Industrial | 4.4% |
| Retail | 5.3% |
| Office | 6.5% |
| Diversified | 6.7% |
| Shopping Centers | 8.2% |
| Specialized | 8.6% |
| Residential | 8.9% |
| Hotels | 25.4% |
Top 10 Holdings (% of net assets)
| Holding Name | % of Net Assets |
| Kimco Realty Corporation, 7.25% - Series D | 4.0% |
| CTO Realty Growth, Inc., 6.38% - Series A | 3.9% |
| KKR Real Estate Finance Trust, Inc., 6.50% - Series A | 3.9% |
| Pebblebrook Hotel Trust, 5.70% - Series H | 3.7% |
| LXP Industrial Trust, 6.50% - Series C | 3.5% |
| RLJ Lodging Trust, 7.80% - Series A | 3.5% |
| Saul Centers, Inc., 6.13% - Series D | 3.2% |
| Hovnanian Enterprises, Inc., 7.63% - Series A | 3.2% |
| National Storage Affiliates Trust, 6.00% - Series A | 3.1% |
| EPR Properties, 9.00% - Series E | 3.0% |
Material Fund Changes
Effective March 31, 2024, the Fund changed its name from the Westwood Select Income Fund to the Westwood Real Estate Income Fund.

Westwood Real Estate Income Fund - Institutional Shares (KIFYX)
Annual Shareholder Report - October 31, 2024
Where can I find additional information about the Fund?
Additional information is available on the Fund's website (https://westwoodgroup.com/product/real-estate-income-fund/), including its:
Prospectus
Financial information
Holdings
Proxy voting information
TSR-AR 103124-KIFYX
Westwood Real Estate Income Fund

A Class Shares (KIFAX)
Annual Shareholder Report - October 31, 2024
Fund Overview
This annual shareholder report contains important information about Westwood Real Estate Income Fund (the "Fund") for the period of November 1, 2023 to October 31, 2024. You can find additional information about the Fund at https://westwoodgroup.com/product/real-estate-income-fund/. You can also request this information by contacting us at (877) 386-3944. This report describes changes to the Fund that occurred during the reporting period.
What were the Fund’s costs for the last year?
(based on a hypothetical $10,000 investment)
| Class Name | Costs of a $10,000 investment | Costs paid as a percentage of a $10,000 investment |
|---|---|---|
| A Class Shares | $139 | 1.23% |
How did the Fund perform during the reporting period?
The Westwood Real Estate Income Fund outperformed its benchmark (the ICE BofA Fixed Rate Preferred Securities Index) by several hundred basis points during the period.
The Fund’s common equity portfolio returned 31.8%, contributing 8.6% to the total portfolio return. After REITs were stuck in neutral for much of 2023, the Federal Reserve’s decision to cut interest rates was a tailwind for investors as REITs tend to benefit from falling rates due to decreased borrowing costs and potential earnings expansion. The Fund’s allocation to the Data Centers and Residential REIT sub-sectors were the main contributors to performance for the period.
The Fund’s preferred equity portfolio returned 25.7%, contributing 17.7% to the total portfolio return. Allocation and selection within the Fund’s preferred equity sleeve were the main contributors to performance with Health Care and Lodging leading the way from a sub-sector perspective.
While we remain cautiously optimistic with regard to the rate outlook, our conviction on real estate fundamentals has notably strengthened. We have intentionally tilted our portfolio toward property sectors that we believe should continue to heal in this setting (office and lodging in particular) as well as thrive (grocery-anchored centers and net lease).
How has the Fund performed over the last ten years?
Total Return Based on $10,000 Investment
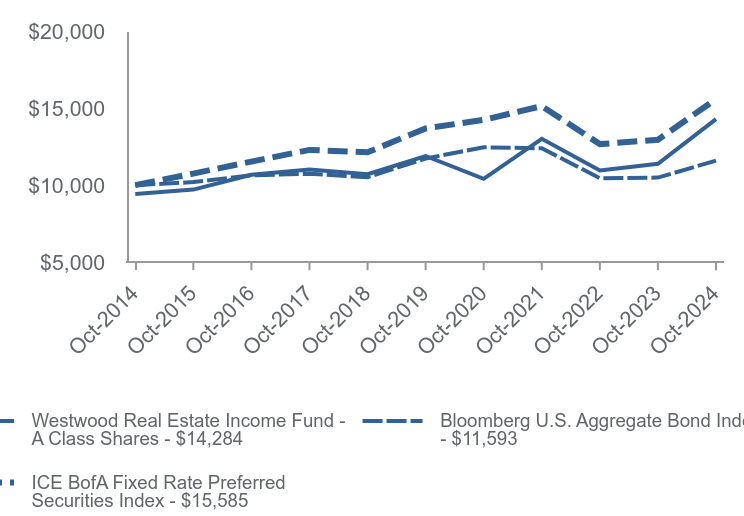
| Westwood Real Estate Income Fund - A Class Shares | Bloomberg U.S. Aggregate Bond Index | ICE BofA Fixed Rate Preferred Securities Index | |
|---|---|---|---|
| Oct-2014 | $9,427 | $10,000 | $10,000 |
| Oct-2015 | $9,709 | $10,196 | $10,750 |
| Oct-2016 | $10,676 | $10,641 | $11,527 |
| Oct-2017 | $11,018 | $10,737 | $12,285 |
| Oct-2018 | $10,708 | $10,517 | $12,133 |
| Oct-2019 | $11,890 | $11,727 | $13,682 |
| Oct-2020 | $10,410 | $12,453 | $14,234 |
| Oct-2021 | $13,006 | $12,393 | $15,128 |
| Oct-2022 | $10,954 | $10,450 | $12,661 |
| Oct-2023 | $11,384 | $10,487 | $12,944 |
| Oct-2024 | $14,284 | $11,593 | $15,585 |
Average Annual Total Returns as of 10/31/2024
| 1 Year | 5 Years | 10 Years | |
|---|---|---|---|
| Westwood Real Estate Income Fund - A Class Shares | |||
| Without Load | 25.47% | 3.74% | 4.24% |
| With Load* | 21.69% | 2.52% | 3.63% |
| Bloomberg U.S. Aggregate Bond Index | 10.55% | -0.23% | 1.49% |
| ICE BofA Fixed Rate Preferred Securities Index | 20.40% | 2.64% | 4.54% |
Past performance does not guarantee future results. Call (877) 386-3944 or visit https://westwoodgroup.com/product/real-estate-income-fund/ for current month-end performance.
* Reflects the maximum sales charge applicable to A Class Shares.
Fund Statistics
- Net Assets$277,237,649
- Number of Portfolio Holdings49
- Advisory Fee (net of recoupments)$1,936,246
- Portfolio Turnover94%
Asset Weighting (% of total investments)

| Value | Value |
|---|---|
| Common Stocks | 27.8% |
| Money Market Funds | 1.3% |
| Preferred Stocks | 70.9% |
What did the Fund invest in?
Industry Weighting (% of net assets)

| Value | Value |
|---|---|
| Liabilities in Excess of Other Assets | -0.3% |
| Other Industries | 5.0% |
| Apartments | 1.6% |
| Specialty Finance | 2.5% |
| Healthcare | 2.9% |
| Storage | 3.1% |
| Home Construction | 3.2% |
| Mortgage | 3.9% |
| Data Centers | 4.1% |
| Industrial | 4.4% |
| Retail | 5.3% |
| Office | 6.5% |
| Diversified | 6.7% |
| Shopping Centers | 8.2% |
| Specialized | 8.6% |
| Residential | 8.9% |
| Hotels | 25.4% |
Top 10 Holdings (% of net assets)
| Holding Name | % of Net Assets |
| Kimco Realty Corporation, 7.25% - Series D | 4.0% |
| CTO Realty Growth, Inc., 6.38% - Series A | 3.9% |
| KKR Real Estate Finance Trust, Inc., 6.50% - Series A | 3.9% |
| Pebblebrook Hotel Trust, 5.70% - Series H | 3.7% |
| LXP Industrial Trust, 6.50% - Series C | 3.5% |
| RLJ Lodging Trust, 7.80% - Series A | 3.5% |
| Saul Centers, Inc., 6.13% - Series D | 3.2% |
| Hovnanian Enterprises, Inc., 7.63% - Series A | 3.2% |
| National Storage Affiliates Trust, 6.00% - Series A | 3.1% |
| EPR Properties, 9.00% - Series E | 3.0% |
Material Fund Changes
Effective March 31, 2024, the Fund changed its name from the Westwood Select Income Fund to the Westwood Real Estate Income Fund.

Westwood Real Estate Income Fund - A Class Shares (KIFAX)
Annual Shareholder Report - October 31, 2024
Where can I find additional information about the Fund?
Additional information is available on the Fund's website (https://westwoodgroup.com/product/real-estate-income-fund/), including its:
Prospectus
Financial information
Holdings
Proxy voting information
TSR-AR 103124-KIFAX
Westwood Real Estate Income Fund

C Class Shares (KIFCX)
Annual Shareholder Report - October 31, 2024
Fund Overview
This annual shareholder report contains important information about Westwood Real Estate Income Fund (the "Fund") for the period of November 1, 2023 to October 31, 2024. You can find additional information about the Fund at https://westwoodgroup.com/product/real-estate-income-fund/. You can also request this information by contacting us at (877) 386-3944. This report describes changes to the Fund that occurred during the reporting period.
What were the Fund’s costs for the last year?
(based on a hypothetical $10,000 investment)
| Class Name | Costs of a $10,000 investment | Costs paid as a percentage of a $10,000 investment |
|---|---|---|
| C Class Shares | $211 | 1.88% |
How did the Fund perform during the reporting period?
The Westwood Real Estate Income Fund outperformed its benchmark (the ICE BofA Fixed Rate Preferred Securities Index) by several hundred basis points during the period.
The Fund’s common equity portfolio returned 31.8%, contributing 8.6% to the total portfolio return. After REITs were stuck in neutral for much of 2023, the Federal Reserve’s decision to cut interest rates was a tailwind for investors as REITs tend to benefit from falling rates due to decreased borrowing costs and potential earnings expansion. The Fund’s allocation to the Data Centers and Residential REIT sub-sectors were the main contributors to performance for the period.
The Fund’s preferred equity portfolio returned 25.7%, contributing 17.7% to the total portfolio return. Allocation and selection within the Fund’s preferred equity sleeve were the main contributors to performance with Health Care and Lodging leading the way from a sub-sector perspective.
While we remain cautiously optimistic with regard to the rate outlook, our conviction on real estate fundamentals has notably strengthened. We have intentionally tilted our portfolio toward property sectors that we believe should continue to heal in this setting (office and lodging in particular) as well as thrive (grocery-anchored centers and net lease).
How has the Fund performed over the last ten years?
Total Return Based on $10,000 Investment
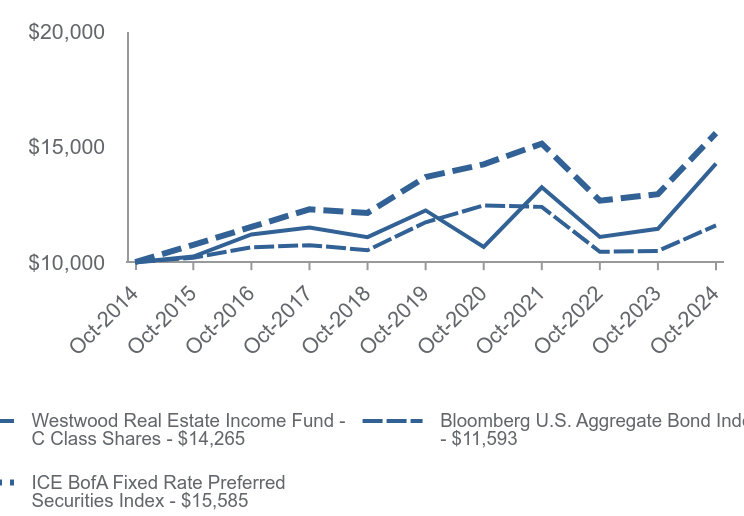
| Westwood Real Estate Income Fund - C Class Shares | Bloomberg U.S. Aggregate Bond Index | ICE BofA Fixed Rate Preferred Securities Index | |
|---|---|---|---|
| Oct-2014 | $10,000 | $10,000 | $10,000 |
| Oct-2015 | $10,243 | $10,196 | $10,750 |
| Oct-2016 | $11,200 | $10,641 | $11,527 |
| Oct-2017 | $11,497 | $10,737 | $12,285 |
| Oct-2018 | $11,085 | $10,517 | $12,133 |
| Oct-2019 | $12,239 | $11,727 | $13,682 |
| Oct-2020 | $10,660 | $12,453 | $14,234 |
| Oct-2021 | $13,240 | $12,393 | $15,128 |
| Oct-2022 | $11,093 | $10,450 | $12,661 |
| Oct-2023 | $11,443 | $10,487 | $12,944 |
| Oct-2024 | $14,265 | $11,593 | $15,585 |
Average Annual Total Returns as of 10/31/2024
| 1 Year | 5 Years | 10 Years | |
|---|---|---|---|
| Westwood Real Estate Income Fund - C Class Shares | |||
| Without CDSC | 24.67% | 3.11% | 3.62% |
| With CDSC | 23.67% | 3.11% | 3.62% |
| Bloomberg U.S. Aggregate Bond Index | 10.55% | -0.23% | 1.49% |
| ICE BofA Fixed Rate Preferred Securities Index | 20.40% | 2.64% | 4.54% |
Past performance does not guarantee future results. Call (877) 386-3944 or visit https://westwoodgroup.com/product/real-estate-income-fund/ for current month-end performance.
Fund Statistics
- Net Assets$277,237,649
- Number of Portfolio Holdings49
- Advisory Fee (net of recoupments)$1,936,246
- Portfolio Turnover94%
Asset Weighting (% of total investments)

| Value | Value |
|---|---|
| Common Stocks | 27.8% |
| Money Market Funds | 1.3% |
| Preferred Stocks | 70.9% |
What did the Fund invest in?
Industry Weighting (% of net assets)
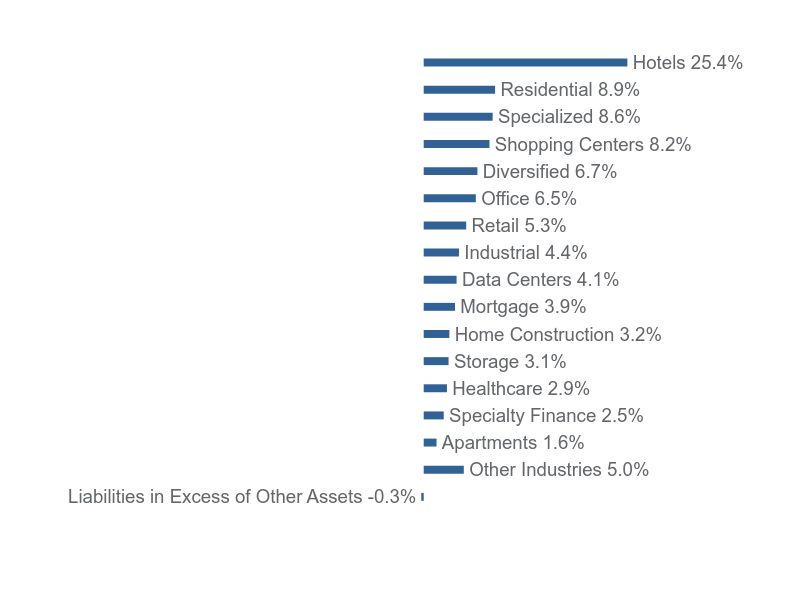
| Value | Value |
|---|---|
| Liabilities in Excess of Other Assets | -0.3% |
| Other Industries | 5.0% |
| Apartments | 1.6% |
| Specialty Finance | 2.5% |
| Healthcare | 2.9% |
| Storage | 3.1% |
| Home Construction | 3.2% |
| Mortgage | 3.9% |
| Data Centers | 4.1% |
| Industrial | 4.4% |
| Retail | 5.3% |
| Office | 6.5% |
| Diversified | 6.7% |
| Shopping Centers | 8.2% |
| Specialized | 8.6% |
| Residential | 8.9% |
| Hotels | 25.4% |
Top 10 Holdings (% of net assets)
| Holding Name | % of Net Assets |
| Kimco Realty Corporation, 7.25% - Series D | 4.0% |
| CTO Realty Growth, Inc., 6.38% - Series A | 3.9% |
| KKR Real Estate Finance Trust, Inc., 6.50% - Series A | 3.9% |
| Pebblebrook Hotel Trust, 5.70% - Series H | 3.7% |
| LXP Industrial Trust, 6.50% - Series C | 3.5% |
| RLJ Lodging Trust, 7.80% - Series A | 3.5% |
| Saul Centers, Inc., 6.13% - Series D | 3.2% |
| Hovnanian Enterprises, Inc., 7.63% - Series A | 3.2% |
| National Storage Affiliates Trust, 6.00% - Series A | 3.1% |
| EPR Properties, 9.00% - Series E | 3.0% |
Material Fund Changes
Effective March 31, 2024, the Fund changed its name from the Westwood Select Income Fund to the Westwood Real Estate Income Fund.

Westwood Real Estate Income Fund - C Class Shares (KIFCX)
Annual Shareholder Report - October 31, 2024
Where can I find additional information about the Fund?
Additional information is available on the Fund's website (https://westwoodgroup.com/product/real-estate-income-fund/), including its:
Prospectus
Financial information
Holdings
Proxy voting information
TSR-AR 103124-KIFCX
Westwood Broadmark Tactical Growth Fund

Institutional Shares (FTGWX)
Annual Shareholder Report - October 31, 2024
Fund Overview
This annual shareholder report contains important information about Westwood Broadmark Tactical Growth Fund (the "Fund") for the period of November 1, 2023 to October 31, 2024. You can find additional information about the Fund at https://westwoodgroup.com/product/tactical-growth-fund/. You can also request this information by contacting us at (877) 386-3944.
What were the Fund’s costs for the last year?
(based on a hypothetical $10,000 investment)
| Class Name | Costs of a $10,000 investment | Costs paid as a percentage of a $10,000 investment |
|---|---|---|
| Institutional Shares | $134 | 1.30% |
How did the Fund perform during the reporting period?
During the period, the Fund trailed the S&P 500 Index, which gained nearly 40%. The strong gains came amid solid economic fundamentals, including moderating inflation and stable employment. It was a narrow market, however, as the “Magnificent 7” — top-performing large-cap growth stocks mainly in the tech sector — surged on optimism surrounding AI-driven opportunities. Small-cap and mid-cap stocks trailed significantly, while value stocks trailed growth stocks.
This backdrop is important in discussing fund performance, as we historically have struggled when stocks are on a constant upward trend. And during the period, there were few significant downturns — the S&P 500 had only three drawdowns of greater than 4%, and in each case, the Fund sidestepped the decline.

From March 28 to April 19, 2024, the S&P 500 declined -5.40%, while the Tactical Growth Institutional Class shares declined -3.15%, capturing only 58% of the market downside.
From July 16 to August 5, 2024, the S&P 500 declined -8.45%; Tactical Growth Institutional Class shares declined -3.61%, capturing 43% of the market downside.
From August 30 to September 6, the S&P 500 declined -4.22%, while the Tactical Growth Institutional Class shares fell -1.45%, capturing only 34% of the market downside.
Turning to our four-pillar investment process, for much of the year, the pillars pointed us to limit exposure to equities. Valuations have been historically high, market sentiment was overly bullish, and monetary and credit conditions were excessively tight, while market momentum trended higher. Given this output from our process, we have been between 45% and 65% exposed to the market.
At the close of the period, valuations remained high, a negative factor, while monetary factors were neutral after a late increase in interest rates. Investor sentiment was less optimistic, a positive factor in our contrarian point of view, while momentum continued to be positive.
How has the Fund performed over the last ten years?
Total Return Based on $100,000 Investment
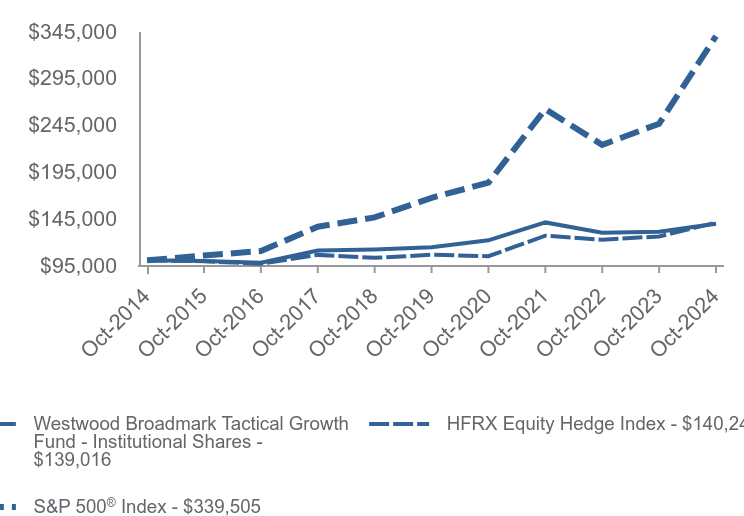
| Westwood Broadmark Tactical Growth Fund - Institutional Shares | HFRX Equity Hedge Index | S&P 500® Index | |
|---|---|---|---|
| Oct-2014 | $100,000 | $100,000 | $100,000 |
| Oct-2015 | $99,302 | $99,040 | $105,200 |
| Oct-2016 | $97,555 | $96,493 | $109,943 |
| Oct-2017 | $110,540 | $105,841 | $135,925 |
| Oct-2018 | $111,650 | $102,678 | $145,911 |
| Oct-2019 | $113,978 | $105,947 | $166,814 |
| Oct-2020 | $121,412 | $104,421 | $183,012 |
| Oct-2021 | $140,524 | $126,286 | $261,550 |
| Oct-2022 | $129,505 | $122,053 | $223,335 |
| Oct-2023 | $130,603 | $125,586 | $245,988 |
| Oct-2024 | $139,016 | $140,248 | $339,505 |
Average Annual Total Returns as of 10/31/2024
| 1 Year | 5 Years | 10 Years | |
|---|---|---|---|
| Westwood Broadmark Tactical Growth Fund - Institutional Shares | 6.44% | 4.05% | 3.35% |
| HFRX Equity Hedge Index | 11.67% | 5.77% | 3.44% |
S&P 500® Index | 38.02% | 15.27% | 13.00% |
Past performance does not guarantee future results. Call (877) 386-3944 or visit https://westwoodgroup.com/product/tactical-growth-fund/ for current month-end performance.
Fund Statistics
- Net Assets$163,862,278
- Number of Portfolio Holdings9
- Advisory Fee $2,138,161
- Portfolio Turnover156%
What did the Fund invest in?
Asset Weighting (% of total investments)
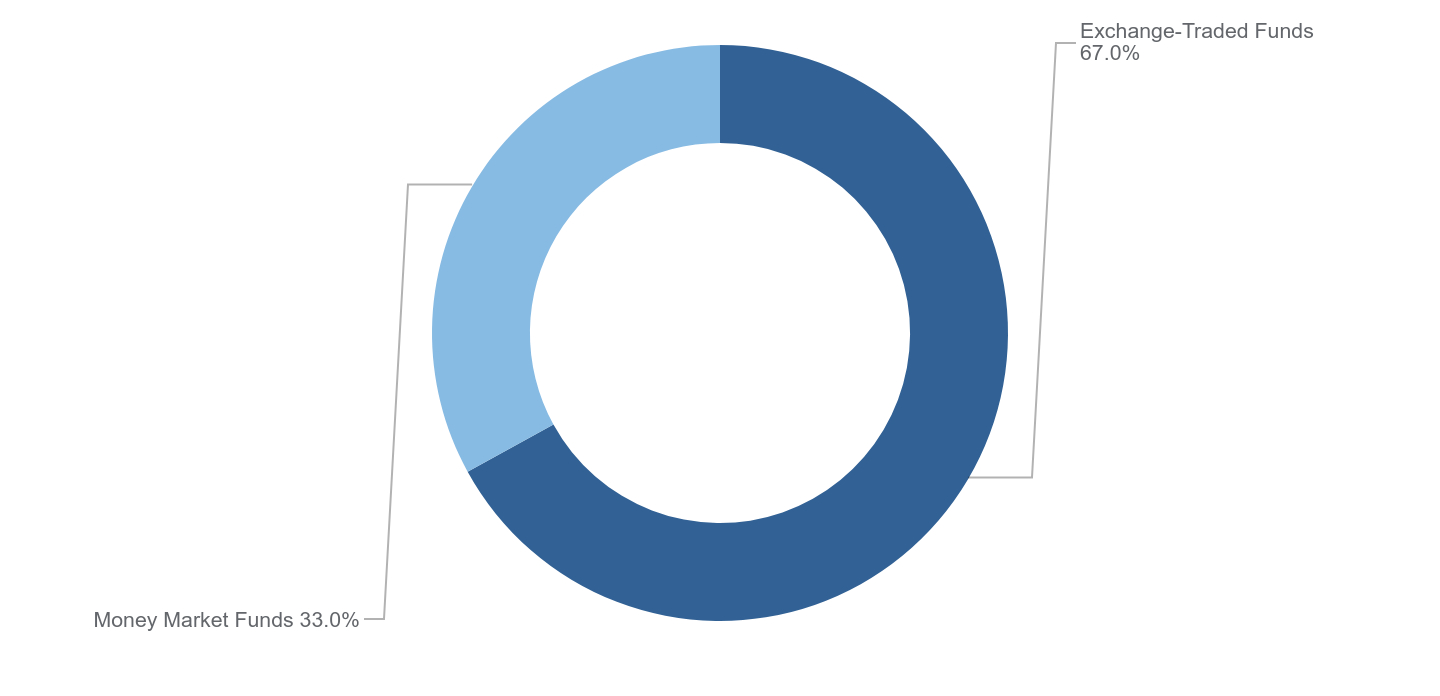
| Value | Value |
|---|---|
| Exchange-Traded Funds | 67.0% |
| Money Market Funds | 33.0% |
Material Fund Changes
No material changes occurred during the year ended October 31, 2024.

Westwood Broadmark Tactical Growth Fund - Institutional Shares (FTGWX)
Annual Shareholder Report - October 31, 2024
Where can I find additional information about the Fund?
Additional information is available on the Fund's website (https://westwoodgroup.com/product/tactical-growth-fund/), including its:
Prospectus
Financial information
Holdings
Proxy voting information
TSR-AR 103124-FTGWX
Westwood Broadmark Tactical Growth Fund

A Class Shares (FTAGX)
Annual Shareholder Report - October 31, 2024
Fund Overview
This annual shareholder report contains important information about Westwood Broadmark Tactical Growth Fund (the "Fund") for the period of November 1, 2023 to October 31, 2024. You can find additional information about the Fund at https://westwoodgroup.com/product/tactical-growth-fund/. You can also request this information by contacting us at (877) 386-3944.
What were the Fund’s costs for the last year?
(based on a hypothetical $10,000 investment)
| Class Name | Costs of a $10,000 investment | Costs paid as a percentage of a $10,000 investment |
|---|---|---|
| A Class Shares | $163 | 1.58% |
How did the Fund perform during the reporting period?
During the period, the Fund trailed the S&P 500 Index, which gained nearly 40%. The strong gains came amid solid economic fundamentals, including moderating inflation and stable employment. It was a narrow market, however, as the “Magnificent 7” — top-performing large-cap growth stocks mainly in the tech sector — surged on optimism surrounding AI-driven opportunities. Small-cap and mid-cap stocks trailed significantly, while value stocks trailed growth stocks.
This backdrop is important in discussing fund performance, as we historically have struggled when stocks are on a constant upward trend. And during the period, there were few significant downturns — the S&P 500 had only three drawdowns of greater than 4%, and in each case, the Fund sidestepped the decline.

From March 28 to April 19, 2024, the S&P 500 declined -5.40%, while the Tactical Growth Class A shares declined -3.15%, capturing only 58% of the market downside.
From July 16 to August 5, 2024, the S&P 500 declined -8.45%; Tactical Growth Class A shares declined -3.64%, capturing 43% of the market downside.
From August 30 to September 6, the S&P 500 declined -4.22%, while the Tactical Growth Class A shares fell -1.44%, capturing only 34% of the market downside.
Turning to our four-pillar investment process, for much of the year, the pillars pointed us to limit exposure to equities. Valuations have been historically high, market sentiment was overly bullish, and monetary and credit conditions were excessively tight, while market momentum trended higher. Given this output from our process, we have been between 45% and 65% exposed to the market.
At the close of the period, valuations remained high, a negative factor, while monetary factors were neutral after a late increase in interest rates. Investor sentiment was less optimistic, a positive factor in our contrarian point of view, while momentum continued to be positive.
How has the Fund performed over the last ten years?
Total Return Based on $10,000 Investment
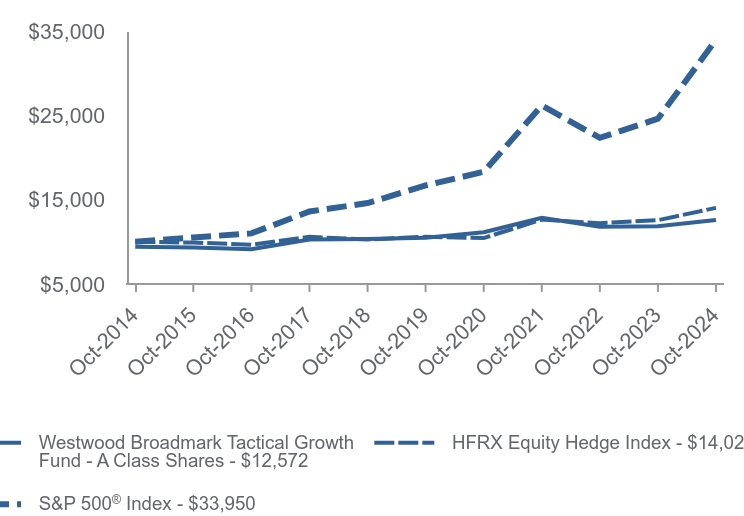
| Westwood Broadmark Tactical Growth Fund - A Class Shares | HFRX Equity Hedge Index | S&P 500® Index | |
|---|---|---|---|
| Oct-2014 | $9,424 | $10,000 | $10,000 |
| Oct-2015 | $9,312 | $9,904 | $10,520 |
| Oct-2016 | $9,105 | $9,649 | $10,994 |
| Oct-2017 | $10,266 | $10,584 | $13,593 |
| Oct-2018 | $10,326 | $10,268 | $14,591 |
| Oct-2019 | $10,490 | $10,595 | $16,681 |
| Oct-2020 | $11,131 | $10,442 | $18,301 |
| Oct-2021 | $12,833 | $12,629 | $26,155 |
| Oct-2022 | $11,776 | $12,205 | $22,334 |
| Oct-2023 | $11,845 | $12,559 | $24,599 |
| Oct-2024 | $12,572 | $14,025 | $33,950 |
Average Annual Total Returns as of 10/31/2024
| 1 Year | 5 Years | 10 Years | |
|---|---|---|---|
| Westwood Broadmark Tactical Growth Fund - A Class Shares | |||
| Without Load | 6.14% | 3.69% | 2.92% |
| With Load* | 2.95% | 2.47% | 2.31% |
| HFRX Equity Hedge Index | 11.67% | 5.77% | 3.44% |
S&P 500® Index | 38.02% | 15.27% | 13.00% |
Past performance does not guarantee future results. Call (877) 386-3944 or visit https://westwoodgroup.com/product/tactical-growth-fund/ for current month-end performance.
* Reflects the maximum sales charge applicable to A Class Shares.
Fund Statistics
- Net Assets$163,862,278
- Number of Portfolio Holdings9
- Advisory Fee $2,138,161
- Portfolio Turnover156%
What did the Fund invest in?
Asset Weighting (% of total investments)

| Value | Value |
|---|---|
| Exchange-Traded Funds | 67.0% |
| Money Market Funds | 33.0% |
Material Fund Changes
No material changes occurred during the year ended October 31, 2024.

Westwood Broadmark Tactical Growth Fund - A Class Shares (FTAGX)
Annual Shareholder Report - October 31, 2024
Where can I find additional information about the Fund?
Additional information is available on the Fund's website (https://westwoodgroup.com/product/tactical-growth-fund/), including its:
Prospectus
Financial information
Holdings
Proxy voting information
TSR-AR 103124-FTAGX
Westwood Broadmark Tactical Growth Fund

C Class Shares (FTGOX)
Annual Shareholder Report - October 31, 2024
Fund Overview
This annual shareholder report contains important information about Westwood Broadmark Tactical Growth Fund (the "Fund") for the period of November 1, 2023 to October 31, 2024. You can find additional information about the Fund at https://westwoodgroup.com/product/tactical-growth-fund/. You can also request this information by contacting us at (877) 386-3944.
What were the Fund’s costs for the last year?
(based on a hypothetical $10,000 investment)
| Class Name | Costs of a $10,000 investment | Costs paid as a percentage of a $10,000 investment |
|---|---|---|
| C Class Shares | $231 | 2.25% |
How did the Fund perform during the reporting period?
During the period, the Fund trailed the S&P 500 Index, which gained nearly 40%. The strong gains came amid solid economic fundamentals, including moderating inflation and stable employment. It was a narrow market, however, as the “Magnificent 7” — top-performing large-cap growth stocks mainly in the tech sector — surged on optimism surrounding AI-driven opportunities. Small-cap and mid-cap stocks trailed significantly, while value stocks trailed growth stocks.
This backdrop is important in discussing fund performance, as we historically have struggled when stocks are on a constant upward trend. And during the period, there were few significant downturns — the S&P 500 had only three drawdowns of greater than 4%, and in each case, the Fund sidestepped the decline.

From March 28 to April 19, 2024, the S&P 500 declined -5.40%, while the Tactical Growth Class C shares declined -3.20%, capturing only 59% of the market downside.
From July 16 to August 5, 2024, the S&P 500 declined -8.45%; Tactical Growth Class C shares declined -3.67%, capturing 43% of the market downside.
From August 30 to September 6, the S&P 500 declined -4.22%, while the Tactical Growth Class C shares fell -1.48%, capturing only 35% of the market downside.
Turning to our four-pillar investment process, for much of the year, the pillars pointed us to limit exposure to equities. Valuations have been historically high, market sentiment was overly bullish, and monetary and credit conditions were excessively tight, while market momentum trended higher. Given this output from our process, we have been between 45% and 65% exposed to the market.
At the close of the period, valuations remained high, a negative factor, while monetary factors were neutral after a late increase in interest rates. Investor sentiment was less optimistic, a positive factor in our contrarian point of view, while momentum continued to be positive.
How has the Fund performed over the last ten years?
Total Return Based on $10,000 Investment
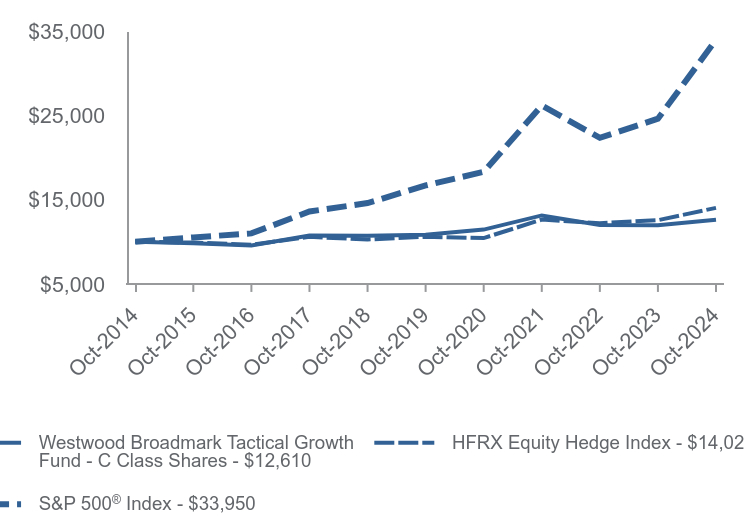
| Westwood Broadmark Tactical Growth Fund - C Class Shares | HFRX Equity Hedge Index | S&P 500® Index | |
|---|---|---|---|
| Oct-2014 | $10,000 | $10,000 | $10,000 |
| Oct-2015 | $9,833 | $9,904 | $10,520 |
| Oct-2016 | $9,571 | $9,649 | $10,994 |
| Oct-2017 | $10,741 | $10,584 | $13,593 |
| Oct-2018 | $10,728 | $10,268 | $14,591 |
| Oct-2019 | $10,844 | $10,595 | $16,681 |
| Oct-2020 | $11,444 | $10,442 | $18,301 |
| Oct-2021 | $13,125 | $12,629 | $26,155 |
| Oct-2022 | $11,978 | $12,205 | $22,334 |
| Oct-2023 | $11,963 | $12,559 | $24,599 |
| Oct-2024 | $12,610 | $14,025 | $33,950 |
Average Annual Total Returns as of 10/31/2024
| 1 Year | 5 Years | 10 Years | |
|---|---|---|---|
| Westwood Broadmark Tactical Growth Fund - C Class Shares | |||
| Without CDSC | 5.41% | 3.06% | 2.35% |
| With CDSC | 4.41% | 3.06% | 2.35% |
| HFRX Equity Hedge Index | 11.67% | 5.77% | 3.44% |
S&P 500® Index | 38.02% | 15.27% | 13.00% |
Past performance does not guarantee future results. Call (877) 386-3944 or visit https://westwoodgroup.com/product/tactical-growth-fund/ for current month-end performance.
Fund Statistics
- Net Assets$163,862,278
- Number of Portfolio Holdings9
- Advisory Fee $2,138,161
- Portfolio Turnover156%
What did the Fund invest in?
Asset Weighting (% of total investments)

| Value | Value |
|---|---|
| Exchange-Traded Funds | 67.0% |
| Money Market Funds | 33.0% |
Material Fund Changes
No material changes occurred during the year ended October 31, 2024.

Westwood Broadmark Tactical Growth Fund - C Class Shares (FTGOX)
Annual Shareholder Report - October 31, 2024
Where can I find additional information about the Fund?
Additional information is available on the Fund's website (https://westwoodgroup.com/product/tactical-growth-fund/), including its:
Prospectus
Financial information
Holdings
Proxy voting information
TSR-AR 103124-FTGOX
Westwood Broadmark Tactical Plus Fund

Institutional Shares (SBTIX)
Annual Shareholder Report - October 31, 2024
Fund Overview
This annual shareholder report contains important information about Westwood Broadmark Tactical Plus Fund (the "Fund") for the period of November 1, 2023 to October 31, 2024. You can find additional information about the Fund at https://westwoodgroup.com/product/tactical-plus-fund/. You can also request this information by contacting us at (877) 386-3944.
What were the Fund’s costs for the last year?
(based on a hypothetical $10,000 investment)
| Class Name | Costs of a $10,000 investment | Costs paid as a percentage of a $10,000 investment |
|---|---|---|
| Institutional Shares | $135 | 1.35% |
How did the Fund perform during the reporting period?
During the fiscal year, the Fund underperformed the S&P 500 Index, which posted an impressive gain of nearly 40%. These robust results reflected strong economic conditions, characterized by easing inflation and steady employment figures. However, market gains were concentrated, driven by the “Magnificent 7” — high-performing, large-cap growth stocks in the tech sector — which soared on optimism about AI-related opportunities. In contrast, small-cap and mid-cap stocks significantly lagged, while value stocks also underperformed their growth counterparts.
This environment is crucial in evaluating fund performance, as the Fund traditionally faces challenges during sustained market uptrends. Throughout the period, the S&P 500 experienced only three notable declines of over 4%, all of which the Fund largely avoided:

Between March 28 and April 19, the S&P 500 fell -5.40%, while the Tactical Plus Institutional Class shares declined just -1.23%, capturing only 22% of the market downside.
From July 16 to August 5, 2024, the S&P 500 shed -8.45%; Tactical Plus Institutional Class shares declined -3.74%, capturing 44% of the market downside.
From August 30 to September 6, the S&P 500 lost -4.22%, while the Tactical Plus Institutional Class shares fell -2.49%, capturing only 59% of the market downside.
The Fund’s four-pillar investment process informed its positioning. Due to high valuations, overly bullish sentiment, tight monetary conditions and positive market momentum, we limited market exposure during the period to between 40% and 70%. At the end of the period, valuations remained elevated, above their historical highs, while monetary factors were neutral following a rise in interest rates in October (despite the Federal Reserve’s interest rate cut). Investor sentiment had become less optimistic (a positive from our contrarian perspective), and market momentum stayed strong.
How has the Fund performed since inception?
Total Return Based on $10,000 Investment
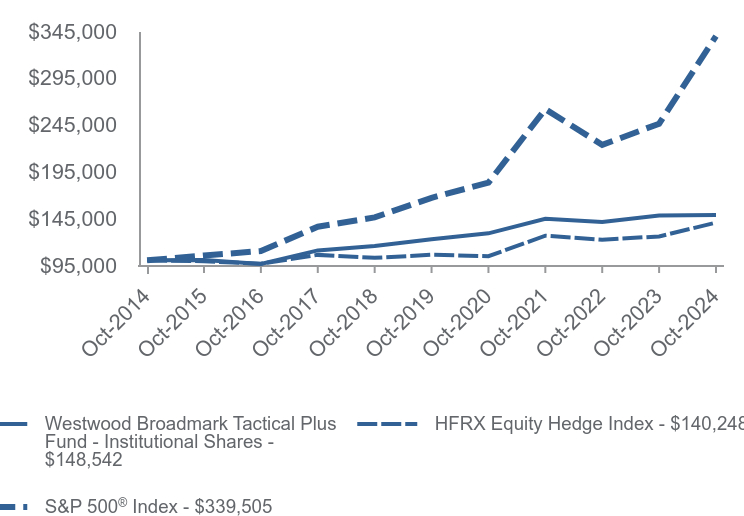
| Westwood Broadmark Tactical Plus Fund - Institutional Shares | HFRX Equity Hedge Index | S&P 500® Index | |
|---|---|---|---|
| Oct-2014 | $100,000 | $100,000 | $100,000 |
| Oct-2015 | $100,494 | $99,040 | $105,200 |
| Oct-2016 | $96,177 | $96,493 | $109,943 |
| Oct-2017 | $110,633 | $105,841 | $135,925 |
| Oct-2018 | $115,271 | $102,678 | $145,911 |
| Oct-2019 | $122,572 | $105,947 | $166,814 |
| Oct-2020 | $128,865 | $104,421 | $183,012 |
| Oct-2021 | $144,460 | $126,286 | $261,550 |
| Oct-2022 | $140,965 | $122,053 | $223,335 |
| Oct-2023 | $147,932 | $125,586 | $245,988 |
| Oct-2024 | $148,542 | $140,248 | $339,505 |
Average Annual Total Returns as of 10/31/2024
| 1 Year | 5 Years | 10 Years | |
|---|---|---|---|
| Westwood Broadmark Tactical Plus Fund - Institutional Shares | 0.41% | 3.92% | 4.04% |
| HFRX Equity Hedge Index | 11.67% | 5.77% | 3.44% |
S&P 500® Index | 38.02% | 15.27% | 13.00% |
Past performance does not guarantee future results. Call (877) 386-3944 or visit https://westwoodgroup.com/product/tactical-plus-fund/ for current month-end performance.
Fund Statistics
- Net Assets$71,647,725
- Number of Portfolio Holdings3
- Advisory Fee (net of waivers)$611,901
- Portfolio Turnover1,280%
What did the Fund invest in?
Asset Weighting (% of total investments)

| Value | Value |
|---|---|
| Money Market Funds | 100.0% |
Material Fund Changes
No material changes occurred during the year ended October 31, 2024.

Westwood Broadmark Tactical Plus Fund - Institutional Shares (SBTIX)
Annual Shareholder Report - October 31, 2024
Where can I find additional information about the Fund?
Additional information is available on the Fund's website (https://westwoodgroup.com/product/tactical-plus-fund/), including its:
Prospectus
Financial information
Holdings
Proxy voting information
TSR-AR 103124-SBTIX
Westwood Broadmark Tactical Plus Fund

A Class Shares (SBTAX)
Annual Shareholder Report - October 31, 2024
Fund Overview
This annual shareholder report contains important information about Westwood Broadmark Tactical Plus Fund (the "Fund") for the period of November 1, 2023 to October 31, 2024. You can find additional information about the Fund at https://westwoodgroup.com/product/tactical-plus-fund/. You can also request this information by contacting us at (877) 386-3944.
What were the Fund’s costs for the last year?
(based on a hypothetical $10,000 investment)
| Class Name | Costs of a $10,000 investment | Costs paid as a percentage of a $10,000 investment |
|---|---|---|
| A Class Shares | $160 | 1.60% |
How did the Fund perform during the reporting period?
During the fiscal year, the Fund underperformed the S&P 500 Index, which posted an impressive gain of nearly 40%. These robust results reflected strong economic conditions, characterized by easing inflation and steady employment figures. However, market gains were concentrated, driven by the “Magnificent 7” — high-performing, large-cap growth stocks in the tech sector — which soared on optimism about AI-related opportunities. In contrast, small-cap and mid-cap stocks significantly lagged, while value stocks also underperformed their growth counterparts.
This environment is crucial in evaluating fund performance, as the Fund traditionally faces challenges during sustained market uptrends. Throughout the period, the S&P 500 experienced only three notable declines of over 4%, all of which the Fund largely avoided:

Between March 28 and April 19, the S&P 500 fell -5.40%, while the Tactical Plus Class A shares declined just -1.25%, capturing only 23% of the market downside.
From July 16 to August 5, 2024, the S&P 500 shed -8.45%; Tactical Plus Class A shares declined -3.73%, capturing 44% of the market downside.
From August 30 to September 6, the S&P 500 lost -4.22%, while the Tactical Plus Class A shares fell -2.45%, capturing only 58% of the market downside.
The Fund’s four-pillar investment process informed its positioning. Due to high valuations, overly bullish sentiment, tight monetary conditions and positive market momentum, we limited market exposure during the period to between 40% and 70%. At the end of the period, valuations remained elevated, above their historical highs, while monetary factors were neutral following a rise in interest rates in October (despite the Federal Reserve’s interest rate cut). Investor sentiment had become less optimistic (a positive from our contrarian perspective), and market momentum stayed strong.
How has the Fund performed since inception?
Total Return Based on $10,000 Investment
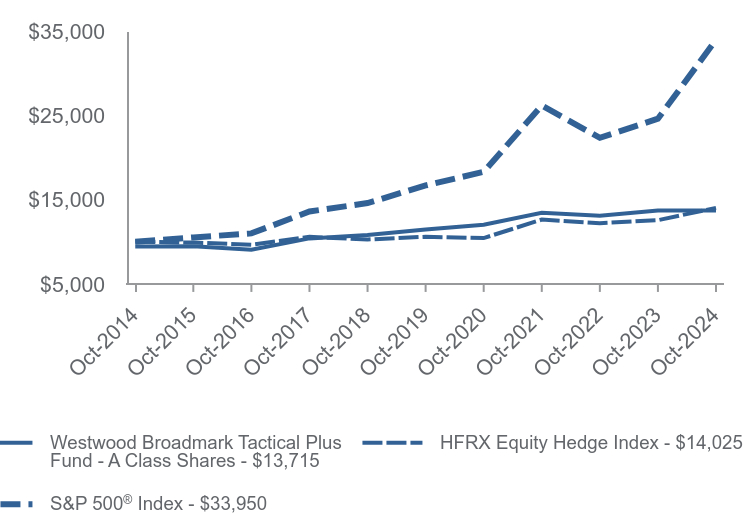
| Westwood Broadmark Tactical Plus Fund - A Class Shares | HFRX Equity Hedge Index | S&P 500® Index | |
|---|---|---|---|
| Oct-2014 | $9,451 | $10,000 | $10,000 |
| Oct-2015 | $9,478 | $9,904 | $10,520 |
| Oct-2016 | $9,062 | $9,649 | $10,994 |
| Oct-2017 | $10,402 | $10,584 | $13,593 |
| Oct-2018 | $10,812 | $10,268 | $14,591 |
| Oct-2019 | $11,462 | $10,595 | $16,681 |
| Oct-2020 | $12,027 | $10,442 | $18,301 |
| Oct-2021 | $13,445 | $12,629 | $26,155 |
| Oct-2022 | $13,082 | $12,205 | $22,334 |
| Oct-2023 | $13,700 | $12,559 | $24,599 |
| Oct-2024 | $13,715 | $14,025 | $33,950 |
Average Annual Total Returns as of 10/31/2024
| 1 Year | 5 Years | 10 Years | |
|---|---|---|---|
| Westwood Broadmark Tactical Plus Fund - A Class Shares | |||
| Without Load | 0.11% | 3.65% | 3.79% |
| With Load* | -2.91% | 2.49% | 3.21% |
| HFRX Equity Hedge Index | 11.67% | 5.77% | 3.44% |
S&P 500® Index | 38.02% | 15.27% | 13.00% |
Past performance does not guarantee future results. Call (877) 386-3944 or visit https://westwoodgroup.com/product/tactical-plus-fund/ for current month-end performance.
* Reflects the maximum sales charge applicable to A Class Shares.
Fund Statistics
- Net Assets$71,647,725
- Number of Portfolio Holdings3
- Advisory Fee (net of waivers)$611,901
- Portfolio Turnover1,280%
What did the Fund invest in?
Asset Weighting (% of total investments)

| Value | Value |
|---|---|
| Money Market Funds | 100.0% |
Material Fund Changes
No material changes occurred during the year ended October 31, 2024.

Westwood Broadmark Tactical Plus Fund - A Class Shares (SBTAX)
Annual Shareholder Report - October 31, 2024
Where can I find additional information about the Fund?
Additional information is available on the Fund's website (https://westwoodgroup.com/product/tactical-plus-fund/), including its:
Prospectus
Financial information
Holdings
Proxy voting information
TSR-AR 103124-SBTAX
Westwood Broadmark Tactical Plus Fund

C Class Shares (SBTCX)
Annual Shareholder Report - October 31, 2024
Fund Overview
This annual shareholder report contains important information about Westwood Broadmark Tactical Plus Fund (the "Fund") for the period of November 1, 2023 to October 31, 2024. You can find additional information about the Fund at https://westwoodgroup.com/product/tactical-plus-fund/. You can also request this information by contacting us at (877) 386-3944.
What were the Fund’s costs for the last year?
(based on a hypothetical $10,000 investment)
| Class Name | Costs of a $10,000 investment | Costs paid as a percentage of a $10,000 investment |
|---|---|---|
| C Class Shares | $234 | 2.35% |
How did the Fund perform during the reporting period?
During the fiscal year, the Fund underperformed the S&P 500 Index, which posted an impressive gain of nearly 40%. These robust results reflected strong economic conditions, characterized by easing inflation and steady employment figures. However, market gains were concentrated, driven by the “Magnificent 7” — high-performing, large-cap growth stocks in the tech sector — which soared on optimism about AI-related opportunities. In contrast, small-cap and mid-cap stocks significantly lagged, while value stocks also underperformed their growth counterparts.
This environment is crucial in evaluating fund performance, as the Fund traditionally faces challenges during sustained market uptrends. Throughout the period, the S&P 500 experienced only three notable declines of over 4%, all of which the Fund largely avoided:

Between March 28 and April 19, the S&P 500 fell -5.40%, while the Tactical Plus Class C shares declined just -1.34%, capturing only 25% of the market downside.
From July 16 to August 5, 2024, the S&P 500 shed -8.45%; Tactical Plus Class C shares declined -3.73%, capturing 44% of the market downside.
From August 30 to September 6, the S&P 500 lost -4.22%, while the Tactical Plus Class C shares fell -2.46%, capturing only 58% of the market downside.
The Fund’s four-pillar investment process informed its positioning. Due to high valuations, overly bullish sentiment, tight monetary conditions and positive market momentum, we limited market exposure during the period to between 40% and 70%. At the end of the period, valuations remained elevated, above their historical highs, while monetary factors were neutral following a rise in interest rates in October (despite the Federal Reserve’s interest rate cut). Investor sentiment had become less optimistic (a positive from our contrarian perspective), and market momentum stayed strong.
How has the Fund performed since inception?
Total Return Based on $10,000 Investment
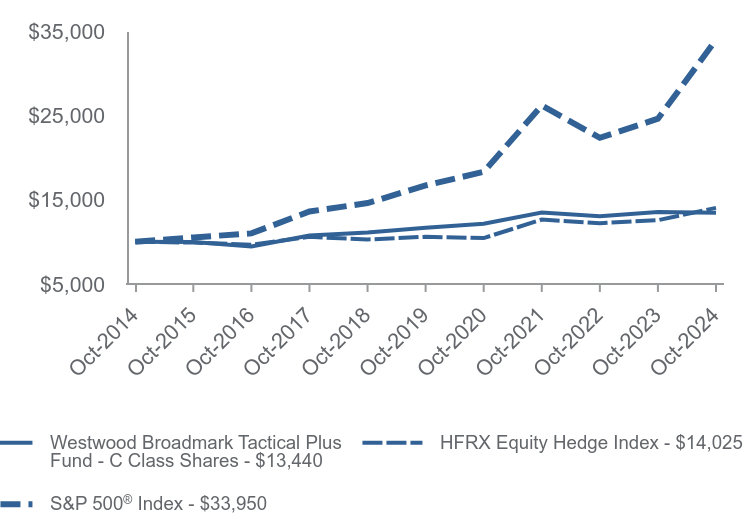
| Westwood Broadmark Tactical Plus Fund - C Class Shares | HFRX Equity Hedge Index | S&P 500® Index | |
|---|---|---|---|
| Oct-2014 | $10,000 | $10,000 | $10,000 |
| Oct-2015 | $9,959 | $9,904 | $10,520 |
| Oct-2016 | $9,431 | $9,649 | $10,994 |
| Oct-2017 | $10,747 | $10,584 | $13,593 |
| Oct-2018 | $11,093 | $10,268 | $14,591 |
| Oct-2019 | $11,673 | $10,595 | $16,681 |
| Oct-2020 | $12,148 | $10,442 | $18,301 |
| Oct-2021 | $13,475 | $12,629 | $26,155 |
| Oct-2022 | $13,021 | $12,205 | $22,334 |
| Oct-2023 | $13,529 | $12,559 | $24,599 |
| Oct-2024 | $13,440 | $14,025 | $33,950 |
Average Annual Total Returns as of 10/31/2024
| 1 Year | 5 Years | 10 Years | |
|---|---|---|---|
| Westwood Broadmark Tactical Plus Fund - C Class Shares | |||
| Without CDSC | -0.66% | 2.86% | 3.00% |
| With CDSC | -1.62% | 2.86% | 3.00% |
| HFRX Equity Hedge Index | 11.67% | 5.77% | 3.44% |
S&P 500® Index | 38.02% | 15.27% | 13.00% |
Past performance does not guarantee future results. Call (877) 386-3944 or visit https://westwoodgroup.com/product/tactical-plus-fund/ for current month-end performance.
Fund Statistics
- Net Assets$71,647,725
- Number of Portfolio Holdings3
- Advisory Fee (net of waivers)$611,901
- Portfolio Turnover1,280%
What did the Fund invest in?
Asset Weighting (% of total investments)

| Value | Value |
|---|---|
| Money Market Funds | 100.0% |
Material Fund Changes
No material changes occurred during the year ended October 31, 2024.

Westwood Broadmark Tactical Plus Fund - C Class Shares (SBTCX)
Annual Shareholder Report - October 31, 2024
Where can I find additional information about the Fund?
Additional information is available on the Fund's website (https://westwoodgroup.com/product/tactical-plus-fund/), including its:
Prospectus
Financial information
Holdings
Proxy voting information
TSR-AR 103124-SBTCX
Westwood Broadmark Tactical Plus Fund

F Class Shares (BTPIX)
Annual Shareholder Report - October 31, 2024
Fund Overview
This annual shareholder report contains important information about Westwood Broadmark Tactical Plus Fund (the "Fund") for the period of November 1, 2023 to October 31, 2024. You can find additional information about the Fund at https://westwoodgroup.com/product/tactical-plus-fund/. You can also request this information by contacting us at (877) 386-3944.
What were the Fund’s costs for the last year?
(based on a hypothetical $10,000 investment)
| Class Name | Costs of a $10,000 investment | Costs paid as a percentage of a $10,000 investment |
|---|---|---|
| F Class Shares | $104 | 1.04% |
How did the Fund perform during the reporting period?
During the fiscal year, the Fund underperformed the S&P 500 Index, which posted an impressive gain of nearly 40%. These robust results reflected strong economic conditions, characterized by easing inflation and steady employment figures. However, market gains were concentrated, driven by the “Magnificent 7” — high-performing, large-cap growth stocks in the tech sector — which soared on optimism about AI-related opportunities. In contrast, small-cap and mid-cap stocks significantly lagged, while value stocks also underperformed their growth counterparts.
This environment is crucial in evaluating fund performance, as the Fund traditionally faces challenges during sustained market uptrends. Throughout the period, the S&P 500 experienced only three notable declines of over 4%, all of which the Fund largely avoided:

Between March 28 and April 19, the S&P 500 fell -5.40%, while the Tactical Plus Class F shares declined just -1.20%, capturing only 22% of the market downside.
From July 16 to August 5, 2024, the S&P 500 shed -8.45%; Tactical Plus Class F shares declined -3.72%, capturing 44% of the market downside.
From August 30 to September 6, the S&P 500 lost -4.22%, while the Tactical Plus Class F shares fell -2.51%, capturing only 59% of the market downside.
The Fund’s four-pillar investment process informed its positioning. Due to high valuations, overly bullish sentiment, tight monetary conditions and positive market momentum, we limited market exposure during the period to between 40% and 70%. At the end of the period, valuations remained elevated, above their historical highs, while monetary factors were neutral following a rise in interest rates in October (despite the Federal Reserve’s interest rate cut). Investor sentiment had become less optimistic (a positive from our contrarian perspective), and market momentum stayed strong.
How has the Fund performed since inception?
Total Return Based on $10,000 Investment
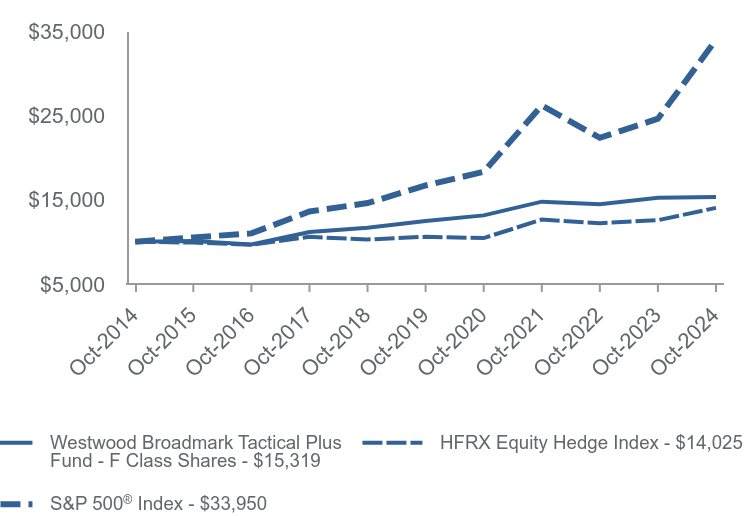
| Westwood Broadmark Tactical Plus Fund - F Class Shares | HFRX Equity Hedge Index | S&P 500® Index | |
|---|---|---|---|
| Oct-2014 | $10,000 | $10,000 | $10,000 |
| Oct-2015 | $10,079 | $9,904 | $10,520 |
| Oct-2016 | $9,683 | $9,649 | $10,994 |
| Oct-2017 | $11,165 | $10,584 | $13,593 |
| Oct-2018 | $11,677 | $10,268 | $14,591 |
| Oct-2019 | $12,451 | $10,595 | $16,681 |
| Oct-2020 | $13,131 | $10,442 | $18,301 |
| Oct-2021 | $14,759 | $12,629 | $26,155 |
| Oct-2022 | $14,445 | $12,205 | $22,334 |
| Oct-2023 | $15,208 | $12,559 | $24,599 |
| Oct-2024 | $15,319 | $14,025 | $33,950 |
Average Annual Total Returns as of 10/31/2024
| 1 Year | 5 Years | 10 Years | |
|---|---|---|---|
| Westwood Broadmark Tactical Plus Fund - F Class Shares | 0.73% | 4.23% | 4.36% |
| HFRX Equity Hedge Index | 11.67% | 5.77% | 3.44% |
S&P 500® Index | 38.02% | 15.27% | 13.00% |
Past performance does not guarantee future results. Call (877) 386-3944 or visit https://westwoodgroup.com/product/tactical-plus-fund/ for current month-end performance.
Fund Statistics
- Net Assets$71,647,725
- Number of Portfolio Holdings3
- Advisory Fee (net of waivers)$611,901
- Portfolio Turnover1,280%
What did the Fund invest in?
Asset Weighting (% of total investments)
| Value | Value |
|---|---|
| Money Market Funds | 100.0% |
Material Fund Changes
No material changes occurred during the year ended October 31, 2024.

Westwood Broadmark Tactical Plus Fund - F Class Shares (BTPIX)
Annual Shareholder Report - October 31, 2024
Where can I find additional information about the Fund?
Additional information is available on the Fund's website (https://westwoodgroup.com/product/tactical-plus-fund/), including its:
Prospectus
Financial information
Holdings
Proxy voting information
TSR-AR 103124-BTPIX
Westwood Salient Enhanced Midstream Income ETF

(MDST) NYSE
Annual Shareholder Report - October 31, 2024
Fund Overview
This annual shareholder report contains important information about Westwood Salient Enhanced Midstream Income ETF (the "Fund") for the period of April 8, 2024 to November 30, 2024. You can find additional information about the Fund at https://westwoodgroup.com/product/westwood-salient-enhanced-midstream-income/. You can also request this information by contacting us at (800) 994-0755.
What were the Fund’s costs for the last year?
(based on a hypothetical $10,000 investment)
| Fund Name | Costs of a $10,000 investment | Costs paid as a percentage of a $10,000 investment |
|---|---|---|
| Westwood Salient Enhanced Midstream Income ETF | $47 | 0.80% |
How did the Fund perform during the reporting period?
Please Note: The Westwood Salient Enhanced Midstream Income Fund reporting period referenced below has a start date of April 8, 2024, which is the inception date of the Fund.
The Westwood Salient Enhanced Midstream Income Fund underperformed its representative benchmark (Alerian Midstream Energy Select TR Index) during the period. As the Fund is designed to enhance distributable income comprising dividends and options premium, investors may not capture the market’s upside during periods of strong performance.
The best-performing sector on an absolute basis was Natural Gas Pipelines, which significantly contributed to fund performance as the sub-sector returned over 30% for the period due to rising U.S. power demand linked to AI data centers. The Fund’s overweight exposure to the Gathering and Processing sub-sector was also a main contributor, adding 5.2% to the total portfolio return.
On a relative basis, allocation was the main driver of underperformance during the period versus the benchmark. We continue to believe that U.S. production growth in the coming years will fill existing pipeline capacity and provide incremental cash flow growth to midstream businesses, which will be returned to shareholders via larger distributions and potential stock buybacks.
The Fund continues to pay attractive monthly income to investors, delivering a 10.4% annualized distribution yield at the period end (Oct. 31).
How has the Fund performed over the last ten years?
Total Return Based on $10,000 Investment
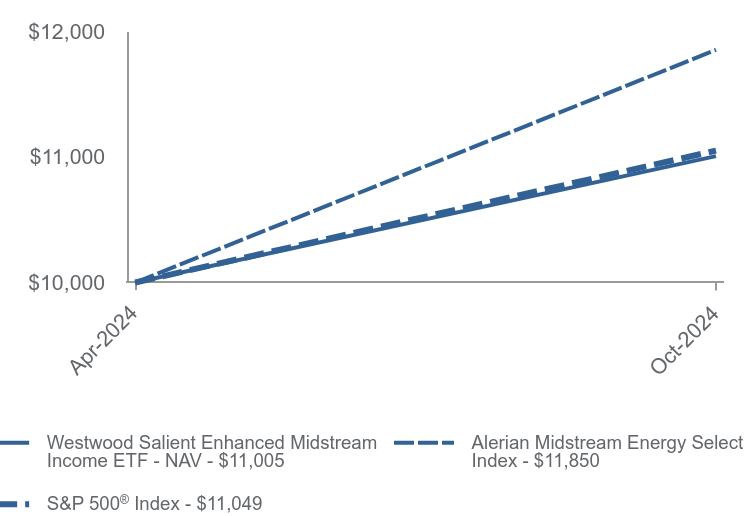
| Westwood Salient Enhanced Midstream Income ETF - NAV | Alerian Midstream Energy Select Index | S&P 500® Index | |
|---|---|---|---|
| Apr-2024 | $10,000 | $10,000 | $10,000 |
| Oct-2024 | $11,005 | $11,850 | $11,049 |
Average Annual Total Returns as of 10/31/2024
| Since Inception (April 8, 2024) | |
|---|---|
| Westwood Salient Enhanced Midstream Income ETF - NAV | 10.05% |
| Alerian Midstream Energy Select Index | 18.50% |
S&P 500® Index | 10.49% |
Past performance does not guarantee future results. Call (800) 994-0755 or visit https://westwoodgroup.com/product/westwood-salient-enhanced-midstream-income/ for current month-end performance.
Fund Statistics
- Net Assets$56,935,145
- Number of Portfolio Holdings80
- Advisory Fee #ERROR:A result could not be returned because the conditional could not be evaluated to a True/False value ((history))$188,580
- Portfolio Turnover47%
What did the Fund invest in?
Sector Weighting (% of net assets)
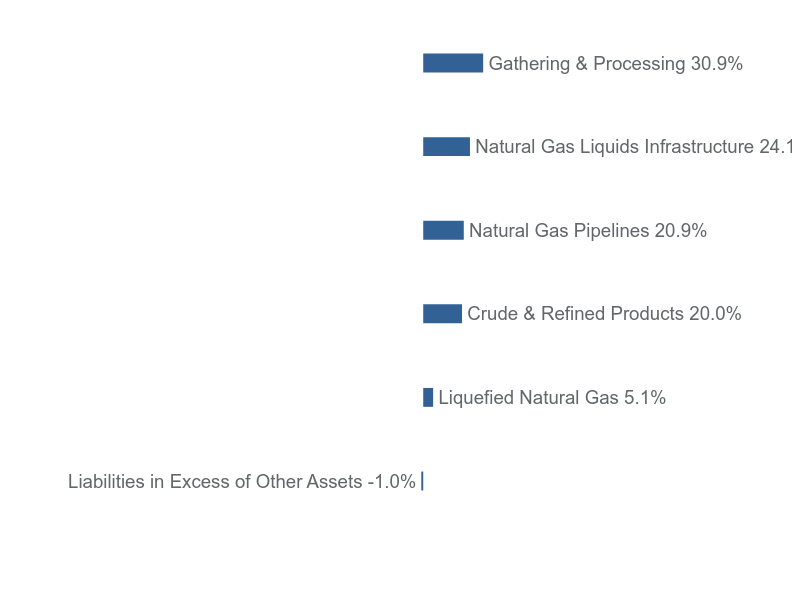
| Value | Value |
|---|---|
| Liabilities in Excess of Other Assets | -1.0% |
| Liquefied Natural Gas | 5.1% |
| Crude & Refined Products | 20.0% |
| Natural Gas Pipelines | 20.9% |
| Natural Gas Liquids Infrastructure | 24.1% |
| Gathering & Processing | 30.9% |
Top 10 Holdings (% of net assets)
| Holding Name | % of Net Assets |
| Energy Transfer, L.P. | 9.3% |
| Enbridge, Inc. | 8.6% |
| Williams Companies, Inc. (The) | 8.4% |
| Enterprise Products Partners, L.P. | 7.9% |
| Kinder Morgan, Inc. | 7.7% |
| Plains GP Holdings, L.P. - Class A | 5.9% |
| DT Midstream, Inc. | 5.6% |
| Targa Resources Corporation | 5.3% |
| Cheniere Energy, Inc. | 5.0% |
| ONEOK, Inc. | 4.9% |
Material Fund Changes
No material changes occurred during the year ended October 31, 2024.

Westwood Salient Enhanced Midstream Income ETF - Fund (MDST)
Annual Shareholder Report - October 31, 2024
Where can I find additional information about the Fund?
Additional information is available on the Fund's website (https://westwoodgroup.com/product/westwood-salient-enhanced-midstream-income/), including its:
Prospectus
Financial information
Holdings
Proxy voting information
TSR-AR 103124-MDST
Westwood Salient Enhanced Energy Income ETF

(WEEI) NASDAQ Stock Market, LLC
Annual Shareholder Report - October 31, 2024
Fund Overview
This annual shareholder report contains important information about Westwood Salient Enhanced Energy Income ETF (the "Fund") for the period of April 30, 2024 to November 30, 2024. You can find additional information about the Fund at https://westwoodgroup.com/product/salient-enhanced-energy-income/. You can also request this information by contacting us at (800) 994-0755.
What were the Fund’s costs for the last year?
(based on a hypothetical $10,000 investment)
| Fund Name | Costs of a $10,000 investment | Costs paid as a percentage of a $10,000 investment |
|---|---|---|
| Westwood Salient Enhanced Energy Income ETF | $42 | 0.85% |
How did the Fund perform during the reporting period?
Please Note: The Westwood Salient Enhanced Energy Income Fund reporting period referenced below has a start date of April 30, 2024, which is the inception date of the Fund.
The Westwood Salient Enhanced Energy Income Fund outperformed its representative benchmark (S&P Energy Select Sector Index) during the period. As the Fund is designed to enhance distributable income comprising dividends and options premium, investors benefited from dampened volatility from the covered call overlay, which helped buffer a portion of the downside return experienced during the period.
On a sub-sector basis, the best performing on an absolute basis was Natural Gas Pipelines, which significantly contributed to fund performance as the sub-sector returned 29% for the period due to rising U.S. power demand linked to AI data centers. Additionally, the Fund’s underweight exposure to the struggling Exploration and Production sub-sector, which returned -6.8%, was also a main contributor as the more commodity-sensitive businesses have faced headwinds, with declining oil prices and uncertainty around the upcoming U.S. presidential election from a policy standpoint.
The Fund continues to pay attractive monthly income to investors, delivering a 12.0% annualized distribution yield at the period end (Oct. 31).
How has the Fund performed over the last ten years?
Total Return Based on $10,000 Investment
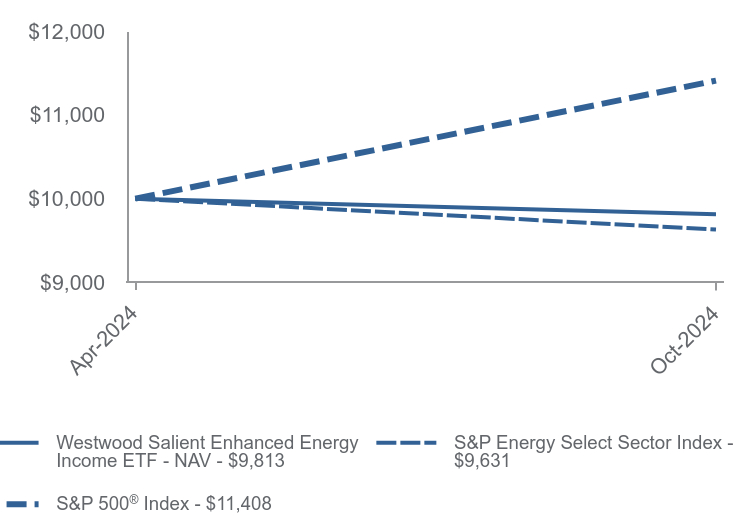
| Westwood Salient Enhanced Energy Income ETF - NAV | S&P Energy Select Sector Index | S&P 500® Index | |
|---|---|---|---|
| Apr-2024 | $10,000 | $10,000 | $10,000 |
| Oct-2024 | $9,813 | $9,631 | $11,408 |
Average Annual Total Returns as of 10/31/2024
| Since Inception (April 30, 2024) | |
|---|---|
| Westwood Salient Enhanced Energy Income ETF - NAV | -1.87% |
| S&P Energy Select Sector Index | -3.69% |
S&P 500® Index | 14.08% |
Past performance does not guarantee future results. Call (800) 994-0755 or visit https://westwoodgroup.com/product/salient-enhanced-energy-income/ for current month-end performance.
Fund Statistics
- Net Assets$14,130,831
- Number of Portfolio Holdings51
- Advisory Fee #ERROR:A result could not be returned because the conditional could not be evaluated to a True/False value ((history))$48,182
- Portfolio Turnover14%
What did the Fund invest in?
Sector Weighting (% of net assets)
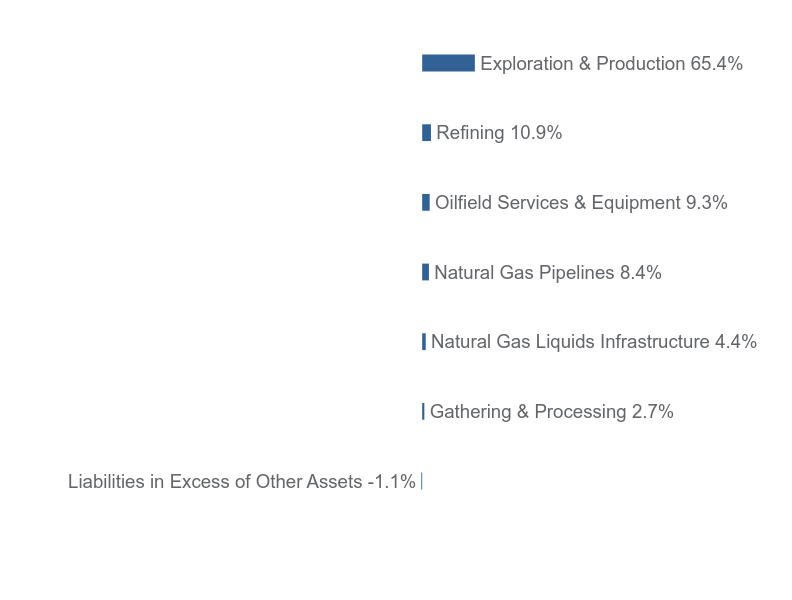
| Value | Value |
|---|---|
| Liabilities in Excess of Other Assets | -1.1% |
| Gathering & Processing | 2.7% |
| Natural Gas Liquids Infrastructure | 4.4% |
| Natural Gas Pipelines | 8.4% |
| Oilfield Services & Equipment | 9.3% |
| Refining | 10.9% |
| Exploration & Production | 65.4% |
Top 10 Holdings (% of net assets)
| Holding Name | % of Net Assets |
| Exxon Mobil Corporation | 21.2% |
| Chevron Corporation | 15.8% |
| ConocoPhillips | 6.8% |
| Williams Companies, Inc. (The) | 4.8% |
| EOG Resources, Inc. | 4.8% |
| Schlumberger Ltd. | 4.6% |
| ONEOK, Inc. | 4.4% |
| Phillips 66 | 3.9% |
| Marathon Petroleum Corporation | 3.9% |
| Diamondback Energy, Inc. | 3.7% |
Material Fund Changes
No material changes occurred during the year ended October 31, 2024.

Westwood Salient Enhanced Energy Income ETF - Fund (WEEI)
Annual Shareholder Report - October 31, 2024
Where can I find additional information about the Fund?
Additional information is available on the Fund's website (https://westwoodgroup.com/product/salient-enhanced-energy-income/), including its:
Prospectus
Financial information
Holdings
Proxy voting information
TSR-AR 103124-WEEI
| (b) | Not applicable |
| Item 2. | Code of Ethics. |
As of the end of the period covered by this report, the registrant has adopted a code of ethics that applies to the registrant’s principal executive officer, principal financial officer, principal accounting officer or controller, or persons performing similar functions, regardless of whether these individuals are employed by the registrant or a third party. Pursuant to Item 12(a)(1), a copy of registrant’s code of ethics is filed as an exhibit to this Form N-CSR. During the period covered by this report, the code of ethics has not been amended, and the registrant has not granted any waivers, including implicit waivers, from the provisions of the code of ethics.
| Item 3. | Audit Committee Financial Expert. |
The registrant’s board of trustees has determined that the registrant has at least one audit committee financial expert serving on its audit committee. The name of the audit committee financial expert is Janine L. Cohen. Ms. Cohen is “independent” for purposes of this Item.
| Item 4. | Principal Accountant Fees and Services. |
| (a) | Audit Fees. The aggregate fees billed for professional services rendered by the principal accountant for the audit of the registrant’s annual financial statements or for services that are normally provided by the accountant in connection with statutory and regulatory filings or engagements were $247,600 and $167,250 with respect to the registrant’s fiscal years ended October 31, 2024 and 2023, respectively. |
| (b) | Audit-Related Fees. No fees were billed in either of the last two fiscal years for assurance and related services by the principal accountant that are reasonably related to the performance of the audit of the registrant’s financial statements and are not reported under paragraph (a) of this Item. |
| (c) | Tax Fees. The aggregate fees billed for professional services rendered by the principal accountant for tax compliance, tax advice, and tax planning were $52,400 and $42,800 with respect to the registrant’s fiscal years ended October 31, 2024 and 2023, respectively. The services comprising these fees are the preparation of the registrant’s federal income and excise tax returns. |
| (d) | All Other Fees. No fees were billed in either of the last two fiscal years for products and services provided by the principal accountant, other than the services reported in paragraphs (a) through (c) of this Item. |
| (e)(1) | The audit committee has not adopted pre-approval policies and procedures described in paragraph (c)(7) of Rule 2-01 of Regulation S-X. |
| (e)(2) | None of the services described in paragraph (b) through (d) of this Item were approved by the audit committee pursuant to paragraph (c)(7)(i)(C) of Rule 2-01 of Regulation S-X. |
| (f) | Less than 50% of hours expended on the principal accountant’s engagement to audit the registrant’s financial statements for the most recent fiscal year were attributed to work performed by persons other than the principal accountant’s full-time, permanent employees. |
| (g) | During the fiscal years ended October 31, 2024 and 2023, aggregate non-audit fees of $52,400 and $42,800, respectively, were billed by the registrant’s accountant for services rendered to the registrant. No non-audit fees were billed in either of the last two fiscal years by the registrant’s accountant for services rendered to the registrant’s investment adviser (not including any sub-adviser whose role is primarily portfolio management and is subcontracted with or overseen by another investment adviser), and any entity controlling, controlled by, or under common control with the adviser that provides ongoing services to the registrant. |
| (h) | The principal accountant has not provided any non-audit services to the registrant’s investment adviser (not including any sub-adviser whose role is primarily portfolio management and is subcontracted with or overseen by another investment adviser), and any entity controlling, controlled by, or under common control with the investment adviser that provides ongoing services to the registrant. |
| (i) | Not applicable |
| (j) | Not applicable |
| Item 5. | Audit Committee of Listed Registrants. |
Certain series of the registrant that appear in the shareholder report included in Item 1 listed issuers as defined in Rule 10A-3 under the Securities Exchange Act of 1934, as amended (the “Exchange Act”) and have a separately-designated standing audit committee established in accordance with Section 3(a)(58)A of the Exchange Act. All of the Board’s independent trustees are members of the audit committee.
| Item 6. | Investments. |
(a) The Registrant(s) schedule(s) of investments is included in the Financial Statements under Item 7 of this form.
(b) Not applicable
| Item 7. | Financial Statements and Financial Highlights for Open-End Management Investment Companies |
| (a) |
 |
| Westwood Quality Value Fund |
| Westwood Quality MidCap Fund |
| Westwood Quality SMidCap Fund |
| Westwood Quality SmallCap Fund |
| Westwood Quality AllCap Fund |
| Westwood Income Opportunity Fund |
| Westwood Multi-Asset Income Fund |
| Westwood Alternative Income Fund |
| Westwood Salient MLP & Energy Infrastructure Fund |
| Westwood Global Real Estate Fund |
| Westwood Real Estate Income Fund |
| Westwood Broadmark Tactical Growth Fund |
| Westwood Broadmark Tactical Plus Fund |
| Financial Statements | October 31, 2024 | ||
| Investment Adviser: | |||
| Westwood Management Corp. | |||
| WESTWOOD FUNDS |
| TABLE OF CONTENTS |
| Schedules of Investments | |
| Westwood Quality Value Fund | 1 |
| Westwood Quality MidCap Fund | 3 |
| Westwood Quality SMidCap Fund | 5 |
| Westwood Quality SmallCap Fund | 7 |
| Westwood Quality AllCap Fund | 9 |
| Westwood Income Opportunity Fund | 11 |
| Westwood Multi-Asset Income Fund | 17 |
| Westwood Alternative Income Fund | 23 |
| Westwood Salient MLP & Energy Infrastructure Fund | 29 |
| Westwood Global Real Estate Fund | 32 |
| Westwood Real Estate Income Fund | 33 |
| Westwood Broadmark Tactical Growth Fund | 35 |
| Westwood Broadmark Tactical Plus Fund | 36 |
| Statements of Assets and Liabilities | 37 |
| Statements of Operations | 42 |
| Statements of Changes in Net Assets | 47 |
| Financial Highlights | 63 |
| Notes to Financial Statements | 87 |
| Report of Independent Registered Public Accounting Firm | 123 |
| Other Information | 125 |
| Other Federal Tax Information | 125 |
| Disclosure Regarding Approval of Investment Advisory Agreement and Sub-Advisory Agreements | 127 |
| WESTWOOD QUALITY VALUE FUND |
| OCTOBER 31, 2024 |
| SCHEDULE OF INVESTMENTS |
| COMMON STOCKS — 99.0% |
| Shares | Value | |||||||
| Communications — 3.1% | ||||||||
| Internet Media & Services — 2.1% | ||||||||
| Alphabet, Inc. - Class A | 25,796 | $ | 4,413,953 | |||||
| Telecommunications — 1.0% | ||||||||
| T-Mobile US, Inc. | 9,991 | 2,229,592 | ||||||
| Consumer Discretionary — 7.1% | ||||||||
| Leisure Facilities & Services — 3.9% | ||||||||
| Darden Restaurants, Inc. | 26,770 | 4,283,736 | ||||||
| Domino’s Pizza, Inc. | 10,040 | 4,153,849 | ||||||
| 8,437,585 | ||||||||
| Retail - Discretionary — 3.2% | ||||||||
| Home Depot, Inc. (The) | 6,153 | 2,422,744 | ||||||
| O’Reilly Automotive, Inc. (a) | 3,776 | 4,354,256 | ||||||
| 6,777,000 | ||||||||
| Consumer Staples — 7.4% | ||||||||
| Beverages — 2.1% | ||||||||
| PepsiCo, Inc. | 26,030 | 4,323,062 | ||||||
| Food — 1.8% | ||||||||
| Hershey Company (The) | 21,628 | 3,840,700 | ||||||
| Household Products — 1.4% | ||||||||
| Church & Dwight Company, Inc. | 30,380 | 3,035,266 | ||||||
| Retail - Consumer Staples — 2.1% | ||||||||
| Walmart, Inc. | 55,266 | 4,529,049 | ||||||
| Energy — 5.4% | ||||||||
| Oil & Gas Producers — 5.4% | ||||||||
| Chevron Corporation | 26,071 | 3,879,886 | ||||||
| EOG Resources, Inc. | 17,032 | 2,077,223 | ||||||
| Exxon Mobil Corporation | 34,238 | 3,998,314 | ||||||
| Valero Energy Corporation | 12,412 | 1,610,581 | ||||||
| 11,566,004 | ||||||||
| Financials — 16.8% | ||||||||
| Banking — 8.9% | ||||||||
| Bank of America Corporation | 109,404 | 4,575,275 | ||||||
| JPMorgan Chase & Company | 35,331 | 7,840,656 | ||||||
| SouthState Corporation | 22,829 | 2,226,512 | ||||||
| Wells Fargo & Company | 68,093 | 4,420,598 | ||||||
| 19,063,041 | ||||||||
| Institutional Financial Services — 2.6% | ||||||||
| Goldman Sachs Group, Inc. (The) | 10,685 | 5,532,586 | ||||||
| COMMON STOCKS — continued |
| Shares | Value | |||||||
| Financials — continued | ||||||||
| Insurance — 5.3% | ||||||||
| Arthur J. Gallagher & Company | 14,880 | $ | 4,184,256 | |||||
| Berkshire Hathaway, Inc. - Class B (a) | 9,145 | 4,123,663 | ||||||
| Progressive Corporation (The) | 12,227 | 2,969,083 | ||||||
| 11,277,002 | ||||||||
| Health Care — 12.1% | ||||||||
| Biotech & Pharma — 2.0% | ||||||||
| Johnson & Johnson | 26,778 | 4,280,731 | ||||||
| Health Care Facilities & Services — 3.4% | ||||||||
| UnitedHealth Group, Inc. | 12,748 | 7,196,246 | ||||||
| Medical Equipment & Devices — 6.7% | ||||||||
| Abbott Laboratories | 57,275 | 6,493,267 | ||||||
| Becton, Dickinson & Company | 17,611 | 4,113,753 | ||||||
| Danaher Corporation | 15,501 | 3,807,976 | ||||||
| 14,414,996 | ||||||||
| Industrials — 13.9% | ||||||||
| Aerospace & Defense — 1.9% | ||||||||
| General Dynamics Corporation | 14,293 | 4,167,982 | ||||||
| Commercial Support Services — 2.1% | ||||||||
| Waste Management, Inc. | 20,985 | 4,529,612 | ||||||
| Diversified Industrials — 2.0% | ||||||||
| Honeywell International, Inc. | 20,583 | 4,233,511 | ||||||
| Electrical Equipment — 3.3% | ||||||||
| Hubbell, Inc. | 11,389 | 4,863,445 | ||||||
| Littelfuse, Inc. | 8,700 | 2,128,281 | ||||||
| 6,991,726 | ||||||||
| Transportation & Logistics — 4.6% | ||||||||
| FedEx Corporation | 13,984 | 3,829,519 | ||||||
| Union Pacific Corporation | 25,720 | 5,968,840 | ||||||
| 9,798,359 | ||||||||
| Materials — 2.0% | ||||||||
| Forestry, Paper & Wood Products — 2.0% | ||||||||
| Boise Cascade Company | 31,690 | 4,215,721 | ||||||
| Real Estate — 4.2% | ||||||||
| REITs — 4.2% | ||||||||
| Federal Realty Investment Trust | 40,030 | 4,436,925 | ||||||
| Prologis, Inc. | 39,831 | 4,498,513 | ||||||
| 8,935,438 | ||||||||
The accompanying notes are an integral part of the financial statements.
1
| WESTWOOD QUALITY VALUE FUND |
| OCTOBER 31, 2024 |
| COMMON STOCKS — continued |
| Shares | Value | |||||||
| Technology — 18.7% | ||||||||
| Semiconductors — 2.6% | ||||||||
| Marvell Technology, Inc. | 25,672 | $ | 2,056,584 | |||||
| Microchip Technology, Inc. | 47,488 | 3,484,194 | ||||||
| 5,540,778 | ||||||||
| Software — 5.4% | ||||||||
| Microsoft Corporation | 16,375 | 6,653,981 | ||||||
| Salesforce, Inc. | 16,426 | 4,786,044 | ||||||
| 11,440,025 | ||||||||
| Technology Hardware — 3.5% | ||||||||
| Apple, Inc. | 18,778 | 4,242,138 | ||||||
| HP, Inc. | 92,507 | 3,285,849 | ||||||
| 7,527,987 | ||||||||
| Technology Services — 7.2% | ||||||||
| Accenture plc - Class A | 12,582 | 4,338,525 | ||||||
| CACI International, Inc. - Class A (a) | 9,308 | 5,143,228 | ||||||
| Visa, Inc. - Class A | 19,908 | 5,770,334 | ||||||
| 15,252,087 | ||||||||
| Utilities — 8.3% | ||||||||
| Electric Utilities — 8.3% | ||||||||
| DTE Energy Company | 36,328 | 4,512,664 | ||||||
| NextEra Energy, Inc. | 55,709 | 4,414,938 | ||||||
| Southern Company (The) | 47,015 | 4,279,775 | ||||||
| WEC Energy Group, Inc. | 45,886 | 4,383,490 | ||||||
| 17,590,867 | ||||||||
| Total Common Stocks | ||||||||
| (Cost $151,573,601) | $ | 211,140,906 | ||||||
| MONEY MARKET FUNDS — 1.0% |
| Shares | Value | |||||||
| First American Government Obligations Fund - Class U, 4.80% (b) (Cost $2,068,391) | 2,068,391 | $ | 2,068,391 | |||||
| Investments at Value — 100.0% | ||||||||
| (Cost $153,641,992) | $ | 213,209,297 | ||||||
| Liabilities in Excess of Other Assets — 0.0% | (10,893 | ) | ||||||
| Net Assets — 100.0% | $ | 213,198,404 | ||||||
plc - Public Limited Company
| (a) | Non-income producing security. |
| (b) | The rate shown is the 7-day effective yield as of October 31, 2024. |
The accompanying notes are an integral part of the financial statements.
2
| WESTWOOD QUALITY MIDCAP FUND |
| OCTOBER 31, 2024 |
| SCHEDULE OF INVESTMENTS |
| COMMON STOCKS — 98.8% |
| Shares | Value | |||||||
| Consumer Discretionary — 6.7% | ||||||||
| Leisure Facilities & Services — 1.1% | ||||||||
| Texas Roadhouse, Inc. | 117 | $ | 22,361 | |||||
| Retail - Discretionary — 5.6% | ||||||||
| Academy Sports & Outdoors, Inc. | 570 | 28,990 | ||||||
| O’Reilly Automotive, Inc. (a) | 36 | 41,513 | ||||||
| Ulta Beauty, Inc. (a) | 110 | 40,588 | ||||||
| 111,091 | ||||||||
| Consumer Staples — 8.5% | ||||||||
| Food — 3.7% | ||||||||
| Hershey Company (The) | 193 | 34,273 | ||||||
| McCormick & Company, Inc. | 497 | 38,885 | ||||||
| 73,158 | ||||||||
| Household Products — 3.4% | ||||||||
| Church & Dwight Company, Inc. | 384 | 38,365 | ||||||
| Interparfums, Inc. | 252 | 30,510 | ||||||
| 68,875 | ||||||||
| Retail - Consumer Staples — 1.4% | ||||||||
| BJ’s Wholesale Club Holdings, Inc. (a) | 327 | 27,707 | ||||||
| Energy — 5.5% | ||||||||
| Oil & Gas Producers — 5.5% | ||||||||
| Chord Energy Corporation | 297 | 37,155 | ||||||
| Diamondback Energy, Inc. | 224 | 39,596 | ||||||
| Permian Resources Corporation | 1,178 | 16,056 | ||||||
| SM Energy Company | 410 | 17,208 | ||||||
| 110,015 | ||||||||
| Financials — 13.3% | ||||||||
| Banking — 4.1% | ||||||||
| Atlantic Union Bankshares Corporation | 811 | 30,656 | ||||||
| Cullen/Frost Bankers, Inc. | 251 | 31,965 | ||||||
| Glacier Bancorp, Inc. | 380 | 19,817 | ||||||
| 82,438 | ||||||||
| Institutional Financial Services — 3.7% | ||||||||
| Intercontinental Exchange, Inc. | 192 | 29,927 | ||||||
| Piper Sandler Companies | 152 | 43,113 | ||||||
| 73,040 | ||||||||
| Insurance — 5.5% | ||||||||
| American International Group, Inc. | 675 | 51,219 | ||||||
| Arthur J. Gallagher & Company | 106 | 29,807 | ||||||
| Everest Group Ltd. | 77 | 27,382 | ||||||
| 108,408 | ||||||||
| COMMON STOCKS — continued |
| Shares | Value | |||||||
| Health Care — 6.9% | ||||||||
| Health Care Facilities & Services — 1.8% | ||||||||
| Acadia Healthcare Company, Inc. (a) | 365 | $ | 15,582 | |||||
| McKesson Corporation | 41 | 20,524 | ||||||
| 36,106 | ||||||||
| Medical Equipment & Devices — 5.1% | ||||||||
| Avantor, Inc. (a) | 1,347 | 30,132 | ||||||
| Cooper Companies, Inc. (The) (a) | 398 | 41,663 | ||||||
| Zimmer Biomet Holdings, Inc. | 279 | 29,831 | ||||||
| 101,626 | ||||||||
| Industrials — 12.4% | ||||||||
| Electrical Equipment — 4.4% | ||||||||
| BWX Technologies, Inc. | 256 | 31,168 | ||||||
| Hubbell, Inc. | 71 | 30,319 | ||||||
| Littelfuse, Inc. | 110 | 26,910 | ||||||
| 88,397 | ||||||||
| Engineering & Construction — 3.1% | ||||||||
| Jacobs Solutions, Inc. | 228 | 32,052 | ||||||
| TopBuild Corporation (a) | 81 | 28,624 | ||||||
| 60,676 | ||||||||
| Industrial Intermediate Products — 1.3% | ||||||||
| Timken Company (The) | 321 | 26,643 | ||||||
| Machinery — 2.1% | ||||||||
| AGCO Corporation | 236 | 23,562 | ||||||
| Middleby Corporation (The) (a) | 140 | 18,158 | ||||||
| 41,720 | ||||||||
| Transportation & Logistics — 1.5% | ||||||||
| XPO, Inc. (a) | 228 | 29,761 | ||||||
| Materials — 13.6% | ||||||||
| Chemicals — 2.9% | ||||||||
| Axalta Coating Systems Ltd. (a) | 794 | 30,108 | ||||||
| CF Industries Holdings, Inc. | 343 | 28,205 | ||||||
| 58,313 | ||||||||
| Construction Materials — 2.3% | ||||||||
| Summit Materials, Inc. - Class A (a) | 970 | 45,988 | ||||||
| Containers & Packaging — 3.7% | ||||||||
| Crown Holdings, Inc. | 443 | 41,443 | ||||||
| Smurfit WestRock plc | 623 | 32,084 | ||||||
| 73,527 | ||||||||
| Forestry, Paper & Wood Products — 1.9% | ||||||||
| Boise Cascade Company | 279 | 37,115 | ||||||
The accompanying notes are an integral part of the financial statements.
3
| WESTWOOD QUALITY MIDCAP FUND |
| OCTOBER 31, 2024 |
| COMMON STOCKS — continued |
| Shares | Value | |||||||
| Materials — continued | ||||||||
| Metals & Mining — 2.8% | ||||||||
| Cameco Corporation | 487 | $ | 25,431 | |||||
| Franco-Nevada Corporation | 228 | 30,247 | ||||||
| 55,678 | ||||||||
| Real Estate — 9.8% | ||||||||
| REITs — 9.8% | ||||||||
| Federal Realty Investment Trust | 256 | 28,375 | ||||||
| Healthpeak Properties, Inc. | 1,332 | 29,903 | ||||||
| Realty Income Corporation | 624 | 37,047 | ||||||
| Ventas, Inc. | 635 | 41,586 | ||||||
| VICI Properties, Inc. | 609 | 19,342 | ||||||
| Weyerhaeuser Company | 1,263 | 39,355 | ||||||
| 195,608 | ||||||||
| Technology — 13.8% | ||||||||
| Semiconductors — 6.1% | ||||||||
| Marvell Technology, Inc. | 499 | 39,975 | ||||||
| Microchip Technology, Inc. | 548 | 40,207 | ||||||
| ON Semiconductor Corporation (a) | 286 | 20,160 | ||||||
| Rambus, Inc. (a) | 442 | 21,136 | ||||||
| 121,478 | ||||||||
| Software — 1.8% | ||||||||
| Verra Mobility Corporation (a) | 1,415 | 36,748 | ||||||
| Technology Services — 5.9% | ||||||||
| Amdocs Ltd. | 463 | 40,626 | ||||||
| CACI International, Inc. - Class A (a) | 78 | 43,099 | ||||||
| MarketAxess Holdings, Inc. | 116 | 33,573 | ||||||
| 117,298 | ||||||||
| COMMON STOCKS — continued |
| Shares | Value | |||||||
| Utilities — 8.3% | ||||||||
| Electric Utilities — 8.3% | ||||||||
| Alliant Energy Corporation | 667 | $ | 40,020 | |||||
| CMS Energy Corporation | 606 | 42,184 | ||||||
| DTE Energy Company | 332 | 41,241 | ||||||
| Evergy, Inc. | 688 | 41,583 | ||||||
| 165,028 | ||||||||
| Total Common Stocks | ||||||||
| (Cost $1,692,023) | $ | 1,968,803 | ||||||
| MONEY MARKET FUNDS — 1.2% | ||||||||
| First American Treasury Obligations Fund - Class X, 4.74% (b) (Cost $23,443) | 23,443 | $ | 23,443 | |||||
| Investments at Value — 100.0% | ||||||||
| (Cost $1,715,466) | $ | 1,992,246 | ||||||
| Liabilities in Excess of Other Assets — 0.0% (c) | (763 | ) | ||||||
| Net Assets — 100.0% | $ | 1,991,483 | ||||||
plc - Public Limited Company
| (a) | Non-income producing security. |
| (b) | The rate shown is the 7-day effective yield as of October 31, 2024. |
| (c) | Percentage rounds to less than 0.1%. |
The accompanying notes are an integral part of the financial statements.
4
| WESTWOOD QUALITY SMIDCAP FUND |
| OCTOBER 31, 2024 |
| SCHEDULE OF INVESTMENTS |
| COMMON STOCKS — 99.5% |
| Shares | Value | |||||||
| Communications — 3.0% | ||||||||
| Telecommunications — 3.0% | ||||||||
| Cogent Communications Holdings, Inc. | 14,225 | $ | 1,141,841 | |||||
| DigitalBridge Group, Inc. | 124,163 | 1,948,117 | ||||||
| 3,089,958 | ||||||||
| Consumer Discretionary — 6.4% | ||||||||
| Leisure Facilities & Services — 3.1% | ||||||||
| Domino’s Pizza, Inc. | 5,071 | 2,098,025 | ||||||
| Texas Roadhouse, Inc. | 5,677 | 1,084,988 | ||||||
| 3,183,013 | ||||||||
| Retail - Discretionary — 3.3% | ||||||||
| Academy Sports & Outdoors, Inc. | 27,313 | 1,389,139 | ||||||
| Lithia Motors, Inc. | 6,223 | 2,068,339 | ||||||
| 3,457,478 | ||||||||
| Consumer Staples — 4.0% | ||||||||
| Food — 1.4% | ||||||||
| J & J Snack Foods Corporation | 8,936 | 1,466,577 | ||||||
| Household Products — 1.0% | ||||||||
| Interparfums, Inc. | 8,732 | 1,057,183 | ||||||
| Retail - Consumer Staples — 1.6% | ||||||||
| BJ’s Wholesale Club Holdings, Inc. (a) | 18,914 | 1,602,583 | ||||||
| Energy — 6.2% | ||||||||
| Oil & Gas Producers — 5.3% | ||||||||
| Chord Energy Corporation | 12,325 | 1,541,857 | ||||||
| Northern Oil and Gas, Inc. | 39,635 | 1,436,769 | ||||||
| Permian Resources Corporation | 75,141 | 1,024,172 | ||||||
| SM Energy Company | 35,991 | 1,510,542 | ||||||
| 5,513,340 | ||||||||
| Oil & Gas Services & Equipment — 0.9% | ||||||||
| Weatherford International plc | 12,735 | 1,006,065 | ||||||
| Financials — 17.8% | ||||||||
| Asset Management — 1.3% | ||||||||
| LPL Financial Holdings, Inc. | 4,681 | 1,320,885 | ||||||
| Banking — 9.8% | ||||||||
| Atlantic Union Bankshares Corporation | 51,275 | 1,938,195 | ||||||
| Cullen/Frost Bankers, Inc. | 19,602 | 2,496,314 | ||||||
| Glacier Bancorp, Inc. | 42,572 | 2,220,130 | ||||||
| Merchants Bancorp | 34,038 | 1,257,364 | ||||||
| Wintrust Financial Corporation | 20,001 | 2,317,916 | ||||||
| 10,229,919 | ||||||||
| COMMON STOCKS — continued |
| Shares | Value | |||||||
| Financials — continued | ||||||||
| Institutional Financial Services — 2.2% | ||||||||
| Piper Sandler Companies | 7,913 | $ | 2,244,443 | |||||
| Insurance — 4.5% | ||||||||
| Baldwin Insurance Group, Inc. (The) (a) | 21,931 | 1,014,528 | ||||||
| International General Insurance Holdings Ltd. | 94,031 | 2,094,071 | ||||||
| RenaissanceRe Holdings Ltd. | 6,198 | 1,626,355 | ||||||
| 4,734,954 | ||||||||
| Health Care — 8.3% | ||||||||
| Medical Equipment & Devices — 8.3% | ||||||||
| Avantor, Inc. (a) | 76,968 | 1,721,774 | ||||||
| Bio-Rad Laboratories, Inc. - Class A (a) | 3,071 | 1,100,001 | ||||||
| Cooper Companies, Inc. (The) (a) | 19,767 | 2,069,210 | ||||||
| Integer Holdings Corporation (a) | 17,201 | 2,137,224 | ||||||
| Teleflex, Inc. | 8,310 | 1,670,809 | ||||||
| 8,699,018 | ||||||||
| Industrials — 20.0% | ||||||||
| Aerospace & Defense — 7.0% | ||||||||
| AAR Corporation (a) | 35,692 | 2,095,120 | ||||||
| Hexcel Corporation | 33,103 | 1,942,815 | ||||||
| Kratos Defense & Security Solutions, Inc. (a) | 95,311 | 2,165,466 | ||||||
| Moog, Inc. - Class A | 5,740 | 1,082,564 | ||||||
| 7,285,965 | ||||||||
| Electrical Equipment — 5.9% | ||||||||
| BWX Technologies, Inc. | 17,215 | 2,095,926 | ||||||
| Hubbell, Inc. | 4,958 | 2,117,215 | ||||||
| Littelfuse, Inc. | 7,895 | 1,931,354 | ||||||
| 6,144,495 | ||||||||
| Engineering & Construction — 0.9% | ||||||||
| TopBuild Corporation (a) | 2,830 | 1,000,065 | ||||||
| Industrial Intermediate Products — 1.0% | ||||||||
| Timken Company (The) | 12,133 | 1,007,039 | ||||||
| Industrial Support Services — 1.0% | ||||||||
| H&E Equipment Services, Inc. | 19,167 | 1,001,476 | ||||||
| Machinery — 1.0% | ||||||||
| AGCO Corporation | 10,666 | 1,064,893 | ||||||
| Transportation & Logistics — 2.2% | ||||||||
| XPO, Inc. (a) | 17,558 | 2,291,846 | ||||||
The accompanying notes are an integral part of the financial statements.
5
| WESTWOOD QUALITY SMIDCAP FUND |
| OCTOBER 31, 2024 |
| COMMON STOCKS — continued |
| Shares | Value | |||||||
| Industrials — continued | ||||||||
| Transportation Equipment — 1.0% | ||||||||
| Blue Bird Corporation (a) | 25,341 | $ | 1,067,110 | |||||
| Materials — 10.5% | ||||||||
| Chemicals — 1.5% | ||||||||
| Axalta Coating Systems Ltd. (a) | 42,455 | 1,609,894 | ||||||
| Construction Materials — 2.6% | ||||||||
| Summit Materials, Inc. - Class A (a) | 57,062 | 2,705,309 | ||||||
| Containers & Packaging — 1.5% | ||||||||
| Crown Holdings, Inc. | 16,864 | 1,577,627 | ||||||
| Forestry, Paper & Wood Products — 1.5% | ||||||||
| Boise Cascade Company | 11,521 | 1,532,639 | ||||||
| Metals & Mining — 3.4% | ||||||||
| Cameco Corporation | 19,404 | 1,013,277 | ||||||
| Constellium SE (a) | 121,265 | 1,346,041 | ||||||
| Royal Gold, Inc. | 7,975 | 1,164,829 | ||||||
| 3,524,147 | ||||||||
| Real Estate — 10.6% | ||||||||
| REITs — 10.6% | ||||||||
| American Healthcare REIT, Inc. | 66,370 | 1,765,442 | ||||||
| Americold Realty Trust, Inc. | 44,144 | 1,133,618 | ||||||
| COPT Defense Properties | 69,464 | 2,236,741 | ||||||
| Equity LifeStyle Properties, Inc. | 13,659 | 957,769 | ||||||
| Federal Realty Investment Trust | 13,203 | 1,463,420 | ||||||
| PotlatchDeltic Corporation | 37,566 | 1,561,619 | ||||||
| Rexford Industrial Realty, Inc. | 45,220 | 1,939,486 | ||||||
| 11,058,095 | ||||||||
| Technology — 8.3% | ||||||||
| Semiconductors — 3.7% | ||||||||
| Allegro MicroSystems, Inc. (a) | 42,320 | 881,949 | ||||||
| Amkor Technology, Inc. | 31,533 | 802,515 | ||||||
| Rambus, Inc. (a) | 45,098 | 2,156,586 | ||||||
| 3,841,050 | ||||||||
| COMMON STOCKS — continued |
| Shares | Value | |||||||
| Technology — continued | ||||||||
| Software — 2.4% | ||||||||
| Pegasystems, Inc. | 13,087 | $ | 1,039,631 | |||||
| Verra Mobility Corporation (a) | 59,013 | 1,532,568 | ||||||
| 2,572,199 | ||||||||
| Technology Services — 2.2% | ||||||||
| Amdocs Ltd. | 12,811 | 1,124,101 | ||||||
| MarketAxess Holdings, Inc. | 3,990 | 1,154,786 | ||||||
| 2,278,887 | ||||||||
| Utilities — 4.4% | ||||||||
| Electric Utilities — 4.4% | ||||||||
| Alliant Energy Corporation | 34,260 | 2,055,600 | ||||||
| IDACORP, Inc. | 24,445 | 2,529,568 | ||||||
| 4,585,168 | ||||||||
| Total Common Stocks | ||||||||
| (Cost $91,993,237) | $ | 103,753,320 | ||||||
| MONEY MARKET FUNDS — 0.9% | ||||||||
| First American Government Obligations Fund - Class U, 4.80% (b) (Cost $935,463) | 935,463 | $ | 935,463 | |||||
| Investments at Value — 100.4% | ||||||||
| (Cost $92,928,700) | $ | 104,688,783 | ||||||
| Liabilities in Excess of Other Assets — (0.4%) | (452,899 | ) | ||||||
| Net Assets — 100.0% | $ | 104,235,884 | ||||||
plc - Public Limited Company
REIT - Real Estate Investment Trust
SE - Societe Europaea
| (a) | Non-income producing security. |
| (b) | The rate shown is the 7-day effective yield as of October 31, 2024. |
The accompanying notes are an integral part of the financial statements.
6
| WESTWOOD QUALITY SMALLCAP FUND |
| OCTOBER 31, 2024 |
| SCHEDULE OF INVESTMENTS |
| COMMON STOCKS — 99.7% |
| Shares | Value | |||||||
| Communications — 1.0% | ||||||||
| Telecommunications — 1.0% | ||||||||
| Cogent Communications Holdings, Inc. | 139,816 | $ | 11,223,030 | |||||
| Consumer Discretionary — 10.1% | ||||||||
| Home Construction — 2.0% | ||||||||
| Century Communities, Inc. | 252,538 | 22,390,019 | ||||||
| Leisure Facilities & Services — 1.6% | ||||||||
| Papa John’s International, Inc. | 335,591 | 17,581,613 | ||||||
| Leisure Products — 0.6% | ||||||||
| YETI Holdings, Inc. (a) | 184,744 | 6,504,836 | ||||||
| Retail - Discretionary — 5.9% | ||||||||
| Academy Sports & Outdoors, Inc. | 416,708 | 21,193,769 | ||||||
| Boot Barn Holdings, Inc. (a) | 71,781 | 8,940,323 | ||||||
| GMS, Inc. (a) | 246,174 | 22,128,581 | ||||||
| Sonic Automotive, Inc. - Class A | 212,782 | 12,071,123 | ||||||
| 64,333,796 | ||||||||
| Consumer Staples — 2.9% | ||||||||
| Food — 2.0% | ||||||||
| J & J Snack Foods Corporation | 133,652 | 21,934,966 | ||||||
| Household Products — 0.9% | ||||||||
| Central Garden & Pet Company - Class A (a) | 351,200 | 10,233,968 | ||||||
| Energy — 8.3% | ||||||||
| Oil & Gas Producers — 8.3% | ||||||||
| Northern Oil and Gas, Inc. | 802,219 | 29,080,439 | ||||||
| Sitio Royalties Corporation - Class A | 989,602 | 22,058,228 | ||||||
| SM Energy Company | 726,964 | 30,510,679 | ||||||
| Vital Energy, Inc. (a) | 357,773 | 9,756,470 | ||||||
| 91,405,816 | ||||||||
| Financials — 24.1% | ||||||||
| Banking — 16.6% | ||||||||
| Atlantic Union Bankshares Corporation | 608,689 | 23,008,444 | ||||||
| Bank of N.T. Butterfield & Son Ltd. (The) | 348,897 | 12,759,163 | ||||||
| Banner Corporation | 187,434 | 12,003,273 | ||||||
| City Holding Company | 200,568 | 23,386,229 | ||||||
| First Bancorp | 562,264 | 23,446,409 | ||||||
| National Bank Holdings Corporation - Class A | 420,756 | 18,917,190 | ||||||
| COMMON STOCKS — continued |
| Shares | Value | |||||||
| Financials — continued | ||||||||
| Banking — continued | ||||||||
| Renasant Corporation | 671,665 | $ | 22,910,493 | |||||
| Seacoast Banking Corporation of Florida | 837,938 | 22,372,945 | ||||||
| Simmons First National Corporation - Class A | 574,028 | 13,317,450 | ||||||
| Veritex Holdings, Inc. | 404,685 | 10,926,495 | ||||||
| 183,048,091 | ||||||||
| Institutional Financial Services — 4.4% | ||||||||
| Moelis & Company - Class A | 170,316 | 11,308,983 | ||||||
| Perella Weinberg Partners | 639,071 | 12,928,406 | ||||||
| Piper Sandler Companies | 83,969 | 23,816,967 | ||||||
| 48,054,356 | ||||||||
| Insurance — 3.1% | ||||||||
| AMERISAFE, Inc. | 232,216 | 12,551,275 | ||||||
| Baldwin Insurance Group, Inc. (The) (a) | 457,990 | 21,186,617 | ||||||
| 33,737,892 | ||||||||
| Health Care — 7.3% | ||||||||
| Biotech & Pharma — 2.1% | ||||||||
| Prestige Consumer Healthcare, Inc. (a) | 307,565 | 22,682,919 | ||||||
| Medical Equipment & Devices — 5.2% | ||||||||
| Avanos Medical, Inc. (a) | 709,156 | 13,247,034 | ||||||
| CONMED Corporation | 301,446 | 20,570,675 | ||||||
| Merit Medical Systems, Inc. (a) | 240,042 | 23,682,544 | ||||||
| 57,500,253 | ||||||||
| Industrials — 15.8% | ||||||||
| Aerospace & Defense — 6.1% | ||||||||
| AAR Corporation (a) | 365,026 | 21,427,026 | ||||||
| Barnes Group, Inc. | 243,972 | 11,408,131 | ||||||
| Kratos Defense & Security Solutions, Inc. (a) | 515,048 | 11,701,890 | ||||||
| Moog, Inc. - Class A | 117,583 | 22,176,154 | ||||||
| 66,713,201 | ||||||||
| Industrial Intermediate Products — 1.5% | ||||||||
| AZZ, Inc. | 225,875 | 17,207,158 | ||||||
| Industrial Support Services — 1.0% | ||||||||
| H&E Equipment Services, Inc. | 205,226 | 10,723,059 | ||||||
| Machinery — 3.1% | ||||||||
| Alamo Group, Inc. | 130,343 | 22,098,352 | ||||||
| Thermon Group Holdings, Inc. (a) | 446,041 | 11,690,735 | ||||||
| 33,789,087 | ||||||||
The accompanying notes are an integral part of the financial statements.
7
| WESTWOOD QUALITY SMALLCAP FUND |
| OCTOBER 31, 2024 |
| COMMON STOCKS — continued |
| Shares | Value | |||||||
| Industrials — continued | ||||||||
| Transportation & Logistics — 2.1% | ||||||||
| ArcBest Corporation | 221,224 | $ | 23,047,116 | |||||
| Transportation Equipment — 2.0% | ||||||||
| Blue Bird Corporation (a) | 527,040 | 22,193,654 | ||||||
| Materials — 8.2% | ||||||||
| Chemicals — 4.8% | ||||||||
| Hawkins, Inc. | 178,356 | 19,066,256 | ||||||
| Innospec, Inc. | 215,756 | 23,254,182 | ||||||
| Stepan Company | 149,216 | 10,794,285 | ||||||
| 53,114,723 | ||||||||
| Forestry, Paper & Wood Products — 2.0% | ||||||||
| Boise Cascade Company | 162,560 | 21,625,357 | ||||||
| Metals & Mining — 1.4% | ||||||||
| Constellium SE (a) | 1,430,539 | 15,878,983 | ||||||
| Real Estate — 11.2% | ||||||||
| REITs — 11.2% | ||||||||
| COPT Defense Properties | 747,867 | 24,081,317 | ||||||
| Four Corners Property Trust, Inc. | 798,548 | 22,007,983 | ||||||
| Plymouth Industrial REIT, Inc. | 993,973 | 20,197,531 | ||||||
| PotlatchDeltic Corporation | 503,092 | 20,913,535 | ||||||
| Sunstone Hotel Investors, Inc. | 1,131,199 | 11,413,798 | ||||||
| Urban Edge Properties | 1,091,191 | 24,268,088 | ||||||
| 122,882,252 | ||||||||
| Technology — 6.7% | ||||||||
| Semiconductors — 2.1% | ||||||||
| Rambus, Inc. (a) | 230,402 | 11,017,824 | ||||||
| Veeco Instruments, Inc. (a) | 416,698 | 11,992,568 | ||||||
| 23,010,392 | ||||||||
| COMMON STOCKS — continued |
| Shares | Value | |||||||
| Technology — continued | ||||||||
| Software — 2.9% | ||||||||
| Verra Mobility Corporation (a) | 881,428 | $ | 22,890,685 | |||||
| Zuora, Inc. - Class A (a) | 854,173 | 8,456,313 | ||||||
| 31,346,998 | ||||||||
| Technology Hardware — 1.7% | ||||||||
| Viavi Solutions, Inc. (a) | 2,054,370 | 18,941,291 | ||||||
| Utilities — 4.1% | ||||||||
| Electric Utilities — 4.1% | ||||||||
| Avista Corporation | 583,774 | 21,879,850 | ||||||
| Northwestern Energy Group, Inc. | 422,789 | 22,602,300 | ||||||
| 44,482,150 | ||||||||
| Total Common Stocks | ||||||||
| (Cost $924,961,980) | $ | 1,095,586,976 | ||||||
| MONEY MARKET FUNDS — 0.6% | ||||||||
| First American Government Obligations Fund - Class U, 4.80% (b) (Cost $6,730,400) | 6,730,400 | $ | 6,730,400 | |||||
| Investments at Value — 100.3% | ||||||||
| (Cost $931,692,380) | $ | 1,102,317,376 | ||||||
| Liabilities in Excess of Other Assets — (0.3%) | (2,809,521 | ) | ||||||
| Net Assets — 100.0% | $ | 1,099,507,855 | ||||||
REIT - Real Estate Investment Trust
SE - Societe Europaea
| (a) | Non-income producing security. |
| (b) | The rate shown is the 7-day effective yield as of October 31, 2024. |
The accompanying notes are an integral part of the financial statements.
8
| WESTWOOD QUALITY ALLCAP FUND |
| OCTOBER 31, 2024 |
| SCHEDULE OF INVESTMENTS |
| COMMON STOCKS — 98.7% |
| Shares | Value | |||||||
| Communications — 4.7% | ||||||||
| Internet Media & Services — 2.7% | ||||||||
| Alphabet, Inc. - Class A | 3,532 | $ | 604,360 | |||||
| Telecommunications — 2.0% | ||||||||
| T-Mobile US, Inc. | 2,066 | 461,049 | ||||||
| Consumer Discretionary — 3.2% | ||||||||
| Leisure Facilities & Services — 1.5% | ||||||||
| Domino’s Pizza, Inc. | 808 | 334,294 | ||||||
| Retail - Discretionary — 1.7% | ||||||||
| O’Reilly Automotive, Inc. (a) | 339 | 390,914 | ||||||
| Consumer Staples — 5.8% | ||||||||
| Beverages — 1.9% | ||||||||
| PepsiCo, Inc. | 2,625 | 435,960 | ||||||
| Household Products — 1.9% | ||||||||
| Church & Dwight Company, Inc. | 4,223 | 421,920 | ||||||
| Retail - Consumer Staples — 2.0% | ||||||||
| BJ’s Wholesale Club Holdings, Inc. (a) | 5,336 | 452,119 | ||||||
| Energy — 7.8% | ||||||||
| Oil & Gas Producers — 7.8% | ||||||||
| Chevron Corporation | 2,996 | 445,865 | ||||||
| ConocoPhillips | 3,848 | 421,510 | ||||||
| Diamondback Energy, Inc. | 2,524 | 446,167 | ||||||
| EOG Resources, Inc. | 3,678 | 448,569 | ||||||
| 1,762,111 | ||||||||
| Financials — 20.1% | ||||||||
| Asset Management — 1.1% | ||||||||
| Apollo Global Management, Inc. | 1,687 | 241,680 | ||||||
| Banking — 11.6% | ||||||||
| Bank of America Corporation | 16,064 | 671,796 | ||||||
| Glacier Bancorp, Inc. | 8,919 | 465,126 | ||||||
| JPMorgan Chase & Company | 2,127 | 472,024 | ||||||
| SouthState Corporation | 3,349 | 326,628 | ||||||
| Wells Fargo & Company | 10,559 | 685,490 | ||||||
| 2,621,064 | ||||||||
| COMMON STOCKS — continued |
| Shares | Value | |||||||
| Financials — continued | ||||||||
| Insurance — 5.9% | ||||||||
| American International Group, Inc. | 6,101 | $ | 462,944 | |||||
| Baldwin Insurance Group, Inc. (The) (a) | 4,159 | 192,396 | ||||||
| International General Insurance Holdings Ltd. | 16,442 | 366,163 | ||||||
| Progressive Corporation (The) | 1,228 | 298,195 | ||||||
| 1,319,698 | ||||||||
| Specialty Finance — 1.5% | ||||||||
| Discover Financial Services | 2,324 | 344,951 | ||||||
| Health Care — 13.1% | ||||||||
| Biotech & Pharma — 2.9% | ||||||||
| Johnson & Johnson | 4,114 | 657,664 | ||||||
| Health Care Facilities & Services — 3.7% | ||||||||
| McKesson Corporation | 392 | 196,231 | ||||||
| UnitedHealth Group, Inc. | 1,143 | 645,224 | ||||||
| 841,455 | ||||||||
| Medical Equipment & Devices — 6.5% | ||||||||
| Abbott Laboratories | 5,015 | 568,551 | ||||||
| Danaher Corporation | 2,085 | 512,201 | ||||||
| Teleflex, Inc. | 1,855 | 372,966 | ||||||
| 1,453,718 | ||||||||
| Industrials — 15.1% | ||||||||
| Aerospace & Defense — 4.1% | ||||||||
| General Dynamics Corporation | 1,461 | 426,042 | ||||||
| L3Harris Technologies, Inc. | 2,015 | 498,652 | ||||||
| 924,694 | ||||||||
| Diversified Industrials — 2.0% | ||||||||
| Honeywell International, Inc. | 2,194 | 451,262 | ||||||
| Electrical Equipment — 4.9% | ||||||||
| BWX Technologies, Inc. | 1,870 | 227,672 | ||||||
| Hubbell, Inc. | 1,041 | 444,538 | ||||||
| Littelfuse, Inc. | 1,720 | 420,764 | ||||||
| 1,092,974 | ||||||||
| Transportation & Logistics — 2.8% | ||||||||
| FedEx Corporation | 852 | 233,321 | ||||||
| XPO, Inc. (a) | 3,038 | 396,550 | ||||||
| 629,871 | ||||||||
| Transportation Equipment — 1.3% | ||||||||
| Blue Bird Corporation (a) | 7,174 | 302,097 | ||||||
| Materials — 2.4% | ||||||||
| Construction Materials — 2.4% | ||||||||
| Summit Materials, Inc. - Class A (a) | 11,293 | 535,401 | ||||||
The accompanying notes are an integral part of the financial statements.
9
| WESTWOOD QUALITY ALLCAP FUND |
| OCTOBER 31, 2024 |
| COMMON STOCKS — continued |
| Shares | Value | |||||||
| Real Estate — 5.8% | ||||||||
| REITs — 5.8% | ||||||||
| American Tower Corporation | 2,207 | $ | 471,283 | |||||
| Americold Realty Trust, Inc. | 14,490 | 372,103 | ||||||
| Ventas, Inc. | 7,163 | 469,105 | ||||||
| 1,312,491 | ||||||||
| Technology — 14.8% | ||||||||
| Software — 7.2% | ||||||||
| Microsoft Corporation | 1,329 | 540,039 | ||||||
| Salesforce, Inc. | 1,783 | 519,513 | ||||||
| Verra Mobility Corporation (a) | 8,423 | 218,745 | ||||||
| Zuora, Inc. - Class A (a) | 33,379 | 330,452 | ||||||
| 1,608,749 | ||||||||
| Technology Hardware — 3.3% | ||||||||
| Apple, Inc. | 1,469 | 331,862 | ||||||
| HP, Inc. | 11,705 | 415,762 | ||||||
| 747,624 | ||||||||
| Technology Services — 4.3% | ||||||||
| Accenture plc - Class A | 1,370 | 472,403 | ||||||
| CACI International, Inc. - Class A (a) | 894 | 493,989 | ||||||
| 966,392 | ||||||||
| Utilities — 5.9% | ||||||||
| Electric Utilities — 5.9% | ||||||||
| CMS Energy Corporation | 6,297 | 438,334 | ||||||
| Southern Company (The) | 4,919 | 447,777 | ||||||
| WEC Energy Group, Inc. | 4,610 | 440,393 | ||||||
| 1,326,504 | ||||||||
| Total Common Stocks | ||||||||
| (Cost $19,110,186) | $ | 22,241,016 | ||||||
| MONEY MARKET FUNDS — 1.3% |
| Shares | Value | |||||||
| First American Treasury Obligations Fund - Class X, 4.74% (b) (Cost $285,547) | 285,547 | $ | 285,547 | |||||
| Investments at Value — 100.0% | ||||||||
| (Cost $19,395,733) | $ | 22,526,563 | ||||||
| Other Assets in Excess of Liabilities — 0.0% (c) | 9,418 | |||||||
| Net Assets — 100.0% | $ | 22,535,981 | ||||||
plc - Public Limited Company
| (a) | Non-income producing security. |
| (b) | The rate shown is the 7-day effective yield as of October 31, 2024. |
| (c) | Percentage rounds to less than 0.1%. |
The accompanying notes are an integral part of the financial statements.
10
| WESTWOOD INCOME OPPORTUNITY FUND |
| OCTOBER 31, 2024 |
| SCHEDULE OF INVESTMENTS |
| U.S. GOVERNMENT & AGENCIES — 10.9% |
| Coupon | Maturity | Par Value | Value | |||||||||
| U.S. Treasury Notes — 3.5% | ||||||||||||
| U.S. Treasury Notes | 4.500% | 05/31/29 | $ | 4,500,000 | $ | 4,563,809 | ||||||
| U.S. Treasury Notes | 4.125% | 11/15/32 | 2,560,000 | 2,540,700 | ||||||||
| U.S. Treasury Notes | 4.000% | 02/15/34 | 2,000,000 | 1,956,875 | ||||||||
| U.S. Treasury Notes | 4.375% | 05/15/34 | 8,880,000 | 8,943,825 | ||||||||
| 18,005,209 | ||||||||||||
| U.S. Treasury Bonds — 7.4% | ||||||||||||
| U.S. Treasury Bonds | 4.000% | 11/15/42 | 4,875,000 | 4,545,938 | ||||||||
| U.S. Treasury Bonds | 3.875% | 05/15/43 | 4,750,000 | 4,331,963 | ||||||||
| U.S. Treasury Bonds | 4.375% | 08/15/43 | 5,250,000 | 5,120,801 | ||||||||
| U.S. Treasury Bonds | 4.000% | 11/15/52 | 5,180,000 | 4,763,779 | ||||||||
| U.S. Treasury Bonds | 4.125% | 08/15/53 | 2,480,000 | 2,332,363 | ||||||||
| U.S. Treasury Bonds | 4.750% | 11/15/53 | 5,030,000 | 5,250,062 | ||||||||
| U.S. Treasury Bonds | 4.625% | 05/15/54 | 10,790,000 | 11,051,319 | ||||||||
| U.S. Treasury Bonds | 4.250% | 08/15/54 | 1,250,000 | 1,203,906 | ||||||||
| 38,600,131 | ||||||||||||
| Total U.S. Government & Agencies | ||||||||||||
| (Cost $56,891,946) | $ | 56,605,340 | ||||||||||
| COLLATERALIZED MORTGAGE OBLIGATIONS — 2.6% | ||||||||||||
| Federal Home Loan Mortgage Corporation — 1.5% | ||||||||||||
| FHLMC, Pool #SD8275 | 4.500% | 12/01/52 | $ | 2,662,510 | $ | 2,531,648 | ||||||
| FHLMC, Pool #SD8288 | 5.000% | 01/01/53 | 2,589,401 | 2,519,282 | ||||||||
| FHLMC, Pool #SD2605 | 5.500% | 04/01/53 | 2,617,113 | 2,596,286 | ||||||||
| 7,647,216 | ||||||||||||
| Federal National Mortgage Association — 1.1% | ||||||||||||
| FNMA, Pool #FS3394 | 4.000% | 10/01/52 | 2,787,776 | 2,584,137 | ||||||||
| FNMA, Pool #MA5192 | 6.500% | 11/01/53 | 3,279,335 | 3,346,742 | ||||||||
| 5,930,879 | ||||||||||||
| Total Collateralized Mortgage Obligations | ||||||||||||
| (Cost $13,673,641) | $ | 13,578,095 | ||||||||||
| CONVERTIBLE BONDS — 5.8% | ||||||||||||
| Consumer Discretionary — 1.1% | ||||||||||||
| Live Nation Entertainment, Inc. | 3.125% | 01/15/29 | $ | 2,175,000 | $ | 2,766,407 | ||||||
| Meritage Homes Corporation, 144A | 1.750% | 05/15/28 | 2,680,000 | 2,844,820 | ||||||||
| 5,611,227 | ||||||||||||
| Energy — 0.4% | ||||||||||||
| Northern Oil & Gas, Inc. | 3.625% | 04/15/29 | 1,950,000 | 2,253,225 | ||||||||
| Health Care — 1.6% | ||||||||||||
| Exact Sciences Corporation | 0.375% | 03/15/27 | 2,273,000 | 2,191,172 | ||||||||
| Integer Holdings Corporation | 2.125% | 02/15/28 | 2,575,000 | 3,908,849 | ||||||||
| Merit Medical Systems, Inc., 144A | 3.000% | 02/01/29 | 2,100,000 | 2,718,450 | ||||||||
| 8,818,471 | ||||||||||||
The accompanying notes are an integral part of the financial statements.
11
| WESTWOOD INCOME OPPORTUNITY FUND |
| OCTOBER 31, 2024 |
| CONVERTIBLE BONDS — continued |
| Coupon | Maturity | Par Value | Value | |||||||||
| Real Estate — 0.5% | ||||||||||||
| Corporate Office Properties, L.P., 144A | 5.250% | 09/15/28 | $ | 2,045,000 | $ | 2,442,753 | ||||||
| Technology — 0.8% | ||||||||||||
| Akamai Technologies, Inc. | 0.125% | 05/01/25 | 3,583,000 | 3,987,879 | ||||||||
| Utilities — 1.4% | ||||||||||||
| CenterPoint Energy, Inc. | 4.250% | 08/15/26 | 3,615,000 | 3,640,305 | ||||||||
| NextEra Energy Capital Holdings, Inc., 144A | 3.000% | 03/01/27 | 2,920,000 | 3,622,260 | ||||||||
| 7,262,565 | ||||||||||||
| Total Convertible Bonds | ||||||||||||
| (Cost $27,322,393) | $ | 30,376,120 | ||||||||||
| CORPORATE BONDS — 29.3% | ||||||||||||
| Communications — 2.8% | ||||||||||||
| América Móvil S.A.B. de C.V., 144A | 5.375% | 04/04/32 | $ | 3,050,000 | $ | 2,925,224 | ||||||
| Charter Communications Operating, LLC | 6.384% | 10/23/35 | 2,430,000 | 2,430,323 | ||||||||
| Charter Communications Operating, LLC | 6.484% | 10/23/45 | 4,950,000 | 4,676,576 | ||||||||
| Connect Finco SARL / Connect U.S. Finco, LLC, 144A | 9.000% | 09/15/29 | 2,585,000 | 2,455,594 | ||||||||
| Level 3 Financing, Inc., 144A | 10.500% | 05/15/30 | 1,750,000 | 1,908,900 | ||||||||
| 14,396,617 | ||||||||||||
| Consumer Discretionary — 0.3% | ||||||||||||
| Aptiv plc / Aptiv Global Financing DAC | 6.875% | 12/15/54 | 1,810,000 | 1,762,081 | ||||||||
| Consumer Staples — 1.5% | ||||||||||||
| BAT Capital Corporation | 7.750% | 10/19/32 | 3,576,000 | 4,108,573 | ||||||||
| Pilgrim’s Pride Corporation | 6.250% | 07/01/33 | 3,720,000 | 3,862,015 | ||||||||
| 7,970,588 | ||||||||||||
| Energy — 3.9% | ||||||||||||
| Columbia Pipelines Operating Company, LLC, 144A | 6.544% | 11/15/53 | 3,705,000 | 3,987,226 | ||||||||
| Diamondback Energy, Inc. | 5.900% | 04/18/64 | 2,490,000 | 2,411,933 | ||||||||
| Energy Transfer, L.P. (H15T5Y + 531) (a)(b) | 7.125% | 05/15/65 | 4,455,000 | 4,528,552 | ||||||||
| Sempra Energy | 5.500% | 08/01/33 | 4,040,000 | 4,123,225 | ||||||||
| Sempra Energy | 6.400% | 10/01/54 | 2,430,000 | 2,422,791 | ||||||||
| TransCanada Trust | 5.600% | 03/07/82 | 2,918,000 | 2,785,413 | ||||||||
| 20,259,140 | ||||||||||||
| Financials — 13.7% | ||||||||||||
| Ally Financial, Inc. | 6.992% | 06/13/29 | 3,175,000 | 3,314,502 | ||||||||
| Ares Capital Corporation | 7.000% | 01/15/27 | 4,210,000 | 4,349,895 | ||||||||
| Bank of Nova Scotia, Series 4 | 8.625% | 10/27/82 | 3,270,000 | 3,503,273 | ||||||||
| Barclays plc | 7.385% | 11/02/28 | 2,845,000 | 3,027,432 | ||||||||
| Barclays plc (b) | 8.000% | 12/31/49 | 3,150,000 | 3,255,900 | ||||||||
| Capital One Financial Corporation (SOFR + 307) (a)(b) | 7.624% | 10/30/31 | 2,560,000 | 2,843,499 | ||||||||
| Citigroup, Inc. (a) | 6.174% | 05/25/34 | 2,065,000 | 2,140,049 | ||||||||
| Citigroup, Inc. (a)(b) | 7.200% | 12/31/49 | 3,330,000 | 3,465,707 | ||||||||
| Farmers Exchange Capital, 144A | 7.050% | 07/15/28 | 3,670,000 | 3,824,362 | ||||||||
The accompanying notes are an integral part of the financial statements.
12
| WESTWOOD INCOME OPPORTUNITY FUND |
| OCTOBER 31, 2024 |
| CORPORATE BONDS — continued |
| Coupon | Maturity | Par Value | Value | |||||||||
| Financials — continued | ||||||||||||
| Five Corners Funding Trust IV, 144A | 5.997% | 02/15/53 | $ | 1,925,000 | $ | 2,026,286 | ||||||
| HSBC Holdings plc (b) | 8.000% | 12/31/49 | 3,455,000 | 3,625,224 | ||||||||
| Intesa Sanpaolo S.p.A., 144A | 7.778% | 06/20/54 | 2,150,000 | 2,369,026 | ||||||||
| JPMorgan Chase & Company (a) | 5.299% | 07/24/29 | 3,396,000 | 3,446,532 | ||||||||
| Lincoln National Corporation (b) | 9.250% | 12/31/49 | 2,065,000 | 2,247,930 | ||||||||
| Morgan Stanley, Series I | 6.296% | 10/18/28 | 2,385,000 | 2,484,416 | ||||||||
| Morgan Stanley, Series F (SOFR + 262) (a) | 5.942% | 02/07/39 | 1,830,000 | 1,856,506 | ||||||||
| National Australia Bank Ltd., 144A | 6.429% | 01/12/33 | 2,870,000 | 3,061,115 | ||||||||
| Penske Truck Leasing Company, L.P. / PTL Finance Corporation, 144A | 6.200% | 06/15/30 | 2,815,000 | 2,973,222 | ||||||||
| RenaissanceRe Holdings Ltd. | 5.750% | 06/05/33 | 2,440,000 | 2,476,900 | ||||||||
| Sixth Street Lending Partners, 144A | 5.750% | 01/15/30 | 2,085,000 | 2,032,452 | ||||||||
| State Street Corporation (a)(b) | 6.700% | 12/31/49 | 5,470,000 | 5,632,530 | ||||||||
| U.S. Bancorp (a)(b) | 3.700% | 12/31/49 | 4,025,000 | 3,773,432 | ||||||||
| Wells Fargo & Company, Series W | 5.198% | 01/23/30 | 3,595,000 | 3,629,324 | ||||||||
| 71,359,514 | ||||||||||||
| Health Care — 1.5% | ||||||||||||
| Community Health Systems, Inc., 144A | 10.875% | 01/15/32 | 2,675,000 | 2,868,129 | ||||||||
| Flex Ltd. | 6.000% | 01/15/28 | 2,735,000 | 2,803,114 | ||||||||
| Mylan, Inc. | 5.200% | 04/15/48 | 2,650,000 | 2,218,240 | ||||||||
| 7,889,483 | ||||||||||||
| Industrials — 0.6% | ||||||||||||
| Regal Rexnord Corporation | 6.300% | 02/15/30 | 3,050,000 | 3,157,603 | ||||||||
| Materials — 1.0% | ||||||||||||
| Celanese US Holdings, LLC | 6.350% | 11/15/28 | 5,200,000 | 5,379,442 | ||||||||
| Real Estate — 0.9% | ||||||||||||
| Kimco Realty OP, LLC | 4.850% | 03/01/35 | 2,545,000 | 2,445,125 | ||||||||
| MPT Operating Partnership, L.P. | 4.625% | 08/01/29 | 3,000,000 | 2,331,611 | ||||||||
| 4,776,736 | ||||||||||||
| Technology — 1.5% | ||||||||||||
| Dell International, LLC / EMC Corporation | 8.350% | 07/15/46 | 1,314,000 | 1,717,710 | ||||||||
| Oracle Corporation | 6.900% | 11/09/52 | 2,075,000 | 2,388,977 | ||||||||
| TIBCO Software, Inc., 144A | 6.500% | 03/31/29 | 3,675,000 | 3,588,248 | ||||||||
| 7,694,935 | ||||||||||||
| Utilities — 1.6% | ||||||||||||
| NextEra Energy Capital Holdings, Inc., Series R | 6.750% | 06/15/54 | 3,090,000 | 3,236,092 | ||||||||
| Piedmont Natural Gas Company, Inc. | 5.050% | 05/15/52 | 2,166,000 | 1,983,987 | ||||||||
| Southern Company, Series 2023E | 5.700% | 03/15/34 | 2,770,000 | 2,880,642 | ||||||||
| 8,100,721 | ||||||||||||
| Total Corporate Bonds | ||||||||||||
| (Cost $146,372,210) | $ | 152,746,860 | ||||||||||
The accompanying notes are an integral part of the financial statements.
13
| WESTWOOD INCOME OPPORTUNITY FUND |
| OCTOBER 31, 2024 |
| COMMON STOCKS — 43.9% |
| Shares | Value | |||||||
| Communications — 0.7% | ||||||||
| Internet Media & Services — 0.7% | ||||||||
| Alphabet, Inc. - Class A | 22,802 | $ | 3,901,650 | |||||
| Consumer Discretionary — 3.8% | ||||||||
| Apparel & Textile Products — 1.1% | ||||||||
| Tapestry, Inc. | 116,642 | 5,534,663 | ||||||
| E-Commerce Discretionary — 0.6% | ||||||||
| JD.com, Inc. - ADR | 75,842 | 3,080,702 | ||||||
| Leisure Facilities & Services — 0.5% | ||||||||
| Domino’s Pizza, Inc. | 6,743 | 2,789,781 | ||||||
| Retail - Discretionary — 1.6% | ||||||||
| Lowe’s Companies, Inc. | 31,330 | 8,203,134 | ||||||
| Consumer Staples — 1.8% | ||||||||
| Retail - Consumer Staples — 1.8% | ||||||||
| Walmart, Inc. | 117,434 | 9,623,716 | ||||||
| Energy — 4.1% | ||||||||
| Oil & Gas Producers — 3.3% | ||||||||
| Chord Energy Corporation | 39,913 | 4,993,116 | ||||||
| Energy Transfer, L.P. | 591,931 | 9,755,023 | ||||||
| Hess Corporation | 18,045 | 2,426,692 | ||||||
| 17,174,831 | ||||||||
| Oil & Gas Services & Equipment — 0.8% | ||||||||
| Schlumberger Ltd. | 106,074 | 4,250,385 | ||||||
| Financials — 6.8% | ||||||||
| Banking — 3.3% | ||||||||
| JPMorgan Chase & Company | 53,263 | 11,820,125 | ||||||
| Wells Fargo & Company | 80,085 | 5,199,118 | ||||||
| 17,019,243 | ||||||||
| Institutional Financial Services — 1.8% | ||||||||
| Goldman Sachs Group, Inc. (The) | 18,117 | 9,380,801 | ||||||
| Insurance — 0.8% | ||||||||
| American International Group, Inc. | 56,761 | 4,307,025 | ||||||
| Specialty Finance — 0.9% | ||||||||
| Discover Financial Services | 31,365 | 4,655,507 | ||||||
| Health Care — 4.1% | ||||||||
| Biotech & Pharma — 1.7% | ||||||||
| Gilead Sciences, Inc. | 97,287 | 8,641,031 | ||||||
| COMMON STOCKS — continued |
| Shares | Value | |||||||
| Health Care — continued | ||||||||
| Medical Equipment & Devices — 2.4% | ||||||||
| Abbott Laboratories | 38,698 | $ | 4,387,192 | |||||
| Becton, Dickinson & Company | 16,764 | 3,915,903 | ||||||
| Medtronic plc | 51,840 | 4,626,720 | ||||||
| 12,929,815 | ||||||||
| Industrials — 4.3% | ||||||||
| Aerospace & Defense — 0.8% | ||||||||
| General Dynamics Corporation | 14,687 | 4,282,876 | ||||||
| Diversified Industrials — 1.2% | ||||||||
| Honeywell International, Inc. | 29,886 | 6,146,952 | ||||||
| Electrical Equipment — 1.0% | ||||||||
| Littelfuse, Inc. | 20,519 | 5,019,563 | ||||||
| Transportation & Logistics — 1.3% | ||||||||
| FedEx Corporation | 24,885 | 6,814,758 | ||||||
| Materials — 1.3% | ||||||||
| Metals & Mining — 1.3% | ||||||||
| Barrick Gold Corporation | 133,015 | 2,569,850 | ||||||
| Glencore plc - ADR | 405,752 | 4,236,051 | ||||||
| 6,805,901 | ||||||||
| Real Estate — 5.9% | ||||||||
| REITs — 5.9% | ||||||||
| Crown Castle, Inc. | 50,060 | 5,380,949 | ||||||
| Essex Property Trust, Inc. | 15,308 | 4,345,329 | ||||||
| Federal Realty Investment Trust | 39,171 | 4,341,714 | ||||||
| NNN REIT, Inc. | 80,312 | 3,488,753 | ||||||
| PotlatchDeltic Corporation | 88,935 | 3,697,028 | ||||||
| Public Storage | 12,297 | 4,046,451 | ||||||
| Ventas, Inc. | 84,489 | 5,533,185 | ||||||
| 30,833,409 | ||||||||
| Technology — 8.4% | ||||||||
| Semiconductors — 1.9% | ||||||||
| Micron Technology, Inc. | 28,855 | 2,875,401 | ||||||
| NVIDIA Corporation (d) | 29,248 | 3,882,965 | ||||||
| Taiwan Semiconductor Manufacturing Company Ltd. - ADR | 17,562 | 3,346,263 | ||||||
| 10,104,629 | ||||||||
| Software — 2.7% | ||||||||
| Microsoft Corporation | 26,434 | 10,741,456 | ||||||
| Salesforce, Inc. (d) | 10,446 | 3,043,651 | ||||||
| 13,785,107 | ||||||||
The accompanying notes are an integral part of the financial statements.
14
| WESTWOOD INCOME OPPORTUNITY FUND |
| OCTOBER 31, 2024 |
| COMMON STOCKS — continued |
| Shares | Value | |||||||
| Technology — continued | ||||||||
| Technology Hardware — 2.4% | ||||||||
| Apple, Inc. | 33,971 | $ | 7,674,389 | |||||
| Cisco Systems, Inc. | 81,609 | 4,469,725 | ||||||
| 12,144,114 | ||||||||
| Technology Services — 1.4% | ||||||||
| International Business Machines Corporation | 34,382 | 7,107,447 | ||||||
| Utilities — 2.7% | ||||||||
| Electric Utilities — 2.7% | ||||||||
| Alliant Energy Corporation | 55,778 | 3,346,680 | ||||||
| Enterprise Products Partners, L.P. | 149,667 | 4,289,456 | ||||||
| WEC Energy Group, Inc. | 68,470 | 6,540,939 | ||||||
| 14,177,075 | ||||||||
| Total Common Stocks | ||||||||
| (Cost $177,441,227) | $ | 228,714,115 | ||||||
| EXCHANGE-TRADED FUNDS — 3.9% | ||||||||
| iShares Core S&P Mid-Cap ETF | 86,918 | $ | 5,380,224 | |||||
| JPMorgan Equity Premium Income ETF | 113,097 | 6,637,663 | ||||||
| JPMorgan Nasdaq Equity Premium Income ETF | 152,337 | 8,314,554 | ||||||
| Total Exchange-Traded Funds | ||||||||
| (Cost $18,097,834) | $ | 20,332,441 | ||||||
| PREFERRED STOCKS — 2.8% | ||||||||
| Industrials — 0.7% | ||||||||
| Aerospace & Defense — 0.7% | ||||||||
| Boeing Company (The), 6.00%, 10/15/2027 (c) | 71,350 | $ | 3,833,636 | |||||
| Materials — 0.4% | ||||||||
| Chemicals — 0.4% | ||||||||
| Albemarle Corporation, 7.25%, 03/01/2027 | 41,387 | 1,852,068 | ||||||
| Technology — 1.2% | ||||||||
| Technology Hardware — 1.2% | ||||||||
| Hewlett Packard Enterprise Company, 7.63%, 09/01/2027 (c) | 105,200 | 6,085,820 | ||||||
| Utilities — 0.5% | ||||||||
| Electric Utilities — 0.5% | ||||||||
| NextEra Energy, Inc., 7.23%, 11/01/2027 (c) | 55,400 | 2,700,750 | ||||||
| Total Preferred Stocks | ||||||||
| (Cost $13,941,211) | $ | 14,472,274 | ||||||
| MONEY MARKET FUNDS — 0.3% |
| Shares | Value | |||||||
| First American Government Obligations Fund - Class U, 4.80% (e) (Cost $1,593,085) | 1,593,085 | $ | 1,593,085 | |||||
| Investments at Value — 99.5% | ||||||||
| (Cost $455,333,547) | $ | 518,418,330 | ||||||
| Other Assets in Excess of Liabilities — 0.5% | 2,914,980 | |||||||
| Net Assets — 100.0% | $ | 521,333,310 | ||||||
144A - Security was purchased in a transaction exempt from registration in compliance with Rule 144A of the Securities Act of 1933. This security may be resold in transactions exempt from registration, normally to qualified institutional buyers. The total value of such securities is $45,648,067 as of October 31, 2024, representing 8.8% of net assets.
ADR - American Depositary Receipt
plc - Public Limited Company
REIT - Real Estate Investment Trust
S.A.B. de C.V. - Societa per azioni
SOFR - Secured Overnight Financing Rate.
| (a) | Variable rate security. Interest rate resets periodically. The rate shown is the effective interest rate as of October 31, 2024. For securities based on a published reference rate and spread, the reference rate and spread (in basis points) are indicated parenthetically. Certain variable rate securities are not based on a published reference rate and spread but are determined by the issuer or agent and are based on current market conditions. These securities, therefore, do not indicate a reference rate and spread. |
| (b) | Security has a perpetual maturity date. |
| (c) | Non-income producing security. |
| (d) | All or a portion of the security covers a written call option. The total value of securities as of October 31, 2024 was $6,926,616. |
| (e) | The rate shown is the 7-day effective yield as of October 31, 2024. |
The accompanying notes are an integral part of the financial statements.
15
| WESTWOOD INCOME OPPORTUNITY FUND |
| OCTOBER 31, 2024 |
| SCHEDULE OF OPEN WRITTEN OPTION CONTRACTS |
| Strike | Notional | Value of | ||||||||||||
| Price | Contracts | Value | Options | |||||||||||
| Call Option Contracts | ||||||||||||||
| NVIDIA Corporation, 12/20/24 | $ | 142.00 | 292 | $ | 3,876,592 | $ | 237,980 | |||||||
| Salesforce, Inc., 12/20/24 | 300.00 | 100 | 2,913,700 | 130,500 | ||||||||||
| Total Written Option Contracts | ||||||||||||||
| (Premiums $287,520) | $ | 6,790,292 | $ | 368,480 | ||||||||||
The average monthly notional value of written option contracts during the year ended October 31, 2024 was $1,499,153.
The accompanying notes are an integral part of the financial statements.
16
| WESTWOOD MULTI-ASSET INCOME FUND |
| OCTOBER 31, 2024 |
| SCHEDULE OF INVESTMENTS |
| U.S. GOVERNMENT & AGENCIES — 5.8% |
| Coupon | Maturity | Par Value | Value | |||||||||
| U.S. Treasury Bonds — 5.8% | ||||||||||||
| U.S. Treasury Bonds | 3.000% | 08/15/52 | $ | 1,200,000 | $ | 910,922 | ||||||
| U.S. Treasury Bonds | 4.750% | 11/15/53 | 1,800,000 | 1,878,750 | ||||||||
| U.S. Treasury Bonds | 4.250% | 02/15/54 | 2,950,000 | 2,838,453 | ||||||||
| Total U.S. Government & Agencies | ||||||||||||
| (Cost $5,680,736) | $ | 5,628,125 | ||||||||||
| COLLATERALIZED MORTGAGE OBLIGATIONS — 2.0% | ||||||||||||
| Federal Home Loan Mortgage Corporation — 1.5% | ||||||||||||
| FHLMC, Pool #SD8275 | 4.500% | 12/01/52 | $ | 496,704 | $ | 472,291 | ||||||
| FHLMC, Pool #SD8288 | 5.000% | 01/01/53 | 483,296 | 470,208 | ||||||||
| FHLMC, Pool #SD2605 | 5.500% | 04/01/53 | 490,709 | 486,804 | ||||||||
| 1,429,303 | ||||||||||||
| Federal National Mortgage Association — 0.5% | ||||||||||||
| FNMA, Pool #FS3394 | 4.000% | 10/01/52 | 520,994 | 482,937 | ||||||||
| Total Collateralized Mortgage Obligations | ||||||||||||
| (Cost $1,941,282) | $ | 1,912,240 | ||||||||||
| CORPORATE BONDS — 61.7% | ||||||||||||
| Communications — 9.3% | ||||||||||||
| América Móvil S.A.B. de C.V., 144A | 5.375% | 04/04/32 | $ | 360,000 | $ | 345,272 | ||||||
| Charter Communications Operating, LLC | 6.384% | 10/23/35 | 1,000,000 | 1,000,133 | ||||||||
| Clear Channel Outdoor Holdings, Inc., 144A | 9.000% | 09/15/28 | 1,000,000 | 1,050,390 | ||||||||
| Connect Finco SARL / Connect U.S. Finco, LLC, 144A | 9.000% | 09/15/29 | 1,420,000 | 1,348,915 | ||||||||
| CSC Holdings, LLC, 144A | 11.250% | 05/15/28 | 1,000,000 | 975,235 | ||||||||
| DIRECTV Financing, LLC, 144A | 8.875% | 02/01/30 | 1,050,000 | 1,036,337 | ||||||||
| DISH Network Corporation, 144A | 11.750% | 11/15/27 | 1,000,000 | 1,052,617 | ||||||||
| Level 3 Financing, Inc., 144A | 10.500% | 05/15/30 | 1,000,000 | 1,090,800 | ||||||||
| Telesat Canada / Telesat, LLC, 144A | 4.875% | 06/01/27 | 1,500,000 | 656,101 | ||||||||
| Vodafone Group plc | 4.875% | 06/19/49 | 500,000 | 441,669 | ||||||||
| 8,997,469 | ||||||||||||
| Consumer Discretionary — 5.5% | ||||||||||||
| AMC Entertainment Holdings, Inc., 144A | 7.500% | 02/15/29 | 750,000 | 646,653 | ||||||||
| Aptiv plc / Aptiv Global Financing DAC | 6.875% | 12/15/54 | 570,000 | 554,909 | ||||||||
| Darden Restaurants, Inc. | 4.550% | 02/15/48 | 790,000 | 651,029 | ||||||||
| Ford Motor Credit Company, LLC | 7.450% | 07/16/31 | 1,000,000 | 1,082,979 | ||||||||
| Magic Mergeco, Inc., 144A | 5.250% | 05/01/28 | 500,000 | 359,691 | ||||||||
| Odeon Finco plc, 144A | 12.750% | 11/01/27 | 1,000,000 | 1,052,694 | ||||||||
| Staples, Inc., 144A | 10.750% | 09/01/29 | 1,000,000 | 969,583 | ||||||||
| 5,317,538 | ||||||||||||
| Consumer Staples — 1.2% | ||||||||||||
| BAT Capital Corporation | 7.750% | 10/19/32 | 552,000 | 634,209 | ||||||||
| US Foods, Inc., 144A | 6.875% | 09/15/28 | 531,000 | 545,874 | ||||||||
| 1,180,083 | ||||||||||||
The accompanying notes are an integral part of the financial statements.
17
| WESTWOOD MULTI-ASSET INCOME FUND |
| OCTOBER 31, 2024 |
| CORPORATE BONDS — continued |
| Coupon | Maturity | Par Value | Value | |||||||||
| Energy — 9.3% | ||||||||||||
| CVR Energy, Inc., 144A | 8.500% | 01/15/29 | $ | 1,000,000 | $ | 969,810 | ||||||
| Diamondback Energy, Inc. | 5.900% | 04/18/64 | 460,000 | 445,578 | ||||||||
| Energy Transfer, L.P. (H15T5Y + 531) (a)(b) | 7.125% | 05/15/65 | 825,000 | 838,621 | ||||||||
| FTAI Infra Escrow Holdings, LLC, 144A | 10.500% | 06/01/27 | 1,000,000 | 1,067,513 | ||||||||
| Global Partners, L.P. / GLP Finance Corporation, 144A | 8.250% | 01/15/32 | 500,000 | 510,153 | ||||||||
| Golar LNG Ltd., 144A | 7.750% | 09/19/29 | 1,000,000 | 998,373 | ||||||||
| Martin Midstream Partners, L.P., 144A | 11.500% | 02/15/28 | 1,000,000 | 1,088,707 | ||||||||
| NGL Energy Operating, LLC / NGL Energy Finance Corporation, 144A | 8.125% | 02/15/29 | 1,000,000 | 1,007,314 | ||||||||
| Paratus Energy Services Ltd. | 9.500% | 06/27/29 | 200,000 | 199,469 | ||||||||
| Sempra Energy | 5.500% | 08/01/33 | 785,000 | 801,171 | ||||||||
| Sempra Energy (a) | 6.400% | 10/01/54 | 450,000 | 448,665 | ||||||||
| Summit Midstream Holdings, LLC, 144A | 8.625% | 10/31/29 | 100,000 | 103,327 | ||||||||
| TransCanada Trust | 5.600% | 03/07/82 | 478,000 | 456,281 | ||||||||
| 8,934,982 | ||||||||||||
| Financials — 10.3% | ||||||||||||
| Ally Financial, Inc. | 6.992% | 06/13/29 | 590,000 | 615,923 | ||||||||
| Ares Capital Corporation | 7.000% | 01/15/27 | 735,000 | 759,424 | ||||||||
| Avation Capital S.A., 144A | 8.250% | 10/31/26 | 1,250,000 | 1,178,763 | ||||||||
| Barclays plc | 7.385% | 11/02/28 | 515,000 | 548,024 | ||||||||
| Blackstone Private Credit Fund | 7.050% | 09/29/25 | 1,000,000 | 1,016,060 | ||||||||
| Blue Owl Credit Income Corporation, 144A | 5.800% | 03/15/30 | 500,000 | 485,690 | ||||||||
| Five Corners Funding Trust IV, 144A | 5.997% | 02/15/53 | 570,000 | 599,991 | ||||||||
| Hercules Capital, Inc. | 2.625% | 09/16/26 | 422,000 | 399,755 | ||||||||
| HSBC Holdings plc | 6.547% | 06/20/34 | 665,000 | 704,765 | ||||||||
| HSBC Holdings plc (b) | 8.000% | 12/31/49 | 615,000 | 645,300 | ||||||||
| Intesa Sanpaolo S.p.A., 144A | 7.778% | 06/20/54 | 360,000 | 396,674 | ||||||||
| Jackson Financial, Inc. | 4.000% | 11/23/51 | 500,000 | 361,256 | ||||||||
| Morgan Stanley, Series F (SOFR + 262) (a) | 5.942% | 02/07/39 | 450,000 | 456,518 | ||||||||
| National Australia Bank Ltd., 144A | 6.429% | 01/12/33 | 485,000 | 517,296 | ||||||||
| RenaissanceRe Holdings Ltd. | 5.750% | 06/05/33 | 230,000 | 233,478 | ||||||||
| Sixth Street Lending Partners, 144A | 5.750% | 01/15/30 | 500,000 | 487,399 | ||||||||
| State Street Corporation (a)(b) | 6.700% | 12/31/49 | 475,000 | 489,114 | ||||||||
| 9,895,430 | ||||||||||||
| Health Care — 1.9% | ||||||||||||
| Community Health Systems, Inc., 144A | 10.875% | 01/15/32 | 1,005,000 | 1,077,559 | ||||||||
| Flex Ltd. | 6.000% | 01/15/28 | 745,000 | 763,554 | ||||||||
| 1,841,113 | ||||||||||||
| Industrials — 8.8% | ||||||||||||
| BLH Escrow 1, LLC, 144A | 11.000% | 01/31/30 | 1,000,000 | 901,495 | ||||||||
| Boeing Company (The) | 5.805% | 05/01/50 | 1,000,000 | 943,963 | ||||||||
| CoreCivic, Inc. | 8.250% | 04/15/29 | 1,000,000 | 1,050,186 | ||||||||
| GEO Group, Inc. | 8.625% | 04/15/29 | 1,000,000 | 1,046,433 | ||||||||
| GEO Group, Inc. | 10.250% | 04/15/31 | 667,000 | 714,823 | ||||||||
| Macquarie AirFinance Holdings Ltd., 144A | 8.375% | 05/01/28 | 1,000,000 | 1,050,752 | ||||||||
| Manitowoc Company, Inc., 144A | 9.250% | 10/01/31 | 250,000 | 254,062 | ||||||||
The accompanying notes are an integral part of the financial statements.
18
| WESTWOOD MULTI-ASSET INCOME FUND |
| OCTOBER 31, 2024 |
| CORPORATE BONDS — continued |
| Coupon | Maturity | Par Value | Value | |||||||||
| Industrials — continued | ||||||||||||
| Rand Parent, LLC, 144A | 8.500% | 02/15/30 | $ | 500,000 | $ | 498,842 | ||||||
| Regal Rexnord Corporation | 6.300% | 02/15/30 | 1,000,000 | 1,035,280 | ||||||||
| XPO, Inc., 144A | 6.250% | 06/01/28 | 1,000,000 | 1,014,983 | ||||||||
| 8,510,819 | ||||||||||||
| Materials — 2.1% | ||||||||||||
| Cleveland-Cliffs, Inc., 144A | 7.000% | 03/15/32 | 1,000,000 | 999,473 | ||||||||
| Rayonier AM Products, Inc., 144A | 7.625% | 01/15/26 | 1,000,000 | 1,001,800 | ||||||||
| 2,001,273 | ||||||||||||
| Real Estate — 7.8% | ||||||||||||
| American Homes 4 Rent, L.P. | 4.300% | 04/15/52 | 1,000,000 | 796,873 | ||||||||
| Iron Mountain, Inc., 144A | 5.000% | 07/15/28 | 500,000 | 487,304 | ||||||||
| Iron Mountain, Inc., 144A | 7.000% | 02/15/29 | 1,000,000 | 1,028,227 | ||||||||
| MPT Operating Partnership, L.P. | 4.625% | 08/01/29 | 1,250,000 | 971,504 | ||||||||
| New Residential Investment Corporation, 144A | 8.000% | 04/01/29 | 1,000,000 | 997,649 | ||||||||
| Office Properties Income Trust, 144A | 9.000% | 09/30/29 | 1,000,000 | 843,986 | ||||||||
| Service Properties Trust | 8.875% | 06/15/32 | 1,500,000 | 1,397,021 | ||||||||
| VICI Properties, L.P. | 5.125% | 05/15/32 | 1,000,000 | 979,513 | ||||||||
| 7,502,077 | ||||||||||||
| Technology — 2.9% | ||||||||||||
| Dell International, LLC / EMC Corporation | 8.350% | 07/15/46 | 342,000 | 447,075 | ||||||||
| Oracle Corporation | 6.900% | 11/09/52 | 320,000 | 368,421 | ||||||||
| Raven Acquisition Holdings, LLC, 144A | 6.875% | 11/15/31 | 1,000,000 | 996,797 | ||||||||
| Sabre Global, Inc., 144A | 11.250% | 12/15/27 | 1,000,000 | 1,031,012 | ||||||||
| 2,843,305 | ||||||||||||
| Utilities — 2.6% | ||||||||||||
| Altice France S.A., 144A | 8.125% | 02/01/27 | 1,000,000 | 828,285 | ||||||||
| Consolidated Edison Company, Inc. | 3.850% | 06/15/46 | 750,000 | 589,255 | ||||||||
| NextEra Energy Capital Holdings, Inc., Series R | 6.750% | 06/15/54 | 570,000 | 596,949 | ||||||||
| Talen Energy Supply, LLC, 144A | 8.625% | 06/01/30 | 500,000 | 539,365 | ||||||||
| 2,553,854 | ||||||||||||
| Total Corporate Bonds | ||||||||||||
| (Cost $59,831,789) | $ | 59,577,943 | ||||||||||
| FOREIGN GOVERNMENTS — 0.7% | ||||||||||||
| Republic of South Africa Government Bonds (Cost $695,000) | 5.875% | 04/20/32 | $ | 695,000 | $ | 667,325 | ||||||
The accompanying notes are an integral part of the financial statements.
19
| WESTWOOD MULTI-ASSET INCOME FUND |
| OCTOBER 31, 2024 |
| COMMON STOCKS — 24.0% |
| Shares | Value | |||||||
| Consumer Discretionary — 1.9% | ||||||||
| Retail - Discretionary — 1.9% | ||||||||
| Lowe’s Companies, Inc. | 3,820 | $ | 1,000,191 | |||||
| TJX Companies, Inc. (The) | 7,473 | 844,673 | ||||||
| 1,844,864 | ||||||||
| Consumer Staples — 1.8% | ||||||||
| Retail - Consumer Staples — 1.2% | ||||||||
| Walmart, Inc. | 13,788 | 1,129,927 | ||||||
| Tobacco & Cannabis — 0.6% | ||||||||
| Altria Group, Inc. | 11,860 | 645,895 | ||||||
| Energy — 1.6% | ||||||||
| Oil & Gas Producers — 1.6% | ||||||||
| Chord Energy Corporation | 3,689 | 461,494 | ||||||
| Devon Energy Corporation | 7,532 | 291,337 | ||||||
| Energy Transfer, L.P. | 49,760 | 820,045 | ||||||
| 1,572,876 | ||||||||
| Financials — 3.4% | ||||||||
| Banking — 1.8% | ||||||||
| Sumitomo Mitsui Financial Group, Inc. - ADR | 42,696 | 545,228 | ||||||
| Truist Financial Corporation | 13,808 | 594,434 | ||||||
| Wells Fargo & Company | 8,824 | 572,854 | ||||||
| 1,712,516 | ||||||||
| Institutional Financial Services — 1.1% | ||||||||
| Goldman Sachs Group, Inc. (The) | 2,026 | 1,049,042 | ||||||
| Specialty Finance — 0.5% | ||||||||
| Discover Financial Services | 3,455 | 512,826 | ||||||
| Health Care — 1.8% | ||||||||
| Biotech & Pharma — 1.3% | ||||||||
| Amgen, Inc. | 1,418 | 453,987 | ||||||
| Gilead Sciences, Inc. | 9,054 | 804,176 | ||||||
| 1,258,163 | ||||||||
| Medical Equipment & Devices — 0.5% | ||||||||
| Abbott Laboratories | 4,092 | 463,910 | ||||||
| Industrials — 1.3% | ||||||||
| Aerospace & Defense — 0.7% | ||||||||
| General Dynamics Corporation | 2,317 | 675,660 | ||||||
| Transportation & Logistics — 0.6% | ||||||||
| FedEx Corporation | 2,023 | 553,999 | ||||||
| COMMON STOCKS — continued |
| Shares | Value | |||||||
| Materials — 0.8% | ||||||||
| Metals & Mining — 0.8% | ||||||||
| Barrick Gold Corporation | 24,271 | $ | 468,916 | |||||
| Glencore plc - ADR | 31,109 | 324,778 | ||||||
| 793,694 | ||||||||
| Real Estate — 4.8% | ||||||||
| REITs — 4.8% | ||||||||
| Crown Castle, Inc. | 4,315 | 463,819 | ||||||
| Essex Property Trust, Inc. | 1,704 | 483,697 | ||||||
| Federal Realty Investment Trust | 4,239 | 469,851 | ||||||
| NNN REIT, Inc. | 13,367 | 580,663 | ||||||
| PotlatchDeltic Corporation | 16,647 | 692,016 | ||||||
| Public Storage | 1,912 | 629,163 | ||||||
| Urban Edge Properties | 30,193 | 671,492 | ||||||
| Ventas, Inc. | 9,147 | 599,037 | ||||||
| 4,589,738 | ||||||||
| Technology — 4.9% | ||||||||
| Semiconductors — 0.5% | ||||||||
| NVIDIA Corporation (c) | 3,600 | 477,936 | ||||||
| Software — 1.5% | ||||||||
| Microsoft Corporation | 2,128 | 864,713 | ||||||
| Salesforce, Inc. (c) | 1,952 | 568,754 | ||||||
| 1,433,467 | ||||||||
| Technology Hardware — 1.9% | ||||||||
| Apple, Inc. | 4,785 | 1,080,979 | ||||||
| Cisco Systems, Inc. | 13,602 | 744,982 | ||||||
| 1,825,961 | ||||||||
| Technology Services — 1.0% | ||||||||
| International Business Machines Corporation | 4,997 | 1,032,980 | ||||||
| Utilities — 1.7% | ||||||||
| Electric Utilities — 1.7% | ||||||||
| Alliant Energy Corporation | 8,891 | 533,460 | ||||||
| Enterprise Products Partners, L.P. | 19,749 | 566,006 | ||||||
| WEC Energy Group, Inc. | 5,495 | 524,938 | ||||||
| 1,624,404 | ||||||||
| Total Common Stocks | ||||||||
| (Cost $18,490,671) | $ | 23,197,858 | ||||||
The accompanying notes are an integral part of the financial statements.
20
| WESTWOOD MULTI-ASSET INCOME FUND |
| OCTOBER 31, 2024 |
| EXCHANGE-TRADED FUNDS — 2.5% |
| Shares | Value | |||||||
| JPMorgan Equity Premium Income ETF | 11,793 | $ | 692,131 | |||||
| JPMorgan Nasdaq Equity Premium Income ETF | 21,700 | 1,184,386 | ||||||
| Westwood Salient Enhanced Energy Income ETF (d) | 21,836 | 494,588 | ||||||
| Total Exchange-Traded Funds | ||||||||
| (Cost $2,135,399) | $ | 2,371,105 | ||||||
| PREFERRED STOCKS — 2.3% | ||||||||
| Industrials — 0.7% | ||||||||
| Aerospace & Defense — 0.7% | ||||||||
| Boeing Company (The), 6.00%, 10/15/2027 (e) | 13,350 | $ | 717,295 | |||||
| Materials — 0.4% | ||||||||
| Chemicals — 0.4% | ||||||||
| Albemarle Corporation, 7.25%, 03/01/2027 | 7,715 | 345,246 | ||||||
| Real Estate — 0.5% | ||||||||
| REITs — 0.5% | ||||||||
| Vinebrook Homes Trust, Inc., 9.50% - Series B (e)(f) | 20,000 | 500,000 | ||||||
| Technology — 0.7% | ||||||||
| Technology Hardware — 0.7% | ||||||||
| Hewlett Packard Enterprise Company, 7.63%, 09/01/2027 (e) | 11,850 | 685,523 | ||||||
| Total Preferred Stocks | ||||||||
| (Cost $2,198,984) | $ | 2,248,064 | ||||||
| WARRANTS — 0.1% | ||||||||
| Communications — 0.1% | ||||||||
| Publishing & Broadcasting — 0.1% | ||||||||
| Audacy 2nd Lien Warrants (f) | 906 | $ | — | |||||
| Audacy 2nd Lien Warrants (f) | 5,433 | — | ||||||
| Audacy Special Warrants (f) | 4,483 | 103,109 | ||||||
| Total Warrants | ||||||||
| (Cost $103,500) | $ | 103,109 | ||||||
| MONEY MARKET FUNDS — 1.2% |
| Shares | Value | |||||||
| First American Government Obligations Fund - Class U, 4.80% (g) (Cost $1,168,062) | 1,168,062 | $ | 1,168,062 | |||||
| Investments at Value — 100.3% | ||||||||
| (Cost $92,245,423) | $ | 96,873,831 | ||||||
| Liabilities in Excess of Other Assets - (0.3%) | (312,786 | ) | ||||||
| Net Assets — 100.0% | $ | 96,561,045 | ||||||
144A - Security was purchased in a transaction exempt from registration in compliance with Rule 144A of the Securities Act of 1933. This security may be resold in transactions exempt from registration, normally to qualified institutional buyers. The total value of such securities is $34,092,763 as of October 31, 2024, representing 35.3% of net assets.
ADR - American Depositary Receipt
plc - Public Limited Company
REIT- Real Estate Investment Trust
S.A. - Societe Anonyme
S.A.B. de C.V. - Societe Anonima Bursatil de Capital Variable
S.p.A. - Societa per azioni
SOFR - Secured Overnight Financing Rate
| (a) | Variable rate security. Interest rate resets periodically. The rate shown is the effective interest rate as of October 31, 2024. For securities based on a published reference rate and spread, the reference rate and spread (in basis points) are indicated parenthetically. Certain variable rate securities are not based on a published reference rate and spread but are determined by the issuer or agent and are based on current market conditions. These securities, therefore, do not indicate a reference rate and spread. |
| (b) | Security has a perpetual maturity date. |
| (c) | All or a portion of the security covers a written call option. The total value of securities as of October 31, 2024 was $1,046,690. |
| (d) | Affiliated fund. |
| (e) | Non-income producing security. |
| (f) | Level 3 security in accordance with fair value hierarchy. |
| (g) | The rate shown is the 7-day effective yield as of October 31, 2024. |
The accompanying notes are an integral part of the financial statements.
21
| WESTWOOD MULTI-ASSET INCOME FUND |
| OCTOBER 31, 2024 |
| SCHEDULE OF OPEN WRITTEN OPTION CONTRACTS |
| Strike | Notional | Value of | ||||||||||||
| Price | Contracts | Value | Options | |||||||||||
| Call Option Contracts | ||||||||||||||
| NVIDIA Corporation, 12/20/24 | $ | 142.00 | 36 | $ | 477,936 | $ | 29,340 | |||||||
| Salesforce, Inc., 12/20/24 | 300.00 | 18 | 524,466 | 23,490 | ||||||||||
| Total Written Option Contracts | ||||||||||||||
| (Premiums $40,075) | $ | 1,002,402 | $ | 52,830 | ||||||||||
The average monthly notional value of written option contracts during the year ended October 31, 2024 was $238,747.
The accompanying notes are an integral part of the financial statements.
22
| WESTWOOD ALTERNATIVE INCOME FUND |
| OCTOBER 31, 2024 |
| SCHEDULE OF INVESTMENTS |
| CONVERTIBLE BONDS — 81.6% |
| Coupon | Maturity | Par Value | Value | |||||||||
| Communications — 3.8% | ||||||||||||
| Liberty Media Corporation - Liberty Formula One, 144A | 2.250% | 08/15/27 | $ | 1,000,000 | $ | 1,106,701 | ||||||
| Trip.com Group Ltd., 144A | 0.750% | 06/15/29 | 1,000,000 | 1,178,000 | ||||||||
| Uber Technologies, Inc., 144A | 0.875% | 12/01/28 | 2,000,000 | 2,410,000 | ||||||||
| 4,694,701 | ||||||||||||
| Consumer Discretionary — 12.8% | ||||||||||||
| Alibaba Group Holding Ltd., 144A | 0.500% | 06/01/31 | 2,000,000 | 2,306,000 | ||||||||
| Etsy, Inc. | 0.125% | 10/01/26 | 1,000,000 | 962,000 | ||||||||
| Ford Motor Company | 0.000% | 03/15/26 | 2,000,000 | 1,942,000 | ||||||||
| JD.com, Inc., 144A | 0.250% | 06/01/29 | 2,000,000 | 2,281,000 | ||||||||
| Live Nation Entertainment, Inc. * | 3.125% | 01/15/29 | 2,000,000 | 2,543,822 | ||||||||
| Meritage Homes Corporation, 144A | 1.750% | 05/15/28 | 1,500,000 | 1,592,250 | ||||||||
| Royal Caribbean Cruises Ltd. | 6.000% | 08/15/25 | 1,000,000 | 4,152,500 | ||||||||
| 15,779,572 | ||||||||||||
| Consumer Staples — 1.9% | ||||||||||||
| Post Holdings, Inc. | 2.500% | 08/15/27 | 2,000,000 | 2,286,000 | ||||||||
| Energy — 5.1% | ||||||||||||
| CMS Energy Corporation * | 3.375% | 05/01/28 | 2,000,000 | 2,123,000 | ||||||||
| Enphase Energy, Inc. | 0.000% | 03/01/28 | 1,000,000 | 837,000 | ||||||||
| Northern Oil & Gas, Inc. | 3.625% | 04/15/29 | 2,900,000 | 3,350,950 | ||||||||
| 6,310,950 | ||||||||||||
| Financials — 2.4% | ||||||||||||
| PennyMac Mortgage Investment Trust * | 5.500% | 11/01/24 | 2,500,000 | 2,481,250 | ||||||||
| RWT Holdings, Inc. | 5.750% | 10/01/25 | 500,000 | 500,000 | ||||||||
| 2,981,250 | ||||||||||||
| Health Care — 16.4% | ||||||||||||
| Alnylam Pharmaceuticals, Inc. | 1.000% | 09/15/27 | 2,500,000 | 2,850,000 | ||||||||
| Dexcom, Inc. | 0.375% | 05/15/28 | 2,000,000 | 1,764,000 | ||||||||
| Exact Sciences Corporation | 0.375% | 03/01/28 | 2,000,000 | 1,859,000 | ||||||||
| Halozyme Therapeutics, Inc. | 1.000% | 08/15/28 | 2,250,000 | 2,480,625 | ||||||||
| Ionis Pharmaceuticals, Inc. | 1.750% | 06/15/28 | 1,000,000 | 1,011,000 | ||||||||
| Jazz Investments I Ltd. | 2.000% | 06/15/26 | 1,500,000 | 1,481,250 | ||||||||
| Lantheus Holdings, Inc., 144A * | 2.625% | 12/15/27 | 2,500,000 | 3,858,750 | ||||||||
| Merit Medical Systems, Inc., 144A | 3.000% | 02/01/29 | 2,500,000 | 3,236,250 | ||||||||
| Sarepta Therapeutics, Inc. | 1.250% | 09/15/27 | 1,500,000 | 1,692,000 | ||||||||
| 20,232,875 | ||||||||||||
| Industrials — 11.4% | ||||||||||||
| Advanced Energy Industries, Inc., 144A | 2.500% | 09/15/28 | 1,500,000 | 1,592,339 | ||||||||
| Axon Enterprise, Inc. * | 0.500% | 12/15/27 | 2,500,000 | 4,722,500 | ||||||||
| Fluor Corporation | 1.125% | 08/15/29 | 2,000,000 | 2,611,000 | ||||||||
| Itron, Inc., 144A | 1.375% | 07/15/30 | 1,000,000 | 1,089,636 | ||||||||
| Tetra Tech, Inc. * | 2.250% | 08/15/28 | 1,500,000 | 2,019,000 | ||||||||
| ZTO Express Cayman, Inc. | 1.500% | 09/01/27 | 2,000,000 | 2,063,000 | ||||||||
| 14,097,475 | ||||||||||||
| Materials — 2.2% | ||||||||||||
| MP Materials Corporation, 144A | 0.250% | 04/01/26 | 3,000,000 | 2,774,805 | ||||||||
The accompanying notes are an integral part of the financial statements.
23
| WESTWOOD ALTERNATIVE INCOME FUND |
| OCTOBER 31, 2024 |
| CONVERTIBLE BONDS — continued |
| Coupon | Maturity | Par Value | Value | |||||||||
| Technology — 23.5% | ||||||||||||
| Akamai Technologies, Inc. | 0.375% | 09/01/27 | $ | 2,000,000 | $ | 2,056,000 | ||||||
| Bentley Systems, Inc. | 0.125% | 01/15/26 | 2,000,000 | 1,969,000 | ||||||||
| Box, Inc., 144A | 1.500% | 09/15/29 | 1,500,000 | 1,470,750 | ||||||||
| Digital Ocean Holdings, Inc. | 0.000% | 12/01/26 | 500,000 | 442,350 | ||||||||
| Dropbox, Inc. | 0.000% | 03/01/28 | 2,000,000 | 1,923,750 | ||||||||
| Lumentum Holdings, Inc. * | 0.500% | 12/15/26 | 2,000,000 | 1,966,000 | ||||||||
| Microchip Technology, Inc., 144A | 0.750% | 06/01/30 | 2,000,000 | 1,925,000 | ||||||||
| MKS Instruments, Inc., 144A | 1.250% | 06/01/30 | 1,000,000 | 961,500 | ||||||||
| MongoDB, Inc. | 0.250% | 01/15/26 | 1,900,000 | 2,537,450 | ||||||||
| ON Semiconductor Corporation | 0.500% | 03/01/29 | 2,500,000 | 2,495,750 | ||||||||
| Pegasystems, Inc. | 0.750% | 03/01/25 | 1,000,000 | 981,500 | ||||||||
| Progress Software Corporation | 1.000% | 04/15/26 | 2,000,000 | 2,385,000 | ||||||||
| Rapid7, Inc., 144A | 1.250% | 03/15/29 | 1,000,000 | 952,667 | ||||||||
| Shift4 Payments, Inc. | 0.500% | 08/01/27 | 2,000,000 | 2,045,000 | ||||||||
| Tyler Technologies, Inc. | 0.250% | 03/15/26 | 2,000,000 | 2,521,000 | ||||||||
| Vishay Intertechnology, Inc. | 2.250% | 09/15/30 | 1,000,000 | 876,500 | ||||||||
| Workiva, Inc. | 1.250% | 08/15/28 | 1,500,000 | 1,417,050 | ||||||||
| 28,926,267 | ||||||||||||
| Utilities — 2.1% | ||||||||||||
| Ormat Technologies, Inc. | 2.500% | 07/15/27 | 1,000,000 | 1,047,500 | ||||||||
| PPL Capital Funding, Inc., 144A | 2.875% | 03/15/28 | 1,500,000 | 1,566,000 | ||||||||
| 2,613,500 | ||||||||||||
| Total Convertible Bonds | ||||||||||||
| (Cost $90,768,026) | $ | 100,697,395 | ||||||||||
| CORPORATE BONDS — 14.1% | ||||||||||||
| Communications — 1.2% | ||||||||||||
| Expedia Group, Inc. | 0.000% | 02/15/26 | $ | 1,500,000 | $ | 1,445,250 | ||||||
| Consumer Discretionary — 1.6% | ||||||||||||
| RLJ Lodging Trust, L.P., 144A | 3.750% | 07/01/26 | 2,000,000 | 1,936,876 | ||||||||
| Energy — 0.9% | ||||||||||||
| FTAI Infra Escrow Holdings, LLC, 144A | 10.500% | 06/01/27 | 1,000,000 | 1,067,513 | ||||||||
| Financials — 6.0% | ||||||||||||
| Aircastle Ltd., 144A | 5.250% | 08/11/25 | 1,200,000 | 1,199,119 | ||||||||
| Ares Capital Corporation | 7.000% | 01/15/27 | 1,735,000 | 1,792,654 | ||||||||
| Blackstone Private Credit Fund | 7.050% | 09/29/25 | 1,090,000 | 1,107,505 | ||||||||
| MidCap Financial Investment Corporation | 5.250% | 03/03/25 | 1,000,000 | 993,093 | ||||||||
| Starwood Property Trust, Inc., 144A | 3.750% | 12/31/24 | 2,400,000 | 2,389,611 | ||||||||
| 7,481,982 | ||||||||||||
| Industrials — 1.3% | ||||||||||||
| GEO Group, Inc. | 8.625% | 04/15/29 | 1,500,000 | 1,569,650 | ||||||||
| Materials — 0.8% | ||||||||||||
| Celanese US Holdings, LLC | 6.350% | 11/15/28 | 915,000 | 946,575 | ||||||||
The accompanying notes are an integral part of the financial statements.
24
| WESTWOOD ALTERNATIVE INCOME FUND |
| OCTOBER 31, 2024 |
| CORPORATE BONDS — continued |
| Coupon | Maturity | Par Value | Value | |||||||||
| Real Estate — 1.6% | ||||||||||||
| Iron Mountain, Inc., 144A | 5.000% | 07/15/28 | $ | 1,000,000 | $ | 974,608 | ||||||
| Service Properties Trust, 144A | 8.625% | 11/15/31 | 1,100,000 | 1,162,291 | ||||||||
| 2,136,899 | ||||||||||||
| Technology — 0.7% | ||||||||||||
| TIBCO Software, Inc., 144A | 6.500% | 03/31/29 | 825,000 | 805,525 | ||||||||
| Total Corporate Bonds | ||||||||||||
| (Cost $17,000,881) | $ | 17,390,270 | ||||||||||
| COMMON STOCKS — 1.1% | ||||||||||||
| Shares | Value | |||||||||||
| Technology — 1.1% | ||||||||||||
| Semiconductors — 0.6% | ||||||||||||
| NVIDIA Corporation (a) | 5,000 | $ | 663,800 | |||||||||
| Software — 0.5% | ||||||||||||
| Salesforce, Inc. (a) | 2,200 | 641,014 | ||||||||||
| Total Common Stocks | ||||||||||||
| (Cost $1,209,527) | $ | 1,304,814 | ||||||||||
| MONEY MARKET FUNDS — 3.6% | ||||||||||||
| First American Government Obligations Fund - Class U, 4.80% (b) (Cost $4,444,075) | 4,444,075 | $ | 4,444,075 | |||||||||
| Investments at Value — 100.4% (Cost $113,422,509) | $ | 123,836,554 | ||||||||||
| Liabilities in Excess of Other Assets — (0.4%) | (451,820 | ) | ||||||||||
| Net Assets — 100.0% | $ | 123,384,734 | ||||||||||
144A - Security was purchased in a transaction exempt from registration in compliance with Rule 144A of the Securities Act of 1933. This security may be resold in transactions exempt from registration, normally to qualified institutional buyers. The total value of such securities is $39,837,191 as of October 31, 2024, representing 32.3% of net assets.
| * | All or a part of this security has been pledged as collateral for derivative instruments held by the fund. |
| (a) | All or a portion of the security covers a written call option. The total value of securities as of October 31, 2024 was $1,304,814. |
| (b) | The rate shown is the 7-day effective yield as of October 31, 2024. |
The accompanying notes are an integral part of the financial statements.
25
| WESTWOOD ALTERNATIVE INCOME FUND |
| OCTOBER 31, 2024 |
A list of open OTC swap agreements as of October 31, 2024, is as follows:
| SCHEDULE OF TOTAL RETURN SWAP AGREEMENTS |
| Net Unrealized | ||||||||||||||||
| Number of | Notional | Termination | Appreciation / | |||||||||||||
| Shares | Reference Entity | Amount | Interest Rate Receivable (a) | Date | Counterparty | (Depreciation) | ||||||||||
| Short Positions | ||||||||||||||||
| (6,600) | Advanced Energy Industries, Inc. | $ | (705,389 | ) | 4.48% OBFR 4.83% minus 35bp | 05/16/2025 | BNP Paribas | $ | (9,781 | ) | ||||||
| (6,900) | Akamai Technologies, Inc. | (712,701 | ) | 4.48% OBFR 4.83% minus 35bp | 05/16/2025 | BNP Paribas | 16,579 | |||||||||
| (11,500) | Alibaba Group Holding Ltd. | (1,171,160 | ) | 4.48% OBFR 4.83% minus 35bp | 05/16/2025 | BNP Paribas | 46,728 | |||||||||
| (5,900) | Alnylam Pharmaceuticals, Inc. | (1,695,424 | ) | 4.48% OBFR 4.83% minus 35bp | 05/16/2025 | BNP Paribas | 125,708 | |||||||||
| (9,400) | Axon Enterprise, Inc. | (4,080,728 | ) | 4.48% OBFR 4.83% minus 35bp | 05/16/2025 | BNP Paribas | 107,446 | |||||||||
| (7,800) | Bentley Systems, Inc. | (389,922 | ) | 4.48% OBFR 4.83% minus 35bp | 05/16/2025 | BNP Paribas | 14,222 | |||||||||
| (19,500) | Box, Inc. | (638,235 | ) | 4.48% OBFR 4.83% minus 35bp | 05/16/2025 | BNP Paribas | 20,106 | |||||||||
| (13,500) | CMS Energy Corporation | (949,050 | ) | 4.48% OBFR 4.83% minus 35bp | 05/16/2025 | BNP Paribas | 11,087 | |||||||||
| (3,700) | DexCom, Inc. | (265,143 | ) | 4.48% OBFR 4.83% minus 35bp | 05/16/2025 | BNP Paribas | 4,811 | |||||||||
| (25,500) | Dropbox, Inc. | (669,885 | ) | 4.48% OBFR 4.83% minus 35bp | 05/16/2025 | BNP Paribas | 11,961 | |||||||||
| (1,000) | Enphase Energy, Inc. | (92,040 | ) | 4.48% OBFR 4.83% minus 35bp | 05/16/2025 | BNP Paribas | 9,172 | |||||||||
| (4,000) | Etsy, Inc. | (205,760 | ) | 4.48% OBFR 4.83% minus 35bp | 05/16/2025 | BNP Paribas | (137 | ) | ||||||||
| (4,600) | Exact Sciences Corporation | (321,770 | ) | 4.48% OBFR 4.83% minus 35bp | 05/16/2025 | BNP Paribas | 5,293 | |||||||||
| (1,200) | Expedia Group, Inc. | (181,440 | ) | 4.48% OBFR 4.83% minus 35bp | 05/16/2025 | BNP Paribas | (5,793 | ) | ||||||||
| (25,500) | Fluor Corporation | (1,290,626 | ) | 4.48% OBFR 4.83% minus 35bp | 05/16/2025 | BNP Paribas | (40,196 | ) | ||||||||
| (43,000) | Ford Motor Company | (467,997 | ) | 4.48% OBFR 4.83% minus 35bp | 05/16/2025 | BNP Paribas | 26,437 | |||||||||
| (26,800) | Halozyme Therapeutics, Inc. | (1,442,376 | ) | 4.48% OBFR 4.83% minus 35bp | 05/16/2025 | BNP Paribas | 89,793 | |||||||||
| (11,200) | Ionis Pharmaceuticals, Inc. | (423,808 | ) | 4.48% OBFR 4.83% minus 35bp | 05/16/2025 | BNP Paribas | (5,369 | ) | ||||||||
| (4,400) | Itron, Inc. | (480,084 | ) | 4.48% OBFR 4.83% minus 35bp | 05/16/2025 | BNP Paribas | (10,764 | ) | ||||||||
| (3,000) | Jazz Pharmaceuticals plc | (351,840 | ) | 4.48% OBFR 4.83% minus 35bp | 05/16/2025 | BNP Paribas | 22,407 | |||||||||
| (25,700) | JD.com, Inc. | (1,032,112 | ) | 4.48% OBFR 4.83% minus 35bp | 05/16/2025 | BNP Paribas | (9,835 | ) | ||||||||
| (23,500) | Lantheus Holdings, Inc. | (2,631,060 | ) | 4.48% OBFR 4.83% minus 35bp | 05/16/2025 | BNP Paribas | 54,732 | |||||||||
| (6,300) | Liberty Media Corporation -Liberty Formula One | (503,370 | ) | 4.48% OBFR 4.83% minus 35bp | 05/16/2025 | BNP Paribas | 1,318 | |||||||||
| (12,300) | Live Nation Entertainment, Inc. | (1,418,805 | ) | 4.48% OBFR 4.83% minus 35bp | 05/16/2025 | BNP Paribas | (19,368 | ) | ||||||||
| (8,100) | Lumentum Holdings, Inc. | (539,298 | ) | 4.26% OBFR 4.83% minus 57bp | 05/16/2025 | BNP Paribas | 22,908 | |||||||||
| (18,100) | Merit Medical Systems, Inc. | (1,730,323 | ) | 4.48% OBFR 4.83% minus 35bp | 05/16/2025 | BNP Paribas | (52,358 | ) | ||||||||
| (3,700) | Meritage Homes Corporation | (725,107 | ) | 4.48% OBFR 4.83% minus 35bp | 05/16/2025 | BNP Paribas | 55,913 | |||||||||
| (5,500) | Microchip Technology, Inc. | (413,765 | ) | 4.48% OBFR 4.83% minus 35bp | 05/16/2025 | BNP Paribas | 11,003 | |||||||||
| (3,600) | MKS Instruments, Inc. | (374,292 | ) | 4.48% OBFR 4.83% minus 35bp | 05/16/2025 | BNP Paribas | 17,403 | |||||||||
| (7,900) | MongoDB, Inc. | (2,207,824 | ) | 4.48% OBFR 4.83% minus 35bp | 05/16/2025 | BNP Paribas | 75,286 | |||||||||
| (52,700) | Northern Oil & Gas, Inc. | (1,981,520 | ) | 4.48% OBFR 4.83% minus 35bp | 05/16/2025 | BNP Paribas | 75,022 | |||||||||
| (13,100) | ON Semiconductor Corporation | (908,092 | ) | 4.48% OBFR 4.83% minus 35bp | 05/16/2025 | BNP Paribas | (13,632 | ) | ||||||||
| (6,300) | Ormat Technologies, Inc. | (485,226 | ) | 4.48% OBFR 4.83% minus 35bp | 05/16/2025 | BNP Paribas | (11,694 | ) | ||||||||
| (13,800) | Post Holdings, Inc. | (1,596,246 | ) | 4.48% OBFR 4.83% minus 35bp | 05/16/2025 | BNP Paribas | 92,128 | |||||||||
| (23,100) | PPL Corporation | (747,054 | ) | 4.48% OBFR 4.83% minus 35bp | 05/16/2025 | BNP Paribas | (3,687 | ) | ||||||||
| (22,700) | Progress Software Corporation | (1,512,274 | ) | 4.48% OBFR 4.83% minus 35bp | 05/16/2025 | BNP Paribas | 60,254 | |||||||||
| (6,700) | Rapid7, Inc. | (269,876 | ) | 4.48% OBFR 4.83% minus 35bp | 05/16/2025 | BNP Paribas | (434 | ) | ||||||||
| (19,000) | Royal Caribbean Cruises Ltd. | (3,846,202 | ) | 4.48% OBFR 4.83% minus 35bp | 05/16/2025 | BNP Paribas | (67,432 | ) | ||||||||
The accompanying notes are an integral part of the financial statements.
26
| WESTWOOD ALTERNATIVE INCOME FUND |
| OCTOBER 31, 2024 |
| SCHEDULE OF TOTAL RETURN SWAP AGREEMENTS — continued |
| Net Unrealized | ||||||||||||||||
| Number of | Notional | Termination | Appreciation / | |||||||||||||
| Shares | Reference Entity | Amount | Interest Rate Receivable (a) | Date | Counterparty | (Depreciation) | ||||||||||
| (4,800) | Sarepta Therapeutics, Inc. | $ | (593,904 | ) | 4.48% OBFR 4.83% minus 35bp | 05/16/2025 | BNP Paribas | $ | (9,787 | ) | ||||||
| (6,300) | Shift4 Payments, Inc. | (593,019 | ) | 4.48% OBFR 4.83% minus 35bp | 05/16/2025 | BNP Paribas | 24,354 | |||||||||
| (24,000) | Tetra Tech, Inc. | (1,177,440 | ) | 4.48% OBFR 4.83% minus 35bp | 05/16/2025 | BNP Paribas | 6,518 | |||||||||
| (9,800) | Trip.com Group Ltd. | (568,596 | ) | 4.48% OBFR 4.83% minus 35bp | 05/16/2025 | BNP Paribas | (61,462 | ) | ||||||||
| (3,100) | Tyler Technologies, Inc. | (1,863,255 | ) | 4.48% OBFR 4.83% minus 35bp | 05/16/2025 | BNP Paribas | (10,596 | ) | ||||||||
| (19,800) | Uber Technologies, Inc. | (1,469,901 | ) | 4.48% OBFR 4.83% minus 35bp | 05/16/2025 | BNP Paribas | 43,604 | |||||||||
| (13,200) | Vishay Intertechnology, Inc. | (239,052 | ) | 4.48% OBFR 4.83% minus 35bp | 05/16/2025 | BNP Paribas | 15,626 | |||||||||
| (4,000) | Workiva, Inc. | (325,320 | ) | 4.48% OBFR 4.83% minus 35bp | 05/16/2025 | BNP Paribas | 6,887 | |||||||||
| (30,900) | ZTO Express Cayman, Inc. | (765,393 | ) | 4.48% OBFR 4.83% minus 35bp | 05/16/2025 | BNP Paribas | 52,748 | |||||||||
| Total Short Positions | $ | 795,129 | ||||||||||||||
| Total swap agreements at value (assets) | $ | 1,127,454 | ||||||||||||||
| Total swap agreements at value (liabilities) | (332,325 | ) | ||||||||||||||
| Net swap agreements at value | $ | 795,129 | ||||||||||||||
OFBR - Overnight Bank Funding Rate
OTC - Over the Counter
| (a) | Payment frequency is monthly. |
The average monthly notional value for Swap Contracts for the year ended October 31, 2024 was $(38,416,286).
The accompanying notes are an integral part of the financial statements.
27
| WESTWOOD ALTERNATIVE INCOME FUND |
| OCTOBER 31, 2024 |
| SCHEDULE OF OPEN WRITTEN OPTION CONTRACTS |
| Strike | Notional | Value of | ||||||||||||
| Price | Contracts | Value | Options | |||||||||||
| Call Option Contracts | ||||||||||||||
| NVIDIA Corporation, 01/17/25 | $ | 140.00 | 50 | $ | 663,800 | $ | 54,500 | |||||||
| Salesforce, Inc., 12/20/24 | 300.00 | 22 | 641,014 | 28,710 | ||||||||||
| Total Written Option Contracts | ||||||||||||||
| (Premiums $44,511) | $ | 1,304,814 | $ | 83,210 | ||||||||||
The average monthly notional value of written option contracts during the year ended October 31, 2024 was $305,617.
The accompanying notes are an integral part of the financial statements.
28
| WESTWOOD SALIENT MLP & ENERGY INFRASTRUCTURE FUND |
| OCTOBER 31, 2024 |
| SCHEDULE OF INVESTMENTS |
| AFFILIATED EXCHANGE-TRADED FUNDS — 4.6% |
| Shares | Value | |||||||
| Westwood Salient Enhanced Energy Income ETF | 481,115 | $ | 10,897,303 | |||||
| Westwood Salient Enhanced Midstream Income ETF | 1,611,112 | 41,842,512 | ||||||
| Total Affiliated Exchange-Traded Funds (Cost $51,272,530) | $ | 52,739,815 | ||||||
| MASTER LIMITED PARTNERSHIPS — 24.2% (a) | ||||||||
| Crude & Refined Products — 8.7% | ||||||||
| Delek Logistics Partners, L.P. (b) | 480,010 | $ | 18,513,986 | |||||
| Genesis Energy, L.P. | 2,098,868 | 23,738,197 | ||||||
| MPLX,L.P. | 1,282,547 | 56,970,737 | ||||||
| 99,222,920 | ||||||||
| Gathering & Processing — 8.1% | ||||||||
| Western Midstream Partners, L.P. (b) | 2,456,027 | 92,665,899 | ||||||
| Natural Gas Liquids Infrastructure — 7.4% | ||||||||
| Energy Transfer, L.P. | 3,871,948 | 63,809,703 | ||||||
| Enterprise Products Partners, L.P. | 756,398 | 21,678,367 | ||||||
| 85,488,070 | ||||||||
| Total Master Limited Partnerships | ||||||||
| (Cost $179,410,694) | $ | 277,376,889 | ||||||
| MLP RELATED COMPANIES — 70.8% | ||||||||
| Crude & Refined Products — 10.7% | ||||||||
| Enbridge, Inc. | 786,898 | $ | 31,790,679 | |||||
| Gibson Energy, Inc. | 1,063,150 | 17,638,356 | ||||||
| Plains GP Holdings, L.P. - Class A | 3,858,431 | 66,365,014 | ||||||
| South Bow Corporation (c) | 290,942 | 7,261,912 | ||||||
| 123,055,961 | ||||||||
| Exploration & Production — 0.5% | ||||||||
| Diamondback Energy, Inc. | 33,387 | 5,901,820 | ||||||
| Gathering & Processing — 22.4% | ||||||||
| Antero Midstream Corporation | 2,959,712 | 42,531,061 | ||||||
| DT Midstream, Inc. | 619,387 | 55,837,737 | ||||||
| EMG Utica I Offshore Co-Investment, L.P. *(d)(e)(f ) | 16,000,000 | 18,054,400 | ||||||
| EnLink Midstream, LLC | 1,852,734 | 27,494,573 | ||||||
| Hess Midstream, L.P. - Class A (b) | 1,134,241 | 39,301,451 | ||||||
| Kinetik Holdings, Inc. (b) | 385,353 | 18,755,131 | ||||||
| Targa Resources Corporation (b) | 336,510 | 56,183,709 | ||||||
| 258,158,062 | ||||||||
| MLP RELATED COMPANIES — continued |
| Shares | Value | |||||||
| Liquefied Natural Gas — 7.0% | ||||||||
| Cheniere Energy, Inc. (b) | 392,862 | $ | 75,185,930 | |||||
| NextDecade Corporation (c) | 814,579 | 4,757,141 | ||||||
| 79,943,071 | ||||||||
| Natural Gas Liquids Infrastructure — 11.8% | ||||||||
| Keyera Corporation | 1,520,994 | 46,710,743 | ||||||
| ONEOK, Inc. | 579,337 | 56,126,169 | ||||||
| Pembina Pipeline Corporation | 778,682 | 32,541,121 | ||||||
| 135,378,033 | ||||||||
| Natural Gas Pipelines — 17.2% | ||||||||
| Kinder Morgan, Inc. | 1,764,274 | 43,242,356 | ||||||
| TC Energy Corporation (b) | 1,491,784 | 69,382,874 | ||||||
| Williams Companies, Inc. (The) | 1,615,473 | 84,602,320 | ||||||
| 197,227,550 | ||||||||
| Renewable Energy Infrastructure — 1.2% | ||||||||
| Eaton Corporation plc (b) | 6,792 | 2,252,091 | ||||||
| First Solar, Inc. (b)(c) | 21,661 | 4,212,631 | ||||||
| GE Vernova, Inc. (b)(c) | 14,818 | 4,469,999 | ||||||
| NEXTracker, Inc. - Class A (c) | 33,031 | 1,315,294 | ||||||
| Quanta Services, Inc. | 3,707 | 1,118,142 | ||||||
| 13,368,157 | ||||||||
| Total MLP Related Companies | ||||||||
| (Cost $535,738,327) | $ | 813,032,654 | ||||||
| SPECIAL PURPOSE ACQUISITION COMPANY — 0.0% (g) | ||||||||
| Renewable Energy Infrastructure — 0.0% (g) | ||||||||
| TortoiseEcofin Acquisition Corporation III -Founder Shares (c)(d)(e)(h) (Cost $315) | 104,850 | $ | 315 | |||||
The accompanying notes are an integral part of the financial statements.
29
| WESTWOOD SALIENT MLP & ENERGY INFRASTRUCTURE FUND |
| OCTOBER 31, 2024 |
| MONEY MARKET FUNDS — 0.2% |
| Shares | Value | |||||||
| First American Government Obligations Fund - Class U, 4.80% (i) (Cost $2,380,282) | 2,380,282 | $ | 2,380,282 | |||||
| Investments at Value — 99.8% | ||||||||
| (Cost $768,802,148) | $ | 1,145,529,955 | ||||||
| Other Assets in Excess of Liabilities — 0.2% | 2,526,641 | |||||||
| Net Assets — 100.0% | $ | 1,148,056,596 | ||||||
plc - Public Limited Company
| * | EMG Utica I Offshore Co-Investment, L.P. is a Co-Investment of MarkWest Utica EMG, LLC. |
| (a) | The security is considered a non-income producing security as any distributions received during the last 12 months (if applicable) are treated as return of capital per Generally Accepted Accounting Principles. |
| (b) | All or a portion of the security covers a written call option. |
| (c) | Non-income producing security. |
| (d) | These securities are exempt from registration under the Securities Act of 1933 and are subject to legal restrictions on resale. These securities generally may be resold in transactions exempt from registration, normally to qualified institutional buyers, or to the public if the securities are subsequently registered. |
| (e) | Security determined to be illiquid under the procedures approved by the Fund’s Board of Trustees and represents 1.6% of net assets. |
| (f) | Investment is valued using the Fund’s pro rata net asset value (or its equivalent) as a practical expedient. |
| (g) | Percentage rounds to less than 0.1%. |
| (h) | Level 3 security in accordance with fair value hierarchy. |
| (i) | The rate shown is the 7-day effective yield as of October 31, 2024. |
The accompanying notes are an integral part of the financial statements.
30
| WESTWOOD SALIENT MLP & ENERGY INFRASTRUCTURE FUND |
| OCTOBER 31, 2024 |
| SCHEDULE OF OPEN WRITTEN OPTION CONTRACTS |
| Strike | Notional | Value of | ||||||||||||
| Price | Contracts | Value | Options | |||||||||||
| Call Option Contracts | ||||||||||||||
| Cheniere Energy, Inc., 11/15/24 | $ | 195.00 | 982 | $ | 18,793,516 | $ | 279,869 | |||||||
| Cheniere Energy, Inc., 11/15/24 | 200.00 | 392 | 7,502,096 | 35,672 | ||||||||||
| Delek Logistics Partners, L.P., 11/15/24 | 40.00 | 2,400 | 9,256,800 | 60,000 | ||||||||||
| Eaton Corporation plc, 11/15/24 | 370.00 | 33 | 1,094,214 | 1,221 | ||||||||||
| Eaton Corporation plc, 11/15/24 | 380.00 | 34 | 1,127,372 | 850 | ||||||||||
| First Solar, Inc., 11/01/24 | 280.00 | 53 | 1,030,744 | 1,060 | ||||||||||
| GE Vernova, Inc., 11/15/24 | 320.00 | 63 | 1,900,458 | 39,627 | ||||||||||
| Hess Midstream, L.P., 11/15/24 | 37.00 | 5,917 | 20,502,405 | 29,585 | ||||||||||
| Kinetik Holdings, Inc., 11/15/24 | 55.00 | 385 | 1,873,795 | 10,588 | ||||||||||
| Targa Resources Corporation, 11/15/24 | 180.00 | 332 | 5,543,072 | 35,192 | ||||||||||
| TC Energy Corporation, 11/15/24 | 50.00 | 727 | 3,381,277 | 12,723 | ||||||||||
| Western Midstream Partners, L.P., 11/15/24 | 40.00 | 3,684 | 13,899,732 | 73,680 | ||||||||||
| Western Midstream Partners, L.P., 11/15/24 | 41.00 | 2,665 | 10,055,045 | 26,650 | ||||||||||
| Total Written Option Contracts | ||||||||||||||
| (Premiums $596,247) | $ | 95,960,526 | $ | 606,717 | ||||||||||
The average monthly notional value of written option contracts during the ten months ended October 31, 2024 was $140,659,426.
The accompanying notes are an integral part of the financial statements.
31
| WESTWOOD GLOBAL REAL ESTATE FUND |
| OCTOBER 31, 2024 |
| SCHEDULE OF INVESTMENTS |
| COMMON STOCKS — 97.8% |
| Shares | Value | |||||||
| Australia — 2.8% | ||||||||
| GPT Group (The) | 75,000 | $ | 232,333 | |||||
| Scentre Group | 100,000 | 229,240 | ||||||
| 461,573 | ||||||||
| Canada — 3.4% | ||||||||
| Dream Industrial Real Estate Investment Trust | 58,559 | 556,002 | ||||||
| Germany — 1.7% | ||||||||
| Vonovia SE | 8,230 | 269,806 | ||||||
| Hong Kong — 1.5% | ||||||||
| Link REIT | 52,775 | 245,907 | ||||||
| Japan — 10.9% | ||||||||
| Mitsubishi Estate Company Ltd. | 40,000 | 591,519 | ||||||
| Sumitomo Realty & Development Company Ltd. | 19,011 | 563,935 | ||||||
| Tokyo Tatemono Company Ltd. | 37,076 | 605,442 | ||||||
| 1,760,896 | ||||||||
| Singapore — 1.1% | ||||||||
| CapitaLand Investment Ltd. | 83,198 | 175,775 | ||||||
| Spain — 2.4% | ||||||||
| Inmobiliaria Colonial Socimi S.A. | 62,587 | 379,310 | ||||||
| Switzerland — 2.0% | ||||||||
| Swiss Prime Site AG | 3,000 | 325,475 | ||||||
| United Kingdom — 4.0% | ||||||||
| Great Portland Estates plc | 110,000 | 446,170 | ||||||
| Segro plc | 19,474 | 197,283 | ||||||
| 643,453 | ||||||||
| United States — 68.0% | ||||||||
| Apple Hospitality REIT, Inc. | 38,414 | 567,375 | ||||||
| BXP, Inc. | 5,385 | 433,816 | ||||||
| Centerspace | 9,718 | 676,956 | ||||||
| COPT Defense Properties | 25,000 | 805,000 | ||||||
| Crown Castle, Inc. | 5,156 | 554,219 | ||||||
| Digital Realty Trust, Inc. | 2,500 | 445,575 | ||||||
| Equinix, Inc. | 900 | 817,272 | ||||||
| Equity Residential | 8,927 | 628,193 | ||||||
| Federal Realty Investment Trust | 5,500 | 609,620 | ||||||
| COMMON STOCKS — continued |
| Shares | Value | |||||||
| United States — continued | ||||||||
| Gaming and Leisure Properties, Inc. | 13,400 | $ | 672,546 | |||||
| Host Hotels & Resorts, Inc. | 23,198 | 399,933 | ||||||
| Hudson Pacific Properties, Inc. | 80,000 | 345,600 | ||||||
| Invitation Homes, Inc. | 15,000 | 471,150 | ||||||
| Kimco Realty Corporation | 27,469 | 651,565 | ||||||
| Outfront Media, Inc. | 40,000 | 710,400 | ||||||
| Phillips Edison & Company, Inc. | 19,500 | 737,295 | ||||||
| Rexford Industrial Realty, Inc. | 14,000 | 600,460 | ||||||
| Ventas, Inc. | 13,531 | 886,145 | ||||||
| 11,013,120 | ||||||||
| Total Common Stocks | ||||||||
| (Cost $14,256,072) | $ | 15,831,317 | ||||||
| MONEY MARKET FUNDS — 2.3% | ||||||||
| First American Government Obligations Fund - Class U, 4.80% (a) (Cost $371,549) | 371,549 | $ | 371,549 | |||||
| Investments at Value — 100.1% | ||||||||
| (Cost $14,627,621) | $ | 16,202,866 | ||||||
| Liabilities in Excess of Other Assets — (0.1%) | (12,898 | ) | ||||||
| Net Assets — 100.0% | $ | 16,189,968 | ||||||
AG - Aktiengesellschaft
plc - Public Limited Company
REIT - Real Estate Investment Trust
S.A. - Societe Anonyme
SE - Societe Europaea
| (a) | The rate shown is the 7-day effective yield as of July 31, 2024. |
The accompanying notes are an integral part of the financial statements.
32
| WESTWOOD REAL ESTATE INCOME FUND |
| OCTOBER 31, 2024 |
| SCHEDULE OF INVESTMENTS |
| COMMON STOCKS — 27.9% |
| Shares | Value | |||||||
| Financials — 2.5% | ||||||||
| Specialty Finance — 2.5% | ||||||||
| Blackstone Mortgage Trust, Inc. - Class A | 375,000 | $ | 6,828,750 | |||||
| Real Estate Investment Trusts (REITs) — 25.4% | ||||||||
| Hotels — 6.4% | ||||||||
| Apple Hospitality REIT, Inc. | 350,000 | 5,169,500 | ||||||
| Gaming and Leisure Properties, Inc. | 125,000 | 6,273,750 | ||||||
| Ryman Hospitality Properties, Inc. | 60,000 | 6,423,000 | ||||||
| 17,866,250 | ||||||||
| Industrial — 0.9% | ||||||||
| Rexford Industrial Realty, Inc. | 60,000 | 2,573,400 | ||||||
| Multi Asset Class — 1.4% | ||||||||
| FrontView REIT, Inc. (a) | 200,000 | 3,732,000 | ||||||
| Office — 5.2% | ||||||||
| BXP, Inc. | 80,000 | 6,444,800 | ||||||
| COPT Defense Properties | 250,000 | 8,050,000 | ||||||
| 14,494,800 | ||||||||
| Residential — 6.1% | ||||||||
| AvalonBay Communities, Inc. | 26,325 | 5,833,883 | ||||||
| Centerspace | 90,000 | 6,269,400 | ||||||
| Invitation Homes, Inc. | 150,000 | 4,711,500 | ||||||
| 16,814,783 | ||||||||
| Retail — 2.6% | ||||||||
| Getty Realty Corporation | 225,000 | 7,062,750 | ||||||
| Specialized — 2.8% | ||||||||
| Outfront Media, Inc. | 440,892 | 7,830,242 | ||||||
| Total Common Stocks | ||||||||
| (Cost $70,414,571) | $ | 77,202,975 | ||||||
| PREFERRED STOCKS* — 71.1% | ||||||||
| Consumer Discretionary — 3.2% | ||||||||
| Home Construction — 3.2% | ||||||||
| Hovnanian Enterprises, Inc., 7.63% - Series A | 500,000 | $ | 8,745,000 | |||||
| Financials — 1.5% | ||||||||
| Banking — 1.5% | ||||||||
| Associated Banc-Corp, 5.63% - Series F | 125,000 | 2,695,000 | ||||||
| Associated Banc-Corp, 5.88% - Series E | 62,206 | 1,399,635 | ||||||
| 4,094,635 | ||||||||
| PREFERRED STOCKS* — continued |
| Shares | Value | |||||||
| Real Estate Investment Trusts (REITs) — 66.4% | ||||||||
| Apartments — 1.6% | ||||||||
| Vinebrook Homes Trust, Inc., 9.50% - Series B (a)(b) | 180,000 | $ | 4,500,000 | |||||
| Data Centers — 4.1% | ||||||||
| DigitalBridge Group, Inc., 7.13% - Series H | 240,000 | 6,067,200 | ||||||
| DigitalBridge Group, Inc., 7.13% - Series J | 28,283 | 705,661 | ||||||
| DigitalBridge Group, Inc., 7.15% - Series I | 182,664 | 4,615,919 | ||||||
| 11,388,780 | ||||||||
| Diversified — 6.7% | ||||||||
| Armada Hoffler Properties, Inc., 6.75% - Series A | 320,000 | 7,734,400 | ||||||
| CTO Realty Growth, Inc., 6.38% - Series A | 447,333 | 10,941,765 | ||||||
| 18,676,165 | ||||||||
| Healthcare — 2.9% | ||||||||
| Global Medical REIT, Inc., 7.50% - Series A | 311,134 | 7,948,789 | ||||||
| Hotels — 19.0% | ||||||||
| Chatham Lodging Trust, 6.63% - Series A | 190,000 | 4,465,000 | ||||||
| DiamondRock Hospitality Company, 8.25% - Series A | 66,410 | 1,723,340 | ||||||
| Pebblebrook Hotel Trust, 5.70% - Series H | 489,548 | 10,133,644 | ||||||
| Pebblebrook Hotel Trust, 6.30% - Series F | 242,066 | 5,644,979 | ||||||
| Pebblebrook Hotel Trust, 6.38% - Series E | 98,002 | 2,213,865 | ||||||
| Pebblebrook Hotel Trust, 6.38% - Series G | 250,000 | 5,697,500 | ||||||
| RLJ Lodging Trust, 7.80% - Series A | 375,000 | 9,697,500 | ||||||
| Summit Hotel Properties, Inc., 5.88% - Series F | 158,938 | 3,345,645 | ||||||
| Summit Hotel Properties, Inc., 6.25% - Series E | 283,000 | 5,940,170 | ||||||
| Sunstone Hotel Investors, Inc., 6.13% - Series H | 166,508 | 3,829,684 | ||||||
| 52,691,327 | ||||||||
| Industrial — 3.5% | ||||||||
| LXP Industrial Trust, 6.50% - Series C | 190,000 | 9,764,100 | ||||||
| Manufactured Homes — 0.8% | ||||||||
| UMH Properties, Inc., 6.38% - Series D | 87,634 | 2,111,103 | ||||||
The accompanying notes are an integral part of the financial statements.
33
| WESTWOOD REAL ESTATE INCOME FUND |
| OCTOBER 31, 2024 |
| PREFERRED STOCKS* — continued |
| Shares | Value | |||||||
| Real Estate Investment Trusts (REITs) — continued | ||||||||
| Mortgage — 3.9% | ||||||||
| KKR Real Estate Finance Trust, Inc., 6.50% - Series A | 499,043 | $ | 10,854,185 | |||||
| Office — 1.3% | ||||||||
| Hudson Pacific Properties, Inc., 4.75% - Series C | 245,493 | 3,581,743 | ||||||
| Residential — 2.8% | ||||||||
| American Homes 4 Rent, 5.88% - Series G | 317,495 | 7,861,176 | ||||||
| Retail — 2.7% | ||||||||
| Regency Centers Corporation, 5.88% - Series B | 100,000 | 2,443,000 | ||||||
| Regency Centers Corporation, 6.25% - Series A | 200,000 | 5,010,000 | ||||||
| 7,453,000 | ||||||||
| Shopping Centers — 8.2% | ||||||||
| Kimco Realty Corporation, 7.25% - Series D | 180,000 | 10,980,000 | ||||||
| Saul Centers, Inc., 6.00% - Series E | 125,000 | 2,918,750 | ||||||
| Saul Centers, Inc., 6.13% - Series D | 381,000 | 8,801,100 | ||||||
| 22,699,850 | ||||||||
| Specialized — 5.8% | ||||||||
| EPR Properties, 5.75% - Series C | 31,000 | 659,060 | ||||||
| EPR Properties, 5.75% - Series G | 107,775 | 2,361,351 | ||||||
| EPR Properties, 9.00% - Series E | 280,000 | 8,386,000 | ||||||
| IQHQ, Inc. (a)(b) | 5,000 | 4,750,000 | ||||||
| 16,156,411 | ||||||||
| Storage — 3.1% | ||||||||
| National Storage Affiliates Trust, 6.00% - Series A | 370,000 | 8,539,600 | ||||||
| Total Preferred Stocks | ||||||||
| (Cost $174,973,172) | $ | 197,065,864 | ||||||
| MONEY MARKET FUNDS — 1.3% |
| Shares | Value | |||||||
| First American Government Obligations Fund - Class U, 4.80% (c) (Cost $3,688,961) | 3,688,961 | $ | 3,688,961 | |||||
| Investments at Value — 100.3% | ||||||||
| (Cost $249,076,704) | $ | 277,957,800 | ||||||
| Liabilities in Excess of Other Assets — (0.3%) | (720,151 | ) | ||||||
| Net Assets — 100.0% | $ | 277,237,649 | ||||||
REIT - Real Estate Investment Trust
| * | Securities listed have a perpetual maturity. |
| (a) | Non-income producing security. |
| (b) | Level 3 security in accordance with fair value hierarchy. |
| (c) | The rate shown is the 7-day effective yield as of October 31, 2024. |
The accompanying notes are an integral part of the financial statements.
34
| WESTWOOD BROADMARK TACTICAL GROWTH FUND |
| OCTOBER 31, 2024 |
| SCHEDULE OF INVESTMENTS |
| EXCHANGE-TRADED FUNDS — 67.0% |
| Shares | Value | |||||||
| Communication Services Select Sector SPDR Fund | 139,503 | $ | 12,839,856 | |||||
| Consumer Staples Select Sector SPDR Fund | 155,278 | 12,440,873 | ||||||
| Financial Select Sector SPDR Fund | 182,314 | 8,473,955 | ||||||
| Health Care Select Sector SPDR Fund | 81,753 | 12,007,063 | ||||||
| Invesco S&P 500 Equal Weight ETF | 109,777 | 19,352,587 | ||||||
| iShares Russell 2000 ETF | 37,342 | 8,131,594 | ||||||
| SPDR S&P 500 ETF Trust | 46,824 | 26,625,999 | ||||||
| Utilities Select Sector SPDR Fund | 125,461 | 10,025,589 | ||||||
| Total Exchange-Traded Funds | ||||||||
| (Cost $102,138,151) | $ | 109,897,516 | ||||||
| MONEY MARKET FUNDS — 33.0% | ||||||||
| First American Government Obligations Fund - Class U, 4.80% (a) (Cost $54,042,070) | 54,042,070 | $ | 54,042,070 | |||||
| Investments at Value — 100.0% (Cost $156,180,221) | $ | 163,939,586 | ||||||
| Liabilities in Excess of Other Assets — 0.0% (b) | (77,308 | ) | ||||||
| Net Assets — 100.0% | $ | 163,862,278 | ||||||
ETF - Exchange Traded Fund
S&P - Standard & Poor
| (a) | The rate shown is the 7-day effective yield as of October 31, 2024. |
| (b) | Percentage rounds to less than 0.1%. |
The accompanying notes are an integral part of the financial statements.
35
| WESTWOOD BROADMARK TACTICAL PLUS FUND |
| OCTOBER 31, 2024 |
| SCHEDULE OF INVESTMENTS |
| MONEY MARKET FUNDS — 97.6% |
| Shares | Value | |||||||
| First American Government Obligations Fund - Class U, 4.80% (a) (Cost $69,913,385) | 69,913,385 | $ | 69,913,385 | |||||
| Investments at Value — 97.6% | ||||||||
| (Cost $69,913,385) | $ | 69,913,385 | ||||||
| Other Assets in Excess of Liabilities — 2.4% | 1,734,340 | |||||||
| Net Assets — 100.0% | $ | 71,647,725 | ||||||
| (a) | The rate shown is the 7-day effective yield as of October 31, 2024. |
| SCHEDULE OF FUTURES CONTRACTS |
| Value/ | ||||||||||||
| Unrealized | ||||||||||||
| Expiration | Notional | Appreciation | ||||||||||
| Contracts | Date | Value | (Depreciation) | |||||||||
| Index Futures | ||||||||||||
| E-Mini S&P 500 Futures | 125 | 12/20/2024 | $ | 35,865,625 | $ | (536,249 | ) | |||||
| NASDAQ 100 E-Mini Futures | 21 | 12/20/2024 | 8,409,135 | (251,896 | ) | |||||||
| Total Futures Contracts | $ | 44,274,760 | $ | (788,145 | ) | |||||||
The average monthly notional value of futures contracts during the year ended October 31, 2024 was $23,811,640.
The accompanying notes are an integral part of the financial statements.
36
| WESTWOOD FUNDS |
| OCTOBER 31, 2024 |
| STATEMENTS OF ASSETS AND LIABILITIES |
| Westwood | Westwood | |||||||||||||||
| Westwood | Westwood | Quality | Quality | |||||||||||||
| Quality Value | Quality MidCap | SMidCap | SmallCap | |||||||||||||
| Fund | Fund | Fund | Fund | |||||||||||||
| ASSETS | ||||||||||||||||
| Investments in unaffiliated securities: | ||||||||||||||||
| At cost | $ | 153,641,992 | $ | 1,715,466 | $ | 92,928,700 | $ | 931,692,380 | ||||||||
| At value (Note 2) | $ | 213,209,297 | $ | 1,992,246 | $ | 104,688,783 | $ | 1,102,317,376 | ||||||||
| Receivable for capital shares sold | 779 | — | 676 | 175,037 | ||||||||||||
| Receivable for investment securities sold | — | 20,668 | — | — | ||||||||||||
| Dividends and interest receivable | 114,886 | 592 | 31,946 | 227,849 | ||||||||||||
| Other assets | 24,891 | 7,110 | 10,835 | 36,181 | ||||||||||||
| Total assets | 213,349,853 | 2,020,616 | 104,732,240 | 1,102,756,443 | ||||||||||||
| LIABILITIES | ||||||||||||||||
| Payable for capital shares redeemed | 1,305 | — | 3,483 | 741,920 | ||||||||||||
| Payable for investment securities purchased | — | 10,166 | 395,032 | 1,671,914 | ||||||||||||
| Payable to Adviser, net of waivers (Note 4) | 75,582 | — | 34,798 | 642,962 | ||||||||||||
| Payable to administrator (Note 4) | 14,643 | 2,667 | 9,255 | 60,865 | ||||||||||||
| Accrued administrative servicing fees — Institutional Shares (Note 4) | 37,581 | 830 | 33,558 | 51,262 | ||||||||||||
| Payable for distribution fees — A Class Shares (Note 4) | 475 | — | — | 2,976 | ||||||||||||
| Payable for distribution fees — C Class Shares (Note 4) | 763 | — | — | 9,499 | ||||||||||||
| Other accrued expenses | 21,100 | 15,470 | 20,230 | 67,190 | ||||||||||||
| Total liabilities | 151,449 | 29,133 | 496,356 | 3,248,588 | ||||||||||||
| CONTINGENCIES AND COMMITMENTS (NOTE 8) | — | — | — | — | ||||||||||||
| NET ASSETS | $ | 213,198,404 | $ | 1,991,483 | $ | 104,235,884 | $ | 1,099,507,855 | ||||||||
| NET ASSETS CONSIST OF: | ||||||||||||||||
| Paid-in capital | $ | 139,550,044 | $ | 1,616,970 | $ | 91,746,937 | $ | 883,718,702 | ||||||||
| Distributable earnings | 73,648,360 | 374,513 | 12,488,947 | 215,789,153 | ||||||||||||
| NET ASSETS | $ | 213,198,404 | $ | 1,991,483 | $ | 104,235,884 | $ | 1,099,507,855 | ||||||||
| NET ASSET VALUE PER SHARE: | ||||||||||||||||
| INSTITUTIONAL SHARES | ||||||||||||||||
| Net assets applicable to Institutional Shares | $ | 210,883,396 | $ | 1,991,483 | $ | 75,452,559 | $ | 455,372,605 | ||||||||
| Institutional Shares of beneficial interest outstanding | 14,481,996 | 164,029 | 4,660,998 | 21,330,954 | ||||||||||||
| Net asset value, offering price and redemption price per share (Note 1) | $ | 14.56 | $ | 12.14 | $ | 16.19 | $ | 21.35 | ||||||||
| A CLASS SHARES | ||||||||||||||||
| Net assets applicable to A Class Shares | $ | 2,137,556 | N/A | N/A | $ | 3,223,852 | ||||||||||
| A Class Shares of beneficial interest outstanding | 146,042 | N/A | N/A | 151,534 | ||||||||||||
| Net asset value, offering price and redemption price per share (Note 1) | $ | 14.64 | N/A | N/A | $ | 21.27 | ||||||||||
| Maximum sales charge | 3.00 | % | N/A | N/A | 4.00 | % | ||||||||||
| Maximum offering price per share | $ | 15.09 | N/A | N/A | $ | 22.16 | ||||||||||
| C CLASS SHARES | ||||||||||||||||
| Net assets applicable to C Class Shares | $ | 176,299 | N/A | N/A | $ | 2,715,018 | ||||||||||
| C Class Shares of beneficial interest outstanding | 12,398 | N/A | N/A | 129,748 | ||||||||||||
| Net asset value, offering price and redemption price per share (Note 1) | $ | 14.22 | N/A | N/A | $ | 20.93 | ||||||||||
| ULTRA CLASS SHARES | ||||||||||||||||
| Net assets applicable to Ultra Class Shares | $ | 1,153 | N/A | $ | 28,783,325 | $ | 638,196,380 | |||||||||
| Ultra Class Shares of beneficial interest outstanding | 79 | N/A | 1,776,284 | 29,856,538 | ||||||||||||
| Net asset value, offering price and redemption price per share (Note 1) | $ | 14.53 | * | N/A | $ | 16.20 | $ | 21.38 | ||||||||
| * | Net Assets divided by Shares do not calculate to the Net Asset Value because Net Assets and Shares are shown rounded. |
Amounts designated as “—” are either $0 or have been rounded to $0.
N/A — Not Applicable
The accompanying notes are an integral part of the financial statements.
37
| WESTWOOD FUNDS |
| OCTOBER 31, 2024 |
| STATEMENTS OF ASSETS AND LIABILITIES |
| Westwood | ||||||||||||
| Westwood | Income | Westwood | ||||||||||
| Quality AllCap | Opportunity | Multi-Asset | ||||||||||
| Fund | Fund | Income Fund | ||||||||||
| ASSETS | ||||||||||||
| Investments in affiliated securities, at cost. | $ | — | $ | — | $ | 524,271 | ||||||
| Investments in unaffiliated securities, at cost | 19,395,733 | 455,333,547 | 91,721,152 | |||||||||
| Investments in affiliated securities, at value (Note 2 and 3) | $ | — | $ | — | $ | 494,588 | ||||||
| Investments in unaffiliated securities, at value (Note 2) | 22,526,563 | 518,418,330 | 96,379,243 | |||||||||
| Receivable for capital shares sold | — | 392,190 | 2,227 | |||||||||
| Receivable for investment securities sold | — | 3,666,173 | — | |||||||||
| Dividends and interest receivable | 8,285 | 3,751,100 | 1,380,292 | |||||||||
| Reclaims receivable | — | — | 1,265 | |||||||||
| Other assets | 21,319 | 31,737 | 24,856 | |||||||||
| Total assets | 22,556,167 | 526,259,530 | 98,282,471 | |||||||||
| LIABILITIES | ||||||||||||
| Written call options, at value (Notes 1 & 4) (premiums received $—, $287,520, $40,075) | — | 368,480 | 52,830 | |||||||||
| Payable for capital shares redeemed | — | 169,916 | 816 | |||||||||
| Payable for investment securities purchased | — | 3,911,868 | 1,001,875 | |||||||||
| Payable to Adviser, net of waivers (Note 4) | — | 281,695 | 622,691 | |||||||||
| Payable to administrator (Note 4) | 3,960 | 30,628 | 8,763 | |||||||||
| Accrued administrative servicing fees — Institutional Shares (Note 4) | 42 | 77,189 | 3,073 | |||||||||
| Payable for distribution fees — A Class Shares (Note 4) | — | 20,597 | 6,886 | |||||||||
| Payable for distribution fees — C Class Shares (Note 4) | — | 27,362 | 217 | |||||||||
| Other accrued expenses | 16,184 | 38,485 | 24,275 | |||||||||
| Total liabilities | 20,186 | 4,926,220 | 1,721,426 | |||||||||
| CONTINGENCIES AND COMMITMENTS (NOTE 8) | — | — | — | |||||||||
| NET ASSETS | $ | 22,535,981 | $ | 521,333,310 | $ | 96,561,045 | ||||||
| NET ASSETS CONSIST OF: | ||||||||||||
| Paid-in capital | $ | 18,404,953 | $ | 479,784,668 | $ | 109,709,478 | ||||||
| Distributable earnings (accumulated deficit) | 4,131,028 | 41,548,642 | (13,148,433 | ) | ||||||||
| NET ASSETS | $ | 22,535,981 | $ | 521,333,310 | $ | 96,561,045 | ||||||
| NET ASSET VALUE PER SHARE: | ||||||||||||
| INSTITUTIONAL SHARES | ||||||||||||
| Net assets applicable to Institutional Shares | $ | 560,860 | $ | 368,843,919 | $ | 88,233,874 | ||||||
| Institutional Shares of beneficial interest outstanding | 46,650 | 30,736,369 | 8,885,205 | |||||||||
| Net asset value, offering price and redemption price per share (Note 1) | $ | 12.02 | $ | 12.00 | $ | 9.93 | ||||||
| A CLASS SHARES | ||||||||||||
| Net assets applicable to A Class Shares | N/A | $ | 43,706,267 | $ | 8,247,909 | |||||||
| A Class Shares of beneficial interest outstanding | N/A | 3,646,421 | 826,223 | |||||||||
| Net asset value, offering price and redemption price per share (Note 1) | N/A | $ | 11.99 | $ | 9.98 | |||||||
| Maximum sales charge | N/A | 3.00 | % | 3.00 | % | |||||||
| Maximum offering price per share | N/A | $ | 12.36 | $ | 10.29 | |||||||
| C CLASS SHARES | ||||||||||||
| Net assets applicable to C Class Shares | N/A | $ | 12,554,618 | $ | 79,262 | |||||||
| C Class Shares of beneficial interest outstanding | N/A | 1,053,073 | 7,912 | |||||||||
| Net asset value, offering price and redemption price per share (Note 1) | N/A | $ | 11.92 | $ | 10.02 | |||||||
| ULTRA SHARES | ||||||||||||
| Net assets applicable to Ultra Shares | $ | 21,975,121 | $ | 96,228,506 | N/A | |||||||
| Ultra Shares of beneficial interest outstanding | 1,825,705 | 8,022,616 | N/A | |||||||||
| Net asset value, offering price and redemption price per share (Note 1) | $ | 12.04 | $ | 11.99 | N/A | |||||||
Amounts designated as “—” are either $0 or have been rounded to $0.
N/A — Not Applicable
The accompanying notes are an integral part of the financial statements.
38
| WESTWOOD FUNDS |
| OCTOBER 31, 2024 |
| STATEMENTS OF ASSETS AND LIABILITIES |
| Westwood | ||||||||||||||||
| Salient MLP | ||||||||||||||||
| Westwood | & Energy | Westwood | Westwood | |||||||||||||
| Alternative | Infrastructure | Global Real | Real Estate | |||||||||||||
| Income Fund | Fund | Estate Fund | Income Fund | |||||||||||||
| ASSETS | ||||||||||||||||
| Investments in affiliated securities, at cost | $ | — | $ | 51,272,530 | $ | — | $ | — | ||||||||
| Investments in unaffiliated securities, at cost | 113,422,509 | 717,529,618 | 14,627,621 | 249,076,704 | ||||||||||||
| Investments in affiliated securities, at value (Note 2 and 3) | $ | — | $ | 52,739,815 | $ | — | $ | — | ||||||||
| Investments in unaffiliated securities, at value (Note 2) | 123,836,554 | 1,092,790,140 | 16,202,866 | 277,957,800 | ||||||||||||
| Unrealized appreciation on swap agreements | 1,127,454 | — | — | — | ||||||||||||
| Receivable for capital shares sold | 91,922 | 651,468 | — | 67,119 | ||||||||||||
| Receivable for investment securities sold | — | 2,299,990 | — | — | ||||||||||||
| Due from broker for swap contracts | 156,934 | — | — | — | ||||||||||||
| Dividends and interest receivable | 613,400 | 4,164,425 | 16,524 | 204,465 | ||||||||||||
| Reclaim receivable | — | — | 7,866 | — | ||||||||||||
| Other assets | 25,546 | 571,883 | 26,799 | 95,053 | ||||||||||||
| Total assets | 125,851,810 | 1,153,217,721 | 16,254,055 | 278,324,437 | ||||||||||||
| LIABILITIES | ||||||||||||||||
| Written call options, at value (Notes 1 & 4) (premiums received $44,511, $596,247, $—, $—) | 83,210 | 606,717 | — | — | ||||||||||||
| Unrealized depreciation on swap agreements | 332,325 | — | — | — | ||||||||||||
| Payable for capital shares redeemed | 23,996 | 658,211 | 23,981 | 788,017 | ||||||||||||
| Payable for investment securities purchased | 1,193,100 | 2,297,901 | — | — | ||||||||||||
| Payable to Adviser, net of waivers (Note 4) | 766,957 | 830,173 | — | 159,426 | ||||||||||||
| Payable to administrator (Note 4) | 11,059 | 77,668 | 4,760 | 19,134 | ||||||||||||
| Payable for tax expense (Note 2) | — | 300,000 | — | — | ||||||||||||
| Accrued administrative servicing fees — Institutional Shares (Note 4) | 20,258 | 152,658 | 308 | 15,774 | ||||||||||||
| Accrued administrative servicing fees — A Class Shares (Note 4) | — | 59,247 | 1,019 | 10,454 | ||||||||||||
| Accrued administrative servicing fees — C Class Shares (Note 4) | — | 5,350 | — | — | ||||||||||||
| Payable for distribution fees — A Class Shares (Note 4) | 116 | 58,281 | 7,164 | 36,585 | ||||||||||||
| Payable for distribution fees — C Class Shares (Note 4) | 4,145 | 29,604 | 1,665 | 23,133 | ||||||||||||
| Other accrued expenses | 31,910 | 85,315 | 25,190 | 34,265 | ||||||||||||
| Total liabilities | 2,467,076 | 5,161,125 | 64,087 | 1,086,788 | ||||||||||||
| CONTINGENCIES AND COMMITMENTS (NOTE 8) | — | — | — | — | ||||||||||||
| NET ASSETS | $ | 123,384,734 | $ | 1,148,056,596 | $ | 16,189,968 | $ | 277,237,649 | ||||||||
| NET ASSETS CONSIST OF: | ||||||||||||||||
| Paid-in capital | $ | 128,613,282 | $ | 1,322,998,161 | $ | 39,732,551 | $ | 248,378,204 | ||||||||
| Distributable earnings (accumulated deficit) | (5,228,548 | ) | (174,941,565 | ) | (23,542,583 | ) | 28,859,445 | |||||||||
| NET ASSETS | $ | 123,384,734 | $ | 1,148,056,596 | $ | 16,189,968 | $ | 277,237,649 | ||||||||
The accompanying notes are an integral part of the financial statements.
39
| WESTWOOD FUNDS |
| OCTOBER 31, 2024 |
| STATEMENTS OF ASSETS AND LIABILITIES |
| Westwood | ||||||||||||||||
| Salient MLP | ||||||||||||||||
| Westwood | & Energy | Westwood | Westwood | |||||||||||||
| Alternative | Infrastructure | Global Real | Real Estate | |||||||||||||
| Income Fund | Fund | Estate Fund | Income Fund | |||||||||||||
| NET ASSET VALUE PER SHARE: | ||||||||||||||||
| INSTITUTIONAL SHARES | ||||||||||||||||
| Net assets applicable to Institutional Shares | $ | 94,690,456 | $ | 972,519,161 | $ | 2,057,091 | $ | 177,944,958 | ||||||||
| Institutional Shares of beneficial interest outstanding | 9,798,527 | 99,254,814 | 159,644 | 9,111,490 | ||||||||||||
| Net asset value, offering price and redemption price per share (Note 1) | $ | 9.66 | $ | 9.80 | $ | 12.89 | $ | 19.53 | ||||||||
| A CLASS SHARES | ||||||||||||||||
| Net assets applicable to A Class Shares | $ | 463,122 | $ | 154,628,736 | $ | 13,710,857 | $ | 94,815,994 | ||||||||
| A Class Shares of beneficial interest outstanding | 47,995 | 15,694,157 | 1,059,823 | 4,834,622 | ||||||||||||
| Net asset value, offering price and redemption price per share (Note 1) | $ | 9.65 | $ | 9.85 | $ | 12.94 | $ | 19.61 | ||||||||
| Maximum sales charge | 3.00 | % | 4.00 | % | 3.00 | % | 3.00 | % | ||||||||
| Maximum offering price per share | $ | 9.95 | $ | 10.26 | $ | 13.34 | $ | 20.22 | ||||||||
| C CLASS SHARES | ||||||||||||||||
| Net assets applicable to C Class Shares | $ | 438,736 | $ | 15,498,606 | $ | 422,020 | $ | 4,476,697 | ||||||||
| C Class Shares of beneficial interest outstanding | 45,407 | 1,581,779 | 32,708 | 237,439 | ||||||||||||
| Net asset value, offering price and redemption price per share (Note 1) | $ | 9.66 | $ | 9.80 | $ | 12.90 | $ | 18.85 | ||||||||
| ULTRA SHARES | ||||||||||||||||
| Net assets applicable to Ultra Shares | $ | 27,792,420 | $ | 5,410,093 | N/A | N/A | ||||||||||
| Ultra Shares of beneficial interest outstanding | 2,875,886 | 552,290 | N/A | N/A | ||||||||||||
| Net asset value, offering price and redemption price per share (Note 1) | $ | 9.66 | $ | 9.80 | N/A | N/A | ||||||||||
Amounts designated as “—” are either $0 or have been rounded to $0.
N/A — Not Applicable
The accompanying notes are an integral part of the financial statements.
40
| WESTWOOD FUNDS |
| OCTOBER 31, 2024 |
| STATEMENTS OF ASSETS AND LIABILITIES |
| Westwood | Westwood | |||||||
| Broadmark | Broadmark | |||||||
| Tactical Growth | Tactical Plus | |||||||
| Fund | Fund | |||||||
| ASSETS | ||||||||
| Investments in unaffiliated securities: | ||||||||
| At cost | $ | 156,180,221 | $ | 69,913,385 | ||||
| At value (Note 2) | $ | 163,939,586 | $ | 69,913,385 | ||||
| Cash | — | 36,436 | ||||||
| Receivable for capital shares sold | 40,084 | — | ||||||
| Cash collateral for futures contracts | — | 2,488,200 | ||||||
| Dividends and interest receivable | 219,211 | 284,437 | ||||||
| Other assets | 84,925 | 29,194 | ||||||
| Total assets | 164,283,806 | 72,751,652 | ||||||
| LIABILITIES | ||||||||
| Variation margin payable on futures contracts | — | 1,005,938 | ||||||
| Payable for capital shares redeemed | 191,927 | 6,076 | ||||||
| Payable to Adviser, net of waivers (Note 4) | 151,105 | 46,602 | ||||||
| Payable to administrator (Note 4) | 13,549 | 8,676 | ||||||
| Accrued administrative servicing fees — Institutional Shares (Note 4) | 11,919 | 3,287 | ||||||
| Accrued administrative servicing fees — A Class Shares (Note 4) | 3,804 | 225 | ||||||
| Accrued administrative servicing fees — C Class Shares (Note 4) | — | 58 | ||||||
| Accrued administrative servicing fees — F Class Shares (Note 4) | — | 6,713 | ||||||
| Payable for distribution fees — A Class Shares (Note 4) | 12,508 | 555 | ||||||
| Payable for distribution fees — C Class Shares (Note 4) | 12,396 | 2,582 | ||||||
| Other accrued expenses | 24,320 | 23,215 | ||||||
| Total liabilities | 421,528 | 1,103,927 | ||||||
| CONTINGENCIES AND COMMITMENTS (NOTE 8) | — | — | ||||||
| NET ASSETS | $ | 163,862,278 | $ | 71,647,725 | ||||
| NET ASSETS CONSIST OF: | ||||||||
| Paid-in capital | $ | 159,027,914 | $ | 71,854,193 | ||||
| Distributable earnings (accumulated deficit) | 4,834,364 | (206,468 | ) | |||||
| NET ASSETS | $ | 163,862,278 | $ | 71,647,725 | ||||
| NET ASSET VALUE PER SHARE: | ||||||||
| INSTITUTIONAL SHARES | ||||||||
| Net assets applicable to Institutional Shares | $ | 144,258,371 | $ | 35,172,151 | ||||
| Institutional Shares of beneficial interest outstanding | 5,335,533 | 3,088,918 | ||||||
| Net asset value, offering price and redemption price per share (Note 1) | $ | 27.04 | $ | 11.39 | ||||
| A CLASS SHARES | ||||||||
| Net assets applicable to A Class Shares | $ | 16,155,533 | $ | 503,763 | ||||
| A Class Shares of beneficial interest outstanding | 643,648 | 45,202 | ||||||
| Net asset value, offering price and redemption price per share (Note 1) | $ | 25.10 | $ | 11.14 | ||||
| Maximum sales charge | 4.00 | % | 3.00 | % | ||||
| Maximum offering price per share | $ | 26.15 | $ | 11.48 | ||||
| C CLASS SHARES | ||||||||
| Net assets applicable to C Class Shares | $ | 3,448,374 | $ | 335,269 | ||||
| C Class Shares of beneficial interest outstanding | 150,226 | 32,442 | ||||||
| Net asset value, offering price and redemption price per share (Note 1) | $ | 22.95 | $ | 10.33 | ||||
| F CLASS SHARES | ||||||||
| Net assets applicable to F Class Shares | N/A | $ | 35,636,542 | |||||
| F Class Shares of beneficial interest outstanding | N/A | 3,048,357 | ||||||
| Net asset value, offering price and redemption price per share (Note 1) | N/A | $ | 11.69 | |||||
Amounts designated as “—” are either $0 or have been rounded to $0.
N/A — Not Applicable.
The accompanying notes are an integral part of the financial statements.
41
| WESTWOOD FUNDS |
| FOR THE YEAR ENDED OCTOBER 31, 2024 |
| STATEMENTS OF OPERATIONS |
| Westwood | Westwood | |||||||||||||||
| Westwood | Westwood | Quality | Quality | |||||||||||||
| Quality Value | Quality MidCap | SMidCap | SmallCap | |||||||||||||
| Fund | Fund | Fund | Fund | |||||||||||||
| INVESTMENT INCOME | ||||||||||||||||
| Dividend income from unaffiliated securities (net of foreign withholding tax of $—, $34, $—, and $20,500, respectively) | $ | 4,445,300 | $ | 38,131 | $ | 4,023,290 | $ | 22,028,595 | ||||||||
| EXPENSES | ||||||||||||||||
| Investment management fees (Note 4) | 1,037,001 | 10,630 | 1,688,049 | 10,038,082 | ||||||||||||
| Administrative service plan fees - Institutional Shares (Note 4) | 142,565 | 2,045 | 281,569 | 543,059 | ||||||||||||
| Administration fees (Note 4) | 58,179 | 2,113 | 61,942 | 319,896 | ||||||||||||
| Distribution fees - A Class (Note 4) | 3,999 | — | — | 6,796 | ||||||||||||
| Distribution fees - C Class (Note 4) | 1,611 | — | — | 21,993 | ||||||||||||
| Registration and filing fees | 58,489 | 2,211 | 34,107 | 89,295 | ||||||||||||
| Legal fees | 17,509 | 152 | 18,128 | 100,751 | ||||||||||||
| Trustees’ fees and expenses (Note 4) | 17,515 | 374 | 21,480 | 99,906 | ||||||||||||
| Audit and tax services fees | 15,332 | 15,332 | 15,332 | 15,332 | ||||||||||||
| Transfer agent fees (Note 4) | 18,633 | 10,041 | 12,221 | 34,287 | ||||||||||||
| Custody fees | 5,761 | 2,066 | 7,829 | 25,062 | ||||||||||||
| Insurance expense | 4,101 | 2,752 | 4,316 | 9,832 | ||||||||||||
| Borrowing costs (Note 2) | 4,796 | — | 38,093 | 10,850 | ||||||||||||
| Compliance fees (Note 4) | 4,165 | 172 | 4,775 | 21,888 | ||||||||||||
| Other expenses | 42,682 | 14,577 | 38,228 | 186,068 | ||||||||||||
| Total expenses | 1,432,338 | 62,465 | 2,226,069 | 11,523,097 | ||||||||||||
| Investment management fees reduced and expense reimbursements by the Adviser (Note 4) | (138,668 | ) | (49,790 | ) | (375,911 | ) | (1,610,873 | ) | ||||||||
| Net expenses | 1,293,670 | 12,675 | 1,850,158 | 9,912,224 | ||||||||||||
| NET INVESTMENT INCOME | 3,151,630 | 25,456 | 2,173,132 | 12,116,371 | ||||||||||||
| REALIZED AND UNREALIZED GAINS ON INVESTMENTS AND FOREIGN CURRENCIES | ||||||||||||||||
| Net realized gains from investment transactions in unaffiliated securities | 14,792,100 | 90,205 | 30,150,397 | 73,539,539 | ||||||||||||
| Net realized gains from in-kind redemptions (Note 9) | — | — | 40,670,720 | — | ||||||||||||
| Net realized gains from foreign currency transactions | — | — | — | 156 | ||||||||||||
| Net change in unrealized appreciation (depreciation) on investment transactions in unaffiliated securities. | 24,331,317 | 331,012 | (3,066,973 | ) | 153,638,732 | |||||||||||
| NET REALIZED AND UNREALIZED GAINS ON INVESTMENTS AND FOREIGN CURRENCIES | 39,123,417 | 421,217 | 67,754,144 | 227,178,427 | ||||||||||||
| NET INCREASE IN NET ASSETS RESULTING FROM OPERATIONS | $ | 42,275,047 | $ | 446,673 | $ | 69,927,276 | $ | 239,294,798 | ||||||||
Amounts designated as “—” are either $0 or have been rounded to $0.
The accompanying notes are an integral part of the financial statements.
42
| WESTWOOD FUNDS |
| FOR THE YEAR ENDED OCTOBER 31, 2024 |
| STATEMENTS OF OPERATIONS |
| Westwood | ||||||||||||
| Westwood | Income | Westwood | ||||||||||
| Quality AllCap | Opportunity | Multi-Asset | ||||||||||
| Fund | Fund | Income Fund(1) | ||||||||||
| INVESTMENT INCOME | ||||||||||||
| Dividend income from affiliated securities (Note 3). | $ | — | $ | — | $ | 44,018 | ||||||
| Dividend income from unaffiliated securities (net of foreign withholding tax of $—, $60,256, and $6,170, respectively) | 437,991 | 6,902,703 | 993,375 | |||||||||
| Interest income (net of foreign withholding tax of $—, $27,696, and $9,133, respectively) | — | 15,841,276 | 5,559,654 | |||||||||
| Total investment income | 437,991 | 22,743,979 | 6,597,047 | |||||||||
| EXPENSES | ||||||||||||
| Investment management fees (Note 4) | 100,544 | 3,393,620 | 742,595 | |||||||||
| Administrative service plan fees - Institutional Shares (Note 4) | 312 | 338,565 | 16,544 | |||||||||
| Administration fees (Note 4) | 7,978 | 146,320 | 29,208 | |||||||||
| Distribution fees - A Class (Note 4) | — | 114,697 | 19,812 | |||||||||
| Distribution fees - C Class (Note 4) | — | 123,700 | 1,666 | |||||||||
| Registration and filing fees | 33,042 | 66,936 | 48,624 | |||||||||
| Legal fees | 1,897 | 50,701 | 9,389 | |||||||||
| Trustees’ fees and expenses (Note 4) | 2,082 | 43,973 | 8,424 | |||||||||
| Audit and tax services fees | 15,333 | 17,532 | 17,532 | |||||||||
| Transfer agent fees (Note 4) | 10,216 | 21,310 | 11,248 | |||||||||
| Custody fees | 3,108 | 16,392 | 9,850 | |||||||||
| Insurance expense | 2,883 | 6,221 | 3,388 | |||||||||
| Borrowing costs (Note 2) | 601 | 9,940 | 4,890 | |||||||||
| Compliance fees (Note 4) | 553 | 9,756 | 1,933 | |||||||||
| Other expenses | 21,449 | 112,734 | 47,567 | |||||||||
| Total expenses | 199,998 | 4,472,397 | 972,670 | |||||||||
| Investment management fees reduced and expense reimbursements by the Adviser (Note 4) | (98,541 | ) | — | (89,835 | ) | |||||||
| Affiliated management fee waived by Adviser (Note 4) | — | — | (2,561 | ) | ||||||||
| Net expenses | 101,457 | 4,472,397 | 880,274 | |||||||||
| NET INVESTMENT INCOME | 336,534 | 18,271,582 | 5,716,773 | |||||||||
| REALIZED AND UNREALIZED GAINS (LOSSES) ON INVESTMENTS AND FOREIGN CURRENCIES | ||||||||||||
| Net realized losses from investment transactions in affiliated securities (Note 3). | — | — | (39,497 | ) | ||||||||
| Net realized gains (losses) from investment transactions in unaffiliated securities | 924,834 | 14,583,509 | (2,168,651 | ) | ||||||||
| Net realized gains from written option contracts | — | 114,334 | 22,867 | |||||||||
| Net realized losses from foreign currency transactions | — | (295,033 | ) | — | ||||||||
| Net change in unrealized appreciation (depreciation) on investment transactions in affiliated securities (Note 3) | — | — | (29,683 | ) | ||||||||
| Net change in unrealized appreciation (depreciation) on investment transactions in unaffiliated securities. | 3,531,197 | 61,349,329 | 13,580,756 | |||||||||
| Net change in unrealized appreciation (depreciation) on currency translations | — | 374,275 | — | |||||||||
| Net change in unrealized appreciation (depreciation) on written option contracts | — | (80,960 | ) | (12,755 | ) | |||||||
| NET REALIZED AND UNREALIZED GAINS ON INVESTMENTS AND FOREIGN CURRENCIES | 4,456,031 | 76,045,454 | 11,353,037 | |||||||||
| NET INCREASE IN NET ASSETS RESULTING FROM OPERATIONS | $ | 4,792,565 | $ | 94,317,036 | $ | 17,069,810 | ||||||
Amounts designated as “—” are either $0 or have been rounded to $0.
| (1) | Effective March 31, 2024, Westwood High Income Fund was renamed as Westwood Multi-Asset Income Fund. |
The accompanying notes are an integral part of the financial statements.
43
| WESTWOOD FUNDS |
| FOR THE YEAR/PERIOD ENDED OCTOBER 31, 2024 |
| STATEMENTS OF OPERATIONS |
| Westwood | Westwood | |||||||||||||||
| Westwood | Salient MLP | Salient MLP | ||||||||||||||
| Alternative | & Energy | & Energy | Westwood | |||||||||||||
| Income | Infrastructure | Infrastructure | Global Real | |||||||||||||
| Fund | Fund(1) | Fund(2) | Estate Fund(3) | |||||||||||||
| INVESTMENT INCOME | ||||||||||||||||
| Distributions from master limited partnerships | $ | — | $ | 15,427,502 | $ | 19,939,537 | $ | — | ||||||||
| Less return of capital on distributions | — | (15,427,502 | ) | (19,939,537 | ) | — | ||||||||||
| Dividends from master limited partnership related companies (net of foreign withholding tax of $—, $1,088,385, $1,344,029 and $— ) | — | 29,221,847 | 31,102,659 | — | ||||||||||||
| Less return of capital on dividends | — | (10,961,457 | ) | (9,165,521 | ) | — | ||||||||||
| Dividend income from affiliated securities (Note 3). | — | 2,783,684 | — | — | ||||||||||||
| Dividend income from unaffiliated securities (net of foreign withholding tax of $—, $—, $— and $24,047) | 193,410 | 290,128 | 457,113 | 590,957 | ||||||||||||
| Interest income | 3,559,142 | — | 2 | — | ||||||||||||
| Total investment income | 3,752,552 | 21,334,202 | 22,394,253 | 590,957 | ||||||||||||
| EXPENSES | ||||||||||||||||
| Investment management fees (Note 4) | 1,017,495 | 7,571,985 | 8,141,323 | 120,375 | ||||||||||||
| Administrative service plan fees - Institutional Shares (Note 4) | 121,018 | 526,644 | 641,419 | 1,052 | ||||||||||||
| Administrative service plan fees - A Class (Note 4) | — | 116,069 | 114,007 | 10,529 | ||||||||||||
| Administrative service plan fees - C Class (Note 4) | — | 12,160 | 9,880 | 1,780 | ||||||||||||
| Administration fees (Note 4) | 42,537 | 324,265 | 353,870 | 7,098 | ||||||||||||
| Distribution fees - A Class Shares (Note 4) | 504 | 290,177 | 347,520 | 35,952 | ||||||||||||
| Distribution fees - C Class Shares (Note 4) | 4,485 | 121,605 | 148,807 | 5,341 | ||||||||||||
| Registration and filing fees | 60,535 | 66,091 | 143,950 | 43,556 | ||||||||||||
| Legal fees | 26,771 | 179,598 | 100,967 | 1,437 | ||||||||||||
| Trustees’ fees and expenses (Note 4) | 10,314 | 69,867 | 71,249 | 1,690 | ||||||||||||
| Audit and tax service fees | 23,532 | 79,253 | 59,826 | 19,832 | ||||||||||||
| Transfer agent fees (Note 4) | 11,201 | 24,081 | 30,590 | 15,265 | ||||||||||||
| Custody fees | 24,971 | 28,414 | 33,840 | 9,714 | ||||||||||||
| Insurance expense | 3,599 | 38,070 | 41,281 | 3,623 | ||||||||||||
| Borrowing costs (Note 2) | 7,095 | 9,770 | 32,996 | — | ||||||||||||
| Compliance fees (Note 4) | 2,348 | 14,907 | 17,675 | 627 | ||||||||||||
| Tax expense (Note 2) | — | 57,375 | 348,777 | 14 | ||||||||||||
| Other expenses | 57,746 | 156,259 | 239,102 | 70,181 | ||||||||||||
| Total expenses | 1,414,151 | 9,686,590 | 10,877,079 | 348,066 | ||||||||||||
| Investment management fees reduced and expense reimbursements by the Adviser (Note 4) | (263,567 | ) | — | (332,497 | ) | (112,955 | ) | |||||||||
| Contractual management fee waived by Adviser (Note 4) | (11,978 | ) | — | — | — | |||||||||||
| Affiliated management fee waived by Adviser (Note 4) | — | (217,435 | ) | — | — | |||||||||||
| Net expenses | 1,138,606 | 9,469,155 | 10,544,582 | 235,111 | ||||||||||||
| NET INVESTMENT INCOME | 2,613,946 | 11,865,047 | 11,849,671 | 355,846 | ||||||||||||
The accompanying notes are an integral part of the financial statements.
44
| WESTWOOD FUNDS |
| FOR THE YEAR/PERIOD ENDED OCTOBER 31, 2024 |
| STATEMENTS OF OPERATIONS |
| Westwood | Westwood | |||||||||||||||
| Westwood | Salient MLP | Salient MLP | ||||||||||||||
| Alternative | & Energy | & Energy | Westwood | |||||||||||||
| Income | Infrastructure | Infrastructure | Global Real | |||||||||||||
| Fund | Fund(1) | Fund(2) | Estate Fund(3) | |||||||||||||
| REALIZED AND UNREALIZED GAINS (LOSSES) ON INVESTMENTS, FOREIGN CURRENCIES, OPTIONS, FUTURES, AND SWAPS | ||||||||||||||||
| Net realized gains (losses) from investment transactions in unaffiliated securities | $ | 2,095,313 | $ | 151,260,093 | $ | 74,327,106 | $ | 493,233 | ||||||||
| Net realized losses from foreign currency transactions | — | (105,771 | ) | (185,884 | ) | (6,097 | ) | |||||||||
| Net realized losses from purchased option contracts | (164,609 | ) | — | — | — | |||||||||||
| Net realized gains from written option contracts | 28,773 | 862,297 | 8,691,149 | — | ||||||||||||
| Net realized losses from swap transactions | (5,449,761 | ) | — | — | — | |||||||||||
| Net change in unrealized appreciation (depreciation) on investment transactions in affiliated securities (Note 3). | — | 1,467,285 | — | — | ||||||||||||
| Net change in unrealized appreciation (depreciation) on investment transactions in unaffiliated securities. | 14,257,622 | 98,537,538 | 21,637,776 | 2,569,315 | ||||||||||||
| Net change in unrealized appreciation (depreciation) on currency translations | — | 749 | (1,498 | ) | (14 | ) | ||||||||||
| Net change in unrealized appreciation (depreciation) on purchased option contracts | (1,908 | ) | — | — | — | |||||||||||
| Net change in unrealized appreciation (depreciation) on written option contracts | (38,699 | ) | (89,530 | ) | 79,060 | — | ||||||||||
| Net change in unrealized appreciation (depreciation) on swap transactions | (2,170,917 | ) | — | — | — | |||||||||||
| NET REALIZED AND UNREALIZED GAINS ON INVESTMENTS, FOREIGN CURRENCIES, OPTIONS, FUTURES, AND SWAPS | 8,555,814 | 251,932,661 | 104,547,709 | 3,056,437 | ||||||||||||
| NET INCREASE IN NET ASSETS RESULTING FROM OPERATIONS | $ | 11,169,760 | $ | 263,797,708 | $ | 116,397,380 | $ | 3,412,283 | ||||||||
Amounts designated as “—” are either $0 or have been rounded to $0.
| (1) | For the Ten Months Ended October 31, 2024. Fund changed fiscal year to October 31. |
| (2) | For the Year Ended December 31, 2023. |
| (3) | Effective March 31, 2024, Westwood Salient Global Real Estate Fund was renamed as Westwood Global Real Estate Fund. |
The accompanying notes are an integral part of the financial statements.
45
| WESTWOOD FUNDS |
| FOR THE YEAR ENDED OCTOBER 31, 2024 |
| STATEMENTS OF OPERATIONS |
| Westwood | Westwood | |||||||||||
| Westwood Real | Broadmark | Broadmark | ||||||||||
| Estate Income | Tactical Growth | Tactical | ||||||||||
| Fund(1) | Fund | Plus Fund | ||||||||||
| INVESTMENT INCOME | ||||||||||||
| Dividend income from unaffiliated securities. | $ | 9,206,241 | $ | 7,076,950 | $ | 3,545,909 | ||||||
| Total investment income | 9,206,241 | 7,076,950 | 3,545,909 | |||||||||
| EXPENSES | ||||||||||||
| Investment management fees (Note 4) | 1,863,393 | 2,138,161 | 1,024,303 | |||||||||
| Administrative service plan fees - Institutional (Note 4) | 80,564 | 86,246 | 35,700 | |||||||||
| Administrative service plan fees - A Class (Note 4) | 96,759 | 13,968 | 541 | |||||||||
| Administrative service plan fees - C Class (Note 4) | 14,047 | 11,061 | 361 | |||||||||
| Administrative service plan fees - F Class (Note 4) | — | — | 36,561 | |||||||||
| Administration fees (Note 4) | 75,467 | 61,838 | 30,060 | |||||||||
| Distribution fees - A Class (Note 4) | 248,627 | 43,651 | 1,352 | |||||||||
| Distribution fees - C Class (Note 4) | 42,142 | 33,182 | 3,611 | |||||||||
| Registration and filing fees | 54,409 | 48,590 | 55,163 | |||||||||
| Legal fees | 29,097 | 22,184 | 11,752 | |||||||||
| Trustees’ fees and expenses (Note 4) | 22,436 | 17,175 | 6,382 | |||||||||
| Audit and tax services fees | 22,032 | 18,192 | 21,432 | |||||||||
| Transfer agent fees (Note 4) | 29,024 | 13,772 | 10,865 | |||||||||
| Custody fees | 6,765 | 5,200 | 3,728 | |||||||||
| Insurance expense | 12,331 | 13,932 | 5,877 | |||||||||
| Borrowing costs (Note 2) | 326 | — | — | |||||||||
| Compliance fees and expenses (Note 4) | 5,374 | 3,926 | 1,495 | |||||||||
| Tax expense (Note 2) | 140 | 20 | 2,090 | |||||||||
| Other expenses | 150,487 | 75,359 | 41,936 | |||||||||
| Total expenses | 2,753,420 | 2,606,457 | 1,293,209 | |||||||||
| Investment management fees reduced and expense reimbursements by the Advisor (Note 4) | — | — | (412,402 | ) | ||||||||
| Prior investment management fees recouped by the Adviser (Note 4) | 72,853 | — | — | |||||||||
| Net expenses | 2,826,273 | 2,606,457 | 880,807 | |||||||||
| NET INVESTMENT INCOME | 6,379,968 | 4,470,493 | 2,665,102 | |||||||||
| REALIZED AND UNREALIZED GAINS (LOSSES) ON INVESTMENTS, OPTIONS, AND FUTURES | ||||||||||||
| Net realized gains (losses) from investment transactions from unaffiliated securities | 12,482,337 | 1,605,604 | (675,941 | ) | ||||||||
| Net realized losses from purchased option contracts | — | — | (7,455 | ) | ||||||||
| Net realized losses from written option contracts | — | — | (6,746 | ) | ||||||||
| Net realized gains (losses) from long futures contracts | — | (4,876,669 | ) | 1,363,398 | ||||||||
| Net realized losses from short futures contracts | — | — | (1,293,577 | ) | ||||||||
| Net change in unrealized appreciation (depreciation) on investment transactions from unaffiliated securities. | 41,116,199 | 13,832,996 | — | |||||||||
| Net change in unrealized appreciation (depreciation) on purchased option contracts | — | — | (57,028 | ) | ||||||||
| Net change in unrealized appreciation (depreciation) on written option contracts | — | — | 1,052 | |||||||||
| Net change in unrealized appreciation (depreciation) on long futures contracts | — | (3,356,008 | ) | (788,145 | ) | |||||||
| Net change in unrealized appreciation (depreciation) on short futures contracts | — | — | (875,603 | ) | ||||||||
| NET REALIZED AND UNREALIZED LOSSES ON INVESTMENTS, OPTIONS AND FUTURES | 53,598,536 | 7,205,923 | (2,340,045 | ) | ||||||||
| NET INCREASE (DECREASE) IN NET ASSETS RESULTING FROM OPERATIONS | $ | 59,978,504 | $ | 11,676,416 | $ | 325,057 | ||||||
Amounts designated as “—” are either $0 or have been rounded to $0.
| (1) | Effective March 31, 2024, Westwood Salient Select Income Fund was renamed as Westwood Real Estate Income Fund. |
The accompanying notes are an integral part of the financial statements.
46
| WESTWOOD FUNDS |
| STATEMENTS OF CHANGES IN NET ASSETS |
| Westwood Quality | Westwood Quality | Westwood Quality | ||||||||||||||||||||||
| Value Fund | MidCap Fund | SMidCap Fund | ||||||||||||||||||||||
| Year Ended | Year Ended | Year Ended | Year Ended | Year Ended | Year Ended | |||||||||||||||||||
| October 31, | October 31, | October 31, | October 31, | October 31, | October 31, | |||||||||||||||||||
| 2024 | 2023 | 2024 | 2023 | 2024 | 2023 | |||||||||||||||||||
| FROM OPERATIONS | ||||||||||||||||||||||||
| Net investment income | $ | 3,151,630 | $ | 3,586,125 | $ | 25,456 | $ | 14,029 | $ | 2,173,132 | $ | 2,971,623 | ||||||||||||
| Net realized gains on investments and foreign currency transactions | 14,792,100 | 5,347,467 | 90,205 | 27,508 | 30,150,397 | 3,559,948 | ||||||||||||||||||
| Net realized gains from in-kind redemptions (Note 9) | — | — | — | — | 40,670,720 | — | ||||||||||||||||||
| Net change in unrealized appreciation (depreciation) on investments and foreign currency translations | 24,331,317 | (8,388,235 | ) | 331,012 | (45,245 | ) | (3,066,973 | ) | (1,947,002 | ) | ||||||||||||||
| Net increase (decrease) in net assets resulting from operations | 42,275,047 | 545,357 | 446,673 | (3,708 | ) | 69,927,276 | 4,584,569 | |||||||||||||||||
| FROM DISTRIBUTIONS TO SHAREHOLDERS | ||||||||||||||||||||||||
| Institutional Shares | (7,516,536 | ) | (3,769,619 | ) | (40,833 | ) | (7,423 | ) | (5,558,912 | ) | (2,978,159 | ) | ||||||||||||
| A Class Shares | (47,334 | ) | (15,237 | ) | N/A | N/A | N/A | N/A | ||||||||||||||||
| C Class Shares | (3,816 | ) | (993 | ) | N/A | N/A | N/A | N/A | ||||||||||||||||
| Ultra Shares | (39 | ) | (14 | ) | N/A | N/A | (3,896,906 | ) | (1,504,912 | ) | ||||||||||||||
| Total distributions | (7,567,725 | ) | (3,785,863 | ) | (40,833 | ) | (7,423 | ) | (9,455,818 | ) | (4,483,071 | ) | ||||||||||||
| CAPITAL SHARE TRANSACTIONS | ||||||||||||||||||||||||
| Institutional Class | ||||||||||||||||||||||||
| Issued | 7,156,002 | 9,104,051 | 49,183 | 1,000,271 | 20,017,079 | 24,438,618 | ||||||||||||||||||
| Reinvestment of dividends | 4,570,154 | 2,563,928 | 40,833 | 7,423 | 5,545,018 | 2,977,375 | ||||||||||||||||||
| Redeemed | (19,151,019 | ) | (74,333,630 | ) | (30,694 | ) | — | (156,295,124 | ) | (60,961,465 | ) | |||||||||||||
| Net increase (decrease) from Institutional Shares capital share transactions | (7,424,863 | ) | (62,665,651 | ) | 59,322 | 1,007,694 | (130,733,027 | ) | (33,545,472 | ) | ||||||||||||||
| A Class | ||||||||||||||||||||||||
| Issued | 724,091 | 344,714 | N/A | N/A | N/A | N/A | ||||||||||||||||||
| Reinvestment of dividends | 47,333 | 15,237 | N/A | N/A | N/A | N/A | ||||||||||||||||||
| Redeemed | (103,273 | ) | (523,461 | ) | N/A | N/A | N/A | N/A | ||||||||||||||||
| Net increase (decrease) from A Class Shares capital share transactions | 668,151 | (163,510 | ) | N/A | N/A | N/A | N/A | |||||||||||||||||
| C Class | ||||||||||||||||||||||||
| Issued | 52,686 | 39,816 | N/A | N/A | N/A | N/A | ||||||||||||||||||
| Reinvestment of dividends | 3,815 | 993 | N/A | N/A | N/A | N/A | ||||||||||||||||||
| Redeemed | (31,506 | ) | (10,356 | ) | N/A | N/A | N/A | N/A | ||||||||||||||||
| Net increase from C Class Shares capital share transactions | 24,995 | 30,453 | N/A | N/A | N/A | N/A | ||||||||||||||||||
The accompanying notes are an integral part of the financial statements.
47
| WESTWOOD FUNDS |
| STATEMENTS OF CHANGES IN NET ASSETS |
| Westwood Quality | Westwood Quality | Westwood Quality | ||||||||||||||||||||||
| Value Fund | MidCap Fund | SMidCap Fund | ||||||||||||||||||||||
| Year Ended | Year Ended | Year Ended | Year Ended | Year Ended | Year Ended | |||||||||||||||||||
| October 31, | October 31, | October 31, | October 31, | October 31, | October 31, | |||||||||||||||||||
| 2024 | 2023 | 2024 | 2023 | 2024 | 2023 | |||||||||||||||||||
| Ultra Class | ||||||||||||||||||||||||
| Issued | $ | — | $ | 1,000 | N/A | N/A | $ | 8,515,742 | $ | 39,329,150 | ||||||||||||||
| Reinvestment of dividends | 39 | 14 | N/A | N/A | 3,896,907 | 1,504,912 | ||||||||||||||||||
| Redeemed | — | — | N/A | N/A | (120,376,338 | ) | (15,423,693 | ) | ||||||||||||||||
| Net increase (decrease) from Ultra Shares capital share transactions | 39 | 1,014 | N/A | N/A | (107,963,689 | ) | 25,410,369 | |||||||||||||||||
| Net increase (decrease) in net assets from capital share transactions | (6,731,678 | ) | (62,797,694 | ) | 59,322 | 1,007,694 | (238,696,716 | ) | (8,135,103 | ) | ||||||||||||||
| TOTAL INCREASE (DECREASE) IN NET ASSETS. | 27,975,644 | (66,038,200 | ) | 465,162 | 996,563 | (178,225,258 | ) | (8,033,605 | ) | |||||||||||||||
| NET ASSETS | ||||||||||||||||||||||||
| Beginning of year | 185,222,760 | 251,260,960 | 1,526,321 | 529,758 | 282,461,142 | 290,494,747 | ||||||||||||||||||
| End of year | $ | 213,198,404 | $ | 185,222,760 | $ | 1,991,483 | $ | 1,526,321 | $ | 104,235,884 | $ | 282,461,142 | ||||||||||||
Amounts designated as “—” are $0 or rounded to $0.
N/A — Not Applicable
The accompanying notes are an integral part of the financial statements.
48
| WESTWOOD FUNDS |
| STATEMENTS OF CHANGES IN NET ASSETS |
| Westwood Quality | Westwood Quality | Westwood Quality | ||||||||||||||||||||||
| Value Fund | MidCap Fund | SMidCap Fund | ||||||||||||||||||||||
| Year Ended | Year Ended | Year Ended | Year Ended | Year Ended | Year Ended | |||||||||||||||||||
| October 31, | October 31, | October 31, | October 31, | October 31, | October 31, | |||||||||||||||||||
| 2024 | 2023 | 2024 | 2023 | 2024 | 2023 | |||||||||||||||||||
| CAPITAL SHARES ACTIVITY | ||||||||||||||||||||||||
| Institutional Shares | ||||||||||||||||||||||||
| Sold | 530,331 | 719,073 | 4,545 | 102,831 | 1,363,803 | 1,845,362 | ||||||||||||||||||
| Issued in reinvestment of dividends to shareholders | 350,332 | 204,787 | 3,852 | 765 | 391,001 | 230,280 | ||||||||||||||||||
| Redeemed | (1,389,271 | ) | (5,881,810 | ) | (2,907 | ) | — | (10,126,998 | ) | (4,676,059 | ) | |||||||||||||
| Net increase (decrease) in shares outstanding | (508,608 | ) | (4,957,950 | ) | 5,490 | 103,596 | (8,372,194 | ) | (2,600,417 | ) | ||||||||||||||
| Shares outstanding at beginning of year | 14,990,604 | 19,948,554 | 158,539 | 54,943 | 13,033,192 | 15,633,609 | ||||||||||||||||||
| Shares outstanding at end of year | 14,481,996 | 14,990,604 | 164,029 | 158,539 | 4,660,998 | 13,033,192 | ||||||||||||||||||
| A Class Shares | ||||||||||||||||||||||||
| Sold | 51,018 | 27,005 | N/A | N/A | N/A | N/A | ||||||||||||||||||
| Issued in reinvestment of dividends to shareholders | 3,607 | 1,208 | N/A | N/A | N/A | N/A | ||||||||||||||||||
| Redeemed | (7,370 | ) | (40,919 | ) | N/A | N/A | N/A | N/A | ||||||||||||||||
| Net increase (decrease) in shares outstanding | 47,255 | (12,706 | ) | N/A | N/A | N/A | N/A | |||||||||||||||||
| Shares outstanding at beginning of year | 98,787 | 111,493 | N/A | N/A | N/A | N/A | ||||||||||||||||||
| Shares outstanding at end of year | 146,042 | 98,787 | N/A | N/A | N/A | N/A | ||||||||||||||||||
| C Class Shares | ||||||||||||||||||||||||
| Sold | 4,010 | 3,211 | N/A | N/A | N/A | N/A | ||||||||||||||||||
| Issued in reinvestment of dividends to shareholders | 299 | 80 | N/A | N/A | N/A | N/A | ||||||||||||||||||
| Redeemed | (2,392 | ) | (816 | ) | N/A | N/A | N/A | N/A | ||||||||||||||||
| Net increase in shares outstanding | 1,917 | 2,475 | N/A | N/A | N/A | N/A | ||||||||||||||||||
| Shares outstanding at beginning of year | 10,481 | 8,006 | N/A | N/A | N/A | N/A | ||||||||||||||||||
| Shares outstanding at end of year | 12,398 | 10,481 | N/A | N/A | N/A | N/A | ||||||||||||||||||
| Ultra Shares | ||||||||||||||||||||||||
| Sold | — | 75 | N/A | N/A | 567,320 | 3,038,302 | ||||||||||||||||||
| Issued in reinvestment of dividends to shareholders | 3 | 1 | N/A | N/A | 274,415 | 116,635 | ||||||||||||||||||
| Redeemed | — | — | N/A | N/A | (7,960,374 | ) | (1,153,074 | ) | ||||||||||||||||
| Net increase (decrease) in shares outstanding | 3 | 76 | N/A | N/A | (7,118,639 | ) | 2,001,863 | |||||||||||||||||
| Shares outstanding at beginning of year | 76 | — | N/A | N/A | 8,894,923 | 6,893,060 | ||||||||||||||||||
| Shares outstanding at end of year | 79 | 76 | N/A | N/A | 1,776,284 | 8,894,923 | ||||||||||||||||||
Amounts designated as “—” are $0 or rounded to $0.
N/A — Not Applicable
The accompanying notes are an integral part of the financial statements.
49
| WESTWOOD FUNDS |
| STATEMENTS OF CHANGES IN NET ASSETS |
| Westwood Quality | Westwood Quality | |||||||||||||||
| SmallCap Fund | AllCap Fund | |||||||||||||||
| Year Ended | Year Ended | Year Ended | Year Ended | |||||||||||||
| October 31, | October 31, | October 31, | October 31, | |||||||||||||
| 2024 | 2023 | 2024 | 2023 | |||||||||||||
| FROM OPERATIONS | ||||||||||||||||
| Net investment income | $ | 12,116,371 | $ | 15,956,563 | $ | 336,534 | $ | 349,248 | ||||||||
| Net realized gains on investments and foreign currency transactions | 73,539,695 | 33,100,857 | 924,834 | 920,915 | ||||||||||||
| Net change in unrealized appreciation (depreciation) on investments and foreign currency translations | 153,638,732 | (62,278,167 | ) | 3,531,197 | (823,745 | ) | ||||||||||
| Net increase (decrease) in net assets resulting from operations | 239,294,798 | (13,220,747 | ) | 4,792,565 | 446,418 | |||||||||||
| FROM DISTRIBUTIONS TO SHAREHOLDERS | ||||||||||||||||
| Institutional Shares | (19,668,695 | ) | (16,723,396 | ) | (7,343 | ) | (9,305 | ) | ||||||||
| A Class Shares | (91,955 | ) | (180,873 | ) | N/A | N/A | ||||||||||
| C Class Shares | (54,222 | ) | (19,411 | ) | N/A | N/A | ||||||||||
| Ultra Shares | (27,901,992 | ) | (20,405,337 | ) | (755,489 | ) | (356,874 | ) | ||||||||
| Total distributions | (47,716,864 | ) | (37,329,017 | ) | (762,832 | ) | (366,179 | ) | ||||||||
| CAPITAL SHARE TRANSACTIONS | ||||||||||||||||
| Institutional Shares | ||||||||||||||||
| Issued | 103,683,222 | 86,126,162 | 294,950 | 43,080 | ||||||||||||
| Reinvestment of dividends | 18,554,793 | 15,875,942 | 7,343 | 9,305 | ||||||||||||
| Redeemed | (174,839,553 | ) | (130,270,468 | ) | (1,807 | ) | (420,000 | ) | ||||||||
| Net increase (decrease) from Institutional Shares capital share transactions | (52,601,538 | ) | (28,268,364 | ) | 300,486 | (367,615 | ) | |||||||||
| A Class Shares | ||||||||||||||||
| Issued | 1,568,260 | 4,741,194 | N/A | N/A | ||||||||||||
| Reinvestment of dividends | 90,168 | 179,473 | N/A | N/A | ||||||||||||
| Redeemed | (1,006,292 | ) | (3,968,342 | ) | N/A | N/A | ||||||||||
| Net increase from A Class Shares capital share transactions | 652,136 | 952,325 | N/A | N/A | ||||||||||||
| C Class Shares | ||||||||||||||||
| Issued | 1,784,217 | 531,871 | N/A | N/A | ||||||||||||
| Reinvestment of dividends | 53,520 | 19,351 | N/A | N/A | ||||||||||||
| Proceeds from redemption fees | 57 | — | N/A | N/A | ||||||||||||
| Redeemed | (406,832 | ) | (198,654 | ) | N/A | N/A | ||||||||||
| Net increase from C Class Shares capital share transactions | 1,430,962 | 352,568 | N/A | N/A | ||||||||||||
| Ultra Shares | ||||||||||||||||
| Issued | 127,543,686 | 204,933,278 | 88,473 | 534,109 | ||||||||||||
| Reinvestment of dividends | 26,372,777 | 19,108,062 | 755,489 | 356,874 | ||||||||||||
| Redeemed | (234,574,289 | ) | (96,958,597 | ) | (2,988,530 | ) | (2,555,865 | ) | ||||||||
| Net increase (decrease) from Ultra Shares capital share transactions | (80,657,826 | ) | 127,082,743 | (2,144,568 | ) | (1,664,882 | ) | |||||||||
| Net increase (decrease) in net assets from capital share transactions | (131,176,266 | ) | 100,119,272 | (1,844,082 | ) | (2,032,497 | ) | |||||||||
| TOTAL INCREASE (DECREASE) INCREASE IN NET ASSETS | 60,401,668 | 49,569,508 | 2,185,651 | (1,952,258 | ) | |||||||||||
| NET ASSETS | ||||||||||||||||
| Beginning of year | 1,039,106,187 | 989,536,679 | 20,350,330 | 22,302,588 | ||||||||||||
| End of year | $ | 1,099,507,855 | $ | 1,039,106,187 | $ | 22,535,981 | $ | 20,350,330 | ||||||||
Amounts designated as “—” are $0 or rounded to $0.
N/A — Not Applicable
The accompanying notes are an integral part of the financial statements.
50
| WESTWOOD FUNDS |
| STATEMENTS OF CHANGES IN NET ASSETS |
| Westwood Quality | Westwood Quality | |||||||||||||||
| SmallCap Fund | AllCap Fund | |||||||||||||||
| Year Ended | Year Ended | Year Ended | Year Ended | |||||||||||||
| October 31, | October 31, | October 31, | October 31, | |||||||||||||
| 2024 | 2023 | 2024 | 2023 | |||||||||||||
| CAPITAL SHARES ACTIVITY | ||||||||||||||||
| Institutional Shares | ||||||||||||||||
| Sold | 5,111,017 | 4,544,630 | 26,435 | 4,274 | ||||||||||||
| Issued in reinvestment of dividends to shareholders | 937,383 | 843,146 | 688 | 916 | ||||||||||||
| Redeemed | (8,407,338 | ) | (6,911,021 | ) | (169 | ) | (40,619 | ) | ||||||||
| Net increase (decrease) in shares outstanding | (2,358,938 | ) | (1,523,245 | ) | 26,954 | (35,429 | ) | |||||||||
| Shares outstanding at beginning of year | 23,689,892 | 25,213,137 | 19,696 | 55,125 | ||||||||||||
| Shares outstanding at end of year | 21,330,954 | 23,689,892 | 46,650 | 19,696 | ||||||||||||
| A Class Shares | ||||||||||||||||
| Sold | 76,469 | 242,058 | N/A | N/A | ||||||||||||
| Issued in reinvestment of dividends to shareholders | 4,587 | 9,556 | N/A | N/A | ||||||||||||
| Redeemed | (49,697 | ) | (214,005 | ) | N/A | N/A | ||||||||||
| Net increase in shares outstanding | 31,359 | 37,609 | N/A | N/A | ||||||||||||
| Shares outstanding at beginning of year | 120,175 | 82,566 | N/A | N/A | ||||||||||||
| Shares outstanding at end of year | 151,534 | 120,175 | N/A | N/A | ||||||||||||
| C Class Shares | ||||||||||||||||
| Sold | 89,247 | 29,355 | N/A | N/A | ||||||||||||
| Issued in reinvestment of dividends to shareholders | 2,757 | 1,035 | N/A | N/A | ||||||||||||
| Redeemed | (20,046 | ) | (10,613 | ) | N/A | N/A | ||||||||||
| Net increase in shares outstanding | 71,958 | 19,777 | N/A | N/A | ||||||||||||
| Shares outstanding at beginning of year | 57,790 | 38,013 | N/A | N/A | ||||||||||||
| Shares outstanding at end of year | 129,748 | 57,790 | N/A | N/A | ||||||||||||
| Ultra Shares | ||||||||||||||||
| Sold | 6,244,418 | 10,760,890 | 8,087 | 51,176 | ||||||||||||
| Issued in reinvestment of dividends to shareholders | 1,329,195 | 1,014,667 | 70,819 | 35,125 | ||||||||||||
| Redeemed | (11,351,350 | ) | (5,173,649 | ) | (264,765 | ) | (243,514 | ) | ||||||||
| Net increase (decrease) in shares outstanding | (3,777,737 | ) | 6,601,908 | (185,859 | ) | (157,213 | ) | |||||||||
| Shares outstanding at beginning of year | 33,634,275 | 27,032,367 | 2,011,564 | 2,168,777 | ||||||||||||
| Shares outstanding at end of year | 29,856,538 | 33,634,275 | 1,825,705 | 2,011,564 | ||||||||||||
N/A — Not Applicable
The accompanying notes are an integral part of the financial statements.
51
| WESTWOOD FUNDS |
| STATEMENTS OF CHANGES IN NET ASSETS |
| Westwood Income | Westwood Multi-Asset | Westwood Alternative | ||||||||||||||||||||||
| Opportunity Fund | Income Fund(1) | Income Fund | ||||||||||||||||||||||
| Year Ended | Year Ended | Year Ended | Year Ended | Year Ended | Year Ended | |||||||||||||||||||
| October 31, | October 31, | October 31, | October 31, | October 31, | October 31, | |||||||||||||||||||
| 2024 | 2023 | 2024 | 2023 | 2024 | 2023 | |||||||||||||||||||
| FROM OPERATIONS | ||||||||||||||||||||||||
| Net investment income | $ | 18,271,582 | $ | 20,426,095 | $ | 5,716,773 | $ | 5,703,330 | $ | 2,613,946 | $ | 4,300,189 | ||||||||||||
| Net realized gains (losses) on investments, futures, purchased options, written options, swap agreements and foreign currency transactions | 14,402,810 | (35,038,111 | ) | (2,185,281 | ) | (4,636,082 | ) | (3,490,284 | ) | (2,639,482 | ) | |||||||||||||
| Net change in unrealized appreciation (depreciation) on investments, purchased options, written options, swap agreements and foreign currency translations | 61,642,644 | 33,959,301 | 13,538,318 | 3,184,796 | 12,046,098 | 4,397,283 | ||||||||||||||||||
| Net increase in net assets resulting from operations | 94,317,036 | 19,347,285 | 17,069,810 | 4,252,044 | 11,169,760 | 6,057,990 | ||||||||||||||||||
| DISTRIBUTIONS TO SHAREHOLDERS | ||||||||||||||||||||||||
| From distributable earnings | ||||||||||||||||||||||||
| Institutional Shares | (14,315,602 | ) | (17,315,754 | ) | (5,190,565 | ) | (5,297,552 | ) | (631,694 | ) | (10,467,327 | ) | ||||||||||||
| A Class Shares | (1,638,250 | ) | (1,651,574 | ) | (445,751 | ) | (267,232 | ) | (1,484 | ) | (5,106 | ) | ||||||||||||
| C Class Shares | (367,521 | ) | (328,686 | ) | (8,093 | ) | (8,822 | ) | (2,414 | ) | (29,517 | ) | ||||||||||||
| Ultra Shares | (2,844,706 | ) | (1,392,781 | ) | N/A | N/A | (236,854 | ) | (11,434,466 | ) | ||||||||||||||
| From return of capital | ||||||||||||||||||||||||
| Institutional Shares | (2,747,330 | ) | — | — | — | (2,229,470 | ) | (571,062 | ) | |||||||||||||||
| A Class Shares | (314,399 | ) | — | — | — | (5,237 | ) | (279 | ) | |||||||||||||||
| C Class Shares | (70,531 | ) | — | — | — | (8,521 | ) | (1,610 | ) | |||||||||||||||
| Ultra Shares | (545,932 | ) | — | N/A | N/A | (835,944 | ) | (623,825 | ) | |||||||||||||||
| Total distributions | (22,844,271 | ) | (20,688,795 | ) | (5,644,409 | ) | (5,573,606 | ) | (3,951,618 | ) | (23,133,192 | ) | ||||||||||||
| CAPITAL SHARE TRANSACTIONS | ||||||||||||||||||||||||
| Institutional Shares | ||||||||||||||||||||||||
| Issued | 54,246,666 | 53,359,284 | 12,126,618 | 14,912,793 | 34,420,579 | 59,137,372 | ||||||||||||||||||
| Reinvestment of dividends | 16,679,788 | 16,747,625 | 5,088,025 | 5,224,536 | 2,860,830 | 11,038,264 | ||||||||||||||||||
| Proceeds from redemption fees | — | — | — | — | 98 | 4,061 | ||||||||||||||||||
| Redeemed | (147,921,947 | ) | (261,438,623 | ) | (33,308,391 | ) | (21,894,900 | ) | (34,375,735 | ) | (42,566,506 | ) | ||||||||||||
| Net increase (decrease) from Institutional Shares capital share transactions | (76,995,493 | ) | (191,331,714 | ) | (16,093,748 | ) | (1,757,571 | ) | 2,905,772 | 27,613,191 | ||||||||||||||
| A Class Shares | ||||||||||||||||||||||||
| Issued | 5,638,892 | 5,516,681 | 680,201 | 5,132,380 | 421,791 | — | ||||||||||||||||||
| Reinvestment of dividends | 1,928,395 | 1,633,004 | 375,643 | 215,118 | 6,721 | 5,385 | ||||||||||||||||||
| Proceeds from redemption fees | — | 3,913 | — | 947 | — | — | ||||||||||||||||||
| Redeemed | (14,445,761 | ) | (17,948,667 | ) | (791,103 | ) | (322,313 | ) | (8,725 | ) | (388 | ) | ||||||||||||
| Net increase (decrease) from A Class Shares capital share transactions | (6,878,474 | ) | (10,795,069 | ) | 264,741 | 5,026,132 | 419,787 | 4,997 | ||||||||||||||||
| C Class Shares | ||||||||||||||||||||||||
| Issued | 1,699,798 | 1,259,828 | — | — | 15,928 | 345,278 | ||||||||||||||||||
| Reinvestment of dividends | 437,952 | 328,617 | 8,093 | 8,822 | 10,935 | 31,127 | ||||||||||||||||||
| Redeemed | (2,869,801 | ) | (2,602,021 | ) | (147,540 | ) | (8,814 | ) | (57,173 | ) | (64,804 | ) | ||||||||||||
| Net increase (decrease) from C Class Shares capital share transactions | (732,051 | ) | (1,013,576 | ) | (139,447 | ) | 8 | (30,310 | ) | 311,601 | ||||||||||||||
The accompanying notes are an integral part of the financial statements.
52
| WESTWOOD FUNDS |
| STATEMENTS OF CHANGES IN NET ASSETS |
| Westwood Income | Westwood Multi-Asset | Westwood Alternative | ||||||||||||||||||||||
| Opportunity Fund | Income Fund(1) | Income Fund | ||||||||||||||||||||||
| Year Ended | Year Ended | Year Ended | Year Ended | Year Ended | Year Ended | |||||||||||||||||||
| October 31, | October 31, | October 31, | October 31, | October 31, | October 31, | |||||||||||||||||||
| 2024 | 2023 | 2024 | 2023 | 2024 | 2023 | |||||||||||||||||||
| Ultra Shares | ||||||||||||||||||||||||
| Issued | $ | 22,024,494 | $ | 64,406,281 | N/A | N/A | $ | 3,029,294 | $ | 4,105,935 | ||||||||||||||
| Reinvestment of dividends | 3,390,638 | 1,392,781 | N/A | N/A | 1,072,798 | 12,042,350 | ||||||||||||||||||
| Proceeds from redemption fees | — | — | N/A | N/A | — | 350 | ||||||||||||||||||
| Redeemed | (77,160 | ) | — | N/A | N/A | (32,700,046 | ) | (41,769,748 | ) | |||||||||||||||
| Net increase (decrease) from Ultra Shares capital share transactions | 25,337,972 | 65,799,062 | N/A | N/A | (28,597,954 | ) | (25,621,113 | ) | ||||||||||||||||
| Net increase (decrease) in net assets from capital share transactions | (59,268,046 | ) | (137,341,297 | ) | (15,968,454 | ) | 3,268,569 | (25,302,705 | ) | 2,308,676 | ||||||||||||||
| TOTAL INCREASE (DECREASE) IN NET ASSETS | 12,204,719 | (138,682,807 | ) | (4,543,053 | ) | 1,947,007 | (18,084,563 | ) | (14,766,526 | ) | ||||||||||||||
| NET ASSETS | ||||||||||||||||||||||||
| Beginning of year | 509,128,591 | 647,811,398 | 101,104,098 | 99,157,091 | 141,469,297 | 156,235,823 | ||||||||||||||||||
| End of year | $ | 521,333,310 | $ | 509,128,591 | $ | 96,561,045 | $ | 101,104,098 | $ | 123,384,734 | $ | 141,469,297 | ||||||||||||
| (1) | Effective March 31, 2024, Westwood High Income Fund was renamed as Westwood Multi-Asset Income Fund. |
Amounts designated as “—” are $0 or rounded to $0.
N/A — Not Applicable
The accompanying notes are an integral part of the financial statements.
53
| WESTWOOD FUNDS |
| STATEMENTS OF CHANGES IN NET ASSETS |
| Westwood Income | Westwood Multi-Asset | Westwood Alternative | ||||||||||||||||||||||
| Opportunity Fund | Income Fund(1) | Income Fund | ||||||||||||||||||||||
| Year Ended | Year Ended | Year Ended | Year Ended | Year Ended | Year Ended | |||||||||||||||||||
| October 31, | October 31, | October 31, | October 31, | October 31, | October 31, | |||||||||||||||||||
| 2024 | 2023 | 2024 | 2023 | 2024 | 2023 | |||||||||||||||||||
| CAPITAL SHARES ACTIVITY | ||||||||||||||||||||||||
| Institutional Shares | ||||||||||||||||||||||||
| Sold | 4,673,569 | 4,838,900 | 1,242,224 | 1,623,816 | 3,630,305 | 6,338,546 | ||||||||||||||||||
| Issued in reinvestment of dividends to shareholders | 1,421,693 | 1,545,353 | 527,373 | 571,313 | 302,758 | 1,206,506 | ||||||||||||||||||
| Redeemed | (12,795,020 | ) | (23,702,388 | ) | (3,488,694 | ) | (2,392,566 | ) | (3,642,815 | ) | (4,512,326 | ) | ||||||||||||
| Net increase (decrease) in shares outstanding | (6,699,758 | ) | (17,318,135 | ) | (1,719,097 | ) | (197,437 | ) | 290,248 | 3,032,726 | ||||||||||||||
| Shares outstanding at beginning of year | 37,436,127 | 54,754,262 | 10,604,302 | 10,801,739 | 9,508,279 | 6,475,553 | ||||||||||||||||||
| Shares outstanding at end of year | 30,736,369 | 37,436,127 | 8,885,205 | 10,604,302 | 9,798,527 | 9,508,279 | ||||||||||||||||||
| A Class Shares | ||||||||||||||||||||||||
| Sold | 491,049 | 499,718 | 69,623 | 551,412 | 44,515 | — | ||||||||||||||||||
| Issued in reinvestment of dividends to shareholders | 164,489 | 150,887 | 38,700 | 23,455 | 708 | 589 | ||||||||||||||||||
| Redeemed | (1,249,840 | ) | (1,638,857 | ) | (80,091 | ) | (34,837 | ) | (922 | ) | (42 | ) | ||||||||||||
| Net increase (decrease) in shares outstanding | (594,302 | ) | (988,252 | ) | 28,232 | 540,030 | 44,301 | 547 | ||||||||||||||||
| Shares outstanding at beginning of year | 4,240,723 | 5,228,975 | 797,991 | 257,961 | 3,694 | 3,147 | ||||||||||||||||||
| Shares outstanding at end of year | 3,646,421 | 4,240,723 | 826,223 | 797,991 | 47,995 | 3,694 | ||||||||||||||||||
| C Class Shares | ||||||||||||||||||||||||
| Sold | 147,061 | 115,317 | — | — | 1,698 | 37,143 | ||||||||||||||||||
| Issued in reinvestment of dividends to shareholders | 37,502 | 30,526 | 838 | 957 | 1,157 | 3,399 | ||||||||||||||||||
| Redeemed | (249,494 | ) | (238,567 | ) | (15,215 | ) | (956 | ) | (6,014 | ) | (7,000 | ) | ||||||||||||
| Net increase (decrease) in shares outstanding | (64,931 | ) | (92,724 | ) | (14,377 | ) | 1 | (3,159 | ) | 33,542 | ||||||||||||||
| Shares outstanding at beginning of year | 1,118,004 | 1,210,728 | 22,289 | 22,288 | 48,566 | 15,024 | ||||||||||||||||||
| Shares outstanding at end of year | 1,053,073 | 1,118,004 | 7,912 | 22,289 | 45,407 | 48,566 | ||||||||||||||||||
| Ultra Shares | ||||||||||||||||||||||||
| Sold | 1,858,673 | 5,753,908 | N/A | N/A | 319,184 | 443,014 | ||||||||||||||||||
| Issued in reinvestment of dividends to shareholders | 288,053 | 128,741 | N/A | N/A | 113,613 | 1,316,438 | ||||||||||||||||||
| Redeemed | (6,759 | ) | — | N/A | N/A | (3,494,832 | ) | (4,353,901 | ) | |||||||||||||||
| Net increase (decrease) in shares outstanding | 2,139,967 | 5,882,649 | N/A | N/A | (3,062,035 | ) | (2,594,449 | ) | ||||||||||||||||
| Shares outstanding at beginning of year | 5,882,649 | — | N/A | N/A | 5,937,921 | 8,532,370 | ||||||||||||||||||
| Shares outstanding at end of year | 8,022,616 | 5,882,649 | N/A | N/A | 2,875,886 | 5,937,921 | ||||||||||||||||||
| (1) | Effective March 31, 2024, Westwood High Income Fund was renamed as Westwood Multi-Asset Income Fund. |
Amounts designated as “—” are $0 or rounded to $0.
N/A — Not Applicable
The accompanying notes are an integral part of the financial statements.
54
| WESTWOOD FUNDS |
| STATEMENTS OF CHANGES IN NET ASSETS |
| Westwood Salient MLP & Energy | ||||||||||||||||||||||||
| Infrastructure Fund | Westwood Global Real Estate Fund(1) | |||||||||||||||||||||||
| Ten Months | Ten Months | |||||||||||||||||||||||
| Ended | Year Ended | Year Ended | Year Ended | Ended | Year Ended | |||||||||||||||||||
| October 31, | December 31, | December 31, | October 31, | October 31, | December 31, | |||||||||||||||||||
| 2024(2) | 2023 | 2022 | 2024 | 2023(2) | 2022 | |||||||||||||||||||
| FROM OPERATIONS | ||||||||||||||||||||||||
| Net investment income | $ | 11,865,047 | $ | 11,849,671 | $ | 4,192,893 | $ | 355,846 | $ | 254,860 | $ | 439,337 | ||||||||||||
| Net realized gains (losses) on investments, purchased options, and written options and foreign currency transactions | 152,016,619 | 82,832,371 | 3,431,642 | 487,136 | (1,454,948 | ) | (1,273,203 | ) | ||||||||||||||||
| Net change in unrealized appreciation (depreciation) on investments, purchased options, and written options and foreign currency translations | 99,916,042 | 21,715,338 | 106,655,035 | 2,569,301 | 281,685 | (5,505,436 | ) | |||||||||||||||||
| Net increase (decrease) in net assets resulting from operations | 263,797,708 | 116,397,380 | 114,279,570 | 3,412,283 | (918,403 | ) | (6,339,302 | ) | ||||||||||||||||
| DISTRIBUTIONS TO SHAREHOLDERS | ||||||||||||||||||||||||
| From distributable earnings | ||||||||||||||||||||||||
| Institutional Shares | (33,180,127 | ) | (27,341,988 | ) | — | (47,661 | ) | (31,451 | ) | (65,104 | ) | |||||||||||||
| A Class Shares | (5,204,696 | ) | (4,936,471 | ) | — | (286,718 | ) | (202,138 | ) | (339,643 | ) | |||||||||||||
| C Class Shares | (459,392 | ) | (460,833 | ) | — | (9,141 | ) | (9,458 | ) | (18,838 | ) | |||||||||||||
| Ultra Shares | (193,623 | ) | (847,726 | ) | — | N/A | N/A | N/A | ||||||||||||||||
| Investor Shares | N/A | N/A | N/A | N/A | N/A | (8,930 | ) | |||||||||||||||||
| From return of capital | ||||||||||||||||||||||||
| Institutional Shares | — | (16,281,710 | ) | (32,026,521 | ) | (6,629 | ) | (11,986 | ) | (9,386 | ) | |||||||||||||
| A Class Shares | — | (2,957,920 | ) | (5,015,402 | ) | (39,880 | ) | (77,040 | ) | (50,743 | ) | |||||||||||||
| C Class Shares | — | (277,766 | ) | (573,190 | ) | (1,271 | ) | (3,604 | ) | (2,716 | ) | |||||||||||||
| Ultra Shares | — | (488,726 | ) | (1,453,169 | ) | N/A | N/A | N/A | ||||||||||||||||
| Total distributions | (39,037,838 | ) | (53,593,140 | ) | (39,068,282 | ) | (391,300 | ) | (335,677 | ) | (495,360 | ) | ||||||||||||
| CAPITAL SHARE TRANSACTIONS | ||||||||||||||||||||||||
| Institutional Shares | ||||||||||||||||||||||||
| Issued | 123,526,743 | 119,568,014 | 326,083,981 | 230,007 | 59,527 | 473,444 | ||||||||||||||||||
| Reinvestment of dividends | 29,953,122 | 38,786,838 | 28,139,077 | 54,195 | 42,853 | 70,414 | ||||||||||||||||||
| Redeemed | (110,022,101 | ) | (250,245,155 | ) | (207,307,366 | ) | (412,823 | ) | (769,167 | ) | (736,257 | ) | ||||||||||||
| Net increase (decrease) from Institutional Shares capital share transactions | 43,457,764 | (91,890,303 | ) | 146,915,692 | (128,621 | ) | (666,787 | ) | (192,399 | ) | ||||||||||||||
| A Class Shares | ||||||||||||||||||||||||
| Issued | 12,910,727 | 7,283,399 | 27,097,263 | 337,446 | 78,445 | 1,082,573 | ||||||||||||||||||
| Proceeds from shares issued in connection with | ||||||||||||||||||||||||
| acquisition from Plan of Reorganization (Note 8) | — | — | 161,677,813 | — | — | — | ||||||||||||||||||
| Shares exchanged from Investor Class | — | — | — | — | — | 375,371 | ||||||||||||||||||
| Reinvestment of dividends | 4,967,732 | 7,558,882 | 4,811,951 | 303,207 | 260,215 | 364,099 | ||||||||||||||||||
| Redeemed | (28,790,959 | ) | (40,811,580 | ) | (137,702,835 | ) | (3,324,544 | ) | (1,752,978 | ) | (3,395,911 | ) | ||||||||||||
| Net increase (decrease) from A Class Shares capital share transactions | (10,912,500 | ) | (25,969,299 | ) | 55,884,192 | (2,683,891 | ) | (1,414,318 | ) | (1,573,868 | ) | |||||||||||||
| C Class Shares | ||||||||||||||||||||||||
| Issued | 3,365,690 | 361,392 | 1,630,960 | 2,500 | 82,100 | 302,955 | ||||||||||||||||||
| Reinvestment of dividends | 455,306 | 726,366 | 564,938 | 7,374 | 10,654 | 17,334 | ||||||||||||||||||
| Redeemed | (5,278,700 | ) | (4,082,510 | ) | (6,447,136 | ) | (695,392 | ) | (117,944 | ) | (440,370 | ) | ||||||||||||
| Net decrease from C Class Shares capital share transactions | (1,457,704 | ) | (2,994,752 | ) | (4,251,238 | ) | (685,518 | ) | (25,190 | ) | (120,081 | ) | ||||||||||||
| (1) | Effective March 31, 2024, Westwood Salient Global Real Estate was renamed as Westwood Global Real Estate Fund. |
| (2) | Fund changed fiscal year to October 31. |
Amounts designated as “—” are $0 or rounded to $0.
N/A — Not Applicable
The accompanying notes are an integral part of the financial statements.
55
| WESTWOOD FUNDS |
| STATEMENTS OF CHANGES IN NET ASSETS |
| Westwood Salient MLP & Energy | ||||||||||||||||||||||||
| Infrastructure Fund | Westwood Global Real Estate Fund(1) | |||||||||||||||||||||||
| Ten Months | Ten Months | |||||||||||||||||||||||
| Ended | Year Ended | Year Ended | Year Ended | Ended | Year Ended | |||||||||||||||||||
| October 31, | December 31, | December 31, | October 31, | October 31, | December 31, | |||||||||||||||||||
| 2024(2) | 2023 | 2022 | 2024 | 2023(2) | 2022 | |||||||||||||||||||
| Ultra Shares | ||||||||||||||||||||||||
| Issued | $ | 14,007 | $ | 53,597 | $ | 1,425,412 | N/A | N/A | N/A | |||||||||||||||
| Reinvestment of dividends | 11,882 | 595,134 | 572,600 | N/A | N/A | N/A | ||||||||||||||||||
| Redeemed | (54,815 | ) | (27,961,154 | ) | (4,533,909 | ) | N/A | N/A | N/A | |||||||||||||||
| Net decrease from C Class Shares capital share transactions | (28,926 | ) | (27,312,423 | ) | (2,535,897 | ) | N/A | N/A | N/A | |||||||||||||||
| Investor Shares | ||||||||||||||||||||||||
| Issued | N/A | N/A | N/A | N/A | N/A | 135,493 | ||||||||||||||||||
| Reinvestment of dividends | N/A | N/A | N/A | N/A | N/A | 8,318 | ||||||||||||||||||
| Redeemed | N/A | N/A | N/A | N/A | N/A | (342,437 | ) | |||||||||||||||||
| Shares exchanged to A Class | N/A | N/A | N/A | N/A | N/A | (375,371 | ) | |||||||||||||||||
| Net decrease from Investor Shares capital share transactions | N/A | N/A | N/A | N/A | N/A | (573,997 | ) | |||||||||||||||||
| Net increase (decrease) in net assets from capital share transactions | 31,058,634 | (148,166,777 | ) | 196,012,749 | (3,498,030 | ) | (2,106,295 | ) | (2,460,345 | ) | ||||||||||||||
| TOTAL INCREASE (DECREASE) IN NET ASSETS | 255,818,504 | (85,362,537 | ) | 271,224,037 | (477,047 | ) | (3,360,375 | ) | (9,295,007 | ) | ||||||||||||||
| NET ASSETS | ||||||||||||||||||||||||
| Beginning of period | 892,238,092 | 977,600,629 | 706,376,592 | 16,667,015 | 20,027,390 | 29,322,397 | ||||||||||||||||||
| End of period | $ | 1,148,056,596 | $ | 892,238,092 | $ | 977,600,629 | $ | 16,189,968 | $ | 16,667,015 | $ | 20,027,390 | ||||||||||||
| (1) | Effective March 31, 2024, Westwood Salient Global Real Estate was renamed as Westwood Global Real Estate Fund. |
| (2) | Fund changed fiscal year to October 31. |
Amounts designated as “—” are $0 or rounded to $0.
N/A — Not Applicable
The accompanying notes are an integral part of the financial statements.
56
| WESTWOOD FUNDS |
| STATEMENTS OF CHANGES IN NET ASSETS |
| Westwood Salient MLP & Energy | ||||||||||||||||||||||||
| Infrastructure Fund | Westwood Global Real Estate Fund(1) | |||||||||||||||||||||||
| Ten Months | Ten Months | |||||||||||||||||||||||
| Ended | Year Ended | Year Ended | Year Ended | Ended | Year Ended | |||||||||||||||||||
| October 31, | December 31, | December 31, | October 31, | October 31, | December 31, | |||||||||||||||||||
| 2024(2) | 2023 | 2022 | 2024 | 2023(2) | 2022 | |||||||||||||||||||
| CAPITAL SHARES ACTIVITY | ||||||||||||||||||||||||
| Institutional Shares | ||||||||||||||||||||||||
| Sold | 14,088,500 | 15,987,827 | 44,603,290 | 18,379 | 5,031 | 37,995 | ||||||||||||||||||
| Issued in reinvestment of dividends to shareholders | 3,470,697 | 5,260,813 | 3,777,997 | 4,315 | 3,743 | 5,798 | ||||||||||||||||||
| Redeemed | (12,702,215 | ) | (33,706,817 | ) | (28,712,439 | ) | (33,210 | ) | (64,872 | ) | (59,582 | ) | ||||||||||||
| Net increase (decrease) in shares outstanding | 4,856,982 | (12,458,177 | ) | 19,668,848 | (10,516 | ) | (56,098 | ) | (15,789 | ) | ||||||||||||||
| Shares outstanding at beginning of period | 94,397,832 | 106,856,009 | 87,187,161 | 170,160 | 226,258 | 242,047 | ||||||||||||||||||
| Shares outstanding at end of period | 99,254,814 | 94,397,832 | 106,856,009 | 159,644 | 170,160 | 226,258 | ||||||||||||||||||
| A Class Shares | ||||||||||||||||||||||||
| Sold | 1,434,937 | 967,455 | 3,635,503 | 27,101 | 6,736 | 83,390 | ||||||||||||||||||
| Proceeds form shares issued with acquisition from Plan of Reorganization (Note 8) | — | — | 21,251,027 | — | — | — | ||||||||||||||||||
| Issued in reinvestment of dividends to shareholders | 574,680 | — | — | 24,005 | 22,646 | 30,062 | ||||||||||||||||||
| Redeemed | (3,393,716 | ) | 1,018,471 | 641,659 | (270,221 | ) | (149,559 | ) | (270,148 | ) | ||||||||||||||
| Shares issued in connection with exchange of Investor Shares | — | (5,538,192 | ) | (18,980,423 | ) | — | — | 31,545 | ||||||||||||||||
| Net increase (decrease) in shares outstanding | (1,384,099 | ) | (3,552,266 | ) | 6,547,766 | (219,115 | ) | (120,177 | ) | (125,151 | ) | |||||||||||||
| Shares outstanding at beginning of period | 17,078,256 | 20,630,522 | 14,082,756 | 1,278,938 | 1,399,115 | 1,524,266 | ||||||||||||||||||
| Shares outstanding at end of period | 15,694,157 | 17,078,256 | 20,630,522 | 1,059,823 | 1,278,938 | 1,399,115 | ||||||||||||||||||
| C Class Shares | ||||||||||||||||||||||||
| Sold | 377,740 | 47,319 | 225,461 | 201 | 6,559 | 21,373 | ||||||||||||||||||
| Issued in reinvestment of dividends to shareholders | 52,822 | 98,343 | 76,445 | 590 | 928 | 1,441 | ||||||||||||||||||
| Redeemed | (600,366 | ) | (543,165 | ) | (878,720 | ) | (56,805 | ) | (9,992 | ) | (35,931 | ) | ||||||||||||
| Net decrease in shares outstanding | (169,804 | ) | (397,503 | ) | (576,814 | ) | (56,014 | ) | (2,505 | ) | (13,117 | ) | ||||||||||||
| Shares outstanding at beginning of period | 1,751,583 | 2,149,086 | 2,725,900 | 88,722 | 91,227 | 104,344 | ||||||||||||||||||
| Shares outstanding at end of period | 1,581,779 | 1,751,583 | 2,149,086 | 32,708 | 88,722 | 91,227 | ||||||||||||||||||
| Ultra Shares | ||||||||||||||||||||||||
| Sold | 1,606 | 7,111 | 199,506 | N/A | N/A | N/A | ||||||||||||||||||
| Issued in reinvestment of dividends to shareholders | 1,380 | 80,958 | 77,005 | N/A | N/A | N/A | ||||||||||||||||||
| Redeemed | (2,950 | ) | (3,741,953 | ) | (627,149 | ) | N/A | N/A | N/A | |||||||||||||||
| Net increase (decrease) in shares outstanding | 36 | (3,653,884 | ) | (350,638 | ) | N/A | N/A | N/A | ||||||||||||||||
| Shares outstanding at beginning of period | 552,254 | 4,206,138 | 4,556,776 | N/A | N/A | N/A | ||||||||||||||||||
| Shares outstanding at end of period | 552,290 | 552,254 | 4,206,138 | N/A | N/A | N/A | ||||||||||||||||||
| Investor Shares | ||||||||||||||||||||||||
| Sold | N/A | N/A | N/A | N/A | N/A | 9,405 | ||||||||||||||||||
| Issued in reinvestment of dividends to shareholders | N/A | N/A | N/A | N/A | N/A | 662 | ||||||||||||||||||
| Redeemed | N/A | N/A | N/A | N/A | N/A | (26,474 | ) | |||||||||||||||||
| Shares exchanged for A Class Shares | N/A | N/A | N/A | N/A | N/A | (31,415 | ) | |||||||||||||||||
| Net decrease in shares outstanding | N/A | N/A | N/A | N/A | N/A | (47,822 | ) | |||||||||||||||||
| Shares outstanding at beginning of period | N/A | N/A | N/A | N/A | N/A | 47,822 | ||||||||||||||||||
| Shares outstanding at end of period | N/A | N/A | N/A | N/A | N/A | — | ||||||||||||||||||
| (1) | Effective March 31, 2024, Westwood Salient Global Real Estate was renamed as Westwood Global Real Estate Fund. |
| (2) | Fund changed fiscal year to October 31. |
Amounts designated as “—” are $0 or rounded to $0.
N/A — Not Applicable
The accompanying notes are an integral part of the financial statements.
57
| WESTWOOD FUNDS |
| STATEMENTS OF CHANGES IN NET ASSETS |
| Westwood Real Estate | Westwood Broadmark Tactical | |||||||||||||||||||||||
| Income Fund(1) | Growth Fund | |||||||||||||||||||||||
| Ten Months | Ten Months | |||||||||||||||||||||||
| Year Ended | Ended | Year Ended | Year Ended | Ended | Year Ended | |||||||||||||||||||
| October 31, | October 31, | December 31, | October 31, | October 31, | December 31, | |||||||||||||||||||
| 2024 | 2023(2) | 2022 | 2024 | 2023(2) | 2022 | |||||||||||||||||||
| FROM OPERATIONS | ||||||||||||||||||||||||
| Net investment income (loss) | $ | 6,379,968 | $ | 9,748,315 | $ | 8,841,841 | $ | 4,470,493 | $ | 5,460,655 | $ | (773,929 | ) | |||||||||||
| Net realized gains (losses) from investments, futures and foreign currency transactions | 12,482,337 | 4,468,437 | (2,566,542 | ) | (3,271,065 | ) | 2,299,216 | 14,378,624 | ||||||||||||||||
| Net change in unrealized appreciation (depreciation) on investments, futures and foreign currency translations | 41,116,199 | (13,271,953 | ) | (46,688,258 | ) | 10,476,988 | (4,529,487 | ) | (38,986,046 | ) | ||||||||||||||
| Net increase (decrease) in net assets resulting from operations | 59,978,504 | 944,799 | (40,412,959 | ) | 11,676,416 | 3,230,384 | (25,381,351 | ) | ||||||||||||||||
| DISTRIBUTIONS TO SHAREHOLDERS | ||||||||||||||||||||||||
| From distributable earnings | ||||||||||||||||||||||||
| Institutional Shares | (11,575,870 | ) | (6,558,250 | ) | (4,587,481 | ) | (7,979,746 | ) | — | (6,735,312 | ) | |||||||||||||
| A Class Shares | (6,662,836 | ) | (4,856,495 | ) | (3,780,834 | ) | (751,357 | ) | — | (818,486 | ) | |||||||||||||
| C Class Shares | (348,719 | ) | (250,766 | ) | (246,967 | ) | (173,655 | ) | — | (259,189 | ) | |||||||||||||
| Investor Shares | N/A | N/A | (226,733 | ) | N/A | N/A | — | |||||||||||||||||
| From return of capital | ||||||||||||||||||||||||
| Institutional Shares | — | (257,080 | ) | (2,929,176 | ) | — | — | — | ||||||||||||||||
| A Class Shares | — | (190,372 | ) | (2,414,128 | ) | — | — | — | ||||||||||||||||
| C Class Shares | — | (9,830 | ) | (157,692 | ) | — | — | — | ||||||||||||||||
| Investor Shares | N/A | N/A | (144,772 | ) | N/A | N/A | — | |||||||||||||||||
| Total distributions | (18,587,425 | ) | (12,122,793 | ) | (14,487,783 | ) | (8,904,758 | ) | — | (7,812,987 | ) | |||||||||||||
| CAPITAL SHARE TRANSACTIONS | ||||||||||||||||||||||||
| Institutional Class | ||||||||||||||||||||||||
| Issued | 48,683,696 | 52,986,286 | 39,575,329 | 35,410,257 | 47,886,289 | 86,724,446 | ||||||||||||||||||
| Reinvestment of dividends | 11,562,313 | 6,804,600 | 7,217,721 | 7,964,224 | — | 6,717,078 | ||||||||||||||||||
| Redeemed | (46,537,152 | ) | (22,299,802 | ) | (54,098,954 | ) | (117,097,899 | ) | (71,540,822 | ) | (129,638,672 | ) | ||||||||||||
| Net increase (decrease) from Institutional Shares capital share transactions | 13,708,857 | 37,491,084 | (7,305,904 | ) | (73,723,418 | ) | (23,654,533 | ) | (36,197,148 | ) | ||||||||||||||
| A Class | ||||||||||||||||||||||||
| Issued | 5,974,199 | 6,702,953 | 5,804,611 | 2,219,487 | 2,367,336 | 5,969,905 | ||||||||||||||||||
| Shares exchanged from Investor Class | — | — | 7,912,733 | — | — | 7,335,253 | ||||||||||||||||||
| Reinvestment of dividends | 5,757,609 | 4,316,540 | 4,946,000 | 729,546 | — | 772,858 | ||||||||||||||||||
| Redeemed | (28,372,262 | ) | (15,244,259 | ) | (17,663,523 | ) | (7,599,131 | ) | (9,156,328 | ) | (6,388,881 | ) | ||||||||||||
| Net increase (decrease) from A Class Shares capital share transactions | (16,640,454 | ) | (4,224,766 | ) | 999,821 | (4,650,098 | ) | (6,788,992 | ) | 7,689,135 | ||||||||||||||
| C Class | ||||||||||||||||||||||||
| Issued | 1,165,400 | 931,919 | 382,301 | 751,331 | 343,187 | 2,036,277 | ||||||||||||||||||
| Reinvestment of dividends | 331,566 | 242,036 | 367,092 | 172,002 | — | 254,902 | ||||||||||||||||||
| Redeemed | (3,188,237 | ) | (1,274,471 | ) | (4,470,668 | ) | (3,774,527 | ) | (1,938,797 | ) | (2,514,488 | ) | ||||||||||||
| Net decrease from C Class Shares capital share transactions | (1,691,271 | ) | (100,516 | ) | (3,721,275 | ) | (2,851,194 | ) | (1,595,610 | ) | (223,309 | ) | ||||||||||||
| (1) | Effective March 31, 2024, Westwood Salient Select Income Fund was renamed as Westwood Real Estate Income Fund. |
| (2) | Fund changed fiscal year to October 31. |
Amounts designated as “—” are $0 or rounded to $0.
N/A — Not Applicable
The accompanying notes are an integral part of the financial statements.
58
| WESTWOOD FUNDS |
| STATEMENTS OF CHANGES IN NET ASSETS |
| Westwood Real Estate | Westwood Broadmark Tactical | |||||||||||||||||||||||
| Income Fund(1) | Growth Fund | |||||||||||||||||||||||
| Ten Months | Ten Months | |||||||||||||||||||||||
| Year Ended | Ended | Year Ended | Year Ended | Ended | Year Ended | |||||||||||||||||||
| October 31, | October 31, | December 31, | October 31, | October 31, | December 31, | |||||||||||||||||||
| 2024 | 2023(2) | 2022 | 2024 | 2023(2) | 2022 | |||||||||||||||||||
| Investor Class | ||||||||||||||||||||||||
| Issued | N/A | N/A | $ | 2,676,209 | N/A | N/A | $ | 22,511,744 | ||||||||||||||||
| Reinvestment of dividends | N/A | N/A | 365,958 | N/A | N/A | — | ||||||||||||||||||
| Redeemed | N/A | N/A | (3,295,504 | ) | N/A | N/A | (19,381,817 | ) | ||||||||||||||||
| Shares exchanged to A Class | N/A | N/A | (7,912,733 | ) | N/A | N/A | (7,335,253 | ) | ||||||||||||||||
| Net decrease from Investor Shares capital share transactions | N/A | N/A | (8,166,070 | ) | N/A | N/A | (4,205,326 | ) | ||||||||||||||||
| Net increase (decrease) in net assets from capital share transactions | (4,622,868 | ) | 33,165,802 | (18,193,428 | ) | (81,224,710 | ) | (32,039,135 | ) | (32,936,648 | ) | |||||||||||||
| TOTAL INCREASE (DECREASE) IN NET ASSETS | 36,768,211 | 21,987,808 | (73,094,170 | ) | (78,453,052 | ) | (28,808,751 | ) | (66,130,986 | ) | ||||||||||||||
| NET ASSETS | ||||||||||||||||||||||||
| Beginning of period | 240,469,438 | 218,481,630 | 291,575,800 | 242,315,330 | 271,124,081 | 337,255,067 | ||||||||||||||||||
| End of period | $ | 277,237,649 | $ | 240,469,438 | $ | 218,481,630 | $ | 163,862,278 | $ | 242,315,330 | $ | 271,124,081 | ||||||||||||
| CAPITAL SHARES ACTIVITY | ||||||||||||||||||||||||
| Institutional Shares | ||||||||||||||||||||||||
| Sold | 2,615,219 | 2,996,731 | 1,999,336 | 1,355,988 | 1,837,415 | 3,163,746 | ||||||||||||||||||
| Issued in reinvestment of dividends to shareholders | 622,745 | 393,446 | 393,116 | 308,306 | — | 257,656 | ||||||||||||||||||
| Redeemed | (2,510,717 | ) | (1,266,003 | ) | (2,798,890 | ) | (4,492,502 | ) | (2,733,946 | ) | (4,698,546 | ) | ||||||||||||
| Net increase (decrease) in shares outstanding | 727,247 | 2,124,174 | (406,438 | ) | (2,828,208 | ) | (896,531 | ) | (1,277,144 | ) | ||||||||||||||
| Shares outstanding at beginning of period | 8,384,243 | 6,260,069 | 6,666,507 | 8,163,741 | 9,060,272 | 10,337,416 | ||||||||||||||||||
| Shares outstanding at end of period | 9,111,490 | 8,384,243 | 6,260,069 | 5,335,533 | 8,163,741 | 9,060,272 | ||||||||||||||||||
| A Class Shares | ||||||||||||||||||||||||
| Sold | 322,610 | 378,510 | 293,830 | 90,584 | 113,413 | 238,306 | ||||||||||||||||||
| Issued in reinvestment of dividends to shareholders | 309,331 | 248,569 | 269,441 | 30,349 | — | 31,778 | ||||||||||||||||||
| Redeemed | (1,520,068 | ) | (859,797 | ) | (909,441 | ) | (313,722 | ) | (392,281 | ) | (253,164 | ) | ||||||||||||
| Shares issued in connection with exchange of Investor Shares | — | — | 448,845 | — | — | 293,979 | ||||||||||||||||||
| Net increase (decrease) in shares outstanding | (888,127 | ) | (232,718 | ) | 102,675 | (192,789 | ) | (278,868 | ) | 310,899 | ||||||||||||||
| Shares outstanding at beginning of period | 5,722,749 | 5,955,467 | 5,852,792 | 836,437 | 1,115,305 | 804,406 | ||||||||||||||||||
| Shares outstanding at end of period | 4,834,622 | 5,722,749 | 5,955,467 | 643,648 | 836,437 | 1,115,305 | ||||||||||||||||||
| C Class Shares | ||||||||||||||||||||||||
| Sold | 65,366 | 54,073 | 21,541 | 33,535 | 15,193 | 85,819 | ||||||||||||||||||
| Issued in reinvestment of dividends to shareholders | 18,563 | 14,441 | 20,451 | 7,801 | — | 11,369 | ||||||||||||||||||
| Redeemed | (177,323 | ) | (74,391 | ) | (241,088 | ) | (168,977 | ) | (86,744 | ) | (105,134 | ) | ||||||||||||
| Net decrease in shares outstanding | (93,394 | ) | (5,877 | ) | (199,096 | ) | (127,641 | ) | (71,551 | ) | (7,946 | ) | ||||||||||||
| Shares outstanding at beginning of period | 330,833 | 336,710 | 535,806 | 277,867 | 349,418 | 357,364 | ||||||||||||||||||
| Shares outstanding at end of period | 237,439 | 330,833 | 336,710 | 150,226 | 277,867 | 349,418 | ||||||||||||||||||
| (1) | Effective March 31, 2024, Westwood Salient Select Income Fund was renamed as Westwood Real Estate Income Fund. |
| (2) | Fund changed fiscal year to October 31. |
Amounts designated as “—” are $0 or rounded to $0.
N/A — Not Applicable
The accompanying notes are an integral part of the financial statements.
59
| WESTWOOD FUNDS |
| STATEMENTS OF CHANGES IN NET ASSETS |
| Westwood Real Estate | Westwood Broadmark Tactical | |||||||||||||||||||||||
| Income Fund(1) | Growth Fund | |||||||||||||||||||||||
| Ten Months | Ten Months | |||||||||||||||||||||||
| Year Ended | Ended | Year Ended | Year Ended | Ended | Year Ended | |||||||||||||||||||
| October 31, | October 31, | December 31, | October 31, | October 31, | December 31, | |||||||||||||||||||
| 2024 | 2023(2) | 2022 | 2024 | 2023(2) | 2022 | |||||||||||||||||||
| Investor Shares | ||||||||||||||||||||||||
| Sold | N/A | N/A | 135,787 | N/A | N/A | 861,114 | ||||||||||||||||||
| Issued in reinvestment of dividends to shareholders | N/A | N/A | 19,397 | N/A | N/A | — | ||||||||||||||||||
| Redeemed | N/A | N/A | (169,323 | ) | N/A | N/A | (750,528 | ) | ||||||||||||||||
| Shares exchanged for A Class Shares | N/A | N/A | (450,660 | ) | N/A | N/A | (287,438 | ) | ||||||||||||||||
| Net decrease in shares outstanding | N/A | N/A | (464,799 | ) | N/A | N/A | (176,852 | ) | ||||||||||||||||
| Shares outstanding at beginning of period | N/A | N/A | 464,799 | N/A | N/A | 176,852 | ||||||||||||||||||
| Shares outstanding at end of period | N/A | N/A | — | N/A | N/A | — | ||||||||||||||||||
| (1) | Effective March 31, 2024, Westwood Salient Select Income Fund was renamed as Westwood Real Estate Income Fund. |
| (2) | Fund changed fiscal year to October 31. |
Amounts designated as “—” are $0 or rounded to $0.
N/A — Not Applicable
The accompanying notes are an integral part of the financial statements.
60
| WESTWOOD FUNDS |
| STATEMENTS OF CHANGES IN NET ASSETS |
| Westwood Broadmark Tactical Plus Fund | ||||||||||||
| Ten Months | ||||||||||||
| Year Ended | Ended | Year Ended | ||||||||||
| October 31, | October 31, | December 31, | ||||||||||
| 2024 | 2023(1) | 2022 | ||||||||||
| FROM OPERATIONS | ||||||||||||
| Net investment income | $ | 2,665,102 | $ | 2,313,424 | $ | 331,413 | ||||||
| Net realized gains (losses) on investments, futures, purchased options, and written options | (620,321 | ) | 319,416 | 8,980,184 | ||||||||
| Net change in unrealized appreciation (depreciation) on investments, futures, purchased options, and written options | (1,719,724 | ) | 972,305 | (10,522,511 | ) | |||||||
| Net increase (decrease) in net assets resulting from operations | 325,057 | 3,605,145 | (1,210,914 | ) | ||||||||
| FROM DISTRIBUTIONS TO SHAREHOLDERS | ||||||||||||
| Institutional Shares | (1,440,029 | ) | — | (2,385,920 | ) | |||||||
| A Class Shares | (23,687 | ) | — | (40,913 | ) | |||||||
| C Class Shares | (11,420 | ) | — | (30,908 | ) | |||||||
| F Class Shares | (1,638,589 | ) | — | (2,661,204 | ) | |||||||
| Total distributions | (3,113,725 | ) | — | (5,118,945 | ) | |||||||
| CAPITAL SHARE TRANSACTIONS | ||||||||||||
| Institutional Class | ||||||||||||
| Issued | 5,873,899 | 7,525,146 | 8,068,184 | |||||||||
| Reinvestment of dividends | 1,440,028 | — | 2,385,919 | |||||||||
| Redeemed | (7,011,056 | ) | (7,415,427 | ) | (3,820,145 | ) | ||||||
| Net increase from Institutional Shares capital share transactions | 302,871 | 109,719 | 6,633,958 | |||||||||
| A Class | ||||||||||||
| Issued | 29,423 | 86,412 | 70,960 | |||||||||
| Reinvestment of dividends | 23,687 | — | 40,913 | |||||||||
| Redeemed | (142,864 | ) | (79,103 | ) | (53,076 | ) | ||||||
| Net increase (decrease) from A Class Shares capital share transactions | (89,754 | ) | 7,309 | 58,797 | ||||||||
| C Class | ||||||||||||
| Issued | 88,015 | — | 15 | |||||||||
| Reinvestment of dividends | 11,420 | — | 30,908 | |||||||||
| Redeemed | (155,299 | ) | (24,130 | ) | (123,653 | ) | ||||||
| Net decrease from C Class Shares capital share transactions | (55,864 | ) | (24,130 | ) | (92,730 | ) | ||||||
| Class F Shares | ||||||||||||
| Issued | 2,472,567 | 6,566,976 | 5,280,910 | |||||||||
| Reinvestment of dividends | 1,638,589 | — | 2,661,204 | |||||||||
| Redeemed | (7,221,927 | ) | (5,339,791 | ) | (7,164,813 | ) | ||||||
| Net increase (decrease) from F Class Shares capital share transactions | (3,110,771 | ) | 1,227,185 | 777,301 | ||||||||
| Net increase (decrease) in net assets from capital share transactions | (2,953,518 | ) | 1,320,083 | 7,377,326 | ||||||||
| TOTAL INCREASE (DECREASE) IN NET ASSETS | (5,742,186 | ) | 4,925,228 | 1,047,467 | ||||||||
| NET ASSETS | ||||||||||||
| Beginning of period | $ | 77,389,911 | $ | 72,464,683 | $ | 71,417,216 | ||||||
| End of period | $ | 71,647,725 | $ | 77,389,911 | $ | 72,464,683 | ||||||
| (1) | Fund changed fiscal year to October 31. |
Amounts designated as “—” are $0 or rounded to $0.
The accompanying notes are an integral part of the financial statements.
61
| WESTWOOD FUNDS |
| STATEMENTS OF CHANGES IN NET ASSETS |
| Westwood Broadmark Tactical Plus Fund | ||||||||||||
| Ten Months | ||||||||||||
| Year Ended | Ended | Year Ended | ||||||||||
| October 31, | October 31, | December 31, | ||||||||||
| 2024 | 2023(1) | 2022 | ||||||||||
| CAPITAL SHARES ACTIVITY | ||||||||||||
| Institutional Shares | ||||||||||||
| Sold | 516,528 | 662,702 | 659,284 | |||||||||
| Issued in reinvestment of dividends to shareholders | 128,141 | — | 211,143 | |||||||||
| Redeemed | (616,248 | ) | (650,561 | ) | (317,193 | ) | ||||||
| Net increase in shares outstanding | 28,421 | 12,141 | 553,234 | |||||||||
| Shares outstanding at beginning of period | 3,060,497 | 3,048,356 | 2,495,122 | |||||||||
| Shares outstanding at end of period | 3,088,918 | 3,060,497 | 3,048,356 | |||||||||
| A Class Shares | ||||||||||||
| Sold | 2,618 | 7,729 | 5,931 | |||||||||
| Issued in reinvestment of dividends to shareholders | 2,148 | — | 3,689 | |||||||||
| Redeemed | (12,843 | ) | (7,137 | ) | (4,490 | ) | ||||||
| Net increase (decrease) in shares outstanding | (8,077 | ) | 592 | 5,130 | ||||||||
| Shares outstanding at beginning of period | 53,279 | 52,687 | 47,557 | |||||||||
| Shares outstanding at end of period | 45,202 | 53,279 | 52,687 | |||||||||
| C Class Shares | ||||||||||||
| Sold | 8,565 | — | 1 | |||||||||
| Issued in reinvestment of dividends to shareholders | 1,110 | — | 2,983 | |||||||||
| Redeemed | (14,933 | ) | (2,299 | ) | (10,994 | ) | ||||||
| Net decrease in shares outstanding | (5,258 | ) | (2,299 | ) | (8,010 | ) | ||||||
| Shares outstanding at beginning of period | 37,700 | 39,999 | 48,009 | |||||||||
| Shares outstanding at end of period | 32,442 | 37,700 | 39,999 | |||||||||
| Class F Shares | ||||||||||||
| Sold | 210,414 | 566,784 | 435,032 | |||||||||
| Issued in reinvestment of dividends to shareholders | 142,387 | — | 230,208 | |||||||||
| Redeemed | (620,664 | ) | (456,195 | ) | (577,435 | ) | ||||||
| Net increase (decrease) in shares outstanding | (267,863 | ) | 110,589 | 87,805 | ||||||||
| Shares outstanding at beginning of period | 3,316,220 | 3,205,631 | 3,117,826 | |||||||||
| Shares outstanding at end of period | 3,048,357 | 3,316,220 | 3,205,631 | |||||||||
| (1) | Fund changed fiscal year to October 31. |
Amounts designated as “—” are $0 or rounded to $0.
The accompanying notes are an integral part of the financial statements.
62
| WESTWOOD FUNDS |
| FINANCIAL HIGHLIGHTS |
SELECTED PER SHARE DATA FOR A SHARE OUTSTANDING THROUGHOUT EACH YEAR OR PERIOD
Westwood Quality Value Fund (1)
| Westwood Quality Value Fund - Institutional Shares | Year Ended October 31, 2024 | Year Ended October 31, 2023 | Year Ended October 31, 2022 | Year Ended October 31, 2021 | Year Ended October 31, 2020 | |||||||||||||||
| Net asset value at beginning of year | $ | 12.27 | $ | 12.52 | $ | 15.46 | $ | 11.80 | $ | 13.16 | ||||||||||
| Net investment income (a) | 0.21 | 0.19 | 0.18 | 0.13 | 0.20 | |||||||||||||||
| Net realized and unrealized gains (losses) on investments | 2.58 | (0.25 | ) | (0.74 | ) | 4.28 | (0.95 | ) | ||||||||||||
| Total from investment operations | 2.79 | (0.06 | ) | (0.56 | ) | 4.41 | (0.75 | ) | ||||||||||||
| Less distributions from: | ||||||||||||||||||||
| Net investment income | (0.23 | ) | (0.19 | ) | (0.10 | ) | (0.17 | ) | (0.21 | ) | ||||||||||
| Net realized gains | (0.27 | ) | — | (2.28 | ) | (0.58 | ) | (0.40 | ) | |||||||||||
| Total distributions | (0.50 | ) | (0.19 | ) | (2.38 | ) | (0.75 | ) | (0.61 | ) | ||||||||||
| Net asset value at end of year | $ | 14.56 | $ | 12.27 | $ | 12.52 | $ | 15.46 | $ | 11.80 | ||||||||||
| Total return (b) | 23.22 | % | (0.51 | %) | (4.37 | )% | 38.80 | % | (6.11 | )% | ||||||||||
| Net assets at end of year (in 000s) | $ | 210,883 | $ | 183,878 | $ | 249,760 | $ | 206,730 | $ | 172,349 | ||||||||||
| Ratio of net expenses to average net assets (c) | 0.62 | % | 0.64 | % | 0.65 | % | 0.65 | % | 0.65 | % | ||||||||||
| Ratio of gross expenses to average net assets | 0.69 | % | 0.70 | % | 0.69 | % | 0.76 | % | 0.77 | % | ||||||||||
| Ratio of net investment income to average net assets (c) | 1.52 | % | 1.52 | % | 1.38 | % | 0.91 | % | 1.66 | % | ||||||||||
| Portfolio turnover rate (d) | 42 | % | 57 | % | 77 | % | 72 | % | 52 | % | ||||||||||
| Westwood Quality Value Fund - A Class Shares | Year Ended October 31, 2024 | Year Ended October 31, 2023 | Year Ended October 31, 2022 | Year Ended October 31, 2021 | Year Ended October 31, 2020 | |||||||||||||||
| Net asset value at beginning of year | $ | 12.33 | $ | 12.58 | $ | 15.53 | $ | 11.84 | $ | 13.20 | ||||||||||
| Net investment income (a) | 0.18 | 0.17 | 0.15 | 0.08 | 0.18 | |||||||||||||||
| Net realized and unrealized gains (losses) on investments | 2.61 | (0.26 | ) | (0.75 | ) | 4.31 | (0.96 | ) | ||||||||||||
| Total from investment operations | 2.79 | (0.09 | ) | (0.60 | ) | 4.39 | (0.78 | ) | ||||||||||||
| Less distributions from: | ||||||||||||||||||||
| Net investment income | (0.21 | ) | (0.16 | ) | (0.07 | ) | (0.12 | ) | (0.18 | ) | ||||||||||
| Net realized gains | (0.27 | ) | — | (2.28 | ) | (0.58 | ) | (0.40 | ) | |||||||||||
| Total distributions | (0.48 | ) | (0.16 | ) | (2.35 | ) | (0.70 | ) | (0.58 | ) | ||||||||||
| Net asset value at end of year | $ | 14.64 | $ | 12.33 | $ | 12.58 | $ | 15.53 | $ | 11.84 | ||||||||||
| Total return (b) | 23.07 | % | (0.75 | %) | (4.64 | )% | 38.46 | % | (6.32 | )% | ||||||||||
| Net assets at end of year (in 000s) | $ | 2,138 | $ | 1,218 | $ | 1,402 | $ | 858 | $ | 2,143 | ||||||||||
| Ratio of net expenses to average net assets (c) | 0.80 | % | 0.82 | % | 0.90 | % | 0.90 | % | 0.90 | % | ||||||||||
| Ratio of gross expenses to average net assets | 0.87 | % | 0.88 | % | 0.94 | % | 1.01 | % | 1.00 | % | ||||||||||
| Ratio of net investment income to average net assets (c) | 1.32 | % | 1.35 | % | 1.15 | % | 0.58 | % | 1.43 | % | ||||||||||
| Portfolio turnover rate (d) | 42 | % | 57 | % | 77 | % | 72 | % | 52 | % | ||||||||||
Amounts designated as “—” are either $0.00 or have been rounded to $0.00.
| (a) | Per share net income has been determined on the basis of average number of shares outstanding during the period. |
| (b) | Total return is a measure of the change in value of an investment in the Fund over the period covered. The returns shown do not reflect the deduction of taxes a shareholder would pay on Fund distributions, if any or the redemption of Fund shares. The total returns would be lower if the Adviser had not reduced investment management fees and/or reimbursed expenses (Note 4). |
| (c) | Ratio was determined after investment management fee reductions and/or reimbursed expenses (Note 4). |
| (d) | Portfolio turnover rate is calculated on the basis of the Fund as a whole without distinguishing between classes of shares issued. |
| (1) | Effective March 1, 2021, Westwood LargeCap Fund was renamed as Westwood Quality Value Fund. |
The accompanying notes are an integral part of the financial statements.
63
| WESTWOOD FUNDS |
| FINANCIAL HIGHLIGHTS |
SELECTED PER SHARE DATA FOR A SHARE OUTSTANDING THROUGHOUT EACH YEAR OR PERIOD
Westwood Quality Value Fund (1) (Continued)
| Westwood Quality Value Fund - C Class Shares | Year Ended October 31, 2024 | Year Ended October 31, 2023 | Year Ended October 31, 2022 | Year Ended October 31, 2021 | Period Ended October 31, 2020 (a) | |||||||||||||||
| Net asset value at beginning of period | $ | 11.99 | $ | 12.28 | $ | 15.33 | $ | 11.80 | $ | 10.17 | ||||||||||
| Net investment income (b) | 0.08 | 0.07 | 0.06 | 0.01 | 0.16 | |||||||||||||||
| Net realized and unrealized gains (losses) on investments | 2.53 | (0.25 | ) | (0.74 | ) | 4.27 | 1.47 | |||||||||||||
| Total from investment operations | 2.61 | (0.18 | ) | (0.68 | ) | 4.28 | 1.63 | |||||||||||||
| Less distributions from: | ||||||||||||||||||||
| Net investment income | (0.11 | ) | (0.11 | ) | (0.09 | ) | (0.17 | ) | — | |||||||||||
| Net realized gains | (0.27 | ) | — | (2.28 | ) | (0.58 | ) | — | ||||||||||||
| Total distributions | (0.38 | ) | (0.11 | ) | (2.37 | ) | (0.75 | ) | — | |||||||||||
| Net asset value at end of period | $ | 14.22 | $ | 11.99 | $ | 12.28 | $ | 15.33 | $ | 11.80 | ||||||||||
| Total return (c) | 22.14 | % | (1.49 | %) | (5.36 | )% | 37.62 | % | 16.03 | % (d) | ||||||||||
| Net assets at end of period (in 000s) | $ | 176 | $ | 126 | $ | 98 | $ | — | $ | — | ||||||||||
| Ratio of net expenses to average net assets (e) | 1.55 | % | 1.56 | % | 1.65 | % | 1.48 | % | 0.00 | % (f)(g) | ||||||||||
| Ratio of gross expenses to average net assets | 1.62 | % | 1.63 | % | 1.68 | % | 1.48 | % | 0.00 | % (f)(g) | ||||||||||
| Ratio of net investment income to average net assets (e) | 0.56 | % | 0.57 | % | 0.46 | % | 0.08 | % | 2.29 | % (f) | ||||||||||
| Portfolio turnover rate (h) | 42 | % | 57 | % | 77 | % | 72 | % | 52 | % (d) | ||||||||||
| Westwood Quality Value Fund - Ultra Shares | Year Ended October 31, 2024 | Period Ended October 31, 2023 (i) | ||||||||||||||||||
| Net asset value at beginning of period | $ | 12.26 | $ | 13.30 | ||||||||||||||||
| Net investment income (b) | 0.20 | 0.17 | ||||||||||||||||||
| Net realized and unrealized gains (losses) on investments | 2.58 | (1.02 | ) | |||||||||||||||||
| Total from investment operations | 2.78 | (0.85 | ) | |||||||||||||||||
| Less distributions from: | ||||||||||||||||||||
| Net investment income | (0.24 | ) | (0.19 | ) | ||||||||||||||||
| Net realized gains | (0.27 | ) | — | |||||||||||||||||
| Total distributions | (0.51 | ) | (0.19 | ) | ||||||||||||||||
| Net asset value at end of period | $ | 14.53 | $ | 12.26 | ||||||||||||||||
| Total return (c) | 23.17 | % | (6.42 | )% (d) | ||||||||||||||||
| Net assets at end of period (in 000s) | $ | 1 | $ | 1 | ||||||||||||||||
| Ratio of net expenses to average net assets (e) | 0.55 | % | 0.55 | % (f) | ||||||||||||||||
| Ratio of gross expenses to average net assets | 0.62 | % | 0.82 | % (f) | ||||||||||||||||
| Ratio of net investment income to average net assets (e) | 1.45 | % | 1.46 | % (f) | ||||||||||||||||
| Portfolio turnover rate (h) | 42 | % | 57 | % (d) | ||||||||||||||||
Amounts designated as “—” are either $0.00 or have been rounded to $0.00.
| (a) | Represents the period from the commencement of operations (March 31, 2020) through October 31, 2020. |
| (b) | Per share net income has been determined on the basis of average number of shares outstanding during the period. |
| (c) | Total return is a measure of the change in value of an investment in the Fund over the period covered. The returns shown do not reflect the deduction of taxes a shareholder would pay on Fund distributions, if any or the redemption of Fund shares. The total returns would be lower if the Adviser had not reduced investment management fees and/or reimbursed expenses (Note 4). |
| (d) | Not annualized. |
| (e) | Ratio was determined after investment management fee reductions and/or reimbursed expenses (Note 4). |
| (f) | Annualized. |
| (g) | The ratio rounds to 0.00% due to the impact of the low level of average net assets. The share class is expected to run at the expense limit of 1.65% (1.73% excluding waivers) when assets are contributed. |
| (h) | Portfolio turnover rate is calculated on the basis of the Fund as a whole without distinguishing between classes of shares issued. |
| (i) | Represents the period from the commencement of operations (November 30, 2022) through October 31, 2023. |
| (1) | Effective March 1, 2021, Westwood LargeCap Fund was renamed as Westwood Quality Value Fund. |
The accompanying notes are an integral part of the financial statements.
64
| WESTWOOD FUNDS |
| FINANCIAL HIGHLIGHTS |
SELECTED PER SHARE DATA FOR A SHARE OUTSTANDING THROUGHOUT EACH YEAR OR PERIOD
Westwood Quality MidCap Fund
| Westwood Quality MidCap Fund - Institutional Shares | Year Ended October 31, 2024 | Year Ended October 31, 2023 | Period Ended October 31, 2022(a) | |||||||||
| Net asset value at beginning of period | $ | 9.63 | $ | 9.64 | $ | 10.00 | ||||||
| Net investment income (b) | 0.16 | 0.14 | 0.11 | |||||||||
| Net realized and unrealized gains (losses) on investments | 2.61 | (0.01 | ) | (0.47 | ) | |||||||
| Total from investment operations | 2.77 | 0.13 | (0.36 | ) | ||||||||
| Less distributions from: | ||||||||||||
| Net investment income | (0.13 | ) | (0.14 | ) | — | |||||||
| Net realized gains | (0.13 | ) | — | — | ||||||||
| Total distributions | (0.26 | ) | (0.14 | ) | — | |||||||
| Net asset value at end of period | $ | 12.14 | $ | 9.63 | $ | 9.64 | ||||||
| Total return (c) | 29.09 | % | 1.29 | % | (3.60 | )% (d) | ||||||
| Net assets at end of period (in 000s) | $ | 1,991 | $ | 1,526 | $ | 530 | ||||||
| Ratio of net expenses to average net assets (e) | 0.69 | % | 0.62 | % | 0.58 | % (f)(g) | ||||||
| Ratio of gross expenses to average net assets | 3.41 | % | 5.79 | % | 20.06 | % (f) | ||||||
| Ratio of net investment income to average net assets (e) | 1.39 | % | 1.43 | % | 1.21 | % (f) | ||||||
| Portfolio turnover rate | 56 | % | 72 | % | 96 | % (d) | ||||||
Amounts designated as “—” are either $0.00 or have been rounded to $0.00.
| (a) | Represents the period from the commencement of operations (November 30, 2021) through October 31, 2022. |
| (b) | Per share net income has been determined on the basis of average number of shares outstanding during the period. |
| (c) | Total return is a measure of the change in value of an investment in the Fund over the period covered. The returns shown do not reflect the deduction of taxes a shareholder would pay on Fund distributions, if any or the redemption of Fund shares. The total returns would be lower if the Adviser had not reduced investment management fees and/or reimbursed expenses (Note 4). |
| (d) | Not annualized. |
| (e) | Ratio was determined after investment management fee reductions and/or reimbursed expenses (Note 4). |
| (f) | Annualized. |
| (g) | Includes federal excise taxes of 0.01% of average net assets with respect to the period ending October 31, 2022. |
The accompanying notes are an integral part of the financial statements.
65
| WESTWOOD FUNDS |
| FINANCIAL HIGHLIGHTS |
SELECTED PER SHARE DATA FOR A SHARE OUTSTANDING THROUGHOUT EACH YEAR OR PERIOD
Westwood Quality SMidCap Fund (1)
| Westwood Quality SMidCap Fund - Institutional Shares | Year Ended October 31, 2024 | Year Ended October 31, 2023 | Year Ended October 31, 2022 | Year Ended October 31, 2021 | Year Ended October 31, 2020 | |||||||||||||||
| Net asset value at beginning of year | $ | 12.88 | $ | 12.89 | $ | 16.62 | $ | 11.97 | $ | 14.21 | ||||||||||
| Net investment income (a) | 0.13 | 0.13 | 0.08 | 0.15 | 0.11 | |||||||||||||||
| Net realized and unrealized gains (losses) on investments | 3.60 | 0.05 | (1.45 | ) | 4.89 | (0.75 | ) | |||||||||||||
| Total from investment operations | 3.73 | 0.18 | (1.37 | ) | 5.04 | (0.64 | ) | |||||||||||||
| Less distributions from: | ||||||||||||||||||||
| Net investment income | (0.14 | ) | (0.09 | ) | (0.11 | ) | (0.13 | ) | (0.11 | ) | ||||||||||
| Net realized gains | (0.28 | ) | (0.10 | ) | (2.25 | ) | (0.26 | ) | (1.49 | ) | ||||||||||
| Total distributions | (0.42 | ) | (0.19 | ) | (2.36 | ) | (0.39 | ) | (1.60 | ) | ||||||||||
| Net asset value at end of year | $ | 16.19 | $ | 12.88 | $ | 12.89 | $ | 16.62 | $ | 11.97 | ||||||||||
| Total return (b) | 29.49 | % | 1.42 | % | (9.64 | %) | 42.85 | % | (5.39 | )% | ||||||||||
| Net assets at end of year (in 000s) | $ | 75,453 | $ | 167,877 | $ | 201,586 | $ | 237,479 | $ | 164,350 | ||||||||||
| Ratio of net expenses to average net assets (c) | 0.90 | % (e) | 0.86 | % | 0.87 | % | 0.88 | % | 0.88 | % | ||||||||||
| Ratio of gross expenses to average net assets | 1.07 | % (e) | 1.01 | % | 1.02 | % | 1.10 | % | 1.05 | % | ||||||||||
| Ratio of net investment income to average net assets (c) | 0.90 | % | 0.96 | % | 0.62 | % | 0.99 | % | 0.90 | % | ||||||||||
| Portfolio turnover rate (d) | 73 | % (i) | 87 | % | 104 | % | 106 | % | 69 | % | ||||||||||
| Westwood Quality SMidCap Fund - Ultra Shares | Year Ended October 31, 2024 | Year Ended October 31, 2023 | Year Ended October 31, 2022 | Year Ended October 31, 2021 | Period Ended October 31, 2020(f) | |||||||||||||||
| Net asset value at beginning of period | $ | 12.88 | $ | 12.90 | $ | 16.62 | $ | 11.96 | $ | 11.44 | ||||||||||
| Net investment income (a) | 0.16 | 0.15 | 0.11 | 0.16 | — | |||||||||||||||
| Net realized and unrealized gains (losses) on investments | 3.60 | 0.04 | (1.44 | ) | 4.91 | 0.52 | ||||||||||||||
| Total from investment operations | 3.76 | 0.19 | (1.33 | ) | 5.07 | 0.52 | ||||||||||||||
| Less distributions from: | ||||||||||||||||||||
| Net investment income | (0.16 | ) | (0.11 | ) | (0.14 | ) | (0.15 | ) | — | |||||||||||
| Net realized gains | (0.28 | ) | (0.10 | ) | (2.25 | ) | (0.26 | ) | — | |||||||||||
| Total distributions | (0.44 | ) | (0.21 | ) | (2.39 | ) | (0.41 | ) | — | |||||||||||
| Net asset value at end of period | $ | 16.20 | $ | 12.88 | $ | 12.90 | $ | 16.62 | $ | 11.96 | ||||||||||
| Total return (b) | 29.77 | % | 1.54 | % | (9.41 | )% | 43.19 | % | 4.55 | % (g) | ||||||||||
| Net assets at end of period (in 000s) | $ | 28,783 | $ | 114,584 | $ | 88,909 | $ | 100,933 | $ | 2,072 | ||||||||||
| Ratio of net expenses to average net assets (c) | 0.70 | % (e) | 0.68 | % | 0.68 | % | 0.68 | % | 0.70 | % (h) | ||||||||||
| Ratio of gross expenses to average net assets | 0.87 | % (e) | 0.83 | % | 0.83 | % | 0.90 | % | 1.02 | % (h) | ||||||||||
| Ratio of net investment income to average net assets (c) | 1.08 | % | 1.12 | % | 0.80 | % | 1.00 | % | 0.08 | % (h) | ||||||||||
| Portfolio turnover rate (d) | 73 | % (i) | 87 | % | 104 | % | 106 | % | 69 | % (g) | ||||||||||
Amounts designated as “—” are either $0.00 or have been rounded to $0.00.
| (a) | Per share net income has been determined on the basis of average number of shares outstanding during the period. |
| (b) | Total return is a measure of the change in value of an investment in the Fund over the period covered. The returns shown do not reflect the deduction of taxes a shareholder would pay on Fund distributions, if any or the redemption of Fund shares. The total returns would be lower if the Adviser had not reduced investment management fees and/or reimbursed expenses (Note 4). |
| (c) | Ratio was determined after investment management fee reductions and/or reimbursed expenses (Note 4). |
| (d) | Portfolio turnover rate is calculated on the basis of the Fund as a whole without distinguishing between classes of shares issued. |
| (e) | Includes 0.02% of borrowing costs (Note 2). |
| (f) | Represents the period from the commencement of operations (July 31, 2020) through October 31, 2020. |
| (g) | Not annualized. |
| (h) | Annualized. |
| (i) | Excludes in kind transactions (Note 9). |
| (1) | Effective March 1, 2021, Westwood SMIDCap Fund was renamed as Westwood Quality SMIDCap Fund. |
The accompanying notes are an integral part of the financial statements.
66
| WESTWOOD FUNDS |
| FINANCIAL HIGHLIGHTS |
SELECTED PER SHARE DATA FOR A SHARE OUTSTANDING THROUGHOUT EACH YEAR OR PERIOD
Westwood Quality SmallCap Fund (1)
| Westwood Quality SmallCap Fund - Institutional Shares | Year Ended October 31, 2024 | Year Ended October 31, 2023 | Year Ended October 31, 2022 | Year Ended October 31, 2021 | Year Ended October 31, 2020 | |||||||||||||||
| Net asset value at beginning of year | $ | 18.06 | $ | 18.88 | $ | 21.99 | $ | 14.46 | $ | 16.97 | ||||||||||
| Net investment income (a) | 0.20 | 0.27 | 0.18 | 0.18 | 0.12 | |||||||||||||||
| Net realized and unrealized gains (losses) on investments | 3.92 | (0.42 | ) | (2.28 | ) | 7.47 | (2.45 | ) | ||||||||||||
| Total from investment operations | 4.12 | (0.15 | ) | (2.10 | ) | 7.65 | (2.33 | ) | ||||||||||||
| Less distributions from: | ||||||||||||||||||||
| Net investment income | (0.28 | ) | (0.19 | ) | (0.20 | ) | (0.12 | ) | (0.12 | ) | ||||||||||
| Net realized gains | (0.55 | ) | (0.48 | ) | (0.81 | ) | — | (0.06 | ) | |||||||||||
| Total distributions | (0.83 | ) | (0.67 | ) | (1.01 | ) | (0.12 | ) | (0.18 | ) | ||||||||||
| Net asset value at end of year | $ | 21.35 | $ | 18.06 | $ | 18.88 | $ | 21.99 | $ | 14.46 | ||||||||||
| Total return (b) | 23.24 | % | (0.92 | %) | (10.08 | )% | 53.07 | % | (13.90 | )% | ||||||||||
| Net assets at end of year (in 000s) | $ | 455,373 | $ | 427,774 | $ | 476,094 | $ | 586,435 | $ | 357,901 | ||||||||||
| Ratio of net expenses to average net assets (c) | 0.90 | % | 0.92 | % | 0.92 | % | 0.92 | % | 0.99 | % | ||||||||||
| Ratio of gross expenses to average net assets | 1.04 | % | 1.05 | % | 1.04 | % | 1.09 | % | 1.16 | % | ||||||||||
| Ratio of net investment income to average net assets (c) | 0.97 | % | 1.43 | % | 0.94 | % | 0.90 | % | 0.81 | % | ||||||||||
| Portfolio turnover rate (d) | 57 | % | 58 | % | 60 | % | 58 | % | 67 | % | ||||||||||
| Westwood Quality SmallCap Fund - A Class Shares | Year Ended October 31, 2024 | Year Ended October 31, 2023 | Year Ended October 31, 2022 | Year Ended October 31, 2021 | Year Ended October 31, 2020 | |||||||||||||||
| Net asset value at beginning of year | $ | 17.99 | $ | 18.84 | $ | 21.94 | $ | 14.44 | $ | 16.99 | ||||||||||
| Net investment income (a) | 0.16 | 0.26 | 0.16 | 0.16 | 0.08 | |||||||||||||||
| Net realized and unrealized gains (losses) on investments | 3.91 | (0.43 | ) | (2.27 | ) | 7.45 | (2.43 | ) | ||||||||||||
| Total from investment operations | 4.07 | (0.17 | ) | (2.11 | ) | 7.61 | (2.35 | ) | ||||||||||||
| Less distributions from: | ||||||||||||||||||||
| Net investment income | (0.24 | ) | (0.20 | ) | (0.18 | ) | (0.11 | ) | (0.14 | ) | ||||||||||
| Net realized gains | (0.55 | ) | (0.48 | ) | (0.81 | ) | — | (0.06 | ) | |||||||||||
| Total distributions | (0.79 | ) | (0.68 | ) | (0.99 | ) | (0.11 | ) | (0.20 | ) | ||||||||||
| Net asset value at end of year | $ | 21.27 | $ | 17.99 | $ | 18.84 | $ | 21.94 | $ | 14.44 | ||||||||||
| Total return (b) | 23.02 | % | (1.03 | %) | (10.15 | )% | 52.90 | % | (14.04 | )% | ||||||||||
| Net assets at end of year (in 000s) | $ | 3,224 | $ | 2,161 | $ | 1,556 | $ | 1,470 | $ | 881 | ||||||||||
| Ratio of net expenses to average net assets (c) | 1.04 | % | 1.04 | % | 1.04 | % | 1.04 | % | 1.09 | % | ||||||||||
| Ratio of gross expenses to average net assets | 1.18 | % | 1.17 | % | 1.16 | % | 1.22 | % | 1.28 | % | ||||||||||
| Ratio of net investment income to average net assets (c) | 0.80 | % | 1.38 | % | 0.81 | % | 0.77 | % | 0.55 | % | ||||||||||
| Portfolio turnover rate (d) | 57 | % | 58 | % | 60 | % | 58 | % | 67 | % | ||||||||||
Amounts designated as “—” are either $0.00 or have been rounded to $ 0.00.
| (a) | Per share net income has been determined on the basis of average number of shares outstanding during the period. |
| (b) | Total return is a measure of the change in value of an investment in the Fund over the period covered. The returns shown do not reflect the deduction of taxes a shareholder would pay on Fund distributions, if any or the redemption of Fund shares. The total returns would be lower if the Adviser had not reduced investment management fees and/or reimbursed expenses (Note 4). |
| (c) | Ratio was determined after investment management fee reductions and/or reimbursed expenses (Note 4). |
| (d) | Portfolio turnover rate is calculated on the basis of the Fund as a whole without distinguishing between classes of shares issued. |
| (1) | Effective March 1, 2021, Westwood SmallCap Fund was renamed as Westwood Quality SmallCap Fund. |
The accompanying notes are an integral part of the financial statements.
67
| WESTWOOD FUNDS |
| FINANCIAL HIGHLIGHTS |
SELECTED PER SHARE DATA FOR A SHARE OUTSTANDING THROUGHOUT EACH YEAR OR PERIOD
Westwood Quality SmallCap Fund (1) (Continued)
| Westwood Quality SmallCap Fund - C Class Shares | Year Ended October 31, 2024 | Year Ended October 31, 2023 | Year Ended October 31, 2022 | Year Ended October 31, 2021 | Year Ended October 31, 2020 | |||||||||||||||
| Net asset value at beginning of year | $ | 17.81 | $ | 18.62 | $ | 21.75 | $ | 14.34 | $ | 16.98 | ||||||||||
| Net investment income (loss) (a) | (0.01 | ) | 0.10 | 0.01 | (0.01 | ) | (0.01 | ) | ||||||||||||
| Net realized and unrealized gains (losses) on investments | 3.88 | (0.41 | ) | (2.25 | ) | 7.44 | (2.45 | ) | ||||||||||||
| Total from investment operations | 3.87 | (0.31 | ) | (2.24 | ) | 7.43 | (2.46 | ) | ||||||||||||
| Less distributions from: | ||||||||||||||||||||
| Net investment income | (0.20 | ) | (0.02 | ) | (0.08 | ) | (0.02 | ) | (0.12 | ) | ||||||||||
| Net realized gains | (0.55 | ) | (0.48 | ) | (0.81 | ) | — | (0.06 | ) | |||||||||||
| Total distributions | (0.75 | ) | (0.50 | ) | (0.89 | ) | (0.02 | ) | (0.18 | ) | ||||||||||
| Net asset value at end of year | $ | 20.93 | $ | 17.81 | $ | 18.62 | $ | 21.75 | $ | 14.34 | ||||||||||
| Total return (b) | 22.12 | % | (1.77 | %) | (10.84 | )% | 51.81 | % | (14.67 | )% | ||||||||||
| Net assets at end of year (in 000s) | $ | 2,715 | $ | 1,029 | $ | 708 | $ | 849 | $ | 186 | ||||||||||
| Ratio of net expenses to average net assets (c) | 1.79 | % | 1.79 | % | 1.79 | % | 1.79 | % | 1.84 | % | ||||||||||
| Ratio of gross expenses to average net assets | 1.93 | % | 1.92 | % | 1.91 | % | 1.97 | % | 2.02 | % | ||||||||||
| Ratio of net investment income (loss) to average net assets (c) | (0.06 | %) | 0.51 | % | 0.07 | % | (0.04 | )% | (0.08 | )% | ||||||||||
| Portfolio turnover rate (d) | 57 | % | 58 | % | 60 | % | 58 | % | 67 | % | ||||||||||
| Westwood Quality SmallCap Fund - Ultra Shares | Year Ended October 31, 2024 | Year Ended October 31, 2023 | Year Ended October 31, 2022 | Year Ended October 31, 2021 | Period Ended October 31, 2020(e) | |||||||||||||||
| Net asset value at beginning of period | $ | 18.08 | $ | 18.91 | $ | 22.01 | $ | 14.47 | $ | 11.72 | ||||||||||
| Net investment income (a) | 0.22 | 0.29 | 0.21 | 0.20 | 0.05 | |||||||||||||||
| Net realized and unrealized gains (losses) on investments | 3.94 | (0.43 | ) | (2.28 | ) | 7.48 | 2.70 | |||||||||||||
| Total from investment operations | 4.16 | (0.14 | ) | (2.07 | ) | 7.68 | 2.75 | |||||||||||||
| Less distributions from: | ||||||||||||||||||||
| Net investment income | (0.31 | ) | (0.21 | ) | (0.22 | ) | (0.14 | ) | — | |||||||||||
| Net realized gains | (0.55 | ) | (0.48 | ) | (0.81 | ) | — | — | ||||||||||||
| Total distributions | (0.86 | ) | (0.69 | ) | (1.03 | ) | (0.14 | ) | — | |||||||||||
| Net asset value at end of period | $ | 21.38 | $ | 18.08 | $ | 18.91 | $ | 22.01 | $ | 14.47 | ||||||||||
| Total return (b) | 23.41 | % | (0.83 | %) | (9.91 | )% | 53.29 | % | 23.46 | % (f) | ||||||||||
| Net assets at end of period (in 000s) | $ | 638,196 | $ | 608,142 | $ | 511,179 | $ | 506,444 | $ | 151,903 | ||||||||||
| Ratio of net expenses to average net assets (c) | 0.79 | % | 0.79 | % | 0.79 | % | 0.79 | % | 0.81 | % (g) | ||||||||||
| Ratio of gross expenses to average net assets | 0.93 | % | 0.92 | % | 0.91 | % | 0.97 | % | 1.10 | % (g) | ||||||||||
| Ratio of net investment income to average net assets (c) | 1.07 | % | 1.52 | % | 1.07 | % | 0.95 | % | 0.63 | % (g) | ||||||||||
| Portfolio turnover rate (d) | 57 | % | 58 | % | 60 | % | 58 | % | 67 | % (f) | ||||||||||
Amounts designated as “—” are either $0.00 or have been rounded to $0.00.
| (a) | Per share net income has been determined on the basis of average number of shares outstanding during the period. |
| (b) | Total return is a measure of the change in value of an investment in the Fund over the period covered. The returns shown do not reflect the deduction of taxes a shareholder would pay on Fund distributions, if any or the redemption of Fund shares. The total returns would be lower if the Adviser had not reduced investment management fees and/or reimbursed expenses (Note 4). |
| (c) | Ratio was determined after investment management fee reductions and/or reimbursed expenses (Note 4). |
| (d) | Portfolio turnover rate is calculated on the basis of the Fund as a whole without distinguishing between classes of shares issued. |
| (e) | Represents the period from the commencement of operations (March 31, 2020) through October 31, 2020. |
| (f) | Not annualized. |
| (g) | Annualized. |
| (1) | Effective March 1, 2021, Westwood SmallCap Fund was renamed as Westwood Quality SmallCap Fund. |
The accompanying notes are an integral part of the financial statements.
68
| WESTWOOD FUNDS |
| FINANCIAL HIGHLIGHTS |
SELECTED PER SHARE DATA FOR A SHARE OUTSTANDING THROUGHOUT EACH YEAR OR PERIOD
Westwood Quality AllCap Fund
| Westwood Quality AllCap Fund - Institutional Shares | Year Ended October 31, 2024 | Year Ended October 31, 2023 | Year Ended October 31, 2022 | Period Ended October 31, 2021(a) | ||||||||||||
| Net asset value at beginning of period | $ | 10.02 | $ | 10.03 | $ | 10.59 | $ | 10.00 | ||||||||
| Net investment income (b) | 0.15 | 0.16 | 0.16 | — | ||||||||||||
| Net realized and unrealized gains (losses) on investments | 2.22 | — | (0.67 | ) | 0.59 | |||||||||||
| Total from investment operations | 2.37 | 0.16 | (0.51 | ) | 0.59 | |||||||||||
| Less distributions from: | ||||||||||||||||
| Net investment income | (0.17 | ) | (0.17 | ) | (0.03 | ) | — | |||||||||
| Net realized gains | (0.20 | ) | — | (0.02 | ) | — | ||||||||||
| Total distributions | (0.37 | ) | (0.17 | ) | (0.05 | ) | — | |||||||||
| Net asset value at end of period | $ | 12.02 | $ | 10.02 | $ | 10.03 | $ | 10.59 | ||||||||
| Total return (c) | 24.16 | % | 1.56 | % | (4.86 | )% | 5.90 | % (d) | ||||||||
| Net assets at end of period (in 000s) | $ | 561 | $ | 197 | $ | 553 | $ | 529 | ||||||||
| Ratio of net expenses to average net assets (e) | 0.53 | % | 0.48 | % | 0.45 | % | 0.65 | % (f) | ||||||||
| Ratio of gross expenses to average net assets | 0.97 | % | 0.91 | % | 0.93 | % | 2.25 | % (f) | ||||||||
| Ratio of net investment income to average net assets (e) | 1.33 | % | 1.56 | % | 1.55 | % | 0.22 | % (f) | ||||||||
| Portfolio turnover rate (g) | 73 | % | 84 | % | 101 | % | 4 | % (d) | ||||||||
| Westwood Quality AllCap Fund - Ultra Shares | Year Ended October 31, 2024 | Year Ended October 31, 2023 | Year Ended October 31, 2022 | Period Ended October 31, 2021(a) | ||||||||||||
| Net asset value at beginning of period | $ | 10.02 | $ | 10.03 | $ | 10.59 | $ | 10.00 | ||||||||
| Net investment income (b) | 0.17 | 0.16 | 0.16 | — | ||||||||||||
| Net realized and unrealized gains (losses) on investments | 2.22 | — | (0.67 | ) | 0.59 | |||||||||||
| Total from investment operations | 2.39 | 0.16 | (0.51 | ) | 0.59 | |||||||||||
| Less distributions from: | ||||||||||||||||
| Net investment income | (0.17 | ) | (0.17 | ) | (0.03 | ) | — | |||||||||
| Net realized gains | (0.20 | ) | — | (0.02 | ) | — | ||||||||||
| Total distributions | (0.37 | ) | (0.17 | ) | (0.05 | ) | — | |||||||||
| Net asset value at end of period | $ | 12.04 | $ | 10.02 | $ | 10.03 | $ | 10.59 | ||||||||
| Total return (c) | 24.39 | % | 1.53 | % | (4.81 | )% | 5.90 | % (d) | ||||||||
| Net assets at end of period (in 000s) | $ | 21,975 | $ | 20,153 | $ | 21,750 | $ | 21,715 | ||||||||
| Ratio of net expenses to average net assets (e) | 0.45 | % | 0.45 | % | 0.45 | % | 0.45 | % (f) | ||||||||
| Ratio of gross expenses to average net assets | 0.89 | % | 0.88 | % | 0.93 | % | 2.07 | % (f) | ||||||||
| Ratio of net investment income to average net assets (e) | 1.51 | % | 1.57 | % | 1.55 | % | 0.44 | % (f) | ||||||||
| Portfolio turnover rate (g) | 73 | % | 84 | % | 101 | % | 4 | % (d) | ||||||||
Amounts designated as “—” are either $0.00 or have been rounded to $0.00.
| (a) | Represents the period from the commencement of operations (September 30, 2021) through October 31, 2021. |
| (b) | Per share net income has been determined on the basis of average number of shares outstanding during the period. |
| (c) | Total return is a measure of the change in value of an investment in the Fund over the period covered. The returns shown do not reflect the deduction of taxes a shareholder would pay on Fund distributions, if any or the redemption of Fund shares. The total returns would be lower if the Adviser had not reduced investment management fees and/or reimbursed expenses (Note 4). |
| (d) | Not annualized. |
| (e) | Ratio was determined after investment management fee reductions and/or reimbursed expenses (Note 4). |
| (f) | Annualized. |
| (g) | Portfolio turnover rate is calculated on the basis of the Fund as a whole without distinguishing between classes of shares issued. |
The accompanying notes are an integral part of the financial statements.
69
| WESTWOOD FUNDS |
| FINANCIAL HIGHLIGHTS |
SELECTED PER SHARE DATA FOR A SHARE OUTSTANDING THROUGHOUT EACH YEAR OR PERIOD
Westwood Income Opportunity Fund
| Westwood Income Opportunity Fund - Institutional Shares | Year Ended October 31, 2024 | Year Ended October 31, 2023 | Year Ended October 31, 2022 | Year Ended October 31, 2021 | Year Ended October 31, 2020 | |||||||||||||||
| Net asset value at beginning of year | $ | 10.46 | $ | 10.59 | $ | 13.92 | $ | 12.84 | $ | 15.89 | ||||||||||
| Net investment income (a) | 0.41 | 0.38 | 0.30 | 0.23 | 0.22 | |||||||||||||||
| Net realized and unrealized gains (losses) on investments | 1.65 | (0.12 | ) | (2.19 | ) | 1.90 | 0.34 | |||||||||||||
| Total from investment operations | 2.06 | 0.26 | (1.89 | ) | 2.13 | 0.56 | ||||||||||||||
| Less distributions from: | ||||||||||||||||||||
| Net investment income | (0.44 | ) | (0.39 | ) | (0.28 | ) | (0.50 | ) | (0.20 | ) | ||||||||||
| Net realized gains | — | — | (1.16 | ) | (0.55 | ) | (3.41 | ) | ||||||||||||
| Return of capital | (0.08 | ) | — | — | — | — | ||||||||||||||
| Total distributions | (0.52 | ) | (0.39 | ) | (1.44 | ) | (1.05 | ) | (3.61 | ) | ||||||||||
| Net asset value at end of year | $ | 12.00 | $ | 10.46 | $ | 10.59 | $ | 13.92 | $ | 12.84 | ||||||||||
| Total return (b) | 19.85 | % | 2.35 | % | (14.97 | )% | 17.21 | % | 4.59 | % | ||||||||||
| Net assets at end of year (in 000s) | $ | 368,844 | $ | 391,661 | $ | 579,772 | $ | 814,633 | $ | 662,612 | ||||||||||
| Ratio of net expenses to average net assets (c) | 0.83 | % | 0.81 | % | 0.81 | % | 0.85 | % | 0.89 | % | ||||||||||
| Ratio of gross expenses to average net assets | 0.83 | % | 0.81 | % | 0.81 | % | 0.86 | % | 0.89 | % | ||||||||||
| Ratio of net investment income to average net assets (c) | 3.53 | % | 3.44 | % | 2.52 | % | 1.68 | % | 1.69 | % | ||||||||||
| Portfolio turnover rate (d) | 57 | % | 88 | % | 81 | % | 82 | % | 111 | % | ||||||||||
| Westwood Income Opportunity Fund - A Class Shares | Year Ended October 31, 2024 | Year Ended October 31, 2023 | Year Ended October 31, 2022 | Year Ended October 31, 2021 | Year Ended October 31, 2020 | |||||||||||||||
| Net asset value at beginning of year | $ | 10.45 | $ | 10.57 | $ | 13.90 | $ | 12.83 | $ | 15.88 | ||||||||||
| Net investment income (a) | 0.39 | 0.36 | 0.27 | 0.20 | 0.18 | |||||||||||||||
| Net realized and unrealized gains (losses) on investments | 1.65 | (0.11 | ) | (2.19 | ) | 1.88 | 0.34 | |||||||||||||
| Total from investment operations | 2.04 | 0.25 | (1.92 | ) | 2.08 | 0.52 | ||||||||||||||
| Less distributions from: | ||||||||||||||||||||
| Net investment income | (0.42 | ) | (0.37 | ) | (0.25 | ) | (0.46 | ) | (0.16 | ) | ||||||||||
| Net realized gains | — | — | (1.16 | ) | (0.55 | ) | (3.41 | ) | ||||||||||||
| Return of capital | (0.08 | ) | — | — | — | — | ||||||||||||||
| Total distributions | (0.50 | ) | (0.37 | ) | (1.41 | ) | (1.01 | ) | (3.57 | ) | ||||||||||
| Net asset value at end of year | $ | 11.99 | $ | 10.45 | $ | 10.57 | $ | 13.90 | $ | 12.83 | ||||||||||
| Total return (b) | 19.68 | % | 2.25 | % | (15.21 | )% | 16.86 | % | 4.34 | % | ||||||||||
| Net assets at end of year (in 000s) | $ | 43,706 | $ | 44,318 | $ | 55,296 | $ | 62,614 | $ | 48,051 | ||||||||||
| Ratio of net expenses to average net assets (c) | 1.00 | % | 0.99 | % | 1.06 | % | 1.10 | % | 1.14 | % | ||||||||||
| Ratio of gross expenses to average net assets | 1.00 | % | 0.99 | % | 1.06 | % | 1.11 | % | 1.14 | % | ||||||||||
| Ratio of net investment income to average net assets (c) | 3.36 | % | 3.27 | % | 2.27 | % | 1.44 | % | 1.43 | % | ||||||||||
| Portfolio turnover rate (d) | 57 | % | 88 | % | 81 | % | 82 | % | 111 | % | ||||||||||
Amounts designated as “—” are either $0.00 or have been rounded to $ 0.00.
| (a) | Per share net income has been determined on the basis of average number of shares outstanding during the period. |
| (b) | Total return is a measure of the change in value of an investment in the Fund over the period covered. The returns shown do not reflect the deduction of taxes a shareholder would pay on Fund distributions, if any or the redemption of Fund shares. The total returns would be lower if the Adviser had not reduced investment management fees and/or reimbursed expenses (Note 4). |
| (c) | Ratio was determined after investment management fee reductions and/or reimbursed expenses (Note 4). |
| (d) | Portfolio turnover rate is calculated on the basis of the Fund as a whole without distinguishing between classes of shares issued. |
The accompanying notes are an integral part of the financial statements.
70
| WESTWOOD FUNDS |
| FINANCIAL HIGHLIGHTS |
SELECTED PER SHARE DATA FOR A SHARE OUTSTANDING THROUGHOUT EACH YEAR OR PERIOD
Westwood Income Opportunity Fund (Continued)
| Westwood Income Opportunity Fund - C Class Shares | Year Ended October 31, 2024 | Year Ended October 31, 2023 | Year Ended October 31, 2022 | Year Ended October 31, 2021 | Year Ended October 31, 2020 | |||||||||||||||
| Net asset value at beginning of year | $ | 10.40 | $ | 10.53 | $ | 13.84 | $ | 12.79 | $ | 15.88 | ||||||||||
| Net investment income (a) | 0.30 | 0.27 | 0.18 | 0.10 | 0.06 | |||||||||||||||
| Net realized and unrealized gains (losses) on investments | 1.63 | (0.12 | ) | (2.16 | ) | 1.88 | 0.36 | |||||||||||||
| Total from investment operations | 1.93 | 0.15 | (1.98 | ) | 1.98 | 0.42 | ||||||||||||||
| Less distributions from: | ||||||||||||||||||||
| Net investment income | (0.34 | ) | (0.28 | ) | (0.17 | ) | (0.38 | ) | (0.10 | ) | ||||||||||
| Net realized gains | — | — | (1.16 | ) | (0.55 | ) | (3.41 | ) | ||||||||||||
| Return of capital | (0.07 | ) | — | — | — | — | ||||||||||||||
| Total distributions | (0.41 | ) | (0.28 | ) | (1.33 | ) | (0.93 | ) | (3.51 | ) | ||||||||||
| Net asset value at end of year | $ | 11.92 | $ | 10.40 | $ | 10.53 | $ | 13.84 | $ | 12.79 | ||||||||||
| Total return (b) | 18.71 | % | 1.40 | % | (15.75 | )% | 16.03 | % | 3.52 | % | ||||||||||
| Net assets at end of year (in 000s) | $ | 12,555 | $ | 11,626 | $ | 12,743 | $ | 13,323 | $ | 4,453 | ||||||||||
| Ratio of net expenses to average net assets (c) | 1.75 | % | 1.74 | % | 1.81 | % | 1.85 | % | 1.90 | % | ||||||||||
| Ratio of gross expenses to average net assets | 1.75 | % | 1.74 | % | 1.81 | % | 1.86 | % | 1.90 | % | ||||||||||
| Ratio of net investment income to average net assets (c) | 2.61 | % | 2.51 | % | 1.52 | % | 0.70 | % | 0.48 | % | ||||||||||
| Portfolio turnover rate (d) | 57 | % | 88 | % | 81 | % | 82 | % | 111 | % | ||||||||||
| Westwood Income Opportunity Fund - Ultra Shares | Year Ended October 31, 2024 | Period Ended October 31, 2023 (e) | ||||||||||||||||||
| Net asset value at beginning of period | $ | 10.46 | $ | 11.12 | ||||||||||||||||
| Net investment income (a) | 0.42 | 0.35 | ||||||||||||||||||
| Net realized and unrealized gains (losses) on investments | 1.64 | (0.62 | ) | |||||||||||||||||
| Total from investment operations | 2.06 | (0.27 | ) | |||||||||||||||||
| Less distributions from: | ||||||||||||||||||||
| Net investment income | (0.44 | ) | (0.39 | ) | ||||||||||||||||
| Net realized gains | — | — | ||||||||||||||||||
| Return of capital | (0.09 | ) | — | |||||||||||||||||
| Total distributions | (0.53 | ) | (0.39 | ) | ||||||||||||||||
| Net asset value at end of period | $ | 11.99 | $ | 10.46 | ||||||||||||||||
| Total return (b) | 19.86 | % | (2.47 | )% (f) | ||||||||||||||||
| Net assets at end of period (in 000s) | $ | 96,228 | $ | 61,524 | ||||||||||||||||
| Ratio of net expenses to average net assets (c) | 0.75 | % | 0.74 | % (g) | ||||||||||||||||
| Ratio of gross expenses to average net assets | 0.75 | % | 0.74 | % (g) | ||||||||||||||||
| Ratio of net investment income to average net assets (c) | 3.59 | % | 3.51 | % (g) | ||||||||||||||||
| Portfolio turnover rate (d) | 57 | % | 88 | % (f) | ||||||||||||||||
Amounts designated as “—” are either $0.00 or have been rounded to $0.00.
| (a) | Per share net income has been determined on the basis of average number of shares outstanding during the period. |
| (b) | Total return is a measure of the change in value of an investment in the Fund over the period covered. The returns shown do not reflect the deduction of taxes a shareholder would pay on Fund distributions, if any or the redemption of Fund shares. The total returns would be lower if the Adviser had not reduced investment management fees and/or reimbursed expenses (Note 4). |
| (c) | Ratio was determined after investment management fee reductions and/or reimbursed expenses (Note 4). |
| (d) | Portfolio turnover rate is calculated on the basis of the Fund as a whole without distinguishing between classes of shares issued. |
| (e) | Represents the period from the commencement of operations (November 30, 2022) through October 31, 2023. |
| (f) | Not annualized. |
| (g) | Annualized. |
The accompanying notes are an integral part of the financial statements.
71
| WESTWOOD FUNDS |
| FINANCIAL HIGHLIGHTS |
SELECTED PER SHARE DATA FOR A SHARE OUTSTANDING THROUGHOUT EACH YEAR OR PERIOD
Westwood Multi-Asset Income Fund (1)(2)
| Westwood Multi-Asset Income Fund - Institutional Shares | Year Ended October 31, 2024 | Year Ended October 31, 2023 | Year Ended October 31, 2022 | Year Ended October 31, 2021 | Year Ended October 31, 2020 | |||||||||||||||
| Net asset value at beginning of year | $ | 8.85 | $ | 8.95 | $ | 10.67 | $ | 9.55 | $ | 9.25 | ||||||||||
| Net investment income (a) | 0.57 | 0.50 | 0.42 | 0.35 | 0.35 | |||||||||||||||
| Net realized and unrealized gains (losses) on investments | 1.08 | (0.11 | ) | (1.71 | ) | 1.14 | 0.29 | |||||||||||||
| Total from investment operations | 1.65 | 0.39 | (1.29 | ) | 1.49 | 0.64 | ||||||||||||||
| Less distributions from: | ||||||||||||||||||||
| Net investment income | (0.57 | ) | (0.49 | ) | (0.43 | ) | (0.37 | ) | (0.34 | ) | ||||||||||
| Total distributions | (0.57 | ) | (0.49 | ) | (0.43 | ) | (0.37 | ) | (0.34 | ) | ||||||||||
| Net asset value at end of year | $ | 9.93 | $ | 8.85 | $ | 8.95 | $ | 10.67 | $ | 9.55 | ||||||||||
| Total return (b) | 18.97 | % | 4.27 | % | (12.38 | )% | 15.69 | % | 7.14 | % | ||||||||||
| Net assets at end of year (in 000s) | $ | 88,234 | $ | 93,810 | $ | 96,636 | $ | 94,360 | $ | 72,914 | ||||||||||
| Ratio of net expenses to average net assets (c) | 0.88 | % (e)(f) | 0.71 | % | 0.80 | % | 0.80 | % | 0.27 | % | ||||||||||
| Ratio of gross expenses to average net assets | 0.97 | % (e) | 0.78 | % | 0.87 | % | 0.96 | % | 0.59 | % | ||||||||||
| Ratio of net investment income to average net assets (c) | 5.90 | % (f) | 5.42 | % | 4.31 | % | 3.37 | % | 3.78 | % | ||||||||||
| Portfolio turnover rate (d) | 65 | % | 52 | % | 62 | % | 67 | % | 130 | % | ||||||||||
| Westwood Multi-Asset Income Fund - A Class Shares | Year Ended October 31, 2024 | Year Ended October 31, 2023 | Year Ended October 31, 2022 | Year Ended October 31, 2021 | Year Ended October 31, 2020 | |||||||||||||||
| Net asset value at beginning of year | $ | 8.89 | $ | 9.00 | $ | 10.72 | $ | 9.60 | $ | 9.29 | ||||||||||
| Net investment income (a) | 0.55 | 0.47 | 0.39 | 0.33 | 0.34 | |||||||||||||||
| Net realized and unrealized gains (losses) on investments | 1.09 | (0.11 | ) | (1.71 | ) | 1.13 | 0.29 | |||||||||||||
| Total from investment operations | 1.64 | 0.36 | (1.32 | ) | 1.46 | 0.63 | ||||||||||||||
| Less distributions from: | ||||||||||||||||||||
| Net investment income | (0.55 | ) | (0.47 | ) | (0.40 | ) | (0.34 | ) | (0.32 | ) | ||||||||||
| Total distributions | (0.55 | ) | (0.47 | ) | (0.40 | ) | (0.34 | ) | (0.32 | ) | ||||||||||
| Net asset value at end of year | $ | 9.98 | $ | 8.89 | $ | 9.00 | $ | 10.72 | $ | 9.60 | ||||||||||
| Total return (b) | 18.73 | % | 3.91 | % | (12.54 | )% | 15.34 | % | 7.01 | % | ||||||||||
| Net assets at end of year (in 000s) | $ | 8,248 | $ | 7,095 | $ | 2,321 | $ | 1,623 | $ | 320 | ||||||||||
| Ratio of net expenses to average net assets (c) | 1.12 | % (e)(f) | 0.94 | % | 1.15 | % | 1.05 | % | 0.48 | % | ||||||||||
| Ratio of gross expenses to average net assets | 1.21 | % (e) | 1.01 | % | 1.22 | % | 1.21 | % | 0.82 | % | ||||||||||
| Ratio of net investment income to average net assets (c) | 5.66 | % (f) | 5.07 | % | 3.95 | % | 3.05 | % | 3.61 | % | ||||||||||
| Portfolio turnover rate (d) | 65 | % | 52 | % | 62 | % | 67 | % | 130 | % | ||||||||||
Amounts designated as “—” are either $0.00 or have been rounded to $ 0.00.
| (a) | Per share net income has been determined on the basis of average number of shares outstanding during the period. |
| (b) | Total return is a measure of the change in value of an investment in the Fund over the period covered. The returns shown do not reflect the deduction of taxes a shareholder would pay on Fund distributions, if any or the redemption of Fund shares. The total returns would be lower if the Adviser had not reduced investment management fees and/or reimbursed expenses (Note 4). |
| (c) | Ratio was determined after investment management fee reductions and/or reimbursed expenses (Note 4). |
| (d) | Portfolio turnover rate is calculated on the basis of the Fund as a whole without distinguishing between classes of shares issued. |
| (e) | Includes 0.01% of borrowing costs (Note 2). |
| (f) | Includes 0.00% of affiliated management fee waived by Adviser (Note 4). |
| (1) | Effective November 1, 2019, Westwood Short Duration Multi-Asset Yield Fund was renamed as Westwood High Income Fund. |
| (2) | Effective March 31, 2024, Westwood High Income Fund was renamed as Westwood Multi-Asseet Income Fund. |
The accompanying notes are an integral part of the financial statements.
72
| WESTWOOD FUNDS |
| FINANCIAL HIGHLIGHTS |
SELECTED PER SHARE DATA FOR A SHARE OUTSTANDING THROUGHOUT EACH YEAR OR PERIOD
Westwood Multi-Asset Income Fund (1)(2)(Continued)
| Westwood Multi-Asset Income Fund - C Class Shares | Year Ended October 31, 2024 | Year Ended October 31, 2023 | Year Ended October 31, 2022 | Year Ended October 31, 2021 | Period Ended October 31, 2020(a) | |||||||||||||||
| Net asset value at beginning of period | $ | 8.92 | $ | 9.01 | $ | 10.75 | $ | 9.55 | $ | 8.23 | ||||||||||
| Net investment income (b) | 0.49 | 0.41 | 0.33 | 0.22 | 0.24 | |||||||||||||||
| Net realized and unrealized gains (losses) on investments | 1.08 | (0.10 | ) | (1.74 | ) | 1.28 | 1.28 | |||||||||||||
| Total from investment operations | 1.57 | 0.31 | (1.41 | ) | 1.50 | 1.52 | ||||||||||||||
| Less distributions from: | ||||||||||||||||||||
| Net investment income | (0.47 | ) | (0.40 | ) | (0.33 | ) | (0.30 | ) | (0.20 | ) | ||||||||||
| Total distributions | (0.47 | ) | (0.40 | ) | (0.33 | ) | (0.30 | ) | (0.20 | ) | ||||||||||
| Net asset value at end of period | $ | 10.02 | $ | 8.92 | $ | 9.01 | $ | 10.75 | $ | 9.55 | ||||||||||
| Total return (c) | 17.85 | % | 3.34 | % | (13.32 | )% | 15.77 | % | 18.51 | % (d) | ||||||||||
| Net assets at end of period (in 000s) | $ | 79 | $ | 199 | $ | 201 | $ | 104 | $ | — | ||||||||||
| Ratio of net expenses to average net assets (e) | 1.87 | % (f)(i) | 1.69 | % | 1.83 | % | 1.80 | % | 0.02 | % (g) | ||||||||||
| Ratio of gross expenses to average net assets | 1.96 | % (f) | 1.76 | % | 1.90 | % | 1.98 | % | 0.03 | % (g) | ||||||||||
| Ratio of net investment income to average net assets (e) | 5.12 | % (i) | 4.44 | % | 3.31 | % | 2.03 | % | 4.46 | % (g) | ||||||||||
| Portfolio turnover rate (h) | 65 | % | 52 | % | 62 | % | 67 | % | 130 | % (d) | ||||||||||
Amounts designated as “—” are either $0.00 or have been rounded to $0.00.
| (a) | Represents the period from the commencement of operations (March 31, 2020) through October 31, 2020. |
| (b) | Per share net income has been determined on the basis of average number of shares outstanding during the period. |
| (c) | Total return is a measure of the change in value of an investment in the Fund over the period covered. The returns shown do not reflect the deduction of taxes a shareholder would pay on Fund distributions, if any or the redemption of Fund shares. The total returns would be lower if the Adviser had not reduced investment management fees and/or reimbursed expenses (Note 4). |
| (d) | Not annualized. |
| (e) | Ratio was determined after investment management fee reductions and/or reimbursed expenses (Note 4). |
| (f) | Includes 0.01% of borrowing costs (Note 2). |
| (g) | Annualized. |
| (h) | Portfolio turnover rate is calculated on the basis of the Fund as a whole without distinguishing between classes of shares issued. |
| (i) | Includes 0.00% of affiliated management fee waived by Adviser (Note 4). |
| (1) | Effective November 1, 2019, Westwood Short Duration Multi-Asset Yield Fund was renamed as Westwood High Income Fund. |
| (2) | Effective March 31, 2024, Westwood High Income Fund was renamed as Westwood Multi-Asseet Income Fund. |
The accompanying notes are an integral part of the financial statements.
73
| WESTWOOD FUNDS |
| FINANCIAL HIGHLIGHTS |
SELECTED PER SHARE DATA FOR A SHARE OUTSTANDING THROUGHOUT EACH YEAR OR PERIOD
Westwood Alternative Income Fund (1)
| Westwood Alternative Income Fund - Institutional Shares | Year Ended October 31, 2024 | Year Ended October 31, 2023 | Year Ended October 31, 2022 | Year Ended October 31, 2021 | Year Ended October 31, 2020 | |||||||||||||||
| Net asset value at beginning of year | $ | 9.13 | $ | 10.39 | $ | 11.02 | $ | 10.47 | $ | 10.25 | ||||||||||
| Net investment income (a) | 0.20 | 0.29 | 0.20 | 0.16 | 0.18 | |||||||||||||||
| Net realized and unrealized gains (losses) on investments | 0.65 | 0.13 | (0.51 | ) | 0.49 | 0.46 | ||||||||||||||
| Total from investment operations | 0.85 | 0.42 | (0.31 | ) | 0.65 | 0.64 | ||||||||||||||
| Less distributions from: | ||||||||||||||||||||
| Net investment income | (0.07 | ) | (1.59 | ) | (0.17 | ) | (0.10 | ) | (0.10 | ) | ||||||||||
| Net realized gains | — | — | (0.15 | ) | — | (0.32 | ) | |||||||||||||
| Return of capital | (0.25 | ) | (0.09 | ) | — | — | — | |||||||||||||
| Total distributions | (0.32 | ) | (1.68 | ) | (0.32 | ) | (0.10 | ) | (0.42 | ) | ||||||||||
| Net asset value at end of year | $ | 9.66 | $ | 9.13 | $ | 10.39 | $ | 11.02 | $ | 10.47 | ||||||||||
| Total return (b) | 9.39 | % | 4.48 | % | (2.88 | )% | 6.19 | % | 6.44 | % | ||||||||||
| Net assets at end of year (in 000s) | $ | 94,691 | $ | 86,793 | $ | 67,312 | $ | 53,734 | $ | 22,772 | ||||||||||
| Ratio of net expenses to average net assets (c) | 0.99 | % (d) | 0.34 | % | 0.30 | % | 0.96 | % | 0.90 | % | ||||||||||
| Ratio of gross expenses to average net assets | 1.22 | % (d) | 0.60 | % | 0.44 | % | 1.21 | % | 1.40 | % | ||||||||||
| Ratio of net investment income to average net assets (c) | 2.12 | % | 3.08 | % | 1.91 | % | 1.45 | % | 1.79 | % | ||||||||||
| Portfolio turnover rate (e) | 51 | % | 92 | % | 128 | % | 125 | % | 137 | % | ||||||||||
| Westwood Alternative Income Fund - A Class Shares | Year Ended October 31, 2024 | Year Ended October 31, 2023 | Year Ended October 31, 2022 | Year Ended October 31, 2021 | Period Ended October 31, 2020(f) | |||||||||||||||
| Net asset value at beginning of period | $ | 9.12 | $ | 10.39 | $ | 11.00 | $ | 10.46 | $ | 9.78 | ||||||||||
| Net investment income (a) | 0.15 | 0.27 | 0.18 | 0.14 | 0.10 | |||||||||||||||
| Net realized and unrealized gains (losses) on investments | 0.69 | 0.13 | (0.49 | ) | 0.48 | 0.62 | ||||||||||||||
| Total from investment operations | 0.84 | 0.40 | (0.31 | ) | 0.62 | 0.72 | ||||||||||||||
| Less distributions from: | ||||||||||||||||||||
| Net investment income | (0.07 | ) | (1.58 | ) | (0.15 | ) | (0.08 | ) | (0.04 | ) | ||||||||||
| Net realized gains | — | — | (0.15 | ) | — | — | ||||||||||||||
| Return of capital | (0.24 | ) | (0.09 | ) | — | — | — | |||||||||||||
| Total distributions | (0.31 | ) | (1.67 | ) | (0.30 | ) | (0.08 | ) | (0.04 | ) | ||||||||||
| Net asset value at end of period | $ | 9.65 | $ | 9.12 | $ | 10.39 | $ | 11.00 | $ | 10.46 | ||||||||||
| Total return (b) | 9.33 | % | 4.25 | % | (2.88 | )% | 5.97 | % | 7.35 | % (g) | ||||||||||
| Net assets at end of period (in 000s) | $ | 463 | $ | 34 | $ | 33 | $ | 68 | $ | 28 | ||||||||||
| Ratio of net expenses to average net assets (c) | 1.09 | % (d) | 0.46 | % | 0.45 | % | 1.11 | % | 1.15 | % (h) | ||||||||||
| Ratio of gross expenses to average net assets | 1.32 | % (d) | 0.72 | % | 0.59 | % | 1.38 | % | 1.67 | % (h) | ||||||||||
| Ratio of net investment income to average net assets (c) | 1.61 | % | 2.90 | % | 1.69 | % | 1.32 | % | 1.61 | % (h) | ||||||||||
| Portfolio turnover rate (e) | 51 | % | 92 | % | 128 | % | 125 | % | 137 | % (g) | ||||||||||
Amounts designated as “—” are either $0.00 or have been rounded to $0.00.
| (a) | Per share net income has been determined on the basis of average number of shares outstanding during the period. |
| (b) | Total return is a measure of the change in value of an investment in the Fund over the period covered. The returns shown do not reflect the deduction of taxes a shareholder would pay on Fund distributions, if any or the redemption of Fund shares. The total returns would be lower if the Adviser had not reduced investment management fees and/or reimbursed expenses (Note 4). |
| (c) | Ratio was determined after investment management fee reductions and/or reimbursed expenses (Note 4). |
| (d) | Includes 0.01% of borrowing costs (Note 2). |
| (e) | Portfolio turnover rate is calculated on the basis of the Fund as a whole without distinguishing between classes of shares issued. |
| (f) | Represents the period from the commencement of operations (March 31, 2020) through October 31, 2020. |
| (g) | Not annualized. |
| (h) | Annualized. |
| (1) | Effective November 1, 2019, Westwood Market Neutral Income Fund was renamed as Westwood Alternative Income Fund. |
The accompanying notes are an integral part of the financial statements.
74
| WESTWOOD FUNDS |
| FINANCIAL HIGHLIGHTS |
SELECTED PER SHARE DATA FOR A SHARE OUTSTANDING THROUGHOUT EACH YEAR OR PERIOD
Westwood Alternative Income Fund (1) (Continued)
| Westwood Alternative Income Fund - C Class Shares | Year Ended October 31, 2024 | Year Ended October 31, 2023 | Year Ended October 31, 2022 | Year Ended October 31, 2021 | Period Ended October 31, 2020 (a) | |||||||||||||||
| Net asset value at beginning of period | $ | 9.13 | $ | 10.40 | $ | 11.01 | $ | 10.46 | $ | 9.78 | ||||||||||
| Net investment income (b) | 0.12 | 0.21 | 0.13 | 0.06 | 0.05 | |||||||||||||||
| Net realized and unrealized gains (losses) on investments | 0.64 | 0.13 | (0.52 | ) | 0.50 | 0.65 | ||||||||||||||
| Total from investment operations | 0.76 | 0.34 | (0.39 | ) | 0.56 | 0.70 | ||||||||||||||
| Less distributions from: | ||||||||||||||||||||
| Net investment income | (0.05 | ) | (1.53 | ) | (0.07 | ) | (0.01 | ) | (0.02 | ) | ||||||||||
| Net realized gains | — | — | (0.15 | ) | — | — | ||||||||||||||
| Return of capital | (0.18 | ) | (0.08 | ) | — | — | — | |||||||||||||
| Total distributions | (0.23 | ) | (1.61 | ) | (0.22 | ) | (0.01 | ) | (0.02 | ) | ||||||||||
| Net asset value at end of period | $ | 9.66 | $ | 9.13 | $ | 10.40 | $ | 11.01 | $ | 10.46 | ||||||||||
| Total return (c) | 8.43 | % | 3.57 | % | (3.59 | )% | 5.93 | % | 7.21 | % (d) | ||||||||||
| Net assets at end of period (in 000s) | $ | 439 | $ | 443 | $ | 156 | $ | 40 | $ | 149 | ||||||||||
| Ratio of net expenses to average net assets (e) | 1.85 | % (f) | 1.21 | % | 1.20 | % | 1.83 | % | 2.10 | % (g) | ||||||||||
| Ratio of gross expenses to average net assets | 2.08 | % (f) | 1.47 | % | 1.34 | % | 2.13 | % | 2.62 | % (g) | ||||||||||
| Ratio of net investment income to average net assets (e) | 1.27 | % | 2.25 | % | 1.24 | % | 0.56 | % | 0.85 | % (g) | ||||||||||
| Portfolio turnover rate (h) | 51 | % | 92 | % | 128 | % | 125 | % | 137 | % (d) | ||||||||||
| Westwood Alternative Income Fund - Ultra Shares | Year Ended October 31, 2024 | Year Ended October 31, 2023 | Year Ended October 31, 2022 | Year Ended October 31, 2021 | Year Ended October 31, 2020 | |||||||||||||||
| Net asset value at beginning of year | $ | 9.13 | $ | 10.40 | $ | 11.02 | $ | 10.47 | $ | 10.25 | ||||||||||
| Net investment income (b) | 0.22 | 0.29 | 0.20 | 0.17 | 0.19 | |||||||||||||||
| Net realized and unrealized gains (losses) on investments | 0.64 | 0.14 | (0.49 | ) | 0.48 | 0.46 | ||||||||||||||
| Total from investment operations | 0.86 | 0.43 | (0.29 | ) | 0.65 | 0.65 | ||||||||||||||
| Less distributions from: | ||||||||||||||||||||
| Net investment income | (0.07 | ) | (1.61 | ) | (0.18 | ) | (0.10 | ) | (0.11 | ) | ||||||||||
| Net realized gains | — | — | (0.15 | ) | — | (0.32 | ) | |||||||||||||
| Return of capital | (0.26 | ) | (0.09 | ) | — | — | — | |||||||||||||
| Total distributions | (0.33 | ) | (1.70 | ) | (0.33 | ) | (0.10 | ) | (0.43 | ) | ||||||||||
| Net asset value at end of year | $ | 9.66 | $ | 9.13 | $ | 10.40 | $ | 11.02 | $ | 10.47 | ||||||||||
| Total return (c) | 9.52 | % | 4.50 | % | (2.69 | )% | 6.26 | % | 6.54 | % | ||||||||||
| Net assets at end of year (in 000s) | $ | 27,792 | $ | 54,200 | $ | 88,734 | $ | 128,329 | $ | 86,386 | ||||||||||
| Ratio of net expenses to average net assets (e) | 0.85 | % (f) | 0.21 | % | 0.20 | % | 0.85 | % | 0.87 | % | ||||||||||
| Ratio of gross expenses to average net assets | 1.08 | % (f) | 0.47 | % | 0.34 | % | 1.12 | % | 1.40 | % | ||||||||||
| Ratio of net investment income to average net assets (e) | 2.35 | % | 3.10 | % | 1.95 | % | 1.53 | % | 1.86 | % | ||||||||||
| Portfolio turnover rate (h) | 51 | % | 92 | % | 128 | % | 125 | % | 137 | % | ||||||||||
Amounts designated as “—” are either $0.00 or have been rounded to $0.00.
| (a) | Represents the period from the commencement of operations (March 31, 2020) through October 31, 2020. |
| (b) | Per share net income has been determined on the basis of average number of shares outstanding during the period. |
| (c) | Total return is a measure of the change in value of an investment in the Fund over the period covered. The returns shown do not reflect the deduction of taxes a shareholder would pay on Fund distributions, if any or the redemption of Fund shares. The total returns would be lower if the Adviser had not reduced investment management fees and/or reimbursed expenses (Note 4). |
| (d) | Not annualized. |
| (e) | Ratio was determined after investment management fee reductions and/or reimbursed expenses (Note 4). |
| (f) | Includes 0.01% of borrowing costs (Note 2). |
| (g) | Annualized. |
| (h) | Portfolio turnover rate is calculated on the basis of the Fund as a whole without distinguishing between classes of shares issued. |
| (1) | Effective November 1, 2019, Westwood Market Neutral Income Fund was renamed as Westwood Alternative Income Fund. |
The accompanying notes are an integral part of the financial statements.
75
| WESTWOOD FUNDS |
| FINANCIAL HIGHLIGHTS |
SELECTED PER SHARE DATA FOR A SHARE OUTSTANDING THROUGHOUT EACH YEAR OR PERIOD
Westwood Salient MLP & Energy Infrastructure Fund (1)
| Westwood Salient MLP & Energy Infrastructure Fund - Institutional Shares (2) | Ten Months Ended October 31, 2024(3) | Year Ended December 31, 2023(4) | Year Ended December 31, 2022 | Year Ended December 31, 2021 | Year Ended December 31, 2020 | Year Ended December 31, 2019 | ||||||||||||||||||
| Net asset value at beginning of period | $ | 7.83 | $ | 7.30 | $ | 6.50 | $ | 5.50 | $ | 7.05 | $ | 6.34 | ||||||||||||
| Net investment income (a) | 0.11 | 0.10 | 0.04 | (0.02 | ) | 0.08 | 0.04 | |||||||||||||||||
| Net realized and unrealized gains (losses) on investments | 2.21 | 0.88 | 1.08 | 1.34 | (1.31 | ) | 0.99 | |||||||||||||||||
| Total from investment operations | 2.32 | 0.98 | 1.12 | 1.32 | (1.23 | ) | 1.03 | |||||||||||||||||
| Less distributions from: | ||||||||||||||||||||||||
| Net investment income | (0.35 | ) | (0.28 | ) | — | — | — | (0.18 | ) | |||||||||||||||
| Return of capital | — | (0.17 | ) | (0.32 | ) | (0.32 | ) | (0.32 | ) | (0.14 | ) | |||||||||||||
| Total distributions | (0.35 | ) | (0.45 | ) | (0.32 | ) | (0.32 | ) | (0.32 | ) | (0.32 | ) | ||||||||||||
| Tax expense reimbursements by Adviser (Note 2) | — | — | (5) | — | — | — | — | |||||||||||||||||
| Net asset value at end of period | $ | 9.80 | $ | 7.83 | $ | 7.30 | $ | 6.50 | $ | 5.50 | $ | 7.05 | ||||||||||||
| Total return (b) | 30.24 | % (c) | 13.97 | % | 17.22 | % | 24.11 | % | (17.32 | %) | 16.33 | % | ||||||||||||
| Net assets at end of period (in 000s) | $ | 972,519 | $ | 739,542 | $ | 779,843 | $ | 566,980 | $ | 393,743 | $ | 617,790 | ||||||||||||
| Ratio of net expenses to average net assets (including tax expense/benefit) (d) | 1.07 | % (e)(h) | 1.11 | % | 1.35 | % (f) | 1.29 | % | 1.30 | % | 1.26 | % | ||||||||||||
| Ratio of net expenses to average net assets (excluding tax expense/benefit) (d) | 1.07 | % (e)(h) | 1.11 | % | 1.35 | % (f) | 1.29 | % | 1.30 | % | 1.24 | % | ||||||||||||
| Ratio of gross expenses to average net assets (including tax expense/benefit) | 1.10 | % (e) | 1.15 | % | 1.35 | % | 1.27 | % | 1.33 | % | 1.24 | % | ||||||||||||
| Ratio of net investment income (loss) to average net assets (d) | 1.46 | % (e)(h) | 1.36 | % | 0.52 | % | (27.00 | %) | 1.55 | % | 0.50 | % | ||||||||||||
| Portfolio turnover rate (g) | 74 | % (c) | 91 | % | 86 | % | 248 | % | 260 | % | 66 | % | ||||||||||||
| Westwood Salient MLP & Energy Infrastructure Fund - A Class Shares | Ten Months Ended October 31, 2024(3) | Year Ended December 31, 2023(4) | Year Ended December 31, 2022 | Year Ended December 31, 2021 | Year Ended December 31, 2020 | Year Ended December 31, 2019 | ||||||||||||||||||
| Net asset value at beginning of period | $ | 7.88 | $ | 7.34 | $ | 6.53 | $ | 5.53 | $ | 7.07 | $ | 6.36 | ||||||||||||
| Net investment income (a) | 0.09 | 0.08 | 0.02 | (0.03 | ) | 0.07 | 0.02 | |||||||||||||||||
| Net realized and unrealized gains (losses) on investments | 2.21 | 0.89 | 1.09 | 1.34 | (1.31 | ) | 1.00 | |||||||||||||||||
| Total from investment operations | 2.30 | 0.97 | 1.11 | 1.31 | (1.24 | ) | 1.02 | |||||||||||||||||
| Less distributions from: | ||||||||||||||||||||||||
| Net investment income | (0.33 | ) | (0.27 | ) | — | — | — | (0.17 | ) | |||||||||||||||
| Return of capital | — | (0.16 | ) | (0.30 | ) | (0.31 | ) | (0.30 | ) | (0.14 | ) | |||||||||||||
| Total distributions | (0.33 | ) | (0.43 | ) | (0.30 | ) | (0.31 | ) | (0.30 | ) | (0.31 | ) | ||||||||||||
| Tax expense reimbursements by Adviser (Note 2) | — | — | (5) | — | — | — | — | |||||||||||||||||
| Net asset value at end of period | $ | 9.85 | $ | 7.88 | $ | 7.34 | $ | 6.53 | $ | 5.53 | $ | 7.07 | ||||||||||||
| Total return (b) | 29.79 | % (c) | 13.75 | % | 17.00 | % | 23.74 | % | (17.43 | %) | 16.03 | % | ||||||||||||
| Net assets at end of period (in 000s) | $ | 154,629 | $ | 134,627 | $ | 151,353 | $ | 92,027 | $ | 63,681 | $ | 110,549 | ||||||||||||
| Ratio of net expenses to average net assets (including tax expense/benefit) (d) | 1.35 | % (e)(h) | 1.36 | % | 1.61 | % (f) | 1.50 | % | 1.55 | % | 1.47 | % | ||||||||||||
| Ratio of net expenses to average net assets (excluding tax expense/benefit) (d) | 1.35 | % (e)(h) | 1.36 | % | 1.61 | % (f) | 1.50 | % | 1.55 | % | 1.49 | % | ||||||||||||
| Ratio of gross expenses to average net assets (including tax expense/benefit) | 1.38 | % (e) | 1.40 | % | 1.61 | % | 1.50 | % | 1.56 | % | 1.47 | % | ||||||||||||
| Ratio of net investment income (loss) to average net assets (d) | 1.21 | % (e)(h) | 1.12 | % | 0.23 | % | (0.42 | %) | 1.29 | % | 0.24 | % | ||||||||||||
| Portfolio turnover rate (g) | 74 | % (c) | 91 | % | 86 | % | 248 | % | 260 | % | 66 | % | ||||||||||||
Amounts designated as “—” are either $0.00 or have been rounded to $0.00.
| (a) | Per share net income has been determined on the basis of average number of shares outstanding during the period. |
| (b) | Total return is a measure of the change in value of an investment in the Fund over the period covered. The returns shown do not reflect the deduction of taxes a shareholder would pay on Fund distributions, if any or the redemption of Fund shares. The total returns would be lower if the Adviser had not reduced investment management fees and/or reimbursed expenses (Note 4). |
| (c) | Not annualized. |
| (d) | Ratio was determined after investment management fee reductions and/or reimbursed expenses (Note 4). |
| (e) | Annualized. |
| (f) | Net expense ratio exceeded the expense limitation during the year ended December 31, 2022 due to reorganization expenses (Note 8). |
| (g) | Portfolio turnover rate is calculated on the basis of the Fund as a whole without distinguishing between classes of shares issued. |
| (h) | Includes 0.03% of affiliated management fee waived by Adviser (Note 4). |
| (1) | Prior to November 18, 2022, Westwood Salient MLP & Energy Infrastructure Fund was known as Salient MLP & Energy Infrastructure Fund. |
| (2) | Prior to November 18, 2022, Institutional Shares were I Share Class. |
| (3) | Fund changed fiscal year to October 31. |
| (4) | Includes adjustments in accordance with accounting principals generally accepted in the United States and, consequently, the net asset values for financial reporting purposes and the returns based upon those net asset values may differ from the net asset values and returns for shareholder transactions. |
| (5) | The Adviser reimbursed the Fund $332,497 for losses incurred from tax expenses for the year ended December 31, 2023 the net impact to the Fund was less than $0.005 per share. |
The accompanying notes are an integral part of the financial statements.
76
| WESTWOOD FUNDS |
| FINANCIAL HIGHLIGHTS |
SELECTED PER SHARE DATA FOR A SHARE OUTSTANDING THROUGHOUT EACH YEAR OR PERIOD
Westwood Salient MLP & Energy Infrastructure Fund (1) (Continued)
| Westwood Salient MLP & Energy Infrastructure Fund - C Class Shares | Ten Months Ended October 31, 2024(3) | Year Ended December 31, 2023(4) | Year Ended December 31, 2022 | Year Ended December 31, 2021 | Year Ended December 31, 2020 | Year Ended December 31, 2019 | ||||||||||||||||||
| Net asset value at beginning of period | $ | 7.85 | $ | 7.30 | $ | 6.50 | $ | 5.50 | $ | 7.02 | $ | 6.32 | ||||||||||||
| Net investment income (a) | 0.03 | 0.03 | (0.03 | ) | (0.08 | ) | 0.03 | -0.03 | (b) | |||||||||||||||
| Net realized and unrealized gains (losses) on investments | 2.20 | 0.90 | 1.07 | 1.34 | (1.31 | ) | 0.98 | |||||||||||||||||
| Total from investment operations | 2.23 | 0.93 | 1.04 | 1.26 | (1.28 | ) | 0.95 | |||||||||||||||||
| Less distributions from: | ||||||||||||||||||||||||
| Net investment income | (0.28 | ) | (0.24 | ) | — | — | — | (0.14 | ) | |||||||||||||||
| Return of capital | — | (0.14 | ) | (0.24 | ) | (0.26 | ) | (0.24 | ) | (0.11 | ) | |||||||||||||
| Total distributions | (0.28 | ) | (0.38 | ) | (0.24 | ) | (0.26 | ) | (0.24 | ) | (0.25 | ) | ||||||||||||
| Tax expense reimbursements by Adviser (Note 2) | — | — | (5) | — | — | — | — | |||||||||||||||||
| Net asset value at end of period | $ | 9.80 | $ | 7.85 | $ | 7.30 | $ | 6.50 | $ | 5.50 | $ | 7.02 | ||||||||||||
| Total return (b) | 28.91 | % (c) | 13.12 | % | 15.98 | % | 22.91 | % | (18.16 | %) | 15.15 | % | ||||||||||||
| Net assets at end of period (in 000s) | $ | 15,499 | $ | 13,741 | $ | 15,694 | $ | 17,726 | $ | 20,468 | $ | 37,346 | ||||||||||||
| Ratio of net expenses to average net assets (including tax expense/benefit) (d) | 2.10 | % (e)(h) | 2.09 | % | 2.34 | % (f) | 2.29 | % | 2.30 | % | 2.22 | % | ||||||||||||
| Ratio of net expenses to average net assets (excluding tax expense/benefit) (d) | 2.10 | % (e)(h) | 2.09 | % | 2.34 | % (f) | 2.29 | % | 2.30 | % | 2.24 | % | ||||||||||||
| Ratio of gross expenses to average net assets (including tax expense/benefit) | 2.13 | % (e) | 2.13 | % | 2.34 | % | 2.26 | % | 2.32 | % | 2.22 | % | ||||||||||||
| Ratio of net investment income (loss) to average net assets (d) | 0.47 | % (e)(h) | 0.37 | % | (0.47 | %) | (1.26 | %) | 0.57 | % | (0.48 | %) | ||||||||||||
| Portfolio turnover rate (g) | 74 | % (c) | 91 | % | 86 | % | 248 | % | 260 | % | 66 | % | ||||||||||||
| Westwood Salient MLP & Energy Infrastructure Fund - Ultra Shares (2) | Ten Months Ended October 31, 2024(3) | Year Ended December 31, 2023(4) | Year Ended December 31, 2022 | Year Ended December 31, 2021 | Year Ended December 31, 2020 | Year Ended December 31, 2019 | ||||||||||||||||||
| Net asset value at beginning of period | $ | 7.84 | $ | 7.30 | $ | 6.51 | $ | 5.50 | $ | 7.05 | $ | 6.34 | ||||||||||||
| Net investment income (a) | 0.11 | 0.11 | 0.04 | (0.01 | ) | 0.08 | 0.04 | |||||||||||||||||
| Net realized and unrealized gains (losses) on investments | 2.20 | 0.89 | 1.08 | 1.35 | (1.31 | ) | 0.99 | |||||||||||||||||
| Total from investment operations | 2.31 | 1.00 | 1.12 | 1.34 | (1.23 | ) | 1.03 | |||||||||||||||||
| Less distributions from: | ||||||||||||||||||||||||
| Net investment income | (0.35 | ) | (0.29 | ) | — | — | — | (0.18 | ) | |||||||||||||||
| Return of capital | — | (0.17 | ) | (0.33 | ) | (0.33 | ) | (0.32 | ) | (0.14 | ) | |||||||||||||
| Total distributions | (0.35 | ) | (0.46 | ) | (0.33 | ) | (0.33 | ) | (0.32 | ) | (0.32 | ) | ||||||||||||
| Tax expense reimbursements by Adviser (Note 2) | — | — | (5) | — | — | — | — | |||||||||||||||||
| Net asset value at end of period | $ | 9.80 | $ | 7.84 | $ | 7.30 | $ | 6.51 | $ | 5.50 | $ | 7.05 | ||||||||||||
| Total return (c) | 30.15 | % (c) | 14.22 | % | 17.12 | % | 24.41 | % | (17.27 | %) | 16.42 | % | ||||||||||||
| Net assets at end of period (in 000s) | $ | 5,410 | $ | 4,328 | $ | 30,710 | $ | 29,645 | $ | 32,949 | $ | 23,879 | ||||||||||||
| Ratio of net expenses to average net assets (including tax expense/benefit) (d) | 1.00 | % (e)(h) | 1.03 | % | 1.27 | % (f) | 1.20 | % | 1.26 | % | 1.16 | % | ||||||||||||
| Ratio of net expenses to average net assets (excluding tax expense/benefit) (d) | 1.00 | % (e)(h) | 10.20 | % | 1.27 | % (f) | 1.20 | % | 1.26 | % | 1.18 | % | ||||||||||||
| Ratio of gross expenses to average net assets (including tax expense/benefit) | 1.03 | % (e) | 1.06 | % | 1.27 | % | 1.20 | % | 1.26 | % | 1.16 | % | ||||||||||||
| Ratio of net investment income (loss) to average net assets (d) | 1.54 | % (e)(h) | 1.42 | % | 0.59 | % | (0.19 | %) | 1.62 | % | 0.59 | % | ||||||||||||
| Portfolio turnover rate (g) | 74 | % (c) | 91 | % | 86 | % | 248 | % | 260 | % | 66 | % | ||||||||||||
| (a) | Per share net income has been determined on the basis of average number of shares outstanding during the period. |
| (b) | Total return is a measure of the change in value of an investment in the Fund over the period covered. The returns shown do not reflect the deduction of taxes a shareholder would pay on Fund distributions, if any or the redemption of Fund shares. The total returns would be lower if the Adviser had not reduced investment management fees and/or reimbursed expenses (Note 4). |
| (c) | Not annualized. |
| (d) | Ratio was determined after investment management fee reductions and/or reimbursed expenses (Note 4). |
| (e) | Annualized. |
| (f) | Net expense ratio exceeded the expense limitation during the year ended December 31, 2022 due to reorganization expenses (Note 8). |
| (g) | Portfolio turnover rate is calculated on the basis of the Fund as a whole without distinguishing between classes of shares issued. |
| (h) | Includes 0.03% of affiliated management fee waived by Adviser (Note 4). |
| (1) | Prior to November 18, 2022, Westwood Salient MLP & Energy Infrastructure Fund was known as Salient MLP & Energy Infrastructure Fund. |
| (2) | Prior to November 18, 2022, Ultra Shares were R6 Share Class. |
| (3) | Fund changed fiscal year to October 31. |
| (4) | Includes adjustments in accordance with accounting principals generally accepted in the United States and, consequently, the net asset values for financial reporting purposes and the returns based upon those net asset values may differ from the net asset values and returns for shareholder transactions. |
| (5) | The Adviser reimbursed the Fund $332,497 for losses incurred from tax expenses for the year ended December 31, 2023 the net impact to the Fund was less than $0.005 per share. |
The accompanying notes are an integral part of the financial statements.
77
| WESTWOOD FUNDS |
| FINANCIAL HIGHLIGHTS |
SELECTED PER SHARE DATA FOR A SHARE OUTSTANDING THROUGHOUT EACH YEAR OR PERIOD
Westwood Global Real Estate Fund (1)(2)
| Westwood Global Real Estate Fund - Institutional Shares | Year Ended October 31, 2024 | Ten Months Ended October 31, 2023(3) | Year Ended December 31, 2022 | Year Ended December 31, 2021 | Year Ended December 31, 2020 | Year Ended December 31, 2019 | ||||||||||||||||||
| Net asset value at beginning of period | $ | 10.80 | $ | 11.63 | $ | 15.22 | $ | 12.86 | $ | 14.59 | $ | 12.33 | ||||||||||||
| Net investment income (a) | 0.29 | 0.18 | 0.28 | 0.18 | 0.16 | 0.22 | ||||||||||||||||||
| Net realized and unrealized gains (losses) on investments | 2.12 | (0.78 | ) | (3.56 | ) | 2.64 | (1.66 | ) | 2.40 | |||||||||||||||
| Total from investment operations | 2.41 | (0.60 | ) | (3.28 | ) | 2.82 | (1.50 | ) | 2.62 | |||||||||||||||
| Less distributions from: | ||||||||||||||||||||||||
| Net investment income | (0.28 | ) | (0.17 | ) | (0.27 | ) | (0.46 | ) | (0.23 | ) | (0.36 | ) | ||||||||||||
| Return of capital | (0.04 | ) | (0.06 | ) | (0.04 | ) | — | — | — | |||||||||||||||
| Total distributions | (0.32 | ) | (0.23 | ) | (0.31 | ) | (0.46 | ) | (0.23 | ) | (0.36 | ) | ||||||||||||
| Net asset value at end of period | $ | 12.89 | $ | 10.80 | $ | 11.63 | $ | 15.22 | $ | 12.86 | $ | 14.59 | ||||||||||||
| Total return (b) | 22.41 | % | (5.22 | )% (c) | (21.61 | %) | 22.09 | % | (9.98 | %) | 21.31 | % | ||||||||||||
| Net assets at end of period (in 000s) | $ | 2,057 | $ | 1,838 | $ | 2,631 | $ | 3,685 | $ | 3,360 | $ | 6,793 | ||||||||||||
| Ratio of net expenses to average net assets (d) | 1.10 | % | 1.09 | % (e) | 1.14 | % | 1.15 | % | 1.15 | % | 1.15 | % | ||||||||||||
| Ratio of gross expenses to average net assets | 1.76 | % | 1.73 | % (e) | 2.09 | % | 1.96 | % | 2.03 | % | 1.71 | % | ||||||||||||
| Ratio of net investment income to average net assets (d) | 2.35 | % | 1.83 | % (e) | 2.17 | % | 1.23 | % | 1.38 | % | 1.54 | % | ||||||||||||
| Portfolio turnover rate (f) | 48 | % | 10 | % (c) | 29 | % | 49 | % | 29 | % | 21 | % | ||||||||||||
| Westwood Global Real Estate Fund - A Class Shares | Year Ended October 31, 2024 | Ten Months Ended October 31, 2023(3) | Year Ended December 31, 2022 | Year Ended December 31, 2021 | Year Ended December 31, 2020 | Year Ended December 31, 2019 | ||||||||||||||||||
| Net asset value at beginning of period | $ | 10.85 | $ | 11.68 | $ | 15.29 | $ | 12.92 | $ | 14.65 | $ | 12.38 | ||||||||||||
| Net investment income (a) | 0.25 | 0.16 | 0.23 | 0.12 | 0.12 | 0.17 | ||||||||||||||||||
| Net realized and unrealized gains (losses) on investments | 2.13 | (0.78 | ) | (3.57 | ) | 2.65 | (1.68 | ) | 2.40 | |||||||||||||||
| Total from investment operations | 2.38 | (0.62 | ) | (3.34 | ) | 2.77 | (1.56 | ) | 2.57 | |||||||||||||||
| Less distributions from: | ||||||||||||||||||||||||
| Net investment income | (0.25 | ) | (0.15 | ) | (0.24 | ) | (0.40 | ) | (0.17 | ) | (0.30 | ) | ||||||||||||
| Return of capital | (0.04 | ) | (0.06 | ) | (0.03 | ) | — | — | — | |||||||||||||||
| Total distributions | (0.29 | ) | (0.21 | ) | (0.27 | ) | (0.40 | ) | (0.17 | ) | (0.30 | ) | ||||||||||||
| Net asset value at end of period | $ | 12.94 | $ | 10.85 | $ | 11.68 | $ | 15.29 | $ | 12.92 | $ | 14.65 | ||||||||||||
| Total return (b) | 21.98 | % | (5.39 | )% (c) | (21.91 | %) | 21.58 | % | (10.36 | %) | 20.82 | % | ||||||||||||
| Net assets at end of period (in 000s) | $ | 13,711 | $ | 13,871 | $ | 16,335 | $ | 23,312 | $ | 20,341 | $ | 26,859 | ||||||||||||
| Ratio of net expenses to average net assets (d) | 1.37 | % | 1.34 | % (e) | 1.54 | % | 1.55 | % | 1.55 | % | 1.55 | % | ||||||||||||
| Ratio of gross expenses to average net assets | 2.03 | % | 1.98 | % (e) | 2.49 | % | 2.36 | % | 2.43 | % | 2.11 | % | ||||||||||||
| Ratio of net investment income to average net assets (d) | 2.07 | % | 1.62 | % (e) | 1.76 | % | 0.83 | % | 1.02 | % | 1.21 | % | ||||||||||||
| Portfolio turnover rate (f) | 48 | % | 10 | % (c) | 29 | % | 49 | % | 29 | % | 21 | % | ||||||||||||
Amounts designated as “—” are either $0.00 or have been rounded to $0.00.
| (a) | Per share net income has been determined on the basis of average number of shares outstanding during the period. |
| (b) | Total return is a measure of the change in value of an investment in the Fund over the period covered. The returns shown do not reflect the deduction of taxes a shareholder would pay on Fund distributions, if any or the redemption of Fund shares. The total returns would be lower if the Adviser had not reduced investment management fees and/or reimbursed expenses (Note 4). |
| (c) | Not annualized. |
| (d) | Ratio was determined after investment management fee reductions and/or reimbursed expenses (Note 4). |
| (e) | Annualized. |
| (f) | Portfolio turnover rate is calculated on the basis of the Fund as a whole without distinguishing between classes of shares issued. |
| (1) | Prior to November 18, 2022, Westwood Salient Global Real Estate Fund was known as Salient Global Real Estate Fund. Prior to August 14, 2018, Salient Global Estate Fund was known as Salient International Real Estate Fund. |
| (2) | Effective March 31, 2024, Westwood Salient Global Real Estate Fund was renamed as Westwood Global Real Estate Fund. |
| (3) | Fund changed fiscal year to October 31. |
The accompanying notes are an integral part of the financial statements.
78
| WESTWOOD FUNDS |
| FINANCIAL HIGHLIGHTS |
SELECTED PER SHARE DATA FOR A SHARE OUTSTANDING THROUGHOUT EACH YEAR OR PERIOD
Westwood Global Real Estate Fund (1)(2) (Continued)
| Westwood Global Real Estate Fund - C Class Shares | Year Ended October 31, 2024 | Ten Months Ended October 31, 2023(3) | Year Ended December 31, 2022 | Year Ended December 31, 2021 | Year Ended December 31, 2020 | Year Ended December 31, 2019 | ||||||||||||||||||
| Net asset value at beginning of period | $ | 10.80 | $ | 11.64 | $ | 15.25 | $ | 12.88 | $ | 14.59 | $ | 12.31 | ||||||||||||
| Net investment income (a) | 0.16 | 0.09 | 0.16 | 0.03 | 0.05 | 0.07 | ||||||||||||||||||
| Net realized and unrealized gains (losses) on investments | 2.12 | (0.78 | ) | (3.56 | ) | 2.66 | (1.65 | ) | 2.41 | |||||||||||||||
| Total from investment operations | 2.28 | (0.69 | ) | (3.40 | ) | 2.69 | (1.60 | ) | 2.48 | |||||||||||||||
| Less distributions from: | ||||||||||||||||||||||||
| Net investment income | (0.16 | ) | (0.11 | ) | (0.18 | ) | (0.32 | ) | (0.11 | ) | (0.20 | ) | ||||||||||||
| Return of capital | (0.02 | ) | (0.04 | ) | (0.03 | ) | — | — | — | |||||||||||||||
| Total distributions | (0.18 | ) | (0.15 | ) | (0.21 | ) | (0.32 | ) | (0.11 | ) | (0.20 | ) | ||||||||||||
| Net asset value at end of period | $ | 12.90 | $ | 10.80 | $ | 11.64 | $ | 15.25 | $ | 12.88 | $ | 14.59 | ||||||||||||
| Total return (b) | 21.21 | % | (6.03 | )% (c) | (22.33 | %) | 20.95 | % | (10.81 | %) | 20.19 | % | ||||||||||||
| Net assets at end of period (in 000s) | $ | 422 | $ | 959 | $ | 1,061 | $ | 1,591 | $ | 2,585 | $ | 4,614 | ||||||||||||
| Ratio of net expenses to average net assets (d) | 2.05 | % | 2.06 | % (e) | 2.09 | % | 2.10 | % | 2.10 | % | 2.10 | % | ||||||||||||
| Ratio of gross expenses to average net assets | 2.71 | % | 2.70 | % (e) | 3.04 | % | 2.94 | % | 2.98 | % | 2.67 | % | ||||||||||||
| Ratio of net investment income to average net assets (d) | 1.31 | % | 0.90 | % (e) | 1.22 | % | 0.22 | % | 0.41 | % | 0.51 | % | ||||||||||||
| Portfolio turnover rate (f) | 48 | % | 10 | % (c) | 29 | % | 49 | % | 29 | % | 21 | % | ||||||||||||
Amounts designated as “—” are either $0.00 or have been rounded to $0.00.
| (a) | Per share net income has been determined on the basis of average number of shares outstanding during the period. |
| (b) | Total return is a measure of the change in value of an investment in the Fund over the period covered. The returns shown do not reflect the deduction of taxes a shareholder would pay on Fund distributions, if any or the redemption of Fund shares. The total returns would be lower if the Adviser had not reduced investment management fees and/or reimbursed expenses (Note 4). |
| (c) | Not annualized. |
| (d) | Ratio was determined after investment management fee reductions and/or reimbursed expenses (Note 4). |
| (e) | Annualized. |
| (f) | Portfolio turnover rate is calculated on the basis of the Fund as a whole without distinguishing between classes of shares issued. |
| (1) | Prior to November 18, 2022, Westwood Salient Global Real Estate Fund was known as Salient Global Real Estate Fund. Prior to August 14, 2018 Salient Global Estate Fund was known as Salient International Real Estate Fund. |
| (2) | Effective March 31, 2024, Westwood Salient Global Real Estate Fund was renamed as Westwood Global Real Estate Fund. |
| (3) | Fund changed fiscal year to October 31. |
The accompanying notes are an integral part of the financial statements.
79
| WESTWOOD FUNDS |
| FINANCIAL HIGHLIGHTS |
SELECTED PER SHARE DATA FOR A SHARE OUTSTANDING THROUGHOUT EACH YEAR OR PERIOD
Westwood Real Estate Income Fund (1)(2)
| Westwood Real Estate Income Fund - Institutional Shares | Year Ended October 31, 2024 | Ten Months Ended October 31, 2023(3) | Year Ended December 31, 2022 | Year Ended December 31, 2021 | Year Ended December 31, 2020 | Year Ended December 31, 2019 | ||||||||||||||||||
| Net asset value at beginning of period | $ | 16.64 | $ | 17.39 | $ | 21.56 | $ | 19.68 | $ | 21.42 | $ | 19.07 | ||||||||||||
| Net investment income (a) | 0.47 | 0.75 | 0.70 | 0.46 | 0.49 | 0.57 | ||||||||||||||||||
| Net realized and unrealized gains (losses) on investments | 3.73 | (0.59 | ) | (3.71 | ) | 3.19 | (1.24 | ) | 2.95 | |||||||||||||||
| Total from investment operations | 4.20 | 0.16 | (3.01 | ) | 3.65 | (0.75 | ) | 3.52 | ||||||||||||||||
| Less distributions from: | ||||||||||||||||||||||||
| Net investment income | (1.31 | ) | (0.87 | ) | (0.71 | ) | (1.11 | ) | (0.46 | ) | (0.51 | ) | ||||||||||||
| Net realized gains | — | — | — | — | — | — | ||||||||||||||||||
| Return of capital | — | (0.04 | ) | (0.45 | ) | (0.66 | ) | (0.53 | ) | (0.66 | ) | |||||||||||||
| Total distributions | (1.31 | ) | (0.91 | ) | (1.16 | ) | (1.77 | ) | (0.99 | ) | (1.17 | ) | ||||||||||||
| Net asset value at end of period | $ | 19.53 | $ | 16.64 | $ | 17.39 | $ | 21.56 | $ | 19.68 | $ | 21.42 | ||||||||||||
| Total return (b) | 25.88 | % | 0.81 | % (c) | (14.10 | %) | 15.44 | % | (2.75 | %) | 18.64 | % | ||||||||||||
| Net assets at end of period (in 000s) | $ | 177,945 | $ | 139,523 | $ | 108,853 | $ | 143,721 | $ | 160,526 | $ | 232,707 | ||||||||||||
| Ratio of net expenses to average net assets (excluding interest and dividends on short sale expense) (d) | 0.93 | % | 1.09 | % (e) | 1.03 | % | 1.10 | % | 1.10 | % | 1.06 | % | ||||||||||||
| Ratio of gross expenses to average net assets (excluding interest and dividends on short sale expense) | 0.90 | % | 0.98 | % (e) | 1.42 | % | 1.37 | % | 1.37 | % | 1.31 | % | ||||||||||||
| Ratio of net investment income to average net assets (d) | 2.56 | % | 5.09 | % (e) | 3.67 | % | 2.26 | % | 2.73 | % | 2.76 | % | ||||||||||||
| Ratio of net expenses to average net assets (including interest and dividends on short sale expense) (d) | 0.93 | % | 1.09 | % (e) | 1.12 | % | 1.15 | % | 1.15 | % | 1.10 | % | ||||||||||||
| Ratio of gross expenses to average net assets (including interest and dividends on short sale expense) | 0.90 | % | 0.98 | % (e) | 1.51 | % | 1.42 | % | 1.42 | % | 1.35 | % | ||||||||||||
| Ratio of net investment income to average net assets (d) | 2.56 | % | 5.09 | % (e) | 3.58 | % | 2.21 | % | 2.68 | % | 2.72 | % | ||||||||||||
| Portfolio turnover rate (f) | 94 | % | 76 | % (c) | 72 | % | 82 | % | 55 | % | 49 | % | ||||||||||||
Amounts designated as “—” are either $0.00 or have been rounded to $0.00.
| (a) | Per share net income has been determined on the basis of average number of shares outstanding during the period. |
| (b) | Total return is a measure of the change in value of an investment in the Fund over the period covered. The returns shown do not reflect the deduction of taxes a shareholder would pay on Fund distributions, if any or the redemption of Fund shares. The total returns would be lower if the Adviser had not reduced investment management fees and/or reimbursed expenses (Note 4). |
| (c) | Not annualized. |
| (d) | Ratio was determined after investment management fee recoupment, reductions and/or reimbursed expenses (Note 4). |
| (e) | Annualized. |
| (f) | Portfolio turnover rate is calculated on the basis of the Fund as a whole without distinguishing between classes of shares issued. |
| (1) | Prior to November 18, 2022, Westwood Salient Select Income Fund was known as Salient Select Income Fund. |
| (2) | Effective March 31, 2024, Westwood Salient Select Income Fund was renamed as Westwood Real Estate Income Fund. |
| (3) | Fund changed fiscal year to October 31. |
The accompanying notes are an integral part of the financial statements.
80
| WESTWOOD FUNDS |
| FINANCIAL HIGHLIGHTS |
SELECTED PER SHARE DATA FOR A SHARE OUTSTANDING THROUGHOUT EACH YEAR OR PERIOD
Westwood Real Estate Income Fund (1)(2) (Continued)
| Westwood Real Estate Income Fund - A Class Shares | Year Ended October 31, 2024 | Ten Months Ended October 31, 2023(3) | Year Ended December 31, 2022 | Year Ended December 31, 2021 | Year Ended December 31, 2020 | Year Ended December 31, 2019 | ||||||||||||||||||
| Net asset value at beginning of period | $ | 16.71 | $ | 17.45 | $ | 21.63 | $ | 19.74 | $ | 21.48 | $ | 19.13 | ||||||||||||
| Net investment income (a) | 0.40 | 0.70 | 0.71 | 0.38 | 0.43 | 0.49 | ||||||||||||||||||
| Net realized and unrealized gains (losses) on investments | 3.76 | (0.57 | ) | (3.80 | ) | 3.14 | (1.26 | ) | 2.94 | |||||||||||||||
| Total from investment operations | 4.16 | 0.13 | (3.09 | ) | 3.52 | (0.83 | ) | 3.43 | ||||||||||||||||
| Less distributions from: | ||||||||||||||||||||||||
| Net investment income | (1.26 | ) | (0.83 | ) | (0.67 | ) | (1.02 | ) | (0.43 | ) | (0.47 | ) | ||||||||||||
| Net realized gains | — | — | — | — | — | — | ||||||||||||||||||
| Return of capital | — | (0.04 | ) | (0.42 | ) | (0.61 | ) | (0.48 | ) | (0.61 | ) | |||||||||||||
| Total distributions | (1.26 | ) | (0.87 | ) | (1.09 | ) | (1.63 | ) | (0.91 | ) | (1.08 | ) | ||||||||||||
| Net asset value at end of period | $ | 19.61 | $ | 16.71 | $ | 17.45 | $ | 21.63 | $ | 19.74 | $ | 21.48 | ||||||||||||
| Total return (b) | 25.47 | % | 0.66 | % (c) | (14.45 | %) | 14.98 | % | (3.17 | %) | 18.12 | % | ||||||||||||
| Net assets at end of period (in 000s) | $ | 94,816 | $ | 95,619 | $ | 103,950 | $ | 126,620 | $ | 125,194 | $ | 160,277 | ||||||||||||
| Ratio of net expenses to average net assets (excluding interest and dividends on short sale expense) (d) | 1.23 | % | 1.33 | % (e) | 1.53 | % | 1.50 | % | 1.50 | % | 1.46 | % | ||||||||||||
| Ratio of gross expenses to average net assets (excluding interest and dividends on short sale expense) | 1.20 | % | 1.22 | % (e) | 1.95 | % | 1.77 | % | 1.77 | % | 1.71 | % | ||||||||||||
| Ratio of net investment income to average net assets (d) | 2.20 | % | 4.75 | % (e) | 3.73 | % | 1.87 | % | 2.38 | % | 2.37 | % | ||||||||||||
| Ratio of net expenses to average net assets (including interest and dividends on short sale expense) (d) | 1.23 | % | 1.33 | % (e) | 1.62 | % | 1.55 | % | 1.55 | % | 1.50 | % | ||||||||||||
| Ratio of gross expenses to average net assets (including interest and dividends on short sale expense) | 1.20 | % | 1.22 | % (e) | 2.04 | % | 1.82 | % | 1.82 | % | 1.75 | % | ||||||||||||
| Ratio of net investment income to average net assets (d) | 2.20 | % | 4.75 | % (e) | 3.64 | % | 1.82 | % | 2.33 | % | 2.33 | % | ||||||||||||
| Portfolio turnover rate (f) | 94 | % | 76 | % (c) | 72 | % | 82 | % | 55 | % | 49 | % | ||||||||||||
Amounts designated as “—” are either $0.00 or have been rounded to $0.00.
| (a) | Per share net income has been determined on the basis of average number of shares outstanding during the period. |
| (b) | Total return is a measure of the change in value of an investment in the Fund over the period covered. The returns shown do not reflect the deduction of taxes a shareholder would pay on Fund distributions, if any or the redemption of Fund shares. The total returns would be lower if the Adviser had not reduced investment management fees and/or reimbursed expenses (Note 4). |
| (c) | Not annualized. |
| (d) | Ratio was determined after investment management fee recoupment, reductions and/or reimbursed expenses (Note 4). |
| (e) | Annualized. |
| (f) | Portfolio turnover rate is calculated on the basis of the Fund as a whole without distinguishing between classes of shares issued. |
| (1) | Prior to November 18, 2022, Westwood Salient Select Income Fund was known as Salient Select Income Fund. |
| (2) | Effective March 31, 2024, Westwood Salient Select Income Fund was renamed as Westwood Real Estate Income Fund. |
| (3) | Fund changed fiscal year to October 31. |
The accompanying notes are an integral part of the financial statements.
81
| WESTWOOD FUNDS |
| FINANCIAL HIGHLIGHTS |
SELECTED PER SHARE DATA FOR A SHARE OUTSTANDING THROUGHOUT EACH YEAR OR PERIOD
Westwood Real Estate Income Fund (1)(2) (Continued)
| Westwood Real Estate Income Fund - C Class Shares | Year Ended October 31, 2024 | Ten Months Ended October 31, 2023(3) | Year Ended December 31, 2022 | Year Ended December 31, 2021 | Year Ended December 31, 2020 | Year Ended December 31, 2019 | ||||||||||||||||||
| Net asset value at beginning of period | $ | 16.10 | $ | 16.87 | $ | 20.94 | $ | 19.13 | $ | 20.84 | $ | 18.56 | ||||||||||||
| Net investment income (a) | 0.22 | 0.58 | 0.47 | 0.21 | 0.30 | 0.31 | ||||||||||||||||||
| Net realized and unrealized gains (losses) on investments | 3.66 | (0.57 | ) | (3.56 | ) | 3.04 | (1.20 | ) | 2.91 | |||||||||||||||
| Total from investment operations | 3.88 | 0.01 | (3.09 | ) | 3.25 | (0.90 | ) | 3.22 | ||||||||||||||||
| Less distributions from: | ||||||||||||||||||||||||
| Net investment income | (1.13 | ) | (0.75 | ) | (0.60 | ) | (0.90 | ) | (0.38 | ) | (0.41 | ) | ||||||||||||
| Net realized gains | — | — | — | — | — | — | ||||||||||||||||||
| Return of capital | — | (0.03 | ) | (0.38 | ) | (0.54 | ) | (0.43 | ) | (0.53 | ) | |||||||||||||
| Total distributions | (1.13 | ) | (0.78 | ) | (0.98 | ) | (1.44 | ) | (0.81 | ) | (0.94 | ) | ||||||||||||
| Net asset value at end of period | $ | 18.85 | $ | 16.10 | $ | 16.87 | $ | 20.94 | $ | 19.13 | $ | 20.84 | ||||||||||||
| Total return (b) | 24.67 | % | (0.03 | )% (c) | (14.92 | %) | 14.35 | % | (3.69 | %) | 17.51 | % | ||||||||||||
| Net assets at end of period (in 000s) | $ | 4,477 | $ | 5,327 | $ | 5,679 | $ | 11,219 | $ | 29,178 | $ | 51,214 | ||||||||||||
| Ratio of net expenses to average net assets (excluding interest and dividends on short sale expense) (d) | 1.88 | % | 2.06 | % (e) | 1.98 | % | 2.05 | % | 2.05 | % | 2.03 | % | ||||||||||||
| Ratio of gross expenses to average net assets (excluding interest and dividends on short sale expense) | 1.85 | % | 1.95 | % (e) | 2.38 | % | 2.33 | % | 2.32 | % | 2.28 | % | ||||||||||||
| Ratio of net investment income to average net assets (d) | 1.27 | % | 4.00 | % (e) | 2.57 | % | 1.11 | % | 1.75 | % | 1.58 | % | ||||||||||||
| Ratio of net expenses to average net assets (including interest and dividends on short sale expense) (d) | 1.88 | % | 2.06 | % (e) | 2.07 | % | 2.10 | % | 2.10 | % | 2.07 | % | ||||||||||||
| Ratio of gross expenses to average net assets (including interest and dividends on short sale expense) | 1.85 | % | 1.95 | % (e) | 2.47 | % | 2.38 | % | 2.37 | % | 2.32 | % | ||||||||||||
| Ratio of net investment income to average net assets (d) | 1.27 | % | 4.00 | % (e) | 2.48 | % | 1.06 | % | 1.70 | % | 1.54 | % | ||||||||||||
| Portfolio turnover rate (f) | 94 | % | 76 | % (c) | 72 | % | 82 | % | 55 | % | 49 | % | ||||||||||||
Amounts designated as “—” are either $0.00 or have been rounded to $0.00.
| (a) | Per share net income has been determined on the basis of average number of shares outstanding during the period. |
| (b) | Total return is a measure of the change in value of an investment in the Fund over the period covered. The returns shown do not reflect the deduction of taxes a shareholder would pay on Fund distributions, if any or the redemption of Fund shares. The total returns would be lower if the Adviser had not reduced investment management fees and/or reimbursed expenses (Note 4). |
| (c) | Not annualized. |
| (d) | Ratio was determined after investment management fee recoupment, reductions and/or reimbursed expenses (Note 4). |
| (e) | Annualized |
| (f) | Portfolio turnover rate is calculated on the basis of the Fund as a whole without distinguishing between classes of shares issued. |
| (1) | Prior to November 18, 2022, Westwood Salient Select Income Fund was known as Salient Select Income Fund. |
| (2) | Effective March 31, 2024, Westwood Salient Select Income Fund was renamed as Westwood Real Estate Income Fund. |
| (3) | Fund changed fiscal year to October 31. |
The accompanying notes are an integral part of the financial statements.
82
| WESTWOOD FUNDS |
| FINANCIAL HIGHLIGHTS |
SELECTED PER SHARE DATA FOR A SHARE OUTSTANDING THROUGHOUT EACH YEAR OR PERIOD
Westwood Broadmark Tactical Growth Fund (1)
| Westwood Broadmark Tactical Growth Fund - Institutional Shares | Year Ended October 31, 2024 | Ten Months Ended October 31, 2023(2) | Year Ended December 31, 2022 | Year Ended December 31, 2021 | Year Ended December 31, 2020 | Year Ended December 31, 2019 | ||||||||||||||||||
| Net asset value at beginning of period | $ | 26.40 | $ | 26.07 | $ | 29.14 | $ | 27.96 | $ | 26.81 | $ | 25.43 | ||||||||||||
| Net investment income (loss) (a) | 0.62 | 0.57 | (0.06 | ) | (0.24 | ) | (0.16 | ) | 0.16 | |||||||||||||||
| Net realized and unrealized gains (losses) on investments | 1.02 | (0.24 | ) | (2.24 | ) | 2.48 | 2.40 | 2.53 | ||||||||||||||||
| Total from investment operations | 1.64 | 0.33 | (2.30 | ) | 2.24 | 2.24 | 2.69 | |||||||||||||||||
| Less distributions from: | ||||||||||||||||||||||||
| Net investment income | (0.53 | ) | — | — | — | (0.03 | ) | (0.14 | ) | |||||||||||||||
| Net realized gains | (0.47 | ) | — | (0.77 | ) | (1.06 | ) | (1.06 | ) | (1.17 | ) | |||||||||||||
| Total distributions | (1.00 | ) | — | (0.77 | ) | (1.06 | ) | (1.09 | ) | (1.31 | ) | |||||||||||||
| Net asset value at end of period | $ | 27.04 | $ | 26.40 | $ | 26.07 | $ | 29.14 | $ | 27.96 | $ | 26.81 | ||||||||||||
| Total return (b) | 6.44 | % | 1.27 | % (c) | (7.90 | )% | 8.02 | % | 8.40 | % | 10.69 | % | ||||||||||||
| Net assets at end of period (in 000s) | $ | 144,258 | $ | 215,512 | $ | 236,181 | $ | 301,241 | $ | 255,095 | $ | 250,153 | ||||||||||||
| Ratio of net expenses to average net assets | 1.30 | % | 1.26 | % (d) | 1.51 | % | 1.46 | % | 1.47 | % | 1.43 | % | ||||||||||||
| Ratio of net investment income (loss) to average net assets | 2.35 | % | 2.60 | % (d) | (0.21 | )% | (0.82 | )% | (0.58 | )% | 0.62 | % | ||||||||||||
| Portfolio turnover rate (e) | 156 | % | 565 | % (c) | 1,037 | % | 201 | % | 626 | % | 435 | % | ||||||||||||
| Westwood Broadmark Tactical Growth Fund - A Class Shares | Year Ended October 31, 2024 | Ten Months Ended October 31, 2023(2) | Year Ended December 31, 2022 | Year Ended December 31, 2021 | Year Ended December 31, 2020 | Year Ended December 31, 2019 | ||||||||||||||||||
| Net asset value at beginning of period | $ | 24.57 | $ | 24.31 | $ | 27.34 | $ | 26.40 | $ | 25.45 | $ | 24.24 | ||||||||||||
| Net investment income (loss) (a) | 0.50 | 0.47 | (0.13 | ) | (0.34 | ) | (0.26 | ) | 0.05 | |||||||||||||||
| Net realized and unrealized gains (losses) on investments | 0.95 | (0.21 | ) | (2.13 | ) | 2.34 | 2.27 | 2.39 | ||||||||||||||||
| Total from investment operations | 1.45 | 0.26 | (2.26 | ) | 2.00 | 2.01 | 2.44 | |||||||||||||||||
| Less distributions from: | ||||||||||||||||||||||||
| Net investment income | (0.45 | ) | — | — | — | — | (0.06 | ) | ||||||||||||||||
| Net realized gains | (0.47 | ) | — | (0.77 | ) | (1.06 | ) | (1.06 | ) | (1.17 | ) | |||||||||||||
| Total distributions | (0.92 | ) | — | (0.77 | ) | (1.06 | ) | (1.06 | ) | (1.23 | ) | |||||||||||||
| Net asset value at end of period | $ | 25.10 | $ | 24.57 | $ | 24.31 | $ | 27.34 | $ | 26.40 | $ | 25.45 | ||||||||||||
| Total return (b) | 6.14 | % | 1.07 | % (c) | (8.27 | )% | 7.59 | % | 7.95 | % | 10.20 | % | ||||||||||||
| Net assets at end of period (in 000s) | $ | 16,156 | $ | 20,551 | $ | 27,117 | $ | 21,995 | $ | 17,949 | $ | 17,273 | ||||||||||||
| Ratio of net expenses to average net assets | 1.58 | % | 1.53 | % (d) | 1.91 | % | 1.86 | % | 1.88 | % | 1.85 | % | ||||||||||||
| Ratio of net investment income (loss) to average net assets | 2.04 | % | 2.31 | % (d) | (0.49 | )% | (1.21 | )% | (0.99 | )% | 0.21 | % | ||||||||||||
| Portfolio turnover rate (e) | 156 | % | 565 | % (c) | 1,037 | % | 201 | % | 626 | % | 435 | % | ||||||||||||
Amounts designated as “—” are either $0.00 or have been rounded to $0.00.
| (a) | Per share net income has been determined on the basis of average number of shares outstanding during the period. |
| (b) | Total return is a measure of the change in value of an investment in the Fund over the period covered. The returns shown do not reflect the deduction of taxes a shareholder would pay on Fund distributions, if any or the redemption of Fund shares. The total returns would be lower if the Adviser had not reduced investment management fees and/or reimbursed expenses (Note 4). |
| (c) | Not annualized. |
| (d) | Annualized. |
| (e) | Portfolio turnover rate is calculated on the basis of the Fund as a whole without distinguishing between classes of shares issued. |
| (1) | Prior to November 18, 2022, Westwood Broadmark Tactical Growth Fund was known as Salient Tactical Growth Fund. |
| (2) | Fund changed fiscal year to October 31. |
The accompanying notes are an integral part of the financial statements.
83
| WESTWOOD FUNDS |
| FINANCIAL HIGHLIGHTS |
SELECTED PER SHARE DATA FOR A SHARE OUTSTANDING THROUGHOUT EACH YEAR OR PERIOD
Westwood Broadmark Tactical Growth Fund (1) (Continued)
| Westwood Broadmark Tactical Growth Fund - C Class Shares | Year Ended October 31, 2024 | Ten Months Ended October 31, 2023(2) | Year Ended December 31, 2022 | Year Ended December 31, 2021 | Year Ended December 31, 2020 | Year Ended December 31, 2019 | ||||||||||||||||||
| Net asset value at beginning of period | $ | 22.50 | $ | 22.40 | $ | 25.39 | $ | 24.72 | $ | 24.03 | $ | 23.01 | ||||||||||||
| Net investment income (loss) (a) | 0.32 | 0.30 | (0.27 | ) | (0.46 | ) | (0.39 | ) | (0.09 | ) (b) | ||||||||||||||
| Net realized and unrealized gains (losses) on investments | 0.86 | (0.20 | ) | (1.95 | ) | 2.19 | 2.14 | 2.28 | ||||||||||||||||
| Total from investment operations | 1.18 | 0.10 | (2.22 | ) | 1.73 | 1.75 | 2.19 | |||||||||||||||||
| Less distributions from: | ||||||||||||||||||||||||
| Net investment income | (0.26 | ) | — | — | — | — | — | |||||||||||||||||
| Net realized gains | (0.47 | ) | — | (0.77 | ) | (1.06 | ) | (1.06 | ) | (1.17 | ) | |||||||||||||
| Total distributions | (0.73 | ) | — | (0.77 | ) | (1.06 | ) | (1.06 | ) | (1.17 | ) | |||||||||||||
| Net asset value at end of period | $ | 22.95 | $ | 22.50 | $ | 22.40 | $ | 25.39 | $ | 24.72 | $ | 24.03 | ||||||||||||
| Total return (c) | 5.41 | % | 0.45 | % (d) | (8.75 | )% | 7.01 | % | 7.33 | % | 9.67 | % | ||||||||||||
| Net assets at end of period (in 000s) | $ | 3,448 | $ | 6,252 | $ | 7,827 | $ | 9,075 | $ | 11,830 | $ | 16,505 | ||||||||||||
| Ratio of net expenses to average net assets | 2.25 | % | 2.23 | % (e) | 2.46 | % | 2.41 | % | 2.42 | % | 2.40 | % | ||||||||||||
| Ratio of net investment income (loss) to average net assets | 1.41 | % | 1.62 | % (e) | (1.14 | )% | (1.80 | )% | (1.60 | )% | (0.36 | )% | ||||||||||||
| Portfolio turnover rate (f) | 156 | % | 565 | % (d) | 1,037 | % | 201 | % | 626 | % | 435 | % | ||||||||||||
Amounts designated as “—” are either $0.00 or have been rounded to $0.00.
| (a) | Per share net income has been determined on the basis of average number of shares outstanding during the period. |
| (b) | The amount shown for a share outstanding throughout the period may not correlate with the Statement of Operations for the period due to the timing of sales and redemptions of Fund shares in relation to income earned and/or fluctuating market value of the investments of the Fund. |
| (c) | Total return is a measure of the change in value of an investment in the Fund over the period covered. The returns shown do not reflect the deduction of taxes a shareholder would pay on Fund distributions, if any or the redemption of Fund shares. The total returns would be lower if the Adviser had not reduced investment management fees and/or reimbursed expenses (Note 4). |
| (d) | Not annualized. |
| (e) | Annualized. |
| (f) | Portfolio turnover rate is calculated on the basis of the Fund as a whole without distinguishing between classes of shares issued. |
| (1) | Prior to November 18, 2022, Westwood Broadmark Tactical Growth Fund was known as Salient Tactical Growth Fund. |
| (2) | Fund changed fiscal year to October 31. |
The accompanying notes are an integral part of the financial statements.
84
| WESTWOOD FUNDS |
| FINANCIAL HIGHLIGHTS |
SELECTED PER SHARE DATA FOR A SHARE OUTSTANDING THROUGHOUT EACH YEAR OR PERIOD
Westwood Broadmark Tactical Plus Fund (1)
| Westwood Broadmark Tactical Plus Fund - Institutional Shares(2) | Year Ended October 31, 2024 | Ten Months Ended October 31, 2023(3) | Year Ended December 31, 2022 | Year Ended December 31, 2021 | Year Ended December 31, 2020 | Year Ended December 31, 2019 | ||||||||||||||||||
| Net asset value at beginning of period | $ | 11.82 | $ | 11.29 | $ | 12.37 | $ | 11.65 | $ | 11.55 | $ | 11.41 | ||||||||||||
| Net investment income (loss) (a) | 0.40 | 0.33 | 0.04 | (0.08 | ) | (0.09 | ) | 0.07 | ||||||||||||||||
| Net realized and unrealized gains (losses) on investments | (0.36 | ) | 0.20 | (0.28 | ) | 0.80 | 0.91 | 0.76 | ||||||||||||||||
| Total from investment operations | 0.04 | 0.53 | (0.24 | ) | 0.72 | 0.82 | 0.83 | |||||||||||||||||
| Less distributions from: | ||||||||||||||||||||||||
| Net investment income | (0.42 | ) | — | — | — | — | (0.12 | ) | ||||||||||||||||
| Net realized gains | (0.05 | ) | — | (0.84 | ) | — | (0.72 | ) | (0.57 | ) | ||||||||||||||
| Total distributions | (0.47 | ) | — | (0.84 | ) | — | (0.72 | ) | (0.69 | ) | ||||||||||||||
| Net asset value at end of period | $ | 11.39 | $ | 11.82 | $ | 11.29 | $ | 12.37 | $ | 11.65 | $ | 11.55 | ||||||||||||
| Total return (b) | 0.41 | % | 4.69 | % (c) | (1.95 | )% | 6.18 | % | 7.15 | % | 7.24 | % | ||||||||||||
| Net assets at end of period (in 000s) | $ | 35,172 | $ | 36,169 | $ | 34,427 | $ | 30,855 | $ | 30,308 | $ | 24,882 | ||||||||||||
| Ratio of net expenses to average net assets (d) | 1.35 | % | 1.36 | % (e) | 1.39 | % | 1.40 | % | 1.40 | % | 1.40 | % | ||||||||||||
| Ratio of gross expenses to average net assets | 1.76 | % | 1.74 | % (e) | 1.93 | % | 1.94 | % | 1.99 | % | 1.94 | % | ||||||||||||
| Ratio of net investment income (loss) to average net assets (d) | 3.49 | % | 3.45 | % (e) | 0.31 | % | (0.68 | )% | (0.77 | )% | 0.61 | % | ||||||||||||
| Portfolio turnover rate (f) | 1280 | % | 0 | % (c) | 827 | % | 62 | % | 5,029 | % | 9,813 | % | ||||||||||||
| Westwood Broadmark Tactical Plus Fund - A Class Shares | Year Ended October 31, 2024 | Ten Months Ended October 31, 2023(3) | Year Ended December 31, 2022 | Year Ended December 31, 2021 | Year Ended December 31, 2020 | Year Ended December 31, 2019 | ||||||||||||||||||
| Net asset value at beginning of period | $ | 11.58 | $ | 11.08 | $ | 12.18 | $ | 11.51 | $ | 11.44 | $ | 11.31 | ||||||||||||
| Net investment income (loss) (a) | 0.36 | 0.30 | — | (0.11 | ) | (0.12 | ) | 0.04 | ||||||||||||||||
| Net realized and unrealized gains (losses) on investments | (0.35 | ) | 0.20 | (0.26 | ) | 0.78 | 0.91 | 0.75 | ||||||||||||||||
| Total from investment operations | 0.01 | 0.50 | (0.26 | ) | 0.67 | 0.79 | 0.79 | |||||||||||||||||
| Less distributions from: | ||||||||||||||||||||||||
| Net investment income | (0.40 | ) | — | — | — | — | (0.09 | ) | ||||||||||||||||
| Net realized gains | (0.05 | ) | — | (0.84 | ) | — | (0.72 | ) | (0.57 | ) | ||||||||||||||
| Total distributions | (0.45 | ) | — | (0.84 | ) | — | (0.72 | ) | (0.66 | ) | ||||||||||||||
| Net asset value at end of period | $ | 11.14 | $ | 11.58 | $ | 11.08 | $ | 12.18 | $ | 11.51 | $ | 11.44 | ||||||||||||
| Total return (b) | 0.11 | % | 4.51 | % (c) | (2.18 | )% | 5.82 | % | 6.95 | % | 6.96 | % | ||||||||||||
| Net assets at end of period (in 000s) | $ | 504 | $ | 617 | $ | 584 | $ | 579 | $ | 668 | $ | 743 | ||||||||||||
| Ratio of net expenses to average net assets (d) | 1.60 | % | 1.57 | % (e) | 1.64 | % | 1.65 | % | 1.65 | % | 1.65 | % | ||||||||||||
| Ratio of gross expenses to average net assets | 2.01 | % | 1.95 | % (e) | 2.16 | % | 2.19 | % | 2.23 | % | 2.17 | % | ||||||||||||
| Ratio of net investment income (loss) to average net assets (d) | 3.26 | % | 3.23 | % (e) | 0.02 | % | (0.95 | )% | (1.04 | )% | 0.33 | % | ||||||||||||
| Portfolio turnover rate (f) | 1280 | % | 0 | % (c) | 827 | % | 62 | % | 5,029 | % | 9,813 | % | ||||||||||||
Amounts designated as “—” are either $0.00 or have been rounded to $0.00.
| (a) | Per share net income has been determined on the basis of average number of shares outstanding during the period. |
| (b) | Total return is a measure of the change in value of an investment in the Fund over the period covered. The returns shown do not reflect the deduction of taxes a shareholder would pay on Fund distributions, if any or the redemption of Fund shares. The total returns would be lower if the Adviser had not reduced investment management fees and/or reimbursed expenses (Note 4). |
| (c) | Not annualized. |
| (d) | Ratio was determined after investment management fee reductions and/or reimbursed expenses (Note 4). |
| (e) | Annualized. |
| (f) | Portfolio turnover rate is calculated on the basis of the Fund as a whole without distinguishing between classes of shares issued. |
| (1) | Prior to November 18, 2022, Westwood Broadmark Tactical Plus Fund was known as Salient Tactical Plus Fund. |
| (2) | Prior to November 18, 2022, Institutional Shares were I Share Class. |
| (3) | Fund changed fiscal year to October 31. |
The accompanying notes are an integral part of the financial statements.
85
| WESTWOOD FUNDS |
| FINANCIAL HIGHLIGHTS |
SELECTED PER SHARE DATA FOR A SHARE OUTSTANDING THROUGHOUT EACH YEAR OR PERIOD
Westwood Broadmark Tactical Plus Fund (1) (Continued)
| Westwood Broadmark Tactical Plus Fund - C Class Shares | Year Ended October 31, 2024 | Ten Months Ended October 31, 2023(2) | Year Ended December 31, 2022 | Year Ended December 31, 2021 | Year Ended December 31, 2020 | Year Ended December 31, 2019 | ||||||||||||||||||
| Net asset value at beginning of period | $ | 10.75 | $ | 10.36 | $ | 11.52 | $ | 10.97 | $ | 11.02 | $ | 10.92 | ||||||||||||
| Net investment income (loss) (a) | 0.26 | 0.21 | (0.09 | ) | (0.19 | ) | (0.20 | ) | (0.03 | ) (b) | ||||||||||||||
| Net realized and unrealized gains (losses) on investments | (0.33 | ) | 0.18 | (0.23 | ) | 0.74 | 0.87 | 0.70 | ||||||||||||||||
| Total from investment operations | (0.07 | ) | 0.39 | (0.32 | ) | 0.55 | 0.67 | 0.67 | ||||||||||||||||
| Less distributions from: | ||||||||||||||||||||||||
| Net investment income | (0.30 | ) | — | — | — | — | — | |||||||||||||||||
| Net realized gains | (0.05 | ) | — | (0.84 | ) | — | (0.72 | ) | (0.57 | ) | ||||||||||||||
| Total distributions | (0.35 | ) | — | (0.84 | ) | — | (0.72 | ) | (0.57 | ) | ||||||||||||||
| Net asset value at end of period | $ | 10.33 | $ | 10.75 | $ | 10.36 | $ | 11.52 | $ | 10.97 | $ | 11.02 | ||||||||||||
| Total return (c) | (0.66 | %) | 3.76 | % (d) | (2.82 | )% | 5.01 | % | 6.13 | % | 6.15 | % | ||||||||||||
| Net assets at end of period (in 000s) | $ | 335 | $ | 405 | $ | 414 | $ | 553 | $ | 575 | $ | 488 | ||||||||||||
| Ratio of net expenses to average net assets (e) | 2.35 | % | 2.34 | % (f) | 2.39 | % | 2.40 | % | 2.40 | % | 2.40 | % | ||||||||||||
| Ratio of gross expenses to average net assets | 2.76 | % | 2.72 | % (f) | 2.93 | % | 2.94 | % | 2.99 | % | 2.89 | % | ||||||||||||
| Ratio of net investment income (loss) to average net assets (e) | 2.51 | % | 2.46 | % (f) | (0.77 | )% | (1.68 | )% | (1.77 | )% | (0.30 | )% | ||||||||||||
| Portfolio turnover rate (g) | 1280 | % | 0 | % (d) | 827 | % | 62 | % | 5,029 | % | 9,813 | % | ||||||||||||
| Westwood Broadmark Tactical Plus Fund - F Class Shares | Year Ended October 31, 2024 | Ten Months Ended October 31, 2023(2) | Year Ended October 31, 2022 | Year Ended October 31, 2021 | Year Ended October 31, 2020 | Year Ended October 31, 2019 | ||||||||||||||||||
| Net asset value at beginning of period | $ | 12.12 | $ | 11.55 | $ | 12.65 | $ | 11.88 | $ | 11.73 | $ | 11.58 | ||||||||||||
| Net investment income (loss) (a) | 0.45 | 0.37 | 0.07 | (0.05 | ) | (0.05 | ) | 0.11 | ||||||||||||||||
| Net realized and unrealized gains (losses) on investments | (0.37 | ) | 0.20 | (0.27 | ) | 0.82 | 0.92 | 0.77 | ||||||||||||||||
| Total from investment operations | 0.08 | 0.57 | (0.20 | ) | 0.77 | 0.87 | 0.88 | |||||||||||||||||
| Less distributions from: | ||||||||||||||||||||||||
| Net investment income | (0.46 | ) | — | (0.06 | ) | — | — | (0.16 | ) | |||||||||||||||
| Net realized gains | (0.05 | ) | — | (0.84 | ) | — | (0.72 | ) | (0.57 | ) | ||||||||||||||
| Total distributions | (0.51 | ) | — | (0.90 | ) | — | (0.72 | ) | (0.73 | ) | ||||||||||||||
| Net asset value at end of period | $ | 11.69 | $ | 12.12 | $ | 11.55 | $ | 12.65 | $ | 11.88 | $ | 11.73 | ||||||||||||
| Total return (c) | 0.73 | % | 4.94 | % (d) | (1.65 | )% | 6.48 | % | 7.46 | % | 7.54 | % | ||||||||||||
| Net assets at end of period (in 000s) | $ | 35,637 | $ | 40,199 | $ | 37,040 | $ | 39,430 | $ | 38,158 | $ | 34,334 | ||||||||||||
| Ratio of net expenses to average net assets (e) | 1.04 | % | 1.05 | % (f) | 1.08 | % | 1.09 | % | 1.09 | % | 1.09 | % | ||||||||||||
| Ratio of gross expenses to average net assets | 1.76 | % | 1.74 | % (f) | 1.93 | % | 1.94 | % | 1.99 | % | 1.95 | % | ||||||||||||
| Ratio of net investment income (loss) to average net assets (e) | 3.81 | % | 3.76 | % (f) | 0.59 | % | (0.37 | )% | (0.46 | )% | 0.93 | % | ||||||||||||
| Portfolio turnover rate (g) | 1280 | % | 0 | % (d) | 827 | % | 62 | % | 5,029 | % | 9,813 | % | ||||||||||||
Amounts designated as “—” are either $0.00 or have been rounded to $0.00.
| (a) | Per share net income has been determined on the basis of average number of shares outstanding during the period. |
| (b) | The amount shown for a share outstanding throughout the period may not correlate with the Statement of Operations for the period due to the timing of sales and redemptions of Fund shares in relation to income earned, class specific expenses and/or fluctuating market value of the investments of the Fund. |
| (c) | Total return is a measure of the change in value of an investment in the Fund over the period covered. The returns shown do not reflect the deduction of taxes a shareholder would pay on Fund distributions, if any or the redemption of Fund shares. The total returns would be lower if the Adviser had not reduced investment management fees and/or reimbursed expenses (Note 4). |
| (d) | Not annualized. |
| (e) | Ratio was determined after investment management fee reductions and/or reimbursed expenses (Note 4). |
| (f) | Annualized. |
| (g) | Portfolio turnover rate is calculated on the basis of the Fund as a whole without distinguishing between classes of shares issued. |
| (1) | Prior to November 18, 2022, Westwood Broadmark Tactical Plus Fund was known as Salient Tactical Plus Fund. |
| (2) | Fund changed fiscal year to October 31. |
The accompanying notes are an integral part of the financial statements.
86
| WESTWOOD FUNDS |
| NOTES TO FINANCIAL STATEMENTS |
1. Organization
Westwood Quality Value Fund (“Value Fund”), Westwood Quality MidCap Fund (“MidCap Fund”), Westwood Quality SMidCap Fund (“SMidCap Fund”), Westwood Quality SmallCap Fund (“SmallCap Fund”), Westwood Quality AllCap Fund (“AllCap Fund”), Westwood Income Opportunity Fund (“Income Opportunity Fund”), Westwood Multi-Asset Income Fund (formerly, the High Income Fund) (“Multi-Asset Income Fund”), Westwood Alternative Income Fund (“Alternative Income Fund”), Westwood Salient MLP & Energy Infrastructure Fund (“MLP & Energy Infrastructure Fund”), Westwood Global Real Estate Fund (formerly, the Salient Global Real Estate Fund) (“Global Real Estate Fund”), Westwood Real Estate Income Fund, (formerly, the Salient Select Income Fund) (“Real Estate Income Fund”), Westwood Broadmark Tactical Growth Fund (“Tactical Growth Fund”) and Westwood Broadmark Tactical Plus Fund (“Tactical Plus Fund”), (individually, a “Fund” and collectively, the “Funds”) are each a series of Ultimus Managers Trust (the “Trust”), an open-end investment company established as an Ohio business trust under a Declaration of Trust dated February 28, 2012. The Trust is registered under the Investment Company Act of 1940, as amended, (the “1940 Act”). Other series of the Trust are not included in this report.
Effective March 31, 2024, the High Income, Salient Global Real Estate, and Salient Select Income Funds changed names to Multi-Asset Income, Global Real Estate, and Real Estate Income Funds, respectively.
The Value, SMidCap, SmallCap, Income Opportunity, Multi-Asset Income and Alternative Income Funds (“Predecessor Funds”) were formerly part of The Advisors’ Inner Circle Fund and were acquired by, and reorganized into, the Trust on November 1, 2021, pursuant to an Agreement and Plan of Reorganization dated August 9, 2021. The AllCap Fund commenced operations on September 30, 2021 and MidCap Fund commenced operations on November 30, 2021. Each Fund is classified as an open-end diversified fund.
Tactical Plus Fund (“Predecessor Salient MF Trust”), formerly part of Salient MF Trust, and another series of the Trust, were the sole remaining series of Salient MF Trust and were reorganized into the Trust on November 18, 2022 pursuant to an Agreement and Plan of Reorganization dated June 27, 2022.
The Global Real Estate Fund, Real Estate Income Fund, and Tactical Growth Fund (“Predecessor Forward Funds”), formerly part of Forward Funds, were the sole remaining series of Forward Funds and were acquired by and reorganized into the Trust on November 18, 2022 pursuant to an Agreement and Plan of Reorganization dated June 27, 2022.
Global Real Estate Fund, Real Estate Income Fund, Tactical Growth Fund and Tactical Plus Fund are open-end diversified funds.
The MLP & Energy Infrastructure Fund, formerly Salient Midstream & MLP Fund a series of Salient MF Trust (“Predecessor Salient MF Trust”), was reorganized into the Trust on November 18, 2022 pursuant to an Agreement and Plan of Reorganization dated June 27, 2022.
The MLP & Energy Infrastructure Fund is an open-end, non-diversified fund that seeks to maximize total return (capital appreciation and income).
The investment objective of the Value, MidCap, SMidCap, SmallCap and AllCap Funds is to seek long-term capital appreciation.
The investment objective of Income Opportunity Fund is to seek to provide current income with a secondary investment objective to provide the opportunity for long-term capital appreciation.
87
| WESTWOOD FUNDS |
The investment objective of Multi-Asset Income Fund is to seek to maximize total return through a high level of current income and capital appreciation.
The investment objective of Alternative Income Fund is to seek to provide absolute returns through a combination of current income and capital appreciation with low correlation to equity and fixed income markets.
The investment objective of Global Real Estate Fund is to seek to provide total return from both capital appreciation and current income.
The investment objective of Real Estate Income Fund is to seek to provide high current income and potential for modest long-term growth of capital.
The investment objective of Tactical Growth Fund is to seek to produce above-average, risk-adjusted returns, in any market environment, while exhibiting less downside volatility than the S&P 500 Index.
The Tactical Plus Fund seeks to produce in any market environment above-average risk-adjusted returns and less downside volatility than the S&P 500 Index.
As of October 31, 2024, all Funds offer Institutional Shares. All Funds except MidCap, SMidCap, and AllCap offer A Class Shares and C Class Shares. Value, SMidCap, SmallCap, AllCap, Income Opportunity, Alternative Income and MLP & Energy Infrastructure Funds have a fourth class, Ultra Shares. Tactical Plus Fund has a fourth class, F Class Shares.
Institutional Shares are sold without any sales loads, but subject to an administrative services plan fee of up to 0.20% of the average daily net assets attributable to Institutional Shares (for MidCap, SMidCap, SmallCap, AllCap, and Multi-Asset Income Funds), up to 0.15% for Alternative Income Fund, up to 0.10% (for Value, Income Opportunity, MLP & Energy Infrastructure and Tactical Plus Funds), and up to 0.05% (for Global Real Estate, Real Estate Income, and Tactical Growth Funds), requiring a $100,000 minimum investment (except for Alternative Income Fund, which has a $1,000,000 minimum investment) and offered exclusively to certain retirement plans established for the benefit of employees of the Westwood Management Corporation (the “Adviser” or “Westwood”) or its affiliates; defined benefit retirement plans, endowments or foundations; banks and trust companies or law firms acting as trustee or manager for trust accounts; investors who purchase through asset-based fee programs available through financial intermediaries; and insurance companies.
The Value, SmallCap, Income Opportunity, Multi-Asset Income, Alternative Income, MLP & Energy Infrastructure, Global Real Estate, Real Estate Income, Tactical Growth, and Tactical Plus Funds offer A Class Shares (sold with a maximum sales charge of 3.00% (except for SmallCap, MLP & Energy Infrastructure and Tactical Growth Funds, which have a maximum sales charge of 4.00%) and a 12b-1 services plan fee up to 0.25% of the average daily net assets attributable to A Class Shares), require a $1,000 minimum investment. A Class Shares are also subject to an administrative services plan fee of up to 0.10% in MLP & Energy Infrastructure and Tactical Plus Funds; and up to 0.20% of the average daily net assets attributable to A Class Shares in the Global Real Estate, Real Estate Income, and Tactical Growth Funds. A Class Shares purchases of $250,000 or more may be subject to a contingent deferred sales charge (“CDSC”) of 1.00% if redeemed within 18 months of purchase (except for SmallCap Fund, in which purchases of $1,000,000 or more may be subject to a 1.00% CDSC fee if redeemed within 18 months of purchase).
The Value, SmallCap, Income Opportunity, Multi-Asset Income, Alternative Income, MLP & Energy Infrastructure and Tactical Plus Funds offer C Class Shares, which are sold without any sales loads, but subject to a 12b-1 services plan fee (up to 1.00% of the average daily net assets attributable to C Class Shares, and up to 0.75% of the average daily net assets of the Global Real Estate, Real Estate Income, and Tactical Growth Funds), all require a $1,000 minimum investment. The Global Real Estate, Real Estate Income, and Tactical Growth Funds offer C Class Shares, sold without any sales loads, but subject to an administrative services plan fee of up to 0.25% of the average daily net assets attributable to C Class Shares; and up to 0.10% in MLP & Energy Infrastructure and Tactical Plus Funds. C Class Shares
88
| WESTWOOD FUNDS |
may be subject to a CDSC fee of 1.00% if redeemed within 12 months of purchase. C Class Shares automatically convert to A Class Shares after being held for 10 years.
The Value, SMidCap, SmallCap, AllCap, Income Opportunity, Alternative Income and MLP & Energy Infrastructure Funds offer Ultra Shares (sold without any sales loads and distribution and/or administrative services fees), require a $1,000,000 initial investment and offered exclusively to employer retirement plans; health savings accounts under Section 223 of the Internal Revenue Code of 1986, as amended, if such accounts are maintained by the Fund at an omnibus level; endowments and foundations and local, city and state agencies; unaffiliated registered investment companies; collective investment trusts; banks and trust companies or law firms acting as trustee or manager for trust accounts; and insurance companies).
F Class Shares are held only by those Fund shareholders who acquired such shares as a result of the Broadmark Reorganization. Only shareholders who acquired Class F shares pursuant to the Broadmark Reorganization may purchase additional F Class shares. There is no subsequent investment minimum for F Class Shares.
Each share class of a Fund represents an ownership interest in the same investment portfolio of the Fund.
The Adviser serves as investment adviser to Value, MidCap, SMidCap, SmallCap, AllCap, Income Opportunity, Multi-Asset Income, Alternative Income, MLP & Energy Infrastructure, Global Real Estate, Real Estate Income, and Tactical Growth Funds. Salient Advisors, L.P. (“Salient Advisors”), together with Westwood, serve as investment adviser to the Tactical Plus Fund. Salient Advisors is a wholly owned subsidiary of Westwood Holdings. Broadmark Asset Management LLC (“Sub-Adviser” or “Broadmark”) is the Sub-Adviser to Tactical Growth Fund and Tactical Plus Fund. Westwood Holdings is a majority owner of Broadmark. Broadmark is paid by the Adviser for their services, not the Funds.
2. Significant Accounting Policies
The following is a summary of the Funds’ significant accounting policies. The policies are in conformity with accounting principles generally accepted in the United States of America (“GAAP”). The Funds follow accounting and reporting guidance under Financial Accounting Standards Board (“FASB”) Accounting Standards Codification Topic 946, “Financial Services – Investment Companies.”
Regulatory Updates
Tailored Shareholder Reports for Mutual Funds and Exchange-Traded Funds (“ETFs”) – Effective January 24, 2023, the Securities and Exchange Commission (the “SEC”) adopted rule and form amendments to require mutual funds and ETFs to transmit concise and visually engaging streamlined annual and semiannual reports to shareholders that highlight key information. Other information, including financial statements, will no longer appear in a streamlined shareholder report but must be available online, delivered free of charge upon request, and filed on a semiannual basis on Form N- CSR. The rule and form amendments have a compliance date of July 24, 2024. The Funds have implemented the rule and form requirements, as applicable, and are currently adhering to the requirements.
Securities valuation – Each Fund values its portfolio securities at market value as of the close of regular trading on the New York Stock Exchange (the “NYSE”) (normally 4:00 p.m. Eastern time) on each business day the NYSE is open for business. The Funds value their listed securities on the basis of the security’s last sale price on the security’s primary exchange, if available, otherwise at the exchange’s most recently quoted mean price. NASDAQ-listed securities are valued at the NASDAQ Official Closing Price. Investments representing shares of other open-end investment companies, other than exchange-traded funds (“ETFs”), if any, but including money market funds, are valued at their net asset value (“NAV”) as reported by such companies. Option contracts are valued at the closing price on the exchange on which they are primarily traded; if no closing price is available at the time of valuation, the option will be valued at the mean of the closing bid and ask prices for that day. Future contracts are valued at the final settlement price, or, if a settled price is not available, at the last sale price as of the close of regular trading
89
| WESTWOOD FUNDS |
on the primary exchange on which they are traded. When using a quoted price and when the market is considered active, these securities will be classified as Level 1 within the fair value hierarchy (see below). Fixed income securities are generally valued using prices provided by an independent pricing service approved by the Board of Trustees of the Trust (the “Board”). The independent pricing service uses information with respect to transactions in bonds, quotations from bond dealers, market transactions in comparable securities, and various relationships between securities in determining these prices. Total return swaps are valued as the change in the value of the underlying security plus/minus the accrued income payment based on Secured Overnight Financing Rate (“SOFR”) or some other form of indices on the notional amount. In the event that market quotations are not readily available or are considered unreliable due to market or other events, the Funds value their securities and other assets at fair value as determined by the Adviser and Salient Advisors, as the Funds’ valuation designees, in accordance with procedures adopted by the Board pursuant to Rule 2a-5 under the 1940 Act. Under these procedures, the securities will be classified as Level 2 or 3 within the fair value hierarchy, depending on the inputs used. Unavailable or unreliable market quotes may be due to the following factors: a substantial bid-ask spread; infrequent sales resulting in stale prices; insufficient trading volume; small trade sizes; a temporary lapse in any reliable pricing source; and actions of the securities or futures markets, such as the suspension or limitation of trading. As a result, the prices of securities used to calculate each Fund’s NAV may differ from quoted or published prices for the same securities. Securities traded on foreign exchanges, if any, are fair valued by an independent pricing service and translated from the local currency into U.S. dollars using currency exchange rates supplied by an independent pricing service.
GAAP establishes a single authoritative definition of fair value, sets out a framework for measuring fair value, and requires additional disclosures about fair value measurements.
Various inputs are used in determining the value of each Fund’s investments. These inputs are summarized in the three broad levels listed below:
| ● | Level 1 – quoted prices in active markets for identical securities |
| ● | Level 2 – other significant observable inputs |
| ● | Level 3 – significant unobservable inputs |
Fixed income securities held by the Funds are classified as Level 2 since values are based on prices provided by an independent pricing service that utilizes various “other significant observable inputs” including bid and ask quotations, prices of similar securities, and interest rates, among other factors.
For most securities, both the latest transaction prices and adjustments are furnished by independent pricing services. The Adviser and Salient Advisor as the Funds’ valuation designee is responsible for carrying out pricing and valuation duties in accordance with the Adviser’s Valuation Procedures (the “Procedures”). The Funds value all other securities and assets for which market quotations are unavailable or unreliable at their fair value determined in good faith.
The inputs or methods used for valuing securities are not necessarily an indication of the risks associated with investing in those securities. The inputs used to measure fair value may fall into different levels of the fair value hierarchy. In such cases, for disclosure purposes, the level in the fair value hierarchy within which the fair value measurement falls in its entirety is determined based on the lowest level input that is significant to the fair value measurement.
90
| WESTWOOD FUNDS |
The following is a summary of each Fund’s investments and the inputs used to value the investments as of October 31, 2024:
| Value Fund | Level 1 | Level 2 | Level 3 | Total | ||||||||||||
| Common Stocks | $ | 211,140,906 | $ | — | $ | — | $ | 211,140,906 | ||||||||
| Money Market Funds | 2,068,391 | — | — | 2,068,391 | ||||||||||||
| Total Investment Securities | $ | 213,209,297 | $ | — | $ | — | $ | 213,209,297 | ||||||||
| MidCap Fund | ||||||||||||||||
| Common Stocks | $ | 1,968,803 | $ | — | $ | — | $ | 1,968,803 | ||||||||
| Money Market Funds | 23,443 | — | — | 23,443 | ||||||||||||
| Total Investment Securities | $ | 1,992,246 | $ | — | $ | — | $ | 1,992,246 | ||||||||
| SMidCap Fund | ||||||||||||||||
| Common Stocks | $ | 103,753,320 | $ | — | $ | — | $ | 103,753,320 | ||||||||
| Money Market Funds | 935,463 | — | — | 935,463 | ||||||||||||
| Total Investment Securities | $ | 104,688,783 | $ | — | $ | — | $ | 104,688,783 | ||||||||
| SmallCap Fund | ||||||||||||||||
| Common Stocks | $ | 1,095,586,976 | $ | — | $ | — | $ | 1,095,586,976 | ||||||||
| Money Market Funds | 6,730,400 | — | — | 6,730,400 | ||||||||||||
| Total Investment Securities | $ | 1,102,317,376 | $ | — | $ | — | $ | 1,102,317,376 | ||||||||
| AllCap Fund | ||||||||||||||||
| Common Stocks | $ | 22,241,016 | $ | — | $ | — | $ | 22,241,016 | ||||||||
| Money Market Funds | 285,547 | — | — | 285,547 | ||||||||||||
| Total Investment Securities | $ | 22,526,563 | $ | — | $ | — | $ | 22,526,563 | ||||||||
91
| WESTWOOD FUNDS |
| Income Opportunity Fund | Level 1 | Level 2 | Level 3 | Total | ||||||||||||
| Investments in Securities | ||||||||||||||||
| U.S. Government & Agencies | $ | — | $ | 56,605,340 | $ | — | $ | 56,605,340 | ||||||||
| Collaterized Mortgage Obligations | — | 13,578,095 | — | 13,578,095 | ||||||||||||
| Convertible Bonds | — | 30,376,120 | — | 30,376,120 | ||||||||||||
| Corporate Bonds | — | 152,746,860 | — | 152,746,860 | ||||||||||||
| Common Stocks | 228,714,115 | — | — | 228,714,115 | ||||||||||||
| Exchange-Traded Funds | 20,332,441 | — | — | 20,332,441 | ||||||||||||
| Preferred Stocks | 14,472,274 | — | — | 14,472,274 | ||||||||||||
| Money Market Funds | 1,593,085 | — | — | 1,593,085 | ||||||||||||
| Total Investment Securities | $ | 265,111,915 | $ | 253,306,415 | $ | — | $ | 518,418,330 | ||||||||
| Other Financial Instruments** | ||||||||||||||||
| Written Option Contracts | $ | (368,480 | ) | $ | — | $ | — | $ | (368,480 | ) | ||||||
| Total | $ | 264,743,435 | $ | 253,306,415 | $ | — | $ | 518,049,850 | ||||||||
| Multi-Asset Income Fund | ||||||||||||||||
| U.S. Government & Agencies | $ | — | $ | 5,628,125 | $ | — | $ | 5,628,125 | ||||||||
| Collaterized Mortgage Obligations | — | 1,912,240 | — | 1,912,240 | ||||||||||||
| Corporate Bonds | — | 59,577,943 | — | 59,577,943 | ||||||||||||
| Foreign Governments | — | 667,325 | — | 667,325 | ||||||||||||
| Common Stocks | 23,197,858 | — | — | 23,197,858 | ||||||||||||
| Exchange-Traded Funds | 2,371,105 | — | — | 2,371,105 | ||||||||||||
| Preferred Stocks | 1,748,064 | — | 500,000 | 2,248,064 | ||||||||||||
| Warrants | — | — | 103,109 | 103,109 | ||||||||||||
| Money Market Funds | 1,168,062 | — | — | 1,168,062 | ||||||||||||
| Total Investment Securities | $ | 28,485,089 | $ | 67,785,633 | $ | 603,109 | $ | 96,873,831 | ||||||||
| Other Financial Instruments** | ||||||||||||||||
| Written Option Contracts | $ | (52,830 | ) | $ | — | $ | — | $ | (52,830 | ) | ||||||
| Total | $ | 28,432,259 | $ | 67,785,633 | $ | 603,109 | $ | 96,821,001 | ||||||||
92
| WESTWOOD FUNDS |
| Practical | ||||||||||||||||||||
| Alternative Income Fund | Expedient(a) | Level 1 | Level 2 | Level 3 | Total | |||||||||||||||
| Convertible Bonds | $ | — | $ | — | $ | 100,697,395 | $ | — | $ | 100,697,395 | ||||||||||
| Corporate Bonds | — | — | 17,390,270 | — | 17,390,270 | |||||||||||||||
| Common Stocks | — | 1,304,814 | — | — | 1,304,814 | |||||||||||||||
| Money Market Funds | — | 4,444,075 | — | — | 4,444,075 | |||||||||||||||
| Total Investment Securities | $ | — | $ | 5,748,889 | $ | 118,087,665 | $ | — | $ | 123,836,554 | ||||||||||
| Other Financial Instruments** | ||||||||||||||||||||
| Total Return Swaps at value (assets) | $ | — | $ | — | $ | 1,127,454 | $ | — | $ | 1,127,454 | ||||||||||
| Total Return Swaps at value (liabilities) | — | — | (332,325 | ) | — | (332,325 | ) | |||||||||||||
| Written Option Contracts | — | (83,210 | ) | — | — | (83,210 | ) | |||||||||||||
| Total Investments | $ | — | $ | 5,665,679 | $ | 118,882,794 | $ | — | $ | 124,548,473 | ||||||||||
| MLP & Energy | ||||||||||||||||||||
| Infrastructure Fund | ||||||||||||||||||||
| Affiliated Exchange-Traded Funds | $ | — | $ | 52,739,815 | $ | — | $ | — | $ | 52,739,815 | ||||||||||
| Master Limited Partnerships | — | 277,376,889 | — | — | 277,376,889 | |||||||||||||||
| MLP Related Companies | 18,054,400 | 794,978,254 | — | — | 813,032,654 | |||||||||||||||
| Special Purpose Acquisition Companies | — | — | — | 315 | 315 | |||||||||||||||
| Money Market Funds | — | 2,380,282 | — | — | 2,380,282 | |||||||||||||||
| Total Investment Securities | $ | 18,054,400 | $ | 1,127,475,240 | $ | — | $ | 315 | $ | 1,145,529,955 | ||||||||||
| Other Financial Instruments** | ||||||||||||||||||||
| Written Option Contracts | $ | — | $ | (552,762 | ) | $ | (53,955 | ) | $ | — | $ | (606,717 | ) | |||||||
| Total | $ | 18,054,400 | $ | 1,126,922,478 | $ | (53,955 | ) | $ | 315 | $ | 1,144,923,238 | |||||||||
| Global Real Estate Fund | ||||||||||||||||||||
| Common Stocks | $ | — | $ | 11,569,121 | $ | 4,262,196 | * | $ | — | $ | 15,831,317 | |||||||||
| Money Market Funds | — | 371,549 | — | — | 371,549 | |||||||||||||||
| Total Investment Securities | $ | — | $ | 11,940,670 | $ | 4,262,196 | $ | — | $ | 16,202,866 | ||||||||||
93
| WESTWOOD FUNDS |
| Real Estate Income Fund | Level 1 | Level 2 | Level 3 | Total | ||||||||||||
| Common Stocks | $ | 77,202,975 | $ | — | $ | — | $ | 77,202,975 | ||||||||
| Preferred Stocks | 187,815,864 | — | 9,250,000 | 197,065,864 | ||||||||||||
| Money Market Funds | 3,688,961 | — | — | 3,688,961 | ||||||||||||
| Total Investment Securities | $ | 268,707,800 | $ | — | $ | 9,250,000 | $ | 277,957,800 | ||||||||
| Tactical Growth Fund | ||||||||||||||||
| Exchange-Traded Funds | $ | 109,897,516 | $ | — | $ | — | $ | 109,897,516 | ||||||||
| Money Market Funds | 54,042,070 | — | — | 54,042,070 | ||||||||||||
| Total Investment Securities | $ | 163,939,586 | $ | — | $ | — | $ | 163,939,586 | ||||||||
| Tactical Plus Fund | ||||||||||||||||
| Money Market Funds | $ | 69,913,385 | $ | — | $ | — | $ | 69,913,385 | ||||||||
| Total Investment Securities | $ | 69,913,385 | $ | — | $ | — | $ | 69,913,385 | ||||||||
| Other Financial Instruments** | ||||||||||||||||
| Futures Contracts | $ | (788,145 | ) | $ | — | $ | — | $ | (788,145 | ) | ||||||
| Total | $ | 69,125,240 | $ | — | $ | — | $ | 69,125,240 | ||||||||
Amounts designated as “—” are $0 or have been rounded to $0.
| (a) | In accordance with Subtopic 820-10, certain investments that are measured at fair value using the net asset value per share (or its equivalent) practical expedient have not been classified in the fair value hierarchy. The fair value amounts presented in this table are intended to permit reconciliation of the fair value hierarchy to the amounts presented in the Schedule of Investments. |
| * | With respect to foreign equity securities that are principally traded on a market outside the United States, the Fund utilizes an independent fair value pricing service to evaluate the effect of market fluctuations on these securities after the close of trading in that foreign market. To the extent that securities are valued using this service, they will be classified as Level 2 securities. |
| ** | Other financial instruments are derivative instruments not reflected in the total investments at value on the Schedule of Investments but as separate schedule such as total return swap contracts, written option contracts, and futures contracts. These instruments are valued at the unrealized appreciation (depreciation) on the instrument. |
The following is a reconciliation of Level 3 instruments held in the Fund for which significant unobservable inputs were used to determine fair value for the period ended October 31, 2024.
Multi-Asset Income Fund
| Balance | Changes in | Balance | ||||||||||||||||||||||||||||||
| as of | Net | Unrealized | Transfer | Transfer | as of | |||||||||||||||||||||||||||
| October 31, | Purchases/ | Realized | Appreciation | Into | Out of | October 31, | ||||||||||||||||||||||||||
| Asset Type | 2023 | Acquisitions | Net Sales | Losses | (Depreciation) | Level 3* | Level 3 | 2024 | ||||||||||||||||||||||||
| Preferred Stocks | $ | — | $ | — | $ | — | $ | — | $ | — | $ | 500,000 | $ | — | $ | 500,000 | ||||||||||||||||
| Warrants | — | 103,109 | — | — | — | — | — | 103,109 | ||||||||||||||||||||||||
94
| WESTWOOD FUNDS |
MLP & Energy Infrastructure Fund
| Balance | Changes in | Balance | ||||||||||||||||||||||||||||||
| as of | Net | Unrealized | Transfer | Transfer | as of | |||||||||||||||||||||||||||
| December 31, | Purchases/ | Realized | Appreciation | Into | Out of | October 31, | ||||||||||||||||||||||||||
| Asset Type | 2023 | Acquisitions | Net Sales | Losses | (Depreciation) | Level 3 | Level 3** | 2024 | ||||||||||||||||||||||||
| MLP Related Companies | $ | 15,345,343 | $ | — | $ | — | $ | — | $ | — | $ | — | $ | 15,345,343 | $ | — | ||||||||||||||||
| Special Purpose Acquisition Companies | 315 | — | — | — | — | — | — | 315 | ||||||||||||||||||||||||
Real Estate Income Fund
| Balance | Balance | |||||||||||||||||||||||||||||||
| as of | Net | Unrealized | Transfer | Transfer | as of | |||||||||||||||||||||||||||
| October 31, | Purchases/ | Realized | Appreciation | Into | Out of | October 31, | ||||||||||||||||||||||||||
| Asset Type | 2023 | Acquisitions | Net Sales | Losses | (Depreciation) | Level 3* | Level 3 | 2024 | ||||||||||||||||||||||||
| Preferred Stocks | $ | — | $ | 4,750,000 | $ | — | $ | — | $ | — | $ | 4,500,000 | $ | — | $ | 9,250,000 | ||||||||||||||||
| * | The transfer into level 3 is due to the stale price. |
| ** | Transfers out of Level 3 during the period represent investments that are being measured at fair value using the Fund’s pro rata NAV (or its equivalent) as a practical expedient and/or being valued using observable market data which was not available in the prior year. |
Multi-Asset Income Fund
| Impact to | ||||||||||||||
| Fair Value as of | Valuation from | |||||||||||||
| October 31, | Valuation | Unobservable | Input Value/ | an Increase in | ||||||||||
| 2024 | Technique | Input | Range | Input | ||||||||||
| Preferred Stocks | $ | 500,000 | Broker Quote | Broker Quote | $ | 25.00 | Increase | |||||||
| Warrants | 103,109 | Broker Quote | Broker Quote | $ | 23.00 | Increase | ||||||||
MLP & Energy Infrastructure Fund
| Impact to | ||||||||||||||
| Fair Value as of | Valuation from | |||||||||||||
| October 31, | Valuation | Unobservable | Input Value/ | an Increase in | ||||||||||
| 2024 | Technique | Input | Range | Input | ||||||||||
| Special Purpose Acquisition Companies | $ | 315 | Broker Quote | Broker Quote | $ | 0.003 | Increase | |||||||
95
| WESTWOOD FUNDS |
Real Estate Income Fund
| Impact to | ||||||||||
| Fair Value as of | Valuation from | |||||||||
| October 31, | Valuation | Unobservable | Input Value/ | an Increase in | ||||||
| 2024 | Technique | Input | Range | Input | ||||||
| Preferred Stocks | $ 9,250,000 | Broker Quote | Broker Quote | $25.00 / $950.00 | Increase |
The restricted securities held by the MLP & Energy Infrastructure Fund at October 31, 2024 are identified below and are also present in the MLP & Energy Infrastructure Fund’s Schedule of Investments.
| Acquistion | ||||||||||||||
| % of Net Assets | Date | Shares/Units | Cost | Fair Value | ||||||||||
| EMG Utica I Offshore Co-Investment, L.P. | 1.57% | 2/22/2013* | 16,000,000 | $ | 16,000,000 | $ | 18,054,400 | |||||||
| TortoiseEconfin Acquisition Corp III - Founder Shares | 0.00% | 7/21/2021* | 104,850 | 315 | 315 | |||||||||
| $ | 16,000,315 | $ | 18,054,715 | |||||||||||
| * | Original purchase date by acquired fund prior to merger. |
Share valuation – The NAV per share of each class of each Fund is calculated daily by dividing the total value of the assets attributable to that class, less liabilities attributable to that class, by the number of shares outstanding of that class. The offering price and redemption price per share of each class of each Fund is equal to the NAV per share of such class except for A Class Shares. A Class Shares have a front-end sales charge, which is deducted from your purchase price when you buy your shares.
Investment income – Dividend income is recorded on the ex-dividend date. Non-cash dividends included in dividend income, if any, are recorded at the fair value of the security received. Interest income is accrued as earned. Withholding taxes on foreign dividends, if any, have been recorded in accordance with the Funds’ understanding of the applicable country’s tax rules and rates. The Funds may invest in real estate investment trusts (“REITs”) that pay distributions to their shareholders based on available funds from operations. It is common for these distributions to exceed the REIT’s taxable earnings and profits resulting in the excess portion of such distribution to be designated as return of capital. Distributions received from REITs are generally recorded as dividend income and, if necessary, are reclassified annually in accordance with tax information provided by the underlying REITs. Distributions received for each Fund’s investments in Master Limited Partnerships (“MLPs”) may be comprised of both income and return of capital. Each Fund records investment income and return of capital based on estimates made at the time such distributions are received. Such estimates are based on historical information available from each MLP and other industry sources. These estimates may subsequently be revised based on information received from MLPs after their tax reporting periods are concluded. Discounts and premiums on fixed income securities, if any, are amortized using the effective interest method.
Investment transactions – Investment transactions are accounted for on the trade date. Realized gains and losses on investments sold are determined on a specific identification basis.
Allocation among Classes – Investment income earned, realized capital gains and losses, and unrealized appreciation and depreciation are allocated daily to each Class of a Fund based upon its proportionate share of total net assets of that Fund. Class-specific expenses are charged directly to the Class incurring the expense. Common
96
| WESTWOOD FUNDS |
expenses which are not attributable to a specific Class are allocated daily to each Class of shares of a Fund based upon its proportionate share of total net assets of that Fund. Distribution fees are class specific expenses.
Common expenses – Common expenses of the Trust are allocated among the Funds and the other series of the Trust based on the relative net assets of each series, the number of series in the Trust, or the nature of the services performed and the relative applicability to each series.
Futures contracts – A Fund may use futures contracts for tactical hedging purposes as well as to enhance a Fund’s returns. A futures contract represents a commitment for the future purchase or sale of an asset at a specified price on a specified date. When a Fund purchases or sells a futures contract, no price is paid to or received by a Fund. Instead, a Fund is required to deposit in a segregated asset account an amount of cash or qualifying securities. This is called the “initial margin deposit.” Subsequent payments, known as “variation margin,” are made or received by a Fund each day, depending on the daily fluctuations in the fair value of the underlying asset. A Fund recognizes an unrealized gain or loss equal to the daily valuation margin. If market conditions move unexpectedly, a Fund may not achieve the anticipated benefits of the futures contracts and may realize a loss. The margin deposits for futures contracts and the variation receivable/payable are reported on the Statements of Assets and Liabilities.
Options written/purchased – The Funds may utilize longer maturity options for stock replacement when and as price and volatility relationships become more favorable for options versus underlying stocks or for tax and liquidity management purposes. The Funds are authorized to write (sell) and purchase put and call options. The risk in writing a call option is that the Funds give up the opportunity to profit if the market price of the security increases. The risk in writing a put option is that the Funds may incur a loss if the market price of the security decreases and the option is exercised. The risk in purchasing an option is that the Funds pay a premium whether or not the option is exercised. The Funds also have the additional risk of being unable to enter into a closing transaction at an acceptable price if a liquid secondary market does not exist. Option contracts also involve the risk that they may not work as intended due to unanticipated developments in market conditions or other causes.
Swap contracts – The Funds are authorized to enter into swap contracts for the purposes of managing the Funds’ interest rate duration, yield curve exposure and yield spread sensitivity. Swaps are a two-party contract in which the seller (buyer) will pay to the buyer (seller) the difference between the current value of a security and its value at the time the contract was entered. Interest rate swaps involve the exchange by a Fund with another party of their respective commitment to pay or receive interest (e.g., an exchange of floating rate payments for fixed rate payments) with respect to a notional amount of principal. Swap contracts are privately negotiated in the over-the-counter market (“OTC Swaps”) or may be executed in a multilateral or other trade facility platform, such as a registered commodities exchange (“Centrally Cleared Swaps”).
Total return swaps allow an investor to benefit from the cash flow without ever actually owning the underlying security. The receiver must pay any decline in value to the payer at the end of the total return swaps. However, the investor does not need to make a payment if there is no decline in price. Payments can be made on various indices, bonds (i.e. mortgage backed securities, bank debt and corporate), loans or commodities. The value of a total return swap is equal to the change in value of the underlying asset versus the accrued income payment based on SOFR or some other form of indices on the notional amount. Payments received or made are recorded as realized gains or loss. A Fund could be exposed to credit or market risk due to unfavorable changes in the fluctuation of interest rates or if the counterparty defaults on its obligation to perform. Risk of loss may exceed amounts recognized on the Statements of Assets and Liabilities. Interest rate and Total Return swap contracts outstanding at period end, if any, are listed after a Fund’s portfolio. In connection with swap agreements, securities may be set aside as collateral by a Fund’s custodian.
Periodic payments made or received are recorded as realized gains or losses. The Statements of Assets and Liabilities reflect, if any, unrealized appreciation or depreciation and accrued periodic payments for swap contracts the Funds may have open.
97
| WESTWOOD FUNDS |
Entering into swap contracts involve, to varying degrees, elements of credit, interest rate and market risk in excess of the amounts recognized on the Statements of Assets and Liabilities. Such risks involve the possibility that there will be no liquid market for these contracts, that the counterparty to the contract may default on its obligation to perform and that there may be unfavorable changes in market conditions or fluctuations in interest rates. Swaps outstanding at year end, if any, are listed on the Schedules of Investments. Refer to each Fund’s Schedule of Investments for details regarding open swap contracts, if applicable.
There is the risk that the counterparty refuses to continue to enter into swap agreements with the Funds in the future, or requires increased fees, which could impair the Funds’ ability to achieve their investment objective. A counterparty may also increase its collateral requirements, which may limit the Fund’s ability to use leverage and reduce investment returns. In addition, if the Funds cannot locate a counterparty willing to enter into transactions with the Funds, they will not be able to implement their investment strategy.
Foreign currency translation – Securities and other assets and liabilities denominated in or expected to settle in foreign currencies are translated into U.S. dollars based on exchange rates on the following basis:
| A. | The fair values of investment securities and other assets and liabilities are translated as of the close of the NYSE each day. |
| B. | Purchases and sales of investment securities and income and expenses are translated at the rate of exchange prevailing as of 4:00 p.m. Eastern Time on the respective date of such transactions. |
| C. | The Funds do not isolate that portion of the results of operations caused by changes in foreign exchange rates on investments from those caused by changes in market prices of securities held. Such fluctuations are included with the net realized and unrealized gains or losses on investments. |
Reported net realized foreign exchange gains or losses arise from 1) purchases and sales of foreign currencies, 2) currency gains or losses realized between the trade and settlement dates on securities transactions and 3) the difference between the amounts of dividends and foreign withholding taxes recorded on a Fund’s books and the U.S. dollar equivalent of the amounts actually received or paid. Reported net unrealized foreign exchange gains and losses arise from changes in the value of assets and liabilities other than investments in securities that result from changes in exchange rates.
The Funds may be subject to foreign taxes related to foreign income received, capital gain on the sale of securities and certain foreign currency transactions (a portion of which may be reclaimable). All foreign taxes are recorded in accordance with the applicable regulations and rates that exist in the foreign jurisdictions in which a Fund invests.
Forward foreign currency contracts – The Funds may enter into forward foreign currency contracts to offset the exposure to foreign currency. All foreign currency contracts are “marked- to-market” daily at the applicable translation rates, resulting in unrealized gains or losses. Realized and unrealized gains or losses from transactions in foreign contracts, if any, will be included on the Funds’ Statements of Operations. Risks associated with these contracts include the potential inability of counterparties to meet the terms of their contracts and unanticipated movements in the value of a foreign currency relative to the U.S. dollar.
Borrowing costs – From time to time, the Funds may have an overdrawn cash balance at the custodian due to redemptions or market movements. When this occurs, the Funds will incur borrowing costs charged by the custodian. Borrowing costs for each Fund, if any, for the year ended October 31, 2024 can be found on the Statements of Operations.
ReFlow transactions – Certain Funds may participate in ReFlow, a program designed to provide an alternative liquidity source for mutual funds experiencing redemptions of their shares. In order to pay cash to shareholders who redeem their shares on a given day, a mutual fund typically must hold cash in its portfolio, liquidate portfolio
98
| WESTWOOD FUNDS |
securities, or borrow money, all of which impose certain costs on the fund. ReFlow provides participating mutual funds with another source of cash by standing ready to purchase shares from a fund equal to the amount of the fund’s net redemptions on a given day. ReFlow then generally redeems those shares when the fund experiences net sales. In return for this service, the fund will pay a fee to ReFlow at a rate determined by a daily auction with other participating mutual funds. The costs to a Fund for participating in ReFlow are generally expected to be influenced by and comparable to the cost of other sources of liquidity, such as the Fund’s short-term lending arrangements or the costs of selling portfolio securities to meet redemptions. ReFlow is prohibited from acquiring more than 2.95% of the total net assets of any Fund. The Board has adopted certain procedures to govern the Funds’ participation in ReFlow. During the year ended October 31, 2024, no ReFlow fees were incurred.
Estimates – The preparation of financial statements in conformity with GAAP requires management to make estimates and assumptions that affect the reported amounts of assets and liabilities and disclosure of contingent assets and liabilities as of the date of the financial statements and the reported amounts of increase (decrease) in net assets from operations during the reporting period. Actual results could differ from those estimates.
Redemption fees – In an effort to discourage short-term trading and defray costs incurred by shareholders as a result of short-term trading, the Alternative Income Fund charges a 1.00% redemption fee on redemptions (including exchanges) of shares that have been held for less than 30 days. The redemption fee is deducted from the Fund’s sale proceeds and cannot be paid separately, and any proceeds of the fee are credited to the assets of the Fund from which the redemption was made. The fee does not apply to shares purchased with reinvested dividends or distributions. Redemption fees collected, if any, are shown on the Statements of Changes in Net Assets.
Distributions to shareholders – Value, MidCap, SMidCap, SmallCap, and AllCap Funds distribute to shareholders any net investment income dividends and net realized capital gains distributions, if any, at least once each year. Income Opportunity and Alternative Income Funds distribute to shareholders any net investment income dividends quarterly and net realized capital gains distributions, if any, at least once each year. Multi-Asset Income Fund distributes to shareholders any net investment income dividends monthly and net realized capital gains distributions, if any, at least once each year. Global Real Estate and Real Estate Income Funds distribute substantially all of their net income to shareholders on a quarterly basis and their net capital gains to shareholders at least annually in December. Tactical Growth and Tactical Plus Funds distribute to shareholders any net investment income and net realized capital gains annually in December. The amount of such dividends and distributions are determined in accordance with federal income tax regulations, which may differ from GAAP. Dividends and distributions to shareholders are recorded on the ex-dividend date.
The character of dividends paid to shareholders of the Funds for federal income tax purposes during the year ended October 31, 2024, ten months ended October 31, 2024, and years ended October 31, 2023, December 31, 2023 and December 31, 2022, if applicable, was as follows:
| Ordinary | Long-Term | Return of | Total | |||||||||||||
| Period Ended | Income | Capital Gains | Capital | Distributions | ||||||||||||
| Value Fund | ||||||||||||||||
| October 31, 2024 | $ | 5,072,853 | $ | 2,494,872 | $ | — | $ | 7,567,725 | ||||||||
| October 31, 2023 | $ | 3,785,863 | $ | — | $ | — | $ | 3,785,863 | ||||||||
| MidCap Fund | ||||||||||||||||
| October 31, 2024 | $ | 34,640 | $ | 6,193 | $ | — | $ | 40,833 | ||||||||
| October 31, 2023 | $ | 7,423 | $ | — | $ | — | $ | 7,423 | ||||||||
| SMidCap Fund | ||||||||||||||||
| October 31, 2024 | $ | 6,852,780 | $ | 2,603,038 | $ | — | $ | 9,455,818 | ||||||||
| October 31, 2023 | $ | 2,178,453 | $ | 2,304,618 | $ | — | $ | 4,483,071 | ||||||||
99
| WESTWOOD FUNDS |
| Ordinary | Long-Term | Return of | Total | |||||||||||||
| Period Ended | Income | Capital Gains | Capital | Distributions | ||||||||||||
| SmallCap Fund | ||||||||||||||||
| October 31, 2024 | $ | 21,471,116 | $ | 26,245,748 | $ | — | $ | 47,716,864 | ||||||||
| October 31, 2023 | $ | 17,615,342 | $ | 19,713,675 | $ | — | $ | 37,329,017 | ||||||||
| AllCap Fund | ||||||||||||||||
| October 31, 2024 | $ | 512,184 | $ | 250,648 | $ | — | $ | 762,832 | ||||||||
| October 31, 2023 | $ | 366,179 | $ | — | $ | — | $ | 366,179 | ||||||||
| Income Opportunity Fund | ||||||||||||||||
| October 31, 2024 | $ | 19,166,079 | $ | — | $ | 3,678,192 | $ | 22,844,271 | ||||||||
| October 31, 2023 | $ | 20,688,795 | $ | — | $ | — | $ | 20,688,795 | ||||||||
| Multi-Asset Income Fund | ||||||||||||||||
| October 31, 2024 | $ | 5,644,409 | $ | — | $ | — | $ | 5,644,409 | ||||||||
| October 31, 2023 | $ | 5,573,606 | $ | — | $ | — | $ | 5,573,606 | ||||||||
| Alternative Income Fund | ||||||||||||||||
| October 31, 2024 | $ | 872,446 | $ | — | $ | 3,079,172 | $ | 3,951,618 | ||||||||
| October 31, 2023 | $ | 21,936,416 | $ | — | $ | 1,196,776 | $ | 23,133,192 | ||||||||
| MLP & Energy Infrastructure Fund | ||||||||||||||||
| Ten months ended October 31, 2024* | $ | 39,037,838 | $ | — | $ | — | $ | 39,037,838 | ||||||||
| December 31, 2023 | $ | 33,587,018 | $ | — | $ | 20,006,122 | $ | 53,593,140 | ||||||||
| December 31, 2022 | $ | — | $ | — | $ | 39,068,282 | $ | 39,068,282 | ||||||||
| Global Real Estate Fund | ||||||||||||||||
| October 31, 2024 | $ | 343,520 | $ | — | $ | 47,780 | $ | 391,300 | ||||||||
| Ten months ended October 31, 2023** | $ | 243,047 | $ | — | $ | 92,630 | $ | 335,677 | ||||||||
| December 31, 2022 | $ | 432,515 | $ | — | $ | 62,845 | $ | 495,360 | ||||||||
| Real Estate Income Fund | ||||||||||||||||
| October 31, 2024 | $ | 9,616,028 | $ | 8,971,397 | $ | — | $ | 18,587,425 | ||||||||
| Ten months ended October 31, 2023** | $ | 9,748,315 | $ | 1,917,196 | $ | 457,282 | $ | 12,122,793 | ||||||||
| December 31, 2022 | $ | 8,842,015 | $ | — | $ | 5,645,768 | $ | 14,487,783 | ||||||||
| Tactical Growth Fund | ||||||||||||||||
| October 31, 2024 | $ | 8,904,758 | $ | — | $ | — | $ | 8,904,758 | ||||||||
| Ten months ended October 31, 2023** | $ | — | $ | — | $ | — | $ | — | ||||||||
| December 31, 2022 | $ | — | $ | 7,812,987 | $ | — | $ | 7,812,987 | ||||||||
| Tactical Plus Fund | ||||||||||||||||
| October 31, 2024 | $ | 2,923,885 | $ | 189,840 | $ | — | $ | 3,113,725 | ||||||||
| Ten months ended October 31, 2023** | $ | — | $ | — | $ | — | $ | — | ||||||||
| December 31, 2022 | $ | 1,681,010 | $ | 3,437,935 | $ | — | $ | 5,118,945 | ||||||||
| * | Represents the ten months ended October 31, 2024. |
| ** | Represents the ten months ended October 31, 2023. |
100
| WESTWOOD FUNDS |
Federal income tax – Each Fund has qualified and intends to continue to qualify as a regulated investment company under the Internal Revenue Code of 1986, as amended (the “Code”). Qualification generally will relieve the Funds of liability for federal income taxes to the extent 100% of their net investment income and net realized capital gains are distributed in accordance with the Code.
In order to avoid imposition of the excise tax applicable to regulated investment companies, it is also each Fund’s intention to declare as dividends in each calendar year at least 98% of its net investment income (earned during the calendar year) and 98.2% of its net realized capital gains (earned during the twelve months ended October 31) plus undistributed amounts from prior years.
The following information is provided on a tax basis as of October 31, 2024.
| Value | MidCap | SMidCap | SmallCap | AllCap | ||||||||||||||||
| Fund | Fund | Fund | Fund | Fund | ||||||||||||||||
| Federal income tax cost | $ | 154,308,771 | $ | 1,720,635 | $ | 93,316,823 | $ | 948,853,377 | $ | 19,481,337 | ||||||||||
| Gross unrealized appreciation | $ | 60,903,994 | $ | 316,002 | $ | 17,712,160 | $ | 213,812,727 | $ | 3,397,757 | ||||||||||
| Gross unrealized depreciation | (2,003,468 | ) | (44,391 | ) | (6,340,200 | ) | (60,348,728 | ) | (352,531 | ) | ||||||||||
| Net unrealized appreciation | 58,900,526 | 271,611 | 11,371,960 | 153,463,999 | 3,045,226 | |||||||||||||||
| Undistributed ordinary income | 2,372,444 | 66,419 | 1,116,987 | 28,228,574 | 315,392 | |||||||||||||||
| Undistributed long-term capital gains | 12,375,390 | 36,483 | — | 34,096,580 | 770,410 | |||||||||||||||
| Total distributable earnings | $ | 73,648,360 | $ | 374,513 | $ | 12,488,947 | $ | 215,789,153 | $ | 4,131,028 | ||||||||||
| Income | Multi-Asset | Alternative | ||||||||||||||||||
| Opportunity | Income | Income | Global Real | Real Estate | ||||||||||||||||
| Fund | Fund | Fund | Estate Fund | Income Fund | ||||||||||||||||
| Federal income tax cost | $ | 452,772,624 | $ | 92,019,330 | $ | 113,730,588 | $ | 14,828,898 | $ | 249,098,355 | ||||||||||
| Gross unrealized appreciation | $ | 71,688,214 | $ | 6,840,759 | $ | 11,836,812 | $ | 2,051,690 | $ | 34,263,069 | ||||||||||
| Gross unrealized depreciation | (6,123,468 | ) | (1,999,013 | ) | (1,769,545 | ) | (677,722 | ) | (5,403,624 | ) | ||||||||||
| Net unrealized appreciation | 65,564,746 | 4,841,746 | 10,067,267 | 1,373,968 | 28,859,445 | |||||||||||||||
| Net unrealized depreciation on foreign currency translation | — | — | — | (227 | ) | — | ||||||||||||||
| Accumulated capital and other losses | (24,016,104 | ) | (17,990,179 | ) | (15,295,815 | ) | (24,916,324 | ) | — | |||||||||||
| Total distributable earnings (accumulated deficit) | $ | 41,548,642 | $ | (13,148,433 | ) | $ | (5,228,548 | ) | $ | (23,542,583 | ) | $ | 28,859,445 | |||||||
101
| WESTWOOD FUNDS |
| Tactical | Tactical | |||||||
| Growth Fund | Plus Fund | |||||||
| Federal income tax cost | $ | 156,180,221 | $ | 69,913,385 | ||||
| Gross unrealized appreciation | $ | 8,102,372 | $ | — | ||||
| Gross unrealized depreciation | (343,007 | ) | — | |||||
| Net unrealized appreciation | 7,759,365 | — | ||||||
| Undistributed ordinary income | 4,470,469 | 2,133,576 | ||||||
| Accumulated capital and other losses | (7,395,470 | ) | (2,340,044 | ) | ||||
| Total distributable earnings (accumulated deficit) | $ | 4,834,364 | $ | (206,468 | ) | |||
The following information is computed on a tax basis for each item as of November 30, 2023. MLP & Energy Infrastructure Fund has a tax year end of November 30, 2023, which is different than the fiscal year of October 31, 2024.
| MLP & Energy | ||||
| Infrastructure | ||||
| Fund | ||||
| Federal income tax cost | $ | 680,212,669 | ||
| Gross unrealized appreciation | $ | 230,667,525 | ||
| Gross unrealized depreciation | (10,559,517 | ) | ||
| Net unrealized appreciation | 220,108,008 | |||
| Accumulated capital and other losses | (965,958,107 | ) | ||
| Total accumulated deficit | $ | (745,850,099 | ) | |
The following information is provided on a tax basis as of October 31, 2024.
| MLP & Energy | ||||
| Infrastructure | ||||
| Fund | ||||
| Federal income tax cost | $ | 802,363,745 | ||
| Gross unrealized appreciation | $ | 344,370,556 | ||
| Gross unrealized depreciation | (1,214,816 | ) | ||
| Net unrealized appreciation | $ | 343,155,740 | ||
The difference between the federal income tax cost of investments and the financial statement cost of investments are due to certain timing differences in the recognition of capital gains or losses under income tax regulations and GAAP. These “book/tax” differences are temporary in nature and are primarily due to the tax deferral of losses on wash
102
| WESTWOOD FUNDS |
sales, constructive dividend income, partnership adjustments, straddle loss deferral, contingent debt adjustment, perpetual bond and options, futures, redemption in kind and swap mark to market adjustments.
As of October 31, 2024, the following Funds had short-term and long-term capital loss carryforwards for federal income tax purposes, which may be carried forward indefinitely. These capital loss carryforwards are available to offset net realized capital gains in future years, thereby reducing future taxable gains distributions, if any.
| Capital Loss Carryovers | ||||||||||||
| Fund | Short-term | Long-term | Total | |||||||||
| Income Opportunity Fund | $ | 17,559,356 | $ | 6,456,748 | $ | 24,016,104 | ||||||
| Mult-Asset Income Fund | 1,428,086 | 16,562,093 | 17,990,179 | |||||||||
| Alternative Income Fund | 4,289,096 | 3,907,602 | 8,196,698 | |||||||||
| Global Real Estate Fund | 13,677,954 | 11,238,370 | 24,916,324 | |||||||||
| Tactical Growth Fund | 2,455,863 | 4,939,607 | 7,395,470 | |||||||||
| Tactical Plus Fund | 1,341,581 | 998,463 | 2,340,044 | |||||||||
For the period ended October 31, 2024, the following Funds utilized the following capital loss carry forwards:
| Fund | Short-term | Long-term | Total | |||||||||
| Income Opportunity Fund | $ | 2,818,062 | $ | 11,962,942 | $ | 14,781,004 | ||||||
| Mult-Asset Income Fund | 637,924 | — | 637,924 | |||||||||
| Alternative Income Fund | 1,552,281 | 715,057 | 2,267,338 | |||||||||
| Global Real Estate Fund | 293,299 | — | 293,299 | |||||||||
Qualified late year ordinary losses incurred after December 31, 2023 and within the taxable year are deemed to arise on the first day of the Fund’s next taxable year. For the year ended October 31, 2024, Alternative Income Fund deferred $6,798,231 of late year ordinary losses to November 1, 2024 for federal income tax purposes.
As of November 30, 2023, the MLP & Energy Infrastructure Fund had short-term and long-term capital loss carryforwards for federal income tax purposes, which may be carried forward indefinitely. These capital loss carryforwards are available to offset net realized capital gains in the current and future years, thereby reducing future taxable gains distributions, if any.
| Capital Loss Carryovers | ||||||||||||
| Fund | Short-term | Long-term | Total | |||||||||
| MLP & Energy Infrastructure Fund | $ | 313,182,994 | $ | 651,309,658 | $ | 964,492,652 | ||||||
For the MLP & Energy Infrastructure Fund, included in the $964,492,652 is short-term available carry forward losses of $135,535,254 and long-term of $61,267,795 for a total of $196,803,049 from the merged Predecessor Fund with an annual limitation of $4,106,607.
During the tax year end ended November 30, 2023, the MLP & Energy Infrastructure Fund utilized $17,213,030 of capital loss carryforwards against current year gains.
The Funds recognize the tax benefits or expenses of uncertain tax positions only when the position is “more likely than not” of being sustained assuming examination by tax authorities. Management has reviewed each Fund’s tax positions for all open tax years (generally, three years) and has concluded that no provision for unrecognized tax
103
| WESTWOOD FUNDS |
benefits or expenses is required in these financial statements. The Funds identify their major tax jurisdiction as U.S. Federal.
The amount and character of income and gains to be distributed are determined in accordance with income tax regulations, which may differ from generally accepted accounting principles. Reclassifications are made to the Funds’ capital accounts to reflect income and gains available for distribution (or available capital loss carryovers) under current income tax regulations. These permanent differences that are credited or charged to Paid in Capital and distributable earnings/(loss) as of October 31, 2024 are primarily related to utilization of tax equalization, non-deductible partnership expenses and return of capital distributions. As of October 31, 2024, the following adjustments were made:
| Distributable | ||||||||
| earnings/(loss) | Paid in capital | |||||||
| Value Fund | $ | (518,031 | ) | $ | 518,031 | |||
| MidCap Fund | 1 | (1 | ) | |||||
| SMidCap Fund | $ | (67,472,548 | ) | $ | 67,472,548 | |||
| SmallCap Fund | (20,620,478 | ) | 20,620,478 | |||||
| AllCap Fund | (76,671 | ) | 76,671 | |||||
| Income Opportunity Fund | 3,151 | (3,151 | ) | |||||
| Multi-Asset Income Fund | 34,268 | (34,268 | ) | |||||
| Real Estate Income Fund | (201,585 | ) | 201,585 | |||||
| Tactical Growth Fund | (796,799 | ) | 796,799 | |||||
| Tactical Plus Fund | 1 | (1 | ) | |||||
The Funds recognize interest and penalties, if any, related to unrecognized tax benefits as income tax expense on the Statements of Operations. During the year ended October 31, 2024, the Funds did not incur any interest or penalties.
In order to meet the distribution requirements under Subchapter M of the Internal Revenue Code of 1986, as amended (the “Code”), and maintain regulated investment company status, the Fund paid a “deficiency dividend,” as such term is defined by Section 860(f) of the Code, to the MLP & Energy Infrastructure Fund’s shareholders totaling $5,648,856 from ordinary income on July 12, 2023. The Adviser reimbursed the MLP & Energy Infrastructure Fund in the amount of $32,497 for the amount of excise tax associated with the under-distribution. An estimated amount of $300,000 is accrued in the MLP & Energy Infrastructure Fund to cover any additional interest and penalties that may still be charged. The Adviser has committed to reimbursing the MLP & Energy Infrastructure Fund for this expense once the final amount is known and has $300,000 accrued in the Fund to cover the estimated amount.
104
| WESTWOOD FUNDS |
3. Investment Transactions
The cost of security purchases and proceeds from sales and maturities of securities (excluding short-term debt securities having maturities one year or less and U.S. Government securities) for the period/year ended October 31, 2024 were as follows:
| Value | MidCap | SMidCap | SmallCap | AllCap | ||||||||||||||||
| Fund | Fund | Fund | Fund | Fund | ||||||||||||||||
| Purchases of investment securities | $ | 84,986,017 | $ | 1,062,147 | $ | 158,505,848 | $ | 659,903,138 | $ | 16,187,891 | ||||||||||
| Proceeds from sales of investment securities | $ | 94,367,084 | $ | 1,016,638 | $ | 207,738,880 | $ | 812,248,824 | $ | 18,389,964 | ||||||||||
| Income | Multi-Asset | Alternative | MLP & Energy | |||||||||||||
| Opportunity | Income | Income | Infrastructure | |||||||||||||
| Fund | Fund | Fund | Fund | |||||||||||||
| Purchases of investment securities | $ | 229,712,036 | $ | 53,939,323 | $ | 54,202,570 | $ | 778,743,117 | ||||||||
| Proceeds from sales and maturities of investment securities | $ | 267,708,962 | $ | 70,179,181 | $ | 78,815,057 | $ | 747,063,200 | ||||||||
| Global | Real | Broadmark | Broadmark | |||||||||||||
| Real Estate | Estate | Tactical | Tactical | |||||||||||||
| Fund | Income Fund | Growth Fund | Plus Fund | |||||||||||||
| Purchases of investment securities | $ | 7,897,499 | $ | 258,724,544 | $ | 184,162,384 | $ | 90,542,419 | ||||||||
| Proceeds from sales and maturities of investment securities | $ | 11,212,975 | $ | 251,552,645 | $ | 138,182,150 | $ | 93,182,264 | ||||||||
For the year ended December 31, 2023, cost of security purchases and proceeds from sales and maturities of securities (excluding short-term debt securities having maturities one year or less and U.S. Government securities), amounted to $814,813,173, and $958,764,069, respectively, for MLP & Energy Infrastructure Fund.
The cost of security purchases and proceeds from sales and maturities of U.S. Government long-term securities for the year ended October 31, 2024 were as follows:
| Income | Multi-Asset | |||||||
| Opportunity | Income | |||||||
| Fund | Fund | |||||||
| Purchases of investment securities | $ | 40,411,822 | $ | 3,142,769 | ||||
| Proceeds from sales and maturities of investment securities | $ | 56,711,451 | $ | 2,586,687 | ||||
105
| WESTWOOD FUNDS |
The Multi-Asset Income and MLP & Energy Infrastructure Funds invest in one or more Westwood Funds (“Underlying Funds), which are also advised by the Adviser. The Underlying Funds are deemed affiliates of the Multi-Asset Income and MLP & Energy Infrastructure Funds, and the related activities in those investments were as follows:
| For the year ended October 31, 2024 | ||||||||||||||||||||
| Change in | ||||||||||||||||||||
| Fair Value at | Unrealized | |||||||||||||||||||
| October 31, | Purchase | Sales | Realized | Appreciation | ||||||||||||||||
| Affiliate | 2023 | Cost | Proceeds | Gain/(Loss) | (Depreciation) | |||||||||||||||
| Multi-Asset Income Fund | ||||||||||||||||||||
| Westwood Salient Enhanced Energy Income ETF | $ | — | $ | 988,078 | $ | (424,310 | ) | $ | (39,497 | ) | $ | (29,683 | ) | |||||||
| For the year ended October 31, 2024 | ||||||||||||||||
| Fair Value at | Long-Term | Shares at | ||||||||||||||
| October 31, | Dividend | Capital Gain | October 31, | |||||||||||||
| Affiliate | 2024 | Income | Distributions | 2024 | ||||||||||||
| Multi-Asset Income Fund | ||||||||||||||||
| Westwood Salient Enhanced Energy Income ETF | $ | 494,588 | $ | 44,018 | $ | — | 21,836 | |||||||||
| For the period ended October 31, 2024 | ||||||||||||||||||||
| Change in | ||||||||||||||||||||
| Fair Value at | Unrealized | |||||||||||||||||||
| December 31, | Purchase | Sales | Realized | Appreciation | ||||||||||||||||
| Affiliate | 2023 | Cost | Proceeds | Gain/(Loss) | (Depreciation) | |||||||||||||||
| MLP & Energy Infrastructure Fund | ||||||||||||||||||||
| Westwood Salient Enhanced Energy Income ETF | $ | — | $ | 11,272,897 | $ | — | $ | — | $ | (375,594 | ) | |||||||||
| Westwood Salient Enhanced Midstream Income ETF | — | 39,999,633 | — | — | 1,842,879 | |||||||||||||||
| Total | $ | — | $ | 51,272,530 | $ | — | $ | — | $ | 1,467,285 | ||||||||||
106
| WESTWOOD FUNDS |
| For the period ended October 31, 2024 | ||||||||||||||||
| Fair Value at | Long-Term | Shares at | ||||||||||||||
| October 31, | Dividend | Capital Gain | October 31, | |||||||||||||
| Affiliate | 2024 | Income | Distributions | 2024 | ||||||||||||
| MLP & Energy Infrastructure Fund | ||||||||||||||||
| Westwood Salient Enhanced Energy Income ETF | $ | 10,897,303 | $ | 510,127 | $ | — | 481,115 | |||||||||
| Westwood Salient Enhanced Midstream Income ETF | 41,842,512 | 2,273,557 | — | 1,611,112 | ||||||||||||
| Total | $ | 52,739,815 | $ | 2,783,684 | $ | — | 2,092,227 | |||||||||
4. Transactions with Related Parties
INVESTMENT MANAGEMENT AGREEMENT
The Funds’ investments are managed by the Adviser pursuant to the terms of an Investment Management Agreement. Each Fund pays the Adviser an investment management fee, based on the average net assets of each Fund, computed and accrued daily and paid monthly, at the annual rate shown in the table below.
Pursuant to an Expense Limitation Agreement (“ELA”) between each Fund and the Adviser, the Adviser has contractually agreed, until March 1, 2025, (for Value, MidCap, SMidCap, SmallCap, AllCap, Income Opportunity, Multi-Asset Income and Alternative Income Funds) and April 30, 2025 (for Global Real Estate, Real Estate Income, MLP & Energy Infrastructure, Tactical Growth and Tactical Plus Funds) to reduce investment management fees and reimburse other expenses to the extent necessary to limit total annual fund operating expenses of each Fund (exclusive of interest; taxes; brokerage commissions; Rule 12b-1 distribution fees (if any), administrative servicing fees (if any); borrowing expenses such as dividend and interest expenses on securities sold short; acquired fund fees and expenses; costs to organize the Funds; other expenditures which are capitalized in accordance with generally accepted accounting principle; and extraordinary expenses) to an amount not exceeding the following percentages of average daily net assets attributable to each respective class:
| Institutional | A Class | C Class | Ultra Class | F Class | ||||||||
| Management | Class Expense | Expense | Expense | Expense | Expense | |||||||
| Fund | Fee | Limitation | Limitation | Limitation | Limitation | Limitation | ||||||
| Value Fund | 0.50% | 0.55% | 0.55% | 0.55% | 0.55% | n/a | ||||||
| MidCap Fund | 0.58% | 0.58% | n/a | n/a | n/a | n/a | ||||||
| SMidCap Fund | 0.75% | 0.68% | n/a | n/a | 0.68% | n/a | ||||||
| SmallCap Fund | 0.85% | 0.79% | 0.79% | 0.79% | 0.79% | n/a | ||||||
| AllCap Fund | 0.45% | 0.45% | n/a | n/a | 0.45% | n/a | ||||||
| Income Opportunity Fund | 0.65% | 0.74% | 0.74% | 0.74% | 0.74% | n/a | ||||||
| Multi-Asset Income Fund* | 0.38% | (a) | n/a | n/a | n/a | n/a | n/a | |||||
| Alternative Income Fund* | 0.53% | (b) | n/a | n/a | n/a | n/a | n/a |
107
| WESTWOOD FUNDS |
| Institutional | A Class | C Class | Ultra Class | F Class | ||||||||
| Management | Class Expense | Expense | Expense | Expense | Expense | |||||||
| Fund | Fee | Limitation | Limitation | Limitation | Limitation | Limitation | ||||||
| MLP & Energy Infrastructure Fund | 0.90% | 1.25% | 1.50% | 2.25% | n/a | n/a | ||||||
| Global Real Estate Fund | 0.70% | 1.10% | 1.50% | 2.05% | n/a | n/a | ||||||
| Real Estate Income Fund^ | 0.70% | 1.10% | 1.50% | 2.05% | n/a | n/a | ||||||
| Tactical Growth Fund^ | 1.10% | n/a | n/a | n/a | n/a | n/a | ||||||
| Tactical Plus Fund^ | 1.40% | 1.35% | 1.60% | 2.35% | n/a | 1.04% |
| ^ | The ratios listed are the contractual amounts which include 12b-1 distribution and administrative services fees. |
The Funds’ Adviser has agreed to waive fees in the pro-rata amount of the management fee charged by the Underlying Funds on each Fund’s investment in such other Underlying Funds. This fee waiver is accrued daily and settled monthly. During the period ended October 31, 2024, the Multi-Asset Income and MLP & Energy Infrastructure Funds reduced investment advisory fees by $2,561 and $217,435, respectively.
The Adviser has contractually agreed to reduce its fees and reimburse expenses of the Multi-Asset Income Fund, and Alternative Income Fund in order to keep net operating expenses (excluding management fees, interest, taxes, brokerage commissions, Rule 12b-1 distribution fees (if any), administrative servicing fees (if any), acquired fund fees and expenses, other expenditures which are capitalized in accordance with generally accepted accounting principles, and extraordinary expenses (collectively, “excluded expenses”) from exceeding the Funds’ average daily net assets as follows:
| Institutional | A Class | C Class | Ultra Class | |
| Shares Expense | Expense | Expense | Expense | |
| Fund | Limitation | Limitation | Limitation | Limitation |
| Multi-Asset Income Fund* | 0.10% | 0.10% | 0.10% | n/a |
| Alternative Income Fund* | 0.00% | 0.00% | 0.00% | 0.00% |
In addition, the Adviser has contractually agreed to waive its management fee at an annual rate in the amount of 0.01% of the Alternative Income Fund’s average daily net assets.
| * | In connection with the Adviser’s Sensible Fees™ framework, for its services to each share class of Multi-Asset Income and Alternative Income Funds, the Adviser is entitled to a management fee, which consists of a base fee (the “Base Fee”) and a positive or negative performance adjustment (the “Performance Adjustment”) based on whether , and to what extent, the investment performance of each share class of each Fund exceeds, or is exceeded by, the performance of an index hurdle (the “Index Hurdle”) over the 12-month period from November 1 of each year through October 31 of the following year (the “Performance Period”). For each share class of each Fund, the Base Fee and Performance Adjustment are each calculated and accrued daily based on the average daily net assets of the share class during the Performance Period. |
| (a) | The Base Fee is an annual rate of 0.38%. The Index Hurdle is the Blended 80/20 Bloomberg U.S. Aggregate Bond Index/S&P 500® Index plus 1.00%. The Performance Adjustment is calculated according to a schedule that adds or subtracts 0.0032% of the share class’s average daily net assets for each 0.01% by which the performance of the share class exceeds or lags the performance of the Index Hurdle over the Performance Period. The maximum Performance Adjustment (positive or negative) will not exceed an annual rate of +/- 0.32% of the share class’s average daily net assets during the Performance Period, which would occur when the performance of the share class exceeds, or is exceeded by, the performance of the Index Hurdle by 1.00% over the Performance Period. Accordingly, the management fee will range from a minimum annual rate of 0.06% to a maximum annual rate of 0.70%. |
108
| WESTWOOD FUNDS |
| (b) | The Base Fee is an annual rate of 0.53%. The Index Hurdle is the FTSE 1-Month U.S. Treasury Bill Index plus 2.00%. The Performance Adjustment is calculated according to a schedule that adds or subtracts 0.0016% of the share class’s average daily net assets for each 0.01% by which the performance of the share class exceeds or lags the performance of the Index Hurdle over the Performance Period. The maximum Performance Adjustment (positive or negative) will not exceed an annual rate of +/- 0.32% of the share class’s average daily net assets during the Performance Period, which would occur when the performance of the share class exceeds, or is exceeded by, the performance of the Index Hurdle by 2.00% over the Performance Period. Accordingly, the management fee will range from a minimum annual rate of 0.21% to a maximum annual rate of 0.85%. |
Under the terms of the ELA, investment management fee reductions and expense reimbursements by the Adviser are subject to repayment by the Funds for a period of three years after the date on which such fees and expenses were incurred or waived, provided that the repayments do not cause total annual fund operating expenses (exclusive of such reductions and reimbursements) to exceed (i) the expense limitation then in effect, if any, and (ii) the expense limitation in effect at the time the expenses to be repaid were incurred. Fee waivers/expense reimbursements for the Predecessor Funds prior to the Reorganization on November 1, 2021 are not subject to recoupment by the Adviser. The prior 0.25% contractual management fee waiver for Global Real Estate Fund and Real Estate Income Fund is not subject to recoupment. As of October 31, 2024, the Adviser may seek repayment of investment management fee reductions and expense reimbursements no later than the dates below:
| Value | MidCap | SMidCap | SmallCap | AllCap | ||||||||||||||||
| Fund | Fund | Fund | Fund | Fund | ||||||||||||||||
| October 31, 2025 | $ | 97,530 | $ | 92,127 | $ | 476,566 | $ | 1,251,166 | $ | 105,671 | ||||||||||
| October 31, 2026 | 131,653 | 50,674 | 434,607 | 1,421,371 | 96,664 | |||||||||||||||
| October 31, 2027 | 138,668 | 49,790 | 375,911 | 1,610,873 | 98,541 | |||||||||||||||
| $ | 367,851 | $ | 192,591 | $ | 1,287,084 | $ | 4,283,410 | $ | 300,876 | |||||||||||
| Income | Multi-Asset | Alternative | MLP & Energy | |||||||||||||
| Opportunity | Income | Income | Infrastructure | |||||||||||||
| Fund | Fund* | Fund** | Fund*** | |||||||||||||
| October 31, 2025 | $ | — | $ | 69,686 | $ | 216,283 | $ | — | ||||||||
| October 31, 2026 | — | 76,545 | 344,139 | — | ||||||||||||
| October 31, 2027 | — | 89,835 | 263,567 | — | ||||||||||||
| $ | — | $ | 236,066 | $ | 823,989 | $ | — | |||||||||
| Broadmark | Broadmark | |||||||||||||||
| Global Real | Real Estate | Tactical Growth | Tactical Plus | |||||||||||||
| Estate Fund | Income Fund^ | Fund | Fund | |||||||||||||
| December 31, 2024 | $ | 161,957 | $ | — | $ | — | $ | 508,303 | ||||||||
| December 31, 2025 | 170,572 | — | — | 513,949 | ||||||||||||
| October 31, 2026 | 85,435 | — | — | 349,534 | ||||||||||||
| October 31, 2027 | 112,955 | — | — | 412,402 | ||||||||||||
| $ | 530,919 | $ | — | $ | — | $ | 1,784,188 | |||||||||
| * | For the year ended October 31, 2024, the Fund had $2,561 management fee waived related to investments in Underlying Funds that is not subject to recoupment. |
| ** | For the year ended October 31, 2024, the Fund had $11,978 management fee waiver that is not subject to recoupment pursuant to the Management Fee Waiver Agreement. |
109
| WESTWOOD FUNDS |
| *** | For the year ended October 31, 2024, the Fund had $217,435 management fee waived related to investments in Underlying Funds that is not subject to recoupment. |
| ^ | For the year ended October 31, 2024, the Fund recouped $72,853 of past management reductions. |
OTHER SERVICE PROVIDERS
Ultimus Fund Solutions, LLC (“Ultimus”) provides administration, fund accounting, and transfer agency services to the Funds. The Funds pay Ultimus fees in accordance with the agreements for such services. In addition, the Funds pay out-of-pocket expenses including, but not limited to, postage, supplies, and certain costs related to the pricing of the Funds’ portfolio securities.
Under the terms of a Consulting Agreement with the Trust, Northern Lights Compliance Services, LLC (“NLCS”) provides a Chief Compliance Officer and an Anti-Money Laundering Officer to the Trust, as well as related compliance services. Under the terms of the agreement, NLCS receives fees from the Funds. NLCS is a wholly-owned subsidiary of Ultimus.
Under the terms of a Distribution Agreement with the Trust, Ultimus Fund Distributors, LLC (the “Distributor”) serves as the principal underwriter to the Funds. The Distributor is a wholly-owned subsidiary of Ultimus. The Distributor is compensated by the Adviser for acting as principal underwriter.
Certain officers of the Trust are also officers of Ultimus and are not paid by the Funds for servicing in such capacities.
ADMINISTRATIVE SERVICES PLAN
As of October 31, 2024, all Funds have adopted an administrative services plan (the “Plan”) that provides that the applicable class of each Fund may pay financial intermediaries for shareholder services in an amount not to exceed the rate shown below based on the average daily net assets of each Fund’s share class. During the period/year ended October 31, 2024, and year ended December 31, 2023, if applicable the Institutional Shares of the Funds incurred the following administrative services plan fees under the Plan:
| Expense Incurred | ||||||||||||
| For the year/ | For the | |||||||||||
| period ended | year ended | |||||||||||
| October 31, | December 31, | |||||||||||
| Administrative service plan fees | Maximum Rate | 2024 | 2023 | |||||||||
| Institutional Shares | ||||||||||||
| Value Fund | 0.10 | % | $ | 142,565 | $ | N/A | ||||||
| MidCap Fund | 0.20 | % | 2,045 | N/A | ||||||||
| SMidCap Fund | 0.20 | % | 281,569 | N/A | ||||||||
| SmallCap Fund | 0.20 | % | 543,059 | N/A | ||||||||
| AllCap Fund | 0.20 | % | 312 | N/A | ||||||||
| Income Opportunity Fund | 0.10 | % | 338,565 | N/A | ||||||||
| Multi-Asset Income Fund | 0.19 | % | 16,544 | N/A | ||||||||
| Alternative Income Fund | 0.15 | % | 121,018 | N/A | ||||||||
| MLP & Energy Infrastructure Fund | 0.10 | % | 526,644 | 641,419 | ||||||||
| Global Real Estate Fund | 0.05 | % | 1,052 | N/A | ||||||||
| Real Estate Income Fund | 0.05 | % | 80,564 | N/A | ||||||||
| Tactical Growth Fund | 0.05 | % | 86,246 | N/A | ||||||||
| Tactical Plus Fund | 0.10 | % | 35,700 | N/A | ||||||||
110
| WESTWOOD FUNDS |
| Expense Incurred | ||||||||||||
| For the year/ | For the | |||||||||||
| period ended | year ended | |||||||||||
| October 31, | December 31, | |||||||||||
| Administrative service plan fees | Maximum Rate | 2024 | 2023 | |||||||||
| A Class Shares | ||||||||||||
| MLP & Energy Infrastructure Fund | 0.10 | % | $ | 116,069 | $ | 114,007 | ||||||
| Global Real Estate Fund | 0.20 | % | 10,529 | N/A | ||||||||
| Real Estate Income Fund | 0.20 | % | 96,759 | N/A | ||||||||
| Tactical Growth Fund | 0.20 | % | 13,968 | N/A | ||||||||
| Tactical Plus Fund | 0.10 | % | 541 | N/A | ||||||||
| C Class Shares | ||||||||||||
| MLP & Energy Infrastructure Fund | 0.10 | % | 12,160 | 9,880 | ||||||||
| Global Real Estate Fund | 0.25 | % | 1,780 | N/A | ||||||||
| Real Estate Income Fund | 0.25 | % | 14,047 | N/A | ||||||||
| Tactical Growth Fund | 0.25 | % | 11,061 | N/A | ||||||||
| Tactical Plus Fund | 0.10 | % | 361 | N/A | ||||||||
| F Class Shares | ||||||||||||
| Tactical Plus Fund | 0.10 | % | 36,561 | N/A | ||||||||
DISTRIBUTION PLAN
All Funds except for MidCap, SMidCap, and AllCap Funds have adopted a distribution plan under Rule 12b-1 of the 1940 Act (the “Plan”) for A Class Shares and C Class Shares that allows the Funds to pay distribution and/or service fees for the sale and distribution of Fund shares, and for services provided to shareholders in an amount not to exceed 0.25% based on average daily net assets of each Fund’s A Class Shares, up to 0.75% of the average daily net assets of the Global Real Estate, Real Estate Income and Tactical Growth Funds’ C Class Shares and 1.00% based on the average daily net assets of the Value, SmallCap, Income Opportunity, Multi-Asset Income, Alternative Income, MLP & Energy Infrastructure and Tactical Plus Funds’ C Class Shares. During the year/period ended October 31, 2024 and year December 31, 2023, if applicable, the A Class Shares and C Class Shares of the Funds incurred the following distribution fees under the Plan:
| Expense Incurred | ||||||||
| For the year/ | For the | |||||||
| period ended | year ended | |||||||
| October 31, | December 31, | |||||||
| Distribution fee | 2024 | 2023 | ||||||
| Value Fund | ||||||||
| A Class Shares | $ | 3,999 | N/A | |||||
| C Class Shares | 1,611 | N/A | ||||||
111
| WESTWOOD FUNDS |
| Expense Incurred | ||||||||
| For the year/ | For the | |||||||
| period ended | year ended | |||||||
| October 31, | December 31, | |||||||
| Distribution fee | 2024 | 2023 | ||||||
| SmallCap Fund | ||||||||
| A Class Shares | 6,796 | N/A | ||||||
| C Class Shares | 21,993 | N/A | ||||||
| Income Opportunity Fund | ||||||||
| A Class Shares | 114,697 | N/A | ||||||
| C Class Shares | 123,700 | N/A | ||||||
| Multi-Asset Income Fund | ||||||||
| A Class Shares | 19,812 | N/A | ||||||
| C Class Shares | 1,666 | N/A | ||||||
| Alternative Income Fund | ||||||||
| A Class Shares | 504 | N/A | ||||||
| C Class Shares | 4,485 | N/A | ||||||
| MLP & Energy Infrastructure Fund | ||||||||
| A Class Shares | 290,177 | $ | 347,520 | |||||
| C Class Shares | 121,605 | 148,807 | ||||||
| Global Real Estate Fund | ||||||||
| A Class Shares | 35,952 | N/A | ||||||
| C Class Shares | 5,341 | N/A | ||||||
| Real Estate Income Fund | ||||||||
| A Class Shares | 248,627 | N/A | ||||||
| C Class Shares | 42,142 | N/A | ||||||
| Tactical Growth Fund | ||||||||
| A Class Shares | 43,651 | N/A | ||||||
| C Class Shares | 33,182 | N/A | ||||||
| Tactical Plus Fund | ||||||||
| A Class Shares | 1,352 | N/A | ||||||
| C Class Shares | 3,611 | N/A | ||||||
TRUSTEE COMPENSATION
Each member of the Board (a “Trustee”) who is not an “interested person” (as defined by the 1940 Act, as amended) of the Trust (“Independent Trustee”) receives an annual retainer and meeting fees, plus reimbursement for travel and other meeting-related expenses.
112
| WESTWOOD FUNDS |
PRINCIPAL HOLDERS OF FUND SHARES
As of October 31, 2024, the following shareholders owned of record 25% or more of the outstanding shares of the Funds:
| NAME OF RECORD OWNER | % Ownership |
| Value Fund | |
| Band & Co. (for the benefit of its customers) | 43% |
| MidCap Fund | |
| UMB FBO (for the benefit of its customers) | 63% |
| Westwood Management Corp. (for the benefit of its customers) | 32% |
| SMIDCap Fund | |
| Bart 401(a) Model (for the benefit of its customers) | 48% |
| National Financial Services, LLC (for the benefit of its customers) | 27% |
| SmallCap Fund | |
| National Financial Services, LLC (for the benefit of its customers) | 52% |
| AllCap Fund | |
| U.S. Bank CAPINCO | 91% |
| Multi-Asset Income Fund | |
| National Financial Services, LLC (for the benefit of its customers) | 70% |
| Alternative Income Fund | |
| LPL Financial (for the benefit of its customers) | 40% |
| National Financial Services, LLC (for the benefit of its customers) | 49% |
| MLP & Energy Infrastructure Fund | |
| Morgan Stanley Smith Barney, LLC (for the benefit of its customers) | 46% |
| Real Estate Income Fund | |
| Charles Schwab & Co., Inc. (for the benefit of its customers) | 40% |
| Broadmark Tactical Growth Fund | |
| Morgan Stanley Smith Barney, LLC (for the benefit of its customers) | 38% |
| Wells Fargo Clearning Services, LLC (for the benefit of its customers) | 27% |
| Broadmark Tactical Plus Fund | |
| National Financial Services, LLC (for the benefit of its customers) | 97% |
A beneficial owner of 25% or more of a Fund’s outstanding shares may be considered a controlling person of the Fund. That shareholder’s vote could have a more significant effect on matters presented at a shareholders’ meeting.
113
| WESTWOOD FUNDS |
5. Derivative Transactions
The following is a summary of the fair value of derivative instruments held by the Funds listed below as of October 31, 2024 presented on the Statements of Assets and Liabilities.
| Assets | Liabilities | |||||||||||||||||||
| Investments, | Unrealized | Unrealized | ||||||||||||||||||
| at value for | appreciation | Investments, | depreciation | |||||||||||||||||
| purchased | for swap | at value for | Futures | for swap | ||||||||||||||||
| Type of Derivative | options | agreements* | written options | Contracts* | agreements* | |||||||||||||||
| Income Opportunity Fund | ||||||||||||||||||||
| Equity Risk Exposure | $ | — | $ | — | $ | (368,480 | ) | $ | — | $ | — | |||||||||
| Multi-Asset Income Fund | ||||||||||||||||||||
| Equity Risk Exposure | $ | — | $ | — | $ | (52,830 | ) | $ | — | $ | — | |||||||||
| Alternative Income Fund | ||||||||||||||||||||
| Equity Risk Exposure | $ | — | $ | 1,127,454 | $ | (83,210 | ) | $ | — | $ | (332,325 | ) | ||||||||
| MLP & Energy Infrastructure Fund | ||||||||||||||||||||
| Equity Risk Exposure | $ | — | $ | — | $ | (606,717 | ) | $ | — | $ | — | |||||||||
| Tactical Plus Fund | ||||||||||||||||||||
| Equity Risk Exposure | $ | — | $ | — | $ | — | $ | (788,145 | ) | $ | — | |||||||||
Amounts designated as “—” are $0 or have been rounded to $0.
| * | Total fair value is presented by Primary Risk Exposure. For future contracts, if any, the amounts represents their cumulative appreciation/depreciation, which includes movements of variation margin. |
The following summary of the effect of derivatives instruments for the Funds on the Statements of Operations for the year/period ended October 31, 2024 and year ended December 31, 2023, if applicable:
Income Opportunity Fund - for the year ended October 31, 2024
| Change in | ||||||||||||||
| Unrealized | ||||||||||||||
| Appreciation | ||||||||||||||
| Type of Derivative | Risk | Location | Realized Gains | Location | (Depreciation) | |||||||||
| Index call options written | Equity | Net realized gains from written options contracts | $ | 114,334 | Net change in unrealized appreciation (depreciation) on written options contracts | $ | (80,960 | ) | ||||||
114
| WESTWOOD FUNDS |
Multi-Asset Income Fund - for the year ended October 31, 2024
| Change in | ||||||||||||||
| Unrealized | ||||||||||||||
| Appreciation | ||||||||||||||
| Type of Derivative | Risk | Location | Realized Gains | Location | (Depreciation) | |||||||||
| Index call options written | Equity | Net realized gains from written options contracts | $ | 22,867 | Net change in unrealized appreciation (depreciation) on written options contracts | $ | (12,755 | ) | ||||||
Alternative Income Fund - for the year ended October 31, 2024
| Change in | ||||||||||||||
| Unrealized | ||||||||||||||
| Realized Gains | Appreciation | |||||||||||||
| Type of Derivative | Risk | Location | (Losses) | Location | (Depreciation) | |||||||||
| Index put options purchased | Equity | Net realized losses from purchased options contracts | $ | (164,609 | ) | Net change in unrealized appreciation (depreciation) on purchased options contracts | $ | (1,908 | ) | |||||
| Index call options written | Equity | Net realized gains from written options contracts | $ | 28,773 | Net change in unrealized appreciation (depreciation) on written options contracts | $ | (38,699 | ) | ||||||
| Swap transactions | Equity | Net realized losses from swap transactions | $ | (5,449,761 | ) | Net change in unrealized appreciation (depreciation) on swap transactions | $ | (2,170,917 | ) | |||||
MLP & Energy Infrastructure Fund - for the period ended October 31, 2024
| Change in | ||||||||||||||
| Unrealized | ||||||||||||||
| Appreciation | ||||||||||||||
| Type of Derivative | Risk | Location | Realized Gains | Location | (Depreciation) | |||||||||
| Index call options written | Equity | Net realized gains from written options contracts | $ | 862,297 | Net change in unrealized appreciation (depreciation) on written options contracts | $ | (89,530 | ) | ||||||
115
| WESTWOOD FUNDS |
MLP & Energy Infrastructure Fund - for the year ended December 31, 2023
| Change in | ||||||||||||||
| Unrealized | ||||||||||||||
| Appreciation | ||||||||||||||
| Type of Derivative | Risk | Location | Realized Gains | Location | (Depreciation) | |||||||||
| Index call options written | Equity | Net realized gains from written options contracts | $ | 8,691,149 | Net change in unrealized appreciation (depreciation) on written options contracts | $ | (79,060 | ) | ||||||
Tactical Growth Fund - for the year ended October 31, 2024
| Change in | ||||||||||||||
| Unrealized | ||||||||||||||
| Appreciation | ||||||||||||||
| Type of Derivative | Risk | Location | Realized Losses | Location | (Depreciation) | |||||||||
| Futures contracts purchased | Equity | Net realized losses from futures contracts | $ | (4,876,669 | ) | Net change in unrealized appreciation (depreciation) on futures contracts | $ | (3,356,008 | ) | |||||
116
| WESTWOOD FUNDS |
Tactical Plus Fund - for the year ended October 31, 2024
| Change in | ||||||||||||||
| Unrealized | ||||||||||||||
| Realized Gains | Appreciation | |||||||||||||
| Type of Derivative | Risk | Location | (Losses) | Location | (Depreciation) | |||||||||
| Index put options purchased | Equity | Net realized losses from purchased option contracts | $ | (309,442 | ) | Net change in unrealized appreciation (depreciation) on purchased option contracts | $ | — | ||||||
| Index call options purchased | Equity | Net realized gains from purchased option contracts | $ | 301,987 | Net change in unrealized appreciation (depreciation) on purchased option contracts | $ | (57,028 | ) | ||||||
| Index put options written | Equity | Net realized losses from written options contracts | $ | (13,447 | ) | Net change in unrealized appreciation (depreciation) on written options contracts | $ | — | ||||||
| Index call options purchased | Equity | Net realized gains from written options contracts | $ | 6,701 | Net change in unrealized appreciation (depreciation) on written options contracts | $ | 1,052 | |||||||
| Futures contracts purchased | Equity | Net realized gains from futures contracts | 1,363,398 | Net change in unrealized appreciation (depreciation) on futures contracts | (788,145 | ) | ||||||||
| Futures contracts sold short | Equity | Net realized losses from futures contracts | $ | (1,293,577 | ) | Net change in unrealized appreciation (depreciation) on futures contracts | $ | (875,603 | ) | |||||
Amounts designated as “—” are $0 or have been rounded to $0.
Offsetting Assets and Liabilities:
Alternative Income, MLP & Energy Infrastructure, Global Real Estate, Real Estate Income, Tactical Growth, and Tactical Plus Funds are required to disclose the impact of offsetting assets and liabilities represented in the Statements of Assets and Liabilities to enable users of the financial statements to evaluate the effect or potential effect of netting arrangements on its financial position for recognized assets and liabilities. These recognized assets and liabilities are financial instruments and derivative instruments that are either subject to an enforceable master netting arrangement or similar agreement or meet the following right of setoff criteria: the amounts owed by these Funds to another party are determinable, the Funds have the right to set off the amounts owed with the amounts owed by the other party, the Funds intend to set off, and the Funds’ right of setoff is enforceable at law.
A fund is subject to various netting arrangements with select counterparties (“Master Agreements” or “MNAs”). Master Agreements govern the terms of certain transactions and reduce the counterparty risk associated with relevant transactions by specifying credit protection mechanisms and providing standardization that improves legal certainty. Since different types of transactions have different mechanics and are sometimes traded out of different
117
| WESTWOOD FUNDS |
legal entities of a particular counterparty organization, each type of transaction may be covered by a different Master Agreement, resulting in the need for multiple agreements with a single counterparty. As the Master Agreements are specific to unique operations of different asset types, they allow a fund to close out and net its total exposure to a specific counterparty entity in the event of a default with respect to all the transactions governed under a single agreement with a specific counterparty entity.
Master Agreements can also help limit counterparty risk by specifying collateral posting arrangements at pre-arranged exposure levels. Under the Master Agreements, collateral is routinely transferred if the total net exposure to certain transactions (net of existing collateral already in place) governed under the relevant Master Agreement with a counterparty in a given account exceeds a specified threshold, which typically ranges from zero to $250,000 depending on the counterparty and the type of Master Agreement. United States Treasury Securities and U.S. dollar cash are generally the preferred forms of collateral. Securities and cash pledged as collateral are reflected as assets in the Statements of Assets and Liabilities as either a component of investments at value (securities) or deposits due from counterparties (cash). Cash collateral received is not typically held in a segregated account and as such is reflected as a liability in the Statements of Assets and Liabilities as deposits due to counterparties. The market value of any securities received as collateral is not reflected as a component of net asset value. A fund’s overall exposure to counterparty risk can change substantially within a short period, as it is affected by each transaction subject to the relevant Master Agreement.
Customer account agreements and related addendums govern cleared derivatives transactions such as futures, options on futures, and cleared Over The Counter (“OTC”) derivatives. Cleared derivative transactions require posting of initial margin as determined by each relevant clearing agency which is segregated at a broker account registered with the Commodities Futures Trading Commission (“CFTC”), or the applicable regulator. In the U.S., counterparty risk is believed to be reduced as creditors of the futures broker do not have claim to fund assets in the segregated account. Additionally, portability of exposure in the event of default further reduces risk to the funds. Variation margin, or changes in market value, are exchanged daily, but generally may not be netted between futures and cleared OTC derivatives.
International Swaps and Derivatives Association, Inc. Master Agreements and Credit Support Annexes (“ISDA Master Agreements”) govern OTC financial derivative transactions entered into by a fund and select counterparties. ISDA Master Agreements maintain provisions for general obligations, representations, agreements, collateral and events of default or termination. Events of termination include conditions that may entitle counterparties to elect to terminate early and cause settlement of all outstanding transactions under the applicable ISDA Master Agreement. Any election to terminate early could be material to the financial statements. In limited circumstances, the ISDA Master Agreement may contain additional provisions that add additional counterparty protection beyond coverage of existing daily exposure if the counterparty has a decline in credit quality below a predefined level. These amounts, if any, may be segregated with a third party custodian.
As of October 31, 2024, derivative assets and liabilities by type by Fund are as follows:
| Descriptions | Assets | Liabilities | ||||||
| Income Opportunity Fund | ||||||||
| Derivatives Financial Instruments: | ||||||||
| Options contract* | $ | — | $ | (368,480 | ) | |||
| Total derivative assets and liabilities in the Statement of Assets and Liabilities | — | (368,480 | ) | |||||
| Derivative not subject to a MNA or similar agreement | — | 368,480 | ||||||
| Total assets and liabilities subject to a MNA | $ | — | $ | — | ||||
118
| WESTWOOD FUNDS |
| Descriptions | Assets | Liabilities | ||||||
| Multi-Asset Income Fund | ||||||||
| Derivatives Financial Instruments: | ||||||||
| Options contract* | $ | — | $ | (52,830 | ) | |||
| Total derivative assets and liabilities in the Statement of Assets and Liabilities | — | (52,830 | ) | |||||
| Derivative not subject to a MNA or similar agreement | — | 52,830 | ||||||
| Total assets and liabilities subject to a MNA | $ | — | $ | — | ||||
| Alternative Income Fund | ||||||||
| Derivatives Financial Instruments: | ||||||||
| Options contract* | $ | — | $ | (83,210 | ) | |||
| Swap agreements | 1,127,454 | (332,325 | ) | |||||
| Total derivative assets and liabilities in the Statement of Assets and Liabilities | 1,127,454 | (415,535 | ) | |||||
| Derivative not subject to a MNA or similar agreement | — | 83,210 | ||||||
| Total assets and liabilities subject to a MNA | $ | 1,127,454 | $ | (332,325 | ) | |||
| MLP & Energy Infrastructure Fund | ||||||||
| Derivatives Financial Instruments: | ||||||||
| Options contract* | $ | — | $ | (606,717 | ) | |||
| Total derivative assets and liabilities in the Statement of Assets and Liabilities | — | (606,717 | ) | |||||
| Derivative not subject to a MNA or similar agreement | — | 606,717 | ||||||
| Total assets and liabilities subject to a MNA | $ | — | $ | — | ||||
| Tactical Plus Fund | ||||||||
| Derivatives Financial Instruments: | ||||||||
| Futures contracts^ | $ | — | $ | (788,145 | ) | |||
| Total derivative assets and liabilities in the Statement of Assets and Liabilities | — | (788,145 | ) | |||||
| Derivative not subject to a MNA or similar agreement | — | 788,145 | ||||||
| Total assets and liabilities subject to a MNA | $ | — | $ | — | ||||
Amounts designated as “—” are $0 or have been rounded to $0.
| * | Includes options contracts purchased at value as reported in the Statements of Assets and Liabilities. |
| ^ | The amount represents their cumulative appreciation/depreciation which includes movements of variation margin. |
The following table represents derivative assets by counterparty, net of amounts available for offset under an MNA and net of the related collateral received by the Fund as of October 31, 2024.
| Alternative Income Fund | Derivative Assets Subject to a MNA by Counterparty | Derivative Liabilities Subject to a MNA by Counterparty | Net Amount of Derivative Assets | Non-cash Collateral Received(a) | Net Exposure | |||||||||||||||
| BNP Paribas | $ | 1,127,454 | $ | (332,325 | ) | $ | 795,129 | $ | (795,129 | ) | $ | — | ||||||||
| (a) | The actual collateral received or pledged may be in excess of the amounts shown in the tables. The tables only reflect collateral amounts up to the amount of the financial instruments disclosed on the Statements of Assets and Liabilities. |
119
| WESTWOOD FUNDS |
Certain derivative contracts are executed under either standardized netting agreements or, for exchange-traded derivatives, the relevant contracts for a particular exchange that contain enforceable netting provisions. A derivative netting arrangement creates an enforceable right of set-off that becomes effective and affects the realization of settlement on individual assets, liabilities and collateral amounts, only following a specified event of default or early termination. Default events may include the failure to make payments or deliver securities timely, material adverse changes in financial condition or insolvency, the breach of minimum regulatory capital requirements, or loss of license, charter or other legal authorization necessary to perform under the contract.
6. Investments in Money Market Funds
In order to maintain sufficient liquidity to implement investment strategies, or for temporary defensive purposes, the Funds may at times invest a significant portion of their assets in shares of money market funds. As of October 31, 2024, Tactical Growth Fund and Tactical Plus Fund had 33.0% and 97.6%, respectively, of the value of its net assets invested in shares of a money market fund registered under the 1940 Act. The annual report, along with the report of the independent registered public accounting firm is included in the money market fund’s N-CSR available at www.sec.gov. An investment in a money market fund is not insured or guaranteed by the Federal Deposit Insurance Corporation or any other governmental agency, entity or person. While investor losses in money market funds have been rare, they are possible. The Funds, as investors in money market funds, indirectly bear the fees and expenses of those funds, which are in addition to the fees and expenses of the respective Fund.
7. Certain Investments and Risks
Below are summaries of some, but not all, of the principal risks of investing in one or more of the Funds, each of which could adversely affect a Fund’s NAV, yield and total return. Each risk listed below does not necessarily apply to each Fund, and you should read each Fund’s prospectus carefully for a description of the principal risks associated with investing in a particular Fund.
RISKS ASSOCIATED WITH LOWER RATE DEBT SECURITIES
Multi-Asset Income Fund invests substantially all of its assets in high yield, or “junk,” bonds, and such investments represent highly speculative securities that are usually issued by smaller, less creditworthy and/or highly leveraged (indebted) companies. Compared with investment-grade bonds, high yield bonds are considered to carry a greater degree of risk and are considered to be less likely to make payments of interest and principal. In particular, lower-quality high yield bonds (rated CCC, CC, C, or unrated securities judged to be of comparable quality) are subject to a greater degree of credit risk than higher-quality high yield bonds and may be near default. High yield bonds rated D are in default. Market developments and the financial and business conditions of the corporation issuing these securities generally influence their price and liquidity more than changes in interest rates, when compared to investment-grade debt securities. In addition, insufficient liquidity in the non-investment grade bond market may make it more difficult to dispose of non-investment grade bonds and may cause the Fund to experience sudden and substantial price declines.
SECTOR RISK
If a Fund has significant investments in the securities of issuers in industries within a particular business sector, any development affecting that sector will have a greater impact on the value of the net assets of the Fund than would be the case if the Fund did not have significant investments in that sector. In addition, this may increase the risk of loss of an investment in the Fund and increase the volatility of the Fund’s NAV per share. From time to time, circumstances may affect a particular sector and the companies within such sector. For instance, economic or market factors, regulation or deregulation, or other developments may negatively impact all companies in a particular sector and therefore the value of a Fund’s portfolio would be adversely affected. As of October 31, 2024, Alternative
120
| WESTWOOD FUNDS |
Income Fund had 25.3% of the value of its net assets invested in securities in the Technology sector and Real Estate Income Fund had 91.8% of the value of its net assets invested in securities in the Real Estate sector.
8. Contingencies and Commitments
The Funds indemnify the Trust’s officers and Trustees for certain liabilities that might arise from their performance of their duties to the Funds. Additionally, in the normal course of business the Funds enter into contracts that contain a variety of representations and warranties and which provide general indemnifications. The Funds’ maximum exposure under these arrangements is unknown, as this would involve future claims that may be made against the Funds that have not yet occurred. However, based on experience, the Funds expect the risk of loss to be remote.
9. In-Kind Transactions
During the year ended October 31, 2024, the SMidCap Fund redeemed shares of beneficial interest in exchange for securities. The securities were transferred at their current value on the date of the transaction.
| Transaction | Shares | Securities at | ||||||||||||||||||||
| Date | Redeemed | Value | Cash | Total | Realized Gain | |||||||||||||||||
| SMidCap Fund | 5/17/2024 | $ | 8,691,205 | $ | 133,784,153 | $ | 1,510,056 | $ | 135,294,209 | $ | 30,443,950 | |||||||||||
| SMidCap Fund | 9/26/2024 | 3,535,353 | 56,978,806 | 241,458 | 57,220,264 | 10,226,770 | ||||||||||||||||
10. Subsequent Events
The Funds are required to recognize in the financial statements the effects of all subsequent events that provide additional evidence about conditions that existed as of the date of the Statements of Assets and Liabilities. For non-recognized subsequent events that must be disclosed to keep the financial statements from being misleading, the Funds are required to disclose the nature of the event as well as an estimate of its financial effect, or a statement that such an estimate cannot be made. Management has evaluated subsequent events through the issuance of these financial statements and has noted no such events. Management has evaluated subsequent events through the issuance of these financial statements and has noted no such events except for the following:
The following Funds paid distributions to shareholders subsequent to October 31, 2024:
| Per Share | ||||||||||||||||
| Record | Short-Term | Long-Term | ||||||||||||||
| Date | Ex-Date | Income | Capital Gain | Capital Gain | ||||||||||||
| Value Fund - Institutional Shares | 12/11/2024 | 12/12/2024 | $ | — | $ | — | $ | 0.8365 | ||||||||
| Value Fund - A Class Shares | 12/11/2024 | 12/12/2024 | — | — | 0.8365 | |||||||||||
| Value Fund - C Class Shares | 12/11/2024 | 12/12/2024 | — | — | 0.8365 | |||||||||||
| Value Fund - Ultra Shares | 12/11/2024 | 12/12/2024 | — | — | 0.8365 | |||||||||||
| MidCap Fund - Institutional Shares | 12/11/2024 | 12/12/2024 | — | 0.2983 | 0.2225 | |||||||||||
| SmallCap Fund - Institutional Shares | 12/11/2024 | 12/12/2024 | — | 0.4369 | 0.6754 | |||||||||||
121
| WESTWOOD FUNDS |
| Per Share | ||||||||||||||||
| Record | Short-Term | Long-Term | ||||||||||||||
| Date | Ex-Date | Income | Capital Gain | Capital Gain | ||||||||||||
| SmallCap Fund - A Class Shares | 12/11/2024 | 12/12/2024 | — | 0.4369 | 0.6754 | |||||||||||
| SmallCap Fund - C Class Shares | 12/11/2024 | 12/12/2024 | $ | — | $ | 0.4369 | $ | 0.6754 | ||||||||
| SmallCap Fund - Ultra Shares | 12/11/2024 | 12/12/2024 | — | 0.4369 | 0.6754 | |||||||||||
| AllCap Fund - Institutional Shares | 12/11/2024 | 12/12/2024 | — | 0.0366 | 0.4117 | |||||||||||
| AllCap Fund - Ultra Shares | 12/11/2024 | 12/12/2024 | — | 0.0366 | 0.4117 | |||||||||||
| Multi-Asset Income Fund - A Class Shares | 11/26/2024 | 11/27/2024 | 0.0466 | — | — | |||||||||||
| Multi-Asset Income Fund - C Class Shares | 11/26/2024 | 11/27/2024 | 0.0433 | — | — | |||||||||||
| Multi-Asset Income Fund - Institutional Shares | 11/26/2024 | 11/27/2024 | 0.0490 | — | — | |||||||||||
| MLP & Energy Infrastructure Fund - A Class Shares | 11/14/2024 | 11/15/2024 | 0.1079 | — | — | |||||||||||
| MLP & Energy Infrastructure Fund - C Class Shares | 11/14/2024 | 11/15/2024 | 0.0899 | — | — | |||||||||||
| MLP & Energy Infrastructure Fund - Institutional Shares | 11/14/2024 | 11/15/2024 | 0.1150 | — | — | |||||||||||
| MLP & Energy Infrastructure Fund - Ultra Shares | 11/14/2024 | 11/15/2024 | 0.1163 | — | — | |||||||||||
122
| WESTWOOD FUNDS |
| REPORT OF INDEPENDENT REGISTERED PUBLIC ACCOUNTING FIRM |
To the Shareholders of Westwood Funds and
Board of Trustees of Ultimus Managers Trust
Opinion on the Financial Statements
We have audited the accompanying statements of assets and liabilities, including the schedules of investments, futures contracts, open written option contracts and total return swap agreements, of Westwood Quality Value Fund, Westwood Quality MidCap Fund, Westwood Quality SMidCap Fund, Westwood Quality SmallCap Fund, Westwood Quality AllCap Fund, Westwood Income Opportunity Fund, Westwood Multi-Asset Income Fund (formerly Westwood High Income Fund), Westwood Alternative Income Fund, Westwood Salient MLP & Energy Infrastructure Fund, Westwood Global Real Estate Fund (formerly Westwood Salient Global Real Estate Fund), Westwood Real Estate Income Fund (formerly Westwood Salient Select Income Fund), Westwood Broadmark Tactical Growth Fund, and Westwood Broadmark Tactical Plus Fund (“Westwood Funds” or the “Funds”), each a series of Ultimus Managers Trust, as of October 31, 2024, the related statements of operations and changes in net assets, and the financial highlights as noted in the table below, and the related notes (collectively referred to as the “financial statements”). In our opinion, the financial statements present fairly, in all material respects, the financial position of each of the Funds as of October 31, 2024, the results of their operations, the changes in net assets, and the financial highlights for each of the periods noted in the table below, in conformity with accounting principles generally accepted in the United States of America.
| Statements of Changes in Net Assets | ||||
| Fund Names | Statements of Operations | and Financial Highlights | ||
| Westwood Quality Value Fund, Westwood Quality MidCap Fund, Westwood Quality SMidCap Fund, Westwood Quality SmallCap Fund, Westwood Quality AllCap Fund, Westwood Income Opportunity Fund, Westwood Multi-Asset In-come Fund, Westwood Alternative Income Fund | For the year ended October 31, 2024. | For the years ended October 31, 2024, and 2023. | ||
| Westwood Salient MLP & Energy Infrastructure Fund | For the ten-month period ended October 31, 2024, and the year ended December 31, 2023. | For the ten-month period ended October 31, 2024, and the year ended December 31, 2023. | ||
| Westwood Global Real Estate Fund, Westwood Select Income Fund, Westwood Broadmark Tactical Growth Fund, Westwood Broadmark Tactical Plus Fund | For the year ended October 31, 2024. | For the year ended October 31, 2024 and the ten-month period ended October 31, 2023. |
The financial highlights of the Westwood Quality Value Fund, Westwood Quality MidCap Fund, Westwood Quality SMidCap Fund, Westwood Quality SmallCap Fund, Westwood Quality AllCap Fund, Westwood Income Opportunity Fund, Westwood Multi-Asset Income Fund, and Westwood Alternative Income Fund, for the year ended October 31, 2022, and Westwood Quality AllCap Fund’s financial highlights for the period ended October 31, 2021, were audited by other auditors whose report dated December 30, 2022, expressed an unqualified opinion on those financial highlights. The financial highlights for the Westwood Quality Value Fund, Westwood Quality MidCap Fund, Westwood Quality SMidCap Fund, Westwood Quality SmallCap Fund, Westwood Income Opportunity Fund, Westwood Multi-Asset Income Fund, and Westwood Alternative Income Fund for the year ended October 31, 2021, and prior, were audited by other auditors, whose report dated December 29, 2021, expressed an unqualified opinion on those financial highlights.
123
| WESTWOOD FUNDS |
The financial statements and financial highlights for the Westwood Salient MLP & Energy Infrastructure Fund, Westwood Global Real Estate Fund, Westwood Real Estate Income Fund, Westwood Broadmark Tactical Growth Fund, and Westwood Broadmark Tactical Plus Fund for the year ended December 31, 2022, were audited by another auditor, whose report dated March 1, 2023, expressed an unqualified opinion on those financial statements and financial highlights. The financial highlights for the Westwood Salient MLP & Energy Infrastructure Fund, Westwood Global Real Estate Fund, Westwood Real Estate Income Fund, Westwood Broadmark Tactical Growth Fund, and Westwood Broadmark Tactical Plus Fund for the year ended December 31, 2021, and prior, were audited by other auditors, whose report, dated February 24, 2022, expressed an unqualified opinion on those financial highlights.
Basis for Opinion
These financial statements are the responsibility of the Funds’ management. Our responsibility is to express an opinion on the Funds’ financial statements based on our audits. We are a public accounting firm registered with the Public Company Accounting Oversight Board (United States) (“PCAOB”) and are required to be independent with respect to the Funds in accordance with the U.S. federal securities laws and the applicable rules and regulations of the Securities and Exchange Commission and the PCAOB.
We conducted our audits in accordance with the standards of the PCAOB. Those standards require that we plan and perform the audit to obtain reasonable assurance about whether the financial statements are free of material misstatement whether due to error or fraud.
Our audits included performing procedures to assess the risks of material misstatement of the financial statements, whether due to error or fraud, and performing procedures that respond to those risks. Such procedures included examining, on a test basis, evidence regarding the amounts and disclosures in the financial statements. Our procedures included confirmation of securities owned as of October 31, 2024, by correspondence with the custodian and brokers; when replies were not received from brokers, we performed other auditing procedures. Our audits also included evaluating the accounting principles used and significant estimates made by management, as well as evaluating the overall presentation of the financial statements. We believe that our audits provide a reasonable basis for our opinion.
We have served as the auditor of one or more investment companies within the Westwood Family of Funds since 2023.

COHEN & COMPANY, LTD.
Philadelphia, Pennsylvania
December 27, 2024
124
| WESTWOOD FUNDS |
| OTHER INFORMATION (Unaudited) |
The Trust files a complete listing of portfolio holdings for the Funds with the U.S. Securities and Exchange Commission (“SEC”) as of the end of the first and third quarters of each fiscal year as an exhibit to its report on Form N-PORT. The filings are available upon request, by calling 1-877-386-3944. Furthermore, you may obtain a copy of these filings on the SEC’s website at www.sec.gov and the Funds’ website at www.westwoodfunds.com.
A description of the policies and procedures that the Funds use to vote proxies relating to portfolio securities is available without charge upon request by calling toll-free 1-877-386-3944, or on the SEC’s website at www.sec.gov. Information regarding how the Funds voted proxies relating to portfolio securities during the period ended June 30, will be available on or about August 31, without charge upon request by calling 1-877-386-3944, or on the SEC’s website at www.sec.gov.
| OTHER FEDERAL TAX INFORMATION (Unaudited) |
For the fiscal year ended October 31, 2024, the Funds designated the following as long-term capital gain distributions.
| Long term | ||||
| capital gain | ||||
| Value Fund | $ | 3,012,903 | ||
| MidCap Fund | 6,193 | |||
| SMidCap Fund | 22,399,965 | |||
| Small Cap Fund | 38,766,356 | |||
| Allcap Fund | 321,063 | |||
| Real Estate Income Fund | 9,172,982 | |||
| Tactical Plus Fund | 189,840 | |||
Qualified Dividend Income – The following Funds designate the following of its ordinary income dividends, or up to the maximum amount of such dividends allowable pursuant to the Internal Revenue Code, as qualified dividend income eligible for the reduced tax rate of 15%:
| Qualified | ||||
| Dividend | ||||
| Income | ||||
| Value Fund | 79.73 | % | ||
| MidCap Fund | 43.88 | % | ||
| SMidCap Fund | 55.26 | % | ||
| Small Cap Fund | 81.46 | % | ||
| AllCap Fund | 80.03 | % | ||
| Income Opportunity Fund | 23.16 | % | ||
| Multi-Asset Income Fund | 8.64 | % | ||
| Global Real Estate Fund | 29.58 | % | ||
| Real Estate Income Fund | 100.00 | % | ||
125
| WESTWOOD FUNDS |
| Qualified | ||||
| Dividend | ||||
| Income | ||||
| Tactical Growth Fund | 4.92 | % | ||
| Tactical Plus Fund | 0.24 | % | ||
Dividends Received Deduction – Corporate shareholders are generally entitled to take the dividends received deduction on the portion of the Fund’s dividend distributions that qualifies under tax law. For the fiscal year ended October 31, 2024, the following Funds had the following ordinary income dividends qualified for the corporate dividends received deduction:
| Dividend | ||||
| Received | ||||
| Fund | Deduction | |||
| Value Fund | 79.52 | % | ||
| MidCap Fund | 46.98 | % | ||
| SMidCap Fund | 59.01 | % | ||
| Small Cap Fund | 86.18 | % | ||
| AllCap Fund | 79.87 | % | ||
| Income Opportunity Fund | 22.04 | % | ||
| Multi-Asset Income Fund | 8.49 | % | ||
| Global Real Estate Fund | 0.46 | % | ||
| Real Estate Income Fund | 100.00 | % | ||
| Tactical Growth Fund | 4.89 | % | ||
| Tactical Plus Fund | 0.48 | % | ||
126
| WESTWOOD FUNDS |
| DISCLOSURE REGARDING APPROVAL OF INVESTMENT ADVISORY AGREEMENT AND SUB-ADVISORY AGREEMENTS (Unaudited) |
The Board of Trustees (the “Board”), including the Independent Trustees voting separately, has reviewed and approved the continuance of the: (i) Investment Advisory Agreement with Westwood Management Corp. (“Westwood”) with respect to the Westwood Alternative Income Fund, Westwood Income Opportunity Fund, Westwood Multi-Asset Income Fund, Westwood Quality AllCap Fund, Westwood Quality MidCap Fund, Westwood Quality SmallCap Fund, Westwood Quality SMid Cap Fund, and Westwood Quality Value Fund, (ii) Investment Advisory Agreement with Westwood with respect to the Westwood Global Real Estate Fund, Westwood Real Estate Income Fund, Westwood Broadmark Tactical Growth Fund, and Westwood Salient MLP & Energy Infrastructure Fund; (iii) Investment Advisory Agreement with Salient Advisors, L.P. (“Salient”) with respect to the Westwood Broadmark Tactical Plus Fund; (iv) Sub-Advisory Agreement between Salient and Broadmark Asset Management LLC (“Broadmark”) with respect to the Westwood Broadmark Tactical Plus Fund; and (v) Sub -Advisory Agreement between Westwood and Broadmark with respect to the Westwood Broadmark Tactical Growth Fund (individually, a “Fund” and collectively, the “Funds”) for an additional one year term.
The Board approved the Investment Advisory Agreements and Sub-Advisory Agreements at a meeting held on July 15-16, 2024, at which all of the Trustees were present (the “Meeting”).
Prior to the Meeting, each of Westwood and Salient (each a “Westwood Adviser” and together, the “Westwood Advisers”) and Broadmark (the “Sub-Adviser”) provided a response to a letter sent by the counsel to the Independent Trustees, on their behalf, requesting various information relevant to the Independent Trustees’ consideration of the renewal of the Investment Advisory Agreements and Sub-Advisory Agreements with respect to the Funds. In approving the continuance of the Investment Advisory Agreements and Sub-Advisory Agreements, the Independent Trustees considered all information they deemed reasonably necessary to evaluate the terms of the Agreements. The principal areas of review by the Independent Trustees were: (1) the nature, extent and quality of the services provided by the Westwood Advisers and the Sub-Adviser; (2) the investment performance of the Funds; (3) the costs of the services provided and profits realized by the Westwood Advisers and the Sub-Adviser from their relationships with the Funds; (4) the financial condition of the Westwood Advisers and the Sub-Adviser; (5) the fall out benefits derived by the Westwood Advisers and their affiliates (including the Sub-Adviser) from their relationships with the Funds and (6) the extent to which economies of scale would be realized as the Funds grow and whether advisory fee levels reflect those economies of scale for the benefit of the Funds’ shareholders. The Independent Trustees’ evaluation of the quality of the Westwood Advisers’ services and the Sub-Adviser’s services also took into consideration their knowledge gained through presentations and reports from the Westwood Advisers and the Sub-Adviser over the course of the preceding year. The Independent Trustees’ analysis of these factors is set forth below.
Nature, Extent and Quality of Services
The Board evaluated the level and depth of knowledge of the Westwood Advisers and the Sub-Adviser, including the professional experience and qualifications of senior personnel. The Board noted the affiliation of the Westwood Advisers and the Sub-Adviser and the fact that they shared many of the same personnel and resources. In evaluating the quality of services provided by the Westwood Advisers and the Sub-Adviser, the Board took into account its familiarity with the Westwood Advisers’ and the Sub -Adviser’s senior management through Board meetings, discussions and reports during the preceding year. The Board also took into account the Westwood Advisers’ and the Sub -Adviser’s compliance policies and procedures based on discussion with the Westwood Advisers, the Sub-Adviser and the Chief Compliance Officer. The Board also considered the Westwood Advisers’ relationship with their affiliates (including the Sub-Adviser) and the resources available to them, as well as any potential conflicts of interest. The Board discussed the nature and extent of the services provided by the Westwood Advisers and the Sub-Adviser including, without limitation, each Westwood Adviser’s continuous review, supervision and administration of the investment program of the Funds and the Sub-Adviser’s provision of the continuous investment program of the
127
| WESTWOOD FUNDS |
Funds. The quality of administrative and other services, including each Westwood Adviser’s role in coordinating the activities of each Fund’s other service providers, was also considered. The Board also considered the Westwood Advisers’ and the Sub-Adviser’s succession planning for senior personnel. The Board concluded that it was satisfied with the nature, extent and quality of services provided to the Funds by each Westwood Adviser under its respective Investment Advisory Agreement and the Sub-Adviser under the Sub-Advisory Agreements.
Fees and Expenses and Comparative Accounts
The Board compared each of the advisory and sub-advisory fees, as applicable, and the total expense ratio for each Fund with various comparative data. In particular, the Board compared each Fund’s advisory fee and overall expense ratio to the median advisory fees and expense ratios for its custom peer group provided by Broadridge and fees charged to the Westwood Advisers’ and the Sub-Adviser’s other client accounts. In reviewing the comparison in fees and expense ratios between each Westwood Fund and comparable funds, the Board also considered the differences in types of funds being compared, the styles of investment management, the size of each Fund relative to the comparable funds, and the nature of the investment strategies. The Board also considered each Westwood Adviser’s commitment to limit each Fund’s expenses under the Expense Limitation Agreement until at least March 1, 2025. The Board noted that the Quality Value Fund, the Quality MidCap Fund, the Quality Small Cap Fund, the Quality SMidCap Fund, the Quality AllCap Fund, the Multi-Asset Income Fund, the Alternative Income Fund, the Broadmark Tactical Growth Fund, the Broadmark Tactical Plus Fund and the Salient MLP & Energy Infrastructure Fund were all in the first or second quartile for net expenses relative to their respective custom peer groups provided by Broadridge; while the Real Estate Income Fund, the Global Real Estate Fund and the Income Opportunity Fund were all in the third and fourth quartile for net expenses relative to their respective custom peer groups provided by Broadridge. The Board further noted Westwood’s response in the Board materials that it seeks for each Fund to be within the top two quartiles of comparable expenses to its peers, and that if fees and expenses fell out of the top two quartiles, Westwood would consider a reduction in advisory fee or further limiting the Funds’ expenses, as appropriate. The Board also noted that the Alternative Income Fund and the Multi-Asset Income Fund each had a base fee coupled with a positive or negative performance adjustment.
The Board also compared the sub-advisory fee paid to the Sub-Adviser and the fees charged to the Sub-Adviser’s other client accounts. The Board noted that the sub-advisory fee under the Sub-Advisory Agreements was paid by each Westwood Adviser out of its respective advisory fees it receives from the Tactical Funds. The Board considered the amount to be retained by each Westwood Adviser and the sub-advisory fee to be paid to the Sub-Adviser with respect to various services they each provided to the Funds. The Board discussed each Westwood Adviser’s process for monitoring the performance of the Sub-Adviser, which included an examination of both qualitative and quantitative elements of the Sub-Adviser’s organization, personnel, procedures, investment discipline, infrastructure and performance. The Board considered that the Westwood Advisers conduct periodic compliance due diligence of the Sub-Adviser, during which each Westwood Adviser examines a wide variety of factors, such as the financial condition of the Sub-Adviser, the quality of the Sub-Adviser’s systems, the effectiveness of the Sub-Adviser’s disaster recovery programs, trade allocation and execution procedures, compliance with the Sub-Adviser’s policies and procedures, results of regulatory examinations and any other factors that might affect the quality of services to be provided by the Sub-Adviser to the Fund. The Board noted that the Westwood Advisers’ compliance monitoring processes also would include quarterly reviews of compliance certifications, and that any issues arising from such certifications and the Westwood Advisers’ compliance reviews of the Sub-Adviser would be reported to the Board.
Fund Performance
The Board also considered, among other data, each Fund’s performance results during certain periods ended April 30, 2024 and noted that the Board reviews on a quarterly basis detailed information about each Fund’s performance results, portfolio composition and investment strategies. The Board noted Westwood’s efforts to address underperforming Funds. The Board also took into account current market conditions and their effect on each Fund’s performance.
128
| WESTWOOD FUNDS |
Economies of Scale
The Board also considered the effect of each Fund’s growth and size on its performance and expenses. The Board noted that the Westwood Advisers limited fees and/or reimbursed expenses for the Funds in order to reduce each Fund’s operating expenses to targeted levels. The Board considered the effective advisory fee under the Investment Advisory Agreements as a percentage of assets at different asset levels and possible economies of scale that might be realized if the assets of the Funds increased. The Board noted that the sub -advisory fee under the Sub-Advisory Agreements is paid by each Westwood Adviser out of the advisory fee that it receives from a Fund. The Board also noted that the advisory fee schedule for the Funds currently did not have breakpoints, and considered Westwood’s assertion that adding breakpoints was not necessary at this time. The Board noted that if a Fund’s assets increase over time, the Fund might realize other economies of scale if assets increase proportionally more than certain other expenses. They further noted that the advisory fee payable to each Westwood Adviser from the Funds was reduced by the sub-advisory fee paid by the Westwood Adviser to the Sub-Adviser, as applicable.
Financial Condition and Profitability
Additionally, the Board took into consideration the financial condition and profitability of each Westwood Adviser and its affiliates (including the Sub-Adviser) and the direct and indirect benefits derived by each Westwood Adviser and its affiliates from their relationship with the Funds. The information considered by the Board included operating profit margin information for each Fund, each Westwood Adviser’s business as a whole, as well as the Sub-Adviser’s business. The Board considered each Westwood Adviser’s commitment to contractually limit each Fund’s net operating expenses and its payment of the sub-advisory fee out of the advisory fee it received from each Fund. The Board reviewed the profitability of each Westwood Adviser’s relationship with the Funds both before and after tax expenses. The Board recognized that each of the Westwood Advisers and the Sub-Adviser should be entitled to earn a reasonable level of profits in exchange for the level of services each provides to the Fund and the entrepreneurial risk that each Westwood Adviser assumes as investment adviser. Based upon its review, the Board concluded that each Westwood Adviser and Sub-Adviser’s level of profitability, if any, from their relationships with the Funds was reasonable and not excessive. The Board also considered whether each Westwood Adviser and the Sub-Adviser has the financial wherewithal to continue to provide services to each Fund, noting its ongoing commitment to provide support and resources to the Fund as needed.
Fall-Out Benefits
The Board also noted that each Westwood Adviser and the Sub-Adviser derive benefits to their reputations and other benefits from their association with the Funds.
In considering the renewal of each of the Investment Advisory Agreements and the Sub-Advisory Agreements, the Board, including the Independent Trustees, did not identify any single factor as controlling, and each Trustee may have attributed different weights to the various factors. The Trustees evaluated all information available to them. The Board concluded the following: (a) each of the Westwood Advisers and Sub-Adviser demonstrated that it possesses the capability and resources to perform the duties required of it under the Investment Advisory Agreement and Sub-Advisory Agreement, respectively; (b) each of the Westwood Advisers and Sub-Adviser maintains an appropriate compliance program; (c) the overall performance of each Fund is satisfactory relative to the performance of funds with similar investment objectives and relevant indices; and (d) each Fund’s advisory and sub-advisory fees are reasonable in light of the services received by each Fund from a Westwood Adviser and the Sub-Adviser and the other factors considered. Based on their conclusions, the Trustees determined with respect to each Fund that continuation of the Investment Advisory Agreement and the Sub-Advisory Agreement was in the best interests of the Fund and its shareholders.
129
| The Westwood Funds |
| P.O. Box 541150 |
| Omaha, NE 68154 |
| 1-877-FUND-WHG |
| www.westwoodfunds.com |
| Adviser: |
| Westwood Management Corp. |
| 200 Crescent Court, Suite 1200 |
| Dallas, TX 75201 |
| Distributor: |
| Ultimus Fund Distributors, LLC |
| 225 Pictoria Drive |
| Suite 450 |
| Cincinnati, OH 45246 |
| Administrator: |
| Ultimus Fund Solutions, LLC |
| 225 Pictoria Drive |
| Suite 450 |
| Cincinnati, OH 45246 |
| Legal Counsel: |
| Sullivan & Worcester LLP |
| 1666 K Streeet, NW |
| Suite 700 |
| Washington, D.C. 20006 |
| Independent Registered Public Accounting Firm: |
| Cohen & Company, Ltd. |
| 1835 Market Street, Suite 310 |
| Philadelphia, PA 19103 |
This information must be preceded or accompanied by a current prospectus for the Funds.
Westwood Salient Enhanced Midstream Income ETF
Westwood Salient Enhanced Energy Income ETF
| Financial Statements | October 31, 2024 | ||
| Investment Adviser: | |||
| Westwood Management Corp. | |||
| WESTWOOD FUNDS |
| TABLE OF CONTENTS |
| Schedules of Investments | |
| Westwood Salient Enhanced Midstream Income ETF | 1 |
| Westwood Salient Enhanced Energy Income ETF | 4 |
| Statements of Assets and Liabilities | 6 |
| Statements of Operations | 7 |
| Statements of Changes in Net Assets | 8 |
| Financial Highlights | 9 |
| Notes to Financial Statements | 11 |
| Other Information | 21 |
| Report of Independent Registered Public Accounting Firm | 22 |
| Disclosure Regarding Approval of the Investment Advisory Agreement and Sub-Advisory Agreement | 23 |
| WESTWOOD SALIENT ENHANCED MIDSTREAM INCOME ETF OCTOBER 31, 2024 |
| SCHEDULE OF INVESTMENTS |
| MASTER LIMITED PARTNERSHIPS — 25.3% (a) |
| Shares | Value | |||||||
| Crude & Refined Products — 5.0% | ||||||||
| Delek Logistics Partners, L.P. (b) | 5,664 | $ | 218,460 | |||||
| Genesis Energy, L.P. (b) | 17,066 | 193,016 | ||||||
| MPLX, L.P. (b) | 54,939 | 2,440,391 | ||||||
| 2,851,867 | ||||||||
| Gathering & Processing — 3.1% | ||||||||
| Western Midstream Partners, L.P. (b) | 47,168 | 1,779,649 | ||||||
| Natural Gas Liquids Infrastructure — 17.2% | ||||||||
| Energy Transfer, L.P. (b) | 322,466 | 5,314,240 | ||||||
| Enterprise Products Partners, L.P. (b) | 156,587 | 4,487,783 | ||||||
| 9,802,023 | ||||||||
| Total Master Limited Partnerships | ||||||||
| (Cost $13,719,166) | $ | 14,433,539 | ||||||
| MLP RELATED COMPANIES — 75.7% | ||||||||
| Crude & Refined Products — 15.0% | ||||||||
| Enbridge, Inc. (b) | 120,662 | $ | 4,874,745 | |||||
| Plains GP Holdings, L.P. - Class A (b) | 195,290 | 3,358,988 | ||||||
| South Bow Corporation (b)(c) | 11,771 | 293,804 | ||||||
| 8,527,537 | ||||||||
| Gathering & Processing — 27.8% | ||||||||
| Antero Midstream Corporation (b) | 186,372 | 2,678,166 | ||||||
| DT Midstream, Inc. (b) | 35,279 | 3,180,403 | ||||||
| EnLink Midstream, LLC (b) | 148,467 | 2,203,250 | ||||||
| Hess Midstream, L.P. - Class A (b) | 73,385 | 2,542,790 | ||||||
| Kinetik Holdings, Inc. (b) | 44,826 | 2,181,681 | ||||||
| Targa Resources Corporation (b) | 18,189 | 3,036,835 | ||||||
| 15,823,125 | ||||||||
| Liquefied Natural Gas — 5.1% | ||||||||
| Cheniere Energy, Inc. (b) | 14,916 | 2,854,624 | ||||||
| NextDecade Corporation (b)(c) | 4,264 | 24,902 | ||||||
| 2,879,526 | ||||||||
| Natural Gas Liquids Infrastructure — 6.9% | ||||||||
| ONEOK, Inc. (b) | 28,929 | 2,802,642 | ||||||
| Pembina Pipeline Corporation (b) | 27,393 | 1,144,753 | ||||||
| 3,947,395 | ||||||||
| MLP RELATED COMPANIES — continued |
| Shares | Value | |||||||
| Natural Gas Pipelines — 20.9% | ||||||||
| Kinder Morgan, Inc. (b) | 178,807 | $ | 4,382,560 | |||||
| TC Energy Corporation (b) | 59,544 | 2,769,391 | ||||||
| Williams Companies, Inc. (The) (b) | 91,048 | 4,768,184 | ||||||
| 11,920,135 | ||||||||
| Total MLP Related Companies | ||||||||
| (Cost $37,261,166) | $ | 43,097,718 | ||||||
| Investments at Value — 101.0% | ||||||||
| (Cost $50,980,332) | $ | 57,531,257 | ||||||
| Liabilities in Excess of Other Assets — (1.0%) | (596,112 | ) | ||||||
| Net Assets — 100.0% | $ | 56,935,145 | ||||||
| (a) | The security is considered a non-income producing security as any distributions received during the last 12 months (if applicable) are treated as return of capital per Generally Accepted Accounting Principles. |
| (b) | All or a portion of the security covers a written call option. The total value of securities as of October 31, 2024 was $54,598,881. |
| (c) | Non-income producing security. |
The accompanying notes are an integral part of the financial statements.
1
| WESTWOOD SALIENT ENHANCED MIDSTREAM INCOME ETF |
| OCTOBER 31, 2024 |
| SCHEDULE OF OPEN WRITTEN OPTION CONTRACTS |
| Value of | ||||||||||||||||
| Strike Price | Contracts | Notional Value | Options | |||||||||||||
| Call Option Contracts | ||||||||||||||||
| Antero Midstream Corporation, 11/15/24 | $ | 16.00 | 1,432 | $ | 2,057,784 | $ | 3,580 | |||||||||
| Antero Midstream Corporation, 12/20/24 | 16.00 | 338 | 485,706 | 3,380 | ||||||||||||
| Cheniere Energy, Inc., 11/15/24 | 190.00 | 138 | 2,641,044 | 74,520 | ||||||||||||
| Cheniere Energy, Inc., 11/15/24 | 200.00 | 2 | 38,276 | 182 | ||||||||||||
| Cheniere Energy, Inc., 12/20/24 | 195.00 | 1 | 19,138 | 480 | ||||||||||||
| Delek Logistics Partners, L.P., 11/15/24 | 40.00 | 53 | 204,421 | 1,325 | ||||||||||||
| DT Midstream, Inc., 11/15/24 | 85.00 | 13 | 117,195 | 7,995 | ||||||||||||
| DT Midstream, Inc., 11/15/24 | 90.00 | 4 | 36,060 | 800 | ||||||||||||
| DT Midstream, Inc., 12/20/24 | 80.00 | 8 | 72,120 | 9,200 | ||||||||||||
| DT Midstream, Inc., 12/20/24 | 90.00 | 310 | 2,794,650 | 110,050 | ||||||||||||
| Enbridge, Inc., 11/15/24 | 42.50 | 58 | 234,320 | 754 | ||||||||||||
| Enbridge, Inc., 12/20/24 | 42.50 | 1,088 | 4,395,520 | 21,760 | ||||||||||||
| Energy Transfer, L.P., 11/15/24 | 17.00 | 2,823 | 4,652,304 | 22,584 | ||||||||||||
| Energy Transfer, L.P., 12/20/24 | 17.00 | 240 | 395,520 | 3,840 | ||||||||||||
| EnLink Midstream, LLC, 11/15/24 | 15.00 | 807 | 1,197,588 | 16,140 | ||||||||||||
| EnLink Midstream, LLC, 12/20/24 | 15.00 | 16 | 23,744 | 720 | ||||||||||||
| EnLink Midstream, LLC, 12/20/24 | 16.00 | 587 | 871,108 | 7,338 | ||||||||||||
| Enterprise Products Partners, L.P., 11/15/24 | 30.00 | 17 | 48,722 | 34 | ||||||||||||
| Enterprise Products Partners, L.P., 11/15/24 | 31.00 | 1,324 | 3,794,584 | 3,310 | ||||||||||||
| Enterprise Products Partners, L.P., 12/20/24 | 30.00 | 146 | 418,436 | 2,482 | ||||||||||||
| Genesis Energy, L.P., 11/15/24 | 15.00 | 66 | 74,646 | 165 | ||||||||||||
| Genesis Energy, L.P., 12/20/24 | 15.00 | 95 | 107,445 | 380 | ||||||||||||
| Hess Midstream, L.P. - Class A, 11/15/24 | 37.00 | 27 | 93,555 | 135 | ||||||||||||
| Hess Midstream, L.P. - Class A, 11/15/24 | 38.00 | 38 | 131,670 | 190 | ||||||||||||
| Hess Midstream, L.P. - Class A, 11/15/24 | 39.00 | 232 | 803,880 | 580 | ||||||||||||
| Hess Midstream, L.P. - Class A, 12/20/24 | 38.00 | 400 | 1,386,000 | 4,000 | ||||||||||||
| Kinder Morgan, Inc., 11/15/24 | 25.00 | 23 | 56,373 | 644 | ||||||||||||
| Kinder Morgan, Inc., 12/20/24 | 25.00 | 574 | 1,406,874 | 37,884 | ||||||||||||
| Kinder Morgan, Inc., 12/20/24 | 26.00 | 1,101 | 2,698,551 | 34,131 | ||||||||||||
| Kinetik Holdings, Inc., 12/20/24 | 55.00 | 425 | 2,068,475 | 24,438 | ||||||||||||
| MPLX,L.P.,11/15/24 | 45.00 | 5 | 22,210 | 125 | ||||||||||||
| MPLX,L.P.,11/15/24 | 46.00 | 171 | 759,582 | 1,282 | ||||||||||||
| MPLX,L.P.,11/15/24 | 47.00 | 277 | 1,230,434 | 1,385 | ||||||||||||
| MPLX,L.P.,12/20/24 | 45.00 | 49 | 217,658 | 1,764 | ||||||||||||
| MPLX,L.P.,12/20/24 | 46.00 | 19 | 84,398 | 380 | ||||||||||||
| NextDecade Corporation, 12/20/24 | 6.00 | 40 | 23,360 | 3,600 | ||||||||||||
| ONEOK, Inc., 11/15/24 | 97.50 | 4 | 38,752 | 600 | ||||||||||||
| ONEOK, Inc., 11/15/24 | 100.00 | 3 | 29,064 | 225 | ||||||||||||
| ONEOK, Inc., 12/20/24 | 100.00 | 264 | 2,557,632 | 54,120 | ||||||||||||
| ONEOK, Inc., 12/20/24 | 105.00 | 3 | 29,064 | 225 | ||||||||||||
| Pembina Pipeline Corporation, 11/15/24 | 45.00 | 264 | 1,103,256 | 1,848 | ||||||||||||
| Plains GP Holdings, L.P. - Class A, 11/15/24 | 19.00 | 21 | 36,120 | 42 | ||||||||||||
| Plains GP Holdings, L.P. - Class A, 11/15/24 | 20.00 | 1,694 | 2,913,680 | 4,235 | ||||||||||||
The accompanying notes are an integral part of the financial statements.
2
| WESTWOOD SALIENT ENHANCED MIDSTREAM INCOME ETF |
| OCTOBER 31, 2024 |
| SCHEDULE OF OPEN WRITTEN OPTION CONTRACTS — continued |
| Value of | ||||||||||||||||
| Strike Price | Contracts | Notional Value | Options | |||||||||||||
| Call Option Contracts — continued | ||||||||||||||||
| Plains GP Holdings, L.P. - Class A, 12/20/24 | $ | 19.00 | 140 | $ | 240,800 | $ | 1,540 | |||||||||
| Targa Resources Corporation, 11/15/24 | 170.00 | 2 | 33,392 | 756 | ||||||||||||
| Targa Resources Corporation, 12/20/24 | 170.00 | 168 | 2,804,928 | 113,400 | ||||||||||||
| Targa Resources Corporation, 12/20/24 | 175.00 | 2 | 33,392 | 930 | ||||||||||||
| TC Energy Corporation, 11/15/24 | 47.50 | 7 | 32,557 | 567 | ||||||||||||
| TC Energy Corporation, 11/15/24 | 47.50 | 546 | 2,539,446 | 248,430 | ||||||||||||
| TC Energy Corporation, 11/15/24 | 52.50 | 6 | 27,906 | 450 | ||||||||||||
| TC Energy Corporation, 12/20/24 | 50.00 | 6 | 27,906 | 360 | ||||||||||||
| Western Midstream Partners, L.P., 11/15/24 | 41.00 | 382 | 1,441,286 | 3,820 | ||||||||||||
| Western Midstream Partners, L.P., 12/20/24 | 40.00 | 5 | 18,865 | 210 | ||||||||||||
| Western Midstream Partners, L.P., 12/20/24 | 41.00 | 61 | 230,153 | 1,830 | ||||||||||||
| Williams Companies, Inc. (The), 11/15/24 | 47.00 | 42 | 219,954 | 24,360 | ||||||||||||
| Williams Companies, Inc. (The), 11/15/24 | 48.00 | 40 | 209,480 | 18,800 | ||||||||||||
| Williams Companies, Inc. (The), 11/15/24 | 50.00 | 12 | 62,844 | 3,600 | ||||||||||||
| Williams Companies, Inc. (The), 12/20/24 | 55.00 | 770 | 4,032,490 | 77,000 | ||||||||||||
| Total Written Option Contracts | ||||||||||||||||
| (Premiums $675,623) | $ | 54,326,318 | $ | 958,905 | ||||||||||||
The average monthly notional value of written option contracts during the period ended October 31, 2024 was $42,509,747.
The accompanying notes are an integral part of the financial statements.
3
| WESTWOOD SALIENT ENHANCED ENERGY INCOME ETF |
| OCTOBER 31, 2024 |
| SCHEDULE OF INVESTMENTS |
| MLP RELATED COMPANIES — 101.1% |
| Shares | Value | |||||||
| Exploration & Production — 65.4% | ||||||||
| APA Corporation (a) | 4,894 | $ | 115,499 | |||||
| Chevron Corporation (a) | 15,017 | 2,234,830 | ||||||
| ConocoPhillips (a) | 8,745 | 957,927 | ||||||
| Coterra Energy, Inc. (a) | 8,123 | 194,302 | ||||||
| Devon Energy Corporation (a) | 6,769 | 261,825 | ||||||
| Diamondback Energy, Inc. (a) | 2,959 | 523,063 | ||||||
| EOG Resources, Inc. (a) | 5,519 | 673,097 | ||||||
| EQT Corporation (a) | 6,561 | 239,739 | ||||||
| Exxon Mobil Corporation (a) | 25,690 | 3,000,078 | ||||||
| Hess Corporation (a) | 3,332 | 448,087 | ||||||
| Marathon Oil Corporation (a) | 5,519 | 152,876 | ||||||
| Occidental Petroleum Corporation (a) | 8,852 | 443,574 | ||||||
| 9,244,897 | ||||||||
| Gathering & Processing — 2.7% | ||||||||
| Targa Resources Corporation (a) | 2,291 | 382,505 | ||||||
| Natural Gas Liquids Infrastructure — 4.4% | ||||||||
| ONEOK, Inc. (a) | 6,353 | 615,479 | ||||||
| Natural Gas Pipelines — 8.4% | ||||||||
| Kinder Morgan, Inc. (a) | 20,829 | 510,519 | ||||||
| Williams Companies, Inc. (The) (a) | 12,913 | 676,254 | ||||||
| 1,186,773 | ||||||||
| Oilfield Services & Equipment — 9.3% | ||||||||
| Baker Hughes Company (a) | 10,518 | 400,525 | ||||||
| Halliburton Company (a) | 9,581 | 265,777 | ||||||
| Schlumberger Ltd. (a) | 16,245 | 650,937 | ||||||
| 1,317,239 | ||||||||
| MLP RELATED COMPANIES — continued |
| Shares | Value | |||||||
| Refining — 10.9% | ||||||||
| Marathon Petroleum Corporation (a) | 3,749 | $ | 545,367 | |||||
| Phillips 66 (a) | 4,478 | 545,510 | ||||||
| Valero Energy Corporation (a) | 3,437 | 445,985 | ||||||
| 1,536,862 | ||||||||
| Investments at Value — 101.1% | ||||||||
| (Cost $14,444,746) | $ | 14,283,755 | ||||||
| Liabilities in Excess of Other Assets — (1.1%) | (152,924 | ) | ||||||
| Net Assets — 100.0% | $ | 14,130,831 | ||||||
| (a) | All or a portion of the security covers a written call option. The total value of securities as of October 31, 2024 was $13,644,352. |
The accompanying notes are an integral part of the financial statements.
4
| WESTWOOD SALIENT ENHANCED ENERGY INCOME ETF |
| OCTOBER 31, 2024 |
| SCHEDULE OF OPEN WRITTEN OPTION CONTRACTS |
| Value of | ||||||||||||||||
| Strike Price | Contracts | Notional Value | Options | |||||||||||||
| Call Option Contracts | ||||||||||||||||
| APA Corporation, 12/20/24 | $ | 27.50 | 46 | $ | 108,560 | $ | 2,576 | |||||||||
| Baker Hughes Company, 12/20/24 | 39.00 | 4 | 15,232 | 500 | ||||||||||||
| Baker Hughes Company, 12/20/24 | 40.00 | 95 | 361,760 | 8,645 | ||||||||||||
| Chevron Corporation, 12/20/24 | 160.00 | 147 | 2,187,654 | 23,961 | ||||||||||||
| ConocoPhillips, 11/15/24 | 115.00 | 81 | 887,274 | 7,938 | ||||||||||||
| ConocoPhillips, 12/20/24 | 120.00 | 2 | 21,908 | 270 | ||||||||||||
| Coterra Energy, Inc., 12/20/24 | 25.00 | 77 | 184,184 | 4,235 | ||||||||||||
| Devon Energy Corporation, 12/20/24 | 45.00 | 64 | 247,552 | 2,560 | ||||||||||||
| Diamondback Energy, Inc., 11/15/24 | 190.00 | 10 | 176,770 | 1,700 | ||||||||||||
| Diamondback Energy, Inc., 12/20/24 | 200.00 | 18 | 318,186 | 3,330 | ||||||||||||
| EOG Resources, Inc., 12/20/24 | 140.00 | 52 | 634,192 | 4,420 | ||||||||||||
| EQT Corporation, 11/15/24 | 38.00 | 65 | 237,510 | 5,200 | ||||||||||||
| Exxon Mobil Corporation, 11/15/24 | 125.00 | 248 | 2,896,144 | 13,144 | ||||||||||||
| Halliburton Company, 12/20/24 | 32.00 | 91 | 252,434 | 3,185 | ||||||||||||
| Hess Corporation, 12/20/24 | 145.00 | 1 | 13,448 | 154 | ||||||||||||
| Hess Corporation, 12/20/24 | 150.00 | 30 | 403,440 | 2,550 | ||||||||||||
| Kinder Morgan, Inc., 12/20/24 | 25.00 | 189 | 463,239 | 12,474 | ||||||||||||
| Kinder Morgan, Inc., 12/20/24 | 26.00 | 8 | 19,608 | 248 | ||||||||||||
| Marathon Oil Corporation, 12/20/24 | 29.00 | 52 | 144,040 | 3,432 | ||||||||||||
| Marathon Petroleum Corporation, 12/20/24 | 175.00 | 35 | 509,145 | 3,360 | ||||||||||||
| Occidental Petroleum Corporation, 12/20/24 | 57.50 | 84 | 420,924 | 5,460 | ||||||||||||
| ONEOK, Inc., 11/15/24 | 97.50 | 61 | 590,968 | 9,150 | ||||||||||||
| Phillips 66, 12/20/24 | 150.00 | 42 | 511,644 | 1,050 | ||||||||||||
| Schlumberger Ltd., 12/20/24 | 47.50 | 154 | 617,078 | 3,696 | ||||||||||||
| Targa Resources Corporation, 12/20/24 | 170.00 | 22 | 367,312 | 14,850 | ||||||||||||
| Valero Energy Corporation, 12/20/24 | 150.00 | 32 | 415,232 | 3,200 | ||||||||||||
| Williams Companies, Inc. (The), 11/15/24 | 48.00 | 27 | 141,399 | 12,690 | ||||||||||||
| Williams Companies, Inc. (The), 11/15/24 | 55.00 | 90 | 471,330 | 4,050 | ||||||||||||
| Williams Companies, Inc. (The), 12/20/24 | 55.00 | 5 | 26,185 | 500 | ||||||||||||
| Total Written Option Contracts | ||||||||||||||||
| (Premiums $203,208) | $ | 13,644,352 | $ | 158,528 | ||||||||||||
The average monthly notional value of written option contracts during the period ended October 31, 2024 was $11,817,662.
The accompanying notes are an integral part of the financial statements.
5
| WESTWOOD FUNDS |
| OCTOBER 31, 2024 |
| STATEMENTS OF ASSETS AND LIABILITIES |
| Westwood | Westwood | |||||||
| Salient | Salient | |||||||
| Enhanced | Enhanced | |||||||
| Midstream | Energy | |||||||
| Income ETF | Income ETF | |||||||
| ASSETS | ||||||||
| Investments in securities: | ||||||||
| At cost | $ | 50,980,332 | $ | 14,444,746 | ||||
| At value (Note 2) | $ | 57,531,257 | $ | 14,283,755 | ||||
| Cash | 613,287 | 72,396 | ||||||
| Receivable for investment securities sold | 49,261 | 74,398 | ||||||
| Dividends receivable | 288,532 | 8,930 | ||||||
| Reclaims receivable | 18,231 | 964 | ||||||
| Total assets | 58,500,568 | 14,440,443 | ||||||
| LIABILITIES | ||||||||
| Written call options, at value (Notes 2 & 5) (premiums received $675,623 & $203,208) | 958,905 | 158,528 | ||||||
| Distributions payable | 495,000 | 140,625 | ||||||
| Payable for investment securities purchased | 71,981 | — | ||||||
| Payable to Adviser (Note 4) | 39,537 | 10,459 | ||||||
| Total liabilities | 1,565,423 | 309,612 | ||||||
| NET ASSETS | $ | 56,935,145 | $ | 14,130,831 | ||||
| NET ASSETS CONSIST OF: | ||||||||
| Paid-in capital | $ | 54,932,418 | $ | 14,748,939 | ||||
| Distributable earnings (deficit) | 2,002,727 | (618,108 | ) | |||||
| NET ASSETS | $ | 56,935,145 | $ | 14,130,831 | ||||
| Shares of beneficial interest outstanding (unlimited number of shares authorized, no par value) | 2,200,000 | 625,000 | ||||||
| Net asset value, offering price and redemption price per share (Note 1) | $ | 25.88 | $ | 22.61 | ||||
The accompanying notes are an integral part of the financial statements.
6
| WESTWOOD FUNDS |
| FOR THE PERIODS ENDED OCTOBER 31, 2024 |
| STATEMENTS OF OPERATIONS |
| Westwood | Westwood | |||||||
| Salient | Salient | |||||||
| Enhanced | Enhanced | |||||||
| Midstream | Energy | |||||||
| Income ETF (a) | Income ETF (b) | |||||||
| INVESTMENT INCOME | ||||||||
| Distributions from master limited partnerships | $ | 426,879 | $ | — | ||||
| Less return of capital distributions | (426,879 | ) | — | |||||
| Dividends from master limited partnership related companies | 947,233 | 150,996 | ||||||
| Less return of capital on dividends | (457,401 | ) | (12,221 | ) | ||||
| Tax reclaims received | 18,636 | 972 | ||||||
| Foreign withholding taxes on dividends | (63,426 | ) | — | |||||
| Total investment income | 445,042 | 139,747 | ||||||
| EXPENSES | ||||||||
| Investment management fees (Note 4) | 188,580 | 48,182 | ||||||
| NET INVESTMENT INCOME | 256,462 | 91,565 | ||||||
| REALIZED AND UNREALIZED GAINS (LOSSES) ON INVESTMENTS, IN-KIND TRANSACTIONS, FOREIGN CURRENCIES, AND WRITTEN OPTIONS | ||||||||
| Net realized gains (losses) from investment transactions | 225,401 | (65,246 | ) | |||||
| Net realized gains from in-kind transactions (Note 3) | 290,742 | — | ||||||
| Net realized gains (losses) from foreign currency transactions | (825 | ) | 12 | |||||
| Net realized gains (losses) from written option contracts (Note 5) | (2,302,637 | ) | 163,767 | |||||
| Net change in unrealized appreciation (depreciation) on investment transactions | 6,550,925 | (160,991 | ) | |||||
| Net change in unrealized appreciation (depreciation) on currency translations | (309 | ) | (20 | ) | ||||
| Net change in unrealized appreciation (depreciation) on written option contracts (Note 5) | (283,282 | ) | 44,680 | |||||
| NET REALIZED AND UNREALIZED GAINS (LOSSES) ON INVESTMENTS, IN-KIND TRANSACTIONS, FOREIGN CURRENCIES, AND WRITTEN OPTIONS | 4,480,015 | (17,798 | ) | |||||
| NET INCREASE IN NET ASSETS RESULTING FROM OPERATIONS | $ | 4,736,477 | $ | 73,767 | ||||
| (a) | Represents the period from the commencement of operations (April 8, 2024) through October 31, 2024. |
| (b) | Represents the period from the commencement of operations (April 30, 2024) through October 31, 2024. |
The accompanying notes are an integral part of the financial statements.
7
| WESTWOOD FUNDS |
| STATEMENTS OF CHANGES IN NET ASSETS |
| Westwood | Westwood | |||||||
| Salient | Salient | |||||||
| Enhanced | Enhanced | |||||||
| Midstream | Energy | |||||||
| Income ETF | Income ETF | |||||||
| Period | Period | |||||||
| Ended | Ended | |||||||
| October 31, | October 31, | |||||||
| 2024(a) | 2024(b) | |||||||
| FROM OPERATIONS | ||||||||
| Net investment income | $ | 256,462 | $ | 91,565 | ||||
| Net realized gains (losses) on investments, in-kind transactions, written options, and foreign currency transactions | (1,787,319 | ) | 98,533 | |||||
| Net change in unrealized appreciation (depreciation) on investments, written options, and foreign currency translations | 6,267,334 | (116,331 | ) | |||||
| Net increase in net assets resulting from operations | 4,736,477 | 73,767 | ||||||
| FROM DISTRIBUTIONS TO SHAREHOLDERS (NOTE 2) | (2,733,750 | ) | (691,875 | ) | ||||
| FROM CAPITAL SHARE TRANSACTIONS | ||||||||
| Proceeds from shares issued | 61,133,515 | 14,748,939 | ||||||
| Payments for shares redeemed | (6,201,097 | ) | — | |||||
| Net increase in net assets from capital share transactions | 54,932,418 | 14,748,939 | ||||||
| TOTAL INCREASE IN NET ASSETS | 56,935,145 | 14,130,831 | ||||||
| NET ASSETS | ||||||||
| Beginning of period | — | — | ||||||
| End of period | $ | 56,935,145 | $ | 14,130,831 | ||||
| CAPITAL SHARES ACTIVITY | ||||||||
| Issued | 2,450,000 | 625,000 | ||||||
| Redeemed | (250,000 | ) | — | |||||
| Net increase in shares outstanding | 2,200,000 | 625,000 | ||||||
| Shares outstanding at beginning of period | — | — | ||||||
| Shares outstanding at end of period | 2,200,000 | 625,000 | ||||||
| (a) | Represents the period from the commencement of operations (April 8, 2024) through October 31, 2024. |
| (b) | Represents the period from the commencement of operations (April 30, 2024) through October 31, 2024. |
The accompanying notes are an integral part of the financial statements.
8
| WESTWOOD SALIENT ENHANCED MIDSTREAM INCOME ETF |
| FINANCIAL HIGHLIGHTS |
| SELECTED PER SHARE DATA & RATIOS FOR A SHARE OUTSTANDING THROUGHOUT THE PERIOD |
| Period Ended | ||||
| October 31, 2024(a) | ||||
| Net asset value at beginning of period | $ | 25.02 | ||
| Net investment income (b) | 0.16 | |||
| Net realized and unrealized gains on investments | 2.27 | |||
| Total from investment operations | 2.43 | |||
| Variable transaction fees (Note 6) (b) | 0.01 | |||
| Less distributions from: | ||||
| Net investment income | (1.58 | ) | ||
| Net asset value at end of period | $ | 25.88 | ||
| Market price at end of period | $ | 25.97 | ||
| Total return (c) | 10.05 | % (d) | ||
| Total return at market (e) | 10.42 | % (d) | ||
| Net assets at end of period (000’s) | $ | 56,935 | ||
| Ratio of total expenses to average net assets | 0.80 | % (f) | ||
| Ratio of net investment income to average net assets | 1.08 | % (f) | ||
| Portfolio turnover rate (g) | 47 | % (d) | ||
| (a) | Represents the period from the commencement of operations (April 8, 2024) through October 31, 2024. |
| (b) | Per share net investment income and variable transaction fees have been determined on the basis of average number of shares outstanding during the period. |
| (c) | Net asset value total return is calculated assuming an initial investment made at the net asset value at the beginning of the period, reinvestment of all dividends and distributions at net asset value during the period, if any, and redemption on the last day of the period at net asset value. This percentage is not an indication of the performance of a shareholder’s investment in the Fund based on market value due to differences between the market price of the shares and the net asset value per share of the Fund. |
| (d) | Not annualized. |
| (e) | Market value total return is calculated assuming an initial investment made at the market value at the beginning of the period, reinvestment of all dividends and distributions at net asset value during the period, if any, and redemption on the last day of the period at market value. Market value is determined by the composite closing price. Composite closing security price is defined as the last reported sale price from any primary listing market (e.g., Nasdaq) or participating regional exchanges or markets. The composite closing price is the last reported sale price from any of the eligible sources, regardless of volume and not an average price and may have occurred on a date prior to the close of the reporting period. Market value may be greater or less than net asset value, depending on the Fund’s closing price on the listing market. |
| (f) | Annualized. |
| (g) | Portfolio turnover rate excludes securities received or delivered from in-kind processing of creations or redemptions, if any (Note 3). |
The accompanying notes are an integral part of the financial statements.
9
| WESTWOOD SALIENT ENHANCED ENERGY INCOME ETF |
| FINANCIAL HIGHLIGHTS |
| SELECTED PER SHARE DATA & RATIOS FOR A SHARE OUTSTANDING THROUGHOUT THE PERIOD |
| Period Ended | ||||
| October 31, 2024(a) | ||||
| Net asset value at beginning of period | $ | 24.41 | ||
| Net investment income (b) | 0.19 | |||
| Net realized and unrealized losses on investments | (0.65 | ) | ||
| Total from investment operations | (0.46 | ) | ||
| Variable transaction fees (Note 6) (b) | 0.01 | |||
| Less distributions from: | ||||
| Net investment income | (1.35 | ) | ||
| Net asset value at end of period | $ | 22.61 | ||
| Market price at end of period | $ | 22.65 | ||
| Total return (c) | (1.87 | %) (d) | ||
| Total return at market (e) | (1.70 | %) (d) | ||
| Net assets at end of period (000’s) | $ | 14,131 | ||
| Ratio of total expenses to average net assets | 0.85 | % (f) | ||
| Ratio of net investment income to average net assets | 1.61 | % (f) | ||
| Portfolio turnover rate (g) | 14 | % (d) | ||
| (a) | Represents the period from the commencement of operations (April 30, 2024) through October 31, 2024. |
| (b) | Per share net investment income and variable transaction fees have been determined on the basis of average number of shares outstanding during the period. |
| (c) | Net asset value total return is calculated assuming an initial investment made at the net asset value at the beginning of the period, reinvestment of all dividends and distributions at net asset value during the period, if any, and redemption on the last day of the period at net asset value. This percentage is not an indication of the performance of a shareholder’s investment in the Fund based on market value due to differences between the market price of the shares and the net asset value per share of the Fund. |
| (d) | Not annualized. |
| (e) | Market value total return is calculated assuming an initial investment made at the market value at the beginning of the period, reinvestment of all dividends and distributions at net asset value during the period, if any, and redemption on the last day of the period at market value. Market value is determined by the composite closing price. Composite closing security price is defined as the last reported sale price from any primary listing market (e.g., NYSE) or participating regional exchanges or markets. The composite closing price is the last reported sale price from any of the eligible sources,regardless of volume and not an average price and may have occurred on a date prior to the close of the reporting period. Market value may be greater or less than net asset value, depending on the Fund’s closing price on the listing market. |
| (f) | Annualized. |
| (g) | Portfolio turnover rate excludes securities received or delivered from in-kind processing of creations or redemptions, if any (Note 3). |
The accompanying notes are an integral part of the financial statements.
10
| WESTWOOD FUNDS |
| NOTES TO FINANCIAL STATEMENTS |
| 1. | Organization |
Westwood Salient Enhanced Midstream Income ETF (“Midstream Income ETF”) and Westwood Salient Enhanced Energy Income ETF (“Energy Income ETF”) (individually, a “Fund” and collectively, the “Funds”) are each a series of Ultimus Managers Trust (the “Trust”), an open-end investment company established as an Ohio business trust under a Declaration of Trust dated February 28, 2012. The Trust is registered under the Investment Company Act of 1940, as amended, (the “1940 Act”). Other series of the Trust are not included in this report. The Midstream Income ETF commenced operations on April 8, 2024, and the Energy Income ETF commenced operations on April 30, 2024.
The Funds are non-diversified, exchange-traded funds (“ETF”) that seek to provide current income and capital appreciation.
Shares of the Midstream Income ETF is listed and traded on the New York Stock Exchange (“NYSE”). Shares of the Energy Income ETF is listed and traded on the Nasdaq Stock Market (“Nasdaq”). Market prices for the Shares may be different from their net asset value (“NAV”.) The Funds issue and redeem shares solely to certain financial institutions such as registered broker-dealers and banks that have entered into agreements with the Funds’ distributor (“Authorized Participants” or “APs”) on a continuous basis at the NAV per share in aggregations of a specified number of shares called “Creation Units.” Creation Units generally are issued in exchange for a basket of securities (“Deposit Securities”), together with the deposit of a specified cash payment (“Balancing Amount”). Shares are not individually redeemable, but are redeemable only in Creation Unit aggregations, and generally in exchange for portfolio securities and a specified cash payment. A Creation Unit of the Funds consists of a block of shares.
Westwood Management Corporation (the “Adviser” or “Westwood”) serves as investment advisor to the Funds. Westwood is wholly owned subsidiary of Westwood Holdings Group, Inc., an institutional asset management company.
The Adviser has retained Vident Asset Management (the “Sub-Adviser”) to serve as the trading sub-adviser for the Funds. The Sub-Adviser is responsible for trading portfolio securities for the Funds, including selecting broker-dealers to execute purchase and sale transactions, subject to supervision of the Adviser and the Board of Trustees of the Trust (the “Board”).
Other series of the Trust, that are also managed by the Adviser, invest in the Funds, therefore making the Funds affiliates of the other series.
| 2. | Significant Accounting Policies |
The following is a summary of the Funds’ significant accounting policies. The policies are in conformity with accounting principles generally accepted in the United States of America (“GAAP”). The Funds follow accounting and reporting guidance under Financial Accounting Standards Board (“FASB”) Accounting Standards Codification Topic 946, “Financial Services – Investment Companies.”
Regulatory Updates
Tailored Shareholder Reports for Mutual Funds and Exchange-Traded Funds (“ETFs”) – Effective January 24, 2023, the Securities and Exchange Commission (the “SEC”) adopted rule and form amendments to require mutual funds and ETFs to transmit concise and visually engaging streamlined annual and semiannual reports to shareholders that highlight key information. Other information, including financial statements, will no longer appear in a streamlined shareholder report but must be available online, delivered free of charge upon request, and filed on a semiannual
11
| WESTWOOD FUNDS |
basis on Form N-CSR. The rule and form amendments have a compliance date of July 24, 2024. The Funds have implemented the rule and form requirements, as applicable, and are currently adhering to the requirements.
Securities valuation – Each Fund values its portfolio securities at market value as of the close of regular trading on the New York Stock Exchange (the “NYSE”) (normally 4:00 p.m. Eastern time) on each business day the NYSE is open for business. The Funds value their listed securities on the basis of the security’s last sale price on the security’s primary exchange, if available, otherwise at the exchange’s most recently quoted mean price. NASDAQ-listed securities are valued at the NASDAQ Official Closing Price. Investments representing shares of other open-end investment companies, other than exchange-traded funds (“ETFs”), if any, but including money market funds, are valued at their NAV as reported by such companies. Option contracts are valued at the closing price on the exchange on which they are primarily traded; if no closing price is available at the time of valuation, the option will be valued at the mean of the closing bid and ask prices for that day. When using a quoted price and when the market is considered active, these securities will be classified as Level 1 within the fair value hierarchy (see below). Fixed income securities, if any, are generally valued using prices provided by an independent pricing service approved by the Board. The independent pricing service uses information with respect to transactions in bonds, quotations from bond dealers, market transactions in comparable securities, and various relationships between securities in determining these prices. In the event that market quotations are not readily available or are considered unreliable due to market or other events, the Funds value its securities and other assets at fair value as determined by the Adviser, as the Funds’ valuation designee, in accordance with procedures adopted by the Board pursuant to Rule 2a-5 under the 1940 Act. Under these procedures, the securities will be classified as Level 2 or 3 within the fair value hierarchy, depending on the inputs used. Unavailable or unreliable market quotes may be due to the following factors: a substantial bid-ask spread; infrequent sales resulting in stale prices; insufficient trading volume; small trade sizes; a temporary lapse in any reliable pricing source; and actions of the securities or futures markets, such as the suspension or limitation of trading. As a result, the prices of securities used to calculate the Funds’ NAV may differ from quoted or published prices for the same securities. Securities traded on foreign exchanges, if any, are fair valued by an independent pricing service and translated from the local currency into U.S. dollars using currency exchange rates supplied by an independent pricing service.
GAAP establishes a single authoritative definition of fair value, sets out a framework for measuring fair value, and requires additional disclosures about fair value measurements.
Various inputs are used in determining the value of the Fund’s investments. These inputs are summarized in the three broad levels listed below:
| ● | Level 1 – quoted prices in active markets for identical securities |
| ● | Level 2 – other significant observable inputs |
| ● | Level 3 – significant unobservable inputs |
The inputs or methods used for valuing securities are not necessarily an indication of the risks associated with investing in those securities. The inputs used to measure fair value may fall into different levels of the fair value hierarchy. In such cases, for disclosure purposes, the level in the fair value hierarchy within which the fair value measurement falls in its entirety is determined based on the lowest level input that is significant to the fair value measurement.
12
| WESTWOOD FUNDS |
The following is a summary of each Fund’s investments and the inputs used to value the investments as of October 31, 2024:
| Midstream Income ETF | Level 1 | Level 2 | Level 3 | Total | ||||||||||||
| Master Limited Partnerships | $ | 14,433,539 | $ | — | $ | — | $ | 14,433,539 | ||||||||
| MLP Related Companies | 43,097,718 | — | — | 43,097,718 | ||||||||||||
| Total Investment Securities | $ | 57,531,257 | $ | — | $ | — | $ | 57,531,257 | ||||||||
| Other Financial Instruments | ||||||||||||||||
| Written Option Contracts | $ | (372,012 | ) | $ | (586,893 | ) | $ | — | $ | (958,905 | ) | |||||
| Total | $ | 57,159,245 | $ | (586,893 | ) | $ | — | $ | 56,572,352 | |||||||
| Energy Income ETF | Level 1 | Level 2 | Level 3 | Total | ||||||||||||
| MLP Related Companies | $ | 14,283,755 | $ | — | $ | — | $ | 14,283,755 | ||||||||
| Total Investment Securities | $ | 14,283,755 | $ | — | $ | — | $ | 14,283,755 | ||||||||
| Other Financial Instruments | ||||||||||||||||
| Written Option Contracts | $ | (124,298 | ) | $ | (34,230 | ) | $ | — | $ | (158,528 | ) | |||||
| Total | $ | 14,159,457 | $ | (34,230 | ) | $ | — | $ | 14,125,227 | |||||||
Refer to the Funds’ Schedules of Investments for a listing of securities by sector and industry type. The Funds did not hold any derivative instruments or any assets or liabilities that were measured at fair value on a recurring basis using significant unobservable inputs (Level 3) as of or during the period ended October 31, 2024.
Cash – The Funds’ cash, if any, is held in a bank account with balances which may exceed the Federal Deposit Insurance Corporation (FDIC) limit of $250,000. The cash balances reflected on the Statements of Assets and Liabilities for the Funds represent the amount held as of October 31, 2024.
Share valuation – The NAV per share of each Fund is calculated daily by dividing the total value of the assets, less the liabilities, by the number of shares outstanding. The offering price and redemption price per share is equal to the NAV per share.
Investment income – Dividend income is recorded on the ex-dividend date. Non-cash dividends included in dividend income, if any, are recorded at the fair value of the security received. Interest income is accrued as earned. Withholding taxes on foreign dividends, if any, have been recorded in accordance with the Funds’ understanding of the applicable country’s tax rules and rates. Distributions received for the Funds’ investments in Master Limited Partnerships (“MLPs”) may be comprised of both income and return of capital. The Funds record investment income and return of capital based on estimates made at the time such distributions are received. Such estimates are based on historical information available from each MLP and other industry sources. These estimates may subsequently be revised based on information received from MLPs after their tax reporting periods are concluded.
Investment transactions – Investment transactions are accounted for on the trade date. Realized gains and losses on investments sold are determined on a specific identification basis.
Common expenses – Common expenses of the Trust are allocated among the Funds and the other series of the Trust based on the relative net assets of each series, the number of series in the Trust, or the nature of the services performed and the relative applicability to each series.
13
| WESTWOOD FUNDS |
Options written/purchased – The Funds may utilize longer maturity options for stock replacement when and as price and volatility relationships become more favorable for options versus underlying stocks or for tax and liquidity management purposes. The Funds are authorized to write (sell) and purchase put and call options. The risk in writing a call option is that the Funds give up the opportunity to profit if the market price of the security increases. The risk in writing a put option is that the Funds may incur a loss if the market price of the security decreases and the option is exercised. The risk in purchasing an option is that the Funds pay a premium whether or not the option is exercised. The Funds also have the additional risk of being unable to enter into a closing transaction at an acceptable price if a liquid secondary market does not exist. Option contracts also involve the risk that they may not work as intended due to unanticipated developments in market conditions or other causes.
Foreign currency translation – Securities and other assets and liabilities denominated in or expected to settle in foreign currencies are translated into U.S. dollars based on exchange rates on the following basis:
A. The fair values of investment securities and other assets and liabilities are translated as of the close of the NYSE each day.
B. Purchases and sales of investment securities and income and expenses are translated at the rate of exchange prevailing as of 4:00 p.m. Eastern Time on the respective date of such transactions.
C. The Funds do not isolate that portion of the results of operations caused by changes in foreign exchange rates on investments from those caused by changes in market prices of securities held. Such fluctuations are included with the net realized and unrealized gains or losses on investments.
Reported net realized foreign exchange gains or losses arise from 1) purchases and sales of foreign currencies, 2) currency gains or losses realized between the trade and settlement dates on securities transactions and 3) the difference between the amounts of dividends and foreign withholding taxes recorded on a Fund’s books and the U.S. dollar equivalent of the amounts actually received or paid. Reported net unrealized foreign exchange gains and losses arise from changes in the value of assets and liabilities other than investments in securities that result from changes in exchange rates.
The Funds may be subject to foreign taxes related to foreign income received, capital gain on the sale of securities and certain foreign currency transactions (a portion of which may be reclaimable). All foreign taxes are recorded in accordance with the applicable regulations and rates that exist in the foreign jurisdictions in which the Funds invest.
Estimates – The preparation of financial statements in conformity with GAAP requires management to make estimates and assumptions that affect the reported amounts of assets and liabilities and disclosure of contingent assets and liabilities as of the date of the financial statements and the reported amounts of increase (decrease) in net assets from operations during the reporting period. Actual results could differ from those estimates.
Distributions to shareholders – Each Fund distributes substantially all of its net income to shareholders on a monthly basis and its net capital gains to shareholders at least annually in December. The amount of such dividends and distributions are determined in accordance with federal income tax regulations, which may differ from GAAP. Dividends and distributions to shareholders are recorded on the ex-dividend date.
14
| WESTWOOD FUNDS |
The character of dividends paid to shareholders of the Funds for federal income tax purposes during the period ended October 31, 2024 was as follows:
| Ordinary | Long-Term | Total | ||||||||||
| Period Ended | Income | Capital Gains | Distributions | |||||||||
| Midstream Income ETF | ||||||||||||
| October 31, 2024 | $ | 2,733,750 | $ | — | $ | 2,733,750 | ||||||
| Energy Income ETF | ||||||||||||
| October 31, 2024 | $ | 691,875 | $ | — | $ | 691,875 | ||||||
Federal income tax – Each Fund has qualified and intends to continue to qualify as regulated investment companies under the Internal Revenue Code of 1986, as amended (the “Code”). Qualification generally will relieve the Funds of liability for federal income taxes to the extent 100% of their net investment income and net realized capital gains are distributed in accordance with the Code.
In order to avoid imposition of the excise tax applicable to regulated investment companies, it is also each Fund’s intention to declare as dividends in each calendar year at least 98% of its net investment income (earned during the calendar year) and 98.2% of its net realized capital gains (earned during the twelve months ended October 31) plus undistributed amounts from prior years.
The Funds have a tax year end of November 30, 2024, which is different than the fiscal year end of October 31, 2024.
The following information is provided on a tax basis as of October 31, 2024:
| Midstream | Energy | |||||||
| Income ETF | Income ETF | |||||||
| Federal income tax cost | $ | 51,047,139 | $ | 14,458,135 | ||||
| Gross unrealized appreciation | $ | 7,107,320 | $ | 649,474 | ||||
| Gross unrealized depreciation | (623,202 | ) | (823,854 | ) | ||||
| Net unrealized appreciation (depreciation) | $ | 6,484,118 | $ | (174,380 | ) | |||
| Net unrealized depreciation on foreign currencies | $ | (309 | ) | $ | (20 | ) | ||
The difference between the federal income tax cost of investments and the financial statement cost of investments are due to certain timing differences in the recognition of capital gains or losses under income tax regulations and GAAP. These “book/tax” differences are temporary in nature and are primarily due to the tax deferral on losses on wash sales.
The Funds recognize the tax benefits or expenses of uncertain tax positions only when the position is “more likely than not” of being sustained assuming examination by tax authorities. Management has reviewed the Funds’ tax positions for the current period and has concluded that no provision for unrecognized tax benefits or expenses is required in these financial statements. The Funds identify its major tax jurisdiction as U.S. Federal.
The Funds recognize interest and penalties, if any, related to unrecognized tax benefits as income tax expense on the Statements of Operations. During the period ended October 31, 2024, the Funds did not incur any interest or penalties.
15
| WESTWOOD FUNDS |
| 3. | Investment Transactions |
During the period ended October 31, 2024, cost of purchases and proceeds from sales of investment securities, excluding in-kind transactions and short-term investments were as follows:
| Midstream | Energy | |||||||
| Income ETF | Income ETF | |||||||
| Purchases of investment securities (excluding in-kind transactions) | $ | 25,737,296 | $ | 1,716,416 | ||||
| Proceeds from sales of investment securities (excluding in-kind transactions) | $ | 20,480,698 | $ | 1,893,321 | ||||
Purchases and sales of in-kind transactions for the period ended October 31, 2024 were as follows:
| Midstream | Energy | |||||||
| Income ETF | Income ETF | |||||||
| Purchases of in-kind transactions | $ | 52,447,832 | $ | 14,703,543 | ||||
| Sales of in-kind transactions | $ | 6,219,943 | $ | — | ||||
The Midstream Income ETF had realized gains of $290,742 from in-kind transactions during the period ended October 31, 2024.
| 4. | Transactions with Related Parties |
INVESTMENT MANAGEMENT AGREEMENT
The Funds’ investments are managed by the Adviser pursuant to the terms of an Investment Management Agreement (the “Agreement”). The Midstream Income ETF and Energy Income ETF pay the Adviser an investment management fee, computed and accrued daily and paid monthly, at the annual rate of 0.80% and 0.85% of average daily net assets, respectively. Pursuant to its Agreement, the Adviser is required to pay all other expenses of the Funds (other than interest charges on any borrowings, dividends and other expenses on securities sold short, taxes, brokerage commissions and other expenses incurred in placing orders for the purchase and sale of securities and other investment instruments, acquired fund fees and expenses, accrued deferred tax liability, and litigation expenses, and other non-routine or extraordinary expenses) so that total annual fund operating expenses remain at 0.80% and 0.85% of the Midstream Income ETF and Energy Income ETF average daily net assets, respectively. During the period ended October 31, 2024, the Adviser earned $188,580 and $48,182 of fees from the Midstream Income ETF and Energy Income ETF, respectively, under the Investment Advisory Agreement. At October 31, 2024, the Midstream Income ETF and Energy Income ETF owed the Adviser $39,537 and $10,459, respectively, relating to the investment management fee.
For its services, the Sub-Adviser is paid by the Adviser, which fee is calculated daily and paid monthly, at an annual rate based on the average daily net assets of each Fund at the following rate: 0.05% (subject to a minimum of $35,000 per year per Fund).
OTHER SERVICE PROVIDERS
Ultimus Fund Solutions, LLC (“Ultimus”) provides administration and fund accounting services to the Funds. The Adviser pays Ultimus fees in accordance with the agreements for such services.
Under the terms of a Consulting Agreement with the Trust, Northern Lights Compliance Services, LLC (“NLCS”) provides a Chief Compliance Officer and an Anti-Money Laundering Officer to the Trust, as well as related compliance services. Under the terms of the agreement, NLCS receives fees from the Adviser. NLCS is a wholly-owned subsidiary of Ultimus.
16
| WESTWOOD FUNDS |
Under the terms of a Distribution Agreement with the Trust, Northern Lights Distributors, LLC (the “Distributor”) serves as the principal underwriter to the Funds. The Distributor is a wholly-owned subsidiary of Ultimus. The Distributor is compensated by the Adviser for acting as principal underwriter.
Certain officers of the Trust are also officers of Ultimus and are not paid by the Funds for servicing in such capacities.
TRUSTEE COMPENSATION
Each member of the Board (a “Trustee”) who is not an “interested person” (as defined by the 1940 Act, as amended) of the Trust (“Independent Trustee”) receives an annual retainer and meeting fees, plus reimbursement for travel and other meeting-related expenses.
| 5. | Derivative Transactions |
The following is a summary of the fair value of derivative instruments held by the Funds listed below as of October 31, 2024 presented on the Statements of Assets and Liabilities.
| Liabilities | ||||
| Investments, | ||||
| at value | ||||
| for written | ||||
| Type of Derivative | options | |||
| Midstream Income ETF | ||||
| Equity Risk Exposure | $ | (958,905 | ) | |
| Energy Income ETF | ||||
| Equity Risk Exposure | $ | (158,528 | ) | |
The following summary of the effect of derivatives instruments for the Funds on the Statements of Operations for the period ended October 31, 2024:
| Change in | ||||||||||||||
| Unrealized | ||||||||||||||
| Realized | Appreciation | |||||||||||||
| Type of Derivative | Risk | Location | Gains (Losses) | Location | (Depreciation) | |||||||||
| Midstream Income ETF | ||||||||||||||
| Call options written | Equity | Net realized gains (losses) from written option contracts | $ | (2,302,637 | ) | Net change in unrealized appreciation (depreciation) on written option contracts | $ | (283,282 | ) | |||||
| Energy Income ETF | ||||||||||||||
| Call options written | Equity | Net realized gains (losses) from written option contracts | $ | 163,767 | Net change in unrealized appreciation (depreciation) on written option contracts | $ | 44,680 | |||||||
17
| WESTWOOD FUNDS |
Offsetting Assets and Liabilities:
The Funds are required to disclose the impact of offsetting assets and liabilities represented on the Statements of Assets and Liabilities to enable users of the financial statements to evaluate the effect or potential effect of netting arrangements on its financial position for recognized assets and liabilities. These recognized assets and liabilities are financial instruments and derivative instruments that are either subject to an enforceable master netting arrangement or similar agreement or meet the following right of setoff criteria: the amounts owed by the Funds to another party are determinable, the Funds have the right to set off the amounts owed with the amounts owed by the other party, the Funds intend to set off, and the Funds’ right of setoff is enforceable at law.
A fund is subject to various netting arrangements with select counterparties (“Master Agreements” or “MNAs”). Master Agreements govern the terms of certain transactions, and reduce the counterparty risk associated with relevant transactions by specifying credit protection mechanisms and providing standardization that improves legal certainty. Since different types of transactions have different mechanics and are sometimes traded out of different legal entities of a particular counterparty organization, each type of transaction may be covered by a different Master Agreement, resulting in the need for multiple agreements with a single counterparty. As the Master Agreements are specific to unique operations of different asset types, they allow a fund to close out and net its total exposure to a specific counterparty entity in the event of a default with respect to all the transactions governed under a single agreement with a specific counterparty entity.
Master Agreements can also help limit counterparty risk by specifying collateral posting arrangements at prearranged exposure levels. Under the Master Agreements, collateral is routinely transferred if the total net exposure to certain transactions (net of existing collateral already in place) governed under the relevant Master Agreement with a counterparty in a given account exceeds a specified threshold, which typically ranges from zero to $250,000 depending on the counterparty and the type of Master Agreement. United States Treasury Securities and U.S. dollar cash are generally the preferred forms of collateral. Securities and cash pledged as collateral are reflected as assets on the Statements of Assets and Liabilities as either a component of investments at value (securities) or deposits due from counterparties (cash). Cash collateral received is not typically held in a segregated account and as such is reflected as a liability on the Statements of Assets and Liabilities as deposits due to counterparties. The market value of any securities received as collateral is not reflected as a component of net asset value. A fund’s overall exposure to counterparty risk can change substantially within a short period, as it is affected by each transaction subject to the relevant Master Agreement.
As of October 31, 2024, derivative assets and liabilities by type by Fund are as follows:
| Descriptions | Assets | Liabilities | ||||||
| Midstream Income ETF | ||||||||
| Derivatives Financial Instruments: | ||||||||
| Options contract | $ | — | $ | (958,905 | ) | |||
| Total derivative assets and liabilities on the Statements of Assets and Liabilities | — | (958,905 | ) | |||||
| Derivative not subject to a MNA or similar agreement | — | 958,905 | ||||||
| Total assets and liabilities subject to a MNA | $ | — | $ | — | ||||
| Energy Income ETF | ||||||||
| Derivatives Financial Instruments: | ||||||||
| Options contract | $ | — | $ | (158,528 | ) | |||
| Total derivative assets and liabilities on the Statements of Assets and Liabilities | — | (158,528 | ) | |||||
| Derivative not subject to a MNA or similar agreement | — | 158,528 | ||||||
| Total assets and liabilities subject to a MNA | $ | — | $ | — | ||||
18
| WESTWOOD FUNDS |
Certain derivative contracts are executed under either standardized netting agreements or, for exchange-traded derivatives, the relevant contracts for a particular exchange that contain enforceable netting provisions. A derivative netting arrangement creates an enforceable right of set-off that becomes effective and affects the realization of settlement on individual assets, liabilities and collateral amounts, only following a specified event of default or early termination. Default events may include the failure to make payments or deliver securities timely, material adverse changes in financial condition or insolvency, the breach of minimum regulatory capital requirements, or loss of license, charter or other legal authorization necessary to perform under the contract.
| 6. | Capital Share Transactions |
Only certain financial institutions such as registered broker-dealers and banks that have entered into agreements with the APs may acquire shares directly from the Funds and tender their shares for redemption directly to the Funds. Such purchases and redemptions are made at NAV per share and only in large blocks, or Creation Units, of shares. Purchases and redemptions directly with the Funds must follow the Funds’ procedures, which are described in the Funds’ Statement of Additional Information (“SAI”).
A creation transaction, which is subject to acceptance by the Funds’ Distributor and the Funds, generally takes place when an AP deposits into the Funds a designated portfolio of securities (“Deposit Securities”) (including any portion of such securities for which cash may be substituted) and a specified amount of cash approximating the holdings of the Funds in exchange for a specified number of Creation Units. The composition of such portfolio generally corresponds pro rata to the holdings of the Funds. However, the Funds may, in certain circumstances, offer Creation Units partially or solely for cash. Similarly, shares can be redeemed only in Creation Units, generally for a designated portfolio of securities (including any portion of such securities for which cash may be substituted) held by the Funds and a specified amount of cash. Except when aggregated in Creation Units, shares are not redeemable. The prices at which creations and redemptions occur are based on the next calculation of NAV after a creation or redemption order is received in an acceptable form under the AP agreement. Realized gains (losses) resulting from in-kind redemption of shares, if any, are reflected separately on the Statements of Operations.
The Funds charge APs standard creation and redemption transaction fees (“Transaction Fees”) to offset transfer and other transaction costs associated with the issuance and redemption of Creation Units. The standard creation and redemption transaction fees are set forth in the table below. The standard creation transaction fee is charged to the AP on the day such AP creates a Creation Unit, and is the same regardless of the number of Creation Units purchased by the AP on the applicable business day. Similarly, the standard redemption transaction fee is charged to the AP on the day such AP redeems a Creation Unit, and is the same regardless of the number of Creation Units redeemed by the AP on the applicable business day. Creations and redemptions for cash (when cash creations and redemptions (in whole or in part) are available or specified) are also subject to an additional charge (up to the maximum amounts shown in the table below). This charge is intended to compensate for brokerage, tax, foreign exchange, execution, price movement and other costs and expenses related to cash transactions (which may, in certain instances, be based on a good faith estimate of transaction costs). For the period ended October 31, 2024, the Midstream Income ETF and Energy Income ETF received $20,500 and $4,000, respectively, in transaction fees.
The Transaction Fees for the Funds are listed in the table below:
| Maximum | |
| Additional Variable | |
| Fee for In-Kind and | Charge for Cash |
| Cash Purchases | Purchases * |
| $500 | 2.00% |
| * | As a percentage of the amount invested. |
19
| WESTWOOD FUNDS |
| 7. | Sector Risk |
If the Funds have significant investments in the securities of issuers in industries within a particular business sector, any development affecting that sector will have a greater impact on the value of the net assets of the Funds than would be the case if the Funds did not have significant investments in that sector. In addition, this may increase the risk of loss of an investment in the Funds and increase the volatility of the Funds’ NAV per share. From time to time, circumstances may affect a particular sector and the companies within such sector. For instance, economic or market factors, regulation or deregulation, or other developments may negatively impact all companies in a particular sector and therefore the value of a Funds’ portfolio would be adversely affected. As of October 31, 2024, the Midstream Income ETF had 30.9% of the value of its net assets invested in securities in the Gathering & Processing sector, and the Energy Income ETF had 65.4% of the value of its net assets in securities in the Exploration & Production sector.
| 8. | Non-Diversification Risk |
The Funds are non-diversified funds. Because the Funds may invest in securities of a smaller number of issuers, the Funds may be more exposed to the risks associated with and developments affecting and individual issuer than a fund that invests more widely, which may, therefore, have a greater impact on each Funds’ performance.
| 9. | Contingencies and Commitments |
The Funds indemnify the Trust’s officers and Trustees for certain liabilities that might arise from their performance of their duties to the Funds. Additionally, in the normal course of business the Fund enters into contracts that contain a variety of representations and warranties and which provide general indemnifications. The Funds’ maximum exposure under these arrangements is unknown, as this would involve future claims that may be made against the Fund that have not yet occurred. However, based on experience, the Funds expect the risk of loss to be remote.
| 10. | Subsequent Events |
The Funds are required to recognize in the financial statements the effects of all subsequent events that provide additional evidence about conditions that existed as of the date of the Statements of Assets and Liabilities. For non-recognized subsequent events that must be disclosed to keep the financial statements from being misleading, the Funds are required to disclose the nature of the event as well as an estimate of its financial effect, or a statement that such an estimate cannot be made. Management has evaluated subsequent events through the issuance of these financial statements and has noted no such events except for the following:
The following Funds paid distributions to shareholders subsequent to October 31, 2024:
| Income Per | |||||||||
| Record Date | Ex-Date | Share | |||||||
| Midstream Income ETF | 11/27/2024 | 12/2/2024 | $ | 0.2250 | |||||
| Energy Income ETF | 11/27/2024 | 12/2/2024 | 0.2250 | ||||||
20
| WESTWOOD FUNDS |
| OTHER INFORMATION (Unaudited) |
The Trust files a complete listing of portfolio holdings for the Funds with the U.S. Securities and Exchange Commission (“SEC”) as of the end of the first and third quarters of each fiscal year as an exhibit to its report on Form N-PORT. The filings are available upon request, by calling 1-800-994-0755. Furthermore, you may obtain a copy of these filings on the SEC’s website at www.sec.gov and the Funds’ website at www.westwoodetfs.com.
A description of the policies and procedures that the Funds uses to vote proxies relating to portfolio securities is available without charge upon request by calling toll-free 1-800-994-0755, or on the SEC’s website at www.sec.gov. Information regarding how the Funds voted proxies relating to portfolio securities during the period ended June 30, will be available on or about August 31, without charge upon request by calling 1-800-994-0755, or on the SEC’s website at www.sec.gov.
21
| WESTWOOD SALIENT ENHANCED ENERGY INCOME ETF |
| REPORT OF INDEPENDENT REGISTERED PUBLIC ACCOUNTING FIRM |
To the Shareholders of Westwood Funds and
Board of Trustees of Ultimus Managers Trust
Opinion on the Financial Statements
We have audited the accompanying statements of assets and liabilities, including the schedules of investments, of Westwood Salient Enhanced Midstream Income ETF and Westwood Salient Enhanced Energy Income ETF (“Westwood Funds” or the “Funds”), each a series of Ultimus Managers Trust, as of October 31, 2024, the related statements of operations and changes in net assets and the financial highlights from commencement of operations (see table below) through October 31, 2024, and the related notes (collectively referred to as the “financial statements”). In our opinion, the financial statements present fairly, in all material respects, the financial position of each of the Funds as of October 31, 2024, the results of their operations, changes in net assets, and the financial highlights from commencement of operations through October 31, 2024, in conformity with accounting principles generally accepted in the United States of America.
| Fund Name | Commencement of Operations | |
| Westwood Salient Enhanced Midstream Income ETF | April 8, 2024 | |
| Westwood Salient Enhanced Energy Income ETF | April 30, 2024 |
Basis for Opinion
These financial statements are the responsibility of the Funds’ management. Our responsibility is to express an opinion on the Funds’ financial statements based on our audits. We are a public accounting firm registered with the Public Company Accounting Oversight Board (United States) (“PCAOB”) and are required to be independent with respect to the Funds in accordance with the U.S. federal securities laws and the applicable rules and regulations of the Securities and Exchange Commission and the PCAOB.
We conducted our audits in accordance with the standards of the PCAOB. Those standards require that we plan and perform the audit to obtain reasonable assurance about whether the financial statements are free of material misstatement whether due to error or fraud.
Our audits included performing procedures to assess the risks of material misstatement of the financial statements, whether due to error or fraud, and performing procedures that respond to those risks. Such procedures included examining, on a test basis, evidence regarding the amounts and disclosures in the financial statements. Our procedures included confirmation of securities owned as of October 31, 2024, by correspondence with the custodian and brokers; when replies were not received from brokers, we performed other auditing procedures. Our audits also included evaluating the accounting principles used and significant estimates made by management, as well as evaluating the overall presentation of the financial statements. We believe that our audits provide a reasonable basis for our opinion.
We have served as the auditor of one or more investment companies within the Westwood Family of Funds since 2023.
COHEN & COMPANY, LTD.
Philadelphia, Pennsylvania
December 27, 2024
22
| WESTWOOD SALIENT ENHANCED ENERGY INCOME ETF |
DISCLOSURE REGARDING APPROVAL OF THE INVESTMENT ADVISORY AGREEMENT AND SUB-ADVISORY AGREEMENT (Unaudited) |
The Board of Trustees (the “Board”), including the Independent Trustees voting separately, has reviewed and approved the Westwood Salient Enhanced Energy Income ETF’s (the “Fund” or the “ETF”) Investment Advisory Agreement with Westwood Management Corp. (the “Adviser” or “Westwood”) for an initial two-year term (the “Westwood Advisory Agreement”) and the Sub-Advisory Agreement between Westwood and Vident Asset Management (the “Sub-Adviser” or “Vident”), on behalf of the Fund, for an initial two-year term (the “Vident Sub-Advisory Agreement”). The Board approved the Advisory Agreement and the Sub-Advisory Agreement at a meeting held on January 16-17, 2024, at which all of the Trustees were present (the “Meeting”).
Prior to the Meeting, the Adviser and Sub-Adviser provided a response to a letter sent by the counsel to the Independent Trustees, on their behalf, requesting various information relevant to the Independent Trustees’ consideration of the Advisory Agreement and Sub-Advisory Agreement with respect to the Fund. In approving the Advisory Agreement and the Sub-Advisory Agreement, the Independent Trustees considered all information they deemed reasonably necessary to evaluate the terms of the Agreements. The principal areas of review by the Independent Trustees were (1) the nature, extent and quality of the services to be provided by the Adviser and Sub-Adviser, (2) the Adviser’s experience and resources in monitoring the performance of other sub-advisers on Westwood-managed funds and the professional experience and the investment capabilities of the individuals at Vident who are expected to serve as portfolio managers of the Fund, (3) the costs of the services to be provided and profits to be realized by the Adviser and Sub-Adviser from the Adviser’s and Sub-Adviser’s relationship with the Fund, (4) the financial condition of the Adviser and Sub-Adviser, (5) the fall out benefits to be derived by the Adviser and Sub-Adviser and their affiliates from their relationships with the Fund and (6) the extent to which economies of scale would be realized as the Fund grows and whether advisory fee levels reflect those economies of scale for the benefit of the Fund’s shareholders. The Independent Trustees’ evaluation of the quality of the Adviser’s and Sub-Adviser’s services also took into consideration their knowledge gained through presentations and reports from the Adviser over the course of the preceding year for other funds managed by the Adviser. The Independent Trustees’ analysis of these factors is set forth below.
Consideration of Approval of Westwood Advisory Agreement
Nature, Extent and Quality of Services
The Board evaluated the level and depth of knowledge of Westwood, including the professional experience and qualifications of senior personnel. In evaluating the quality of services to be provided by Westwood, the Board took into account its familiarity with Westwood’s senior management through Board meetings, discussions and reports during the preceding year. The Board also took into account Westwood’s compliance policies and procedures based on discussion with Westwood and the Chief Compliance Officer. The quality of administrative and other services, including Westwood’s role in coordinating the activities of the Fund’s other service providers, was also considered. The Board also considered Westwood’s relationship with its affiliates and the resources available to them, as well as any potential conflicts of interest. The Board discussed the nature and extent of the services to be provided by Westwood including, without limitation, Westwood’s provision of a continuous investment program for the ETF. The Board considered the qualifications and experience of Westwood’s portfolio managers who would be responsible for the day-to- day management of the ETF’s portfolio, as well as the qualifications of other individuals at Westwood anticipated to provide services to the ETF. The Board also considered Westwood’s succession planning for the portfolio managers of the ETF.
The Board considered Westwood’s process for monitoring the proposed Sub-Adviser, which would include an examination of both qualitative and quantitative elements of the Sub-Adviser’s organization, personnel, procedures,
23
| WESTWOOD SALIENT ENHANCED ENERGY INCOME ETF |
infrastructure and performance. The Board further considered that Westwood would conduct periodic reviews of the Sub-Adviser. The Board concluded that it was satisfied with the nature, extent and quality of services to be provided to the ETF by Westwood under the Westwood Advisory Agreement.
Advisory Fees and Expenses and Comparative Accounts
The Board compared the proposed advisory fee and total expense ratio for the ETF with various comparative data. In particular, the Board compared the ETF’s proposed advisory fee and overall expense ratio to the median advisory fees and expense ratios for its custom peer group provided by Broadridge. The Board noted Westwood’s response in the 15(c) materials that there were no accounts or funds comparable to the ETF that were managed by Westwood. The Board noted that the ETF would be charged a unitary fee under the proposed Westwood Advisory Agreement. The Board further noted that, under the unitary fee arrangement, the ETF would pay Westwood a unitary fee from which Westwood would pay the ETF’s other expenses, including the cost of sub-advisory, transfer agency, custody, fund administration, legal, audit and other services and fees, if any, but excluding the fee payment under the Westwood Advisory Agreement and interest, taxes, acquired fund fees and expenses, if any, brokerage commissions and other expenses connected with the execution of portfolio transactions, distribution and service fees pursuant to a Rule 12b-1 plan, if any, and extraordinary expenses, if any. The Board considered that, from the unitary fee for the ETF, Westwood would pay the Sub-Adviser a proposed sub-advisory fee equal to 0.05% of the ETF’s average net assets, subject to a $35,000 annual minimum. Because the ETF will pay a unitary fee, the Board determined that expense ratios were the most relevant comparative data point.
In reviewing the comparison in expense ratios between the ETF and comparable funds, the Board also considered the differences in types of funds being compared, the styles of investment management, and the nature of the investment strategies. The Board noted that the proposed advisory fee for the ETF was below the average and the median for the other funds in its Broadridge custom peer group, respectively.
Fund Performance
The Board also considered, among other data, the investment performance of the proposed investment strategy for the ETF. The Board also noted the Adviser’s experience and resources in monitoring the performance of other sub-advisers on Westwood-managed funds.
Potential Economies of Scale
The Board also considered the effect of the ETF’s potential growth and size on its performance and expenses. The Board took into account management’s discussion of the ETF’s advisory fee structure. The Board considered the proposed advisory fees under the Westwood Advisory Agreement and possible economies of scale that might be realized if the assets of the ETF increase. The Board noted that the advisory fee schedule for the ETF currently did not have breakpoints, and considered Westwood’s assertion that adding breakpoints was not appropriate at this time. The Board noted that if the ETF’s assets increase over time, the ETF might realize other economies of scale if assets increase proportionally more than certain other expenses. The Board also considered the fact that, under the Westwood Advisory Agreement, the advisory fee payable to Westwood by the ETF would be reduced by the total sub-advisory fee paid to the Sub-Adviser.
Financial Condition of the Adviser and Adviser Profitability
Additionally, the Board took into consideration the financial condition and anticipated profitability of Westwood and its affiliates and the anticipated direct and indirect benefits derived by Westwood and its affiliates from their relationship with the ETF. The information considered by the Board included operating profit margin information for Westwood’s business as a whole. The Board reviewed the anticipated profitability of Westwood’s relationship with the ETF both before and after tax expenses, and also considered whether Westwood has the financial wherewithal
24
| WESTWOOD SALIENT ENHANCED ENERGY INCOME ETF |
to provide services to the ETF, noting Westwood’s ongoing commitment to provide support and resources to the ETF as needed.
Fall-Out Benefits
The Board also noted that Westwood would derive benefits to its reputation and other benefits from its association with the ETF. The Board recognized that Westwood should be entitled to earn a reasonable level of profits in exchange for the level of services it would provide to the ETF and the entrepreneurial risk that it assumes as investment adviser. Based upon its review, the Board concluded that Westwood’s level of profitability, if any, to be derived from its relationship with the ETF was reasonable and not excessive.
Consideration of Approval of Vident Sub-Advisory Agreement
Nature, Extent and Quality of Services
The Board considered information provided by Vident regarding the services to be provided by Vident to the ETF. The Board evaluated the level and depth of knowledge of Vident, including the professional experience and qualifications of senior personnel. The Board also took into account Vident’s compliance policies and procedures based on discussion with Vident and the Chief Compliance Officer. The Board discussed the nature and extent of the services to be provided by Vident including, without limitation, Vident’s portfolio management and trading services, daily monitoring of the ETF’s positions and variances against the model portfolio provided by Westwood, monitoring to adhere to investment guidelines, cash management, cash and holdings reconciliation, and review of creation and redemption file data. The Board considered the qualifications and experience of Vident’s portfolio managers who would be responsible for trading the ETF’s portfolio, as well as the qualifications of other individuals at Vident anticipated to provide services to the ETF. The Board also considered Vident’s succession planning for the portfolio managers of the ETF. The Board then took into consideration Westwood’s due diligence of Vident and Westwood’s selection of Vident based on, as Westwood previously noted, Vident’s reputation, comprehensive service offering, experience with buy-write strategies in ETF wrappers, and competitive pricing. The Board concluded that it was satisfied with the nature, extent and quality of services to be provided to the ETF by Vident under the Vident Sub-Advisory Agreement.
Sub-Advisory Fees and Expenses and Comparative Accounts
The Board considered that the sub -advisory fee would be paid by Westwood and not by the ETF. The Board also considered that the ETF would pay an advisory fee to Westwood and that Westwood would pay a sub-advisory fee to Vident out of the advisory fee it receives from the ETF. The Board also considered Vident’s response in its 15(c) materials that it does not believe the other accounts managed by Vident would be considered similar in nature to the ETF to be appropriate for a fee comparison.
Fund Performance
As the ETF had not yet commenced operations, the Board did not consider past performance. The Board considered the professional experience and the investment capabilities of the individuals at Vident who are expected to serve as portfolio managers to the ETF.
Potential Economies of Scale
The Board also considered the effect of the ETF’s potential growth and size on its performance and expenses. The Board took into account management’s discussion of the ETF’s advisory fee structure. The Board considered the proposed advisory fees under the Westwood Advisory Agreement and possible economies of scale that might be realized if the assets of the ETF increase. The Board noted that the advisory fee schedule for the ETF currently did not have breakpoints, and considered Westwood’s assertion that adding breakpoints was not appropriate at this
25
| WESTWOOD SALIENT ENHANCED ENERGY INCOME ETF |
time. The Board noted that if the ETF’s assets increase over time, the ETF might realize other economies of scale if assets increase proportionally more than certain other expenses. The Board also considered the fact that, under the Westwood Advisory Agreement, the advisory fee payable to Westwood by the ETF would be reduced by the total sub-advisory fee paid to Vident.
Financial Condition of the Sub-Adviser and Sub-Adviser Profitability
Additionally, the Board took into consideration the financial condition and anticipated profitability of Vident and its affiliates and the anticipated direct and indirect benefits derived by Vident and its affiliates from their relationship with the ETF. The Board noted that the sub-advisory fee under the Vident Sub-Advisory Agreement would be paid by Westwood out of the advisory fee it would receive under the Westwood Advisory Agreement. As a consequence, the anticipated profitability to Vident of its relationship with the ETF was not a substantial factor in the Board’s deliberations.
Fall-Out Benefits
The Board also noted that Vident would derive benefits to its reputation and other benefits from its association with the ETF. The Board recognized that Vident should be entitled to earn a reasonable level of profits in exchange for the level of services it would provide to the ETF. Based upon its review, the Board concluded that Vident’s level of profitability, if any, to be derived from its relationship with the ETF was reasonable and not excessive.
In considering the approvals of the Westwood Advisory Agreement and the Vident Sub-Advisory Agreement, the Board, including the Independent Trustees, did not identify any single factor as controlling, and each Trustee may have attributed different weights to the various factors. The Trustees evaluated all information available to them. The Board concluded the following: (a) Westwood and Vident each demonstrated that they possess the capability and resources to perform the duties required of them under the advisory agreement and sub-advisory agreement, respectively; (b) Westwood and Vident maintain appropriate compliance programs; and (c) the ETF’s advisory fees are reasonable in light of the services to be provided and the other factors considered. Based on their conclusions, the Trustees determined with respect to the ETF that approval of the Westwood Advisory Agreement and the Vident Sub-Advisory Agreement is in the best interests of the ETF and its shareholders.
26
The Westwood Funds
P.O. Box 541150
Omaha, NE 68154
1-800-994-0755
www.westwoodetfs.com
Adviser:
Westwood Management Corp.
200 Crescent Court, Suite 1200
Dallas, TX 75201
Distributor:
Northern Lights Distributors, LLC
4221 North 203rd Street
Suite 100
Elkhorn, NE 68022
Administrator:
Ultimus Fund Solutions, LLC
225 Pictoria Drive
Suite 450
Cincinnati, OH 45246
Legal Counsel:
Sullivan & Worcester LLP
1666 K Streeet, NW
Suite 700
Washington, D.C. 20006
Independent Registered Public Accounting Firm:
Cohen & Company, Ltd.
1835 Market Street, Suite 310
Philadelphia, PA 19103
This information must be preceded or accompanied by a current
prospectus for the Fund.
(b) Included in (a)
| Item 8. | Changes in and Disagreements with Accountants for Open-End Management Investment Companies. |
Not applicable
| Item 9. | Proxy Disclosures for Open-End Management Investment Companies. |
Not applicable
| Item 10. | Remuneration Paid to Directors, Officers, and Others of Open-End Management Investment Companies. |
Included under Item 7
| Item 11. | Statement Regarding Basis for Approval of Investment Advisory Contract. |
Included under Item 7
| Item 12. | Disclosure of Proxy Voting Policies and Procedures for Closed-End Management Investment Companies. |
Not applicable
| Item 13. | Portfolio Managers of Closed-End Management Investment Companies. |
Not applicable
| Item 14. | Purchases of Equity Securities by Closed-End Management Investment Company and Affiliated Purchasers. |
Not applicable
| Item 15. | Submission of Matters to a Vote of Security Holders. |
There has been no material changes to the manner in which shareholders may recommend nominees to the Registrant’s Board of Trustees or the Nominations & Governance Committee (the “Committee”). The Registrant does not have formal procedures by which shareholders may recommend nominees to the Registrant’s Board of Trustees. While the Registrant does not have formal procedure, the Committee shall to the extent required under applicable law, when identifying potential candidates for the position of Independent Trustee, consider any such candidate recommended by a shareholder.
| Item 16. | Controls and Procedures. |
(a) Based on their evaluation of the registrant’s disclosure controls and procedures (as defined in Rule 30a-3(c) under the Investment Company Act of 1940) as of a date within 90 days of the filing date of this report, the registrant’s principal executive officer and principal financial officer have concluded that such disclosure controls and procedures are reasonably designed and are operating effectively to ensure that material information relating to the registrant, including its consolidated subsidiaries, is made known to them by others within those entities, particularly during the period in which this report is being prepared, and that the information required in filings on Form N-CSR is recorded, processed, summarized, and reported on a timely basis.
(b) There were no changes in the registrant’s internal control over financial reporting (as defined in Rule 30a-3(d) under the Investment Company Act of 1940) that occurred during the period covered by this report that have materially affected, or are reasonably likely to materially affect, the registrant’s internal control over financial reporting.
| Item 17. | Disclosure of Securities Lending Activities for Closed-End Management Investment Companies. |
Not applicable
| Item 18. | Recovery of Erroneously Awarded Compensation. |
(a) Not applicable
(b) Not applicable
| Item 19. | Exhibits. |
File the exhibits listed below as part of this Form. Letter or number the exhibits in the sequence indicated.
(a)(1) Any code of ethics, or amendment thereto, that is the subject of the disclosure required by Item 2, to the extent that the registrant intends to satisfy the Item 2 requirements through filing of an exhibit: Attached hereto
(a)(2) A separate certification for each principal executive officer and principal financial officer of the registrant as required by Rule 30a-2(a) under the Act (17 CFR 270.30a-2(a)): Attached hereto
(1) Not applicable
(2) Change in the registrant’s independent public accountant: Not applicable
(b) Certifications required by Rule 30a-2(b) under the Act (17 CFR 270.30a-2(b)): Attached hereto
| Exhibit 99.CODE ETH | Code of Ethics |
| Exhibit 99.CERT | Certifications required by Rule 30a-2(a) under the Act |
| Exhibit 99.906CERT | Certifications required by Rule 30a-2(b) under the Act |
SIGNATURES
Pursuant to the requirements of the Securities Exchange Act of 1934 and the Investment Company Act of 1940, the registrant has duly caused this report to be signed on its behalf by the undersigned, thereunto duly authorized.
| (Registrant) | Ultimus Managers Trust | |||
| By (Signature and Title)* | /s/ Todd E. Heim | |||
| Todd E. Heim, President and Principal Executive Officer | ||||
| Date | January 10, 2025 | |||
| Pursuant to the requirements of the Securities Exchange Act of 1934 and the Investment Company Act of 1940, this report has been signed below by the following persons on behalf of the registrant and in the capacities and on the dates indicated. | ||||
| By (Signature and Title)* | /s/ Todd E. Heim | |||
| Todd E. Heim, President and Principal Executive Officer | ||||
| Date | January 10, 2025 | |||
| By (Signature and Title)* | /s/ Daniel D. Bauer | |||
| Daniel D. Bauer, Treasurer and Principal Financial Officer | ||||
| Date | January 10, 2025 | |||
| * | Print the name and title of each signing officer under his or her signature. |