UNITED STATES
SECURITIES AND EXCHANGE COMMISSION
Washington, D.C. 20549
FORM N-CSR
CERTIFIED SHAREHOLDER REPORT OF REGISTERED
MANAGEMENT INVESTMENT COMPANIES
| Investment Company Act file number | 811-22680 | |
| Ultimus Managers Trust |
| (Exact name of registrant as specified in charter) |
| 225 Pictoria Drive, Suite 450 Cincinnati, Ohio | | 45246 |
| (Address of principal executive offices) | | (Zip code) |
Karen Jacoppo-Wood
| Ultimus Fund Solutions, LLC 225 Pictoria Drive, Suite 450 Cincinnati, Ohio 45246 |
| (Name and address of agent for service) |
| Registrant’s telephone number, including area code: | (513) 587-3400 | |
| Date of fiscal year end: | November 30 | |
| | | |
| Date of reporting period: | November 30, 2024 | |
Form N-CSR is to be used by management investment companies to file reports with the Commission not later than 10 days after the transmission to stockholders of any report that is required to be transmitted to stockholders under Rule 30e-1 under the Investment Company Act of 1940 (17 CFR 270.30e-1). The Commission may use the information provided on Form N-CSR in its regulatory, disclosure review, inspection, and policymaking roles.
A registrant is required to disclose the information specified by Form N-CSR, and the Commission will make this information public. A registrant is not required to respond to the collection of information contained in Form N-CSR unless the Form displays a currently valid Office of Management and Budget (“OMB”) control number. Please direct comments concerning the accuracy of the information collection burden estimate and any suggestions for reducing the burden to Secretary, Securities and Exchange Commission, 450 Fifth Street, NW, Washington, DC 20549-0609. The OMB has reviewed this collection of information under the clearance requirements of 44 U.S.C. § 3507.
| Item 1. | Reports to Stockholders. |
Lyrical U.S. Value Equity Fund
Institutional Class (LYRIX)
Annual Shareholder Report - November 30, 2024
This annual shareholder report contains important information about Lyrical U.S. Value Equity Fund for the period of December 1, 2023 to November 30, 2024. You can find additional information about the Fund at www.lyricalvaluefunds.com. You can also request this information by contacting us at (888) 884-8099.
What were the Fund’s costs for the last year?
(based on a hypothetical $10,000 investment)
| Class Name | Costs of a $10,000 investment | Costs paid as a percentage of a $10,000 investment |
|---|
| Institutional Class | $116 | 0.99% |
|---|
How did the Fund perform during the reporting period?
The Fund performed well during the reporting period with above average absolute returns. Our returns nearly matched those of the S&P 500 Index, which was no easy task given how much of the index returns were driven by mega cap growth stocks. In fact, mega cap growth stocks had such a large impact on the S&P 500 return, it outperformed the S&P 500 Equal Weight Index by over five percentage points.
For the reporting period, the three positions that most positively impacted performance were: United Rentals, Inc. (URI) up 84%, NRG Energy, Inc. (NRG) up 117%, and Ameriprise Financial, Inc. (AMP) up 65%. On the other side, the three positions that most negatively impacted performance were: Celanese Cprporation (CE) down 46%, Concentrix Corporation (CNXC) down 51%, and Centene Corporation (CNC) down 19%.
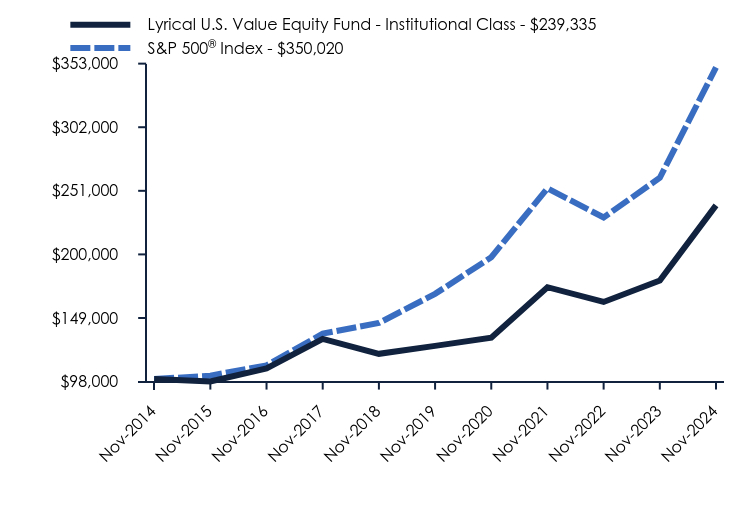
How has the Fund performed over the last 10 years?
Total Return Based on $100,000 Investment
| Lyrical U.S. Value Equity Fund - Institutional Class | S&P 500® Index |
|---|
| Nov-2014 | $100,000 | $100,000 |
|---|
| Nov-2015 | $98,091 | $102,749 |
|---|
| Nov-2016 | $108,617 | $111,029 |
|---|
| Nov-2017 | $132,184 | $136,425 |
|---|
| Nov-2018 | $120,256 | $144,985 |
|---|
| Nov-2019 | $126,634 | $168,342 |
|---|
| Nov-2020 | $133,167 | $197,728 |
|---|
| Nov-2021 | $173,701 | $252,935 |
|---|
| Nov-2022 | $161,873 | $229,640 |
|---|
| Nov-2023 | $179,100 | $261,422 |
|---|
| Nov-2024 | $239,335 | $350,020 |
|---|
Average Annual Total Returns
| 1 Year | 5 Years | 10 Years |
|---|
| Lyrical U.S. Value Equity Fund - Institutional Class | 33.63% | 13.58% | 9.12% |
|---|
S&P 500® Index | 33.89% | 15.77% | 13.35% |
|---|
Past performance is not necessarily indicative of future results. The graph and table do not reflect the deduction of taxes that a shareholder would pay on fund distributions or redemption of fund shares.
- Net Assets$1,158,869,606
- Number of Portfolio Holdings34
- Advisory Fee (net of waivers)$6,346,976
- Portfolio Turnover13%
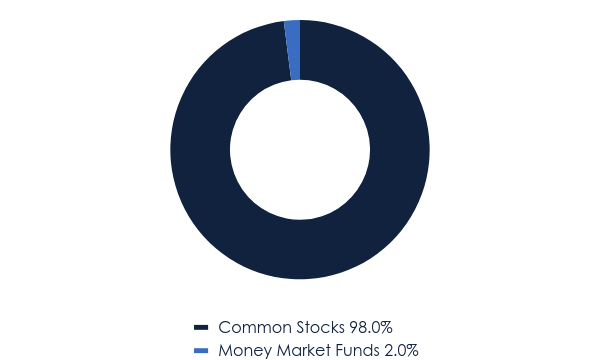
Asset Weighting (% of total investments)
| Value | Value |
|---|
| Common Stocks | 98.0% |
| Money Market Funds | 2.0% |
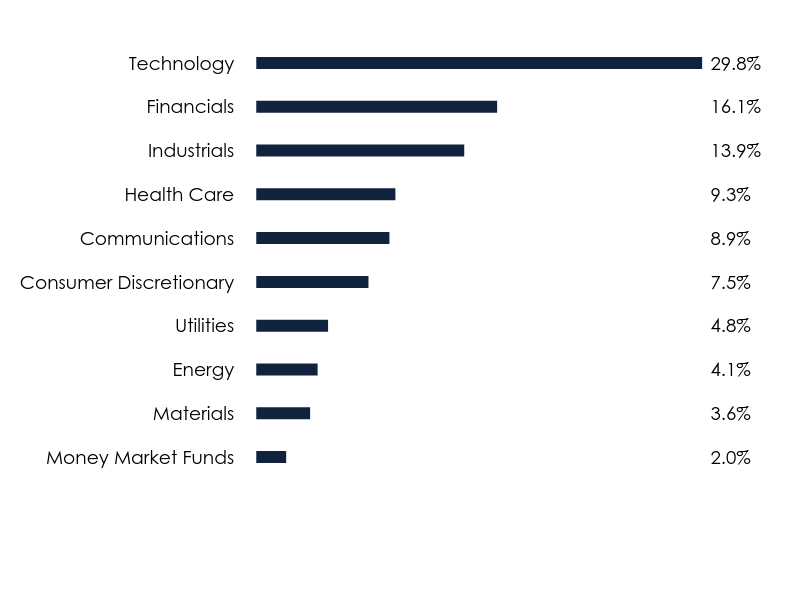
What did the Fund invest in?
Sector Weighting (% of net assets)
| Value | Value |
|---|
| Money Market Funds | 2.0% |
| Materials | 3.6% |
| Energy | 4.1% |
| Utilities | 4.8% |
| Consumer Discretionary | 7.5% |
| Communications | 8.9% |
| Health Care | 9.3% |
| Industrials | 13.9% |
| Financials | 16.1% |
| Technology | 29.8% |
Top 10 Holdings (% of net assets)
| Holding Name | % of Net Assets |
| United Rentals, Inc. | 7.2% |
| Corpay, Inc. | 5.3% |
| Fidelity National Information Services, Inc. | 5.2% |
| Ameriprise Financial, Inc. | 4.9% |
| NRG Energy, Inc. | 4.8% |
| Expedia Group, Inc. | 4.7% |
| Johnson Controls International plc | 4.6% |
| Uber Technologies, Inc. | 4.2% |
| Suncor Energy, Inc. | 4.1% |
| eBay, Inc. | 3.9% |
No material changes occurred during the year ended November 30, 2024.
Lyrical U.S. Value Equity Fund - Institutional Class (LYRIX)
Annual Shareholder Report - November 30, 2024
Where can I find additional information about the Fund?
Additional information is available on the Fund's website (www.lyricalvaluefunds.com), including its:
Prospectus
Financial information
Holdings
Proxy voting information
Lyrical U.S. Value Equity Fund
Annual Shareholder Report - November 30, 2024
This annual shareholder report contains important information about Lyrical U.S. Value Equity Fund for the period of December 1, 2023 to November 30, 2024. You can find additional information about the Fund at www.lyricalvaluefunds.com. You can also request this information by contacting us at (888) 884-8099.
What were the Fund’s costs for the last year?
(based on a hypothetical $10,000 investment)
| Class Name | Costs of a $10,000 investment | Costs paid as a percentage of a $10,000 investment |
|---|
| Investor Class | $145 | 1.24% |
|---|
How did the Fund perform during the reporting period?
The Fund performed well during the reporting period with above average absolute returns. Our returns nearly matched those of the S&P 500 Index, which was no easy task given how much of the index returns were driven by mega cap growth stocks. In fact, mega cap growth stocks had such a large impact on the S&P 500 return, it outperformed the S&P 500 Equal Weight Index by over five percentage points.
For the reporting period, the three positions that most positively impacted performance were: United Rentals, Inc. (URI) up 84%, NRG Energy, Inc. (NRG) up 117%, and Ameriprise Financial, Inc. (AMP) up 65%. On the other side, the three positions that most negatively impacted performance were: Celanese Cprporation (CE) down 46%, Concentrix Corporation (CNXC) down 51%, and Centene Corporation (CNC) down 19%.
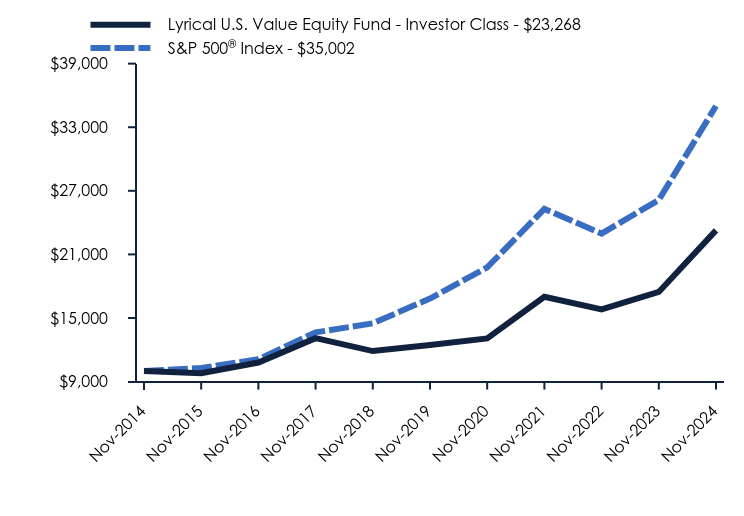
How has the Fund performed over the last 10 years?
Total Return Based on $10,000 Investment
| Lyrical U.S. Value Equity Fund - Investor Class | S&P 500® Index |
|---|
| Nov-2014 | $10,000 | $10,000 |
|---|
| Nov-2015 | $9,781 | $10,275 |
|---|
| Nov-2016 | $10,794 | $11,103 |
|---|
| Nov-2017 | $13,095 | $13,642 |
|---|
| Nov-2018 | $11,878 | $14,498 |
|---|
| Nov-2019 | $12,458 | $16,834 |
|---|
| Nov-2020 | $13,074 | $19,773 |
|---|
| Nov-2021 | $17,008 | $25,294 |
|---|
| Nov-2022 | $15,813 | $22,964 |
|---|
| Nov-2023 | $17,455 | $26,142 |
|---|
| Nov-2024 | $23,268 | $35,002 |
|---|
Average Annual Total Returns
| 1 Year | 5 Years | 10 Years |
|---|
| Lyrical U.S. Value Equity Fund - Investor Class | 33.30% | 13.31% | 8.81% |
|---|
S&P 500® Index | 33.89% | 15.77% | 13.35% |
|---|
Past performance is not necessarily indicative of future results. The graph and table do not reflect the deduction of taxes that a shareholder would pay on fund distributions or redemption of fund shares.
- Net Assets$1,158,869,606
- Number of Portfolio Holdings34
- Advisory Fee (net of waivers)$6,346,976
- Portfolio Turnover13%
Asset Weighting (% of total investments)
| Value | Value |
|---|
| Common Stocks | 98.0% |
| Money Market Funds | 2.0% |
What did the Fund invest in?
Sector Weighting (% of net assets)
| Value | Value |
|---|
| Money Market Funds | 2.0% |
| Materials | 3.6% |
| Energy | 4.1% |
| Utilities | 4.8% |
| Consumer Discretionary | 7.5% |
| Communications | 8.9% |
| Health Care | 9.3% |
| Industrials | 13.9% |
| Financials | 16.1% |
| Technology | 29.8% |
Top 10 Holdings (% of net assets)
| Holding Name | % of Net Assets |
| United Rentals, Inc. | 7.2% |
| Corpay, Inc. | 5.3% |
| Fidelity National Information Services, Inc. | 5.2% |
| Ameriprise Financial, Inc. | 4.9% |
| NRG Energy, Inc. | 4.8% |
| Expedia Group, Inc. | 4.7% |
| Johnson Controls International plc | 4.6% |
| Uber Technologies, Inc. | 4.2% |
| Suncor Energy, Inc. | 4.1% |
| eBay, Inc. | 3.9% |
No material changes occurred during the year ended November 30, 2024.
Lyrical U.S. Value Equity Fund - Investor Class (LYRBX)
Annual Shareholder Report - November 30, 2024
Where can I find additional information about the Fund?
Additional information is available on the Fund's website (www.lyricalvaluefunds.com), including its:
Prospectus
Financial information
Holdings
Proxy voting information
Lyrical U.S. Value Equity Fund
Annual Shareholder Report - November 30, 2024
This annual shareholder report contains important information about Lyrical U.S. Value Equity Fund for the period of December 1, 2023 to November 30, 2024. You can find additional information about the Fund at www.lyricalvaluefunds.com. You can also request this information by contacting us at (888) 884-8099.
What were the Fund’s costs for the last year?
(based on a hypothetical $10,000 investment)
| Class Name | Costs of a $10,000 investment | Costs paid as a percentage of a $10,000 investment |
|---|
| A Class | $145 | 1.24% |
|---|
How did the Fund perform during the reporting period?
The Fund performed well during the reporting period with above average absolute returns. Our returns nearly matched those of the S&P 500 Index, which was no easy task given how much of the index returns were driven by mega cap growth stocks. In fact, mega cap growth stocks had such a large impact on the S&P 500 return, it outperformed the S&P 500 Equal Weight Index by over five percentage points.
For the reporting period, the three positions that most positively impacted performance were: United Rentals, Inc. (URI) up 84%, NRG Energy, Inc. (NRG) up 117%, and Ameriprise Financial, Inc. (AMP) up 65%. On the other side, the three positions that most negatively impacted performance were: Celanese Cprporation (CE) down 46%, Concentrix Corporation (CNXC) down 51%, and Centene Corporation (CNC) down 19%.
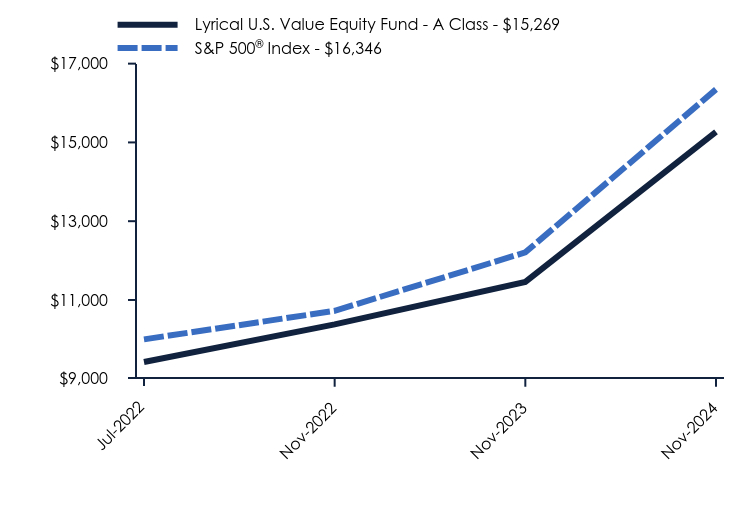
How has the Fund performed since inception?
Total Return Based on $10,000 Investment*
| Lyrical U.S. Value Equity Fund - A Class | S&P 500® Index |
|---|
| Jul-2022 | $9,426 | $10,000 |
|---|
| Nov-2022 | $10,380 | $10,724 |
|---|
| Nov-2023 | $11,457 | $12,208 |
|---|
| Nov-2024 | $15,269 | $16,346 |
|---|
Average Annual Total Returns
| 1 Year | Since Inception (July 5, 2022) |
|---|
| Lyrical U.S. Value Equity Fund - A Class | | |
|---|
| Without Load | 33.27% | 22.20% |
|---|
| With Load* | 25.63% | 19.24% |
|---|
S&P 500® Index | 33.89% | 22.66% |
|---|
Past performance is not necessarily indicative of future results. The graph and table do not reflect the deduction of taxes that a shareholder would pay on fund distributions or redemption of fund shares.
* Reflects the maximum sales charge applicable to A Class.
- Net Assets$1,158,869,606
- Number of Portfolio Holdings34
- Advisory Fee (net of waivers)$6,346,976
- Portfolio Turnover13%
Asset Weighting (% of total investments)
| Value | Value |
|---|
| Common Stocks | 98.0% |
| Money Market Funds | 2.0% |
What did the Fund invest in?
Sector Weighting (% of net assets)
| Value | Value |
|---|
| Money Market Funds | 2.0% |
| Materials | 3.6% |
| Energy | 4.1% |
| Utilities | 4.8% |
| Consumer Discretionary | 7.5% |
| Communications | 8.9% |
| Health Care | 9.3% |
| Industrials | 13.9% |
| Financials | 16.1% |
| Technology | 29.8% |
Top 10 Holdings (% of net assets)
| Holding Name | % of Net Assets |
| United Rentals, Inc. | 7.2% |
| Corpay, Inc. | 5.3% |
| Fidelity National Information Services, Inc. | 5.2% |
| Ameriprise Financial, Inc. | 4.9% |
| NRG Energy, Inc. | 4.8% |
| Expedia Group, Inc. | 4.7% |
| Johnson Controls International plc | 4.6% |
| Uber Technologies, Inc. | 4.2% |
| Suncor Energy, Inc. | 4.1% |
| eBay, Inc. | 3.9% |
No material changes occurred during the year ended November 30, 2024.
Lyrical U.S. Value Equity Fund - A Class (LYRAX)
Annual Shareholder Report - November 30, 2024
Where can I find additional information about the Fund?
Additional information is available on the Fund's website (www.lyricalvaluefunds.com), including its:
Prospectus
Financial information
Holdings
Proxy voting information
Lyrical U.S. Value Equity Fund
Annual Shareholder Report - November 30, 2024
This annual shareholder report contains important information about Lyrical U.S. Value Equity Fund for the period of December 1, 2023 to November 30, 2024. You can find additional information about the Fund at www.lyricalvaluefunds.com. You can also request this information by contacting us at (888) 884-8099.
What were the Fund’s costs for the last year?
(based on a hypothetical $10,000 investment)
| Class Name | Costs of a $10,000 investment | Costs paid as a percentage of a $10,000 investment |
|---|
| C Class | $231 | 1.99% |
|---|
How did the Fund perform during the reporting period?
The Fund performed well during the reporting period with above average absolute returns. Our returns nearly matched those of the S&P 500 Index, which was no easy task given how much of the index returns were driven by mega cap growth stocks. In fact, mega cap growth stocks had such a large impact on the S&P 500 return, it outperformed the S&P 500 Equal Weight Index by over five percentage points.
For the reporting period, the three positions that most positively impacted performance were: United Rentals, Inc. (URI) up 84%, NRG Energy, Inc. (NRG) up 117%, and Ameriprise Financial, Inc. (AMP) up 65%. On the other side, the three positions that most negatively impacted performance were: Celanese Cprporation (CE) down 46%, Concentrix Corporation (CNXC) down 51%, and Centene Corporation (CNC) down 19%.
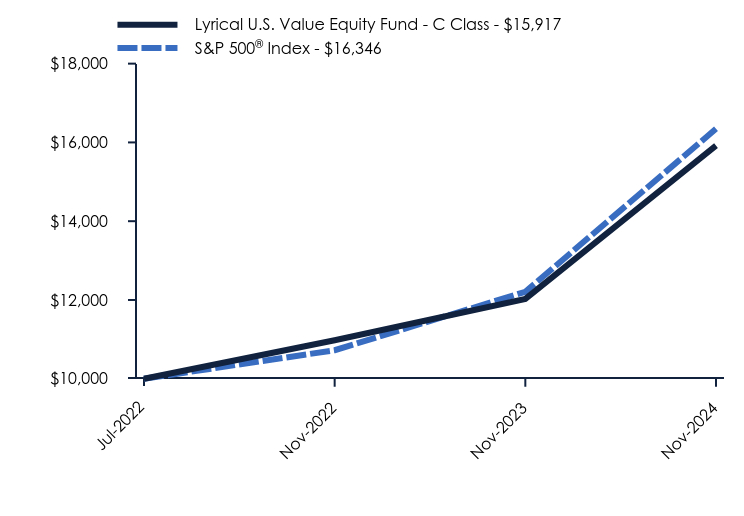
How has the Fund performed since inception?
Total Return Based on $10,000 Investment
| Lyrical U.S. Value Equity Fund - C Class | S&P 500® Index |
|---|
| Jul-2022 | $10,000 | $10,000 |
|---|
| Nov-2022 | $10,979 | $10,724 |
|---|
| Nov-2023 | $12,028 | $12,208 |
|---|
| Nov-2024 | $15,917 | $16,346 |
|---|
Average Annual Total Returns
| 1 Year | Since Inception (July 5, 2022) |
|---|
| Lyrical U.S. Value Equity Fund - C Class | | |
|---|
| Without CDSC | 32.33% | 21.32% |
|---|
| With CDSC | 31.33% | 21.32% |
|---|
S&P 500® Index | 33.89% | 22.66% |
|---|
Past performance is not necessarily indicative of future results. The graph and table do not reflect the deduction of taxes that a shareholder would pay on fund distributions or redemption of fund shares.
- Net Assets$1,158,869,606
- Number of Portfolio Holdings34
- Advisory Fee (net of waivers)$6,346,976
- Portfolio Turnover13%
Asset Weighting (% of total investments)
| Value | Value |
|---|
| Common Stocks | 98.0% |
| Money Market Funds | 2.0% |
What did the Fund invest in?
Sector Weighting (% of net assets)
| Value | Value |
|---|
| Money Market Funds | 2.0% |
| Materials | 3.6% |
| Energy | 4.1% |
| Utilities | 4.8% |
| Consumer Discretionary | 7.5% |
| Communications | 8.9% |
| Health Care | 9.3% |
| Industrials | 13.9% |
| Financials | 16.1% |
| Technology | 29.8% |
Top 10 Holdings (% of net assets)
| Holding Name | % of Net Assets |
| United Rentals, Inc. | 7.2% |
| Corpay, Inc. | 5.3% |
| Fidelity National Information Services, Inc. | 5.2% |
| Ameriprise Financial, Inc. | 4.9% |
| NRG Energy, Inc. | 4.8% |
| Expedia Group, Inc. | 4.7% |
| Johnson Controls International plc | 4.6% |
| Uber Technologies, Inc. | 4.2% |
| Suncor Energy, Inc. | 4.1% |
| eBay, Inc. | 3.9% |
No material changes occurred during the year ended November 30, 2024.
Lyrical U.S. Value Equity Fund - C Class (LYRCX)
Annual Shareholder Report - November 30, 2024
Where can I find additional information about the Fund?
Additional information is available on the Fund's website (www.lyricalvaluefunds.com), including its:
Prospectus
Financial information
Holdings
Proxy voting information
Lyrical International Value Equity Fund
Institutional Class (LYRWX)
Annual Shareholder Report - November 30, 2024
This annual shareholder report contains important information about Lyrical International Value Equity Fund for the period of December 1, 2023 to November 30, 2024. You can find additional information about the Fund at www.lyricalvaluefunds.com. You can also request this information by contacting us at (888) 884-8099.
What were the Fund’s costs for the last year?
(based on a hypothetical $10,000 investment)
| Class Name | Costs of a $10,000 investment | Costs paid as a percentage of a $10,000 investment |
|---|
| Institutional Class | $104 | 0.99% |
|---|
How did the Fund perform during the reporting period?
The Fund was up during the reporting period, driven by a combination of multiple expansion and earnings growth. The MSCI EAFE Index was up 11.9% during the period and the MSCI EAFE Equal-Weighted Index was up 10.8%.
For the reporting period, the three positions that most positively impacted performance were: AerCap Holdings N.V. (AER-US) up 47%, Euronext N.V. (ENX-FR) up 38%, and Ashtead Group plc (AHT-LON) up 35%. On the other side, the three positions that most negatively impacted performance were: Samsung Electronics Company Ltd. (SMSN-LON) down 28%, Teleperformance SE (TEP-FR) down 30%, and Open Text Corporation (OTEX-CA) down 24%.
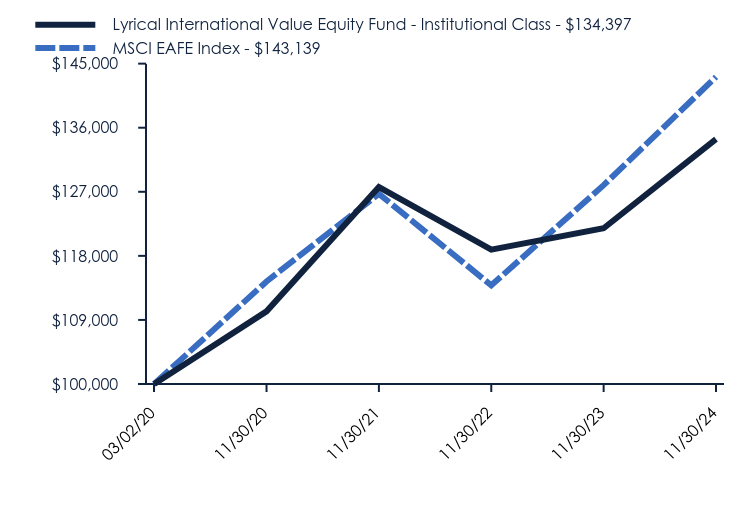
How has the Fund performed since inception?
Total Return Based on $100,000 Investment
| Lyrical International Value Equity Fund - Institutional Class | MSCI EAFE Index |
|---|
| 03/02/20 | $100,000 | $100,000 |
|---|
| 11/30/20 | $110,200 | $114,397 |
|---|
| 11/30/21 | $127,659 | $126,712 |
|---|
| 11/30/22 | $118,872 | $113,859 |
|---|
| 11/30/23 | $121,872 | $127,935 |
|---|
| 11/30/24 | $134,397 | $143,139 |
|---|
Average Annual Total Returns
| 1 Year | Since Inception (March 2, 2020) |
|---|
| Lyrical International Value Equity Fund - Institutional Class | 10.28% | 6.42% |
|---|
| MSCI EAFE Index | 11.88% | 7.85% |
|---|
Past performance is not necessarily indicative of future results. The graph and table do not reflect the deduction of taxes that a shareholder would pay on fund distributions or redemption of fund shares.
What did the Fund invest in?
Sector Weighting (% of net assets)
| Value | Value |
|---|
| Other Assets in Excess of Liabilities | 0.1% |
| Money Market Funds | 0.9% |
| Materials | 2.1% |
| Consumer Staples | 3.7% |
| Communications | 4.5% |
| Consumer Discretionary | 9.6% |
| Energy | 12.2% |
| Financials | 17.4% |
| Technology | 18.9% |
| Industrials | 30.6% |
- Net Assets$12,678,854
- Number of Portfolio Holdings30
- Advisory Fee (net of waivers)$0
- Portfolio Turnover31%
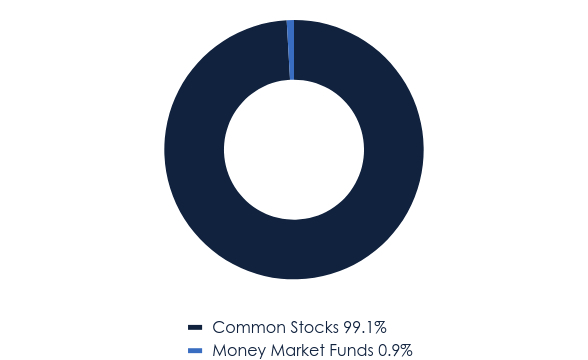
Asset Weighting (% of total investments)
| Value | Value |
|---|
| Common Stocks | 99.1% |
| Money Market Funds | 0.9% |
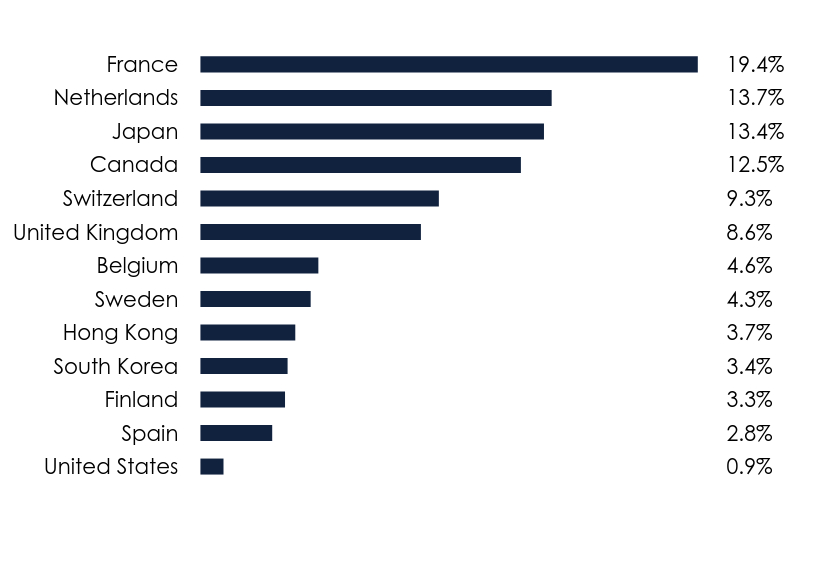
Country Weighting (% of net assets)
| Value | Value |
|---|
| United States | 0.9% |
| Spain | 2.8% |
| Finland | 3.3% |
| South Korea | 3.4% |
| Hong Kong | 3.7% |
| Sweden | 4.3% |
| Belgium | 4.6% |
| United Kingdom | 8.6% |
| Switzerland | 9.3% |
| Canada | 12.5% |
| Japan | 13.4% |
| Netherlands | 13.7% |
| France | 19.4% |
Top 10 Holdings (% of net assets)
| Holding Name | % of Net Assets |
| AerCap Holdings N.V. | 5.3% |
| Suncor Energy, Inc. | 5.2% |
| Ashtead Group plc | 5.1% |
| Nintendo Company Ltd. - ADR | 5.0% |
| Euronext N.V. | 4.8% |
| Johnson Controls International plc | 4.8% |
| Sony Group Corporation | 4.8% |
| D'ieteren Group | 4.6% |
| Bollore SE | 4.5% |
| Julius Baer Group Ltd. | 4.5% |
No material changes occurred during the year ended November 30, 2024.
Where can I find additional information about the Fund?
Additional information is available on the Fund's website (www.lyricalvaluefunds.com), including its:
Prospectus
Financial information
Holdings
Proxy voting information
Lyrical International Value Equity Fund - Institutional Class (LYRWX)
Annual Shareholder Report - November 30, 2024
Lyrical International Value Equity Fund
Annual Shareholder Report - November 30, 2024
This annual shareholder report contains important information about Lyrical International Value Equity Fund for the period of December 1, 2023 to November 30, 2024. You can find additional information about the Fund at www.lyricalvaluefunds.com. You can also request this information by contacting us at (888) 884-8099.
What were the Fund’s costs for the last year?
(based on a hypothetical $10,000 investment)
| Class Name | Costs of a $10,000 investment | Costs paid as a percentage of a $10,000 investment |
|---|
| Investor Class | $130 | 1.24% |
|---|
How did the Fund perform during the reporting period?
The Fund was up during the reporting period, driven by a combination of multiple expansion and earnings growth. The MSCI EAFE Index was up 11.9% during the period and the MSCI EAFE Equal-Weighted Index was up 10.8%.
For the reporting period, the three positions that most positively impacted performance were: AerCap Holdings N.V. (AER-US) up 47%, Euronext N.V. (ENX-FR) up 38%, and Ashtead Group plc (AHT-LON) up 35%. On the other side, the three positions that most negatively impacted performance were: Samsung Electronics Company Ltd. (SMSN-LON) down 28%, Teleperformance SE (TEP-FR) down 30%, and Open Text Corporation (OTEX-CA) down 24%.
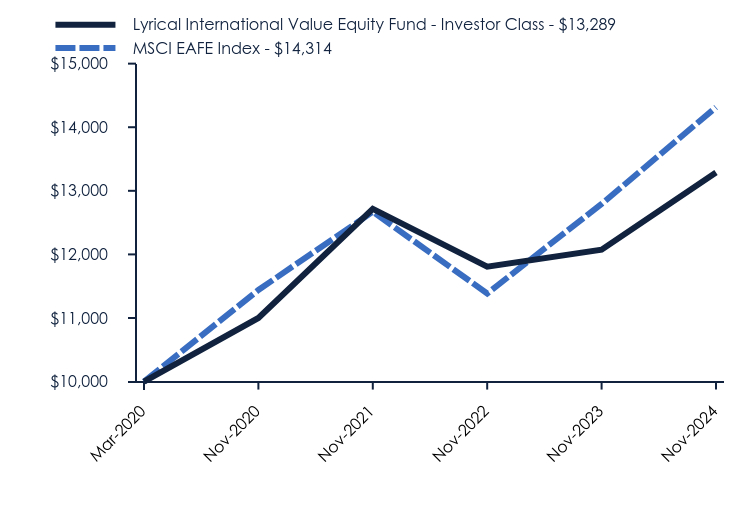
How has the Fund performed since inception?
Total Return Based on $10,000 Investment
| Lyrical International Value Equity Fund - Investor Class | MSCI EAFE Index |
|---|
| Mar-2020 | $10,000 | $10,000 |
|---|
| Nov-2020 | $11,000 | $11,440 |
|---|
| Nov-2021 | $12,715 | $12,671 |
|---|
| Nov-2022 | $11,806 | $11,386 |
|---|
| Nov-2023 | $12,075 | $12,794 |
|---|
| Nov-2024 | $13,289 | $14,314 |
|---|
Average Annual Total Returns
| 1 Year | Since Inception (March 2, 2020) |
|---|
| Lyrical International Value Equity Fund - Investor Class | 10.06% | 6.17% |
|---|
| MSCI EAFE Index | 11.88% | 7.85% |
|---|
Past performance is not necessarily indicative of future results. The graph and table do not reflect the deduction of taxes that a shareholder would pay on fund distributions or redemption of fund shares.
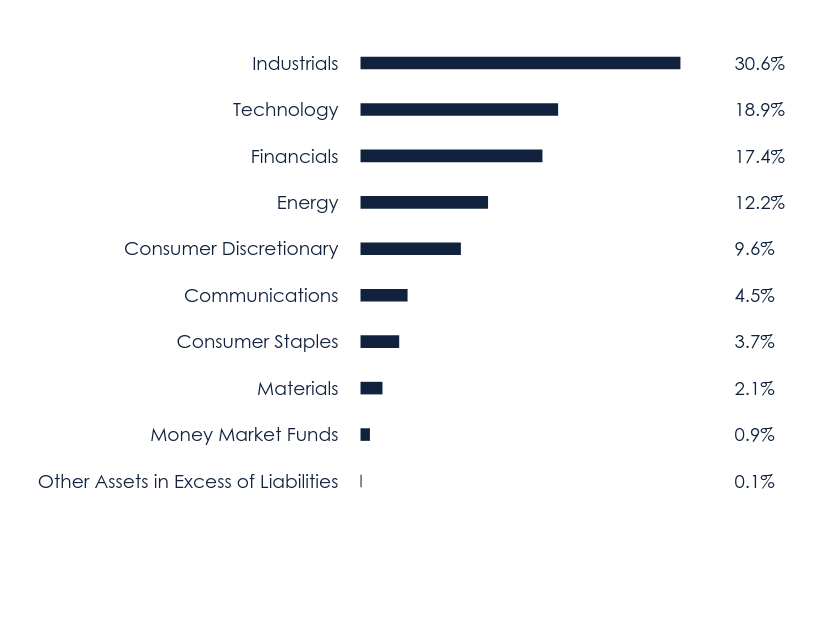
What did the Fund invest in?
Sector Weighting (% of net assets)
| Value | Value |
|---|
| Other Assets in Excess of Liabilities | 0.1% |
| Money Market Funds | 0.9% |
| Materials | 2.1% |
| Consumer Staples | 3.7% |
| Communications | 4.5% |
| Consumer Discretionary | 9.6% |
| Energy | 12.2% |
| Financials | 17.4% |
| Technology | 18.9% |
| Industrials | 30.6% |
- Net Assets$12,678,854
- Number of Portfolio Holdings30
- Advisory Fee (net of waivers)$0
- Portfolio Turnover31%
Asset Weighting (% of total investments)
| Value | Value |
|---|
| Common Stocks | 99.1% |
| Money Market Funds | 0.9% |
Country Weighting (% of net assets)
| Value | Value |
|---|
| United States | 0.9% |
| Spain | 2.8% |
| Finland | 3.3% |
| South Korea | 3.4% |
| Hong Kong | 3.7% |
| Sweden | 4.3% |
| Belgium | 4.6% |
| United Kingdom | 8.6% |
| Switzerland | 9.3% |
| Canada | 12.5% |
| Japan | 13.4% |
| Netherlands | 13.7% |
| France | 19.4% |
Top 10 Holdings (% of net assets)
| Holding Name | % of Net Assets |
| AerCap Holdings N.V. | 5.3% |
| Suncor Energy, Inc. | 5.2% |
| Ashtead Group plc | 5.1% |
| Nintendo Company Ltd. - ADR | 5.0% |
| Euronext N.V. | 4.8% |
| Johnson Controls International plc | 4.8% |
| Sony Group Corporation | 4.8% |
| D'ieteren Group | 4.6% |
| Bollore SE | 4.5% |
| Julius Baer Group Ltd. | 4.5% |
No material changes occurred during the year ended November 30, 2024.
Where can I find additional information about the Fund?
Additional information is available on the Fund's website (www.lyricalvaluefunds.com), including its:
Prospectus
Financial information
Holdings
Proxy voting information
Lyrical International Value Equity Fund - Investor Class (LYRNX)
Annual Shareholder Report - November 30, 2024
Lyrical International Value Equity Fund
Annual Shareholder Report - November 30, 2024
This annual shareholder report contains important information about Lyrical International Value Equity Fund for the period of December 1, 2023 to November 30, 2024. You can find additional information about the Fund at www.lyricalvaluefunds.com. You can also request this information by contacting us at (888) 884-8099.
What were the Fund’s costs for the last year?
(based on a hypothetical $10,000 investment)
| Class Name | Costs of a $10,000 investment | Costs paid as a percentage of a $10,000 investment |
|---|
| A Class | $130 | 1.24% |
|---|
How did the Fund perform during the reporting period?
The Fund was up during the reporting period, driven by a combination of multiple expansion and earnings growth. The MSCI EAFE Index was up 11.9% during the period and the MSCI EAFE Equal-Weighted Index was up 10.8%.
For the reporting period, the three positions that most positively impacted performance were: AerCap Holdings N.V. (AER-US) up 47%, Euronext N.V. (ENX-FR) up 38%, and Ashtead Group plc (AHT-LON) up 35%. On the other side, the three positions that most negatively impacted performance were: Samsung Electronics Company Ltd. (SMSN-LON) down 28%, Teleperformance SE (TEP-FR) down 30%, and Open Text Corporation (OTEX-CA) down 24%.
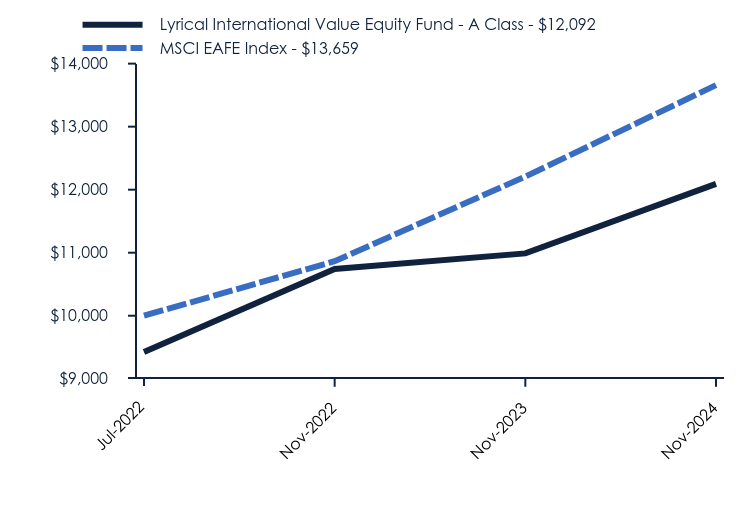
How has the Fund performed since inception?
Total Return Based on $10,000 Investment*
| Lyrical International Value Equity Fund - A Class | MSCI EAFE Index |
|---|
| Jul-2022 | $9,424 | $10,000 |
|---|
| Nov-2022 | $10,741 | $10,865 |
|---|
| Nov-2023 | $10,989 | $12,208 |
|---|
| Nov-2024 | $12,092 | $13,659 |
|---|
Average Annual Total Returns
| 1 Year | Since Inception (July 5, 2022) |
|---|
| Lyrical International Value Equity Fund - A Class | | |
|---|
| Without Load | 10.03% | 10.92% |
|---|
| With Load* | 3.69% | 8.22% |
|---|
| MSCI EAFE Index | 11.88% | 13.84% |
|---|
Past performance is not necessarily indicative of future results. The graph and table do not reflect the deduction of taxes that a shareholder would pay on fund distributions or redemption of fund shares.
* Reflects the maximum sales charge applicable to A Class.
What did the Fund invest in?
Sector Weighting (% of net assets)
| Value | Value |
|---|
| Other Assets in Excess of Liabilities | 0.1% |
| Money Market Funds | 0.9% |
| Materials | 2.1% |
| Consumer Staples | 3.7% |
| Communications | 4.5% |
| Consumer Discretionary | 9.6% |
| Energy | 12.2% |
| Financials | 17.4% |
| Technology | 18.9% |
| Industrials | 30.6% |
- Net Assets$12,678,854
- Number of Portfolio Holdings30
- Advisory Fee (net of waivers)$0
- Portfolio Turnover31%
Asset Weighting (% of total investments)
| Value | Value |
|---|
| Common Stocks | 99.1% |
| Money Market Funds | 0.9% |
Country Weighting (% of net assets)
| Value | Value |
|---|
| United States | 0.9% |
| Spain | 2.8% |
| Finland | 3.3% |
| South Korea | 3.4% |
| Hong Kong | 3.7% |
| Sweden | 4.3% |
| Belgium | 4.6% |
| United Kingdom | 8.6% |
| Switzerland | 9.3% |
| Canada | 12.5% |
| Japan | 13.4% |
| Netherlands | 13.7% |
| France | 19.4% |
Top 10 Holdings (% of net assets)
| Holding Name | % of Net Assets |
| AerCap Holdings N.V. | 5.3% |
| Suncor Energy, Inc. | 5.2% |
| Ashtead Group plc | 5.1% |
| Nintendo Company Ltd. - ADR | 5.0% |
| Euronext N.V. | 4.8% |
| Johnson Controls International plc | 4.8% |
| Sony Group Corporation | 4.8% |
| D'ieteren Group | 4.6% |
| Bollore SE | 4.5% |
| Julius Baer Group Ltd. | 4.5% |
No material changes occurred during the year ended November 30, 2024.
Where can I find additional information about the Fund?
Additional information is available on the Fund's website (www.lyricalvaluefunds.com), including its:
Prospectus
Financial information
Holdings
Proxy voting information
Lyrical International Value Equity Fund - A Class (LYRVX)
Annual Shareholder Report - November 30, 2024
Lyrical International Value Equity Fund
Annual Shareholder Report - November 30, 2024
This annual shareholder report contains important information about Lyrical International Value Equity Fund for the period of December 1, 2023 to November 30, 2024. You can find additional information about the Fund at www.lyricalvaluefunds.com. You can also request this information by contacting us at (888) 884-8099.
What were the Fund’s costs for the last year?
(based on a hypothetical $10,000 investment)
| Class Name | Costs of a $10,000 investment | Costs paid as a percentage of a $10,000 investment |
|---|
| C Class | $208 | 1.99% |
|---|
How did the Fund perform during the reporting period?
The Fund was up during the reporting period, driven by a combination of multiple expansion and earnings growth. The MSCI EAFE Index was up 11.9% during the period and the MSCI EAFE Equal-Weighted Index was up 10.8%.
For the reporting period, the three positions that most positively impacted performance were: AerCap Holdings N.V. (AER-US) up 47%, Euronext N.V. (ENX-FR) up 38%, and Ashtead Group plc (AHT-LON) up 35%. On the other side, the three positions that most negatively impacted performance were: Samsung Electronics Company Ltd. (SMSN-LON) down 28%, Teleperformance SE (TEP-FR) down 30%, and Open Text Corporation (OTEX-CA) down 24%.
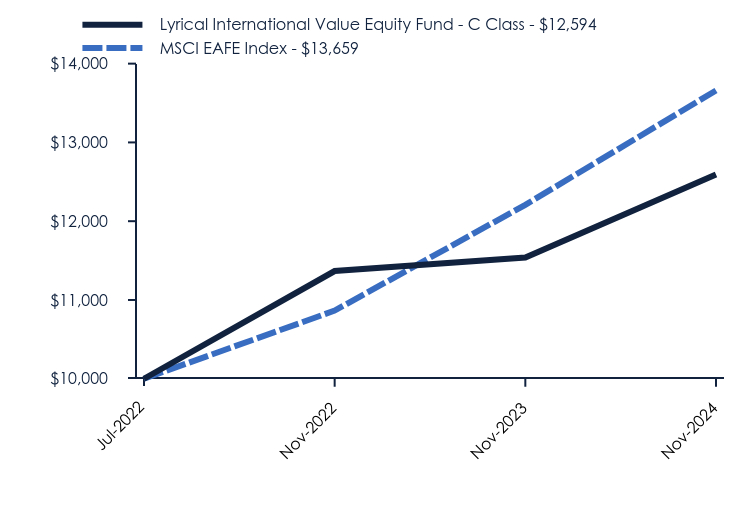
How has the Fund performed since inception?
Total Return Based on $10,000 Investment
| Lyrical International Value Equity Fund - C Class | MSCI EAFE Index |
|---|
| Jul-2022 | $10,000 | $10,000 |
|---|
| Nov-2022 | $11,367 | $10,865 |
|---|
| Nov-2023 | $11,538 | $12,208 |
|---|
| Nov-2024 | $12,594 | $13,659 |
|---|
Average Annual Total Returns
| 1 Year | Since Inception (July 5, 2022) |
|---|
| Lyrical International Value Equity Fund - C Class | | |
|---|
| Without CDSC | 9.15% | 10.06% |
|---|
| With CDSC | 8.15% | 10.06% |
|---|
| MSCI EAFE Index | 11.88% | 13.84% |
|---|
Past performance is not necessarily indicative of future results. The graph and table do not reflect the deduction of taxes that a shareholder would pay on fund distributions or redemption of fund shares.
What did the Fund invest in?
Sector Weighting (% of net assets)
| Value | Value |
|---|
| Other Assets in Excess of Liabilities | 0.1% |
| Money Market Funds | 0.9% |
| Materials | 2.1% |
| Consumer Staples | 3.7% |
| Communications | 4.5% |
| Consumer Discretionary | 9.6% |
| Energy | 12.2% |
| Financials | 17.4% |
| Technology | 18.9% |
| Industrials | 30.6% |
- Net Assets$12,678,854
- Number of Portfolio Holdings30
- Advisory Fee (net of waivers)$0
- Portfolio Turnover31%
Asset Weighting (% of total investments)
| Value | Value |
|---|
| Common Stocks | 99.1% |
| Money Market Funds | 0.9% |
Country Weighting (% of net assets)
| Value | Value |
|---|
| United States | 0.9% |
| Spain | 2.8% |
| Finland | 3.3% |
| South Korea | 3.4% |
| Hong Kong | 3.7% |
| Sweden | 4.3% |
| Belgium | 4.6% |
| United Kingdom | 8.6% |
| Switzerland | 9.3% |
| Canada | 12.5% |
| Japan | 13.4% |
| Netherlands | 13.7% |
| France | 19.4% |
Top 10 Holdings (% of net assets)
| Holding Name | % of Net Assets |
| AerCap Holdings N.V. | 5.3% |
| Suncor Energy, Inc. | 5.2% |
| Ashtead Group plc | 5.1% |
| Nintendo Company Ltd. - ADR | 5.0% |
| Euronext N.V. | 4.8% |
| Johnson Controls International plc | 4.8% |
| Sony Group Corporation | 4.8% |
| D'ieteren Group | 4.6% |
| Bollore SE | 4.5% |
| Julius Baer Group Ltd. | 4.5% |
No material changes occurred during the year ended November 30, 2024.
Where can I find additional information about the Fund?
Additional information is available on the Fund's website (www.lyricalvaluefunds.com), including its:
Prospectus
Financial information
Holdings
Proxy voting information
Lyrical International Value Equity Fund - C Class (LYRZX)
Annual Shareholder Report - November 30, 2024
Q3 All-Season Systematic Opportunities Fund
Institutional Class (QASOX)
Annual Shareholder Report - November 30, 2024
This annual shareholder report contains important information about Q3 All-Season Systematic Opportunities Fund (the "Fund") for the period of December 1, 2023 to November 30, 2024. You can find additional information about the Fund at https://www.q3allseasonfunds.com/funds/. You can also request this information by contacting us at (855) 784-2399.
What were the Fund’s costs for the last year?
(based on a hypothetical $10,000 investment)
| Class Name | Costs of a $10,000 investment | Costs paid as a percentage of a $10,000 investment |
|---|
| Institutional Class | $132 | 1.28% |
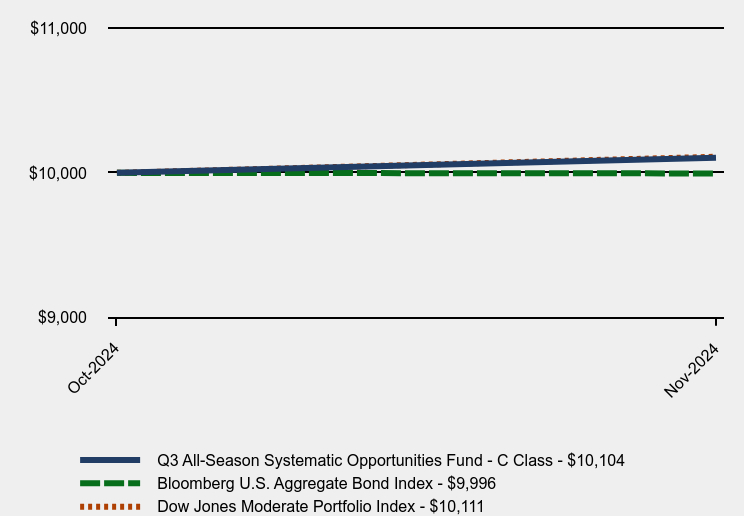
How did the Fund perform during the reporting period?
The Q3 All-Season Systematic Opportunities Fund continues to perform as designed – yielding positive returns over all market environments. For the most recent period, the Fund was able to capitalize on stock market volatility by entering into short-term trades as equities dipped. The Fund attempts to take advantage of this “mean-reversion” in the markets, as such dips are often followed by significant market bounces.
Over the last six months, the Fund was invested in equities approximately 50% of the time, and registered gains with considerably less risk than the equity markets as a whole. Equity positions consisted of holdings in S&P 500 and NASDAQ 100 Index funds. During bullish moves in stocks, the Fund will tend to have fewer trades as it looks for buying opportunities on short-term moves to the downside.
Given that there were fewer meaningful pullbacks in equities over the period, the Fund maintained larger than normal defensive positions (money market funds) while it waited for opportunities to enter the equity markets. Currently, these defensive positions are generating an annual yield of over 4.5%, so the Fund has the ability to earn healthy yields when it is waiting for potential equity trades.
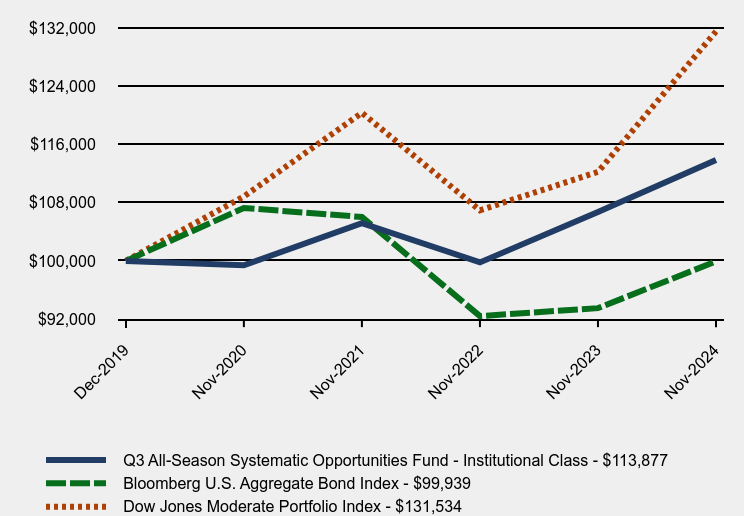
How has the Fund performed since inception?
Total Return Based on $100,000 Investment
| Q3 All-Season Systematic Opportunities Fund - Institutional Class | Bloomberg U.S. Aggregate Bond Index | Dow Jones Moderate Portfolio Index |
|---|
| Dec-2019 | $100,000 | $100,000 | $100,000 |
| Nov-2020 | $99,400 | $107,272 | $108,849 |
| Nov-2021 | $105,200 | $106,035 | $120,343 |
| Nov-2022 | $99,796 | $92,420 | $106,957 |
| Nov-2023 | $106,706 | $93,510 | $112,228 |
| Nov-2024 | $113,877 | $99,939 | $131,534 |
Average Annual Total Returns
| 1 Year | Since Inception (December 30, 2019) |
|---|
| Q3 All-Season Systematic Opportunities Fund - Institutional Class | 6.72% | 2.68% |
| Bloomberg U.S. Aggregate Bond Index | 6.88% | -0.01% |
| Dow Jones Moderate Portfolio Index | 17.20% | 5.73% |
The Fund's past performance is not a good predictor of how the Fund will perform in the future. The graph and table do not reflect the deduction of taxes that a shareholder would pay on fund distributions or redemption of fund shares.
- Net Assets$178,343,142
- Number of Portfolio Holdings1
- Advisory Fee (net of waivers & recoupments)$1,864,912
- Portfolio Turnover8,158%
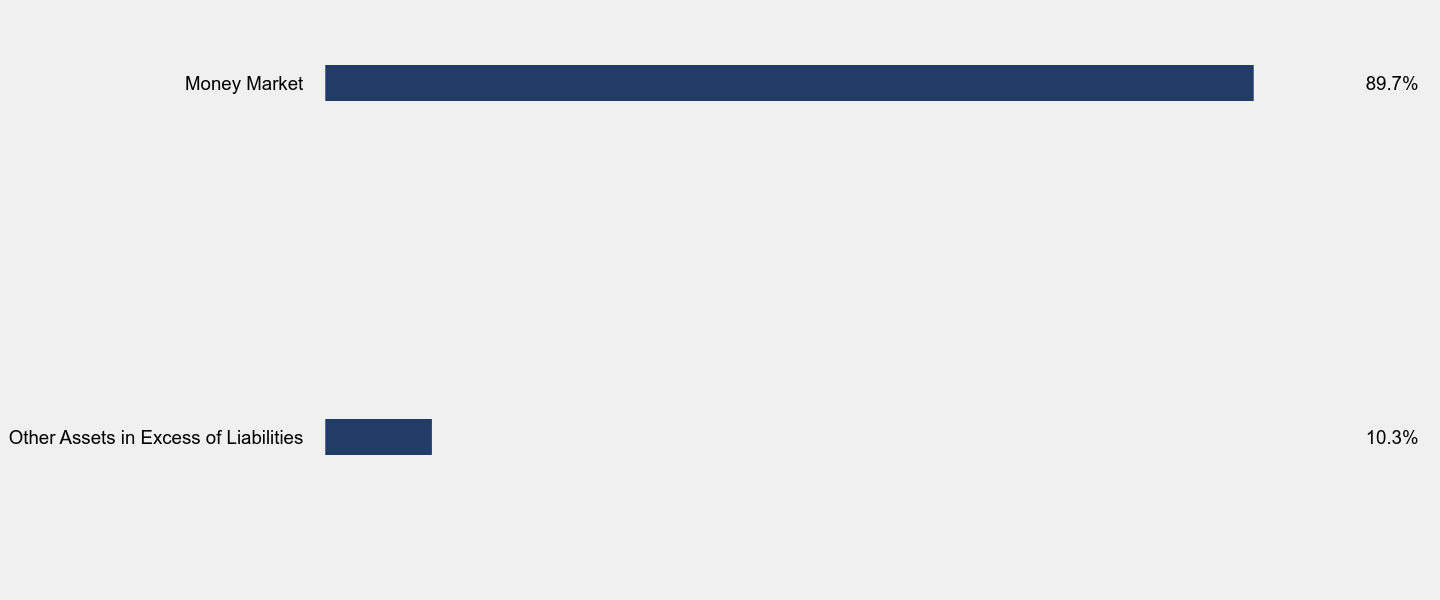
What did the Fund invest in?
Sector Weighting (% of net assets)
| Value | Value |
|---|
| Other Assets in Excess of Liabilities | 10.3% |
| Money Market | 89.7% |
No material changes occurred during the year ended November 30, 2024.
Q3 All-Season Systematic Opportunities Fund - Institutional Class (QASOX)
Annual Shareholder Report - November 30, 2024
Where can I find additional information about the Fund?
Additional information is available on the Fund's website (https://www.q3allseasonfunds.com/funds/), including its:
Prospectus
Financial information
Holdings
Proxy voting information
Q3 All-Season Systematic Opportunities Fund
Annual Shareholder Report - November 30, 2024
This annual shareholder report contains important information about Q3 All-Season Systematic Opportunities Fund (the "Fund") for the period of October 18, 2024 to November 30, 2024. You can find additional information about the Fund at https://www.q3allseasonfunds.com/funds/. You can also request this information by contacting us at (855) 784-2399.
What were the Fund’s costs for the last year?
(based on a hypothetical $10,000 investment)
| Class Name | Costs of a $10,000 investment | Costs paid as a percentage of a $10,000 investment |
|---|
| C Class | $34 | 2.79% |
|---|
How did the Fund perform during the reporting period?
The Q3 All-Season Systematic Opportunities Fund continues to perform as designed – yielding positive returns over all market environments. For the most recent period, the Fund was able to capitalize on stock market volatility by entering into short-term trades as equities dipped. The Fund attempts to take advantage of this “mean-reversion” in the markets, as such dips are often followed by significant market bounces.
Over the last six months, the Fund was invested in equities approximately 50% of the time, and registered gains with considerably less risk than the equity markets as a whole. Equity positions consisted of holdings in S&P 500 and NASDAQ 100 Index funds. During bullish moves in stocks, the Fund will tend to have fewer trades as it looks for buying opportunities on short-term moves to the downside.
Given that there were fewer meaningful pullbacks in equities over the period, the Fund maintained larger than normal defensive positions (money market funds) while it waited for opportunities to enter the equity markets. Currently, these defensive positions are generating an annual yield of over 4.5%, so the Fund has the ability to earn healthy yields when it is waiting for potential equity trades.
How has the Fund performed since inception?
Total Return Based on $10,000 Investment
| Q3 All-Season Systematic Opportunities Fund - C Class | Bloomberg U.S. Aggregate Bond Index | Dow Jones Moderate Portfolio Index |
|---|
| Oct-2024 | $10,000 | $10,000 | $10,000 |
|---|
| Nov-2024 | $10,104 | $9,996 | $10,111 |
|---|
Average Annual Total Returns
| Since Inception (October 18, 2024) |
|---|
| Q3 All-Season Systematic Opportunities Fund - C Class | 1.04% |
|---|
| Bloomberg U.S. Aggregate Bond Index | -0.04% |
|---|
| Dow Jones Moderate Portfolio Index | 1.11% |
|---|
The Fund's past performance is not a good predictor of how the Fund will perform in the future. The graph and table do not reflect the deduction of taxes that a shareholder would pay on fund distributions or redemption of fund shares.
- Net Assets$178,343,142
- Number of Portfolio Holdings1
- Advisory Fee (net of waivers & recoupments)$1,864,912
- Portfolio Turnover8,158%
What did the Fund invest in?
Sector Weighting (% of net assets)
| Value | Value |
|---|
| Other Assets in Excess of Liabilities | 10.3% |
| Money Market | 89.7% |
No material changes occurred during the year ended November 30, 2024.
Q3 All-Season Systematic Opportunities Fund - C Class (QCSOX)
Annual Shareholder Report - November 30, 2024
Where can I find additional information about the Fund?
Additional information is available on the Fund's website (https://www.q3allseasonfunds.com/funds/), including its:
Prospectus
Financial information
Holdings
Proxy voting information
Q3 All-Season Tactical Fund
Institutional Class (QAITX)
Annual Shareholder Report - November 30, 2024
This annual shareholder report contains important information about Q3 All-Season Tactical Fund (the "Fund") for the period of December 1, 2023 to November 30, 2024. You can find additional information about the Fund at https://www.q3allseasonfunds.com/funds/. You can also request this information by contacting us at (855) 784-2399.
What were the Fund’s costs for the last year?
(based on a hypothetical $10,000 investment)
| Class Name | Costs of a $10,000 investment | Costs paid as a percentage of a $10,000 investment |
|---|
| Institutional Class | $175 | 1.58% |
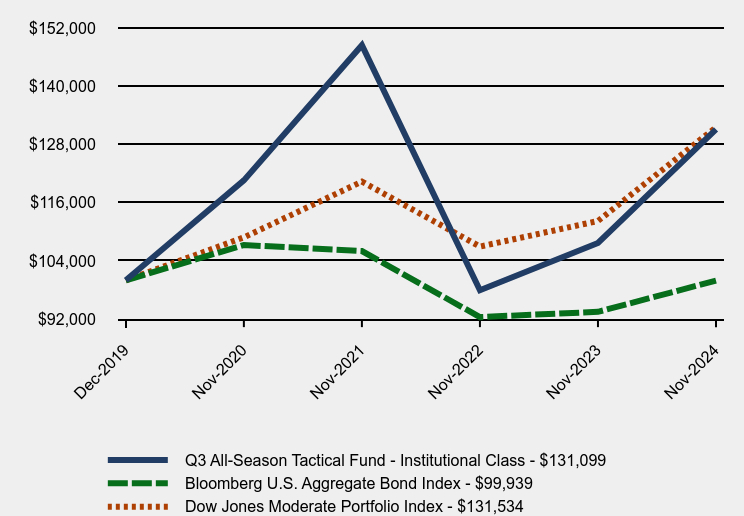
How did the Fund perform during the reporting period?
Performance for the Q3 All-Season Tactical Fund was primarily due to the exposure it had to NASDAQ 100 Index funds. The Fund identified conditions that suggested a continued positive trend in that index. Ongoing strength in the technology sector bolstered the index to new highs during the period. This led to the Fund’s quantitative trading rules signaling multiple buying opportunities throughout the last six months.
Occasional defensive positions were taken in long-term Treasuries and money markets when the Fund determined the volatility of the NASDAQ was at an elevated level. These trades amounted to approximately 15% of the overall market exposure for the time period. Small gains were realized in the Treasury positions, mostly on the short side, as investors remained uncertain as to the future of interest rate cuts which led to a general decline in the bond market.
The Tactical Fund continued to participate in the upward movement of the equity markets during the period as it kept a close watch on signs of over-extension by monitoring several technical signals on a daily basis. Such indicators are designed to identify short-term tops in the market, so the Fund is able to pivot away from equities and into areas of the market deemed less prone to significant downside moves.
How has the Fund performed since inception?
Total Return Based on $100,000 Investment
| Q3 All-Season Tactical Fund - Institutional Class | Bloomberg U.S. Aggregate Bond Index | Dow Jones Moderate Portfolio Index |
|---|
| Dec-2019 | $100,000 | $100,000 | $100,000 |
| Nov-2020 | $120,600 | $107,272 | $108,849 |
| Nov-2021 | $148,463 | $106,035 | $120,343 |
| Nov-2022 | $97,948 | $92,420 | $106,957 |
| Nov-2023 | $107,685 | $93,510 | $112,228 |
| Nov-2024 | $131,099 | $99,939 | $131,534 |
Average Annual Total Returns
| 1 Year | Since Inception (December 30, 2019) |
|---|
| Q3 All-Season Tactical Fund - Institutional Class | 21.74% | 5.66% |
| Bloomberg U.S. Aggregate Bond Index | 6.88% | -0.01% |
| Dow Jones Moderate Portfolio Index | 17.20% | 5.73% |
The Fund's past performance is not a good predictor of how the Fund will perform in the future. The graph and table do not reflect the deduction of taxes that a shareholder would pay on fund distributions or redemption of fund shares.
- Net Assets$56,869,690
- Number of Portfolio Holdings3
- Advisory Fee (net of waivers)$519,178
- Portfolio Turnover795%
What did the Fund invest in?
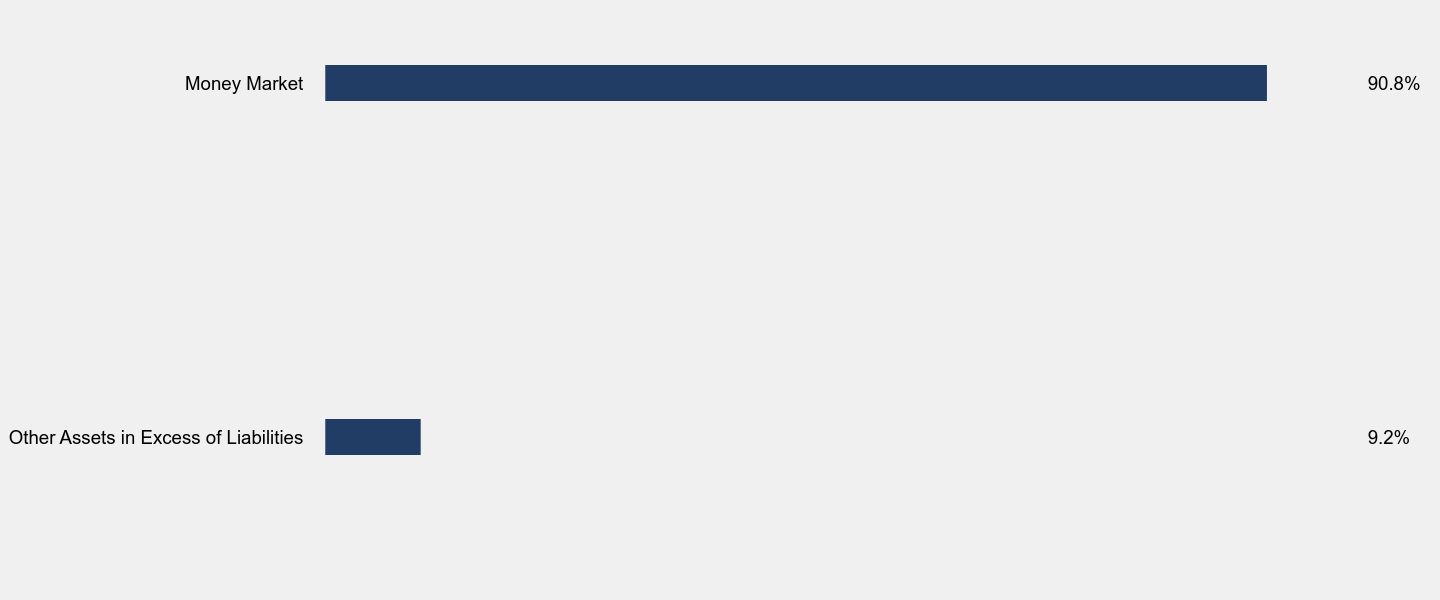
Sector Weighting (% of net assets)
| Value | Value |
|---|
| Other Assets in Excess of Liabilities | 9.2% |
| Money Market | 90.8% |
No material changes occurred during the year ended November 30, 2024.
Q3 All-Season Tactical Fund - Institutional Class (QAITX)
Annual Shareholder Report - November 30, 2024
Where can I find additional information about the Fund?
Additional information is available on the Fund's website (https://www.q3allseasonfunds.com/funds/), including its:
Prospectus
Financial information
Holdings
Proxy voting information
Q3 All-Season Tactical Fund
Annual Shareholder Report - November 30, 2024
This annual shareholder report contains important information about Q3 All-Season Tactical Fund (the "Fund") for the period of December 1, 2023 to November 30, 2024. You can find additional information about the Fund at https://www.q3allseasonfunds.com/funds/. You can also request this information by contacting us at (855) 784-2399.
What were the Fund’s costs for the last year?
(based on a hypothetical $10,000 investment)
| Class Name | Costs of a $10,000 investment | Costs paid as a percentage of a $10,000 investment |
|---|
| C Class | $324 | 2.94% |
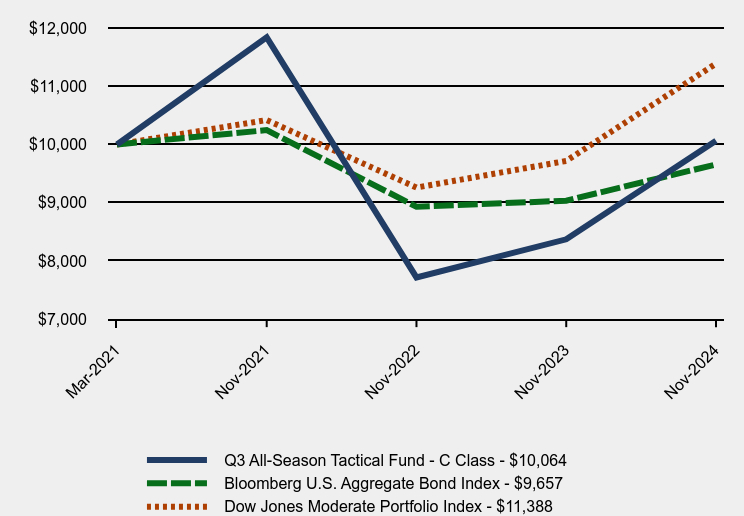
How did the Fund perform during the reporting period?
Performance for the Q3 All-Season Tactical Fund was primarily due to the exposure it had to NASDAQ 100 Index funds. The Fund identified conditions that suggested a continued positive trend in that index. Ongoing strength in the technology sector bolstered the index to new highs during the period. This led to the Fund’s quantitative trading rules signaling multiple buying opportunities throughout the last six months.
Occasional defensive positions were taken in long-term Treasuries and money markets when the Fund determined the volatility of the NASDAQ was at an elevated level. These trades amounted to approximately 15% of the overall market exposure for the time period. Small gains were realized in the Treasury positions, mostly on the short side, as investors remained uncertain as to the future of interest rate cuts which led to a general decline in the bond market.
The Tactical Fund continued to participate in the upward movement of the equity markets during the period as it kept a close watch on signs of over-extension by monitoring several technical signals on a daily basis. Such indicators are designed to identify short-term tops in the market, so the Fund is able to pivot away from equities and into areas of the market deemed less prone to significant downside moves.
How has the Fund performed since inception?
Total Return Based on $10,000 Investment
| Q3 All-Season Tactical Fund - C Class | Bloomberg U.S. Aggregate Bond Index | Dow Jones Moderate Portfolio Index |
|---|
| Mar-2021 | $10,000 | $10,000 | $10,000 |
| Nov-2021 | $11,839 | $10,246 | $10,419 |
| Nov-2022 | $7,716 | $8,930 | $9,260 |
| Nov-2023 | $8,371 | $9,035 | $9,717 |
| Nov-2024 | $10,064 | $9,657 | $11,388 |
Average Annual Total Returns
| 1 Year | Since Inception (March 18, 2021) |
|---|
| Q3 All-Season Tactical Fund - C Class | 20.22% | 0.17% |
| Bloomberg U.S. Aggregate Bond Index | 6.88% | -0.94% |
| Dow Jones Moderate Portfolio Index | 17.20% | 3.57% |
The Fund's past performance is not a good predictor of how the Fund will perform in the future. The graph and table do not reflect the deduction of taxes that a shareholder would pay on fund distributions or redemption of fund shares.
- Net Assets$56,869,690
- Number of Portfolio Holdings3
- Advisory Fee (net of waivers)$519,178
- Portfolio Turnover795%
What did the Fund invest in?
Sector Weighting (% of net assets)
| Value | Value |
|---|
| Other Assets in Excess of Liabilities | 9.2% |
| Money Market | 90.8% |
No material changes occurred during the year ended November 30, 2024.
Q3 All-Season Tactical Fund - C Class (QACTX)
Annual Shareholder Report - November 30, 2024
Where can I find additional information about the Fund?
Additional information is available on the Fund's website (https://www.q3allseasonfunds.com/funds/), including its:
Prospectus
Financial information
Holdings
Proxy voting information
Q3 All-Season Active Rotation ETF
(QVOY) Cboe BZX Exchange, Inc.
Annual Shareholder Report - November 30, 2024
This annual shareholder report contains important information about Q3 All-Season Active Rotation ETF for the period of December 1, 2023 to November 30, 2024. You can find additional information about the Fund at www.q3allseasonfunds.com/etf/. You can also request this information by contacting us at (888) 348-1255.
What were the Fund’s costs for the last year?
(based on a hypothetical $10,000 investment)
| Fund Name | Costs of a $10,000 investment | Costs paid as a percentage of a $10,000 investment |
|---|
| Q3 All-Season Active Rotation ETF | $101 | 0.96% |
|---|
How did the Fund perform during the reporting period?
Over the last six months, the Q3 All-Season Active Rotation Fund has held equity positions across all market capitalizations and the growth/value spectrum, as it often will. During this period, growth stocks, especially large-cap growth, have outperformed. As such, the Fund’s performance has lagged certain equity indexes while maintaining increased diversification, and lower overall risk.
The “core equity” holdings of the Fund were invested in both growth and value index funds; this was the primary driver of the underperformance for the period. Additionally, the Fund holds several positions in an “active equity” sleeve, and many of those also leaned towards value including real estate, gold miners and industrials. Value, and defensive, stocks had several instances of short-lived momentum where they rallied, but then quickly retreated before an established trend was put in place. This market activity, known as “whipsawing,” can be challenging to investment strategies looking to exploit short-term strength in the markets.
Fixed income holdings in the Fund shifted from a more conservative posture earlier in the year to a more aggressive one later in the year. Positions included High Yields, Long-term Treasuries, and Emerging Markets. The bond holdings were able to add value to the Fund, as they outperformed the broader bond market as a whole. Finally, the Fund allocates 15% to an “alternative” sleeve of ETFs, which seeks to add further diversification to the portfolio. Positions for the period included gold, convertible bonds, and currencies. These holdings served to dampen volatility in the Fund, while also providing modest upside value for the period.
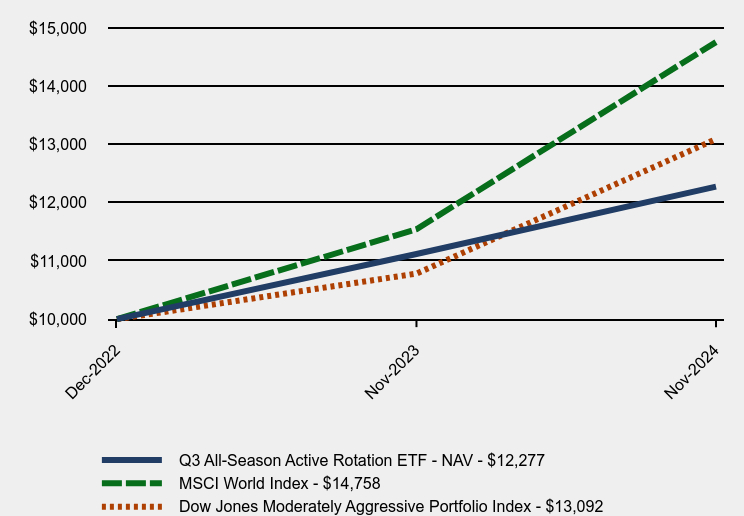
How has the Fund performed since inception?
Total Return Based on $10,000 Investment
| Q3 All-Season Active Rotation ETF - NAV | MSCI World Index | Dow Jones Moderately Aggressive Portfolio Index |
|---|
| Dec-2022 | $10,000 | $10,000 | $10,000 |
|---|
| Nov-2023 | $11,119 | $11,545 | $10,782 |
|---|
| Nov-2024 | $12,277 | $14,758 | $13,092 |
|---|
Average Annual Total Returns
| 1 Year | Since Inception (December 6, 2022) |
|---|
| Q3 All-Season Active Rotation ETF | 10.42% | 10.90% |
|---|
| MSCI World Index | 27.83% | 21.68% |
|---|
| Dow Jones Moderately Aggressive Portfolio Index | 21.42% | 14.55% |
|---|
The Fund's past performance is not a good predictor of how the Fund will perform in the future. The graph and table do not reflect the deduction of taxes that a shareholder would pay on fund distributions or redemption of fund shares.
- Net Assets$63,717,031
- Number of Portfolio Holdings12
- Advisory Fee (net of waivers)$503,532
- Portfolio Turnover653%
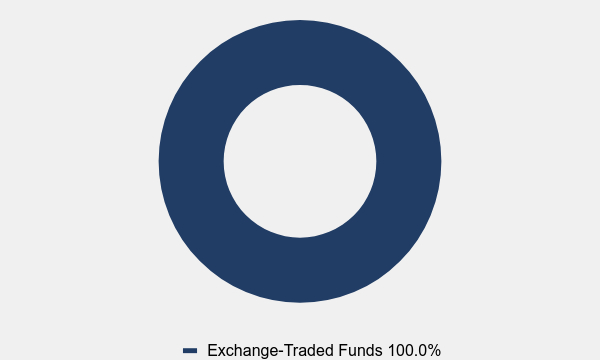
Asset Weighting (% of total investments)
| Value | Value |
|---|
| Exchange-Traded Funds | 100.0% |
What did the Fund invest in?
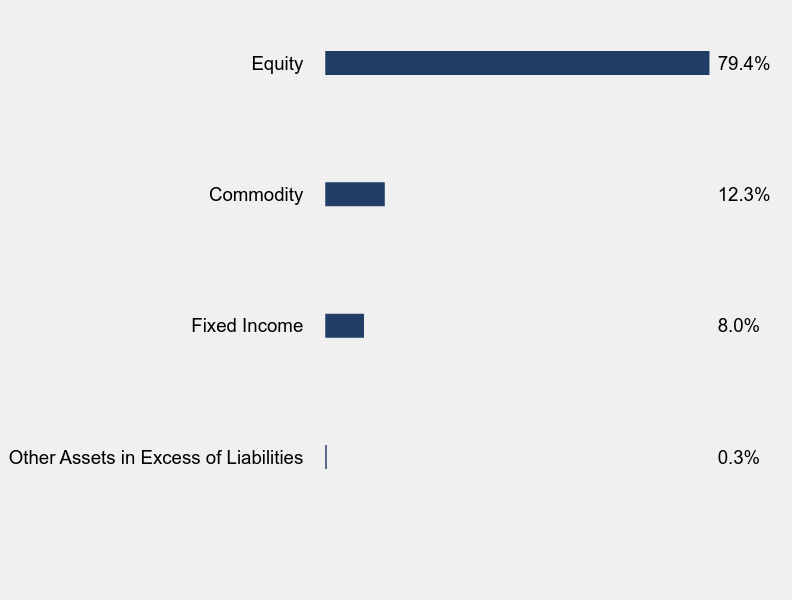
Sector Weighting (% of net assets)
| Value | Value |
|---|
| Other Assets in Excess of Liabilities | 0.3% |
| Fixed Income | 8.0% |
| Commodity | 12.3% |
| Equity | 79.4% |
Top 10 Holdings (% of net assets)
| Holding Name | % of Net Assets |
| Consumer Discretionary Select Sector SPDR Fund | 15.4% |
| Schwab U.S. Large-Cap Growth ETF | 14.5% |
| Industrial Select Sector SPDR Fund | 14.4% |
| Vanguard FTSE Emerging Markets ETF | 13.4% |
| iShares Core S&P 500 ETF | 13.4% |
| VanEck Gold Miners ETF | 12.3% |
| Amplify Transformational Data Sharing ETF | 4.2% |
| iShares Convertible Bond ETF | 4.2% |
| Invesco S&P 500 BuyWrite ETF | 4.1% |
| iShares 7-10 Year Treasury Bond ETF | 1.3% |
No material changes occurred during the year ended November 30, 2024.
Q3 All-Season Active Rotation ETF (QVOY)
Annual Shareholder Report - November 30, 2024
Where can I find additional information about the Fund?
Additional information is available on the Fund's website (www.q3allseasonfunds.com/etf/), including its:
Prospectus
Financial information
Holdings
Proxy voting information
As of the end of the period covered by this report, the registrant has adopted a code of ethics that applies to the registrant’s principal executive officer, principal financial officer, principal accounting officer or controller, or persons performing similar functions, regardless of whether these individuals are employed by the registrant or a third party. Pursuant to Item 12(a)(1), a copy of registrant’s code of ethics is filed as an exhibit to this Form N-CSR. During the period covered by this report, the code of ethics has not been amended, and the registrant has not granted any waivers, including implicit waivers, from the provisions of the code of ethics.
| Item 3. | Audit Committee Financial Expert. |
The registrant’s board of trustees has determined that the registrant has at least one audit committee financial expert serving on its audit committee. The name of the audit committee financial expert is Janine L. Cohen. Ms. Cohen is “independent” for purposes of this Item.
| Item 4. | Principal Accountant Fees and Services. |
| (a) | Audit Fees. The aggregate fees billed for professional services rendered by the principal accountant for the audit of the registrant’s annual financial statements or for services that are normally provided by the accountant in connection with statutory and regulatory filings or engagements were $75,400 and $80,900 with respect to the registrant’s fiscal years ended November 30, 2024 and 2023, respectively. |
| (b) | Audit-Related Fees. No fees were billed in either of the last two fiscal years for assurance and related services by the principal accountant that are reasonably related to the performance of the audit of the registrant’s financial statements and are not reported under paragraph (a) of this Item. |
| (c) | Tax Fees. The aggregate fees billed for professional services rendered by the principal accountant for tax compliance, tax advice, and tax planning were $15,900 and $19,000 with respect to the registrant’s fiscal years ended November 30, 2024 and 2023, respectively. The services comprising these fees are the preparation of the registrant’s federal income and excise tax returns. |
| (d) | All Other Fees. No fees were billed in either of the last two fiscal years for products and services provided by the principal accountant, other than the services reported in paragraphs (a) through (c) of this Item. |
| (e)(1) | The audit committee has not adopted pre-approval policies and procedures described in paragraph (c)(7) of Rule 2-01 of Regulation S-X. |
| (e)(2) | None of the services described in paragraph (b) through (d) of this Item were approved by the audit committee pursuant to paragraph (c)(7)(i)(C) of Rule 2-01 of Regulation S-X. |
| (f) | Less than 50% of hours expended on the principal accountant’s engagement to audit the registrant’s financial statements for the most recent fiscal year were attributed to work performed by persons other than the principal accountant’s full-time, permanent employees. |
| (g) | During the fiscal years ended November 30, 2024 and 2023, aggregate non-audit fees of $15,900 and $19,000, respectively, were billed by the registrant’s accountant for services rendered to the registrant. No non-audit fees were billed in either of the last two fiscal years by the registrant’s accountant for services rendered to the registrant’s investment adviser (not including any sub-adviser whose role is primarily portfolio management and is subcontracted with or overseen by another investment adviser), and any entity controlling, controlled by, or under common control with the adviser that provides ongoing services to the registrant. |
| (h) | The principal accountant has not provided any non-audit services to the registrant’s investment adviser (not including any sub-adviser whose role is primarily portfolio management and is subcontracted with or overseen by another investment adviser), and any entity controlling, controlled by, or under common control with the investment adviser that provides ongoing services to the registrant. |
| Item 5. | Audit Committee of Listed Registrants. |
Certain series of the registrant that appear in the shareholder report included in Item 1 listed issuers as defined in Rule 10A-3 under the Securities Exchange Act of 1934, as amended (the “Exchange Act”) and have a separately-designated standing audit committee established in accordance with Section 3(a)(58)A of the Exchange Act. All of the Board’s independent trustees are members of the audit committee.
| (a) | The Registrant(s) schedule(s) of investments is included in the Financial Statements under Item 7 of this form. |
| Item 7. | Financial Statements and Financial Highlights for Open-End Management Investment Companies |
LYRICAL U.S. VALUE EQUITY FUND
Institutional Class (LYRIX)
Investor Class (LYRBX)
A Class (LYRAX)
C Class (LYRCX)
LYRICAL INTERNATIONAL VALUE EQUITY FUND
Institutional Class (LYRWX)
Investor Class (LYRNX)
A Class (LYRVX)
C Class (LYRZX)
Financial Statements
November 30, 2024
| LYRICAL U.S. VALUE EQUITY FUND |
| SCHEDULE OF INVESTMENTS |
| November 30, 2024 |
| COMMON STOCKS — 98.0% | | Shares | | | Value | |
| Communications — 8.9% | | | | | | | | |
| Internet Media & Services — 8.9% | | | | | | | | |
| Expedia Group, Inc. (a) | | | 294,436 | | | $ | 54,358,774 | |
| Uber Technologies, Inc. (a) | | | 685,581 | | | | 49,334,409 | |
| | | | | | | | 103,693,183 | |
| Consumer Discretionary — 7.5% | | | | | | | | |
| Automotive — 1.5% | | | | | | | | |
| Adient plc (a) | | | 206,717 | | | | 3,975,168 | |
| Lear Corporation | | | 137,163 | | | | 13,420,028 | |
| | | | | | | | 17,395,196 | |
| E-Commerce Discretionary — 3.9% | | | | | | | | |
| eBay, Inc. | | | 724,115 | | | | 45,829,238 | |
| | | | | | | | | |
| Retail - Discretionary — 2.1% | | | | | | | | |
| Lithia Motors, Inc. | | | 61,974 | | | | 23,977,741 | |
| | | | | | | | | |
| Energy — 4.1% | | | | | | | | |
| Oil & Gas Producers — 4.1% | | | | | | | | |
| Suncor Energy, Inc. | | | 1,200,490 | | | | 47,395,345 | |
| | | | | | | | | |
| Financials — 16.1% | | | | | | | | |
| Asset Management — 6.5% | | | | | | | | |
| Affiliated Managers Group, Inc. | | | 96,903 | | | | 18,173,189 | |
| Ameriprise Financial, Inc. | | | 99,089 | | | | 56,874,113 | |
| | | | | | | | 75,047,302 | |
| Insurance — 4.7% | | | | | | | | |
| Assurant, Inc. | | | 132,716 | | | | 30,139,804 | |
| Primerica, Inc. | | | 82,667 | | | | 25,027,434 | |
| | | | | | | | 55,167,238 | |
| Specialty Finance — 4.9% | | | | | | | | |
| AerCap Holdings N.V. | | | 430,185 | | | | 42,743,182 | |
| Air Lease Corporation | | | 274,536 | | | | 13,973,882 | |
| | | | | | | | 56,717,064 | |
| Health Care — 9.3% | | | | | | | | |
| Health Care Facilities & Services — 9.3% | | | | | | | | |
| Centene Corporation (a) | | | 482,888 | | | | 28,973,280 | |
| Cigna Group (The) | | | 122,937 | | | | 41,528,119 | |
| HCA Healthcare, Inc. | | | 113,715 | | | | 37,209,822 | |
| | | | | | | | 107,711,221 | |
| LYRICAL U.S. VALUE EQUITY FUND |
| SCHEDULE OF INVESTMENTS (Continued) |
| COMMON STOCKS — 98.0% (Continued) | | Shares | | | Value | |
| Industrials — 13.9% | | | | | | | | |
| Electrical Equipment — 4.6% | | | | | | | | |
| Johnson Controls International plc | | | 630,491 | | | $ | 52,872,975 | |
| | | | | | | | | |
| Industrial Support Services — 9.3% | | | | | | | | |
| United Rentals, Inc. | | | 96,388 | | | | 83,472,008 | |
| WESCO International, Inc. | | | 116,330 | | | | 24,611,938 | |
| | | | | | | | 108,083,946 | |
| Materials — 3.6% | | | | | | | | |
| Chemicals — 1.6% | | | | | | | | |
| Celanese Corporation | | | 249,352 | | | | 18,255,060 | |
| | | | | | | | | |
| Containers & Packaging — 1.9% | | | | | | | | |
| Berry Global Group, Inc. | | | 308,229 | | | | 22,288,039 | |
| | | | | | | | | |
| Forestry, Paper & Wood Products — 0.1% | | | | | | | | |
| Magnera Corporation (a) | | | 79,491 | | | | 1,627,976 | |
| | | | | | | | | |
| Technology — 29.8% | | | | | | | | |
| Software — 4.0% | | | | | | | | |
| Concentrix Corporation | | | 131,292 | | | | 5,901,575 | |
| Gen Digital, Inc. | | | 1,324,826 | | | | 40,870,882 | |
| | | | | | | | 46,772,457 | |
| Technology Hardware — 10.1% | | | | | | | | |
| Arrow Electronics, Inc. (a) | | | 162,397 | | | | 19,513,623 | |
| F5, Inc. (a) | | | 138,333 | | | | 34,631,667 | |
| Flex Ltd. (a) | | | 1,110,847 | | | | 43,289,708 | |
| TD SYNNEX Corporation | | | 162,651 | | | | 19,353,842 | |
| | | | | | | | 116,788,840 | |
| Technology Services — 15.7% | | | | | | | | |
| Corpay, Inc. (a) | | | 160,552 | | | | 61,199,211 | |
| Fidelity National Information Services, Inc. | | | 712,817 | | | | 60,803,290 | |
| Global Payments, Inc. | | | 349,708 | | | | 41,601,264 | |
| WEX, Inc. (a) | | | 96,780 | | | | 18,258,515 | |
| | | | | | | | 181,862,280 | |
| Utilities — 4.8% | | | | | | | | |
| Electric Utilities — 4.8% | | | | | | | | |
| NRG Energy, Inc. | | | 542,060 | | | | 55,078,717 | |
| | | | | | | | | |
| Total Common Stocks (Cost $794,003,467) | | | | | | $ | 1,136,563,818 | |
| LYRICAL U.S. VALUE EQUITY FUND |
| SCHEDULE OF INVESTMENTS (Continued) |
| MONEY MARKET FUNDS — 2.0% | | Shares | | | Value | |
| Invesco Treasury Portfolio - Institutional Class, 4.55% (b) (Cost $22,840,101) | | | 22,840,101 | | | $ | 22,840,101 | |
| | | | | | | | | |
| Investments at Value — 100.0% (Cost $816,843,568) | | | | | | $ | 1,159,403,919 | |
| | | | | | | | | |
| Liabilities in Excess of Other Assets — (0.0)% (c) | | | | | | | (534,313 | ) |
| | | | | | | | | |
| Net Assets — 100.0% | | | | | | $ | 1,158,869,606 | |
N.V. - Naamloze Vennootschap
plc - Public Limited Company
| (a) | Non-income producing security. |
| (b) | The rate shown is the 7-day effective yield as of November 30, 2024. |
| (c) | Percentage rounds to less than 0.1%. |
See accompanying notes to financial statements.
| LYRICAL INTERNATIONAL VALUE EQUITY FUND |
| SCHEDULE OF INVESTMENTS |
| November 30, 2024 |
| COMMON STOCKS — 99.0% | | Shares | | | Value | |
| Belgium — 4.6% | | | | | | | | |
| D’ieteren Group | | | 2,696 | | | $ | 576,407 | |
| | | | | | | | | |
| Canada — 12.5% | | | | | | | | |
| Linamar Corporation | | | 4,578 | | | | 201,023 | |
| Open Text Corporation | | | 13,439 | | | | 409,346 | |
| Parkland Corporation | | | 11,915 | | | | 307,686 | |
| Suncor Energy, Inc. | | | 16,822 | | | | 664,133 | |
| | | | | | | | 1,582,188 | |
| Finland — 3.3% | | | | | | | | |
| Konecranes OYJ | | | 6,239 | | | | 422,182 | |
| | | | | | | | | |
| France — 19.4% | | | | | | | | |
| Ayvens S.A. | | | 42,912 | | | | 282,048 | |
| Bollore SE | | | 93,284 | | | | 575,347 | |
| Elis S.A. | | | 16,720 | | | | 340,577 | |
| Rexel S.A. | | | 21,644 | | | | 559,282 | |
| SPIE S.A. | | | 12,358 | | | | 389,379 | |
| Teleperformance SE | | | 3,378 | | | | 317,987 | |
| | | | | | | | 2,464,620 | |
| Hong Kong — 3.7% | | | | | | | | |
| CK Hutchison Holdings Ltd. | | | 89,680 | | | | 468,984 | |
| | | | | | | | | |
| Japan — 13.4% | | | | | | | | |
| Air Water, Inc. | | | 17,653 | | | | 219,192 | |
| Kyudenko Corporation | | | 5,494 | | | | 188,919 | |
| Nintendo Company Ltd. - ADR | | | 43,043 | | | | 630,580 | |
| SK Kaken Company Ltd. | | | 849 | | | | 50,821 | |
| Sony Group Corporation | | | 30,159 | | | | 605,551 | |
| | | | | | | | 1,695,063 | |
| Netherlands — 13.7% | | | | | | | | |
| AerCap Holdings N.V. | | | 6,725 | | | | 668,196 | |
| CNH Industrial N.V. | | | 36,742 | | | | 461,479 | |
| Euronext N.V. | | | 5,491 | | | | 612,474 | |
| | | | | | | | 1,742,149 | |
| South Korea — 3.4% | | | | | | | | |
| Samsung Electronics Company Ltd. | | | 444 | | | | 435,564 | |
| LYRICAL INTERNATIONAL VALUE EQUITY FUND |
| SCHEDULE OF INVESTMENTS (Continued) |
| COMMON STOCKS — 99.0% (Continued) | | Shares | | | Value | |
| Spain — 2.8% | | | | | | | | |
| Grupo Catalana Occidente S.A. | | | 9,085 | | | $ | 347,985 | |
| | | | | | | | | |
| Sweden — 4.3% | | | | | | | | |
| Evolution AB | | | 6,178 | | | | 539,116 | |
| | | | | | | | | |
| Switzerland — 9.3% | | | | | | | | |
| Johnson Controls International plc | | | 7,230 | | | | 606,308 | |
| Julius Baer Group Ltd. | | | 8,654 | | | | 573,070 | |
| | | | | | | | 1,179,378 | |
| United Kingdom — 8.6% | | | | | | | | |
| Ashtead Group plc | | | 8,122 | | | | 650,933 | |
| Babcock International Group plc | | | 38,775 | | | | 253,502 | |
| Vistry Group plc (a) | | | 22,429 | | | | 187,382 | |
| | | | | | | | 1,091,817 | |
| Total Common Stocks (Cost $11,675,764) | | | | | | $ | 12,545,453 | |
| MONEY MARKET FUNDS — 0.9% | | | | | | |
| Invesco Treasury Portfolio - Institutional Class, 4.55% (b) (Cost $114,443) | | | 114,443 | | | $ | 114,443 | |
| | | | | | | | | |
| Investments at Value — 99.9% (Cost $11,790,207) | | | | | | $ | 12,659,896 | |
| | | | | | | | | |
| Other Assets in Excess of Liabilities — 0.1% | | | | | | | 18,958 | |
| | | | | | | | | |
| Net Assets — 100.0% | | | | | | $ | 12,678,854 | |
AB - Aktiebolag
ADR - American Depositary Receipt
N.V. - Naamloze Vennootschap
OYJ - Julkinen Osakeyhtio
plc - Public Limited Company
S.A. - Societe Anonyme
SE - Societe Europaea
| (a) | Non-income producing security. |
| (b) | The rate shown is the 7-day effective yield as of November 30, 2024. |
See accompanying notes to financial statements.
| LYRICAL INTERNATIONAL VALUE EQUITY FUND |
| SCHEDULE OF INVESTMENTS (Continued) |
| | | % of | |
| Common Stocks by Sector/Industry | | Net Assets | |
| Communications — 4.5% | | | | |
| Entertainment Content | | | 4.5 | % |
| Consumer Discretionary — 9.6% | | | | |
| Automotive | | | 1.6 | % |
| Home Construction | | | 1.5 | % |
| Leisure Facilities & Services | | | 4.3 | % |
| Retail - Discretionary | | | 2.2 | % |
| Consumer Staples — 3.7% | | | | |
| Retail - Consumer Staples | | | 3.7 | % |
| Energy — 12.2% | | | | |
| Oil & Gas Producers | | | 7.7 | % |
| Oil & Gas Services & Equipment | | | 4.5 | % |
| Financials — 17.4% | | | | |
| Asset Management | | | 4.5 | % |
| Institutional Financial Services | | | 4.8 | % |
| Insurance | | | 2.8 | % |
| Specialty Finance | | | 5.3 | % |
| Industrials — 30.6% | | | | |
| Commercial Support Services | | | 2.7 | % |
| Electrical Equipment | | | 4.8 | % |
| Engineering & Construction | | | 4.6 | % |
| Industrial Support Services | | | 9.5 | % |
| Machinery | | | 7.0 | % |
| Transportation & Logistics | | | 2.0 | % |
| Materials — 2.1% | | | | |
| Chemicals | | | 2.1 | % |
| Technology — 18.9% | | | | |
| Software | | | 3.2 | % |
| Technology Hardware | | | 13.2 | % |
| Technology Services | | | 2.5 | % |
| | | | 99.0 | % |
See accompanying notes to financial statements.
| LYRICAL FUNDS |
| STATEMENTS OF ASSETS AND LIABILITIES |
| November 30, 2024 |
| | | Lyrical
U.S. Value
Equity Fund | | | Lyrical
International
Value Equity Fund | |
| Investments in securities: | | | | | | | | |
| Investments in securities: | | | | | | | | |
| At cost | | $ | 816,843,568 | | | $ | 11,790,207 | |
| At value (Note 2) | | $ | 1,159,403,919 | | | $ | 12,659,896 | |
| Receivable for capital shares sold | | | 684,479 | | | | — | |
| Receivable from Adviser (Note 4) | | | — | | | | 19,969 | |
| Dividends receivable | | | 595,357 | | | | 11,098 | |
| Tax reclaims receivable | | | — | | | | 9,771 | |
| Other assets | | | 40,774 | | | | 4,956 | |
| Total assets | | | 1,160,724,529 | | | | 12,705,690 | |
| | | | | | | | | |
| LIABILITIES | | | | | | | | |
| Distributions payable | | | 248,654 | | | | — | |
| Payable for capital shares redeemed | | | 641,611 | | | | — | |
| Payable to Adviser (Note 4) | | | 777,235 | | | | — | |
| Payable to administrator (Note 4) | | | 90,821 | | | | 13,647 | |
| Accrued distribution fees (Note 4) | | | 37,117 | | | | — | |
| Other accrued expenses | | | 59,485 | | | | 13,189 | |
| Total liabilities | | | 1,854,923 | | | | 26,836 | |
| | | | | | | | | |
| CONTINGENCIES AND COMMITMENTS (NOTE 7) | | | — | | | | — | |
| | | | | | | | | |
| NET ASSETS | | $ | 1,158,869,606 | | | $ | 12,678,854 | |
| | | | | | | | | |
| NET ASSETS CONSIST OF: | | | | | | | | |
| Paid-in capital | | $ | 827,456,552 | | | $ | 11,882,329 | |
| Distributable earnings | | | 331,413,054 | | | | 796,525 | |
| NET ASSETS | | $ | 1,158,869,606 | | | $ | 12,678,854 | |
| | | | | | | | | |
| NET ASSET VALUE PER SHARE: | | | | | | | | |
| INSTITUTIONAL CLASS | | | | | | | | |
| Net assets applicable to Institutional Class | | $ | 1,138,757,393 | | | $ | 12,215,592 | |
| Institutional Class shares of beneficial interest outstanding(unlimited number of shares authorized, no par value) | | | 40,582,788 | | | | 1,010,337 | |
| Net asset value, offering price and redemption price per share(Note 2) | | $ | 28.06 | | | $ | 12.09 | |
| | | | | | | | | |
| INVESTOR CLASS | | | | | | | | |
| Net assets applicable to Investor Class | | $ | 10,346,649 | | | $ | 450,552 | |
| Investor Class shares of beneficial interest outstanding (unlimited number of shares authorized, no par value) | | | 372,089 | | | | 37,390 | |
| Net asset value, offering price and redemption price per share (Note 2) | | $ | 27.81 | | | $ | 12.05 | |
See accompanying notes to financial statements.
| LYRICAL FUNDS |
| STATEMENTS OF ASSETS AND LIABILITIES |
| November 30, 2024 (Continued) |
| | | Lyrical
U.S. Value
Equity Fund | | | Lyrical
International
Value Equity Fund | |
| NET ASSET VALUE PER SHARE: | | | | | | | | |
| A Class | | | | | | | | |
| Net assets applicable to A Class | | $ | 6,683,304 | | | $ | 6,413 | |
| A Class shares of beneficial interest outstanding (unlimited number of shares authorized, no par value) | | | 239,425 | | | | 532 | |
| Net asset value and redemption price per share (Note 2) | | $ | 27.91 | | | $ | 12.07 | (a) |
| Maximum sales charge | | | 5.75 | % | | | 5.75 | % |
| Maximum offering price per share (Note 2) | | $ | 29.61 | | | $ | 12.81 | |
| | | | | | | | | |
| C Class | | | | | | | | |
| Net assets applicable to C Class | | $ | 3,082,260 | | | $ | 6,297 | |
| C Class shares of beneficial interest outstanding (unlimited number of shares authorized, no par value) | | | 111,976 | | | | 526 | |
| Net asset value, offering price and redemption price per share (Note 2) | | $ | 27.53 | | | $ | 11.97 | |
| Redemption price per share with CDSC fee (Note 2)(b) | | $ | 27.25 | | | $ | 11.85 | |
| (a) | Net Assets divided by Shares do not calculate to the stated Net Asset Value because Net Assets and Shares are shown rounded. |
| (b) | A contingent deferred sales charge (“CDSC”) of 1.00% is charged on C Class shares redeemed within one year of purchase. Redemption price per share is equal to net asset value less any redemption fee or CDSC. |
See accompanying notes to financial statements.
| LYRICAL FUNDS |
| STATEMENTS OF OPERATIONS |
| Year Ended November 30, 2024 |
| | | Lyrical
U.S. Value
Equity Fund | | | Lyrical
International
Value Equity Fund | |
| INVESTMENT INCOME | | | | | | | | |
| Dividend income | | $ | 9,394,455 | | | $ | 346,914 | |
| Foreign withholding taxes on dividends | | | (180,885 | ) | | | (54,628 | ) |
| Tax reclaims received | | | — | | | | 18,610 | |
| Total investment income | | | 9,213,570 | | | | 310,896 | |
| | | | | | | | | |
| EXPENSES | | | | | | | | |
| Management fees (Note 4) | | | 6,500,738 | | | | 107,909 | |
| Administration fees (Note 4) | | | 574,751 | | | | 38,786 | |
| Transfer agent fees (Note 2 and 4) | | | 143,057 | | | | 53,532 | |
| Fund accounting fees (Note 4) | | | 117,797 | | | | 61,223 | |
| Registration and filing fees (Note 2) | | | 97,056 | | | | 14,865 | |
| Compliance fees and expenses (Note 4) | | | 73,241 | | | | 12,139 | |
| Custody and bank service fees | | | 58,791 | | | | 15,438 | |
| Distribution fees (Note 2 and 4) | | | 57,698 | | | | 1,109 | |
| Legal fees | | | 25,153 | | | | 25,153 | |
| Trustees’ fees and expenses (Note 4) | | | 20,998 | | | | 20,998 | |
| Audit and tax services fees | | | 17,332 | | | | 17,932 | |
| Postage and supplies | | | 27,656 | | | | 2,337 | |
| Networking fees | | | 26,906 | | | | 458 | |
| Printing of shareholder reports | | | 12,176 | | | | 7,011 | |
| Insurance expense | | | 6,533 | | | | 2,830 | |
| Borrowing costs (Note 5) | | | 923 | | | | — | |
| Other expenses | | | 22,887 | | | | 29,667 | |
| Total expenses | | | 7,783,693 | | | | 411,387 | |
| Less fees reduced and/or expenses reimbursed by Adviser (Note 4) | | | (153,762 | ) | | | (284,595 | ) |
| Net expenses | | | 7,629,931 | | | | 126,792 | |
| | | | | | | | | |
| NET INVESTMENT INCOME | | | 1,583,639 | | | | 184,104 | |
| | | | | | | | | |
| REALIZED AND UNREALIZED GAINS (LOSSES) ON INVESTMENTS AND FOREIGN CURRENCIES | | | | | | | | |
| Net realized gains (losses) from investment transactions | | | 27,257,146 | | | | (103,132 | ) |
| Net realized gains (losses) from foreign currency transactions (Note 2) | | | 5,262 | | | | (11,073 | ) |
| Net change in unrealized appreciation (depreciation) on investments | | | 193,188,400 | | | | 1,118,374 | |
| Net change in unrealized appreciation (depreciation) on foreign currency translation | | | — | | | | (397 | ) |
| NET REALIZED AND UNREALIZED GAINS ON INVESTMENTS AND FOREIGN CURRENCIES | | | 220,450,808 | | | | 1,003,772 | |
| | | | | | | | | |
| NET INCREASE IN NET ASSETS RESULTING FROM OPERATIONS | | $ | 222,034,447 | | | $ | 1,187,876 | |
See accompanying notes to financial statements.
| LYRICAL U.S. VALUE EQUITY FUND |
| STATEMENTS OF CHANGES IN NET ASSETS |
| | | Year Ended
November 30,
2024 | | | Year Ended
November 30,
2023 | |
| FROM OPERATIONS | | | | | | | | |
| Net investment income | | $ | 1,583,639 | | | $ | 2,955,292 | |
| Net realized gains (losses) from investment transactions | | | 27,257,146 | | | | (5,293,254 | ) |
| Net realized gains (losses) from foreign currency transactions | | | 5,262 | | | | (1,572 | ) |
| Net change in unrealized appreciation (depreciation) on investments | | | 193,188,400 | | | | 57,786,075 | |
| Net increase in net assets resulting from operations | | | 222,034,447 | | | | 55,446,541 | |
| | | | | | | | | |
| FROM DISTRIBUTIONS TO SHAREHOLDERS (Note 2) | | | | | | | | |
| Institutional Class | | | (3,796,417 | ) | | | (2,731,975 | ) |
| Investor Class | | | (30,907 | ) | | | (10,806 | ) |
| A Class | | | (17,367 | ) | | | (59 | ) |
| C Class | | | (4,912 | ) | | | (76 | ) |
| Decrease in net assets from distributions to shareholders | | | (3,849,603 | ) | | | (2,742,916 | ) |
| | | | | | | | | |
| CAPITAL SHARE TRANSACTIONS | | | | | | | | |
| Institutional Class | | | | | | | | |
| Proceeds from shares sold | | | 482,561,621 | | | | 133,926,339 | |
| Net asset value of shares issued in reinvestment of distributions to shareholders | | | 2,635,264 | | | | 1,435,955 | |
| Payments for shares redeemed | | | (115,635,707 | ) | | | (286,969,441 | ) |
| Net increase (decrease) in Institutional Class net assets from capital share transactions | | | 369,561,178 | | | | (151,607,147 | ) |
| | | | | | | | | |
| Investor Class | | | | | | | | |
| Proceeds from shares sold | | | 2,768,409 | | | | 2,419,124 | |
| Net asset value of shares issued in reinvestment of distributions to shareholders | | | 24,856 | | | | 8,706 | |
| Payments for shares redeemed | | | (3,208,159 | ) | | | (2,767,257 | ) |
| Net decrease in Investor Class net assets from capital share transactions | | | (414,894 | ) | | | (339,427 | ) |
| | | | | | | | | |
| A Class | | | | | | | | |
| Proceeds from shares sold | | | 5,299,654 | | | | 86,483 | |
| Net asset value of shares issued in reinvestment of distributions to shareholders | | | 1,213 | | | | 59 | |
| Payments for shares redeemed | | | (117,925 | ) | | | (3,069 | ) |
| Net increase in A Class net assets from capital share transactions | | | 5,182,942 | | | | 83,473 | |
| | | | | | | | | |
| C Class | | | | | | | | |
| Proceeds from shares sold | | | 1,303,514 | | | | 1,212,707 | |
| Net asset value of shares issued in reinvestment of distributions to shareholders | | | 4,912 | | | | 76 | |
| Payments for shares redeemed | | | (86,428 | ) | | | — | |
| Net increase in C Class net assets from capital share transactions | | | 1,221,998 | | | | 1,212,783 | |
| | | | | | | | | |
| TOTAL INCREASE (DECREASE) IN NET ASSETS | | | 593,736,068 | | | | (97,946,693 | ) |
| LYRICAL U.S. VALUE EQUITY FUND |
| STATEMENTS OF CHANGES IN NET ASSETS (Continued) |
| | | Year Ended
November 30,
2024 | | | Year Ended
November 30,
2023 | |
| NET ASSETS | | | | | | | | |
| Beginning of year | | $ | 565,133,538 | | | $ | 663,080,231 | |
| End of year | | $ | 1,158,869,606 | | | $ | 565,133,538 | |
| | | | | | | | | |
| CAPITAL SHARE ACTIVITY | | | | | | | | |
| Institutional Class | | | | | | | | |
| Shares sold | | | 18,876,107 | | | | 7,165,197 | |
| Shares issued in reinvestment of distributions to shareholders | | | 107,269 | | | | 79,466 | |
| Shares redeemed | | | (4,721,367 | ) | | | (15,120,233 | ) |
| Net increase (decrease) in shares outstanding | | | 14,262,009 | | | | (7,875,570 | ) |
| Shares outstanding at beginning of year | | | 26,320,779 | | | | 34,196,349 | |
| Shares outstanding at end of year | | | 40,582,788 | | | | 26,320,779 | |
| | | | | | | | | |
| Investor Class | | | | | | | | |
| Shares sold | | | 113,166 | | | | 125,433 | |
| Shares issued in reinvestment of distributions to shareholders | | | 1,019 | | | | 485 | |
| Shares redeemed | | | (131,719 | ) | | | (144,776 | ) |
| Net decrease in shares outstanding | | | (17,534 | ) | | | (18,858 | ) |
| Shares outstanding at beginning of year | | | 389,623 | | | | 408,481 | |
| Shares outstanding at end of year | | | 372,089 | | | | 389,623 | |
| | | | | | | | | |
| A Class | | | | | | | | |
| Shares sold | | | 238,985 | | | | 4,318 | |
| Shares issued in reinvestment of distributions to shareholders | | | 49 | | | | 3 | |
| Shares redeemed | | | (4,508 | ) | | | (150 | ) |
| Net increase in shares outstanding | | | 234,526 | | | | 4,171 | |
| Shares outstanding at beginning of year | | | 4,899 | | | | 728 | |
| Shares outstanding at end of year | | | 239,425 | | | | 4,899 | |
| | | | | | | | | |
| C Class | | | | | | | | |
| Shares sold | | | 53,405 | | | | 60,370 | |
| Shares issued in reinvestment of distributions to shareholders | | | 191 | | | | 4 | |
| Shares redeemed | | | (3,614 | ) | | | — | |
| Net increase in shares outstanding | | | 49,982 | | | | 60,374 | |
| Shares outstanding at beginning of year | | | 61,994 | | | | 1,620 | |
| Shares outstanding at end of year | | | 111,976 | | | | 61,994 | |
See accompanying notes to financial statements.
| LYRICAL INTERNATIONAL VALUE EQUITY FUND |
| STATEMENTS OF CHANGES IN NET ASSETS |
| | | Year Ended
November 30,
2024 | | | Year Ended
November 30,
2023 | |
| FROM OPERATIONS | | | | | | | | |
| Net investment income | | $ | 184,104 | | | $ | 157,365 | |
| Net realized gains (losses) from investment transactions | | | (103,132 | ) | | | 5,582 | |
| Net realized losses from foreign currency transactions | | | (11,073 | ) | | | (25,763 | ) |
| Net change in unrealized appreciation (depreciation) on investments | | | 1,118,374 | | | | (305,366 | ) |
| Net change in unrealized appreciation (depreciation) on foreign currency translation | | | (397 | ) | | | (44 | ) |
| Net increase (decrease) in net assets resulting from operations | | | 1,187,876 | | | | (168,226 | ) |
| | | | | | | | | |
| FROM DISTRIBUTIONS TO SHAREHOLDERS (Note 2) | | | | | | | | |
| Institutional Class | | | (182,872 | ) | | | (37,129 | ) |
| Investor Class | | | (3,777 | ) | | | (25,670 | ) |
| A Class | | | (80 | ) | | | (161 | ) |
| C Class | | | (36 | ) | | | (142 | ) |
| Decrease in net assets from distributions to shareholders | | | (186,765 | ) | | | (63,102 | ) |
| | | | | | | | | |
| CAPITAL SHARE TRANSACTIONS | | | | | | | | |
| Institutional Class | | | | | | | | |
| Proceeds from shares sold | | | 81,430 | | | | 10,975,623 | |
| Net asset value of shares issued in reinvestment of distributions to shareholders | | | 177,621 | | | | 37,129 | |
| Payments for shares redeemed | | | (256,707 | ) | | | (800,112 | ) |
| Net increase in Institutional Class net assets from capital share transactions | | | 2,344 | | | | 10,212,640 | |
| | | | | | | | | |
| Investor Class | | | | | | | | |
| Proceeds from shares sold | | | 140,905 | | | | 22,762 | |
| Net asset value of shares issued in reinvestment of distributions to shareholders | | | 3,777 | | | | 25,670 | |
| Payments for shares redeemed | | | (41,678 | ) | | | (682,338 | ) |
| Net increase (decrease) in Investor Class net assets from capital share transactions | | | 103,004 | | | | (633,906 | ) |
| | | | | | | | | |
| A Class | | | | | | | | |
| Net asset value of shares issued in reinvestment of distributions to shareholders | | | 80 | | | | 161 | |
| Net increase in A Class net assets from capital share transactions | | | 80 | | | | 161 | |
| | | | | | | | | |
| C Class | | | | | | | | |
| Net asset value of shares issued in reinvestment of distributions to shareholders | | | 36 | | | | 142 | |
| Net increase in C Class net assets from capital share transactions | | | 36 | | | | 142 | |
| | | | | | | | | |
| TOTAL INCREASE IN NET ASSETS | | | 1,106,575 | | | | 9,347,709 | |
| LYRICAL INTERNATIONAL VALUE EQUITY FUND |
| STATEMENTS OF CHANGES IN NET ASSETS (Continued) |
| | | Year Ended
November 30,
2024 | | | Year Ended
November 30,
2023 | |
| NET ASSETS | | | | | | | | |
| Beginning of year | | $ | 11,572,279 | | | $ | 2,224,570 | |
| End of year | | $ | 12,678,854 | | | $ | 11,572,279 | |
| | | | | | | | | |
| CAPITAL SHARE ACTIVITY | | | | | | | | |
| Institutional Class | | | | | | | | |
| Shares sold | | | 6,942 | | | | 964,356 | |
| Shares issued in reinvestment of distributions to shareholders | | | 15,027 | | | | 3,480 | |
| Shares redeemed | | | (21,775 | ) | | | (70,821 | ) |
| Net increase in shares outstanding | | | 194 | | | | 897,015 | |
| Shares outstanding at beginning of year | | | 1,010,143 | | | | 113,128 | |
| Shares outstanding at end of year | | | 1,010,337 | | | | 1,010,143 | |
| | | | | | | | | |
| Investor Class | | | | | | | | |
| Shares sold | | | 11,628 | | | | 2,042 | |
| Shares issued in reinvestment of distributions to shareholders | | | 320 | | | | 2,413 | |
| Shares redeemed | | | (3,460 | ) | | | (60,617 | ) |
| Net increase (decrease) in shares outstanding | | | 8,488 | | | | (56,162 | ) |
| Shares outstanding at beginning of year | | | 28,902 | | | | 85,064 | |
| Shares outstanding at end of year | | | 37,390 | | | | 28,902 | |
| | | | | | | | | |
| A Class | | | | | | | | |
| Shares issued in reinvestment of distributions to shareholders | | | 7 | | | | 15 | |
| Net increase in shares outstanding | | | 7 | | | | 15 | |
| Shares outstanding at beginning of year | | | 525 | | | | 510 | |
| Shares outstanding at end of year | | | 532 | | | | 525 | |
| | | | | | | | | |
| C Class | | | | | | | | |
| Shares issued in reinvestment of distributions to shareholders | | | 3 | | | | 13 | |
| Net increase in shares outstanding | | | 3 | | | | 13 | |
| Shares outstanding at beginning of year | | | 523 | | | | 510 | |
| Shares outstanding at end of year | | | 526 | | | | 523 | |
See accompanying notes to financial statements.
| LYRICAL U.S. VALUE EQUITY FUND |
| INSTITUTIONAL CLASS |
| FINANCIAL HIGHLIGHTS |
Per Share Data for a Share Outstanding Throughout Each Year:
| | | Year
Ended
Nov. 30,
2024 | | | Year
Ended
Nov. 30,
2023 | | | Year
Ended
Nov. 30,
2022 | | | Year
Ended
Nov. 30,
2021 | | | Year
Ended
Nov. 30,
2020 | |
| Net asset value at beginning of year | | $ | 21.11 | | | $ | 19.16 | | | $ | 21.59 | | | $ | 16.68 | | | $ | 15.91 | |
| | | | | | | | | | | | | | | | | | | | | |
| Income (loss) from investment operations: | | | | | | | | | | | | | | | | | | | | |
| Net investment income (a) | | | 0.05 | | | | 0.10 | | | | 0.07 | | | | 0.03 | | | | 0.10 | |
| Net realized and unrealized gains (losses) on investments and foreign currencies | | | 7.03 | | | | 1.93 | | | | (1.54 | ) | | | 5.02 | | | | 0.72 | (b) |
| Total from investment operations | | | 7.08 | | | | 2.03 | | | | (1.47 | ) | | | 5.05 | | | | 0.82 | |
| | | | | | | | | | | | | | | | | | | | | |
| Less distributions from: | | | | | | | | | | | | | | | | | | | | |
| Net investment income | | | (0.10 | ) | | | (0.08 | ) | | | (0.03 | ) | | | (0.14 | ) | | | (0.05 | ) |
| Net realized gains | | | (0.03 | ) | | | — | | | | (0.93 | ) | | | — | | | | — | |
| Total distributions | | | (0.13 | ) | | | (0.08 | ) | | | (0.96 | ) | | | (0.14 | ) | | | (0.05 | ) |
| | | | | | | | | | | | | | | | | | | | | |
| Net asset value at end of year | | $ | 28.06 | | | $ | 21.11 | | | $ | 19.16 | | | $ | 21.59 | | | $ | 16.68 | |
| | | | | | | | | | | | | | | | | | | | | |
| Total return (c) | | | 33.63 | % | | | 10.64 | % | | | (6.81 | %) | | | 30.44 | % | | | 5.16 | % |
| | | | | | | | | | | | | | | | | | | | | |
| Net assets at end of year (000,000’s) | | $ | 1,139 | | | $ | 556 | | | $ | 655 | | | $ | 696 | | | $ | 327 | |
| | | | | | | | | | | | | | | | | | | | | |
| Ratios/supplementary data: | | | | | | | | | | | | | | | | | | | | |
| Ratio of total expenses to average net assets | | | 1.00 | % | | | 1.03 | % | | | 1.02 | % | | | 1.01 | % | | | 1.25 | % |
| Ratio of net expenses to average net assets (d) | | | 0.99 | %(e) | | | 1.00 | %(e) | | | 0.99 | % | | | 0.99 | % | | | 1.22 | % |
| Ratio of net investment income to average net assets (d) | | | 0.21 | % | | | 0.51 | % | | | 0.36 | % | | | 0.13 | % | | | 0.73 | % |
| Portfolio turnover rate (f) | | | 13 | % | | | 23 | % | | | 24 | % | | | 14 | % | | | 30 | % |
| (a) | Per share net investment income has been determined on the basis of average number of shares outstanding during the year. |
| (b) | Represents a balancing figure derived from other amounts in the financial highlights table that captures all other changes affecting net asset value per share. This per share amount does not correlate to the aggregate of the net realized and unrealized losses on the Statements of Operations for the same year. |
| (c) | Total return is a measure of the change in value of an investment in the Fund over the years covered. The returns shown do not reflect the deduction of taxes a shareholder would pay on Fund distributions, if any, or the redemption of Fund shares. The total return would have been lower if the Adviser had not reduced fees (Note 4). |
| (d) | Ratio was determined after fee reductions (Note 4). |
| (e) | Includes 0.00%(g) and 0.01% of borrowing costs for 2024 and 2023, respectively (Note 5). |
| (f) | Portfolio turnover is calculated on the basis on the Fund as a whole without distinguishing among the classes of shares. |
| (g) | Amount rounds to less than 0.005%. |
See accompanying notes to financial statements.
| LYRICAL U.S. VALUE EQUITY FUND |
| INVESTOR CLASS |
| FINANCIAL HIGHLIGHTS |
Per Share Data for a Share Outstanding Throughout Each Year:
| | | Year
Ended
Nov. 30,
2024 | | | Year
Ended
Nov. 30,
2023 | | | Year
Ended
Nov. 30,
2022 | | | Year
Ended
Nov. 30,
2021 | | | Year
Ended
Nov. 30,
2020 | |
| Net asset value at beginning of year | | $ | 20.93 | | | $ | 18.99 | | | $ | 21.43 | | | $ | 16.56 | | | $ | 15.78 | |
| | | | | | | | | | | | | | | | | | | | | |
| Income (loss) from investment operations: | | | | | | | | | | | | | | | | | | | | |
| Net investment income (loss) (a) | | | (0.01 | ) | | | 0.05 | | | | 0.02 | | | | (0.02 | ) | | | 0.07 | |
| Net realized and unrealized gains (losses) on investments and foreign currencies | | | 6.97 | | | | 1.92 | | | | (1.53 | ) | | | 4.98 | | | | 0.71 | (b) |
| Total from investment operations | | | 6.96 | | | | 1.97 | | | | (1.51 | ) | | | 4.96 | | | | 0.78 | |
| | | | | | | | | | | | | | | | | | | | | |
| Less distributions from: | | | | | | | | | | | | | | | | | | | | |
| Net investment income | | | (0.05 | ) | | | (0.03 | ) | | | — | | | | (0.09 | ) | | | — | |
| Net realized gains | | | (0.03 | ) | | | — | | | | (0.93 | ) | | | — | | | | — | |
| Total distributions | | | (0.08 | ) | | | (0.03 | ) | | | (0.93 | ) | | | (0.09 | ) | | | — | |
| | | | | | | | | | | | | | | | | | | | | |
| Net asset value at end of year | | $ | 27.81 | | | $ | 20.93 | | | $ | 18.99 | | | $ | 21.43 | | | $ | 16.56 | |
| | | | | | | | | | | | | | | | | | | | | |
| Total return (c) | | | 33.30 | % | | | 10.38 | % | | | (7.03 | %) | | | 30.10 | % | | | 4.94 | % |
| | | | | | | | | | | | | | | | | | | | | |
| Net assets at end of year (000’s) | | $ | 10,347 | | | $ | 8,153 | | | $ | 7,758 | | | $ | 8,270 | | | $ | 4,914 | |
| | | | | | | | | | | | | | | | | | | | | |
| Ratios/supplementary data: | | | | | | | | | | | | | | | | | | | | |
| Ratio of total expenses to average net assets | | | 1.62 | % | | | 1.72 | % | | | 1.74 | % | | | 1.79 | % | | | 2.02 | % |
| Ratio of net expenses to average net assets (d) | | | 1.24 | %(e) | | | 1.25 | %(e) | | | 1.24 | % | | | 1.24 | % | | | 1.44 | % |
| Ratio of net investment income (loss) to average net assets (d) | | | (0.03 | %) | | | 0.26 | % | | | 0.10 | % | | | (0.12 | %) | | | 0.53 | % |
| Portfolio turnover rate (f) | | | 13 | % | | | 23 | % | | | 24 | % | | | 14 | % | | | 30 | % |
| (a) | Per share net investment income (loss) has been determined on the basis of average number of shares outstanding during the year. |
| (b) | Represents a balancing figure derived from other amounts in the financial highlights table that captures all other changes affecting net asset value per share. This per share amount does not correlate to the aggregate of the net realized and unrealized losses on the Statements of Operations for the same year. |
| (c) | Total return is a measure of the change in value of an investment in the Fund over the years covered. The returns shown do not reflect the deduction of taxes a shareholder would pay on Fund distributions, if any, or the redemption of Fund shares. The total return would have been lower if the Adviser had not reduced fees (Note 4). |
| (d) | Ratio was determined after fee reductions (Note 4). |
| (e) | Includes 0.00%(g) and 0.01% of borrowing costs for 2024 and 2023, respectively (Note 5). |
| (f) | Portfolio turnover is calculated on the basis on the Fund as a whole without distinguishing among the classes of shares. |
| (g) | Amount rounds to less than 0.005%. |
See accompanying notes to financial statements.
| LYRICAL U.S. VALUE EQUITY FUND |
| A CLASS |
| FINANCIAL HIGHLIGHTS |
Per Share Data for a Share Outstanding Throughout Each Period:
| | | Year
Ended
Nov. 30,
2024 | | | Year
Ended
Nov. 30,
2023 | | | Period
Ended
Nov. 30,
2022 (a) | |
| Net asset value at beginning of period | | $ | 21.05 | | | $ | 19.14 | | | $ | 18.23 | |
| | | | | | | | | | | | | |
| Income (loss) from investment operations: | | | | | | | | | | | | |
| Net investment income (loss) (b) | | | (0.00 | )(c) | | | 0.06 | | | | 0.03 | |
| Net realized and unrealized gains on investments and foreign currencies | | | 6.99 | | | | 1.92 | | | | 1.81 | (d) |
| Total from investment operations | | | 6.99 | | | | 1.98 | | | | 1.84 | |
| | | | | | | | | | | | | |
| Less distributions from: | | | | | | | | | | | | |
| Net investment income | | | (0.10 | ) | | | (0.07 | ) | | | — | |
| Net realized gains | | | (0.03 | ) | | | — | | | | (0.93 | ) |
| Total distributions | | | (0.13 | ) | | | (0.07 | ) | | | (0.93 | ) |
| | | | | | | | | | | | | |
| Net asset value at end of period | | $ | 27.91 | | | $ | 21.05 | | | $ | 19.14 | |
| | | | | | | | | | | | | |
| Total return (e) | | | 33.27 | % | | | 10.38 | % | | | 10.12 | %(f) |
| | | | | | | | | | | | | |
| Net assets at end of period (000’s) | | $ | 6,683 | | | $ | 103 | | | $ | 14 | |
| | | | | | | | | | | | | |
| Ratios/supplementary data: | | | | | | | | | | | | |
| Ratio of total expenses to average net assets | | | 1.56 | % | | | 29.74 | % | | | 176.77 | %(g) |
| Ratio of net expenses to average net assets (h) | | | 1.24 | %(i) | | | 1.25 | %(i) | | | 1.24 | %(g) |
| Ratio of net investment income (loss) to average net assets (h) | | | (0.02 | %) | | | 0.31 | % | | | 0.36 | %(g) |
| Portfolio turnover rate (j) | | | 13 | % | | | 23 | % | | | 24 | %(f) |
| (a) | Represents the period from the commencement of operations (July 5, 2022) through November 30, 2022. |
| (b) | Per share net investment income (loss) has been determined on the basis of average number of shares outstanding during the period. |
| (c) | Amount rounds to less than $0.01. |
| (d) | Represents a balancing figure derived from other amounts in the financial highlights table that captures all other changes affecting net asset value per share. This per share amount does not correlate to the aggregate of the net realized and unrealized losses on the Statements of Operations for the same period. |
| (e) | Total return is a measure of the change in value of an investment in the Fund over the period covered. The return shown does not reflect the deduction of taxes a shareholder would pay on Fund distributions, if any, or the redemption of Fund shares. The total returns would be lower if the Adviser had not reduced fees and/ or reimbursed expenses (Note 4). Calculation does not reflect sales load. |
| (f) | Not annualized. |
| (g) | Annualized. |
| (h) | Ratio was determined after fee reductions and/or expense reimbursements (Note 4). |
| (i) | Includes 0.00%(k) and 0.01% of borrowing costs for 2024 and 2023, respectively (Note 5). |
| (j) | Portfolio turnover is calculated on the basis on the Fund as a whole without distinguishing among the classes of shares. |
| (k) | Amount rounds to less than 0.005%. |
See accompanying notes to financial statements.
| LYRICAL U.S. VALUE EQUITY FUND |
| C CLASS |
| FINANCIAL HIGHLIGHTS |
Per Share Data for a Share Outstanding Throughout Each Period:
| | | Year | | | Year | | | Period | |
| | | Ended | | | Ended | | | Ended | |
| | | Nov. 30, | | | Nov. 30, | | | Nov. 30, | |
| | | 2024 | | | 2023 | | | 2022 (a) | |
| Net asset value at beginning of period | | $ | 20.85 | | | $ | 19.08 | | | $ | 18.23 | |
| | | | | | | | | | | | | |
| Income (loss) from investment operations: | | | | | | | | | | | | |
| Net investment loss (b) | | | (0.19 | ) | | | (0.07 | ) | | | (0.03 | ) |
| Net realized and unrealized gains on investments and foreign currencies | | | 6.93 | | | | 1.89 | | | | 1.81 | (c) |
| Total from investment operations | | | 6.74 | | | | 1.82 | | | | 1.78 | |
| | | | | | | | | | | | | |
| Less distributions from: | | | | | | | | | | | | |
| Net investment income | | | (0.03 | ) | | | (0.05 | ) | | | — | |
| Net realized gains | | | (0.03 | ) | | | — | | | | (0.93 | ) |
| Total distributions | | | (0.06 | ) | | | (0.05 | ) | | | (0.93 | ) |
| | | | | | | | | | | | | |
| Net asset value at end of period | | $ | 27.53 | | | $ | 20.85 | | | $ | 19.08 | |
| | | | | | | | | | | | | |
| Total return (d) | | | 32.33 | % | | | 9.56 | % | | | 9.79 | %(e) |
| | | | | | | | | | | | | |
| Net assets at end of period (000’s) | | $ | 3,082 | | | $ | 1,292 | | | $ | 31 | |
| | | | | | | | | | | | | |
| Ratios/supplementary data: | | | | | | | | | | | | |
| Ratio of total expenses to average net assets | | | 2.88 | % | | | 6.64 | % | | | 196.90 | %(f) |
| Ratio of net expenses to average net assets (g) | | | 1.99 | %(h) | | | 2.00 | %(h) | | | 1.99 | %(f) |
| Ratio of net investment loss to average net assets (g) | | | (0.77 | %) | | | (0.38 | %) | | | (0.36 | %)(f) |
| Portfolio turnover rate (i) | | | 13 | % | | | 23 | % | | | 24 | %(e) |
| (a) | Represents the period from the commencement of operations (July 5, 2022) through November 30, 2022. |
| (b) | Per share net investment loss has been determined on the basis of average number of shares outstanding during the period. |
| (c) | Represents a balancing figure derived from other amounts in the financial highlights table that captures all other changes affecting net asset value per share. This per share amount does not correlate to the aggregate of the net realized and unrealized losses on the Statements of Operations for the same period. |
| (d) | Total return is a measure of the change in value of an investment in the Fund over the period covered. The return shown does not reflect the deduction of taxes a shareholder would pay on Fund distributions, if any, or the redemption of Fund shares. The total returns would be lower if the Adviser had not reduced fees and/ or reimbursed expenses (Note 4). Calculation does not reflect CDSC. |
| (e) | Not annualized. |
| (f) | Annualized. |
| (g) | Ratio was determined after fee reductions and/or expense reimbursements. |
| (h) | Includes 0.00%(j) and 0.01% of borrowing costs for 2024 and 2023, respectively (Note 5). |
| (i) | Portfolio turnover is calculated on the basis on the Fund as a whole without distinguishing among the classes of shares. |
| (j) | Amount rounds to less than 0.005%. |
See accompanying notes to financial statements.
| LYRICAL INTERNATIONAL VALUE EQUITY FUND |
| INSTITUTIONAL CLASS |
| FINANCIAL HIGHLIGHTS |
Per Share Data for a Share Outstanding Throughout Each Period:
| | | Year | | | Year | | | Year | | | Year | | | Period | |
| | | Ended | | | Ended | | | Ended | | | Ended | | | Ended | |
| | | Nov. 30, | | | Nov. 30, | | | Nov. 30, | | | Nov. 30, | | | Nov. 30, | |
| | | 2024 | | | 2023 | | | 2022 | | | 2021 | | | 2020 (a) | |
| Net asset value at beginning of period | | $ | 11.13 | | | $ | 11.19 | | | $ | 12.03 | | | $ | 11.02 | | | $ | 10.00 | |
| | | | | | | | | | | | | | | | | | | | | |
| Income (loss) from investment operations: | | | | | | | | | | | | | | | | | | | | |
| Net investment income (b) | | | 0.18 | | | | 0.18 | | | | 0.11 | | | | 0.05 | | | | 0.05 | |
| Net realized and unrealized gains (losses) on investments and foreign currencies | | | 0.96 | | | | 0.09 | | | | (0.94 | ) | | | 1.69 | | | | 0.97 | |
| Total from investment operations | | | 1.14 | | | | 0.27 | | | | (0.83 | ) | | | 1.74 | | | | 1.02 | |
| | | | | | | | | | | | | | | | | | | | | |
| Less distributions from: | | | | | | | | | | | | | | | | | | | | |
| Net investment income | | | (0.18 | ) | | | (0.33 | ) | | | — | | | | (0.05 | ) | | | — | |
| Net realized gains | | | — | | | | — | | | | (0.01 | ) | | | (0.68 | ) | | | — | |
| Total distributions | | | (0.18 | ) | | | (0.33 | ) | | | (0.01 | ) | | | (0.73 | ) | | | — | |
| | | | | | | | | | | | | | | | | | | | | |
| Net asset value at end of period | | $ | 12.09 | | | $ | 11.13 | | | $ | 11.19 | | | $ | 12.03 | | | $ | 11.02 | |
| | | | | | | | | | | | | | | | | | | | | |
| Total return (c) | | | 10.28 | % | | | 2.52 | % | | | (6.88 | %) | | | 15.84 | % | | | 10.20 | %(d) |
| | | | | | | | | | | | | | | | | | | | | |
| Net assets at end of period (000’s) | | $ | 12,216 | | | $ | 11,241 | | | $ | 1,266 | | | $ | 1,355 | | | $ | 613 | |
| | | | | | | | | | | | | | | | | | | | | |
| Ratios/supplementary data: | | | | | | | | | | | | | | | | | | | | |
| Ratio of total expenses to average net assets | | | 2.87 | % | | | 3.48 | % | | | 12.32 | % | | | 11.34 | % | | | 21.16 | %(e) |
| Ratio of net expenses to average net assets (f) | | | 0.99 | % | | | 1.00 | %(g) | | | 0.99 | % | | | 0.99 | % | | | 1.03 | %(e) |
| Ratio of net investment income to average net assets (f) | | | 1.46 | % | | | 1.62 | % | | | 1.00 | % | | | 0.36 | % | | | 0.72 | %(e) |
| Portfolio turnover rate (h) | | | 31 | % | | | 40 | % | | | 33 | % | | | 34 | % | | | 25 | %(d) |
| (a) | Represents the year from the commencement of operations (March 2, 2020) through November 30, 2020. |
| (b) | Per share net investment income has been determined on the basis of average number of shares outstanding during the year/period. |
| (c) | Total return is a measure of the change in value of an investment in the Fund over the years covered. The returns shown do not reflect the deduction of taxes a shareholder would pay on Fund distributions, if any, or the redemption of Fund shares. The total returns would have been lower if the Adviser had not reduced fees and/or reimbursed expenses (Note 4). |
| (d) | Not annualized. |
| (e) | Annualized. |
| (f) | Ratio was determined after fee reductions and/or expense reimbursements (Note 4). |
| (g) | Includes 0.01% of borrowing costs (Note 5). |
| (h) | Portfolio turnover is calculated on the basis on the Fund as a whole without distinguishing among the classes of shares. |
See accompanying notes to financial statements.
| LYRICAL INTERNATIONAL VALUE EQUITY FUND |
| INVESTOR CLASS |
| FINANCIAL HIGHLIGHTS |
Per Share Data for a Share Outstanding Throughout Each Period:
| | | Year | | | Year | | | Year | | | Year | | | Period | |
| | | Ended | | | Ended | | | Ended | | | Ended | | | Ended | |
| | | Nov. 30, | | | Nov. 30, | | | Nov. 30, | | | Nov. 30, | | | Nov. 30, | |
| | | 2024 | | | 2023 | | | 2022 | | | 2021 | | | 2020 (a) | |
| Net asset value at beginning of period | | $ | 11.07 | | | $ | 11.13 | | | $ | 12.00 | | | $ | 11.00 | | | $ | 10.00 | |
| | | | | | | | | | | | | | | | | | | | | |
| Income (loss) from investment operations: | | | | | | | | | | | | | | | | | | | | |
| Net investment income (b) | | | 0.15 | | | | 0.12 | | | | 0.08 | | | | 0.02 | | | | 0.04 | |
| Net realized and unrealized gains (losses) on investments and foreign currencies | | | 0.96 | | | | 0.12 | | | | (0.94 | ) | | | 1.69 | | | | 0.96 | |
| Total from investment operations | | | 1.11 | | | | 0.24 | | | | (0.86 | ) | | | 1.71 | | | | 1.00 | |
| | | | | | | | | | | | | | | | | | | | | |
| Less distributions from: | | | | | | | | | | | | | | | | | | | | |
| Net investment income | | | (0.13 | ) | | | (0.30 | ) | | | — | | | | (0.03 | ) | | | — | |
| Net realized gains | | | — | | | | — | | | | (0.01 | ) | | | (0.68 | ) | | | — | |
| Total distributions | | | (0.13 | ) | | | (0.30 | ) | | | (0.01 | ) | | | (0.71 | ) | | | — | |
| | | | | | | | | | | | | | | | | | | | | |
| Net asset value at end of period | | $ | 12.05 | | | $ | 11.07 | | | $ | 11.13 | | | $ | 12.00 | | | $ | 11.00 | |
| | | | | | | | | | | | | | | | | | | | | |
| Total return (c) | | | 10.06 | % | | | 2.27 | % | | | (7.15 | %) | | | 0.16 | % | | | 10.00 | %(d) |
| | | | | | | | | | | | | | | | | | | | | |
| Net assets at end of period (000’s) | | $ | 451 | | | $ | 320 | | | $ | 947 | | | $ | 1,127 | | | $ | 663 | |
| | | | | | | | | | | | | | | | | | | | | |
| Ratios/supplementary data: | | | | | | | | | | | | | | | | | | | | |
| Ratio of total expenses to average net assets | | | 6.79 | % | | | 6.00 | % | | | 12.90 | % | | | 11.70 | % | | | 21.14 | %(e) |
| Ratio of net expenses to average net assets (f) | | | 1.24 | % | | | 1.25 | %(g) | | | 1.24 | % | | | 1.24 | % | | | 1.27 | %(e) |
| Ratio of net investment income to average net assets (f) | | | 1.27 | % | | | 1.08 | % | | | 0.76 | % | | | 0.16 | % | | | 0.52 | %(e) |
| Portfolio turnover rate (h) | | | 31 | % | | | 40 | % | | | 33 | % | | | 34 | % | | | 25 | %(d) |
| (a) | Represents the period from the commencement of operations (March 2, 2020) through November 30, 2020. |
| (b) | Per share net investment income has been determined on the basis of average number of shares outstanding during the period. |
| (c) | Total return is a measure of the change in value of an investment in the Fund over the periods covered. The returns shown do not reflect the deduction of taxes a shareholder would pay on Fund distributions, if any, or the redemption of Fund shares. The total returns would have been lower if the Adviser had not reduced fees and/or reimbursed expenses. (Note 4) |
| (d) | Not annualized. |
| (e) | Annualized. |
| (f) | Ratio was determined after fee reductions and/or expense reimbursements (Note 4). |
| (g) | Includes 0.01% of borrowing costs (Note 5). |
| (h) | Portfolio turnover is calculated on the basis on the Fund as a whole without distinguishing among the classes of shares. |
See accompanying notes to financial statements.
| LYRICAL INTERNATIONAL VALUE EQUITY FUND |
| A CLASS |
| FINANCIAL HIGHLIGHTS |
Per Share Data for a Share Outstanding Throughout Each Period:
| | | Year | | | Year | | | Period | |
| | | Ended | | | Ended | | | Ended | |
| | | Nov. 30, | | | Nov. 30, | | | Nov. 30, | |
| | | 2024 | | | 2023 | | | 2022 (a) | |
| Net asset value at beginning of period | | $ | 11.11 | | | $ | 11.18 | | | $ | 9.82 | |
| | | | | | | | | | | | | |
| Income from investment operations: | | | | | | | | | | | | |
| Net investment income (b) | | | 0.15 | | | | 0.13 | | | | 0.01 | |
| Net realized and unrealized gains on investments and foreign currencies | | | 0.96 | | | | 0.12 | | | | 1.36 | (c) |
| Total from investment operations | | | 1.11 | | | | 0.25 | | | | 1.37 | |
| | | | | | | | | | | | | |
| Less distributions from: | | | | | | | | | | | | |
| Net investment income | | | (0.15 | ) | | | (0.32 | ) | | | — | |
| Net realized gains | | | — | | | | — | | | | (0.01 | ) |
| Total distributions | | | (0.15 | ) | | | (0.32 | ) | | | (0.01 | ) |
| | | | | | | | | | | | | |
| Net asset value at end of period | | $ | 12.07 | | | $ | 11.11 | | | $ | 11.18 | |
| | | | | | | | | | | | | |
| Total return (d) | | | 10.03 | % | | | 2.31 | % | | | 13.97 | %(e) |
| | | | | | | | | | | | | |
| Net assets at end of period | | $ | 6,413 | | | $ | 5,828 | | | $ | 5,700 | |
| | | | | | | | | | | | | |
| Ratios/supplementary data: | | | | | | | | | | | | |
| Ratio of total expenses to average net assets | | | 246.84 | % | | | 256.73 | % | | | 264.21 | %(f) |
| Ratio of net expenses to average net assets (g) | | | 1.24 | % | | | 1.25 | %(h) | | | 1.24 | %(f) |
| Ratio of net investment income to average net assets (g) | | | 1.21 | % | | | 1.14 | % | | | 0.14 | %(f) |
| Portfolio turnover rate (i) | | | 31 | % | | | 40 | % | | | 33 | %(e) |
| (a) | Represents the period from the commencement of operations (July 5, 2022) through November 30, 2022. |
| (b) | Per share net investment income has been determined on the basis of average number of shares outstanding during the period. |
| (c) | Represents a balancing figure derived from other amounts in the financial highlights table that captures all other changes affecting net asset value per share. This per share amount does not correlate to the aggregate of the net realized and unrealized losses on the Statements of Operations for the same period. |
| (d) | Total return is a measure of the change in value of an investment in the Fund over the period covered. The return shown does not reflect the deduction of taxes a shareholder would pay on Fund distributions, if any, or the redemption of Fund shares. The total returns would be lower if the Adviser had not reduced fees and/ or reimbursed expenses (Note 4). Calculation does not reflect sales load. |
| (e) | Not annualized. |
| (f) | Annualized. |
| (g) | Ratio was determined after fee reductions and/or expense reimbursements (Note 4). |
| (h) | Includes 0.01% of borrowing costs (Note 5). |
| (i) | Portfolio turnover is calculated on the basis on the Fund as a whole without distinguishing among the classes of shares. |
See accompanying notes to financial statements.
| LYRICAL INTERNATIONAL VALUE EQUITY FUND |
| C CLASS |
| FINANCIAL HIGHLIGHTS |
Per Share Data for a Share Outstanding Throughout Each Period:
| | | Year | | | Year | | | Period | |
| | | Ended | | | Ended | | | Ended | |
| | | Nov. 30, | | | Nov. 30, | | | Nov. 30, | |
| | | 2024 | | | 2023 | | | 2022 (a) | |
| Net asset value at beginning of period | | $ | 11.03 | | | $ | 11.15 | | | $ | 9.82 | |
| | | | | | | | | | | | | |
| Income (loss) from investment operations: | | | | | | | | | | | | |
| Net investment income (loss) (b) | | | 0.05 | | | | 0.05 | | | | (0.03 | ) |
| Net realized and unrealized gains on investments and foreign currencies | | | 0.96 | | | | 0.11 | | | | 1.37 | (c) |
| Total from investment operations | | | 1.01 | | | | 0.16 | | | | 1.34 | |
| | | | | | | | | | | | | |
| Less distributions from: | | | | | | | | | | | | |
| Net investment income | | | (0.07 | ) | | | (0.28 | ) | | | — | |
| Net realized gains | | | — | | | | — | | | | (0.01 | ) |
| Total distributions | | | (0.07 | ) | | | (0.28 | ) | | | (0.01 | ) |
| | | | | | | | | | | | | |
| Net asset value at end of period | | $ | 11.97 | | | $ | 11.03 | | | $ | 11.15 | |
| | | | | | | | | | | | | |
| Total return (d) | | | 9.15 | % | | | 1.51 | % | | | 13.67 | %(e) |
| | | | | | | | | | | | | |
| Net assets at end of period | | $ | 6,297 | | | $ | 5,767 | | | $ | 5,682 | |
| | | | | | | | | | | | | |
| Ratios/supplementary data: | | | | | | | | | | | | |
| Ratio of total expenses to average net assets | | | 251.13 | % | | | 259.21 | % | | | 265.34 | %(f) |
| Ratio of net expenses to average net assets (g) | | | 1.99 | % | | | 2.00 | %(h) | | | 1.99 | %(f) |
| Ratio of net investment income (loss) to average net assets (g) | | | 0.45 | % | | | 0.40 | %(h) | | | (0.60 | %)(f) |
| Portfolio turnover rate (i) | | | 31 | % | | | 40 | % | | | 33 | %(e) |
| (a) | Represents the period from the commencement of operations (July 5, 2022) through Novemeber 30, 2022. |
| (b) | Per share net investment income (loss) has been determined on the basis of average number of shares outstanding during the period. |
| (c) | Represents a balancing figure derived from other amounts in the financial highlights table that captures all other changes affecting net asset value per share. This per share amount does not correlate to the aggregate of the net realized and unrealized losses on the Statements of Operations for the same period. |
| (d) | Total return is a measure of the change in value of an investment in the Fund over the period covered. The return shown does not reflect the deduction of taxes a shareholder would pay on Fund distributions, if any, or the redemption of Fund shares. The total returns would be lower if the Adviser had not reduced fees and/ or reimbursed expenses (Note 4). Calculation does not reflect CDSC. |
| (e) | Not annualized. |
| (f) | Annualized. |
| (g) | Ratio was determined after fee reductions and/or expense reimbursements (Note 4). |
| (h) | Includes 0.01% of borrowing costs (Note 5). |
| (i) | Portfolio turnover is calculated on the basis on the Fund as a whole without distinguishing among the classes of shares. |
See accompanying notes to financial statements.
LYRICAL FUNDS
NOTES TO FINANCIAL STATEMENTS
November 30, 2024
1. Organization
Lyrical U.S. Value Equity Fund and Lyrical International Value Equity Fund (individually, a “Fund” and collectively, the “Funds”) are each a diversified series of Ultimus Managers Trust (the “Trust”), an open-end investment company established as an Ohio business trust under a Declaration of Trust dated February 28, 2012. Other series of the Trust are not incorporated in this report. Lyrical U.S. Value Equity Fund commenced operations on February 4, 2013. Lyrical International Value Equity Fund commenced operations on March 2, 2020.
The investment objective of each Fund is to seek to achieve long-term capital growth.
Each Fund currently offers four classes of shares: Institutional Class shares (sold without any sales loads and distribution and/or shareholder service fees and requiring a $100,000 initial investment), Investor Class shares (sold without any sales loads, but subject to a distribution and/or shareholder service fee of up to 0.25% of the average daily net assets attributable to Investor Class shares, and requiring a $2,500 initial investment), A Class shares (sold subject to an initial maximum front end sales load of 5.75% and a distribution and/or shareholder service fee of up to 0.25% of the average daily net assets attributable to A Class shares, and requiring a $1,000 initial investment and for purchases of $1,000,000 or more, a front end sales load is not charged, but a 1.00% contingent deferred sales charge (“CDSC”) may be charged if redeemed during the first 18 months), and C Class shares (sold subject to a CDSC fee of 1.00% if the shares are redeemed within 12 months after the original purchase of the shares and a distribution and/or shareholder servicing fee of up to 1.00% of the average daily net assets attributable to C Class shares, and requiring a $1,000 initial investment) (each a “Class”). Each share class represents an ownership interest in the same investment portfolio.
2. Significant Accounting Policies
The following is a summary of the Funds’ significant accounting policies. The policies are in conformity with accounting principles generally accepted in the United States of America (“GAAP”). The Funds follow accounting and reporting guidance under Financial Accounting Standards Board Accounting Standards Codification Topic 946, “Financial Services – Investment Companies.”
Regulatory update – Tailored Shareholder Reports for Mutual Funds and Exchange-Traded Funds (“ETFs”) – Effective January 24, 2023, the Securities and Exchange Commission (the “SEC”) adopted rule and form amendments to require mutual funds and ETFs to transmit concise and visually engaging streamlined annual and semiannual reports to shareholders that highlight key information. Other information, including financial statements, will no longer appear in a streamlined shareholder report but must be available online, delivered free of charge upon request, and filed on a semiannual basis
LYRICAL FUNDS
NOTES TO FINANCIAL STATEMENTS (Continued)
on Form N-CSR. The rule and form amendments had a compliance date of July 24, 2024. The Funds have implemented the rule and form amendments, as applicable, and are currently adhering to the requirements.
Securities valuation – Each Fund values its portfolio securities at market value as of the close of regular trading on the New York Stock Exchange (the “NYSE”) (normally 4:00 p.m. Eastern time) on each business day the NYSE is open for business. The Funds value their listed securities on the basis of the security’s last sale price on the security’s primary exchange, if available, otherwise at the exchange’s most recently quoted mean price. NASDAQ-listed securities are valued at the NASDAQ Official Closing Price. Investments representing shares of money market funds and other open-end investment companies are valued at their net asset value (“NAV”) as reported by such companies. When using a quoted price and when the market is considered active, the security will be classified as Level 1 within the fair value hierarchy (see below). In the event that market quotations are not readily available or are considered unreliable due to market or other events, the Funds value their securities and other assets at fair value as determined by Lyrical Asset Management L.P. (the “Adviser”), as the valuation designee, in accordance with procedures adopted by the Board of Trustees (the “Board”) pursuant to Rule 2a-5 under the Investment Company Act of 1940, as amended (the “1940 Act”). Under these procedures, the securities will be classified as Level 2 or 3 within the fair value hierarchy, depending on the inputs used. Unavailable or unreliable market quotes may be due to the following factors: a substantial bid-ask spread; infrequent sales resulting in stale prices; insufficient trading volume; small trade sizes; a temporary lapse in any reliable pricing source; and actions of the securities or futures markets, such as the suspension or limitation of trading. As a result, the prices of securities used to calculate each Fund’s NAV may differ from quoted or published prices for the same securities.
GAAP establishes a single authoritative definition of fair value, sets out a framework for measuring fair value, and requires additional disclosures about fair value measurements.
Various inputs are used in determining the value of each Fund’s investments. These inputs are summarized in the three broad levels listed below:
| ● | Level 1 – quoted prices in active markets for identical securities |
| ● | Level 2 – other significant observable inputs |
| ● | Level 3 – significant unobservable inputs |
The inputs or methods used for valuing securities are not necessarily an indication of the risks associated with investing in those securities. The inputs used to measure fair value may fall into different levels of the fair value hierarchy. In such cases, for disclosure purposes, the level in the fair value hierarchy within which the fair value measurement falls in its entirety is determined based on the lowest level input that is significant to the fair value measurement.
LYRICAL FUNDS
NOTES TO FINANCIAL STATEMENTS (Continued)
Lyrical International Value Equity Fund’s foreign equity securities actively traded in foreign markets may be classified as Level 2 despite the availability of closing prices because such securities are typically fair valued by an independent pricing service. The Board has authorized the Fund to retain an independent pricing service to determine the fair value of its foreign securities because the value of such securities may be materially affected by events occurring before the Fund’s pricing time but after the close of the primary markets or exchanges on which such foreign securities are traded. These intervening events might be country-specific (e.g., natural disaster, economic or political developments, interest rate change); issuer specific (e.g., earnings report or merger announcement); or U.S. market-specific (such as a significant movement in the U.S. market that is deemed to affect the value of foreign securities). The pricing service uses an automated system that incorporates a model based on multiple parameters, including a security’s local closing price, relevant general and sector indices, currency fluctuations, trading in depositary receipts and futures, if applicable, and/or research valuations by its staff, in determining what it believes is the fair value of the securities.
The following is a summary of each Fund’s investments by the inputs used to value the investments as of November 30, 2024:
| Lyrical U.S. Value Equity Fund | | Level 1 | | | Level 2 | | | Level 3 | | | Total | |
| Common Stocks | | $ | 1,136,563,818 | | | $ | — | | | $ | — | | | $ | 1,136,563,818 | |
| Money Market Funds | | | 22,840,101 | | | | — | | | | — | | | | 22,840,101 | |
| Total | | $ | 1,159,403,919 | | | $ | — | | | $ | — | | | $ | 1,159,403,919 | |
| | | | | | | | | | | | | | | | | |
| Lyrical International Value Equity Fund | | Level 1 | | | Level 2 | | | Level 3 | | | Total | |
| Common Stocks | | $ | 4,384,315 | | | $ | 8,161,138 | * | | $ | — | | | $ | 12,545,453 | |
| Money Market Funds | | | 114,443 | | | | — | | | | — | | | | 114,443 | |
| Total | | $ | 4,498,758 | | | $ | 8,161,138 | | | $ | — | | | $ | 12,659,896 | |
| | | | | | | | | | | | | | | | | |
| * | With respect to foreign equity securities that are principally traded on a market outside the United States, the Board has approved the utilization of an independent fair value pricing service to evaluate the effect of market fluctuations on these securities after the close of trading in that foreign market. To the extent that securities are valued using this service, they will be classified as Level 2 securities. |
Refer to each Fund’s Schedule of Investments for a listing of securities by sector and industry type or geographical region. The Funds did not hold any derivative instruments or any assets or liabilities that were measured at fair value on a recurring basis using significant unobservable inputs (Level 3) as of or during the year ended November 30, 2024.
LYRICAL FUNDS
NOTES TO FINANCIAL STATEMENTS (Continued)
Share valuation – The NAV per share of each class of each Fund is calculated daily by dividing the total value of the assets attributable to that class, less liabilities attributable to that class, by the number of shares outstanding of that class. The offering price and redemption price per share of each class of each Fund is equal to the NAV per share of such class.
Investment income – Dividend income is recorded on the ex-dividend date. Interest income is accrued as earned. Non-cash dividends included in dividend income, if any, are recorded at the fair value of the security received. Withholding taxes on foreign dividends have been recorded in accordance with the Funds’ understanding of the applicable country’s rules and tax rates.
Investment transactions – Investment transactions are accounted for on the trade date. Realized gains and losses on investments sold are determined on a specific identification basis.
Foreign currency translation – Securities and other assets and liabilities denominated in or expected to settle in foreign currencies, if any, are translated into U.S. dollars based on exchange rates on the following basis:
| A. | The fair values of investment securities and other assets and liabilities are translated as of the close of the NYSE each day. |
| B. | Purchases and sales of investment securities and income and expenses are translated at the rate of exchange prevailing as of 4:00 p.m. Eastern time on the respective date of such transactions. |
| C. | The Funds do not isolate that portion of the results of operations caused by changes in foreign exchange rates on investments from those caused by changes in market prices of securities held. Such fluctuations are included with the net realized and unrealized gains or losses on investments. |
Reported net realized foreign exchange gains or losses arise from 1) purchases and sales of foreign currencies, 2) currency gains or losses realized between trade and settlement dates on securities transactions, and 3) the difference between the amounts of dividends and foreign withholding taxes recorded on each Fund’s books and the U.S. dollar equivalent of the amounts actually received or paid. Reported net unrealized foreign exchange gains and losses arise from changes in the value of assets and liabilities other than investments in securities that result from changes in exchange rates.
Allocation between classes – Investment income earned, realized capital gains and losses, and unrealized appreciation and depreciation are allocated daily to each class of a Fund based upon its proportionate share of total net assets of that Fund. Class-specific expenses are charged directly to the class incurring the expense. Common expenses which are not attributable to a specific class are allocated daily to each class of shares of
LYRICAL FUNDS
NOTES TO FINANCIAL STATEMENTS (Continued)
a Fund based upon its proportionate share of total net assets of that Fund. Distribution fees, registration and filing fees and transfer agent fees are class specific expenses. For the year ending November 30, 2024, class specific expenses were as follows:
| | | Institutional | | | Investor | | | A Class | | | C Class | | | Total | |
| Lyrical U.S. Value Equity Fund | | | | | | | | | | | | | | | | | | | | |
| Expenses | | | | | | | | | | | | | | | | | | | | |
| Distribution fees | | $ | — | | | $ | 23,026 | | | $ | 13,429 | | | $ | 21,243 | | | $ | 57,698 | |
| Registration and filing fees | | | 71,311 | | | | 15,237 | | | | 4,677 | | | | 5,831 | | | | 97,056 | |
| Transfer Agent fees | | | 95,707 | | | | 20,584 | | | | 13,383 | | | | 13,383 | | | | 143,057 | |
| | | | | | | | | | | | | | | | | | | | | |
| Lyrical International Value Equity Fund | | | | | | | | | | | | | | | | | | | | |
| Expenses | | | | | | | | | | | | | | | | | | | | |
| Distribution fees | | $ | — | | | $ | 1,031 | | | $ | 15 | | | $ | 63 | | | $ | 1,109 | |
| Registration and filing fees | | | 7,797 | | | | 2,498 | | | | 2,285 | | | | 2,285 | | | | 14,865 | |
| Transfer Agent fees | | | 13,383 | | | | 13,383 | | | | 13,383 | | | | 13,383 | | | | 53,532 | |
Common expenses – Common expenses of the Trust are allocated among the Funds and the other series of the Trust based on the relative net assets of each series, the number of series in the Trust, or the nature of the services performed and the relative applicability to each series.
Distributions to shareholders – Each Fund distributes to shareholders any net investment income dividends and net realized capital gains distributions at least once each year. The amount of such dividends and distributions are determined in accordance with federal income tax regulations, which may differ from GAAP. Dividends and distributions to shareholders are recorded on the ex-dividend date. The Funds may utilize earnings and profits distributed to shareholders on redemption of shares as part of the dividends paid deduction for income tax purposes. The tax character of distributions paid to shareholders by the Funds during the years ended November 30, 2024 and 2023 was as follows:
| | | Year
Ended | | | Ordinary
Income | | | Long-Term
Capital Gains | | | Total
Distributions | |
| Lyrical U.S. Value Equity Fund | | 11/30/2024 | | | $ | 2,681,605 | | | $ | 1,167,998 | | | $ | 3,849,603 | |
| | | 11/30/2023 | | | $ | 2,742,916 | | | $ | — | | | $ | 2,742,916 | |
| | | | | | | | | | | | | | | | |
| Lyrical International Value Equity Fund | | 11/30/2024 | | | $ | 186,765 | | | $ | — | | | $ | 186,765 | |
| | | 11/30/2023 | | | $ | 63,102 | | | $ | — | | | $ | 63,102 | |
| | | | | | | | | | | | | | | | |
LYRICAL FUNDS
NOTES TO FINANCIAL STATEMENTS (Continued)
Estimates – The preparation of financial statements in conformity with GAAP requires management to make estimates and assumptions that affect the reported amounts of assets and liabilities and disclosure of contingent assets and liabilities as of the date of the financial statements and the reported amounts of increase (decrease) in net assets from operations during the reporting period. Actual results could differ from those estimates.
Federal income tax – Each Fund has qualified and intends to continue to qualify as a regulated investment company under the Internal Revenue Code of 1986, as amended (the “Code”). Qualification generally will relieve the Funds of liability for federal income taxes to the extent 100% of their net investment income and net realized capital gains are distributed in accordance with the Code.
In order to avoid imposition of the excise tax applicable to regulated investment companies, it is also each Fund’s intention to declare as dividends in each calendar year at least 98% of its net investment income (earned during the calendar year) and 98.2% of its net realized capital gains (earned during the twelve months ended October 31) plus undistributed amounts from prior years.
The following information is computed on a tax basis for each item as of November 30, 2024:
| | | Lyrical
U.S. Value
Equity Fund | | | Lyrical
International Value
Equity Fund | |
| Tax cost of investments | | $ | 829,430,763 | | | $ | 11,825,716 | |
| Gross unrealized appreciation | | $ | 369,464,574 | | | $ | 1,843,765 | |
| Gross unrealized depreciation | | | (39,491,418 | ) | | | (1,009,585 | ) |
| Net unrealized appreciation | | | 329,973,156 | | | | 834,180 | |
| Net unrealized depreciation on foreign currency translation | | | — | | | | (343 | ) |
| Undistributed ordinary income | | | 1,351,178 | | | | 222,294 | |
| Undistributed long-term gains | | | 88,720 | | | | — | |
| Accumulated capital and other losses | | | — | | | | (259,606 | ) |
| Distributable earnings | | $ | 331,413,054 | | | $ | 796,525 | |
| | | | | | | | | |
The difference between the federal income tax cost of portfolio investments and the financial statement cost of investments for each Fund is due to certain timing differences in the recognition of capital gains or losses under income tax regulations and GAAP. These “book/tax” differences are temporary in nature and are primarily due to the tax deferral of losses on wash sales and holdings classified as passive foreign investment companies.
LYRICAL FUNDS
NOTES TO FINANCIAL STATEMENTS (Continued)
As of November 30, 2024, the Funds had the following capital loss carryforwards for federal income tax purposes, which may be carried forward indefinitely:
| | | Lyrical
U.S. Value Equity Fund | | | Lyrical
International Value
Equity Fund | |
| No expiration - short-term | | $ | — | | | $ | — | |
| No expiration - long-term | | $ | — | | | $ | 259,606 | |
These capital loss carryforwards are available to offset net realized capital gains in future years, thereby reducing taxable gain distributions, if any.
For the year ended November 30, 2024, the Funds utilized the following capital loss carryforwards:
| | | Lyrical
U.S. Value
Equity Fund | | | Lyrical
International Value
Equity Fund | |
| Short-term | | $ | 2,099,121 | | | $ | — | |
| Long-term | | $ | 15,756,950 | | | $ | — | |
The Funds recognize the tax benefits or expenses of uncertain tax positions only when the position is “more likely than not” of being sustained assuming examination by tax authorities. Management has reviewed each Fund’s tax positions for all open tax years (generally, three years) and has concluded that no provision for unrecognized tax benefits or expenses is required in these financial statements. The Funds identify their major tax jurisdiction as U.S. Federal.
The Funds recognize interest and penalties, if any, related to unrecognized tax benefits as income tax expense on the Statements of Operations. During the year ended November 30, 2024, the Funds did not incur any interest or penalties.
3. Investment Transactions
During the year ended November 30, 2024, cost of purchases and proceeds from sales of investment securities, other than short-term investments, amounted to $450,355,224 and $96,991,944, respectively, for Lyrical U.S. Value Equity Fund and $4,063,459 and $3,905,797, respectively, for Lyrical International Value Equity Fund.
4. Transactions with Related Parties
INVESTMENT ADVISORY AGREEMENT
The Funds’ investments are managed by the Adviser pursuant to the terms of an Investment Advisory Agreement. The Funds pay the Adviser a management fee, computed and accrued daily and paid monthly, at the annual rate of 0.85% of average daily net
LYRICAL FUNDS
NOTES TO FINANCIAL STATEMENTS (Continued)
assets. During the year ended November 30, 2024, the Adviser earned $6,500,738 and $107,909 of fees under the Investment Advisory Agreement for Lyrical U.S. Value Equity Fund and Lyrical International Value Equity Fund, respectively.
Pursuant to an Expense Limitation Agreement (“ELA”) between each Fund and the Adviser, the Adviser has contractually agreed, until April 1, 2025, to reduce management fees and reimburse other operating expenses to limit total annual operating expenses of each Fund (exclusive of brokerage costs; taxes; interest; borrowing costs such as interest and dividend expenses on securities sold short; costs to organize the Fund; acquired fund fees and expenses; extraordinary expenses such as litigation and merger or reorganization costs; and other expenses not incurred in the ordinary course of the Fund’s business) to an amount not exceeding the following percentages of average daily net assets attributable to each respective class:
| Institutional Class | | Investor Class | | A Class | | C Class |
| 0.99% | | 1.24% | | 1.24% | | 1.99% |
Accordingly, during the year ended November 30, 2024, the Adviser reduced fees and reimbursed other operating expenses of $153,762 for Lyrical U.S. Value Equity Fund and $284,595 for Lyrical International Value Equity Fund.
Under the terms of the ELA, management fee reductions and expense reimbursements by the Adviser are subject to repayment by the Funds for a period of three years after such fees and expenses were incurred, provided that the repayments do not cause total annual fund operating expenses to exceed the lesser of: (i) the expense limitation then in effect, if any, and (ii) the expense limitation in effect at the time the expenses to be repaid were incurred. As of November 30, 2024, the Adviser may seek repayment of management fee reductions and expense reimbursements no later than the dates below:
| | | November 30,
2025 | | | November 30,
2026 | | | November 30,
2027 | | | Total | |
| Lyrical U.S. Value Equity Fund | | $ | 225,900 | | | $ | 264,225 | | | $ | 153,762 | | | $ | 643,887 | |
| Lyrical International Value Equity Fund | | $ | 262,691 | | | $ | 289,848 | | | $ | 284,595 | | | $ | 837,134 | |
OTHER SERVICE PROVIDERS
Ultimus Fund Solutions, LLC (“Ultimus”) provides administration, fund accounting and transfer agency services to the Funds. The Funds pay Ultimus fees in accordance with the agreements for such services. In addition, the Funds pay out-of-pocket expenses including, but not limited to, postage, supplies, and certain costs related to the pricing of the Funds’ portfolio securities.
LYRICAL FUNDS
NOTES TO FINANCIAL STATEMENTS (Continued)
Under the terms of a Consulting Agreement with the Trust, Northern Lights Compliance Services, LLC (“NLCS”) provides a Chief Compliance Officer and an Anti-Money Laundering Officer as well as related compliance services. Under the terms of the agreement, NLCS receives fees from the Funds. NLCS is a wholly-owned subsidiary of Ultimus.
Under the terms of a Distribution Agreement with the Trust, Ultimus Fund Distributors, LLC (the “Distributor”) serves as the principal underwriter to the Funds. The Distributor is a wholly-owned subsidiary of Ultimus. The Distributor is compensated partially by the Adviser and partially by the Investor Class, A Class and C Class shares of each Fund for acting as principal underwriter.
Certain officers of the Trust are also officers of Ultimus and are not paid by the Funds for serving in such capacities.
DISTRIBUTION PLAN
The Funds have adopted a plan of distribution (the “Plan”), pursuant to Rule 12b-1 under the 1940 Act, which permits Investor Class, A Class and C Class shares of each Fund to directly incur or reimburse the Funds’ principal underwriter for certain expenses related to the distribution of its shares. The annual limitation for payment of expenses pursuant to the Plan is 0.25% of each Fund’s average daily net assets allocable to Investor Class shares and A Class shares, and 1.00% of each Fund’s average daily net assets allocable to C Class shares. The Funds have not adopted a plan of distribution with respect to the Institutional Class shares.
TRUSTEE COMPENSATION
Each member of the Board (a “Trustee”) who is not an “interested person” (as defined by the 1940 Act, as amended) of the Trust (“Independent Trustee”) receives an annual retainer and meeting fees, plus reimbursement for travel and other meeting-related expenses.
PRINCIPAL HOLDERS OF FUND SHARES
As of November 30, 2024, the following shareholders owned of record 25% or more of the outstanding shares of the Funds:
| NAME OF RECORD OWNERS | | % Ownership | |
| Lyrical U.S. Value Equity Fund | | | |
| J.P. Morgan Securities, LLC (for the benefit of its customers) | | 27% | |
| | | | |
| Lyrical International Value Equity Fund | | | |
| National Financial Services, LLC (for the benefit of its customers) | | 85% | |
LYRICAL FUNDS
NOTES TO FINANCIAL STATEMENTS (Continued)
A beneficial owner of 25% or more of a Fund’s outstanding shares may be considered a controlling person of the Fund. That shareholder’s vote could have a more significant effect on matters presented at a shareholders’ meeting.
5. Borrowing Costs
From time to time, the Funds may have an overdrawn cash balance at the custodian due to redemptions or market movements. When this occurs, the Funds will incur borrowing costs charged by the custodian. During the year ended November 30, 2024, Lyrical U.S. Value Equity Fund and Lyrical International Value Equity Fund incurred borrowing costs in the amounts of $923 and $0, respectively.
6. Sector Risk
If a Fund has significant investments in the securities of issuers within a particular sector, any development affecting that sector will have a greater impact on the value of the net assets of the Fund than would be the case if the Fund did not have significant investments in that sector. In addition, this may increase the risk of loss in the Fund and increase the volatility of the Fund’s NAV per share. For instance, economic or market factors, regulatory changes or other developments may negatively impact all companies in a particular sector, and therefore the value of the Fund’s portfolio will be adversely affected. As of November 30, 2024, Lyrical U.S. Value Equity Fund had 29.8% of the value of its net assets invested in stocks within the Technology sector and Lyrical International Value Equity Fund had 30.6% of the value of its net assets invested in stocks within the Industrials sector.
7. Contingencies and Commitments
The Funds indemnify the Trust’s officers and Trustees for certain liabilities that might arise from their performance of their duties to the Funds. Additionally, in the normal course of business the Funds enter into contracts that contain a variety of representations and warranties and which provide general indemnifications. The Funds’ maximum exposure under these arrangements is unknown, as this would involve future claims that may be made against the Funds that have not yet occurred. However, based on experience, the Funds expect the risk of loss to be remote.
8. Subsequent Events
The Funds are required to recognize in the financial statements the effects of all subsequent events that provide additional evidence about conditions that existed as of the date of the Statement of Assets and Liabilities. For non-recognized subsequent events that must be disclosed to keep the financial statements from being misleading, the Funds are required to disclose the nature of the event as well as an estimate of its financial
LYRICAL FUNDS
NOTES TO FINANCIAL STATEMENTS (Continued)
effect, or a statement that such an estimate cannot be made. Management has evaluated subsequent events through the issuance of these financial statements and has noted no such events except for the following:
The funds paid the following distributions to shareholders subsequent to November 30, 2024:
| | | | | | | Per Share | |
| | | Record | | | | Ordinary | |
| | | Date | | Ex-Date | | Income | |
| Lyrical U.S. Value Equity Fund | | | | | | | | |
| Institutional Class | | 12/27/2024 | | 12/30/2024 | | | 0.0532 | |
| | | | | | | | | |
| Lyrical International Value Equity Fund | | | | | | | | |
| Institutional Class | | 12/27/2024 | | 12/30/2024 | | | 0.3906 | |
| Investor Class | | 12/27/2024 | | 12/30/2024 | | | 0.3627 | |
| A Class | | 12/27/2024 | | 12/30/2024 | | | 0.3609 | |
| C Class | | 12/27/2024 | | 12/30/2024 | | | 0.2704 | |
LYRICAL FUNDS
REPORT OF INDEPENDENT REGISTERED
PUBLIC ACCOUNTING FIRM
To the Shareholders of Lyrical U.S. Value Equity Fund and Lyrical International Value Equity Fund and Board of Trustees of Ultimus Managers Trust
Opinion on the Financial Statements
We have audited the accompanying statements of assets and liabilities, including the schedules of investments, of Lyrical U.S. Value Equity Fund and Lyrical International Value Equity Fund (the “Funds”), each a series of Ultimus Managers Trust, as of November 30, 2024, the related statements of operations for the year then ended, the statements of changes in net assets for each of the two years in the period then ended, the financial highlights for each of the two years in the period then ended, and the related notes (collectively referred to as the “financial statements”). In our opinion, the financial statements present fairly, in all material respects, the financial position of each of the Funds as of November 30, 2024, the results of their operations for the year then ended, the changes in net assets for each of the two years in the period then ended, and the financial highlights for each of the two years in the period then ended, in conformity with accounting principles generally accepted in the United States of America.
The Funds’ financial highlights for the years and periods ended November 30, 2022, and prior, were audited by other auditors whose report, dated January 26, 2023, expressed an unqualified opinion on those financial highlights.
Basis for Opinion
These financial statements are the responsibility of the Funds’ management. Our responsibility is to express an opinion on the Funds’ financial statements based on our audits. We are a public accounting firm registered with the Public Company Accounting Oversight Board (United States) (“PCAOB”) and are required to be independent with respect to the Funds in accordance with the U.S. federal securities laws and the applicable rules and regulations of the Securities and Exchange Commission and the PCAOB.
We conducted our audits in accordance with the standards of the PCAOB. Those standards require that we plan and perform the audit to obtain reasonable assurance about whether the financial statements are free of material misstatement whether due to error or fraud.
LYRICAL FUNDS
REPORT OF INDEPENDENT REGISTERED
PUBLIC ACCOUNTING FIRM (Continued)
Our audits included performing procedures to assess the risks of material misstatement of the financial statements, whether due to error or fraud, and performing procedures that respond to those risks. Such procedures included examining, on a test basis, evidence regarding the amounts and disclosures in the financial statements. Our procedures included confirmation of securities owned as of November 30, 2024, by correspondence with the custodian. Our audits also included evaluating the accounting principles used and significant estimates made by management, as well as evaluating the overall presentation of the financial statements. We believe that our audits provide a reasonable basis for our opinion.
We have served as the Funds’ auditor since 2023.

COHEN & COMPANY, LTD.
Philadelphia, Pennsylvania
January 29, 2025
LYRICAL FUNDS
OTHER INFORMATION (Unaudited)
A description of the policies and procedures that the Funds use to vote proxies relating to portfolio securities is available without charge upon request by calling toll-free 1-888-884-8099, or on the SEC’s website at www.sec.gov. Information regarding how the Funds voted proxies relating to portfolio securities during the most recent 12-month period ended June 30 is available without charge upon request by calling toll-free 1-888-884-8099, or on the SEC’s website at www.sec.gov.
The Trust files a complete listing of portfolio holdings for the Funds with the SEC as of the end of the first and third quarters of each fiscal year as an exhibit to its reports on Form N-PORT. These filings are available upon request by calling 1-888-884-8099. Furthermore, you may obtain a copy of the filings on the SEC’s website at www.sec.gov and the Funds’ website at www.lyricalvaluefunds.com.
FEDERAL TAX INFORMATION (Unaudited)
For the fiscal year ended November 30, 2024, Lyrical U.S. Value Equity Fund designated $1,167,988 as long-term capital gain distributions.
Qualified Dividend Income – Lyrical U.S. Value Equity Fund and Lyrical International Value Equity Fund designates 91.14% and 71.03%, respectively, of their ordinary income dividends, or up to the maximum amount of such dividends allowable pursuant to the Internal Revenue Code, as qualified dividend income eligible for the reduced tax rate.
Dividends Received Deduction – Corporate shareholders are generally entitled to take the dividends received deduction on the portion of the Fund’s dividend distribution that qualifies under tax law. For the fiscal year ended November 30, 2024, the percentage of ordinary income dividends qualified for the corporate dividends receivable deduction for Lyrical U.S Value Equity Fund was 91.14%.
Lyrical International Value Equity Fund intends to pass through to shareholders the income tax credit for taxes paid to foreign countries. The Fund’s foreign source income per share was $0.XXXX and the foreign tax expenses per share was $0.XXXX. The passthrough of the foreign tax credit will only affect those persons who are shareholders on the dividend date of record. These shareholders will receive more detailed information with there 2024 Form 1099-DIV.
Q3 All-Season Systematic Opportunities Fund
Institutional Class (QASOX)
C Class (QCSOX)
Q3 All-Season Tactical Fund
Institutional Class (QAITX)
C Class (QACTX)
Annual Financial Statements and Additional Information
November 30, 2024
|
| Q3 ALL-SEASON SYSTEMATIC OPPORTUNITIES FUND |
| SCHEDULE OF INVESTMENTS |
| November 30, 2024 |
| MONEY MARKET FUNDS — 89.7% | | Shares | | | Value | |
| First American Government Obligations Fund - Class X, 4.56% (a) (Cost $159,912,388) | | | 159,912,388 | | | $ | 159,912,388 | |
| | | | | | | | | |
| Other Assets in Excess of Liabilities — 10.3% | | | | | | | 18,430,754 | |
| | | | | | | | | |
| Net Assets — 100.0% | | | | | | $ | 178,343,142 | |
| (a) | The rate shown is the 7-day effective yield as of November 30, 2024. |
See accompanying notes to financial statements.
|
| Q3 ALL-SEASON TACTICAL FUND |
| SCHEDULE OF INVESTMENTS |
| November 30, 2024 |
| MONEY MARKET FUNDS — 90.8% | | Shares | | | Value | |
| First American Government Obligations Fund - Class X, 4.56% (a) (Cost $51,624,491) | | | 51,624,491 | | | $ | 51,624,491 | |
| | | | | | | | | |
| Other Assets in Excess of Liabilities — 9.2% | | | | | | | 5,245,199 | |
| | | | | | | | | |
| Net Assets — 100.0% | | | | | | $ | 56,869,690 | |
| (a) | The rate shown is the 7-day effective yield as of November 30, 2024. |
See accompanying notes to financial statements.
|
| Q3 ALL-SEASON TACTICAL FUND |
| SCHEDULE OF FUTURES CONTRACTS AND FUTURES CONTRACTS SOLD SHORT |
| November 30, 2024 |
| FUTURES CONTRACTS | | Contracts | | | Expiration
Date | | Notional
Value | | | Value/
Unrealized
Appreciation | |
| Index Futures | | | | | | | | | | | | | |
| NASDAQ 100 E-Mini Futures | | 105 | | | 12/24/2024 | | $ | 44,086,350 | | | $ | 17,023 | |
| | | | | | | | | | | | | | |
| FUTURES CONTRACTS SOLD SHORT | | Contracts | | | Expiration
Date | | Notional
Value | | | Value/
Unrealized
Depreciation | |
| Treasury Futures | | | | | | | | | | | | | |
| U.S. Treasury Bond Futures | | 27 | | | 03/25/25 | | $ | 3,226,500 | | | $ | (39,131 | ) |
| | | | | | | | | | | | | | |
The average monthly notional value of futures contracts during the year ended November 30, 2024 was $3,673,863.
The average monthly notional value of futures sold short during the year ended November 30, 2024 was $268,875.
See accompanying notes to financial statements.
|
| Q3 ALL-SEASON FUNDS |
| STATEMENTS OF ASSETS AND LIABILITIES |
| November 30, 2024 |
| | | Q3 All-Season
Systematic
Opportunities Fund | | | Q3 All-Season
Tactical
Fund | |
| ASSETS | | | | | | | | |
| Investments in securities: | | | | | | | | |
| At cost | | $ | 159,912,388 | | | $ | 51,624,491 | |
| At value (Note 2) | | $ | 159,912,388 | | | $ | 51,624,491 | |
| Margin deposits for futures contracts (Note 2) | | | 18,088,406 | | | | 5,095,336 | |
| Receivable for capital shares sold | | | 93,359 | | | | 103,084 | |
| Dividends receivable | | | 516,609 | | | | 144,044 | |
| Other assets | | | 32,217 | | | | 10,499 | |
| Total assets | | | 178,642,979 | | | | 56,977,454 | |
| | | | | | | | | |
| LIABILITIES | | | | | | | | |
| Variation margin payable (Notes 2 & 5) | | | — | | | | 17,071 | |
| Payable for capital shares redeemed | | | 107,628 | | | | 13,102 | |
| Payable to Adviser (Note 4) | | | 146,920 | | | | 46,293 | |
| Payable to administrator (Note 4) | | | 22,502 | | | | 13,142 | |
| Accrued distribution fees (Note 4) | | | 439 | | | | 1,750 | |
| Other accrued expenses | | | 22,348 | | | | 16,406 | |
| Total liabilities | | | 299,837 | | | | 107,764 | |
| | | | | | | | | |
| CONTINGENCIES AND COMITTMENTS (NOTE 8) | | | — | | | | — | |
| | | | | | | | | |
| NET ASSETS | | $ | 178,343,142 | | | $ | 56,869,690 | |
| | | | | | | | | |
| NET ASSETS CONSIST OF: | | | | | | | | |
| Paid-in capital | | $ | 175,591,270 | | | $ | 76,731,097 | |
| Distributable earnings (accumulated deficit) | | | 2,751,872 | | | | (19,861,407 | ) |
| NET ASSETS | | $ | 178,343,142 | | | $ | 56,869,690 | |
See accompanying notes to financial statements.
|
| Q3 ALL-SEASON FUNDS |
| STATEMENTS OF ASSETS AND LIABILITIES |
| November 30, 2024 (Continued) |
| | | Q3 All-Season
Systematic
Opportunities Fund | | | Q3 All-Season
Tactical
Fund | |
| NET ASSET VALUE PER SHARE: | | | | | | | | |
| INSTITUTIONAL CLASS | | | | | | | | |
| Net assets applicable to Institutional Class | | $ | 177,335,975 | | | $ | 55,339,550 | |
| Institutional Class shares of beneficial interest outstanding (unlimited number of shares authorized, no par value) | | | 18,233,346 | | | | 4,893,781 | |
| Net asset value, offering price and redemption price per share (Note 2) | | $ | 9.73 | | | $ | 11.31 | |
| | | | | | | | | |
| C CLASS | | | | | | | | |
| Net assets applicable to C Class | | $ | 1,007,167 | | | $ | 1,530,140 | |
| C Class shares of beneficial interest outstanding (unlimited number of shares authorized, no par value) | | | 103,729 | | | | 142,269 | |
| Net asset value, offering price and redemption price per share (Note 2) | | $ | 9.71 | | | $ | 10.76 | |
See accompanying notes to financial statements.
|
| Q3 ALL-SEASON FUNDS |
| STATEMENTS OF OPERATIONS |
| Year Ended November 30, 2024 |
| | | Q3 All-Season
Systematic
Opportunities Fund | | | Q3 All-Season
Tactical
Fund | |
| INVESTMENT INCOME | | | | | | | | |
| Dividend income | | $ | 5,749,027 | | | $ | 764,183 | |
| | | | | | | | | |
| EXPENSES | | | | | | | | |
| Management fees (Note 4) | | | 1,785,319 | | | | 520,993 | |
| Administration fees (Note 4) | | | 163,771 | | | | 57,309 | |
| Legal fees | | | 50,658 | | | | 50,658 | |
| Fund accounting fees (Note 4) | | | 51,736 | | | | 44,588 | |
| Transfer agent fees (Note 4) | | | 21,275 | | | | 39,361 | |
| Registration and filing fees - Institutional Class | | | 26,691 | | | | 19,995 | |
| Registration and filing fees - C Class | | | 387 | | | | 8,915 | |
| Trustees’ fees and expenses (Note 4) | | | 20,978 | | | | 20,978 | |
| Audit and tax services fees | | | 16,932 | | | | 16,932 | |
| Compliance fees and expenses (Note 4) | | | 19,751 | | | | 12,159 | |
| Custody and bank service fees | | | 17,454 | | | | 8,311 | |
| Postage and supplies | | | 13,244 | | | | 10,229 | |
| Distribution fees - C Class (Note 4) | | | 439 | | | | 17,728 | |
| Shareholder reporting expenses | | | 6,692 | | | | 6,671 | |
| Insurance | | | 3,579 | | | | 3,060 | |
| Borrowing costs (Note 6) | | | — | | | | 367 | |
| Other expenses | | | 13,542 | | | | 12,346 | |
| Total expenses | | | 2,212,448 | | | | 850,600 | |
| Management fees reduced by the adviser (Note 4) | | | (168 | ) | | | (1,815 | ) |
| Management fees recouped (Note 4) | | | 79,761 | | | | — | |
| Net expenses | | | 2,292,041 | | | | 848,785 | |
| | | | | | | | | |
| NET INVESTMENT INCOME (LOSS) | | | 3,456,986 | | | | (84,602 | ) |
See accompanying notes to financial statements.
|
| Q3 ALL-SEASON FUNDS |
| STATEMENTS OF OPERATIONS |
| Year Ended November 30, 2024 (Continued) |
| | | Q3 All-Season
Systematic
Opportunities Fund | | | Q3 All-Season
Tactical
Fund | |
| REALIZED AND UNREALIZED GAINS (LOSSES) ON INVESTMENTS AND FUTURES CONTRACTS | | | | | | | | |
| Net realized gains (losses) from: | | | | | | | | |
| Investments | | $ | 8,149,112 | | | $ | 13,050,091 | |
| Long futures contracts (Note 5) | | | (911,569 | ) | | | (791,188 | ) |
| Short futures contracts (Note 5) | | | — | | | | (108,428 | ) |
| Net change in unrealized appreciation (depreciation) on: | | | | | | | | |
| Investments | | | (104,650 | ) | | | (2,504,690 | ) |
| Long futures contracts (Note 5) | | | — | | | | 17,023 | |
| Short futures contracts (Note 5) | | | — | | | | (39,131 | ) |
| NET REALIZED AND UNREALIZED GAINS ON INVESTMENTS AND FUTURES CONTRACTS | | | 7,132,893 | | | | 9,623,677 | |
| | | | | | | | | |
| NET INCREASE IN NET ASSETS RESULTING FROM OPERATIONS | | $ | 10,589,879 | | | $ | 9,539,075 | |
See accompanying notes to financial statements.
|
| Q3 ALL-SEASON SYSTEMATIC OPPORTUNITIES FUND |
| STATEMENTS OF CHANGES IN NET ASSETS |
| | | Year Ended
November 30,
2024(a) | | | Year Ended
November 30,
2023 | |
| FROM OPERATIONS | | | | | | | | |
| Net investment income | | $ | 3,456,986 | | | $ | 1,286,648 | |
| Net realized gains (losses) from: | | | | | | | | |
| Investments | | | 8,149,112 | | | | 6,540,238 | |
| Futures contracts (Note 5) | | | (911,569 | ) | | | — | |
| Net change in unrealized appreciation (depreciation) on: | | | | | | | | |
| Investments | | | (104,650 | ) | | | (65,007 | ) |
| Net increase in net assets resulting from operations | | | 10,589,879 | | | | 7,761,879 | |
| | | | | | | | | |
| FROM DISTRIBUTIONS TO SHAREHOLDERS (Note 2) | | | | | | | | |
| Institutional Class | | | (14,097,011 | ) | | | (925,842 | ) |
| | | | | | | | | |
| CAPITAL SHARE TRANSACTIONS | | | | | | | | |
| Institutional Class | | | | | | | | |
| Proceeds from shares sold | | | 121,811,355 | | | | 186,590,361 | |
| Net asset value of shares issued in reinvestment of distributions to shareholders | | | 14,086,682 | | | | 925,444 | |
| Payments for shares redeemed | | | (113,097,501 | ) | | | (39,743,004 | ) |
| Payments for transfer to C Class | | | (1,000 | ) | | | — | |
| Net increase in Institutional Class net assets from capital share transactions | | | 22,799,536 | | | | 147,772,801 | |
| | | | | | | | | |
| C Class | | | | | | | | |
| Proceeds from shares sold | | | 1,009,715 | | | | — | |
| Proceeds received for transfer from Institutional Class | | | 1,000 | | | | — | |
| Net increase in C Class net assets from capital share transactions | | | 1,010,715 | | | | — | |
| | | | | | | | | |
| TOTAL INCREASE IN NET ASSETS | | | 20,303,119 | | | | 154,608,838 | |
| | | | | | | | | |
| NET ASSETS | | | | | | | | |
| Beginning of year | | | 158,040,023 | | | | 3,431,185 | |
| End of year | | $ | 178,343,142 | | | $ | 158,040,023 | |
| (a) | Except for C Class information, which represents the period from the commencement of C Class operations (October 18, 2024) through November 30, 2024. |
See accompanying notes to financial statements.
|
| Q3 ALL-SEASON SYSTEMATIC OPPORTUNITIES FUND |
| STATEMENTS OF CHANGES IN NET ASSETS (Continued) |
| | | Year Ended
November 30,
2024(a) | | | Year Ended
November 30,
2023 | |
| CAPITAL SHARE ACTIVITY | | | | | | | | |
| Institutional Class | | | | | | | | |
| Shares sold | | | 12,803,697 | | | | 19,453,988 | |
| Shares reinvested | | | 1,508,191 | | | | 93,212 | |
| Shares redeemed | | | (11,929,725 | ) | | | (4,060,989 | ) |
| Shares redeemed for transfer to C Class | | | (104 | ) | | | — | |
| Net increase in shares outstanding | | | 2,382,059 | | | | 15,486,211 | |
| Shares outstanding at beginning of year | | | 15,851,287 | | | | 365,076 | |
| Shares outstanding at end of year | | | 18,233,346 | | | | 15,851,287 | |
| | | | | | | | | |
| C Class | | | | | | | | |
| Shares sold | | | 103,625 | | | | — | |
| Shares received for transfer from Institutional Class | | | 104 | | | | — | |
| Net increase in shares outstanding | | | 103,729 | | | | — | |
| Shares outstanding at beginning of period | | | — | | | | — | |
| Shares outstanding at end of period | | | 103,729 | | | | — | |
| (a) | Except for C Class information, which represents the period from the commencement of C Class operations (October 18, 2024) through November 30, 2024. |
See accompanying notes to financial statements.
|
| Q3 ALL-SEASON TACTICAL FUND |
| STATEMENTS OF CHANGES IN NET ASSETS |
| | | Year Ended
November 30,
2024 | | | Year Ended
November 30,
2023 | |
| FROM OPERATIONS | | | | | | | | |
| Net investment loss | | $ | (84,602 | ) | | $ | (54,908 | ) |
| Net realized gains (losses) from: | | | | | | | | |
| Investments | | | 13,050,091 | | | | 604,259 | |
| Futures contracts (Note 5) | | | (899,616 | ) | | | — | |
| Long-term capital gain distributions from regulated investment companies | | | — | | | | 26 | |
| Net change in unrealized appreciation (depreciation) on: | | | | | | | | |
| Investments | | | (2,504,690 | ) | | | 2,633,156 | |
| Futures contracts (Note 5) | | | (22,108 | ) | | | — | |
| Net increase in net assets resulting from operations | | | 9,539,075 | | | | 3,182,533 | |
| | | | | | | | | |
| CAPITAL SHARE TRANSACTIONS | | | | | | | | |
| Institutional Class | | | | | | | | |
| Proceeds from shares sold | | | 38,687,619 | | | | 88,678,211 | |
| Payments for shares redeemed | | | (35,226,678 | ) | | | (99,907,138 | ) |
| Net increase (decrease) in Institutional Class net assets from capital share transactions | | | 3,460,941 | | | | (11,228,927 | ) |
| | | | | | | | | |
| C Class | | | | | | | | |
| Proceeds from shares sold | | | 100,000 | | | | 18,385 | |
| Payments for shares redeemed | | | (999,852 | ) | | | (763,919 | ) |
| Net decrease in C Class net assets from capital share transactions | | | (899,852 | ) | | | (745,534 | ) |
| | | | | | | | | |
| TOTAL INCREASE (DECREASE) IN NET ASSETS | | | 12,100,164 | | | | (8,791,928 | ) |
| | | | | | | | | |
| NET ASSETS | | | | | | | | |
| Beginning of year | | | 44,769,526 | | | | 53,561,454 | |
| End of year | | $ | 56,869,690 | | | $ | 44,769,526 | |
See accompanying notes to financial statements.
|
| Q3 ALL-SEASON TACTICAL FUND |
| STATEMENTS OF CHANGES IN NET ASSETS (Continued) |
| | | Year Ended
November 30,
2024 | | | Year Ended
November 30,
2023 | |
| CAPITAL SHARE ACTIVITY | | | | | | | | |
| Institutional Class | | | | | | | | |
| Shares sold | | | 3,560,028 | | | | 10,561,324 | |
| Shares redeemed | | | (3,261,966 | ) | | | (11,985,702 | ) |
| Net increase (decrease) in shares outstanding | | | 298,062 | | | | (1,424,378 | ) |
| Shares outstanding at beginning of year | | | 4,595,719 | | | | 6,020,097 | |
| Shares outstanding at end of year | | | 4,893,781 | | | | 4,595,719 | |
| | | | | | | | | |
| C Class | | | | | | | | |
| Shares sold | | | 10,310 | | | | 2,333 | |
| Shares redeemed | | | (101,970 | ) | | | (94,579 | ) |
| Net decrease in shares outstanding | | | (91,660 | ) | | | (92,246 | ) |
| Shares outstanding at beginning of year | | | 233,929 | | | | 326,175 | |
| Shares outstanding at end of year | | | 142,269 | | | | 233,929 | |
See accompanying notes to financial statements.
|
| Q3 ALL-SEASON SYSTEMATIC OPPORTUNITIES FUND |
| INSTITUTIONAL CLASS |
| FINANCIAL HIGHLIGHTS |
Per Share Data for a Share Outstanding Throughout Each Period:
| | | Year Ended
November 30,
2024 | | | Year Ended
November 30,
2023 | | | Year Ended
November 30,
2022 | | | Year Ended
November 30,
2021 | | | Period Ended
November 30,
2020 (a) | |
| Net asset value at beginning of period | | $ | 9.97 | | | $ | 9.40 | | | $ | 10.52 | | | $ | 9.94 | | | $ | 10.00 | |
| | | | | | | | | | | | | | | | | | | | | |
| Income (loss) from investment operations: | | | | | | | | | | | | | | | | | | | | |
| Net investment income (loss) (b)(c) | | | 0.18 | | | | 0.18 | | | | (0.03 | ) | | | (0.13 | ) | | | (0.11 | ) |
| Net realized and unrealized gains (losses) on investments and futures contracts | | | 0.45 | | | | 0.47 | (d) | | | (0.45 | ) | | | 0.71 | | | | 0.05 | (d) |
| Total from investment operations | | | 0.63 | | | | 0.65 | | | | (0.48 | ) | | | 0.58 | | | | (0.06 | ) |
| | | | | | | | | | | | | | | | | | | | | |
| Less distributions from: | | | | | | | | | | | | | | | | | | | | |
| Net investment income | | | (0.10 | ) | | | — | | | | — | | | | — | | | | — | |
| Net realized gains | | | (0.77 | ) | | | (0.08 | ) | | | (0.64 | ) | | | — | | | | — | |
| Total distributions | | | (0.87 | ) | | | (0.08 | ) | | | (0.64 | ) | | | — | | | | — | |
| | | | | | | | | | | | | | | | | | | | | |
| Net asset value at end of period | | $ | 9.73 | | | $ | 9.97 | | | $ | 9.40 | | | $ | 10.52 | | | $ | 9.94 | |
| | | | | | | | | | | | | | | | | | | | | |
| Total return (e) | | | 6.72 | % | | | 6.92 | % | | | (5.14 | %) | | | 5.83 | % | | | (0.60 | %)(f) |
| | | | | | | | | | | | | | | | | | | | | |
| Net assets at end of period (000’s) | | $ | 177,336 | | | $ | 158,040 | | | $ | 3,431 | | | $ | 6,048 | | | $ | 4,491 | |
| | | | | | | | | | | | | | | | | | | | | |
| Ratios/supplementary data: | | | | | | | | | | | | | | | | | | | | |
| Ratio of total expenses to average net assets (g) | | | 1.24 | % | | | 1.40 | % | | | 5.46 | % | | | 4.20 | % | | | 6.10 | %(h) |
| Ratio of net expenses to average net assets (g)(i) | | | 1.28 | % | | | 1.83 | % | | | 1.94 | % | | | 1.94 | % | | | 1.94 | %(h) |
| Ratio of net investment income (loss) to average net assets (c)(g)(i) | | | 1.94 | % | | | 1.78 | % | | | (0.34 | %) | | | (1.19 | %) | | | (1.31 | %)(h) |
| Portfolio turnover rate | | | 8158 | %(j) | | | 6171 | %(j) | | | 517 | % | | | 441 | % | | | 523 | %(f) |
| (a) | Represents the period from the commencement of operations (December 30, 2019) through November 30, 2020. |
| (b) | Per share net investment income (loss) has been determined on the basis of average number of shares outstanding during the period. |
| (c) | Recognition of net investment income (loss) by the Fund is affected by the timing of the declaration of dividends by the underlying companies in which the Fund invests. |
| (d) | Represents a balancing figure derived from other amounts in the financial highlights table that captures all other changes affecting net asset value per share. This per share amount does not correlate to the aggregate of the net realized and unrealized losses on the Statement of Operations for the same period. |
| (e) | Total return is a measure of the change in value of an investment in the Fund over the periods covered. The returns shown do not reflect the deduction of taxes a shareholder would pay on Fund distributions, if any, or the redemption of Fund shares. |
| (f) | Not annualized. |
| (g) | The ratios of expenses and net investment income (loss) to average net assets do not reflect the Fund’s proportionate share of expenses of the underlying investment companies in which the Fund invests. |
|
| Q3 ALL-SEASON SYSTEMATIC OPPORTUNITIES FUND |
| INSTITUTIONAL CLASS |
| FINANCIAL HIGHLIGHTS (Continued) |
| (h) | Annualized. |
| (i) | Ratio was determined after fee reductions and/or expense reimbursements/recoupments (Note 4). |
| (j) | Given market conditions during the period, the Fund rotated assets into and out of positions on a periodic basis and the Fund’s portfolio was traded frequently. |
See accompanying notes to financial statements.
Q3 ALL-SEASON SYSTEMATIC OPPORTUNITIES FUND
C SHARE CLASS
FINANCIAL HIGHLIGHTS
Per Share Data for a Share Outstanding Throughout the Period:
| | | Period Ended
November 30,
2024 (a) | |
| Net asset value at beginning of period | | $ | 9.61 | |
| | | | | |
| Income from investment operations: | | | | |
| Net investment income (b)(c) | | | 0.02 | |
| Net realized and unrealized gains on investments and futures contracts | | | 0.08 | |
| Total from investment operations | | | 0.10 | |
| | | | | |
| Net asset value at end of period | | $ | 9.71 | |
| | | | | |
| Total return (d) | | | 1.04 | %(e) |
| | | | | |
| Net assets at end of period (000’s) | | $ | 1,007 | |
| | | | | |
| Ratios/supplementary data: | | | | |
| Ratio of total expenses to average net assets (f) | | | 3.15 | %(g) |
| Ratio of net expenses to average net assets (f)(h) | | | 2.79 | %(g) |
| Ratio of net investment income to average net assets (c)(f)(h) | | | 1.55 | %(g) |
| Portfolio turnover rate(i) | | | 8158 | % |
| (a) | Represents the period from the commencement of operations (October 18, 2024) through November 30, 2024. |
| (b) | Per share net investment income has been determined on the basis of average number of shares outstanding during the period. |
| (c) | Recognition of net investment income by the Fund is affected by the timing of the declaration of dividends by the underlying companies in which the Fund invests. |
| (d) | Total return is a measure of the change in value of an investment in the Fund over the period covered. The return shown does not reflect the deduction of taxes a shareholder would pay on Fund distributions, if any, or the redemption of Fund shares. |
| (e) | Not annualized. |
| (f) | The ratios of expenses and net investment income to average net assets do not reflect the Fund’s proportionate share of expenses of the underlying investment companies in which the Fund invests. |
| (g) | Annualized. |
| (h) | Ratio was determined after fee reductions (Note 4). |
| (i) | Given market conditions during the period, the Fund rotated assets into, and out of, positions on a periodic basis due to its tactical trading mandate, and the Fund’s portfolio was traded frequently. |
See accompanying notes to financial statements.
Q3 ALL-SEASON TACTICAL FUND
INSTITUTIONAL CLASS
FINANCIAL HIGHLIGHTS
Per Share Data for a Share Outstanding Throughout Each Period:
| | | Year Ended
November 30,
2024 | | | Year Ended
November 30,
2023 | | | Year Ended
November 30,
2022 | | | Year Ended
November 30,
2021 | | | Period Ended
November 30,
2020 (a) | |
| Net asset value at beginning of period | | $ | 9.29 | | | $ | 8.45 | | | $ | 13.80 | | | $ | 12.06 | | | $ | 10.00 | |
| | | | | | | | | | | | | | | | | | | | | |
| Income (loss) from investment operations: | | | | | | | | | | | | | | | | | | | | |
| Net investment loss (b)(c) | | | (0.01 | ) | | | (0.01 | ) | | | (0.06 | ) | | | (0.09 | ) | | | (0.11 | ) |
| Net realized and unrealized gains (losses) on investments and futures contracts | | | 2.03 | | | | 0.85 | | | | (4.30 | ) | | | 2.72 | | | | 2.17 | |
| Total from investment operations | | | 2.02 | | | | 0.84 | | | | (4.36 | ) | | | 2.63 | | | | 2.06 | |
| | | | | | | | | | | | | | | | | | | | | |
| Less distributions from: | | | | | | | | | | | | | | | | | | | | |
| Net realized gains | | | — | | | | — | | | | (0.99 | ) | | | (0.89 | ) | | | — | |
| | | | | | | | | | | | | | | | | | | | | |
| Net asset value at end of period | | $ | 11.31 | | | $ | 9.29 | | | $ | 8.45 | | | $ | 13.80 | | | $ | 12.06 | |
| | | | | | | | | | | | | | | | | | | | | |
| Total return (d) | | | 21.74 | % | | | 9.94 | % | | | (34.03 | %) | | | 23.10 | %(e) | | | 20.60 | %(f) |
| | | | | | | | | | | | | | | | | | | | | |
| Net assets at end of period (000’s) | | $ | 55,340 | | | $ | 42,675 | | | $ | 50,871 | | | $ | 148,813 | | | $ | 71,884 | |
| | | | | | | | | | | | | | | | | | | | | |
| Ratios/supplementary data: | | | | | | | | | | | | | | | | | | | | |
| Ratio of total expenses to average net assets (g) | | | 1.58 | % | | | 1.68 | % | | | 1.36 | % | | | 1.32 | % | | | 1.55 | %(h) |
| Ratio of net expenses to average net assets (g) | | | 1.58 | %(i) | | | 1.68 | %(i) | | | 1.36 | % | | | 1.32 | % | | | 1.55 | %(h) |
| Ratio of net investment loss to average net assets (c)(g) | | | (0.12 | %) | | | (0.05 | %) | | | (0.59 | %) | | | (0.73 | %) | | | (1.10 | %)(h) |
| Portfolio turnover rate (j) | | | 795 | % | | | 2004 | % | | | 3770 | % | | | 1639 | % | | | 3078 | %(f) |
| (a) | Represents the period from the commencement of operations (December 30, 2019) through November 30, 2020. |
| (b) | Per share net investment loss has been determined on the basis of average number of shares outstanding during the period. |
| (c) | Recognition of net investment loss by the Fund is affected by the timing of the declaration of dividends by the underlying companies in which the Fund invests. |
| (d) | Total return is a measure of the change in value of an investment in the Fund over the periods covered. The returns shown do not reflect the deduction of taxes a shareholder would pay on Fund distributions, if any, or the redemption of Fund shares. |
| (e) | During the year ended November 30, 2021, the Fund received a payment from the Adviser of $336,826 for losses realized on the disposal of the investments purchased in violation of investment restrictions, which otherwise would have reduced the total return by 0.27%. |
| (f) | Not annualized. |
| (g) | The ratios of expenses and net investment loss to average net assets do not reflect the Fund’s proportionate share of expenses of the underlying investment companies in which the Fund invests. |
Q3 ALL-SEASON TACTICAL FUND
INSTITUTIONAL CLASS
FINANCIAL HIGHLIGHTS (Continued)
| (h) | Annualized. |
| (i) | Includes 0.00% and 0.06% of borrowing costs for the years ended November 30, 2024 and 2023, respectively (Note 5). |
| (j) | Given market conditions during the period, the Fund rotated assets into and out of positions on a periodic basis and the Fund’s portfolio was traded frequently. |
See accompanying notes to financial statements.
Q3 ALL-SEASON TACTICAL FUND
C SHARE CLASS
FINANCIAL HIGHLIGHTS
Per Share Data for a Share Outstanding Throughout Each Period:
| | | Year Ended
November 30,
2024 | | | Year Ended
November 30,
2023 | | | Year Ended
November 30,
2022 | | | Period Ended
November 30,
2021 (a) | |
| Net asset value at beginning of period | | $ | 8.95 | | | $ | 8.25 | | | $ | 13.65 | | | $ | 11.53 | |
| | | | | | | | | | | | | | | | | |
| Income (loss) from investment operations: | | | | | | | | | | | | | | | | |
| Net investment loss (b)(c) | | | (0.15 | ) | | | (0.12 | ) | | | (0.17 | ) | | | (0.22 | ) |
| Net realized and unrealized gains (losses) on investments and futures contracts | | | 1.96 | | | | 0.82 | | | | (4.24 | ) | | | 2.34 | |
| Total from investment operations | | | 1.81 | | | | 0.70 | | | | (4.41 | ) | | | 2.12 | |
| | | | | | | | | | | | | | | | | |
| Less distributions from: | | | | | | | | | | | | | | | | |
| Net realized gains | | | — | | | | — | | | | (0.99 | ) | | | — | |
| | | | | | | | | | | | | | | | | |
| Net asset value at end of period | | $ | 10.76 | | | $ | 8.95 | | | $ | 8.25 | | | $ | 13.65 | |
| | | | | | | | | | | | | | | | | |
| Total return (d) | | | 20.22 | % | | | 8.48 | % | | | (34.82 | %) | | | 18.39 | %(e)(f) |
| | | | | | | | | | | | | | | | | |
| Net assets at end of period (000’s) | | $ | 1,530 | | | $ | 2,094 | | | $ | 2,690 | | | $ | 3,260 | |
| | | | | | | | | | | | | | | | | |
| Ratios/supplementary data: | | | | | | | | | | | | | | | | |
| Ratio of total expenses to average net assets (g) | | | 3.05 | % | | | 3.03 | % | | | 2.65 | % | | | 2.72 | %(h) |
| Ratio of net expenses to average net assets (g) | | | 2.94 | %(i)(j) | | | 3.03 | %(i)(j) | | | 2.65 | % | | | 2.72 | %(h) |
| Ratio of net investment loss to average net assets (c)(g) | | | (1.46 | %)(i) | | | (1.42 | %) | | | (1.73 | %) | | | (2.42 | %)(h) |
| Portfolio turnover rate (k) | | | 795 | % | | | 2004 | % | | | 3770 | % | | | 1639 | %(f) |
| (a) | Represents the period from the commencement of operations (March 18, 2021) through November 30, 2021. |
| (b) | Per share net investment loss has been determined on the basis of average number of shares outstanding during the period. |
| (c) | Recognition of net investment loss by the Fund is affected by the timing of the declaration of dividends by the underlying companies in which the Fund invests. |
| (d) | Total return is a measure of the change in value of an investment in the Fund over the period covered. The returns shown do not reflect the deduction of taxes a shareholder would pay on Fund distributions, if any, or the redemption of Fund shares. |
| (e) | During the year ended November 30,2021, the Fund received a payment from the Adviser of $336,826 for losses realized on the disposal of the investments purchased in violation of investment restrictions, which otherwise would have reduced the total return by 0.27% (Note 4). |
| (f) | Not annualized. |
| (g) | The ratios of expenses and net investment loss to average net assets do not reflect the Fund’s proportionate share of expenses of the underlying investment companies in which the Fund invests. |
| (h) | Annualized. |
| (i) | Ratio was determined after fee reductions (Note 4). |
| (j) | Includes 0.00% and 0.06% of borrowing costs for the years ended November 30, 2024 and 2023, respectively (Note 5). |
| (k) | Given market conditions during the period, the Fund rotated assets into, and out of, positions on a periodic basis due to its tactical trading mandate, and the Fund’s portfolio was traded frequently. |
See accompanying notes to financial statements.
| Q3 ALL-SEASON FUNDS |
| NOTES TO FINANCIAL STATEMENTS |
| November 30, 2024 |
1. Organization
Q3 All-Season Systematic Opportunities Fund and Q3 All-Season Tactical Fund (individually, a “Fund” and collectively, the “Funds”) are each a diversified series of Ultimus Managers Trust (the “Trust”), an open-end investment company established as an Ohio business trust under a Declaration of Trust dated February 28, 2012. Other series of the Trust are not incorporated in this report. The Funds commenced operations on December 30, 2019. The Funds are “funds of funds”, in that the Funds will generally invest in other investment companies.
Q3 All-Season Systematic Opportunities Fund seeks to achieve capital appreciation.
Q3 All-Season Tactical Fund seeks a positive rate of return over a calendar year regardless of market conditions.
The Q3 All-Season Systematic Opportunities Fund currently offers two classes of shares: Institutional Class shares (sold without any sales loads, but subject to an administrative services plan fee of up to 0.25% and requiring a $100,000 initial investment) and C Class shares (sold without any sales loads, but subject to a distribution and/or shareholder service fee of up to 1.00% of the average daily net assets attributable to C Class shares and requiring a $1,000 minimum initial investment). Each share class represents an ownership interest in the same investment portfolio.
The Q3 All-Season Tactical Fund currently offers two classes of shares: Institutional Class shares (sold without any sales loads, but subject to an administrative services plan fee of up to 0.25% and requiring a $100,000 initial investment) and C Class shares (sold without any sales loads, but subject to a distribution and/or shareholder service fee of up to 1.00% of the average daily net assets attributable to C Class shares and requiring a $1,000 minimum initial investment). Each share class represents an ownership interest in the same investment portfolio.
2. Significant Accounting Policies
The following is a summary of the Funds’ significant accounting policies. The policies are in conformity with accounting principles generally accepted in the United States of America (“GAAP”). The Funds follow accounting and reporting guidance under Financial Accounting Standards Board Accounting Standards Codification Topic 946, “Financial Services – Investment Companies.”
Regulatory update – Tailored Shareholder Reports for Mutual Funds and Exchange-Traded Funds (“ETFs”) – Effective January 24, 2023, the Securities and Exchange Commission (the “SEC”) adopted rule and form amendments to require mutual funds and ETFs to transmit concise and visually engaging streamlined annual and semiannual reports to shareholders that highlight key information. Other information, including
| Q3 ALL-SEASON FUNDS |
| NOTES TO FINANCIAL STATEMENTS (Continued) |
financial statements, will no longer appear in a streamlined shareholder report but must be available online, delivered free of charge upon request, and filed on a semiannual basis on Form N-CSR. The rule and form amendments had a compliance date of July 24, 2024. At this time, the Funds have implemented the rule and form requirements, as applicable, and are currently adhering to the requirements.
Securities and futures valuation – Each Fund values its portfolio securities at market value as of the close of regular trading on the New York Stock Exchange (the “NYSE”) (normally 4:00 p.m. Eastern time) on each business day the NYSE is open for business. Exchange-traded funds (“ETFs”) are valued at the security’s last sale price on the primary exchange, if available, otherwise at the exchange’s most recently quoted mean price. Investments representing shares of other open-end investment companies, except ETFs but including money market funds, are valued at their net asset value (“NAV”) as reported by such companies. The Funds value their exchange-traded futures contracts at their last sale price as of the close of regular trading on the NYSE. Prices for futures contracts are monitored daily by Q3 Asset Management Corporation (the “Adviser”), as the Funds’ valuation designee, until the close of regular trading to determine is fair valuation is required. When using a quoted price and when the market is considered active, these securities will be classified as Level 1 within the fair value hierarchy (see below). In the event that market quotations are not readily available or are considered unreliable due to market or other events, the Funds value their securities and other assets at fair value as determined by the Adviser, in accordance with procedures adopted by the Board of Trustees of the Trust (the “Board”) pursuant to Rule 2a-5 under the Investment Company Act of 1940, as amended (the “1940 Act”). Under these procedures, the securities will be classified as Level 2 or 3 within the fair value hierarchy, depending on the inputs used. Unavailable or unreliable market quotes may be due to the following factors: a substantial bid-ask spread; infrequent sales resulting in stale prices; insufficient trading volume; small trade sizes; a temporary lapse in any reliable pricing source; and actions of the securities or futures markets, such as the suspension or limitation of trading. As a result, the prices of securities used to calculate each Fund’s NAV may differ from quoted or published prices for the same securities.
GAAP establishes a single authoritative definition of fair value, sets out a framework for measuring fair value, and requires additional disclosures about fair value measurements.
Various inputs are used in determining the value of each Fund’s investments. These inputs are summarized in the three broad levels listed below:
| ● | Level 1 – quoted prices in active markets for identical securities |
| ● | Level 2 – other significant observable inputs |
| ● | Level 3 – significant unobservable inputs |
| Q3 ALL-SEASON FUNDS |
| NOTES TO FINANCIAL STATEMENTS (Continued) |
The inputs or methods used for valuing securities are not necessarily an indication of the risks associated with investing in those securities. The inputs used to measure fair value may fall into different levels of the fair value hierarchy. In such cases, for disclosure purposes, the level in the fair value hierarchy within which the fair value measurement falls in its entirety is determined based on the lowest level input that is significant to the fair value measurement.
The following is a summary of each Fund’s investments and other financial instruments and the inputs used to value the investments and other financial instruments as of November 30, 2024:
| Q3 All-Season Systematic Opportunities Fund | | Level 1 | | | Level 2 | | | Level 3 | | | Total | |
| Investments in Securities | | | | | | | | | | | | | | | | |
| Money Market Funds | | $ | 159,912,388 | | | $ | — | | | $ | — | | | $ | 159,912,388 | |
| Total | | $ | 159,912,388 | | | $ | — | | | $ | — | | | $ | 159,912,388 | |
| | | | | | | | | | | | | | | | | |
| Q3 All-Season Tactical Fund | | Level 1 | | | Level 2 | | | Level 3 | | | Total | |
| Investments in Securities | | | | | | | | | | | | | | | | |
| Money Market Funds | | $ | 51,624,491 | | | $ | — | | | $ | — | | | $ | 51,624,491 | |
| Total | | $ | 51,624,491 | | | $ | — | | | $ | — | | | $ | 51,624,491 | |
| | | | | | | | | | | | | | | | | |
| Other Financial Instruments | | | | | | | | | | | | | | | | |
| Futures Contracts | | $ | 17,023 | | | $ | — | | | $ | — | | | $ | 17,023 | |
| Futures Contracts Sold Short | | | (39,131 | ) | | | — | | | | — | | | | (39,131 | ) |
| Total | | $ | (22,108 | ) | | $ | — | | | $ | — | | | $ | (22,108 | ) |
| | | | | | | | | | | | | | | | | |
The Funds did not have any assets or liabilities that were measured at fair value on a recurring basis using significant unobservable inputs (Level 3) as of or during the year ended November 30, 2024. Other Financial Instruments are futures contracts and futures contracts sold short which are valued at the unrealized appreciation (depreciation) as of November 30, 2024.
Share valuation – The NAV per share of each class of each Fund is calculated daily by dividing the total value of the assets attributable to that class, less liabilities attributable to that class, by the number of shares outstanding of that class. The offering price and redemption price per share of each class of each Fund is equal to the NAV per share of such class.
Investment income – Dividend income is recorded on the ex-dividend date. Non-cash dividends included in dividend income, if any, are recorded at the fair value of the security received.
| Q3 ALL-SEASON FUNDS |
| NOTES TO FINANCIAL STATEMENTS (Continued) |
Investment transactions – Investment transactions are accounted for on the trade date. Realized gains and losses on investments sold are determined on a specific identification basis.
Allocation between classes – Investment income earned, realized capital gains and losses, and unrealized appreciation and depreciation are allocated daily to each Class of a Fund based upon its proportionate share of total net assets of that Fund. Class-specific expenses are charged directly to the class incurring the expense. Common expenses which are not attributable to a specific class are allocated daily to each class of shares of a Fund based upon its proportionate share of total net assets of that Fund. Distribution fees and registration and filing fees are class specific expenses.
Common expenses – Common expenses of the Trust are allocated among the Funds and the other series of the Trust based on the relative net assets of each series, the number of series in the Trust, or the nature of the services performed and the relative applicability to each series.
Distributions to shareholders – Dividends arising from net investment income, if any, are declared and paid quarterly to shareholders for Q3 All-Season Tactical Fund and annually for Q3 All-Season Systematic Opportunities Fund. Net realized capital gains, if any, are distributed at least once each year. The amount of such dividends and distributions are determined in accordance with federal income tax regulations, which may differ from GAAP. Dividends and distributions to shareholders are recorded on the ex-dividend date. The tax character of distributions paid to shareholders by the Funds during the years ended November 30, 2024 and 2023 was as follows:
| | | Year
Ended | | Ordinary
Income | | | Long-Term
Capital Gains | | | Total
Distributions | |
| Q3 All-Season Systematic Opportunities Fund | | 11/30/2024 | | $ | 14,045,899 | | | $ | 51,112 | | | $ | 14,097,011 | |
| | | 11/30/2023 | | $ | 925,842 | | | $ | — | | | $ | 925,842 | |
| | | | | | | | | | | | | | | |
| Q3 All-Season Tactical Fund | | 11/30/2024 | | $ | — | | | $ | — | | | $ | — | |
| | | 11/30/2023 | | $ | — | | | $ | — | | | $ | — | |
| | | | | | | | | | | | | | | |
Futures contracts – The Funds use futures contracts to gain exposure to or to hedge against changes in the value of equities, real estate, interest rates or commodities. A futures contract represents a commitment for the future purchase or sale of an asset at a specified price on a specified date. When the Funds purchase or sell a futures contract, no price is paid to or received by the Funds. Instead, the Funds are required to deposit in a segregated asset account an amount of cash or qualifying securities currently ranging from 2% to 10% of the contract amount. This is called the “initial margin deposit.” Subsequent payments, known as “variation margin,” are made or received by the Funds each day, depending on the daily fluctuations in the fair value of the underlying asset. The Funds recognize an unrealized gain or loss equal to the daily variation margin. If market
| Q3 ALL-SEASON FUNDS |
| NOTES TO FINANCIAL STATEMENTS (Continued) |
conditions move unexpectedly, the Funds may not achieve the anticipated benefits of the futures contracts and may realize a loss. The margin deposits for futures contracts and the variation receivable/payable are reported on the Statements of Assets and Liabilities.
Estimates – The preparation of financial statements in conformity with GAAP requires management to make estimates and assumptions that affect the reported amounts of assets and liabilities and disclosure of contingent assets and liabilities as of the date of the financial statements and the reported amounts of increase (decrease) in net assets from operations during the reporting period. Actual results could differ from those estimates.
Federal income tax – Each Fund has qualified and intends to continue to qualify as a regulated investment company under the Internal Revenue Code of 1986, as amended (the “Code”). Qualification generally will relieve the Funds of liability for federal income taxes to the extent 100% of their net investment income and net realized capital gains are distributed in accordance with the Code.
In order to avoid imposition of the excise tax applicable to regulated investment companies, it is also each Fund’s intention to declare as dividends in each calendar year at least 98% of its net investment income (earned during the calendar year) and 98.2% of its net realized capital gains (earned during the twelve months ended October 31) plus undistributed amounts from prior years.
The following information is computed on a tax basis for each item as of November 30, 2024:
| |
| Q3 All-Season
Systematic
Opportunities
Fund | | | Q3 All-Season
Tactical Fund | |
| Tax cost of investments | | $ | 159,912,388 | | | $ | 51,624,491 | |
| Gross unrealized appreciation | | $ | — | | | $ | — | |
| Gross unrealized depreciation | | | — | | | | — | |
| Net unrealized appreciation | | | — | | | | — | |
| Undistributed ordinary income | | | 3,264,955 | | | | — | |
| Accumulated capital and other losses | | | (513,083 | ) | | | (19,861,407 | ) |
| Distributable earnings (accumulated deficit) | | $ | 2,751,872 | | | $ | (19,861,407 | ) |
| | | | | | | | | |
The difference, if any, between the federal income tax cost of investments and the financial statement cost of investments for the Funds is due to certain timing differences in the recognition of capital gains or losses under income tax regulations and GAAP. These “book/tax” differences are temporary in nature.
Qualified late year ordinary losses incurred after December 31, 2023 and within the taxable year are deemed to arise on the first day of the Fund’s next taxable year. For the year ended November 30, 2024, Q3 All-Season Tactical Fund deferred late year ordinary losses to December 1, 2024 for federal income tax purposes in the amount of $143,657.
| Q3 ALL-SEASON FUNDS |
| NOTES TO FINANCIAL STATEMENTS (Continued) |
During the year ended November 30, 2024, Q3 All-Season Tactical Fund utilized $12,681,402 of short-term capital loss carryforwards (“CLCFs”) against current year realized capital gains.
As of November 30, 2024, Q3 All-Season Systematic Opportunities Fund had short-term CLCFs for income tax purposes in the amount of $513,083. As a result of an ownership change, Q3 All-Season Systematic Opportunities Fund is eligible to utilize this amount to offset the current year and future net realized capital gains, if any, subject to an annual limitation under Code Section 382 of $96,234. As of November 30, 2024, Q3 All-Season Tactical Fund had short-term CLCFs in the amount of $19,164,715 and long-term CLCFs in the amount of $553,035 for income tax purposes. These CLCFs, which do not expire, may be utilized in future years to offset net realized capital gains, if any, prior to distributing such gains to shareholders.
For the year ended November 30, 2024, Q3 All-Season Tactical Fund reclassified $49,078 of accumulated deficit against paid-in capital on the Statement of Assets and Liabilities. Such reclassification, the result of permanent differences between the financial statement and income tax reporting requirements, had no effect on the Fund’s net assets or NAV per share and were due to a net operating loss. Reclassifications are made to the Fund’s capital accounts to reflect income and gains available for distribution (or available capital loss carryovers) under current income tax regulations.
The Funds recognize the tax benefits or expenses of uncertain tax positions only when the position is “more likely than not” of being sustained assuming examination by tax authorities. Management has reviewed each Fund’s tax positions for all open tax years (generally, three years) and has concluded that no provision for unrecognized tax benefits or expenses is required in these financial statements. The Funds identify their major tax jurisdiction as U.S. Federal.
The Funds recognize interest and penalties, if any, related to unrecognized tax benefits as income tax expense on the Statements of Operations. During the year ended November 30, 2024, the Funds did not incur any interest or penalties.
3. Investment Transactions
For the year ended November 30, 2024, cost of purchases and proceeds from sales of investment securities, other than short-term investments, amounted to $6,605,960,433, and $6,771,395,755, respectively, for Q3 All-Season Systematic Opportunities Fund and $348,532,088 and $403,383,639, respectively, for Q3 All-Season Tactical Fund.
| Q3 ALL-SEASON FUNDS |
| NOTES TO FINANCIAL STATEMENTS (Continued) |
4. Transactions with Related Parties
INVESTMENT MANAGEMENT AGREEMENT
The Funds’ investments are managed by the Adviser pursuant to the terms of an Investment Advisory Agreement. Each Fund pays the Adviser a management fee, computed and accrued daily and paid monthly, at the annual rate of 1.00% of average daily net assets. During the year ended November 30, 2024, the Adviser earned $1,785,319 and $520,993 of fees under the Investment Management Agreement for Q3 All-Season Systematic Opportunities Fund and Q3 All-Season Tactical Fund, respectively.
Pursuant to an Expense Limitation Agreement (“ELA”) between each Fund and the Adviser, the Adviser has contractually agreed, until March 31, 2026, to reduce management fees and reimburse other expenses to the extent necessary to limit total annual fund operating expenses of the Q3 All-Season Tactical Fund and the All-Season Systematic Opportunities Fund (exclusive of brokerage costs; taxes; interest; borrowing costs such as interest and dividend expenses on securities sold short; costs to organize the Fund; acquired fund fees and expenses; extraordinary expenses such as litigation and merger or reorganization costs; and other expenses not incurred in the ordinary course of the Fund’s business) to an amount not exceeding the following percentages of average daily net assets attributable to each respective class, if applicable:
| All-Season Systematic Opportunities Fund |
| Institutional Class | C Class |
| 1.79% | 2.79% |
| All-Season Tactical Fund |
| Institutional Class | C Class |
| 1.94% | 2.94% |
Accordingly, during the year ended November 30, 2024, the Adviser reduced management fees in the amount of $168 for Q3 All-Season Systematic Opportunities Fund and $1,815 for Q3 All-Season Tactical Fund.
Under the terms of the ELA, management fee reductions and expense reimbursements by the Adviser are subject to repayment by the Funds for a period of thirty-six months after the date on which such fees and expenses were incurred or waived, provided that the repayments do not cause total annual fund operating expenses (exclusive of such reductions and reimbursements) to exceed: (i) the expense limitation then in effect, if any, and (ii) the expense limitation in effect at the time the expenses to be repaid were incurred. During the year ended November 30, 2024, the Adviser recouped $79,761 of prior years’ management fee reductions and expense reimbursements from the Q3 All-
| Q3 ALL-SEASON FUNDS |
| NOTES TO FINANCIAL STATEMENTS (Continued) |
Season Systematic Opportunities Fund. As of November 30,2024, the Adviser may seek repayments of management fee reductions and expense reimbursement no later than below:
| |
| Q3 All-Season
Systematic
Opportunities
Fund | | | Q3 All-Season
Tactical Fund | |
| November 30, 2027 | | $ | 168 | | | $ | 1,815 | |
| Total | | $ | 168 | | | $ | 1,815 | |
| | | | | | | | | |
OTHER SERVICE PROVIDERS
Ultimus Fund Solutions, LLC (“Ultimus”) provides administration, fund accounting, and transfer agency services to the Funds. The Funds pay Ultimus fees in accordance with the agreements for such services. In addition, the Funds pay out-of-pocket expenses including, but not limited to, postage, supplies, and certain costs related to the pricing of the Funds’ portfolio securities.
Under the terms of a Consulting Agreement with the Trust, Northern Lights Compliance Services, LLC (“NLCS”) provides an Anti-Money Laundering Officer and Chief Compliance Officer to the Trust, as well as related compliance services. Under the terms of the agreement, NLCS receives fees from the Funds. NLCS is a wholly-owned subsidiary of Ultimus.
Under the terms of a Distribution Agreement with the Trust, Ultimus Fund Distributors, LLC (the “Distributor”) serves as the principal underwriter to the Funds. The Distributor is a wholly-owned subsidiary of Ultimus. The Distributor is compensated partially by the Adviser and partially by the C Class shares of each fund for acting as principal underwriter.
Certain officers of the Trust are also officers of Ultimus and are not paid by the Funds for serving such capacities.
DISTRIBUTION PLAN
The Funds have adopted a plan of distribution (the “Plan”), pursuant to Rule 12b-1 under the 1940 Act, which permits C Class shares of the Funds to directly incur or reimburse the Funds’ principal underwriter for certain expenses related to the distribution of its shares. The annual limitation for payment of expenses pursuant to the Plan 1.00% of the Funds’ average daily net assets allocable to C Class shares. The Funds have not adopted a plan of distribution with respect to the Institutional Class shares. During the year ended November 30, 2024, the C Class shares incurred $439 and $17,728 of distribution fees under the Plan for the Q3 All-Season Systematic Opportunities Fund and Q3 All-Season Tactical Fund, respectively.
| Q3 ALL-SEASON FUNDS |
| NOTES TO FINANCIAL STATEMENTS (Continued) |
ADMINISTRATIVE SERVICES PLAN
The Trust has adopted an Administrative Services Plan (the “Administrative Service Plan”) for the Institutional Shares of the Funds. The Administrative Service Plan allows the Funds to use the net assets of the Institutional Shares to pay financial intermediaries that provide services relating to Institutional Shares. The Administrative Service Plan permits payments for the provision of certain administrative, recordkeeping and other non-distribution related services to Institutional Share shareholders. The Administrative Service Plan permits the Funds to make service fee payments at an annual rate of up to 0.25% of each Fund’s average daily net assets attributable to its Institutional Shares. During the year ended November 30, 2024, no fees were incurred by the Funds under the Administrative Service Plan.
TRUSTEE COMPENSATION
Each member of the Board who is not an “interested person” (as defined by the 1940 Act, as amended) of the Trust receives an annual retainer and meeting fees, plus reimbursement for travel and other meeting-related expenses.
PRINCIPAL HOLDERS OF FUND SHARES
As of November 30, 2024, the following shareholders owned of record 25% or more of the outstanding shares of the Funds:
| NAME OF RECORD OWNER | | % Ownership | |
| Q3 All-Season Systematic Opportunities Fund | | | |
| E*TRADE Savings Bank (for the benefit of its customers) | | 55% | |
| Charles Schwab & Co. Inc. (for the benefit of its customers) | | 25% | |
| | | | |
| Q3 All-Season Tactical Fund | | | |
| E*TRADE Savings Bank (for the benefit of its customers) | | 66% | |
| Charles Schwab & Co. Inc. (for the benefit of its customers) | | 27% | |
A beneficial owner of 25% or more of a Fund’s outstanding shares may be considered a controlling person of the Fund. That shareholder’s vote could have a more significant effect on matters presented at a shareholders’ meeting.
5. Derivatives Transactions
The Funds’ positions in derivative instruments as of November 30, 2024 are recorded in the following location on the Statements of Assets and Liabilities:
| Derivative Investment Type | Location |
| Futures contracts | Variation margin payable |
| Q3 ALL-SEASON FUNDS |
| NOTES TO FINANCIAL STATEMENTS (Continued) |
The following table sets forth the values of variation margin of the Q3 All-Season Tactical Fund as of November 30, 2024:
| Q3 All-Season Tactical Fund | | | | | | |
| | | Variation Margin | | | | |
| Type of Derivative and Risk | | Receivable | | | (Payable) | | | Total | |
| Futures contracts | | | | | | | | | | | | |
| Treasury | | $ | — | | | $ | (17,071 | ) | | $ | (17,071 | ) |
| Total | | $ | — | | | $ | (17,071 | ) | | $ | (17,071 | ) |
| | | | | | | | | | | | | |
The Funds’ transactions in derivative instruments during the year ended November 30, 2024 are recorded in the following locations on the Statements of Operations:
| Derivative Investment Type | Location |
| Futures contracts | Net realized losses from long futures contracts and short futures contracts |
| Net change in unrealized appreciation (depreciation) on long futures contracts and short futures contracts |
The following is a summary of the Funds’ net realized losses and net change in unrealized appreciation (depreciation) on derivative instruments recognized on the Statements of Operations during the year ended November 30, 2024:
| Type of Derivative and Risk | | Net Realized
Losses | | | Net Change
in Unrealized
Appreciation
(Depreciation) | |
| Q3 All-Season Systematic Opportunities Fund | | | | | | | | |
| Futures contracts | | | | | | | | |
| Index | | $ | (911,569 | ) | | $ | — | |
| Total | | $ | (911,569 | ) | | $ | — | |
| | | | | | | | | |
| Q3 All-Season Tactical Fund | | | | | | | | |
| Futures contracts | | | | | | | | |
| Index | | $ | (791,188 | ) | | $ | 17,023 | |
| Treasury | | | (108,428 | ) | | | (39,131 | ) |
| Total | | $ | (899,616 | ) | | $ | (22,108 | ) |
| | | | | | | | | |
| Q3 ALL-SEASON FUNDS |
| NOTES TO FINANCIAL STATEMENTS (Continued) |
6. Borrowing Costs
From time to time, the Funds may have an overdrawn cash balance at the custodian due to redemptions or market movements. When this occurs, the Funds will incur borrowing costs charged by the custodian. Accordingly, during the year ended November 30, 2024, the Q3 All-Season Tactical Fund incurred $367 of borrowing costs charged by the custodian.
7. Investments in Other Investment Companies
Each Fund may invest a significant portion of its assets in shares of one or more investment companies, including ETFs, open-end mutual funds and money market mutual funds. Each Fund will incur additional indirect expenses (acquired fund fees and expenses) to the extent it invests in shares of other investment companies.
In order to maintain sufficient liquidity to implement investment strategies, or for temporary defensive purposes, a Fund may at times invest a significant portion of its assets in shares of a money market fund. As of November 30, 2024, Q3 All-Season Systematic Opportunities Fund had 89.7% of the value of its net assets invested in shares of First American Government Obligations Fund - Class X (“FGXXX”), a money market fund registered under the 1940 Act. As of November 30, 2024, Q3 All-Season Tactical Fund had 90.8% of the value of its net assets invested in shares of First American Government Obligations Fund - Class X (“FGXXX”), a money market fund registered under the 1940 Act. An investment in a money market fund is not insured or guaranteed by the Federal Deposit Insurance Corporation or any other government agency, entity or person. While investor losses in money market funds have been rare, they are possible. A Fund incurs additional indirect expenses due to acquired fund fees and expenses to the extent it invests in shares of money market funds. The financial statements for FGXXX can be found at www.sec.gov.
8. Contingencies and Commitments
The Funds indemnify the Trust’s officers and Trustees for certain liabilities that might arise from their performance of their duties to the Funds. Additionally, in the normal course of business the Funds enter into contracts that contain a variety of representations and warranties and which provide general indemnifications. The Funds’ maximum exposure under these arrangements is unknown, as this would involve future claims that may be made against the Funds that have not yet occurred. However, based on experience, the Funds expect the risk of loss to be remote.
9. Subsequent Events
The Funds are required to recognize in the financial statements the effects of all subsequent events that provide additional evidence about conditions that existed as of the date of the Statements of Assets and Liabilities. For non-recognized subsequent events
| Q3 ALL-SEASON FUNDS |
| NOTES TO FINANCIAL STATEMENTS (Continued) |
that must be disclosed to keep the financial statements from being misleading, the Funds are required to disclose the nature of the event as well as an estimate of its financial effect, or a statement that such an estimate cannot be made. Management has evaluated subsequent events through the issuance of these financial statements and has noted no such events except the following:
On January 2, 2025, the Q3 All-Season Systematic Opportunities Fund paid the following to shareholders of record on December 30, 2024:
| | | Income
Per Share | | | Short-Term
Capital Gain
Per Share | |
| Q3 All-Season Systematic Opportunities Fund - Institutional Class | | $ | 0.1418 | | | $ | 0.3797 | |
| Q3 All-Season Systematic Opportunities Fund - C Class | | | 0.1261 | | | | 0.3797 | |
Q3 ALL-SEASON FUNDS
REPORT OF INDEPENDENT REGISTERED |
| PUBLIC ACCOUNTING FIRM |
To the Shareholders of Q3 All-Season Systematic Opportunities Fund and Q3 All-Season Tactical Fund and Board of Trustees of Ultimus Managers Trust
Opinion on the Financial Statements
We have audited the accompanying statements of assets and liabilities, including the schedules of investments, futures contracts and futures contracts sold short, of Q3 All-Season Systematic Opportunities Fund and Q3 All-Season Tactical Fund (the “Funds”), each a series of Ultimus Managers Trust, as of November 30, 2024, the related statements of operations for the year then ended, the statements of changes in net assets for each of the two years in the period then ended, the financial highlights for each of the two years in the period then ended, and the related notes (collectively referred to as the “financial statements”). In our opinion, the financial statements present fairly, in all material respects, the financial position of each of the Funds as of November 30, 2024, the results of their operations for the year then ended, the changes in net assets for each of the two years in the period then ended, and the financial highlights for each of the two years in the period then ended, in conformity with accounting principles generally accepted in the United States of America.
The Funds’ financial highlights for the years or periods ended November 30, 2022, and prior, were audited by other auditors whose report, dated January 26, 2023, expressed an unqualified opinion on those financial highlights.
Basis for Opinion
These financial statements are the responsibility of the Funds’ management. Our responsibility is to express an opinion on the Funds’ financial statements based on our audits. We are a public accounting firm registered with the Public Company Accounting Oversight Board (United States) (“PCAOB”) and are required to be independent with respect to the Funds in accordance with the U.S. federal securities laws and the applicable rules and regulations of the Securities and Exchange Commission and the PCAOB.
We conducted our audits in accordance with the standards of the PCAOB. Those standards require that we plan and perform the audit to obtain reasonable assurance about whether the financial statements are free of material misstatement whether due to error or fraud.
Our audits included performing procedures to assess the risks of material misstatement of the financial statements, whether due to error or fraud, and performing procedures that respond to those risks. Such procedures included examining, on a test basis, evidence regarding the amounts and disclosures in the financial statements. Our procedures included confirmation of securities owned as of November 30, 2024, by correspondence with the custodians and brokers. Our audits also included evaluating the accounting
Q3 ALL-SEASON FUNDS
REPORT OF INDEPENDENT REGISTERED |
| PUBLIC ACCOUNTING FIRM (Continued) |
principles used and significant estimates made by management, as well as evaluating the overall presentation of the financial statements. We believe that our audits provide a reasonable basis for our opinion.
We have served as the Funds’ auditor since 2023.

COHEN & COMPANY, LTD.
Philadelphia, Pennsylvania
January 29, 2025
| Q3 ALL-SEASON FUNDS |
| ADDITIONAL INFORMATION (Unaudited) |
Changes in and Disagreements with Accountants
There were no changes in or disagreements with accountants during the period covered by this report.
Proxy Disclosures
Not applicable.
Remuneration Paid to Directors, Officers and Others
Refer to the financial statements included herein.
Statement Regarding Basis for Approval of Investment Advisory Agreement
Not applicable.
| Q3 ALL-SEASON FUNDS |
| OTHER INFORMATION (Unaudited) |
A description of the policies and procedures that the Funds use to vote proxies relating to portfolio securities is available without charge upon request by calling toll-free 1-855-784-2399, or on the SEC’s website at www.sec.gov. Information regarding how the Funds voted proxies relating to portfolio securities during the most recent 12-month period ended June 30 is available without charge upon request by calling toll-free 1-855-784-2399, or on the SEC’s website at www.sec.gov.
The Trust files a complete listing of portfolio holdings for the Funds with the SEC as of the end of the first and third quarters of each fiscal year as an exhibit to its reports on Form N-PORT. These filings are available upon request by calling 1-855-784-2399. Furthermore, you may obtain a copy of the filings on the SEC’s website at www.sec.gov and on the Funds’ website at www.Q3AllSeasonfunds.com.
Q3 ALL-SEASON FUNDS
FEDERAL TAX INFORMATION (Unaudited)
For the fiscal year ended November 30, 2024, the Funds designated the following as long-term capital gain distributions.
| Q3 All-Season Systematic Opportunities Fund | | $ | 51,112 | |
| Q3 All-Season Tactical Fund | | | — | |
Qualified Dividend Income – The Funds have designated the following of their ordinary income dividends, or up to the maximum amount of such dividends allowable pursuant to the Internal Revenue Code, as qualified dividend income eligible for the reduced tax rate:
| Q3 All-Season Systematic Opportunities Fund | | | 0.14 | % |
| Q3 All-Season Tactical Fund | | | 0.00 | % |
Q3 All-Season Active Rotation ETF
(QVOY)
Annual Financial Statements and Additional Information
November 30, 2024
Q3 ALL-SEASON ACTIVE ROTATION ETF
SCHEDULE OF INVESTMENTS
November 30, 2024
| EXCHANGE-TRADED FUNDS — 99.7% | | Shares | | | Value | |
| Equity — 79.4% | | | | | | | | |
| Amplify Transformational Data Sharing ETF | | | 53,000 | | | $ | 2,663,250 | |
| Consumer Discretionary Select Sector SPDR Fund | | | 44,006 | | | | 9,782,534 | |
| Industrial Select Sector SPDR Fund | | | 63,832 | | | | 9,191,170 | |
| Invesco S&P 500 BuyWrite ETF | | | 113,000 | | | | 2,626,120 | |
| iShares Core S&P 500 ETF | | | 14,080 | | | | 8,519,386 | |
| Schwab U.S. Large-Cap Growth ETF | | | 332,822 | | | | 9,249,123 | |
| Vanguard FTSE Emerging Markets ETF | | | 187,661 | | | | 8,551,712 | |
| | | | | | | | 50,583,295 | |
| Fixed Income — 8.0% | | | | | | | | |
| iShares 7-10 Year Treasury Bond ETF | | | 8,752 | | | | 833,103 | |
| iShares Broad USD High Yield Corporate Bond ETF | | | 20,700 | | | | 776,871 | |
| iShares Convertible Bond ETF | | | 29,712 | | | | 2,652,687 | |
| Vanguard Intermediate-Term Corporate Bond ETF | | | 10,060 | | | | 826,630 | |
| | | | | | | | 5,089,291 | |
| Commodity — 12.3% | | | | | | | | |
| VanEck Gold Miners ETF | | | 208,217 | | | | 7,841,452 | |
| | | | | | | | | |
| Investments at Value — 99.7% (Cost $61,927,444) | | | | | | $ | 63,514,038 | |
| | | | | | | | | |
| Other Assets in Excess of Liabilities — 0.3% | | | | | | | 202,993 | |
| | | | | | | | | |
| Net Assets — 100.0% | | | | | | $ | 63,717,031 | |
See accompanying notes to financial statements.
Q3 ALL-SEASON ACTIVE ROTATION ETF
STATEMENT OF ASSETS AND LIABILITIES
November 30, 2024
| ASSETS | | | | |
| Investments in securities: | | | | |
| At cost | | $ | 61,927,444 | |
| At value (Note 2) | | $ | 63,514,038 | |
| Cash (Note 2) | | | 269,614 | |
| Interest receivable | | | 845 | |
| Other assets | | | 1,952 | |
| Total assets | | | 63,786,449 | |
| | | | | |
| LIABILITIES | | | | |
| Payable to Adviser (Note 4) | | | 32,439 | |
| Payable to administrator (Note 4) | | | 8,230 | |
| Other accrued expenses and liabilities | | | 28,749 | |
| Total liabilities | | | 69,418 | |
| | | | | |
| NET ASSETS | | $ | 63,717,031 | |
| | | | | |
| NET ASSETS CONSIST OF: | | | | |
| Paid-in capital | | $ | 56,369,165 | |
| Distributable earnings | | | 7,347,866 | |
| NET ASSETS | | $ | 63,717,031 | |
| | | | | |
Shares of beneficial interest outstanding
(unlimited number of shares authorized, no par value) | | | 2,210,000 | |
| | | | | |
| Net asset value, offering price and redemption price per share (Note 2) | | $ | 28.83 | |
See accompanying notes to financial statements.
Q3 ALL-SEASON ACTIVE ROTATION ETF
STATEMENT OF OPERATIONS
Year Ended November 30, 2024
| INVESTMENT INCOME | | | | |
| Dividend income | | $ | 1,233,393 | |
| Interest income | | | 11,725 | |
| | | | 1,245,118 | |
| EXPENSES | | | | |
| Management fees (Note 4) | | | 503,532 | |
| Administration fees (Note 4) | | | 68,513 | |
| Legal fees | | | 33,124 | |
| Trustees’ fees and expenses (Note 4) | | | 20,998 | |
| Fund accounting fees (Note 4) | | | 17,347 | |
| Audit and tax services fees | | | 16,195 | |
| Compliance fees and expenses (Note 4) | | | 16,179 | |
| Custody fees | | | 14,981 | |
| Borrowing costs (Note 6) | | | 14,073 | |
| Transfer agent fees | | | 9,167 | |
| Shareholder reporting expenses | | | 8,086 | |
| Registration and filing fees | | | 4,506 | |
| Other expenses | | | 19,505 | |
| Total expenses | | | 746,206 | |
| | | | | |
| NET INVESTMENT INCOME | | | 498,912 | |
| | | | | |
| REALIZED AND UNREALIZED GAINS (LOSSES) ON INVESTMENTS | | | | |
| Net realized gains from investment transactions | | | 6,286,313 | |
| Net realized gains from in-kind transactions (Note 3) | | | 425,203 | |
| Net change in unrealized appreciation (depreciation) on investments | | | (356,486 | ) |
| NET REALIZED AND UNREALIZED GAINS ON INVESTMENTS | | | 6,355,030 | |
| | | | | |
| NET INCREASE IN NET ASSETS RESULTING FROM OPERATIONS | | $ | 6,853,942 | |
See accompanying notes to financial statements.
Q3 ALL-SEASON ACTIVE ROTATION ETF
STATEMENTS OF CHANGES IN NET ASSETS
| | | Year Ended
November 30,
2024 | | | Period Ended
November 30,
2023(a) | |
| FROM OPERATIONS | | | | | | | | |
| Net investment income | | $ | 498,912 | | | $ | 216,461 | |
| Net realized gains from investment transactions | | | 6,286,313 | | | | 3,512,508 | |
| Net realized gains from in-kind transactions (Note 3) | | | 425,203 | | | | 252,195 | |
| Net change in unrealized appreciation (depreciation) on investments | | | (356,486 | ) | | | 1,943,080 | |
| Net increase in net assets resulting from operations | | | 6,853,942 | | | | 5,924,244 | |
| | | | | | | | | |
| FROM DISTRIBUTIONS TO SHAREHOLDERS (NOTE 2) | | | (4,338,720 | ) | | | (225,959 | ) |
| | | | | | | | | |
| FROM CAPITAL SHARE TRANSACTIONS | | | | | | | | |
| Proceeds from shares issued | | | 20,330,790 | | | | 77,184,137 | |
| Payments for shares redeemed | | | (30,788,451 | ) | | | (11,222,952 | ) |
| Net increase (decrease) in net assets from capital share transactions | | | (10,457,661 | ) | | | 65,961,185 | |
| | | | | | | | | |
| TOTAL INCREASE (DECREASE) IN NET ASSETS | | | (7,942,439 | ) | | | 71,659,470 | |
| | | | | | | | | |
| NET ASSETS | | | | | | | | |
| Beginning of period | | | 71,659,470 | | | | — | |
| End of period | | $ | 63,717,031 | | | $ | 71,659,470 | |
| | | | | | | | | |
| SHARE TRANSACTIONS | | | | | | | | |
| Shares issued | | | 730,000 | | | | 3,020,000 | |
| Shares redeemed | | | (1,110,000 | ) | | | (430,000 | ) |
| Net increase (decrease) in shares outstanding | | | (380,000 | ) | | | 2,590,000 | |
| Shares outstanding at beginning of period | | | 2,590,000 | | | | — | |
| Shares outstanding at end of period | | | 2,210,000 | | | | 2,590,000 | |
| (a) | Represents the period from the commencement of operations (December 6, 2022) through November 30, 2023. |
See accompanying notes to financial statements.
Q3 ALL-SEASON ACTIVE ROTATION ETF
FINANCIAL HIGHLIGHTS
Per Share Data for a Share Outstanding Throughout Each Period:
| | | Year Ended
November 30,
2024 | | | Period Ended
November 30,
2023(a) | |
| Net asset value at beginning of period | | $ | 27.67 | | | $ | 25.00 | |
| | | | | | | | | |
| Income from investment operations: | | | | | | | | |
| Net investment income (b)(c) | | | 0.18 | | | | 0.10 | |
| Net realized and unrealized gains on investments | | | 2.63 | | | | 2.68 | |
| Total from investment operations | | | 2.81 | | | | 2.78 | |
| | | | | | | | | |
| Less distributions to shareholders from: | | | | | | | | |
| Net investment income | | | (0.05 | ) | | | (0.11 | ) |
| Net realized gains | | | (1.60 | ) | | | — | |
| Total distributions from shareholders | | | (1.65 | ) | | | (0.11 | ) |
| | | | | | | | | |
| Net asset value at end of period | | $ | 28.83 | | | $ | 27.67 | |
| Market price at end of period | | $ | 28.81 | | | $ | 27.67 | |
| | | | | | | | | |
| Total return (d) | | | 10.42 | % | | | 11.19 | %(e) |
| Total return at market (f) | | | 10.34 | % | | | 11.19 | %(e) |
| | | | | | | | | |
| Net assets at end of period (000’s) | | $ | 63,717 | | | $ | 71,659 | |
| | | | | | | | | |
| Ratios/supplementary data: | | | | | | | | |
| Ratio of total expenses to average net assets (g) | | | 0.96 | %(i) | | | 1.08 | %(h)(i) |
| Ratio of net investment income to average net assets (g) | | | 0.64 | %(i) | | | 0.39 | %(h)(i) |
| Portfolio turnover rate (j) | | | 653 | % | | | 581 | %(e) |
| (a) | Represents the period from the commencement of operations (December 6, 2022) through November 30, 2023. |
| (b) | Per share net investment income has been determined on the basis of average number of shares outstanding during the period. |
| (c) | Recognition of net investment income by the Fund is affected by the timing of the declaration of dividends by the underlying companies in which the Fund invests. |
| (d) | Net asset value total return is calculated assuming an initial investment made at the net asset value at the beginning of the period, reinvestment of all dividends and distributions at net asset value during the period, if any, and redemption on the last day of the period at net asset value. This percentage is not an indication of the performance of a shareholder’s investment in the Fund based on market value due to differences between the market price of the shares and the net asset value per share of the Fund. |
| (e) | Not annualized. |
| (f) | Market value total return is calculated assuming an initial investment made at the market value at the beginning of the period, reinvestment of all dividends and distributions at net asset value during the period, if any, and redemption on the last day of the period at market value. Market value is determined by the composite closing price. Composite closing security price is defined as the last reported sale price from any primary listing market (e.g., Cboe BZX) or participating regional exchanges or markets. The composite closing price is the last reported sale price from any of the eligible sources, regardless of volume and not an average price and may have occurred on a date prior to the close of the reporting period. Market value may be greater or less than net asset value, depending on the Fund’s closing price on the listing market. |
| (g) | The ratios of expense and net investment income to average net assets do not reflect the Fund’s proportionate share of expenses of the underlying investment companies in which the Fund invests. |
Q3 ALL-SEASON ACTIVE ROTATION ETF
FINANCIAL HIGHLIGHTS (Continued)
| (h) | Annualized. |
| (i) | Includes 0.02% and 0.03%(h) of borrowing costs, for the year/period ended November 30, 2024 and 2023, respectively (Note 6). |
| (j) | Portfolio turnover rate excludes securities received or delivered from in-kind processing of creations or redemptions (Note 3). |
See accompanying notes to financial statements.
| Q3 ALL-SEASON ACTIVE ROTATION ETF |
| NOTES TO FINANCIAL STATEMENTS |
| November 30, 2024 |
1. Organization
Q3 All-Season Active Rotation ETF (the “Fund”) is a diversified series of Ultimus Managers Trust (the “Trust”), an open-end investment company established as an Ohio business trust under a Declaration of Trust dated February 28, 2012. Other series of the Trust are not incorporated in this report. The Fund commenced operations on December 6, 2022. The Fund is a “fund of funds,” in that the Fund will generally invest in other investment companies.
The Fund is an exchange-traded fund (“ETF”). The investment objective of the Fund is to seek to achieve long-term growth of capital.
Shares of the Fund are listed and traded on the Cboe BZX Exchange, Inc. Market prices for the Shares may be different from their net asset value (“NAV”.) The Fund issues and redeems shares solely to certain financial institutions such as registered broker-dealers and banks that have entered into agreements with the Fund’s distributor (“Authorized Participants” or “APs”) on a continuous basis at net asset value per share (“NAV”) in aggregations of a specified number of shares called “Creation Units.” Creation Units generally are issued in exchange for a basket of securities (“Deposit Securities”), together with the deposit of a specified cash payment (“Balancing Amount”). Shares are not individually redeemable, but are redeemable only in Creation Unit aggregations, and generally in exchange for portfolio securities and a specified cash payment. A Creation Unit of the Fund consists of a block of shares.
2. Significant Accounting Policies
The following is a summary of the Fund’s significant accounting policies. The policies are in conformity with accounting principles generally accepted in the United States of America (“GAAP”). The Fund follows accounting and reporting guidance under Financial Accounting Standards Board Accounting Standards Codification Topic 946, “Financial Services – Investment Companies.”
Regulatory update - Tailored Shareholder Reports for Mutual Funds and Exchange-Traded Funds (“ETFs”) – Effective January 24, 2023, the Securities and Exchange Commission (the “SEC”) adopted rule and form amendments to require mutual funds and ETFs to transmit concise and visually engaging streamlined annual and semiannual reports to shareholders that highlight key information. Other information, including financial statements, will no longer appear in a streamlined shareholder report but must be available online, delivered free of charge upon request, and filed on a semiannual basis on Form N-CSR. The rule and form amendments had a compliance date of July 24, 2024. The Fund has implemented the rule and form amendments, as applicable, and is currently adhering to the requirements.
| Q3 ALL-SEASON ACTIVE ROTATION ETF |
| NOTES TO FINANCIAL STATEMENTS (Continued) |
Securities valuation – The Fund values its portfolio securities at market value as of the close of regular trading on the New York Stock Exchange (the “NYSE”) (normally 4:00 p.m. Eastern time) on each business day the NYSE is open for business. ETFs are valued at the securities last sale price on the primary exchange, if available, otherwise at the exchange’s most recently quoted mean price. When using a quoted price and when the market is considered active, the security will be classified as Level 1 within the fair value hierarchy (see below). In the event that market quotations are not readily available or are considered unreliable due to market or other events, the Fund values its securities and other assets at fair value as determined by Q3 Asset Management Corporation (the “Adviser”), as the valuation designee, in accordance with procedures adopted by the Board of Trustees (the “Board”) pursuant to Rule 2a-5 under the Investment Company Act of 1940, as amended (the “1940 Act”). Under these procedures, the securities will be classified as Level 2 or 3 within the fair value hierarchy, depending on the inputs used. Unavailable or unreliable market quotes may be due to the following factors: a substantial bid-ask spread; infrequent sales resulting in stale prices; insufficient trading volume; small trade sizes; a temporary lapse in any reliable pricing source; and actions of the securities or futures markets, such as the suspension or limitation of trading. As a result, the prices of securities used to calculate the Fund’s NAV may differ from quoted or published prices for the same securities.
GAAP establishes a single authoritative definition of fair value, sets out a framework for measuring fair value, and requires additional disclosures about fair value measurements.
Various inputs are used in determining the value of the Fund’s investments. These inputs are summarized in the three broad levels listed below:
| ● | Level 1 – quoted prices in active markets for identical securities |
| ● | Level 2 – other significant observable inputs |
| ● | Level 3 – significant unobservable inputs |
The inputs or methods used for valuing securities are not necessarily an indication of the risks associated with investing in those securities. The inputs used to measure fair value may fall into different levels of the fair value hierarchy. In such cases, for disclosure purposes, the level in the fair value hierarchy within which the fair value measurement falls in its entirety is determined based on the lowest level input that is significant to the fair value measurement.
The following is a summary of the Fund’s investments by the inputs used to value the investments as of November 30, 2024:
| | | Level 1 | | | Level 2 | | | Level 3 | | | Total | |
| Exchange-Traded Funds | | $ | 63,514,038 | | | $ | — | | | $ | — | | | $ | 63,514,038 | |
| Total | | $ | 63,514,038 | | | $ | — | | | $ | — | | | $ | 63,514,038 | |
| | | | | | | | | | | | | | | | | |
| Q3 ALL-SEASON ACTIVE ROTATION ETF |
| NOTES TO FINANCIAL STATEMENTS (Continued) |
Refer to the Fund’s Schedule of Investments for a listing of securities by sector and industry type. The Fund did not hold any derivative instruments or any assets or liabilities that were measured at fair value on a recurring basis using significant unobservable inputs (Level 3) as of or during the year ended November 30, 2024.
Cash – The Fund’s cash, if any, is held in a bank account with balances which may exceed the Federal Deposit Insurance Corporation (FDIC) limit of $250,000. The cash balance reflected on the Statement of Assets and Liabilities for the Fund represents the amount held as of November 30, 2024.
Share valuation – Individual shares of an ETF may be purchased and sold only on a national securities exchange through a broker-dealer. Lack of liquidity in an ETF could result in the ETF being more volatile than its underlying securities. The price of such shares is based on market price, and because ETF shares trade at market prices rather than NAV, shares may trade at a price greater than NAV (a premium) or less than NAV (a discount). The market price of an ETF’s shares, like the price of any exchange-traded security, includes a “bid ask spread” charged by the exchange specialists, market makers or other participants that trade the particular security. The bid ask spread often increases significantly during times of market disruption, which means that, to the extent that the Fund invests directly in an ETF, the shares of that ETF may trade at a greater discount at a time when the Fund wishes to sell its shares.
Investment income – Dividend income is recorded on the ex-dividend date. Interest income, if any, is accrued as earned. Non-cash dividends included in dividend income, if any, are recorded at the fair value of the security received.
Investment transactions – Investment transactions are accounted for on the trade date. Realized gains and losses on investments sold are determined on a specific identification basis.
Common expenses – Common expenses of the Trust are allocated among the Fund and the other series of the Trust based on the relative net assets of each series, the number of series in the Trust, or the nature of the services performed and the relative applicability to each series.
Distributions to shareholders – Dividends arising from net investment income, if any, are declared and paid quarterly to shareholders of the Fund. Net realized capital gains, if any, are distributed at least once each year. The amount of such dividends and distributions are determined in accordance with federal income tax regulations, which may differ from
| Q3 ALL-SEASON ACTIVE ROTATION ETF |
| NOTES TO FINANCIAL STATEMENTS (Continued) |
GAAP. Dividends and distributions to shareholders are recorded on the ex-dividend date. The tax character of distributions paid to shareholders by the Fund during the year/period ended November 30, 2024 and 2023 was as follows:
| Year | | Ordinary | | | Long-Term | | | Total | |
| Ended | | Income | | | Capital Gains | | | Distributions | |
| 11/30/2024 | | $ | 4,338,720 | | | $ | — | | | $ | 4,338,720 | |
| 11/30/2023 | | $ | 225,959 | | | $ | — | | | $ | 225,959 | |
Estimates – The preparation of financial statements in conformity with GAAP requires management to make estimates and assumptions that affect the reported amounts of assets and liabilities and disclosure of contingent assets and liabilities as of the date of the financial statements and the reported amounts of increase (decrease) in net assets from operations during the reporting period. Actual results could differ from those estimates.
Federal income tax – The Fund has qualified and intends to continue to qualify as a regulated investment company under the Internal Revenue Code of 1986, as amended (the “Code”). Qualification generally will relieve the Fund of liability for federal income taxes to the extent 100% of its net investment income and net realized capital gains are distributed in accordance with the Code.
In order to avoid imposition of the excise tax applicable to regulated investment companies, it is also the Fund’s intention to declare as dividends in each calendar year at least 98% of its net investment income (earned during the calendar year) and 98.2% of its net realized capital gains (earned during the twelve months ended October 31) plus undistributed amounts from prior years.
The following information was computed on a tax basis for each item as of November 30, 2024:
| Tax cost of investments | | $ | 61,931,902 | |
| Gross unrealized appreciation | | $ | 2,709,868 | |
| Gross unrealized depreciation | | | (1,127,732 | ) |
| Net unrealized appreciation | | | 1,582,136 | |
| Undistributed ordinary income | | | 5,765,730 | |
| Distributable earnings | | $ | 7,347,866 | |
| | | | | |
The difference between the federal income tax cost of investments and the financial statement cost of investments for the Fund is due to certain timing differences in the recognition of capital gains or losses under income tax regulations and GAAP. These “book/tax” differences are temporary in nature and are primarily due to losses deferred due to wash sales.
| Q3 ALL-SEASON ACTIVE ROTATION ETF |
| NOTES TO FINANCIAL STATEMENTS (Continued) |
For the year ended November 30, 2024, the Fund reclassified $624,449 of distributable earnings against paid-in capital on the Statement of Assets and Liabilities. Such reclassification, the result of permanent differences between the financial statement and income tax reporting requirements, had no effect on the Fund’s net assets or NAV per share and were due to in-kind transactions and adjustments for holdings in grantor trusts. Reclassifications are made to the Fund’s capital accounts to reflect income and gains available for distribution (or available capital loss carryovers) under current income tax regulations.
The Fund recognizes the tax benefits or expenses of uncertain tax positions only when the position is “more likely than not” of being sustained assuming examination by tax authorities. Management has reviewed the Fund’s tax positions for all open tax years and has concluded that no provision for unrecognized tax benefits or expenses is required in these financial statements. The Fund identifies its major tax jurisdiction as U.S. Federal.
The Fund recognizes interest and penalties, if any, related to unrecognized tax benefits as income tax expense on the Statement of Operations. During the year ended November 30, 2024, the Fund did not incur any interest or penalties.
3. Investment Transactions
During the year ended November 30, 2024, cost of purchases and proceeds from sales of investment securities, excluding in-kind transactions and short-term investments, amounted to $496,542,075 and $501,190,768, respectively. Purchases and sales of in-kind transactions for the year ended November 30, 2024 amounted to $19,657,638 and $28,938,531, respectively. There were realized gains of $425,203 from in-kind transactions during the year ended November 30, 2024.
4. Transactions with Related Parties
INVESTMENT ADVISORY AGREEMENT
The Fund’s investments are managed by the Adviser pursuant to the terms of an Investment Advisory Agreement. The Fund pays the Adviser a management fee, computed and accrued daily and paid monthly, at the annual rate of 0.65% of average daily net assets. During the year ended November 30, 2024, the Adviser earned $503,532 of fees under the Investment Advisory Agreement.
Pursuant to an Expense Limitation Agreement (“ELA”) between the Fund and the Adviser, the Adviser has contractually agreed, until March 31, 2026, to reduce the management fees and to reimburse Fund expenses to the extent necessary to limit Annual Fund Operating Expenses (exclusive of brokerage costs; taxes; interest; borrowing costs such as interest and dividend expenses on securities sold short; costs to organize the Fund; Acquired Fund fees and expenses; extraordinary expenses such as litigation and merger or reorganization costs; and other expenses not incurred in the ordinary course of the Fund’s business) to an amount not exceeding 1.09% of the Fund’s shares.
| Q3 ALL-SEASON ACTIVE ROTATION ETF |
| NOTES TO FINANCIAL STATEMENTS (Continued) |
Under the terms of the ELA, management fee reductions and expense reimbursements by the Adviser are subject to repayment by the Funds for a period of three years after the date on which such fees and expenses were incurred, provided that the repayments do not cause Total Annual Operating Expenses (exclusive of such reductions and reimbursements) to exceed (i) the expense limitation then in effect, if any, and (ii) the expense limitation in effect at the time the expenses to be repaid were incurred. During the year ended November 30, 2024, the Advisor did not reduce Management fees or reimburse other Fund expenses.
OTHER SERVICE PROVIDERS
Ultimus Fund Solutions, LLC (“Ultimus”) provides administration and fund accounting services to the Fund. The Fund pays Ultimus fees in accordance with the agreements for such services. In addition, the Fund pays out-of-pocket expenses including, but not limited to, postage, supplies, and certain costs related to the pricing of the Fund’s portfolio securities.
Under the terms of a Consulting Agreement with the Trust, Northern Lights Compliance Services, LLC (“NLCS”) provides an Anti-Money Laundering Officer and Chief Compliance Officer to the Trust, as well as related compliance services. Under the terms of the agreement, NLCS receives fees from the Funds. NLCS is a wholly-owned subsidiary of Ultimus.
Under the terms of a Distribution Agreement with the Trust, Northern Lights Distributors, LLC (the “Distributor”) serves as the principal underwriter to the Fund. The Distributor is compensated by the Adviser for acting as principal underwriter.
Certain officers of the Trust are also officers of Ultimus and are not paid by the Fund for serving in such capacities.
TRUSTEE COMPENSATION
Each member of the Board who is not an “interested person” (as defined by the 1940 Act) of the Trust receives an annual retainer and meeting fees, plus reimbursement for travel and other meeting-related expenses.
5. Capital Share Transactions
Only certain financial institutions such as registered broker-dealers and banks that have entered into agreements with the Fund’s Distributor APs may acquire shares directly from the Fund and tender their shares for redemption directly to the Fund. Such purchases and redemptions are made at NAV per share and only in large blocks, or Creation Units, of shares. Purchases and redemptions directly with the Fund must follow the Fund’s procedures, which are described in the Fund’s Statement of Additional Information (“SAI”).
| Q3 ALL-SEASON ACTIVE ROTATION ETF |
| NOTES TO FINANCIAL STATEMENTS (Continued) |
A creation transaction, which is subject to acceptance by the Fund’s Distributor and the Fund, generally takes place when an AP deposits into the Fund a designated portfolio of securities (“Deposit Securities”) (including any portion of such securities for which cash may be substituted) and a specified amount of cash approximating the holdings of the Fund in exchange for a specified number of Creation Units. The composition of such portfolio generally corresponds pro rata to the holdings of the Fund. However, the Fund may, in certain circumstances, offer Creation Units partially or solely for cash. Similarly, shares can be redeemed only in Creation Units, generally for a designated portfolio of securities (including any portion of such securities for which cash may be substituted) held by the Fund and a specified amount of cash. Except when aggregated in Creation Units, shares are not redeemable. The prices at which creations and redemptions occur are based on the next calculation of NAV after a creation or redemption order is received in an acceptable form under the AP agreement. Realized gains (losses) resulting from in-kind redemption of shares, if any, are reflected separately on the Statement of Operations.
The Fund charges APs standard creation and redemption transaction fees (“Transaction Fees”) to offset transfer and other transaction costs associated with the issuance and redemption of Creation Units. The standard creation and redemption transaction fees are set forth in the table below. The standard creation transaction fee is charged to the AP on the day such AP creates a Creation Unit, and is the same regardless of the number of Creation Units purchased by the AP on the applicable business day. Similarly, the standard redemption transaction fee is charged to the AP on the day such AP redeems a Creation Unit, and is the same regardless of the number of Creation Units redeemed by the AP on the applicable business day. Creations and redemptions for cash (when cash creations and redemptions (in whole or in part) are available or specified) are also subject to an additional charge (up to the maximum amounts shown in the table below). This charge is intended to compensate for brokerage, tax, foreign exchange, execution, price movement and other costs and expenses related to cash transactions (which may, in certain instances, be based on a good faith estimate of transaction costs). For the year ended November 30, 2024, the Fund received $9,000 in transaction fees.
The Transaction Fees for the Fund are listed in the table below:
| Fee for In-Kind and Cash Purchases | | Maximum Additional Variable Charge for Cash Purchases* |
| $200 | | 200 basis points (2.0)% |
| * | As a percentage of the amount invested. |
| Q3 ALL-SEASON ACTIVE ROTATION ETF |
| NOTES TO FINANCIAL STATEMENTS (Continued) |
6. Borrowing costs
From time to time the Fund may have an overdrawn cash balance at the custodian due to redemptions or market movements. When this occurs, the Fund will incur borrowing costs charged by the custodian. Accordingly, during the year ended November 30, 2024, the Fund incurred $14,073 in borrowing costs charged by the custodian.
7. Investments in Other Investments Companies
The Fund may invest a significant portion of its assets in shares of one or more investment companies, including ETFs, open-end mutual funds and money market mutual funds. The Fund will incur additional indirect expenses (acquired fund fees and expenses) to the extent it invests in shares of other investment companies. As of November 30, 2024, the Fund had 99.7% of the value of its net assets invested in ETFs. The financial statements of these ETFs can be found at www.sec.gov.
8. Contingencies and Commitments
The Fund indemnifies the Trust’s officers and Trustees for certain liabilities that might arise from their performance of their duties to the Fund. Additionally, in the normal course of business the Fund enters into contracts that contain a variety of representations and warranties and which provide general indemnifications. The Fund’s maximum exposure under these arrangements is unknown, as this would involve future claims that may be made against the Fund that have not yet occurred. However, based on experience, the Fund expects the risk of loss to be remote.
9. Subsequent Events
The Fund is required to recognize in the financial statements the effects of all subsequent events that provide additional evidence about conditions that existed as of the date of the Statement of Assets and Liabilities. For non-recognized subsequent events that must be disclosed to keep the financial statements from being misleading, the Fund is required to disclose the nature of the event as well as an estimate of its financial effect, or a statement that such an estimate cannot be made. Management has evaluated subsequent events through the issuance of these financial statements and has noted no such events except for the following:
On January 3, 2025 the Fund declared an ordinary dividend of $0.1559 per share and a short-term capital gain or $2.5897 per share to shareholders of record on December 27, 2024.
| Q3 ALL-SEASON ACTIVE ROTATION ETF |
REPORT OF INDEPENDENT REGISTERED
PUBLIC ACCOUNTING FIRM |
To the Shareholders of Q3 All-Season Active Rotation ETF and
Board of Trustees of Ultimus Managers Trust
Opinion on the Financial Statements
We have audited the accompanying statement of assets and liabilities, including the schedule of investments, of Q3 All-Season Active Rotation ETF (the “Fund”), a series of Ultimus Managers Trust, as of November 30, 2024, the related statement of operations for the year then ended, the statements of changes in net assets for each of the two years or periods in the period then ended, the financial highlights for each of the two years or periods in the period then ended, and the related notes (collectively referred to as the “financial statements”). In our opinion, the financial statements present fairly, in all material respects, the financial position of the Fund as of November 30, 2024, the results of its operations for the year then ended, the changes in net assets and financial highlights for each of the two years or periods in the period then ended, in conformity with accounting principles generally accepted in the United States of America.
Basis for Opinion
These financial statements are the responsibility of the Fund’s management. Our responsibility is to express an opinion on the Fund’s financial statements based on our audit. We are a public accounting firm registered with the Public Company Accounting Oversight Board (United States) (“PCAOB”) and are required to be independent with respect to the Fund in accordance with the U.S. federal securities laws and the applicable rules and regulations of the Securities and Exchange Commission and the PCAOB.
We conducted our audits in accordance with the standards of the PCAOB. Those standards require that we plan and perform the audits to obtain reasonable assurance about whether the financial statements are free of material misstatement whether due to error or fraud.
Our audits included performing procedures to assess the risks of material misstatement of the financial statements, whether due to error or fraud, and performing procedures that respond to those risks. Such procedures included examining, on a test basis, evidence regarding the amounts and disclosures in the financial statements. Our procedures included confirmation of securities owned as of November 30, 2024, by correspondence with the custodian. Our audits also included evaluating the accounting principles used and significant estimates made by management, as well as evaluating the overall presentation of the financial statements. We believe that our audits provide a reasonable basis for our opinion.
| Q3 ALL-SEASON ACTIVE ROTATION ETF |
REPORT OF INDEPENDENT REGISTERED
PUBLIC ACCOUNTING FIRM (Continued) |
We have served as the Fund’s auditor since 2023.

COHEN & COMPANY, LTD.
Philadelphia, Pennsylvania
January 29, 2025
| Q3 ALL-SEASON ACTIVE ROTATION ETF |
| ADDITIONAL INFORMATION (Unaudited) |
Changes in and Disagreements with Accountants
There were no changes in or disagreements with accountants during the period covered by this report.
Proxy Disclosures
Not applicable.
Remuneration Paid to Directors, Officers and Others
Refer to the financial statements included herein.
Statement Regarding Basis for Approval of Investment Advisory Agreement
Not applicable.
| Q3 ALL-SEASON ACTIVE ROTATION ETF |
| OTHER INFORMATION (Unaudited) |
A description of the policies and procedures that the Fund uses to vote proxies relating to portfolio securities is available without charge upon request by calling toll-free 1-888-348-1255, or on the SEC’s website at www.sec.gov. Information regarding how the Fund voted proxies relating to portfolio securities during the most recent period ended June 30 will be available without charge upon request by calling toll-free 1-888-348-1255, or on the SEC’s website at www.sec.gov.
The Trust files a complete listing of portfolio holdings for the Fund with the SEC as of the end of the first and third quarters of each fiscal year as an exhibit to its reports on Form N-PORT. These filings are available upon request by calling 1-888-348-1255. Furthermore, you may obtain a copy of the filings on the SEC’s website at www.sec.gov and on the Fund’s website at www.q3allseasonfunds.com.
| FEDERAL TAX INFORMATION (Unaudited) |
Qualified Dividend Income - The Fund designates 5.19% of its ordinary income dividends, or up to the maximum amount of such dividends allowable pursuant to the Internal Revenue Code, as qualified dividend income eligible for the reduced tax rate.
Dividends Received Deduction - Corporate shareholders are generally entitled to take the dividends received deduction on the portion of the Fund’s dividend distribution that qualifies under tax law. For the fiscal year ended November 30, 2024, the percentage of ordinary income dividends qualified for the corporate dividends receivable deduction for the Fund was 2.17%.
This page intentionally left blank.
This page intentionally left blank.
This page intentionally left blank.
| Item 8. | Changes in and Disagreements with Accountants for Open-End Management Investment Companies. |
Not applicable
| Item 9. | Proxy Disclosures for Open-End Management Investment Companies. |
Not applicable
| Item 10. | Remuneration Paid to Directors, Officers, and Others of Open-End Management Investment Companies. |
Included under Item 7
| Item 11. | Statement Regarding Basis for Approval of Investment Advisory Contract. |
Not applicable
| Item 12. | Disclosure of Proxy Voting Policies and Procedures for Closed-End Management Investment Companies. |
Not applicable
| Item 13. | Portfolio Managers of Closed-End Management Investment Companies. |
Not applicable
| Item 14. | Purchases of Equity Securities by Closed-End Management Investment Company and Affiliated Purchasers. |
Not applicable
| Item 15. | Submission of Matters to a Vote of Security Holders. |
There has been no material changes to the manner in which shareholders may recommend nominees to the Registrant’s Board of Trustees or the Nominations & Governance Committee (the “Committee”). The Registrant does not have formal procedures by which shareholders may recommend nominees to the Registrant’s Board of Trustees. While the Registrant does not have formal procedure, the Committee shall to the extent required under applicable law, when identifying potential candidates for the position of Independent Trustee, consider any such candidate recommended by a shareholder.
| Item 16. | Controls and Procedures. |
| (a) | Based on their evaluation of the registrant’s disclosure controls and procedures (as defined in Rule 30a-3(c) under the Investment Company Act of 1940) as of a date within 90 days of the filing date of this report, the registrant’s principal executive officer and principal financial officer have concluded that such disclosure controls and procedures are reasonably designed and are operating effectively to ensure that material information relating to the registrant, including its consolidated subsidiaries, is made known to them by others within those entities, particularly during the period in which this report is being prepared, and that the information required in filings on Form N-CSR is recorded, processed, summarized, and reported on a timely basis. |
| (b) | There were no changes in the registrant’s internal control over financial reporting (as defined in Rule 30a-3(d) under the Investment Company Act of 1940) that occurred during the period covered by this report that have materially affected, or are reasonably likely to materially affect, the registrant’s internal control over financial reporting. |
| Item 17. | Disclosure of Securities Lending Activities for Closed-End Management Investment Companies. |
Not applicable
| Item 18. | Recovery of Erroneously Awarded Compensation. |
File the exhibits listed below as part of this Form. Letter or number the exhibits in the sequence indicated.
| (a)(1) | Any code of ethics, or amendment thereto, that is the subject of the disclosure required by Item 2, to the extent that the registrant intends to satisfy the Item 2 requirements through filing of an exhibit: Attached hereto |
| (a)(2) | A separate certification for each principal executive officer and principal financial officer of the registrant as required by Rule 30a-2(a) under the Act (17 CFR 270.30a-2(a)): Attached hereto |
| (2) | Change in the registrant’s independent public accountant: Not applicable |
| (b) | Certifications required by Rule 30a-2(b) under the Act (17 CFR 270.30a-2(b)): Attached hereto |
SIGNATURES
Pursuant to the requirements of the Securities Exchange Act of 1934 and the Investment Company Act of 1940, the registrant has duly caused this report to be signed on its behalf by the undersigned, thereunto duly authorized.
| (Registrant) | Ultimus Managers Trust | | | |
| | | | | |
| By (Signature and Title)* | | /s/ Todd E. Heim | |
| | | | Todd E. Heim, President and Principal Executive Officer | |
| | | | | |
| Date | February 6, 2025 | | | |
| | | | | |
| | | | | |
| Pursuant to the requirements of the Securities Exchange Act of 1934 and the Investment Company Act of 1940, this report has been signed below by the following persons on behalf of the registrant and in the capacities and on the dates indicated. |
| | | | | |
| By (Signature and Title)* | | /s/ Todd E. Heim | |
| | | | Todd E. Heim, President and Principal Executive Officer | |
| | | | | |
| Date | February 6, 2025 | | | |
| | | | | |
| By (Signature and Title)* | | /s/ Daniel D. Bauer | |
| | | | Daniel D. Bauer, Treasurer and Principal Financial Officer | |
| | | | | |
| Date | February 6, 2025 | | | |
| * | Print the name and title of each signing officer under his or her signature. |