UNITED STATES
SECURITIES AND EXCHANGE COMMISSION
Washington, D.C. 20549
________
FORM N-CSR
________
CERTIFIED SHAREHOLDER REPORT OF REGISTERED MANAGEMENT
INVESTMENT COMPANIES
Investment Company Act File number 811-22698
KraneShares Trust
(Exact name of registrant as specified in charter)
________
1270 Avenue of the Americas
22nd Floor
New York, New York, 10020
(Address of principal executive offices) (Zip code)
Jonathan Krane
KraneShares Trust
1270 Avenue of the Americas
22nd Floor
New York, New York, 10020
(Name and address of agent for service)
Copy to:
Stacy L. Fuller
K&L Gates LLP
1601 K Street NW
Washington, DC 20006-1600
Registrant’s telephone number, including area code: (855) 857-2638
Date of fiscal year end: March 31, 2017
Date of reporting period: March 31, 2017
| Item 1. | Reports to Stockholders. |

Annual Report
KraneShares Bosera MSCI China A Share ETF
KraneShares Zacks New China ETF
KraneShares CSI China Internet ETF
KraneShares E Fund China Commercial Paper ETF
KraneShares FTSE Emerging Markets Plus ETF
March 31, 2017
Table of Contents
The Funds file their complete schedules of Fund holdings with the Securities and Exchange Commission (the ‘‘Commission’’) for the first and third quarters of each fiscal year on Form N-Q within sixty days after the end of the period. The Funds’ Forms N-Q are available on the Commission’s website at http://www.sec.gov, and may be reviewed and copied at the Commission’s Public Reference Room in Washington, DC. Information on the operation of the Public Reference Room may be obtained by calling 1-800-SEC-0330.
A description of the policies and procedures that KraneShares Trust uses to determine how to vote proxies relating to Fund securities, as well as information relating to how the Funds voted proxies relating to Fund securities during the most recent 12-month period ended June 30, are available (i) without charge, upon request, by calling 1-855-8KRANE8; and (ii) on the Commission’s website at http://www.sec.gov.
Fund shares may only be purchased or redeemed from a Fund in large Creation Unit aggregations. Investors who cannot transact in Creation Units of a Fund’s shares must buy or sell Fund shares in the secondary market at their market price, which may be at a premium or discount to a Fund’s net asset value, with the assistance of a broker. In doing so, the investor may incur brokerage commissions and may pay more than net asset value when buying Fund shares and receive less than net asset value when selling Fund shares.
Management Discussion of Fund Performance (Unaudited)
Dear Shareholders:
We are pleased to send you the Annual Report for KraneShares exchange-traded funds (‘‘ETFs’’) for the 12-month period ended March 31, 2017. For the period, the ETFs delivered the following total returns:
| Morningstar | | | One-Year | | | |
| Peer Group Median | | | Return* | | | |
| | 15.86%(1) | | | | -2.04% | | | KraneShares Bosera MSCI China A Share ETF (KBA) |
| | 15.86%(1) | | | | 24.54% | | | KraneShares Zacks New China ETF (KFYP) |
| | 15.86%(1) | | | | 19.44% | | | KraneShares CSI China Internet ETF (KWEB) |
| | 4.17%(2) | | | | -3.95% | | | KraneShares E Fund China Commercial Paper ETF (KCNY) |
| | 15.40%(3) | | | | 11.24% | | | KraneShares FTSE Emerging Markets Plus ETF (KEMP) |
For comparison, the indices below produced the following returns:
| One-Year | | | |
| Return | | | Index Name |
| | 17.17% | | | S&P 500 Index |
| | 27.26% | | | Hybrid CSI Overseas China Five-Year Plan Index/Zacks New China Index(a) |
| | 18.25% | | | CSI Overseas China Internet Index(b) |
| | 0.04% | | | MSCI China A Index |
| | 1.40% | | | Hybrid MSCI China A Index/MSCI China A International Index(c) |
| | 8.73% | | | JPMorgan EMBI Global Core Index |
| | -3.41% | | | CSI Diversified High Grade Commercial Paper Index(d) |
| | 17.22% | | | MSCI Emerging Markets Index |
| | 14.02% | | | FTSE Emerging incl. China Overseas non-R/QFII GDP Weighted Index(e) |
We are encouraged by the steady progress being made by China to increase access in local Mainland Chinese markets for international investors, as well as by the heightened demand and awareness of these markets by the global investor community.
| · | We believe that China will continue to grow and be an essential element of a well-designed investment portfolio. |
| · | We believe that investors should have low-cost, transparent tools to obtain exposure to Chinese equity and fixed income markets. |
| · | We are dedicated to helping investors obtain more complete passive market exposures and more balanced investment portfolios. |
Thank you for investing with us.
Jonathan Krane, CEO
March 31, 2017
| * | Returns based on Net Asset Value |
| | | Morningstar | | | |
| | | Peer Group Median | | | Morningstar Peer Group Name |
| (1) | | | 15.86% | | | U.S. Fund China Region |
| (2) | | | 4.17% | | | U.S. Fund Emerging Markets Local Currency Bond |
| (3) | | | 15.40% | | | U.S. Fund Diversified Emerging Markets |
| (a) | The underlying index for KraneShares Zacks New China ETF (see definition on page 6). |
| (b) | The underlying index for KraneShares CSI China Internet ETF. |
| (c) | The underlying index for KraneShares Bosera MSCI China A Share ETF (see definition on page 4). |
| (d) | The underlying index for KraneShares E Fund China Commercial Paper ETF. |
| (e) | The underlying index for KraneShares FTSE Emerging Markets Plus ETF. |
Management Discussion of Fund Performance (Unaudited) (continued)
The S&P 500 Index is a market capitalization weighted composite index of 500 large-cap U.S. companies.
The MSCI China A Index is a free-float adjusted market capitalization weighted index that is designed to track the equity market performance of large-cap and mid-cap Chinese securities ("A Shares").
The JPMorgan EMBI Global Core Index is a broad, diverse U.S. dollar denominated emerging markets debt benchmark that tracks the total return of actively traded debt instruments in emerging market countries.
The MSCI Emerging Markets Index is a free-float adjusted market capitalization index that is designed to measure equity market performance of emerging markets.
The Morningstar Fund China Region Category portfolios invest almost exclusively in stocks from China, Taiwan, and Hong Kong. These portfolios invest at least 70% of total assets in equities and invest at least 75% of stock assets in one specific region or a combination of China, Taiwan, and/or Hong Kong. This peer group has a total of 60 funds in the category as of March 31, 2017.
The Momingstar Fund Diversified Emerging Markets Category portfolios tend to divide their assets among 20 or more nations, although they tend to focus on the emerging markets of Asia and Latin America rather than on those of the Middle East, Africa, or Europe. These portfolios invest predominantly in emerging market equities, but some funds also invest in both equities and fixed income investments from emerging markets. This peer group has a total of 89 funds in the category as of March 31, 2017.
The Momingstar Fund Emerging Markets Local Currency Bond Category portfolios invest more than 65% of their assets in foreign bonds from developing countries in the local currency. Funds in this category have a mandate to maintain exposure to currencies of emerging markets. The largest portion of the emerging-markets bond market comes from Latin America, followed by Eastern Europe, Africa, the Middle East, and Asia. This peer group has a total of 15 funds in the category as of March 31, 2017.
Management Discussion of Fund Performance (Unaudited) (continued)
KraneShares Bosera MSCI China A Share ETF
The KraneShares Bosera MSCI China A Share ETF (the "Fund") seeks to provide investment results that, before fees and expenses, correspond to the price and yield performance of the MSCI China A International Index (the "Underlying Index").
The Underlying Index is a free-float adjusted market capitalization weighted index that is designed to track the equity market performance of large-cap and mid-cap Chinese securities ("A Shares").
China review
In the fiscal year from April 1, 2016 to March 31, 2017, global equity markets remained relatively calm. Chinese-listed companies saw volatilities fall as emerging markets and U.S. equities performed well.
Initial uncertainty around U.S.-China trade relations after the 2016 U.S. election diminished as President Donald Trump dialed back campaign rhetoric around China.
Within China, reform of Mainland-listed State Owned Enterprises was a key directive by Chinese policy makers. Mainland Chinese equities were flat over the time period; however, we believe performance may accelerate as these reforms go into effect over the next few years.
The level of international access into China's Mainland capital markets continued to expand.
| · | In October 2016, the International Monetary Fund added China's currency, the renminbi ("RMB"), to its Special Drawing Rights basket of reserve currencies. |
| · | The launch of the Shenzhen Hong Kong Stock Connect Program complimented the previously launched Shanghai Hong Kong Stock Connect Program, making the majority of China's Mainland equity market capitalization freely accessible to international investors for the first time. |
| · | The Mainland bond market also took a step towards inclusion in global and emerging market bond indices with the launch of a direct access program for global investors. |
While we were encouraged by the Chinese equity markets' performance and the continued opening up of China's capital markets, one detractor was the continued strength of the U.S. dollar. The U.S. dollar rose on expectations the Federal Reserve would raise interest rates. The RMB subsequently fell -5.89% against the U.S. dollar.The RMB's depreciation was a detractor from the performance of our Mainland China focused strategies, though was not a factor in our Hong Kong or U.S.-listed equity exposures.
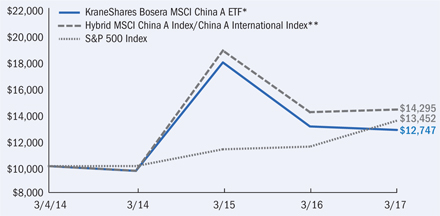
By the Fund's fiscal year end on March 31, 2017 (the "reporting period"), the NAV of the Fund decreased -2.04% for the year, while the Underlying Index increased 1.40%.
Management Discussion of Fund Performance (Unaudited) (continued)
KraneShares Bosera MSCI China A Share ETF (concluded)
Growth of a $10,000 Investment‡
(at Net Asset Value)‡
AVERAGE TOTAL RETURN FOR THE PERIOD ENDED MARCH 31, 2017*
| | | | | | | | | | | | | | | Annualized | |
| | | One Year Return | | | Three Year Return | | | Inception to Date | |
| | | Net Asset | | | Market | | | Net Asset | | | Market | | | Net Asset | | | Market | |
| | | Value | | | Price^ | | | Value | | | Price^ | | | Value | | | Price^ | |
| KraneShares Bosera MSCI China A Share ETF | | | -2.04 | % | | | -0.42 | %‡ | | | 9.76 | % | | | 9.98 | %‡ | | | 8.22 | %‡ | | | 8.74 | %‡ |
| Hybrid MSCI China A Index/ China A International Index** | | | N/A | | | | 1.40 | %‡ | | | N/A | | | | 13.98 | %‡ | | | N/A | | | | 12.31 | %‡ |
| S&P 500 Index | | | N/A | | | | 17.17 | %‡ | | | N/A | | | | 10.37 | %‡ | | | N/A | | | | 10.12 | %‡ |
| * | The Fund commenced operations on March 4, 2014. |
| ** | The Hybrid MSCI China A Index/China A International Index consists of the MSCI China A Index from the inception of the Fund through October 23, 2014, and the MSCI China A International Index going forward. Prior to October 24, 2014, the Fund sought investment results that, before fees and expenses, corresponded to the price and yield performance of the MSCI China A Index. |
| ^ | The ‘‘Market Price’’ of the Funds generally is determined using the midpoint between the highest bid and the lowest offer on the stock exchange on which the Shares of the Funds are listed for trading, as of the time that the Funds’ NAV is calculated. |
The performance data quoted herein represents past performance and the return and value of an investment in the Fund will fluctuate so that, when redeemed, may be worth less than its original cost. Current performance may be lower or higher than the performance data quoted. Past performance is no guarantee of future performance and should not be considered as a representation of the future results of the Fund. For performance data current to the most recent month end, please call 855-8KRANE8 (855-857-2638) or visit www.kraneshares.com. The Fund’s performance assumes the reinvestment of all dividends and all capital gains. Index returns assume reinvestment of dividends and, unlike a Fund’s returns, do not reflect any fees or expenses. If such fees and expenses were included in the index returns, the performance would have been lower. As stated in the Fund’s prospectus, as supplemented, the Fund’s gross operating expense ratio is 1.03% and its net expense ratio is 0.83% due to an Expense Limitation Agreement whereby the Fund’s investment manager, Krane Funds Advisors, LLC, has contractually agreed to reduce its management fee to 0.58% of the Fund’s average daily net assets until July 31, 2017. Please note that one cannot invest directly in an unmanaged index. There are no assurances that the Fund will meet its stated objectives. The Fund’s holdings and allocations are subject to change and should not be considered recommendations to buy individual securities. For further information on the Fund’s objectives, risks, and strategies, see the Fund’s prospectus. Returns shown do not reflect the deduction of taxes that a shareholder would pay on Fund distributions or the redemption of Fund shares.
See definition of comparative indices on previous page.
Management Discussion of Fund Performance (Unaudited) (continued)
KraneShares Zacks New China ETF
The KraneShares Zacks New China ETF (the "Fund") seeks to provide investment results that, before fees and expenses, correspond generally to the price and yield performance of the Zacks New China Index (the "Underlying Index").
The Underlying Index provides exposure to companies listed in Mainland China, Hong Kong and the United States whose primary business or businesses the index sponsor, Zacks Index Services ("Zacks"), has determined are important in the current Five-Year Plan of the central Chinese government.
China review
In the fiscal year from April 1, 2016 to March 31, 2017, global equity markets remained relatively calm. Chinese-listed companies saw volatilities fall as emerging markets and U.S. equities performed well.
Initial uncertainty around U.S.-China trade relations after the 2016 U.S. election diminished as President Donald Trump dialed back campaign rhetoric around China.
Within China, reform of Mainland-listed State Owned Enterprises was a key directive by Chinese policy makers. Mainland Chinese equities were flat over the time period; however, we believe performance may accelerate as these reforms go into effect over the next few years.
The level of international access into China's Mainland capital markets continued to expand.
| · | In October 2016, the International Monetary Fund added China's currency, the renminbi ("RMB"), to its Special Drawing Rights basket of reserve currencies. |
| · | The launch of the Shenzhen Hong Kong Stock Connect Program complimented the previously launched Shanghai Hong Kong Stock Connect Program, making the majority of China's Mainland equity market capitalization freely accessible to international investors for the first time. |
| · | The Mainland bond market also took a step towards inclusion in global and emerging market bond indices with the launch of a direct access program for global investors. |
While we were encouraged by the Chinese equity markets' performance and the continued opening up of China's capital markets, one detractor was the continued strength of the U.S. dollar. The U.S. dollar rose on expectations the Federal Reserve would raise interest rates. The RMB subsequently fell -5.89% against the U.S. dollar. The RMB's depreciation was a detractor from the performance of our Mainland China focused strategies, though was not a factor in our Hong Kong or U.S.-listed equity exposures.
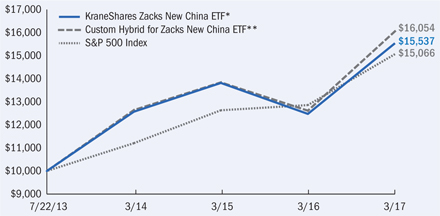
By the Fund's fiscal year end on March 31, 2017 (the "reporting period"), the NAV of the Fund increased 24.54% for the year, while the Underlying Index increased 27.26%.
Management Discussion of Fund Performance (Unaudited) (continued)
KraneShares Zacks New China ETF (concluded)
Growth of a $10,000 Investment‡
(at Net Asset Value)‡
AVERAGE TOTAL RETURN FOR THE PERIOD ENDED MARCH 31, 2017*
| | | | | | | | | | | | | | | Annualized | |
| | | One Year Return | | | Three Year Return | | | Inception to Date | |
| | | Net Asset | | | Market | | | Net Asset | | | Market | | | Net Asset | | | Market | |
| | | Value | | | Price^ | | | Value | | | Price^ | | | Value | | | Price^ | |
| KraneShares Zacks New China ETF | | | 24.54 | % | | | 29.16 | %‡ | | | 7.32 | % | | | 6.96 | %‡ | | | 12.68 | %‡ | | | 12.50 | %‡ |
| Hybrid CSI Overseas China Five-Year Plan Index/Zacks New China Index** | | | N/A | | | | 27.26 | %‡ | | | N/A | | | | 8.29 | %‡ | | | N/A | | | | 13.68 | %‡ |
| S&P 500 Index | | | N/A | | | | 17.17 | %‡ | | | N/A | | | | 10.37 | %‡ | | | N/A | | | | 11.74 | %‡ |
| * | The Fund commenced operations on July 22, 2013. |
| ** | The Hybrid CSI Overseas China Five-Year Plan Index/Zacks New China Index consists of the CSI Overseas China Five-Year Plan Index from the inception of the Fund through May 31, 2016, and the Zacks New China Index going forward. Prior to June 1, 2016, the Fund was known as the KraneShares CSI New China ETF and sought to provide investment results that, before fees and expenses, corresponded generally to the price and yield performance of the CSI Overseas China Five-Year Plan Index. |
| ^ | The ‘‘Market Price’’ of the Funds generally is determined using the midpoint between the highest bid and the lowest offer on the stock exchange on which the Shares of the Funds are listed for trading, as of the time that the Funds’ NAV is calculated. |
The performance data quoted herein represents past performance and the return and value of an investment in the Fund will fluctuate so that, when redeemed, may be worth less than its original cost. Current performance may be lower or higher than the performance data quoted. Past performance is no guarantee of future performance and should not be considered as a representation of the future results of the Fund. For performance data current to the most recent month end, please call 855-8KRANE8 (855-857-2638) or visit www.kraneshares.com. The Fund’s performance assumes the reinvestment of all dividends and all capital gains. Index returns assume reinvestment of dividends and, unlike a Fund’s returns, do not reflect any fees or expenses. If such fees and expenses were included in the index returns, the performance would have been lower. As stated in the Fund’s prospectus, the Fund’s operating expense ratio is 0.73%. Please note that one cannot invest directly in an unmanaged index. There are no assurances that the Fund will meet its stated objectives. The Fund’s holdings and allocations are subject to change and should not be considered recommendations to buy individual securities. For further information on the Fund’s objectives, risks, and strategies, see the Fund’s prospectus. Returns shown do not reflect the deduction of taxes that a shareholder would pay on Fund distributions or the redemption of Fund shares.
See definition of comparative indices on previous page.
Management Discussion of Fund Performance (Unaudited) (continued)
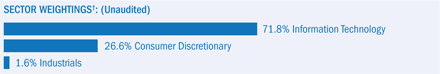
KraneShares CSI China Internet ETF
The KraneShares CSI China Internet ETF (the ‘‘Fund’’) seeks to provide investment results that, before fees and expenses, correspond generally to the price and yield performance of the CSI Overseas China Internet Index (the ‘‘Underlying Index’’).
The Underlying Index is designed to measure the performance of the investable universe of publicly traded China-based companies whose primary business or businesses are in the Internet and Internet-related sectors (‘‘China Internet Companies’’), as defined by the index sponsor, China Securities Index Co., Ltd. (‘‘CSI’’).
China review
In the fiscal year from April 1, 2016 to March 31, 2017, global equity markets remained relatively calm. Chinese-listed companies saw volatilities fall as emerging markets and U.S. equities performed well.
Initial uncertainty around U.S.-China trade relations after the 2016 U.S. election diminished as President Donald Trump dialed back campaign rhetoric around China.
Within China, reform of Mainland-listed State Owned Enterprises was a key directive by Chinese policy makers. Mainland Chinese equities were flat over the time period; however, we believe performance may accelerate as these reforms go into effect over the next few years.
The level of international access into China’s Mainland capital markets continued to expand.
| · | In October 2016, the International Monetary Fund added China’s currency, the renminbi (‘‘RMB’’), to its Special Drawing Rights basket of reserve currencies. |
| · | The launch of the Shenzhen Hong Kong Stock Connect Program complimented the previously launched Shanghai Hong Kong Stock Connect Program, making the majority of China’s Mainland equity market capitalization freely accessible to international investors for the first time. |
| · | The Mainland bond market also took a step towards inclusion in global and emerging market bond indices with the launch of a direct access program for global investors. |
While we were encouraged by the Chinese equity markets’ performance and the continued opening up of China’s capital markets, one detractor was the continued strength of the U.S. dollar. The U.S. dollar rose on expectations the Federal Reserve would raise interest rates. The RMB subsequently fell -5.89% against the U.S. dollar. The RMB’s depreciation was a detractor from the performance of our Mainland China focused strategies, though was not a factor in our Hong Kong or U.S.-listed equity exposures.
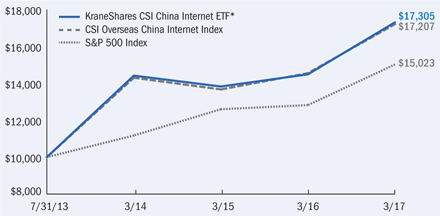
By the Fund’s fiscal year end on March 31, 2017 (the ‘‘reporting period’’), the NAV of the Fund increased 19.44% for the year, while the Underlying Index increased 18.25%.
Management Discussion of Fund Performance (Unaudited) (continued)
KraneShares CSI China Internet ETF (concluded)
Growth of a $10,000 Investment‡
(at Net Asset Value)‡
AVERAGE TOTAL RETURN FOR THE PERIOD ENDED MARCH 31, 2017*
| | | | | | | | | | | | | | | Annualized | |
| | | One Year Return | | | Three Year Return | | | Inception to Date | |
| | | Net Asset | | | Market | | | Net Asset | | | Market | | | Net Asset | | | Market | |
| | | Value | | | Price^ | | | Value | | | Price^ | | | Value | | | Price^ | |
| KraneShares CSI China Internet ETF | | | 19.44 | % | | | 19.48 | %‡ | | | 6.27 | % | | | 6.30 | %‡ | | | 16.13 | %‡ | | | 16.22 | %‡ |
| CSI Overseas China Internet Index | | | N/A | | | | 18.25 | %‡ | | | N/A | | | | 6.35 | %‡ | | | N/A | | | | 15.83 | %‡ |
| S&P 500 Index | | | N/A | | | | 17.17 | %‡ | | | N/A | | | | 10.37 | %‡ | | | N/A | | | | 11.90 | %‡ |
| * | The Fund commenced operations on July 31, 2013. |
| ^ | The ‘‘Market Price’’ of the Funds generally is determined using the midpoint between the highest bid and the lowest offer on the stock exchange on which the Shares of the Funds are listed for trading, as of the time that the Funds’ NAV is calculated. |
The performance data quoted herein represents past performance and the return and value of an investment in the Fund will fluctuate so that, when redeemed, may be worth less than its original cost. Current performance may be lower or higher than the performance data quoted. Past performance is no guarantee of future performance and should not be considered as a representation of the future results of the Fund. For performance data current to the most recent month end, please call 855-8KRANE8 (855-857-2638) or visit www.kraneshares.com. The Fund’s performance assumes the reinvestment of all dividends and all capital gains. Index returns assume reinvestment of dividends and, unlike a Fund’s returns, do not reflect any fees or expenses. If such fees and expenses were included in the index returns, the performance would have been lower. As stated in the Fund’s prospectus, the Fund’s operating expense ratio is 0.72%. Please note that one cannot invest directly in an unmanaged index. There are no assurances that the Fund will meet its stated objectives. The Fund’s holdings and allocations are subject to change and should not be considered recommendations to buy individual securities. For further information on the Fund’s objectives, risks, and strategies, see the Fund’s prospectus. Returns shown do not reflect the deduction of taxes that a shareholder would pay on Fund distributions or the redemption of Fund shares.
See definition of comparative indices on previous page.
Management Discussion of Fund Performance (Unaudited) (continued)
KraneShares E Fund China Commercial Paper ETF
The KraneShares E Fund China Commercial Paper ETF (the ‘‘Fund’’) seeks to provide investment results that, before fees and expenses, correspond to the price and yield performance of the CSI Diversified High Grade Commercial Paper Index (the ‘‘Underlying Index’’).
The Underlying Index seeks to deliver a diversified basket of investment-grade (according to a Chinese ratings organization) on-shore renminbi (‘‘RMB’’)-denominated commercial paper issued by sovereign, quasi-sovereign and corporate issuers in the People’s Republic of China and traded in the inter-bank bond market. A commercial paper issue must have at least RMB ¥600 million outstanding and a remaining term to final maturity of no more than one year (365 days) and no less than one month (31 days).
China review
In the fiscal year from April 1, 2016 to March 31, 2017, global equity markets remained relatively calm. Chinese-listed companies saw volatilities fall as emerging markets and U.S. equities performed well.
Initial uncertainty around U.S.-China trade relations after the 2016 U.S. election diminished as President Donald Trump dialed back campaign rhetoric around China.
Within China, reform of Mainland-listed State Owned Enterprises was a key directive by Chinese policy makers. Mainland Chinese equities were flat over the time period; however, we believe performance may accelerate as these reforms go into effect over the next few years.
The level of international access into China’s Mainland capital markets continued to expand.
| · | In October 2016, the International Monetary Fund added China’s currency, the renminbi (‘‘RMB’’), to its Special Drawing Rights basket of reserve currencies. |
| · | The launch of the Shenzhen Hong Kong Stock Connect Program complimented the previously launched Shanghai Hong Kong Stock Connect Program, making the majority of China’s Mainland equity market capitalization freely accessible to international investors for the first time. |
| · | The Mainland bond market also took a step towards inclusion in global and emerging market bond indices with the launch of a direct access program for global investors. |
While we were encouraged by the Chinese equity markets’ performance and the continued opening up of China’s capital markets, one detractor was the continued strength of the U.S. dollar. The U.S. dollar rose on expectations the Federal Reserve would raise interest rates. The RMB subsequently fell -5.89% against the U.S. dollar. The RMB’s depreciation was a detractor from the performance of our Mainland China focused strategies, though was not a factor in our Hong Kong or U.S.-listed equity exposures. This strategy’s returns are comprised of yield and appreciation of the RMB. Due to currency depreciation in the prior year, this strategy was negatively impacted.
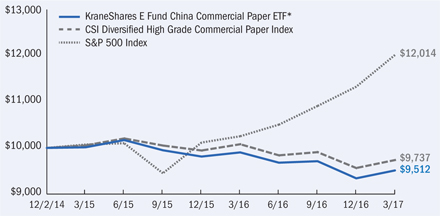
By the Fund’s fiscal year end on March 31, 2017 (the ‘‘reporting period’’), the NAV of the Fund decreased -3.95% for the year, while the Underlying Index decreased -3.41%.
Management Discussion of Fund Performance (Unaudited) (continued)
KraneShares E Fund China Commercial Paper ETF (concluded)
Growth of a $10,000 Investment‡
(at Net Asset Value)‡
AVERAGE ANNUAL TOTAL RETURN FOR THE PERIOD ENDED MARCH 31, 2017*
| | | One Year Return | | | Annualized Inception to Date | |
| | | Net Asset | | | Market | | | Net Asset | | | Market | |
| | | Value | | | Price^ | | | Value | | | Price^ | |
| KraneShares E Fund China Commercial Paper ETF | | | -3.95 | % | | | -4.33 | %‡ | | | -2.13 | %‡ | | | -2.37 | %‡ |
| CSI Diversified High Grade Commercial Paper Index | | | N/A | | | | -3.41 | %‡ | | | N/A | | | | -1.14 | %‡ |
| S&P 500 Index | | | N/A | | | | 17.17 | %‡ | | | N/A | | | | 8.20 | %‡ |
| * | The Fund commenced operations on December 2, 2014. |
| ^ | The ‘‘Market Price’’ of the Funds generally is determined using the midpoint between the highest bid and the lowest offer on the stock exchange on which the Shares of the Funds are listed for trading, as of the time that the Funds’ NAV is calculated. |
The performance data quoted herein represents past performance and the return and value of an investment in the Fund will fluctuate so that, when redeemed, may be worth less than its original cost. Current performance may be lower or higher than the performance data quoted. Past performance is no guarantee of future performance and should not be considered as a representation of the future results of the Fund. For performance data current to the most recent month end, please call 855-8KRANE8 (855-857-2638) or visit www.kraneshares.com. The Fund’s performance assumes the reinvestment of all dividends and all capital gains. Index returns assume reinvestment of dividends and, unlike a Fund’s returns, do not reflect any fees or expenses. If such fees and expenses were included in the index returns, the performance would have been lower. As stated in the Fund’s prospectus, as supplemented, the Fund’s gross operating expense ratio is 0.69% and its net expense ratio is 0.57% due to an Expense Limitation Agreement whereby the Fund’s investment manager, Krane Funds Advisors, LLC, has contractually agreed to reduce its management fee to 0.56% of the Fund’s average daily net assets until July 31, 2017. Please note that one cannot invest directly in an unmanaged index. There are no assurances that the Fund will meet its stated objectives. The Fund’s holdings and allocations are subject to change and should not be considered recommendations to buy individual securities. For further information on the Fund’s objectives, risks, and strategies, see the Fund’s prospectus. Returns shown do not reflect the deduction of taxes that a shareholder would pay on Fund distributions or the redemption of Fund shares.
See definition of comparative indices on previous page.
Management Discussion of Fund Performance (Unaudited) (continued)
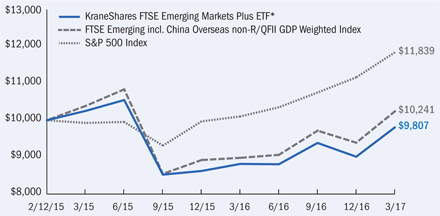
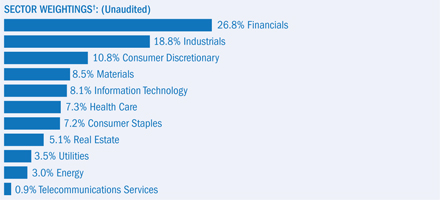
KraneShares FTSE Emerging Markets Plus ETF
The KraneShares FTSE Emerging Markets Plus ETF (the ‘‘Fund’’) seeks to provide investment results that, before fees and expenses, correspond to the price and yield performance of the FTSE Emerging incl. China Overseas non-R/QFII GDP Weighted Index (the ‘‘Underlying Index’’).
The Underlying Index is a gross domestic product (‘‘GDP’’) weighted index of large and mid-cap issuers in emerging markets. As a result of the GDP weighting, the emerging markets with the largest GDPs have the heaviest weightings in the Underlying Index. As of March 31, 2017, the largest markets in the Underlying Index were China and India.
China review
In the fiscal year from April 1, 2016 to March 31, 2017, global equity markets remained relatively calm. Chinese-listed companies saw volatilities fall as emerging markets and U.S. equities performed well.
Initial uncertainty around U.S.-China trade relations after the 2016 U.S. election diminished as President Donald Trump dialed back campaign rhetoric around China.
Within China, reform of Mainland-listed State Owned Enterprises was a key directive by Chinese policy makers. Mainland Chinese equities were flat over the time period; however, we believe performance may accelerate as these reforms go into effect over the next few years.
The level of international access into China’s Mainland capital markets continued to expand.
| · | In October 2016, the International Monetary Fund added China’s currency, the renminbi (‘‘RMB’’), to its Special Drawing Rights basket of reserve currencies. |
| · | The launch of the Shenzhen Hong Kong Stock Connect Program complimented the previously launched Shanghai Hong Kong Stock Connect Program, making the majority of China’s Mainland equity market capitalization freely accessible to international investors for the first time. |
| · | The Mainland bond market also took a step towards inclusion in global and emerging market bond indices with the launch of a direct access program for global investors. |
While we were encouraged by the Chinese equity markets’ performance and the continued opening up of China’s capital markets, one detractor was the continued strength of the U.S. dollar. The U.S. dollar rose on expectations the Federal Reserve would raise interest rates. The RMB subsequently fell -5.89% against the U.S. dollar. The RMB’s depreciation was a detractor from the performance of our Mainland China focused strategies, though was not a factor in our Hong Kong or U.S.-listed equity exposures. The Chinese equity market had a strong impact on this strategy due to its weightings in Chinese stocks.
By the Fund’s fiscal year end on March 31, 2017 (the ‘‘reporting period’’), the NAV of the Fund increased 11.24% for the year, while the Underlying Index increased 14.02%.
Management Discussion of Fund Performance (Unaudited) (concluded)
KraneShares FTSE Emerging Markets Plus ETF (concluded)
Growth of a $10,000 Investment‡
(at Net Asset Value)‡
AVERAGE ANNUAL TOTAL RETURN FOR THE PERIOD ENDED MARCH 31, 2017*
| | | One Year Return | | | Annualized Inception to Date | |
| | | Net Asset | | | Market | | | Net Asset | | | Market | |
| | | Value | | | Price^ | | | Value | | | Price^ | |
| KraneShares FTSE Emerging Markets Plus ETF | | | 11.24 | % | | | 10.64 | %‡ | | | -0.91 | %‡ | | | -0.62 | %‡ |
| FTSE Emerging incl. China Overseas non-R/QFII GDP Weighted Index | | | N/A | | | | 14.02 | %‡ | | | N/A | | | | 1.12 | %‡ |
| S&P 500 Index | | | N/A | | | | 17.17 | %‡ | | | N/A | | | | 8.24 | %‡ |
| * | The Fund commenced operations on February 12, 2015. |
| ^ | The ‘‘Market Price’’ of the Funds generally is determined using the midpoint between the highest bid and the lowest offer on the stock exchange on which the Shares of the Funds are listed for trading, as of the time that the Funds’ NAV is calculated. |
The performance data quoted herein represents past performance and the return and value of an investment in the Fund will fluctuate so that, when redeemed, may be worth less than its original cost. Current performance may be lower or higher than the performance data quoted. Past performance is no guarantee of future performance and should not be considered as a representation of the future results of the Fund. For performance data current to the most recent month end, please call 855-8KRANE8 (855-857-2638) or visit www.kraneshares.com. The Fund’s performance assumes the reinvestment of all dividends and all capital gains. Index returns assume reinvestment of dividends and, unlike a Fund’s returns, do not reflect any fees or expenses. If such fees and expenses were included in the index returns, the performance would have been lower. As stated in the Fund’s prospectus, as supplemented, the Fund’s gross operating expense ratio is 1.11% and its net expense ratio is 0.91% due to an Expense Limitation Agreement whereby the Fund’s investment manager, Krane Funds Advisors, LLC, has contractually agreed to reduce its management fees in an amount equal to any acquired fund fees and expenses incurred by the Fund from its investments in the KraneShares Bosera MSCI China A Share ETF. Please note that one cannot invest directly in an unmanaged index. There are no assurances that the Fund will meet its stated objectives. The Fund’s holdings and allocations are subject to change and should not be considered recommendations to buy individual securities. For further information on the Fund’s objectives, risks, and strategies, see the Fund’s prospectus. Returns shown do not reflect the deduction of taxes that a shareholder would pay on Fund distributions or the redemption of Fund shares.
See definition of comparative indices on previous page.
Schedule of Investments March 31, 2017
KraneShares Bosera MSCI China A Share ETF
| † | Percentages are based on total investments. More narrow industries are utilized for compliance purposes, whereas broad sectors are utilized for reporting purposes. |
| | | Shares | | | Value | |
| COMMON STOCK — 99.3%‡ | | | | | | | | |
| CHINA — 99.3% | | | | | | | | |
| Consumer Discretionary — 10.8% | | | | | | | | |
| Alpha Group, Cl A | | | 42,168 | | | $ | 122,861 | |
| Anhui Zhongding Sealing Parts, Cl A | | | 41,900 | | | | 149,438 | |
| BYD, Cl A | | | 9,953 | | | | 69,350 | |
| China Film, Cl A* | | | 22,600 | | | | 77,194 | |
| China Shipbuilding Industry Group Power, Cl A | | | 12,200 | | | | 57,231 | |
| Chinese Universe Publishing and Media, Cl A | | | 33,000 | | | | 106,827 | |
| Chongqing Changan Automobile, Cl A | | | 79,700 | | | | 182,487 | |
| CITIC Guoan Information Industry, Cl A | | | 52,100 | | | | 77,260 | |
| Gansu Gangtai Holding Group, Cl A | | | 17,700 | | | | 33,875 | |
| Global Top E-Commerce, Cl A(A)(B) | | | 18,200 | | | | 45,079 | |
| Gree Electric Appliances of Zhuhai, Cl A | | | 66,500 | | | | 305,878 | |
| Hangzhou Robam Appliances, Cl A | | | 43,000 | | | | 309,469 | |
| Hisense Electric, Cl A* | | | 65,300 | | | | 171,403 | |
| Huayu Automotive Systems, Cl A | | | 184,000 | | | | 486,178 | |
| Jiangsu Broadcasting Cable Information Network, Cl A* | | | 26,900 | | | | 40,710 | |
| Jiangsu Phoenix Publishing & Media, Cl A | | | 149,500 | | | | 217,792 | |
| Jishi Media, Cl A | | | 484,700 | | | | 285,540 | |
| Leo Group, Cl A | | | 37,200 | | | | 78,375 | |
| Liaoning Cheng Da, Cl A* | | | 98,300 | | | | 252,301 | |
| Midea Group, Cl A | | | 103,350 | | | | 499,370 | |
| Nanjing Xinjiekou Department Store, Cl A | | | 33,300 | | | | 176,645 | |
| Pang Da Automobile Trade, Cl A* | | | 48,500 | | | | 20,268 | |
| Qingdao Haier, Cl A | | | 47,400 | | | | 83,771 | |
| SAIC Motor, Cl A | | | 192,000 | | | | 707,066 | |
| Shanghai Oriental Pearl Media, Cl A | | | 58,200 | | | | 190,346 | |
| Shenzhen Overseas Chinese Town, Cl A | | | 101,600 | | | | 107,618 | |
| Suning Commerce Group, Cl A | | | 153,600 | | | | 240,703 | |
| Visual China Group, Cl A* | | | 34,100 | | | | 94,703 | |
| Wanda Cinema Line, Cl A | | | 15,000 | | | | 123,016 | |
| Wanxiang Qianchao, Cl A | | | 122,800 | | | | 213,463 | |
| Wuchan Zhongda Group, Cl A | | | 46,910 | | | | 72,422 | |
| Zhejiang Wanfeng Auto Wheel, Cl A | | | 31,600 | | | | 102,937 | |
| | | | | | | | 5,701,576 | |
The accompanying notes are an integral part of the financial statements.
Schedule of Investments March 31, 2017
KraneShares Bosera MSCI China A Share ETF (continued)
| | | Shares | | | Value | |
| COMMON STOCK (continued) | | | | | | | | |
| Consumer Staples — 7.2% | | | | | | | | |
| Bright Dairy & Food, Cl A* | | | 98,000 | | | $ | 184,857 | |
| COFCO Tunhe Sugar, Cl A | | | 115,900 | | | | 189,192 | |
| Fujian Sunner Development, Cl A*(A)(B) | | | 12,500 | | | | 36,130 | |
| Henan Shuanghui Investment & Development, Cl A | | | 121,900 | | | | 398,857 | |
| Inner Mongolia Yili Industrial Group, Cl A | | | 105,800 | | | | 290,298 | |
| Jiangsu Yanghe Brewery Joint-Stock, Cl A | | | 16,300 | | | | 206,665 | |
| Kweichow Moutai, Cl A | | | 24,800 | | | | 1,390,309 | |
| Luzhou Laojiao, Cl A | | | 11,500 | | | | 70,400 | |
| Muyuan Foodstuff, Cl A | | | 49,400 | | | | 195,303 | |
| Wuliangye Yibin, Cl A | | | 59,900 | | | | 373,734 | |
| Yonghui Superstores, Cl A | | | 381,100 | | | | 304,137 | |
| Yuan Longping High-tech Agriculture, Cl A | | | 39,893 | | | | 120,111 | |
| | | | | | | | 3,759,993 | |
| Energy — 3.0% | | | | | | | | |
| China Merchants Energy Shipping, Cl A | | | 162,900 | | | | 128,348 | |
| China Petroleum & Chemical, Cl A | | | 874,200 | | | | 728,098 | |
| China Shenhua Energy, Cl A* | | | 62,900 | | | | 176,695 | |
| Geo-Jade Petroleum, Cl A | | | 48,820 | | | | 56,599 | |
| Guanghui Energy, Cl A | | | 100,100 | | | | 68,120 | |
| PetroChina, Cl A | | | 122,100 | | | | 139,431 | |
| Shanxi Lu’an Environmental Energy Development, Cl A* | | | 193,000 | | | | 248,012 | |
| Wintime Energy, Cl A | | | 44,000 | | | | 25,282 | |
| | | | | | | | 1,570,585 | |
| Financials — 26.5% | | | | | | | | |
| Agricultural Bank of China, Cl A | | | 1,897,600 | | | | 919,641 | |
| Anxin Trust, Cl A | | | 139,500 | | | | 229,538 | |
| Bank of Beijing, Cl A | | | 138,936 | | | | 193,734 | |
| Bank of China, Cl A | | | 789,400 | | | | 423,805 | |
| Bank of Communications, Cl A | | | 761,000 | | | | 687,923 | |
| Bank of Nanjing, Cl A | | | 81,100 | | | | 141,447 | |
| Bank of Ningbo, Cl A | | | 55,900 | | | | 149,406 | |
| Bank of Shanghai, Cl A* | | | 93,400 | | | | 324,985 | |
| Bohai Financial Investment Holding, Cl A* | | | 128,300 | | | | 132,734 | |
| Changjiang Securities, Cl A | | | 97,500 | | | | 138,502 | |
| China Construction Bank, Cl A* | | | 501,500 | | | | 432,240 | |
| China Everbright Bank, Cl A | | | 995,300 | | | | 593,558 | |
| China Life Insurance, Cl A* | | | 114,700 | | | | 421,067 | |
| China Merchants Bank, Cl A | | | 249,800 | | | | 694,835 | |
| China Merchants Securities, Cl A | | | 69,801 | | | | 164,785 | |
| China Minsheng Banking, Cl A | | | 573,700 | | | | 705,908 | |
| China Pacific Insurance Group, Cl A | | | 145,335 | | | | 578,236 | |
| CITIC Securities, Cl A | | | 113,600 | | | | 265,547 | |
| Founder Securities, Cl A | | | 27,900 | | | | 32,832 | |
| GF Securities, Cl A | | | 114,400 | | | | 283,684 | |
| Guotai Junan Securities, Cl A | | | 213,500 | | | | 565,364 | |
| Guoyuan Securities, Cl A | | | 39,100 | | | | 116,418 | |
| Haitong Securities, Cl A | | | 89,500 | | | | 189,602 | |
| Huatai Securities, Cl A | | | 48,000 | | | | 117,078 | |
| Huaxia Bank, Cl A | | | 102,800 | | | | 168,405 | |
| Industrial & Commercial Bank of China, Cl A | | | 431,000 | | | | 302,685 | |
| Industrial Bank, Cl A | | | 436,700 | | | | 1,027,149 | |
| New China Life Insurance, Cl A* | | | 70,000 | | | | 428,524 | |
The accompanying notes are an integral part of the financial statements.
Schedule of Investments March 31, 2017
KraneShares Bosera MSCI China A Share ETF (continued)
| | | Shares | | | Value | |
| COMMON STOCK (continued) | | | | | | | | |
| Financials (continued) | | | | | | | | |
| Northeast Securities, Cl A | | | 275,500 | | | $ | 476,902 | |
| Orient Securities, Cl A | | | 25,600 | | | | 54,530 | |
| Ping An Bank, Cl A | | | 133,480 | | | | 177,604 | |
| Ping An Insurance Group of China, Cl A | | | 271,600 | | | | 1,458,533 | |
| SDIC Essence Holdings, Cl A | | | 24,100 | | | | 52,593 | |
| Shanghai Pudong Development Bank, Cl A | | | 334,370 | | | | 776,759 | |
| Shanxi Securities, Cl A | | | 57,400 | | | | 91,949 | |
| Shenwan Hongyuan Group, Cl A | | | 181,860 | | | | 163,605 | |
| Southwest Securities, Cl A | | | 96,600 | | | | 87,043 | |
| Western Securities, Cl A(A)(B) | | | 10,400 | | | | 27,661 | |
| Xishui Strong Year Inner Mongolia, Cl A | | | 54,700 | | | | 114,689 | |
| | | | | | | | 13,911,500 | |
| Health Care — 7.3% | | | | | | | | |
| Beijing SL Pharmaceutical, Cl A | | | 65,200 | | | | 244,081 | |
| Beijing Tongrentang, Cl A | | | 22,855 | | | | 104,827 | |
| China Resources Sanjiu Medical & Pharmaceutical, Cl A | | | 39,660 | | | | 155,376 | |
| Guangxi Wuzhou Zhongheng Group, Cl A* | | | 310,100 | | | | 202,030 | |
| Guangzhou Baiyunshan Pharmaceutical Holdings, Cl A | | | 7,200 | | | | 29,743 | |
| Guizhou Bailing Group Pharmaceutical, Cl A | | | 22,400 | | | | 57,464 | |
| Harbin Pharmaceutical Group, Cl A* | | | 262,300 | | | | 289,634 | |
| Huapont Life Sciences, Cl A | | | 195,500 | | | | 235,446 | |
| Jiangsu Hengrui Medicine, Cl A | | | 39,440 | | | | 310,917 | |
| Jointown Pharmaceutical Group, Cl A | | | 70,900 | | | | 200,711 | |
| Kangmei Pharmaceutical, Cl A | | | 63,800 | | | | 174,594 | |
| Searainbow Holding, Cl A* | | | 14,300 | | | | 70,942 | |
| Shanghai Fosun Pharmaceutical Group, Cl A* | | | 90,400 | | | | 370,163 | |
| Shanghai Pharmaceuticals Holding, Cl A* | | | 117,000 | | | | 395,727 | |
| Shanghai RAAS Blood Products, Cl A | | | 28,260 | | | | 84,307 | |
| Shenzhen Salubris Pharmaceuticals, Cl A | | | 53,796 | | | | 222,856 | |
| Shijiazhuang Yiling Pharmaceutical, Cl A | | | 26,600 | | | | 68,895 | |
| Sichuan Kelun Pharmaceutical, Cl A | | | 59,700 | | | | 137,733 | |
| Tasly Pharmaceutical Group, Cl A | | | 24,100 | | | | 139,702 | |
| Yunnan Baiyao Group, Cl A | | | 8,200 | | | | 101,277 | |
| Zhejiang NHU, Cl A* | | | 78,934 | | | | 225,689 | |
| | | | | | | | 3,822,114 | |
| Industrials — 18.7% | | | | | | | | |
| AVIC Aero-Engine Controls, Cl A | | | 11,300 | | | | 40,302 | |
| AVIC Aircraft, Cl A | | | 21,000 | | | | 75,081 | |
| AVIC Aviation Engine, Cl A | | | 31,100 | | | | 151,940 | |
| AVIC Aviation High-Technology, Cl A* | | | 123,400 | | | | 210,746 | |
| AVIC Electromechanical Systems, Cl A | | | 22,200 | | | | 54,535 | |
| Beijing Orient Landscape & Environment, Cl A | | | 43,850 | | | | 101,611 | |
| China Avionics Systems, Cl A* | | | 147,800 | | | | 413,903 | |
| China Baoan Group, Cl A | | | 34,020 | | | | 45,266 | |
| China CSSC Holdings, Cl A | | | 58,900 | | | | 241,863 | |
| China Eastern Airlines, Cl A* | | | 294,000 | | | | 293,070 | |
| China First Heavy Industries, Cl A | | | 76,100 | | | | 46,598 | |
| China Gezhouba Group, Cl A* | | | 177,800 | | | | 303,651 | |
| China National Chemical Engineering, Cl A | | | 81,100 | | | | 102,966 | |
| China Railway Construction, Cl A | | | 276,900 | | | | 521,915 | |
| China Railway Group, Cl A | | | 382,100 | | | | 488,450 | |
| China Shipbuilding Industry, Cl A | | | 314,700 | | | | 339,732 | |
The accompanying notes are an integral part of the financial statements.
Schedule of Investments March 31, 2017
KraneShares Bosera MSCI China A Share ETF (continued)
| | | Shares | | | Value | |
| COMMON STOCK (continued) | | | | | | | | |
| Industrials (continued) | | | | | | | | |
| China Southern Airlines, Cl A | | | 243,300 | | | $ | 284,541 | |
| China State Construction Engineering, Cl A | | | 552,900 | | | | 738,077 | |
| China XD Electric, Cl A | | | 70,100 | | | | 64,793 | |
| CMST Development, Cl A | | | 169,400 | | | | 214,337 | |
| COSCO Shipping Holdings, Cl A* | | | 294,300 | | | | 252,374 | |
| CRRC, Cl A | | | 475,500 | | | | 706,509 | |
| Daqin Railway, Cl A | | | 141,200 | | | | 155,095 | |
| Eternal Asia Supply Chain Management, Cl A | | | 125,300 | | | | 185,083 | |
| Galaxy Biomedical Investment, Cl A* | | | 31,700 | | | | 53,816 | |
| Guoxuan High-Tech, Cl A | | | 22,600 | | | | 108,281 | |
| Henan Pinggao Electric, Cl A* | | | 78,900 | | | | 193,249 | |
| Luxshare Precision Industry, Cl A | | | 14,450 | | | | 53,046 | |
| Metallurgical Corp of China, Cl A | | | 120,800 | | | | 89,043 | |
| Minmetals Development, Cl A | | | 98,800 | | | | 204,573 | |
| NARI Technology, Cl A(A)(B) | | | 58,000 | | | | 146,772 | |
| Power Construction Corp of China, Cl A | | | 169,800 | | | | 189,220 | |
| Sany Heavy Industry, Cl A | | | 257,100 | | | | 268,598 | |
| Shanghai Construction Group, Cl A* | | | 309,200 | | | | 218,941 | |
| Shanghai Environment Group, Cl A* | | | 5,450 | | | | 23,164 | |
| Shanghai International Port Group, Cl A* | | | 357,900 | | | | 307,953 | |
| Shanghai Mechanical and Electrical Industry, Cl A* | | | 83,900 | | | | 263,321 | |
| Sinotrans Air Transportation Development, Cl A | | | 46,300 | | | | 120,792 | |
| Sinovel Wind Group, Cl A* | | | 150,500 | | | | 49,134 | |
| Taihai Manoir Nuclear Equipment, Cl A | | | 29,300 | | | | 214,187 | |
| TBEA, Cl A | | | 137,600 | | | | 223,417 | |
| Weichai Power, Cl A* | | | 136,400 | | | | 222,502 | |
| Xinjiang Goldwind Science & Technology, Cl A* | | | 94,617 | | | | 221,417 | |
| XJ Electric, Cl A | | | 83,000 | | | | 212,805 | |
| Yingkou Port Liability, Cl A | | | 295,500 | | | | 160,360 | |
| Zhejiang Chint Electrics, Cl A | | | 20,800 | | | | 60,633 | |
| Zhengzhou Yutong Bus, Cl A | | | 56,173 | | | | 175,077 | |
| | | | | | | | 9,812,739 | |
| Information Technology — 8.0% | | | | | | | | |
| Aisino, Cl A | | | 19,000 | | | | 57,895 | |
| Beijing Xinwei Technology Group, Cl A(A)(B) | | | 23,600 | | | | 51,263 | |
| BOE Technology Group, Cl A | | | 650,900 | | | | 324,893 | |
| China Security & Fire, Cl A(A)(B) | | | 7,500 | | | | 19,175 | |
| Dalian Zeus Entertainment Group, Cl A* | | | 19,800 | | | | 187,848 | |
| Dawning Information Industry, Cl A | | | 8,200 | | | | 31,304 | |
| DHC Software, Cl A | | | 8,800 | | | | 27,172 | |
| Digital China Group, Cl A*(A)(B) | | | 33,700 | | | | 119,557 | |
| Dongxu Optoelectronic Technology, Cl A | | | 41,300 | | | | 67,956 | |
| Fiberhome Telecommunication Technologies, Cl A | | | 33,000 | | | | 118,079 | |
| GoerTek, Cl A | | | 11,900 | | | | 58,777 | |
| GRG Banking Equipment, Cl A | | | 135,745 | | | | 253,298 | |
| Hangzhou Hikvision Digital Technology, Cl A | | | 83,700 | | | | 387,421 | |
| Hangzhou Liaison Interactive Information Technology, Cl A(A)(B) | | | 30,100 | | | | 56,821 | |
| Hengtong Optic-electric, Cl A | | | 55,800 | | | | 208,568 | |
| Hundsun Technologies, Cl A | | | 13,500 | | | | 82,761 | |
| Iflytek, Cl A | | | 13,000 | | | | 66,209 | |
| Jiangsu Protruly Vision Technology Group, Cl A* | | | 57,200 | | | | 107,066 | |
| People.cn, Cl A | | | 116,365 | | | | 280,790 | |
The accompanying notes are an integral part of the financial statements.
Schedule of Investments March 31, 2017
KraneShares Bosera MSCI China A Share ETF (continued)
| | | Shares | | | Value | |
| COMMON STOCK (continued) | | | | | | | | |
| Information Technology (continued) | | | | | | | | |
| Sanan Optoelectronics, Cl A | | | 153,045 | | | $ | 355,087 | |
| Shanghai 2345 Network Holding Group, Cl A | | | 20,200 | | | | 33,941 | |
| Shanghai DZH, Cl A* | | | 50,100 | | | | 45,144 | |
| Shenzhen Aisidi, Cl A* | | | 74,000 | | | | 131,963 | |
| Shenzhen O-film Tech, Cl A | | | 11,300 | | | | 62,076 | |
| Sinodata, Cl A | | | 56,000 | | | | 273,752 | |
| Suzhou Victory Precision Manufacture, Cl A(A)(B) | | | 34,800 | | | | 40,345 | |
| Taiji Computer, Cl A* | | | 51,500 | | | | 226,635 | |
| Tianjin Zhonghuan Semiconductor, Cl A(A)(B) | | | 9,600 | | | | 11,687 | |
| Tianma Microelectronics, Cl A* | | | 74,633 | | | | 185,419 | |
| Tongding Interconnection Information, Cl A | | | 49,600 | | | | 106,227 | |
| Tsinghua Tongfang, Cl A | | | 17,300 | | | | 34,265 | |
| Yonyou Network Technology, Cl A | | | 21,700 | | | | 56,015 | |
| Zhejiang Dahua Technology, Cl A | | | 30,350 | | | | 70,329 | |
| ZTE, Cl A | | | 27,140 | | | | 66,789 | |
| | | | | | | | 4,206,527 | |
| Materials — 8.4% | | | | | | | | |
| Aluminum Corp of China, Cl A* | | | 124,900 | | | | 84,272 | |
| Anhui Conch Cement, Cl A | | | 114,300 | | | | 343,971 | |
| Baoshan Iron & Steel, Cl A | | | 291,900 | | | | 275,729 | |
| China Hainan Rubber Industry Group, Cl A | | | 42,200 | | | | 42,250 | |
| China Northern Rare Earth Group High-Tech, Cl A | | | 89,900 | | | | 157,969 | |
| Hubei Biocause Pharmaceutical, Cl A | | | 95,900 | | | | 105,198 | |
| Inner Mongolia BaoTou Steel Union, Cl A* | | | 226,600 | | | | 99,625 | |
| Inner Mongolia Junzheng Energy & Chemical Industry Group, Cl A | | | 176,100 | | | | 124,183 | |
| Jiangxi Copper, Cl A* | | | 104,900 | | | | 262,562 | |
| Jiangxi Ganfeng Lithium, Cl A | | | 7,700 | | | | 46,177 | |
| Kangde Xin Composite Material Group, Cl A | | | 26,795 | | | | 74,338 | |
| Kingenta Ecological Engineering Group, Cl A | | | 183,600 | | | | 192,343 | |
| Maanshan Iron & Steel, Cl A* | | | 557,000 | | | | 264,151 | |
| Org Packaging, Cl A | | | 85,200 | | | | 101,496 | |
| Shandong Gold Mining, Cl A | | | 17,200 | | | | 89,297 | |
| Shandong Iron and Steel, Cl A* | | | 540,900 | | | | 211,124 | |
| Shanxi Taigang Stainless Steel, Cl A | | | 176,700 | | | | 129,221 | |
| Shenzhen Zhongjin Lingnan Nonfemet, Cl A* | | | 140,400 | | | | 226,945 | |
| Tianqi Lithium Industries, Cl A | | | 8,800 | | | | 55,161 | |
| Tongling Nonferrous Metals Group, Cl A* | | | 566,200 | | | | 260,433 | |
| Wanhua Chemical Group, Cl A | | | 93,900 | | | | 369,371 | |
| Xiamen Tungsten, Cl A | | | 9,600 | | | | 29,990 | |
| Xinjiang Zhongtai Chemical, Cl A* | | | 95,900 | | | | 179,505 | |
| Yunnan Tin, Cl A | | | 111,100 | | | | 212,147 | |
| Zhongjin Gold, Cl A | | | 26,700 | | | | 45,405 | |
| Zijin Mining Group, Cl A | | | 830,600 | | | | 407,358 | |
| | | | | | | | 4,390,221 | |
| Real Estate — 5.1% | | | | | | | | |
| China Fortune Land Development, Cl A | | | 16,700 | | | | 66,056 | |
| China Merchants Shekou Industrial Zone Holdings, Cl A | | | 43,182 | | | | 110,276 | |
| China Vanke, Cl A | | | 194,700 | | | | 581,405 | |
| Chongqing Dima Industry, Cl A* | | | 231,800 | | | | 222,995 | |
| Financial Street Holdings, Cl A | | | 62,500 | | | | 100,482 | |
| Future Land Holdings, Cl A | | | 35,300 | | | | 78,777 | |
The accompanying notes are an integral part of the financial statements.
Schedule of Investments March 31, 2017
KraneShares Bosera MSCI China A Share ETF (continued)
| | | Shares/ | | | | |
| | | Face Amount | | | Value | |
| COMMON STOCK (continued) | | | | | | | | |
| Real Estate (continued) | | | | | | | | |
| Gemdale, Cl A | | | 153,500 | | | $ | 247,229 | |
| Poly Real Estate Group, Cl A | | | 418,500 | | | | 578,703 | |
| RiseSun Real Estate Development, Cl A | | | 53,600 | | | | 67,819 | |
| Shanghai Lujiazui Finance & Trade Zone Development, Cl A | | | 68,800 | | | | 229,606 | |
| Shanghai SMI Holding, Cl A | | | 19,625 | | | | 52,138 | |
| Shanghai Zhangjiang High-Tech Park Development, Cl A | | | 18,100 | | | | 45,304 | |
| Suning Universal, Cl A | | | 49,900 | | | | 50,828 | |
| Xinhu Zhongbao, Cl A | | | 291,700 | | | | 206,972 | |
| Zhejiang China Commodities City Group, Cl A | | | 59,200 | | | | 68,032 | |
| | | | | | | | 2,706,622 | |
| Telecommunication Services — 0.8% | | | | | | | | |
| China United Network Communications, Cl A | | | 411,200 | | | | 445,698 | |
| Utilities — 3.5% | | | | | | | | |
| Chengdu Xingrong Environment, Cl A | | | 319,200 | | | | 267,706 | |
| China National Nuclear Power, Cl A | | | 135,500 | | | | 142,739 | |
| China Yangtze Power, Cl A | | | 308,583 | | | | 594,169 | |
| Inner Mongolia MengDian HuaNeng Thermal Power, Cl A | | | 335,500 | | | | 163,082 | |
| Shanghai Electric Power, Cl A | | | 92,100 | | | | 164,641 | |
| Shenergy, Cl A | | | 191,000 | | | | 173,490 | |
| Zhejiang Zheneng Electric Power, Cl A | | | 385,600 | | | | 318,898 | |
| | | | | | | | 1,824,725 | |
| TOTAL COMMON STOCK | | | | | | | | |
| (Cost $52,309,586) | | | | | | | 52,152,300 | |
| | | | | | | | | |
| CONVERTIBLE BOND — 0.1% | | | | | | | | |
| CHINA — 0.1% | | | | | | | | |
| Financials — 0.1% | | | | | | | | |
| China Everbright Bank CV to 22.9358 | | | | | | | | |
| 0.200%, 03/16/2023 | | $ | 269,000 | | | | 39,032 | |
| TOTAL CONVERTIBLE BOND | | | | | | | | |
| (Cost $38,938) | | | | | | | 39,032 | |
| TOTAL INVESTMENTS — 99.4% | | | | | | | | |
| (Cost $52,348,524) | | | | | | | 52,191,332 | |
| OTHER ASSETS LESS LIABILITIES — 0.6% | | | | | | | 302,453 | |
| NET ASSETS — 100.0% | | | | | | $ | 52,493,785 | |
| ‡ | Narrow industries are utilized for compliance purposes, whereas broad sectors are utilized for reporting purposes. |
| * | Non-income producing security. |
| (A) | Security is fair valued using methods determined in good faith by the Fair Value Committee of the Board of Trustees. The total value of such securities as of March 31, 2017 was $554,490 and represents 1.1% of Net Assets. |
| (B) | Security considered illiquid. The total value of such securities as of March 31, 2017 was $554,490 and represents 1.1% of Net Assets. |
Cl — Class
CV — Convertible Security
The accompanying notes are an integral part of the financial statements.
Schedule of Investments March 31, 2017
KraneShares Bosera MSCI China A Share ETF (concluded)
The following is a list of the inputs used, as of March 31, 2017, in valuing the Fund’s investments carried at value:
| | | Level 1 | | | Level 2 | | | Level 3 | | | Total | |
| Investments in Securities | | | | | | | | | | | | | | | | |
| Common Stock | | | | | | | | | | | | | | | | |
| China | | | | | | | | | | | | | | | | |
| Consumer Discretionary | | $ | 5,656,497 | | | $ | — | | | $ | 45,079 | | | $ | 5,701,576 | |
| Consumer Staples | | | 3,723,863 | | | | — | | | | 36,130 | | | | 3,759,993 | |
| Energy | | | 1,570,585 | | | | — | | | | — | | | | 1,570,585 | |
| Financials | | | 13,883,839 | | | | — | | | | 27,661 | | | | 13,911,500 | |
| Health Care | | | 3,822,114 | | | | — | | | | — | | | | 3,822,114 | |
| Industrials | | | 9,665,967 | | | | — | | | | 146,772 | | | | 9,812,739 | |
| Information Technology | | | 3,907,679 | | | | — | | | | 298,848 | | | | 4,206,527 | |
| Materials | | | 4,390,221 | | | | — | | | | — | | | | 4,390,221 | |
| Real Estate | | | 2,706,622 | | | | — | | | | — | | | | 2,706,622 | |
| Telecommunication Services | | | 445,698 | | | | — | | | | — | | | | 445,698 | |
| Utilities | | | 1,824,725 | | | | — | | | | — | | | | 1,824,725 | |
| Total Common Stock | | | 51,597,810 | | | | — | | | | 554,490 | | | | 52,152,300 | |
| Convertible Bond | | | — | | | | 39,032 | | | | — | | | | 39,032 | |
| Total Investments in Securities | | $ | 51,597,810 | | | $ | 39,032 | | | $ | 554,490 | | | $ | 52,191,332 | |
The following is a reconciliation of the investments in which significant unobservable inputs (Level 3) were used in determining value:
| | | Common Stock | |
| Beginning balance as of April 1, 2016 | | $ | 484,406 | |
| Accrued discounts/premiums | | | — | |
| Realized gain/(loss)(1) | | | (32,808 | ) |
| Change in unrealized appreciation/(depreciation)(2) | | | (10,761 | ) |
| Purchases | | | — | |
| Sales | | | (50,276 | ) |
| Transfer into Level 3 | | | 535,314 | |
| Transfer out of Level 3 | | | (371,385 | ) |
| Ending balance as of March 31, 2017 | | $ | 554,490 | |
| (1) | Realized gain/(loss) from the sale of Level 3 securities is included on the Statement of Operations in Net Realized Gain (Loss) on Investments |
| (2) | Change in unrealized appreciation/(depreciation) is included on the Statement of Operations in Net Change in Unrealized Appreciation (Depreciation) on Investments |
For the year ended March 31, 2017, there have been no transfers between Level 1 and Level 2 investments.
For the year ended March 31, 2017, there have been no transfers between Level 2 and Level 3 investments.
For the year ended March 31, 2017, the transfers in and out of Level 3 occurred due to a halt in trading of these securities. Transfers between levels are recognized at period end.
Amounts designated as ‘‘—’’ are $0 or have been rounded to $0.
The accompanying notes are an integral part of the financial statements.
Schedule of Investments March 31, 2017
KraneShares Zacks New China ETF
| † | Percentages are based on total investments. More narrow industries are utilized for compliance purposes, whereas broad sectors are utilized for reporting purposes. |
| | | Shares | | | Value | |
| COMMON STOCK — 99.8%‡ | | | | | | | | |
| CHINA — 86.8% | | | | | | | | |
| Consumer Discretionary — 16.3% | | | | | | | | |
| China Lodging Group ADR* | | | 1,800 | | | $ | 111,690 | |
| China Maple Leaf Educational Systems | | | 52,000 | | | | 39,210 | |
| Goodbaby International Holdings | | | 61,000 | | | | 29,591 | |
| Huangshan Tourism Development, Cl A | | | 13,950 | | | | 35,017 | |
| Huayu Automotive Systems, Cl A | | | 30,800 | | | | 81,382 | |
| Nexteer Automotive Group | | | 66,000 | | | | 97,325 | |
| SAIC Motor, Cl A | | | 32,000 | | | | 117,844 | |
| Shanghai Jin Jiang International Hotels Group, Cl H | | | 168,000 | | | | 44,316 | |
| | | | | | | | 556,375 | |
| Consumer Staples — 12.2% | | | | | | | | |
| Angel Yeast, Cl A | | | 29,244 | | | | 89,024 | |
| China Agri-Industries Holdings | | | 217,712 | | | | 109,535 | |
| Inner Mongolia Yili Industrial Group, Cl A | | | 41,800 | | | | 114,693 | |
| Want Want China Holdings | | | 146,452 | | | | 101,385 | |
| | | | | | | | 414,637 | |
| Financials — 6.4% | | | | | | | | |
| China Pacific Insurance Group, Cl A | | | 25,500 | | | | 101,455 | |
| Ping An Insurance Group of China, Cl A | | | 21,400 | | | | 114,921 | |
| | | | | | | | 216,376 | |
| Health Care — 10.7% | | | | | | | | |
| China Animal Healthcare(A)(B) | | | 4,000 | | | | — | |
| China Biologic Products* | | | 600 | | | | 60,078 | |
| Harbin Pharmaceutical Group, Cl A* | | | 58,800 | | | | 64,928 | |
| Jiangsu Hengrui Medicine, Cl A | | | 17,125 | | | | 135,001 | |
| Sinopharm Group, Cl H | | | 22,880 | | | | 106,134 | |
| | | | | | | | 366,141 | |
| Industrials — 5.2% | | | | | | | | |
| Weichai Power, Cl H | | | 59,368 | | | | 104,810 | |
| Zhengzhou Yutong Bus, Cl A | | | 22,740 | | | | 70,875 | |
| | | | | | | | 175,685 | |
| Information Technology — 30.6% | | | | | | | | |
| AAC Technologies Holdings | | | 13,500 | | | | 157,991 | |
| Changyou.com ADR* | | | 1,400 | | | | 39,256 | |
| ChinaCache International Holdings ADR* | | | 4,400 | | | | 6,864 | |
| Hanergy Thin Film Power Group*(A)(B) | | | 65,064 | | | | 84 | |
The accompanying notes are an integral part of the financial statements.
Schedule of Investments March 31, 2017
KraneShares Zacks New China ETF (continued)
| | | Shares | | | Value | |
| COMMON STOCK (continued) | | | | | | | | |
| Information Technology (continued) | | | | | | | | |
| Hollysys Automation Technologies | | | 1,620 | | | $ | 27,427 | |
| Kingsoft | | | 29,000 | | | | 79,856 | |
| NetEase ADR | | | 537 | | | | 152,508 | |
| Shengyi Technology, Cl A | | | 55,500 | | | | 105,656 | |
| Sohu.com* | | | 1,467 | | | | 57,697 | |
| Sunny Optical Technology Group | | | 24,075 | | | | 175,958 | |
| Tencent Holdings | | | 4,942 | | | | 141,682 | |
| TravelSky Technology, Cl H | | | 41,000 | | | | 96,862 | |
| | | | | | | | 1,041,841 | |
| Materials — 0.4% | | | | | | | | |
| BBMG, Cl H | | | 35,674 | | | | 14,827 | |
| China Lumena New Materials*(A)(B) | | | 28,720 | | | | — | |
| China Shanshui Cement Group(A)(B) | | | 10,672 | | | | 14 | |
| Tianhe Chemicals Group*(A)(B) | | | 40,000 | | | | — | |
| | | | | | | | 14,841 | |
| Utilities — 5.0% | | | | | | | | |
| Beijing Jingneng Clean Energy, Cl H | | | 209,632 | | | | 63,929 | |
| Beijing Jingneng Power, Cl A | | | 91,900 | | | | 59,206 | |
| Yunnan Wenshan Electric Power, Cl A | | | 25,951 | | | | 48,198 | |
| | | | | | | | 171,333 | |
| TOTAL CHINA | | | | | | | 2,957,229 | |
| | | | | | | | | |
| HONG KONG — 6.2% | | | | | | | | |
| Consumer Discretionary — 2.2% | | | | | | | | |
| Skyworth Digital Holdings | | | 111,806 | | | | 73,660 | |
| Information Technology — 4.0% | | | | | | | | |
| ASM Pacific Technology | | | 8,400 | | | | 114,248 | |
| Digital China Holdings | | | 26,000 | | | | 22,817 | |
| | | | | | | | 137,065 | |
| TOTAL HONG KONG | | | | | | | 210,725 | |
| | | | | | | | | |
| SINGAPORE — 4.8% | | | | | | | | |
| Information Technology — 4.8% | | | | | | | | |
| IGG | | | 81,000 | | | | 112,357 | |
| Kulicke & Soffa Industries* | | | 2,500 | | | | 50,800 | |
| TOTAL SINGAPORE | | | | | | | 163,157 | |
| | | | | | | | | |
| UNITED STATES — 2.0% | | | | | | | | |
| Information Technology — 2.0% | | | | | | | | |
| Flex* | | | 4,000 | | | | 67,200 | |
| TOTAL UNITED STATES | | | | | | | 67,200 | |
| TOTAL COMMON STOCK | | | | | | | | |
| (Cost $2,628,288) | | | | | | | 3,398,311 | |
| TOTAL INVESTMENTS — 99.8% | | | | | | | | |
| (Cost $2,628,288) | | | | | | | 3,398,311 | |
| OTHER ASSETS LESS LIABILITIES — 0.2% | | | | | | | 7,356 | |
| NET ASSETS — 100.0% | | | | | | $ | 3,405,667 | |
| ‡ | Narrow industries are utilized for compliance purposes, whereas broad sectors are utilized for reporting purposes. |
| * | Non-income producing security. |
| (A) | Security is fair valued using methods determined in good faith by the Fair Value Committee of the Board of Trustees. The total value of such securities as of March 31, 2017 was $98 and represents 0.0% of Net Assets. |
The accompanying notes are an integral part of the financial statements.
Schedule of Investments March 31, 2017
KraneShares Zacks New China ETF (concluded)
| (B) | Security considered illiquid. The total value of such securities as of March 31, 2017 was $98 and represents 0.0% of Net Assets. |
ADR — American Depositary Receipt
Cl — Class
The following is a list of the inputs used, as of March 31, 2017, in valuing the Fund’s investments carried at value:
| | | Level 1 | | | Level 2 | | | Level 3^ | | | Total | |
| Investments in Securities | | | | | | | | | | | | | | | | |
| Common Stock | | | | | | | | | | | | | | | | |
| China | | | | | | | | | | | | | | | | |
| Consumer Discretionary | | $ | 556,375 | | | $ | — | | | $ | — | | | $ | 556,375 | |
| Consumer Staples | | | 414,637 | | | | — | | | | — | | | | 414,637 | |
| Financials | | | 216,376 | | | | — | | | | — | | | | 216,376 | |
| Health Care | | | 366,141 | | | | — | | | | — | | | | 366,141 | |
| Industrials | | | 175,685 | | | | — | | | | — | | | | 175,685 | |
| Information Technology | | | 1,041,757 | | | | — | | | | 84 | | | | 1,041,841 | |
| Materials | | | 14,827 | | | | — | | | | 14 | | | | 14,841 | |
| Utilities | | | 171,333 | | | | — | | | | — | | | | 171,333 | |
| Hong Kong | | | 210,725 | | | | — | | | | — | | | | 210,725 | |
| Singapore | | | 163,157 | | | | — | | | | — | | | | 163,157 | |
| United States | | | 67,200 | | | | — | | | | — | | | | 67,200 | |
| Total Common Stock | | | 3,398,213 | | | | — | | | | 98 | | | | 3,398,311 | |
| Total Investments in Securities | | $ | 3,398,213 | | | $ | — | | | $ | 98 | | | $ | 3,398,311 | |
| ^ | A reconciliation of Level 3 investments, including certain disclosures related to significant inputs used in valuing Level 3 investments is only presented when the Fund has over 1% of Level 3 investments at the beginning and/or end of the period in relation to net assets. |
For the year ended March 31, 2017, there have been no transfers between Level 1 and Level 2 investments.
For the year ended March 31, 2017, there have been no transfers between Level 2 and Level 3 investments.
For the year ended March 31, 2017, the transfers in and out of Level 3 occurred due to a halt in trading of these securities. Transfers between levels are recognized at period end.
Amounts designated as ‘‘—’’ are $0 or have been rounded to $0.
The accompanying notes are an integral part of the financial statements.
Schedule of Investments March 31, 2017
KraneShares CSI China Internet ETF
| † | Percentages are based on total investments. More narrow industries are utilized for compliance purposes, whereas broad sectors are utilized for reporting purposes. |
| | | Shares | | | Value | |
| COMMON STOCK — 99.9%‡ | | | | | | | | |
| CHINA — 98.4% | | | | | | | | |
| Consumer Discretionary — 26.6% | | | | | | | | |
| 500.com ADR, Cl A* | | | 138,592 | | | $ | 1,858,519 | |
| Cogobuy Group* | | | 3,138,818 | | | | 4,434,694 | |
| Ctrip.com International ADR* | | | 375,934 | | | | 18,477,156 | |
| JD.com ADR* | | | 743,170 | | | | 23,120,019 | |
| Jumei International Holding ADR* | | | 464,819 | | | | 1,715,182 | |
| TAL Education Group ADR* | | | 134,447 | | | | 14,328,017 | |
| Tuniu ADR* | | | 201,504 | | | | 1,765,175 | |
| Vipshop Holdings ADR* | | | 895,377 | | | | 11,944,329 | |
| | | | | | | | 77,643,091 | |
| Industrials — 1.6% | | | | | | | | |
| 51job ADR* | | | 126,396 | | | | 4,633,677 | |
| Information Technology — 70.2% | | | | | | | | |
| 21Vianet Group ADR* | | | 268,267 | | | | 1,472,786 | |
| 58.com ADR* | | | 308,863 | | | | 10,930,662 | |
| Alibaba Group Holding ADR* | | | 256,062 | | | | 27,611,165 | |
| Autohome ADR* | | | 329,952 | | | | 10,482,575 | |
| Baidu ADR* | | | 125,527 | | | | 21,655,918 | |
| Baozun ADR* | | | 171,747 | | | | 2,565,900 | |
| Bitauto Holdings ADR* | | | 194,614 | | | | 4,984,064 | |
| Boyaa Interactive International | | | 2,227,000 | | | | 1,203,551 | |
| Changyou.com ADR* | | | 112,264 | | | | 3,147,882 | |
| Cheetah Mobile ADR* | | | 321,043 | | | | 3,448,002 | |
| Fang Holdings ADR* | | | 1,465,142 | | | | 4,776,363 | |
| HC International | | | 3,241,900 | | | | 2,886,695 | |
| Kingsoft | | | 4,863,000 | | | | 13,391,006 | |
| Momo ADR* | | | 400,512 | | | | 13,645,444 | |
| NetEase ADR | | | 45,754 | | | | 12,994,136 | |
| NQ Mobile ADR, Cl A* | | | 362,471 | | | | 1,511,504 | |
| SINA* | | | 152,918 | | | | 11,028,446 | |
| Sohu.com* | | | 149,265 | | | | 5,870,592 | |
| Tencent Holdings | | | 1,069,800 | | | | 30,669,940 | |
| Tian Ge Interactive Holdings | | | 4,181,000 | | | | 3,297,887 | |
| Weibo ADR* | | | 164,103 | | | | 8,562,895 | |
| Yirendai ADR* | | | 43,245 | | | | 1,085,017 | |
| YY ADR* | | | 157,534 | | | | 7,263,893 | |
| | | | | | | | 204,486,323 | |
| TOTAL CHINA | | | | | | | 286,763,091 | |
The accompanying notes are an integral part of the financial statements.
Schedule of Investments March 31, 2017
KraneShares CSI China Internet ETF (concluded)
| | | Shares | | | Value | |
| COMMON STOCK (continued) | | | | | | | | |
| HONG KONG — 1.5% | | | | | | | | |
| Information Technology — 1.5% | | | | | | | | |
| NetDragon Websoft Holdings | | | 1,411,252 | | | $ | 4,294,681 | |
| TOTAL COMMON STOCK | | | | | | | | |
| (Cost $276,876,802) | | | | | | | 291,057,772 | |
| TOTAL INVESTMENTS — 99.9% | | | | | | | | |
| (Cost $276,876,802) | | | | | | | 291,057,772 | |
| OTHER ASSETS LESS LIABILITIES — 0.1% | | | | | | | 199,204 | |
| NET ASSETS — 100.0% | | | | | | $ | 291,256,976 | |
| ‡ | Narrow industries are utilized for compliance purposes, whereas broad sectors are utilized for reporting purposes. |
| * | Non-income producing security. |
ADR — American Depositary Receipt
Cl — Class
As of March 31, 2017, all of the Fund’s investments were considered Level 1 of the fair value hierarchy, in accordance with the authoritative guidance under U.S. GAAP.
For the year ended March 31, 2017, there have been no transfers between Level 1 and Level 2 investments.
For the year ended March 31, 2017, there have been no transfers between Level 2 and Level 3 investments.
For the year ended March 31, 2017, there were no Level 3 investments.
The accompanying notes are an integral part of the financial statements.
Schedule of Investments March 31, 2017
KraneShares E Fund China Commercial Paper ETF

| † | Percentages are based on total investments. More narrow industries are utilized for compliance purposes, whereas broad sectors are utilized for reporting purposes. |
| | | Face | | | | |
| | | Amount(A) | | | Value | |
| COMMERCIAL PAPER — 88.2% | | | | | | | | |
| CHINA — 88.2% | | | | | | | | |
| Consumer Staples — 7.3% | | | | | | | | |
| COFCO Group | | | | | | | | |
| 2.650%, 06/09/2017 | | | 5,000,000 | | | $ | 723,607 | |
| Financials — 19.1% | | | | | | | | |
| Haidian State-owned Assets | | | | | | | | |
| 2.780%, 09/06/2017 | | | 7,000,000 | | | | 1,008,821 | |
| Qinghai State-owned Assets Investment Management Ltd. | | | | | | | | |
| 3.700%, 04/21/2017 | | | 3,000,000 | | | | 435,162 | |
| Shandong State-owned Assets | | | | | | | | |
| 2.780%, 07/15/2017 | | | 3,000,000 | | | | 433,383 | |
| | | | | | | | 1,877,366 | |
| Industrials — 23.5% | | | | | | | | |
| Beijing Capital Airport | | | | | | | | |
| 3.200%, 11/17/2017 | | | 5,000,000 | | | | 720,876 | |
| Capital Airports Holding | | | | | | | | |
| 2.670%, 04/25/2017 | | | 2,000,000 | | | | 289,949 | |
| Jiangsu Communications Holding | | | | | | | | |
| 2.950%, 05/23/2017 | | | 3,000,000 | | | | 434,571 | |
| Shanghai Urban Construction Group | | | | | | | | |
| 2.700%, 05/08/2017 | | | 3,000,000 | | | | 434,593 | |
| Xiamen Iport Group | | | | | | | | |
| 2.770%, 04/10/2017 | | | 3,000,000 | | | | 435,207 | |
| | | | | | | | 2,315,196 | |
| Materials — 7.4% | | | | | | | | |
| Aluminum Corporation of China Ltd. | | | | | | | | |
| 4.350%, 08/22/2017 | | | 3,000,000 | | | | 434,595 | |
| Shougang Group | | | | | | | | |
| 4.300%, 11/14/2017 | | | 2,000,000 | | | | 289,426 | |
| | | | | | | | 724,021 | |
| Utilities — 30.9% | | | | | | | | |
| China Guodian | | | | | | | | |
| 3.600%, 08/14/2017 | | | 3,000,000 | | | | 434,617 | |
| Chongqing Water Asset Management Ltd. | | | | | | | | |
| 2.810%, 06/09/2017 | | | 3,000,000 | | | | 434,066 | |
| Dadu River Hydropower Development | | | | | | | | |
| 2.740%, 04/10/2017 | | | 2,000,000 | | | | 290,143 | |
| GD Power Development | | | | | | | | |
| 3.750%, 10/20/2017 | | | 5,000,000 | | | | 723,930 | |
| 3.690%, 09/15/2017 | | | 3,000,000 | | | | 435,053 | |
The accompanying notes are an integral part of the financial statements.
Schedule of Investments March 31, 2017
KraneShares E Fund China Commercial Paper ETF (concluded)
| | | Face | | | | |
| | | Amount(A)/ | | | | |
| | | Shares | | | Value | |
| COMMERCIAL PAPER (continued) | | | | | | | | |
| Utilities (continued) | | | | | | | | |
| State Grid Corporation of China | | | | | | | | |
| 3.510%, 08/30/2017 | | | 2,000,000 | | | $ | 289,579 | |
| State Power Investment | | | | | | | | |
| 4.100%, 10/20/2017 | | | 3,000,000 | | | | 435,062 | |
| | | | | | | | 3,042,450 | |
| TOTAL COMMERCIAL PAPER | | | | | | | | |
| (Cost $8,838,807) | | | | | | | 8,682,640 | |
| | | | | | | | | |
| SHORT-TERM INVESTMENTS(B)(C) — 9.8% | | | | | | | | |
| China Universal Express Income Money Market Fund, 3.518% | | | 363 | | | | 53 | |
| E Fund Money Market Fund, 4.334%* | | | 3,326,733 | | | | 482,743 | |
| Fortune SGAM Xianjin Tianyi Money Market Fund, 3.570% | | | 3,323,099 | | | | 482,225 | |
| Xianjinbao Real-Time Redemption Money Market Fund, 3.518% | | | 3,286 | | | | 476 | |
| TOTAL SHORT-TERM INVESTMENTS | | | | | | | | |
| (Cost $954,948) | | | | | | | 965,497 | |
| TOTAL INVESTMENTS — 98.0% | | | | | | | | |
| (Cost $9,793,755) | | | | | | | 9,648,137 | |
| OTHER ASSETS LESS LIABILITIES — 2.0% | | | | | | | 197,118 | |
| NET ASSETS — 100.0% | | | | | | $ | 9,845,255 | |
| * | Affiliated investment is a Chinese investment company which is managed by E Fund Management (Hong Kong) Co., Limited (the ‘‘Sub-Adviser’’) or an affiliate of the Sub-Adviser or which is distributed by an affiliate of the Fund’s distributor. Transactions with affiliated companies during the year ended March 31, 2017 are as follows: |
| Value | | | | | | | | | Change in | | | | | | Value | | | Balance | | | | |
| of Shares | | | | | | | | | Unrealized | | | | | | of Shares | | | of Shares | | | | |
| Held as of | | | Purchases | | | Proceeds | | | Appreciation | | | Realized | | | Held as of | | | Held as of | | | Dividend | |
| 3/31/16 | | | at Cost | | | from Sales | | | (Depreciation) | | | Gain (Loss) | | | 3/31/17 | | | 3/31/17 | | | Income | |
| E Fund Money Market Fund | | | | | | | | | | | | | | | | | | | | | | | | | |
| $ | 885,214 | | | $ | 1,524,894 | | | $ | (1,916,024 | ) | | $ | (11,084 | ) | | $ | (257 | ) | | $ | 482,743 | | | | 3,326,733 | | | $ | — | |
| (A) | In CNY unless otherwise indicated. |
| (C) | The rate shown is the 7-day effective yield as of March 31, 2017. |
CNY — Chinese Yuan
Ltd. — Limited
As of March 31, 2017, all of the Fund’s investments were considered Level 2 of the fair value hierarchy, in accordance with the authoritative guidance under U.S. GAAP.
For the year ended March 31, 2017, there have been no transfers between Level 1 and Level 2 investments.
For the year ended March 31, 2017, there have been no transfers between Level 2 and Level 3 investments.
For the year ended March 31, 2017, there were no Level 3 investments.
The accompanying notes are an integral part of the financial statements.
Schedule of Investments March 31, 2017
KraneShares FTSE Emerging Markets Plus ETF
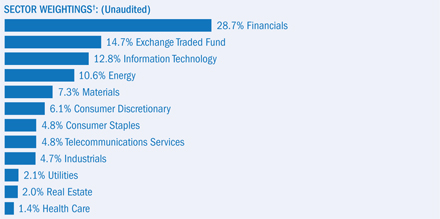
| † | Percentages are based on total investments. More narrow industries are utilized for compliance purposes, whereas broad sectors are utilized for reporting purposes. |
| | | Shares | | | Value | |
| COMMON STOCK — 80.7%‡ | | | | | | | | |
| BRAZIL — 4.6% | | | | | | | | |
| Consumer Discretionary — 0.4% | | | | | | | | |
| Lojas Renner | | | 1,100 | | | $ | 9,632 | |
| Consumer Staples — 1.2% | | | | | | | | |
| Ambev | | | 2,850 | | | | 16,319 | |
| BRF | | | 900 | | | | 10,945 | |
| | | | | | | | 27,264 | |
| Energy — 0.7% | | | | | | | | |
| Petroleo Brasileiro* | | | 1,298 | | | | 6,230 | |
| Ultrapar Participacoes | | | 427 | | | | 9,616 | |
| | | | | | | | 15,846 | |
| Financials — 0.9% | | | | | | | | |
| BB Seguridade Participacoes | | | 910 | | | | 8,404 | |
| BM&FBovespa - Bolsa de Valores Mercadorias e Futuros | | | 1,720 | | | | 10,450 | |
| | | | | | | | 18,854 | |
| Information Technology — 0.3% | | | | | | | | |
| Cielo | | | 676 | | | | 6,043 | |
| Materials — 0.8% | | | | | | | | |
| Vale | | | 2,000 | | | | 18,860 | |
| Telecommunication Services — 0.3% | | | | | | | | |
| TIM Participacoes | | | 2,193 | | | | 6,935 | |
| TOTAL BRAZIL | | | | | | | 103,434 | |
| | | | | | | | | |
| CHILE — 1.1% | | | | | | | | |
| Energy — 0.2% | | | | | | | | |
| Empresas COPEC | | | 456 | | | | 4,940 | |
| Financials — 0.2% | | | | | | | | |
| Banco Santander Chile | | | 56,610 | | | | 3,537 | |
| Utilities — 0.7% | | | | | | | | |
| Enel Americas | | | 45,128 | | | | 9,343 | |
| Enel Generacion Chile | | | 9,353 | | | | 7,014 | |
| | | | | | | | 16,357 | |
| TOTAL CHILE | | | | | | | 24,834 | |
The accompanying notes are an integral part of the financial statements.
Schedule of Investments March 31, 2017
KraneShares FTSE Emerging Markets Plus ETF (continued)
| | | Shares | | | Value | |
| COMMON STOCK (continued) | | | | | | | | |
| CHINA — 21.8% | | | | | | | | |
| Consumer Discretionary — 1.3% | | | | | | | | |
| BYD, Cl H | | | 3,475 | | | $ | 19,272 | |
| Ctrip.com International ADR* | | | 188 | | | | 9,240 | |
| Shanghai Jinjiang International Hotels Development | | | 200 | | | | 438 | |
| | | | | | | | 28,950 | |
| Consumer Staples — 0.2% | | | | | | | | |
| Hengan International Group | | | 560 | | | | 4,165 | |
| Energy — 2.0% | | | | | | | | |
| China Petroleum & Chemical, Cl H | | | 16,500 | | | | 13,376 | |
| China Shenhua Energy, Cl H | | | 4,701 | | | | 10,913 | |
| CNOOC | | | 9,826 | | | | 11,733 | |
| PetroChina, Cl H | | | 11,984 | | | | 8,774 | |
| | | | | | | | 44,796 | |
| Financials — 6.5% | | | | | | | | |
| Agricultural Bank of China, Cl H | | | 26,397 | | | | 12,160 | |
| Bank of China, Cl H | | | 48,396 | | | | 24,038 | |
| China CITIC Bank, Cl H | | | 21,858 | | | | 14,485 | |
| China Construction Bank, Cl H | | | 57,296 | | | | 46,078 | |
| China Life Insurance, Cl H | | | 7,483 | | | | 22,965 | |
| New China Life Insurance, Cl H | | | 1,445 | | | | 6,880 | |
| PICC Property & Casualty, Cl H | | | 2,340 | | | | 3,607 | |
| Ping An Insurance Group of China, Cl H | | | 3,000 | | | | 16,792 | |
| | | | | | | | 147,005 | |
| Health Care — 0.3% | | | | | | | | |
| China Medical System Holdings | | | 3,340 | | | | 5,922 | |
| Industrials — 1.6% | | | | | | | | |
| Anhui Expressway, Cl H | | | 15,512 | | | | 12,275 | |
| China Communications Construction, Cl H | | | 14,690 | | | | 20,717 | |
| CITIC | | | 3,780 | | | | 5,389 | |
| | | | | | | | 38,381 | |
| Information Technology — 7.4% | | | | | | | | |
| Alibaba Group Holding ADR* | | | 378 | | | | 40,760 | |
| Baidu ADR* | | | 173 | | | | 29,846 | |
| Hanergy Thin Film Power Group*(A)(B) | | | 4,364 | | | | 6 | |
| NetEase ADR | | | 78 | | | | 22,152 | |
| Tencent Holdings | | | 2,558 | | | | 73,335 | |
| | | | | | | | 166,099 | |
| Real Estate — 0.6% | | | | | | | | |
| China Overseas Land & Investment | | | 2,839 | | | | 8,110 | |
| China Resources Land | | | 2,214 | | | | 5,983 | |
| | | | | | | | 14,093 | |
| Telecommunication Services — 1.4% | | | | | | | | |
| China Mobile | | | 2,972 | | | | 32,525 | |
| Utilities — 0.5% | | | | | | | | |
| ENN Energy Holdings | | | 882 | | | | 4,965 | |
| Huaneng Power International, Cl H | | | 9,077 | | | | 6,062 | |
| | | | | | | | 11,027 | |
| TOTAL CHINA | | | | | | | 492,963 | |
The accompanying notes are an integral part of the financial statements.
Schedule of Investments March 31, 2017
KraneShares FTSE Emerging Markets Plus ETF (continued)
| | | Shares | | | Value | |
| COMMON STOCK (continued) | | | | | | | | |
| COLOMBIA — 1.3% | | | | | | | | |
| Energy — 0.3% | | | | | | | | |
| Ecopetrol | | | 14,710 | | | $ | 6,862 | |
| Financials — 0.5% | | | | | | | | |
| Bancolombia | | | 507 | | | | 4,601 | |
| Financiera Colombiana | | | 195 | | | | 1,894 | |
| Grupo de Inversiones Suramericana | | | 377 | | | | 5,091 | |
| | | | | | | | 11,586 | |
| Materials — 0.5% | | | | | | | | |
| Cementos Argos | | | 1,089 | | | | 4,441 | |
| Grupo Argos | | | 940 | | | | 6,574 | |
| | | | | | | | 11,015 | |
| TOTAL COLOMBIA | | | | | | | 29,463 | |
| | | | | | | | | |
| CZECH REPUBLIC — 0.6% | | | | | | | | |
| Financials — 0.2% | | | | | | | | |
| Komercni banka as | | | 130 | | | | 4,837 | |
| Utilities — 0.4% | | | | | | | | |
| CEZ | | | 461 | | | | 7,955 | |
| TOTAL CZECH REPUBLIC | | | | | | | 12,792 | |
| | | | | | | | | |
| EGYPT — 2.0% | | | | | | | | |
| Financials — 1.2% | | | | | | | | |
| Commercial International Bank Egypt SAE | | | 4,326 | | | | 18,102 | |
| Egyptian Financial Group-Hermes Holding* | | | 6,108 | | | | 8,825 | |
| | | | | | | | 26,927 | |
| Industrials — 0.2% | | | | | | | | |
| ElSewedy Electric | | | 1,111 | | | | 5,285 | |
| Real Estate — 0.3% | | | | | | | | |
| Talaat Moustafa Group | | | 11,045 | | | | 5,618 | |
| Telecommunication Services — 0.3% | | | | | | | | |
| Global Telecom Holding SAE* | | | 19,879 | | | | 7,478 | |
| TOTAL EGYPT | | | | | | | 45,308 | |
| | | | | | | | | |
| HONG KONG — 1.1% | | | | | | | | |
| Consumer Discretionary — 0.2% | | | | | | | | |
| Haier Electronics Group | | | 2,056 | | | | 4,709 | |
| Consumer Staples — 0.0% | | | | | | | | |
| Qinqin Foodstuffs Group Cayman* | | | 112 | | | | 38 | |
| Financials — 0.9% | | | | | | | | |
| China Cinda Asset Management, Cl H | | | 13,504 | | | | 5,248 | |
| Industrial & Commercial Bank of China, Cl H | | | 19,441 | | | | 12,708 | |
| People’s Insurance Group of China, Cl H | | | 6,452 | | | | 2,673 | |
| | | | | | | | 20,629 | |
| TOTAL HONG KONG | | | | | | | 25,376 | |
| | | | | | | | | |
| HUNGARY — 0.3% | | | | | | | | |
| Financials — 0.3% | | | | | | | | |
| OTP Bank | | | 210 | | | | 5,886 | |
| TOTAL HUNGARY | | | | | | | 5,886 | |
The accompanying notes are an integral part of the financial statements.
Schedule of Investments March 31, 2017
KraneShares FTSE Emerging Markets Plus ETF (continued)
| | | Shares | | | Value | |
| COMMON STOCK (continued) | | | | | | | | |
| INDIA — 15.0% | | | | | | | | |
| Consumer Discretionary — 1.4% | | | | | | | | |
| Tata Motors ADR | | | 900 | | | $ | 32,085 | |
| Financials — 7.5% | | | | | | | | |
| HDFC Bank ADR | | | 1,500 | | | | 112,830 | |
| ICICI Bank ADR | | | 6,517 | | | | 56,046 | |
| | | | | | | | 168,876 | |
| Health Care — 0.9% | | | | | | | | |
| Dr Reddy’s Laboratories ADR | | | 512 | | | | 20,557 | |
| Information Technology — 3.7% | | | | | | | | |
| Infosys ADR | | | 4,045 | | | | 63,911 | |
| Wipro ADR | | | 1,962 | | | | 20,071 | |
| | | | | | | | 83,982 | |
| Materials — 1.5% | | | | | | | | |
| Vedanta ADR | | | 1,908 | | | | 32,761 | |
| TOTAL INDIA | | | | | | | 338,261 | |
| | | | | | | | | |
| INDONESIA — 6.3% | | | | | | | | |
| Consumer Discretionary — 1.1% | | | | | | | | |
| Astra International | | | 38,102 | | | | 24,662 | |
| Consumer Staples — 0.7% | | | | | | | | |
| Indofood Sukses Makmur | | | 12,428 | | | | 7,461 | |
| Unilever Indonesia | | | 2,784 | | | | 9,052 | |
| | | | | | | | 16,513 | |
| Financials — 2.6% | | | | | | | | |
| Bank Central Asia | | | 12,820 | | | | 15,922 | |
| Bank Mandiri Persero | | | 12,722 | | | | 11,170 | |
| Bank Negara Indonesia Persero | | | 20,176 | | | | 9,804 | |
| Bank Rakyat Indonesia Persero | | | 20,841 | | | | 20,293 | |
| | | | | | | | 57,189 | |
| Industrials — 0.6% | | | | | | | | |
| United Tractors | | | 7,104 | | | | 14,127 | |
| Materials — 0.4% | | | | | | | | |
| Semen Indonesia Persero | | | 12,163 | | | | 8,215 | |
| Telecommunication Services — 0.9% | | | | | | | | |
| Telekomunikasi Indonesia Persero | | | 67,448 | | | | 20,904 | |
| TOTAL INDONESIA | | | | | | | 141,610 | |
| | | | | | | | | |
| MALAYSIA — 1.4% | | | | | | | | |
| Consumer Discretionary — 0.1% | | | | | | | | |
| Genting | | | 1,603 | | | | 3,474 | |
| Industrials — 0.4% | | | | | | | | |
| Gamuda | | | 7,674 | | | | 8,982 | |
| Materials — 0.4% | | | | | | | | |
| Petronas Chemicals Group | | | 4,820 | | | | 8,386 | |
| Utilities — 0.5% | | | | | | | | |
| Petronas Gas | | | 1,305 | | | | 5,827 | |
| Tenaga Nasional | | | 1,817 | | | | 5,633 | |
| | | | | | | | 11,460 | |
| TOTAL MALAYSIA | | | | | | | 32,302 | |
The accompanying notes are an integral part of the financial statements.
Schedule of Investments March 31, 2017
KraneShares FTSE Emerging Markets Plus ETF (continued)
| | | Shares | | | Value | |
| COMMON STOCK (continued) | | | | | | | | |
| MEXICO — 4.5% | | | | | | | | |
| Consumer Discretionary — 0.4% | | | | | | | | |
| Grupo Televisa | | | 1,774 | | | $ | 9,136 | |
| Consumer Staples — 1.0% | | | | | | | | |
| Fomento Economico Mexicano | | | 1,336 | | | | 11,792 | |
| Grupo Bimbo, Ser A | | | 1,430 | | | | 3,534 | |
| Wal-Mart de Mexico | | | 3,372 | | | | 7,734 | |
| | | | | | | | 23,060 | |
| Financials — 0.7% | | | | | | | | |
| Gentera | | | 4,178 | | | | 6,859 | |
| Grupo Financiero Banorte, Cl O | | | 1,536 | | | | 8,787 | |
| | | | | | | | 15,646 | |
| Industrials — 0.5% | | | | | | | | |
| Grupo Aeroportuario del Sureste, Cl B | | | 374 | | | | 6,441 | |
| Promotora y Operadora de Infraestructura | | | 412 | | | | 4,422 | |
| | | | | | | | 10,863 | |
| Materials — 1.0% | | | | | | | | |
| Cemex* | | | 12,141 | | | | 10,933 | |
| Grupo Mexico | | | 3,992 | | | | 11,906 | |
| | | | | | | | 22,839 | |
| Real Estate — 0.3% | | | | | | | | |
| Fibra Uno Administracion† | | | 3,433 | | | | 5,835 | |
| Telecommunication Services — 0.6% | | | | | | | | |
| America Movil | | | 19,782 | | | | 13,959 | |
| TOTAL MEXICO | | | | | | | 101,338 | |
| | | | | | | | | |
| PAKISTAN — 1.7% | | | | | | | | |
| Energy — 1.2% | | | | | | | | |
| Oil & Gas Development | | | 10,465 | | | | 14,805 | |
| Pakistan Petroleum | | | 7,376 | | | | 10,900 | |
| | | | | | | | 25,705 | |
| Materials — 0.5% | | | | | | | | |
| Fauji Fertilizer | | | 11,972 | | | | 11,832 | |
| TOTAL PAKISTAN | | | | | | | 37,537 | |
| | | | | | | | | |
| PERU — 1.0% | | | | | | | | |
| Financials — 0.7% | | | | | | | | |
| Credicorp | | | 105 | | | | 17,147 | |
| Materials — 0.3% | | | | | | | | |
| Cia de Minas Buenaventura ADR | | | 502 | | | | 6,044 | |
| TOTAL PERU | | | | | | | 23,191 | |
| | | | | | | | | |
| PHILIPPINES — 1.4% | | | | | | | | |
| Consumer Staples — 0.2% | | | | | | | | |
| Universal Robina | | | 1,150 | | | | 3,747 | |
| Financials — 0.2% | | | | | | | | |
| Ayala | | | 315 | | | | 5,305 | |
| Industrials — 0.6% | | | | | | | | |
| International Container Terminal Services | | | 3,777 | | | | 6,767 | |
| SM Investments | | | 510 | | | | 7,085 | |
| | | | | | | | 13,852 | |
| Real Estate — 0.3% | | | | | | | | |
| Ayala Land | | | 9,000 | | | | 5,928 | |
The accompanying notes are an integral part of the financial statements.
Schedule of Investments March 31, 2017
KraneShares FTSE Emerging Markets Plus ETF (continued)
| | | Shares | | | Value | |
| COMMON STOCK (continued) | | | | | | | | |
| Telecommunication Services — 0.1% | | | | | | | | |
| Globe Telecom | | | 80 | | | $ | 3,240 | |
| TOTAL PHILIPPINES | | | | | | | 32,072 | |
| | | | | | | | | |
| POLAND — 1.4% | | | | | | | | |
| Energy — 0.5% | | | | | | | | |
| Polski Koncern Naftowy ORLEN | | | 466 | | | | 11,762 | |
| Financials — 0.9% | | | | | | | | |
| Bank Pekao | | | 130 | | | | 4,335 | |
| Powszechna Kasa Oszczednosci Bank Polski | | | 698 | | | | 5,648 | |
| Powszechny Zaklad Ubezpieczen | | | 1,098 | | | | 9,644 | |
| | | | | | | | 19,627 | |
| TOTAL POLAND | | | | | | | 31,389 | |
| | | | | | | | | |
| RUSSIA — 6.2% | | | | | | | | |
| Consumer Staples — 0.8% | | | | | | | | |
| Magnit GDR | | | 463 | | | | 17,687 | |
| Energy — 3.4% | | | | | | | | |
| Gazprom | | | 9,824 | | | | 22,301 | |
| Lukoil | | | 569 | | | | 30,105 | |
| Novatek OAO | | | 130 | | | | 1,627 | |
| Rosneft | | | 1,064 | | | | 6,109 | |
| Tatneft* | | | 2,482 | | | | 15,315 | |
| | | | | | | | 75,457 | |
| Financials — 1.4% | | | | | | | | |
| Sberbank of Russia | | | 9,698 | | | | 27,506 | |
| VTB Bank | | | 4,583,252 | | | | 5,389 | |
| | | | | | | | 32,895 | |
| Materials — 0.6% | | | | | | | | |
| MMC Norilsk Nickel* | | | 88 | | | | 13,946 | |
| TOTAL RUSSIA | | | | | | | 139,985 | |
| | | | | | | | | |
| SOUTH AFRICA — 1.4% | | | | | | | | |
| Consumer Discretionary — 0.7% | | | | | | | | |
| Naspers, Cl N | | | 77 | | | | 13,294 | |
| Steinhoff International Holdings | | | 506 | | | | 2,421 | |
| | | | | | | | 15,715 | |
| Financials — 0.4% | | | | | | | | |
| Remgro | | | 634 | | | | 9,744 | |
| Information Technology — 0.3% | | | | | | | | |
| Sasol | | | 244 | | | | 7,108 | |
| TOTAL SOUTH AFRICA | | | | | | | 32,567 | |
| | | | | | | | | |
| TAIWAN — 2.4% | | | | | | | | |
| Energy — 0.2% | | | | | | | | |
| Formosa Petrochemical | | | 1,447 | | | | 5,055 | |
| Information Technology — 0.9% | | | | | | | | |
| Taiwan Semiconductor Manufacturing | | | 3,163 | | | | 19,702 | |
The accompanying notes are an integral part of the financial statements.
Schedule of Investments March 31, 2017
KraneShares FTSE Emerging Markets Plus ETF (continued)
| | | Shares | | | Value | |
| COMMON STOCK (continued) | | | | | | | | |
| Materials — 1.3% | | | | | | | | |
| Formosa Chemicals & Fibre | | | 2,556 | | | $ | 7,952 | |
| Formosa Plastics | | | 3,312 | | | | 9,879 | |
| Nan Ya Plastics | | | 4,403 | | | | 10,433 | |
| | | | | | | | 28,264 | |
| TOTAL TAIWAN | | | | | | | 53,021 | |
| | | | | | | | | |
| THAILAND — 1.9% | | | | | | | | |
| Consumer Staples — 0.3% | | | | | | | | |
| CP ALL | | | 4,096 | | | | 7,033 | |
| Energy — 0.8% | | | | | | | | |
| PTT | | | 865 | | | | 9,742 | |
| Thai Oil | | | 3,342 | | | | 7,343 | |
| | | | | | | | 17,085 | |
| Health Care — 0.2% | | | | | | | | |
| Bumrungrad Hospital | | | 824 | | | | 4,388 | |
| Industrials — 0.2% | | | | | | | | |
| Airports of Thailand | | | 4,700 | | | | 5,368 | |
| Telecommunication Services — 0.4% | | | | | | | | |
| Advanced Info Service | | | 1,805 | | | | 9,350 | |
| TOTAL THAILAND | | | | | | | 43,224 | |
| | | | | | | | | |
| TURKEY — 2.6% | | | | | | | | |
| Consumer Discretionary — 0.3% | | | | | | | | |
| Arcelik | | | 986 | | | | 6,135 | |
| Consumer Staples — 0.3% | | | | | | | | |
| BIM Birlesik Magazalar | | | 496 | | | | 7,614 | |
| Energy — 0.6% | | | | | | | | |
| Tupras Turkiye Petrol Rafinerileri | | | 505 | | | | 12,508 | |
| Financials — 0.7% | | | | | | | | |
| Akbank | | | 2,892 | | | | 6,774 | |
| Turkiye Garanti Bankasi | | | 3,481 | | | | 8,469 | |
| | | | | | | | 15,243 | |
| Industrials — 0.4% | | | | | | | | |
| KOC Holding | | | 2,195 | | | | 9,252 | |
| Telecommunication Services — 0.3% | | | | | | | | |
| Turkcell Iletisim Hizmetleri | | | 2,250 | | | | 7,396 | |
| TOTAL TURKEY | | | | | | | 58,148 | |
| | | | | | | | | |
| UNITED ARAB EMIRATES — 0.7% | | | | | | | | |
| Financials — 0.2% | | | | | | | | |
| Abu Dhabi Commercial Bank | | | 1,164 | | | | 2,155 | |
| First Gulf Bank | | | 534 | | | | 1,875 | |
| | | | | | | | 4,030 | |
| Real Estate — 0.5% | | | | | | | | |
| Emaar Properties | | | 5,130 | | | | 10,196 | |
| Telecommunication Services — 0.0% | | | | | | | | |
| Emirates Telecommunications Group | | | 186 | | | | 914 | |
| TOTAL UNITED ARAB EMIRATES | | | | | | | 15,140 | |
| TOTAL COMMON STOCK | | | | | | | | |
| (Cost $1,773,686) | | | | | | | 1,819,841 | |
The accompanying notes are an integral part of the financial statements.
Schedule of Investments March 31, 2017
KraneShares FTSE Emerging Markets Plus ETF (continued)
| | | Shares | | | Value | |
| OTHER INVESTMENT COMPANY — 14.4% | | | | | | | | |
| KraneShares Bosera MSCI China A Share ETF** | | | 11,342 | | | $ | 325,969 | |
| TOTAL OTHER INVESTMENT COMPANY | | | | | | | | |
| (Cost $426,974) | | | | | | | 325,969 | |
| | | | | | | | | |
| PREFERRED STOCK(C) — 3.0% | | | | | | | | |
| BRAZIL — 3.0% | | | | | | | | |
| Energy — 0.6% | | | | | | | | |
| Petroleo Brasileiro* | | | 3,200 | | | | 14,685 | |
| Financials — 2.1% | | | | | | | | |
| Banco Bradesco | | | 1,584 | | | | 16,105 | |
| Itau Unibanco Holding | | | 1,672 | | | | 20,011 | |
| Itausa - Investimentos Itau | | | 3,391 | | | | 10,200 | |
| | | | | | | | 46,316 | |
| Telecommunication Services — 0.3% | | | | | | | | |
| Telefonica Brasil | | | 500 | | | | 7,332 | |
| TOTAL PREFERRED STOCK | | | | | | | | |
| (Cost $58,952) | | | | | | | 68,333 | |
| TOTAL INVESTMENTS — 98.1% | | | | | | | | |
| (Cost $2,259,612) | | | | | | | 2,214,143 | |
| OTHER ASSETS LESS LIABILITIES — 1.9% | | | | | | | 42,183 | |
| NET ASSETS — 100.0% | | | | | | $ | 2,256,326 | |
| ** | Affiliated investment is a registered investment company which is managed by Krane Funds Advisors, LLC (the ‘‘Adviser’’). Transactions with affiliated companies during the year ended March 31, 2017 are as follows: |
| Value | | | | | | | | | Change in | | | | | | Value of | | | Balance | | | | |
| of Shares | | | | | | | | | Unrealized | | | | | | Shares | | | of Shares | | | | |
| Held as of | | | Purchases | | | Proceeds | | | Appreciation | | | Realized | | | Held as of | | | Held as of | | | Dividend | |
| 3/31/16 | | | at Cost | | | from Sales | | | (Depreciation) | | | Gain (Loss) | | | 3/31/17 | | | 3/31/17 | | | Income | |
| KraneShares Bosera MSCI China A Share ETF | | | | | | | | | | | | | | | | | |
| $ | 355,203 | | | $ | 91,379 | | | $ | (101,106 | ) | | $ | 46,702 | | | $ | (66,209 | ) | | $ | 325,969 | | | | 11,342 | | | $ | 5,682 | |
| ‡ | Narrow industries are utilized for compliance purposes, whereas broad sectors are utilized for reporting purposes. |
| * | Non-income producing security. |
| † | Real Estate Investment Trust |
| (A) | Security is fair valued using methods determined in good faith by the Fair Value Committee of the Board of Trustees. The total value of such securities as of March 31, 2017 was $6 and represents 0.0% of Net Assets. |
| (B) | Security considered illiquid. The total value of such securities as of March 31, 2017 was $6 and represents 0.0% of Net Assets. |
| (C) | Rates not available for international preferred securities. |
ADR — American Depositary Receipt
Cl — Class
ETF — Exchange Traded Fund
GDR — Global Depositary Receipt
MSCI — Morgan Stanley Capital International
Ser — Series
The accompanying notes are an integral part of the financial statements.
Schedule of Investments March 31, 2017
KraneShares FTSE Emerging Markets Plus ETF (concluded)
The following is a list of the inputs used, as of March 31, 2017, in valuing the Fund’s investments carried at value:
| | | Level 1 | | | Level 2 | | | Level 3^ | | | Total | |
| Investments in Securities | | | | | | | | | | | | | | | | |
| Common Stock | | | | | | | | | | | | | | | | |
| Brazil | | $ | 103,434 | | | $ | — | | | $ | — | | | $ | 103,434 | |
| Chile | | | 24,834 | | | | — | | | | — | | | | 24,834 | |
| China | | | | | | | | | | | | | | | | |
| Consumer Discretionary | | | 28,950 | | | | — | | | | — | | | | 28,950 | |
| Consumer Staples | | | 4,165 | | | | — | | | | — | | | | 4,165 | |
| Energy | | | 44,796 | | | | — | | | | — | | | | 44,796 | |
| Financials | | | 147,005 | | | | — | | | | — | | | | 147,005 | |
| Health Care | | | 5,922 | | | | — | | | | — | | | | 5,922 | |
| Industrials | | | 38,381 | | | | — | | | | — | | | | 38,381 | |
| Information Technology | | | 166,093 | | | | — | | | | 6 | | | | 166,099 | |
| Real Estate | | | 14,093 | | | | — | | | | — | | | | 14,093 | |
| Telecommunication Services | | | 32,525 | | | | — | | | | — | | | | 32,525 | |
| Utilities | | | 11,027 | | | | — | | | | — | | | | 11,027 | |
| Colombia | | | 29,463 | | | | — | | | | — | | | | 29,463 | |
| Czech Republic | | | 12,792 | | | | — | | | | — | | | | 12,792 | |
| Egypt | | | 45,308 | | | | — | | | | — | | | | 45,308 | |
| Hong Kong | | | 25,376 | | | | — | | | | — | | | | 25,376 | |
| Hungary | | | 5,886 | | | | — | | | | — | | | | 5,886 | |
| India | | | 338,261 | | | | — | | | | — | | | | 338,261 | |
| Indonesia | | | 141,610 | | | | — | | | | — | | | | 141,610 | |
| Malaysia | | | 32,302 | | | | — | | | | — | | | | 32,302 | |
| Mexico | | | 101,338 | | | | — | | | | — | | | | 101,338 | |
| Pakistan | | | 37,537 | | | | — | | | | — | | | | 37,537 | |
| Peru | | | 23,191 | | | | — | | | | — | | | | 23,191 | |
| Philippines | | | 32,072 | | | | — | | | | — | | | | 32,072 | |
| Poland | | | 31,389 | | | | — | | | | — | | | | 31,389 | |
| Russia | | | 139,985 | | | | — | | | | — | | | | 139,985 | |
| South Africa | | | 32,567 | | | | — | | | | — | | | | 32,567 | |
| Taiwan | | | 53,021 | | | | — | | | | — | | | | 53,021 | |
| Thailand | | | 43,224 | | | | — | | | | — | | | | 43,224 | |
| Turkey | | | 58,148 | | | | — | | | | — | | | | 58,148 | |
| United Arab Emirates | | | 15,140 | | | | — | | | | — | | | | 15,140 | |
| Total Common Stock | | | 1,819,835 | | | | — | | | | 6 | | | | 1,819,841 | |
| Other Investment Company | | | 325,969 | | | | — | | | | — | | | | 325,969 | |
| Preferred Stock | | | 68,333 | | | | — | | | | — | | | | 68,333 | |
| Total Investments in Securities | | $ | 2,214,137 | | | $ | — | | | $ | 6 | | | $ | 2,214,143 | |
| ^ | A reconciliation of Level 3 investments, including certain disclosures related to significant inputs used in valuing Level 3 investments is only presented when the Fund has over 1% of Level 3 investments at the beginning and/or end of the period in relation to net assets. |
For the year ended March 31, 2017, there have been no transfers between Level 1 and Level 2 investments.
For the year ended March 31, 2017, there have been no transfers between Level 2 and Level 3 investments.
For the year ended March 31, 2017, there have been no transfers between Level 1 and Level 3 investments. Transfers between levels are recognized at period end.
Amounts designated as ‘‘—’’ are $0 or have been rounded to $0.
The accompanying notes are an integral part of the financial statements.
Statements of Assets and Liabilities
March 31, 2017
| | | KraneShares | | | KraneShares | | | KraneShares | |
| | | Bosera MSCI | | | Zacks New | | | CSI China | |
| | | China A Share | | | China | | | Internet | |
| | | ETF | | | ETF | | | ETF | |
| Assets: | | | | | | | | | | | | |
| Investments at Value | | $ | 52,191,332 | | | $ | 3,398,311 | | | $ | 291,057,772 | |
| Foreign Currency at Value | | | 1,032,130 | | | | — | | | | — | |
| Cash and Cash Equivalents | | | 173,170 | | | | 9,280 | | | | 353,859 | |
| Prepaid Expenses | | | 1,790 | | | | — | | | | — | |
| Interest Receivable | | | 4 | | | | — | | | | — | |
| Total Assets | | | 53,398,426 | | | | 3,407,591 | | | | 291,411,631 | |
| | | | | | | | | | | | | |
| Liabilities: | | | | | | | | | | | | |
| Payable to Custodian | | | 851,442 | | | | — | | | | — | |
| Payable for Foreign Capital Gains Tax | | | 34,549 | | | | — | | | | — | |
| Payable for Management Fees | | | 18,650 | | | | 1,924 | | | | 154,655 | |
| Total Liabilities | | | 904,641 | | | | 1,924 | | | | 154,655 | |
| Net Assets | | $ | 52,493,785 | | | $ | 3,405,667 | | | $ | 291,256,976 | |
| | | | | | | | | | | | | |
| Net Assets Consist of: | | | | | | | | | | | | |
| Paid-in Capital | | $ | 53,727,109 | | | $ | 2,655,744 | | | $ | 295,539,650 | |
| Distributions in Excess of Net Investment Income | | | (142,152 | ) | | | (17,940 | ) | | | (2,689,036 | ) |
| Accumulated Net Realized Loss on Investments and Foreign Currency Translations | | | (933,980 | ) | | | (2,160 | ) | | | (15,774,608 | ) |
| Net Unrealized Appreciation (Depreciation) on Investments | | | (157,192 | ) | | | 770,023 | | | | 14,180,970 | |
| Net Assets | | $ | 52,493,785 | | | $ | 3,405,667 | | | $ | 291,256,976 | |
| | | | | | | | | | | | | |
| Outstanding Shares of Beneficial Interest (unlimited authorization - no par value) | | | 1,850,000 | | | | 100,000 | # | | | 6,900,000 | |
| Net Asset Value, Offering and Redemption Price Per Share | | $ | 28.38 | | | $ | 34.06 | | | $ | 42.21 | |
| Cost of Investments | | $ | 52,348,524 | | | $ | 2,628,288 | | | $ | 276,876,802 | |
| Cost of Foreign Currency | | | 1,032,130 | | | | — | | | | — | |
| # | After the close of the markets on September 13, 2016, the Fund effected a 2 for 1 share split (see Note 7). |
Amounts designated as ‘‘—’’ are $0 or have been rounded to $0.
The accompanying notes are an integral part of the financial statements.
Statements of Assets and Liabilities (concluded)
March 31, 2017
| | | KraneShares | | | KraneShares | |
| | | E Fund China | | | FTSE Emerging | |
| | | Commercial | | | Markets Plus | |
| | | Paper ETF | | | ETF | |
| Assets: | | | | | | | | |
| Investments at Value | | $ | 9,165,394 | | | $ | 1,888,174 | |
| Affiliated Investments at Value | | | 482,743 | | | | 325,969 | |
| Cash and Cash Equivalents | | | 22,019 | | | | 32,361 | |
| Foreign Currency at Value | | | 1,500 | | | | 695 | |
| Dividend and Interest Receivable | | | 107,410 | | | | 2,532 | |
| Other Receivable | | | 50,500 | | | | — | |
| Prepaid Expenses | | | 20,361 | | | | — | |
| Receivable from Adviser | | | — | | | | 7,853 | |
| Reclaim Receivable | | | — | | | | 162 | |
| Total Assets | | | 9,849,927 | | | | 2,257,746 | |
| | | | | | | | | |
| Liabilities: | | | | | | | | |
| Payable for Investment Securities Purchased | | | — | | | | 106 | |
| Payable for Management Fees | | | 4,672 | | | | 1,287 | |
| Payable for Trustees’ Fee | | | — | | | | 27 | |
| Total Liabilities | | | 4,672 | | | | 1,420 | |
| Net Assets | | $ | 9,845,255 | | | $ | 2,256,326 | |
| | | | | | | | | |
| Net Assets Consist of: | | | | | | | | |
| Paid-in Capital | | $ | 10,530,666 | | | $ | 2,483,561 | |
| Distributions in Excess of Net Investment Income | | | (477,888 | ) | | | (1,289 | ) |
| Accumulated Net Realized Loss on Investments, Affiliated Investments and Foreign Currency Translations | | | (61,042 | ) | | | (180,490 | ) |
| Net Unrealized Depreciation on Investments and Affiliated Investments | | | (145,618 | ) | | | (45,469 | ) |
| Net Unrealized Appreciation (Depreciation) on Foreign Currency Translations | | | (863 | ) | | | 13 | |
| Net Assets | | $ | 9,845,255 | | | $ | 2,256,326 | |
| | | | | | | | | |
| Outstanding Shares of Beneficial Interest (unlimited authorization - no par value) | | | 300,000 | | | | 100,000 | |
| Net Asset Value, Offering and Redemption Price Per Share | | $ | 32.82 | | | $ | 22.56 | |
| Cost of Investments | | $ | 9,318,913 | | | $ | 1,832,638 | |
| Cost of Affiliated Investments | | | 474,842 | | | | 426,974 | |
| Cost of Foreign Currency | | | 1,491 | | | | 695 | |
Amounts designated as ‘‘—’’ are $0 or have been rounded to $0.
The accompanying notes are an integral part of the financial statements.
Statements of Operations
For the Year Ended March 31, 2017
| | | KraneShares | | | KraneShares | | | KraneShares | |
| | | Bosera MSCI | | | Zacks New | | | CSI China | |
| | | China A Share | | | China | | | Internet | |
| | | ETF | | | ETF | | | ETF | |
| Investment Income: | | | | | | | | | | | | |
| Dividend Income | | $ | 136,163 | | | $ | 45,295 | | | $ | 217,377 | |
| Interest Income | | | 2,552 | | | | 64 | | | | 1,163 | |
| Less: Foreign Taxes Withheld | | | (14,282 | ) | | | (3,384 | ) | | | (12,485 | ) |
| Total Investment Income | | | 124,433 | | | | 41,975 | | | | 206,055 | |
| | | | | | | | | | | | | |
| Expenses: | | | | | | | | | | | | |
| Management Fees | | | 142,147 | (2) | | | 20,445 | | | | 1,422,676 | |
| Trustees’ Fees | | | 12,071 | | | | 4,969 | | | | 283,178 | |
| Total Expenses | | | 154,218 | | | | 25,414 | | | | 1,705,854 | |
| Management Fee Waiver | | | (22,096 | )(2) | | | – | | | | – | |
| Net Expenses | | | 132,122 | | | | 25,414 | | | | 1,705,854 | |
| Net Investment Income (Loss) | | | (7,689 | ) | | | 16,561 | | | | (1,499,799 | ) |
| | | | | | | | | | | | | |
| Net Realized Gain (Loss) on: | | | | | | | | | | | | |
| Investments | | | (774,553 | ) | | | 166,317 | | | | 1,510,387 | (1) |
| Foreign Currency Translations | | | (92,357 | ) | | | 4,135 | | | | (4,345 | ) |
| Net Realized Gain (Loss) on Investments and Foreign Currency Translations | | | (866,910 | ) | | | 170,452 | | | | 1,506,042 | |
| | | | | | | | | | | | | |
| Net Change in Unrealized Appreciation (Depreciation) on: | | | | | | | | | | | | |
| Investments | | | 434,361 | | | | 486,873 | | | | 33,149,251 | |
| Foreign Currency Translations | | | (402 | ) | | | (171 | ) | | | (3 | ) |
| Net Change in Unrealized Appreciation on Investments and Foreign Currency Translations | | | 433,959 | | | | 486,702 | | | | 33,149,248 | |
| Net Realized and Unrealized Gain (Loss) on Investments and Foreign Currency Translations | | | (432,951 | ) | | | 657,154 | | | | 34,655,290 | |
| Net Increase (Decrease) in Net Assets Resulting from Operations | | $ | (440,640 | ) | | $ | 673,715 | | | $ | 33,155,491 | |
| (1) | Includes realized gains (losses) as a result of in-kind redemptions. (See Note 4 in Notes to Financial Statements.) |
| (2) | As of February 17, 2017, pursuant to the terms of an Expense Limitation Agreement, the Adviser has contractually agreed to reduce its management fee to 0.58% of the Fund’s average daily net assets until July 31, 2017. |
Amounts designated as ‘‘—’’ are $0 or have been rounded to $0.
The accompanying notes are an integral part of the financial statements.
Statements of Operations (concluded)
For the Year Ended March 31, 2017
| | | KraneShares | | | | |
| | | E Fund China | | | KraneShares | |
| | | Commercial | | | FTSE Emerging | |
| | | Paper | | | Markets Plus | |
| | | ETF | | | ETF | |
| Investment Income: | | | | | | | | |
| Dividend Income | | $ | — | | | $ | 44,728 | |
| Income Distributions Received from Affiliated Fund | | | — | | | | 5,682 | |
| Interest Income | | | 391,530 | | | | 53 | |
| Less: Foreign Taxes Withheld | | | (3,687 | ) | | | (5,901 | ) |
| Total Investment Income | | | 387,843 | | | | 44,562 | |
| | | | | | | | | |
| Expenses: | | | | | | | | |
| Management Fees | | | 94,526 | | | | 14,670 | |
| Trustees’ Fees | | | 54,095 | | | | 1,085 | |
| Total Expenses | | | 148,621 | | | | 15,755 | |
| Management Fee Waiver | | | (16,681 | ) | | | (7,853 | ) |
| Net Expenses | | | 131,940 | | | | 7,902 | |
| Net Investment Income | | | 255,903 | | | | 36,660 | |
| | | | | | | | | |
| Net Realized Gain (Loss) on: | | | | | | | | |
| Investments | | | (6,847 | ) | | | (132,614 | ) |
| Affiliated Investments | | | (257 | ) | | | (66,209 | ) |
| Capital Gain Distributions Received From Affiliated Fund | | | — | | | | 12,784 | |
| Foreign Currency Translations | | | (949,915 | ) | | | (631 | ) |
| Net Realized Loss on Investments, Affiliated Investments and Foreign Currency Translations | | | (957,019 | ) | | | (186,670 | ) |
| | | | | | | | | |
| Net Change in Unrealized Appreciation (Depreciation) on: | | | | | | | | |
| Investments | | | 14,212 | | | | 329,097 | |
| Affiliated Investments | | | (11,084 | ) | | | 46,702 | |
| Foreign Currency Translations | | | (4,925 | ) | | | 23 | |
| Net Change in Unrealized Appreciation (Depreciation) on Investments, Affiliated Investments and Foreign Currency Translations | | | (1,797 | ) | | | 375,822 | |
| Net Realized and Unrealized Gain (Loss) on Investments, Affiliated Investments and Foreign Currency Translations | | | (958,816 | ) | | | 189,152 | |
| Net Increase (Decrease) in Net Assets Resulting from Operations | | $ | (702,913 | ) | | $ | 225,812 | |
Amounts designated as ‘‘—’’ are $0 or have been rounded to $0.
The accompanying notes are an integral part of the financial statements.
Statements of Changes in Net Assets
| | | KraneShares Bosera | |
| | | MSCI China A Share ETF | |
| | | Year Ended | | | Year Ended | |
| | | March 31, | | | March 31, | |
| | | 2017 | | | 2016 | |
| Operations: | | | | | | | | |
| Net Investment Income (Loss) | | $ | (7,689 | ) | | $ | 186,437 | |
| Net Realized Gain (Loss) on Investments and Foreign Currency Translations | | | (866,910 | ) | | | 1,759,188 | |
| Net Change in Unrealized Appreciation (Depreciation) on Investments and Foreign Currency Translations | | | 433,959 | | | | (6,505,315 | ) |
| Net Decrease in Net Assets Resulting from Operations | | | (440,640 | ) | | | (4,559,690 | ) |
| | | | | | | | | |
| Dividends and Distributions from: | | | | | | | | |
| Net Investment Income | | | — | | | | (82,915 | ) |
| Net Realized Gains | | | (127,486 | ) | | | (2,017,341 | ) |
| Return of Capital | | | (437,353 | ) | | | — | |
| Total Dividends and Distributions | | | (564,839 | ) | | | (2,100,256 | ) |
| | | | | | | | | |
| Capital Share Transactions:(1) | | | | | | | | |
| Issued | | | 58,784,489 | | | | 3,264,139 | |
| Redeemed | | | (9,840,619 | ) | | | (18,822,951 | ) |
| Increase (Decrease) in Net Assets from Capital Share Transactions | | | 48,943,870 | | | | (15,558,812 | ) |
| Total Increase (Decrease) in Net Assets | | | 47,938,391 | | | | (22,218,758 | ) |
| | | | | | | | | |
| Net Assets: | | | | | | | | |
| Beginning of Year | | | 4,555,394 | | | | 26,774,152 | |
| End of Year | | $ | 52,493,785 | | | $ | 4,555,394 | |
| Distributions in Excess of Net Investment Income | | $ | (142,152 | ) | | $ | (60,851 | ) |
| | | | | | | | | |
| Share Transactions: | | | | | | | | |
| Issued | | | 2,050,000 | | | | 50,000 | |
| Redeemed | | | (350,000 | ) | | | (400,002 | ) |
| Net Increase (Decrease) in Shares Outstanding from Share Transactions | | | 1,700,000 | | | | (350,002 | ) |
(1) Includes transaction costs related to creations and redemptions.
Amounts designated as ‘‘—’’ are $0 or have been rounded to $0.
The accompanying notes are an integral part of the financial statements.
Statements of Changes in Net Assets (continued)
| | | KraneShares | |
| | | Zacks New China ETF | |
| | | Year Ended | | | Year Ended | |
| | | March 31, | | | March 31, | |
| | | 2017 | | | 2016 | |
| Operations: | | | | | | | | |
| Net Investment Income | | $ | 16,561 | | | $ | 18,440 | |
| Net Realized Gain (Loss) on Investments and Foreign Currency Translations | | | 170,452 | | | | (1,029 | ) |
| Net Change in Unrealized Appreciation (Depreciation) on Investments and Foreign Currency Translations | | | 486,702 | | | | (504,675 | ) |
| Net Increase (Decrease) in Net Assets Resulting from Operations | | | 673,715 | | | | (487,264 | ) |
| | | | | | | | | |
| Dividends and Distributions from: | | | | | | | | |
| Net Investment Income | | | (32,656 | ) | | | (25,169 | ) |
| Net Realized Gains | | | — | | | | (289,653 | ) |
| Return of Capital | | | (38,008 | ) | | | (788 | ) |
| Total Dividends and Distributions | | | (70,664 | ) | | | (315,610 | ) |
| | | | | | | | | |
| Capital Share Transactions:(1) | | | | | | | | |
| Issued | | | — | | | | 184,546 | |
| Increase in Net Assets from Capital Share Transactions | | | — | | | | 184,546 | |
| Total Increase (Decrease) in Net Assets | | | 603,051 | | | | (618,328 | ) |
| | | | | | | | | |
| Net Assets: | | | | | | | | |
| Beginning of Year | | | 2,802,616 | | | | 3,420,944 | |
| End of Year | | $ | 3,405,667 | | | $ | 2,802,616 | |
| Distributions in Excess of Net Investment Income | | $ | (17,940 | ) | | $ | (7,614 | ) |
| | | | | | | | | |
| Share Transactions: | | | | | | | | |
| Issued | | | — | # | | | — | |
| Net Increase in Shares Outstanding from Share Transactions | | | — | | | | — | |
| (1) | Includes transaction costs related to creations and redemptions. |
| # | After the close of the markets on September 13, 2016, the Fund effected a 2 for 1 share split (see Note 7). |
Amounts designated as ‘‘—’’ are $0 or have been rounded to $0.
The accompanying notes are an integral part of the financial statements.
Statements of Changes in Net Assets (continued)
| | | KraneShares | |
| | | CSI China Internet ETF | |
| | | Year Ended | | | Year Ended | |
| | | March 31, | | | March 31, | |
| | | 2017 | | | 2016 | |
| Operations: | | | | | | | | |
| Net Investment Loss | | $ | (1,499,799 | ) | | $ | (741,539 | ) |
| Net Realized Gain on Investments and Foreign Currency Translations | | | 1,506,042 | | | | 19,253,499 | |
| Net Change in Unrealized Appreciation (Depreciation) on Investments and Foreign Currency Translations | | | 33,149,248 | | | | (4,193,530 | ) |
| Net Increase in Net Assets Resulting from Operations | | | 33,155,491 | | | | 14,318,430 | |
| | | | | | | | | |
| Dividends and Distributions from: | | | | | | | | |
| Net Investment Income | | | (1,721,413 | ) | | | (240,264 | ) |
| Return of Capital | | | (656,632 | ) | | | (18,722 | ) |
| Total Dividends and Distributions | | | (2,378,045 | ) | | | (258,986 | ) |
| | | | | | | | | |
| Capital Share Transactions:(1) | | | | | | | | |
| Issued | | | 235,861,086 | | | | 327,489,029 | |
| Redeemed | | | (170,250,484 | ) | | | (278,291,404 | ) |
| Increase in Net Assets from Capital Share Transactions | | | 65,610,602 | | | | 49,197,625 | |
| Total Increase in Net Assets | | | 96,388,048 | | | | 63,257,069 | |
| | | | | | | | | |
| Net Assets: | | | | | | | | |
| Beginning of Year | | | 194,868,928 | | | | 131,611,859 | |
| End of Year | | $ | 291,256,976 | | | $ | 194,868,928 | |
| Distributions in Excess of Net Investment Income | | $ | (2,689,036 | ) | | $ | (821,359 | ) |
| | | | | | | | | |
| Share Transactions: | | | | | | | | |
| Issued | | | 6,300,000 | | | | 9,150,000 | |
| Redeemed | | | (4,850,000 | ) | | | (7,550,000 | ) |
| Net Increase in Shares Outstanding from Share Transactions | | | 1,450,000 | | | | 1,600,000 | |
| (1) | Includes transaction costs related to creations and redemptions. |
The accompanying notes are an integral part of the financial statements.
Statements of Changes in Net Assets (continued)
| | | KraneShares E Fund | |
| | | China Commercial Paper ETF | |
| | | Year Ended | | | Year Ended | |
| | | March 31, | | | March 31, | |
| | | 2017 | | | 2016 | |
| Operations: | | | | | | | | |
| Net Investment Income | | $ | 255,903 | | | $ | 1,127,869 | |
| Net Realized Loss on Investments, Affiliated Investments and Foreign Currency Translations | | | (957,019 | ) | | | (2,343,319 | ) |
| Net Change in Unrealized Appreciation (Depreciation) on Investments, Affiliated Investments and Foreign Currency Translations | | | (1,797 | ) | | | (131,988 | ) |
| Net Decrease in Net Assets Resulting from Operations | | | (702,913 | ) | | | (1,347,438 | ) |
| | | | | | | | | |
| Dividends and Distributions from: | | | | | | | | |
| Net Investment Income | | | — | | | | (343,941 | ) |
| Net Realized Gains | | | — | | | | (9,852 | ) |
| Return of Capital | | | (6,584 | ) | | | (52,224 | ) |
| Total Dividends and Distributions | | | (6,584 | ) | | | (406,017 | ) |
| | | | | | | | | |
| Capital Share Transactions:(1) | | | | | | | | |
| Issued | | | — | | | | 59,536,118 | |
| Other | | | 50,500 | | | | — | |
| Redeemed | | | (8,294,993 | ) | | | (47,685,576 | ) |
| Increase (Decrease) in Net Assets from Capital Share Transactions | | | (8,244,493 | ) | | | 11,850,542 | |
| Total Increase (Decrease) in Net Assets | | | (8,953,990 | ) | | | 10,097,087 | |
| | | | | | | | | |
| Net Assets: | | | | | | | | |
| Beginning of Year | | | 18,799,245 | | | | 8,702,158 | |
| End of Year | | $ | 9,845,255 | | | $ | 18,799,245 | |
| Distributions in Excess of Net Investment Income | | $ | (477,888 | ) | | $ | (1,567,273 | ) |
| | | | | | | | | |
| Share Transactions: | | | | | | | | |
| Issued | | | — | | | | 1,700,000 | |
| Redeemed | | | (250,000 | ) | | | (1,400,002 | ) |
| Net Increase (Decrease) in Shares Outstanding from Share Transactions | | | (250,000 | ) | | | 299,998 | |
| (1) | Includes transaction costs related to creations and redemptions. |
Amounts designated as ‘‘—’’ are $0 or have been rounded to $0.
The accompanying notes are an integral part of the financial statements.
Statements of Changes in Net Assets (concluded)
| | | KraneShares FTSE | |
| | | Emerging Markets Plus ETF | |
| | | Year Ended | | | Year Ended | |
| | | March 31, | | | March 31, | |
| | | 2017 | | | 2016 | |
| Operations: | | | | | | | | |
| Net Investment Income | | $ | 36,660 | | | $ | 29,419 | |
| Net Realized Gain (Loss) on Investments, Affiliated Investments and Foreign Currency Translations | | | (186,670 | ) | | | 84,600 | |
| Net Change in Unrealized Appreciation (Depreciation) on Investments, Affiliated Investments and Foreign Currency Translations | | | 375,822 | | | | (471,459 | ) |
| Net Increase (Decrease) in Net Assets Resulting from Operations | | | 225,812 | | | | (357,440 | ) |
| | | | | | | | | |
| Dividends and Distributions from: | | | | | | | | |
| Net Investment Income | | | (70,606 | ) | | | (34,814 | ) |
| Net Realized Gains | | | (46,996 | ) | | | (5,119 | ) |
| Return of Capital | | | (17,872 | ) | | | — | |
| Total Dividends and Distributions | | | (135,474 | ) | | | (39,933 | ) |
| | | | | | | | | |
| Capital Share Transactions:(1) | | | | | | | | |
| Issued | | | — | | | | 584 | |
| Redeemed | | | — | | | | (43 | ) |
| Increase in Net Assets from Capital Share Transactions | | | — | | | | 541 | |
| Total Increase (Decrease) in Net Assets | | | 90,338 | | | | (396,832 | ) |
| | | | | | | | | |
| Net Assets: | | | | | | | | |
| Beginning of Year | | | 2,165,988 | | | | 2,562,820 | |
| End of Year | | $ | 2,256,326 | | | $ | 2,165,988 | |
| Undistributed (Distributions in Excess of) Net Investment Income | | $ | (1,289 | ) | | $ | 38,837 | |
| | | | | | | | | |
| Share Transactions: | | | | | | | | |
| Redeemed | | | — | | | | (2 | ) |
| Net Decrease in Shares Outstanding from Share Transactions | | | — | | | | (2 | ) |
| (1) | Includes transaction costs related to creations and redemptions. |
Amounts designated as ‘‘—’’ are $0 or have been rounded to $0.
The accompanying notes are an integral part of the financial statements.
(This page intentionally left blank.)
Financial Highlights
Selected Per Share Data & Ratios
For the Years/Periods Ended March 31
For a Share Outstanding Throughout Each Period
| | | | | | | | | Net Realized | | | | | | | | | | | | | |
| | | | | | | | | and | | | | | | | | | | | | | |
| | | Net Asset | | | Net | | | Unrealized | | | | | | Distribution | | | Distribution | | | | |
| | | Value, | | | Investment | | | Gain | | | | | | from Net | | | from | | | Return | |
| | | Beginning | | | Income | | | (Loss) on | | | Total from | | | Investment | | | Capital | | | of | |
| | | of Period | | | (Loss) | | | Investments | | | Operations | | | Income | | | Gains | | | Capital | |
| | | ($) | | | ($)* | | | ($) | | | ($) | | | ($) | | | ($) | | | ($) | |
| KraneShares Bosera MSCI China A Share ETF | | | | | | | | | | | | | | | | | |
| 2017 | | | 30.37 | | | | (0.01 | ) | | | (0.67 | ) | | | (0.68 | ) | | | — | | | | (0.85 | ) | | | (0.46 | ) |
| 2016 | | | 53.55 | | | | 0.62 | | | | (13.67 | ) | | | (13.05 | ) | | | (0.41 | ) | | | (9.72 | ) | | | — | |
| 2015 | | | 28.92 | | | | (0.22 | ) | | | 24.90 | | | | 24.68 | | | | (0.05 | ) | | | — | | | | — | |
| 2014(1) | | | 30.00 | | | | (0.02 | ) | | | (1.06 | ) | | | (1.08 | ) | | | — | | | | — | | | | — | |
| KraneShares Zacks New China ETF(6)# | | | | | | | | | | | | | | | | | |
| 2017 | | | 28.02 | | | | 0.21 | | | | 6.54 | | | | 6.75 | | | | (0.33 | ) | | | — | | | | (0.38 | ) |
| 2016 | | | 34.20 | | | | 0.18 | | | | (3.21 | ) | | | (3.03 | ) | | | (0.25 | ) | | | (2.89 | ) | | | (0.01 | ) |
| 2015 | | | 31.42 | | | | 0.12 | | | | 2.97 | | | | 3.09 | | | | (0.31 | ) | | | — | | | | — | |
| 2014(2) | | | 25.00 | | | | (0.03 | ) | | | 6.45 | | | | 6.42 | | | | — | | | | — | | | | — | |
| KraneShares CSI China Internet ETF | | | | | | | | | | | | | | | | | |
| 2017 | | | 35.76 | | | | (0.27 | ) | | | 7.13 | | | | 6.86 | | | | (0.30 | ) | | | — | | | | (0.11 | ) |
| 2016 | | | 34.18 | | | | (0.20 | ) | | | 1.84 | | | | 1.64 | | | | (0.06 | ) | | | — | | | | — | (7) |
| 2015 | | | 35.93 | | | | (0.14 | ) | | | (1.32 | ) | | | (1.46 | ) | | | (0.29 | ) | | | — | | | | — | |
| 2014(3) | | | 25.00 | | | | (0.02 | ) | | | 11.05 | | | | 11.03 | | | | (0.06 | ) | | | (0.04 | ) | | | — | |
| KraneShares E Fund China Commercial Paper ETF | | | | | | | | | | | | | | | | | |
| 2017 | | | 34.18 | | | | 0.61 | | | | (1.96 | ) | | | (1.35 | ) | | | — | | | | — | | | | (0.01 | ) |
| 2016 | | | 34.81 | | | | 1.01 | | | | (1.39 | ) | | | (0.38 | ) | | | (0.21 | ) | | | (0.01 | ) | | | (0.03 | ) |
| 2015(4) | | | 35.00 | | | | 0.39 | | | | (0.35 | ) | | | 0.04 | | | | (0.23 | ) | | | — | | | | — | |
| KraneShares FTSE Emerging Markets Plus ETF | | | | | | | | | | | | | | | | | |
| 2017 | | | 21.66 | | | | 0.37 | | | | 1.88 | | | | 2.25 | | | | (0.70 | ) | | | (0.47 | ) | | | (0.18 | ) |
| 2016 | | | 25.63 | | | | 0.29 | | | | (3.86 | ) | | | (3.57 | ) | | | (0.35 | ) | | | (0.05 | ) | | | — | |
| 2015(5) | | | 25.00 | | | | — | | | | 0.63 | | | | 0.63 | | | | — | | | | — | | | | — | |
| (1) | The Fund commenced operations on March 4, 2014. |
| (2) | The Fund commenced operations on July 22, 2013. |
| (3) | The Fund commenced operations on July 31, 2013. |
| (4) | The Fund commenced operations on December 2, 2014. |
| (5) | The Fund commenced operations on February 12, 2015. |
| (6) | Effective August 1, 2014, the KraneShares CSI China Five Year Plan ETF changed its name to KraneShares CSI New China ETF. Effective June 1, 2016, the KraneShares CSI New China ETF changed its name to KraneShares Zacks New China ETF. |
| (7) | Amount was less than $0.01 per share. |
| (8) | Pursuant to an Investment Advisory Agreement between the Trust and the Adviser, the Fund paid the Adviser a fee, calculated daily and paid monthly, at an annual rate of 0.78% of the average daily net assets of the Fund (prior to March 24, 2016, the Fund paid the Adviser at an annual rate of 1.10% of the average daily net assets of the Fund). Effective March 24, 2016, pursuant to the terms of an Expense Limitation Agreement, the Adviser had contractually agreed to reduce its management fee to 0.68% of the Fund’s average daily net assets until July 31, 2017. |
| (9) | As of February 17, 2017, pursuant to the terms of an Expense Limitation Agreement, the Adviser has contractually agreed to reduce its management fee to 0.58% of the Fund’s average daily net assets until July 31, 2017. |
| (10) | Fund received reimbursement from third-party for dilution to shareholders for an accounting error. Absent the reimbursement, total return would have been (4.44)%. |
| * | Per share data calculated using average shares method. |
The accompanying notes are an integral part of the financial statements.
| | | | | | | | | | | | | | | | Ratio of | | | Ratio of Net | | | | |
| | | | | | | | | | | | | | | | Expenses | | | Investment | | | | |
| | | | Net Asset | | | | | | | | | Ratio of | | | to Average | | | Income | | | | |
| | | | Value, | | | | | | Net Assets | | | Expenses | | | Net Assets | | | (Loss) | | | | |
| Total from | | | End of | | | Total | | | End of | | | to Average | | | (Excluding | | | to Average | | | Portfolio | |
| Distributions | | | Period | | | Return | | | Period | | | Net Assets | | | Waivers) | | | Net Assets | | | Turnover | |
| ($) | | | ($) | | | (%)** | | | ($)(000) | | | (%) | | | (%) | | | (%) | | | (%) | |
| | | | | | | | | | | | | | | | | | | | | | | | | | | | | | | |
| | (1.31 | ) | | | 28.38 | | | | (2.04 | ) | | | 52,494 | | | | 0.72 | (9) | | | 0.84 | (9) | | | (0.04 | ) | | | 95 | |
| | (10.13 | ) | | | 30.37 | | | | (27.18 | ) | | | 4,555 | | | | 0.93 | (8) | | | 1.18 | (8) | | | 1.18 | | | | 116 | |
| | (0.05 | ) | | | 53.55 | | | | 85.37 | | | | 26,774 | | | | 1.31 | | | | 1.51 | | | | (0.55 | ) | | | 110 | |
| | — | | | | 28.92 | | | | (3.60 | ) | | | 11,566 | | | | 1.10 | † | | | 1.10 | † | | | (0.84 | )† | | | — | †† |
| | | | | | | | | | | | | | | | | | | | | | | | | | | | | | | |
| | (0.71 | ) | | | 34.06 | | | | 24.54 | | | | 3,406 | | | | 0.84 | | | | 0.84 | | | | 0.55 | | | | 86 | |
| | (3.15 | ) | | | 28.02 | | | | (9.71 | ) | | | 2,803 | | | | 0.73 | | | | 0.73 | | | | 0.60 | | | | 575 | |
| | (0.31 | ) | | | 34.20 | | | | 9.92 | | | | 3,421 | | | | 0.71 | | | | 0.71 | | | | 0.37 | | | | 36 | |
| | — | | | | 31.42 | | | | 25.70 | | | | 3,143 | | | | 0.68 | † | | | 0.68 | † | | | (0.15 | )† | | | 7 | †† |
| | | | | | | | | | | | | | | | | | | | | | | | | | | | | | | |
| | (0.41 | ) | | | 42.21 | | | | 19.44 | | | | 291,257 | | | | 0.81 | | | | 0.81 | | | | (0.72 | ) | | | 35 | |
| | (0.06 | ) | | | 35.76 | | | | 4.77 | | | | 194,869 | | | | 0.72 | | | | 0.72 | | | | (0.56 | ) | | | 27 | |
| | (0.29 | ) | | | 34.18 | | | | (4.09 | ) | | | 131,612 | | | | 0.71 | | | | 0.71 | | | | (0.39 | ) | | | 43 | |
| | (0.10 | ) | | | 35.93 | | | | 44.18 | | | | 77,243 | | | | 0.68 | † | | | 0.68 | † | | | (0.90 | )† | | | 8 | †† |
| | | | | | | | | | | | | | | | | | | | | | | | | | | | | | | |
| | (0.01 | ) | | | 32.82 | | | | (3.95 | )(10) | | | 9,845 | | | | 0.95 | ^ | | | 1.07 | ^ | | | 1.84 | ^ | | | — | |
| | (0.25 | ) | | | 34.18 | | | | (1.11 | ) | | | 18,799 | | | | 0.57 | ^ | | | 0.69 | ^ | | | 2.92 | ^ | | | 717 | |
| | (0.23 | ) | | | 34.81 | | | | 0.13 | | | | 8,702 | | | | 0.60 | †^ | | | 0.72 | †^ | | | 3.46 | †^ | | | — | †† |
| | | | | | | | | | | | | | | | | | | | | | | | | | | | | | | |
| | (1.35 | ) | | | 22.56 | | | | 11.24 | | | | 2,256 | | | | 0.37 | ‡‡ | | | 0.73 | ‡‡ | | | 1.70 | ‡‡ | | | 25 | |
| | (0.40 | ) | | | 21.66 | | | | (14.00 | ) | | | 2,166 | | | | 0.91 | ‡ | | | 1.12 | ‡ | | | 1.27 | ‡ | | | 1 | |
| | — | | | | 25.63 | | | | 2.52 | | | | 2,563 | | | | 0.88 | †‡ | | | 0.88 | †‡ | | | (0.07 | )†‡ | | | 8 | †† |
| ** | Total return is based on the change in net asset value of a share during the year or period and assumes reinvestment of dividends and distributions at net asset value. Total return is for the period indicated and periods of less than one year have not been annualized. The return shown does not reflect the deduction of taxes that a shareholder would pay on Fund distributions or the redemption of Fund shares. Excludes effects of creation and redemption fees associated with creation units. |
| †† | Portfolio turnover rate is for the period indicated and periods of less than one year have not been annualized. Excludes effect of in-kind transfers. |
| ^ | The ratios of expenses and net investment income/(loss) to Average Net Assets reflect the expenses and net investment income/(loss), respectively, for the year/period as reported in the Statements of Operations and do not reflect the Fund’s proportionate share of the income and expenses of the money market funds. |
| ‡ | The ratios of expenses and net investment income/(loss) to Average Net Assets reflect the expenses and net investment income/(loss), respectively, for the year/period as reported in the Statements of Operations and do not reflect the Fund’s proportionate share of the income and expenses from investments in other investment companies, except for investments in the KraneShares Bosera MSCI China A Share ETF. |
| ‡‡ | The ratios of expenses and net investment income/(loss) to Average Net Assets reflect the expenses and net investment income/(loss), respectively, for the year/period as reported in the Statements of Operations and do not reflect the Fund’s proportionate share of the income and expenses from investments in other investment companies. |
| # | After the close of the markets on September 13, 2016, the Fund effected a 2 for 1 share split (see Note 7). Per share data has been adjusted to reflect the share split. |
Amounts designated as ‘‘—’’ are $0 or have been rounded to $0.
The accompanying notes are an integral part of the financial statements.
Notes to Financial Statements
1. ORGANIZATION
KraneShares Trust (the ‘‘Trust’’) is a Delaware Statutory Trust formed on February 3, 2012. The Trust is registered under the Investment Company Act of 1940, as amended, as an open-end management investment company. As of March 31, 2017, the Trust had five operational series. The financial statements herein and the related notes pertain to the KraneShares Bosera MSCI China A Share ETF, KraneShares Zacks New China ETF (formerly, KraneShares CSI New China ETF), KraneShares CSI China Internet ETF, KraneShares E Fund China Commercial Paper ETF and KraneShares FTSE Emerging Markets Plus ETF (each, a ‘‘Fund’’ and collectively, the ‘‘Funds’’). KraneShares Bosera MSCI China A Share ETF and KraneShares FTSE Emerging Markets Plus ETF are diversified, as defined under Section 5(b)(1) of the Investment Company Act of 1940; while the KraneShares CSI China Internet ETF, KraneShares Zacks New China ETF and KraneShares E Fund China Commercial Paper ETF are non-diversified. Krane Funds Advisors, LLC (the ‘‘Adviser’’), a Delaware limited liability company, serves as the investment adviser for the Funds and is subject to the supervision of the Board of Trustees (the ‘‘Board’’). The Adviser is responsible for managing the investment activities of the Funds, the Funds’ business affairs and other administrative matters. The Adviser may use co-advisers (each, a ‘‘Sub-Adviser’’ or collectively, the ‘‘Sub-Advisers’’) to perform the day-to-day management for the Funds.
Shares of KraneShares Bosera MSCI China A Share ETF, KraneShares Zacks New China ETF and KraneShares E Fund China Commercial Paper ETF are listed and traded on the NYSE Arca, Inc. Shares of KraneShares CSI China Internet ETF are listed and traded on the NASDAQ Exchange. Shares of KraneShares FTSE Emerging Markets Plus ETF are listed and traded on the BATS Exchange. Market prices for Fund shares (‘‘Shares’’) may be different from their net asset value (‘‘NAV’’). The Funds issue and redeem Shares on a continuous basis at NAV only in large blocks of Shares, typically 50,000 Shares or multiples thereof, called ‘‘Creation Units’’. This does not mean, however, that individual investors will be able to redeem and purchase Shares directly with the series of the Trust. Only Authorized Participants can redeem and purchase Creation Units of Shares directly. With respect to the KraneShares Zacks New China ETF, KraneShares CSI China Internet ETF and KraneShares FTSE Emerging Markets Plus ETF, Creation Units will be issued and redeemed principally in-kind for a basket of securities and a balancing cash amount. With respect to the KraneShares Bosera MSCI China A Share ETF and the KraneShares E Fund China Commercial Paper ETF, Creation Units will be issued and redeemed principally for cash. To the extent the KraneShares Bosera MSCI China A Share ETF and the KraneShares E Fund China Commercial Paper ETF permit in-kind consideration for the purchase of a Creation Units, such Creation Units will be issued and redeemed for a basket of securities and a balancing cash amount. Shares generally will trade in the secondary market in amounts less than a Creation Unit at market prices that change throughout the day.
Notes to Financial Statements (continued)
The investment objective of each Fund is to seek investment results that generally correspond (before fees and expenses) to its respective index listed below (each, an ‘‘Underlying Index’’):
| Fund | | Index |
| | | |
| KraneShares Bosera MSCI China A Share ETF | | MSCI China A International Index |
| KraneShares Zacks New China ETF | | Zacks New China Index |
| KraneShares CSI China Internet ETF | | CSI Overseas China Internet Index |
| KraneShares E Fund China Commercial Paper ETF | | CSI Diversified High Grade Commercial Paper Index |
| KraneShares FTSE Emerging Markets Plus ETF | | FTSE Emerging incl. China Overseas non-R/QFII GDP Weighted Index |
2. SIGNIFICANT ACCOUNTING POLICIES
The following is a summary of the significant accounting policies followed by the Funds. The Funds are investment companies in conformity with U.S. generally accepted accounting principles (‘‘U.S. GAAP’’) and, therefore, the Funds follow the accounting and reporting guidelines for investment companies.
USE OF ESTIMATES — The preparation of financial statements in conformity with U.S. GAAP requires management to make estimates and assumptions that affect the reported amounts of assets and liabilities and disclosure of contingent assets and liabilities at the date of the financial statements and the reported amounts of increases and decreases in net assets from operations during the reporting period. Actual results could differ from those estimates, and could have a material impact to the Funds.
SECURITY VALUATION — The NAV per share of each Fund is computed by dividing the value of the net assets of the Fund (i.e., the current market value of its total assets less any liabilities and withholdings (if any) for applicable capital gains) by the total number of shares of the Fund outstanding, rounded to the nearest cent. Expenses and fees, including without limitation, the management fees and expenses of the Independent Trustees (including any Trustees’ counsel fees), are accrued daily and taken into account for purposes of determining NAV. The NAV per share for each Fund normally is calculated as of the regularly scheduled close of the normal trading on each day that the Exchange is scheduled to be open for business (normally, 4:00 p.m., Eastern Time).
In calculating the values of each Fund’s portfolio securities, securities listed on a securities exchange, market or automated quotation system for which quotations are readily available (except for securities traded on NASDAQ), including securities traded over the counter, are valued at the last reported sale price on the primary exchange or market (foreign or domestic) on which they are traded on the valuation date (or at the time as of which the Fund’s NAV is calculated if a security’s exchange is normally open at that time). If there is no such reported sale on the valuation date, such securities are valued at the most recently reported bid price. For securities traded on NASDAQ, the NASDAQ Official Closing Price will be used. If available, debt securities are priced based upon valuations provided by independent, third-party pricing agents. Such values generally reflect the last reported sales price if the security is actively traded. The third-party pricing agents may also value debt securities at an evaluated bid price by employing methodologies that utilize actual market transactions (if the security is actively traded), broker-dealer supplied valuations, or other methodologies designed to identify the market value
Notes to Financial Statements (continued)
for such securities. Debt obligations with remaining maturities of sixty days or less may be valued at their amortized cost, which is an approximation of market value. The prices for foreign securities are reported in their local currencies and converted to U.S. dollars using prevailing currency exchange rates. The value of a swap contract is equal to the obligation (or rights) under the swap contract, which will generally be equal to the net amounts to be paid (or received) under the contract based upon the relative values of the positions held by each party to the contract. Exchange-traded options are valued at the last reported sales price on the valuation date on the exchange on which they are listed. Futures are valued at the settlement price established by the board of trade on which they are traded. Foreign currency forward contracts are valued at the current day’s interpolated foreign exchange rate, as calculated using the current day’s spot rate. The exchange rates used for valuation are captured as of the close of the London Stock Exchange each day, normally at 4:00 p.m. Greenwich Mean Time. Prices for most securities held by each Fund are provided daily by independent pricing agents. If a security price cannot be obtained from an independent, third-party pricing agent, the Fund seeks to obtain bid and ask prices from two broker-dealers who make a market in the portfolio instrument and determine the average of the two.
Securities for which market prices are not ‘‘readily available,’’ or are not deemed to reflect current market values, or debt securities where no evaluated price is available from the Trust’s third-party pricing agents pursuant to established methodologies, are fair valued by the Trust’s Fair Valuation Committee in accordance with the Trust’s valuation policies and procedures approved by the Board of Trustees. Some of the more common reasons that may necessitate that a security be valued using ‘‘fair value’’ pricing may include, but are not limited to: the security’s trading has been halted or suspended; the security’s primary trading market is temporarily closed; or the security has not been traded for an extended period of time. The Fund may fair value certain of the foreign securities held by the Fund each day the Fund calculates its NAV.
In addition, the Fund may fair value its securities if an event that may materially affect the value of the Fund’s securities that trade outside of the United States (a ‘‘Significant Event’’) has occurred between the time of the security’s last close and the time that the Fund calculates its NAV. A Significant Event may relate to a single issuer or to an entire market sector. Events that may be Significant Events may include: government actions, natural disasters, armed conflict, acts of terrorism and significant market fluctuations.
Investments in redeemable securities issued by open-end investment companies that do not trade on an exchange are valued at an applicable investment company’s NAV. Investments in open-end investment companies that trade on an exchange are valued at the last reported sale price or official closing price as of the close of the customary trading session on the exchange where the security is principally traded on the valuation date. If there is no such reported sale on the valuation date, such securities are valued at the most recently reported bid price. Fair value pricing involves subjective judgments and it is possible that a fair value determination for a security is materially different than the value that could actually be realized upon the sale of the security or that another fund that uses market quotations or its own fair value procedures to price the same securities. In addition, fair value pricing could result in a difference between the prices used to calculate the Fund’s NAV and the prices used by the Underlying Index. This may adversely affect the Fund’s ability to track the Underlying Index.
Notes to Financial Statements (continued)
As of March 31, 2017, the total market value of securities valued in accordance with Fair Value Procedures is as follows:
| | | Fair Valued | | | % of | |
| | | Amount | | | Net Assets | |
| KraneShares Bosera MSCI China A Share ETF | | $ | 554,490 | | | | 1.1 | % |
| KraneShares Zacks New China ETF | | | 98 | | | | 0.0 | % |
| KraneShares FTSE Emerging Markets Plus ETF | | | 6 | | | | 0.0 | % |
In accordance with the authoritative guidance on fair value measurements and disclosure under U.S. GAAP, the Funds disclose the fair value of their investments in a hierarchy that prioritizes the inputs to valuation techniques used to measure the fair value. The objective of a fair value measurement is to determine the price that would be received to sell an asset or paid to transfer a liability in an orderly transaction between market participants at the measurement date (an exit price). Accordingly, the fair value hierarchy gives the highest priority to quoted prices (unadjusted) in active markets for identical assets or liabilities (Level 1) and the lowest priority to unobservable inputs (Level 3). The three levels of the fair value hierarchy are described below:
Level 1 — Unadjusted quoted prices in active markets for identical, unrestricted assets or liabilities that the Funds have the ability to access at the measurement date.
Level 2 — Other significant observable inputs (including quoted prices in non-active markets, quoted prices for similar investments, fair value of investments for which the Funds have the ability to fully redeem tranches at net asset value as of the measurement date or within the near term, and short-term investments valued at amortized cost).
Level 3 — Significant unobservable inputs (including the Funds’ own assumptions in determining the fair value of investments, broker quotes, fair value of investments for which the Funds do not have the ability to fully redeem tranches at net asset value as of the measurement date or within the near term).
Investments are classified within the level of the lowest significant input considered in determining fair value. Investments classified within Level 3 whose fair value measurement considers several inputs may include Level 1 or Level 2 inputs as components of the overall fair value measurement.
For the year ended March 31, 2017, there have been no significant changes to the Funds’ fair valuation methodologies.
Notes to Financial Statements (continued)
The following table summarizes the quantitative inputs and assumptions used for items categorized as material Level 3 investments as of March 31, 2017. The disclosures below also include qualitative information on the sensitivity of the fair value measurements to changes in the significant unobservable inputs.
KraneShares Bosera MSCI China A Share ETF
| Quantitative information about Level 3 fair value measurements |
| | | Fair Value | | | | | | | Discount | |
| Assets | | at 3/31/17 | | | Valuation Technique(s) | | Unobservable Input | | Percentage* | |
| Common Stock | | $ | 554,490 | | | Sector Movement | | Sector Performance | | | +/-10% | |
| * | Certain foreign securities exchanges have mechanisms in place that confine one day’s price movement in an individual security to a pre-determined price range, based on that day’s opening price (‘‘Collared Securities’’). Fair value determinations for Collared Securities will be capped by the Adviser based on any applicable pre-determined ‘‘limit down’’ or ‘‘limit up’’ prices established by a foreign securities exchange. As a result, the fair value price determination on a given day is capped plus or minus ten percent. |
The unobservable input used to determine fair value of the Level 3 asset may have similar or diverging impacts on valuation. Significant increases and decreases in this input could result in significantly higher or lower fair value measurement.
FEDERAL INCOME TAXES — It is each Fund’s intention to qualify or continue to qualify as a regulated investment company for federal income tax purposes by complying with the appropriate provisions of Subchapter M of the Internal Revenue Code of 1986, as amended, and to distribute annually all or substantially all of its taxable income and gains to shareholders. Accordingly, no provisions for federal income taxes have been made in the financial statements.
The Funds evaluate tax positions taken or expected to be taken in the course of preparing the Funds’ tax returns to determine whether it is ‘‘more-likely-than-not’’ (i.e., greater than 50 percent) that each tax position will be sustained upon examination by a taxing authority based on the technical merits of the position. Tax positions not deemed to meet the more-likely-than-not threshold are recorded as a tax benefit or expense in the current year. The Funds did not record any tax provisions in the current period. However, management’s conclusions regarding tax positions may be subject to review and adjustment at a later date based on factors including, but not limited to, examination by tax authorities (i.e., the last three tax year ends, as applicable), on-going analysis of and changes to tax laws, regulations and interpretations thereof.
As of March 31, 2017, management of the Funds has reviewed all open tax years since inception and concluded that there is no tax liability resulting from unrecognized tax benefits relating to uncertain income tax positions taken or expected to be taken in future tax returns. The Funds are also not aware of any tax positions for which it is reasonably possible that the total amounts of unrecognized tax benefits will significantly change in the next 12 months.
SECURITY TRANSACTIONS AND INVESTMENT INCOME — Security transactions are accounted for on the trade date for financial reporting purposes. Costs used in determining realized gains and losses on the sale of investment securities are based on specific identification. Dividend income is generally recorded on the ex-dividend date. Interest income is recognized on the accrual basis from the settlement date.
Dividend income received from affiliated funds is recognized on the ex-dividend date and is recorded as income distributions in the Statement of Operations. Capital gain distributions
Notes to Financial Statements (continued)
received from affiliated funds are recognized on ex-dividend date and are recorded on the Statement of Operations as such. Costs used in determining realized gains and losses on the sales of affiliated funds are on the basis of specific identification.
FOREIGN CURRENCY — The books and records of the Funds are maintained in U.S. dollars. Investment securities and other assets and liabilities denominated in a foreign currency are translated into U.S. dollars on the date of valuation. Purchases and sales of investment securities, income and expenses are translated into U.S. dollars at the relevant rates of exchange prevailing on the respective dates of such transactions. The Funds do not isolate that portion of realized or unrealized gains and losses resulting from changes in the foreign exchange rate from fluctuations arising from changes in the market prices of the securities. These gains and losses are included in net realized and unrealized gains and losses on foreign currency translations on the Statements of Operations. Net realized and unrealized gains and losses on foreign currency transactions and translations represent net foreign exchange gains or losses from foreign currency exchange contracts, disposition of foreign currencies, currency gains or losses realized between trade and settlement dates on securities transactions and the difference between the amount of the investment income and foreign withholding taxes recorded on the Funds’ books and the U.S. dollar equivalent amounts actually received or paid.
DIVIDENDS AND DISTRIBUTIONS TO SHAREHOLDERS — The Funds distribute their net investment income at least annually. Any net realized capital gains are distributed annually. All distributions are recorded on the ex-dividend date.
CREATION UNITS — The Funds issue and redeem Shares at NAV and only in large blocks of Shares (each block of Shares for a Fund is a Creation Unit of 50,000 Shares, or multiples thereof).
The standard creation and redemption fees for each Fund are listed below. These fees are subject to adjustment from time to time by the Adviser.
| | Standard creation and redemption fees |
| KraneShares Bosera MSCI China A Share ETF | | $8,500 and a variable fee of up to 2.0% |
| KraneShares Zacks New China ETF | | $1,500 and a variable fee of up to 2.0% |
| KraneShares CSI China Internet ETF | | $500 and a variable fee of up to 2.0% |
| KraneShares E Fund China Commercial Paper ETF | | $500 and a variable fee of up to 2.0% |
| KraneShares FTSE Emerging Markets Plus ETF | | $8,500 and a variable fee of up to 2.0% |
Except when aggregated in Creation Units, Shares are not redeemable securities of a Fund. Shares of a Fund may only be purchased or redeemed by certain Authorized Participants. An Authorized Participant is either (i) a broker-dealer or other participant in the clearing process through the Continuous Net Settlement System of the National Securities Clearing Corporation or (ii) a Depository Trust Company (‘‘DTC’’) participant and, in each case, must have executed a Participant Agreement with the Distributor. Most retail investors will not qualify as Authorized Participants or have the resources to buy and sell whole Creation Units. Therefore, they will be unable to purchase or redeem the Shares directly from a Fund. Rather, most retail investors will purchase Shares in the secondary market with the assistance of a broker and will be subject to customary brokerage commissions or fees when buying or selling Shares.
If a Creation Unit is purchased or redeemed for cash, a higher transaction fee will be charged. The KraneShares Bosera MSCI China A Share ETF and the KraneShares E Fund China Commercial Paper ETF generally expect that Creation Units of the Fund will be issued and redeemed principally for cash.
Notes to Financial Statements (continued)
The following table discloses Creation Unit activity and transaction costs for the year ended March 31, 2017:
| | | Creation | | | Subscription | | | | | | Redemption | |
| | | Unit Shares | | | Fee | | | Value | | | Fee | |
| KraneShares Bosera MSCI China A Share ETF | | | 1,700,000 | | | $ | 117,299 | | | $ | 48,856,468 | | | $ | 29,897 | |
| KraneShares CSI China Internet ETF | | | 1,450,000 | | | | 17,705 | | | | 65,602,397 | | | | 9,500 | |
| KraneShares E Fund China Commercial Paper ETF | | | (250,000 | ) | | | — | | | | (8,241,623 | ) | | | 2,870 | |
CASH AND CASH EQUIVALENTS — Idle cash and currency balances may be swept into various overnight sweep accounts and are classified as cash equivalents on the Statement of Assets and Liabilities. These amounts, at times, may exceed United States federally insured limits. Amounts swept are available on the next business day.
3. RELATED PARTY TRANSACTIONS
INVESTMENT ADVISORY AGREEMENT — The Adviser serves as investment adviser to each Fund pursuant to an Investment Advisory Agreement between the Trust on behalf of each Fund and the Adviser (the ‘‘Agreements’’). Under the Agreements, the Adviser is responsible for the day-to-day management of each Fund listed below, and continuously reviews, supervises, and administers the Fund’s investment program. The Board of Trustees of the Trust supervises the Adviser and establishes policies that the Adviser must follow in its day-to-day management activities. Each Agreement provides that each Fund pays a unitary (or unified) fee to the Adviser for advisory and management services provided to the Fund. Pursuant to the Agreements between the Trust and the Adviser, the Funds below pay the Adviser a fee, which is calculated daily and paid monthly, at the following annual rates, based on a percentage of the average daily net assets of each Fund:
| | | Management | |
| | | Fee | |
| KraneShares Bosera MSCI China A Share ETF | | | 0.78% | |
| KraneShares Zacks New China ETF | | | 0.68% | |
| KraneShares CSI China Internet ETF | | | 0.68% | |
| KraneShares E Fund China Commercial Paper ETF | | | 0.68% | |
| KraneShares FTSE Emerging Markets Plus ETF | | | 0.68% | |
The Agreements require the Adviser to pay all operating expenses of the Funds, except: (a) interest and taxes (including, but not limited to, income, excise, transaction, transfer and withholding taxes); (b) expenses of the Funds incurred with respect to the acquisition and disposition of portfolio securities and the execution of portfolio transactions, including brokerage commissions and short sale dividend or interest expense; (c) expenses incurred in connection with any distribution plan adopted by the Trust in compliance with Rule 12b-1 under the Investment Company Act, including distribution fees; (d) ‘‘Acquired Fund Fees and Expenses’’ (as defined by Form N-1A under the Investment Company Act); (e) litigation expenses; (f) the advisory fee payable to the Adviser; (g) compensation and expenses of the Independent Trustees (including any fees of independent legal counsel to the Independent Trustees); and (h) any expenses determined to be extraordinary expenses by the Board.
Effective February 17, 2017, pursuant to the terms of an Expense Limitation Agreement, the Adviser has contractually agreed to reduce its management fee for the KraneShares Bosera MSCI China A Share ETF to 0.58% of the Fund’s average daily net assets until July 31, 2017. The
Notes to Financial Statements (continued)
Expense Limitation Agreement may only be terminated prior to July 31, 2017 by the Board upon 60 days’ written notice to the Adviser. Prior to February 17, 2017, pursuant to the terms of an Expense Limitation Agreement, the Adviser had contractually agreed to reduce its management fee to 0.68% of the Fund’s average daily net assets.
Pursuant to the terms of an Expense Limitation Agreement, the Adviser has contractually agreed to reduce its management fee for the KraneShares E Fund China Commercial Paper ETF to 0.56% of the Fund’s average daily net assets until July 31, 2017. The Expense Limitation Agreement may only be terminated prior to July 31, 2017 by the Board upon 60 days’ written notice to the Adviser.
Pursuant to the terms of an Expense Limitation Agreement, Krane has contractually agreed to reduce its management fee for the KraneShares FTSE Emerging Markets Plus ETF in an amount equal to any Acquired Fund Fees and Expenses incurred by the Fund from its investments in the KraneShares Bosera MSCI China A Share ETF. This Expense Limitation Agreement will continue in effect for so long as the Fund invests in the KraneShares Bosera MSCI China A Share ETF. The Expense Limitation Agreement may only be terminated by the Board of Trustees.
The Adviser and each Sub-Adviser bear all of their own costs associated with providing these advisory services. As part of its agreement with the Trust, the Adviser has contractually agreed to pay all operating expenses of the Funds, including the cost of index licensing fees, transfer agency, custody, fund administration, legal, audit and other services.
SUB-ADVISORY AGREEMENT – Bosera Asset Management (International) Co., Ltd. (‘‘Bosera’’), operating out of Hong Kong, serves as the Sub-Adviser to the KraneShares Bosera MSCI China A Share ETF and is responsible for the day-to-day management of the Fund, subject to the supervision by the Adviser and the Board of Trustees of the Trust. For the services Bosera provides to KraneShares Bosera MSCI China A Share ETF, the Adviser pays Bosera a fee equal to 50% of the net revenue the Adviser receives from the Fund.
E Fund Management (Hong Kong) Co., Limited (‘‘E Fund’’), operating out of Hong Kong, serves as the Sub-Adviser to the KraneShares E Fund China Commercial Paper ETF and is responsible for the day-to-day management of the Fund, subject to the supervision by the Adviser and the Board of Trustees of the Trust. For the services E Fund provides to KraneShares E Fund China Commercial Paper ETF, the Adviser pays E Fund a fee equal to 50% of the net revenue the Adviser receives from the Fund.
DISTRIBUTION AGREEMENT – SEI Investments Distribution Co. (the ‘‘Distributor’’), a wholly-owned subsidiary of SEI Investments Company, and an affiliate of the administrator, serves as the Funds’ distributor of Creation Units pursuant to a Distribution Agreement. The Distributor does not maintain any secondary market in Fund shares.
The Trust has adopted a Distribution and Service Plan (‘‘Plan’’) pursuant to Rule 12b-1 under the 1940 Act. In accordance with its Plan, each Fund is authorized to pay an amount up to 0.25% of its average daily net assets each year for certain distribution-related activities. For the year ended March 31, 2017 no fees were charged under the Plan. Fees would only be charged under the Plan upon approval by the Board of Trustees.
Notes to Financial Statements (continued)
ADMINISTRATOR, CUSTODIAN AND TRANSFER AGENT – SEI Investments Global Funds Services (the ‘‘Administrator’’) serves as the Funds’ Administrator pursuant to an Administration Agreement. Brown Brothers Harriman & Co. serves as the Funds’ Custodian and Transfer Agent pursuant to a Custodian and Transfer Agent Agreement.
4. INVESTMENT TRANSACTIONS
For the year ended March 31, 2017, the purchases and sales of investments in securities excluding in-kind transactions, long-term U.S. Government and short-term securities were:
| | | | | | Sales and | |
| | | Purchases | | | Maturities | |
| KraneShares Bosera MSCI China A Share ETF | | $ | 66,919,449 | | | $ | 18,893,250 | |
| KraneShares Zacks New China ETF | | | 2,612,926 | | | | 2,569,170 | |
| KraneShares CSI China Internet ETF | | | 93,445,717 | | | | 75,239,550 | |
| KraneShares FTSE Emerging Markets Plus ETF | | | 524,158 | | | | 635,611 | |
For the year ended March 31, 2017, in-kind transactions associated with creations and redemptions were:
| | | | | | Sales and | | | Realized | |
| | | Purchases | | | Maturities | | | Gain (Loss) | |
| KraneShares CSI China Internet ETF | | $ | 235,397,462 | | | $ | 170,085,083 | | | $ | 8,778,698 | |
During the year ended March 31, 2017, there were no purchases or sales of long-term U.S. government securities for the Funds.
5. TAX INFORMATION
The amount and character of income and capital gain distributions to be paid, if any, are determined in accordance with Federal income tax regulations, which may differ from U.S. GAAP. As a result, net investment income (loss) and net realized gain (loss) on investment transactions for a reporting period may differ significantly from distributions during such period. These book/tax differences may be temporary or permanent. To the extent these differences are permanent in nature, they are charged or credited to undistributed net investment income (loss), accumulated net realized gain (loss) or paid-in capital, as appropriate, in the period that the differences arise.
The following differences, primarily attributable to foreign currency, redemptions in-kind, reclass of distributions, sales of passive foreign investment companies, REIT reclass, and net operating losses, have been reclassified to/from the following accounts during the fiscal year ended March 31, 2017.
| | | | | | Undistributed | | | Accumulated Net | |
| | | | | | Net Investment | | | Realized Gain | |
| KraneShares Funds | | Paid-in Capital | | | Income | | | (Loss) | |
| KraneShares Bosera MSCI China A Share ETF | | $ | (16,970 | ) | | $ | (73,612 | ) | | $ | 90,582 | |
| KraneShares Zacks New China ETF | | | — | | | | 5,769 | | | | (5,769 | ) |
| KraneShares CSI China Internet ETF | | | 5,899,329 | | | | 1,353,535 | | | | (7,252,864 | ) |
| KraneShares E Fund China Commercial Paper ETF | | | (1,783,397 | ) | | | 833,482 | | | | 949,915 | |
| KraneShares FTSE Emerging Markets Plus ETF | | | — | | | | (6,180 | ) | | | 6,180 | |
These reclassifications have no impact on net assets or net asset value per share.
Notes to Financial Statements (continued)
The tax character of dividends and distributions paid during the years ended March 31, 2017 and March 31, 2016 were as follows:
| | | Ordinary | | | Long-Term | | | Return of | | | | |
| KraneShares Funds | | Income | | | Capital Gain | | | Capital | | | Totals | |
| KraneShares Bosera MSCI China A Share ETF | | | | | | | | | | | | | | | | |
| 2017 | | $ | – | | | $ | 127,486 | | | $ | 437,353 | | | $ | 564,839 | |
| 2016 | | | 949,369 | | | | 1,150,887 | | | | – | | | | 2,100,256 | |
| KraneShares Zacks New China ETF | | | | | | | | | | | | | | | | |
| 2017 | | $ | 32,656 | | | $ | – | | | $ | 38,008 | | | $ | 70,664 | |
| 2016 | | | 25,169 | | | | 289,655 | | | | 786 | | | | 315,610 | |
| KraneShares CSI China Internet ETF | | | | | | | | | | | | | | | | |
| 2017 | | $ | 1,721,413 | | | $ | – | | | $ | 656,632 | | | $ | 2,378,045 | |
| 2016 | | | 240,264 | | | | – | | | | 18,722 | | | | 258,986 | |
| KraneShares E Fund China Commercial Paper ETF | | | | | | | | | | | | | | | | |
| 2017 | | $ | – | | | $ | – | | | $ | 6,584 | | | $ | 6,584 | |
| 2016 | | | 353,793 | | | | – | | | | 52,224 | | | | 406,017 | |
| KraneShares FTSE Emerging Markets Plus ETF | | | | | | | | | | | | | | | | |
| 2017 | | $ | 70,606 | | | $ | 46,996 | | | $ | 17,872 | | | $ | 135,474 | |
| 2016 | | | 39,933 | | | | – | | | | – | | | | 39,933 | |
As of March 31, 2017, the components of tax basis distributable earnings (accumulated losses) were as follows:
| | | | | | | | | | | | KraneShares | | | KraneShares | |
| | | KraneShares | | | | | | | | | E Fund | | | FTSE | |
| | | Bosera MSCI | | | KraneShares | | | KraneShares | | | China | | | Emerging | |
| | | China A | | | Zacks New | | | CSI China | | | Commercial | | | Markets | |
| | | Share ETF | | | China ETF | | | Internet ETF | | | Paper ETF | | | Plus ETF | |
| Capital Loss Carryforwards | | $ | (511,878 | ) | | $ | (1,116 | ) | | $ | (9,490,738 | ) | | $ | (58,351 | ) | | $ | (167,871 | ) |
| Post October Losses | | | (273,155 | ) | | | – | | | | – | | | | (2,347 | ) | | | (18,301 | ) |
| Qualified Late-Year Loss Deferrals | | | (142,151 | ) | | | (4,803 | ) | | | (382,730 | ) | | | (477,888 | ) | | | (228 | ) |
| Unrealized Appreciation (Depreciation) on Investments and Foreign Currency | | | (306,136 | ) | | | 755,842 | | | | 5,590,790 | | | | (146,825 | ) | | | (40,835 | ) |
| Other Temporary Differences | | | (4 | ) | | | – | | | | 4 | | | | – | | | | – | |
| Total Distributable Earnings (Accumulated Losses) | | $ | (1,233,324 | ) | | $ | 749,923 | | | $ | (4,282,674 | ) | | $ | (685,411 | ) | | $ | (227,235 | ) |
Qualified late year ordinary and Post-October capital losses (including currency and specified gain/loss items) represent losses realized from Jan. 1, 2017 through March 31, 2017 and November 1, 2016 through March 31, 2017, respectively, that in accordance with federal income tax regulations, the Funds have elected to defer and treat as having arisen in the following fiscal year.
Under the Regulated Investment Company Modernization Act of 2010, the Funds are permitted to carry forward capital losses incurred in taxable years beginning after December 22, 2010 for an
Notes to Financial Statements (continued)
unlimited period. Post-enactment capital losses that are carried forward will retain their character as either short-term or long-term capital losses rather than being considered all short-term as under previous law. Losses carried forward under these new provisions are as follows:
| | | Short-Term | | | Long-Term | | | | |
| | | Loss | | | Loss | | | Total | |
| KraneShares Bosera MSCI China A Share ETF | | $ | 455,383 | | | $ | 56,495 | | | $ | 511,878 | |
| KraneShares Zacks New China ETF | | | 1,116 | | | | – | | | | 1,116 | |
| KraneShares CSI China Internet ETF | | | 7,794,587 | | | | 1,696,151 | | | | 9,490,738 | |
| KraneShares E Fund China Commercial Paper ETF | | | 58,351 | | | | – | | | | 58,351 | |
| KraneShares FTSE Emerging Markets Plus ETF | | | 2,935 | | | | 164,936 | | | | 167,871 | |
The differences between book and tax-basis unrealized appreciation and depreciation are attributable primarily to the tax deferral of losses on wash sales and investments in passive foreign investment companies. The federal tax cost and aggregate gross unrealized appreciation and depreciation on investments held by the Funds at March 31, 2017 were as follows:
| | | | | | Aggregated | | | Aggregated | | | | |
| | | | | | Gross | | | Gross | | | Net Unrealized | |
| | | Federal | | | Unrealized | | | Unrealized | | | Appreciation | |
| KraneShares Funds | | Tax Cost | | | Appreciation | | | Depreciation | | | (Depreciation) | |
| KraneShares Bosera MSCI China A Share ETF | | $ | 52,497,468 | | | $ | 1,583,435 | | | $ | (1,889,571 | ) | | $ | (306,136 | ) |
| KraneShares Zacks New China ETF | | | 2,642,469 | | | | 901,187 | | | | (145,345 | ) | | | 755,842 | |
| KraneShares CSI China Internet ETF | | | 285,466,982 | | | | 37,176,637 | | | | (31,585,847 | ) | | | 5,590,790 | |
| KraneShares E Fund China Commercial Paper ETF | | | 9,794,099 | | | | 18,599 | | | | (164,561 | ) | | | (145,962 | ) |
| KraneShares FTSE Emerging Markets Plus ETF | | | 2,254,991 | | | | 230,165 | | | | (271,013 | ) | | | (40,848 | ) |
Uncertainties in the Chinese tax rules governing the taxation of income distributions and capital gains from investments in A Shares could result in unexpected tax liabilities for the Funds. China generally imposes withholding tax at a rate of 10% on dividends and interest derived by non-Chinese resident investors (including, for example, Qualified Foreign Institutional Investors (QFII)) from Chinese companies and those companies which are not Chinese tax residents, but which are deemed to be Chinese tax residents (e.g., under Notice 7). China also imposes withholding tax at a rate of 10% on capital gains derived by non-residents from investment in actual and constructive Chinese resident companies. The Chinese withholding taxes applied to dividends, interest and capital gains may, in principle, be subject to a reduced rate under an applicable Chinese tax treaty, but the application of such treaties in the case of a non-resident (e.g., in the case of a QFII acting on behalf of non-resident investors, such as the Funds) is also uncertain. The imposition of such taxes could have a material adverse effect on the Funds’ returns. The People’s Republic of China (the ‘‘PRC’’) rules regarding the taxation of non-resident investors are quickly evolving and certain of the tax regulations to be issued by the PRC State Administration of Taxation and/or the PRC Ministry of Finance to clarify matters may apply retrospectively. Such retroactively applied rules may be adverse to the Funds and their shareholders. Effective November 17, 2014, QFIIs, RQFIIs (i.e., QFIIs investing in Yuan, rather than foreign currency) and non-Chinese resident investors investing through the Hong Kong-Shanghai Stock Connect are exempted temporarily from the 10% capital gains tax that normally applies to sales of A Shares on a public Chinese exchange (such as the Shanghai Stock Exchange). However, such investors
Notes to Financial Statements (continued)
are still required to pay capital gains tax for gains realized on trades executed before November 17, 2014. The Funds have recorded capital gains tax for gains realized prior to November 17, 2014, and have reflected such taxes in the Statement of Assets and Liabilities.
6. CONCENTRATION OF RISKS
As with all ETFs, shareholders of the Funds are subject to the risk that their investment could lose money. The Funds are subject to the principal risks noted below, any of which may adversely affect a Fund’s NAV, trading price, yield, total return and ability to meet its investment objective. A more complete description of principal risks is included in each Fund’s prospectus under the heading ‘‘Principal Risks.’’
CHINESE CREDIT RATINGS RISK – The debt securities included in Underlying Index securities, and therefore the securities held by the KraneShares E Fund China Commercial Paper ETF Fund, will be rated by Chinese ratings agencies (and not by U.S. entities, such as nationally recognized statistical ratings organizations (‘‘NRSROs’’)). The rating criteria and methodology used by Chinese rating agencies may be different from those adopted by NRSROs and international credit rating agencies. Therefore, such rating systems may not provide an equivalent standard for comparison with securities rated by international credit rating agencies.
FIXED INCOME SECURITIES RISK – Fixed income securities are subject to credit risk and interest rate risk. Credit risk refers to the possibility that the issuer of a security will not make timely interest payments or repay the principal of debt issued. Interest rate risk refers to fluctuations in the value of a debt security resulting from changes in the level of interest rates. When interest rates go up, the prices of most debt securities go down; and when interest rates go down, the prices of most debt securities go up. Debt securities with longer durations tend to be more sensitive to interest rate changes, typically making them more volatile. The current low-interest-rate environment heightens the risks associated with rising interest rates.
FOREIGN SECURITIES RISK – Investments in securities of non-U.S. issuers involve certain risks that may not be present with investments in securities of U.S. issuers, such as risk of loss due to foreign currency fluctuations or to political or economic instability. There may be less information publicly available about non-U.S. issuers. Non-U.S. issuers, especially issuers in China and other emerging markets, may also be subject to different accounting, auditing, financial reporting and investor protection standards than U.S. issuers.
Income from securities of non-U.S. issuers, including, in the case of Chinese issuers, gains on the sale of such securities, may be subject to foreign taxes. Even if the Funds qualify to pass these taxes through to shareholders, your ability to claim a credit for such taxes may be limited, particularly in the case of taxes on capital gains. Investments in foreign securities may be less liquid than investments in U.S. securities.
GEOGRAPHIC FOCUS IN CHINA AND HONG KONG – Because the Funds focus their investments, at least in part, in securities issued in China and Hong Kong, each Fund’s performance will be susceptible to adverse market, political, regulatory and geographic events affecting China and Hong Kong and may be more volatile than the performance of more geographically diversified funds. These and other factors could have a negative impact on the Funds’ performance and increase the volatility of an investment in the Funds.
Notes to Financial Statements (continued)
INDEX RISK – Unlike many investment companies, the Funds do not utilize an investing strategy that seeks returns in excess of each Fund’s respective Underlying Index. Therefore, a Fund would not necessarily buy or sell a security unless that security is added or removed, respectively, from its respective Underlying Index, even if that security generally is underperforming.
INDUSTRY CONCENTRATION RISK – In following its methodology, each Fund’s Underlying Index from time to time may be concentrated to a significant degree in securities of issuers located in a single industry or group of industries. To the extent that an Underlying Index concentrates in the securities of issuers in a particular industry or group of industries, each Fund also is expected to concentrate its investments to approximately the same extent. If a Fund concentrates its investments in an industry, the Fund may face more risks than if it were diversified broadly over industries. In addition, at times, an industry or sector may be out of favor and underperforms other industries or the market as a whole. Any factors detrimental to the performance of such industry or sector may disproportionately impact a Fund’s NAV.
INVESTMENTS IN OTHER INVESTMENT COMPANIES – The Funds utilize a cash sweep program (the ‘‘Cash Sweep Program’’), whereby at least a portion of the Funds’ uninvested cash balances are expected to be used to purchase shares of money market funds. In addition, under the Cash Sweep Program, the KraneShares E Fund China Commercial Paper ETF is expected to invest at least a portion of its uninvested cash balance to purchase shares of funds that are registered in China, but not the United States (‘‘PRC Investment Companies’’). Investments in money market funds and the PRC Investment Companies are subject to the risks faced by them, which include credit risk and interest rate risk. Investments in PRC Investment Companies are also subject to currency risk, foreign investment risk, and custody risk. The PRC Investment Companies are PRC-domiciled funds, and to the extent that they or any fund is not registered pursuant to the 1940 Act, the Funds will not enjoy the protections of the United States securities laws, including the 1940 Act, with respect to its investments in the PRC Investment Companies or other funds not registered in the United States.
The KraneShares FTSE Emerging Markets Plus ETF also invests in other investment companies. By doing so, the Fund is exposed to the risks of investments by such companies. Moreover, the Fund will incur its pro rata share of the underlying investment companies’ expenses.
The KraneShares E Fund China Commercial Paper ETF and KraneShares FTSE Emerging Markets Plus ETF may invest in investment companies that are sponsored or advised by the Adviser and/or Co-Adviser. The Adviser and/or Co-Adviser may be subject to conflicts of interest in allocating Fund assets to such funds if they derive fees or other benefits from the underlying funds.
LIQUIDITY RISK – The Funds’ investments are subject to liquidity risk, which exists when an investment is or becomes difficult to purchase or sell. If a transaction is particularly large or if the relevant market is or becomes illiquid, it may not be possible to initiate a transaction or liquidate a position at an advantageous time or price, which may cause the Funds to suffer significant losses and difficulties in meeting redemptions. If a number of securities held by the Funds halt trading, such as due to an exchange’s limit-up, limit-down rules, it may have a cascading effect and cause the Funds to halt trading. Volatility in market prices will increase the risk of the Funds being subject to a trading halt.
Notes to Financial Statements (continued)
MARKET RISK – The trading prices of equity securities and other instruments fluctuate in response to a variety of factors. The Funds NAV and market price may fluctuate significantly in response to such factors. As a result, an investor could lose money over short or long periods of time.
NON-CORRELATION RISK – Each Fund’s return may not match the return of its Underlying Index for a number of reasons. For example, each Fund incurs operating expenses not applicable to the Underlying Index, and incurs costs in buying and selling securities, especially when rebalancing the Fund’s securities holdings to reflect changes in the composition of its Underlying Index. The performance of each Fund and its Underlying Index may vary due to asset valuation differences and differences between each Fund’s portfolio and its Underlying Index resulting from legal restrictions, cost or liquidity constraints. Further, performance may diverge when a Fund employs a representative sampling, rather than a replication strategy.
NON-DIVERSIFICATION RISK – The KraneShares Zacks New China ETF, KraneShares CSI China Internet ETF and KraneShares E Fund China Commercial Paper ETF are considered to be non-diversified, which means that they may invest more of their assets in the securities of a single issuer or a smaller number of issuers than if they were diversified funds. To the extent a Fund invests a significant percentage of its assets in a limited number of issuers, the Fund is subject to the risks of investing in those few issuers, and may be more susceptible to a single adverse economic or regulatory occurrence. As a result, changes in the market value of a single security could cause greater fluctuations in the value of Fund shares than would occur in a diversified fund.
VALUATION RISK – Independent market quotations for the non-U.S. securities held by the Funds may not be readily available, and such securities may be fair valued. In addition, the securities in which the Funds invest may trade on days that the Funds do not price their shares; as a result, the value of Fund shares may change on days when investors cannot purchase or sell their holdings.
7. OTHER
At March 31, 2017, the records of the Trust reflect all Shares outstanding created by Authorized Participants are in the form of Creation Units. However, the individual shares comprising such Creation Units are listed and traded on either the NYSE, NASDAQ Exchange or BATS Exchange, and a portion thereof have been purchased and sold by persons other than Authorized Participants. Each Authorized Participant has entered into an agreement with the Funds’ Distributor.
After the close of the markets on September 13, 2016, the KraneShares Zacks New China ETF effected a split of its issued and outstanding shares for shareholders of record on September 12, 2016. The effect of this transaction was to increase the number of outstanding shares of the Fund by a ratio of two-for-one, resulting in a corresponding decrease in the net asset value per share. The capital share activity presented in the Statements of Changes in Net Assets for each of the years in the period then ended, and per share data in the financial highlights for each of the years in the period then ended, have been given retroactive effect to reflect these share splits. There were no changes in net assets, results of operations or total return as a result of these transactions.
A third party reimbursed the KraneShares E Fund China Commercial Paper ETF for dilution to shareholders resulting from an accounting error. Refer to ‘‘Other Receivable’’ on the Fund’s Statement of Assets and Liabilities.
Notes to Financial Statements (continued)
8. INDEMNIFICATIONS
In the normal course of business, the Funds enter into contracts that provide general indemnifications. The Funds’ maximum exposure under these arrangements is dependent on future claims that may be made against the Funds and, therefore, cannot be established; however, based on experience, the risk of loss from such claims is considered remote.
9. ADVISER OBLIGATIONS
The Adviser serves as investment adviser to each Fund pursuant to unitary (or unified) fee investment advisory agreements (‘‘Agreements’’). As discussed in Note 3, the Adviser is responsible for certain expenses of the Funds (the ‘‘Expenses’’). The Adviser is current with the payment of all Expenses or has entered into work-out arrangements to schedule the future payment by the Adviser of outstanding Expenses, which include amounts due to certain service providers of the Funds.
10. CHANGE OF INDEPENDENT REGISTERED PUBLIC ACCOUNTING FIRM (Unaudited)
The Funds have selected KPMG LLP (‘‘KPMG’’) to serve as each Fund’s independent registered public accounting firm for the Funds’ fiscal year ended March 31, 2017. The decision to select KPMG was recommended by the Funds’ Audit Committee on February 13, 2017 and was approved by the Funds’ Board of Trustees on February 13, 2017. This was communicated to PricewaterhouseCoopers LLP (‘‘PwC’’) on February 15, 2017. For the Funds’ two most recent fiscal years ended March 31, 2016 and March 31, 2015 and the subsequent interim period through February 15, 2017, neither the Funds, nor anyone on their behalf, consulted with KPMG on items which: (i) concerned the application of accounting principles to a specified transaction, either completed or proposed, or the type of audit opinion that might be rendered on the Funds’ financial statements; or (ii) concerned the subject of a disagreement (as defined in paragraph (a)(1)(iv) of Item 304 of Regulation S-K and the instructions thereto) or reportable events (as described in paragraph (a)(1)(iv) of said Item 304). The selection of KPMG does not reflect any disagreements with or dissatisfaction by the Funds or the Funds’ Board of Trustees with the performance of the Funds’ prior independent registered public accounting firm, PwC, for fiscal years ended March 31, 2016 and March 31, 2015 and the subsequent interim period through February 15, 2017. The decision not to renew the engagement of PwC, effective upon its completion of its audit for the fiscal year ended March 31, 2016, and to select KPMG was recommended by the Fund’s Audit Committee and approved by the Funds’ Board of Trustees. PwC’s reports on the Funds’ financial statements for the fiscal years ended March 31, 2016 and March 31, 2015 contained no adverse opinion or disclaimer of opinion, and were not qualified or modified as to uncertainty, audit scope, or accounting principles. During the Funds’ fiscal years ended March 31, 2016 and March 31, 2015 and the subsequent interim period through February 15, 2017, there were no disagreements with PwC on any matter of accounting principles or practices, financial statement disclosure, or auditing scope or procedures, which disagreements, if not resolved to the satisfaction of PwC, would have caused them to make reference to the subject matter of the disagreements in their reports on the Funds’ financial statements for such years.
Notes to Financial Statements (concluded)
11. SUBSEQUENT EVENTS
The Funds have evaluated the need for additional disclosures and/or adjustments resulting from subsequent events. Based on this evaluation, no additional disclosures or adjustments were required to the financial statements as of the date the financial statements were issued.
Report of Independent Registered Public Accounting Firm
To the Shareholders and Board of Trustees of KraneShares Trust:
We have audited the accompanying statements of assets and liabilities, including the schedules of investments, of KraneShares Trust, comprised of the KraneShares Bosera MSCI China A Share ETF, KraneShares Zacks New China ETF (formerly, KraneShares CSI New China ETF), KraneShares CSI China Internet ETF, KraneShares E Fund China Commercial Paper ETF, and KraneShares FTSE Emerging Markets Plus ETF (collectively, the ‘‘Funds’’) as of March 31, 2017, and the related statements of operations, statements of changes in net assets, and the financial highlights for the year then ended. These financial statements and financial highlights are the responsibility of the Funds’ management. Our responsibility is to express an opinion on these financial statements and financial highlights based on our audits. The statements of changes in net assets and the financial highlights for the periods presented through March 31, 2016 were audited by other auditors whose report dated May 31, 2016 expressed an unqualified opinion on those statements and those financial highlights.
We conducted our audits in accordance with the standards of the Public Company Accounting Oversight Board (United States). Those standards require that we plan and perform the audit to obtain reasonable assurance about whether the financial statements and financial highlights are free of material misstatement. An audit includes examining, on a test basis, evidence supporting the amounts and disclosures in the financial statements. Our procedures included confirmation of securities owned as of March 31, 2017, by correspondence with the custodian or other appropriate auditing procedures. An audit also includes assessing the accounting principles used and significant estimates made by management, as well as evaluating the overall financial statement presentation. We believe that our audits provide a reasonable basis for our opinion.
In our opinion, the financial statements and financial highlights referred to above present fairly, in all material respects, the financial position of each of the Funds comprising KraneShares Trust as of March 31, 2017, and the results of their operations, the changes in their net assets, and the financial highlights for the year then ended, in conformity with U.S. generally accepted accounting principles.

Philadelphia, Pennsylvania
May 30, 2017
Trustees and Officers of the Trust (Unaudited)
Set forth below are the names, addresses, years of birth, position with the Trust, term of office and length of time served; the principal occupations for the last five years; number of Funds in fund complex overseen; and other directorships outside the fund complex of each of the persons currently serving as Trustees and Officers of the Trust. The Trust’s Statement of Additional Information (‘‘SAI’��) includes additional information about the Trustees and Officers. The SAI may be obtained without charge, upon request, by calling 1-855-857-2638. The following chart lists Trustees and Officers as of March 31, 2017.
| | | | | | | Number of | | |
| | | | | | | Funds in | | Other |
| | | | | | | Trust | | Directorships |
| Name, Address | | Position(s) Held | | Principal Occupation(s) | | Overseen | | Held by |
| (Year of Birth) | | with Funds | | During the Past 5 Years | | by Trustee | | Trustee |
| | | | | | | | | |
| Interested Trustee(2) | | | | | | | |
| | | | | | | | | |
Jonathan Krane(1)
1270 Avenue of the
Americas, 22nd Floor
New York, NY 10020
(1968) | | Trustee and Chairman of the Board, No set term; served since 2012 | | Chief Executive Officer of Krane Funds Advisors, LLC from May 2011 to present. Principal of Krane Capital LLC from June 2009 to 2011. | | 5 | | None |
| | | | | | | | | |
| Independent Trustees(2) | | | | | | | |
| | | | | | | | | |
John Ferguson
1270 Avenue of the
Americas, 22nd Floor
New York, NY 10020
(1966) | | Trustee, No set term; served since 2012 | | Chief Operating Officer of Kang Global Investors LP from May 2014 to present. President of Alden Global Capital, LLC (hedge fund adviser) from April 2012 to April 2014 (formerly, Chief Operating Officer from November 2011 to April 2012). Senior Managing Director and Chief Operating Officer of K2 Advisors, L.L.C. from April 2005 to October 2011. | | 5 | | None |
| | | | | | | | | |
Matthew Stroyman
1270 Avenue of the
Americas, 22nd Floor
New York, NY 10020
(1968) | | Trustee, No set term; served since 2012 | | Co-Founder, President and Chief Operating Officer of Arcturus (real estate asset and investment management services firm) from September 2007 to present. | | 5 | | None |
Trustees and Officers of the Trust (Unaudited) (concluded)
| | | | | | | Number of | | |
| | | | | | | Funds in | | Other |
| | | | | | | Trust | | Directorships |
| Name, Address | | Position(s) Held | | Principal Occupation(s) | | Overseen | | Held by |
| (Year of Birth) | | with Funds | | During the Past 5 Years | | by Officer | | Officer |
| | | | | | | | | |
| Officers(2) | | | | | | | | |
| | | | | | | | | |
Jonathan Krane
1270 Avenue of the
Americas, 22nd Floor
New York, NY 10020
(1968) | | Principal Executive Officer and Principal Financial Officer, No set term; served since 2012 | | Chief Executive Officer of Krane Funds Advisors, LLC from May 2011 to present. Principal of Krane Capital LLC from June 2009 to 2011. | | 5 | | None |
| | | | | | | | | |
Jennifer Tarleton
(formerly Krane)
1270 Avenue of the
Americas, 22nd Floor
New York, NY 10020
(1966) | | Vice President and Secretary, No set term; served since 2012 | | Principal of Krane Capital LLC from June 2009 to 2011. Vice President of Krane Funds Advisors, LLC from May 2011 to present. | | 5 | | None |
| | | | | | | | | |
Michael Quain
1270 Avenue of the
Americas, 22nd Floor
New York, NY 10020
(1957) | | Chief Compliance Officer, No set term; served since June 2015 | | Principal/President of Quain Compliance Consulting, LLC from February 2014 to present. First Vice President of Aberdeen Asset Management Inc. from May 2013 to September 2013. First Vice President and Chief Compliance Officer of Artio Global Management, LLC from September 2004 to May 2013. | | 5 | | None |
| | | | | | | | | |
James Hoffmayer(3)
SEI Investments
Company
One Freedom Valley Drive
Oaks, PA 19456
(1973) | | Assistant Treasurer, No set term; served since 2017 | | Controller and Chief Financial Officer of SEI Investments Global Funds Services from 2016 to present. Senior Director, Funds Accounting and Fund Administration of SEI Investments Global Funds Services from September 2016 to present. Senior Director of Fund Administration of SEI Investments Global Funds Services from October 2014 to present. Director of Financial Reporting of SEI Investments Global Funds Services from November 2004 to October 2014. | | 5 | | None |
| (1) | Mr. Krane is an ‘‘interested’’ person of the Trust, as that term is defined in the 1940 Act, by virtue of his ownership and controlling interest in the Adviser. |
| (2) | Each Trustee serves until his or her successor is duly elected or appointed and qualified. |
| (3) | These officers of the Trust also serve as officers of one or more funds for which SEI Investments Company or an affiliate acts as investment manager, administrator or distributor. |
Renewal of Advisory Agreements & Board Considerations (Unaudited)
At an in-person meeting on October 5, 2016, the Board of Trustees (‘‘Board’’) of the KraneShares Trust (‘‘Trust’’), including a majority of the Independent Trustees, voted to renew the advisory agreement between Krane Funds Advisors, LLC (‘‘Krane’’) and the Trust, on behalf of the KraneShares Zacks New China ETF, KraneShares CSI China Internet ETF, KraneShares Bosera MSCI China A Share ETF, KraneShares E Fund China Commercial Paper ETF and KraneShares FTSE Emerging Markets Plus ETF, the sub-advisory agreement between Krane and Bosera Asset Management (International) Co., Ltd. (‘‘Bosera’’) with respect to the KraneShares Bosera MSCI China A Share ETF and the sub-advisory agreement between Krane and E Fund Management (Hong Kong) Co., Ltd. (‘‘E Fund’’, together with Bosera, the ‘‘Sub-Advisers’’) with respect to the KraneShares E Fund China Commercial Paper ETF (collectively, the ‘‘Agreements’’). In evaluating the Agreements, the Board considered, among other matters: (1) the nature, extent and quality of the services provided by Krane and the Sub-Advisers; (2) the performance of the Funds and Krane and the Sub-Advisers; (3) the costs of the services provided and profitability to Krane with respect to its relationship with the Funds; (4) the advisory fees and total expense ratios of the Funds compared to a relevant peer group of funds; (5) the extent to which economies of scale would be realized as the Funds grow and whether the advisory fee would enable investors to share in the benefits of economies of scale; and (6) other benefits received by Krane and the Sub-Advisers from their relationship with the Funds. In its consideration of the Agreements, the Board considered that the evaluation process with respect to Krane and the Sub-Advisers is an ongoing one and, in this regard, noted that it considers information at each regularly scheduled meeting regarding, among other matters, the performance and services provided by Krane and the Sub-Advisers and information provided outside of the Board meetings. In this regard, the Board’s consideration of the Agreements included information previously received at such meetings and outside of the meetings.
Nature, Quality and Extent of Services. Based on the written and oral reports received by the Board prior to and at the October 5, 2016 meeting and a presentation from senior representatives of Krane at the October 5, 2016 meeting, the Board considered the nature, quality and extent of the overall services provided by Krane under the advisory agreement and by each Sub-Adviser under its sub-advisory agreement. In this connection, the Board considered the responsibilities of Krane and the Sub-Advisers. The Board discussed Krane’s resources available to the management of the Funds and recognized that Krane had invested significant time and effort in structuring the Trust and the Funds, obtaining the necessary exemptive relief from the Securities and Exchange Commission (‘‘SEC’’), assessing the market appeal of each Fund’s investment strategy and arranging service providers. In addition, the Board observed that Krane had agreed to bear many of the Funds’ expenses under a unitary fee arrangement. The Board considered that Krane is responsible for establishing and monitoring each Fund’s investment program and carrying out directives of the Board and that Krane and the Sub-Advisers, as applicable, manage the day-to-day investment activities of the Funds. In this regard, the Board considered information provided by Krane regarding its selection and oversight of the Sub-Advisers, as applicable. In addition, the Board evaluated its experience with the services provided by Krane and the Sub-Advisers and noted that it would continue to routinely monitor such matters. The Board also considered Krane’s analysis and recommendations regarding each Sub-Adviser. Based on its review and other considerations, the Board determined, in the exercise of its reasonable business judgment, that the nature, quality and extent of the services provided by Krane and each Sub-Adviser are appropriate for the Funds.
Renewal of Advisory Agreements & Board Considerations (Unaudited) (continued)
Performance. The Board noted that it considered the performance of the Funds throughout the year and reviewed each Fund’s performance for various periods. The Board considered the performance of each Fund against its underlying index, noting that the information provided by Krane indicated that each Fund’s performance correlated with that of its underlying index, except where certain factors affected the Funds but not their underlying indices, such as the use of fair value pricing by the Funds and the Funds’ asset inflows and outflows. The Board also considered Krane’s representation that each Fund was achieving its purpose of offering investors unique investment exposures. In addition, the Board was provided with, among other things, information regarding each Fund’s returns against a group of funds identified as comparable (‘‘peer group’’) and its Morningstar category. The Board also considered the respective Morningstar ratings received by the KraneShares Zacks New China ETF and KraneShares CSI China Internet ETF Fund based on their three-year performance, acknowledging that those were the only Funds that had been operational for at least three years as of the date of the Board meeting.
With respect to the KraneShares Zacks New China ETF, the Board noted further that: (1) the Fund outperformed its peer group for the quarter period August 31, 2016 and generally performed in line with its peer group for the year-to-date, one-year and since-inception periods ended August 31, 2016; and (2) the Fund outperformed its Morningstar category median for the one-year and since-inception periods ended August 31, 2016.
With respect to the KraneShares CSI China Internet ETF, the Board noted that: (1) the Fund outperformed its peer group for the quarter and since-inception periods ended August 31, 2016 and generally performed in line with its peer group for the year-to-date and one-year periods ended August 31, 2016; and (2) the Fund outperformed its Morningstar category median for the one-year and since-inception periods ended August 31, 2016.
With respect to the KraneShares Bosera MSCI China A Share ETF, the Board noted that: (1) the Fund outperformed its peer group for the quarter ended August 31, 2016, but underperformed its peer group for the year-to-date, one-year and since-inception periods ended August 31, 2016; and (2) the Fund outperformed its Morningstar category median for the since-inception period ended August 31, 2016, but underperformed its Morningstar category median for the one-year period ended August 31, 2016.
With respect to the KraneShares E Fund China Commercial Paper ETF, the Board noted that: (1) the Fund underperformed its peer group for the quarter, year-to-date, one-year and since-inception periods ended August 31, 2016; and (2) the Fund underperformed its Morningstar category median for the one-year and since-inception periods ended August 31, 2016. In assessing the Fund’s relative performance, the Board’s considered the impact of the Fund’s average portfolio weighted duration as compared to that of its peer group and the Morningstar category.
With respect to the KraneShares FTSE Emerging Markets Plus ETF, the Board noted that: (1) the Fund had generally performed in line with its peer group for the quarter and one-year periods ended August 31, 2016, but underperformed its peer group for the year-to-date and since-inception periods ended August 31, 2016; and (2) the Fund underperformed its Morningstar category median for the one-year and since-inception periods ended August 31, 2016. In assessing the Fund’s relative performance, the Board considered information provided by Krane regarding the Fund’s exposure to Chinese and Indian securities as compared to the peer group and Morningstar category.
Renewal of Advisory Agreements & Board Considerations (Unaudited) (continued)
Based on its review, the Board determined, in its reasonable business judgment, that continuing to engage Krane and the Sub-Advisers could benefit the Funds and their shareholders.
Comparative Fees and Expenses. The Board considered that Krane has entered into a unitary advisory fee arrangement to the Funds, under which Krane, and not the Funds, is responsible for paying many of the Funds’ expenses, including those of the Funds’ principal service providers and the Sub-Advisers and considered the information provided by Krane regarding the amounts paid by it to the Funds’ service providers under the arrangement. The Board reviewed and considered the fees in light of the nature, quality and extent of the services provided by Krane. The Board also considered the net expense ratios of the Funds compared to those of their peer groups. The Board noted that: (1) the KraneShares Zacks New China ETF’s management fee and net expense ratio were higher than its peer group; (2) the KraneShares CSI China Internet ETF’s management fee was in line with that of its peer group, but its net expense ratio was higher than its peer group; (3) the KraneShares Bosera MSCI China A Share ETF’s management fee and net expense ratio were higher than its peer group; (4) the KraneShares E Fund Commercial Paper ETF’s management fee and net expense ratio were higher its peer group; and (5) the KraneShares FTSE Emerging Markets Plus ETF’s management fee and net expense ratio were higher than its peer group. The Board noted Krane’s representation that each Fund offers unique investment exposure for shareholders and potential investors and that Krane did not advise any other accounts with similar investment strategies. The Board also considered the effect of each Fund’s assets under management on its net expense ratio.
Although the Board received information regarding the fees paid to the Sub-Advisers under the sub-advisory agreements, the Board noted the arm’s-length nature of the relationship between the Krane and the Sub-Advisers with respect to the negotiation of sub-advisory fee rates. The Board also considered that Krane (and not the Funds) pays the Sub-Adviser’s fees.
Based on these and other considerations, the Board, in the exercise of its reasonable business judgment, determined that the fees and expenses of the Funds under the advisory and sub-advisory agreements are reasonable.
Costs and Profitability. The Board then considered profit and loss information provided by Krane with respect to the Funds. In this regard, the Board noted that Krane continued to waive certain fees and that it had not made a profit from its relationship with the Funds under the advisory agreements. The Board also noted Krane’s commitment to the success of the Funds and the use of a unitary fee structure under which Krane bears the risk if certain of the Funds’ expenses increase. The Board further considered the costs associated with the personnel, systems and equipment necessary to manage the Funds and to meet the regulatory and compliance requirements adopted by the SEC and other regulatory bodies as well as other expenses Krane pays in accordance with the advisory agreement.
The Board did not consider information regarding the costs of services provided or profits realized by each Sub-Adviser from its relationship with the Funds, noting instead the arm’s-length nature of the relationship between Krane and the Sub-Advisers with respect to the negotiation of the sub-advisory fee rate on behalf of each Fund and that Krane, and not the Fund, was responsible for paying the sub-advisory fees under each sub-advisory agreement.
Renewal of Advisory Agreements & Board Considerations (Unaudited) (concluded)
Under the totality of the circumstances, the Board concluded in the exercise of its reasonable business judgment, that the Funds were not excessively profitable to Krane, because, based on the information provided by Krane, Krane had not made a profit from its relationship with the Funds under the advisory agreements.
Other Benefits. The Board then considered the extent to which Krane and the Sub-Advisers derive ancillary benefits from the Funds’ operations, including potential benefits to Krane and the Sub-Advisers as a result of their ability to use Fund assets to engage in soft dollar transactions. Based on the materials provided to the Board, the Board determined that any other benefits realized by Krane and the Sub-Advisers from their relationship with the Funds were not a material factor to be considered in connection with the proposed renewal of the Agreements.
Economies of Scale. The Board considered Krane’s representation that none of the Funds were currently in a position to realize economies of scale. The Board thus determined to continue monitoring for potential economies of scale, but concluded that, at present, they were not a material factor for the Board to consider.
Conclusion. The Board did not identify any single factor as being of paramount importance, and different Trustees may have given different weight to different factors. The Board reviewed a memorandum from Trustee counsel discussing the legal standards applicable to its consideration of the Agreements. The Board noted that, as in the past, it would continue to monitor the Funds at its regular meetings and outside of the Board meetings. Based on its review, including consideration of each of the factors referenced above, the Board determined, in the exercise of its reasonable business judgment, that the advisory and sub-advisory arrangements, as outlined in the Agreements, were reasonable in light of the factors considered by the Board.
Disclosure of Fund Expenses (Unaudited)
As a shareholder of a Fund, you incur two types of costs: (1) transaction costs, including brokerage expenses; and (2) ongoing costs. All Exchange Traded Funds (‘‘ETFs’’) have operating expenses. As a shareholder of an ETF, your investment is affected by these ongoing costs, which include (among others) costs for ETF management, administrative services, commissions, and shareholder reports like this one. It is important for you to understand the impact of these costs on your investment returns. In addition, a shareholder is responsible for brokerage fees as a result of their investment in the Fund.
Operating expenses such as these are deducted from an ETF’s gross income and directly reduce its final investment return. These expenses are expressed as a percentage of the ETF’s average net assets; this percentage is known as the ETF’s expense ratio.
The following examples use the expense ratio and are intended to help you understand the ongoing costs (in dollars) of investing in your Fund and to compare these costs with those of other funds. The examples are based on an investment of $1,000 made at the beginning of the period shown and held for the entire period (October 1, 2016 to March 31, 2017).
The table on the next page illustrates your Fund’s costs in two ways:
Actual Fund Return. This section helps you to estimate the actual expenses that your Fund incurred over the period. The ‘‘Expenses Paid During Period’’ column shows the actual dollar expense cost incurred by a $1,000 investment in the Fund, and the ‘‘Ending Account Value’’ number is derived from deducting that expense cost from the Fund’s gross investment return.
You can use this information, together with the actual amount you invested in the Fund, to estimate the expenses you paid over that period. Simply divide your actual account value by $1,000 to arrive at a ratio (for example, an $8,600 account value divided by $1,000 = 8.6), then multiply that ratio by the number shown for your Fund under ‘‘Expenses Paid During Period.’’
Hypothetical 5% Return. This section helps you compare your Fund’s costs with those of other funds. It assumes that the Fund had an annual 5% return before expenses during the year, but that the expense ratio (Column 3) for the period is unchanged. This example is useful in making comparisons because the Securities and Exchange Commission requires all funds to make this 5% calculation. You can assess your Fund’s comparative cost by comparing the hypothetical result for your Fund in the ‘‘Expenses Paid During Period’’ column with those that appear in the same charts in the shareholder reports for other funds.
NOTE: Because the return is set at 5% for comparison purposes — NOT your Fund’s actual return — the account values shown may not apply to your specific investment.
Please note that the expenses shown in the table are meant to highlight your ongoing costs only and do not reflect any transactional costs, including brokerage commissions on the purchases and sale of Fund shares. Therefore, the expense examples are useful in comparing ongoing costs only, and will not help you determine the relative total costs of owning different funds. If these transactional costs had been included, your costs would have been higher.
Disclosure of Fund Expenses (Unaudited) (concluded)
| | | Beginning | | | Ending | | | | | | | |
| | | Account | | | Account | | | Annualized | | | Expenses | |
| | | Value | | | Value | | | Expense | | | Paid During | |
| | | 10/1/2016 | | | 3/31/2017 | | | Ratios | | | Period(1) | |
| KraneShares Bosera MSCI China A Share ETF(2) | | | | | | | | | | | | | | | | |
| Actual Fund Return | | $ | 1,000.00 | | | $ | 1,006.60 | | | | 0.69 | % | | $ | 3.45 | |
| Hypothetical 5% Return | | | 1,000.00 | | | | 1,021.49 | | | | 0.69 | | | | 3.48 | |
| KraneShares Zacks New China ETF | | | | | | | | | | | | | | | | |
| Actual Fund Return | | $ | 1,000.00 | | | $ | 1,113.70 | | | | 0.94 | % | | $ | 4.95 | |
| Hypothetical 5% Return | | | 1,000.00 | | | | 1,020.24 | | | | 0.94 | | | | 4.73 | |
| KraneShares CSI China Internet ETF | | | | | | | | | | | | | | | | |
| Actual Fund Return | | $ | 1,000.00 | | | $ | 1,037.00 | | | | 0.90 | % | | $ | 4.57 | |
| Hypothetical 5% Return | | | 1,000.00 | | | | 1,020.44 | | | | 0.90 | | | | 4.53 | |
| KraneShares E Fund China Commercial Paper ETF | | | | | | | | | | | | | | | | |
| Actual Fund Return | | $ | 1,000.00 | | | $ | 977.30 | | | | 1.40 | % | | $ | 6.90 | |
| Hypothetical 5% Return | | | 1,000.00 | | | | 1,017.95 | | | | 1.40 | | | | 7.04 | |
| KraneShares FTSE Emerging Markets Plus ETF | | | | | | | | | | | | | | | | |
| Actual Fund Return | | $ | 1,000.00 | | | $ | 1,045.00 | | | | 0.38 | % | | $ | 1.94 | |
| Hypothetical 5% Return | | | 1,000.00 | | | | 1,023.04 | | | | 0.38 | | | | 1.92 | |
| (1) | Expenses are equal to the Fund’s annualized expense ratio multiplied by the average account value over the period, multiplied by 182/365 (to reflect the one-half year period from 10/01/16-03/31/17). |
| (2) | As of February 17, 2017, pursuant to the terms of an Expense Limitation Agreement, the Adviser has contractually agreed to reduce its management fee to 0.58% of the Fund’s average daily net assets until July 31, 2017. Prior to February 17, 2017, the management fee was 0.78% before a contractual waiver and 0.68% after the contractual waiver. If the current fees had been in effect throughout the period, Actual Fund Return Expenses Paid During Period would have been $3.25 and the Hypothetical 5% Return Expenses Paid During Period would have been $3.28. |
Notice to Shareholders (Unaudited)
For shareholders that do not have a March 31, 2017 tax year end, this notice is for informational purposes only. For shareholders with a March 31, 2017 tax year end, please consult your tax advisor as to the pertinence of this notice. For the fiscal year ended March 31, 2017, the Funds are designating the following items with regard to distributions paid during the year.
| | | | | | | | | | | | | Qualifying for | | | | | | | | | | | | | |
| | | | | | | | | | | | | Corporate | | | | | | | | | | | | | |
| | | | Long-Term | | | Ordinary | | | | | | Dividends | | | Qualifying | | | U.S. | | | Interest | | | Short Term | |
| Return of | | | Capital Gain | | | Income | | | Total | | | Received | | | Dividend | | | Government | | | Related | | | Capital Gain | |
| Capital(1) | | | Distributions | | | Distributions | | | Distributions | | | Deduction(2) | | | Income(3) | | | Interest(4) | | | Dividends(5) | | | Dividends(6) | |
| KraneShares Bosera MSCI China A Share ETF | | | | | | | | | | | | | | | | | | | | | | | | | |
| | 77.43 | % | | | 22.57 | % | | | 0.00 | % | | | 100.00 | % | | | 0.00 | % | | | 0.00 | % | | | 0.00 | % | | | 0.00 | % | | | 0.00 | % |
| KraneShares Zacks New China ETF(7) | | | | | | | | | | | | | | | | | | | | | | | | | |
| | 51.33 | % | | | 0.00 | % | | | 48.67 | % | | | 100.00 | % | | | 2.92 | % | | | 100.00 | % | | | 0.00 | % | | | 0.10 | % | | | 0.00 | % |
| KraneShares CSI China Internet ETF(7) | | | | | | | | | | | | | | | | | | | | | | | | | |
| | 27.47 | % | | | 0.00 | % | | | 72.53 | % | | | 100.00 | % | | | 0.00 | % | | | 14.64 | % | | | 0.00 | % | | | 0.03 | % | | | 0.00 | % |
| KraneShares E Fund China Commercial Paper ETF | | | | | | | | | | | | | | | | | | | | | | | | |
| | 100.00 | % | | | 0.00 | % | | | 0.00 | % | | | 100.00 | % | | | 0.00 | % | | | 0.00 | % | | | 0.00 | % | | | 0.00 | % | | | 0.00 | % |
| KraneShares FTSE Emerging Markets Plus ETF(7) | | | | | | | | | | | | | | | | | | | | | |
| | 12.64 | % | | | 33.24 | % | | | 54.12 | % | | | 100.00 | % | | | 58.69 | % | | | 100.00 | % | | | 0.00 | % | | | 0.06 | % | | | 0.00 | % |
| (1) | Return of capital is a payment received from the fund that is not considered to be taxable income. The return of capital distribution is considered to be a return of the investor’s original investment and reduces the investor’s cost basis in the fund. |
| (2) | Qualifying dividends represent dividends which qualify for the corporate dividends received deduction and is reflected as a percentage of ordinary income distributions (the total of short term capital gain and net investment income distributions). |
| (3) | The percentage in this column represents the amount of ‘‘Qualifying Dividend Income’’ as created by the Jobs and Growth Relief Reconciliation Act of 2003 and is reflected as a percentage of ordinary income distributions (the total of short term capital gain and net investment income distributions). It is the intention of each of the aforementioned funds to designate the maximum amount permitted by law. |
| (4) | ‘‘U.S. Government Interest’’ represents the amount of interest that was derived from U.S. Government obligations and distributed during the fiscal year. Generally, interest from direct U.S. Government obligations is exempt from state income tax. However, for shareholders who are residents of California, Connecticut and New York, the statutory threshold requirements were not satisfied to permit exemption of these amounts from state income. |
| (5) | The percentage in this column represents the amount of ‘‘Interest Related Dividends’’ and is reflected as a percentage of ordinary income distributions that is exempt from U.S. withholding tax when paid for foreign investors. |
| (6) | The percentage in this column represents the amount of ‘‘Short Term Capital Gain Dividends’’ and is reflected as a percentage of short term capital gain distributions that is exempt from U.S. withholding tax when paid for foreign investors. |
| (7) | The KraneShares Zacks New China ETF, KraneShares CSI China Internet ETF and KraneShares FTSE Emerging Markets Plus ETF intend to pass through a foreign tax credit to their shareholders. For the fiscal year ended March 31, 2017, the total amount of foreign source income is $45,295, $852,955 and $39,555, respectively. The total amount of foreign tax to be paid is $3,384, $12,485, and $5,902, respectively. The allocable share of foreign tax credit will be reported on Form 1099-DIV. |
Supplemental Information (Unaudited)
Net asset value, or ‘‘NAV’’, is the price per Share at which the Funds issue and redeem Shares to Authorized Participants. It is calculated in accordance with the policies described in Note 2 in Notes to Financial Statements.) The ‘‘Market Price’’ of the Funds generally is determined using the midpoint between the highest bid and the lowest offer on the stock exchange on which the Shares of the Funds are listed for trading, as of the time that the Funds’ NAV is calculated. The Funds’ Market Price may be at, above or below their NAV. The NAV of the Funds will fluctuate with changes in the market value of their holdings. The Market Price of the Funds will fluctuate in accordance with changes in their NAV, as well as market supply and demand of Fund Shares.
Premiums or discounts are the differences (expressed as a percentage) between the NAV and Market Price of the Funds on a given day, generally at the time NAV is calculated. A premium is the amount that the Funds are trading above the reported NAV, expressed as a percentage of the NAV. A discount is the amount that the Funds are trading below the reported NAV, expressed as a percentage of the NAV. Shareholders may pay more than NAV when they buy Fund Shares and receive less than NAV when they sell those Shares, because Shares are bought and sold at Market Price.
Further information regarding premiums and discounts is available on the Funds’ website at http://kraneshares.com. The premium and discount information contained on the website represents past performance and cannot be used to predict future results.
(This page intentionally left blank.)
(This page intentionally left blank.)

KraneShares Trust:
1270 Avenue of the Americas, 22nd Floor
New York, New York 10020
1-855-857-2638
http://kraneshares.com/
Investment Adviser:
Krane Funds Advisors, LLC
1270 Avenue of the Americas, 22nd Floor
New York, New York 10020
Distributor:
SEI Investments Distribution Co.
One Freedom Valley Drive
Oaks, PA 19456
Administrator:
SEI Investments Global Funds Services
One Freedom Valley Drive
Oaks, PA 19456
This information must be preceded or accompanied by a current prospectus for the Funds described.

KraneShares Trust: |
| 1270 Avenue of the Americas, |
| 22nd Floor |
| New York, New York 10020 |
| |
| |
| KRS-AR-001-0400 |
The Registrant has adopted a code of ethics that applies to the Registrant's principal executive officer, principal financial officer, controller or principal accounting officer or any person who performs a similar function. During the period covered by the report, there were no amendments to the code of ethics, and the Registrant did not grant any waivers from a provision of the code of ethics.
| Item 3. | Audit Committee Financial Expert. |
(a) (1) The Registrant’s Board of Trustees has determined that the Registrant has an audit committee financial expert serving on the audit committee.
(a) (2) The audit committee financial expert, John Ferguson, is an independent trustee as defined in Form N-CSR Item 3 (a) (2)
| Item 4. | Principal Accountant Fees and Services. |
Fees billed by KPMG LLP (“KPMG”) in 2017 and PricewaterhouseCoopers LLP (“PwC”) in 2016 related to the Registrant.
In 2017 and 2016, KPMG and PwC, respectively, billed the Registrant aggregate fees for services rendered to the Registrant for the last two fiscal years as follows:
| | 2017 | 2016 |
| | | All fees and services to the Registrant that were pre-approved | All fees and services to service affiliates that were pre-approved | All other fees and services to service affiliates that did not require pre-approval | All fees and services to the Registrant that were pre-approved | All fees and services to service affiliates that were pre-approved | All other fees and services to service affiliates that did not require pre-approval |
| (a) | Audit Fees | $100,000 | $0 | N/A | $110,000 | $0 | N/A |
| (b) | Audit-Related Fees | $0 | $0 | N/A | $0 | $0 | N/A |
| (c) | Tax Fees(1) | $20,000 | $0 | N/A | $22,500 | $0 | N/A |
| (d) | All Other Fees | $0 | $0 | N/A | $0 | $0 | N/A |
Notes:
(1) These services included tax return preparation for the Funds.
(e)(1) Pursuant to the requirements of the Sarbanes Act, the SEC adopted Rule 2-01 under Regulation S-X, which, among other things, requires a fund’s audit committee to pre-approve certain audit and non-audit services that are provided by its independent auditors in order to ensure the auditors’ independence. The Registrant’s Board of Trustees has established an Audit Committee that has been charged with, among other things, assisting the Board of Trustees in its oversight of: the Registrant’s independent auditors; preapproving all audit and non-audit services provided by the Registrant’s independent auditors; the integrity of the Funds’ financial statements; the independent auditors’ qualifications and independence; and the use of appropriate accounting principles.
(e)(2) Percentage of fees billed applicable to non-audit services approved pursuant to the “de minimis” exception of Rule 2-01(c)(7)(i)(C) were as follows for KPMG in 2017 and PwC in 2016:
| | 2017 | 2016 |
Audit-Related Fees | 0% | 0% |
| Tax Fees | 0% | 0% |
All Other Fees | 0% | 0% |
(f) Not applicable.
(g) The aggregate non-audit fees and services billed by KPMG in 2017 and PwC in 2016 for the last two fiscal years were $20,000 and $22,500, respectively.
(h) During the past fiscal year, all non-audit services provided by Registrant’s principal accountant to either Registrant's investment adviser or to entities controlling, controlled by, or under common control with Registrant’s investment adviser that provides ongoing services to Registrant were pre-approved by the Audit Committee of Registrant's Board of Trustees. Included in the audit committee’s pre-approval was the review and consideration as to whether the provision of these non-audit services is compatible with maintaining the principal accountant’s independence.
| Items 5. | Audit Committee of Listed Registrants. |
The Registrant has a separately-designated standing Audit Committee, which is composed of the Registrant's Independent Trustees, Messrs. John Ferguson and Matthew Stroyman.
| Item 6. | Schedule of Investments |
Schedule of Investments is included as part of the Report to Shareholders filed under Item 1 of this form.
| Item 7. | Disclosure of Proxy Voting Policies and Procedures for Closed-End Management Investment Companies. |
Not applicable to open-end management investment companies.
| Item 8. | Portfolio Managers of Closed-End Management Investment Companies |
Not applicable to open-end management investment companies.
| Item 9. | Purchases of Equity Securities by Closed-End Management Company and Affiliated Purchasers. |
Not applicable to open-end management investment companies.
Item 10. Submission of Matters to a Vote of Security Holders.
There have been no changes to the procedures by which shareholders may recommend nominees to the Registrant’s Board of Trustees during the period covered by this report.
Item 11. Controls and Procedures.
(a) Based on the evaluation required by Rule 30a-3(b) under the 1940 Act (17 CFR 270.30a-3(b)) and Rules 13a-15(b) or 15d-15(b) under the Securities Exchange Act of 1934 (17 CFR 240.13a-15(b) or 240.15d-15(b)), and except as discussed below, the Registrant’s principal executive and principal financial officers, or persons performing similar functions, have concluded that the Registrant’s disclosure controls and procedures (as defined in Rule 30a-3(c) under the Investment Company Act of 1940 (the “1940 Act”) (17 CFR 270.30a-3(c))) as of a date within 90 days of the filing date of the report, are effective.
In connection with its audit of the Registrant’s financial statements for the period ended March 31, 2017, KPMG noted a matter involving internal control over financial reporting and its operations related to accrual of expenses for trustee fees. KPMG’s internal control report, which discussed this matter, is filed as an Exhibit to the Registrant’s most recent Form N-SAR.
(b) There has been no change in the Registrant’s internal control over financial reporting (as defined in Rule 30a-3(d) under the 1940 Act (17 CFR 270.30a-3(d)) that occurred during the second fiscal quarter of the period covered by this report that has materially affected, or is reasonably likely to materially affect, the Registrant’s internal control over financial reporting.
Subsequent to the Registrant’s last fiscal year, a control enhancement has been implemented to ensure that trustee fees and expenses, as discussed above, are properly accrued for and reviewed for reasonableness.
Items 12. Exhibits.
(a)(1) Code of Ethics attached hereto.
(a)(2) A certification for the principal executive officer and the principal financial officer of the Registrant as required by Rule 30a-2(a) under the 1940 Act, as amended (17 CFR 270.30a-2(a)), is filed herewith.
(b) Officer certification as required by Rule 30a-2(b) under the 1940 Act, as amended (17 CFR 270.30a-2(b)) also accompany this filing as an exhibit.
SIGNATURES
Pursuant to the requirements of the Securities Exchange Act of 1934 and the Investment Company Act of 1940, the Registrant has duly caused this report to be signed on its behalf by the undersigned, thereunto duly authorized.
| By: | /s/ Jonathan Krane |
| | Jonathan Krane |
| | Trustee and Principal Executive Officer |
Date: June 7, 2017
Pursuant to the requirements of the Securities Exchange Act of 1934 and the Investment Company Act of 1940, this report has been signed below by the following persons on behalf of the registrant and in the capacities and on the dates indicated.
| By: | /s/ Jonathan Krane |
| | Jonathan Krane |
| | Trustee and Principal Executive Officer |
Date: June 7, 2017
| By: | /s/ Jonathan Krane |
| | Jonathan Krane |
| | Principal Financial Officer |
Date: June 7, 2017