UNITED STATES
SECURITIES AND EXCHANGE COMMISSION
Washington, D.C. 20549
FORM N-CSR
CERTIFIED SHAREHOLDER REPORT OF REGISTERED MANAGEMENT
INVESTMENT COMPANIES
Investment Company Act File number 811-22698
KraneShares Trust
(Exact name of registrant as specified in charter)
1270 Avenue of the Americas
22ndFloor
New York, New York, 10020
(Address of principal executive offices) (Zip code)
Jonathan Krane
KraneShares Trust
1270 Avenue of the Americas
22ndFloor
New York, New York, 10020
(Name and address of agent for service)
Copy to:
Stacy L. Fuller
K&L Gates LLP
1601 K Street NW
Washington, DC 20006-1600
Registrant’s telephone number, including area code: (855) 857-2638
Date of fiscal year end: March 31, 2019
Date of reporting period: March 31, 2019
| Item 1. | Reports to Stockholders. |
The Registrant’s schedules as of the close of the reporting period, as set forth in §§ 210.12-12 through 210.12-14 of Regulation S-X [17 CFR §§ 210-12.12-12.14], are attached hereto.

| | | Annual Report KraneShares CICC China Leaders 100 Index ETF (Formerly, KraneShares Zacks New China ETF) KraneShares CSI China Internet ETF KraneShares Bosera MSCI China A Share ETF KraneShares E Fund China Commercial Paper ETF KraneShares MSCI All China Index ETF (Formerly, KraneShares FTSE Emerging Market Plus ETF) KraneShares MSCI One Belt One Road Index ETF KraneShares Emerging Markets Consumer Technology Index ETF KraneShares MSCI China Environment Index ETF KraneShares Electric Vehicles and Future Mobility Index ETF KraneShares MSCI All China Health Care Index ETF KraneShares CCBS China Corporate High Yield Bond USD Index ETF KraneShares Emerging Markets Healthcare Index ETF Beginning on January 1, 2021, as permitted by regulations adopted by the Securities and Exchange Commission, paper copies of the Fund’s shareholder reports will no longer be sent by mail, unless you specifically request paper copies of the reports from the Fund (if you hold your Fund shares directly with the Fund) or from your financial intermediary, such as a broker-dealer or bank (if you hold your Fund shares through a financial intermediary). Instead, the reports will be made available on a website, and you will be notified by mail each time a report is posted and provided with a website link to access the report. If you already elected to receive shareholder reports electronically, you will not be affected by this change and you need not take any action. If you hold your Fund shares directly with the Fund, you may elect to receive shareholder reports and other communications electronically from the Fund by contacting the Fund at 855-857-2638 or, if you hold your Fund shares through a financial intermediary, contacting your financial intermediary. You may elect to receive all future reports in paper free of charge. If you hold your Fund shares directly with the Fund, you can inform the Fund that you wish to continue receiving paper copies of your shareholder reports at 855-857-2638 or, if you hold your Fund shares through a financial intermediary, contacting your financial intermediary. Your election to receive reports in paper will apply to all of the KraneShares Funds you hold directly with series of the Trust or through your financial intermediary, as applicable. March 31, 2019 |
Table of Contents
| Management Discussion of Fund Performance (Unaudited) | | 1 |
| Schedules of Investments | | |
| KraneShares CICC China Leaders 100 Index ETF | | 30 |
| KraneShares CSI China Internet ETF | | 34 |
| KraneShares Bosera MSCI China A Share ETF | | 37 |
| KraneShares E Fund China Commercial Paper ETF | | 44 |
| KraneShares MSCI All China Index ETF | | 48 |
| KraneShares MSCI One Belt One Road Index ETF | | 57 |
| KraneShares Emerging Markets Consumer Technology Index ETF | | 62 |
| KraneShares MSCI China Environment Index ETF | | 66 |
| KraneShares Electric Vehicles and Future Mobility Index ETF | | 69 |
| KraneShares MSCI All China Health Care Index ETF | | 73 |
| KraneShares CCBS China Corporate High Yield Bond USD Index ETF | | 75 |
| KraneShares Emerging MarketsHealthcare Index ETF | | 79 |
| Statements of Assets and Liabilities | | 82 |
| Statements of Operations | | 86 |
| Statements of Changes in Net Assets | | 90 |
| Financial Highlights | | 102 |
| Notes to Financial Statements | | 106 |
| Report of Independent Registered Public Accounting Firm | | 130 |
| Trustees and Officers of the Trust (Unaudited) | | 133 |
| Disclosure of Fund Expenses (Unaudited) | | 135 |
| Notice to Shareholders (Unaudited) | | 137 |
| Supplemental Information (Unaudited) | | 139 |
The Funds file their complete schedules of Fund holdings with the Securities and Exchange Commission (the “Commission”) for the first and third quarters of each fiscal year as an exhibit to its reports on Form N-PORT within sixty days after the end of the period. The Funds’ Form N-PORT reports are available on the Commission’s website at http://www.sec.gov, and may be reviewed and copied at the Commission’s Public Reference Room in Washington, DC. Information on the operation of the Public Reference Room may be obtained by calling 1-800-SEC-0330.
A description of the policies and procedures that KraneShares Trust uses to determine how to vote proxies relating to Fund securities, as well as information relating to how the Funds voted proxies relating to Fund securities during the most recent 12-month year ended June 30, are available (i) without charge, upon request, by calling 855-857-2638; and (ii) on the Commission’s website at http://www.sec.gov.
Fund shares may only be purchased or redeemed from a Fund in large Creation Unit aggregations. Investors who cannot transact in Creation Units of a Fund’s shares must buy or sell Fund shares in the secondary market at their market price, which may be at a premium or discount to a Fund’s net asset value, with the assistance of a broker. In doing so, the investor may incur brokerage commissions and may pay more than net asset value when buying Fund shares and receive less than net asset value when selling Fund shares.
Management Discussion of Fund Performance (Unaudited)
Dear Shareholders:
We are pleased to send you the Annual Report for KraneShares exchange-traded funds (“ETFs”) for the 12-month period ended March 31, 2019.
For the period, the ETFs delivered the following total returns:
| Fund | | Return* | | Underlying
Index
Return** | | Morningstar
Peer Group
Median | |
| KraneShares Bosera MSCI China A Share ETF (KBA) | | | -4.01%· | | | -5.77% | (a) | | | -6.40% | (1) | |
| KraneShares CICC China Leaders 100 Index ETF (KFYP) | | | -0.62%· | | | -0.83% | (b) | | | -6.40% | (1) | |
| KraneShares CSI China Internet ETF (KWEB) | | | -20.44%· | | | -19.88% | (c) | | | -6.40% | (1) | |
| KraneShares MSCI All China Index ETF (KALL) | | | -3.52%· | | | -3.13% | (d) | | | -6.40% | (1) | |
| KraneShares MSCI China Environment Index ETF (KGRN) | | | -13.28%· | | | -12.50% | (e) | | | -6.40% | (1) | |
| KraneShares MSCI All China Health Care Index ETF (KURE) | | | -15.99%· | | | -16.71% | (f) | | | -6.40% | (1) | |
| KraneShares MSCI One Belt One Road Index ETF (OBOR) | | | -4.94%· | | | -3.76% | (g) | | | -9.31% | (2) | |
| KraneShares Emerging Markets Consumer Technology Index ETF (KEMQ) | | | -13.37%· | | | -12.79% | (h) | | | -9.31% | (2) | |
| KraneShares Electric Vehicles and Future Mobility Index ETF (KARS) | | | -10.19%· | | | -10.55% | (i) | | | 0.04% | (3) | |
| KraneShares E Fund China Commercial Paper ETF (KCNY) | | | -2.52%· | | | -2.54% | (j) | | | 0.70% | (4) | |
| KraneSahres CCBS China Corporate High Yield Bond USD Index ETF (KCCB) | | | 5.72%^ | | | 8.84% | (k) | | | N/A | | |
KraneShares Emerging Market Healthcare
Index ETF (KMED) | | | -10.47%^ | | | -10.75% | (l) | | | N/A | | |
For comparison, below are the returns of broad-based U.S. and international market indexes, including emerging market and China indexes. The indexes provide measures of the broad market performance of U.S. and international equities, including emerging market and China equities.
| Index | | One-Year
Return** | |
| S&P 500 Index | | 9.50% | |
| JPMorgan EMBI Global Core Index | | 3.96% | |
| MSCI Emerging Markets Index | | -7.41% | |
| MSCI China All Shares Index | | -6.82% | |
We are encouraged by the steady progress being made by China to increase access to local Mainland Chinese markets for international investors, as well as by the heightened demand and awareness of these markets by the global investor community.
| • | We believe that China will continue to grow and be an essential element of a well-designed investment portfolio. |
| • | We believe that investors should have low-cost, transparent tools to obtain exposure to Chinese equity and fixed income markets. |
| • | We are dedicated to helping investors obtain more complete passive market exposures and more balanced investment portfolios. |
Thank you for investing with us.
Jonathan Krane, CEO
March 31, 2019
Management Discussion of Fund Performance (Unaudited)(continued)
____________
| * | Return based on net asset value as of March 31, 2019 |
| ** | Return as of March 31, 2019. Indices are unmanaged and do not include the effect of fees. One cannot invest directly in an index. |
| • | Return for one-year period |
| ^ | Return period since Fund inception (less than one-year period) |
| | | Morning Star
Peer Group Median | | Morningstar Peer Group Name |
| (1) | | -6.40% | | U.S. Fund China Region |
| (2) | | -9.31% | | U.S. Fund Diversified Emerging Markets |
| (3) | | 0.04% | | U.S. Fund Industrials |
| (4) | | 0.70% | | U.S. Fund Emerging Markets Bond |
(a) The underlying index for KraneShares Bosera MSCI China A Share ETF.
(b) The underlying index for KraneShares CICC China Leaders 100 Index ETF.
(c) The underlying index for KraneShares CSI China Internet ETF.
(d) The underlying index for KraneShares MSCI All China Index ETF.
(e) The underlying index for KraneShares MSCI China Environment Index ETF.
(f) The underlying index for KraneShares MSCI All China Health Care Index ETF.
(g) The underlying index for KraneShares MSCI One Belt One Road Index ETF.
(h) The underlying index for KraneShares Emerging Markets Consumer Technology Index ETF.
(i) The underlying index for KraneShares Electric Vehicles and Future Mobility Index ETF.
(j) The underlying index for KraneShares E Fund China Commercial Paper ETF.
(k) The underlying index for KraneShares CCBS China Corporate High Yield Bond USD Index ETF.
(l) The underlying index for KraneShares Emerging Market Healthcare Index ETF.
TheS&P 500 Index is a market capitalization weighted composite index of 500 large-cap U.S. companies.
TheMSCI China All Shares Indexcaptures large and mid-cap representation across China A-shares, B-shares, H-shares, Red-chips, P-chips and foreign listings (e.g. American Depository Receipts, “ADR”s). The index aims to reflect the opportunity set of China share classes listed in Hong Kong, Shanghai, Shenzhen and outside of China.
TheJPMorgan EMBI Global Core Index is a broad, diverse U.S. dollar denominated emerging markets debt benchmark that tracks the total return of actively traded debt instruments in emerging market countries.
TheMSCI Emerging Markets Indexis a free-float adjusted market capitalization index that is designed to measure equity market performance of emerging markets.
TheMorningstar Fund China RegionCategory portfolios invest almost exclusively in stocks from China, Taiwan, and Hong Kong. These portfolios invest at least 70% of total assets in equities and invest at least 75% of stock assets in one specific region or a combination of China, Taiwan, and/ or Hong Kong.
TheMorningstar Fund Diversified Emerging Markets Category portfolios tend to divide their assets among 20 or more nations, although they tend to focus on the emerging markets of Asia and Latin America rather than on those of the Middle East, Africa, or Europe. These portfolios invest predominantly in emerging market equities, but some funds also invest in both equities and fixed income investments from emerging markets.
Management Discussion of Fund Performance (Unaudited)(continued)
TheMorningstar Fund Emerging Markets Bond portfolios invest more than 65% of their assets in foreign bonds from developing countries. The largest portion of the emerging-markets bond market comes from Latin America, followed by Eastern Europe. Africa, the Middle East, and Asia make up the rest.
TheMorningstar Fund IndustrialsCategory portfolios seek capital appreciation by investing in equity securities of U.S. or non-U.S. companies that are engaged in services related to cyclical industries. This includes and is not limited to companies in aerospace and defense, automotive, chemicals, construction, environmental services, machinery, paper and transportation.
Management Discussion of Fund Performance (Unaudited)(continued)
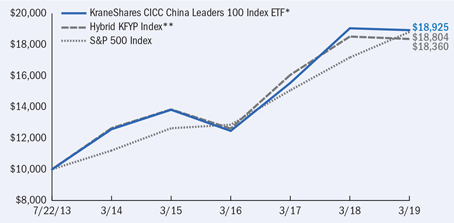
KraneShares CICC China Leaders 100 Index ETF
The KraneShares CICC China Leaders 100 Index ETF (the ‘‘Fund’’) seeks to provide investment results that, before fees and expenses, correspond generally to the price and yield performance of the CSI CICC Select 100 Index (the ‘‘Underlying Index’’).
The Underlying Index takes a smart-beta approach to systematically investing in companies listed in Mainland China. The strategy is based on China International Capital Corporation (“CICC”)’s latest research on China’s capital markets. This quantitative approach reflects CICC’s top down and bottom up research process, seeking to deliver the 100 leading companies in Mainland China.
China review
In the fiscal year from April 1, 2018 through March 31, 2019, global equity markets faced two main challenges, each of which materially affected the performance of the Fund: an uncertain rate cycle from the U.S. Federal Reserve (“Fed”) and trade tensions between the U.S. and China. Trade tensions initially had an outsized negative impact on Chinese equities compared to the U.S., however, by the end of December 2018, U.S. equities experienced a steep decline exacerbated by hawkish Fed comments. This volatility in U.S. markets caused the Fed to forgo raising rates for the foreseeable future accompanied by a temporary trade truce between the U.S. and China. Both Chinese and U.S. equity markets rebounded sharply in January 2019 and have since continued to climb, though trade concerns and global equity market volatility still lingers.
We see two key positive developments for the opening up of China’s capital markets:
| • | On February 28, 2019, MSCI made a larger than expected China A-Share inclusion announcement. MSCI will increase the inclusion factor of China A-Shares in their Global Standard Indexes from 5% to 20% in 2019. |
| • | On April 1, 2019, Bloomberg Barclays began including renminbi (“RMB”)-denominated bonds issued by the Chinese government and policy banks into their Global Aggregate Index, tracked by $2.5 trillion in assets. |
China Capital Market Overview
| • | China’s equity market, as measured by the MSCI China All Shares Index, was down for the period, returning -6.4%, while China’s currency, the RMB depreciated 6.9% against the U.S. dollar. |
| • | The best performing sectors across China’s equity markets included Communication Services (+16.38%), Energy (+4.84%) and Utilities (+3.74%). |
| • | The worst performing sectors across China’s equity markets were Health Care (-20.32%), Consumer Discretionary (-17.58%) and Materials (-16.74%). |
By the Fund’s fiscal year end on March 31, 2019 (the ‘‘reporting period’’), the NAV of the Fund decreased 0.62% for the year, while the Underlying Index decreased 0.83%.
The Fund held 32% of the portfolio in the Financials Sector and 20% in the Consumer Discretionary Sector.
Management Discussion of Fund Performance (Unaudited)(continued)
KraneShares CICC China Leaders 100 Index ETF(concluded)
Growth of a $10,000 Investment‡
(at Net Asset Value)‡
AVERAGE TOTAL RETURN FOR THE PERIOD ENDED MARCH 31, 2019*
| | | One Year
Return | | Three Year
Return | | Five Year
Return | | Annualized
Inception to Date | |
| | | Net
Asset
Value | | Market
Price^ | | Net
Asset
Value | | Market
Price^ | | Net
Asset
Value | | Market
Price^ | | Net
Asset
Value | | Market
Price^ | |
KraneShares CICC China
Leaders 100 Index ETF | | | -0.62% | | | -1.97%‡ | | | 14.94%‡ | | | 15.45%‡ | | | 8.53%‡ | | | 7.83%‡ | | | 11.86%‡ | | | 11.31%‡ | |
| Hybrid KFYP Index (Net)** | | | N/A | | | -0.83%‡ | | | N/A | | | 13.32%‡ | | | N/A | | | 7.75%‡ | | | N/A | | | 11.26%‡ | |
| S&P 500 Index | | | N/A | | | 9.50%‡ | | | N/A | | | 13.51%‡ | | | N/A | | | 10.91%‡ | | | N/A | | | 11.73%‡ | |
| * | The Fund commenced operations on July 22, 2013. |
| ** | The Hybrid KFYP Index (Net) consists of the CSI China Overseas Five Year Plan Index from the inception of the Fund through May 31, 2016, the Zacks New China Index from June 1, 2016 through November 1, 2018, and the CSI CICC Select 100 Index going forward. From June 1, 2016 to November 1, 2018, the Fund sought to provide investment results that, before fees and expenses, corresponded generally to the price and yield performance of the Zacks New China Index. Prior to June 1, 2016, the Fund was known as the KraneShares CSI New China ETF and sought to provide investment results that, before fees and expenses, corresponded generally to the price and yield performance of the CSI Overseas China Five-Year Plan Index. Hybrid KFYP Index (Net) Reflects reinvested dividends net of withholding taxes, but reflects no deduction for fees, expenses, or other taxes. |
| ^ | The “Market Price” of the Funds generally is determined using the midpoint between the highest bid and the lowest offer on the stock exchange on which the Shares of the Funds are listed for trading, as of the time that the Funds’ NAV is calculated. |
The performance data quoted herein represents past performance and the return and value of an investment in the Fund will fluctuate so that, when redeemed, may be worth less than its original cost. Current performance may be lower or higher than the performance data quoted. Past performance is no guarantee of future performance and should not be considered as a representation of the future results of the Fund. For performance data current to the most recent month end, please call 855-857-2638 or visit www.kraneshares.com. The Fund’s performance assumes the reinvestment of all dividends and all capital gains. Index returns assume reinvestment of dividends and, unlike a Fund’s returns, do not reflect any fees or expenses. If such fees and expenses were included in the index returns, the performance would have been lower. As stated in the Fund’s prospectus, the Fund’s operating expense ratio is 0.71%. Please note that one cannot invest directly in an unmanaged index. There are no assurances that the Fund will meet its stated objectives. The Fund’s holdings and allocations are subject to change and should not be considered recommendations to buy individual securities. For further information on the Fund’s objectives, risks, and strategies, see the Fund’s prospectus. Returns shown do not reflect the deduction of taxes that a shareholder would pay on Fund distributions or the redemption of Fund shares.
Management Discussion of Fund Performance (Unaudited)(continued)
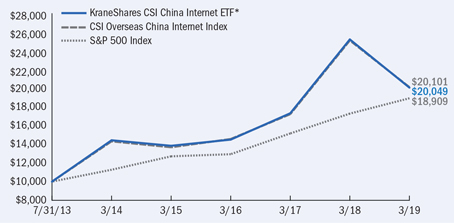
KraneShares CSI China Internet ETF
The KraneShares CSI China Internet ETF (the ‘‘Fund’’) seeks to provide investment results that, before fees and expenses, correspond generally to the price and yield performance of the CSI Overseas China Internet Index (the ‘‘Underlying Index’’).
The Underlying Index is designed to measure the performance of the investable universe of publicly traded China-based companies whose primary business or businesses are in the Internet and Internet-related sectors (‘‘China Internet Companies’’), as defined by the index sponsor, China Securities Index Co., Ltd. (‘‘CSI’’).
China review
In the fiscal year from April 1, 2018 through March 31, 2019, global equity markets faced two main challenges, each of which materially affected the performance of the Fund: an uncertain rate cycle from the U.S. Federal Reserve (“Fed”) and trade tensions between the U.S. and China. Trade tensions initially had an outsized negative impact on Chinese equities compared to the U.S., however, by the end of December 2018, U.S. equities experienced a steep decline exacerbated by hawkish Fed comments. This volatility in U.S. markets caused the Fed to forgo raising rates for the foreseeable future accompanied by a temporary trade truce between the U.S. and China. Both Chinese and U.S. equity markets rebounded sharply in January 2019 and have since continued to climb, though trade concerns and global equity market volatility still lingers.
We see two key positive developments for the opening up of China’s capital markets:
| • | On February 28, 2019, MSCI made a larger than expected China A-Share inclusion announcement. MSCI will increase the inclusion factor of China A-Shares in their Global Standard Indexes from 5% to 20% in 2019. |
| • | On April 1, 2019, Bloomberg Barclays began including renminbi (“RMB”)-denominated bonds issued by the Chinese government and policy banks into their Global Aggregate Index, tracked by $2.5 trillion in assets. |
China Capital Market Overview
| • | China’s equity market, as measured by the MSCI China All Shares Index, was down for the period, returning -6.4%, while China’s currency, the RMB depreciated 6.9% against the U.S. dollar. |
| • | The best performing sectors across China’s equity markets included Communication Services (+16.38%), Energy (+4.84%) and Utilities (+3.74%). |
| • | The worst performing sectors across China’s equity markets were Health Care (-20.32%), Consumer Discretionary (-17.58%) and Materials (-16.74%). |
By the Fund’s fiscal year end on March 31, 2019 (the ‘‘reporting period’’), the NAV of the Fund decreased 20.44% for the year, while the Underlying Index decreased 19.88%.
The Fund held 55% of the portfolio in the Global Communication Services Sector and 38% in the Consumer Discretionary Sector.
Management Discussion of Fund Performance (Unaudited)(continued)
KraneShares CSI China Internet ETF(concluded)
Growth of a $10,000 Investment‡
(at Net Asset Value)‡
AVERAGE TOTAL RETURN FOR THE PERIOD ENDED MARCH 31, 2019*
| | | One Year
Return | | Three Year
Return | | Five Year
Return | | Annualized
Inception to Date | |
| | | Net
Asset
Value | | Market
Price^ | | Net
Asset
Value | | Market
Price^ | | Net Asset
Value | | Market
Price^ | | Net
Asset
Value | | Market Price^ | |
KraneShares CSI
China Internet ETF | | | -20.44% | | | -20.53%‡ | | | 11.46%‡ | | | 11.35%‡ | | | 6.82%‡ | | | 6.78%‡ | | | 13.06%‡ | | | 13.07%‡ | |
CSI Overseas China
Internet Index | | | N/A | | | -19.88%‡ | | | N/A | | | 11.37%‡ | | | N/A | | | 7.04%‡ | | | N/A | | | 13.11%‡ | |
| S&P 500 Index | | | N/A | | | 9.50%‡ | | | N/A | | | 13.51%‡ | | | N/A | | | 10.91%‡ | | | N/A | | | 11.89%‡ | |
| * | The Fund commenced operations on July 31, 2013. |
| ^ | The “Market Price” of the Funds generally is determined using the midpoint between the highest bid and the lowest offer on the stock exchange on which the Shares of the Funds are listed for trading, as of the time that the Funds’ NAV is calculated. |
The performance data quoted herein represents past performance and the return and value of an investment in the Fund will fluctuate so that, when redeemed, may be worth less than its original cost. Current performance may be lower or higher than the performance data quoted. Past performance is no guarantee of future performance and should not be considered as a representation of the future results of the Fund. For performance data current to the most recent month end, please call 855-857-2638 or visit www.kraneshares.com. The Fund’s performance assumes the reinvestment of all dividends and all capital gains. Index returns assume reinvestment of dividends and, unlike a Fund’s returns, do not reflect any fees or expenses. If such fees and expenses were included in the index returns, the performance would have been lower. As stated in the Fund’s prospectus, the Fund’s operating expense ratio is 0.70%. Please note that one cannot invest directly in an unmanaged index. There are no assurances that the Fund will meet its stated objectives. The Fund’s holdings and allocations are subject to change and should not be considered recommendations to buy individual securities. For further information on the Fund’s objectives, risks, and strategies, see the Fund’s prospectus. Returns shown do not reflect the deduction of taxes that a shareholder would pay on Fund distributions or the redemption of Fund shares.
Management Discussion of Fund Performance (Unaudited)(continued)
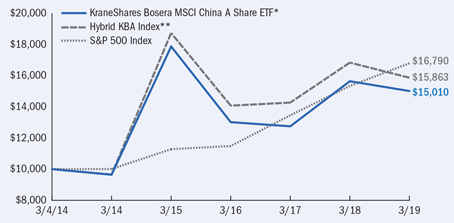
KraneShares Bosera MSCI China A Share ETF
The KraneShares Bosera MSCI China A Share ETF (the ‘‘Fund’’) seeks to provide investment results that, before fees and expenses, correspond to the price and yield performance of the MSCI China A Inclusion Index (the ‘‘Underlying Index’’).
The Underlying Index is designed to track the progressive partial inclusion of A shares in the MSCI Emerging Markets Index over time. The index is designed for global investors accessing the A shares market using the Stock Connect framework and is calculated using China A Stock Connect listings based on the offshore renminbi (“RMB”) exchange rate (CNH).
China Review
In the fiscal year from April 1, 2018 through March 31, 2019, global equity markets faced two main challenges, each of which materially affected the performance of the Fund: an uncertain rate cycle from the U.S. Federal Reserve (“Fed”) and tensions between the U.S. and China. Trade tensions initially had an outsized negative impact on Chinese equities compared to the U.S. However, by the end of December 2018, U.S. equities experienced a steep decline exacerbated by hawkish Fed comments. This volatility in U.S. markets caused the Fed to forgo raising rates for the foreseeable future accompanied by a temporary trade truce between the U.S. and China. Both Chinese and U.S. equity markets rebounded sharply in January 2019 and have since continued to climb, though trade concerns and global equity market volatility still lingers.
We see two key positive developments for the opening up of China’s capital markets:
| • | On February 28, 2019, MSCI made a larger than expected China A-Share inclusion announcement. MSCI will increase the inclusion factor of China A-Shares in their Global Standard Indexes from 5% to 20% in 2019. |
| • | On April 1, 2019, Bloomberg Barclays began including RMB-denominated bonds issued by the Chinese government and policy banks into their Global Aggregate Index, tracked by $2.5 trillion in assets. |
China Capital Market Overview
| • | China’s equity market, as measured by the MSCI China All Shares Index, was down for the period, returning -6.4%, while China’s currency, the RMB depreciated 6.9% against the U.S. dollar. |
| • | The best performing sectors across China’s equity markets included Communication Services (+16.38%), Energy (+4.84%) and Utilities (+3.74%). |
| • | The worst performing sectors across China’s equity markets were Health Care (-20.32%), Consumer Discretionary (-17.58%) and Materials (-16.74%). |
By the Fund’s fiscal year end on March 31, 2019 (the ‘‘reporting period’’), the NAV of the Fund decreased 4.01% for the year, while the Underlying Index decreased 5.77%.
The Fund held 34% of the portfolio in the Financials Sector and 13% in the Consumer Staples Sector.
Management Discussion of Fund Performance (Unaudited)(continued)
KraneShares Bosera MSCI China A Share ETF(continued)
Growth of a $10,000 Investment‡
(at Net Asset Value)‡
AVERAGE TOTAL RETURN FOR THE PERIOD ENDED MARCH 31, 2019*
| | | One Year
Return | | Three Year
Return | | Five Year
Return | | Annualized
Inception to Date | |
| | | Net
Asset
Value | | Market
Price^ | | Net
Asset Value | | Market
Price^ | | Net Asset
Value | | Market
Price^ | | Net
Asset
Value | | Market
Price^ | |
KraneShares Bosera
MSCI China A
Share ETF | | | -4.01% | | | -5.30%‡ | | | 4.88%‡ | | | 4.99%‡ | | | 9.26%‡ | | | 9.11%‡ | | | 8.34%‡ | | | 8.37%‡ | |
| Hybrid KBA Index** | | | N/A | | | -5.77%‡ | | | N/A | | | 4.08%‡ | | | N/A | | | 10.45%‡ | | | N/A | | | 9.52%‡ | |
| S&P 500 Index | | | N/A | | | 9.50%‡ | | | N/A | | | 13.51%‡ | | | N/A | | | 10.91%‡ | | | N/A | | | 10.75%‡ | |
| * | The Fund commenced operations on March 4, 2014. |
| ** | The Hybrid KBA Index consists of the MSCI China A Index from the inception of the Fund through October 23, 2014, the MSCI China A International Index from October 23, 2014 through December 26, 2017 and the MSCI China A Inclusion Index going forward. From October 23, 2014 through December 26, 2017, the Fund sought investment results that, before fees and expenses, corresponded to the price and yield performance of the MSCI China A International Index. Prior to October 23, 2014, the Fund sought investment results that, before fees and expenses, corresponded to the price and yield performance of the MSCI China A Index. |
| ^ | The “Market Price” of the Funds generally is determined using the midpoint between the highest bid and the lowest offer on the stock exchange on which the Shares of the Funds are listed for trading, as of the time that the Funds’ NAV is calculated. |
The performance data quoted herein represents past performance and the return and value of an investment in the Fund will fluctuate so that, when redeemed, may be worth less than its original cost. Current performance may be lower or higher than the performance data quoted. Past performance is no guarantee of future performance and should not be considered as a representation of the future results of the Fund. For performance data current to the most recent month end, please call 855-857-2638 or visit www.kraneshares.com. The Fund’s performance assumes the reinvestment of all dividends and all capital gains. Index returns assume reinvestment of dividends and, unlike a Fund’s returns, do not reflect any fees or expenses. If such fees and expenses were included in the index returns, the performance would have been lower. As stated in the Fund’s prospectus, as supplemented, the Fund’s gross operating expense ratio is 0.80% and its net expense ratio is 0.60% due to an Expense Limitation Agreement whereby the Fund’s investment manager, Krane Funds Advisors, LLC, has contractually agreed to reduce its management fee to 0.20% of the Fund’s average daily net assets until October 4, 2019. Please note that one cannot invest directly in an unmanaged index. There are no assurances that the Fund
Management Discussion of Fund Performance (Unaudited)(continued)
KraneShares Bosera MSCI China A Share ETF(concluded)
will meet its stated objectives. The Fund’s holdings and allocations are subject to change and should not be considered recommendations to buy individual securities. For further information on the Fund’s objectives, risks, and strategies, see the Fund’s prospectus. Returns shown do not reflect the deduction of taxes that a shareholder would pay on Fund distributions or the redemption of Fund shares.
Management Discussion of Fund Performance (Unaudited)(continued)
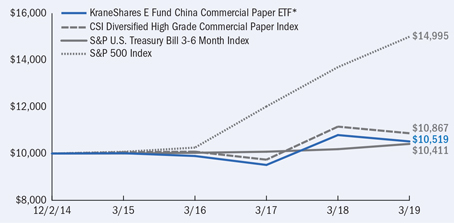
KraneShares E Fund China Commercial Paper ETF
The KraneShares E Fund China Commercial Paper ETF (the ‘‘Fund’’) seeks to provide investment results that, before fees and expenses, correspond to the price and yield performance of the CSI Diversified High Grade Commercial Paper Index (the ‘‘Underlying Index’’).
The Underlying Index seeks to deliver a diversified basket of investment-grade (according to a Chinese ratings organization) on-shore renminbi (“RMB”)-denominated commercial paper issued by sovereign, quasi-sovereign and corporate issuers in the People’s Republic of China and traded in the inter-bank bond market. A commercial paper issue must have at least RMB ¥600 million outstanding and a remaining term to final maturity of no more than one year (365 days) and no less than one month (31 days).
China Review
In the fiscal year from April 1, 2018 through March 31, 2019, global equity markets faced two main challenges, each of which materially affected the performance of the Fund: an uncertain rate cycle from the U.S. Federal Reserve (“Fed”) and trade tensions between the U.S. and China. Trade tensions initially had an outsized negative impact on Chinese equities compared to the U.S., however, by the end of December 2018, U.S. equities experienced a steep decline exacerbated by hawkish Fed comments. This volatility in U.S. markets caused the Fed to forgo raising rates for the foreseeable future accompanied by a temporary trade truce between the U.S. and China. Both Chinese and U.S. equity markets rebounded sharply in January 2019 and have since continued to climb, though trade concerns and global equity market volatility still lingers.
We see two key positive developments for the opening up of China’s capital markets:
| • | On February 28, 2019, MSCI made a larger than expected China A-Share inclusion announcement. MSCI will increase the inclusion factor of China A-Shares in their Global Standard Indexes from 5% to 20% in 2019. |
| • | On April 1, 2019, Bloomberg Barclays began including RMB-denominated bonds issued by the Chinese government and policy banks into their Global Aggregate Index, tracked by $2.5 trillion in assets. |
China Capital Market Overview
| • | China’s equity market, as measured by the MSCI China All Shares Index, was down for the period, returning -6.4%, while China’s currency, the RMB depreciated 6.9% against the U.S. dollar. |
| • | The best performing sectors across China’s equity markets included Communication Services (+16.38%), Energy (+4.84%) and Utilities (+3.74%). |
| • | The worst performing sectors across China’s equity markets were Health Care (-20.32%), Consumer Discretionary (-17.58%) and Materials (-16.74%). |
By the Fund’s fiscal year end on March 31, 2019 (the ‘‘reporting period’’), the NAV of the Fund decreased 2.52% for the year, while the Underlying Index decreased 2.54%.
Yields in Mainland China’s Interbank Bond Market were comparable to yields in the United States Bonds. Short term yields on one-year maturities were 2.44% in China and 2.39% in the United States.
Management Discussion of Fund Performance (Unaudited)(continued)
KraneShares E Fund China Commercial Paper ETF(concluded)
Growth of a $10,000 Investment‡
(at Net Asset Value)‡
AVERAGE ANNUAL TOTAL RETURN FOR THE PERIOD ENDED MARCH 31, 2019*
| | | One Year
Return | | Three Year
Return | | Annualized
Inception to Date | |
| | | Net Asset
Value | | Market
Price^ | | Net Asset
Value | | Market
Price^ | | Net Asset
Value | | Market
Price^ | |
KraneShares E Fund China
Commercial Paper ETF | | | -2.52% | | | -2.38%‡ | | | 2.06%‡ | | | 2.03%‡ | | | 1.18%‡ | | | 1.13%‡ | |
CSI Diversified High Grade
Commercial Paper Index | | | N/A | | | -2.54%‡ | | | N/A | | | 2.54%‡ | | | N/A | | | 1.94%‡ | |
S&P U.S. Treasury Bill 3-6
Month Index** | | | N/A | | | 2.21%‡ | | | N/A | | | 1.25%‡ | | | N/A | | | 0.94%‡ | |
| S&P 500 Index | | | N/A | | | 9.50%‡ | | | N/A | | | 13.51%‡ | | | N/A | | | 9.81%‡ | |
| * | The Fund commenced operations on December 2, 2014. |
| ** | Index added to provide a fixed income benchmark for fixed income funds. |
| ^ | The “Market Price” of the Funds generally is determined using the midpoint between the highest bid and the lowest offer on the stock exchange on which the Shares of the Funds are listed for trading, as of the time that the Funds’ NAV is calculated. |
The performance data quoted herein represents past performance and the return and value of an investment in the Fund will fluctuate so that, when redeemed, may be worth less than its original cost. Current performance may be lower or higher than the performance data quoted. Past performance is no guarantee of future performance and should not be considered as a representation of the future results of the Fund. For performance data current to the most recent month end, please call 855-857-2638 or visit www.kraneshares.com. The Fund’s performance assumes the reinvestment of all dividends and all capital gains. Index returns assume reinvestment of dividends and, unlike a Fund’s returns, do not reflect any fees or expenses. If such fees and expenses were included in the index returns, the performance would have been lower. As stated in the Fund’s prospectus, the Fund’s gross operating expense ratio is 0.74% and its net expense ratio is 0.62% due to an Expense Limitation Agreement whereby the Fund’s investment manager, Krane Funds Advisors, LLC, has contractually agreed to reduce its management fee by 0.12% of the Fund’s average daily net assets until October 4, 2019. Please note that one cannot invest directly in an unmanaged index. There are no assurances that the Fund will meet its stated objectives. The Fund’s holdings and allocations are subject to change and should not be considered recommendations to buy individual securities. For further information on the Fund’s objectives, risks, and strategies, see the Fund’s prospectus. Returns shown do not reflect the deduction of taxes that a shareholder would pay on Fund distributions or the redemption of Fund shares.
Management Discussion of Fund Performance (Unaudited)(continued)
KraneShares MSCI All China Index ETF
The KraneShares MSCI All China Index ETF (the ‘‘Fund’’) seeks to provide investment results that, before fees and expenses, correspond to the price and yield performance of the MSCI China All Shares Index (the ‘‘Underlying Index’’).
The Underlying Index seeks to track the equity market performance of companies based in China and listed in Mainland China, Hong Kong, and the United States. Companies available for inclusion must be headquartered in China and meet the market capitalization minimums required by the MSCI Global Investable Market Indexes Methodology.
China Review
In the fiscal year from April 1, 2018 through March 31, 2019, global equity markets faced two main challenges, each of which materially affected the performance of the Fund: an uncertain rate cycle from the U.S. Federal Reserve (“Fed”) and trade tensions between the U.S. and China. Trade tensions initially had an outsized negative impact on Chinese equities compared to the U.S., however, by the end of December 2018, U.S. equities experienced a steep decline exacerbated by hawkish Fed comments. This volatility in U.S. markets caused the Fed to forgo raising rates for the foreseeable future accompanied by a temporary trade truce between the U.S. and China. Both Chinese and U.S. equity markets rebounded sharply in January 2019 and have since continued to climb, though trade concerns and global equity market volatility still lingers.
We see two key positive developments for the opening up of China’s capital markets:
| • | On February 28, 2019, MSCI made a larger than expected China A-Share inclusion announcement. MSCI will increase the inclusion factor of China A-Shares in their Global Standard Indexes from 5% to 20% in 2019. |
| • | On April 1, 2019, Bloomberg Barclays began including renminbi (“RMB”)-denominated bonds issued by the Chinese government and policy banks into their Global Aggregate Index, tracked by $2.5 trillion in assets. |
China capital market overview
| • | China’s equity market, as measured by the MSCI China All Shares Index, was down for the period, returning -6.4%, while China’s currency, the RMB depreciated 6.9% against the U.S. dollar. |
| • | The best performing sectors across China’s equity markets included Communication Services (+16.38%), Energy (+4.84%) and Utilities (+3.74%). |
| • | The worst performing sectors across China’s equity markets were Health Care (-20.32%), Consumer Discretionary (-17.58%) and Materials (-16.74%). |
By the Fund’s fiscal year end on March 31, 2019 (the ‘‘reporting period’’), the NAV of the Fund decreased 3.52% for the year, while the Underlying Index decreased 3.13%.
The Fund held 23% of the portfolio in the Financials Sector and 19% in the Communication Services Sector.
Management Discussion of Fund Performance (Unaudited)(continued)
KraneShares MSCI All China Index ETF(continued)
Growth of a $10,000 Investment‡
(at Net Asset Value)‡

AVERAGE TOTAL RETURN FOR THE PERIOD ENDED MARCH 31, 2019*
| | | One Year
Return | | Three Year
Return | | Annualized
Inception to Date | |
| | | Net Asset
Value | | Market
Price^ | | Net Asset
Value | | Market
Price^ | | Net Asset
Value | | Market Price^ | |
KraneShares MSCI All
China Index ETF | | | -3.52% | | | -3.84%‡ | | | 9.01%‡ | | | 9.10%‡ | | | 3.32%‡ | | | 3.62%‡ | |
FTSE Emerging incl. China
Overseas non-R/QFII
GDP Weighted Index /
MSCI China All Shares
Index** | | | N/A | | | -4.16%‡ | | | N/A | | | 9.24%‡ | | | N/A | | | 3.89%‡ | |
| S&P 500 Index | | | N/A | | | 9.50%‡ | | | N/A | | | 13.51%‡ | | | N/A | | | 9.91%‡ | |
| * | The Fund commenced operations on February 12, 2015. |
| ** | The FTSE Emerging incl. China Overseas non-R/QFII GDP Weighted Index / MSCI China All Shares Index consists of the FTSE Emerging incl. China Overseas non-R/QFII GDP Weighted Index from the inception of the Fund through July 31, 2018, and the MSCI China All Shares Index going forward. Prior to July 31, 2018, the Fund was known as the KraneShares FTSE Emerging Markets Plus ETF and sought to provide investment results that, before fees and expenses, corresponded generally to the price and yield performance of the FTSE Emerging incl. China Overseas non-R/QFII GDP Weighted Index. |
| ^ | The “Market Price” of the Funds generally is determined using the midpoint between the highest bid and the lowest offer on the stock exchange on which the Shares of the Funds are listed for trading, as of the time that the Funds’ NAV is calculated. |
The performance data quoted herein represents past performance and the return and value of an investment in the Fund will fluctuate so that, when redeemed, may be worth less than its original cost. Current performance may be lower or higher than the performance data quoted. Past performance is no guarantee of future performance and should not be considered as a representation of the future results of the Fund. For performance data current to the most recent month end, please call 855-857-2638 or visit www.kraneshares.com. The Fund’s performance assumes the reinvestment of all dividends and all capital gains. Index returns assume reinvestment of dividends and, unlike a Fund’s returns, do not reflect any fees or expenses. If such fees and expenses were included in the index returns, the performance would have been lower. As stated in the Fund’s prospectus, as supplemented, the Fund’s operating expense ratio is 0.72. Please note that one cannot invest directly in an unmanaged index. There
Management Discussion of Fund Performance (Unaudited)(continued)
KraneShares MSCI All China Index ETF(concluded)
are no assurances that the Fund will meet its stated objectives. The Fund’s holdings and allocations are subject to change and should not be considered recommendations to buy individual securities. For further information on the Fund’s objectives, risks, and strategies, see the Fund’s prospectus. Returns shown do not reflect the deduction of taxes that a shareholder would pay on Fund distributions or the redemption of Fund shares.
Management Discussion of Fund Performance (Unaudited)(continued)
The KraneShares MSCI One Belt One Road Index ETF
The KraneShares MSCI One Belt One Road Index ETF (the ‘‘Fund’’) seeks to provide investment results that, before fees and expenses, correspond to the price and yield performance of the MSCI Global China Infrastructure Exposure Index (the ‘‘Underlying Index’’).
The Underlying Index is designed to represent the performance of listed companies within Developed, Emerging and Frontier markets whose revenues are likely to benefit from China infrastructure development from within a specified set of industries relevant to what has become known as the ‘One Belt, One Road’ (“OBOR”) investment program and development strategy promoted by China.
China Review
In the fiscal year from April 1, 2018 through March 31, 2019, global equity markets faced two main challenges, each of which materially affected the performance of the Fund: an uncertain rate cycle from the U.S. Federal Reserve (“Fed”) and trade tensions between the U.S. and China. Trade tensions initially had an outsized negative impact on Chinese equities compared to the U.S., however, by the end of December 2018, U.S. equities experienced a steep decline exacerbated by hawkish Fed comments. This volatility in U.S. markets caused the Fed to forgo raising rates for the foreseeable future accompanied by a temporary trade truce between the U.S. and China. Both Chinese and U.S. equity markets rebounded sharply in January 2019 and have since continued to climb, though trade concerns and global equity market volatility still lingers.
We see two key positive developments for the opening up of China’s capital markets:
| • | On February 28, 2019, MSCI made a larger than expected China A-Share inclusion announcement. MSCI will increase the inclusion factor of China A-Shares in their Global Standard Indexes from 5% to 20% in 2019. |
| • | On April 1, 2019, Bloomberg Barclays began including renminbi (“RMB”)-denominated bonds issued by the Chinese government and policy banks into their Global Aggregate Index, tracked by $2.5 trillion in assets. |
China Capital Market Overview
| • | China’s equity market, as measured by the MSCI China All Shares Index, was down for the period, returning -6.4%, while China’s currency, the RMB depreciated 6.9% against the U.S. dollar. |
| • | The best performing sectors across China’s equity markets included Communication Services (+16.38%), Energy (+4.84%) and Utilities (+3.74%). |
| • | The worst performing sectors across China’s equity markets were Health Care (-20.32%), Consumer Discretionary (-17.58%) and Materials (-16.74%). |
By the Fund’s fiscal year end on March 31, 2019 (the ‘‘reporting period’’), the NAV of the Fund decreased 4.94% for the year, while the Underlying Index decreased 3.76%.
The Fund held 34% of the portfolio in the Industrials Sector and 30% in the Materials Sector.
Management Discussion of Fund Performance (Unaudited)(continued)
The KraneShares MSCI One Belt One Road Index ETF(concluded)
Growth of a $10,000 Investment‡
(at Net Asset Value)‡

AVERAGE TOTAL RETURN FOR THE PERIOD ENDED MARCH 31, 2019*
| | | One Year
Return | | Annualized
Inception to Date | |
| | | Net Asset
Value | | Market
Price^ | | Net Asset
Value | | Market
Price^ | |
| KraneShares MSCI One Belt One Road Index ETF | | | -4.94% | | | -6.46%‡ | | | -1.54%‡ | | | -1.56%‡ | |
| MSCI Global China Infrastructure Exposure Index | | | N/A | | | -3.76%‡ | | | N/A | | | -0.50%‡ | |
| S&P 500 Index | | | N/A | | | 9.50%‡ | | | N/A | | | 11.52%‡ | |
| * | The Fund commenced operations on September 7, 2017. |
| ^ | The “Market Price” of the Funds generally is determined using the midpoint between the highest bid and the lowest offer on the stock exchange on which the Shares of the Funds are listed for trading, as of the time that the Funds’ NAV is calculated. |
The performance data quoted herein represents past performance and the return and value of an investment in the Fund will fluctuate so that, when redeemed, may be worth less than its original cost. Current performance may be lower or higher than the performance data quoted. Past performance is no guarantee of future performance and should not be considered as a representation of the future results of the Fund. For performance data current to the most recent month end, please call 855-857-2638 or visit www.kraneshares.com. The Fund’s performance assumes the reinvestment of all dividends and all capital gains. Index returns assume reinvestment of dividends and, unlike a Fund’s returns, do not reflect any fees or expenses. If such fees and expenses were included in the index returns, the performance would have been lower. As stated in the Fund’s prospectus, as supplemented, the Fund’s operating expense ratio is 0.80%. Please note that one cannot invest directly in an unmanaged index. There are no assurances that the Fund will meet its stated objectives. The Fund’s holdings and allocations are subject to change and should not be considered recommendations to buy individual securities. For further information on the Fund’s objectives, risks, and strategies, see the Fund’s prospectus. Returns shown do not reflect the deduction of taxes that a shareholder would pay on Fund distributions or the redemption of Fund shares.
Management Discussion of Fund Performance (Unaudited)(continued)
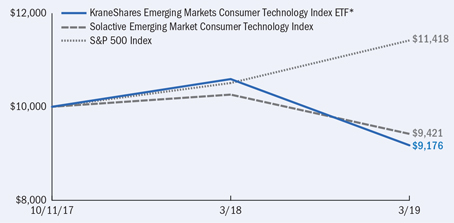
KraneShares Emerging Markets Consumer Technology Index ETF
The KraneShares Emerging Markets Consumer Technology Index ETF (the ‘‘Fund’’) seeks to provide investment results that, before fees and expenses, correspond to the price and yield performance of the Solactive Emerging Market Consumer Technology Index (the ‘‘Underlying Index’’).
The Underlying Index selects companies from 26 eligible countries in emerging markets whose primary business or businesses are internet retail, internet software/services, purchase, payment processing, or software for internet and E-Commerce transactions.
China review
In the fiscal year from April 1, 2018 through March 31, 2019, global equity markets faced two main challenges, each of which materially affected the performance of the Fund: an uncertain rate cycle from the U.S. Federal Reserve (“Fed”) and trade tensions between the U.S. and China. Trade tensions initially had an outsized negative impact on Chinese equities compared to the U.S., however, by the end of December 2018, U.S. equities experienced a steep decline exacerbated by hawkish Fed comments. This volatility in U.S. markets caused the Fed to forgo raising rates for the foreseeable future accompanied by a temporary trade truce between the U.S. and China. Both Chinese and U.S. equity markets rebounded sharply in January 2019 and have since continued to climb, though trade concerns and global equity market volatility still lingers.
We see two key positive developments for the opening up of China’s capital markets:
| • | On February 28, 2019, MSCI made a larger than expected China A-Share inclusion announcement. MSCI will increase the inclusion factor of China A-Shares in their Global Standard Indexes from 5% to 20% in 2019. |
| • | On April 1, 2019, Bloomberg Barclays began including renminbi (“RMB”)-denominated bonds issued by the Chinese government and policy banks into their Global Aggregate Index, tracked by $2.5 trillion in assets. |
China Capital Market Overview
| • | China’s equity market, as measured by the MSCI China All Shares Index, was down for the period, returning -6.4%, while China’s currency, the RMB depreciated 6.9% against the U.S. dollar. |
| • | The best performing sectors across China’s equity markets included Communication Services (+16.38%), Energy (+4.84%) and Utilities (+3.74%). |
| • | The worst performing sectors across China’s equity markets were Health Care (-20.32%), Consumer Discretionary (-17.58%) and Materials (-16.74%). |
By the Fund’s fiscal year end on March 31, 2019 (the ‘‘reporting period’’), the NAV of the Fund decreased 13.37% for the year, while the Underlying Index decreased 12.79%.
The Fund held 52% of the portfolio in the Communication Services Sector and 38% in the Consumer Discretionary Sector.
Management Discussion of Fund Performance (Unaudited)(continued)
KraneShares Emerging Markets Consumer Technology Index ETF(concluded)
Growth of a $10,000 Investment‡
(at Net Asset Value)‡
AVERAGE TOTAL RETURN FOR THE PERIOD ENDED MARCH 31, 2019*
| | | One Year
Return | | Annualized
Inception to Date | |
| | | Net Asset
Value | | Market
Price^ | | Net Asset
Value | | Market
Price^ | |
KraneShares Emerging Markets Consumer
Technology Index ETF | | | -13.37% | | | -13.99%‡ | | | -5.68%‡ | | | -5.51%‡ | |
Solactive Emerging Market Consumer
Technology Index | | | N/A | | | -12.79%‡ | | | N/A | | | -3.98%‡ | |
| S&P 500 Index | | | N/A | | | 9.50%‡ | | | N/A | | | 9.45%‡ | |
| * | The Fund commenced operations on October 11, 2017. |
| ^ | The “Market Price” of the Funds generally is determined using the midpoint between the highest bid and the lowest offer on the stock exchange on which the Shares of the Funds are listed for trading, as of the time that the Funds’ NAV is calculated. |
The performance data quoted herein represents past performance and the return and value of an investment in the Fund will fluctuate so that, when redeemed, may be worth less than its original cost. Current performance may be lower or higher than the performance data quoted. Past performance is no guarantee of future performance and should not be considered as a representation of the future results of the Fund. For performance data current to the most recent month end, please call 855-857-2638 or visit www.kraneshares.com. The Fund’s performance assumes the reinvestment of all dividends and all capital gains. Index returns assume reinvestment of dividends and, unlike a Fund’s returns, do not reflect any fees or expenses. If such fees and expenses were included in the index returns, the performance would have been lower. As stated in the Fund’s prospectus, as supplemented, the Fund’s operating expense ratio is 0.79%. Please note that one cannot invest directly in an unmanaged index. There are no assurances that the Fund will meet its stated objectives. The Fund’s holdings and allocations are subject to change and should not be considered recommendations to buy individual securities. For further information on the Fund’s objectives, risks, and strategies, see the Fund’s prospectus. Returns shown do not reflect the deduction of taxes that a shareholder would pay on Fund distributions or the redemption of Fund shares.
Management Discussion of Fund Performance (Unaudited)(continued)
KraneShares MSCI China Environment Index ETF
The KraneShares MSCI China Environment Index (the ‘‘Fund’’) seeks to provide investment results that, before fees and expenses, correspond to the price and yield performance of the MSCI China IMI Environment 10/40 Index (the ‘‘Underlying Index’’).
��
The Underlying Index is comprised of securities that derive at least 50% of their revenues from environmentally beneficial products and services. The Index is based on five key Clean Technology environmental themes: Alternative Energy, Sustainable Water, Green Building, Pollution Prevention and Energy Efficiency. The Index aims to serve as a benchmark for investors seeking exposure to Chinese companies that focus on contributing to a more environmentally sustainable economy by making efficient use of scarce natural resources or by mitigating the impact of environmental degradation. Constituent selection is based on data from MSCI Environment, Social, and Governance (“ESG”).
China Review
In the fiscal year from April 1, 2018 through March 31, 2019, global equity markets faced two main challenges, each of which materially affected the performance of the Fund: an uncertain rate cycle from the U.S. Federal Reserve (“Fed”) and trade tensions between the U.S. and China. Trade tensions initially had an outsized negative impact on Chinese equities compared to the U.S., however, by the end of December 2018, U.S. equities experienced a steep decline exacerbated by hawkish Fed comments. This volatility in U.S. markets caused the Fed to forgo raising rates for the foreseeable future accompanied by a temporary trade truce between the U.S. and China. Both Chinese and U.S. equity markets rebounded sharply in January 2019 and have since continued to climb, though trade concerns and global equity market volatility still lingers.
We see two key positive developments for the opening up of China’s capital markets:
| • | On February 28, 2019, MSCI made a larger than expected China A-Share inclusion announcement. MSCI will increase the inclusion factor of China A-Shares in their Global Standard Indexes from 5% to 20% in 2019. |
| • | On April 1, 2019, Bloomberg Barclays began including renminbi (“RMB”)-denominated bonds issued by the Chinese government and policy banks into their Global Aggregate Index, tracked by $2.5 trillion in assets. |
China Capital Market Overview
| • | China’s equity market, as measured by the MSCI China All Shares Index, was down for the period, returning -6.4%, while China’s currency, the RMB depreciated 6.9% against the U.S. dollar. |
| • | The best performing sectors across China’s equity markets included Communication Services (+16.38%), Energy (+4.84%) and Utilities (+3.74%). |
| • | The worst performing sectors across China’s equity markets were Health Care (-20.32%), Consumer Discretionary (-17.58%) and Materials (-16.74%). |
By the Fund’s fiscal year end on March 31, 2019 (the ‘‘reporting period’’), the NAV of the Fund decreased 13.28% for the period, while the Underlying Index decreased 12.50%.
The Fund held 27% of the portfolio in the Industrials Sector and 23% in the Real Estate Sector.
Management Discussion of Fund Performance (Unaudited)(continued)
KraneShares MSCI China Environment Index ETF(concluded)
Growth of a $10,000 Investment‡
(at Net Asset Value)‡

AVERAGE TOTAL RETURN FOR THE PERIOD ENDED MARCH 31, 2019*
| | | One Year Return | | Annualized
Inception to Date | |
| | | Net Asset
Value | | Market
Price^ | | Net Asset
Value | | Market
Price^ | |
| KraneShares MSCI China Environment Index | | | -13.28% | | | -14.78%‡ | | | -12.09%‡ | | | -12.19%‡ | |
| MSCI China IMI Environment 10/40 Index | | | N/A | | | -12.50%‡ | | | N/A | | | -11.41%‡ | |
| S&P 500 Index | | | N/A | | | 9.50%‡ | | | N/A | | | 9.59%‡ | |
| * | The Fund commenced operations on October 12, 2017. |
| ^ | The “Market Price” of the Funds generally is determined using the midpoint between the highest bid and the lowest offer on the stock exchange on which the Shares of the Funds are listed for trading, as of the time that the Funds’ NAV is calculated. |
The performance data quoted herein represents past performance and the return and value of an investment in the Fund will fluctuate so that, when redeemed, may be worth less than its original cost. Current performance may be lower or higher than the performance data quoted. Past performance is no guarantee of future performance and should not be considered as a representation of the future results of the Fund. For performance data current to the most recent month end, please call 855-857-2638 or visit www.kraneshares.com. The Fund’s performance assumes the reinvestment of all dividends and all capital gains. Index returns assume reinvestment of dividends and, unlike a Fund’s returns, do not reflect any fees or expenses. If such fees and expenses were included in the index returns, the performance would have been lower. As stated in the Fund’s prospectus, as supplemented, the Fund’s gross operating expense ratio is 0.79%. Please note that one cannot invest directly in an unmanaged index. There are no assurances that the Fund will meet its stated objectives. The Fund’s holdings and allocations are subject to change and should not be considered recommendations to buy individual securities. For further information on the Fund’s objectives, risks, and strategies, see the Fund’s prospectus. Returns shown do not reflect the deduction of taxes that a shareholder would pay on Fund distributions or the redemption of Fund shares.
Management Discussion of Fund Performance (Unaudited)(continued)
KraneShares Electric Vehicles and Future Mobility Index ETF
The KraneShares Electric Vehicles and Future Mobility Index ETF (the ‘‘Fund’’) seeks to provide investment results that, before fees and expenses, correspond to the price and yield performance of the Solactive Electric Vehicles and Future Mobility Index (the ‘‘Underlying Index’’).
The Underlying Index is designed to track the performance of companies engaged in the production of electric vehicles and/or their components, or engaged in other initiatives that may change the future of mobility. The Index includes issuers engaged in the electric vehicle production, autonomous driving, shared mobility, lithium and/or copper production, lithium-ion/lead acid batteries, hydrogen fuel cell manufacturing and/or electric infrastructure businesses.
China review
In the fiscal year from April 1, 2018 through March 31, 2019, global equity markets faced two main challenges, each of which materially affected the performance of the Fund: an uncertain rate cycle from the U.S. Federal Reserve (“Fed”) and trade tensions between the U.S. and China. Trade tensions initially had an outsized negative impact on Chinese equities compared to the U.S., however, by the end of December 2018, U.S. equities experienced a steep decline exacerbated by hawkish Fed comments. This volatility in U.S. markets caused the Fed to forgo raising rates for the foreseeable future accompanied by a temporary trade truce between the U.S. and China. Both Chinese and U.S. equity markets rebounded sharply in January 2019 and have since continued to climb, though trade concerns and global equity market volatility still lingers.
We see two key positive developments for the opening up of China’s capital markets:
| • | On February 28, 2019, MSCI made a larger than expected China A-Share inclusion announcement. MSCI will increase the inclusion factor of China A-Shares in their Global Standard Indexes from 5% to 20% in 2019. |
| • | On April 1, 2019, Bloomberg Barclays began including renminbi (“RMB”)-denominated bonds issued by the Chinese government and policy banks into their Global Aggregate Index, tracked by $2.5 trillion in assets. |
China Capital Market Overview
| • | China’s equity market, as measured by the MSCI China All Shares Index, was down for the period, returning -6.4%, while China’s currency, the RMB depreciated 6.9% against the U.S. dollar. |
| • | The best performing sectors across China’s equity markets included Communication Services (+16.38%), Energy (+4.84%) and Utilities (+3.74%). |
| • | The worst performing sectors across China’s equity markets were Health Care (-20.32%), Consumer Discretionary (-17.58%) and Materials (-16.74%). |
By the Fund’s fiscal year end on March 31, 2019 (the ‘‘reporting period’’), the NAV of the Fund decreased 10.19% for the year, while the Underlying Index decreased 10.55%.
The Fund held 39% of the portfolio in the Consumer Discretionary Sector and 36% in the Information Technology Sector.
Management Discussion of Fund Performance (Unaudited)(continued)
KraneShares Electric Vehicles and Future Mobility Index(concluded)
Growth of a $10,000 Investment‡
(at Net Asset Value)‡

AVERAGE TOTAL RETURN FOR THE PERIOD ENDED MARCH 31, 2019*
| | | One Year
Return | | Annualized
Inception to Date | |
| | | Net Asset
Value | | Market
Price^ | | Net Asset
Value | | Market
Price^ | |
KraneShares Electric Vehicles and Future
Mobility Index ETF | | | -10.19% | | | -10.78%‡ | | | -13.76%‡ | | | -13.38%‡ | |
Solactive Electric Vehicles and Future Mobility
Index | | | N/A | | | -10.55%‡ | | | N/A | | | -14.35%‡ | |
| S&P 500 Index | | | N/A | | | 9.50%‡ | | | N/A | | | 3.13%‡ | |
| * | The Fund commenced operations on January 18, 2018. |
| ^ | The “Market Price” of the Funds generally is determined using the midpoint between the highest bid and the lowest offer on the stock exchange on which the Shares of the Funds are listed for trading, as of the time that the Funds’ NAV is calculated. |
The performance data quoted herein represents past performance and the return and value of an investment in the Fund will fluctuate so that, when redeemed, may be worth less than its original cost. Current performance may be lower or higher than the performance data quoted. Past performance is no guarantee of future performance and should not be considered as a representation of the future results of the Fund. For performance data current to the most recent month end, please call 855-857-2638 or visit www.kraneshares.com. The Fund’s performance assumes the reinvestment of all dividends and all capital gains. Index returns assume reinvestment of dividends and, unlike a Fund’s returns, do not reflect any fees or expenses. If such fees and expenses were included in the index returns, the performance would have been lower. As stated in the Fund’s prospectus, the Fund’s operating expense ratio is 0.70%. Please note that one cannot invest directly in an unmanaged index. There are no assurances that the Fund will meet its stated objectives. The Fund’s holdings and allocations are subject to change and should not be considered recommendations to buy individual securities. For further information on the Fund’s objectives, risks, and strategies, see the Fund’s prospectus. Returns shown do not reflect the deduction of taxes that a shareholder would pay on Fund distributions or the redemption of Fund shares.
Management Discussion of Fund Performance (Unaudited)(continued)
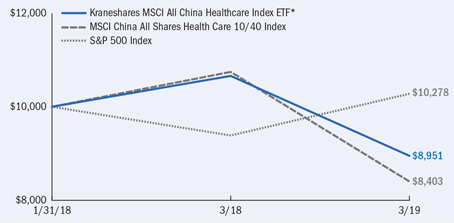
KraneShares MSCI All China Health Care Index ETF
The KraneShares MSCI All China Health Care Index ETF (the ‘‘Fund’’) seeks to provide investment results that, before fees and expenses, correspond to the price and yield performance of the MSCI China All Shares Health Care 10/40 Index (the ‘‘Underlying Index’’).
The Underlying Index is a free float adjusted market capitalization weighted index designed to track the equity market performance of Chinese companies engaged in the health care sector. The securities in the Index include all types of publicly issued shares of Chinese issuers, which are listed in Mainland China, Hong Kong and United States. Issuers eligible for inclusion must be classified under the Global Industry Classification Standard as engaged in the healthcare sector. The issuers included in the Underlying Index may include small-cap, mid-cap and large-cap companies.
China Review
In the fiscal year from April 1, 2018 through March 31, 2019, global equity markets faced two main challenges, each of which materially affected the performance of the Fund: an uncertain rate cycle from the U.S. Federal Reserve (“Fed”) and trade tensions between the U.S. and China. Trade tensions initially had an outsized negative impact on Chinese equities compared to the U.S., however, by the end of December 2018, U.S. equities experienced a steep decline exacerbated by hawkish Fed comments. This volatility in U.S. markets caused the Fed to forgo raising rates for the foreseeable future accompanied by a temporary trade truce between the U.S. and China. Both Chinese and U.S. equity markets rebounded sharply in January 2019 and have since continued to climb, though trade concerns and global equity market volatility still lingers.
We see two key positive developments for the opening up of China’s capital markets:
| • | On February 28, 2019, MSCI made a larger than expected China A-Share inclusion announcement. MSCI will increase the inclusion factor of China A-Shares in their Global Standard Indexes from 5% to 20% in 2019. |
| • | On April 1, 2019, Bloomberg Barclays began including renminbi (“RMB”)-denominated bonds issued by the Chinese government and policy banks into their Global Aggregate Index, tracked by $2.5 trillion in assets. |
China Capital Market Overview
| • | China’s equity market, as measured by the MSCI China All Shares Index, was down for the period, returning -6.4%, while China’s currency, the RMB depreciated 6.9% against the U.S. dollar. |
| • | The best performing sectors across China’s equity markets included Communication Services (+16.38%), Energy (+4.84%) and Utilities (+3.74%). |
| • | The worst performing sectors across China’s equity markets were Health Care (-20.32%), Consumer Discretionary (-17.58%) and Materials (-16.74%). |
By the Fund’s fiscal year end on March 31, 2019 (the ‘‘reporting period’’), the NAV of the Fund decreased 15.99% for the year, while the Underlying Index decreased 16.71%.
The Fund held 100% of the portfolio in the Health Care Sector.
Management Discussion of Fund Performance (Unaudited)(continued)
KraneShares MSCI All China Health Care Index ETF(concluded)
Growth of a $10,000 Investment‡
(at Net Asset Value)‡
AVERAGE TOTAL RETURN FOR THE PERIOD ENDED MARCH 31, 2019*
| | | One Year
Return | | Annualized
Inception to Date | |
| | | Net Asset
Value | | Market
Price^ | | Net Asset
Value | | Market
Price^ | |
KraneShares MSCI All China Health Care
Index ETF | | | -15.99% | | | -18.03%‡ | | | -9.03%‡ | | | -9.51%‡ | |
MSCI China All Shares Health
Care 10/40 Index | | | N/A | | | -16.71%‡ | | | N/A | | | 9.10%‡ | |
| S&P 500 Index | | | N/A | | | 9.50%‡ | | | N/A | | | 2.39%‡ | |
| * | The Fund commenced operations on January 31, 2018. |
| ^ | The “Market Price” of the Funds generally is determined using the midpoint between the highest bid and the lowest offer on the stock exchange on which the Shares of the Funds are listed for trading, as of the time that the Funds’ NAV is calculated. |
The performance data quoted herein represents past performance and the return and value of an investment in the Fund will fluctuate so that, when redeemed, may be worth less than its original cost. Current performance may be lower or higher than the performance data quoted. Past performance is no guarantee of future performance and should not be considered as a representation of the future results of the Fund. For performance data current to the most recent month end, please call 855-857-2638 or visit www.kraneshares.com. The Fund’s performance assumes the reinvestment of all dividends and all capital gains. Index returns assume reinvestment of dividends and, unlike a Fund’s returns, do not reflect any fees or expenses. If such fees and expenses were included in the index returns, the performance would have been lower. As stated in the Fund’s prospectus, the Fund’s operating expense ratio is 0.82%. Please note that one cannot invest directly in an unmanaged index. There are no assurances that the Fund will meet its stated objectives. The Fund’s holdings and allocations are subject to change and should not be considered recommendations to buy individual securities. For further information on the Fund’s objectives, risks, and strategies, see the Fund’s prospectus. Returns shown do not reflect the deduction of taxes that a shareholder would pay on Fund distributions or the redemption of Fund shares.
Management Discussion of Fund Performance (Unaudited)(continued)
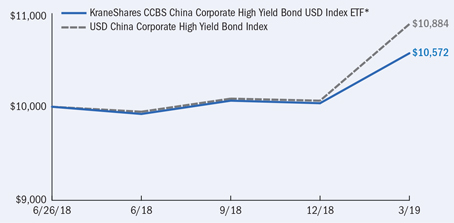
KraneShares CCBS China Corporate High Yield Bond USD Index ETF
The KraneShares CCBS China Corporate High Yield Bond USD Index ETF (the ‘‘Fund’’) seeks to provide investment results that, before fees and expenses, correspond to the price and yield performance of the Solactive USD China Corporate High Yield Bond Index (the ‘‘Underlying Index’’).
The Underlying Index seeks to track the performance of outstanding high yield debt securities denominated in U.S. dollars issued by Chinese companies. For purposes of the Underlying Index, Chinese companies include companies that conduct the majority of their business activities in, are headquartered in or have the majority of their business assets, profits, or revenues in China or Hong Kong as determined by the index provider, Solactive, AG (“Index Provider”).
China review
In the fiscal year from April 1, 2018 through March 31, 2019, global equity markets faced two main challenges, each of which materially affected the performance of the Fund: an uncertain rate cycle from the U.S. Federal Reserve (“Fed”) and trade tensions between the U.S. and China. Trade tensions initially had an outsized negative impact on Chinese equities compared to the U.S., however, by the end of December 2018, U.S. equities experienced a steep decline exacerbated by hawkish Fed comments. This volatility in U.S. markets caused the Fed to forgo raising rates for the foreseeable future accompanied by a temporary trade truce between the U.S. and China. Both Chinese and U.S. equity markets rebounded sharply in January 2019 and have since continued to climb, though trade concerns and global equity market volatility still lingers.
We see two key positive developments for the opening up of China’s capital markets:
| • | On February 28, 2019, MSCI made a larger than expected China A-Share inclusion announcement. MSCI will increase the inclusion factor of China A-Shares in their Global Standard Indexes from 5% to 20% in 2019. |
| • | On April 1, 2019, Bloomberg Barclays began including renminbi (“RMB”)-denominated bonds issued by the Chinese government and policy banks into their Global Aggregate Index, tracked by $2.5 trillion in assets. |
China Capital Market Overview
| • | China’s equity market, as measured by the MSCI China All Shares Index, was down for the period, returning -6.4%, while China’s currency, the RMB depreciated 6.9% against the U.S. dollar. |
| • | The best performing sectors across China’s equity markets included Communication Services (+16.38%), Energy (+4.84%) and Utilities (+3.74%). |
| • | The worst performing sectors across China’s equity markets were Health Care (-20.32%), Consumer Discretionary (-17.58%) and Materials (-16.74%). |
From the Fund’s inception on June 28, 2018 to the Fund’s fiscal year end on March 31, 2019 (the ‘‘reporting period’’), the NAV of the Fund rose 5.72% for the period, while the Underlying Index rose 8.84%.
New issuance of USD denominated high yield bonds also remained strong in China, increasing from a total amount of around $50 billion in 2017 to over $250 billion in 2018.
Management Discussion of Fund Performance (Unaudited)(continued)
KraneShares CCBS China Corporate High Yield Bond USD Index ETF(concluded)
Growth of a $10,000 Investment‡
(at Net Asset Value)‡
AVERAGE TOTAL RETURN FOR THE PERIOD ENDED MARCH 31, 2019*
| | | Cumulative Inception to Date | |
| | | Net Asset
Value | | Market
Price^ | |
| KraneShares CCBS China Corporate High Yield Bond USD Index ETF | | | 5.72% | | | 5.99%‡ | |
| Solactive USD China Corporate High Yield Bond Index | | | N/A | | | 8.84%‡ | |
| Lipper China Region Funds Classification | | | N/A | | | -1.24%‡ | |
| * | The Fund commenced operations on June 26, 2018. |
| ^ | The “Market Price” of the Funds generally is determined using the midpoint between the highest bid and the lowest offer on the stock exchange on which the Shares of the Funds are listed for trading, as of the time that the Funds’ NAV is calculated. |
The performance data quoted herein represents past performance and the return and value of an investment in the Fund will fluctuate so that, when redeemed, may be worth less than its original cost. Current performance may be lower or higher than the performance data quoted. Past performance is no guarantee of future performance and should not be considered as a representation of the future results of the Fund. For performance data current to the most recent month end, please call 855-857-2638 or visit www.kraneshares.com. The Fund’s performance assumes the reinvestment of all dividends and all capital gains. Index returns assume reinvestment of dividends and, unlike a Fund’s returns, do not reflect any fees or expenses. If such fees and expenses were included in the index returns, the performance would have been lower. As stated in the Fund’s prospectus, the Fund’s operating expense ratio is 0.69%. Please note that one cannot invest directly in an unmanaged index. There are no assurances that the Fund will meet its stated objectives. The Fund’s holdings and allocations are subject to change and should not be considered recommendations to buy individual securities. For further information on the Fund’s objectives, risks, and strategies, see the Fund’s prospectus. Returns shown do not reflect the deduction of taxes that a shareholder would pay on Fund distributions or the redemption of Fund shares.
Management Discussion of Fund Performance (Unaudited)(continued)
KraneShares Emerging Market Healthcare Index ETF
The KraneShares Emerging Markets Healthcare Index ETF (the ‘‘Fund’’) seeks to provide investment results that, before fees and expenses, correspond to the price and yield performance of the Solactive Emerging Markets Healthcare Index (the ‘‘Underlying Index’’).
The Underlying Index seeks to track the equity market performance of companies engaged in the health care sector in various emerging markets. The issuers include small-cap, mid-cap, and large-cap companies involved in hospital management, healthcare management, pharmaceutical manufacturing, and biotechnology, among other sub-industries.
China review
In the fiscal year from April 1, 2018 through March 31, 2019, global equity markets faced two main challenges, each of which materially affected the performance of the Fund: an uncertain rate cycle from the U.S. Federal Reserve (“Fed”) and trade tensions between the U.S. and China. Trade tensions initially had an outsized negative impact on Chinese equities compared to the U.S., however, by the end of December 2018, U.S. equities experienced a steep decline exacerbated by hawkish Fed comments. This volatility in U.S. markets caused the Fed to forgo raising rates for the foreseeable future accompanied by a temporary trade truce between the U.S. and China. Both Chinese and U.S. equity markets rebounded sharply in January 2019 and have since continued to climb, though trade concerns and global equity market volatility still lingers.
We see two key positive developments for the opening up of China’s capital markets:
| • | On February 28, 2019, MSCI made a larger than expected China A-Share inclusion announcement. MSCI will increase the inclusion factor of China A-Shares in their Global Standard Indexes from 5% to 20% in 2019. |
| • | On April 1, 2019, Bloomberg Barclays began including renminbi (“RMB”)-denominated bonds issued by the Chinese government and policy banks into their Global Aggregate Index, tracked by $2.5 trillion in assets. |
China Capital Market Overview
| • | China’s equity market, as measured by the MSCI China All Shares Index, was down for the period, returning -6.4%, while China’s currency, the RMB depreciated 6.9% against the U.S. dollar. |
| • | The best performing sectors across China’s equity markets included Communication Services (+16.38%), Energy (+4.84%) and Utilities (+3.74%). |
| • | The worst performing sectors across China’s equity markets were Health Care (-20.32%), Consumer Discretionary (-17.58%) and Materials (-16.74%). |
From the Fund’s inception on August 29, 2018 to the Fund’s fiscal year end on March 31, 2019 (the ‘‘reporting period’’), the NAV of the Fund decreased 10.47% for the period, while the Underlying Index decreased 10.75%.
The Fund held 100% of the portfolio in the Health Care Sector.
Management Discussion of Fund Performance (Unaudited)(concluded)
KraneShares Emerging Market Healthcare Index ETF(concluded)
Growth of a $10,000 Investment‡
(at Net Asset Value)‡
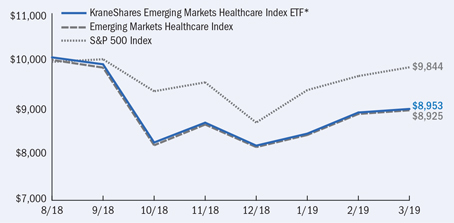
AVERAGE TOTAL RETURN FOR THE PERIOD ENDED MARCH 31, 2019*
| | | Cumulative Inception to Date | |
| | | Net Asset
Value | | Market
Price^ | |
| KraneShares Emerging Markets Healthcare Index ETF | | | -10.47% | | | -10.63%‡ | |
| Solactive Emerging Markets Healthcare Index | | | N/A | | | -10.75%‡ | |
| S&P 500 Index | | | N/A | | | -1.56%‡ | |
| * | The Fund commenced operations on August 29, 2018. |
| ^ | The “Market Price” of the Funds generally is determined using the midpoint between the highest bid and the lowest offer on the stock exchange on which the Shares of the Funds are listed for trading, as of the time that the Funds’ NAV is calculated. |
The performance data quoted herein represents past performance and the return and value of an investment in the Fund will fluctuate so that, when redeemed, may be worth less than its original cost. Current performance may be lower or higher than the performance data quoted. Past performance is no guarantee of future performance and should not be considered as a representation of the future results of the Fund. For performance data current to the most recent month end, please call 855-857-2638 or visit www.kraneshares.com. The Fund’s performance assumes the reinvestment of all dividends and all capital gains. Index returns assume reinvestment of dividends and, unlike a Fund’s returns, do not reflect any fees or expenses. If such fees and expenses were included in the index returns, the performance would have been lower. As stated in the Fund’s prospectus, the Fund’s operating expense ratio is 0.79%. Please note that one cannot invest directly in an unmanaged index. There are no assurances that the Fund will meet its stated objectives. The Fund’s holdings and allocations are subject to change and should not be considered recommendations to buy individual securities. For further information on the Fund’s objectives, risks, and strategies, see the Fund’s prospectus. Returns shown do not reflect the deduction of taxes that a shareholder would pay on Fund distributions or the redemption of Fund shares.
Schedule of InvestmentsMarch 31, 2019
KraneShares CICC China Leaders 100 Index ETF
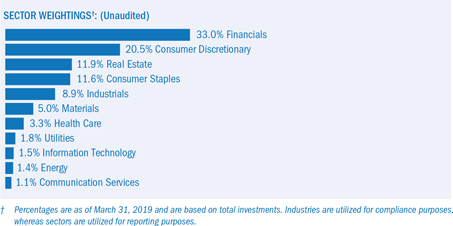
| | | Shares | | | Value |
| COMMON STOCK — 99.8%‡ | | | | | | | |
| CHINA — 99.8% | | | | | | | |
| Communication Services — 1.1% | | | | | | | |
| China Film, Cl A | | | 4,000 | | | $ | 10,577 |
| Shanghai Oriental Pearl Group, Cl A | | | 10,700 | | | | 19,664 |
| | | | | | | | 30,241 |
| Consumer Discretionary — 20.5% | | | | | | | |
| Beijing WKW Automotive Parts, Cl A | | | 2,900 | | | | 2,162 |
| Changchun Faway Automobile Components, Cl A | | | 2,200 | | | | 4,518 |
| Changzhou Xingyu Automotive Lighting Systems, Cl A | | | 800 | | | | 7,154 |
| Chongqing Department Store, Cl A | | | 1,300 | | | | 7,192 |
| Dashang, Cl A | | | 900 | | | | 4,160 |
| Fuyao Glass Industry Group, Cl A | | | 7,500 | | | | 27,153 |
| Gree Electric Appliances of Zhuhai, Cl A | | | 20,500 | | | | 144,014 |
| Guangdong Vanward New Electric, Cl A | | | 900 | | | | 1,989 |
| Hang Zhou Great Star Industrial, Cl A | | | 2,900 | | | | 5,265 |
| HLA, Cl A | | | 9,600 | | | | 13,957 |
| Huangshan Tourism Development, Cl A | | | 1,400 | | | | 2,475 |
| Huayu Automotive Systems, Cl A | | | 8,400 | | | | 25,474 |
| Jason Furniture Hangzhou, Cl A | | | 700 | | | | 6,156 |
| Joyoung, Cl A | | | 1,700 | | | | 5,836 |
| Lao Feng Xiang, Cl A | | | 700 | | | | 4,625 |
| Loncin Motor, Cl A | | | 5,500 | | | | 4,141 |
| Luolai Lifestyle Technology, Cl A | | | 1,700 | | | | 3,162 |
| Luthai Textile | | | 2,400 | | | | 3,796 |
| Midea Group, Cl A | | | 20,200 | | | | 146,476 |
| Rainbow Department Store, Cl A | | | 2,600 | | | | 5,649 |
| SAIC Motor, Cl A | | | 18,700 | | | | 72,544 |
| Shandong Linglong Tyre, Cl A | | | 2,600 | | | | 6,883 |
| Shanghai Jinjiang International Hotels Development, Cl A | | | 900 | | | | 3,719 |
| TCL, Cl A | | | 57,800 | | | | 34,920 |
| Wangfujing Group, Cl A | | | 1,700 | | | | 4,768 |
| Weifu High-Technology Group, Cl A | | | 3,200 | | | | 10,995 |
| Wuchan Zhongda Group, Cl A | | | 9,200 | | | | 7,749 |
The accompanying notes are an integral part of the financial statements.
Schedule of InvestmentsMarch 31, 2019
KraneShares CICC China Leaders 100 Index ETF(continued)
| | | Shares | | | Value |
| COMMON STOCK (continued) | | | | | | | |
| Consumer Discretionary (continued) | | | | | | | |
| Zhejiang Meida Industrial, Cl A | | | 1,100 | | | $ | 2,327 |
| Zhejiang Semir Garment, Cl A | | | 2,900 | | | | 5,174 |
| | | | | | | | 574,433 |
| Consumer Staples — 11.6% | | | | | | | |
| By-health, Cl A | | | 4,700 | | | | 15,981 |
| Henan Shuanghui Investment & Development, Cl A | | | 5,300 | | | | 20,387 |
| Jiangsu Yanghe Brewery Joint-Stock, Cl A | | | 3,300 | | | | 64,044 |
| Luzhou Laojiao, Cl A | | | 4,000 | | | | 39,630 |
| Shanghai Jahwa United, Cl A | | | 1,800 | | | | 8,461 |
| Shanxi Xinghuacun Fen Wine Factory, Cl A | | | 1,400 | | | | 12,598 |
| Tsingtao Brewery, Cl A | | | 1,900 | | | | 12,205 |
| Wuliangye Yibin, Cl A | | | 10,700 | | | | 151,260 |
| | | | | | | | 324,566 |
| Energy — 1.4% | | | | | | | |
| Cangzhou Mingzhu Plastic, Cl A | | | 5,300 | | | | 3,967 |
| China Shenhua Energy, Cl A | | | 10,600 | | | | 30,932 |
| Huolinhe Opencut Coal Industry of Inner Mongolia, Cl A | | | 3,600 | | | | 4,880 |
| | | | | | | | 39,779 |
| Financials — 32.9% | | | | | | | |
| Agricultural Bank of China, Cl A | | | 212,800 | | | | 118,113 |
| Bank of China, Cl A | | | 112,200 | | | | 62,944 |
| Bank of Communications, Cl A | | | 138,400 | | | | 128,511 |
| China Merchants Bank, Cl A | | | 27,100 | | | | 136,786 |
| Industrial & Commercial Bank of China, Cl A | | | 114,900 | | | | 95,234 |
| Industrial Bank, Cl A | | | 50,300 | | | | 136,001 |
| Ping An Insurance Group of China, Cl A | | | 12,200 | | | | 139,969 |
| Shanghai Pudong Development Bank, Cl A | | | 62,600 | | | | 105,075 |
| | | | | | | | 922,633 |
| Health Care — 3.2% | | | | | | | |
| China Animal Healthcare*(A)(B)(C) | | | 4,000 | | | | — |
| Harbin Gloria Pharmaceuticals, Cl A | | | 4,700 | | | | 3,637 |
| Hualan Biological Engineering, Cl A | | | 3,000 | | | | 20,089 |
| Hubei Jumpcan Pharmaceutical, Cl A | | | 1,600 | | | | 8,219 |
| Kangmei Pharmaceutical, Cl A | | | 15,900 | | | | 24,725 |
| Shanghai Pharmaceuticals Holding, Cl A | | | 6,200 | | | | 19,079 |
| Xiamen Kingdomway Group, Cl A | | | 1,400 | | | | 2,769 |
| Zhejiang NHU, Cl A | | | 4,600 | | | | 12,649 |
| | | | | | | | 91,167 |
| Industrials — 8.9% | | | | | | | |
| China Meheco, Cl A | | | 2,900 | | | | 6,641 |
| China State Construction Engineering, Cl A | | | 116,500 | | | | 106,095 |
| CNHTC Jinan Truck, Cl A | | | 1,500 | | | | 4,002 |
| Daqin Railway, Cl A | | | 31,700 | | | | 39,341 |
| Fujian Longking, Cl A | | | 4,000 | | | | 7,518 |
| Henan Pinggao Electric, Cl A | | | 4,400 | | | | 5,467 |
| Jiangsu Guotai International Group Guomao, Cl A | | | 4,200 | | | | 4,194 |
| Jiangsu Linyang Energy, Cl A | | | 5,700 | | | | 4,945 |
| Juneyao Airlines, Cl A | | | 2,900 | | | | 6,374 |
| Shanghai International Port Group, Cl A | | | 17,300 | | | | 18,715 |
The accompanying notes are an integral part of the financial statements.
Schedule of InvestmentsMarch 31, 2019
KraneShares CICC China Leaders 100 Index ETF(continued)
| | | Shares | | | Value |
| COMMON STOCK (continued) | | | | | | | |
| Industrials (continued) | | | | | | | |
| Shanghai Tunnel Engineering, Cl A | | | 10,100 | | | $ | 11,032 |
| Shenzhen Desay Battery Technology, Cl A | | | 700 | | | | 3,640 |
| Sieyuan Electric, Cl A | | | 2,500 | | | | 4,624 |
| Zhejiang Chint Electrics, Cl A | | | 4,600 | | | | 18,345 |
| Zhejiang Weixing New Building Materials, Cl A | | | 2,800 | | | | 8,400 |
| | | | | | | | 249,333 |
| Information Technology — 1.5% | | | | | | | |
| Beijing Zhong Ke San Huan High-Tech, Cl A | | | 4,600 | | | | 6,701 |
| Hanergy Thin Film Power Group*(A)(B)(C) | | | 65,064 | | | | 83 |
| Shengyi Technology, Cl A | | | 5,700 | | | | 11,230 |
| Shenzhen Sunlord Electronics, Cl A | | | 3,500 | | | | 9,849 |
| Victory Giant Technology Huizhou, Cl A* | | | 2,500 | | | | 5,138 |
| Wuhu Token Science, Cl A | | | 9,800 | | | | 8,691 |
| | | | | | | | 41,692 |
| Materials — 5.0% | | | | | | | |
| Anhui Conch Cement, Cl A | | | 10,700 | | | | 60,791 |
| China Lumena New Materials*(A)(B)(C) | | | 28,720 | | | | — |
| Fangda Special Steel Technology, Cl A | | | 3,900 | | | | 8,351 |
| Guangdong Tapai Group, Cl A | | | 2,000 | | | | 3,684 |
| Jiangxi Wannianqing Cement, Cl A | | | 2,000 | | | | 4,601 |
| Kingfa Sci & Tech, Cl A | | | 10,200 | | | | 8,363 |
| Shenzhen Jinjia Group, Cl A | | | 4,800 | | | | 10,135 |
| Tianhe Chemicals Group*(A)(B)(C) | | | 40,000 | | | | — |
| Zhejiang Longsheng Group, Cl A | | | 13,900 | | | | 35,576 |
| Zhejiang Runtu, Cl A | | | 3,700 | | | | 7,835 |
| | | | | | | | 139,336 |
| Real Estate — 11.9% | | | | | | | |
| Beijing Urban Construction Investment & Development, Cl A | | | 5,100 | | | | 7,779 |
| China Merchants Shekou Industrial Zone Holdings, Cl A | | | 12,700 | | | | 43,542 |
| China Vanke, Cl A | | | 27,000 | | | | 123,425 |
| Cinda Real Estate, Cl A | | | 4,600 | | | | 3,826 |
| Gemdale, Cl A | | | 12,100 | | | | 24,757 |
| Jinke Properties Group, Cl A | | | 14,300 | | | | 15,534 |
| Oceanwide Holdings, Cl A | | | 8,400 | | | | 9,162 |
| Poly Developments and Holdings Group, Cl A | | | 38,000 | | | | 80,521 |
| RiseSun Real Estate Development, Cl A | | | 9,300 | | | | 15,569 |
| Shanghai SMI Holding, Cl A | | | 6,800 | | | | 8,085 |
| | | | | | | | 332,200 |
| Utilities — 1.8% | | | | | | | |
| SDIC Power Holdings, Cl A | | | 21,700 | | | | 26,801 |
| Shanghai Electric Power, Cl A | | | 5,600 | | | | 7,525 |
| Zhejiang Zheneng Electric Power, Cl A | | | 21,800 | | | | 15,798 |
| | | | | | | | 50,124 |
TOTAL COMMON STOCK
(Cost $2,310,024) | | | | | | | 2,795,504 |
| | | | | | | | |
TOTAL INVESTMENTS — 99.8%
(Cost $2,310,024) | | | | | | | 2,795,504 |
| OTHER ASSETS LESS LIABILITIES – 0.2% | | | | | | | 4,548 |
| NET ASSETS - 100% | | | | | | $ | 2,800,052 |
The accompanying notes are an integral part of the financial statements.
Schedule of InvestmentsMarch 31, 2019
KraneShares CICC China Leaders 100 Index ETF(concluded)
| ‡ | Industries are utilized for compliance purposes, whereas sectors are utilized for reporting. |
| * | Non-income producing security. |
| (A) | Security is fair valued using methods determined in good faith by the Fair Value Committee appointed by the Board of Trustees. The total value of such securities as of March 31, 2019 was $83 and represents 0.0% of Net Assets. |
| (B) | Level 3 security in accordance with fair value hierarchy. |
| (C) | Security considered illiquid. The total value of such securities as of March 31, 2019 was $83 and represents 0.0% of Net Assets (Unaudited). |
Cl — Class
The following summarizes the market value of the Fund’s investments used as of March 31, 2019, based on the inputs used to value them:
| Investments in Securities | | Level 1 | | Level 2 | | Level 3^ | | Total | |
| | | | | | | | | | |
| Common Stock | | | | | | | | | | | | | |
| China | | | | | | | | | | | | | |
| Communication Services | | $ | 30,241 | | $ | — | | $ | — | | $ | 30,241 | |
| Consumer Discretionary | | | 574,433 | | | — | | | — | | | 574,433 | |
| Consumer Staples | | | 324,566 | | | — | | | — | | | 324,566 | |
| Energy | | | 39,779 | | | — | | | — | | | 39,779 | |
| Financials | | | 922,633 | | | — | | | — | | | 922,633 | |
| Health Care | | | 91,167 | | | — | | | — | | | 91,167 | |
| Industrials | | | 249,333 | | | — | | | — | | | 249,333 | |
| Information Technology | | | 41,609 | | | — | | | 83 | | | 41,692 | |
| Materials | | | 139,336 | | | — | | | — | | | 139,336 | |
| Real Estate | | | 332,200 | | | — | | | — | | | 332,200 | |
| Utilities | | | 50,124 | | | — | | | — | | | 50,124 | |
| Total Common Stock | | | 2,795,421 | | | — | | | 83 | | | 2,795,504 | |
| Total Investments in Securities | | $ | 2,795,421 | | $ | — | | $ | 83 | | $ | 2,795,504 | |
| ^ | A reconciliation of Level 3 investments, including certain disclosures related to significant inputs used in valuing Level 3 investments is only presented when the Fund has over 1% of Level 3 investments at the beginning and/or end of the period in relation to net assets. |
For the year ended March 31, 2019, there have been no transfers between Level 1 and Level 2 investments.
For the year ended March 31, 2019, there have been no transfers between Level 2 and Level 3 investments.
For the year ended March 31, 2019, the transfers in and out of Level 3 occurred due to a halt in trading of these securities. Transfers between levels are recognized at period end.
Amounts designated as “—” are $0 or have been rounded to $0.
The accompanying notes are an integral part of the financial statements.
Schedule of InvestmentsMarch 31, 2019
KraneShares CSI China Internet ETF
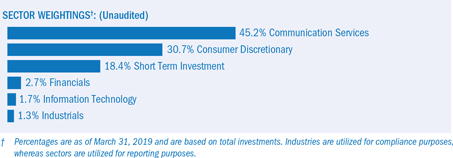
| | | Shares | | | Value |
| COMMON STOCK — 99.9%‡ | | | | | | | |
| CHINA — 89.1% | | | | | | | |
| Communication Services — 52.1% | | | | | | | |
| 58.com ADR* | | | 1,224,238 | | | $ | 80,407,952 |
| Autohome ADR*(A) | | | 679,186 | | | | 71,396,032 |
| Baidu ADR* | | | 814,853 | | | | 134,328,517 |
| Bilibili ADR* | | | 2,003,093 | | | | 37,958,612 |
| Bitauto Holdings ADR* | | | 435,517 | | | | 6,933,431 |
| Changyou.com ADR | | | 253,264 | | | | 4,330,814 |
| Fang Holdings ADR* | | | 2,672,557 | | | | 3,607,952 |
| HUYA ADR*(A) | | | 732,438 | | | | 20,603,481 |
| iQIYI ADR*(A) | | | 3,525,641 | | | | 84,333,333 |
| Momo ADR* | | | 1,960,677 | | | | 74,976,289 |
| NetEase ADR | | | 415,622 | | | | 100,351,932 |
| SINA* | | | 856,796 | | | | 50,756,595 |
| Sogou ADR*(A) | | | 950,780 | | | | 5,647,633 |
| Sohu.com ADR*(A) | | | 373,489 | | | | 6,192,448 |
| Tencent Holdings | | | 4,304,275 | | | | 197,943,079 |
| Tencent Music Entertainment Group ADR*(A) | | | 5,360,200 | | | | 97,019,620 |
| Tian Ge Interactive Holdings | | | 7,631,000 | | | | 3,032,977 |
| Weibo ADR* | | | 802,487 | | | | 49,746,169 |
| YY ADR* | | | 606,614 | | | | 50,961,642 |
| | | | | | | | 1,080,528,508 |
| Consumer Discretionary — 31.0% | | | | | | | |
| Alibaba Group Holding ADR* | | | 1,088,122 | | | | 198,527,859 |
| Baozun ADR*(A) | | | 478,919 | | | | 19,894,295 |
| Cogobuy Group*(A) | | | 7,211,818 | | | | 2,655,068 |
| Ctrip.com International ADR* | | | 2,483,455 | | | | 108,502,149 |
| JD.com ADR* | | | 3,281,699 | | | | 98,943,225 |
| Pinduoduo ADR* | | | 3,116,352 | | | | 77,285,530 |
| Secoo Holding ADR* | | | 425,249 | | | | 3,725,181 |
| TAL Education Group ADR* | | | 2,419,996 | | | | 87,313,456 |
| Tuniu ADR*(A) | | | 578,253 | | | | 2,775,614 |
| Vipshop Holdings ADR* | | | 5,561,300 | | | | 44,657,239 |
| | | | | | | | 644,279,616 |
The accompanying notes are an integral part of the financial statements.
Schedule of InvestmentsMarch 31, 2019
KraneShares CSI China Internet ETF(continued)
| | | Shares | | | Value |
| COMMON STOCK (continued) | | | | | | | |
| Financials — 2.7% | | | | | | | |
| Fanhua ADR(A) | | | 545,690 | | | $ | 14,329,820 |
| LexinFintech Holdings ADR* | | | 1,009,427 | | | | 10,598,984 |
| PPDAI Group ADR*(A) | | | 1,080,494 | | | | 4,084,267 |
| Qudian ADR* | | | 1,575,027 | | | | 7,969,637 |
| Yirendai ADR(A) | | | 145,647 | | | | 1,974,973 |
| ZhongAn Online P&C Insurance, Cl H*(A) | | | 4,616,500 | | | | 16,584,220 |
| | | | | | | | 55,541,901 |
| Industrials — 1.4% | | | | | | | |
| 51job ADR* | | | 370,409 | | | | 28,847,453 |
| | | | | | | | |
| Information Technology — 1.9% | | | | | | | |
| 21Vianet Group ADR* | | | 939,814 | | | | 7,462,123 |
| Aurora Mobile ADR* | | | 470,766 | | | | 3,107,056 |
| Cheetah Mobile ADR* | | | 514,429 | | | | 3,302,634 |
| Kingsoft | | | 9,620,000 | | | | 24,460,691 |
| Xunlei ADR* | | | 481,231 | | | | 1,761,306 |
| | | | | | | | 40,093,810 |
| TOTAL CHINA | | | | | | | 1,849,291,288 |
| | | | | | | | |
| HONG KONG — 10.8% | | | | | | | |
| Communication Services — 3.3% | | | | | | | |
| Alibaba Pictures Group*(A) | | | 188,964,000 | | | | 33,460,081 |
| China Literature*(A) | | | 4,869,000 | | | | 22,794,508 |
| Inke*(A) | | | 12,752,000 | | | | 3,167,715 |
| NetDragon Websoft Holdings | | | 3,266,315 | | | | 8,205,369 |
| | | | | | | | 67,627,673 |
| Consumer Discretionary — 6.5% | | | | | | | |
| Meituan Dianping, Cl B*(A) | | | 20,110,800 | | | | 135,524,598 |
| | | | | | | | |
| Financials — 0.6% | | | | | | | |
| 51 Credit Card*(A) | | | 5,624,000 | | | | 4,083,695 |
| Chong Sing Holdings FinTech Gr(A) | | | 229,200,000 | | | | 1,897,846 |
| Yixin Group*(A) | | | 30,559,000 | | | | 7,435,422 |
| | | | | | | | 13,416,963 |
| Industrials — 0.2% | | | | | | | |
| HC Group(A) | | | 6,813,400 | | | | 3,680,127 |
| | | | | | | | |
| Information Technology — 0.2% | | | | | | | |
| Huifu Payment*(A) | | | 6,946,800 | | | | 3,451,298 |
| TOTAL HONG KONG | | | | | | | 223,700,659 |
TOTAL COMMON STOCK
(Cost $2,019,172,463) | | | | | | | 2,072,991,947 |
| | | | | | | | |
| SHORT-TERM INVESTMENT(B)(C) — 22.6% | | | | | | | |
Invesco Government & Agency Portfolio,
Cl Institutional, 2.340% | | | 468,400,662 | | | | 468,400,662 |
TOTAL SHORT-TERM INVESTMENT
(Cost $468,400,662) | | | | | | | 468,400,662 |
The accompanying notes are an integral part of the financial statements.
Schedule of InvestmentsMarch 31, 2019
KraneShares CSI China Internet ETF(concluded)
| | | Value | |
TOTAL INVESTMENTS — 122.5%
(Cost $2,487,573,125) | | $ | 2,541,392,609 | |
| OTHER ASSETS LESS LIABILITIES — (22.5)% | | | (466,888,025 | ) |
| NET ASSETS - 100% | | $ | 2,074,504,584 | |
| ‡ | Industries are utilized for compliance purposes, whereas sectors are utilized for reporting. |
| * | Non-income producing security. |
| (A) | This security or a partial position of this security is on loan at March 31, 2019. The total market value of securities on loan at March 31, 2019 was $452,716,688. |
| (B) | The rate shown is the 7-day effective yield as of March 31, 2019. |
| (C) | This security was purchased with cash collateral held from securities on loan. The total value of such security as of March 31, 2019 was $468,400,662. |
ADR — American Depositary Receipt
Cl — Class
As of March 31, 2019, all of the Fund’s investments were considered Level 1 of the fair value hierarchy, in accordance with the authoritative guidance under U.S. GAAP.
For the year ended March 31, 2019, there have been no transfers between Level 1, Level 2 or Level 3 investments. Transfers between levels are recognized at period end.
The accompanying notes are an integral part of the financial statements.
Schedule of InvestmentsMarch 31, 2019
KraneShares Bosera MSCI China A Share ETF
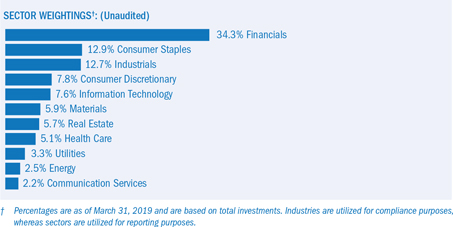
| | | Shares | | | Value |
| COMMON STOCK — 99.5%‡ | | | | | | | |
| CHINA — 99.5% | | | | | | | |
| Communication Services — 2.1% | | | | | | | |
| China Film, Cl A | | | 285,093 | | | $ | 753,862 |
| China South Publishing & Media Group, Cl A | | | 481,948 | | | | 922,989 |
| China United Network Communications, Cl A | | | 6,174,520 | | | | 6,238,652 |
| Chinese Universe Publishing and Media, Cl A | | | 380,236 | | | | 859,466 |
| CITIC Guoan Information Industry, Cl A | | | 745,497 | | | | 658,946 |
| Giant Network Group, Cl A | | | 232,836 | | | | 764,663 |
| Perfect World, Cl A | | | 156,138 | | | | 741,633 |
| Shanghai Oriental Pearl Group, Cl A | | | 796,646 | | | | 1,464,031 |
| Wuhu Shunrong Sanqi Interactive Entertainment Network Technology, Cl A | | | 261,140 | | | | 540,140 |
| | | | | | | | 12,944,382 |
| Consumer Discretionary — 7.8% | | | | | | | |
| BYD, Cl A | | | 366,827 | | | | 2,919,790 |
| China Grand Automotive Services, Cl A | | | 1,056,387 | | | | 833,138 |
| China International Travel Service, Cl A | | | 389,973 | | | | 4,066,740 |
| China Shipbuilding Industry Group Power, Cl A | | | 402,668 | | | | 1,584,260 |
| Chongqing Changan Automobile, Cl A | | | 967,720 | | | | 1,192,334 |
| Fuyao Glass Industry Group, Cl A | | | 230,824 | | | | 835,682 |
| Gree Electric Appliances of Zhuhai, Cl A | | | 617,150 | | | | 4,335,534 |
| Guangzhou Automobile Group, Cl A | | | 512,016 | | | | 889,906 |
| Hangzhou Robam Appliances, Cl A | | | 180,010 | | | | 862,522 |
| HLA, Cl A | | | 612,092 | | | | 889,875 |
| Huayu Automotive Systems, Cl A | | | 531,955 | | | | 1,613,232 |
| Liaoning Cheng Da, Cl A | | | 415,438 | | | | 925,435 |
| Midea Group, Cl A | | | 673,375 | | | | 4,882,825 |
| Oppein Home Group, Cl A | | | 69,891 | | | | 1,262,577 |
| Qingdao Haier, Cl A | | | 1,226,245 | | | | 3,122,087 |
| SAIC Motor, Cl A | | | 1,592,171 | | | | 6,176,587 |
| Shandong Linglong Tyre, Cl A | | | 296,919 | | | | 786,017 |
| Shenzhen Overseas Chinese Town, Cl A | | | 1,800,323 | | | | 2,062,809 |
The accompanying notes are an integral part of the financial statements.
Schedule of InvestmentsMarch 31, 2019
KraneShares Bosera MSCI China A Share ETF(continued)
| | | Shares | | | Value |
| COMMON STOCK (continued) | | | | | | | |
| Consumer Discretionary (continued) | | | | | | | |
| Suning.com, Cl A | | | 1,900,620 | | | $ | 3,549,415 |
| TCL, Cl A | | | 3,038,900 | | | | 1,835,948 |
| Wanxiang Qianchao, Cl A | | | 498,733 | | | | 500,202 |
| Weifu High-Technology Group, Cl A | | | 238,174 | | | | 818,344 |
| Zhejiang Semir Garment, Cl A | | | 500,800 | | | | 893,514 |
| | | | | | | | 46,838,773 |
| Consumer Staples — 12.9% | | | | | | | |
| Beijing Dabeinong Technology Group, Cl A | | | 696,700 | | | | 552,575 |
| Foshan Haitian Flavouring & Food, Cl A | | | 452,519 | | | | 5,838,129 |
| Henan Shuanghui Investment & Development, Cl A | | | 589,890 | | | | 2,269,078 |
| Inner Mongolia Yili Industrial Group, Cl A | | | 1,234,132 | | | | 5,345,910 |
| Jiangsu Yanghe Brewery Joint-Stock, Cl A | | | 304,837 | | | | 5,916,021 |
| Kweichow Moutai, Cl A | | | 256,769 | | | | 32,629,707 |
| Luzhou Laojiao, Cl A | | | 305,030 | | | | 3,022,067 |
| Muyuan Foodstuff, Cl A | | | 343,611 | | | | 3,237,108 |
| New Hope Liuhe, Cl A | | | 787,115 | | | | 1,557,785 |
| Shanxi Xinghuacun Fen Wine Factory, Cl A | | | 194,223 | | | | 1,747,666 |
| Tongwei, Cl A | | | 755,120 | | | | 1,366,367 |
| Tsingtao Brewery, Cl A | | | 121,828 | | | | 782,613 |
| Wuliangye Yibin, Cl A | | | 790,478 | | | | 11,174,580 |
| Yonghui Superstores, Cl A | | | 1,851,686 | | | | 2,380,668 |
| | | | | | | | 77,820,274 |
| Energy — 2.5% | | | | | | | |
| China Petroleum & Chemical, Cl A | | | 5,103,784 | | | | 4,359,352 |
| China Shenhua Energy, Cl A | | | 919,058 | | | | 2,681,874 |
| Guanghui Energy, Cl A | | | 1,698,505 | | | | 1,099,446 |
| Offshore Oil Engineering, Cl A | | | 792,100 | | | | 759,073 |
| PetroChina, Cl A | | | 3,409,855 | | | | 3,856,269 |
| Shaanxi Coal Industry, Cl A | | | 825,740 | | | | 1,094,810 |
| Shanxi Lu’an Environmental Energy Development, Cl A | | | 530,916 | | | | 618,594 |
| Shanxi Xishan Coal & Electricity Power, Cl A | | | 609,546 | | | | 565,083 |
| | | | | | | | 15,034,501 |
| Financials — 34.1% | | | | | | | |
| Agricultural Bank of China, Cl A | | | 15,365,507 | | | | 8,528,518 |
| Anxin Trust, Cl A | | | 1,042,875 | | | | 1,121,988 |
| AVIC Capital, Cl A | | | 1,730,700 | | | | 1,522,044 |
| Bank of Beijing, Cl A | | | 4,201,313 | | | | 3,876,096 |
| Bank of China, Cl A | | | 10,194,500 | | | | 5,719,066 |
| Bank of Communications, Cl A | | | 7,986,914 | | | | 7,416,200 |
| Bank of Guiyang, Cl A | | | 393,534 | | | | 764,206 |
| Bank of Hangzhou, Cl A | | | 1,179,503 | | | | 1,511,193 |
| Bank of Jiangsu, Cl A | | | 2,432,000 | | | | 2,580,304 |
| Bank of Nanjing, Cl A | | | 1,628,409 | | | | 1,916,716 |
| Bank of Ningbo, Cl A | | | 1,050,800 | | | | 3,321,180 |
| Bank of Shanghai, Cl A | | | 2,208,748 | | | | 3,937,502 |
| Changjiang Securities, Cl A | | | 1,292,603 | | | | 1,448,365 |
| China CITIC Bank, Cl A | | | 1,126,034 | | | | 1,053,950 |
| China Construction Bank, Cl A | | | 2,160,926 | | | | 2,234,820 |
| China Everbright Bank, Cl A | | | 7,970,284 | | | | 4,862,677 |
The accompanying notes are an integral part of the financial statements.
Schedule of InvestmentsMarch 31, 2019
KraneShares Bosera MSCI China A Share ETF(continued)
| | | Shares | | | Value |
| COMMON STOCK (continued) | | | | | | | |
| Financials (continued) | | | | | | | |
| China Life Insurance, Cl A | | | 569,052 | | | $ | 2,398,076 |
| China Merchants Bank, Cl A | | | 4,218,187 | | | | 21,291,167 |
| China Merchants Securities, Cl A | | | 1,178,670 | | | | 3,072,870 |
| China Minsheng Banking, Cl A | | | 7,307,618 | | | | 6,894,184 |
| China Pacific Insurance Group, Cl A | | | 1,284,221 | | | | 6,504,998 |
| CITIC Securities, Cl A | | | 1,993,242 | | | | 7,349,861 |
| Dongxing Securities, Cl A | | | 425,617 | | | | 874,009 |
| Everbright Securities, Cl A | | | 753,420 | | | | 1,475,404 |
| First Capital Securities, Cl A | | | 785,761 | | | | 919,032 |
| Founder Securities, Cl A | | | 1,795,046 | | | | 2,051,420 |
| GF Securities, Cl A | | | 1,225,181 | | | | 2,948,004 |
| Guosen Securities, Cl A | | | 789,441 | | | | 1,590,582 |
| Guotai Junan Securities, Cl A | | | 1,504,581 | | | | 4,511,370 |
| Guoyuan Securities, Cl A | | | 608,118 | | | | 945,632 |
| Haitong Securities, Cl A | | | 1,625,681 | | | | 3,393,992 |
| Huaan Securities, Cl A | | | 581,854 | | | | 619,067 |
| Huatai Securities, Cl A | | | 1,320,181 | | | | 4,402,437 |
| Huaxi Securities, Cl A | | | 347,931 | | | | 638,372 |
| Huaxia Bank, Cl A | | | 2,642,127 | | | | 3,243,586 |
| Hubei Biocause Pharmaceutical, Cl A | | | 738,990 | | | | 749,964 |
| Industrial & Commercial Bank of China, Cl A | | | 11,148,730 | | | | 9,240,562 |
| Industrial Bank, Cl A | | | 4,244,608 | | | | 11,476,523 |
| Industrial Securities, Cl A | | | 1,267,344 | | | | 1,367,258 |
| New China Life Insurance, Cl A | | | 428,056 | | | | 3,419,887 |
| Orient Securities, Cl A | | | 1,158,740 | | | | 2,055,323 |
| Ping An Bank, Cl A | | | 3,507,163 | | | | 6,690,549 |
| Ping An Insurance Group of China, Cl A | | | 2,219,180 | | | | 25,460,370 |
| SDIC Capital, Cl A | | | 655,100 | | | | 1,416,417 |
| Shanghai Pudong Development Bank, Cl A | | | 6,014,132 | | | | 10,094,850 |
| Shanxi Securities, Cl A | | | 501,400 | | | | 715,518 |
| Shenwan Hongyuan Group, Cl A | | | 3,863,989 | | | | 3,173,896 |
| Sinolink Securities, Cl A | | | 752,300 | | | | 1,202,301 |
| SooChow Securities, Cl A | | | 731,587 | | | | 1,101,702 |
| Western Securities, Cl A | | | 619,693 | | | | 1,063,221 |
| | | | | | | | 206,167,229 |
| Health Care — 5.1% | | | | | | | |
| Beijing Tongrentang, Cl A | | | 223,131 | | | | 993,767 |
| China Resources Sanjiu Medical & Pharmaceutical, Cl A | | | 251,360 | | | | 1,078,721 |
| Dong-E-E-Jiao, Cl E | | | 161,055 | | | | 1,137,177 |
| Guangzhou Baiyunshan Pharmaceutical Holdings, Cl A | | | 247,039 | | | | 1,433,666 |
| Huadong Medicine, Cl A | | | 329,701 | | | | 1,600,866 |
| Jiangsu Hengrui Medicine, Cl A | | | 860,368 | | | | 8,375,536 |
| Jointown Pharmaceutical Group, Cl A | | | 287,250 | | | | 670,230 |
| Kangmei Pharmaceutical, Cl A | | | 1,106,327 | | | | 1,720,353 |
| Meinian Onehealth Healthcare Holdings, Cl A | | | 588,841 | | | | 1,628,903 |
| Shandong Buchang Pharmaceuticals, Cl A | | | 229,638 | | | | 989,943 |
| Shanghai Fosun Pharmaceutical Group, Cl A | | | 381,813 | | | | 1,691,972 |
| Shanghai Pharmaceuticals Holding, Cl A | | | 448,403 | | | | 1,379,866 |
| Shenzhen Salubris Pharmaceuticals, Cl A | | | 124,369 | | | | 503,198 |
The accompanying notes are an integral part of the financial statements.
Schedule of InvestmentsMarch 31, 2019
KraneShares Bosera MSCI China A Share ETF(continued)
| | | Shares | | | Value |
| COMMON STOCK (continued) | | | | | | | |
| Health Care (continued) | | | | | | | |
| Sichuan Kelun Pharmaceutical, Cl A | | | 342,068 | | | $ | 1,473,597 |
| Tasly Pharmaceutical Group, Cl A | | | 242,638 | | | | 813,102 |
| Tonghua Dongbao Pharmaceutical, Cl A | | | 362,583 | | | | 936,645 |
| Yunnan Baiyao Group, Cl A | | | 195,337 | | | | 2,485,241 |
| Zhangzhou Pientzehuang Pharmaceutical, Cl A | | | 111,400 | | | | 1,904,684 |
| | | | | | | | 30,817,467 |
| Industrials — 12.7% | | | | | | | |
| AECC Aviation Power, Cl A | | | 388,644 | | | | 1,526,770 |
| Air China, Cl A | | | 940,900 | | | | 1,517,716 |
| AVIC Aircraft, Cl A | | | 631,668 | | | | 1,602,622 |
| AVIC Shenyang Aircraft, Cl A* | | | 174,723 | | | | 851,749 |
| China Avionics Systems, Cl A | | | 387,503 | | | | 958,350 |
| China Communications Construction, Cl A | | | 542,495 | | | | 1,009,882 |
| China Eastern Airlines, Cl A | | | 1,504,716 | | | | 1,553,932 |
| China Gezhouba Group, Cl A | | | 1,118,164 | | | | 1,207,981 |
| China International Marine Containers Group, Cl A | | | 126,634 | | | | 281,149 |
| China National Chemical Engineering, Cl A | | | 1,220,439 | | | | 1,175,001 |
| China Railway Construction, Cl A | | | 2,321,155 | | | | 3,975,550 |
| China Shipbuilding Industry, Cl A | | | 4,512,699 | | | | 3,921,634 |
| China Southern Airlines, Cl A | | | 1,734,402 | | | | 2,206,651 |
| China Spacesat, Cl A | | | 194,210 | | | | 727,399 |
| China State Construction Engineering, Cl A | | | 8,553,786 | | | | 7,789,824 |
| COSCO Shipping Development, Cl A* | | | 2,102,478 | | | | 960,479 |
| COSCO Shipping Holdings, Cl A* | | | 1,255,764 | | | | 986,642 |
| CRRC, Cl A | | | 4,047,505 | | | | 5,480,833 |
| Daqin Railway, Cl A | | | 3,014,928 | | | | 3,741,630 |
| Dongfang Electric, Cl A | | | 694,326 | | | | 1,096,217 |
| Fangda Carbon New Material, Cl A | | | 354,900 | | | | 1,192,999 |
| Guangshen Railway, Cl A | | | 1,564,891 | | | | 828,995 |
| Luxshare Precision Industry, Cl A | | | 853,056 | | | | 3,148,089 |
| Metallurgical Corp of China, Cl A | | | 3,361,621 | | | | 1,760,797 |
| NARI Technology, Cl A | | | 894,519 | | | | 2,809,931 |
| Power Construction Corp of China, Cl A | | | 1,982,646 | | | | 1,702,311 |
| Sany Heavy Industry, Cl A | | | 1,609,414 | | | | 3,060,669 |
| SF Holding, Cl A | | | 244,184 | | | | 1,330,618 |
| Shanghai Electric Group, Cl A | | | 1,353,860 | | | | 1,202,724 |
| Shanghai International Airport, Cl A | | | 185,660 | | | | 1,717,027 |
| Shanghai International Port Group, Cl A | | | 1,649,289 | | | | 1,784,223 |
| Shanghai Tunnel Engineering, Cl A | | | 842,750 | | | | 920,476 |
| Spring Airlines, Cl A | | | 129,850 | | | | 784,487 |
| Suzhou Gold Mantis Construction Decoration, Cl A | | | 471,861 | | | | 827,136 |
| TBEA, Cl A | | | 922,593 | | | | 1,136,732 |
| Tus-Sound Environmental Resources, Cl A | | | 239,211 | | | | 551,379 |
| Weichai Power, Cl A | | | 1,297,466 | | | | 2,287,874 |
| XCMG Construction Machinery, Cl A | | | 1,363,287 | | | | 892,602 |
| Xiamen C & D, Cl A | | | 420,275 | | | | 541,588 |
| Xinjiang Goldwind Science & Technology, Cl A | | | 792,091 | | | | 1,714,967 |
| Zhejiang Chint Electrics, Cl A | | | 473,851 | | | | 1,889,707 |
The accompanying notes are an integral part of the financial statements.
Schedule of InvestmentsMarch 31, 2019
KraneShares Bosera MSCI China A Share ETF(continued)
| | | Shares | | | Value |
| COMMON STOCK (continued) | | | | | | | |
| Industrials (continued) | | | | | | | |
| Zhengzhou Yutong Bus, Cl A | | | 416,050 | | | $ | 831,456 |
| Zoomlion Heavy Industry Science and Technology, Cl A | | | 1,616,791 | | | | 1,077,829 |
| | | | | | | | 76,566,627 |
| Information Technology — 7.5% | | | | | | | |
| 360 Security Technology, Cl A | | | 261,994 | | | | 1,006,620 |
| Aisino, Cl A | | | 417,303 | | | | 1,734,364 |
| Beijing Shiji Information Technology, Cl A | | | 223,718 | | | | 1,086,931 |
| Beijing Xinwei Technology Group, Cl A(A)(B)(C) | | | 27,410 | | | | — |
| BOE Technology Group, Cl A | | | 6,821,500 | | | | 3,958,788 |
| DHC Software, Cl A | | | 800,130 | | | | 1,053,711 |
| Focus Media Information Technology, Cl A | | | 2,455,329 | | | | 2,290,841 |
| Foxconn Industrial Internet, Cl A* | | | 865,412 | | | | 1,899,471 |
| GoerTek, Cl A | | | 587,563 | | | | 918,040 |
| Guangzhou Haige Communications Group, Cl A | | | 624,765 | | | | 909,229 |
| Hangzhou Hikvision Digital Technology, Cl A | | | 1,878,800 | | | | 9,804,696 |
| Hengtong Optic-electric, Cl A | | | 357,275 | | | | 1,128,147 |
| Hundsun Technologies, Cl A | | | 138,637 | | | | 1,806,353 |
| Iflytek, Cl A | | | 400,241 | | | | 2,161,356 |
| LONGi Green Energy Technology, Cl A | | | 551,487 | | | | 2,141,872 |
| Ninestar, Cl A | | | 133,000 | | | | 623,617 |
| O-film Tech, Cl A | | | 616,946 | | | | 1,303,627 |
| Sanan Optoelectronics, Cl A | | | 809,898 | | | | 1,767,984 |
| Shanghai 2345 Network Holding Group, Cl A | | | 1,186,834 | | | | 1,070,238 |
| Tianma Microelectronics, Cl A | | | 372,911 | | | | 859,002 |
| Tunghsu Optoelectronic Technology, Cl A | | | 1,331,845 | | | | 1,197,039 |
| Unisplendour, Cl A | | | 113,750 | | | | 737,830 |
| Yonyou Network Technology, Cl A | | | 358,520 | | | | 1,808,552 |
| Zhejiang Dahua Technology, Cl A | | | 503,100 | | | | 1,229,264 |
| ZTE, Cl A* | | | 682,824 | | | | 2,966,945 |
| | | | | | | | 45,464,517 |
| Materials — 5.9% | | | | | | | |
| Aluminum Corp of China, Cl A* | | | 2,493,800 | | | | 1,554,868 |
| Angang Steel, Cl A | | | 1,086,601 | | | | 921,643 |
| Anhui Conch Cement, Cl A | | | 814,053 | | | | 4,624,943 |
| Baoshan Iron & Steel, Cl A | | | 3,739,100 | | | | 4,022,751 |
| BBMG, Cl A | | | 1,534,908 | | | | 1,014,106 |
| China Molybdenum, Cl A | | | 3,706,649 | | | | 2,570,308 |
| China Northern Rare Earth Group High-Tech, Cl A | | | 637,100 | | | | 1,057,062 |
| Hengli Petrochemical, Cl A | | | 407,966 | | | | 1,123,087 |
| Hesteel, Cl A | | | 2,529,559 | | | | 1,287,326 |
| Inner Mongolia BaoTou Steel Union, Cl A | | | 8,946,280 | | | | 2,436,191 |
| Jiangxi Copper, Cl A | | | 318,804 | | | | 740,059 |
| Jiangxi Ganfeng Lithium, Cl A | | | 257,965 | | | | 1,059,084 |
| Jinduicheng Molybdenum, Cl A | | | 773,278 | | | | 796,269 |
| Maanshan Iron & Steel, Cl A | | | 906,900 | | | | 524,961 |
| Rongsheng Petro Chemical, Cl A | | | 523,907 | | | | 983,076 |
| Shandong Gold Mining, Cl A | | | 354,637 | | | | 1,640,147 |
| Shenzhen Zhongjin Lingnan Nonfemet, Cl A | | | 1,038,093 | | | | 780,091 |
The accompanying notes are an integral part of the financial statements.
Schedule of InvestmentsMarch 31, 2019
KraneShares Bosera MSCI China A Share ETF(continued)
| | | Shares | | | Value |
| COMMON STOCK (continued) | | | | | | | |
| Materials (continued) | | | | | | | |
| Sinopec Shanghai Petrochemical, Cl A | | | 835,804 | | | $ | 667,877 |
| Tianqi Lithium, Cl A | | | 234,750 | | | | 1,228,209 |
| Tongling Nonferrous Metals Group, Cl A | | | 2,690,900 | | | | 1,025,074 |
| Zhejiang Huayou Cobalt, Cl A | | | 173,823 | | | | 969,707 |
| Zhejiang Longsheng Group, Cl A | | | 765,056 | | | | 1,958,121 |
| Zhongjin Gold, Cl A | | | 589,837 | | | | 750,440 |
| Zijin Mining Group, Cl A | | | 3,780,975 | | | | 1,974,825 |
| | | | | | | | 35,710,225 |
| Real Estate — 5.6% | | | | | | | |
| China Fortune Land Development, Cl A | | | 499,778 | | | | 2,306,942 |
| China Merchants Shekou Industrial Zone Holdings, Cl A | | | 1,339,856 | | | | 4,593,655 |
| China Vanke, Cl A | | | 1,996,480 | | | | 9,126,494 |
| Financial Street Holdings, Cl A | | | 531,159 | | | | 678,156 |
| Gemdale, Cl A | | | 988,107 | | | | 2,021,736 |
| Greenland Holdings, Cl A | | | 1,343,641 | | | | 1,507,552 |
| Jinke Properties Group, Cl A | | | 1,293,941 | | | | 1,405,579 |
| Poly Developments and Holdings Group, Cl A | | | 2,429,397 | | | | 5,147,855 |
| RiseSun Real Estate Development, Cl A | | | 854,437 | | | | 1,430,376 |
| Seazen Holdings, Cl A | | | 466,910 | | | | 3,136,959 |
| Xinhu Zhongbao, Cl A | | | 1,640,268 | | | | 961,676 |
| Youngor Group, Cl A | | | 890,715 | | | | 1,207,466 |
| Zhejiang China Commodities City Group, Cl A | | | 888,056 | | | | 629,021 |
| | | | | | | | 34,153,467 |
| Utilities — 3.3% | | | | | | | |
| Beijing Capital, Cl A | | | 845,625 | | | | 524,725 |
| China National Nuclear Power, Cl A | | | 1,952,366 | | | | 1,757,658 |
| China Yangtze Power, Cl A | | | 2,940,138 | | | | 7,380,752 |
| GD Power Development, Cl A | | | 4,380,600 | | | | 1,746,973 |
| Huadian Power International, Cl A | | | 1,696,285 | | | | 1,100,533 |
| Huaneng Power International, Cl A | | | 848,597 | | | | 828,368 |
| Hubei Energy Group, Cl A | | | 703,500 | | | | 438,628 |
| SDIC Power Holdings, Cl A | | | 1,491,475 | | | | 1,842,094 |
| Shenergy, Cl A | | | 1,189,694 | | | | 994,923 |
| Shenzhen Energy Group, Cl A | | | 602,392 | | | | 581,757 |
| Sichuan Chuantou Energy, Cl A | | | 746,682 | | | | 1,036,657 |
| Zhejiang Zheneng Electric Power, Cl A | | | 2,088,142 | | | | 1,513,236 |
| | | | | | | | 19,746,304 |
TOTAL COMMON STOCK
(Cost $586,269,837) | | | | | | | 601,263,766 |
| | | | | | | | |
TOTAL INVESTMENTS — 99.5%
(Cost $586,269,837) | | | | | | | 601,263,766 |
| OTHER ASSETS LESS LIABILITIES – 0.5% | | | | | | | 2,771,467 |
| NET ASSETS - 100% | | | | | | $ | 604,035,233 |
| * | Non-income producing security. |
| ‡ | Industries are utilized for compliance purposes, whereas sectors are utilized for reporting. |
| (A) | Security is fair valued using methods determined in good faith by the Fair Value Committee appointed by the Board of Trustees. The total value of such securities as of March 31, 2019 was $0 and represents 0.0% of Net Assets. |
The accompanying notes are an integral part of the financial statements.
Schedule of InvestmentsMarch 31, 2019
KraneShares Bosera MSCI China A Share ETF(concluded)
| (B) | Level 3 security in accordance with fair value hierarchy. |
| (C) | Security considered illiquid. The total value of such securities as of March 31, 2019 was $0 and represents 0.0% of Net Assets (Unaudited). |
Cl — Class
The following summarizes the market value of the Fund’s investments used as of March 31, 2019, based on the inputs used to value them:
| Investments in Securities | | Level 1 | | | Level 2 | | | Level 3 | | | Total |
| Common Stock | | | | | | | | | | | | | | | |
| China | | | | | | | | | | | | | | | |
| Communication Services | | $ | 12,944,382 | | | $ | — | | | $ | — | | | $ | 12,944,382 |
| Consumer Discretionary | | | 46,838,773 | | | | — | | | | — | | | | 46,838,773 |
| Consumer Staples | | | 77,820,274 | | | | — | | | | — | | | | 77,820,274 |
| Energy | | | 15,034,501 | | | | — | | | | — | | | | 15,034,501 |
| Financials | | | 206,167,229 | | | | — | | | | — | | | | 206,167,229 |
| Health Care | | | 30,817,467 | | | | — | | | | — | | | | 30,817,467 |
| Industrials | | | 76,566,627 | | | | — | | | | — | | | | 76,566,627 |
| Information Technology | | | 45,464,517 | | | | — | | | | — | | | | 45,464,517 |
| Materials | | | 35,710,225 | | | | — | | | | — | | | | 35,710,225 |
| Real Estate | | | 34,153,467 | | | | — | | | | — | | | | 34,153,467 |
| Utilities | | | 19,746,304 | | | | — | | | | — | | | | 19,746,304 |
| Total Common Stock | | | 601,263,766 | | | | — | | | | — | | | | 601,263,766 |
| Total Investments in Securities | | $ | 601,263,766 | | | $ | — | | | $ | — | | | $ | 601,263,766 |
The following is a reconciliation of the beginning and ending balances, of the year ended March 31, 2019, of investments in which significant unobservable inputs (Level 3) were used in determining value:
| | | Common Stock | |
| Beginning balance as of March 29, 2018 | | $ | 6,103,566 | |
| Accrued discounts/premiums | | | — | |
| Realized gain/(loss)(1) | | | 124,864 | |
| Change in unrealized appreciation/(depreciation)(2) | | | (553,405 | ) |
| Purchases | | | 47,553 | |
| Sales | | | (5,722,578 | ) |
| Transfer into Level 3 | | | — | |
| Transfer out of Level 3 | | | — | |
| Ending balance as of March 31, 2019 | | $ | — | |
| (1) | Realized gain/(loss) from the sale of Level 3 securities is included on the Statement of Operations in Net Realized Gain (Loss) on Investments. |
| (2) | Change in unrealized appreciation/(depreciation) is included on the Statement of Operations in Net Change in Unrealized Appreciation (Depreciation) on Investments. |
For the year ended March 31, 2019, there have been no transfers between Level 1, Level 2 or Level 3 investments. Transfers between levels are recognized at period end.
Amounts designated as “—” are $0 or have been rounded to $0.
The accompanying notes are an integral part of the financial statements.
Schedule of InvestmentsMarch 31, 2019
KraneShares E Fund China Commercial Paper ETF
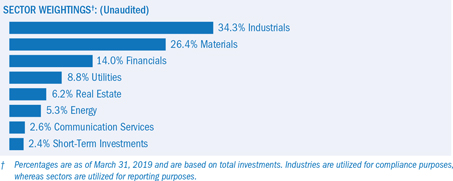
| | | Face
Amount(A) | | | Value |
| COMMERCIAL PAPER — 79.1%‡ | | | | | | | |
| CHINA — 79.1% | | | | | | | |
| Communication Services — 2.4% | | | | | | | |
| China Telecom | | | | | | | |
| 3.050%, 04/26/2019 | | | 3,000,000 | | | $ | 446,370 |
| | | | | | | | |
| Energy — 2.4% | | | | | | | |
| Nanjing Railway Construction Investment | | | | | | | |
| 3.830%, 11/05/2019 | | | 3,000,000 | | | | 447,799 |
| | | | | | | | |
| Financials — 12.6% | | | | | | | |
| Beijing State-Owned Assets Management | | | | | | | |
| 2.950%, 11/18/2019 | | | 5,000,000 | | | | 742,852 |
| Central Huijin Investment | | | | | | | |
| 3.430%, 08/06/2019 | | | 4,000,000 | | | | 596,092 |
| Ping An International Financial Leasing | | | | | | | |
| 3.440%, 06/06/2019 | | | 4,000,000 | | | | 595,139 |
| Shanghai Lujiazui Group | | | | | | | |
| 3.600%, 06/14/2019 | | | 3,000,000 | | | | 446,751 |
| | | | | | | | 2,380,834 |
| Industrials — 28.5% | | | | | | | |
| CCCC First Harbor Engineering | | | | | | | |
| 3.380%, 09/06/2019 | | | 5,000,000 | | | | 744,330 |
| China Eastern Airlines | | | | | | | |
| 3.650%, 05/30/2019 | | | 3,000,000 | | | | 446,840 |
| China Heavy Duty Truck | | | | | | | |
| 3.850%, 06/17/2019 | | | 3,000,000 | | | | 447,024 |
| Guangzhou Yuexiu Holding Ltd. | | | | | | | |
| 3.200%, 05/20/2019 | | | 4,000,000 | | | | 595,071 |
| Rizhao Port Group | | | | | | | |
| 4.600%, 07/23/2019 | | | 2,000,000 | | | | 298,680 |
| Shaanxi Construction Engineering Group | | | | | | | |
| 3.750%, 09/09/2019 | | | 7,000,000 | | | | 1,043,686 |
| Tianjin Infrastructure Construction & Investment Group | | | | | | | |
| 3.300%, 01/09/2020 | | | 5,000,000 | | | | 743,754 |
The accompanying notes are an integral part of the financial statements.
Schedule of InvestmentsMarch 31, 2019
KraneShares E Fund China Commercial Paper ETF(continued)
| | | Face
Amount(A) | | | Value |
| COMMERCIAL PAPER (continued) | | | | | | | |
| Industrials(continued) | | | | | | | |
| Xiamen ITG Group | | | | | | | |
| 3.000%, 11/25/2019 | | | 5,000,000 | | | $ | 742,557 |
| Zhejiang Geely Holding Group | | | | | | | |
| 3.490%, 10/22/2019 | | | 2,000,000 | | | | 298,182 |
| | | | | | | | 5,360,124 |
| Materials — 19.8% | | | | | | | |
| Aluminum Corporation of China | | | | | | | |
| 3.770%, 07/09/2019 | | | 4,000,000 | | | | 596,132 |
| Anshan Iron And Steel Group | | | | | | | |
| 4.000%, 08/20/2019 | | | 4,000,000 | | | | 596,877 |
| Henan Pinggao Electric Ltd. | | | | | | | |
| 4.510%, 04/19/2019 | | | 4,000,000 | | | | 595,445 |
| Jiangsu Shagang Group | | | | | | | |
| 3.290%, 11/22/2019 | | | 5,000,000 | | | | 742,719 |
| Shougang Group | | | | | | | |
| 3.140%, 11/15/2019 | | | 5,000,000 | | | | 743,236 |
| South Cement | | | | | | | |
| 3.790%, 07/12/2019 | | | 3,000,000 | | | | 447,145 |
| | | | | | | | 3,721,554 |
| Real Estate — 5.5% | | | | | | | |
| Beijing Capital Development | | | | | | | |
| 3.790%, 09/01/2019 | | | 4,000,000 | | | | 596,183 |
| Gemdale | | | | | | | |
| 4.070%, 08/25/2019 | | | 3,000,000 | | | | 447,717 |
| | | | | | | | 1,043,900 |
| Utilities — 7.9% | | | | | | | |
| China Datang Corporation | | | | | | | |
| 3.450%, 07/19/2019 | | | 4,000,000 | | | | 595,720 |
| GD Power Development | | | | | | | |
| 4.100%, 04/12/2019 | | | 6,000,000 | | | | 893,031 |
| | | | | | | | 1,488,751 |
TOTAL COMMERCIAL PAPER
(Cost $14,706,438) | | | | | | | 14,889,332 |
The accompanying notes are an integral part of the financial statements.
Schedule of InvestmentsMarch 31, 2019
KraneShares E Fund China Commercial Paper ETF(continued)
| | | Face
Amount(A)/
Shares | | | Value |
| CORPORATE OBLIGATIONS — 8.7% | | | | | | | |
| CHINA — 8.7% | | | | | | | |
| HBIS Group | | | | | | | |
| 4.870%, 04/04/2019 | | | 5,000,000 | | | $ | 744,086 |
| Nanjing Yangzi State-Owned Assets Investment Group | | | | | | | |
| 4.450%, 07/19/2019 | | | 3,000,000 | | | | 447,930 |
| Ningbo Development & Investment Group | | | | | | | |
| 3.870%, 06/18/2019 | | | 3,000,000 | | | | 446,946 |
TOTAL CORPORATE OBLIGATIONS
(Cost $1,656,429) | | | | | | | 1,638,962 |
| | | | | | | | |
| SHORT-TERM INVESTMENTS(B)(C)— 2.2% | | | | | | | |
China Universal Express Income Money Market
Fund, 2.238% | | | 385 | | | | 57 |
| E Fund Money Market Fund, 3.356%* | | | 2,582,000 | | | | 384,215 |
| Fortune SGAM Xianjin Tianyi Money Market Fund, 2.630% | | | 161,466 | | | | 24,022 |
Xianjinbao Real-Time Redemption Money Market
Fund, 2.100% | | | 3,501 | | | | 521 |
TOTAL SHORT-TERM INVESTMENTS
(Cost $416,385) | | | | | | | 408,815 |
| | | | | | | | |
TOTAL INVESTMENTS — 90.0%
(Cost $16,779,252) | | | | | | | 16,937,109 |
| OTHER ASSETS LESS LIABILITIES — 10.0% | | | | | | | 1,885,123 |
| NET ASSETS — 100% | | | | | | $ | 18,822,232 |
| * | Affiliated investment is a Chinese investment company which is managed by E Fund Management (Hong Kong) Co., Limited (the “Sub-Adviser”) or an affiliate of the Sub-Adviser or which is distributed by an affiliate of the Fund’s distributor. Transactions with affiliated companies during the year ended March 31, 2019 are as follows: |
Value
of Shares Held as
of 3/29/18 | | Purchases
at Cost | | Proceeds
from Sales | | Change in
Unrealized
Appreciation
(Depreciation) | | Realized
Gain
(Loss) | | Value
of Shares
Held as
of 3/31/19 | | Number of
Shares
Held as
of 3/31/19 | | Dividend
Income | | Capital Gains
Distributions | |
| E Fund Money Market Fund | |
| $23,714 | | $446,092 | | $(73,581) | | $(7,986) | | $(4,024) | | $384,215 | | 2,582,000 | | $6,729 | | $ — | |
Amounts designated as “—” are $0.
| ‡ | Narrow industries are utilized for compliance purposes, whereas broad sectors are utilized for reporting. |
| (A) | In CNY unless otherwise indicated. |
| (B) | The rate shown is the 7-day effective yield as of March 31, 2019. |
CNY — Chinese Yuan
Ltd. — Limited
The accompanying notes are an integral part of the financial statements.
Schedule of InvestmentsMarch 31, 2019
KraneShares E Fund China Commercial Paper ETF(concluded)
The following summarizes the market value of the Fund’s investments used as of March 31, 2019, based on the inputs used to value them:
| Investments in Securities | | Level 1 | | | Level 2 | | | Level 3 | | | Total |
| Commercial Paper | | $ | — | | | $ | 14,889,332 | | | $ | — | | | $ | 14,889,332 |
| Corporate Obligations | | | — | | | | 1,638,962 | | | | — | | | | 1,638,962 |
| Short-Term Investments | | | 408,815 | | | | — | | | | — | | | | 408,815 |
| Total Investments in Securities | | $ | 408,815 | | | $ | 16,528,294 | | | $ | — | | | $ | 16,937,109 |
For the year ended March 31, 2019, there have been no transfers between Level 1, Level 2 or Level 3 investments. Transfers between levels are recognized at period end.
The accompanying notes are an integral part of the financial statements.
Schedule of InvestmentsMarch 31, 2019
KraneShares MSCI All China Index ETF
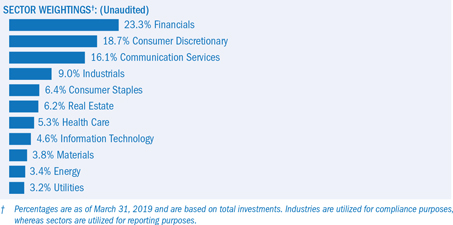
| | | Shares | | | Value |
| COMMON STOCK — 99.4%‡ | | | | | | | |
| CHINA — 89.9% | | | | | | | |
| Communication Services — 15.7% | | | | | | | |
| 58.com ADR* | | | 246 | | | $ | 16,157 |
| Autohome ADR* | | | 148 | | | | 15,558 |
| Baidu ADR* | | | 698 | | | | 115,065 |
| China Mobile | | | 10,972 | | | | 111,817 |
| China Telecom, Cl H | | | 30,000 | | | | 16,663 |
| China Unicom Hong Kong | | | 12,000 | | | | 15,210 |
| Momo ADR* | | | 210 | | | | 8,030 |
| NetEase ADR | | | 190 | | | | 45,876 |
| Shanghai Oriental Pearl Group, Cl A | | | 5,640 | | | | 10,365 |
| SINA* | | | 200 | | | | 11,848 |
| Tencent Holdings | | | 13,358 | | | | 614,302 |
| Tencent Music Entertainment Group ADR* | | | 1 | | | | 18 |
| Weibo ADR* | | | 146 | | | | 9,051 |
| YY ADR* | | | 141 | | | | 11,845 |
| | | | | | | | 1,001,805 |
| Consumer Discretionary — 18.2% | | | | | | | |
| Alibaba Group Holding ADR* | | | 3,245 | | | | 592,050 |
| ANTA Sports Products | | | 5,000 | | | | 34,013 |
| BAIC Motor, Cl H | | | 8,000 | | | | 5,228 |
| Brilliance China Automotive Holdings | | | 12,000 | | | | 11,893 |
| BYD, Cl A | | | 1,600 | | | | 12,735 |
| BYD, Cl H | | | 2,500 | | | | 15,064 |
| China Grand Automotive Services, Cl A | | | 8,500 | | | | 6,704 |
| China International Travel Service, Cl A | | | 1,500 | | | | 15,642 |
| Chongqing Changan Automobile, Cl A | | | 13,100 | | | | 16,141 |
| Ctrip.com International ADR* | | | 995 | | | | 43,472 |
| Dongfeng Motor Group, Cl H | | | 10,000 | | | | 10,013 |
| Fuyao Glass Industry Group, Cl A | | | 5,500 | | | | 19,913 |
| Geely Automobile Holdings | | | 11,000 | | | | 21,019 |
| Great Wall Motor, Cl H | | | 15,500 | | | | 11,630 |
The accompanying notes are an integral part of the financial statements.
Schedule of InvestmentsMarch 31, 2019
KraneShares MSCI All China Index ETF(continued)
| | | Shares | | | Value |
| COMMON STOCK (continued) | | | | | | | |
| Consumer Discretionary (continued) | | | | | | | |
| Gree Electric Appliances of Zhuhai, Cl A | | | 2,500 | | | $ | 17,563 |
| Guangzhou Automobile Group, Cl H | | | 12,000 | | | | 14,171 |
| Huayu Automotive Systems, Cl A | | | 3,100 | | | | 9,401 |
| Huazhu Group ADR | | | 341 | | | | 14,370 |
| JD.com ADR* | | | 1,250 | | | | 37,688 |
| Midea Group, Cl A | | | 4,500 | | | | 32,631 |
| NavInfo, Cl A | | | 3,000 | | | | 10,124 |
| New Oriental Education & Technology Group ADR* | | | 338 | | | | 30,451 |
| Qingdao Haier, Cl A | | | 5,600 | | | | 14,258 |
| SAIC Motor, Cl A | | | 4,657 | | | | 18,066 |
| Shenzhen Overseas Chinese Town, Cl A | | | 12,000 | | | | 13,750 |
| Shenzhou International Group Holdings | | | 2,500 | | | | 33,503 |
| Suning.com, Cl A | | | 8,600 | | | | 16,060 |
| Suofeiya Home Collection, Cl A | | | 2,100 | | | | 8,015 |
| TAL Education Group ADR* | | | 792 | | | | 28,575 |
| Vipshop Holdings ADR* | | | 1,283 | | | | 10,302 |
| Yum China Holdings | | | 796 | | | | 35,748 |
| | | | | | | | 1,160,193 |
| Consumer Staples — 6.3% | | | | | | | |
| Angel Yeast, Cl A | | | 2,000 | | | | 8,053 |
| Anhui Gujing Distillery, Cl A | | | 600 | | | | 9,598 |
| China Mengniu Dairy* | | | 6,000 | | | | 22,319 |
| China Resources Beer Holdings | | | 8,000 | | | | 33,682 |
| Foshan Haitian Flavouring & Food, Cl A | | | 1,600 | | | | 20,642 |
| Guangdong Haid Group, Cl A | | | 3,100 | | | | 13,009 |
| Henan Shuanghui Investment & Development, Cl A | | | 3,100 | | | | 11,924 |
| Inner Mongolia Yili Industrial Group, Cl A | | | 5,000 | | | | 21,659 |
| Jiangsu Yanghe Brewery Joint-Stock, Cl A | | | 1,000 | | | | 19,407 |
| Kweichow Moutai, Cl A | | | 1,000 | | | | 127,078 |
| Luzhou Laojiao, Cl A | | | 1,500 | | | | 14,861 |
| Muyuan Foodstuff, Cl A | | | 2,400 | | | | 22,610 |
| New Hope Liuhe, Cl A | | | 14,100 | | | | 27,905 |
| Shanxi Xinghuacun Fen Wine Factory, Cl A | | | 600 | | | | 5,399 |
| Tingyi Cayman Islands Holding | | | 8,000 | | | | 13,187 |
| Want Want China Holdings | | | 15,000 | | | | 12,459 |
| Yonghui Superstores, Cl A | | | 10,500 | | | | 13,500 |
| | | | | | | | 397,292 |
| Energy — 3.2% | | | | | | | |
| China Oilfield Services, Cl H | | | 10,000 | | | | 10,802 |
| China Petroleum & Chemical, Cl A | | | 18,500 | | | | 15,801 |
| China Petroleum & Chemical, Cl H | | | 42,500 | | | | 33,513 |
| China Shenhua Energy, Cl H | | | 7,500 | | | | 17,102 |
| CNOOC | | | 31,826 | | | | 59,598 |
| Offshore Oil Engineering, Cl A | | | 12,600 | | | | 12,075 |
| PetroChina, Cl A | | | 9,600 | | | | 10,857 |
| PetroChina, Cl H | | | 43,984 | | | | 28,520 |
| Shaanxi Coal Industry, Cl A | | | 8,000 | | | | 10,607 |
| Shanxi Lu’an Environmental Energy Development, Cl A | | | 5,000 | | | | 5,826 |
| | | | | | | | 204,701 |
The accompanying notes are an integral part of the financial statements.
Schedule of InvestmentsMarch 31, 2019
KraneShares MSCI All China Index ETF(continued)
| | | Shares | | | Value |
| COMMON STOCK (continued) | | | | | | | |
| Financials — 18.8% | | | | | | | |
| Agricultural Bank of China, Cl A | | | 17,500 | | | $ | 9,713 |
| Agricultural Bank of China, Cl H | | | 70,397 | | | | 32,464 |
| Anxin Trust, Cl A | | | 8,000 | | | | 8,607 |
| AVIC Capital, Cl A | | | 15,100 | | | | 13,280 |
| Bank of Beijing, Cl A | | | 19,500 | | | | 17,991 |
| Bank of China, Cl A | | | 20,600 | | | | 11,557 |
| Bank of China, Cl H | | | 146,396 | | | | 66,391 |
| Bank of Communications, Cl A | | | 30,000 | | | | 27,856 |
| Bank of Communications, Cl H | | | 4,000 | | | | 3,276 |
| Bank of Hangzhou, Cl A | | | 9,600 | | | | 12,300 |
| Bank of Jiangsu, Cl A | | | 15,600 | | | | 16,551 |
| Bank of Nanjing, Cl A | | | 10,100 | | | | 11,888 |
| Bank of Ningbo, Cl A | | | 4,600 | | | | 14,539 |
| Bank of Shanghai, Cl A | | | 10,100 | | | | 18,005 |
| Changjiang Securities, Cl A | | | 14,600 | | | | 16,359 |
| China CITIC Bank, Cl H | | | 21,000 | | | | 13,376 |
| China Construction Bank, Cl A | | | 8,600 | | | | 8,894 |
| China Construction Bank, Cl H | | | 201,000 | | | | 172,323 |
| China Everbright Bank, Cl A | | | 37,500 | | | | 22,879 |
| China Life Insurance, Cl H | | | 20,483 | | | | 55,057 |
| China Merchants Bank, Cl A | | | 10,000 | | | | 50,475 |
| China Merchants Securities, Cl A | | | 6,500 | | | | 16,946 |
| China Minsheng Banking, Cl A* | | | 19,000 | | | | 17,925 |
| China Pacific Insurance Group, Cl A | | | 3,600 | | | | 18,235 |
| CITIC Securities, Cl A | | | 7,500 | | | | 27,655 |
| Everbright Securities, Cl A | | | 7,000 | | | | 13,708 |
| Founder Securities, Cl A | | | 12,000 | | | | 13,714 |
| GF Securities, Cl A* | | | 3,600 | | | | 8,662 |
| Guosen Securities, Cl A | | | 8,000 | | | | 16,119 |
| Guotai Junan Securities, Cl A | | | 5,500 | | | | 16,491 |
| Haitong Securities, Cl A | | | 8,500 | | | | 17,746 |
| Huatai Securities, Cl A | | | 4,100 | | | | 13,672 |
| Huaxia Bank, Cl A | | | 13,100 | | | | 16,082 |
| Hubei Biocause Pharmaceutical, Cl A | | | 8,600 | | | | 8,728 |
| Industrial & Commercial Bank of China, Cl A | | | 35,000 | | | | 29,010 |
| Industrial Bank, Cl A | | | 13,600 | | | | 36,772 |
| Industrial Securities, Cl A | | | 18,500 | | | | 19,958 |
| New China Life Insurance, Cl A | | | 1,500 | | | | 11,984 |
| New China Life Insurance, Cl H | | | 3,100 | | | | 15,796 |
| Noah Holdings ADR* | | | 141 | | | | 6,833 |
| Orient Securities, Cl A | | | 9,500 | | | | 16,851 |
| PICC Property & Casualty, Cl H | | | 13,510 | | | | 15,352 |
| Ping An Bank, Cl A | | | 14,100 | | | | 26,898 |
| Ping An Insurance Group of China, Cl A | | | 6,000 | | | | 68,837 |
| Ping An Insurance Group of China, Cl H | | | 8,000 | | | | 89,580 |
| Shanghai Pudong Development Bank, Cl A | | | 20,000 | | | | 33,570 |
| Shenwan Hongyuan Group, Cl A | | | 22,600 | | | | 18,564 |
| | | | | | | | 1,199,469 |
The accompanying notes are an integral part of the financial statements.
Schedule of InvestmentsMarch 31, 2019
KraneShares MSCI All China Index ETF(continued)
| | | Shares | | | Value |
| COMMON STOCK (continued) | | | | | | | |
| Health Care — 5.3% | | | | | | | |
| 3SBio | | | 5,000 | | | $ | 9,834 |
| Alibaba Health Information Technology* | | | 12,000 | | | | 13,865 |
| Beijing Tongrentang, Cl A | | | 2,544 | | | | 11,330 |
| Changchun High & New Technology Industry Group, Cl A | | | 400 | | | | 18,868 |
| China Medical System Holdings | | | 6,000 | | | | 5,816 |
| China Traditional Chinese Medicine Holdings | | | 12,000 | | | | 7,139 |
| CSPC Pharmaceutical Group | | | 10,000 | | | | 18,599 |
| Dong-E-E-Jiao, Cl E | | | 2,000 | | | | 14,122 |
| Genscript Biotech* | | | 8,000 | | | | 15,103 |
| Guangzhou Baiyunshan Pharmaceutical Holdings, Cl A | | | 1,600 | | | | 9,285 |
| Huadong Medicine, Cl A | | | 1,600 | | | | 7,769 |
| Hualan Biological Engineering, Cl A | | | 2,000 | | | | 13,393 |
| Jiangsu Hengrui Medicine, Cl A | | | 3,000 | | | | 29,204 |
| Kangmei Pharmaceutical, Cl A | | | 4,600 | | | | 7,153 |
| Meinian Onehealth Healthcare Holdings, Cl A | | | 4,000 | | | | 11,065 |
| Shanghai Fosun Pharmaceutical Group, Cl A | | | 2,600 | | | | 11,522 |
| Shanghai Fosun Pharmaceutical Group, Cl H | | | 2,000 | | | | 7,223 |
| Shanghai Pharmaceuticals Holding, Cl A | | | 5,000 | | | | 15,386 |
| Sichuan Kelun Pharmaceutical, Cl A | | | 1,600 | | | | 6,893 |
| Sino Biopharmaceutical | | | 15,000 | | | | 13,682 |
| Sinopharm Group, Cl H | | | 4,000 | | | | 16,663 |
| Tasly Pharmaceutical Group, Cl A | | | 2,500 | | | | 8,378 |
| Tong Ren Tang Technologies, Cl H | | | 6,000 | | | | 8,056 |
| Tonghua Dongbao Pharmaceutical, Cl A | | | 3,500 | | | | 9,041 |
| Wuxi Biologics Cayman* | | | 2,000 | | | | 19,453 |
| Yunnan Baiyao Group, Cl A | | | 1,000 | | | | 12,723 |
| Zhangzhou Pientzehuang Pharmaceutical, Cl A | | | 500 | | | | 8,549 |
| Zhejiang NHU, Cl A | | | 3,000 | | | | 8,250 |
| | | | | | | | 338,364 |
| Industrials — 8.8% | | | | | | | |
| 51job ADR* | | | 93 | | | | 7,243 |
| AECC Aviation Power, Cl A | | | 2,600 | | | | 10,214 |
| AVIC Aircraft, Cl A | | | 3,600 | | | | 9,133 |
| AVIC Electromechanical Systems, Cl A | | | 5,000 | | | | 5,967 |
| AVIC Shenyang Aircraft, Cl A* | | | 1,600 | | | | 7,800 |
| Beijing Capital International Airport, Cl H | | | 8,000 | | | | 7,592 |
| China Communications Construction, Cl H | | | 20,000 | | | | 20,688 |
| China Conch Venture Holdings | | | 5,000 | | | | 17,898 |
| China Eastern Airlines, Cl A | | | 17,100 | | | | 17,659 |
| China Everbright International | | | 10,323 | | | | 10,494 |
| China Gezhouba Group, Cl A | | | 7,100 | | | | 7,670 |
| China Merchants Port Holdings | | | 8,000 | | | | 17,040 |
| China Railway Construction, Cl A | | | 7,100 | | | | 12,161 |
| China Railway Construction, Cl H | | | 8,000 | | | | 10,476 |
| China Railway Group, Cl H | | | 15,000 | | | | 13,682 |
| China Southern Airlines, Cl A | | | 6,600 | | | | 8,397 |
| China State Construction Engineering, Cl A | | | 27,500 | | | | 25,044 |
| China State Construction International Holdings | | | 10,000 | | | | 9,363 |
| CITIC | | | 10,780 | | | | 16,095 |
The accompanying notes are an integral part of the financial statements.
Schedule of InvestmentsMarch 31, 2019
KraneShares MSCI All China Index ETF(continued)
| | | Shares | | | Value |
| COMMON STOCK (continued) | | | | | | | |
| Industrials (continued) | | | | | | | |
| COSCO Shipping Development, Cl A* | | | 41,000 | | | $ | 18,730 |
| COSCO Shipping Holdings, Cl A* | | | 19,000 | | | | 14,928 |
| CRRC, Cl A | | | 14,000 | | | | 18,958 |
| CRRC, Cl H | | | 11,000 | | | | 10,370 |
| Daqin Railway, Cl A | | | 11,600 | | | | 14,396 |
| Fosun International | | | 7,500 | | | | 12,707 |
| Guangzhou Baiyun International Airport, Cl A | | | 5,000 | | | | 10,997 |
| Jiangsu Expressway, Cl H | | | 10,000 | | | | 14,140 |
| Luxshare Precision Industry, Cl A | | | 4,600 | | | | 16,975 |
| Metallurgical Corp of China, Cl A | | | 28,500 | | | | 14,928 |
| Ningbo Zhoushan Port, Cl A | | | 6,500 | | | | 4,208 |
| Power Construction Corp of China, Cl A | | | 13,100 | | | | 11,248 |
| Sany Heavy Industry, Cl A | | | 9,000 | | | | 17,116 |
| Shanghai Electric Group, Cl H | | | 32,000 | | | | 12,148 |
| Shanghai International Airport, Cl A | | | 1,000 | | | | 9,248 |
| Shanghai International Port Group, Cl A | | | 9,000 | | | | 9,736 |
| Suzhou Gold Mantis Construction Decoration, Cl A | | | 5,600 | | | | 9,816 |
| Weichai Power, Cl A | | | 17,500 | | | | 30,858 |
| Xinjiang Goldwind Science & Technology, Cl A | | | 7,249 | | | | 15,695 |
| Zhejiang Chint Electrics, Cl A | | | 2,500 | | | | 9,970 |
| Zhejiang Sanhua Intelligent Controls, Cl A | | | 4,000 | | | | 9,327 |
| Zhengzhou Yutong Bus, Cl A | | | 4,600 | | | | 9,193 |
| Zhuzhou CRRC Times Electric, Cl H | | | 2,000 | | | | 11,822 |
| Zoomlion Heavy Industry Science and Technology, Cl A | | | 25,500 | | | | 16,999 |
| | | | | | | | 559,129 |
| Information Technology — 4.1% | | | | | | | |
| AAC Technologies Holdings | | | 2,500 | | | | 14,793 |
| Aisino, Cl A | | | 2,600 | | | | 10,806 |
| BOE Technology Group, Cl A | | | 32,600 | | | | 18,919 |
| DHC Software, Cl A | | | 6,600 | | | | 8,692 |
| Focus Media Information Technology, Cl A | | | 9,600 | | | | 8,957 |
| GDS Holdings ADR* | | | 193 | | | | 6,888 |
| Hanergy Thin Film Power Group*(A)(B)(C) | | | 4,364 | | | | 6 |
| Hangzhou Hikvision Digital Technology, Cl A | | | 7,000 | | | | 36,530 |
| Hengtong Optic-electric, Cl A | | | 2,600 | | | | 8,210 |
| Iflytek, Cl A | | | 2,100 | | | | 11,340 |
| Kingdee International Software Group | | | 10,000 | | | | 11,567 |
| Kingsoft* | | | 5,000 | | | | 12,714 |
| Lenovo Group | | | 12,000 | | | | 10,792 |
| LONGi Green Energy Technology, Cl A | | | 3,600 | | | | 13,982 |
| O-film Tech, Cl A | | | 4,500 | | | | 9,509 |
| Sanan Optoelectronics, Cl A | | | 5,500 | | | | 12,006 |
| Sunny Optical Technology Group | | | 1,600 | | | | 19,108 |
| Tianma Microelectronics, Cl A | | | 5,000 | | | | 11,517 |
| TravelSky Technology, Cl H | | | 4,000 | | | | 10,573 |
| Unigroup Guoxin Microelectronics, Cl A | | | 1,100 | | | | 7,371 |
| Yonyou Network Technology, Cl A | | | 2,100 | | | | 10,593 |
| Zhejiang Dahua Technology, Cl A | | | 3,500 | | | | 8,552 |
| | | | | | | | 263,425 |
The accompanying notes are an integral part of the financial statements.
Schedule of InvestmentsMarch 31, 2019
KraneShares MSCI All China Index ETF(continued)
| | | Shares | | | Value |
| COMMON STOCK (continued) | | | | | | | |
| Materials — 3.4% | | | | | | | |
| Angang Steel, Cl A | | | 12,500 | | | $ | 10,603 |
| Anhui Conch Cement, Cl A | | | 2,500 | | | | 14,203 |
| Anhui Conch Cement, Cl H | | | 2,500 | | | | 15,271 |
| Baoshan Iron & Steel, Cl A | | | 12,600 | | | | 13,556 |
| BBMG, Cl A | | | 19,500 | | | | 12,884 |
| China Molybdenum, Cl H | | | 33,000 | | | | 13,789 |
| China National Building Material, Cl H | | | 12,000 | | | | 9,462 |
| China Northern Rare Earth Group High-Tech, Cl A | | | 7,100 | | | | 11,780 |
| Hesteel, Cl A | | | 22,000 | | | | 11,196 |
| Inner Mongolia BaoTou Steel Union, Cl A | | | 44,100 | | | | 12,009 |
| Jiangxi Ganfeng Lithium, Cl A | | | 1,500 | | | | 6,158 |
| Rongsheng Petro Chemical, Cl A | | | 5,100 | | | | 9,570 |
| Shandong Gold Mining, Cl A | | | 3,500 | | | | 16,187 |
| Shandong Hualu Hengsheng Chemical, Cl A | | | 3,000 | | | | 6,826 |
| Sinopec Shanghai Petrochemical, Cl A | | | 22,600 | | | | 18,059 |
| Tianqi Lithium, Cl A | | | 1,500 | | | | 7,848 |
| Zhejiang Huayou Cobalt, Cl A | | | 600 | | | | 3,347 |
| Zhejiang Longsheng Group, Cl A | | | 7,500 | | | | 19,196 |
| Zijin Mining Group, Cl A | | | 12,600 | | | | 6,581 |
| | | | | | | | 218,525 |
| Real Estate — 3.9% | | | | | | | |
| China Fortune Land Development, Cl A | | | 3,000 | | | | 13,848 |
| China Merchants Shekou Industrial Zone Holdings, Cl A | | | 6,000 | | | | 20,571 |
| China Overseas Land & Investment | | | 10,839 | | | | 41,147 |
| China Resources Land | | | 10,214 | | | | 45,801 |
| China Vanke, Cl A | | | 6,000 | | | | 27,428 |
| China Vanke, Cl H | | | 3,100 | | | | 13,032 |
| Gemdale, Cl A | | | 7,000 | | | | 14,322 |
| Greenland Holdings, Cl A | | | 12,000 | | | | 13,464 |
| Poly Developments and Holdings Group, Cl A | | | 8,600 | | | | 18,223 |
| Seazen Holdings, Cl A | | | 2,000 | | | | 13,437 |
| Xinhu Zhongbao, Cl A | | | 21,100 | | | | 12,371 |
| Zhejiang China Commodities City Group, Cl A | | | 21,000 | | | | 14,874 |
| | | | | | | | 248,518 |
| Utilities — 2.2% | | | | | | | |
| Beijing Enterprises Water Group | | | 20,000 | | | | 12,357 |
| China Longyuan Power Group, Cl H | | | 10,000 | | | | 6,955 |
| China National Nuclear Power, Cl A | | | 16,100 | | | | 14,494 |
| China Yangtze Power, Cl A | | | 8,000 | | | | 20,083 |
| ENN Energy Holdings | | | 382 | | | | 3,694 |
| Guangdong Investment | | | 10,000 | | | | 19,312 |
| Huadian Power International, Cl A | | | 17,000 | | | | 11,029 |
| Huaneng Power International, Cl H | | | 11,077 | | | | 6,435 |
| Hubei Energy Group, Cl A | | | 17,600 | | | | 10,973 |
| SDIC Power Holdings, Cl A | | | 9,000 | | | | 11,116 |
| Sichuan Chuantou Energy, Cl A | | | 9,100 | | | | 12,634 |
| Zhejiang Zheneng Electric Power, Cl A | | | 12,500 | | | | 9,059 |
| | | | | | | | 138,141 |
| TOTAL CHINA | | | | | | | 5,729,562 |
The accompanying notes are an integral part of the financial statements.
Schedule of InvestmentsMarch 31, 2019
KraneShares MSCI All China Index ETF(continued)
| | | Shares | | | Value |
| COMMON STOCK (continued) | | | | | | | |
| HONG KONG — 9.5% | | | | | | | |
| Communication Services — 0.3% | | | | | | | |
| Alibaba Pictures Group* | | | 100,000 | | | $ | 17,707 |
| | | | | | | | |
| Consumer Discretionary — 0.3% | | | | | | | |
| China First Capital Group* | | | 12,000 | | | | 6,344 |
| Haier Electronics Group | | | 5,000 | | | | 14,522 |
| | | | | | | | 20,866 |
| Consumer Staples — 0.1% | | | | | | | |
| Sun Art Retail Group | | | 7,500 | | | | 7,309 |
| | | | | | | | |
| Energy — 0.2% | | | | | | | |
| Yanzhou Coal Mining, Cl H | | | 10,000 | | | | 9,822 |
| | | | | | | | |
| Financials — 4.3% | | | | | | | |
| China Cinda Asset Management, Cl H | | | 3,504 | | | | 973 |
| China Galaxy Securities, Cl H | | | 25,500 | | | | 16,762 |
| China Huarong Asset Management, Cl H | | | 41,000 | | | | 8,722 |
| China International Capital, Cl H | | | 4,400 | | | | 10,190 |
| China Merchants Bank, Cl H | | | 8,000 | | | | 38,879 |
| China Minsheng Banking, Cl H | | | 23,000 | | | | 16,701 |
| China Pacific Insurance Group, Cl H | | | 7,200 | | | | 28,250 |
| China Taiping Insurance Holdings | | | 4,200 | | | | 12,520 |
| CITIC Securities, Cl H | | | 5,000 | | | | 11,643 |
| Far East Horizon | | | 6,000 | | | | 6,359 |
| GF Securities, Cl H* | | | 10,000 | | | | 14,370 |
| Huatai Securities, Cl H | | | 6,000 | | | | 12,000 |
| Industrial & Commercial Bank of China, Cl H | | | 121,441 | | | | 88,954 |
| People’s Insurance Group of China, Cl H | | | 16,452 | | | | 7,042 |
| | | | | | | | 273,365 |
| Industrials — 0.2% | | | | | | | |
| Fullshare Holdings | | | 25,000 | | | | 3,344 |
| Shenzhen International Holdings | | | 5,500 | | | | 11,673 |
| | | | | | | | 15,017 |
| Information Technology — 0.5% | | | | | | | |
| Kingboard Holdings | | | 3,000 | | | | 10,643 |
| Meitu* | | | 12,500 | | | | 5,876 |
| Semiconductor Manufacturing International* | | | 12,500 | | | | 12,643 |
| | | | | | | | 29,162 |
| Materials — 0.3% | | | | | | | |
| China Resources Cement Holdings | | | 10,000 | | | | 10,319 |
| Nine Dragons Paper Holdings | | | 10,000 | | | | 9,529 |
| | | | | | | | 19,848 |
| Real Estate — 2.3% | | | | | | | |
| China Evergrande Group | | | 5,000 | | | | 16,624 |
| China Jinmao Holdings Group | | | 20,000 | | | | 13,045 |
| CIFI Holdings Group | | | 20,000 | | | | 15,159 |
| Country Garden Holdings | | | 21,000 | | | | 32,798 |
The accompanying notes are an integral part of the financial statements.
Schedule of InvestmentsMarch 31, 2019
KraneShares MSCI All China Index ETF(continued)
| | | Shares | | | Value | |
| COMMON STOCK (continued) | | | | | | | | |
| Real Estate (continued) | | | | | | | | |
| Guangzhou R&F Properties | | | 4,400 | | | $ | 9,517 | |
| KWG Group Holdings | | | 5,500 | | | | 6,635 | |
| Longfor Group Holdings | | | 5,000 | | | | 17,612 | |
| Shimao Property Holdings | | | 3,000 | | | | 9,382 | |
| Sunac China Holdings | | | 5,000 | | | | 24,905 | |
| | | | | | | | 145,677 | |
| | | | | | | | | |
| Utilities — 1.0% | | | | | | | | |
| China Gas Holdings | | | 4,200 | | | | 14,767 | |
| China Resources Gas Group | | | 8,000 | | | | 37,707 | |
| China Resources Power Holdings | | | 8,000 | | | | 12,026 | |
| | | | | | | | 64,500 | |
| TOTAL HONG KONG | | | | | | | 603,273 | |
TOTAL COMMON STOCK
(Cost $5,639,913) | | | | | | | 6,332,835 | |
| | | | | | | | | |
TOTAL INVESTMENTS — 99.4%
(Cost $5,639,913) | | | | | | | 6,332,835 | |
| OTHER ASSETS LESS LIABILITIES — 0.6% | | | | | | | 36,806 | |
| NET ASSETS — 100% | | | | | | $ | 6,369,641 | |
| ‡ | Industries are utilized for compliance purposes, whereas sectors are utilized for reporting. |
| * | Non-income producing security. |
| (A) | Security is fair valued using methods determined in good faith by the Fair Value Committee appointed by the Board of Trustees. The total value of such securities as of March 31, 2019 was $6 and represents 0.0% of Net Assets. |
| (B) | Level 3 security in accordance with fair value hierarchy. |
| (C) | Security considered illiquid. The total value of such securities as of March 31, 2019 was $6 and represents 0.0% of Net Assets (Unaudited). |
ADR — American Depositary Receipt
Cl — Class
The accompanying notes are an integral part of the financial statements.
Schedule of InvestmentsMarch 31, 2019
KraneShares MSCI All China Index ETF(concluded)
The following summarizes the market value of the Fund’s investments used as of March 31, 2019, based on the inputs used to value them:
| Investments in Securities | | Level 1 | | | Level 2 | | | Level 3^ | | | Total |
| Common Stock | | | | | | | | | | | | | | | |
| China | | | | | | | | | | | | | | | |
| Communication Services | | $ | 1,001,805 | | | $ | — | | | $ | — | | | $ | 1,001,805 |
| Consumer Discretionary | | | 1,160,193 | | | | — | | | | — | | | | 1,160,193 |
| Consumer Staples | | | 397,292 | | | | — | | | | — | | | | 397,292 |
| Energy | | | 204,701 | | | | — | | | | — | | | | 204,701 |
| Financials | | | 1,199,469 | | | | — | | | | — | | | | 1,199,469 |
| Health Care | | | 338,364 | | | | — | | | | — | | | | 338,364 |
| Industrials | | | 559,129 | | | | — | | | | — | | | | 559,129 |
| Information Technology | | | 263,419 | | | | — | | | | 6 | | | | 263,425 |
| Materials | | | 218,525 | | | | — | | | | — | | | | 218,525 |
| Real Estate | | | 248,518 | | | | — | | | | — | | | | 248,518 |
| Utilities | | | 138,141 | | | | — | | | | — | | | | 138,141 |
| Hong Kong | | | 603,273 | | | | — | | | | — | | | | 603,273 |
| Total Common Stock | | | 6,332,829 | | | | — | | | | 6 | | | | 6,332,835 |
| Total Investments in Securities | | $ | 6,332,829 | | | $ | — | | | $ | 6 | | | $ | 6,332,835 |
| ^ | A reconciliation of Level 3 investments, including certain disclosures related to significant inputs used in valuing Level 3 investments is only presented when the Fund has over 1% of Level 3 investments at the beginning and/or end of the period in relation to net assets. |
For the year ended March 31, 2019, there have been no transfers between Level 1 and Level 2 investments.
For the year ended March 31, 2019, there have been no transfers between Level 2 and Level 3 investments.
For the year ended March 31, 2019, the transfers in and out of Level 3 occurred due to a halt in trading of these securities. Transfers between levels are recognized at period end.
Amounts designated as “—” are $0 or have been rounded to $0.
The accompanying notes are an integral part of the financial statements.
Schedule of InvestmentsMarch 31, 2019
KraneShares MSCI One Belt One Road Index ETF
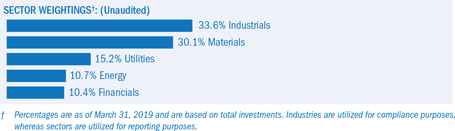
| | | Shares | | | Value |
| COMMON STOCK — 99.8%‡ | | | | | | | |
| CHINA — 40.8% | | | | | | | |
| Energy — 0.3% | | | | | | | |
| Guanghui Energy, Cl A | | | 109,300 | | | $ | 70,750 |
| | | | | | | | |
| Financials — 4.2% | | | | | | | |
| Bank of Guiyang, Cl A | | | 38,305 | | | | 74,385 |
| Bank of Hangzhou, Cl A | | | 86,300 | | | | 110,569 |
| Bank of Jiangsu, Cl A | | | 190,255 | | | | 201,857 |
| Bank of Nanjing, Cl A | | | 141,291 | | | | 166,306 |
| Bank of Ningbo, Cl A | | | 82,846 | | | | 261,845 |
| Chongqing Rural Commercial Bank, Cl H | | | 139,425 | | | | 80,458 |
| | | | | | | | 895,420 |
| Industrials — 20.1% | | | | | | | |
| Beijing New Building Materials, Cl A | | | 26,608 | | | | 79,782 |
| China Conch Venture Holdings | | | 90,000 | | | | 322,168 |
| China Gezhouba Group, Cl A | | | 76,350 | | | | 82,483 |
| China Railway Construction, Cl H | | | 110,500 | | | | 144,707 |
| China Railway Group, Cl H | | | 208,500 | | | | 190,174 |
| China Railway Hi-tech Industry, Cl A | | | 36,676 | | | | 65,709 |
| China Shipbuilding Industry, Cl A | | | 381,400 | | | | 331,445 |
| China State Construction Engineering, Cl A | | | 685,479 | | | | 624,257 |
| CRRC, Cl H | | | 231,850 | | | | 218,561 |
| Daqin Railway, Cl A | | | 243,932 | | | | 302,728 |
| Inner Mongolia First Machinery Group, Cl A | | | 28,200 | | | | 50,607 |
| Jiangsu Expressway, Cl H | | | 68,000 | | | | 96,154 |
| Jiangsu Zhongtian Technology, Cl A | | | 51,049 | | | | 75,584 |
| Metallurgical Corp of China, Cl A | | | 299,300 | | | | 156,771 |
| NARI Technology, Cl A | | | 75,500 | | | | 237,166 |
| Ningbo Zhoushan Port, Cl A | | | 101,001 | | | | 65,378 |
| Shanghai Construction Group, Cl A | | | 144,500 | | | | 80,419 |
| Shanghai Electric Group, Cl H | | | 150,000 | | | | 56,943 |
| Shanghai International Port Group, Cl A | | | 140,410 | | | | 151,897 |
| Shanghai Tunnel Engineering, Cl A | | | 51,900 | | | | 56,687 |
| Suzhou Gold Mantis Construction Decoration, Cl A | | | 41,619 | | | | 72,955 |
| TBEA, Cl A | | | 61,275 | | | | 75,497 |
| XCMG Construction Machinery, Cl A | | | 128,348 | | | | 84,035 |
| Xinjiang Goldwind Science & Technology, Cl A | | | 56,644 | | | | 122,642 |
| Yangzijiang Shipbuilding Holdings | | | 110,200 | | | | 122,038 |
| Zhejiang Expressway, Cl H | | | 78,000 | | | | 89,427 |
The accompanying notes are an integral part of the financial statements.
Schedule of InvestmentsMarch 31, 2019
KraneShares MSCI One Belt One Road Index ETF(continued)
| | | Shares | | | Value |
| COMMON STOCK (continued) | | | | | | | |
| Industrials (continued) | | | | | | | |
| Zhengzhou Yutong Bus, Cl A | | | 38,897 | | | $ | 77,733 |
| Zhuzhou CRRC Times Electric, Cl H | | | 30,200 | | | | 178,508 |
| Zoomlion Heavy Industry Science and Technology, Cl A | | | 105,657 | | | | 70,436 |
| | | | | | | | 4,282,891 |
| Materials — 4.7% | | | | | | | |
| Anhui Conch Cement, Cl H | | | 68,500 | | | | 418,420 |
| BBMG, Cl A | | | 134,400 | | | | 88,797 |
| Beijing Oriental Yuhong Waterproof Technology, Cl A | | | 24,124 | | | | 75,637 |
| China National Building Material, Cl H | | | 215,000 | | | | 169,536 |
| China Northern Rare Earth Group High-Tech, Cl A | | | 61,424 | | | | 101,913 |
| Jiangxi Ganfeng Lithium, Cl A | | | 18,400 | | | | 75,542 |
| Yunnan Chihong Zinc & Germanium, Cl A | | | 86,059 | | | | 65,695 |
| | | | | | | | 995,540 |
| Utilities — 11.5% | | | | | | | |
| Beijing Enterprises Holdings | | | 28,500 | | | | 161,562 |
| CGN Power, Cl H | | | 582,875 | | | | 162,612 |
| China Longyuan Power Group, Cl H | | | 176,000 | | | | 122,416 |
| China National Nuclear Power, Cl A | | | 172,642 | | | | 155,424 |
| China Yangtze Power, Cl A | | | 241,143 | | | | 605,352 |
| ENN Energy Holdings | | | 42,600 | | | | 411,893 |
| GD Power Development, Cl A | | | 327,500 | | | | 130,606 |
| Huadian Power International, Cl A | | | 116,142 | | | | 75,352 |
| Huaneng Power International, Cl H | | | 233,000 | | | | 135,349 |
| Huaneng Renewables, Cl H | | | 264,860 | | | | 73,554 |
| SDIC Power Holdings, Cl A | | | 114,206 | | | | 141,053 |
| Shenergy, Cl A | | | 74,819 | | | | 62,570 |
| Sichuan Chuantou Energy, Cl A | | | 73,384 | | | | 101,883 |
| Zhejiang Zheneng Electric Power, Cl A | | | 150,141 | | | | 108,804 |
| | | | | | | | 2,448,430 |
| TOTAL CHINA | | | | | | | 8,693,031 |
| | | | | | | | |
| HONG KONG — 5.2% | | | | | | | |
| Industrials — 0.9% | | | | | | | |
| Shenzhen International Holdings | | | 52,163 | | | | 110,706 |
| Sinotruk Hong Kong | | | 39,000 | | | | 82,969 |
| | | | | | | | 193,675 |
| Materials — 0.6% | | | | | | | |
| China Resources Cement Holdings | | | 134,000 | | | | 138,268 |
| | | | | | | | |
| Utilities — 3.7% | | | | | | | |
| China Gas Holdings | | | 96,400 | | | | 338,937 |
| China Power International Development | | | 241,000 | | | | 61,709 |
| China Resources Gas Group | | | 47,500 | | | | 223,887 |
| China Resources Power Holdings | | | 106,635 | | | | 160,293 |
| | | | | | | | 784,826 |
| TOTAL HONG KONG | | | | | | | 1,116,769 |
| | | | | | | | |
| INDIA — 3.8% | | | | | | | |
| Industrials — 0.7% | | | | | | | |
| AIA Engineering | | | 5,842 | | | | 151,466 |
The accompanying notes are an integral part of the financial statements.
Schedule of InvestmentsMarch 31, 2019
KraneShares MSCI One Belt One Road Index ETF(continued)
| | | Shares | | | Value |
| COMMON STOCK (continued) | | | | | | | |
| Materials — 3.1% | | | | | | | |
| Hindalco Industries | | | 180,153 | | | $ | 534,412 |
| PI Industries | | | 8,528 | | | | 127,037 |
| | | | | | | | 661,449 |
| TOTAL INDIA | | | | | | | 812,915 |
| | | | | | | | |
| INDONESIA — 3.7% | | | | | | | |
| Energy — 1.7% | | | | | | | |
| Adaro Energy | | | 2,312,900 | | | | 218,458 |
| Bukit Asam | | | 457,700 | | | | 134,996 |
| | | | | | | | 353,454 |
| Materials — 2.0% | | | | | | | |
| Indah Kiat Pulp & Paper | | | 416,200 | | | | 251,357 |
| Pabrik Kertas Tjiwi Kimia | | | 224,200 | | | | 173,582 |
| | | | | | | | 424,939 |
| TOTAL INDONESIA | | | | | | | 778,393 |
| | | | | | | | |
| ISRAEL — 2.7% | | | | | | | |
| Materials — 2.7% | | | | | | | |
| Israel Chemicals | | | 108,881 | | | | 566,403 |
| TOTAL ISRAEL | | | | | | | 566,403 |
| | | | | | | | |
| JORDAN — 0.6% | | | | | | | |
| Financials — 0.6% | | | | | | | |
| Arab Bank | | | 13,176 | | | | 120,795 |
| TOTAL JORDAN | | | | | | | 120,795 |
| | | | | | | | |
| KAZAKHSTAN — 1.4% | | | | | | | |
| Energy — 1.4% | | | | | | | |
| KazMunaiGas Exploration Production GDR*(A)(B)(C) | | | 27,720 | | | | 293,832 |
| TOTAL KAZAKHSTAN | | | | | | | 293,832 |
| | | | | | | | |
| KUWAIT — 1.7% | | | | | | | |
| Industrials — 1.7% | | | | | | | |
| Agility Public Warehousing KSC | | | 131,074 | | | | 370,248 |
| TOTAL KUWAIT | | | | | | | 370,248 |
| | | | | | | | |
| MALAYSIA — 6.0% | | | | | | | |
| Industrials — 1.0% | | | | | | | |
| Sime Darby | | | 372,400 | | | | 203,417 |
| Materials — 5.0% | | | | | | | |
| Petronas Chemicals Group | | | 374,100 | | | | 839,377 |
| Press Metal Aluminium Holdings | | | 213,100 | | | | 235,415 |
| | | | | | | | 1,074,792 |
| TOTAL MALAYSIA | | | | | | | 1,278,209 |
| | | | | | | | |
| PHILIPPINES — 4.9% | | | | | | | |
| Industrials — 4.9% | | | | | | | |
| DMCI Holdings | | | 626,500 | | | | 143,173 |
| International Container Terminal Services | | | 146,120 | | | | 363,700 |
| JG Summit Holdings | | | 438,150 | | | | 529,852 |
| TOTAL PHILIPPINES | | | | | | | 1,036,725 |
The accompanying notes are an integral part of the financial statements.
Schedule of InvestmentsMarch 31, 2019
KraneShares MSCI One Belt One Road Index ETF(continued)
| | | Shares | | | Value |
| COMMON STOCK (continued) | | | | | | | |
| POLAND — 2.8% | | | | | | | |
| Materials — 2.8% | | | | | | | |
| KGHM Polska Miedz* | | | 21,698 | | | $ | 605,576 |
| TOTAL POLAND | | | | | | | 605,576 |
| | | | | | | | |
| RUSSIA — 5.9% | | | | | | | |
| Energy — 5.9% | | | | | | | |
| Rosneft | | | 172,300 | | | | 1,080,522 |
| Transneft | | | 69 | | | | 185,372 |
| TOTAL RUSSIA | | | | | | | 1,265,894 |
| | | | | | | | |
| SINGAPORE — 9.1% | | | | | | | |
| Financials — 5.7% | | | | | | | |
| Oversea-Chinese Banking | | | 147,900 | | | | 1,206,567 |
| Industrials — 3.4% | | | | | | | |
| Hutchison Port Holdings Trust, Cl U | | | 242,000 | | | | 56,870 |
| Keppel | | | 66,000 | | | | 303,079 |
| Singapore Airlines | | | 24,500 | | | | 174,729 |
| Singapore Technologies Engineering | | | 70,700 | | | | 195,214 |
| | | | | | | | 729,892 |
| TOTAL SINGAPORE | | | | | | | 1,936,459 |
| | | | | | | | |
| SOUTH AFRICA — 5.5% | | | | | | | |
| Materials — 5.5% | | | | | | | |
| Anglo American Platinum | | | 8,354 | | | | 426,440 |
| Impala Platinum Holdings* | | | 108,105 | | | | 457,270 |
| Kumba Iron Ore | | | 9,977 | | | | 297,693 |
| TOTAL SOUTH AFRICA | | | | | | | 1,181,403 |
| | | | | | | | |
| THAILAND — 4.8% | | | | | | | |
| Energy — 1.3% | | | | | | | |
| IRPC | | | 1,584,000 | | | | 287,002 |
| Materials — 3.5% | | | | | | | |
| PTT Global Chemical | | | 353,300 | | | | 748,682 |
| TOTAL THAILAND | | | | | | | 1,035,684 |
| | | | | | | | |
| TURKEY — 0.9% | | | | | | | |
| Industrials — 0.9% | | | | | | | |
| Turk Hava Yollari AO* | | | 85,591 | | | | 195,888 |
| TOTAL TURKEY | | | | | | | 195,888 |
TOTAL COMMON STOCK
(Cost $22,307,475) | | | | | | | 21,288,224 |
| | | | | | | | |
TOTAL INVESTMENTS — 99.8%
(Cost $22,307,475) | | | | | | | 21,288,224 |
| OTHER ASSETS LESS LIABILITIES — 0.2% | | | | | | | 33,575 |
| NET ASSETS — 100% | | | | | | $ | 21,321,799 |
| * | Non-income producing security. |
| ‡ | Industries are utilized for compliance purposes, whereas sectors are utilized for reporting. |
| (A) | Security is fair valued using methods determined in good faith by the Fair Value Committee appointed by the Board of Trustees. The total value of such securities as of March 31, 2019 was $293,832 and represents 1.4% of Net Assets. |
| (B) | Level 3 security in accordance with fair value hierarchy. |
The accompanying notes are an integral part of the financial statements.
Schedule of InvestmentsMarch 31, 2019
KraneShares MSCI One Belt One Road Index ETF(concluded)
| (C) | Security considered illiquid. The total value of such securities as of March 31, 2019 was $293,832 and represents 1.4% of Net Assets (Unaudited). |
Cl — Class
GDR — Global Depositary Receipt
The following summarizes the market value of the Fund’s investments used as of March 31, 2019, based on the inputs used to value them:
| Investments in Securities | | Level 1 | | | Level 2 | | | Level 3 | | | Total |
| Common Stock | | | | | | | | | | | | | | | |
| China | | $ | 8,693,031 | | | $ | — | | | $ | — | | | $ | 8,693,031 |
| Hong Kong | | | 1,116,769 | | | | — | | | | — | | | | 1,116,769 |
| India | | | 812,915 | | | | — | | | | — | | | | 812,915 |
| Indonesia | | | 778,393 | | | | — | | | | — | | | | 778,393 |
| Israel | | | 566,403 | | | | — | | | | — | | | | 566,403 |
| Jordan | | | 120,795 | | | | — | | | | — | | | | 120,795 |
| Kazakhstan | | | | | | | | | | | | | | | |
| Energy | | | — | | | | — | | | | 293,832 | | | | 293,832 |
| Kuwait | | | 370,248 | | | | — | | | | — | | | | 370,248 |
| Malaysia | | | 1,278,209 | | | | — | | | | — | | | | 1,278,209 |
| Philippines | | | 1,036,725 | | | | — | | | | — | | | | 1,036,725 |
| Poland | | | 605,576 | | | | — | | | | — | | | | 605,576 |
| Russia | | | 1,265,894 | | | | — | | | | — | | | | 1,265,894 |
| Singapore | | | 1,936,459 | | | | — | | | | — | | | | 1,936,459 |
| South Africa | | | 1,181,403 | | | | — | | | | — | | | | 1,181,403 |
| Thailand | | | 1,035,684 | | | | — | | | | — | | | | 1,035,684 |
| Turkey | | | 195,888 | | | | — | | | | — | | | | 195,888 |
| Total Common Stock | | | 20,994,392 | | | | — | | | | 293,832 | | | | 21,288,224 |
| Total Investments in Securities | | $ | 20,994,392 | | | $ | — | | | $ | 293,832 | | | $ | 21,288,224 |
The following is a reconciliation of the beginning and ending balances, of the year ended March 31, 2019, of investments in which significant unobservable inputs (Level 3) were used in determining value:
| | | Common Stock |
| Beginning balance as of March 29, 2018 | | $ | — |
| Accrued discounts/premiums | | | — |
| Realized gain/(loss)(1) | | | — |
| Change in unrealized appreciation/(depreciation)(2) | | | — |
| Purchases | | | — |
| Sales | | | — |
| Transfer into Level 3 | | | 293,832 |
| Transfer out of Level 3 | | | — |
| Ending balance as of March 31, 2019 | | $ | 293,832 |
| (1) | Realized gain/(loss) from the sale of Level 3 securities is included on the Statement of Operations in Net Realized Gain (Loss) on Investments |
| (2) | Change in unrealized appreciation/(depreciation) is included on the Statement of Operations in Net Change in Unrealized Appreciation (Depreciation) on Investments |
For the year ended March 31, 2019, there have been no transfers between Level 1 and Level 2 investments.
For the year ended March 31, 2019, there have been no transfers between Level 2 and Level 3 investments.
For the year ended March 31, 2019, the transfers in and out of Level 3 occurred due to a halt in trading of these securities. Transfers between levels are recognized at period end.
Amounts designated as “—” are $0 or have been rounded to $0.
The accompanying notes are an integral part of the financial statements.
Schedule of InvestmentsMarch 31, 2019
KraneShares Emerging Markets Consumer Technology Index ETF
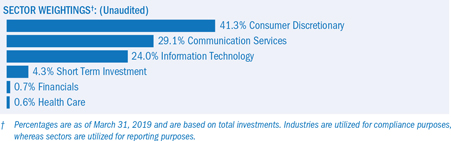
| | | Shares | | | Value |
| COMMON STOCK — 99.8%‡ | | | | | | | |
| ARGENTINA — 3.5% | | | | | | | |
| Consumer Discretionary — 3.5% | | | | | | | |
| MercadoLibre* | | | 1,969 | | | $ | 999,720 |
| TOTAL ARGENTINA | | | | | | | 999,720 |
| | | | | | | | |
| BRAZIL — 5.1% | | | | | | | |
| Consumer Discretionary — 2.9% | | | | | | | |
| B2W Cia Digital* | | | 58,970 | | | | 635,961 |
| CVC Brasil Operadora e Agencia de Viagens | | | 14,126 | | | | 198,694 |
| | | | | | | | 834,655 |
| Information Technology — 2.2% | | | | | | | |
| Cielo | | | 253,380 | | | | 616,571 |
| TOTAL BRAZIL | | | | | | | 1,451,226 |
| | | | | | | | |
| CHINA — 40.7% | | | | | | | |
| Communication Services — 20.6% | | | | | | | |
| 58.com ADR* | | | 11,672 | | | | 766,617 |
| Autohome ADR* | | | 7,738 | | | | 813,419 |
| Baidu ADR* | | | 5,946 | | | | 980,198 |
| iQIYI ADR* | | | 26,888 | | | | 643,161 |
| NetEase ADR | | | 4,132 | | | | 997,671 |
| Tencent Holdings | | | 21,675 | | | | 996,780 |
| Tencent Music Entertainment Group ADR* | | | 5 | | | | 91 |
| Weibo ADR* | | | 11,486 | | | | 712,017 |
| | | | | | | | 5,909,954 |
| Consumer Discretionary — 20.1% | | | | | | | |
| Alibaba Group Holding ADR* | | | 5,498 | | | | 1,003,110 |
| Ctrip.com International ADR* | | | 23,997 | | | | 1,048,429 |
| JD.com ADR* | | | 35,326 | | | | 1,065,079 |
| New Oriental Education & Technology Group ADR* | | | 13,031 | | | | 1,173,963 |
| TAL Education Group ADR* | | | 21,060 | | | | 759,845 |
| Vipshop Holdings ADR* | | | 89,443 | | | | 718,227 |
| | | | | | | | 5,768,653 |
| TOTAL CHINA | | | | | | | 11,678,607 |
| | | | | | | | |
| EGYPT — 0.7% | | | | | | | |
| Communication Services — 0.7% | | | | | | | |
| Telecom Egypt | | | 251,444 | | | | 210,963 |
| TOTAL EGYPT | | | | | | | 210,963 |
The accompanying notes are an integral part of the financial statements.
Schedule of InvestmentsMarch 31, 2019
KraneShares Emerging Markets Consumer Technology Index ETF(continued)
| | | Shares | | | Value |
| COMMON STOCK (continued) | | | | | | | |
| GREECE — 5.4% | | | | | | | |
| Communication Services — 2.8% | | | | | | | |
| Hellenic Telecommunications Organization | | | 58,731 | | | $ | 787,398 |
| Consumer Discretionary — 2.6% | | | | | | | |
| OPAP | | | 71,902 | | | | 742,764 |
| TOTAL GREECE | | | | | | | 1,530,162 |
| | | | | | | | |
| INDIA — 1.4% | | | | | | | |
| Consumer Discretionary — 1.4% | | | | | | | |
| Infibeam Avenues | | | 334,544 | | | | 207,415 |
| MakeMyTrip* | | | 7,051 | | | | 194,607 |
| TOTAL INDIA | | | | | | | 402,022 |
| | | | | | | | |
| MALAYSIA — 0.7% | | | | | | | |
| Communication Services — 0.7% | | | | | | | |
| Telekom Malaysia | | | 267,400 | | | | 209,597 |
| TOTAL MALAYSIA | | | | | | | 209,597 |
| | | | | | | | |
| MEXICO — 2.5% | | | | | | | |
| Consumer Discretionary — 2.5% | | | | | | | |
| Grupo Televisa | | | 325,500 | | | | 719,884 |
| TOTAL MEXICO | | | | | | | 719,884 |
| | | | | | | | |
| POLAND — 3.2% | | | | | | | |
| Communication Services — 0.7% | | | | | | | |
| Orange Polska* | | | 150,601 | | | | 201,516 |
| Consumer Discretionary — 2.5% | | | | | | | |
| Cyfrowy Polsat* | | | 108,902 | | | | 729,451 |
| TOTAL POLAND | | | | | | | 930,967 |
| | | | | | | | |
| PUERTO RICO — 0.7% | | | | | | | |
| Information Technology — 0.7% | | | | | | | |
| EVERTEC | | | 7,587 | | | | 210,994 |
| TOTAL PUERTO RICO | | | | | | | 210,994 |
| | | | | | | | |
| RUSSIA — 2.5% | | | | | | | |
| Information Technology — 2.5% | | | | | | | |
| Mail.Ru Group GDR* | | | 28,692 | | | | 710,414 |
| TOTAL RUSSIA | | | | | | | 710,414 |
| | | | | | | | |
| SOUTH AFRICA — 3.7% | | | | | | | |
| Consumer Discretionary — 3.7% | | | | | | | |
| Naspers, Cl N | | | 4,558 | | | | 1,053,161 |
| TOTAL SOUTH AFRICA | | | | | | | 1,053,161 |
| | | | | | | | |
| SOUTH KOREA — 21.6% | | | | | | | |
| Communication Services — 2.4% | | | | | | | |
| KT ADR* | | | 54,060 | | | | 672,507 |
The accompanying notes are an integral part of the financial statements.
Schedule of InvestmentsMarch 31, 2019
KraneShares Emerging Markets Consumer Technology Index ETF(continued)
| | | Shares | | | Value | |
| COMMON STOCK (continued) | | | | | | | | |
| Consumer Discretionary — 3.2% | | | | | | | | |
| CJ ENM | | | 3,411 | | | $ | 700,170 | |
| DoubleUGames | | | 3,872 | | | | 209,445 | |
| | | | | | | | 909,615 | |
| Financials — 0.7% | | | | | | | | |
| Daou Technology | | | 11,065 | | | | 206,171 | |
| | | | | | | | | |
| Health Care — 0.6% | | | | | | | | |
| Celltrion Pharm* | | | 3,768 | | | | 183,902 | |
| | | | | | | | | |
| Information Technology — 14.7% | | | | | | | | |
| Com2uSCorp | | | 2,169 | | | | 199,492 | |
| Douzone Bizon | | | 5,235 | | | | 214,916 | |
| Kakao | | | 7,731 | | | | 704,923 | |
| NAVER | | | 8,584 | | | | 937,729 | |
| NCSoft | | | 1,814 | | | | 792,656 | |
| Netmarble(A) | | | 7,020 | | | | 773,060 | |
| NHN Entertainment* | | | 2,814 | | | | 219,398 | |
| Pearl Abyss*(A) | | | 1,303 | | | | 192,850 | |
| Webzen* | | | 11,167 | | | | 191,839 | |
| | | | | | | | 4,226,863 | |
| TOTAL SOUTH KOREA | | | | | | | 6,199,058 | |
| | | | | | | | | |
| TAIWAN — 2.3% | | | | | | | | |
| Information Technology — 2.3% | | | | | | | | |
| Accton Technology | | | 61,000 | | | | 246,411 | |
| Holy Stone Enterprise | | | 55,000 | | | | 207,005 | |
| WPG Holdings | | | 167,880 | | | | 218,970 | |
| TOTAL TAIWAN | | | | | | | 672,386 | |
| | | | | | | | | |
| THAILAND — 2.5% | | | | | | | | |
| Communication Services — 2.5% | | | | | | | | |
| Intouch Holdings | | | 392,037 | | | | 710,324 | |
| TOTAL THAILAND | | | | | | | 710,324 | |
| | | | | | | | | |
| UNITED STATES — 3.3% | | | | | | | | |
| Consumer Discretionary — 0.7% | | | | | | | | |
| Despegar.com* | | | 12,473 | | | | 185,848 | |
| Information Technology — 2.6% | | | | | | | | |
| Pagseguro Digital, Cl A* | | | 25,028 | | | | 747,086 | |
| TOTAL UNITED STATES | | | | | | | 932,934 | |
TOTAL COMMON STOCK
(Cost $30,334,842) | | | | | | | 28,622,419 | |
| | | | | | | | | |
| SHORT-TERM INVESTMENT(B)(C) — 4.6% | | | | | | | | |
| Invesco Government & Agency Portfolio, Cl Institutional, 2.340% | | | 1,323,063 | | | | 1,323,063 | |
TOTAL SHORT-TERM INVESTMENT
(Cost $1,323,063) | | | | | | | 1,323,063 | |
| | | | | | | | | |
TOTAL INVESTMENTS — 104.4%
(Cost $31,657,905) | | | | | | | 29,945,482 | |
| OTHER ASSETS LESS LIABILITIES — (4.4)% | | | | | | | (1,265,251 | ) |
| NET ASSETS — 100% | | | | | | $ | 28,680,231 | |
| * | Non-income producing security. |
The accompanying notes are an integral part of the financial statements.
Schedule of InvestmentsMarch 31, 2019
KraneShares Emerging Markets Consumer Technology Index ETF(concluded)
| ‡ | Industries are utilized for compliance purposes, whereas sectors are utilized for reporting. |
| (A) | This security or a partial position of this security is on loan at March 31, 2019. The total market value of securities on loan at March 31, 2019 was $1,277,165. |
| (B) | The rate shown is the 7-day effective yield as of March 31, 2019. |
| (C) | This security was purchased with cash collateral held from securities on loan. The total value of such security as of March 31, 2019 was $1,323,063. |
ADR — American Depositary Receipt
Cl — Class
GDR — Global Depositary Receipt
As of March 31, 2019, all of the Fund’s investments were considered Level 1 of the fair value hierarchy, in accordance with the authoritative guidance under U.S. GAAP.
For the year ended March 31, 2019, there have been no transfers between Level 1, Level 2 or Level 3 investments. Transfers between levels are recognized at period end.
The accompanying notes are an integral part of the financial statements.
Schedule of InvestmentsMarch 31, 2019
KraneShares MSCI China Environment Index ETF
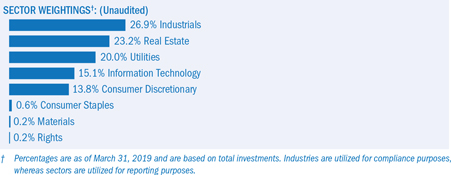
| | | Shares | | | Value |
| COMMON STOCK — 99.7%‡ | | | | | | | |
| CHINA — 70.3% | | | | | | | |
| Consumer Discretionary — 13.7% | | | | | | | |
| BYD, Cl A | | | 2,100 | | | $ | 16,715 |
| BYD, Cl H | | | 51,500 | | | | 310,314 |
| Chaowei Power Holdings | | | 91,000 | | | | 34,430 |
| TCL Electronics Holdings | | | 103,000 | | | | 56,290 |
| Tianneng Power International | | | 93,885 | | | | 84,437 |
| Yadea Group Holdings | | | 156,694 | | | | 55,492 |
| | | | | | | | 557,678 |
| Consumer Staples — 0.6% | | | | | | | |
| NVC Lighting Holding | | | 285,000 | | | | 22,510 |
| | | | | | | | |
| Industrials — 23.5% | | | | | | | |
Beijing Urban Construction Design &
Development Group, Cl H | | | 45,000 | | | | 18,516 |
| Capital Environment Holdings * | | | 750,000 | | | | 18,631 |
| China Conch Venture Holdings | | | 117,000 | | | | 418,818 |
| China Everbright International | | | 296,216 | | | | 301,123 |
| CT Environmental Group | | | 329,000 | | | | 14,250 |
| Dynagreen Environmental Protection Group, Cl H* | | | 55,000 | | | | 25,854 |
| Tus-Sound Environmental Resources, Cl A | | | 3,200 | | | | 7,376 |
| Xinjiang Goldwind Science & Technology, Cl A | | | 7,735 | | | | 16,747 |
| Xinjiang Goldwind Science & Technology, Cl H | | | 91,600 | | | | 131,858 |
| | | | | | | | 953,173 |
| Information Technology — 7.3% | | | | | | | |
| JinkoSolar Holding ADR* | | | 4,303 | | | | 77,454 |
| LONGi Green Energy Technology, Cl A | | | 6,100 | | | | 23,691 |
| Sanan Optoelectronics, Cl A | | | 9,000 | | | | 19,647 |
| Xinyi Solar Holdings | | | 368,000 | | | | 177,204 |
| | | | | | | | 297,996 |
| Real Estate — 10.0% | | | | | | | |
| China Vanke, Cl A | | | 10,300 | | | | 47,084 |
| China Vanke, Cl H | | | 85,200 | | | | 358,168 |
| | | | | | | | 405,252 |
| Utilities — 15.2% | | | | | | | |
| Beijing Enterprises Water Group | | | 306,500 | | | | 189,367 |
| China Datang Renewable Power, Cl H | | | 351,000 | | | | 41,584 |
The accompanying notes are an integral part of the financial statements.
Schedule of InvestmentsMarch 31, 2019
KraneShares MSCI China Environment Index ETF(continued)
| | | Shares | | | Value |
| COMMON STOCK (continued) | | | | | | | |
| Utilities (continued) | | | | | | | |
| China Everbright Water | | | 72,027 | | | $ | 18,612 |
| China Longyuan Power Group, Cl H | | | 248,800 | | | | 173,052 |
| China Power Clean Energy Development | | | 62,000 | | | | 40,754 |
| Huaneng Renewables, Cl H | | | 558,000 | | | | 154,961 |
| | | | | | | | 618,330 |
| TOTAL CHINA | | | | | | | 2,854,939 |
| | | | | | | | |
| HONG KONG — 29.4% | | | | | | | |
| Industrials — 3.4% | | | | | | | |
| China High Speed Transmission Equipment Group | | | 49,000 | | | | 42,446 |
| Fullshare Holdings* | | | 702,500 | | | | 93,966 |
| | | | | | | | 136,412 |
| Information Technology — 7.8% | | | | | | | |
| China Railway Signal & Communication, Cl H | | | 218,000 | | | | 172,457 |
| GCL-Poly Energy Holdings* | | | 1,474,000 | | | | 103,274 |
| Wasion Holdings | | | 75,000 | | | | 39,268 |
| | | | | | | | 314,999 |
| Materials — 0.3% | | | | | | | |
| Chiho Environmental Group* | | | 58,000 | | | | 10,196 |
| | | | | | | | |
| Real Estate — 13.2% | | | | | | | |
| China Merchants Land* | | | 176,000 | | | | 29,371 |
| Shimao Property Holdings | | | 69,500 | | | | 217,355 |
| SOHO China* | | | 313,000 | | | | 131,580 |
| Yuexiu Real Estate Investment Trust † | | | 222,000 | | | | 157,805 |
| | | | | | | | 536,111 |
| Utilities — 4.7% | | | | | | | |
| Canvest Environmental Protection Group | | | 111,000 | | | | 55,571 |
| China Everbright Greentech | | | 42,000 | | | | 33,333 |
| Concord New Energy Group | | | 840,000 | | | | 44,408 |
| GCL New Energy Holdings* | | | 768,000 | | | | 33,264 |
| Panda Green Energy Group* | | | 562,000 | | | | 26,131 |
| | | | | | | | 192,707 |
| TOTAL HONG KONG | | | | | | | 1,190,425 |
TOTAL COMMON STOCK
(Cost $3,769,455) | | | | | | | 4,045,364 |
| | | | | | | | |
| RIGHTS — 0.2% | | | | | | | |
Xinjiang Goldwind Science & Technology, Expires 04/26/2019*
(Cost $–) | | | 17,404 | | | | 6,851 |
| | | | | | | | |
TOTAL INVESTMENTS — 99.9%
(Cost $3,769,455) | | | | | | | 4,052,215 |
| OTHER ASSETS LESS LIABILITIES — 0.1% | | | | | | | 4,220 |
| NET ASSETS — 100% | | | | | | $ | 4,056,435 |
| ‡ | Narrow industries are utilized for compliance purposes, whereas broad sectors are utilized for reporting. |
| * | Non-income producing security. |
| † | Real Estate Investment Trust |
The accompanying notes are an integral part of the financial statements.
Schedule of InvestmentsMarch 31, 2019
KraneShares MSCI China Environment Index ETF(concluded)
ADR — American Depositary Receipt
Cl — Class
Amounts designated as “—” are $0 or have been rounded to $0.
As of March 31, 2019, all of the Fund’s investments were considered Level 1 of the fair value hierarchy, in accordance with the authoritative guidance under U.S. GAAP.
For the year ended March 31, 2019, there have been no transfers between Level 1, Level 2 or Level 3 investments. Transfers between levels are recognized at period end.
The accompanying notes are an integral part of the financial statements.
Schedule of InvestmentsMarch 31, 2019
KraneShares Electric Vehicles and Future Mobility Index ETF

| | | Shares | | | Value |
| COMMON STOCK — 96.8%‡ | | | | | | | |
| AUSTRIA — 1.0% | | | | | | | |
| Information Technology — 1.0% | | | | | | | |
| ams * | | | 12,083 | | | $ | 325,886 |
| TOTAL AUSTRIA | | | | | | | 325,886 |
| | | | | | | | |
| CANADA — 1.6% | | | | | | | |
| Materials — 1.6% | | | | | | | |
| First Quantum Minerals | | | 47,186 | | | | 535,101 |
| TOTAL CANADA | | | | | | | 535,101 |
| | | | | | | | |
| CHILE — 3.2% | | | | | | | |
| Materials — 3.2% | | | | | | | |
| Antofagasta | | | 55,421 | | | | 697,610 |
| Sociedad Quimica y Minera de Chile ADR (A) | | | 9,129 | | | | 350,919 |
| TOTAL CHILE | | | | | | | 1,048,529 |
| | | | | | | | |
| CHINA — 23.3% | | | | | | | |
| Communication Services — 3.5% | | | | | | | |
| Baidu ADR * | | | 7,046 | | | | 1,161,533 |
| | | | | | | | |
| Consumer Discretionary — 12.1% | | | | | | | |
| Aerospace Hi-Tech Holdings Grp, Cl A * | | | 153,700 | | | | 342,841 |
| BYD, Cl H (A) | | | 80,500 | | | | 485,054 |
| Changzhou Xingyu Automotive Lighting Systems, Cl A | | | 40,836 | | | | 365,204 |
| China Shipbuilding Industry Group Power, Cl A | | | 143,346 | | | | 563,982 |
| Great Wall Motor, Cl H (A) | | | 491,500 | | | | 368,784 |
| Guangdong Dongfang Precision Science & Technology, Cl A | | | 522,400 | | | | 320,271 |
| Haima Automobile Group, Cl A * | | | 808,900 | | | | 316,569 |
| Huizhou Desay Sv Automotive, Cl A | | | 80,100 | | | | 344,348 |
| Kuang-Chi Technologies, Cl A | | | 191,282 | | | | 329,325 |
| Ningbo Joyson Electronic, Cl A | | | 56 | | | | 222 |
| NIO ADR * (A) | | | 111,582 | | | | 569,069 |
| | | | | | | | 4,005,669 |
| Industrials — 4.9% | | | | | | | |
| Camel Group, Cl A | | | 159,600 | | | | 320,853 |
| Guoxuan High-Tech, Cl A | | | 125,289 | | | | 327,942 |
| Jiangxi Special Electric Motor, Cl A | | | 378,906 | | | | 342,245 |
| Shaanxi J&R Optimum Energy, Cl A * | | | 1,057,000 | | | | 303,564 |
| Zhejiang Narada Power Source, Cl A | | | 146,100 | | | | 333,716 |
| | | | | | | | 1,628,320 |
The accompanying notes are an integral part of the financial statements.
Schedule of InvestmentsMarch 31, 2019
KraneShares Electric Vehicles and Future Mobility Index ETF(continued)
| | | Shares | | | Value |
| COMMON STOCK (continued) | | | | | | | |
| Information Technology — 2.8% | | | | | | | |
| GoerTek, Cl A | | | 347,928 | | | $ | 543,621 |
| Shanghai Belling, Cl A | | | 171,200 | | | | 388,500 |
| | | | | | | | 932,121 |
| TOTAL CHINA | | | | | | | 7,727,643 |
| | | | | | | | |
| FRANCE — 2.1% | | | | | | | |
| Consumer Discretionary — 1.5% | | | | | | | |
| Valeo | | | 16,810 | | | | 487,922 |
| Information Technology — 0.6% | | | | | | | |
| STMicroelectronics | | | 14,538 | | | | 214,906 |
| TOTAL FRANCE | | | | | | | 702,828 |
| | | | | | | | |
| GERMANY — 10.5% | | | | | | | |
| Consumer Discretionary — 8.6% | | | | | | | |
| Bayerische Motoren Werke | | | 14,374 | | | | 1,109,616 |
| Daimler | | | 20,863 | | | | 1,224,010 |
| Hella GmbH & KGaA | | | 11,183 | | | | 492,228 |
| | | | | | | | 2,825,854 |
| Information Technology — 1.9% | | | | | | | |
| Infineon Technologies | | | 31,590 | | | | 627,302 |
| TOTAL GERMANY | | | | | | | 3,453,156 |
| | | | | | | | |
| JAPAN — 2.2% | | | | | | | |
| Industrials — 1.1% | | | | | | | |
| GS Yuasa | | | 17,800 | | | | 349,134 |
| Materials — 1.1% | | | | | | | |
| Hitachi Chemical | | | 15,700 | | | | 347,801 |
| TOTAL JAPAN | | | | | | | 696,935 |
| | | | | | | | |
| NETHERLANDS — 2.0% | | | | | | | |
| Information Technology — 2.0% | | | | | | | |
| NXP Semiconductors | | | 7,487 | | | | 661,776 |
| TOTAL NETHERLANDS | | | | | | | 661,776 |
| | | | | | | | |
| PERU — 2.2% | | | | | | | |
| Materials — 2.2% | | | | | | | |
| Southern Copper | | | 18,145 | | | | 719,994 |
| TOTAL PERU | | | | | | | 719,994 |
| | | | | | | | |
| SOUTH KOREA — 2.1% | | | | | | | |
| Information Technology — 2.1% | | | | | | | |
| Samsung SDI | | | 3,730 | | | | 704,859 |
| TOTAL SOUTH KOREA | | | | | | | 704,859 |
| | | | | | | | |
| SWITZERLAND — 1.3% | | | | | | | |
| Information Technology — 1.3% | | | | | | | |
| STMicroelectronics | | | 28,215 | | | | 417,559 |
| TOTAL SWITZERLAND | | | | | | | 417,559 |
| | | | | | | | |
| TAIWAN — 1.1% | | | | | | | |
| Information Technology — 1.1% | | | | | | | |
| Parade Technologies | | | 21,000 | | | | 352,266 |
| TOTAL TAIWAN | | | | | | | 352,266 |
The accompanying notes are an integral part of the financial statements.
Schedule of InvestmentsMarch 31, 2019
KraneShares Electric Vehicles and Future Mobility Index ETF(continued)
| | | Shares | | | Value |
| COMMON STOCK (continued) | | | | | | | |
| UNITED KINGDOM — 1.0% | | | | | | | |
| Information Technology — 1.0% | | | | | | | |
| Dialog Semiconductor * | | | 11,232 | | | $ | 342,286 |
| TOTAL UNITED KINGDOM | | | | | | | 342,286 |
| | | | | | | | |
| UNITED STATES — 43.2% | | | | | | | |
| Communication Services — 3.6% | | | | | | | |
| Alphabet, Cl A * | | | 1,018 | | | | 1,198,074 |
| | | | | | | | |
| Consumer Discretionary — 14.8% | | | | | | | |
| Ford Motor | | | 149,146 | | | | 1,309,502 |
| General Motors | | | 32,000 | | | | 1,187,200 |
| Gentherm * | | | 9,158 | | | | 337,564 |
| Stoneridge * | | | 12,000 | | | | 346,320 |
| Tesla * | | | 4,879 | | | | 1,365,436 |
| Visteon * | | | 5,299 | | | | 356,888 |
| | | | | | | | 4,902,910 |
| Industrials — 1.0% | | | | | | | |
| EnerSys | | | 5,094 | | | | 331,925 |
| | | | | | | | |
| Information Technology — 20.7% | | | | | | | |
| Advanced Micro Devices * | | | 25,849 | | | | 659,666 |
| Ambarella * | | | 9,834 | | | | 424,829 |
| Analog Devices | | | 11,075 | | | | 1,165,865 |
| Cirrus Logic * | | | 8,315 | | | | 349,812 |
| Maxim Integrated Products | | | 12,331 | | | | 655,639 |
| MaxLinear, Cl A * | | | 14,909 | | | | 380,627 |
| NVIDIA | | | 7,113 | | | | 1,277,210 |
| Skyworks Solutions | | | 8,895 | | | | 733,660 |
| Texas Instruments | | | 11,074 | | | | 1,174,619 |
| | | | | | | | 6,821,927 |
| Materials — 3.1% | | | | | | | |
| Albemarle | | | 6,057 | | | | 496,553 |
| FMC | | | 6,736 | | | | 517,459 |
| | | | | | | | 1,014,012 |
| TOTAL UNITED STATES | | | | | | | 14,268,848 |
TOTAL COMMON STOCK
(Cost $34,097,883) | | | | | | | 31,957,666 |
| | | | | | | | |
| PREFERRED STOCK — 2.0% | | | | | | | |
| | | | | | | | |
| GERMANY— 2.0% | | | | | | | |
| Consumer Discretionary — 2.0% | | | | | | | |
| Volkswagen(B) | | | 4,188 | | | | 659,855 |
TOTAL PREFERRED STOCK
(Cost $731,928) | | | | | | | 659,855 |
The accompanying notes are an integral part of the financial statements.
Schedule of InvestmentsMarch 31, 2019
KraneShares Electric Vehicles and Future Mobility Index ETF(concluded)
| | | Shares | | | Value | |
| COMMON STOCK (continued) | | | | | | | | |
| SHORT-TERM INVESTMENT(C)(D)— 4.2% | | | | | | | | |
| Invesco Government & Agency Portfolio, Cl Institutional, 2.340% | | | 1,404,802 | | | $ | 1,404,802 | |
TOTAL SHORT-TERM INVESTMENT
(Cost $1,404,802) | | | | | | | 1,404,802 | |
| | | | | | | | | |
TOTAL INVESTMENTS — 103.0%
(Cost $36,234,613) | | | | | | | 34,022,323 | |
| OTHER ASSETS LESS LIABILITIES — (3.0)% | | | | | | | (996,481 | ) |
| NET ASSETS — 100% | | | | | | $ | 33,025,842 | |
| ‡ | Industries are utilized for compliance purposes, whereas sectors are utilized for reporting. |
| * | Non-income producing security. |
| (A) | This security or a partial position of this security is on loan at March 31, 2019. The total market value of securities on loan at March 31, 2019 was $1,354,696. |
| (B) | Currently, no stated interest rate. |
| (C) | The rate shown is the 7-day effective yield as of March 31, 2019. |
| (D) | This security was purchased with cash collateral held from securities on loan. The total value of such security as of March 31, 2019 was $1,404,802. |
ADR — American Depositary Receipt
Cl — Class
As of March 31, 2019, all of the Fund’s investments were considered Level 1 of the fair value hierarchy, in accordance with the authoritative guidance under U.S. GAAP.
For the year ended March 31, 2019, there have been no transfers between Level 1, Level 2 or Level 3 investments. Transfers between levels are recognized at period end.
The accompanying notes are an integral part of the financial statements.
Schedule of InvestmentsMarch 31, 2019
KraneShares MSCI All China Health Care Index ETF
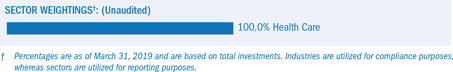
| | | Shares | | | Value |
| COMMON STOCK — 100.0%‡ | | | | | | | |
| CHINA — 100.0% | | | | | | | |
| Health Care — 100.0% | | | | | | | |
| 3SBio | | | 427,000 | | | $ | 839,863 |
| Alibaba Health Information Technology* | | | 1,202,000 | | | | 1,388,816 |
| Beijing SL Pharmaceutical, Cl A | | | 66,435 | | | | 272,850 |
| Beijing Tiantan Biological Products, Cl A | | | 84,865 | | | | 316,971 |
| Beijing Tongrentang, Cl A | | | 138,068 | | | | 614,918 |
| Changchun High & New Technology Industry Group, Cl A | | | 16,900 | | | | 797,169 |
| Chengdu Kanghong Pharmaceutical Group, Cl A | | | 44,500 | | | | 337,183 |
| China Medical System Holdings | | | 442,000 | | | | 428,489 |
| China National Accord Medicines, Cl A | | | 37,132 | | | | 284,504 |
| China National Medicines, Cl A | | | 74,655 | | | | 295,056 |
| China Resources Double Crane Pharmaceutical, Cl A | | | 102,307 | | | | 209,936 |
| China Resources Pharmaceutical Group | | | 516,500 | | | | 730,342 |
| China Resources Sanjiu Medical & Pharmaceutical, Cl A | | | 94,609 | | | | 406,018 |
| China Traditional Chinese Medicine Holdings | | | 792,000 | | | | 471,167 |
| CSPC Pharmaceutical Group | | | 1,536,000 | | | | 2,856,784 |
| Dong-E-E-Jiao, Cl A | | | 3,600 | | | | 25,419 |
| Dong-E-E-Jiao, Cl E | | | 60,014 | | | | 423,747 |
| Genscript Biotech* | | | 296,000 | | | | 558,821 |
| Guangzhou Baiyunshan Pharmaceutical Holdings, Cl A | | | 135,746 | | | | 787,788 |
| Guizhou Bailing Group Pharmaceutical, Cl A | | | 139,100 | | | | 219,200 |
| Huadong Medicine, Cl A | | | 142,635 | | | | 692,565 |
| Hualan Biological Engineering, Cl A | | | 91,576 | | | | 613,214 |
| Hubei Jumpcan Pharmaceutical, Cl A | | | 65,575 | | | | 336,843 |
| Humanwell Healthcare Group, Cl A | | | 131,170 | | | | 222,904 |
| Hutchison China MediTech ADR* | | | 18,414 | | | | 563,100 |
| Jiangsu Hengrui Medicine, Cl A | | | 389,149 | | | | 3,788,302 |
| Jiangsu Yuyue Medical Equipment & Supply, Cl A | | | 97,710 | | | | 366,983 |
| Jilin Aodong Pharmaceutical Group, Cl A | | | 112,811 | | | | 305,689 |
| Jinyu Bio-Technology, Cl A | | | 115,068 | | | | 304,442 |
| Joincare Pharmaceutical Group Industry, Cl A | | | 193,648 | | | | 254,444 |
| Jointown Pharmaceutical Group, Cl A | | | 181,550 | | | | 423,604 |
| Kangmei Pharmaceutical, Cl A | | | 462,495 | | | | 719,186 |
| Livzon Pharmaceutical Group, Cl A | | | 46,616 | | | | 242,715 |
| Luye Pharma Group | | | 380,000 | | | | 332,079 |
| Meinian Onehealth Healthcare Holdings, Cl A | | | 301,592 | | | | 834,290 |
| Realcan Pharmaceutical, Cl A | | | 148,571 | | | | 200,079 |
| Shandong Buchang Pharmaceuticals, Cl A* | | | 86,292 | | | | 371,994 |
| Shandong Weigao Group Medical Polymer, Cl H | | | 656,000 | | | | 626,756 |
| Shanghai Fosun Pharmaceutical Group, Cl A | | | 196,459 | | | | 870,591 |
| Shanghai Fosun Pharmaceutical Group, Cl H | | | 183,500 | | | | 662,708 |
The accompanying notes are an integral part of the financial statements.
Schedule of InvestmentsMarch 31, 2019
KraneShares MSCI All China Health Care Index ETF(concluded)
| | | Shares | | | Value |
| COMMON STOCK (continued) | | | | | | | |
| Health Care (continued) | | | | | | | |
| Shanghai Pharmaceuticals Holding, Cl A | | | 185,094 | | | $ | 569,588 |
| Shanghai Pharmaceuticals Holding, Cl H | | | 300,500 | | | | 654,597 |
| Shenzhen Hepalink Pharmaceutical Group, Cl A | | | 102,628 | | | | 395,686 |
| Shenzhen Salubris Pharmaceuticals, Cl A | | | 84,543 | | | | 342,061 |
| Shijiazhuang Yiling Pharmaceutical, Cl A | | | 117,025 | | | | 226,903 |
| Sichuan Kelun Pharmaceutical, Cl A | | | 140,900 | | | | 606,984 |
| Sihuan Pharmaceutical Holdings Group | | | 1,240,000 | | | | 300,129 |
| Sino Biopharmaceutical | | | 2,306,500 | | | | 2,103,777 |
| Sinopharm Group, Cl H | | | 409,200 | | | | 1,704,577 |
| SSY Group | | | 494,000 | | | | 459,391 |
| Tasly Pharmaceutical Group, Cl A | | | 148,452 | | | | 497,477 |
| Tong Ren Tang Technologies, Cl H | | | 183,000 | | | | 245,711 |
| Tonghua Dongbao Pharmaceutical, Cl A | | | 203,591 | | | | 525,928 |
| Wuxi Biologics Cayman* | | | 164,500 | | | | 1,599,956 |
| Yifan Pharmaceutical, Cl A | | | 120,539 | | | | 237,663 |
| Yunnan Baiyao Group, Cl A | | | 100,065 | | | | 1,273,111 |
| Zhangzhou Pientzehuang Pharmaceutical, Cl A | | | 57,523 | | | | 983,511 |
| Zhejiang Conba Pharmaceutical, Cl A | | | 263,700 | | | | 401,032 |
| Zhejiang Huahai Pharmaceutical, Cl A | | | 122,716 | | | | 283,042 |
| Zhejiang NHU, Cl A | | | 210,833 | | | | 579,773 |
TOTAL COMMON STOCK
(Cost $39,067,572) | | | | | | | 38,988,426 |
| | | | | | | | |
TOTAL INVESTMENTS — 100.0%
(Cost $39,067,572) | | | | | | | 38,988,426 |
| OTHER ASSETS LESS LIABILITIES – 0.0% | | | | | | | 15,441 |
| NET ASSETS – 100% | | | | | | $ | 39,003,867 |
| * | Non-income producing security. |
| ‡ | Industries are utilized for compliance purposes, whereas sectors are utilized for reporting. |
Cl — Class
As of March 31, 2019, all of the Fund’s investments were considered Level 1 of the fair value hierarchy, in accordance with the authoritative guidance under U.S. GAAP.
For the year ended March 31, 2019, there have been no transfers between Level 1, Level 2 or Level 3 investments. Transfers between levels are recognized at period end.
The accompanying notes are an integral part of the financial statements.
Schedule of InvestmentsMarch 31, 2019
KraneShares CCBS China Corporate High Yield Bond USD Index ETF
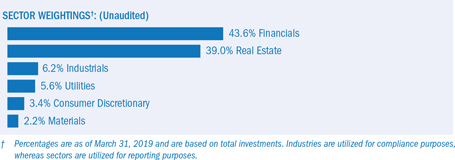
| | | Face
Amount | | | Value |
| CORPORATE OBLIGATIONS — 93.8% | | | | | | | |
| CHINA — 72.4% | | | | | | | |
| Consumer Discretionary — 1.5% | | | | | | | |
| Baoxin Auto Finance I | | | | | | | |
5.625%, VAR US Treas Yield Curve Rate T Note Const Mat
3 Yr+3.909% 10/30/2020‡ | | $ | 200,000 | | | $ | 188,464 |
| Financials — 30.3% | | | | | | | |
| Bank of Communications | | | | | | | |
| 5.000%, VAR US Treas Yield Curve Rate T Note Const Mat 5 Yr+3.344% 07/29/2020‡ | | | 600,000 | | | | 602,520 |
| CCB Life Insurance | | | | | | | |
| 4.500%, VAR US Treas Yield Curve Rate T Note Const Mat 5 Yr+2.680% 04/21/2077 | | | 300,000 | | | | 286,589 |
| CFLD Cayman Investment | | | | | | | |
| 9.000%, 07/31/2021 | | | 200,000 | | | | 207,472 |
| China Construction Bank | | | | | | | |
| 4.650%, VAR US Treas Yield Curve Rate T Note Const Mat 5 Yr+2.974% 12/16/2020‡ | | | 600,000 | | | | 600,060 |
| China Life Insurance | | | | | | | |
| 4.000%, VAR US Treas Yield Curve Rate T Note Const Mat 5 Yr+2.294% 07/03/2075 | | | 200,000 | | | | 198,573 |
| China Reinsurance Finance | | | | | | | |
| 3.375%, 03/09/2022 | | | 400,000 | | | | 393,395 |
| Chong Hing Bank | | | | | | | |
| 6.500%, VAR US Treas Yield Curve Rate T Note Const Mat 5 Yr+4.628% 09/25/2019‡ | | | 300,000 | | | | 302,990 |
| Fortune Star BVI | | | | | | | |
| 5.950%, 01/29/2023 | | | 200,000 | | | | 196,500 |
| Industrial & Commercial Bank of China | | | | | | | |
| 6.000%, VAR US Treas Yield Curve Rate T Note Const Mat 5 Yr+4.382% 12/10/2019‡ | | | 300,000 | | | | 303,814 |
| New Metro Global | | | | | | | |
| 6.500%, 04/23/2021 | | | 200,000 | | | | 201,762 |
| Unigroup International Holdings | | | | | | | |
| 6.000%, 12/10/2020 | | | 200,000 | | | | 200,318 |
| Westwood Group Holdings | | | | | | | |
| 5.375%, 10/19/2023 | | | 200,000 | | | | 209,136 |
| | | | | | | | 3,703,129 |
The accompanying notes are an integral part of the financial statements.
Schedule of InvestmentsMarch 31, 2019
KraneShares CCBS China Corporate High Yield Bond USD Index ETF(continued)
| | | Face
Amount | | | Value |
| CORPORATE OBLIGATIONS (continued) | | | | | | | |
| Industrials — 4.1% | | | | | | | |
| CNAC HK Synbridge | | | | | | | |
| 5.000%, 05/05/2020 | | $ | 300,000 | | | $ | 303,424 |
| Huzhou City Investment Development Group | | | | | | | |
| 4.875%, 12/20/2020 | | | 200,000 | | | | 198,597 |
| | | | | | | | 502,021 |
| Materials — 2.0% | | | | | | | |
| Chinalco Capital Holdings | | | | | | | |
| 4.250%, 04/21/2022 | | | 250,000 | | | | 247,401 |
| | | | | | | | |
| Real Estate — 31.3% | | | | | | | |
| Agile Group Holdings | | | | | | | |
| 9.000%, 05/21/2020 | | | 200,000 | | | | 206,722 |
| Central China Real Estate | | | | | | | |
| 8.750%, 01/23/2021 | | | 200,000 | | | | 207,451 |
| Central Plaza Development | | | | | | | |
| 7.125%, VAR US Treas Yield Curve Rate T Note Const Mat 5 Yr+10.532% 12/02/2019‡ | | | 200,000 | | | | 202,972 |
| China Evergrande Group | | | | | | | |
| 7.500%, 06/28/2023 | | | 400,000 | | | | 377,029 |
| China SCE Group Holdings | | | | | | | |
| 10.000%, 07/02/2020 | | | 200,000 | | | | 207,114 |
| CIFI Holdings Group | | | | | | | |
| 7.750%, 06/05/2020 | | | 200,000 | | | | 204,453 |
| Fantasia Holdings Group | | | | | | | |
| 7.950%, 07/05/2022 | | | 200,000 | | | | 175,943 |
| Franshion Brilliant | | | | | | | |
| 5.750%, VAR US Treas Yield Curve Rate T Note Const Mat 5 Yr+3.859% 01/17/2022‡ | | | 200,000 | | | | 195,297 |
| Greenland Global Investment | | | | | | | |
| 5.250%, 02/12/2021 | | | 200,000 | | | | 196,803 |
| Kaisa Group Holdings | | | | | | | |
| 7.250%, 06/30/2020 | | | 200,000 | | | | 196,064 |
| Logan Property Holdings | | | | | | | |
| 5.250%, 02/23/2023 | | | 200,000 | | | | 190,449 |
| Ronshine China Holdings | | | | | | | |
| 8.250%, 02/01/2021 | | | 200,000 | | | | 203,035 |
| Shui On Development Holding | | | | | | | |
| 6.400%, VAR US Treas Yield Curve Rate T Note Const Mat 5 Yr+7.627% 06/20/2022‡ | | | 200,000 | | | | 196,150 |
| Sunac China Holdings | | | | | | | |
| 7.950%, 08/08/2022 | | | 200,000 | | | | 204,042 |
| Times China Holdings | | | | | | | |
| 6.250%, 01/17/2021 | | | 200,000 | | | | 200,116 |
| Well Hope Development | | | | | | | |
| 3.875%, VAR US Treas Yield Curve Rate T Note Const Mat 5 Yr+6.927% 10/19/2022‡ | | | 200,000 | | | | 195,545 |
| Wuhan Real Estate Development & Investment Group | | | | | | | |
| 5.700%, 08/09/2021 | | | 250,000 | | | | 252,568 |
The accompanying notes are an integral part of the financial statements.
Schedule of InvestmentsMarch 31, 2019
KraneShares CCBS China Corporate High Yield Bond USD Index ETF(continued)
| | | Face
Amount | | | Value |
| CORPORATE OBLIGATIONS (continued) | | | | | | | |
| Real Estate (continued) | | | | | | | |
| Yuzhou Properties | | | | | | | |
| 8.500%, 02/04/2023 | | $ | 200,000 | | | $ | 208,200 |
| | | | | | | | 3,819,953 |
| Utilities — 3.2% | | | | | | | |
| Huaneng Hong Kong Capital | | | | | | | |
| 3.600%, VAR US Treas Yield Curve Rate T Note Const Mat 5 Yr+6.596% 10/30/2022‡ | | | 200,000 | | | | 194,545 |
| Lenovo Group | | | | | | | |
| 4.750%, 03/29/2023 | | | 200,000 | | | | 200,658 |
| | | | | | | | 395,203 |
| TOTAL CHINA | | | | | | | 8,856,171 |
| | | | | | | | |
| HONG KONG — 21.4% | | | | | | | |
| Consumer Discretionary — 1.7% | | | | | | | |
| Studio City | | | | | | | |
| 7.250%, 11/30/2021 | | | 200,000 | | | | 206,898 |
| | | | | | | | |
| Financials — 10.6% | | | | | | | |
| Bank of East Asia | | | | | | | |
| 5.500%, VAR US Treas Yield Curve Rate T Note Const Mat 5 Yr+3.834% 12/02/2020‡ | | | 250,000 | | | | 250,221 |
| China CITIC Bank International | | | | | | | |
| 7.100%, VAR US Treas Yield Curve Rate T Note Const Mat 5 Yr+4.151% 11/06/2023‡ | | | 200,000 | | | | 207,706 |
| Industrial & Commercial Bank of China Asia | | | | | | | |
| 4.250%, VAR US Treas Yield Curve Rate T Note Const Mat 5 Yr+3.135% 07/21/2021‡ | | | 300,000 | | | | 295,548 |
| Nanyang Commercial Bank | | | | | | | |
| 5.000%, VAR US Treas Yield Curve Rate T Note Const Mat 5 Yr+3.205% 06/02/2022‡ | | | 350,000 | | | | 337,824 |
| Sun Hung Kai & BVI | | | | | | | |
| 4.650%, 09/08/2022 | | | 200,000 | | | | 198,376 |
| | | | | | | | 1,289,675 |
| Industrials — 1.7% | | | | | | | |
| Celestial Miles | | | | | | | |
| 5.750%, VAR US Treas Yield Curve Rate T Note Const Mat 5 Yr+8.205% 01/31/2024‡ | | | 200,000 | | | | 207,400 |
| | | | | | | | |
| Real Estate — 5.3% | | | | | | | |
| HLP Finance | | | | | | | |
| 4.750%, 06/25/2022 | | | 200,000 | | | | 207,832 |
| NWD Finance BVI | | | | | | | |
| 5.750%, 10/05/2021‡ | | | 250,000 | | | | 242,293 |
| WTT Investment | | | | | | | |
| 5.500%, 11/21/2022 | | | 200,000 | | | | 198,778 |
| | | | | | | | 648,903 |
The accompanying notes are an integral part of the financial statements.
Schedule of InvestmentsMarch 31, 2019
KraneShares CCBS China Corporate High Yield Bond USD Index ETF(concluded)
| | | Face
Amount | | | Value |
| CORPORATE OBLIGATIONS (continued) | | | | | | | |
| Utilities — 2.1% | | | | | | | |
| OVPH | | | | | | | |
| 5.875%, 03/01/2021‡ | | $ | 250,000 | | | $ | 252,187 |
| TOTAL HONG KONG | | | | | | | 2,605,063 |
TOTAL CORPORATE OBLIGATIONS
(Cost $11,222,617) | | | | | | | 11,461,234 |
TOTAL INVESTMENTS — 93.8%
(Cost $11,222,617) | | | | | | | 11,461,234 |
| OTHER ASSETS LESS LIABILITIES — 6.2% | | | | | | | 758,558 |
| NET ASSETS — 100% | | | | | | $ | 12,219,792 |
‡ — Perpetual Bond - Maturity Date listed represents the next call date.
VAR — Variable Rate
As of March 31, 2019, all of the Fund’s investments were considered Level 2 of the fair value hierarchy, in accordance with the authoritative guidance under U.S. GAAP.
For the period ended March 31, 2019, there have been no transfers between Level 1, Level 2 or Level 3 investments. Transfers between levels are recognized at period end.
The accompanying notes are an integral part of the financial statements.
Schedule of InvestmentsMarch 31, 2019
KraneShares Emerging Markets Healthcare Index ETF
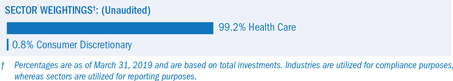
| | | Shares | | | Value |
| COMMON STOCK — 99.7%‡ | | | | | | | |
| BRAZIL — 4.1% | | | | | | | |
| Health Care — 4.1% | | | | | | | |
| Fleury | | | 4,200 | | | $ | 22,059 |
| Hapvida Participacoes e Investimentos | | | 8,500 | | | | 67,293 |
| Notre Dame Intermedica Participacoes | | | 6,300 | | | | 52,887 |
| Odontoprev | | | 6,600 | | | | 27,983 |
| Qualicorp Consultoria e Corretora de Seguros | | | 3,600 | | | | 14,505 |
| TOTAL BRAZIL | | | | | | | 184,727 |
| | | | | | | | |
| CHINA — 40.8% | | | | | | | |
| Health Care — 40.8% | | | | | | | |
| 3SBio | | | 32,500 | | | | 63,924 |
| Aier Eye Hospital Group, Cl A | | | 31,305 | | | | 158,383 |
| Beijing Tongrentang, Cl A | | | 17,750 | | | | 79,054 |
| China Medical System Holdings | | | 31,000 | | | | 30,052 |
| China Shineway Pharmaceutical Group | | | 10,000 | | | | 10,013 |
| Chongqing Zhifei Biological Products, Cl A | | | 20,713 | | | | 157,500 |
| Genscript Biotech* | | | 24,000 | | | | 45,310 |
| Huadong Medicine, Cl A | | | 20,300 | | | | 98,567 |
| Hualan Biological Engineering, Cl A | | | 12,300 | | | | 82,364 |
| Jiangsu Hengrui Medicine, Cl A | | | 25,450 | | | | 247,748 |
| Kangmei Pharmaceutical, Cl A | | | 64,100 | | | | 99,676 |
| Lepu Medical Technology Beijing, Cl A | | | 24,922 | | | | 98,276 |
| Luye Pharma Group | | | 44,000 | | | | 38,451 |
| Shandong Weigao Group Medical Polymer, Cl H | | | 56,000 | | | | 53,503 |
| Shanghai Fosun Pharmaceutical Group, Cl H | | | 7,000 | | | | 25,280 |
| Shanghai Pharmaceuticals Holding, Cl H | | | 12,200 | | | | 26,576 |
| Sichuan Kelun Pharmaceutical, Cl A | | | 19,493 | | | | 83,975 |
| Sihuan Pharmaceutical Holdings Group | | | 117,000 | | | | 28,319 |
| Wuxi Biologics Cayman* | | | 15,500 | | | | 150,756 |
| Yunnan Baiyao Group, Cl A | | | 9,200 | | | | 117,050 |
| Zhangzhou Pientzehuang Pharmaceutical, Cl A | | | 7,600 | | | | 129,942 |
| TOTAL CHINA | | | | | | | 1,824,719 |
| | | | | | | | |
| HONG KONG — 4.3% | | | | | | | |
| Health Care — 4.3% | | | | | | | |
| BeiGene* | | | 9,500 | | | | 93,427 |
| Microport Scientific | | | 23,000 | | | | 21,623 |
| Ping An Healthcare and Technology* | | | 13,700 | | | | 77,314 |
| TOTAL HONG KONG | | | | | | | 192,364 |
| | | | | | | | |
| HUNGARY — 1.0% | | | | | | | |
| Health Care — 1.0% | | | | | | | |
| Richter Gedeon Nyrt* | | | 2,407 | | | | 45,377 |
| TOTAL HUNGARY | | | | | | | 45,377 |
The accompanying notes are an integral part of the financial statements.
Schedule of InvestmentsMarch 31, 2019
KraneShares Emerging Markets Healthcare Index ETF(continued)
| | | Shares | | | Value |
| COMMON STOCK (continued) | | | | | | | |
| INDIA — 14.6% | | | | | | | |
| Health Care — 14.6% | | | | | | | |
| Aurobindo Pharma | | | 7,550 | | | $ | 85,472 |
| Biocon | | | 7,850 | | | | 69,185 |
| Cipla | | | 10,316 | | | | 78,760 |
| Dr Reddy’s Laboratories ADR | | | 2,138 | | | | 86,589 |
| Lupin | | | 5,750 | | | | 61,389 |
| Piramal Enterprises | | | 2,346 | | | | 93,578 |
| Sun Pharmaceutical Industries | | | 25,986 | | | | 179,623 |
| TOTAL INDIA | | | | | | | 654,596 |
| | | | | | | | |
| INDONESIA — 1.4% | | | | | | | |
| Health Care — 1.4% | | | | | | | |
| Kalbe Farma | | | 580,700 | | | | 61,985 |
| TOTAL INDONESIA | | | | | | | 61,985 |
| | | | | | | | |
| MALAYSIA — 5.4% | | | | | | | |
| Health Care — 5.4% | | | | | | | |
| Hartalega Holdings | | | 42,200 | | | | 47,859 |
| IHH Healthcare | | | 102,500 | | | | 144,868 |
| KPJ Healthcare | | | 56,000 | | | | 13,443 |
| Top Glove | | | 32,900 | | | | 37,232 |
| TOTAL MALAYSIA | | | | | | | 243,402 |
| | | | | | | | |
| SOUTH AFRICA — 2.4% | | | | | | | |
| Health Care — 2.4% | | | | | | | |
| Aspen Pharmacare Holdings | | | 6,133 | | | | 39,542 |
| Life Healthcare Group Holdings | | | 18,987 | | | | 35,338 |
| Netcare | | | 18,565 | | | | 30,059 |
| TOTAL SOUTH AFRICA | | | | | | | 104,939 |
| | | | | | | | |
| SOUTH KOREA — 19.6% | | | | | | | |
| Consumer Discretionary — 0.8% | | | | | | | |
| HLB* | | | 515 | | | | 36,296 |
| | | | | | | | |
| Health Care — 18.8% | | | | | | | |
| Bukwang Pharmaceutical | | | 829 | | | | 13,948 |
| Celltrion | | | 976 | | | | 155,595 |
| Celltrion Healthcare | | | 1,509 | | | | 88,792 |
| Daewoong Pharmaceutical | | | 149 | | | | 24,153 |
| Genexine* | | | 264 | | | | 19,746 |
| Green Cross | | | 145 | | | | 18,459 |
| Hanall Biopharma* | | | 625 | | | | 18,749 |
| Hanmi Pharm | | | 149 | | | | 59,857 |
| Hanmi Science ltd | | | 823 | | | | 56,119 |
| Hugel* | | | 57 | | | | 18,982 |
| Komipharm International* | | | 743 | | | | 15,022 |
| Medy-Tox | | | 77 | | | | 39,479 |
| Samsung Biologics* | | | 645 | | | | 181,550 |
| SillaJen* | | | 868 | | | | 49,169 |
The accompanying notes are an integral part of the financial statements.
Schedule of InvestmentsMarch 31, 2019
KraneShares Emerging Markets Healthcare Index ETF(concluded)
| | | Shares | | | Value |
| COMMON STOCK (continued) | | | | | | | |
| Health Care (continued) | | | | | | | |
| ViroMed* | | | 198 | | | $ | 48,807 |
| Yuhan | | | 157 | | �� | | 33,195 |
| | | | | | | | 841,622 |
| TOTAL SOUTH KOREA | | | | | | | 877,918 |
| | | | | | | | |
| THAILAND — 5.1% | | | | | | | |
| Health Care — 5.1% | | | | | | | |
| Bangkok Chain Hospital | | | 34,100 | | | | 18,267 |
| Bangkok Dusit Medical Services | | | 198,200 | | | | 154,888 |
| Bumrungrad Hospital | | | 9,700 | | | | 54,865 |
| TOTAL THAILAND | | | | | | | 228,020 |
| | | | | | | | |
| UNITED STATES — 1.0% | | | | | | | |
| Health Care — 1.0% | | | | | | | |
| China Biologic Products Holdings* | | | 506 | | | | 46,173 |
| TOTAL UNITED STATES | | | | | | | 46,173 |
TOTAL COMMON STOCK
(Cost $4,358,370) | | | | | | | 4,464,220 |
| | | | | | | | |
TOTAL INVESTMENTS — 99.7%
(Cost $4,358,370) | | | | | | | 4,464,220 |
| OTHER ASSETS LESS LIABILITIES — 0.3% | | | | | | | 12,191 |
| NET ASSETS — 100% | | | | | | $ | 4,476,411 |
| ‡ | Industries are utilized for compliance purposes, whereas sectors are utilized for reporting. |
| * | Non-income producing security. |
ADR — American Depositary Receipt
Cl — Class
As of March 31, 2019, all of the Fund’s investments were considered Level 1 of the fair value hierarchy, in accordance with the authoritative guidance under U.S. GAAP.
For the period ended March 31, 2019, there have been no transfers between Level 1, Level 2 or Level 3 investments. Transfers between levels are recognized at period end.
The accompanying notes are an integral part of the financial statements.
Statements of Assets and Liabilities
March 31, 2019
| | | KraneShares CICC China Leaders 100 Index ETF | | | KraneShares CSI China Internet ETF | | | KraneShares Bosera MSCI China A Share ETF | |
| Assets: | | | | | | | | | | | | |
| Investments at Value | | $ | 2,795,504 | | | $ | 2,541,392,609 | * | | $ | 601,263,766 | |
| Cash and Cash Equivalents | | | 6,128 | | | | 1,989,975 | | | | 7,558,178 | |
| Foreign Currency at Value | | | 5 | | | | — | | | | 7,186,377 | |
| Receivable for Capital Shares Sold | | | — | | | | 33,822 | | | | — | |
| Receivable for Investment Securities Sold | | | — | | | | 523,057 | | | | — | |
| Dividend and Interest Receivable | | | — | | | | 2,248,276 | | | | — | |
| Total Assets | | | 2,801,637 | | | | 2,546,187,739 | | | | 616,008,321 | |
| | | | | | | | | | | | | |
| Liabilities: | | | | | | | | | | | | |
| Payable for Investment Securities Purchased | | | — | | | | 1,277,976 | | | | — | |
| Obligation to Return Securities Lending Collateral | | | — | | | | 468,400,662 | | | | — | |
| Payable for Capital Shares Redeemed | | | — | | | | 597,374 | | | | — | |
| Payable for Management Fees | | | 1,561 | | | | 1,178,433 | | | | 243,303 | |
| Payable for Trustees’ Fee | | | 24 | | | | 17,585 | | | | 3,692 | |
| Payable to Authorized Participant | | | — | | | | — | | | | 5,182,612 | |
| Subscriptions Received in Advance | | | — | | | | — | | | | 6,543,481 | |
| Payable for Securities Lending Fees | | | — | | | | 211,122 | | | | — | |
| Unrealized Depreciation on Spot Contracts | | | — | | | | 3 | | | | — | |
| Total Liabilities | | | 1,585 | | | | 471,683,155 | | | | 11,973,088 | |
| | | | | | | | | | | | | |
| Net Assets | | $ | 2,800,052 | | | $ | 2,074,504,584 | | | $ | 604,035,233 | |
| | | | | | | | | | | | | |
| Net Assets Consist of: | | | | | | | | | | | | |
| Paid-in Capital | | $ | 2,941,285 | | | $ | 2,328,096,369 | | | $ | 624,685,188 | |
| Total Distributable Loss | | | (141,233 | ) | | | (253,591,785 | ) | | | (20,649,955 | ) |
| | | | | | | | | | | | | |
| Net Assets | | $ | 2,800,052 | | | $ | 2,074,504,584 | | | $ | 604,035,233 | |
| Outstanding Shares of Beneficial Interest (unlimited authorization - no par value) | | | 100,000 | | | | 44,100,000 | | | | 18,950,000 | |
| Net Asset Value, Offering and Redemption Price Per Share | | $ | 28.00 | | | $ | 47.04 | | | $ | 31.88 | |
| | | | | | | | | | | | | |
| Cost of Investments | | $ | 2,310,024 | | | $ | 2,487,573,125 | | | $ | 586,269,837 | |
| Cost of Foreign Currency | | | 5 | | | | — | | | | 7,314,434 | |
| *Includes Market Value of Securities on Loan | | | — | | | | 452,716,688 | | | | — | |
Amounts designated as “—” are $0 or have been rounded to $0.
The accompanying notes are an integral part of the financial statements.
Statements of Assets and Liabilities (continued)
March 31, 2019
| | | KraneShares E Fund China Commercial Paper ETF | | | KraneShares MSCI All China Index ETF | | | KraneShares MSCI One Belt One Road Index ETF | |
| Assets: | | | | | | | | | | | | |
| Investments at Value | | $ | 16,552,894 | | | $ | 6,332,835 | | | $ | 21,288,224 | |
| Affiliated Investments at Value | | | 384,215 | | | | — | | | | — | |
| Foreign Currency at Value | | | 2,524,917 | | | | 21,916 | | | | 4 | |
| Cash and Cash Equivalents | | | — | | | | 17,702 | | | | 28,046 | |
| Dividend and Interest Receivable | | | 266,777 | | | | 46 | | | | 38,271 | |
| Receivable from Adviser for Withholding/Value Added Tax | | | 39,485 | | | | — | | | | — | |
| Reclaim Receivable | | | — | | | | 427 | | | | 1,820 | |
| Prepaid Expenses | | | — | | | | 450 | | | | — | |
| Total Assets | | | 19,768,288 | | | | 6,373,376 | | | | 21,356,365 | |
| | | | | | | | | | | | | |
| Liabilities: | | | | | | | | | | | | |
| Payable to Custodian | | | 935,726 | | | | — | | | | — | |
| Payable for Management Fees | | | 7,980 | | | | 3,610 | | | | 14,089 | |
| Payable for Foreign Capital Gains Tax | | | 2,247 | | | | — | | | | — | |
| Payable for Trustees’ Fee | | | 103 | | | | 125 | | | | 183 | |
| Payable to Authorized Participant | | | — | | | | — | | | | 20,294 | |
| Total Liabilities | | | 946,056 | | | | 3,735 | | | | 34,566 | |
| | | | | | | | | | | | | |
| Net Assets | | $ | 18,822,232 | | | $ | 6,369,641 | | | $ | 21,321,799 | |
| | | | | | | | | | | | | |
| Net Assets Consist of: | | | | | | | | | | | | |
| Paid-in Capital | | $ | 19,084,198 | | | $ | 5,817,003 | | | $ | 25,167,534 | |
| Total Distributable Earnings/(Loss) | | | (261,966 | ) | | | 552,638 | | | | (3,845,735 | ) |
| | | | | | | | | | | | | |
| Net Assets | | $ | 18,822,232 | | | $ | 6,369,641 | | | $ | 21,321,799 | |
| Outstanding Shares of Beneficial Interest (unlimited authorization - no par value) | | | 550,000 | | | | 250,000 | | | | 900,002 | |
| Net Asset Value, Offering and Redemption Price Per Share | | $ | 34.22 | | | $ | 25.48 | | | $ | 23.69 | |
| | | | | | | | | | | | | |
| Cost of Investments | | $ | 16,388,044 | | | $ | 5,639,913 | | | $ | 22,307,475 | |
| Cost of Affiliated Investments | | | 391,208 | | | | — | | | | — | |
| Cost of Foreign Currency | | | 2,526,850 | | | | 23,236 | | | | 2 | |
Amounts designated as “—” are $0 or have been rounded to $0.
The accompanying notes are an integral part of the financial statements.
Statements of Assets and Liabilities (continued)
March 31, 2019
| | | KraneShares
Emerging Markets
Consumer
Technology
Index ETF | | | KraneShares MSCI
China Environment
Index ETF | | | KraneShares
Electric Vehicles
and Future
Mobility
Index ETF | |
| Assets: | | | | | | | | | | | | |
| Investments at Value | | $ | 29,945,482 | * | | $ | 4,052,215 | | | $ | 34,022,323* | |
| Cash and Cash Equivalents | | | 15,328 | | | | 7,622 | | | | 19,823 | |
| Foreign Currency at Value | | | — | | | | — | | | | 942 | |
| Dividend and Interest Receivable | | | 58,864 | | | | — | | | | 23,112 | |
| Reclaim Receivable | | | 2,789 | | | | — | | | | 16,032 | |
| Receivable for Investment Securities Sold | | | — | | | | — | | | | 738,830 | |
| Total Assets | | | 30,022,463 | | | | 4,059,837 | | | | 34,821,062 | |
| | | | | | | | | | | | | |
| Liabilities: | | | | | | | | | | | | |
| Payable for Investment Securities Purchased | | | — | | | | — | | | | 370,288 | |
| Obligation to Return Securities Lending Collateral | | | 1,323,063 | | | | — | | | | 1,404,802 | |
| Payable for Management Fees | | | 18,491 | | | | 3,310 | | | | 19,218 | |
| Payable for Trustees’ Fee | | | 415 | | | | 92 | | | | 510 | |
| Payable for Securities Lending Fees | | | 263 | | | | — | | | | 402 | |
| Total Liabilities | | | 1,342,232 | | | | 3,402 | | | | 1,795,220 | |
| | | | | | | | | | | | | |
| Net Assets | | $ | 28,680,231 | | | $ | 4,056,435 | | | $ | 33,025,842 | |
| | | | | | | | | | | | | |
| Net Assets Consist of: | | | | | | | | | | | | |
| Paid-in Capital | | $ | 34,644,661 | | | $ | 5,571,254 | | | $ | 38,236,044 | |
| Total Distributable Loss | | | (5,964,430 | ) | | | (1,514,819 | ) | | | (5,210,202 | ) |
| | | | | | | | | | | | | |
| Net Assets | | $ | 28,680,231 | | | $ | 4,056,435 | | | $ | 33,025,842 | |
| Outstanding Shares of Beneficial Interest (unlimited authorization - no par value) | | | 1,250,002 | | | | 200,002 | | | | 1,600,002 | |
| Net Asset Value, Offering and Redemption Price Per Share | | $ | 22.94 | | | $ | 20.28 | | | $ | 20.64 | |
| | | | | | | | | | | | | |
| Cost of Investments | | $ | 31,657,905 | | | $ | 3,769,455 | | | $ | 36,234,613 | |
| Cost of Foreign Currency | | | — | | | | — | | | | 954 | |
| *Includes Market Value of Securities on Loan | | | 1,277,165 | | | | — | | | | 1,354,696 | |
Amounts designated as “—” are $0 or have been rounded to $0.
The accompanying notes are an integral part of the financial statements.
Statements of Assets and Liabilities (concluded)
March 31, 2019
| | | KraneShares MSCI
All China
Health Care
Index ETF | | | KraneShares CCBS
China Corporate
High Yield
Bond USD
Index ETF | | | KraneShares
Emerging Markets
Healthcare
Index ETF | |
| Assets: | | | | | | | | | | | | |
| Investments at Value | | $ | 38,988,426 | | | $ | 11,461,234 | | | $ | 4,464,220 | |
| Cash and Cash Equivalents | | | 33,974 | | | | 681,739 | | | | 10,530 | |
| Foreign Currency at Value | | | 8,433 | | | | — | | | | 1,169 | |
| Dividend and Interest Receivable | | | 18 | | | | 188,874 | | | | 3,433 | |
| Receivable for Investment Securities Sold | | | — | | | | 885,270 | | | | — | |
| Reclaim Receivable | | | — | | | | — | | | | 61 | |
| Total Assets | | | 39,030,851 | | | | 13,217,117 | | | | 4,479,413 | |
| | | | | | | | | | | | | |
| Liabilities: | | | | | | | | | | | | |
| Payable for Investment Securities Purchased | | | — | | | | 990,100 | | | | — | |
| Payable for Management Fees | | | 26,386 | | | | 7,019 | | | | 2,959 | |
| Payable for Trustees’ Fee | | | 568 | | | | 206 | | | | 41 | |
| Unrealized Depreciation on Spot Contracts | | | 28 | | | | — | | | | 2 | |
| Payable for Securities Lending Fees | | | 2 | | | | — | | | | — | |
| Total Liabilities | | | 26,984 | | | | 997,325 | | | | 3,002 | |
| | | | | | | | | | | | | |
| Net Assets | | $ | 39,003,867 | | | $ | 12,219,792 | | | $ | 4,476,411 | |
| | | | | | | | | | | | | |
| Net Assets Consist of: | | | | | | | | | | | | |
| Paid-in Capital | | $ | 45,333,442 | | | $ | 11,935,858 | | | $ | 4,706,628 | |
| Total Distributable Earnings/(Loss) | | | (6,329,575 | ) | | | 283,934 | | | | (230,217 | ) |
| | | | | | | | | | | | | |
| Net Assets | | $ | 39,003,867 | | | $ | 12,219,792 | | | $ | 4,476,411 | |
| Outstanding Shares of Beneficial Interest (unlimited authorization - no par value) | | | 1,750,002 | | | | 300,001 | | | | 200,002 | |
| Net Asset Value, Offering and Redemption Price Per Share | | $ | 22.29 | | | $ | 40.73 | | | $ | 22.38 | |
| | | | | | | | | | | | | |
| Cost of Investments | | $ | 39,067,572 | | | $ | 11,222,617 | | | $ | 4,358,370 | |
| Cost of Foreign Currency | | | 8,423 | | | | — | | | | 1,168 | |
Amounts designated as “—” are $0 or have been rounded to $0.
The accompanying notes are an integral part of the financial statements.
Statements of Operations
For the year ended March 31, 2019
| | | KraneShares CICC
China Leaders 100
Index ETF | | | KraneShares
CSI China
Internet ETF | | | KraneShares
Bosera MSCI
China A
Share ETF | |
| Investment Income: | | | | | | | | | | | | |
| Dividend Income | | $ | 101,887 | | | $ | 5,324,428 | | | $ | 11,149,753 | |
| Less: Foreign Taxes Withheld | | | (5,910 | ) | | | (3,803 | ) | | | (1,118,582 | ) |
| Interest Income | | | 1,247 | | | | 122,431 | | | | 53,777 | |
| Security Lending Income | | | — | | | | 9,746,130 | | | | — | |
| Total Investment Income | | | 97,224 | | | | 15,189,186 | | | | 10,084,948 | |
| | | | | | | | | | | | | |
| Expenses: | | | | | | | | | | | | |
| Management Fees† | | | 22,764 | | | | 10,796,534 | | | | 2,970,967 | |
| Trustees’ Fees | | | 446 | | | | 196,964 | | | | 46,341 | |
| Security Lending Fees† | | | — | | | | 968,632 | | | | — | |
| Insurance Expense | | | 110 | | | | 34,434 | | | | 7,615 | |
| Total Expenses | | | 23,320 | | | | 11,996,564 | | | | 3,024,923 | |
| Management Fee Waiver† | | | — | | | | — | | | | (761,792 | ) |
| Reimbursement for Trustees’ Fees† | | | (41 | ) | | | (14,468 | ) | | | — | |
| Net Expenses | | | 23,279 | | | | 11,982,096 | | | | 2,263,131 | |
| | | | | | | | | | | | | |
| Net Investment Income | | | 73,945 | | | | 3,207,090 | | | | 7,821,817 | |
| | | | | | | | | | | | | |
| Net Realized Loss on: | | | | | | | | | | | | |
| Investments | | | (326,604 | ) | | | (192,328,222 | ) | | | (34,610,797 | ) |
| Foreign Currency Translations | | | (3,545 | ) | | | (67,441 | ) | | | (1,915,409 | ) |
| | | | | | | | | | | | | |
| Net Realized Loss on Investments and Foreign Currency Translations | | | (330,149 | ) | | | (192,395,663 | ) | | | (36,526,206 | ) |
| | | | | | | | | | | | | |
| Net Change in Unrealized Appreciation (Depreciation) on: | | | | | | | | | | | | |
| Investments | | | 172,753 | | | | (63,848,462 | ) | | | (17,089,860 | ) |
| Foreign Currency Translations | | | — | | | | (29 | ) | | | (7,717 | ) |
| | | | | | | | | | | | | |
| Net Change in Unrealized Appreciation (Depreciation) on Investments and Foreign Currency Translations | | | 172,753 | | | | (63,848,491 | ) | | | (17,097,577 | ) |
| | | | | | | | | | | | | |
| Net Realized and Unrealized Loss on Investments and Foreign Currency Translations | | | (157,396 | ) | | | (256,244,154 | ) | | | (53,623,783 | ) |
| | | | | | | | | | | | | |
| Net Decrease in Net Assets Resulting from Operations | | $ | (83,451 | ) | | $ | (253,037,064 | ) | | $ | (45,801,966 | ) |
† See Note 3 in Notes to Financial Statements.
Amounts designated as “—” are $0 or have been rounded to $0.
The accompanying notes are an integral part of the financial statements.
Statements of Operations (continued)
For the year ended March 31, 2019
| | | KraneShares
E Fund China
Commercial
Paper ETF | | | KraneShares MSCI
All China
Index ETF | | | KraneShares MSCI
One Belt One Road
Index ETF | |
| Investment Income: | | | | | | | | | | | | |
| Dividend Income | | $ | — | | | $ | 47,675 | | | $ | 848,425 | |
| Dividend from Affiliated Investment | | | 6,729 | | | | — | | | | — | |
| Less: Foreign Taxes Withheld | | | — | | | | (4,906 | ) | | | (73,394 | ) |
| Interest Income | | | 539,975 | | | | 466 | | | | — | |
| Less: Foreign Withholding/Value Added Tax | | | (39,485 | ) | | | — | | | | — | |
| Reimbursement of Foreign Withholding/Value Added Tax | | | 39,485 | | | | — | | | | — | |
| Total Investment Income | | | 546,704 | | | | 43,235 | | | | 775,031 | |
| | | | | | | | | | | | | |
| Expenses: | | | | | | | | | | | | |
| Management Fees† | | | 86,228 | | | | 20,805 | | | | 212,524 | |
| Trustees’ Fees | | | 1,589 | | | | 365 | | | | 3,481 | |
| Insurance Expense | | | 268 | | | | 92 | | | | 542 | |
| Total Expenses | | | 88,085 | | | | 21,262 | | | | 216,547 | |
| Management Fee Waiver† | | | (15,217 | ) | | | (685 | ) | | | — | |
| Reimbursement for Trustees’ Fees† | | | (118 | ) | | | (23 | ) | | | (300 | ) |
| Net Expenses | | | 72,750 | | | | 20,554 | | | | 216,247 | |
| | | | | | | | | | | | | |
| Net Investment Income | | | 473,954 | | | | 22,681 | | | | 558,784 | |
| | | | | | | | | | | | | |
| Net Realized Gain (Loss) on: | | | | | | | | | | | | |
| Investments | | | 17,051 | | | | 54,660 | | | | (3,059,644 | ) |
| Affiliated Investments | | | (4,024 | ) | | | — | | | | — | |
| Foreign Currency Translations | | | (501,734 | ) | | | 4,808 | | | | (20,661 | ) |
| | | | | | | | | | | | | |
| Net Realized Gain (Loss) on Investments, Affiliated Investments and Foreign Currency Translations | | | (488,707 | ) | | | 59,468 | | | | (3,080,305 | ) |
| | | | | | | | | | | | | |
| Net Change in Unrealized Appreciation (Depreciation) on: | | | | | | | | | | | | |
| Investments | | | (333,490 | ) | | | 300,832 | | | | 42,576 | |
| Affiliated Investments | | | (7,986 | ) | | | — | | | | — | |
| Foreign Currency Translations | | | 9,127 | | | | (147 | ) | | | (294 | ) |
| | | | | | | | | | | | | |
| Net Change in Unrealized Appreciation (Depreciation) on Investments, Affiliated Investments and Foreign Currency Translations | | | (332,349 | ) | | | 300,685 | | | | 42,282 | |
| | | | | | | | | | | | | |
| Net Realized and Unrealized Gain (Loss) on Investments, Affiliated Investments and Foreign Currency Translations | | | (821,056 | ) | | | 360,153 | | | | (3,038,023 | ) |
| | | | | | | | | | | | | |
| Net Increase (Decrease) in Net Assets Resulting from Operations | | $ | (347,102 | ) | | $ | 382,834 | | | $ | (2,479,239 | ) |
† See Note 3 in Notes to Financial Statements.
Amounts designated as “—” are $0 or have been rounded to $0
The accompanying notes are an integral part of the financial statements.
Statements of Operations (continued)
For the year ended March 31, 2019
| | | KraneShares
Emerging Markets
Consumer
Technology
Index ETF | | | KraneShares MSCI
China Environment
Index ETF | | | KraneShares
Electric Vehicles
and Future
Mobility
Index ETF | |
| Investment Income: | | | | | | | | | | | | |
| Dividend Income | | $ | 273,841 | | | $ | 168,882 | | | $ | 536,725 | |
| Less: Foreign Taxes Withheld | | | (25,628 | ) | | | (4,354 | ) | | | (39,260 | ) |
| Interest Income | | | 15 | | | | 15 | | | | — | |
| Security Lending Income | | | 11,053 | | | | — | | | | 26,362 | |
| Total Investment Income | | | 259,281 | | | | 164,543 | | | | 523,827 | |
| | | | | | | | | | | | | |
| Expenses: | | | | | | | | | | | | |
| Management Fees† | | | 260,087 | | | | 47,301 | | | | 211,250 | |
| Trustees’ Fees | | | 4,125 | | | | 802 | | | | 4,025 | |
| Security Lending Fees† | | | 1,089 | | | | — | | | | 2,612 | |
| Insurance Expense | | | 67 | | | | 138 | | | | 46 | |
| Total Expenses | | | 265,368 | | | | 48,241 | | | | 217,933 | |
| Reimbursement for Trustees’ Fees† | | | (350 | ) | | | (93 | ) | | | — | |
| Net Expenses | | | 265,018 | | | | 48,148 | | | | 217,933 | |
| | | | | | | | | | | | | |
| Net Investment Income (Loss) | | | (5,737 | ) | | | 116,395 | | | | 305,894 | |
| | | | | | | | | | | | | |
| Net Realized Gain (Loss) on: | | | | | | | | | | | | |
| Investments | | | (4,629,289 | ) | | | (1,570,914 | ) | | | (2,848,745 | ) |
| Foreign Currency Translations | | | (29,306 | ) | | | 194 | | | | (7,015 | ) |
| | | | | | | | | | | | | |
| Net Realized Loss on Investments and Foreign Currency Translations | | | (4,658,595 | ) | | | (1,570,720 | ) | | | (2,855,760 | ) |
| | | | | | | | | | | | | |
| Net Change in Unrealized Appreciation (Depreciation) on: | | | | | | | | | | | | |
| Investments | | | (1,648,124 | ) | | | 441,824 | | | | (996,004 | ) |
| Foreign Currency Translations | | | 1,239 | | | | 21 | | | | (923 | ) |
| | | | | | | | | | | | | |
| Net Change in Unrealized Appreciation (Depreciation) on Investments and Foreign Currency Translations | | | (1,646,885 | ) | | | 441,845 | | | | (996,927 | ) |
| | | | | | | | | | | | | |
| Net Realized and Unrealized Loss on Investments and Foreign Currency Translations | | | (6,305,480 | ) | | | (1,128,875 | ) | | | (3,852,687 | ) |
| | | | | | | | | | | | | |
| Net Decrease in Net Assets Resulting from Operations | | $ | (6,311,217 | ) | | $ | (1,012,480 | ) | | $ | (3,546,793 | ) |
† See Note 3 in Notes to Financial Statements.
Amounts designated as “—” are $0 or have been rounded to $0.
The accompanying notes are an integral part of the financial statements.
Statements of Operations (concluded)
For the year ended March 31, 2019
| | | KraneShares MSCI
All China
Health Care
Index ETF | | | KraneShares CCBS
China Corporate
High Yield Bond
USD Index ETF(1) | | | KraneShares
Emerging Markets
Healthcare
Index ETF(2) | |
| Investment Income: | | | | | | | | | | | | |
| Dividend Income | | $ | 289,098 | | | $ | — | | | $ | 11,590 | |
| Less: Foreign Taxes Withheld | | | (22,671 | ) | | | — | | | | (1,438 | ) |
| Interest Income | | | — | | | | 490,260 | | | | — | |
| Security Lending Income | | | 382 | | | | — | | | | — | |
| Total Investment Income | | | 266,809 | | | | 490,260 | | | | 10,152 | |
| | | | | | | | | | | | | |
| Expenses: | | | | | | | | | | | | |
| Management Fees† | | | 238,335 | | | | 57,272 | | | | 17,385 | |
| Trustees’ Fees | | | 3,863 | | | | 1,169 | | | | 237 | |
| Security Lending Fees† | | | 22 | | | | — | | | | 16 | |
| Insurance Expense | | | 45 | | | | — | | | | — | |
| Total Expenses | | | 242,265 | | | | 58,441 | | | | 17,638 | |
| Net Expenses | | | 242,265 | | | | 58,441 | | | | 17,638 | |
| | | | | | | | | | | | | |
| Net Investment Income (Loss) | | | 24,544 | | | | 431,819 | | | | (7,486 | ) |
| | | | | | | | | | | | | |
| Net Realized Gain (Loss) on: | | | | | | | | | | | | |
| Investments | | | (6,137,215 | ) | | | (12,382 | ) | | | (336,554 | ) |
| Foreign Currency Translations | | | (18,857 | ) | | | — | | | | 8,733 | |
| | | | | | | | | | | | | |
| Net Realized Loss on Investments and Foreign Currency Translations | | | (6,156,072 | ) | | | (12,382 | ) | | | (327,821 | ) |
| | | | | | | | | | | | | |
| Net Change in Unrealized Appreciation (Depreciation) on: | | | | | | | | | | | | |
| Investments | | | (248,776 | ) | | | 238,617 | | | | 105,850 | |
| Foreign Currency Translations | | | (18 | ) | | | — | | | | (8 | ) |
| | | | | | | | | | | | | |
| Net Change in Unrealized Appreciation (Depreciation) on Investments and Foreign Currency Translations | | | (248,794 | ) | | | 238,617 | | | | 105,842 | |
| | | | | | | | | | | | | |
| Net Realized and Unrealized Gain (Loss) on Investments and Foreign Currency Translations | | | (6,404,866 | ) | | | 226,235 | | | | (221,979 | ) |
| | | | | | | | | | | | | |
| Net Increase (Decrease) in Net Assets Resulting from Operations | | $ | (6,380,322 | ) | | $ | 658,054 | | | $ | (229,465 | ) |
† See Note 3 in Notes to Financial Statements.
(1) Commenced operations on June 26, 2018.
(2) Commenced operations on August 29, 2018.
Amounts designated as “—” are $0 or have been rounded to $0.
The accompanying notes are an integral part of the financial statements.
Statements of Changes in Net Assets
| | | KraneShares CICC China Leaders 100
Index ETF | |
| | | Year Ended
March 31, 2019 | | | Year Ended
March 29, 2018^ | |
| Operations: | | | | | | | | |
| Net Investment Income | | $ | 73,945 | | | $ | 32,511 | |
| Net Realized Gain (Loss) on Investments and Foreign Currency Translations | | | (330,149 | ) | | | 1,236,546 | |
| Net Change in Unrealized Appreciation (Depreciation) on Investments | | | 172,753 | | | | (457,296 | ) |
| Net Increase (Decrease) in Net Assets Resulting from Operations | | | (83,451 | ) | | | 811,761 | |
| | | | | | | | | |
| Distributions:(1) | | | (445,172 | ) | | | (1,146,124 | ) |
| | | | | | | | | |
| Capital Share Transactions:(2) | | | | | | | | |
| Issued | | | — | | | | 2,010,914 | |
| Redeemed | | | (1,753,543 | ) | | | — | |
| Increase (Decrease) in Net Assets from Capital Share Transactions | | | (1,753,543 | ) | | | 2,010,914 | |
| | | | | | | | | |
| Total Increase (Decrease) in Net Assets | | | (2,282,166 | ) | | | 1,676,551 | |
| | | | | | | | | |
| Net Assets: | | | | | | | | |
| Beginning of Year | | | 5,082,218 | | | | 3,405,667 | |
| End of Year(3) | | $ | 2,800,052 | | | $ | 5,082,218 | |
| | | | | | | | | |
| Share Transactions: | | | | | | | | |
| Issued | | | — | | | | 50,000 | |
| Redeemed | | | (50,000 | ) | | | — | |
| | | | | | | | | |
| Net Increase (Decrease) in Shares Outstanding from Share Transactions | | | (50,000 | ) | | | 50,000 | |
| ^ | March 29, 2018 represents the last business day of the Fund’s reporting period in 2018. |
| (1) | Current year presentation of distributions conform with S-X Disclosure Simplification. Prior year distributions have been consolidated to conform with S-X Disclosure Simplification (see Note 9). |
| (2) | Includes transaction costs related to creations and redemptions. |
| (3) | Includes distributions in excess of net investment income of $(6,954) in 2018. The SEC eliminated the requirement to disclose undistributed net investment income on November 5, 2018 (see Note 9). |
Amounts designated as “—” are $0 or have been rounded to $0.
The accompanying notes are an integral part of the financial statements.
Statements of Changes in Net Assets(continued)
| | | KraneShares CSI China Internet ETF | |
| | | Year Ended
March 31, 2019 | | | Year Ended
March 29, 2018^ | |
| Operations: | | | | | | | | |
| Net Investment Income (Loss) | | $ | 3,207,090 | | | $ | (3,282,143 | ) |
| Net Realized Gain (Loss) on Investments and Foreign Currency Translations | | | (192,395,663 | ) | | | 116,670,014 | |
| Net Change in Unrealized Appreciation (Depreciation) on Investments and Foreign Currency Translations | | | (63,848,491 | ) | | | 103,487,002 | |
| | | | | | | | | |
| Net Increase (Decrease) in Net Assets Resulting from Operations | | | (253,037,064 | ) | | | 216,874,873 | |
| | | | | | | | | |
| Distributions:(1) | | | (52,775,933 | ) | | | (7,001,175 | ) |
| | | | | | | | | |
| Capital Share Transactions:(2) | | | | | | | | |
| Issued | | | 1,491,668,993 | | | | 1,335,264,104 | |
| Redeemed | | | (739,973,651 | ) | | | (207,772,539 | ) |
| Increase in Net Assets from Capital Share Transactions | | | 751,695,342 | | | | 1,127,491,565 | |
| | | | | | | | | |
| Total Increase in Net Assets | | | 445,882,345 | | | | 1,337,365,263 | |
| | | | | | | | | |
| Net Assets: | | | | | | | | |
| Beginning of Year | | | 1,628,622,239 | | | | 291,256,976 | |
| End of Year(3) | | $ | 2,074,504,584 | | | $ | 1,628,622,239 | |
| | | | | | | | | |
| Share Transactions: | | | | | | | | |
| Issued | | | 32,250,000 | | | | 23,350,000 | |
| Redeemed | | | (14,800,000 | ) | | | (3,600,000 | ) |
| | | | | | | | | |
| Net Increase in Shares Outstanding from Share Transactions | | | 17,450,000 | | | | 19,750,000 | |
| ^ | March 29, 2018 represents the last business day of the Fund’s reporting period in 2018. |
| (1) | Current year presentation of distributions conform with S-X Disclosure Simplification. Prior year distributions have been consolidated to conform with S-X Disclosure Simplification (see Note 9). |
| (2) | Includes transaction costs related to creations and redemptions. |
| (3) | Includes distribution in excess of net investment income of $(11,487,930) in 2018. The SEC eliminated the requirement to disclose undistributed net investment income on November 5, 2018 (see Note 9). |
Amounts designated as “—” are $0 or have been rounded to $0.
The accompanying notes are an integral part of the financial statements.
Statements of Changes in Net Assets(continued)
| | | KraneShares Bosera MSCI China A Share ETF | |
| | | Year Ended
March 31, 2019 | | | Year Ended
March 29, 2018^ | |
| Operations: | | | | | | | | |
| Net Investment Income | | $ | 7,821,817 | | | $ | 1,479,820 | |
| Net Realized Gain (Loss) on Investments and Foreign Currency Translations | | | (36,526,206 | ) | | | 6,492,291 | |
| Net Change in Unrealized Appreciation (Depreciation) on Investments and Foreign Currency Translations | | | (17,097,577 | ) | | | 32,248,698 | |
| | | | | | | | | |
| Net Increase (Decrease) in Net Assets Resulting from Operations | | | (45,801,966 | ) | | | 40,220,809 | |
| | | | | | | | | |
| Distributions:(1) | | | (10,889,028 | ) | | | (2,946,446 | ) |
| | | | | | | | | |
| Capital Share Transactions:(2) | | | | | | | | |
| Issued | | | 542,064,331 | | | | 273,881,297 | |
| Redeemed | | | (234,661,691 | ) | | | (10,325,858 | ) |
| Increase in Net Assets from Capital Share Transactions | | | 307,402,640 | | | | 263,555,439 | |
| | | | | | | | | |
| Total Increase in Net Assets | | | 250,711,646 | | | | 300,829,802 | |
| | | | | | | | | |
| Net Assets: | | | | | | | | |
| Beginning of Year | | | 353,323,587 | | | | 52,493,785 | |
| End of Year(3) | | $ | 604,035,233 | | | $ | 353,323,587 | |
| | | | | | | | | |
| Share Transactions: | | | | | | | | |
| Issued | | | 16,750,000 | | | | 8,700,000 | |
| Redeemed | | | (8,050,000 | ) | | | (300,000 | ) |
| | | | | | | | | |
| Net Increase in Shares Outstanding from Share Transactions | | | 8,700,000 | | | | 8,400,000 | |
| ^ | March 29, 2018 represents the last business day of the Fund’s reporting period in 2018. |
| (1) | Current year presentation of distributions conform with S-X Disclosure Simplification. Prior year distributions have been consolidated to conform with S-X Disclosure Simplification (see Note 9). |
| (2) | Includes transaction costs related to creations and redemptions. |
| (3) | Includes distributions in excess of net investment income of $(6,771) in 2018. The SEC eliminated the requirement to disclose undistributed net investment income on November 5, 2018 (see Note 9). |
Amounts designated as “—” are $0 or have been rounded to $0.
The accompanying notes are an integral part of the financial statements.
Statements of Changes in Net Assets(continued)
| | | KraneShares E Fund China
Commercial Paper ETF | |
| | | Year Ended
March 31,
2019 | | | Year Ended
March 29,
2018^ | |
| Operations: | | | | | | | | |
| Net Investment Income | | $ | 473,954 | | | $ | 355,255 | |
| Net Realized Gain (Loss) on Investments, Affiliated Investments and Foreign Currency Translations | | | (488,707 | ) | | | 466,850 | |
| Net Change in Unrealized Appreciation (Depreciation) on Investments, Affiliated Investments and Foreign Currency Translations | | | (332,349 | ) | | | 652,690 | |
| | | | | | | | | |
| Net Increase (Decrease) in Net Assets Resulting from Operations | | | (347,102 | ) | | | 1,474,795 | |
| | | | | | | | | |
| Distributions:(1) | | | (704,248 | ) | | | — | |
| | | | | | | | | |
| Return of Capital: | | | (28,559 | ) | | | — | |
| Capital Share Transactions:(2) | | | | | | | | |
| Issued | | | 6,871,858 | | | | 1,710,233 | |
| Increase in Net Assets from Capital Share Transactions | | | 6,871,858 | | | | 1,710,233 | |
| | | | | | | | | |
| Total Increase in Net Assets | | | 5,791,949 | | | | 3,185,028 | |
| | | | | | | | | |
| Net Assets: | | | | | | | | |
| Beginning of Year | | | 13,030,283 | | | | 9,845,255 | |
| End of Year(3) | | $ | 18,822,232 | | | $ | 13,030,283 | |
| | | | | | | | | |
| Share Transactions: | | | | | | | | |
| Issued | | | 200,000 | �� | | | 50,000 | |
| | | | | | | | | |
| Net Increase in Shares Outstanding from Share Transactions | | | 200,000 | | | | 50,000 | |
| ^ | March 29, 2018 represents the last business day of the Fund’s reporting period in 2018. |
| (1) | Current year presentation of distributions conform with S-X Disclosure Simplification. Prior year distributions have been consolidated to conform with S-X Disclosure Simplification (see Note 9). |
| (2) | Includes transaction costs related to creations and redemptions. |
| (3) | Includes undistributed net investment income of $324,836 in 2018. The SEC eliminated the requirement to disclose undistributed net investment income on November 5, 2018 (see Note 9). |
Amounts designated as “—” are $0 or have been rounded to $0.
The accompanying notes are an integral part of the financial statements.
Statements of Changes in Net Assets(continued)
| | | KraneShares MSCI All China Index ETF | |
| | | Year Ended
March 31, 2019 | | | Year Ended
March 29, 2018^ | |
| Operations: | | | | | | | | |
| Net Investment Income | | $ | 22,681 | | | $ | 44,815 | |
| Net Realized Gain (Loss) on Investments and Foreign Currency Translations | | | 59,468 | | | | (9,600 | ) |
| Net Change in Unrealized Appreciation (Depreciation) on Investments and Foreign Currency Translations | | | 300,685 | | | | 437,556 | |
| | | | | | | | | |
| Net Increase in Net Assets Resulting from Operations | | | 382,834 | | | | 472,771 | |
| | | | | | | | | |
| Distributions:(1) | | | (43,104 | ) | | | (32,628 | ) |
| | | | | | | | | |
| Capital Share Transactions:(2) | | | | | | | | |
| Issued | | | 3,333,442 | | | | — | |
| Increase in Net Assets from Capital Share Transactions | | | 3,333,442 | | | | — | |
| | | | | | | | | |
| Total Increase in Net Assets | | | 3,673,172 | | | | 440,143 | |
| | | | | | | | | |
| Net Assets: | | | | | | | | |
| Beginning of Year | | | 2,696,469 | | | | 2,256,326 | |
| End of Year(3) | | $ | 6,369,641 | | | $ | 2,696,469 | |
| | | | | | | | | |
| Share Transactions: | | | | | | | | |
| Issued | | | 150,000 | | | | — | |
| | | | | | | | | |
| Net Increase in Shares Outstanding from Share Transactions | | | 150,000 | | | | — | |
| ^ | March 29, 2018 represents the last business day of the Fund’s reporting period in 2018. |
| (1) | Current year presentation of distributions conform with S-X Disclosure Simplification. Prior year distributions have been consolidated to conform with S-X Disclosure Simplification (see Note 9). |
| (2) | Includes transaction costs related to creations and redemptions. |
| (3) | Includes undistributed net investment income of $12,531 in 2018. The SEC eliminated the requirement to disclose undistributed net investment income on November 5, 2018 (see Note 9). |
Amounts designated as “—” are $0 or have been rounded to $0.
The accompanying notes are an integral part of the financial statements.
Statements of Changes in Net Assets(continued)
| | | KraneShares MSCI One Belt One
Road Index ETF | |
| | | Year Ended
March 31, 2019 | | | Period Ended
March 29, 2018(1)^ | |
| Operations: | | | | | | | | |
| Net Investment Income | | $ | 558,784 | | | $ | 40,387 | |
| Net Realized Loss on Investments and Foreign Currency Translations | | | (3,080,305 | ) | | | (5,101 | ) |
| Net Change in Unrealized Appreciation (Depreciation) on Investments and Foreign Currency Translations | | | 42,282 | | | | (1,061,566 | ) |
| | | | | | | | | |
| Net Decrease in Net Assets Resulting from Operations | | | (2,479,239 | ) | | | (1,026,280 | ) |
| | | | | | | | | |
| Distributions:(2) | | | (553,422 | ) | | | (6,687 | ) |
| | | | | | | | | |
| Capital Share Transactions:(3) | | | | | | | | |
| Issued | | | 2,531,004 | | | | 33,080,732 | |
| Redeemed | | | (10,224,309 | ) | | | — | |
| Increase (Decrease) in Net Assets from Capital Share Transactions | | | (7,693,305 | ) | | | 33,080,732 | |
| | | | | | | | | |
| Total Increase (Decrease) in Net Assets | | | (10,725,966 | ) | | | 32,047,765 | |
| | | | | | | | | |
| Net Assets: | | | | | | | | |
| Beginning of Year/Period | | | 32,047,765 | | | | — | |
| End of Year/Period(4) | | $ | 21,321,799 | | | $ | 32,047,765 | |
| | | | | | | | | |
| Share Transactions: | | | | | | | | |
| Issued | | | 100,000 | | | | 1,250,002 | |
| Redeemed | | | (450,000 | ) | | | — | |
| | | | | | | | | |
| Net Increase (Decrease) in Shares Outstanding from Share Transactions | | | (350,000 | ) | | | 1,250,002 | |
| ^ | March 29, 2018 represents the last business day of the Fund’s reporting period in 2018. |
| (1) | Commenced operations on September 7, 2017. |
| (2) | Current year presentation of distributions conform with S-X Disclosure Simplification. Prior year distributions have been consolidated to conform with S-X Disclosure Simplification (see Note 9). |
| (3) | Includes transaction costs related to creations and redemptions. |
| (4) | Includes undistributed net investment income of $25,520 in 2018. The SEC eliminated the requirement to disclose undistributed net investment income on November 5, 2018 (see Note 9). |
Amounts designated as “—” are $0 or have been rounded to $0.
The accompanying notes are an integral part of the financial statements.
Statements of Changes in Net Assets(continued)
| | | KraneShares Emerging Markets
Consumer Technology Index ETF | |
| | | Year Ended
March 31, 2019 | | | Period Ended
March 29, 2018(1)^ | |
| Operations: | | | | | | | | |
| Net Investment Loss | | $ | (5,737 | ) | | $ | (7,348 | ) |
| Net Realized Gain (Loss) on Investments and Foreign Currency Translations | | | (4,658,595 | ) | | | 2,456 | |
| Net Change in Unrealized Appreciation (Depreciation) on Investments and Foreign Currency Translations | | | (1,646,885 | ) | | | (66,112 | ) |
| | | | | | | | | |
| Net Decrease in Net Assets Resulting from Operations | | | (6,311,217 | ) | | | (71,004 | ) |
| | | | | | | | | |
| Capital Share Transactions:(2) | | | | | | | | |
| Issued | | | 31,316,594 | | | | 23,899,284 | |
| Redeemed | | | (20,153,426 | ) | | | — | |
| Increase in Net Assets from Capital Share Transactions | | | 11,163,168 | | | | 23,899,284 | |
| | | | | | | | | |
| Total Increase in Net Assets | | | 4,851,951 | | | | 23,828,280 | |
| | | | | | | | | |
| Net Assets: | | | | | | | | |
| Beginning of Year/Period | | | 23,828,280 | | | | — | |
| End of Year/Period(3) | | $ | 28,680,231 | | | $ | 23,828,280 | |
| | | | | | | | | |
| Share Transactions: | | | | | | | | |
| Issued | | | 1,250,000 | | | | 900,002 | |
| Redeemed | | | (900,000 | ) | | | — | |
| | | | | | | | | |
| Net Increase in Shares Outstanding from Share Transactions | | | 350,000 | | | | 900,002 | |
| ^ | March 29, 2018 represents the last business day of the Fund’s reporting period in 2018. |
| (1) | Commenced operations on October 11, 2017. |
| (2) | Includes transaction costs related to creations and redemptions. |
| (3) | Includes accumulated net investment loss of $(4,566) in 2018. The SEC eliminated the requirement to disclose undistributed net investment income on November 5, 2018 (see Note 9). |
Amounts designated as “—” are $0 or have been rounded to $0.
The accompanying notes are an integral part of the financial statements.
Statements of Changes in Net Assets(continued)
| | | KraneShares MSCI China
Environment Index ETF | |
| | | Year Ended
March 31, 2019 | | | Period Ended
March 29, 2018(1)^ | |
| Operations: | | | | | | | | |
| Net Investment Income (Loss) | | $ | 116,395 | | | $ | (20,699 | ) |
| Net Realized Loss on Investments and Foreign Currency Translations | | | (1,570,720 | ) | | | (214,154 | ) |
| Net Change in Unrealized Appreciation (Depreciation) on Investments and Foreign Currency Translations | | | 441,845 | | | | (159,085 | ) |
| | | | | | | | | |
| Net Decrease in Net Assets Resulting from Operations | | | (1,012,480 | ) | | | (393,938 | ) |
| | | | | | | | | |
| Distributions:(2) | | | (107,314 | ) | | | — | |
| | | | | | | | | |
| Capital Share Transactions:(3) | | | | | | | | |
| Issued | | | 2,265,922 | | | | 8,730,662 | |
| Redeemed | | | (4,248,046 | ) | | | (1,178,371 | ) |
| Increase (Decrease) in Net Assets from Capital Share Transactions | | | (1,982,124 | ) | | | 7,552,291 | |
| | | | | | | | | |
| Total Increase (Decrease) in Net Assets | | | (3,101,918 | ) | | | 7,158,353 | |
| | | | | | | | | |
| Net Assets: | | | | | | | | |
| Beginning of Year/Period | | | 7,158,353 | | | | — | |
| End of Year/Period(4) | | $ | 4,056,435 | | | $ | 7,158,353 | |
| | | | | | | | | |
| Share Transactions: | | | | | | | | |
| Issued | | | 100,000 | | | | 350,002 | |
| Redeemed | | | (200,000 | ) | | | (50,000 | ) |
| | | | | | | | | |
| Net Increase (Decrease) in Shares Outstanding from Share Transactions | | | (100,000 | ) | | | 300,002 | |
| ^ | March 29, 2018 represents the last business day of the Fund’s reporting period in 2018. |
| (1) | Commenced operations on October 12, 2017. |
| (2) | Current year presentation of distributions conform with S-X Disclosure Simplification. Prior year distributions have been consolidated to conform with S-X Disclosure Simplification (see Note 9). |
| (3) | Includes transaction costs related to creations and redemptions. |
| (4) | Includes accumulated net investment loss of $(13,176) in 2018. The SEC eliminated the requirement to disclose undistributed net investment income on November 5, 2018 (see Note 9). |
Amounts designated as “—” are $0 or have been rounded to $0.
The accompanying notes are an integral part of the financial statements.
Statements of Changes in Net Assets(continued)
| | | KraneShares Electric Vehicles and Future
Mobility Index ETF | |
| | | Year Ended
March 31, 2019 | | | Period Ended
March 29, 2018(1)^ | |
| Operations: | | | | | | | | |
| Net Investment Income | | $ | 305,894 | | | $ | 15,786 | |
| Net Realized Loss on Investments and Foreign Currency Translations | | | (2,855,760 | ) | | | (80,579 | ) |
| Net Change in Unrealized Appreciation (Depreciation) on Investments and Foreign Currency Translations | | | (996,927 | ) | | | (1,216,424 | ) |
| | | | | | | | | |
| Net Decrease in Net Assets Resulting from Operations | | | (3,546,793 | ) | | | (1,281,217 | ) |
| | | | | | | | | |
| Distributions:(2) | | | (382,192 | ) | | | — | |
| | | | | | | | | |
| Capital Share Transactions:(3) | | | | | | | | |
| Issued | | | 10,157,198 | | | | 28,078,846 | |
| Increase in Net Assets from Capital Share Transactions | | | 10,157,198 | | | | 28,078,846 | |
| | | | | | | | | |
| Total Increase in Net Assets | | | 6,228,213 | | | | 26,797,629 | |
| | | | | | | | | |
| Net Assets: | | | | | | | | |
| Beginning of Year/Period | | | 26,797,629 | | | | — | |
| End of Year/Period(4) | | $ | 33,025,842 | | | $ | 26,797,629 | |
| | | | | | | | | |
| Share Transactions: | | | | | | | | |
| Issued | | | 450,000 | | | | 1,150,002 | |
| | | | | | | | | |
| Net Increase in Shares Outstanding from Share Transactions | | | 450,000 | | | | 1,150,002 | |
| ^ | March 29, 2018 represents the last business day of the Fund’s reporting period in 2018. |
| (1) | Commenced operations on January 18, 2018. |
| (2) | Current year presentation of distributions conform with S-X Disclosure Simplification. Prior year distributions have been consolidated to conform with S-X Disclosure Simplification (see Note 9). |
| (3) | Includes transaction costs related to creations and redemptions. |
| (4) | Includes undistributed net investment income of $3,098 in 2018. The SEC eliminated the requirement to disclose undistributed net investment income on November 5, 2018 (see Note 9). |
Amounts designated as “—” are $0 or have been rounded to $0.
The accompanying notes are an integral part of the financial statements.
Statements of Changes in Net Assets(continued)
| | | KraneShares MSCI All China
Health Care Index ETF | |
| | | Year Ended
March 31, 2019 | | | Period Ended
March 29, 2018(1)^ | |
| Operations: | | | | | | | | |
| Net Investment Income (Loss) | | $ | 24,544 | | | $ | (3,585 | ) |
| Net Realized Loss on Investments and Foreign Currency Translations | | | (6,156,072 | ) | | | (529 | ) |
| Net Change in Unrealized Appreciation (Depreciation) on Investments and Foreign Currency Translations | | | (248,794 | ) | | | 169,630 | |
| | | | | | | | | |
| Net Increase (Decrease) in Net Assets Resulting from Operations | | | (6,380,322 | ) | | | 165,516 | |
| | | | | | | | | |
| Distributions:(2) | | | (136,712 | ) | | | — | |
| | | | | | | | | |
| Capital Share Transactions:(3) | | | | | | | | |
| Issued | | | 52,247,029 | | | | 3,832,495 | |
| Redeemed | | | (10,724,139 | ) | | | — | |
| Increase in Net Assets from Capital Share Transactions | | | 41,522,890 | | | | 3,832,495 | |
| | | | | | | | | |
| Total Increase in Net Assets | | | 35,005,856 | | | | 3,998,011 | |
| | | | | | | | | |
| Net Assets: | | | | | | | | |
| Beginning of Year/Period | | | 3,998,011 | | | | — | |
| End of Year/Period(4) | | $ | 39,003,867 | | | $ | 3,998,011 | |
| | | | | | | | | |
| Share Transactions: | | | | | | | | |
| Issued | | | 2,150,000 | | | | 150,002 | |
| Redeemed | | | (550,000 | ) | | | — | |
| | | | | | | | | |
| Net Increase in Shares Outstanding from Share Transactions | | | 1,600,000 | | | | 150,002 | |
| ^ | March 29, 2018 represents the last business day of the Fund’s reporting period in 2018. |
| (1) | Commenced operations on January 31, 2018. |
| (2) | Current year presentation of distributions conform with S-X Disclosure Simplification. Prior year distributions have been consolidated to conform with S-X Disclosure Simplification (see Note 9). |
| (3) | Includes transaction costs related to creations and redemptions. |
| (4) | Includes accumulated net investment loss of $(4,114) in 2018. The SEC eliminated the requirement to disclose undistributed net investment income on November 5, 2018 (see Note 9). |
Amounts designated as “—” are $0 or have been rounded to $0.
The accompanying notes are an integral part of the financial statements.
Statements of Changes in Net Assets(concluded)
| | | KraneShares CCBS China Corporate High Yield Bond USD Index ETF | | | KraneShares Emerging Markets Healthcare
Index ETF | |
| | | Period Ended March 31, 2019(1) | | | Period Ended March 31, 2019(2) | |
| Operations: | | | | | | | | |
| Net Investment Income (Loss) | | $ | 431,819 | | | $ | (7,486 | ) |
| Net Realized Loss on Investments and Foreign Currency Translations | | | (12,382 | ) | | | (327,821 | ) |
| Net Change in Unrealized Appreciation (Depreciation) on Investments and Foreign Currency Translations | | | 238,617 | | | | 105,842 | |
| | | | | | | | | |
| Net Increase (Decrease) in Net Assets Resulting from Operations | | | 658,054 | | | | (229,465 | ) |
| | | | | | | | | |
| Distributions:(3) | | | (374,120 | ) | | | (752 | ) |
| | | | | | | | | |
| Return of Capital: | | | (49,368 | ) | | | — | |
| Capital Share Transactions(4) | | | | | | | | |
| Issued | | | 11,985,226 | | | | 5,708,901 | |
| Redeemed | | | — | | | | (1,002,273 | ) |
| Increase in Net Assets from Capital Share Transactions | | | 11,985,226 | | | | 4,706,628 | |
| | | | | | | | | |
| Total Increase in Net Assets | | | 12,219,792 | | | | 4,476,411 | |
| | | | | | | | | |
| Net Assets: | | | | | | | | |
| Beginning of Period | | | — | | | | — | |
| End of Period | | $ | 12,219,792 | | | $ | 4,476,411 | |
| | | | | | | | | |
| Share Transactions: | | | | | | | | |
| Issued | | | 300,001 | | | | 250,002 | |
| Redeemed | | | — | | | | (50,000 | ) |
| | | | | | | | | |
| Net Increase in Shares Outstanding from Share Transactions | | | 300,001 | | | | 200,002 | |
| (1) | Commenced operations on June 26, 2018. |
| (2) | Commenced operations on August 29, 2018. |
| (3) | Includes transaction costs related to creations and redemptions. |
| (4) | Current year presentation of distributions conform with S-X Disclosure Simplification (see Note 9). |
The accompanying notes are an integral part of the financial statements.
(This page intentionally left blank.)
Financial Highlights
Selected Per Share Data & Ratios
For the Years/Periods Ended March 31 (unless otherwise indicated)
For a Share Outstanding Throughout Each Period
| | | Net Asset
Value,
Beginning of
Period
($) | | | Net
Investment
Income
(Loss)
($)* | | | Net Realized
and
Unrealized
Gain
(Loss) on
Investments
($) | | | Total from
Operations
($) | | | Distribution
from Net
Investment
Income
($) | | | Distribution
from Capital
Gains
($) | | | Return of
Capital
($) | |
| KraneShares CICC China Leaders 100 Index ETF(3)# | | | | | | | | |
| 2019 | | | 33.88 | | | | 0.66 | | | | (2.09 | ) | | | (1.43 | ) | | | (0.68 | ) | | | (3.77 | ) | | | — | |
| 2018(1) | | | 34.06 | | | | 0.24 | | | | 7.22 | | | | 7.46 | | | | (0.30 | ) | | | (7.34 | ) | | | — | |
| 2017 | | | 28.02 | | | | 0.21 | | | | 6.54 | | | | 6.75 | | | | (0.33 | ) | | | — | | | | (0.38 | ) |
| 2016 | | | 34.20 | | | | 0.18 | | | | (3.21 | ) | | | (3.03 | ) | | | (0.25 | ) | | | (2.89 | ) | | | (0.01 | ) |
| 2015 | | | 31.42 | | | | 0.12 | | | | 2.97 | | | | 3.09 | | | | (0.31 | ) | | | — | | | | — | |
| KraneShares CSI China Internet ETF | | | | | | | | |
| 2019 | | | 61.11 | | | | 0.10 | | | | (12.90 | ) | | | (12.80 | ) | | | (0.01 | ) | | | (1.26 | ) | | | — | |
| 2018(1) | | | 42.21 | | | | (0.19 | ) | | | 19.43 | | | | 19.24 | | | | (0.34 | ) | | | — | | | | — | |
| 2017 | | | 35.76 | | | | (0.27 | ) | | | 7.13 | | | | 6.86 | | | | (0.30 | ) | | | — | | | | (0.11 | ) |
| 2016 | | | 34.18 | | | | (0.20 | ) | | | 1.84 | | | | 1.64 | | | | (0.06 | ) | | | — | | | | — | (4) |
| 2015 | | | 35.93 | | | | (0.14 | ) | | | (1.32 | ) | | | (1.46 | ) | | | (0.29 | ) | | | — | | | | — | |
| KraneShares Bosera MSCI China A Share ETF | | | | | | | | |
| 2019 | | | 34.47 | | | | 0.60 | | | | (2.27 | ) | | | (1.67 | ) | | | (0.52 | ) | | | (0.40 | ) | | | — | |
| 2018(1) | | | 28.38 | | | | 0.21 | | | | 6.22 | | | | 6.43 | | | | (0.18 | ) | | | (0.16 | ) | | | — | |
| 2017 | | | 30.37 | | | | (0.01 | ) | | | (0.67 | ) | | | (0.68 | ) | | | — | | | | (0.85 | ) | | | (0.46 | ) |
| 2016 | | | 53.55 | | | | 0.62 | | | | (13.67 | ) | | | (13.05 | ) | | | (0.41 | ) | | | (9.72 | ) | | | — | |
| 2015 | | | 28.92 | | | | (0.22 | ) | | | 24.90 | | | | 24.68 | | | | (0.05 | ) | | | — | | | | — | |
| KraneShares E Fund China Commercial Paper ETF | | | | | | | | |
| 2019 | | | 37.23 | | | | 1.31 | | | | (2.29 | ) | | | (0.98 | ) | | | (1.95 | ) | | | — | | | | (0.08 | ) |
| 2018(1) | | | 32.82 | | | | 1.07 | | | | 3.34 | | | | 4.41 | | | | — | | | | — | | | | — | |
| 2017 | | | 34.18 | | | | 0.61 | | | | (1.96 | ) | | | (1.35 | ) | | | — | | | | — | | | | (0.01 | ) |
| 2016 | | | 34.81 | | | | 1.01 | | | | (1.39 | ) | | | (0.38 | ) | | | (0.21 | ) | | | (0.01 | ) | | | (0.03 | ) |
| 2015(2) | | | 35.00 | | | | 0.39 | | | | (0.35 | ) | | | 0.04 | | | | (0.23 | ) | | | — | | | | — | |
| (1) | March 29, 2018 represents the last business day of the Fund’s reporting period in 2018. |
| (2) | The Fund commenced operations on December 2, 2014. |
| (3) | Effective August 1, 2014, the KraneShares CSI China Five Year Plan ETF changed its name to KraneShares CSI New China ETF. Effective June 1, 2016, the KraneShares CSI New China ETF changed its name to KraneShares Zacks New China ETF. Effective November 1, 2018, the KraneShares Zacks New China ETF was renamed the KraneShares CICC China Leaders 100 Index ETF. |
| (4) | Amount was less than $0.01 per share. |
| (5) | Pursuant to an Investment Advisory Agreement between the Trust and the Adviser, the Fund paid the Adviser a fee, calculated daily and paid monthly, at an annual rate of 0.78% of the average daily net assets of the Fund (prior to March 24, 2016, the Fund paid the Adviser at an annual rate of 1.10% of the average daily net assets of the Fund). Effective March 24, 2016, pursuant to the terms of an Expense Limitation Agreement, the Adviser had contractually agreed to reduce its management fee to 0.68% of the Fund’s average daily net assets until July 31, 2017. |
| (6) | As of February 17, 2017, pursuant to the terms of an Expense Limitation Agreement, the Adviser had contractually agreed to waive its management fee by 0.20% of the Fund’s average daily net assets. The contractual fee waiver will remain in effect until October 4, 2019. |
| (7) | As of July 28, 2017, pursuant to the terms of an Expense Limitation Agreement, the Adviser has contractually agreed to reduce its management fee and/or reimburse the Fund in an amount equal to the fees paid by the Fund to counsel to the Independent Trustees of the Trust until July 31, 2018. |
| (8) | Fund received reimbursement from third-party for dilution to shareholders for an accounting error. Absent the reimbursement, total return would have been (4.44)%. |
| (9) | The expenses during the year include a one-time, non-recurring expense. Had this expense not been included, the net and gross expense ratios for the period would have been 0.59% and 0.71%, respectively. |
| (10) | During the year ended March 31, 2019, the Fund participated in securities lending, generating $9,746,130 in security lending income. The expense ratios include $968,632 in security lending fees paid to the Adviser. Had these fees been excluded, the expense ratios would have been 0.69% and 0.70%, respectively. |
The accompanying notes are an integral part of the financial statements.
Total from
Distributions
($) | | | Net Asset
Value, End
of Period
($) | | | Total
Return
(%)** | | | Net Assets
End of Period
($)(000) | | | Ratio of
Expenses to
Average Net
Assets
(%) | | | Ratio of
Expenses
to Average
Net Assets
(Excluding
Waivers)
(%) | | | Ratio of Net
Investment
Income
(Loss) to
Average Net
Assets
(%) | | | Portfolio
Turnover
(%) | |
| | | | | | | | | | | | | | | | | | | | | | | |
| | (4.45 | ) | | | 28.00 | | | | (0.62 | ) | | | 2,800 | | | | 0.70 | | | | 0.70 | | | | 2.21 | | | | 181 | |
| | (7.64 | ) | | | 33.88 | | | | 22.57 | | | | 5,082 | | | | 0.71 | (7) | | | 0.71 | (7) | | | 0.64 | | | | 105 | |
| | (0.71 | ) | | | 34.06 | | | | 24.54 | | | | 3,406 | | | | 0.84 | | | | 0.84 | | | | 0.55 | | | | 86 | |
| | (3.15 | ) | | | 28.02 | | | | (9.71 | ) | | | 2,803 | | | | 0.73 | | | | 0.73 | | | | 0.60 | | | | 575 | |
| | (0.31 | ) | | | 34.20 | | | | 9.92 | | | | 3,421 | | | | 0.71 | | | | 0.71 | | | | 0.37 | | | | 36 | |
| | | | | | | | | | | | | | | | | | | | | | | | | | | | | | | |
| | (1.27 | ) | | | 47.04 | | | | (20.44 | ) | | | 2,074,505 | | | | 0.75 | (10) | | | 0.76 | (10) | | | 0.20 | | | | 70 | |
| | (0.34 | ) | | | 61.11 | | | | 45.62 | | | | 1,628,622 | | | | 0.70 | (7) | | | 0.70 | (7) | | | (0.33 | ) | | | 29 | |
| | (0.41 | ) | | | 42.21 | | | | 19.44 | | | | 291,257 | | | | 0.81 | | | | 0.81 | | | | (0.72 | ) | | | 35 | |
| | (0.06 | ) | | | 35.76 | | | | 4.77 | | | | 194,869 | | | | 0.72 | | | | 0.72 | | | | (0.56 | ) | | | 27 | |
| | (0.29 | ) | | | 34.18 | | | | (4.09 | ) | | | 131,612 | | | | 0.71 | | | | 0.71 | | | | (0.39 | ) | | | 43 | |
| | | | | | | | | | | | | | | | | | | | | | | | | | | | | | | |
| | (0.92 | ) | | | 31.88 | | | | (4.01 | ) | | | 604,035 | | | | 0.60 | | | | 0.80 | | | | 2.05 | | | | 106 | |
| | (0.34 | ) | | | 34.47 | | | | 22.68 | | | | 353,324 | | | | 0.60 | | | | 0.80 | | | | 0.61 | | | | 52 | |
| | (1.31 | ) | | | 28.38 | | | | (2.04 | ) | | | 52,494 | | | | 0.72 | (6) | | | 0.84 | (6) | | | (0.04 | ) | | | 95 | |
| | (10.13 | ) | | | 30.37 | | | | (27.18 | ) | | | 4,555 | | | | 0.93 | (5) | | | 1.18 | (5) | | | 1.18 | | | | 116 | |
| | (0.05 | ) | | | 53.55 | | | | 85.37 | | | | 26,774 | | | | 1.31 | | | | 1.51 | | | | (0.55 | ) | | | 110 | |
| | | | | | | | | | | | | | | | | | | | | | | | | | | | | | | |
| | (2.03 | ) | | | 34.22 | | | | (2.52 | ) | | | 18,822 | | | | 0.58 | ^ | | | 0.70 | ^ | | | 3.76 | ^ | | | — | |
| | — | | | | 37.23 | | | | 13.44 | | | | 13,030 | | | | 0.77 | ^(7)(9) | | | 0.89 | ^(7)(9) | | | 3.10 | ^ | | | — | |
| | (0.01 | ) | | | 32.82 | | | | (3.95 | )(8) | | | 9,845 | | | | 0.95 | ^ | | | 1.07 | ^ | | | 1.84 | ^ | | | — | |
| | (0.25 | ) | | | 34.18 | | | | (1.11 | ) | | | 18,799 | | | | 0.57 | ^ | | | 0.69 | ^ | | | 2.92 | ^ | | | 717 | |
| | (0.23 | ) | | | 34.81 | | | | 0.13 | | | | 8,702 | | | | 0.60 | †^ | | | 0.72 | †^ | | | 3.46 | †^ | | | — | †† |
| * | Per share data calculated using average shares method |
| ** | Total return is based on the change in net asset value of a share during the year or period and assumes reinvestment of dividends and distributions at net asset value. Total return is for the period indicated and periods of less than one year have not been annualized. The return shown does not reflect the deduction of taxes that a shareholder would pay on Fund distributions or the redemption of Fund shares. Excludes effects of standard creation and redemption transaction fees associated with creation units. |
| †† | Portfolio turnover rate is for the period indicated and periods of less than one year have not been annualized. Excludes effect of in-kind transfers. |
| ^ | The ratios of expenses and net investment income/(loss) to Average Net Assets reflect the expenses and net investment income/(loss), respectively, for the year/period as reported in the Statements of Operations and do not reflect the Fund’s proportionate share of the income and expenses of the money market funds. |
| # | After the close of the markets on September 13, 2016, the Fund effected a 2 for 1 share split. Per share data has been adjusted to reflect the share split. |
Amounts designated as “—” are $0 or have been rounded to $0.
The accompanying notes are an integral part of the financial statements.
Financial Highlights(concluded)
Selected Per Share Data & Ratios
For the Years/Periods Ended March 31 (unless otherwise indicated)
For a Share Outstanding Throughout Each Period
| | | Net Asset Value,
Beginning of
Period
($) | | | Net
Investment
Income (Loss)
($)* | | | Net Realized
and Unrealized
Gain (Loss) on
Investments
($) | | | Total from
Operations
($) | | | Distribution
from Net
Investment
Income
($) | | | Distribution
from Capital
Gains
($) | | | Return of
Capital
($) | |
| KraneShares MSCI All China Index ETF | | | | | | | | |
| 2019 | | | 26.96 | | | | 0.18 | | | | (1.23 | ) | | | (1.05 | ) | | | (0.43 | ) | | | — | | | | — | |
| 2018(1) | | | 22.56 | | | | 0.45 | | | | 4.28 | | | | 4.73 | | | | (0.33 | ) | | | — | | | | — | |
| 2017 | | | 21.66 | | | | 0.37 | | | | 1.88 | | | | 2.25 | | | | (0.70 | ) | | | (0.47 | ) | | | (0.18 | ) |
| 2016 | | | 25.63 | | | | 0.29 | | | | (3.86 | ) | | | (3.57 | ) | | | (0.35 | ) | | | (0.05 | ) | | | — | |
| 2015(2) | | | 25.00 | | | | — | | | | 0.63 | | | | 0.63 | | | | — | | | | — | | | | — | |
| KraneShares MSCI One Belt One Road Index ETF | | | | | | | | |
| 2019 | | | 25.64 | | | | 0.48 | | | | (1.82 | ) | | | (1.34 | ) | | | (0.61 | ) | | | — | | | | — | |
| 2018(1)(3) | | | 25.00 | | | | 0.08 | | | | 0.59 | ^ | | | 0.67 | | | | (0.03 | ) | | | — | | | | — | |
| KraneShares Emerging Markets Consumer Technology Index ETF | | | | | | | | |
| 2019 | | | 26.48 | | | | (0.00 | ) | | | (3.54 | ) | | | (3.54 | ) | | | — | | | | — | | | | — | |
| 2018(1)(4) | | | 25.00 | | | | (0.03 | ) | | | 1.51 | ^ | | | 1.48 | | | | — | | | | — | | | | — | |
| KraneShares MSCI China Environment Index ETF | | | | | | | | |
| 2019 | | | 23.86 | | | | 0.39 | | | | (3.61 | ) | | | (3.22 | ) | | | (0.36 | ) | | | — | | | | — | |
| 2018(1)(5) | | | 25.00 | | | | (0.09 | ) | | | (1.05 | ) | | | (1.14 | ) | | | — | | | | — | | | | — | |
| KraneShares Electric Vehicles and Future Mobility Index ETF | | | | | | | | |
| 2019 | | | 23.30 | | | | 0.21 | | | | (2.62 | ) | | | (2.41 | ) | | | (0.25 | ) | | | — | | | | — | |
| 2018(1)(6) | | | 25.00 | | | | 0.02 | | | | (1.72 | ) | | | (1.70 | ) | | | — | | | | — | | | | — | |
| KraneShares MSCI All China Health Care Index ETF | | | | | | | | |
| 2019 | | | 26.65 | | | | 0.02 | | | | (4.30 | ) | | | (4.28 | ) | | | (0.04 | ) | | | (0.04 | ) | | | — | |
| 2018(1)(7) | | | 25.00 | | | | (0.03 | ) | | | 1.68 | | | | 1.65 | | | | — | | | | — | | | | — | |
| KraneShares CCBS China Corporate High Yield Bond USD Index ETF | | | | | | | | |
| 2019(8) | | | 40.00 | | | | 1.55 | | | | 0.67 | | | | 2.22 | | | | (1.31 | ) | | | — | # | | | (0.18 | ) |
| KraneShares Emerging Markets Healthcare Index ETF | | | | | | | | |
| 2019(9) | | | 25.00 | | | | (0.04 | ) | | | (2.58 | ) | | | (2.62 | ) | | | — | # | | | — | | | | — | |
| (1) | March 29, 2018 represents the last business day of the Fund’s reporting period in 2018. |
| (2) | The Fund commenced operations on February 12, 2015. |
| (3) | The Fund commenced operations on September 7, 2017. |
| (4) | The Fund commenced operations on October 11, 2017. |
| (5) | The Fund commenced operations on October 12, 2017. |
| (6) | The Fund commenced operations on January 18, 2018. |
| (7) | The Fund commenced operations on January 31, 2018. |
| (8) | The Fund commenced operations on June 26, 2018. |
| (9) | The Fund commenced operations on August 29, 2018. |
| (10) | As of July 28, 2017, pursuant to the terms of an Expense Limitation Agreement, the Adviser has contractually agreed to reduce its management fee and/or reimburse the Fund in an amount equal to the fees paid by the Fund to counsel to the Independent Trustees of the Trust until July 31, 2018. |
| (11) | The expense ratio includes interest expense. Had this expense been excluded, the ratios would have been 0.78%, 0.79% and 0.53%, respectively. |
| (12) | The expense ratio includes interest expense. Had this expense been excluded, the ratios would have been 0.78%, 0.78% and (0.22)%, respectively. |
| (13) | The expense ratio includes interest expense. Had this expense been excluded, the ratios would have been 0.78%, 0.79% and (0.78)%, respectively. |
| (14) | The expense ratio includes interest expense. Had this expense been excluded, the ratios would have been 0.69%, 0.69% and 0.44%, respectively. |
| (15) | The expense ratio includes interest expense. Had this expense been excluded, the ratios would have been 0.79%, 0.79% and (0.79)%, respectively. |
The accompanying notes are an integral part of the financial statements.
Total from
Distributions
($) | | | Net Asset
Value, End
of Period
($) | | | Total
Return
(%)** | | | Net Assets
End of
Period ($)
(000) | | | Ratio of
Expenses to
Average Net
Assets
(%) | | | Ratio of
Expenses to
Average Net
Assets (Excluding
Waivers)
(%) | | | Ratio of Net
Investment
Income (Loss)
to Average
Net Assets
(%) | | | Portfolio
Turnover
(%) | |
| | | | | | | | | | | | | | | | | | | | | | | |
| | (0.43 | ) | | | 25.48 | | | | (3.52 | ) | | | 6,370 | | | | 0.67 | | | | 0.69 | | | | 0.74 | | | | 62 | |
| | (0.33 | ) | | | 26.96 | | | | 20.99 | | | | 2,696 | | | | 0.63 | ‡‡(10) | | | 0.72 | ‡‡(10) | | | 1.75 | ‡‡ | | | 3 | |
| | (1.35 | ) | | | 22.56 | | | | 11.24 | | | | 2,256 | | | | 0.37 | ‡‡ | | | 0.73 | ‡‡ | | | 1.70 | ‡‡ | | | 25 | |
| | (0.40 | ) | | | 21.66 | | | | (14.00 | ) | | | 2,166 | | | | 0.91 | ‡ | | | 1.12 | ‡ | | | 1.27 | ‡ | | | 1 | |
| | — | | | | 25.63 | | | | 2.52 | | | | 2,563 | | | | 0.88 | †‡ | | | 0.88 | †‡ | | | (0.07 | )†‡ | | | 8 | †† |
| | | | | | | | | | | | | | | | | | | | | | | | | | | | | | | |
| | (0.61 | ) | | | 23.69 | | | | (4.94 | ) | | | 21,322 | | | | 0.79 | | | | 0.79 | | | | 2.05 | | | | 72 | |
| | (0.03 | ) | | | 25.64 | | | | 2.67 | | | | 32,048 | | | | 0.79 | †‡‡(10)(11) | | | 0.80 | †‡‡(10)(11) | | | 0.52 | †(11) | | | 1 | †† |
| | | | | | | | | | | | | | | | | | | | | | | | | | | | | | | |
| | — | | | | 22.94 | | | | (13.37 | ) | | | 28,680 | | | | 0.80 | | | | 0.80 | | | | (0.02 | ) | | | 119 | |
| | — | | | | 26.48 | | | | 5.92 | | | | 23,828 | | | | 0.79 | †(10)(12) | | | 0.79 | †(10)(12) | | | (0.23 | )†(12) | | | — | †† |
| | | | | | | | | | | | | | | | | | | | | | | | | | | | | | | |
| | (0.36 | ) | | | 20.28 | | | | (13.28 | ) | | | 4,056 | | | | 0.79 | | | | 0.80 | | | | 1.92 | | | | 147 | |
| | — | | | | 23.86 | | | | (4.56 | ) | | | 7,158 | | | | 0.78 | †(10)(13) | | | 0.79 | †(10)(13) | | | (0.78 | )†(13) | | | 36 | †† |
| | | | | | | | | | | | | | | | | | | | | | | | | | | | | | | |
| | (0.25 | ) | | | 20.64 | | | | (10.19 | ) | | | 33,026 | | | | 0.70 | | | | 0.70 | | | | 0.98 | | | | 74 | |
| | — | | | | 23.30 | | | | (6.80 | ) | | | 26,798 | | | | 0.70 | †(14) | | | 0.70 | †(14) | | | 0.43 | †(14) | | | 18 | †† |
| | | | | | | | | | | | | | | | | | | | | | | | | | | | | | | |
| | (0.08 | ) | | | 22.29 | | | | (15.99 | ) | | | 39,004 | | | | 0.79 | | | | 0.79 | | | | 0.08 | | | | 71 | |
| | — | | | | 26.65 | | | | 6.60 | | | | 3,998 | | | | 0.82 | †(15) | | | 0.82 | †(15) | | | (0.82 | )†(15) | | | — | †† |
| | | | | | | | | | | | | | | | | | | | | | | | | | | | | | | |
| | (1.49 | ) | | | 40.73 | | | | 5.72 | | | | 12,220 | | | | 0.69 | † | | | 0.69 | † | | | 5.13 | † | | | 38 | †† |
| | | | | | | | | | | | | | | | | | | | | | | | | | | | | | | |
| | — | | | | 22.38 | | | | (10.47 | ) | | | 4,476 | | | | 0.79 | † | | | 0.79 | † | | | (0.34 | )† | | | 57 | †† |
| * | Per share data calculated using average shares method. |
| ** | Total return is based on the change in net asset value of a share during the year or period and assumes reinvestment of dividends and distributions at net asset value. Total return is for the period indicated and periods of less than one year have not been annualized. The return shown does not reflect the deduction of taxes that a shareholder would pay on Fund distributions or the redemption of Fund shares. Excludes effects of standard creation and redemption transaction fees associated with creation units. |
| # | Amount was less than $0.01 per share. |
| ^ | Realized and unrealized gains and losses per share are balancing amounts necessary to reconcile the change in net asset value per share for the period, and may not reconcile with the aggregate gains and losses in the Statement of Operations due to share transactions for the period. |
| †† | Portfolio turnover rate is for the period indicated and periods of less than one year have not been annualized. Excludes effect of in-kind transfers. |
| ‡ | The ratios of expenses and net investment income/(loss) to Average Net Assets reflect the expenses and net investment income/(loss), respectively, for the year/period as reported in the Statements of Operations and do not reflect the Fund’s proportionate share of the income and expenses from investments in other investment companies, except for investments in the KraneShares Bosera MSCI China A Share ETF. |
| ‡‡ | The ratios of expenses and net investment income/(loss) to Average Net Assets reflect the expenses and net investment income/(loss), respectively, for the year/period as reported in the Statements of Operations and do not reflect the Fund’s proportionate share of the income and expenses from investments in other investment companies. |
Amounts designated as “—” are $0 or have been rounded to $0.
The accompanying notes are an integral part of the financial statements.
Notes to Financial Statements
1. ORGANIZATION
KraneShares Trust (the “Trust”) is a Delaware Statutory Trust formed on February 3, 2012. The Trust is registered under the Investment Company Act of 1940, as amended, as an open-end management investment company. As of March 31, 2019, the Trust had twelve operational series. The financial statements herein and the related notes pertain to the KraneShares CICC China Leaders 100 Index ETF (formerly, KraneShares Zacks New China ETF), KraneShares CSI China Internet ETF, KraneShares Bosera MSCI China A Share ETF, KraneShares E Fund China Commercial Paper ETF, KraneShares MSCI All China Index ETF (formerly, KraneShares FTSE Emerging Markets Plus ETF), KraneShares MSCI One Belt One Road Index ETF, KraneShares Emerging Markets Consumer Technology Index ETF, KraneShares MSCI China Environment Index ETF, KraneShares Electric Vehicles and Future Mobility Index ETF, KraneShares MSCI All China Health Care Index ETF, KraneShares CCBS China Corporate High Yield Bond USD Index ETF and KraneShares Emerging Markets Healthcare Index ETF (each, a “Fund” and collectively, the “Funds”). KraneShares Bosera MSCI China A Share ETF and KraneShares MSCI All China Index ETF are diversified Funds, as defined under Section 5(b)(1) of the Investment Company Act of 1940; while the KraneShares CICC China Leaders 100 Index ETF, KraneShares CSI China Internet ETF, KraneShares E Fund China Commercial Paper ETF, KraneShares MSCI One Belt One Road Index ETF, KraneShares Emerging Markets Consumer Technology Index ETF, KraneShares MSCI China Environment Index ETF, KraneShares Electric Vehicles and Future Mobility Index ETF, KraneShares MSCI All China Health Care Index ETF, KraneShares CCBS China Corporate High Yield Bond USD Index ETF and KraneShares Emerging Markets Healthcare Index ETF are non-diversified Funds. Krane Funds Advisors, LLC (“Krane” or the ‘‘Adviser’’), a Delaware limited liability company, serves as the investment adviser for the Funds and is subject to the supervision of the Board of Trustees (the ‘‘Board’’). The Adviser is responsible for managing the investment activities of the Funds, the Funds’ business affairs and other administrative matters. The Adviser may use sub-advisers (each, a “Sub-Adviser” or collectively, the “Sub-Advisers”) to perform the day-to-day management of the Funds.
China International Capital Corporation (USA) Holdings Inc., a wholly-owned, indirect subsidiary of China International Capital Corporation Limited owns a majority stake in Krane. Central Huijin Investment Limited, a mainland Chinese-domiciled entity, currently holds approximately 46.2% of the shares of China International Capital Corporation Limited. Central Huijin Investment Limited is a wholly-owned subsidiary of China Investment Corporation, which is a mainland Chinese sovereign wealth fund. KFA One Holdings, LLC, located at 1270 Avenue of the Americas, 22nd Floor, New York, NY 10020, holds the remaining equity interests in Krane and Jonathan Krane, through his equity interests in KFA One Holdings, LLC, beneficially owns more than 10% of the equity interests in Krane.
Shares of the Funds are listed and traded on the NYSE Arca, Inc. (“NYSE Arca”), (the “Exchange”). Market prices for Fund shares (“Shares”) may be different from their net asset value (“NAV”). The Funds issue and redeem Shares on a continuous basis at NAV only in large blocks of Shares, typically 50,000 Shares or multiples thereof, called “Creation Units”. This does not mean, however, that individual investors will be able to redeem and purchase Shares directly with the series of the Trust. Only Authorized Participants can redeem and purchase Creation Units of Shares directly. Each Fund will issue and redeem Shares for a basket of securities and/or a balancing cash amount. Individual shares trade in the secondary market at market prices that change throughout the day.
Notes to Financial Statements(continued)
The investment objective of each Fund is to seek investment results that generally correspond (before fees and expenses) to its respective index listed below (each, an “Underlying Index”):
| KraneShares Funds | | Index |
| KraneShares CICC China Leaders 100 Index ETF | | CSI CICC Select 100 Index |
| KraneShares CSI China Internet ETF | | CSI Overseas China Internet Index |
| KraneShares Bosera MSCI China A Share ETF | | MSCI China A Inclusion Index |
| KraneShares E Fund China Commercial Paper ETF | | CSI Diversified High Grade Commercial Paper Index |
| KraneShares MSCI All China Index ETF | | MSCI China All Shares Index |
| KraneShares MSCI One Belt One Road Index ETF | | MSCI Global China Infrastructure Exposure Index |
| KraneShares Emerging Markets Consumer Technology Index ETF | | Solactive Emerging Market Consumer Technology Index |
| KraneShares MSCI China Environment Index ETF | | MSCI China IMI Environment 10/40 Index |
| KraneShares Electric Vehicles and Future Mobility Index ETF | | Solactive Electric Vehicles and Future Mobility Index |
| KraneShares MSCI All China Health Care Index ETF | | MSCI China All Shares Health Care 10/40 Index |
| KraneShares CCBS China Corporate High Yield Bond USD Index ETF | | Solactive USD China Corporate High Yield Bond Index |
| KraneShares Emerging Markets Healthcare Index ETF | | Solactive Emerging Markets Healthcare Index |
2. SIGNIFICANT ACCOUNTING POLICIES
The following is a summary of the significant accounting policies followed by the Funds. The Funds are investment companies that apply the accounting and reporting guidance issued in Topic 946 by the U.S. Financial Accounting Standards Board (FASB”).
USE OF ESTIMATES — The preparation of financial statements in conformity with U.S. generally accepted accounting principles (“U.S. GAAP”) requires management to make estimates and assumptions that affect the reported amounts of assets and liabilities and disclosure of contingent assets and liabilities at the date of the financial statements and the reported amounts of increases and decreases in net assets from operations during the reporting period. Actual results could differ from those estimates, and could have a material impact to the Funds.
SECURITY VALUATION — The NAV per share of each Fund is computed by dividing the value of the net assets of a Fund (i.e., the value of its total assets less total liabilities and withholdings) by the total number of shares of a Fund outstanding, rounded to the nearest cent. Expenses and fees, including without limitation, the management, administration and distribution fees, are accrued daily and taken into account for purposes of determining NAV. The NAV per share for each Fund normally is calculated by the Administrator and determined as of the regularly scheduled close of the regular trading session on the NYSE (ordinarily 4:00 p.m., Eastern Time) on each day that the Exchange is open.
In calculating the values of each Fund’s portfolio securities, securities listed on a securities exchange, market or automated quotation system for which quotations are readily available (except for securities traded on NASDAQ), including securities traded over the counter, are valued at the last reported sale price on the primary exchange or market (foreign or domestic) on which they are traded (or at the time as of which the Fund’s NAV is calculated if a security’s exchange is normally open at that time). If there is no such reported sale, such securities are valued at the most recently reported bid price. For securities traded on NASDAQ, the NASDAQ Official Closing Price will be used. If available, debt securities are priced based upon valuations provided by independent, third-party pricing agents. Such values generally reflect the last reported sales price if the security is actively traded. The third-party pricing agents may also value debt securities at an evaluated bid price by employing methodologies
Notes to Financial Statements(continued)
that utilize actual market transactions, broker-supplied valuations, or other methodologies designed to identify the market value for such securities. Debt obligations with remaining maturities of sixty days or less may be valued at their amortized cost, which approximates market value. The prices for foreign securities are reported in local currency and converted to U.S. dollars using currency exchange rates. The value of a swap contract is equal to the obligation (or rights) under the swap contract, which will generally be equal to the net amounts to be paid or received under the contract based upon the relative values of the positions held by each party to the contract as determined by the applicable independent, third party pricing agent. Exchange-traded options are valued at the last reported sales price on the exchange on which they are listed. If there is no such reported sale on the valuation date, long positions are valued at the most recent bid price, and short positions are valued at the most recent ask price. Futures are valued at the settlement price established by the board of trade on which they are traded. Foreign currency forward contracts are valued at the current day’s interpolated foreign exchange rate, as calculated using the current day’s spot rate and the 30-, 60-, 90- and 180-day forward rates provided by an independent pricing agent. The exchange rates used for valuation are captured as of the close of the London Stock Exchange each day normally at 4:00 p.m. Greenwich Mean Time. Prices for most securities held by a Fund are provided daily by independent pricing agents. If a security price cannot be obtained from an independent, third-party pricing agent, the Fund seeks to obtain bid and ask prices from two broker-dealers who make a market in the portfolio instrument and determines the average of the two. As of and during the year ended March 31, 2019, the Funds did not hold options, swaps and futures.
Investments in open-end investment companies that do not trade on an exchange are valued at the end of day NAV per share. Investments in open-end investment companies that trade on an exchange are valued at the last reported sale price or official closing price as of the close of the customary trading session on the exchange where the security is principally traded. If there is no such reported sale, such securities are valued at the most recently reported bid price.
Securities for which market prices are not ‘‘readily available,’’ or are not deemed to reflect current market values, or are debt securities where no evaluated price is available from the Trust’s third-party pricing agents pursuant to established methodologies, are fair valued in accordance with the Trust’s valuation policies and procedures approved by the Board of Trustees. Some of the more common reasons that may necessitate that a security be valued using ‘‘fair value’’ pricing may include, but are not limited to: the security’s trading has been halted or suspended; the security’s primary trading market is temporarily closed; or the security has not been traded for an extended period of time. A Fund may fair value certain of the foreign securities held by the Fund each day the Fund calculates its NAV.
In addition, a Fund may fair value its securities if an event that may materially affect the value of the Fund’s securities that trade outside of the United States (a ‘‘Significant Event’’) has occurred between the time of the security’s last close and the time that the Fund calculates its NAV. A Significant Event may relate to a single issuer or to an entire market sector, country or region. Events that may be Significant Events may include: government actions, natural disasters, armed conflict, acts of terrorism and significant market fluctuations. If Krane becomes aware of a Significant Event that has occurred with respect to a portfolio instrument or group of portfolio instruments after the closing of the exchange or market on which the portfolio instrument or portfolio instruments principally trade, but before the time at which a Fund calculates its NAV, it will notify the Administrator and may request that an ad hoc meeting of the Fair Valuation Committee be called.
Notes to Financial Statements(continued)
With respect to trade-halted securities, the Trust typically will fair value a trade-halted security by adjusting the security’s last market close price by the security’s sector performance, as measured by a predetermined index, unless Krane recommends and the Trust’s Fair Valuation Committee determines to make additional adjustments. Certain foreign securities exchanges have mechanisms in place that confine one day’s price movement in an individual security to a pre-determined price range based on that day’s opening price (‘‘Collared Securities’’). Fair value determinations for Collared Securities will generally be capped based on any applicable pre-determined ‘‘limit down’’ or ‘‘limit up’’ prices established by the relevant foreign securities exchange. As an example, China A-Shares can only be plus or minus ten percent in one day of trading in the relevant mainland China equity market. As a result, the fair value price determination on a given day will generally be capped plus or minus ten percent.
Fair value pricing involves subjective judgments and it is possible that a fair value determination for a security is materially different than the value that could actually be realized upon the sale of the security or that another fund that uses market quotations or its own fair value procedures to price the same securities. In addition, fair value pricing could result in a difference between the prices used to calculate a Fund’s NAV and the prices used by the Underlying Index. This may adversely affect a Fund’s ability to track the Underlying Index.
Trading in securities on many foreign exchanges is normally completed before the close of business on each Business Day. In addition, securities trading in a particular country or countries may not take place on each Business Day or may take place on days that are not Business Days. Changes in valuations on certain securities may occur at times or on days on which a Fund’s NAV is not calculated and on which Fund shares do not trade and sales and redemptions of shares do not occur. As a result, the value of a Fund’s portfolio securities and the net asset value of its shares may change on days when you will not be able to purchase or sell your shares. Fund shares are purchased or sold on a national securities exchange at market prices, which may be higher or lower than NAV. No secondary sales will be made to brokers or dealers at a concession by the Distributor or by a Fund. Purchases and sales of shares in the secondary market, which will not involve a Fund, will be subject to customary brokerage commissions and charges. Transactions in Fund shares will be priced at NAV only if you purchase or redeem shares directly from a Fund in Creation Units.
As of March 31, 2019, the total market value of securities valued in accordance with Fair Value Procedures is as follows:
| KraneShares Funds | | Fair Valued
Amount | | | % of
Net Assets | |
| KraneShares CICC China Leaders 100 Index ETF | | $ | 83 | | | | 0.0% | |
| KraneShares Bosera MSCI China A Share ETF | | | 0 | | | | 0.0% | |
| KraneShares MSCI All China Index ETF | | | 6 | | | | 0.0% | |
| KraneShares MSCI One Belt One Road Index ETF | | | 293,832 | | | | 1.4% | |
In accordance with the authoritative guidance on fair value measurements and disclosure under U.S. GAAP, the Funds disclose the fair value of their investments in a hierarchy that prioritizes the inputs to valuation techniques used to measure the fair value. The objective of a fair value measurement is to determine the price that would be received to sell an asset or paid to transfer a liability in an orderly transaction between market participants at the measurement date (an exit price). Accordingly, the fair value hierarchy gives the highest priority to quoted prices (unadjusted)
Notes to Financial Statements(continued)
in active markets for identical assets or liabilities (Level 1) and the lowest priority to unobservable inputs (Level 3). The three levels of the fair value hierarchy are described below:
Level 1 — Unadjusted quoted prices in active markets for identical, unrestricted assets or liabilities that the Funds have the ability to access at the measurement date.
Level 2 — Other significant observable inputs (including quoted prices in non-active markets, quoted prices for similar investments, fair value of investments for which the Funds have the ability to fully redeem tranches at net asset value as of the measurement date or within the near term, and short-term investments valued at amortized cost).
Level 3 — Significant unobservable inputs (including the Funds’ own assumptions in determining the fair value of investments, broker quotes, fair value of investments for which the Funds do not have the ability to fully redeem tranches at net asset value as of the measurement date or within the near term).
Investments are classified within the level of the lowest significant input considered in determining fair value. Investments classified within Level 3 whose fair value measurement considers several inputs may include Level 1 or Level 2 inputs as components of the overall fair value measurement. For details of the investment classification, refer to each Fund’s Schedule of Investments.
The valuation techniques and significant amounts of unobservable inputs used in the fair valuation measurement of the Fund’s Level 3 securities are outlined in the table below. A significant increase or decrease in any of those inputs in isolation would result in a significantly higher or lower fair value measurement.
KraneShares MSCI One Belt One Road Index ETF
| | | Quantitative information about Level 3 fair value measurements | |
| Assets | | Fair Value at
3/31/19 | | | Valuation
Technique(s) | | Unobservable
Input | | Discount
Percentage | |
| Common Stock | | $ | 293,832 | | | Discount from the Last Traded Price | | Last Traded Price Comparability Adjustment % | | | 0.0% | |
FEDERAL INCOME TAXES — It is each Fund’s intention to qualify or continue to qualify as a regulated investment company for federal income tax purposes by complying with the appropriate provisions of Subchapter M of the Internal Revenue Code of 1986, as amended, and to distribute annually all or substantially all of its taxable income and gains to shareholders. Accordingly, no provisions for federal income taxes have been made in the financial statements.
The Funds evaluate tax positions taken or expected to be taken in the course of preparing the Funds’ tax returns to determine whether it is “more-likely-than-not” (i.e., greater than 50 percent) that each tax position will be sustained upon examination by a taxing authority based on the technical merits of the position. Tax positions not deemed to meet the more-likely-than-not threshold are recorded as a tax benefit or expense in the current year. The Funds did not record any tax provisions in the current period. However, management’s conclusions regarding tax positions may be subject to review and adjustment at a later date based on factors including, but not limited to, examination by tax authorities (i.e., the last three tax year ends, as applicable), on-going analysis of and changes to tax laws, regulations and interpretations thereof.
Notes to Financial Statements(continued)
As of March 31, 2019, management of the Funds has reviewed all open tax years since inception and concluded that there is no tax liability resulting from unrecognized tax benefits relating to uncertain income tax positions taken or expected to be taken in future tax returns. The Funds are also not aware of any tax positions for which it is reasonably possible that the total amounts of unrecognized tax benefits will significantly change in the next 12 months.
SECURITY TRANSACTIONS AND INVESTMENT INCOME — Security transactions are accounted for on the trade date for financial reporting purposes. Costs used in determining realized gains and losses on the sale of investment securities are based on specific identification. Dividend income is recorded, net of any applicable withholding tax, on the ex-dividend date, or for certain foreign securities, when the information becomes available to the Funds. Interest income is recognized on the accrual basis from the settlement date.
Dividend income received from affiliated funds is recognized on the ex-dividend date and is recorded as income distributions in the Statement of Operations. Capital gain distributions received from affiliated funds are recognized on ex-dividend date and are recorded on the Statement of Operations as such. Costs used in determining realized gains and losses on the sales of affiliated funds are on the basis of specific identification. See details on the Statements of Operations.
FOREIGN CURRENCY — The books and records of the Funds are maintained in U.S. dollars. Investment securities and other assets and liabilities denominated in a foreign currency are translated into U.S. dollars on the date of valuation. Purchases and sales of investment securities, income and expenses are translated into U.S. dollars at the relevant rates of exchange prevailing on the respective dates of such transactions. The Funds do not isolate that portion of realized or unrealized gains and losses resulting from changes in the foreign exchange rate from fluctuations arising from changes in the market prices of the securities. These gains and losses are included in net realized and unrealized gains and losses on foreign currency translations on the Statements of Operations. Net realized and unrealized gains and losses on foreign currency transactions and translations represent net foreign exchange gains or losses from foreign currency exchange contracts, disposition of foreign currencies, currency gains or losses realized between trade and settlement dates on securities transactions and the difference between the amount of the investment income and foreign withholding taxes recorded on the Funds’ books and the U.S. dollar equivalent amounts actually received or paid.
DIVIDENDS AND DISTRIBUTIONS TO SHAREHOLDERS — The Funds distribute their net investment income at least annually. Any net realized capital gains are distributed annually. All distributions are recorded on the ex-dividend date.
CASH OVERDRAFT CHARGES — Per the terms of an agreement with Brown Brothers Harriman & Co. (“BBH”), the Funds’ Custodian, if a Fund has a cash overdraft on a given day, it will be assessed an overdraft charge of LIBOR plus 2.00%. Cash overdraft charges are included in “Interest Expense” on the Statements of Operations.
SECURITIES LENDING — The Funds may lend securities from their portfolios to brokers, dealers and other financial institutions. In connection with such loans, a Fund remains the beneficial owner of the loaned securities and continues to receive payments in amounts approximately equal to the interest, dividends or other distributions payable on the loaned securities. A Fund also has the right to terminate a loan at any time. A Fund does not have the right to vote on securities while they are on loan. Loans of portfolio securities will not exceed 33 1/3% of the value of a Fund’s total assets (including the value of all assets received as collateral for the loan). The Funds’ secured borrowings under the securities
Notes to Financial Statements(continued)
lending agreements have contractual maturities on an overnight and continuous basis. A Fund will receive collateral consisting of cash in the form of U.S. dollars, foreign currency, or securities issued or fully guaranteed by the U.S. Government which will be maintained at all times in an amount equal to at least 102% on domestic securities and 105% on international securities of the current market value of the loaned securities. If the collateral consists of cash, a Fund will reinvest the cash and pay the borrower a pre-negotiated fee or “rebate” from any return earned on the investment. Should the borrower of the securities fail financially, a Fund may experience delays in recovering the loaned securities or exercising its rights in the collateral. In a loan transaction, a Fund will also bear the risk of any decline in value of securities acquired with cash collateral. Krane and a sub-adviser are subject to potential conflicts of interest because the compensation paid to them increases in connection with any net income received by a Fund from a securities lending program. Each Fund pays Krane 10% of any net monthly income received from the investment of cash collateral and loan fees received from borrowers in respect of each securities loan (net of any amounts paid to the custodian and/or securities lending agent or rebated to borrowers) (see Note 3).
The following table discloses the securities on loan as of March 31, 2019:
| KraneShares Funds | | Market Value of
Securities on
Loan | | | Cash Collateral for
Securities on Loan | |
| KraneShares CSI China Internet ETF | | $ | 452,716,688 | | | $ | 468,400,662 | |
| KraneShares Emerging Markets Consumer Technology Index ETF | | | 1,277,165 | | | | 1,323,063 | |
| KraneShares Electric Vehicles and Future Mobility Index ETF | | | 1,354,696 | | | | 1,404,802 | |
CREATION UNITS — The Funds issue and redeem Shares at NAV and only in large blocks of Shares (each block of Shares for a Fund is a Creation Unit of 50,000 Shares, or multiples thereof).
Except when aggregated in Creation Units, Shares are not redeemable securities of a Fund. Shares of a Fund may only be purchased or redeemed by certain Authorized Participants. An Authorized Participant is either (i) a broker-dealer or other participant in the clearing process through the Continuous Net Settlement System of the National Securities Clearing Corporation or (ii) a Depository Trust Company (‘‘DTC’’) participant and, in each case, must have executed a Participant Agreement with the Distributor. Most retail investors will not qualify as Authorized Participants or have the resources to buy and sell whole Creation Units. Therefore, they will be unable to purchase or redeem the Shares directly from a Fund. Rather, most retail investors will purchase Shares in the secondary market with the assistance of a broker and will be subject to customary brokerage commissions or fees when buying or selling Shares. If a Creation Unit is purchased or redeemed for cash, a higher transaction fee will be charged.
Notes to Financial Statements(continued)
The following table discloses Creation Unit breakdown for the year ended March 31, 2019:
| KraneShares Funds | | Creation
Unit
Shares | | | Standard
Transaction
Fee – Subscriptions | | | Value at
March 31,
2019 | | | Standard
Transaction
Fee – Redemptions | | | Maximum
Variable
Transaction
Fee* | |
| KraneShares CICC China Leaders 100 Index ETF | | | 50,000 | | | $ | 2,500 | | | $ | 1,400,000 | | | $ | 2,500 | | | | 2.00% | |
| KraneShares CSI China Internet ETF | | | 50,000 | | | | 500 | | | | 2,352,000 | | | | 500 | | | | 2.00% | |
| KraneShares Bosera MSCI China A Share ETF | | | 50,000 | | | | 5,800 | | | | 1,594,000 | | | | 5,800 | | | | 2.00% | |
| KraneShares E Fund China Commercial Paper ETF | | | 50,000 | | | | 1,000 | | | | 1,711,000 | | | | 1,000 | | | | 2.00% | |
| KraneShares MSCI All China Index ETF | | | 50,000 | | | | 8,500 | | | | 1,274,000 | | | | 8,500 | | | | 2.00% | |
| KraneShares MSCI One Belt One Road Index ETF | | | 50,000 | | | | 3,900 | | | | 1,184,500 | | | | 3,900 | | | | 2.00% | |
| KraneShares Emerging Markets Consumer Technology Index ETF | | | 50,000 | | | | 1,500 | | | | 1,147,000 | | | | 1,500 | | | | 2.00% | |
| KraneShares MSCI China Environment Index ETF | | | 50,000 | | | | 750 | | | | 1,014,000 | | | | 750 | | | | 2.00% | |
| KraneShares Electric Vehicles and Future Mobility Index ETF | | | 50,000 | | | | 1,100 | | | | 1,032,000 | | | | 1,100 | | | | 2.00% | |
| KraneShares MSCI All China Health Care Index ETF | | | 50,000 | | | | 1,320 | | | | 1,114,500 | | | | 1,320 | | | | 2.00% | |
| Kraneshares CCBS China Corporate High Yield Bond USD Index Fund | | | 50,000 | | | | 1,000 | | | | 2,036,500 | | | | 1,000 | | | | 2.00% | |
| Kraneshares Emerging Markets Healthcare Index ETF | | | 50,000 | | | | 2,800 | | | | 1,119,000 | | | | 2,800 | | | | 2.00% | |
* As a percentage of the Creation Unit(s) purchased.
CASH AND CASH EQUIVALENTS — Idle cash and currency balances may be swept into various overnight sweep accounts and are classified as cash equivalents on the Statement of Assets and Liabilities. These amounts, at times, may exceed United States federally insured limits. Amounts swept are available on the next business day.
Notes to Financial Statements(continued)
3. RELATED PARTY TRANSACTIONS
INVESTMENT ADVISORY AGREEMENT — The Adviser serves as investment adviser to each Fund pursuant to an Investment Advisory Agreement between the Trust on behalf of each Fund and the Adviser (the “Agreement”). Under the Agreement, Krane is responsible for reviewing, supervising and administering each Fund’s investment program and the general management and administration of the Trust. In addition to these services, to the extent a Fund engages in securities lending, Krane will: (i) assist the securities lending agent of the Fund (the “Agent”) to determine which securities are available for loan, (ii) monitor the Agent’s activities to ensure that securities loans are effected in accordance with Krane’s instructions and in accordance with applicable procedures and guidelines adopted by the Board, (iii) make recommendations to the Board regarding the Fund’s participation in securities lending; (iv) prepare appropriate periodic reports for, and seek appropriate periodic approvals from, the Board with respect to securities lending activities, (v) respond to Agent inquiries concerning the Agent’s activities, and (vi) such other related duties as Krane deems necessary or appropriate (this provision became effective with respect to the Funds on the later of October 5, 2017, or the date the Fund commenced operations). The Board of Trustees of the Trust supervises Krane and establishes policies that Krane must follow in its management activities.
The Agreement requires the Adviser to pay all operating expenses of the Funds, except: (a) interest and taxes (including, but not limited to, income, excise, transaction, transfer and withholding taxes); (b) expenses of the Funds incurred with respect to the acquisition and disposition of portfolio securities and the execution of portfolio transactions, including brokerage commissions and short sale dividend or interest expense; (c) expenses incurred in connection with any distribution plan adopted by the Trust in compliance with Rule 12b-1 under the Investment Company Act, including distribution fees; (d) “Acquired Fund Fees and Expenses” (as defined by Form N-1A under the 1940 Act); (e) litigation expenses; (f) the compensation payable to the Adviser under the Agreement; (g) compensation and expenses of the Independent Trustees (including any fees of independent legal counsel to the Independent Trustees); and (h) any expenses determined to be extraordinary expenses by the Board. In addition, effective on the later of October 5, 2017, or the date the Fund commenced operations, under the Agreement, while the fees and expenses related to the Funds’ securities lending-related activities reduce the gross revenues and income of the Funds from such activities, they are not fees and expenses for which Krane is responsible.
Each Agreement provides that each Fund pays a unitary (or unified) fee to the Adviser for advisory and management services provided to the Fund, subject to the exceptions noted herein. In this context, there exists a risk that a Trust service provider will seek recourse against the Trust if is not timely paid by Krane for the fees and expenses for which it is responsible, which could materially adversely affect the Funds. Pursuant to the Agreement between the Trust and the Adviser, the Funds below pay the Adviser a fee, which is calculated daily and paid monthly, at the following annual rates, based on a percentage of the average daily net assets of each Fund. In addition, as compensation for the services provided by the Adviser in connection with any securities lending-related activities, each Fund pays the Adviser 10% of the monthly investment income received from the investment of cash collateral and loan fees received from borrowers in respect to securities loans (net of any amounts paid to the custodian and/or securities lending agent or rebated to borrowers), included on the Statements of Operations as “Security Lending Fees”.
Notes to Financial Statements(continued)
| KraneShares Funds | | Management
Fee | |
| KraneShares CICC China Leaders 100 Index ETF | | 0.68% | |
| KraneShares CSI China Internet ETF | | 0.68% | |
| KraneShares Bosera MSCI China A Share ETF | | 0.78% | |
| KraneShares E Fund China Commercial Paper ETF | | 0.68% | |
| KraneShares MSCI All China Index ETF | | 0.68% | |
| KraneShares MSCI One Belt One Road Index ETF | | 0.78% | |
| KraneShares Emerging Markets Consumer Technology Index ETF | | 0.78% | |
| KraneShares MSCI China Environment Index ETF | | 0.78% | |
| KraneShares Electric Vehicles and Future Mobility Index ETF | | 0.68% | |
| KraneShares MSCI All China Health Care Index ETF | | 0.78% | |
| Kraneshares CCBS China Corporate High Yield Bond USD Index Fund | | 0.68% | |
| Kraneshares Emerging Markets Healthcare Index ETF | | 0.78% | |
Prior to July 31, 2018, pursuant to the terms of an Expense Limitation Agreement, the Adviser had contractually agreed to reduce its management fee and/or reimburse the Funds, except for KraneShares Bosera MSCI China A Share ETF, KraneShares Electric Vehicles and Future Mobility Index ETF, KraneShares MSCI All China Health Care Index ETF, KraneShares CCBS China Corporate High Yield Bond USD Index ETF and KraneShares Emerging Markets Healthcare Index ETF, in an amount equal to the fees paid by the Funds to counsel to the independent Trustees of the Trust.
Pursuant to the terms of an Expense Limitation Agreement, the Adviser has contractually agreed to waive its management fee for the KraneShares Bosera MSCI China A Share ETF by 0.20% of the Fund’s average daily net assets. This contractual fee waiver will continue until October 4, 2019, and may only be terminated prior thereto by the Board. In addition, the Fee Waiver Agreement will terminate if the Investment Advisory Agreement for the Fund is terminated.
Pursuant to the terms of an Expense Limitation Agreement, the Adviser has contractually agreed to reduce its management fee for the KraneShares E Fund China Commercial Paper ETF by 0.12% of the Fund’s average daily net assets until October 4, 2019. The Expense Limitation Agreement may only be terminated prior thereto by the Board. In addition, the Fee Waiver Agreement will terminate if the Investment Advisory Agreement for the Fund is terminated.
Pursuant to the terms of an Expense Limitation Agreement, Krane has contractually agreed to reduce its management fee for the KraneShares MSCI All China Index ETF in an amount equal to any Acquired Fund Fees and Expenses incurred by the Fund from its investments in the KraneShares Bosera MSCI China A Share ETF. This Expense Limitation Agreement will continue until October 4, 2019. The Expense Limitation Agreement may only be terminated by the Board. In addition, the Fee Waiver Agreement will terminate if the Investment Advisory Agreement for the Fund is terminated.
The Adviser and each Sub-Adviser bear all of their own costs associated with providing these advisory services. As part of its agreement with the Trust, the Adviser has contractually agreed to pay all operating expenses of the Funds, including the cost of index licensing fees, transfer agency, custody, fund administration, legal, audit and other services, except as set forth above and as otherwise indicated in those agreements.
SUB-ADVISORY AGREEMENT — Bosera Asset Management (International) Co., Ltd. (“Bosera”), operating out of Hong Kong, serves as the Sub-Adviser to the KraneShares Bosera MSCI China A Share ETF and is responsible for the day-to-day management of the Fund, subject to the supervision by the Adviser and the Board. For the services Bosera provides to KraneShares Bosera MSCI China A Share ETF, the Adviser pays Bosera a fee equal to 50% of the net revenue the Adviser receives from the Fund.
Notes to Financial Statements(continued)
CCB Securities Ltd. (“CCBS”), located at 18/F CCB Centre, 18 Wang Chiu Road, Kowloon Bay, Kowloon, Hong Kong, serves as the sub-adviser of KraneShares CCBS China Corporate High Yield Bond USD Index ETF. CCBS is responsible for the day-to-day investment management of the Fund, subject to the supervision of Krane and the Board. The Adviser has entered into a Sub-Advisory Agreement with CCBS pursuant to which the Adviser has agreed to pay CCBS a fee equal to 50% of net revenue earned by the Adviser from the Fund. For these purposes, net revenue is defined as gross revenue less gross fund-related expenses (including any waiver by the Adviser of its compensation under the investment advisory agreement and any payments or reimbursements by Krane of the Fund’s expenses).
E Fund Management (Hong Kong) Co., Limited (‘‘E Fund”), operating out of Hong Kong, serves as the Sub-Adviser to the KraneShares E Fund China Commercial Paper ETF and is responsible for the day-to-day management of the Fund, subject to the supervision by the Adviser and the Board. For the services E Fund provides to KraneShares E Fund China Commercial Paper ETF, the Adviser pays E Fund a fee equal to 50% of the net revenue the Adviser receives from the Fund.
DISTRIBUTION AGREEMENT — SEI Investments Distribution Co. (the “Distributor”), a wholly-owned subsidiary of SEI Investments Company, and an affiliate of the administrator, serves as the Funds’ distributor of Creation Units pursuant to a Distribution Agreement. The Distributor does not maintain any secondary market in Fund shares.
The Trust has adopted a Distribution and Service Plan (“Plan”) pursuant to Rule 12b-1 under the 1940 Act. In accordance with its Plan, each Fund is authorized to pay an amount up to 0.25% of its average daily net assets each year for certain distribution-related activities. For the year ended March 31, 2019 no fees were charged under the Plan. Fees would only be charged under the Plan upon approval by the Board.
ADMINISTRATOR, CUSTODIAN AND TRANSFER AGENT — SEI Investments Global Funds Services (the “Administrator”) serves as the Funds’ Administrator pursuant to an Administration Agreement. BBH serves as the Funds’ Custodian and Transfer Agent pursuant to a Custodian and Transfer Agent Agreement.
4. INVESTMENT TRANSACTIONS
For the ended March 31, 2019, the purchases and sales of investments in securities excluding in-kind transactions, long-term U.S. Government and short-term securities were:
| KraneShares Funds | | Purchases | | | Sales and
Maturities | |
| KraneShares CICC China Leaders 100 Index ETF | | $ | 6,055,770 | | | $ | 7,780,038 | |
| KraneShares CSI China Internet ETF | | | 1,258,816,423 | | | | 1,124,339,363 | |
| KraneShares Bosera MSCI China A Share ETF | | | 712,020,823 | | | | 409,196,466 | |
| KraneShares E Fund China Commercial Paper ETF | | | — | | | | — | |
| KraneShares MSCI All China Index ETF | | | 4,733,961 | | | | 2,001,497 | |
| KraneShares MSCI One Belt One Road Index ETF | | | 19,221,100 | | | | 21,778,172 | |
| KraneShares Emerging Markets Consumer Technology Index ETF | | | 47,388,294 | | | | 37,896,422 | |
| KraneShares MSCI China Environment Index ETF | | | 8,660,900 | | | | 10,287,194 | |
| KraneShares Electric Vehicles and Future Mobility Index ETF | | | 25,645,514 | | | | 22,825,667 | |
| KraneShares MSCI All China Health Care Index ETF | | | 62,568,160 | | | | 20,999,367 | |
| Kraneshares CCBS China Corporate High Yield Bond USD Index Fund | | | 12,125,595 | | | | 3,055,320 | |
| Kraneshares Emerging Markets Healthcare Index ETF | | | 6,256,950 | | | | 2,087,913 | |
Notes to Financial Statements(continued)
During the year ended March 31, 2019, there were no purchases or sales of long-term U.S. government securities for the Funds.
For the year ended March 31, 2019, in-kind transactions associated with creations and redemptions were:
| KraneShares Funds | | Purchases | | | Sales and
Maturities | | | Realized Gain
(Loss) | |
| KraneShares CICC China Leaders 100 Index ETF | | $ | — | | | $ | 301,926 | | | $ | 28,170 | |
| KraneShares CSI China Internet ETF | | | 1,143,129,892 | | | | 573,935,381 | | | | 96,211,751 | |
| KraneShares MSCI All China Index ETF | | | 585,834 | | | | — | | | | — | |
| KraneShares MSCI One Belt One Road Index ETF | | | 1,088,468 | | | | 4,294,690 | | | | (213,181) | |
| KraneShares Emerging Markets Consumer Technology Index ETF | | | 19,263,092 | | | | 13,889,324 | | | | (411,686) | |
| KraneShares MSCI China Environment Index ETF | | | 104,436 | | | | 143,895 | | | | 8,935 | |
| KraneShares Electric Vehicles and Future Mobility Index ETF | | | 7,660,432 | | | | — | | | | — | |
| KraneShares MSCI All China Health Care Index ETF | | | 54,725 | | | | 160,387 | | | | (21,943) | |
| Kraneshares Emerging Markets Healthcare Index ETF | | | 525,872 | | | | — | | | | — | |
5. TAX INFORMATION
The amount and character of income and capital gain distributions to be paid, if any, are determined in accordance with Federal income tax regulations, which may differ from U.S. GAAP. As a result, net investment income (loss) and net realized gain (loss) on investment transactions for a reporting period may differ significantly from distributions during such period. These book/tax differences may be temporary or permanent. To the extent these differences are permanent in nature, they are charged or credited to undistributed net investment income (loss), accumulated net realized gain (loss) or paid-in capital, as appropriate, in the period that the differences arise.
The following differences, primarily attributable to redemptions in kind, net operating losses, distribution in excess, and excise tax, have been reclassified to/from the following accounts during the fiscal year ended March 31, 2019.
| KraneShares Funds | | Distributable
Earnings/(Loss) | | | Paid-In-Capital | |
| KraneShares CICC China Leaders 100 Index ETF | | $ | (28,170) | | | $ | 28,170 | |
| KraneShares CSI China Internet ETF | | | (80,552,801) | | | | 80,552,801 | |
| KraneShares MSCI One Belt One Road Index ETF | | | 219,893 | | | | (219,893) | |
| KraneShares Emerging Markets Consumer Technology Index ETF | | | 417,791 | | | | (417,791) | |
| KraneShares MSCI China Environment Index ETF | | | (8,935) | | | | 8,935 | |
| KraneShares MSCI All China Health Care Index ETF | | | 21,943 | | | | (21,943) | |
Notes to Financial Statements(continued)
These reclassifications have no impact on net assets or net asset value per share. The tax character of dividends and distributions paid during the years or periods ended March 31, 2019 and March 29, 2018 were as follows:
| KraneShares Funds | | Ordinary
Income | | | Long-Term
Capital Gain | | | Return of
Capital | | | Totals | |
| KraneShares CICC China Leaders 100 Index ETF | | | | | | | | | | | | | | | | |
| 2019 | | $ | 244,415 | | | $ | 200,757 | | | $ | — | | | $ | 445,172 | |
| 2018 | | | 44,526 | | | | 1,101,598 | | | | — | | | | 1,146,124 | |
| | | | | | | | | | | | | | | | | |
| KraneShares CSI China Internet ETF | | | | | | | | | | | | | | | | |
| 2019 | | $ | 620,213 | | | $ | 52,155,720 | | | $ | — | | | $ | 52,775,933 | |
| 2018 | | | 7,001,175 | | | | — | | | | — | | | | 7,001,175 | |
| | | | | | | | | | | | | | | | | |
| KraneShares Bosera MSCI China A Share ETF | | | | | | | | | | | | | | | | |
| 2019 | | $ | 10,176,902 | | | $ | 712,126 | | | $ | — | | | $ | 10,889,028 | |
| 2018 | | | 2,946,446 | | | | — | | | | — | | | | 2,946,446 | |
| | | | | | | | | | | | | | | | | |
| KraneShares E Fund China Commercial Paper ETF | | | | | | | | | | | | | | | | |
| 2019 | | $ | 704,248 | | | $ | — | | | $ | 28,559 | | | $ | 732,807 | |
| 2018 | | | — | | | | — | | | | — | | | | — | |
| | | | | | | | | | | | | | | | | |
| KraneShares MSCI All China Index ETF | | | | | | | | | | | | | | | | |
| 2019 | | $ | 43,104 | | | $ | — | | | $ | — | | | $ | 43,104 | |
| 2018 | | | 32,628 | | | | — | | | | — | | | | 32,628 | |
| | | | | | | | | | | | | | | | | |
| KraneShares MSCI One Belt One Road Index ETF | | | | | | | | | | | | | | | | |
| 2019 | | $ | 553,422 | | | $ | — | | | $ | — | | | $ | 553,422 | |
| 2018 | | | 6,687 | | | | — | | | | — | | | | 6,687 | |
| | | | | | | | | | | | | | | | | |
| KraneShares Emerging Market Consumer Technology Index ETF | | | | | | | | | | | | | | | | |
| 2019 | | $ | — | | | $ | — | | | $ | — | | | $ | — | |
| 2018 | | | — | | | | — | | | | — | | | | — | |
| | | | | | | | | | | | | | | | | |
| KraneShares MSCI China Environment Index ETF | | | | | | | | | | | | | | | | |
| 2019 | | $ | 107,314 | | | $ | — | | | $ | — | | | $ | 107,314 | |
| 2018 | | | — | | | | — | | | | — | | | | — | |
| | | | | | | | | | | | | | | | | |
| KraneShares Electric Vehicles and Future Mobility Index ETF | | | | | | | | | | | | | | | | |
| 2019 | | $ | 382,192 | | | $ | — | | | $ | — | | | $ | 382,192 | |
| 2018 | | | — | | | | — | | | | — | | | | — | |
| | | | | | | | | | | | | | | | | |
| KraneShares MSCI All China Health Care Index ETF | | | | | | | | | | | | | | | | |
| 2019 | | $ | 136,712 | | | $ | — | | | $ | — | | | $ | 136,712 | |
| 2018 | | | — | | | | — | | | | — | | | | — | |
| | | | | | | | | | | | | | | | | |
| KraneShares CCBS China Corporate High Yield Bond USD Index Fund | | | | | | | | | | | | | | | | |
| 2019 | | $ | 374,120 | | | $ | — | | | $ | 49,368 | | | $ | 423,488 | |
| | | | | | | | | | | | | | | | | |
| KraneShares Emerging Markets Healthcare Index ETF | | | | | | | | | | | | | | | | |
| 2019 | | $ | 752 | | | $ | — | | | $ | — | | | $ | 752 | |
Notes to Financial Statements(continued)
As of March 31, 2019, the components of tax basis distributable earnings (accumulated losses) were as follows:
| | | KraneShares
CICC China
Leaders 100
Index ETF | | | KraneShares
CSI China
Internet ETF | | | KraneShares
Bosera MSCI
China A
Share ETF | | | KraneShares
E Fund
China
Commercial
Paper ETF | | | KraneShares
MSCI All
China Index | |
| Undistributed Ordinary Income | | $ | — | | | $ | — | | | $ | — | | | $ | — | | | $ | 2,941 | |
| Capital Loss Carryforwards | | | — | | | | — | | | | (7,407,733 | ) | | | (28,632 | ) | | | (131,967 | ) |
| Post October Losses | | | (623,235 | ) | | | (93,150,121 | ) | | | (15,932,668 | ) | | | — | | | | — | |
| Qualified Late-Year Loss Deferrals | | | (3,477 | ) | | | — | | | | (66,907 | ) | | | (391,750 | ) | | | — | |
| Unrealized Appreciation (Depreciation) on Investments and Foreign Currency | | | 485,480 | | | | (160,441,670 | ) | | | 2,757,359 | | | | 158,417 | | | | 681,664 | |
| Other Temporary Differences | | | (1 | ) | | | 6 | | | | (6 | ) | | | (11 | ) | | | — | |
| Total Distributable Earnings (Accumulated Losses) | | $ | (141,233 | ) | | $ | (253,591,785 | ) | | $ | (20,649,955 | ) | | $ | (261,976 | ) | | $ | 552,638 | |
| | | KraneShares
MSCI One
Belt One Road
Index ETF | | | KraneShares
Emerging
Markets
Consumer
Technology
Index ETF | | | KraneShares
MSCI China
Environment
Index ETF | | | KraneShares
Electric
Vehicles
and Future
Mobility
Index ETF | | | KraneShares
MSCI All China
Health Care
Index ETF | |
| Undistributed Ordinary Income | | $ | 44,176 | | | $ | 64,368 | | | $ | — | | | $ | — | | | $ | — | |
| Post October Losses | | | — | | | | — | | | | (767,588 | ) | | | — | | | | (1,522,222 | ) |
| Capital Loss Carryforwards | | | (2,564,896 | ) | | | (2,287,120 | ) | | | (700,820 | ) | | | (2,300,182 | ) | | | — | |
| Qualified Late-Year Loss Deferrals | | | — | | | | — | | | | (44 | ) | | | (1,965 | ) | | | (64,320 | ) |
| Unrealized Appreciation (Depreciation) on Investments and Foreign Currency | | | (1,325,015 | ) | | | (3,741,678 | ) | | | (46,367 | ) | | | (2,908,055 | ) | | | (4,743,033 | ) |
| Other Temporary Differences | | | — | | | | — | | | | — | | | | — | | | | — | |
| Total Distributable Earnings (Accumulated Losses) | | $ | (3,845,735 | ) | | $ | (5,964,430 | ) | | $ | (1,514,819 | ) | | $ | (5,210,202 | ) | | $ | (6,329,575 | ) |
Notes to Financial Statements(continued)
| | | KraneShares
CCBS China
Corporate High
Yield Bond USD
Index ETF | | KraneShares
Emerging
Markets
Healthcare Index
ETF | |
| Undistributed Ordinary Income | | $ | — | | | $ | 17,204 | |
| Capital Loss Carryforwards | | | — | | | | (277,708 | ) |
| Post October Losses | | | (12,897 | ) | | | — | |
| Unrealized Appreciation (Depreciation) on Investments and Foreign Currency | | | 238,733 | | | | 30,287 | |
| Other Temporary Differences | | | 58,098 | | | | — | |
| Total Distributable Earnings (Accumulated Losses) | | $ | 283,934 | | | $ | (230,217) | |
Qualified late year ordinary and Post-October capital losses (including currency and specified gain/loss items) represent losses realized from January 1, 2019 through March 31, 2019 and November 1, 2018 through March 31, 2019, respectively, that in accordance with federal income tax regulations, the Funds have elected to defer and treat as having arisen in the following fiscal year.
Under the Regulated Investment Company Modernization Act of 2010, the Funds are permitted to carry forward capital losses incurred in taxable years beginning after December 22, 2010 for an unlimited period. Post-enactment capital losses that are carried forward will retain their character as either short-term or long-term capital losses rather than being considered all short-term as under previous law. Losses carried forward under these provisions are as follows:
| KraneShares Funds | | Short-Term
Loss | | | Long-Term
Loss | | | Total | |
| KraneShares Bosera MSCI China A Share ETF | | $ | 7,407,733 | | | $ | — | | | $ | 7,407,733 | |
| KraneShares E Fund China Commercial Paper ETF | | | 28,288 | | | | 344 | | | | 28,632 | |
| KraneShares MSCI All China Index ETF | | | 7,048 | | | | 124,920 | | | | 131,968 | |
| KraneShares MSCI One Belt One Road Index ETF | | | 2,511,485 | | | | 53,411 | | | | 2,564,896 | |
| KraneShares Emerging Markets Consumer Technology Index ETF | | | 1,922,675 | | | | 364,445 | | | | 2,287,120 | |
| KraneShares MSCI China Environment Index ETF | | | 700,820 | | | | — | | | | 700,820 | |
| KraneShares Electric Vehicles and Future Mobility Index ETF | | | 1,885,086 | | | | 415,096 | | | | 2,300,182 | |
| KraneShares Emerging Markets Healthcare Index ETF | | | 277,708 | | | | — | | | | 277,708 | |
During the year ended March 31, 2019, KraneShares E Fund China Commercial Paper ETF and KraneShares MSCI All China Index ETF utilized $13,029 and $67,006 of capital loss carryforwards, respectively, to offset capital gains.
Notes to Financial Statements(continued)
The differences between book and tax-basis unrealized appreciation and depreciation are attributable primarily to the tax deferral of losses on wash sales and investments in passive foreign investment companies. The federal tax cost and aggregate gross unrealized appreciation and depreciation on investments held by the Funds at March 31, 2019 were as follows:
| KraneShares Funds | | Federal Tax
Cost | | | Aggregated
Gross
Unrealized
Appreciation | | | Aggregated
Gross
Unrealized
Depreciation | | | Net Unrealized
Appreciation/
Depreciation | |
| KraneShares CICC China Leaders 100 Index ETF | | $ | 2,310,024 | | | $ | 534,885 | | | $ | (49,405) | | | $ | 485,480 | |
| KraneShares CSI China Internet ETF | | | 2,701,834,273 | | | | 170,757,689 | | | | (331,199,353) | | | | (160,441,664) | |
| KraneShares Bosera MSCI China A Share ETF | | | 598,506,407 | | | | 32,883,715 | | | | (30,126,356) | | | | 2,757,359 | |
| KraneShares E Fund China Commercial Paper ETF | | | 16,779,254 | | | | 242,332 | | | | (84,477) | | | | 157,855 | |
| KraneShares MSCI All China Index ETF | | | 5,651,034 | | | | 791,691 | | | | (109,890) | | | | 681,801 | |
| KraneShares MSCI One Belt One Road Index ETF | | | 22,613,206 | | | | 1,484,601 | | | | (2,809,583) | | | | (1,324,982) | |
| KraneShares Emerging Markets Consumer Technology Index ETF | | | 33,686,586 | | | | 1,660,423 | | | | (5,401,527) | | | | (3,741,104) | |
| KraneShares MSCI China Environment Index ETF | | | 4,098,582 | | | | 482,698 | | | | (529,065) | | | | (46,367) | |
| KraneShares Electric Vehicles and Future Mobility Index ETF | | | 36,929,317 | | | | 1,469,285 | | | | (4,376,279) | | | | (2,906,994) | |
| KraneShares MSCI All China Health Care Index ETF | | | 43,731,441 | | | | 2,948,169 | | | | (7,691,184) | | | | (4,743,015) | |
| KraneShares CCBS China Corporate High Yield Bond USD Index ETF | | | 11,222,501 | | | | 244,163 | | | | (5,430) | | | | 238,733 | |
| KraneShares Emerging Markets Healthcare Index ETF | | | 4,443,925 | | | | 311,473 | | | | (281,178) | | | | 30,295 | |
Uncertainties in the Chinese tax rules governing the taxation of income distributions and capital gains from investments in A Shares could result in unexpected tax liabilities for the Funds. China generally imposes withholding tax at a rate of 10% on dividends and interest derived by non-Chinese resident investors (including, for example, Qualified Foreign Institutional Investors (“QFII”)) from Chinese companies and those companies which are not Chinese tax residents, but which are deemed to be Chinese tax residents (e.g., under Notice 7). China also imposes withholding tax at a rate of 10% on capital gains derived by non-residents from investment in actual and constructive Chinese resident companies. The Chinese withholding taxes applied to dividends, interest and capital gains may, in principle, be subject to a reduced rate under an applicable Chinese tax treaty, but the application of such treaties in the case of a non-resident (e.g., in the case of a QFII acting on behalf of non-resident investors, such as the Funds) is also uncertain. The imposition of such taxes could have a material adverse effect on the Funds’ returns. The People’s Republic of China (the “PRC”) rules regarding the taxation of non-resident investors are quickly evolving and certain of the tax regulations to be issued by the PRC State Administration of Taxation and/or the PRC Ministry of Finance to clarify matters may apply retrospectively. Such retroactively applied rules may be adverse to the Funds and their shareholders. It is also unclear
Notes to Financial Statements(continued)
how China’s value added tax (“VAT”) may be affected by tax treaty provisions. If such a tax is collected, the expenses will be passed on and borne by the Funds. The imposition of such taxes, as well as future changes in applicable PRC tax law, may adversely affect the Funds. If the Funds expect VAT to be imposed, they reserve the right to establish a reserve for such tax. If the Funds establish such a reserve but are not ultimately subject to the tax, shareholders who redeemed or sold their shares while the reserve was in place will effectively bear the tax and may not benefit from the later release, if any, of the reserve. Conversely, if the Funds do not establish such a reserve but ultimately are subject to the tax, shareholders who redeemed or sold their shares prior to the tax being withheld, reserved or paid will have effectively avoided the tax, even if they benefited from investments in a Fund. Effective November 17, 2014, QFIIs, RQFIIs (i.e., QFIIs investing in Yuan, rather than foreign currency) and non-Chinese resident investors investing through the Hong Kong-Shanghai Stock Connect are exempted temporarily from the 10% capital gains tax that normally applies to sales of A Shares on a public Chinese exchange (such as the Shanghai Stock Exchange). However, such investors are still required to pay capital gains tax for gains realized on trades executed before November 17, 2014. The Funds have recorded capital gains tax for gains realized prior to November 17, 2014, and have reflected such taxes in the Statement of Assets and Liabilities.
On November 7, 2018, China’s Ministry of Finance and the State Administration of Taxation jointly issued Circular 108. This circular announced a three year exemption from corporate income tax withholding (“WHT”) and Value Added Tax (“VAT”) for China-sourced bond interest derived by overseas institutional investors. The WHT and VAT exemptions apply from November 7, 2018 to November 6, 2021.
6. CONCENTRATION OF RISKS
As with all ETFs, shareholders of the Funds are subject to the risk that their investment could lose money. Each Fund is subject to certain of the principal risks noted below, any of which may adversely affect a Fund’s NAV, trading price, yield, total return and ability to meet its investment objective. A more complete description of principal risks is included in each Fund’s prospectus under the heading “Principal Risks”.
Cash and Cash Equivalents Risk— The Fund may hold cash or cash equivalents. Generally, such positions offer less potential for gain than other investments. Holding cash or cash equivalents, even strategically, may lead to missed investment opportunities. This is particularly true when the market for other investments in which the Fund may invest is rapidly rising. If the Fund holds cash uninvested it will be subject to the credit risk of the depositing institution holding the cash.
CHINA RISK — The Chinese economy is generally considered an emerging market and can be significantly affected by economic and political conditions in China and surrounding Asian countries. In addition, the Chinese economy is export-driven and highly reliant on trade. A downturn in the economies of China’s primary trading partners could slow or eliminate the growth of the Chinese economy and adversely impact the Fund’s investments. The Chinese government strictly regulates the payment of foreign currency denominated obligations and sets monetary policy. The Chinese government may introduce new laws and regulations that could have an adverse effect on the Fund. Although China has begun the process of privatizing certain sectors of its economy, privatized entities may lose money and/or be re-nationalized.
Notes to Financial Statements(continued)
In the Chinese securities markets, a small number of issuers may represent a large portion of the entire market. The Chinese securities markets are subject to more frequent trading halts, low trading volume and price volatility. Further, the Chinese economy is heavily dependent upon trading with key partners. Recent developments in relations between the United States and China have heightened concerns of increased tariffs and restrictions on trade between the two countries. An increase in tariffs or trade restrictions or even the threat of such developments, could lead to significant reduction in international trade, which could have a negative impact on China’s export industry and a commensurately negative impact on the Fund.
The RMB Bond market is volatile with a risk of trading suspensions in particular securities and government interventions. Trading in RMB Bonds may be suspended without warning and for lengthy periods. Information on such trading suspensions, including as to their expected length, may be unavailable. Securities affected by trading suspensions may be or become illiquid. In recent years, Chinese entities have incurred significant levels of debt and Chinese financial institutions currently hold relatively large amounts of non-performing debt. Thus, there exists a possibility that widespread defaults could occur, which could trigger a financial crisis, freeze Chinese debt and finance markets and make certain Chinese securities illiquid.
CHINESE CREDIT RATINGS RISK — The debt securities included in Underlying Index securities, and therefore the securities held by the KraneShares E Fund China Commercial Paper ETF Fund, will generally be rated by Chinese ratings agencies (and not by U.S. nationally recognized statistical ratings organizations (“NRSROs”)). The rating criteria and methodology used by Chinese rating agencies may be different from those adopted by NRSROs and international credit rating agencies. Therefore, such rating systems may not provide an equivalent standard for comparison with securities rated by NRSROs or other international credit rating agencies.
CONCENTRATION RISK — Because the Fund’s assets are expected to be concentrated in an industry or group of industries to the extent that the Underlying Index concentrates in a particular industry or group of industries, the Fund is subject to loss due to adverse occurrences that may affect that industry or group of industries or sector. Market conditions, interest rates, and economic, regulatory, or financial developments could significantly affect a single industry or a group of related industries, and the securities of companies in that industry or group of industries could react similarly to these or other developments. Depending on the composition of each Fund’s Underlying Index, the Fund may be subject to principal risks, as outlined in each Funds’ prospectus. Each Fund may have significant exposure to other industries or sectors over time.
CURRENCY RISK — The Fund’s NAV is determined on the basis of the U.S. dollar, therefore, the Fund may lose value if the local currency of a foreign market depreciates against the U.S. dollar, even if the local currency value of the Fund’s holdings goes up. Currency exchange rates can be very volatile and can change quickly and unpredictably, which may adversely affect the Fund. The Fund may also be subject to delays in converting or transferring U.S. dollars to foreign currencies for the purpose of purchasing portfolio investments. This may hinder the Fund’s performance, including because any delay could result in the Fund missing an investment opportunity and purchasing securities at a higher price than originally intended, or incurring cash drag.
DEPOSITARY RECEIPTS RISK — The Fund may hold the securities of foreign companies in the form of depositary receipts, including American Depositary Receipts and Global Depositary Receipts. Investing in depositary receipts entails the risks associated with foreign investments. The underlying
Notes to Financial Statements(continued)
securities of the depositary receipts in the Fund’s portfolio are subject to fluctuations in foreign currency exchange rates that may affect the value of the Fund’s portfolio. In addition, the value of the securities underlying the depositary receipts may change materially when the U.S. markets are not open for trading, which will affect the value of the depositary receipts. Like direct investments in foreign securities, investments in depositary receipts involve political and economic risks distinct from those associated with investing in the securities of U.S. issuers.
Emerging Markets Risk— The Fund’s investments in emerging markets are subject to greater risk of loss than investments in developed markets. This is due to, among other things, greater market volatility, greater risk of asset seizures and capital controls, lower trading volume, political and economic instability, greater risk of market shutdown and more governmental limitations on foreign investments than typically found in developed markets. The economies of emerging markets, and China in particular, may be heavily reliant upon international trade and may suffer disproportionately if international trading declines or is disrupted.
ETF Risk.As an ETF, the Fund is subject to the following risks:
Authorized Participants Concentration Risk. The Fund has a limited number of financial institutions that may act as Authorized Participants. To the extent they cannot or are otherwise unwilling to engage in creation and redemption transactions with the Fund and no other Authorized Participant steps in, shares of the Fund may trade like closed-end fund shares at a significant discount to net asset value (“NAV”) and may face delisting from the Exchange.
Cash Transactions Risk. Like other ETFs, the Fund sells and redeems its shares only in large blocks called Creation Units and only to “Authorized Participants.” Unlike many other ETFs, however, the Fund expects to effect its creations and redemptions at least partially or fully for cash, rather than in-kind securities. Thus, an investment in the Fund may be less tax-efficient than an investment in other ETFs as the Fund may recognize a capital gain that it could have avoided by making redemptions in-kind. As a result, the Fund may pay out higher capital gains distributions than ETFs that redeem in-kind. Further, paying redemption proceeds in cash rather than through in-kind delivery of portfolio securities may require the Fund to dispose of or sell portfolio investments to obtain the cash needed to distribute redemption proceeds at an inopportune time.
International Closed Market Trading Risk. Because certain of the Fund’s investments trade in markets that are closed when the Fund and Exchange are open, there are likely to be deviations between current pricing of an underlying security and stale pricing, resulting in the Fund trading at a discount or premium to NAV greater than those incurred by other ETFs.
New Fund Risk. The Fund is new and does not yet have shares outstanding. If the Fund does not grow large in size once it commences trading, it will be at greater risk than larger funds of wider bid-ask spreads for its shares, trading at a greater premium or discount to NAV, liquidation and/or a stop to trading.
Premium/Discount Risk. There may be times when the market price of the Fund’s shares is more than the NAV intra-day (at a premium) or less than the NAV intra-day (at a discount). As a result, shareholders of the Fund may pay more than NAV when purchasing shares and receive less than NAV when selling Fund shares. This risk is heightened in times of market volatility or periods of steep market declines. In such market conditions, market or stop loss orders to sell Fund shares may be executed at prices well below NAV.
Notes to Financial Statements(continued)
Secondary Market Trading Risk. Investors buying or selling shares in the secondary market will normally pay brokerage commissions, which are often a fixed amount and may be a significant proportional cost for investors buying or selling relatively small amounts of shares. Secondary market trading is subject to bid-ask spreads and trading in Fund shares may be halted by the Exchange because of market conditions or other reasons. If a trading halt occurs, a shareholder may temporarily be unable to purchase or sell shares of the Fund. In addition, although the Fund’s shares are listed on the Exchange, there can be no assurance that an active trading market for shares will develop or be maintained or that the Fund’s shares will continue to be listed.
EQUITY SECURITIES RISK —The values of equity securities are subject to factors such as market fluctuations, changes in interest rates and perceived trends in stock prices. Equity securities are subject to volatile changes in value and their values may be more volatile than other asset classes. In the event of liquidation, equity securities are generally subordinate in rank to debt and other securities of the same issuer.
FIXED INCOME SECURITIES RISK —Fixed income securities are subject to credit risk and interest rate risk. Credit risk refers to the possibility that the issuer of a security will not make timely interest payments or repay the principal of the debt issued (i.e., it defaults on its obligations). Interest rate risk refers to fluctuations in the value of a debt resulting from changes in the level of interest rates. When interest rates go up, the prices of most debt instruments go down; and when interest rates go down, the prices of most debt instruments go up. Debt instruments with longer durations tend to be more sensitive to interest rate changes, typically making them more volatile. The current low-interest-rate environment heightens the risks associated with rising interest rates.
FOREIGN SECURITIES RISK — Investments in securities of non-U.S. issuers may be less liquid than investments in U.S. issuers as foreign trading markets are not typically as active as U.S. markets and may have less governmental regulation and oversight. For example, non-U.S. issuers may be subject to different accounting, auditing, financial reporting and investor protection standards than U.S. issuers. As a result, there may be less information publicly available about non-U.S. issuers. Investments in non-U.S. securities also involve risk of loss due to foreign currency fluctuations and political or economic instability. Foreign markets also may have clearance and settlement procedures that make it difficult for the Funds to buy and sell securities. These factors could result in a loss to the Funds by causing the Funds to be unable to dispose of an investment or to miss an attractive investment opportunity, or by causing the Funds’ assets to be uninvested for some period of time.
FRONTIER MARKETS RISK — Frontier market countries generally have smaller economies and less developed capital markets or legal, regulatory and political systems than traditional emerging market countries. As a result, the risks of investing in emerging market countries are magnified in frontier market countries.
GEOGRAPHIC FOCUS RISK — The Funds’ investments will be focused in a particular country, countries, or region and therefore a Fund may be susceptible to adverse market, political, regulatory, and geographic events affecting that country, countries or region. Such geographic focus also may subject the Fund to a higher degree of volatility than a more geographically diversified fund.
HIGH PORTFOLIO TURNOVER RISK — The Fund may incur high turnover rates, which may increase the Fund’s brokerage commission costs and negatively impact the Fund’s performance. Such portfolio turnover also may generate net short-term capital gains.
Notes to Financial Statements(continued)
INDUSTRY CONCENTRATION RISK — In following its methodology, each Fund’s Underlying Index from time to time may be concentrated to a significant degree in securities of issuers located in a single industry or group of industries or sector of the economy. To the extent that an Underlying Index concentrates in the securities of issuers in a particular industry or group of industries, each Fund also is expected to concentrate its investments to approximately the same extent. If a Fund concentrates its investments in an industry, the Fund may face more risks than if it were diversified broadly over industries. In addition, at times, an industry or sector may be out of favor and underperforms other industries or the market as a whole. Any factors detrimental to the performance of such industry or sector may disproportionately impact a Fund’s NAV.
KraneShares E Fund China Commercial Paper ETF utilizes a cash sweep program (the “Cash Sweep Program”). In the Cash Sweep Program, at least a portion of the Fund’s uninvested cash balance is used to purchase shares of funds that are registered in China, but not in the U.S., and that provide daily liquidity, including the E Fund Money Market Fund. The Fund may also invest in other similar investment companies that are registered in China and provide daily liquidity (collectively, the “PRC Investment Companies”). The Fund’s investments in the PRC Investment Companies are, in conjunction with other investments in investment companies (other than U.S. money market funds), subject to the limitations imposed by Section 12(d)(1) and the rules thereunder. The PRC Investment Companies are intended to provide liquidity, increased diversity of holdings, and a return on investment that is similar to the return on investments in underlying index constituents. Investments in the PRC Investment Companies are subject to the risks faced by them, which include credit risk, interest rate risk, currency risk, foreign investment risk, and custody risk. The PRC Investment Companies are PRC-domiciled funds and the Fund, therefore, will not enjoy the protections of the United States securities laws, including the 1940 Act, with respect to its investments in the PRC Investment Companies. In addition, E Fund is subject to conflicts of interest in allocating Fund assets to PRC Investment Companies that are sponsored by E Fund or its affiliates.
Investment in Investment Companies Risk— The Fund may invest in other investment companies, including those advised, sponsored or otherwise serviced by the Adviser, the Sub-Adviser and/or their affiliates. The Fund will indirectly be exposed to the risks of investments by such funds. Moreover, the Fund will incur its pro rata share of the underlying fund’s expenses. the Adviser and the Sub-Adviser are subject to conflicts of interest in allocating Fund assets to investment companies that are advised, sponsored or otherwise serviced by the Adviser and the Sub-Adviser and/or their affiliates. To the extent that the Fund invests in investment companies or other pooled investment vehicles that are not registered pursuant to the 1940 Act, including foreign investment companies, it will not enjoy the protections of the 1940 Act.
Large Capitalization Company Risk— Investments in large capitalization companies may go in and out of favor based on market and economic conditions and may underperform other market segments. Some large capitalization companies may be unable to respond quickly to new competitive challenges and attain the high growth rate of successful smaller companies, especially during extended periods of economic expansion. As such, returns on investments in stocks of large capitalization companies could trail the returns on investments in stocks of small and mid-capitalization companies.
LIQUIDITY RISK — Certain of the Funds’ investments are subject to liquidity risk, which exists when an investment is or becomes difficult to purchase or sell at a reasonable time or price. If a transaction is particularly large or if the relevant market is or becomes illiquid, it may not be possible to initiate
Notes to Financial Statements(continued)
a transaction or liquidate, which may cause the Funds to suffer significant losses and difficulties in meeting redemptions. If a number of securities held by the Funds halt trading, it may have a cascading effect and cause the Funds to halt trading. Volatility in market prices will increase the risk of the Funds being subject to a trading halt.
Management Risk— Because the Fund may not fully replicate the Underlying Index and may hold less than the total number of securities in the Underlying Index, the Fund is subject to management risk. This is the risk that Krane or its subadviser’s security selection process, which is subject to a number of constraints, may not produce the intended results.
MARKET RISK — The values of the Funds’ holdings could decline generally or could underperform other investments. In addition, there is a risk that policy changes by the U.S. Government, Federal Reserve, and/or other government actors, such as continuing to raise interest rates, could cause increased volatility in global financial markets and higher levels of Fund redemptions, which could have a negative impact on the Funds. Further, the Funds are susceptible to the risk that certain investments may be difficult or impossible to sell at a favorable time or price. Market developments may cause the Funds’ investments to become less liquid and subject to erratic price movements. Such market developments may also cause the Funds to encounter difficulties in timely honoring redemptions, especially if market events cause an increased incidence of shareholder redemptions.
Non-Diversified Fund Risk— Because the Fund is non-diversified and may invest a greater portion of its assets in fewer issuers than a diversified fund, changes in the market value of a single portfolio holding could cause greater fluctuations in the Fund’s share price than would occur in a diversified fund. This may increase the Fund’s volatility and cause the performance of a single portfolio holding or a relatively small number of portfolio holdings to have a greater impact on the Fund’s performance.
Passive Investment Risk— The Fund is not actively managed, does not seek to “beat” the Underlying Index and does not take temporary defensive positions when markets decline. Therefore, the Fund may not sell a security due to current or projected underperformance of a security, industry or sector. There is no guarantee that the Underlying Index will create the desired exposure. The Underlying Index may not contain an appropriate mix of securities, but the Fund’s investment objective and principal investment strategies impose limits on the Fund’s ability to invest in securities not included in the Underlying Index.
SECURITIES LENDING RISK — To the extent a Fund lends its securities, it may be subject to the following risks: (1) borrowers of the Funds’ securities typically provide collateral in the form of cash that is reinvested in securities; (2) the securities in which the collateral is invested may not perform sufficiently to cover the return collateral payments owed to borrowers; (3) delays may occur in the recovery of securities from borrowers, which could interfere with the Funds’ ability to vote proxies or to settle transactions; and (4) there is the risk of possible loss of rights in the collateral should the borrower fail financially.
Small and Mid-Capitalization Company Risk— Investing in the securities of small and medium capitalization companies involves greater risk and the possibility of greater price volatility than investing in larger capitalization companies and more established companies. Since small and medium-sized companies may have limited operating histories, product lines and financial resources, the securities of these companies may lack sufficient market liquidity and can be sensitive to expected changes in interest rates, borrowing costs and earnings.
Notes to Financial Statements(continued)
Tax Risk— In order to qualify for the favorable tax treatment generally available to regulated investment companies, the Fund must satisfy certain income, asset diversification and distribution requirements each year. If the Fund were to fail to qualify as a regulated investment company, it would be taxed in the same manner as an ordinary corporation, and distributions to its shareholders would not be deductible by the Fund in computing its taxable income, which would adversely affect the Fund’s performance.
Tracking Error Risk— The Fund’s return may not match or achieve a high degree of correlation with the return of the Underlying Index. This may be due to, among other factors, the Fund holding cash under certain circumstances in lieu of Underlying Index securities, such as when the Fund is subject to delays converting U.S. dollars into a foreign currency to purchase foreign securities. The Fund may not be able to invest in certain components of the Underlying Index due to legal restrictions imposed by foreign governments or other regulatory reasons. In addition, securities included in the Underlying Index may be suspended from trading. To the extent that the Fund employs a representative sampling strategy or calculates its NAV based on fair value prices and the value of the Underlying Index is based on securities’ closing prices on local foreign markets, the Fund’s ability to track the Underlying Index may be adversely affected. Changes in currency exchange rates or delays in converting currencies may also cause tracking error.
VALUATION RISK — Independent market quotations for the non-U.S. securities held by the Funds may not be readily available and such securities may be fair valued. Fair valuation is subjective and different market participants may assign different prices to the same security. As a result, there is a risk that the Funds may not be able to sell a security at the price assigned to the security by the Fund. In addition, the securities in which the Funds invest may trade on days that the Funds do not price their shares; as a result, the value of Fund shares may change on days when investors cannot purchase or sell their holdings.
7. OTHER
At March 31, 2019, the records of the Trust reflect all Shares outstanding created by Authorized Participants are in the form of Creation Units. However, the individual shares comprising such Creation Units are listed and traded on the NYSE Arca Exchange, and a portion thereof have been purchased and sold by persons other than Authorized Participants. Each Authorized Participant has entered into an agreement with the Funds’ Distributor.
8. INDEMNIFICATIONS
In the normal course of business, the Funds enter into contracts that provide general indemnifications. The Funds’ maximum exposure under these arrangements is dependent on future claims that may be made against the Funds and, therefore, cannot be established; however, based on experience, the risk of loss from such claims is considered remote.
9. REGULATORY MATTERS
On August 17, 2018, the SEC adopted amendments to Regulation S-X. These changes are effective for periods after November 5, 2018. The updates to Registered Investment Companies were mainly focused on simplifying the presentation of distributable earnings by eliminating the need to present the components of distributable earning on a book basis in the Statement of Assets and Liabilities. The update also impacted the presentation of undistributed net investment income and distribution
Notes to Financial Statements(concluded)
to shareholders on the Statement of Changes in Net Assets. The amounts presented in the current Statement of Changes in Net Assets represent the aggregated total distributions of net investment income and realized capital gains, except for distributions classified as return of capital which are still presented separately. The disaggregated amounts from the prior fiscal year are broken out below if there were both distributions from net investment income, net realized gains and/or return of capital, otherwise, the amount on the current Statement of Changes for the prior fiscal year end represents distributions of net investment income:
| | | Net
Investment Income | | | Net
Realized Gains | | | Total | |
| KraneShares CICC China Leaders 100 Index ETF | | $ | (44,526) | | | $ | (1,101,598) | | | $ | (1,146,124) | |
| KraneShares Bosera MSCI China A Share ETF | | | (1,563,342) | | | | (1,383,104) | | | | (2,946,446) | |
10. NEW ACCOUNTING PRONOUNCEMENTS
In August 2018, the FASB issued Accounting Standards Update 2018-13, Fair Value Measurement (Topic 820). The new guidance includes additions and modifications to disclosures requirements for fair value measurements. For public entities, the amendments are effective for financial statements issued for fiscal years beginning after December 15, 2019, and interim periods within those fiscal years. At this time, management is currently evaluating the impact of this new guidance on the financial statements and disclosures.
11. SUBSEQUENT EVENTS
As of April 16, 2019, the KraneShares MSCI All China Index ETF’s (the “Fund”) 80% policy changed to investing at least 80% of its total assets in components of the MSCI China All Shares Index (“Underlying Index”), depositary receipts, and investment companies, particularly the KraneShares Bosera MSCI China A Share ETF (the “Underlying Fund”), that seek to track the performance of a subset of the Underlying Index or of an index highly correlated to a portion of the Underlying Index. The Fund plans to achieve its investment objective, in part, by investing a portion of its assets in the Underlying Fund, which seeks to provide investment results that, before fees and expenses, correspond to the price and yield performance of the MSCI China A Inclusion Index, which is highly correlated to a portion of the Underlying Index.
In addition, as of April 12, 2019, as stated in the Fund’s prospectus, as supplemented, the operating expense ratio (gross) was 0.90% and the net expense ratio was 0.49% due to two Expense Limitation Agreements whereby the Adviser has contractually agreed to reduce its management and advisory fees until at least April 16, 2020.
The Funds have evaluated the need for additional disclosures and/or adjustments resulting from subsequent events. Based on this evaluation, other than the above, no additional disclosures or adjustments were required to the financial statements as of the date the financial statements were issued.
Report of Independent Registered Public Accounting Firm
To the Shareholders and Board of Trustees KraneShares Trust:
Opinion on the Financial Statements
We have audited the accompanying statements of assets and liabilities of KraneShares Trust, comprised of the funds listed in the Appendix (the Funds), including the schedules of investments, as of March 31, 2019, the related statements of operations for the year or period then ended listed in the Appendix, the statements of changes in net assets for each of the years or periods in the two-year period then ended listed in the Appendix, and the related notes (collectively, the financial statements), and the financial highlights for the years or periods listed in the Appendix. In our opinion, the financial statements and financial highlights present fairly, in all material respects, the financial position of each of the Funds as of March 31, 2019, the results of its operations for the year or period then ended listed in the Appendix, changes in its net assets for each of the years or periods in the two-year period then ended listed in the Appendix, and the financial highlights for each of the years or periods listed in the Appendix, in conformity with U.S. generally accepted accounting principles. The financial highlights for the periods presented through March 31, 2016 were audited by other independent registered public accountants whose report, dated May 31, 2016, expressed an unqualified opinion on those financial highlights.
Basis for Opinion
These financial statements and financial highlights are the responsibility of the Funds’ management. Our responsibility is to express an opinion on these financial statements and financial highlights based on our audits. We are a public accounting firm registered with the Public Company Accounting Oversight Board (United States) (PCAOB) and are required to be independent with respect to the Funds in accordance with the U.S. federal securities laws and the applicable rules and regulations of the Securities and Exchange Commission and the PCAOB.
We conducted our audits in accordance with the standards of the PCAOB. Those standards require that we plan and perform the audit to obtain reasonable assurance about whether the financial statements and financial highlights are free of material misstatement, whether due to error or fraud. Our audits included performing procedures to assess the risks of material misstatement of the financial statements and financial highlights, whether due to error or fraud, and performing procedures that respond to those risks. Such procedures included examining, on a test basis, evidence regarding the amounts and disclosures in the financial statements and financial highlights. Such procedures also included confirmation of securities owned as of March 31, 2019, by correspondence with the custodian, transfer agent and brokers or by other appropriate auditing procedures when replies from brokers were not received. Our audits also included evaluating the accounting principles used and significant estimates made by management, as well as evaluating the overall presentation of the financial statements and financial highlights. We believe that our audits provide a reasonable basis for our opinion.

KPMG has served as the auditor of one or more KraneShares investment companies since 2017.
Philadelphia, Pennsylvania
May 30, 2019
Report of Independent Registered Public Accounting Firm (continued)
Appendix
Funds with commencement of operations prior to 3/31/2017:
KraneShares CICC China Leaders 100 Index ETF (formerly, KraneShares Zacks New China ETF)
KraneShares CSI China Internet ETF
KraneShares Bosera MSCI China A Share ETF
KraneShares E Fund China Commercial Paper ETF
KraneShares MSCI All China Index ETF (formerly, KraneShares FTSE Emerging Markets Plus ETF)
Statements of operations for the year ended March 31, 2019
Statements of changes in net assets for each of the years in the two-year period ended March 31, 2019
Financial highlights for each of the years in the three-year period ended March 31, 2019
Funds with commencement of operations during the year ended 3/31/2018:
KraneShares MSCI One Belt One Road Index ETF
Statement of operations for the year ended March 31, 2019
Statements of changes in net assets and the financial highlights for the year ended March 31, 2019 and the period from September 7, 2017 (commencement of operations) through March 29, 2018
KraneShares MSCI China Environment Index ETF
Statement of operations for the year ended March 31, 2019
Statements of changes in net assets and the financial highlights for the year ended March 31, 2019 and the period from October 12, 2017 (commencement of operations) through March 29, 2018
KraneShares Emerging Markets Consumer Technology Index ETF
Statement of operations for the year ended March 31, 2019
Statements of changes in net assets and the financial highlights for the year ended March 31, 2019 and the period from October 11, 2017 (commencement of operations) through March 29, 2018
KraneShares Electric Vehicles and Future Mobility Index ETF
Statement of operations for the year ended March 31, 2019
Statements of changes in net assets and the financial highlights for the year ended March 31, 2019 and the period from January 18, 2018 (commencement of operations) through March 29, 2018
KraneShares MSCI All China Health Care Index ETF
Statement of operations for the year ended March 31, 2019
Statements of changes in net assets and the financial highlights for the year ended March 31, 2019 and the period from January 31, 2018 (commencement of operations) through March 29, 2018
Report of Independent Registered Public Accounting Firm (concluded)
Funds with commencement of operations during the year ended 3/31/2019:
KraneShares CCBS China Corporate High Yield Bond USD Index ETF
Statements of operations and changes in net assets and the financial highlights for the period from June 26, 2018 (commencement of operations) through March 31, 2019
KraneShares Emerging Markets Healthcare Index ETF
Statements of operations and changes in net assets and the financial highlights for the period from August 29, 2018 (commencement of operations) through March 31, 2019
Trustees and Officers of the Trust (Unaudited)
March 31, 2019
Set forth below are the names, addresses, years of birth, positions with the Trust, terms of office and lengths of time served; the principal occupations for the last five years; number of Funds in fund complex overseen; and other directorships outside the fund complex of each of the persons currently serving as Trustees and Officers of the Trust. The Trust’s Statement of Additional Information (“SAI”) includes additional information about the Trustees and Officers. The SAI may be obtained without charge, upon request, by calling 1-855-857-2638. The following chart lists Trustees and Officers as of March 31, 2019.
Name, Address
(Year of Birth) | | Position(s) Held
with Funds | | Principal
Occupation(s) During
the Past 5 Years | | Number
of Funds
in Trust
Overseen by
Trustee | | Other
Directorships
Held by
Trustee |
| Interested Trustee2 |
Jonathan Krane1
(1968) 1270 Avenue
of the Americas,
22nd Floor New York,
NY 10020 | | Trustee and
Chairman of the Board, No set term; served
since 2012 | | Chief Executive Officer of Krane Funds Advisors, LLC from 2011 to present. Chief Executive of Krane Portfolio Advisors, LLC from 2018 to present. Principal of Krane Capital LLC from 2009 to 2011. Chief Executive Officer of Emma Entertainment from 2004 to 2009. | | 18 | | None |
| | | | | | | | | |
| Independent Trustees2 |
Patrick P. Campo
(1970) 1270 Avenue
of the Americas,
22nd Floor New York,
NY 10020 | | Trustee, No set term; served since 2017 | | From 2013 to present, Director of Long Short Equity, Titan Advisors; from 2009 to 2013, Director of Hedge Fund Research, Alternative Investment Management, LLC. | | 18 | | None |
| | | | | | | | | |
John Ferguson
(1966) 1270 Avenue
of the Americas,
22nd Floor New York,
NY 10020 | | Trustee, No set
term; served
since 2012 | | Chief Operating Officer of Shrewsbury River Capital from 2017 to present. Chief Operating Officer of Kang Global Investors LP (hedge fund adviser) from 2014 to 2016. President of Alden Global Capital, LLC (hedge fund adviser) from 2012 to 2014 (formerly, Chief Operating Officer from 2011 to 2012). Senior Managing Director and Chief Operating Officer of K2 Advisors, L.L.C. from 2005 to 2011. | | 18 | | None |
| | | | | | | | | |
Matthew Stroyman (1968) 1270 Avenue
of the Americas,
22nd Floor New York,
NY 10020 | | Trustee, No set
term; served
since 2012 | | Co-Founder, President and Chief Operating Officer of Arcturus (real estate asset and investment management services firm) from 2007 to present. | | 18 | | None |
Trustees and Officers of the Trust (Unaudited)(concluded)
March 31, 2019
Name, Address
(Year of Birth) | | Position(s) Held
with Funds | | Principal Occupation(s)
During the Past 5 Years | | Number
of Funds
in Trust
Overseen by
Officer | | Other
Directorships
Held by
Officer |
| Officers | | | | | | | | |
Jonathan Krane
(1968) 1270 Avenue
of the Americas,
22nd Floor New York,
NY 10020 | | Principal Executive Officer and Principal Financial Officer, No set term; served since 2012 | | Chief Executive Officer of Krane Funds Advisors, LLC from 2011 to present. Chief Executive of Krane Portfolio Advisors, LLC from 2018 to present. Principal of Krane Capital LLC from 2009 to 2011. Chief Executive Officer of Emma Entertainment from 2004 to 2009. | | 18 | | None |
| | | | | | | | | |
Jennifer Tarleton (formerly Krane)
(1966) 1270 Avenue
of the Americas,
22nd Floor New York,
NY 10020 | | Vice President and Secretary, No set term; served since 2012 | | Vice President of Krane Funds Advisors, LLC from 2011 to present. Principal of Krane Capital LLC from 2009 to 2011. Sole Practitioner of Jennifer Krane, Esq. from 2001 to 2009. | | 18 | | None |
| | | | | | | | | |
Michael Quain
(1957) 1270 Avenue
of the Americas,
22nd Floor New York,
NY 10020 | | Chief Compliance Officer and Anti-Money Laundering Officer, No set term; served since 2015 | | Principal/President of Quain Compliance Consulting, LLC from 2014 to present. First Vice President of Aberdeen Asset Management Inc. from May 2013 to September 2013. First Vice President and Chief Compliance Officer of Artio Global Management, LLC from 2004 to 2013. | | 18 | | None |
| | | | | | | | | |
James Hoffmayer3
(1973) SEI Investments Company One Freedom Valley Drive Oaks,
PA 19456 | | Assistant Treasurer, No set term; served since 2017 | | Controller and Chief Financial Officer of SEI Investments Global Funds Services from 2016 to present. Senior Director, Funds Accounting and Fund Administration of SEI Investments Global Funds Services from September 2016 to present. Senior Director of Fund Administration of SEI Investments Global Funds Services from 2014 to present. Director of Financial Reporting of SEI Investments Global Funds Services from 2004 to 2014. | | 18 | | None |
| 1 | Mr. Krane is an “interested” person of the Trust, as that term is defined in the 1940 Act, by virtue of his ownership and controlling interest in the Adviser. |
| 2 | Each Trustee serves until his or her successor is duly elected or appointed and qualified. |
| 3 | These officers of the Trust also serve as officers of one or more funds for which SEI Investments Company or an affiliate acts as investment manager, administrator or distributor. |
Disclosure of Fund Expenses (Unaudited)
As a shareholder of a Fund, you incur two types of costs: (1) transaction costs, including brokerage expenses; and (2) ongoing costs. All Exchange Traded Funds (“ETFs”) have operating expenses. As a shareholder of an ETF, your investment is affected by these ongoing costs, which include (among others) costs for ETF management, administrative services, commissions, and shareholder reports like this one. It is important for you to understand the impact of these costs on your investment returns. In addition, a shareholder is responsible for brokerage fees as a result of their investment in the Fund.
Operating expenses such as these are deducted from an ETF’s gross income and directly reduce its final investment return. These expenses are expressed as a percentage of the ETF’s average net assets; this percentage is known as the ETF’s expense ratio.
The following examples use the expense ratio and are intended to help you understand the ongoing costs (in dollars) of investing in your Fund and to compare these costs with those of other funds. The examples are based on an investment of $1,000 made at the beginning of the period shown and held for the entire period (October 1, 2018 to March 31, 2019).
The table on the next page illustrates your Fund’s costs in two ways:
Actual Fund Return. This section helps you to estimate the actual expenses that your Fund incurred over the period. The “Expenses Paid During Period” column shows the actual dollar expense cost incurred by a $1,000 investment in the Fund, and the “Ending Account Value” number is derived from deducting that expense cost from the Fund’s gross investment return.
You can use this information, together with the actual amount you invested in the Fund, to estimate the expenses you paid over that period. Simply divide your actual account value by $1,000 to arrive at a ratio (for example, an $8,600 account value divided by $1,000 = 8.6), then multiply that ratio by the number shown for your Fund under “Expenses Paid During Period.”
Hypothetical 5% Return. This section helps you compare your Fund’s costs with those of other funds. It assumes that the Fund had an annual 5% return before expenses during the year, but that the expense ratio (Column 3) for the period is unchanged. This example is useful in making comparisons because the Securities and Exchange Commission requires all funds to make this 5% calculation. You can assess your Fund’s comparative cost by comparing the hypothetical result for your Fund in the “Expenses Paid During Period” column with those that appear in the same charts in the shareholder reports for other funds.
NOTE:Because the return is set at 5% for comparison purposes — NOT your Fund’s actual return — the account values shown may not apply to your specific investment.
Please note that the expenses shown in the table are meant to highlight your ongoing costs only and do not reflect any transactional costs, including brokerage commissions on the purchases and sale of Fund shares. Therefore, the expense examples are useful in comparing ongoing costs only, and will not help you determine the relative total costs of owning different funds. If these transactional costs had been included, your costs would have been higher.
Disclosure of Fund Expenses (Unaudited)(concluded)
| | | Beginning
Account
Value
10/1/2018 | | | Ending
Account
Value
3/31/2019 | | | Annualized
Expense
Ratios | | | Expenses
Paid During
Period(1) | |
| KraneShares CICC China Leaders 100 Index ETF | | | | | | | | | | | | | | | | |
| Actual Fund Return | | $ | 1,000.00 | | | $ | 1,075.70 | | | | 0.70% | | | $ | 3.62 | |
| Hypothetical 5% Return | | | 1,000.00 | | | | 1,021.40 | | | | 0.70 | | | | 3.53 | |
| KraneShares CSI China Internet ETF | | | | | | | | | | | | | | | | |
| Actual Fund Return | | $ | 1,000.00 | | | $ | 994.50 | | | | 0.77%(2) | | | $ | 3.83 | |
| Hypothetical 5% Return | | | 1,000.00 | | | | 1,021.10 | | | | 0.77(2) | | | | 3.88 | |
| KraneShares Bosera MSCI China A Share ETF | | | | | | | | | | | | | | | | |
| Actual Fund Return | | $ | 1,000.00 | | | $ | 1,149.20 | | | | 0.60% | | | $ | 3.21 | |
| Hypothetical 5% Return | | | 1,000.00 | | | | 1,021.90 | | | | 0.60 | | | | 3.02 | |
| KraneShares E Fund China Commercial Paper ETF | | | | | | | | | | | | | | | | |
| Actual Fund Return | | $ | 1,000.00 | | | $ | 1,042.60 | | | | 0.58% | | | $ | 2.95 | |
| Hypothetical 5% Return | | | 1,000.00 | | | | 1,022.00 | | | | 0.58 | | | | 2.92 | |
| KraneShares MSCI All China Index ETF | | | | | | | | | | | | | | | | |
| Actual Fund Return | | $ | 1,000.00 | | | $ | 1,088.40 | | | | 0.71% | | | $ | 3.70 | |
| Hypothetical 5% Return | | | 1,000.00 | | | | 1,021.40 | | | | 0.71 | | | | 3.58 | |
| KraneShares MSCI One Belt One Road Index ETF | | | | | | | | | | | | | | | | |
| Actual Fund Return | | $ | 1,000.00 | | | $ | 1,022.80 | | | | 0.83% | | | $ | 4.19 | |
| Hypothetical 5% Return | | | 1,000.00 | | | | 1,020.80 | | | | 0.83 | | | | 4.18 | |
| KraneShares Emerging Markets Consumer Technology Index ETF | | | | | | | | | | | | | | | | |
| Actual Fund Return | | $ | 1,000.00 | | | $ | 1,048.00 | | | | 0.80% | | | $ | 4.08 | |
| Hypothetical 5% Return | | | 1,000.00 | | | | 1,020.90 | | | | 0.80 | | | | 4.03 | |
| KraneShares MSCI China Environment Index ETF | | | | | | | | | | | | | | | | |
| Actual Fund Return | | $ | 1,000.00 | | | $ | 1,056.20 | | | | 0.81% | | | $ | 4.15 | |
| Hypothetical 5% Return | | | 1,000.00 | | | | 1,020.90 | | | | 0.81 | | | | 4.08 | |
| KraneShares Electric Vehicles and Future Mobility Index ETF | | | | | | | | | | | | | | | | |
| Actual Fund Return | | $ | 1,000.00 | | | $ | 963.40 | | | | 0.71% | | | $ | 3.48 | |
| Hypothetical 5% Return | | | 1,000.00 | | | | 1,021.40 | | | | 0.71 | | | | 3.58 | |
| Kraneshares MSCI All China Health Care Index ETF | | | | | | | | | | | | | | | | |
| Actual Fund Return | | $ | 1,000.00 | | | $ | 1,003.50 | | | | 0.81% | | | $ | 4.05 | |
| Hypothetical 5% Return | | | 1,000.00 | | | | 1,020.90 | | | | 0.81 | | | | 4.08 | |
| KraneShares CCBS China Corporate High Yield Bond USD Index ETF | | | | | | | | | | | | | | | | |
| Actual Fund Return | | $ | 1,000.00 | | | $ | 1,050.40 | | | | 0.69% | | | $ | 3.53 | |
| Hypothetical 5% Return | | | 1,000.00 | | | | 1,021.50 | | | | 0.69 | | | | 3.48 | |
| KraneShares Emerging Market Health Care Index ET | | | | | | | | | | | | | | | | |
| Actual Fund Return | | $ | 1,000.00 | | | $ | 903.60 | | | | 0.79% | | | $ | 3.75 | |
| Hypothetical 5% Return | | | 1,000.00 | | | | 1,021.00 | | | | 0.79 | | | | 3.98 | |
| (1) | Expenses are equal to the Fund’s annualized expense ratio multiplied by the average account value over the period, multiplied by 182/365 (to reflect the one-half year period from 10/01/18-03/31/19). |
| (2) | The annualized expense ratio includes security lending fees paid to the Adviser during the six month period. Had these fees been excluded, the expense ratio would have been 0.70%. |
Notice to Shareholders (Unaudited)
For shareholders that do not have a March 31, 2019 tax year end, this notice is for informational purposes only. For shareholders with a March 31, 2019 tax year end, please consult your tax advisor as to the pertinence of this notice. For the fiscal year ended March 31, 2019, the Funds are designating the following items with regard to distributions paid during the year.
Return of
Capital(1) | | Long-Term
Capital Gain
Distributions | | | Ordinary
Income
Distributions | | | Total
Distributions | | | Qualifying
for
Corporate
Dividends
Received
Deduction(2) | | | Qualifying
Dividend
Income(3) | | | U.S.
Government
Interest(4) | | | Interest
Related
Dividends(5) | | | Short Term
Capital Gain
Dividends(6) | | | Foreign
Tax
Credit | |
| KraneShares CICC China Leaders 100 Index ETF(7) | | | | | | | | | | | | | | | | | | | | | | | |
| 0.00% | | | 44.51 | % | | | 55.49 | % | | | 100.00 | % | | | 0.96 | % | | | 33.07 | % | | | 0.00 | % | | | 0.51 | % | | | 100.00 | % | | | 1.31 | % |
| KraneShares CSI China Internet ETF | | | | | | | | | | | | | | | | | | | | | | | |
| 0.00% | | | 98.82 | % | | | 1.18 | % | | | 100.00 | % | | | 0.00 | % | | | 0.00 | % | | | 0.00 | % | | | 0.00 | % | | | 0.00 | % | | | 0.00 | % |
| KraneShares Bosera MSCI China A Share ETF(7) | | | | | | | | | | | | | | | | | | | | | | | |
| 0.00% | | | 5.93 | % | | | 94.07 | % | | | 100.00 | % | | | 0.00 | % | | | 79.87 | % | | | 0.00 | % | | | 0.10 | % | | | 100.00 | % | | | 9.32 | % |
| KraneShares E Fund China Commercial Paper ETF | | | | | | | | | | | | | | | | | | | | | | | |
| 3.90% | | | 0.00 | % | | | 96.10 | % | | | 100.00 | % | | | 0.00 | % | | | 0.00 | % | | | 0.00 | % | | | 0.00 | % | | | 0.00 | % | | | 0.00 | % |
| KraneShares MSCI All China Index ETF(7) | | | | | | | | | | | | | | | | | | | | | | | |
| 0.00% | | | 0.00 | % | | | 100.00 | % | | | 100.00 | % | | | 2.24 | % | | | 94.40 | % | | | 0.00 | % | | | 0.69 | % | | | 0.00 | % | | | 10.22 | % |
| KraneShares MSCI One Belt One Road Index ETF(7) | | | | | | | | | | | | | | | | | | | | | | | |
| 0.00% | | | 0.00 | % | | | 100.00 | % | | | 100.00 | % | | | 0.05 | % | | | 98.34 | % | | | 0.00 | % | | | 0.00 | % | | | 100.00 | % | | | 11.71 | % |
| KraneShares Emerging Markets Consumer Technology Index ETF(7) | | | | | | | | | | | | | | | | | | | | |
| 0.00% | | | 0.00 | % | | | 100.00 | % | | | 100.00 | % | | | 0.00 | % | | | 100.00 | % | | | 0.00 | % | | | 0.00 | % | | | 0.00 | % | | | 100.00 | % |
| KraneShares MSCI China Environment Index ETF(7) | | | | | | | | | | | | | | | | | | | | | | | | | |
| 0.00% | | | 0.00 | % | | | 100.00 | % | | | 100.00 | % | | | 0.00 | % | | | 35.55 | % | | | 0.00 | % | | | 0.01 | % | | | 0.00 | % | | | 3.90 | % |
| KraneShares Electric Vehicles and Future Mobility Index ETF(7) | | | | | | | | | | | | | | | | | | | | |
| 0.00% | | | 0.00 | % | | | 100.00 | % | | | 100.00 | % | | | 58.73 | % | | | 99.13 | % | | | 0.00 | % | | | 0.00 | % | | | 0.00 | % | | | 9.22 | % |
| KraneShares MSCI All China Health Care Index ETF(7) | | | | | | | | | | | | | | | | | | | | | | | |
| 0.00% | | | 0.00 | % | | | 100.00 | % | | | 100.00 | % | | | 0.00 | % | | | 100.00 | % | | | 0.00 | % | | | 0.00 | % | | | 100.00 | % | | | 14.19 | % |
| KraneShares CCBS China Corporate High Yield Bond USD Index ETF | | | | | | | | | | | | | | | | | | | | |
| 11.66% | | | 0.00 | % | | | 88.34 | % | | | 100.00 | % | | | 0.00 | % | | | 0.00 | % | | | 0.00 | % | | | 0.00 | % | | | 100.00 | % | | | 0.00 | % |
| KraneShares Emerging Markets Healthcare Index ETF(7) | | | | | | | | | | | | | | | | | | | | | | | |
| 0.00% | | | 0.00 | % | | | 100.00 | % | | | 100.00 | % | | | 0.00 | % | | | 33.16 | % | | | 0.00 | % | | | 0.00 | % | | | 0.00 | % | | | 60.96 | % |
| (1) | Return of capital is a payment received from the fund that is not considered to be taxable income. The return of capital distribution is considered to be a return of the investor’s original investment and reduces the investor’s cost basis in the fund. |
| (2) | Qualifying dividends represent dividends which qualify for the corporate dividends received deduction and is reflected as a percentage of ordinary income distributions (the total of short term capital gain and net investment income distributions). |
| (3) | The percentage in this column represents the amount of “Qualifying Dividend Income” as created by the Jobs and Growth Relief Reconciliation Act of 2003 and is reflected as a percentage of ordinary income distributions (the total of short term capital gain and net investment income distributions). It is the intention of each of the aforementioned funds to designate the maximum amount permitted by law. |
| (4) | “U.S. Government Interest” represents the amount of interest that was derived from U.S. Government obligations and distributed during the fiscal year. Generally, interest from direct U.S. Government obligations is exempt from state income tax. However, for shareholders who are residents of California, Connecticut and New York, the statutory threshold requirements were not satisfied to permit exemption of these amounts from state income. |
| (5) | The percentage in this column represents the amount of “Interest Related Dividends” and is reflected as a percentage of ordinary income distributions that is exempt from U.S. withholding tax when paid for foreign investors. |
Notice to Shareholders (Unaudited)(concluded)
| (6) | The percentage in this column represents the amount of “Short Term Capital Gain Dividends” and is reflected as a percentage of short term capital gain distributions that is exempt from U.S. withholding tax when paid for foreign investors. |
| (7) | The KraneShares CICC China Leaders 100 Index ETF, KraneShares Bosera MSCI China A Share ETF, KraneShares MSCI All China Index ETF, KraneShares MSCI One Belt One Road Index ETF, KraneShares Emerging Markets Consumer Technology Index ETF, KraneShares MSCI China Environment Index ETF, KraneShares Electric Vehicles and Future Mobility Index ETF, KraneShares MSCI All China Health Care Index ETF and KraneShares Emerging Markets Healthcare Index ETF intend to pass through a foreign tax credit to their shareholders. For the fiscal year ended March 31, 2019, the total amount of foreign source income is $92,464, $8,502,758, $30,751, $622,924, $69,739, $118,003, $342,820, $114,678 and $5,987, respectively. The total amount of foreign tax to be paid is $5,910, $1,118,544, $4,905, $73,398, $25,628, $4,354, $38,797, $22,612 and $1,174, respectively. The allocable share of foreign tax credit will be reported on Form 1099-DIV. |
Supplemental Information (Unaudited)
Net asset value, or “NAV”, is the price per Share at which the Funds issue and redeem Shares to Authorized Participants. It is calculated in accordance with the policies described in Note 2 in Notes to Financial Statements. The “Market Price” of the Funds generally is determined using the midpoint between the highest bid and the lowest offer on the stock exchange on which the Shares of the Funds are listed for trading, as of the time that the Funds’ NAV is calculated. The Funds’ Market Price may be at, above or below their NAV. The NAV of the Funds will fluctuate with changes in the market value of their holdings. The Market Price of the Funds will fluctuate in accordance with changes in their NAV, as well as market supply and demand of Fund Shares.
Premiums or discounts are the differences (expressed as a percentage) between the NAV and Market Price of the Funds on a given day, generally at the time NAV is calculated. A premium is the amount that the Funds are trading above the reported NAV, expressed as a percentage of the NAV. A discount is the amount that the Funds are trading below the reported NAV, expressed as a percentage of the NAV. Shareholders may pay more than NAV when they buy Fund Shares and receive less than NAV when they sell those Shares, because Shares are bought and sold at Market Price.
Further information regarding premiums and discounts is available on the Funds’ website athttp://kraneshares.com. The premium and discount information contained on the website represents past performance and cannot be used to predict future results.
(This page intentionally left blank.)
(This page intentionally left blank.)
(This page intentionally left blank.)
KraneShares Trust:
1270 Avenue of the Americas, 22nd Floor
New York, New York 10020
1-855-857-2638
http://kraneshares.com/
Investment Adviser:
Krane Funds Advisors, LLC
1270 Avenue of the Americas, 22nd Floor
New York, New York 10020
Distributor:
SEI Investments Distribution Co.
One Freedom Valley Drive
Oaks, PA 19456
Administrator:
SEI Investments Global Funds Services
One Freedom Valley Drive
Oaks, PA 19456
This information must be preceded or accompanied by a current prospectus for the Funds described.
KraneShares Trust:
1270 Avenue of the Americas, 22nd Floor
New York, New York 10020
KRS-AR-001-0600
The Registrant has adopted a code of ethics that applies to the Registrant's principal executive officer, principal financial officer, controller or principal accounting officer or any person who performs a similar function. During the period covered by the report, there were no amendments to the code of ethics, and the Registrant did not grant any waivers from a provision of the code of ethics.
| Item 3. | Audit Committee Financial Expert. |
(a) (1) The Registrant’s Board of Trustees has determined that the Registrant has an audit committee financial expert serving on the audit committee.
(a) (2) The audit committee financial expert, John Ferguson, is an independent trustee as defined in Form N-CSR Item 3 (a) (2)
| Item 4. | Principal Accountant Fees and Services. |
Fees billed by KPMG LLP (“KPMG”) related to the Registrant.
KPMG billed the Registrant aggregate fees for services rendered to the Registrant for the last two fiscal years as follows:
| | 2019 | 2018 |
| | | All fees and services to the Registrant that were pre-approved | All fees and services to service affiliates that were pre-approved | All other fees and services to service affiliates that did not require pre-approval | All fees and services to the Registrant that were pre-approved | All fees and services to service affiliates that were pre-approved | All other fees and services to service affiliates that did not require pre-approval |
| (a) | Audit Fees | $232,400 | $0 | N/A | $171,400 | $0 | N/A |
| (b) | Audit-Related Fees | $0 | $0 | N/A | $0 | $0 | N/A |
| (c) | Tax Fees(1) | $42,660 | $0 | N/A | $33,280 | $0 | N/A |
| (d) | All Other Fees | $0 | $0 | N/A | $0 | $0 | N/A |
Notes:
(1) These services included tax return preparation and tax compliance for the Funds.
(e)(1) Pursuant to the requirements of the Sarbanes Act, the SEC adopted Rule 2-01 under Regulation S-X, which, among other things, requires a fund’s audit committee to pre-approve certain audit and non-audit services that are provided by its independent auditors in order to ensure the auditors’ independence. The Registrant’s Board of Trustees has established an Audit Committee that has been charged with, among other things, assisting the Board of Trustees in its oversight of: the Registrant’s independent auditors; preapproving all audit and non-audit services provided by the Registrant’s independent auditors; the integrity of the Funds’ financial statements; the independent auditors’ qualifications and independence; and the use of appropriate accounting principles.
(e)(2) Percentage of fees billed applicable to non-audit services approved pursuant to the “de minimis” exception of Rule 2-01(c)(7)(i)(C) were as follows for KPMG:
| | 2019 | 2018 |
Audit-Related Fees | 0% | 0% |
| Tax Fees | 0% | 0% |
All Other Fees | 0% | 0% |
(f) Not applicable.
(g) The aggregate non-audit fees and services billed by KPMG for the last two fiscal years were $42,660 and $33,280, respectively.
(h) During the past fiscal year, all non-audit services provided by the Registrant’s principal accountant to either the Registrant's investment adviser or to entities controlling, controlled by, or under common control with the Registrant’s investment adviser that provides ongoing services to the Registrant were pre-approved by the Audit Committee of the Registrant's Board of Trustees. Included in the audit committee’s pre-approval was the review and consideration as to whether the provision of these non-audit services is compatible with maintaining the principal accountant’s independence.
| Items 5. | Audit Committee of Listed Registrants. |
The Registrant has a separately-designated standing Audit Committee, which is composed of the Registrant's Independent Trustees, Messrs. Patrick Campo, John Ferguson and Matthew Stroyman.
| Item 6. | Schedule of Investments |
Schedule of Investments is included as part of the Report to Shareholders filed under Item 1 of this form.
| Item 7. | Disclosure of Proxy Voting Policies and Procedures for Closed-End Management Investment Companies. |
Not applicable to open-end management investment companies.
| Item 8. | Portfolio Managers of Closed-End Management Investment Companies |
Not applicable to open-end management investment companies.
| Item 9. | Purchases of Equity Securities by Closed-End Management Company and Affiliated Purchasers. |
Not applicable to open-end management investment companies.
| Item 10. | Submission of Matters to a Vote of Security Holders. |
There have been no changes to the procedures by which shareholders may recommend nominees to the Registrant’s Board of Trustees during the period covered by this report.
| Item 11. | Controls and Procedures. |
(a) The Registrant’s principal executive and principal financial officers, or persons performing similar functions, have concluded that the Registrant’s disclosure controls and procedures (as defined in Rule 30a-3(c) under the Act (17 CFR § 270.30a-3(c)) as of a date within 90 days of the filing date of the report, are effective based on the evaluation of these controls and procedures required by Rule 30a-3(b) under the Act (17 CFR § 270.30a-3(b)) and Rules 13a-15(b) or 15d-15(b) under the Exchange Act of 1934 (17 CFR § 240.13a-15(b) or § 240.15d-15(b)).
(b)There has been no change in the Registrant’s internal control over financial reporting (as defined in Rule 30a-3(d) under the 1940 Act (17 CFR § 270.30a-3(d)) that occurred during the period covered by this report that has materially affected, or is reasonably likely to materially affect, the Registrant’s internal control over financial reporting.
| Item 12. | Disclosure of Securities Lending Activities for Closed-End Management Investment Companies. |
Not applicable to open-end management investment companies.
(a)(1) Code of Ethics attached hereto.
(a)(2) A certification for the principal executive officer and the principal financial officer of the Registrant as required by Rule 30a-2(a) under the 1940 Act, as amended (17 CFR 270.30a-2(a)), is filed herewith.
(b) Officer certification as required by Rule 30a-2(b) under the 1940 Act, as amended (17 CFR 270.30a-2(b)) also accompany this filing as an exhibit.
SIGNATURES
Pursuant to the requirements of the Securities Exchange Act of 1934 and the Investment Company Act of 1940, the Registrant has duly caused this report to be signed on its behalf by the undersigned, thereunto duly authorized.
| | | KraneShares Trust |
| | | |
| By: | | /s/ Jonathan Krane |
| | Jonathan Krane |
| | | Principal Executive Officer |
Date: June 7, 2019
Pursuant to the requirements of the Securities Exchange Act of 1934 and the Investment Company Act of 1940, this report has been signed below by the following persons on behalf of the registrant and in the capacities and on the dates indicated.
| | | |
| By: | | /s/ Jonathan Krane |
| | Jonathan Krane |
| | | Principal Executive Officer |
Date: June 7, 2019
| | | |
| By: | | /s/ Jonathan Krane |
| | Jonathan Krane |
| | | Principal Financial Officer |
Date: June 7, 2019