Stacy L. Fuller
Item 1. Reports to Stockholders.
The Registrant’s schedules as of the close of the reporting period, as set forth in §§ 210.12-12 through 210.12-14 of Regulation S-X [17 CFR §§ 210-12.12-12.14], are attached hereto.

Annual Report
KraneShares Bosera MSCI China A Share ETF
KraneShares Zacks New China ETF
KraneShares CSI China Internet ETF
KraneShares E Fund China Commercial Paper ETF
KraneShares FTSE Emerging Markets Plus ETF
KraneShares MSCI One Belt One Road Index ETF
KraneShares Emerging Markets Consumer Technology Index ETF
KraneShares MSCI China Environment Index ETF
KraneShares Electric Vehicles and Future Mobility Index ETF
KraneShares MSCI All China Health Care Index ETF
March 31, 2018
Table of Contents
Management Discussion of Fund Performance (Unaudited) | | 1 |
Schedules of Investments | | |
KraneShares Bosera MSCI China A Share ETF | | 24 |
KraneShares Zacks New China ETF | | 32 |
KraneShares CSI China Internet ETF | | 36 |
KraneShares E Fund China Commercial Paper ETF | | 38 |
KraneShares FTSE Emerging Markets Plus ETF | | 41 |
KraneShares MSCI One Belt One Road Index ETF | | 50 |
KraneShares Emerging Markets Consumer Technology Index ETF | | 55 |
KraneShares MSCI China Environment Index ETF | | 58 |
KraneShares Electric Vehicles and Future Mobility Index ETF | | 60 |
KraneShares MSCI All China Health Care Index ETF | | 64 |
Statements of Assets and Liabilities | | 67 |
Statements of Operations | | 71 |
Statements of Changes in Net Assets | | 75 |
Financial Highlights | | 82 |
Notes to Financial Statements | | 86 |
Report of Independent Registered Public Accounting Firm | | 106 |
Trustees and Officers of the Trust (Unaudited) | | 108 |
Approval of Investment Advisory Agreement (Unaudited) | | 110 |
Disclosure of Fund Expenses (Unaudited) | | 116 |
Notice to Shareholders (Unaudited) | | 118 |
Supplemental Information (Unaudited) | | 119 |
The Funds file their complete schedules of Fund holdings with the Securities and Exchange Commission (the “Commission”) for the first and third quarters of each fiscal year on Form N-Q within sixty days after the end of the period. The Funds’ Forms N-Q are available on the Commission’s website at http://www.sec.gov, and may be reviewed and copied at the Commission’s Public Reference Room in Washington, DC. Information on the operation of the Public Reference Room may be obtained by calling 1-800-SEC-0330.
A description of the policies and procedures that KraneShares Trust uses to determine how to vote proxies relating to Fund securities, as well as information relating to how the Funds voted proxies relating to Fund securities during the most recent 12-month period ended June 30, are available (i) without charge, upon request, by calling 1-855-8KRANE8; and (ii) on the Commission’s website at http://www.sec.gov.
Fund shares may only be purchased or redeemed from a Fund in large Creation Unit aggregations. Investors who cannot transact in Creation Units of a Fund’s shares must buy or sell Fund shares in the secondary market at their market price, which may be at a premium or discount to a Fund’s net asset value, with the assistance of a broker. In doing so, the investor may incur brokerage commissions and may pay more than net asset value when buying Fund shares and receive less than net asset value when selling Fund shares.
Management Discussion of Fund Performance (Unaudited)
Dear Shareholders:
We are pleased to send you the Annual Report for KraneShares exchange-traded funds (“ETFs”) for the 12-month period ended March 29, 2018.
For the period, the ETFs delivered the following total returns:
| | | | | | | | Morningstar
Peer Group
Median |
KraneShares Bosera MSCI China A Share ETF (KBA) | | | | 22.68%· | | 17.99%· | (a) | | 24.43%· | (1) |
KraneShares Zacks New China ETF (KFYP) | | | | 22.57%· | | 15.32%· | (b) | | 24.43%· | (1) |
KraneShares CSI China Internet ETF (KWEB) | | | | 45.62%· | | 45.80%· | (c) | | 24.43%· | (1) |
KraneShares E Fund China Commercial Paper
ETF (KCNY) | | | | 13.44%· | | 14.52%· | (d) | | 10.17%· | (2) |
KraneShares FTSE Emerging Markets Plus
ETF (KEMP) | | | | 20.99%· | | 19.47%· | (e) | | 20.95%· | (3) |
KraneShares MSCI One Belt One Road Index
ETF (OBOR) | | | | 2.67%^ | | 2.57%^ | (f) | | -5.57%^ | (4) |
KraneShares Emerging Markets Consumer Technology Index ETF (KEMQ) | | | | 5.92%^ | | 8.02%^ | (g) | | 5.10%^ | (5) |
KraneShares MSCI China Environment Index
ETF (KGRN) | | | | -4.56%^ | | -4.31%^ | (h) | | 3.22%^ | (6) |
KraneShares Electric Vehicles and Future Mobility Index ETF (KARS) | | | | -6.80%^ | | -7.13%^ | (i) | | -5.19%^ | (7) |
KraneShares MSCI All China Health Care Index
ETF (KURE) | | | | 6.60%^ | | 7.46%^ | (j) | | -7.79%^ | (8) |
For comparison, below are the returns of broad-based U.S. and international market indexes, including emerging market and China indexes. The Funds do not track any of the below indexes but the indexes provide measures of the broad market performance of U.S. and international equities, including emerging market and China equities.
| | |
S&P 500 Index | | 13.99 | % |
JPMorgan EMBI Global Core Index | | 7.68 | % |
MSCI Emerging Markets Index | | 21.71 | % |
MSCI China A Index | | 8.72 | % |
We are encouraged by the steady progress being made by China to increase access to local Mainland Chinese markets for international investors, as well as by the heightened demand and awareness of these markets by the global investor community.
· We believe that China will continue to grow and be an essential element of a well-designed investment portfolio.
· We believe that investors should have low-cost, transparent tools to obtain exposure to Chinese equity and fixed income markets.
1
Management Discussion of Fund Performance (Unaudited) (continued)
· We are dedicated to helping investors obtain more complete passive market exposures and more balanced investment portfolios.
Thank you for investing with us.
Jonathan Krane, CEO
March 29, 2018
| | Morningstar
Peer Group Median | | Morningstar Peer Group Name |
(1) | | 24.43% | | U.S. Fund China Region |
(2) | | 10.17% | | U.S. Fund Emerging Markets Local Currency Bond |
(3) | | 20.95% | | U.S. Fund Diversified Emerging Markets |
(4) | | -5.57% | | U.S. Fund Infrastructure as of September 7, 2017 |
(5) | | 5.10% | | U.S. Fund Diversified Emerging Markets as October 11, 2017 |
(6) | | 3.22% | | U.S. Fund China Region as of October 12, 2017 |
(7) | | -5.19% | | U.S. Fund Industrials as of January 18, 2018 |
(8) | | -7.79% | | U.S. Fund China Region as of January 31, 2018 |
The S&P 500 Index is a market capitalization weighted composite index of 500 large-cap U.S. companies.
The MSCI China A Index is a free-float adjusted market capitalization weighted index that is designed to track the equity market performance of large-cap and mid-cap Chinese securities (‘‘A Shares’’).
The JPMorgan EMBI Global Core Index is a broad, diverse U.S. dollar denominated emerging markets debt benchmark that tracks the total return of actively traded debt instruments in emerging market countries.
The MSCI Emerging Markets Index is a free-float adjusted market capitalization index that is designed to measure equity market performance of emerging markets.
The Morningstar Fund China Region Category portfolios invest almost exclusively in stocks from China, Taiwan, and Hong Kong. These portfolios invest at least 70% of total assets in equities and invest at least 75% of stock assets in one specific region or a combination of China, Taiwan, and/or Hong Kong.
The Morningstar Fund Emerging Markets Local Currency Bond Category portfolios invest more than 65% of their assets in foreign bonds from developing countries in the local currency. Funds in this category have a mandate to maintain exposure to currencies of emerging markets. The largest portion of the emerging-markets bond market comes from Latin America, followed by Eastern Europe, Africa, the Middle East, and Asia.
2
Management Discussion of Fund Performance (Unaudited) (continued)
The Morningstar Fund Diversified Emerging Markets Category portfolios tend to divide their assets among 20 or more nations, although they tend to focus on the emerging markets of Asia and Latin America rather than on those of the Middle East, Africa, or Europe. These portfolios invest predominantly in emerging market equities, but some funds also invest in both equities and fixed income investments from emerging markets.
The Morningstar Fund Infrastructure Category portfolios tend to invest more than 60% of their assets in stocks of companies engaged in infrastructure activities. Industries considered to be part of the infrastructure sector include: oil & gas midstream; waste management; airports; integrated shipping; railroads; shipping & ports; trucking; engineering & construction; infrastructure operations; and the utilities sector.
The Morningstar Fund Industrials Category portfolios seek capital appreciation by investing in equity securities of U.S. or non-U.S. companies that are engaged in services related to cyclical industries. This includes and is not limited to companies in aerospace and defense, automotive, chemicals, construction, environmental services, machinery, paper and transportation.
3
Management Discussion of Fund Performance (Unaudited) (continued)
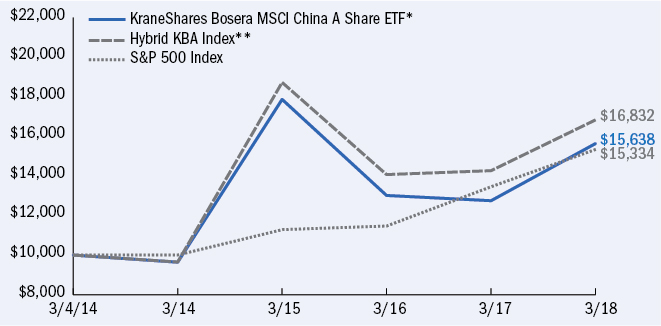
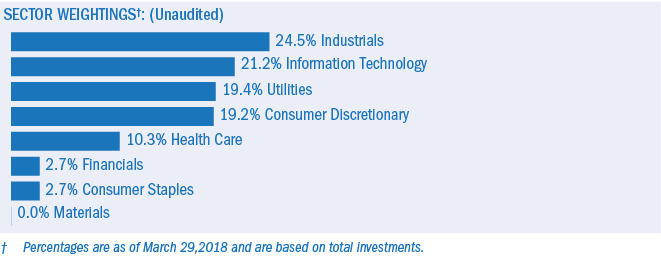
KraneShares Bosera MSCI China A Share ETF
The KraneShares Bosera MSCI China A Share ETF (the ‘‘Fund’’) seeks to provide investment results that, before fees and expenses, correspond to the price and yield performance of the MSCI China A Inclusion Index (the ‘‘Underlying Index’’).
The Underlying Index is designed to track the progressive partial inclusion of A shares in the MSCI Emerging Markets Index over time. The index is designed for global investors accessing the A shares market using the Stock Connect framework and is calculated using China A Stock Connect listings based on the offshore RMB exchange rate (CNH).
The Fund outperformed the Underlying Index due to changes in the values of securities held, liquidated and purchased in connection with index transition and rebalancing transactions.
China review
In the fiscal year from April 1, 2017 through March 29, 2018, global equity markets saw steady appreciation through late January followed by a correction due to rising concerns over inflation, interest rate hikes, and protectionist trade policies. Since then, markets have mostly recovered but with increased volatility. Chinese equities have performed in line with the rest of the world.
Despite the increase in volatility we see a number of bright spots for China’s capital markets.
· Global institutional flows into China have increased leading up to the June 1st 2018 inclusion of Mainland listed Chinese securities (A-shares) into leading index provider MSCI’s Global Standard Indexes.
· In 2017, Chinese E-Commerce sales surpassed $1 trillion USD for the first time. Total retail sales reached $5.8 trillion USD, surpassing total annual retail sales in the United States for the first time.
· China’s equity market was up for the period, returning 29.6%, while China’s currency, the renminbi (RMB) saw steady appreciation, rising 9.4% against the US dollar.
· The best performing sectors across China’s equity markets included Information Technology (+60.8%), Real Estate (+56.4%) and Consumer Staples (+56.3%).
· The worst performing sectors across China’s equity markets were Utilities (+14.1%), Industrials (+3.1%) and Telecom (-9.7%).
By the Fund’s fiscal year end on March 29, 2018 (the ‘‘reporting period’’), the NAV of the Fund increased 22.68% for the year, while the Underlying Index increased 17.99%.
The Fund held 33% of the portfolio in Financials and 14% in the Industrial Sector.
4
Management Discussion of Fund Performance (Unaudited) (continued)
KraneShares Bosera MSCI China A Share ETF (concluded)
Growth of a $10,000 Investment‡
(at Net Asset Value)‡
AVERAGE TOTAL RETURN FOR THE PERIOD ENDED MARCH 29, 2018*†
| | | | | | Annualized
Inception to Date |
| | | | | | | | | | | | |
KraneShares Bosera MSCI China A Share ETF | | 22.68 | % | | 22.74 | % | ‡ | | -4.35 | %‡ | | -3.73 | % | ‡ | | 11.60 | ‡% | | 12.02 | % | ‡ |
Hybrid KBA Index** | | N/A | | | 17.99 | % | ‡ | | N/A | | | -3.50 | % | ‡ | | N/A | | | 13.64 | % | ‡ |
S&P 500 Index | | N/A | | | 13.99 | % | ‡ | | N/A | | | 10.78 | % | ‡ | | N/A | | | 11.06 | % | ‡ |
5
Management Discussion of Fund Performance (Unaudited) (continued)
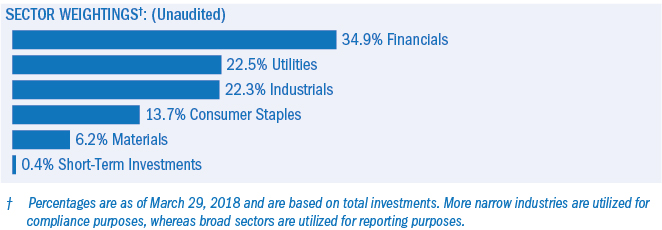
KraneShares Zacks New China ETF
The KraneShares Zacks New China ETF (the ‘‘Fund’’) seeks to provide investment results that, before fees and expenses, correspond generally to the price and yield performance of the Zacks New China Index (the ‘‘Underlying Index’’).
The Underlying Index provides exposure to companies listed in Mainland China, Hong Kong and the United States whose primary business or businesses the index sponsor, Zacks Index Services (‘‘Zacks’’), has determined are important in the current Five-Year Plan of the central Chinese government.
The Fund outperformed the Underlying Index due to changes in the values of securities held, liquidated and purchased in connection with index rebalancing transactions.
China review
In the fiscal year from April 1, 2017 through March 29, 2018, global equity markets saw steady appreciation through late January followed by a correction due to rising concerns over inflation, interest rate hikes, and protectionist trade policies. Since then, markets have mostly recovered but with increased volatility. Chinese equities have performed in line with the rest of the world.
Despite the increase in volatility we see a number of bright spots for China’s capital markets.
· Global institutional flows into China have increased leading up to the June 1st 2018 inclusion of Mainland listed Chinese securities (A-shares) into leading index provider MSCI’s Global Standard Indexes.
· In 2017, Chinese E-Commerce sales surpassed $1 trillion USD for the first time. Total retail sales reached $5.8 trillion USD, surpassing total annual retail sales in the United States for the first time.
· China’s equity market was up for the period, returning 29.6%, while China’s currency, the renminbi (RMB) saw steady appreciation, rising 9.4% against the US dollar.
· The best performing sectors across China’s equity markets included Information Technology (+60.8%), Real Estate (+56.4%) and Consumer Staples (+56.3%).
· The worst performing sectors across China’s equity markets were Utilities (+14.1%), Industrials (+3.1%) and Telecom (-9.7%).
By the Fund’s fiscal year end on March 29, 2018 (the ‘‘reporting period’’), the NAV of the Fund increased 22.57% for the year, while the Underlying Index increased 15.32%.
The Fund held 25% of the portfolio in Industrials and 21% in the Technology Sector.
6
Management Discussion of Fund Performance (Unaudited) (continued)
KraneShares Zacks New China ETF (concluded)
Growth of a $10,000 Investment‡
(at Net Asset Value)‡

AVERAGE TOTAL RETURN FOR THE PERIOD ENDED MARCH 29, 2018*†
| | | | | | Annualized
Inception to Date |
| | | | | | | | | | | | |
KraneShares Zacks New China ETF | | 22.57 | % | | 21.52 | % | ‡ | | 11.29% | ‡ | | 11.31 | % | ‡ | | 14.72% | ‡ | | 14.37 | % | ‡ |
Hybrid CSI Overseas China Five-Year Plan Index/Zacks New China Index** | | N/A | | | 15.32 | % | ‡ | | N/A | | | 10.18 | % | ‡ | | N/A | | | 14.02 | % | ‡ |
S&P 500 Index | | N/A | | | 13.99 | % | ‡ | | N/A | | | 10.78 | % | ‡ | | N/A | | | 12.21 | % | ‡ |
7
Management Discussion of Fund Performance (Unaudited) (continued)
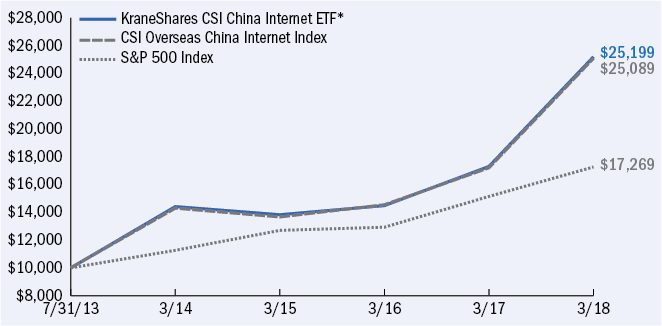
KraneShares CSI China Internet ETF
The KraneShares CSI China Internet ETF (the ‘‘Fund’’) seeks to provide investment results that, before fees and expenses, correspond generally to the price and yield performance of the CSI Overseas China Internet Index (the ‘‘Underlying Index’’).
The Underlying Index is designed to measure the performance of the investable universe of publicly traded China-based companies whose primary business or businesses are in the Internet and Internet-related sectors (‘‘China Internet Companies’’), as defined by the index sponsor, China Securities Index Co., Ltd. (‘‘CSI’’).
China review
In the fiscal year from April 1, 2017 through March 29, 2018, global equity markets saw steady appreciation through late January followed by a correction due to rising concerns over inflation, interest rate hikes, and protectionist trade policies. Since then, markets have mostly recovered but with increased volatility. Chinese equities have performed in line with the rest of the world.
Despite the increase in volatility we see a number of bright spots for China’s capital markets.
· Global institutional flows into China have increased leading up to the June 1st 2018 inclusion of Mainland listed Chinese securities (A-shares) into leading index provider MSCI’s Global Standard Indexes.
· In 2017, Chinese E-Commerce sales surpassed $1 trillion USD for the first time. Total retail sales reached $5.8 trillion USD, surpassing total annual retail sales in the United States for the first time.
· China’s equity market was up for the period, returning 29.6%, while China’s currency, the renminbi (RMB) saw steady appreciation, rising 9.4% against the US dollar.
· The best performing sectors across China’s equity markets included Information Technology (+60.8%), Real Estate (+56.4%) and Consumer Staples (+56.3%).
· The worst performing sectors across China’s equity markets were Utilities (+14.1%), Industrials (+3.1%) and Telecom (-9.7%).
By the Fund’s fiscal year end on March 29, 2018 (the ‘‘reporting period’’), the NAV of the Fund increased 45.62% for the year, while the Underlying Index increased 45.80%.
The Fund held 67% of the portfolio in Technology and 20% in the Consumer Discretionary Sector.
8
Management Discussion of Fund Performance (Unaudited) (continued)
KraneShares CSI China Internet ETF (concluded)
Growth of a $10,000 Investment‡
(at Net Asset Value)‡
AVERAGE TOTAL RETURN FOR THE PERIOD ENDED MARCH 29, 2018*†
| | | | | | Annualized
Inception to Date |
| | | | | | | | | | | | |
KraneShares CSI China Internet ETF | | 45.62 | % | | 45.42 | % | ‡ | | 22.14 | %‡ | | 22.16 | % | ‡ | | 21.90 | %‡ | | 21.94 | % | ‡ |
CSI Overseas China Internet Index | | N/A | | | 45.80 | % | ‡ | | N/A | | | 22.43 | % | ‡ | | N/A | | | 21.78 | % | ‡ |
S&P 500 Index | | N/A | | | 13.99 | % | ‡ | | N/A | | | 10.78 | % | ‡ | | N/A | | | 12.41 | % | ‡ |
9
Management Discussion of Fund Performance (Unaudited) (continued)
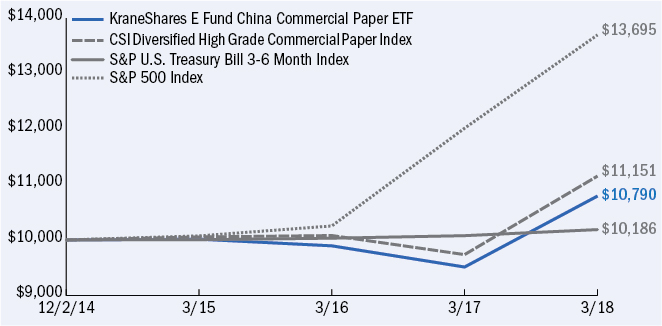
KraneShares E Fund China Commercial Paper ETF
The KraneShares E Fund China Commercial Paper ETF (the ‘‘Fund’’) seeks to provide investment results that, before fees and expenses, correspond to the price and yield performance of the CSI Diversified High Grade Commercial Paper Index (the ‘‘Underlying Index’’).
The Underlying Index seeks to deliver a diversified basket of investment-grade (according to a Chinese ratings organization) on-shore renminbi (“RMB”)-denominated commercial paper issued by sovereign, quasi-sovereign and corporate issuers in the People’s Republic of China and traded in the inter-bank bond market. A commercial paper issue must have at least RMB ¥600 million outstanding and a remaining term to final maturity of no more than one year (365 days) and no less than one month (31 days).
China review
In the fiscal year from April 1, 2017 through March 29, 2018, global equity markets saw steady appreciation through late January followed by a correction due to rising concerns over inflation, interest rate hikes, and protectionist trade policies. Since then, markets have mostly recovered but with increased volatility. Chinese equities have performed in line with the rest of the world.
Despite the increase in volatility we see a number of bright spots for China’s capital markets.
· Global institutional flows into China have increased leading up to the June 1st 2018 inclusion of Mainland listed Chinese securities (A-shares) into leading index provider MSCI’s Global Standard Indexes.
· In 2017, Chinese E-Commerce sales surpassed $1 trillion USD for the first time. Total retail sales reached $5.8 trillion USD, surpassing total annual retail sales in the United States for the first time.
· China’s equity market was up for the period, returning 29.6%, while China’s currency, the renminbi (RMB) saw steady appreciation, rising 9.4% against the US dollar.
By the Fund’s fiscal year end on March 29, 2018 (the ‘‘reporting period’’), the NAV of the Fund increased 13.44% for the year, while the Underlying Index increased 14.52%.
Yields in Mainland China’s Interbank Bond Market remained attractive. Short term yields on one-year maturities rose 0.45% year over year to 3.30%, or 1.20% higher than equivalent yields in the United States.
10
Management Discussion of Fund Performance (Unaudited) (continued)
KraneShares E Fund China Commercial Paper ETF (concluded)
Growth of a $10,000 Investment‡
(at Net Asset Value)‡
AVERAGE ANNUAL TOTAL RETURN FOR THE PERIOD ENDED MARCH 29, 2018*†
| | | | | | Annualized
Inception to Date |
| | | | | | | | | | | | |
KraneShares E Fund China Commercial Paper ETF | | 13.44 | % | | 13.73 | % | ‡ | | 2.52 | %‡ | | 2.63 | % | ‡ | | 2.31 | %‡ | | 2.21 | % | ‡ |
CSI Diversified High Grade Commercial Paper Index | | N/A | | | 14.52 | % | ‡ | | N/A | | | 3.51 | % | ‡ | | N/A | | | 3.33 | % | ‡ |
S&P U.S. Treasury Bill 3-6 Month Index** | | N/A | | | 1.08 | % | ‡ | | N/A | | | 0.60 | % | ‡ | | N/A | | | 0.56 | % | ‡ |
S&P 500 Index | | N/A | | | 13.99 | % | ‡ | | N/A | | | 10.78 | % | ‡ | | N/A | | | 9.91 | % | ‡ |
11
Management Discussion of Fund Performance (Unaudited) (continued)
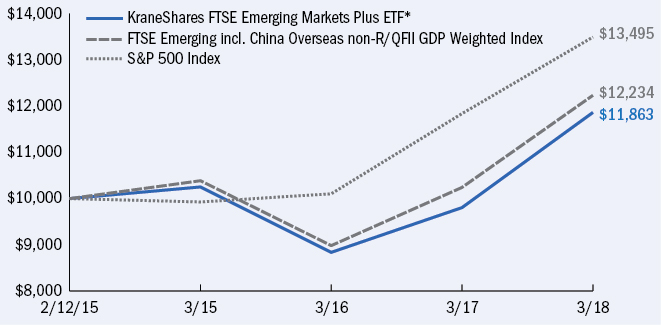
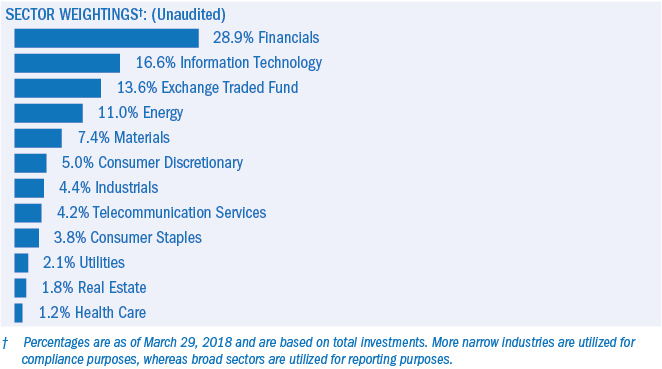
KraneShares FTSE Emerging Markets Plus ETF
The KraneShares FTSE Emerging Markets Plus ETF (the ‘‘Fund’’) seeks to provide investment results that, before fees and expenses, correspond to the price and yield performance of the FTSE Emerging incl. China Overseas non-R/QFII GDP Weighted Index (the ‘‘Underlying Index’’).
The Underlying Index is a gross domestic product (‘‘GDP’’) weighted index of large and mid-cap issuers in emerging markets. As a result of the GDP weighting, the emerging markets with the largest GDPs have the heaviest weightings in the Underlying Index. As of March 29, 2018, the largest markets in the Underlying Index were China and India.
China review
In the fiscal year from April 1, 2017 through March 29, 2018, global equity markets saw steady appreciation through late January followed by a correction due to rising concerns over inflation, interest rate hikes, and protectionist trade policies. Since then, markets have mostly recovered but with increased volatility. Chinese equities have performed in line with the rest of the world.
Despite the increase in volatility we see a number of bright spots for China’s capital markets.
· Global institutional flows into China have increased leading up to the June 1st 2018 inclusion of Mainland listed Chinese securities (A-shares) into leading index provider MSCI’s Global Standard Indexes.
· In 2017, Chinese E-Commerce sales surpassed $1 trillion USD for the first time. Total retail sales reached $5.8 trillion USD, surpassing total annual retail sales in the United States for the first time.
· China’s equity market was up for the period, returning 29.6%, while China’s currency, the renminbi (RMB) saw steady appreciation, rising 9.4% against the US dollar.
· The best performing sectors across China’s equity markets included Information Technology (+60.8%), Real Estate (+56.4%) and Consumer Staples (+56.3%).
· The worst performing sectors across China’s equity markets were Utilities (+14.1%), Industrials (+3.1%) and Telecom (-9.7%).
By the Fund’s fiscal year end on March 29, 2018 (the ‘‘reporting period’’), the NAV of the Fund increased 20.99% for the year, while the Underlying Index increased 19.47%.
The Fund held large country positions in China (39.6%) and India (14.8%), while 29% of the portfolio was in Financials, and 17% in the Technology Sector.
12
Management Discussion of Fund Performance (Unaudited) (continued)
KraneShares FTSE Emerging Markets Plus ETF (concluded)
Growth of a $10,000 Investment‡
(at Net Asset Value)‡
AVERAGE TOTAL RETURN FOR THE PERIOD ENDED MARCH 29, 2018*†
| | | | | | Annualized
Inception to Date |
| | | | | | | | | | | | |
KraneShares FTSE Emerging Markets Plus ETF | | 20.99 | % | | 22.05 | % | ‡ | | 4.99 | %‡ | | 5.19 | % | ‡ | | 5.61 | %‡ | | 6.12 | % | ‡ |
FTSE Emerging incl. China Overseas non-R/QFII GDP Weighted Index | | N/A | | | 19.47 | % | ‡ | | N/A | | | 5.61 | % | ‡ | | N/A | | | 6.65 | % | ‡ |
S&P 500 Index | | N/A | | | 13.99 | % | ‡ | | N/A | | | 10.78 | % | ‡ | | N/A | | | 10.05 | % | ‡ |
13
Management Discussion of Fund Performance (Unaudited) (continued)
KraneShares MSCI One Belt One Road Index ETF
The KraneShares MSCI One Belt One Road Index ETF (the ‘‘Fund’’) seeks to provide investment results that, before fees and expenses, correspond to the price and yield performance of the MSCI Global China Infrastructure Exposure Index (the ‘‘Underlying Index’’).
The Underlying Index is designed to represent the performance of listed companies within Developed, Emerging and Frontier markets whose revenues are likely to benefit from China infrastructure development from within a specified set of industries relevant to what has become known as the ‘One Belt, One Road’ (“OBOR”) investment program and development strategy promoted by China.
China review
In the fiscal year from April 1, 2017 through March 29, 2018, global equity markets saw steady appreciation through late January followed by a correction due to rising concerns over inflation, interest rate hikes, and protectionist trade policies. Since then, markets have mostly recovered but with increased volatility. Chinese equities have performed in line with the rest of the world.
Despite the increase in volatility we see a number of bright spots for China’s capital markets.
· Global institutional flows into China have increased leading up to the June 1st 2018 inclusion of Mainland listed Chinese securities (A-shares) into leading index provider MSCI’s Global Standard Indexes.
· In 2017, Chinese E-Commerce sales surpassed $1 trillion USD for the first time. Total retail sales reached $5.8 trillion USD, surpassing total annual retail sales in the United States for the first time.
· China’s equity market was up for the period, returning 29.6%, while China’s currency, the renminbi (RMB) saw steady appreciation, rising 9.4% against the US dollar.
· The best performing sectors across China’s equity markets included Information Technology (+60.8%), Real Estate (+56.4%) and Consumer Staples (+56.3%).
· The worst performing sectors across China’s equity markets were Utilities (+14.1%), Industrials (+3.1%) and Telecom (-9.7%).
By the Fund’s fiscal period end on March 29, 2018 (the ‘‘reporting period’’), the NAV of the Fund increased 2.67% for the period, while the Underlying Index increased 2.57%.
The Fund held 37% of the portfolio in Industrials and 22% in the Materials Sector.
14
Management Discussion of Fund Performance (Unaudited) (continued)
KraneShares MSCI One Belt One Road Index ETF (concluded)
Growth of a $10,000 Investment‡
(at Net Asset Value)‡

AVERAGE ANNUAL TOTAL RETURN FOR THE PERIOD ENDED MARCH 29, 2018*†
| | Cumulative Inception to Date |
| | | | |
KraneShares MSCI One Belt One Road Index ETF | | 2.67 | % | | 4.31 | % | ‡ |
MSCI Global China Infrastructure Exposure Index | | N/A | | | 2.57 | % | ‡ |
S&P 500 Index | | N/A | | | 7.27 | % | ‡ |
15
Management Discussion of Fund Performance (Unaudited) (continued)
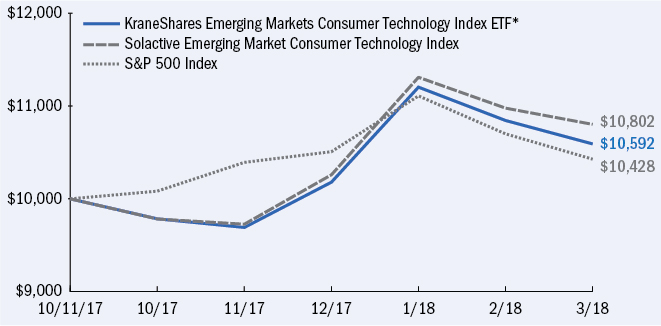
KraneShares Emerging Markets Consumer Technology Index ETF
The KraneShares Emerging Markets Consumer Technology Index ETF (the ‘‘Fund’’) seeks to provide investment results that, before fees and expenses, correspond to the price and yield performance of the Solactive Emerging Market Consumer Technology Index (the ‘‘Underlying Index’’).
The Underlying Index selects companies from 26 eligible countries in emerging markets whose primary business or businesses are internet retail, internet software/services, purchase, payment processing, or software for internet and E-Commerce transactions.
China review
In the fiscal year from April 1, 2017 through March 29, 2018, global equity markets saw steady appreciation through late January followed by a correction due to rising concerns over inflation, interest rate hikes, and protectionist trade policies. Since then, markets have mostly recovered but with increased volatility. Chinese equities have performed in line with the rest of the world.
Despite the increase in volatility we see a number of bright spots for China’s capital markets.
· Global institutional flows into China have increased leading up to the June 1st 2018 inclusion of Mainland listed Chinese securities (A-shares) into leading index provider MSCI’s Global Standard Indexes.
· In 2017, Chinese E-Commerce sales surpassed $1 trillion USD for the first time. Total retail sales reached $5.8 trillion USD, surpassing total annual retail sales in the United States for the first time.
· China’s equity market was up for the period, returning 29.6%, while China’s currency, the renminbi (RMB) saw steady appreciation, rising 9.4% against the US dollar.
· The best performing sectors across China’s equity markets included Information Technology (+60.8%), Real Estate (+56.4%) and Consumer Staples (+56.3%).
· The worst performing sectors across China’s equity markets were Utilities (+14.1%), Industrials (+3.1%) and Telecom (-9.7%).
By the Fund’s fiscal period end on March 29, 2018 (the ‘‘reporting period’’), the NAV of the Fund increased 5.92% for the period, while the Underlying Index increased 8.02%.
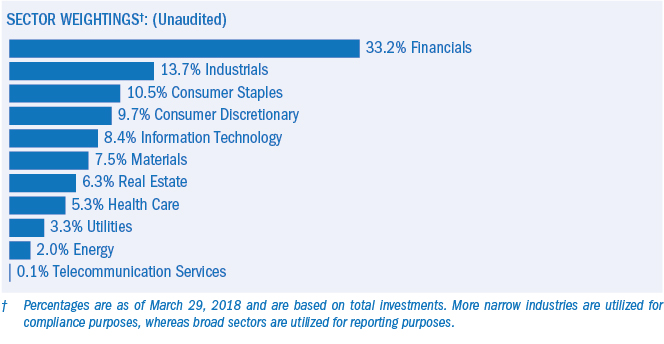
The Fund held 63% of the portfolio in Technology and 30% in the Consumer Discretionary Sector.
16
Management Discussion of Fund Performance (Unaudited) (continued)
KraneShares Emerging Markets Consumer Technology Index ETF (concluded)
Growth of a $10,000 Investment‡
(at Net Asset Value)‡
AVERAGE ANNUAL TOTAL RETURN FOR THE PERIOD ENDED MARCH 29, 2018*†
| | Cumulative Inception to Date |
| | | | |
KraneShares Emerging Markets Consumer Technology Index ETF | | 5.92 | % | | 6.96 | % | ‡ |
Solactive Emerging Market Consumer Technology Index | | N/A | | | 8.02 | % | ‡ |
S&P 500 Index | | N/A | | | 4.28 | % | ‡ |
17
Management Discussion of Fund Performance (Unaudited) (continued)
KraneShares MSCI China Environment Index ETF
The KraneShares MSCI China Environment Index (the ‘‘Fund’’) seeks to provide investment results that, before fees and expenses, correspond to the price and yield performance of the MSCI China IMI Environment 10/40 Index (the ‘‘Underlying Index’’).
The Underlying Index is comprised of securities that derive at least 50% of their revenues from environmentally beneficial products and services. The Index is based on five key Clean Technology environmental themes: Alternative Energy, Sustainable Water, Green Building, Pollution Prevention and Energy Efficiency. The Index aims to serve as a benchmark for investors seeking exposure to Chinese companies that focus on contributing to a more environmentally sustainable economy by making efficient use of scarce natural resources or by mitigating the impact of environmental degradation. Constituent selection is based on data from MSCI Environment, Social, and Governance (ESG).
China review
In the fiscal year from April 1, 2017 through March 29, 2018, global equity markets saw steady appreciation through late January followed by a correction due to rising concerns over inflation, interest rate hikes, and protectionist trade policies. Since then, markets have mostly recovered but with increased volatility. Chinese equities have performed in line with the rest of the world.
Despite the increase in volatility we see a number of bright spots for China’s capital markets.
· Global institutional flows into China have increased leading up to the June 1st 2018 inclusion of Mainland listed Chinese securities (A-shares) into leading index provider MSCI’s Global Standard Indexes.
· In 2017, Chinese E-Commerce sales surpassed $1 trillion USD for the first time. Total retail sales reached $5.8 trillion USD, surpassing total annual retail sales in the United States for the first time.
· China’s equity market was up for the period, returning 29.6%, while China’s currency, the renminbi (RMB) saw steady appreciation, rising 9.4% against the US dollar.
· The best performing sectors across China’s equity markets included Information Technology (+60.8%), Real Estate (+56.4%) and Consumer Staples (+56.3%).
· The worst performing sectors across China’s equity markets were Utilities (+14.1%), Industrials (+3.1%) and Telecom (-9.7%).
By the Fund’s fiscal period end on March 29, 2018 (the ‘‘reporting period’’), the NAV of the Fund decreased 4.56% for the period, while the Underlying Index decreased 4.31%.
The Fund held 31% of the portfolio in Utilities and 25% in the Industrials Sector.
18
Management Discussion of Fund Performance (Unaudited) (continued)
KraneShares MSCI China Environment Index ETF (concluded)
Growth of a $10,000 Investment‡
(at Net Asset Value)‡

AVERAGE ANNUAL TOTAL RETURN FOR THE PERIOD ENDED MARCH 29, 2018*†
| | Cumulative Inception to Date |
| | | | |
KraneShares MSCI China Environment Index | | -4.56 | % | | -3.04 | % | ‡ |
MSCI China IMI Environment 10/40 Index | | N/A | | | -4.31 | % | ‡ |
S&P 500 Index | | N/A | | | 4.45 | % | ‡ |
19
Management Discussion of Fund Performance (Unaudited) (continued)
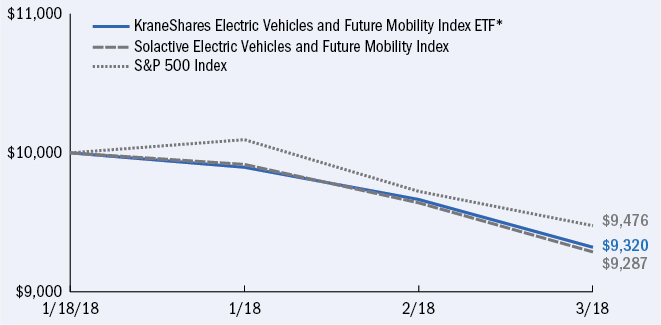
KraneShares Electric Vehicles and Future Mobility Index ETF
The KraneShares Electric Vehicles and Future Mobility Index ETF (the ‘‘Fund’’) seeks to provide investment results that, before fees and expenses, correspond to the price and yield performance of the Solactive Electric Vehicles and Future Mobility Index (the ‘‘Underlying Index’’).
The Underlying Index is designed to track the performance of companies engaged in the production of electric vehicles and/or their components, or engaged in other initiatives that may change the future of mobility. The Index includes issuers engaged in the electric vehicle production, autonomous driving, shared mobility, lithium and/or copper production, lithium-ion/lead acid batteries, hydrogen fuel cell manufacturing and/or electric infrastructure businesses.
China review
In the fiscal year from April 1, 2017 through March 29, 2018, global equity markets saw steady appreciation through late January followed by a correction due to rising concerns over inflation, interest rate hikes, and protectionist trade policies. Since then, markets have mostly recovered but with increased volatility. Chinese equities have performed in line with the rest of the world.
Despite the increase in volatility we see a number of bright spots for China’s capital markets.
· Global institutional flows into China have increased leading up to the June 1st 2018 inclusion of Mainland listed Chinese securities (A-shares) into leading index provider MSCI’s Global Standard Indexes.
· In 2017, Chinese E-Commerce sales surpassed $1 trillion USD for the first time. Total retail sales reached $5.8 trillion USD, surpassing total annual retail sales in the United States for the first time.
· China’s equity market was up for the period, returning 29.6%, while China’s currency, the renminbi (RMB) saw steady appreciation, rising 9.4% against the US dollar.
· The best performing sectors across China’s equity markets included Information Technology (+60.8%), Real Estate (+56.4%) and Consumer Staples (+56.3%).
· The worst performing sectors across China’s equity markets were Utilities (+14.1%), Industrials (+3.1%) and Telecom (-9.7%).
By the Fund’s fiscal period end on March 29, 2018 (the ‘‘reporting period’’), the NAV of the Fund decreased 6.80% for the period, while the Underlying Index decreased 7.13%.
The Fund held 44% of the portfolio in Technology and 40% in the Consumer Discretionary Sector.
20
Management Discussion of Fund Performance (Unaudited) (continued)
KraneShares Electric Vehicles and Future Mobility Index ETF (concluded)
Growth of a $10,000 Investment‡
(at Net Asset Value)‡
AVERAGE ANNUAL TOTAL RETURN FOR THE PERIOD ENDED MARCH 29, 2018*†
| | Cumulative Inception to Date |
| | | | |
KraneShares Electric Vehicles and Future Mobility Index ETF | | -6.80 | % | | -5.68 | % | ‡ |
Solactive Electric Vehicles and Future Mobility Index | | N/A | | | -7.13 | % | ‡ |
S&P 500 Index | | N/A | | | -5.24 | % | ‡ |
21
Management Discussion of Fund Performance (Unaudited) (continued)
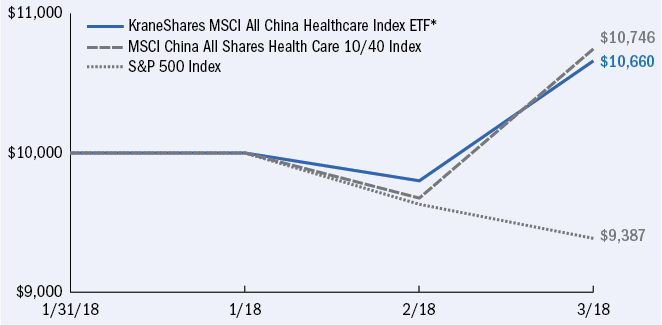
KraneShares MSCI All China Health Care Index ETF
The KraneShares MSCI All China Health Care Index ETF (the ‘‘Fund’’) seeks to provide investment results that, before fees and expenses, correspond to the price and yield performance of the MSCI China All Shares Health Care 10/40 Index (the ‘‘Underlying Index’’).
The Underlying is a free float adjusted market capitalization weighted index designed to track the equity market performance of Chinese companies engaged in the health care sector. The securities in the Index include all types of publicly issued shares of Chinese issuers, which are listed in Mainland China, Hong Kong and United States. Issuers eligible for inclusion must be classified under the Global Industry Classification Standard as engaged in the healthcare sector. The issuers included in the Underlying Index may include small-cap, mid-cap and large-cap companies.
China review
In the fiscal year from April 1, 2017 through March 29, 2018, global equity markets saw steady appreciation through late January followed by a correction due to rising concerns over inflation, interest rate hikes, and protectionist trade policies. Since then, markets have mostly recovered but with increased volatility. Chinese equities have performed in line with the rest of the world.
Despite the increase in volatility we see a number of bright spots for China’s capital markets.
· Global institutional flows into China have increased leading up to the June 1st 2018 inclusion of Mainland listed Chinese securities (A-shares) into leading index provider MSCI’s Global Standard Indexes.
· In 2017, Chinese E-Commerce sales surpassed $1 trillion USD for the first time. Total retail sales reached $5.8 trillion USD, surpassing total annual retail sales in the United States for the first time.
· China’s equity market was up for the period, returning 29.6%, while China’s currency, the renminbi (RMB) saw steady appreciation, rising 9.4% against the US dollar.
· The best performing sectors across China’s equity markets included Information Technology (+60.8%), Real Estate (+56.4%) and Consumer Staples (+56.3%).
· The worst performing sectors across China’s equity markets were Utilities (+14.1%), Industrials (+3.1%) and Telecom (-9.7%).
By the Fund’s fiscal period end on March 29, 2018 (the ‘‘reporting period’’), the NAV of the Fund increased 6.60% for the period, while the Underlying Index increased 7.46%.
The Fund held 100% of the portfolio in the Healthcare sector.
22
Management Discussion of Fund Performance (Unaudited) (concluded)
KraneShares MSCI All China Health Care Index ETF (concluded)
Growth of a $10,000 Investment‡
(at Net Asset Value)‡
AVERAGE ANNUAL TOTAL RETURN FOR THE PERIOD ENDED MARCH 29, 2018*†
| | Cumulative Inception to Date |
| | | | |
KraneShares MSCI All China Health Care Index ETF | | 6.60 | % | | 8.56 | % | ‡ |
MSCI China All Shares Health Care 10/40 Index | | N/A | | | 7.46 | % | ‡ |
S&P 500 Index | | N/A | | | -6.13 | % | ‡ |
23
Schedule of Investments March 29, 2018^
KraneShares Bosera MSCI China A Share ETF
| | | | |
COMMON STOCK — 99.1%‡ | | | | | |
CHINA — 99.1% | | | | | |
Consumer Discretionary — 9.7% | | | | | |
Anhui Xinhua Media, Cl A | | 362,937 | | $ | 572,236 |
BYD, Cl A | | 193,480 | | | 1,721,784 |
China Film, Cl A | | 180,400 | | | 472,526 |
China Grand Automotive Services, Cl A | | 798,630 | | | 921,540 |
China International Travel Service, Cl A | | 206,700 | | | 1,764,524 |
China Shipbuilding Industry Group Power, Cl A | | 154,600 | | | 596,364 |
China South Publishing & Media Group, Cl A | | 123,500 | | | 252,822 |
Chinese Universe Publishing and Media, Cl A | | 236,100 | | | 571,891 |
Chongqing Changan Automobile, Cl A | | 358,800 | | | 636,427 |
CITIC Guoan Information Industry, Cl A | | 304,600 | | | 340,827 |
Fuyao Glass Industry Group, Cl A | | 191,213 | | | 729,088 |
Giant Network Group, Cl A | | 122,000 | | | 618,367 |
Gree Electric Appliances of Zhuhai, Cl A | | 290,300 | | | 2,173,201 |
Guangzhou Automobile Group, Cl A | | 189,000 | | | 647,052 |
Hangzhou Robam Appliances, Cl A | | 114,320 | | | 672,471 |
Huayu Automotive Systems, Cl A | | 411,914 | | | 1,549,661 |
Liaoning Cheng Da, Cl A* | | 112,900 | | | 323,894 |
Midea Group, Cl A | | 768,352 | | | 6,753,320 |
Qingdao Haier, Cl A | | 705,700 | | | 2,005,486 |
SAIC Motor, Cl A | | 945,100 | | | 4,948,042 |
Shanghai Oriental Pearl Group, Cl A | | 232,985 | | | 602,116 |
Shenzhen Overseas Chinese Town, Cl A | | 1,092,350 | | | 1,449,707 |
Suning.com, Cl A | | 994,200 | | | 2,220,149 |
Wanda Film Holding, Cl A(A)(B)(C) | | 43,600 | | | 387,651 |
Wanxiang Qianchao, Cl A | | 388,340 | | | 517,235 |
Weifu High-Technology Group, Cl A | | 71,584 | | | 255,881 |
Wuhu Shunrong Sanqi Interactive Entertainment
Network Technology, Cl A | | 228,000 | | | 673,668 |
| | | | | 34,377,930 |
24
Schedule of Investments March 29, 2018^
KraneShares Bosera MSCI China A Share ETF (continued)
| | | | |
COMMON STOCK (continued) | | | | | |
Consumer Staples — 10.4% | | | | | |
Beijing Dabeinong Technology Group, Cl A | | 505,000 | | $ | 462,323 |
Foshan Haitian Flavouring & Food, Cl A | | 242,670 | | | 2,212,753 |
Henan Shuanghui Investment & Development, Cl A | | 279,600 | | | 1,132,318 |
Inner Mongolia Yili Industrial Group, Cl A | | 723,500 | | | 3,217,498 |
Jiangsu Yanghe Brewery Joint-Stock, Cl A | | 173,300 | | | 2,970,645 |
Kweichow Moutai, Cl A | | 145,380 | | | 15,922,781 |
Luzhou Laojiao, Cl A | | 152,800 | | | 1,376,771 |
Muyuan Foodstuff, Cl A | | 135,099 | | | 976,573 |
New Hope Liuhe, Cl A | | 628,563 | | | 725,300 |
Shanghai Bailian Group, Cl A | | 287,100 | | | 497,384 |
Shanxi Xinghuacun Fen Wine Factory, Cl A | | 100,600 | | | 876,535 |
Tsingtao Brewery, Cl A | | 51,300 | | | 326,062 |
Wuliangye Yibin, Cl A | | 429,556 | | | 4,608,457 |
Yonghui Superstores, Cl A | | 1,011,700 | | | 1,601,559 |
| | | | | 36,906,959 |
Energy — 1.9% | | | | | |
China Petroleum & Chemical, Cl A | | 3,159,100 | | | 3,323,941 |
Offshore Oil Engineering, Cl A | | 339,600 | | | 333,031 |
PetroChina, Cl A | | 1,120,700 | | | 1,371,552 |
Shaanxi Coal Industry, Cl A* | | 547,200 | | | 663,594 |
Shanxi Lu’an Environmental Energy Development, Cl A | | 441,900 | | | 736,769 |
Shanxi Xishan Coal & Electricity Power, Cl A | | 244,500 | | | 306,223 |
Wintime Energy, Cl A(A)(B)(C) | | 4,900 | | | 2,547 |
| | | | | 6,737,657 |
Financials — 32.9% | | | | | |
Agricultural Bank of China, Cl A | | 7,147,600 | | | 4,498,704 |
Anxin Trust, Cl A | | 439,276 | | | 812,685 |
AVIC Capital, Cl A | | 1,266,200 | | | 1,076,684 |
Bank of Beijing, Cl A | | 2,317,203 | | | 2,552,286 |
Bank of China, Cl A | | 6,017,000 | | | 3,815,794 |
Bank of Communications, Cl A | | 4,727,500 | | | 4,703,681 |
Bank of Guiyang, Cl A | | 344,320 | | | 794,622 |
Bank of Hangzhou, Cl A | | 330,800 | | | 595,700 |
Bank of Jiangsu, Cl A | | 1,196,300 | | | 1,395,623 |
Bank of Nanjing, Cl A | | 867,340 | | | 1,134,544 |
Bank of Ningbo, Cl A | | 605,100 | | | 1,860,973 |
Bank of Shanghai, Cl A | | 839,750 | | | 1,986,026 |
Changjiang Securities, Cl A | | 488,600 | | | 560,690 |
China CITIC Bank, Cl A | | 826,800 | | | 852,859 |
China Construction Bank, Cl A | | 990,300 | | | 1,207,241 |
China Everbright Bank, Cl A | | 4,394,100 | | | 2,863,425 |
China Life Insurance, Cl A | | 367,400 | | | 1,502,488 |
China Merchants Bank, Cl A | | 2,412,869 | | | 11,240,395 |
China Merchants Securities, Cl A | | 736,912 | | | 2,028,596 |
China Minsheng Banking, Cl A | | 3,592,000 | | | 4,612,960 |
China Pacific Insurance Group, Cl A | | 763,899 | | | 4,268,908 |
CITIC Securities, Cl A | | 1,215,100 | | | 3,536,164 |
Dongxing Securities, Cl A | | 182,300 | | | 411,730 |
Everbright Securities, Cl A | | 367,663 | | | 716,428 |
25
Schedule of Investments March 29, 2018^
KraneShares Bosera MSCI China A Share ETF (continued)
| | | | |
COMMON STOCK (continued) | | | | | |
Financials (continued) | | | | | |
First Capital Securities, Cl A | | 271,000 | | $ | 348,027 |
Founder Securities, Cl A* | | 781,100 | | | 773,440 |
GF Securities, Cl A | | 762,800 | | | 1,985,896 |
Guosen Securities, Cl A | | 370,300 | | | 635,637 |
Guotai Junan Securities, Cl A | | 944,900 | | | 2,566,610 |
Guoyuan Securities, Cl A | | 520,250 | | | 755,771 |
Haitong Securities, Cl A | | 1,042,300 | | | 1,888,555 |
Huaan Securities, Cl A | | 218,200 | | | 243,111 |
Huatai Securities, Cl A | | 704,800 | | | 1,918,913 |
Huaxia Bank, Cl A | | 1,377,220 | | | 1,961,297 |
Industrial & Commercial Bank of China, Cl A | | 6,141,700 | | | 5,944,809 |
Industrial Bank, Cl A | | 2,366,100 | | | 6,359,291 |
Industrial Securities, Cl A | | 612,100 | | | 638,202 |
New China Life Insurance, Cl A | | 224,500 | | | 1,675,266 |
Northeast Securities, Cl A | | 127,200 | | | 158,502 |
Orient Securities, Cl A | | 786,000 | | | 1,554,086 |
Pacific Securities, Cl A | | 417,700 | | | 191,201 |
Ping An Bank, Cl A | | 2,101,580 | | | 3,690,967 |
Ping An Insurance Group of China, Cl A | | 1,283,700 | | | 13,545,599 |
SDIC Capital, Cl A | | 166,900 | | | 337,689 |
Sealand Securities, Cl A | | 236,700 | | | 162,523 |
Shanghai Pudong Development Bank, Cl A | | 3,341,591 | | | 6,171,509 |
Shanxi Securities, Cl A | | 490,000 | | | 605,909 |
Shenwan Hongyuan Group, Cl A | | 1,964,460 | | | 1,545,540 |
Sinolink Securities, Cl A | | 275,100 | | | 360,288 |
SooChow Securities, Cl A | | 224,100 | | | 292,071 |
Southwest Securities, Cl A | | 401,100 | | | 277,315 |
Western Securities, Cl A | | 298,504 | | | 459,733 |
| | | | | 116,076,963 |
Health Care — 5.3% | | | | | |
Beijing Tongrentang, Cl A | | 125,055 | | | 669,430 |
China Resources Sanjiu Medical & Pharmaceutical, Cl A | | 160,060 | | | 689,420 |
Dong-E-E-Jiao, Cl A | | 58,000 | | | 561,960 |
Guangzhou Baiyunshan Pharmaceutical Holdings, Cl A | | 210,500 | | | 971,919 |
Guizhou Bailing Group Pharmaceutical, Cl A | | 138,800 | | | 316,793 |
Hainan Haiyao, Cl A(A)(B)(C) | | 33,300 | | | 71,875 |
Harbin Pharmaceutical Group, Cl A | | 416,300 | | | 345,389 |
Hengkang Medical Group, Cl A*(A)(B)(C) | | 167,500 | | | 336,773 |
Huadong Medicine, Cl A | | 93,600 | | | 941,698 |
Jiangsu Hengrui Medicine, Cl A | | 313,544 | | | 4,126,300 |
Jointown Pharmaceutical Group, Cl A* | | 287,778 | | | 864,473 |
Kangmei Pharmaceutical, Cl A | | 523,900 | | | 1,865,213 |
Meinian Onehealth Healthcare Holdings, Cl A | | 259,927 | | | 1,051,821 |
Shanghai Fosun Pharmaceutical Group, Cl A | | 206,600 | | | 1,380,464 |
Shanghai Pharmaceuticals Holding, Cl A | | 277,500 | | | 1,070,446 |
Shenzhen Salubris Pharmaceuticals, Cl A | | 128,796 | | | 853,222 |
Tasly Pharmaceutical Group, Cl A | | 92,600 | | | 632,718 |
Tonghua Golden-Horse Pharmaceutical Industry, Cl A*(A)(B)(C) | | 46,500 | | | 110,565 |
Yunnan Baiyao Group, Cl A | | 109,800 | | | 1,739,048 |
| | | | | 18,599,527 |
26
Schedule of Investments March 29, 2018^
KraneShares Bosera MSCI China A Share ETF (continued)
| | | | |
COMMON STOCK (continued) | | | | | |
Industrials — 13.6% | | | | | |
AECC Aviation Power, Cl A | | 213,100 | | $ | 925,668 |
Air China, Cl A | | 395,900 | | | 716,077 |
AVIC Aircraft, Cl A | | 343,500 | | | 905,197 |
Beijing Orient Landscape & Environment, Cl A | | 319,250 | | | 1,015,336 |
China Avionics Systems, Cl A | | 269,700 | | | 634,845 |
China Communications Construction, Cl A | | 229,400 | | | 470,708 |
China CSSC Holdings, Cl A | | 63,500 | | | 174,906 |
China Eastern Airlines, Cl A | | 811,600 | | | 921,027 |
China Gezhouba Group, Cl A | | 671,900 | | | 924,814 |
China International Marine Containers Group, Cl A | | 210,600 | | | 562,341 |
China National Chemical Engineering, Cl A | | 405,300 | | | 468,965 |
China Nuclear Engineering, Cl A | | 78,200 | | | 121,432 |
China Railway Construction, Cl A | | 1,455,800 | | | 2,253,682 |
China Railway Group, Cl A | | 2,027,200 | | | 2,377,853 |
China Southern Airlines, Cl A | | 727,800 | | | 1,169,486 |
China Spacesat, Cl A | | 175,800 | | | 618,627 |
China State Construction Engineering, Cl A | | 3,635,900 | | | 5,068,081 |
COSCO Shipping Development, Cl A* | | 560,300 | | | 270,724 |
COSCO Shipping Energy Transportation, Cl A | | 112,700 | | | 96,190 |
COSCO Shipping Holdings, Cl A* | | 1,083,502 | | | 1,019,491 |
CRRC, Cl A | | 2,733,300 | | | 4,400,771 |
CSSC Offshore and Marine Engineering Group, Cl A | | 51,700 | | | 175,437 |
Daqin Railway, Cl A | | 1,839,600 | | | 2,426,797 |
Fangda Carbon New Material, Cl A | | 248,500 | | | 1,043,892 |
Guangshen Railway, Cl A | | 407,400 | | | 296,564 |
Hainan Airlines Holding, Cl A(A)(B)(C) | | 2,095,400 | | | 989,134 |
Han’s Laser Technology Industry Group, Cl A | | 147,100 | | | 1,236,802 |
Jihua Group, Cl A | | 655,700 | | | 574,234 |
Luxshare Precision Industry, Cl A | | 324,525 | | | 1,255,970 |
Metallurgical Corp of China, Cl A | | 1,462,500 | | | 876,333 |
Ningbo Zhoushan Port, Cl A | | 804,700 | | | 681,700 |
Power Construction Corp of China, Cl A | | 1,031,300 | | | 1,099,865 |
Sany Heavy Industry, Cl A | | 1,028,200 | | | 1,289,397 |
Shanghai Construction Group, Cl A | | 1,346,948 | | | 802,812 |
Shanghai International Airport, Cl A | | 87,837 | | | 665,231 |
Shanghai International Port Group, Cl A | | 1,154,600 | | | 1,304,767 |
Shanghai Tunnel Engineering, Cl A | | 521,900 | | | 600,562 |
Spring Airlines, Cl A | | 41,200 | | | 198,807 |
Suzhou Gold Mantis Construction Decoration, Cl A | | 262,300 | | | 537,382 |
Taihai Manoir Nuclear Equipment, Cl A(A)(B)(C) | | 61,300 | | | 240,944 |
TBEA, Cl A | | 565,485 | | | 791,825 |
Tus-Sound Environmental Resources, Cl A | | 78,100 | | | 347,693 |
Weichai Power, Cl A | | 843,400 | | | 1,105,909 |
XCMG Construction Machinery, Cl A | | 1,096,200 | | | 682,980 |
Xiamen C & D, Cl A* | | 422,300 | | | 751,746 |
Xinjiang Goldwind Science & Technology, Cl A | | 407,892 | | | 1,152,032 |
Zhejiang Chint Electrics, Cl A | | 160,700 | | | 646,968 |
Zhengzhou Yutong Bus, Cl A | | 210,673 | | | 754,401 |
Zoomlion Heavy Industry Science and Technology, Cl A | | 458,900 | | | 307,066 |
| | | | | 47,953,471 |
27
Schedule of Investments March 29, 2018^
KraneShares Bosera MSCI China A Share ETF (continued)
| | | | |
COMMON STOCK (continued) | | | | | |
Information Technology — 8.4% | | | | | |
Addsino, Cl A | | 101,100 | | $ | 170,811 |
Aisino, Cl A | | 276,992 | | | 1,012,134 |
Beijing Shiji Information Technology, Cl A | | 146,300 | | | 590,623 |
Beijing Xinwei Technology Group, Cl A(A)(B)(C) | | 23,600 | | | 60,241 |
BOE Technology Group, Cl A | | 4,085,700 | | | 3,487,167 |
DHC Software, Cl A | | 219,500 | | | 282,587 |
Digital China Group, Cl A*(A)(B)(C) | | 65,500 | | | 237,569 |
Dongxu Optoelectronic Technology, Cl A | | 717,400 | | | 880,259 |
Focus Media Information Technology, Cl A | | 1,111,880 | | | 2,329,192 |
GoerTek, Cl A | | 463,100 | | | 1,005,443 |
Guangzhou Haige Communications Group, Cl A | | 390,841 | | | 636,731 |
Hangzhou Hikvision Digital Technology, Cl A | | 1,097,300 | | | 7,237,782 |
Hengtong Optic-electric, Cl A | | 141,800 | | | 830,061 |
Hundsun Technologies, Cl A | | 97,500 | | | 893,069 |
Iflytek, Cl A | | 140,900 | | | 1,323,296 |
Kingnet Network, Cl A | | 23,800 | | | 64,421 |
LONGi Green Energy Technology, Cl A | | 267,600 | | | 1,435,038 |
O-film Tech, Cl A | | 261,300 | | | 834,771 |
Sanan Optoelectronics, Cl A | | 513,985 | | | 1,893,633 |
Shanghai 2345 Network Holding Group, Cl A | | 178,340 | | | 159,301 |
Tatwah Smartech, Cl A* | | 67,200 | | | 126,140 |
Unisplendour, Cl A | | 80,500 | | | 878,735 |
Zhejiang Dahua Technology, Cl A | | 297,950 | | | 1,206,158 |
ZTE, Cl A* | | 403,540 | | | 1,913,892 |
| | | | | 29,489,054 |
Materials — 7.4% | | | | | |
Aluminum Corp of China, Cl A* | | 832,100 | | | 634,817 |
Angang Steel, Cl A | | 30,365 | | | 29,247 |
Anhui Conch Cement, Cl A | | 502,400 | | | 2,562,426 |
Baoshan Iron & Steel, Cl A | | 2,199,800 | | | 3,020,848 |
BBMG, Cl A | | 865,200 | | | 683,447 |
China Hainan Rubber Industry Group, Cl A | | 353,200 | | | 334,579 |
China Molybdenum, Cl A | | 787,100 | | | 1,063,361 |
China Northern Rare Earth Group High-Tech, Cl A | | 334,800 | | | 689,640 |
Hesteel, Cl A | | 948,800 | | | 529,315 |
Huapont Life Sciences, Cl A | | 227,100 | | | 233,536 |
Hubei Biocause Pharmaceutical, Cl A | | 21,100 | | | 26,192 |
Inner Mongolia BaoTou Steel Union, Cl A* | | 3,952,380 | | | 1,375,735 |
Inner Mongolia Junzheng Energy & Chemical Industry Group, Cl A(A)(B)(C) | | 619,900 | | | 451,252 |
Jiangsu Bicon Pharmaceutical Listed, Cl A | | 71,400 | | | 296,758 |
Jiangxi Copper, Cl A | | 304,800 | | | 840,032 |
Jiangxi Ganfeng Lithium, Cl A | | 68,700 | | | 854,423 |
Jinduicheng Molybdenum, Cl A | | 146,100 | | | 158,600 |
Kangde Xin Composite Material Group, Cl A(A)(B)(C) | | 423,095 | | | 1,213,127 |
Maanshan Iron & Steel, Cl A* | | 974,600 | | | 559,198 |
Qinghai Salt Lake Industry, Cl A | | 152,000 | | | 305,126 |
Rongsheng Petro Chemical, Cl A | | 223,800 | | | 526,802 |
Shandong Gold Mining, Cl A | | 235,400 | | | 1,079,031 |
Shanxi Taigang Stainless Steel, Cl A | | 834,600 | | | 766,723 |
Shenzhen Zhongjin Lingnan Nonfemet, Cl A | | 392,500 | | | 582,665 |
28
Schedule of Investments March 29, 2018^
KraneShares Bosera MSCI China A Share ETF (continued)
| | | | |
COMMON STOCK (continued) | | | | | |
Materials (continued) | | | | | |
Sinopec Shanghai Petrochemical, Cl A | | 766,600 | | $ | 733,495 |
Tianqi Lithium, Cl A | | 114,110 | | | 1,053,010 |
Tongling Nonferrous Metals Group, Cl A* | | 814,900 | | | 341,932 |
Wanhua Chemical Group, Cl A(A)(B)(C) | | 261,800 | | | 1,507,960 |
Zhejiang Huayou Cobalt, Cl A* | | 79,900 | | | 1,461,686 |
Zhejiang Longsheng Group, Cl A | | 97,800 | | | 174,096 |
Zhongjin Gold, Cl A | | 271,100 | | | 398,569 |
Zijin Mining Group, Cl A | | 2,265,800 | | | 1,584,551 |
| | | | | 26,072,179 |
Real Estate — 6.2% | | | | | |
China Fortune Land Development, Cl A | | 282,316 | | | 1,506,774 |
China Merchants Shekou Industrial Zone Holdings, Cl A | | 720,682 | | | 2,536,023 |
China Vanke, Cl A | | 1,171,700 | | | 6,361,599 |
COFCO Property Group, Cl A(A)(B)(C) | | 130,200 | | | 182,107 |
Financial Street Holdings, Cl A | | 237,000 | | | 374,427 |
Future Land Holdings, Cl A | | 298,057 | | | 1,657,109 |
Gemdale, Cl A | | 617,400 | | | 1,176,570 |
Greenland Holdings, Cl A | | 1,099,400 | | | 1,312,283 |
Jinke Properties Group, Cl A | | 402,900 | | | 353,483 |
Oceanwide Holdings, Cl A(A)(B)(C) | | 26,700 | | | 30,639 |
Poly Real Estate Group, Cl A | | 1,462,100 | | | 3,197,625 |
RiseSun Real Estate Development, Cl A | | 608,200 | | | 986,004 |
Shanghai Lujiazui Finance & Trade Zone Development, Cl A | | 129,300 | | | 387,179 |
Shanghai Zhangjiang High-Tech Park Development, Cl A | | 82,000 | | | 174,382 |
Xinhu Zhongbao, Cl A | | 1,273,100 | | | 940,909 |
Youngor Group, Cl A | | 285,900 | | | 382,157 |
Zhejiang China Commodities City Group, Cl A | | 417,400 | | | 356,253 |
Zhongtian Financial Group, Cl A(A)(B)(C) | | 101,000 | | | 129,868 |
| | | | | 22,045,391 |
Telecommunication Services — 0.1% | | | | | |
Dr Peng Telecom & Media Group, Cl A | | 135,358 | | | 322,921 |
| | | | | |
Utilities — 3.2% | | | | | |
Beijing Capital, Cl A | | 326,300 | | | 272,794 |
China National Nuclear Power, Cl A | | 1,356,300 | | | 1,444,317 |
China Yangtze Power, Cl A | | 1,643,683 | | | 4,206,064 |
Datang International Power Generation, Cl A* | | 829,000 | | | 487,515 |
Huadian Power International, Cl A | | 617,000 | | | 371,669 |
Huaneng Power International, Cl A | | 381,000 | | | 412,992 |
Hubei Energy Group, Cl A | | 762,100 | | | 525,695 |
Kaidi Ecological and Environmental Technology, Cl A*(A)(B)(C) | | 201,700 | | | 151,314 |
SDIC Power Holdings, Cl A | | 941,000 | | | 1,055,909 |
Shenergy, Cl A | | 732,000 | | | 670,140 |
Shenzhen Energy Group, Cl A | | 181,600 | | | 167,408 |
Sichuan Chuantou Energy, Cl A | | 643,100 | | | 913,793 |
Zhejiang Zheneng Electric Power, Cl A | | 853,000 | | | 749,732 |
| | | | | 11,429,342 |
29
Schedule of Investments March 29, 2018^
KraneShares Bosera MSCI China A Share ETF (continued)
| | | | |
COMMON STOCK (continued) | | | | | |
TOTAL COMMON STOCK | | | | | |
(Cost $317,927,605) | | | | $ | 350,011,394 |
| | | | | |
TOTAL INVESTMENTS — 99.1% | | | | | |
(Cost $317,927,605) | | | | | 350,011,394 |
OTHER ASSETS LESS LIABILITIES – 0.9% | | | | | 3,312,193 |
NET ASSETS — 100% | | | | $ | 353,323,587 |
The following is a list of the inputs used, as of March 29, 2018, in valuing the Fund’s investments carried at value:
| | | | | | | | |
Investments in Securities | | | | | | | | | | | | |
Common Stock | | | | | | | | | | | | |
China | | | | | | | | | | | | |
Consumer Discretionary | | $ | 33,990,279 | | $ | — | | $ | 387,651 | | $ | 34,377,930 |
Consumer Staples | | | 36,906,959 | | | — | | | — | | | 36,906,959 |
Energy | | | 6,735,110 | | | — | | | 2,547 | | | 6,737,657 |
Financials | | | 116,076,963 | | | — | | | — | | | 116,076,963 |
Health Care | | | 18,080,314 | | | — | | | 519,213 | | | 18,599,527 |
Industrials | | | 46,723,393 | | | — | | | 1,230,078 | | | 47,953,471 |
Information Technology | | | 29,191,244 | | | — | | | 297,810 | | | 29,489,054 |
Materials | | | 22,899,840 | | | — | | | 3,172,339 | | | 26,072,179 |
Real Estate | | | 21,702,777 | | | — | | | 342,614 | | | 22,045,391 |
Telecommunication Services | | | 322,921 | | | — | | | — | | | 322,921 |
Utilities | | | 11,278,028 | | | — | | | 151,314 | | | 11,429,342 |
Total Common Stock | | | 343,907,828 | | | — | | | 6,103,566 | | | 350,011,394 |
Total Investments in Securities | | $ | 343,907,828 | | $ | — | | $ | 6,103,566 | | $ | 350,011,394 |
30
Schedule of Investments March 29, 2018^
KraneShares Bosera MSCI China A Share ETF (concluded)
The following is a reconciliation of the investments in which significant unobservable inputs (Level 3) were used in determining value:
| | |
Beginning balance as of April 1, 2017 | | $ | 554,490 | |
Accrued discounts/premiums | | | — | |
Realized gain/(loss)(1) | | | (54,513 | ) |
Change in unrealized appreciation/(depreciation)(2) | | | (23,727 | ) |
Purchases | | | 2,543,243 | |
Sales | | | (2,261,951 | ) |
Transfer into Level 3 | | | 5,805,757 | |
Transfer out of Level 3 | | | (459,733 | ) |
Ending balance as of March 29, 2018 | | $ | 6,103,566 | |
For the year ended March 29, 2018, there have been no transfers between Level 1 and Level 2 investments.
For the year ended March 29, 2018, there have been no transfers between Level 2 and Level 3 investments.
For the year ended March 29, 2018, the transfers in and out of Level 3 occurred due to a halt in trading of these securities. Transfers between levels are recognized at period end.
Amounts designated as “—” are $0 or have been rounded to $0.
31
Schedule of Investments March 29, 2018^
KraneShares Zacks New China ETF
| | | | |
COMMON STOCK — 97.9% | | | | | |
CHINA — 68.2% | | | | | |
Consumer Discretionary — 16.0% | | | | | |
Changchun Faway Automobile Components, Cl A | | 45,941 | | $ | 115,880 |
China International Travel Service, Cl A | | 26,000 | | | 221,953 |
Hisense Electric, Cl A | | 44,000 | | | 108,047 |
Huayu Automotive Systems, Cl A | | 45,000 | | | 169,294 |
Tianneng Power International | | 166,000 | | | 196,494 |
| | | | | 811,668 |
Consumer Staples — 2.6% | | | | | |
COFCO Tunhe Sugar, Cl A | | 74,000 | | | 90,799 |
Meihua Holdings Group, Cl A | | 53,000 | | | 43,467 |
| | | | | 134,266 |
Health Care — 10.1% | | | | | |
China Animal Healthcare*(A)(B)(C) | | 4,000 | | | — |
China Resources Pharmaceutical Group | | 51,500 | | | 72,181 |
Guangzhou Baiyunshan Pharmaceutical Holdings, Cl A | | 36,000 | | | 166,219 |
Guangzhou Baiyunshan Pharmaceutical Holdings, Cl H | | 68,000 | | | 209,676 |
Zhejiang Conba Pharmaceutical, Cl A | | 60,000 | | | 66,373 |
| | | | | 514,449 |
Industrials — 18.2% | | | | | |
Anhui Heli, Cl A | | 96,000 | | | 151,819 |
CIMC Enric Holdings* | | 182,000 | | | 174,387 |
First Tractor, Cl H | | 302,000 | | | 112,360 |
Fujian Longking, Cl A | | 61,000 | | | 140,582 |
Haitian International Holdings | | 67,000 | | | 203,178 |
Weichai Power, Cl H | | 124,736 | | | 139,862 |
| | | | | 922,188 |
Information Technology — 4.6% | | | | | |
Baidu ADR* | | 313 | | | 69,859 |
Hanergy Thin Film Power Group*(A)(B)(C) | | 65,064 | | | 83 |
Legend Holdings, Cl H | | 19,000 | | | 62,822 |
Tencent Holdings | | 1,942 | | | 101,352 |
| | | | | 234,116 |
32
Schedule of Investments March 29, 2018^
KraneShares Zacks New China ETF (continued)
| | | | |
COMMON STOCK (continued) | | | | | |
Materials — 0.0% | | | | | |
China Lumena New Materials*(A)(B)(C) | | 28,720 | | $ | — |
China Shanshui Cement Group*(A)(B)(C) | | 10,672 | | | 14 |
Tianhe Chemicals Group*(A)(B)(C) | | 40,000 | | | — |
| | | | | 14 |
Utilities — 16.7% | | | | | |
Datang International Power Generation, Cl H* | | 390,000 | | | 116,777 |
Huadian Power International, Cl A | | 80,000 | | | 48,191 |
Huadian Power International, Cl H | | 142,000 | | | 54,641 |
Huaneng Power International, Cl H | | 234,000 | | | 157,127 |
Huaneng Power International ADR | | 5,546 | | | 148,910 |
SDIC Power Holdings, Cl A | | 52,000 | | | 58,350 |
Shanghai Electric Power, Cl A | | 98,000 | | | 137,848 |
Zhejiang Zheneng Electric Power, Cl A | | 143,000 | | | 125,688 |
| | | | | 847,532 |
TOTAL CHINA | | | | | 3,464,233 |
| | | | | |
HONG KONG — 18.9% | | | | | |
Consumer Discretionary — 2.7% | | | | | |
Haier Electronics Group* | | 39,000 | | | 138,890 |
Financials — 2.6% | | | | | |
People’s Insurance Group of China, Cl H | | 289,000 | | | 135,141 |
Industrials — 3.4% | | | | | |
Sinotruk Hong Kong | | 146,000 | | | 172,820 |
Information Technology — 7.8% | | | | | |
ASM Pacific Technology | | 14,200 | | | 198,300 |
Kingboard Chemical Holdings | | 15,500 | | | 70,802 |
Kingboard Laminates Holdings | | 86,500 | | | 125,425 |
| | | | | 394,527 |
Utilities — 2.4% | | | | | |
China Resources Power Holdings | | 66,000 | | | 120,423 |
TOTAL HONG KONG | | | | | 961,801 |
| | | | | |
SINGAPORE — 5.4% | | | | | |
Industrials — 2.4% | | | | | |
China Yuchai International | | 5,810 | | | 122,998 |
Information Technology — 3.0% | | | | | |
Kulicke & Soffa Industries* | | 6,163 | | | 154,136 |
TOTAL SINGAPORE | | | | | 277,134 |
33
Schedule of Investments March 29, 2018^
KraneShares Zacks New China ETF (continued)
| | | | |
COMMON STOCK (continued) | | | | | |
UNITED STATES — 5.4% | | | | | |
Information Technology — 5.4% | | | | | |
Broadcom | | 532 | | $ | 125,366 |
Flex* | | 9,000 | | | 146,970 |
TOTAL UNITED STATES | | | | | 272,336 |
TOTAL COMMON STOCK | | | | | |
(Cost $4,662,777) | | | | | 4,975,504 |
TOTAL INVESTMENTS — 97.9% | | | | | |
(Cost $4,662,777) | | | | | 4,975,504 |
OTHER ASSETS LESS LIABILITIES — 2.1% | | | | | 106,714 |
NET ASSETS — 100% | | | | $ | 5,082,218 |
34
Schedule of Investments March 29, 2018^
KraneShares Zacks New China ETF (concluded)
The following is a list of the inputs used, as of March 29, 2018, in valuing the Fund’s investments carried at value:
| | | | | | | | |
Investments in Securities | | | | | | | | | | | | |
Common Stock | | | | | | | | | | | | |
China | | | | | | | | | | | | |
Consumer Discretionary | | $ | 811,668 | | $ | — | | $ | — | | $ | 811,668 |
Consumer Staples | | | 134,266 | | | — | | | — | | | 134,266 |
Health Care | | | 514,449 | | | — | | | — | | | 514,449 |
Industrials | | | 922,188 | | | — | | | — | | | 922,188 |
Information Technology | | | 234,033 | | | — | | | 83 | | | 234,116 |
Materials | | | — | | | — | | | 14 | | | 14 |
Utilities | | | 847,532 | | | — | | | — | | | 847,532 |
Hong Kong | | | 961,801 | | | — | | | — | | | 961,801 |
Singapore | | | 277,134 | | | — | | | — | | | 277,134 |
United States | | | 272,336 | | | — | | | — | | | 272,336 |
Total Common Stock | | | 4,975,407 | | | — | | | 97 | | | 4,975,504 |
Total Investments in Securities | | $ | 4,975,407 | | $ | — | | $ | 97 | | $ | 4,975,504 |
For the year ended March 29, 2018, there have been no transfers between Level 1 and Level 2 investments.
For the year ended March 29, 2018, there have been no transfers between Level 2 and Level 3 investments.
For the year ended March 29, 2018, the transfers in and out of Level 3 occurred due to a halt in trading of these securities. Transfers between levels are recognized at period end.
Amounts designated as “—” are $0 or have been rounded to $0.
35
Schedule of Investments March 29, 2018^
KraneShares CSI China Internet ETF

| | | | |
COMMON STOCK — 99.8%‡ | | | | | |
CHINA — 96.6% | | | | | |
Consumer Discretionary — 19.0% | | | | | |
Cogobuy Group | | 10,789,818 | | $ | 5,471,691 |
Ctrip.com International ADR* | | 1,345,585 | | | 62,731,173 |
JD.com ADR* | | 2,270,128 | | | 91,917,483 |
Jumei International Holding ADR* | | 1,545,212 | | | 4,481,115 |
TAL Education Group ADR | | 840,411 | | | 31,170,844 |
Vipshop Holdings ADR* | | 6,806,201 | | | 113,119,060 |
| | | | | 308,891,366 |
Financials — 5.9% | | | | | |
China Rapid Finance ADR*(A) | | 976,037 | | | 4,860,664 |
Fanhua ADR(A) | | 460,979 | | | 12,455,652 |
Qudian ADR*(A) | | 2,157,309 | | | 25,240,516 |
ZhongAn Online P&C Insurance, Cl H*(A) | | 7,267,700 | | | 54,774,213 |
| | | | | 97,331,045 |
Industrials — 2.1% | | | | | |
51job ADR* | | 398,777 | | | 34,310,773 |
Information Technology — 69.6% | | | | | |
21Vianet Group ADR* | | 1,626,188 | | | 11,269,483 |
58.com ADR* | | 830,855 | | | 66,352,080 |
Alibaba Group Holding ADR* | | 783,002 | | | 143,712,187 |
Autohome ADR | | 928,768 | | | 79,818,322 |
Baidu ADR* | | 502,205 | | | 112,087,134 |
Baozun ADR*(A) | | 490,395 | | | 22,499,323 |
Bitauto Holdings ADR*(A) | | 599,908 | | | 12,688,054 |
Changyou.com ADR* | | 359,662 | | | 10,030,973 |
Cheetah Mobile ADR*(A) | | 803,375 | | | 10,741,124 |
Fang Holdings ADR* | | 4,841,528 | | | 24,885,454 |
HC International | | 9,932,900 | | | 7,201,330 |
Kingsoft | | 19,483,000 | | | 61,812,966 |
Momo ADR* | | 2,256,940 | | | 84,364,417 |
NetEase ADR | | 279,839 | | | 78,464,057 |
SINA* | | 587,999 | | | 61,310,656 |
Sohu.com* | | 531,850 | | | 16,444,802 |
Tencent Holdings | | 3,084,175 | | | 160,962,002 |
36
Schedule of Investments March 29, 2018^
KraneShares CSI China Internet ETF (concluded)
| | | | |
COMMON STOCK (continued) | | | | | | |
Information Technology (continued) | | | | | | |
Tian Ge Interactive Holdings | | 13,038,000 | | $ | 10,980,872 | |
Weibo ADR* | | 572,860 | | | 68,479,684 | |
Yirendai ADR (A) | | 687,150 | | | 27,644,045 | |
YY ADR* | | 585,714 | | | 61,617,113 | |
| | | | | 1,133,366,078 | |
TOTAL CHINA | | | | | 1,573,899,262 | |
| | | | | | |
HONG KONG — 3.2% | | | | | | |
Consumer Discretionary — 2.3% | | | | | | |
Alibaba Pictures Group* | | 288,660,000 | | | 37,515,538 | |
| | | | | | |
Information Technology — 0.9% | | | | | | |
NetDragon Websoft Holdings | | 5,616,752 | | | 13,669,198 | |
TOTAL HONG KONG | | | | | 51,184,736 | |
TOTAL COMMON STOCK | | | | | | |
(Cost $1,507,416,052) | | | | | 1,625,083,998 | |
| | | | | | |
SHORT-TERM INVESTMENT(B)(C) — 5.1% | | | | | | |
Invesco Government & Agency Portfolio, Institutional Class, 1.574% | | 83,019,440 | | | 83,019,440 | |
TOTAL SHORT-TERM INVESTMENT | | | | | | |
(Cost $83,019,440) | | | | | 83,019,440 | |
| | | | | | |
TOTAL INVESTMENTS — 104.9% | | | | | | |
(Cost $1,590,435,492) | | | | | 1,708,103,438 | |
OTHER ASSETS LESS LIABILITIES – (4.9)% | | | | | (79,481,199 | ) |
NET ASSETS - 100% | | | | $ | 1,628,622,239 | |
As of March 29, 2018, all of the Fund’s investments were considered Level 1 of the fair value hierarchy, in accordance with the authoritative guidance under U.S. GAAP.
For the year ended March 29, 2018, there have been no transfers between Level 1 and Level 2 investments.
For the year ended March 29, 2018, there have been no transfers between Level 2 and Level 3 investments.
For the year ended March 29, 2018, there were no Level 3 investments.
37
Schedule of Investments March 29, 2018^
KraneShares E Fund China Commercial Paper ETF
| | | | |
COMMERCIAL PAPER — 97.5%‡ | | | | | |
CHINA — 97.5% | | | | | |
Consumer Staples — 13.4% | | | | | |
Fujian Provincial Expressway Ltd. | | | | | |
4.350%, 05/01/2018 | | 3,000,000 | | $ | 475,923 |
Jiangsu Communications Holding Ltd. | | | | | |
4.500%, 05/09/2018 | | 5,000,000 | | | 794,454 |
Sinopharm Group Ltd. | | | | | |
4.890%, 08/29/2018 | | 3,000,000 | | | 477,020 |
| | | | | 1,747,397 |
Financials — 34.1% | | | | | |
Beijing Yizhuang Investment Holdings | | | | | |
4.590%, 05/18/2018 | | 3,000,000 | | | 476,686 |
HeBei Transportation Investment Group | | | | | |
5.200%, 11/17/2018 | | 4,000,000 | | | 635,554 |
Lianyungang City Construction Investment Group Ltd. | | | | | |
5.490%, 01/12/2019 | | 4,000,000 | | | 635,965 |
Ping An International Financial Leasing Ltd. | | | | | |
5.180%, 11/03/2018 | | 3,000,000 | | | 477,356 |
Shaanxi Provincial Communication Construction Group | | | | | |
5.350%, 10/27/2018 | | 2,000,000 | | | 318,270 |
Shandong State-owned Assets Ltd. | | | | | |
4.730%, 06/04/2018 | | 7,000,000 | | | 1,111,739 |
Zhuhai Huafa Synthetical Development Ltd. | | | | | |
4.680%, 05/11/2018 | | 5,000,000 | | | 794,044 |
| | | | | 4,449,614 |
38
Schedule of Investments March 29, 2018^
KraneShares E Fund China Commercial Paper ETF (continued)
| | | | |
COMMERCIAL PAPER (continued) | | | | | |
Industrials — 21.9% | | | | | |
China National Building Material Ltd. | | | | | |
5.060%, 10/26/2018 | | 2,000,000 | | $ | 317,968 |
4.730%, 07/20/2018 | | 3,000,000 | | | 476,605 |
Jiangxi Provincial Expressway Investment Group Ltd. | | | | | |
4.850%, 11/26/2018 | | 5,000,000 | | | 795,126 |
Shandong Hi-Speed Group Ltd. | | | | | |
4.790%, 06/02/2018 | | 2,000,000 | | | 317,747 |
South Cement Ltd. | | | | | |
4.730%, 06/19/2018 | | 3,000,000 | | | 476,541 |
Tianjin Rail Transit Group Ltd. | | | | | |
4.600%, 05/19/2018 | | 3,000,000 | | | 476,415 |
| | | | | 2,860,402 |
Materials — 6.1% | | | | | |
China National Gold Group Ltd. | | | | | |
4.650%, 05/22/2018 | | 3,000,000 | | | 476,524 |
Shandong Hongqiao New Material Ltd. | | | | | |
6.250%, 03/16/2019 | | 2,000,000 | | | 318,217 |
| | | | | 794,741 |
Utilities — 22.0% | | | | | |
Beijing Jingneng Power Ltd. | | | | | |
4.600%, 04/26/2018 | | 3,000,000 | | | 476,821 |
China Datang | | | | | |
4.900%, 08/01/2018 | | 3,000,000 | | | 477,138 |
Shenergy Group Ltd. | | | | | |
4.350%, 04/23/2018 | | 5,000,000 | | | 794,575 |
Shenzhen Energy Group Ltd. | | | | | |
4.990%, 08/12/2018 | | 7,000,000 | | | 1,112,203 |
| | | | | 2,860,737 |
TOTAL COMMERCIAL PAPER | | | | | |
(Cost $12,244,479) | | | | | 12,712,891 |
| | | | | |
SHORT-TERM INVESTMENTS — 0.4% | | | | | |
China Universal Express Income Money Market Fund(B)(C),
3.701% | | 375 | | | 59 |
E Fund Money Market Fund(B)(C), 4.476%* | | 149,351 | | | 23,714 |
Fortune SGAM Xianjin Tianyi Money Market Fund(B)(C), 4.198% | | 156,647 | | | 24,889 |
Xianjinbao Real-Time Redemption Money Market Fund(B)(C), 3.573% | | 3,408 | | | 542 |
TOTAL SHORT-TERM INVESTMENTS
(Cost $18,283) | | | | | 49,204 |
TOTAL INVESTMENTS — 97.9%
(Cost $12,262,762) | | | | | 12,762,095 |
OTHER ASSETS LESS LIABILITIES — 2.1% | | | | | 268,188 |
NET ASSETS — 100% | | | | $ | 13,030,283 |
39
Schedule of Investments March 29, 2018^
KraneShares E Fund China Commercial Paper ETF (concluded)
| | Value
of Shares Held as
of 3/31/17 | | | | | | Change in Unrealized Appreciation (Depreciation) | | | | Value
of Shares Held as
of 3/29/18 | | Number of
Shares Held as
of 3/29/18 | | |
E Fund Money Market Fund |
| | $482,743 | | $119,798 | | $(644,178) | | $6,539 | | $58,812 | | $23,714 | | 149,351 | | $— |
| | | | | | | | |
Investments in Securities | | | | | | | | | | | | |
Commercial Paper | | $ | — | | $ | 12,712,891 | | $ | — | | $ | 12,712,891 |
Short-Term Investments | | | 49,204 | | | — | | | — | | | 49,204 |
Total Investments in Securities | | $ | 49,204 | | $ | 12,712,891 | | $ | — | | $ | 12,762,095 |
For the year ended March 29, 2018, there have been no transfers between Level 1 and Level 2 investments.
For the year ended March 29, 2018, there have been no transfers between Level 2 and Level 3 investments.
For the year ended March 29, 2018, there were no Level 3 investments.
40
Schedule of Investments March 29, 2018^
KraneShares FTSE Emerging Markets Plus ETF
| | | | | | |
COMMON STOCK — 81.9%‡ | | | | | | | |
BRAZIL — 4.4% | | | | | | | |
Consumer Discretionary — 0.5% | | | | | | | |
Lojas Renner | | 1,210 | | | | $ | 12,433 |
Consumer Staples — 1.0% | | | | | | | |
Ambev | | 2,850 | | | | | 20,760 |
BRF* | | 900 | | | | | 6,182 |
| | | | | | | 26,942 |
Energy — 0.7% | | | | | | | |
Petroleo Brasileiro* | | 1,298 | | | | | 9,139 |
Ultrapar Participacoes | | 427 | | | | | 9,188 |
| | | | | | | 18,327 |
Financials — 0.8% | | | | | | | |
B3 — Brasil Bolsa Balcao | | 1,720 | | | | | 13,854 |
BB Seguridade Participacoes | | 910 | | | | | 8,022 |
| | | | | | | 21,876 |
Information Technology — 0.2% | | | | | | | |
Cielo | | 811 | | | | | 5,054 |
Materials — 0.9% | | | | | | | |
Vale | | 2,000 | | | | | 25,521 |
Telecommunication Services — 0.3% | | | | | | | |
TIM Participacoes | | 2,193 | | | | | 9,488 |
TOTAL BRAZIL | | | | | | | 119,641 |
| | | | | | | |
CHILE — 1.1% | | | | | | | |
Energy — 0.2% | | | | | | | |
Empresas COPEC | | 456 | | | | | 7,163 |
Financials — 0.2% | | | | | | | |
Banco Santander Chile | | 56,610 | | | | | 4,772 |
Utilities — 0.7% | | | | | | | |
Enel Americas | | 45,128 | | | | | 10,541 |
Enel Generacion Chile | | 9,353 | | | | | 7,631 |
| | | | | | | 18,172 |
TOTAL CHILE | | | | | | | 30,107 |
41
Schedule of Investments March 29, 2018^
KraneShares FTSE Emerging Markets Plus ETF (continued)
| | | | | | |
COMMON STOCK (continued) | | | | | | | |
CHINA — 24.8% | | | | | | | |
Consumer Discretionary — 1.3% | | | | | | | |
BYD, Cl H* | | 3,475 | | | | $ | 27,098 |
Ctrip.com International ADR* | | 188 | | | | | 8,765 |
Shanghai Jinjiang International Hotels Development | | 200 | | | | | 532 |
| | | | | | | 36,395 |
Consumer Staples — 0.2% | | | | | | | |
Hengan International Group | | 560 | | | | | 5,187 |
Energy — 1.8% | | | | | | | |
China Petroleum & Chemical, Cl H | | 16,500 | | | | | 14,486 |
China Shenhua Energy, Cl H | | 4,701 | | | | | 11,680 |
CNOOC | | 9,826 | | | | | 14,473 |
PetroChina, Cl H | | 11,984 | | | | | 8,230 |
| | | | | | | 48,869 |
Financials — 6.6% | | | | | | | |
Agricultural Bank of China, Cl H | | 26,397 | | | | | 15,001 |
Bank of China, Cl H | | 48,396 | | | | | 26,022 |
China CITIC Bank, Cl H | | 21,858 | | | | | 14,928 |
China Construction Bank, Cl H | | 57,296 | | | | | 58,841 |
China Life Insurance, Cl H | | 7,483 | | | | | 20,595 |
New China Life Insurance, Cl H | | 1,445 | | | | | 6,729 |
PICC Property & Casualty, Cl H | | 2,340 | | | | | 4,097 |
Ping An Insurance Group of China, Cl H | | 3,000 | | | | | 30,503 |
| | | | | | | 176,716 |
Health Care — 0.3% | | | | | | | |
China Medical System Holdings | | 3,340 | | | | | 7,584 |
Industrials — 1.2% | | | | | | | |
Anhui Expressway, Cl H | | 15,512 | | | | | 11,859 |
China Communications Construction, Cl H | | 14,690 | | | | | 15,086 |
CITIC | | 3,780 | | | | | 5,288 |
| | | | | | | 32,233 |
Information Technology — 11.2% | | | | | | | |
Alibaba Group Holding ADR* | | 418 | | | | | 76,720 |
Baidu ADR* | | 248 | | | | | 55,351 |
Hanergy Thin Film Power Group*(A)(B)(C) | | 4,364 | | | | | 6 |
NetEase ADR | | 130 | | | | | 36,451 |
Tencent Holdings | | 2,558 | | | | | 133,501 |
| | | | | | | 302,029 |
Real Estate — 0.7% | | | | | | | |
China Overseas Land & Investment | | 2,839 | | | | | 9,857 |
China Resources Land | | 2,214 | | | | | 8,054 |
| | | | | | | 17,911 |
Telecommunication Services — 1.0% | | | | | | | |
China Mobile | | 2,972 | | | | | 27,246 |
Utilities — 0.5% | | | | | | | |
ENN Energy Holdings | | 882 | | | | | 7,878 |
Huaneng Power International, Cl H | | 9,077 | | | | | 6,095 |
| | | | | | | 13,973 |
TOTAL CHINA | | | | | | | 668,143 |
42
Schedule of Investments March 29, 2018^
KraneShares FTSE Emerging Markets Plus ETF (continued)
| | | | | | |
COMMON STOCK (continued) | | | | | | | |
COLOMBIA — 1.3% | | | | | | | |
Energy — 0.5% | | | | | | | |
Ecopetrol | | 14,710 | | | | $ | 13,772 |
Financials — 0.4% | | | | | | | |
Bancolombia | | 507 | | | | | 5,485 |
Financiera Colombiana | | 195 | | | | | 1,659 |
Grupo de Inversiones Suramericana | | 377 | | | | | 5,032 |
| | | | | | | 12,176 |
Materials — 0.4% | | | | | | | |
Cementos Argos | | 1,089 | | | | | 3,778 |
Grupo Argos | | 940 | | | | | 6,334 |
| | | | | | | 10,112 |
TOTAL COLOMBIA | | | | | | | 36,060 |
| | | | | | | |
CZECH REPUBLIC — 0.6% | | | | | | | |
Financials — 0.2% | | | | | | | |
Komercni banka as | | 130 | | | | | 5,927 |
Utilities — 0.4% | | | | | | | |
CEZ | | 461 | | | | | 11,480 |
TOTAL CZECH REPUBLIC | | | | | | | 17,407 |
| | | | | | | |
EGYPT — 2.2% | | | | | | | |
Financials — 1.1% | | | | | | | |
Commercial International Bank Egypt SAE | | 4,326 | | | | | 21,841 |
Egyptian Financial Group-Hermes Holding | | 6,108 | | | | | 8,918 |
| | | | | | | 30,759 |
Industrials — 0.5% | | | | | | | |
ElSewedy Electric | | 1,111 | | | | | 13,652 |
Real Estate — 0.3% | | | | | | | |
Talaat Moustafa Group | | 11,045 | | | | | 7,167 |
Telecommunication Services — 0.3% | | | | | | | |
Global Telecom Holding SAE* | | 19,879 | | | | | 7,408 |
TOTAL EGYPT | | | | | | | 58,986 |
| | | | | | | |
HONG KONG — 1.2% | | | | | | | |
Consumer Discretionary — 0.3% | | | | | | | |
Haier Electronics Group | | 2,056 | | | | | 7,322 |
Consumer Staples — 0.0% | | | | | | | |
Qinqin Foodstuffs Group Cayman* | | 112 | | | | | 34 |
Financials — 0.9% | | | | | | | |
China Cinda Asset Management, Cl H | | 13,504 | | | | | 4,904 |
Industrial & Commercial Bank of China, Cl H | | 19,441 | | | | | 16,671 |
People’s Insurance Group of China, Cl H | | 6,452 | | | | | 3,017 |
| | | | | | | 24,592 |
TOTAL HONG KONG | | | | | | | 31,948 |
| | | | | | | |
HUNGARY — 0.3% | | | | | | | |
Financials — 0.3% | | | | | | | |
OTP Bank | | 210 | | | | | 9,448 |
TOTAL HUNGARY | | | | | | | 9,448 |
43
Schedule of Investments March 29, 2018^
KraneShares FTSE Emerging Markets Plus ETF (continued)
| | | | | | |
COMMON STOCK (continued) | | | | | | | |
INDIA — 14.6% | | | | | | | |
Consumer Discretionary — 0.9% | | | | | | | |
Tata Motors ADR* | | 900 | | | | $ | 23,130 |
| | | | | | | |
Financials — 7.5% | | | | | | | |
HDFC Bank ADR | | 1,500 | | | | | 148,155 |
ICICI Bank ADR | | 6,168 | | | | | 54,587 |
| | | | | | | 202,742 |
Health Care — 0.6% | | | | | | | |
Dr Reddy’s Laboratories ADR | | 512 | | | | | 16,737 |
| | | | | | | |
Information Technology — 3.7% | | | | | | | |
Infosys ADR | | 4,415 | | | | | 78,808 |
Wipro ADR | | 3,924 | | | | | 20,248 |
| | | | | | | 99,056 |
Materials — 1.9% | | | | | | | |
Vedanta ADR | | 2,908 | | | | | 51,093 |
TOTAL INDIA | | | | | | | 392,758 |
| | | | | | | |
INDONESIA — 5.8% | | | | | | | |
Consumer Discretionary — 0.8% | | | | | | | |
Astra International | | 38,102 | | | | | 20,203 |
Consumer Staples — 0.6% | | | | | | | |
Indofood Sukses Makmur | | 12,428 | | | | | 6,499 |
Unilever Indonesia | | 2,784 | | | | | 10,015 |
| | | | | | | 16,514 |
Financials — 2.8% | | | | | | | |
Bank Central Asia | | 12,820 | | | | | 21,697 |
Bank Mandiri Persero | | 25,444 | | | | | 14,184 |
Bank Negara Indonesia Persero | | 20,176 | | | | | 12,713 |
Bank Rakyat Indonesia Persero | | 104,205 | | | | | 27,248 |
| | | | | | | 75,842 |
Industrials — 0.6% | | | | | | | |
United Tractors | | 7,104 | | | | | 16,512 |
Materials — 0.3% | | | | | | | |
Semen Indonesia Persero | | 12,163 | | | | | 9,144 |
Telecommunication Services — 0.7% | | | | | | | |
Telekomunikasi Indonesia Persero | | 67,448 | | | | | 17,636 |
TOTAL INDONESIA | | | | | | | 155,851 |
| | | | | | | |
MALAYSIA — 1.4% | | | | | | | |
Consumer Discretionary — 0.1% | | | | | | | |
Genting | | 1,603 | | | | | 3,606 |
Industrials — 0.4% | | | | | | | |
Gamuda | | 7,674 | | | | | 10,217 |
Materials — 0.4% | | | | | | | |
Petronas Chemicals Group | | 4,820 | | | | | 10,156 |
Utilities — 0.5% | | | | | | | |
Petronas Gas | | 1,305 | | | | | 6,012 |
Tenaga Nasional | | 1,817 | | | | | 7,591 |
| | | | | | | 13,603 |
TOTAL MALAYSIA | | | | | | | 37,582 |
44
Schedule of Investments March 29, 2018^
KraneShares FTSE Emerging Markets Plus ETF (continued)
| | | | | | |
COMMON STOCK (continued) | | | | | | | |
MEXICO — 3.6% | | | | | | | |
Consumer Discretionary — 0.2% | | | | | | | |
Grupo Televisa | | 1,774 | | | | $ | 5,620 |
Consumer Staples — 0.9% | | | | | | | |
Fomento Economico Mexicano | | 1,336 | | | | | 12,137 |
Grupo Bimbo, Ser A | | 1,430 | | | | | 3,116 |
Wal-Mart de Mexico | | 3,372 | | | | | 8,546 |
| | | | | | | 23,799 |
Financials — 0.4% | | | | | | | |
Gentera | | 4,178 | | | | | 3,035 |
Grupo Financiero Banorte, Cl O | | 1,536 | | | | | 9,351 |
| | | | | | | 12,386 |
Industrials — 0.4% | | | | | | | |
Grupo Aeroportuario del Sureste, Cl B | | 374 | | | | | 6,278 |
Promotora y Operadora de Infraestructura | | 412 | | | | | 4,080 |
| | | | | | | 10,358 |
Materials — 0.8% | | | | | | | |
Cemex* | | 12,627 | | | | | 8,322 |
Grupo Mexico | | 3,992 | | | | | 13,242 |
| | | | | | | 21,564 |
Real Estate — 0.2% | | | | | | | |
Fibra Uno Administracion† | | 3,433 | | | | | 5,146 |
Telecommunication Services — 0.7% | | | | | | | |
America Movil | | 19,782 | | | | | 18,694 |
TOTAL MEXICO | | | | | | | 97,567 |
| | | | | | | |
PAKISTAN — 1.5% | | | | | | | |
Energy — 1.1% | | | | | | | |
Oil & Gas Development | | 10,465 | | | | | 15,802 |
Pakistan Petroleum | | 7,376 | | | | | 13,643 |
| | | | | | | 29,445 |
Materials — 0.4% | | | | | | | |
Fauji Fertilizer | | 11,972 | | | | | 9,706 |
TOTAL PAKISTAN | | | | | | | 39,151 |
| | | | | | | |
PERU — 1.2% | | | | | | | |
Financials — 0.9% | | | | | | | |
Credicorp | | 105 | | | | | 23,839 |
Materials — 0.3% | | | | | | | |
Cia de Minas Buenaventura ADR | | 502 | | | | | 7,646 |
TOTAL PERU | | | | | | | 31,485 |
| | | | | | | |
PHILIPPINES — 1.3% | | | | | | | |
Consumer Staples — 0.1% | | | | | | | |
Universal Robina | | 1,150 | | | | | 3,350 |
Financials — 0.2% | | | | | | | |
Ayala | | 315 | | | | | 5,723 |
Industrials — 0.6% | | | | | | | |
International Container Terminal Services | | 3,777 | | | | | 7,239 |
SM Investments | | 510 | | | | | 8,963 |
| | | | | | | 16,202 |
45
Schedule of Investments March 29, 2018^
KraneShares FTSE Emerging Markets Plus ETF (continued)
| | | | | | |
COMMON STOCK (continued) | | | | | | | |
Real Estate — 0.3% | | | | | | | |
Ayala Land | | 9,000 | | | | $ | 7,089 |
Telecommunication Services — 0.1% | | | | | | | |
Globe Telecom | | 80 | | | | | 2,487 |
TOTAL PHILIPPINES | | | | | | | 34,851 |
| | | | | | | |
POLAND — 1.4% | | | | | | | |
Energy — 0.4% | | | | | | | |
Polski Koncern Naftowy ORLEN | | 466 | | | | | 11,444 |
Financials — 1.0% | | | | | | | |
Bank Pekao | | 130 | | | | | 4,680 |
Powszechna Kasa Oszczednosci Bank Polski | | 698 | | | | | 8,241 |
Powszechny Zaklad Ubezpieczen | | 1,098 | | | | | 13,383 |
| | | | | | | 26,304 |
TOTAL POLAND | | | | | | | 37,748 |
| | | | | | | |
RUSSIA — 6.1% | | | | | | | |
Consumer Staples — 0.3% | | | | | | | |
Magnit GDR | | 463 | | | | | 8,536 |
Energy — 3.6% | | | | | | | |
Gazprom | | 9,824 | | | | | 24,398 |
Lukoil | | 569 | | | | | 39,498 |
Novatek OAO | | 130 | | | | | 1,677 |
Rosneft | | 1,064 | | | | | 5,854 |
Tatneft | | 2,482 | | | | | 26,547 |
| | | | | | | 97,974 |
Financials — 1.6% | | | | | | | |
Sberbank of Russia | | 9,698 | | | | | 42,654 |
Materials — 0.6% | | | | | | | |
MMC Norilsk Nickel | | 88 | | | | | 16,521 |
TOTAL RUSSIA | | | | | | | 165,685 |
| | | | | | | |
SOUTH AFRICA — 1.5% | | | | | | | |
Consumer Discretionary — 0.7% | | | | | | | |
Naspers, Cl N | | 77 | | | | | 18,793 |
Steinhoff International Holdings* | | 506 | | | | | 141 |
| | | | | | | 18,934 |
Financials — 0.5% | | | | | | | |
Remgro | | 634 | | | | | 11,879 |
Industrials — 0.0% | | | | | | | |
Novus Holdings | | 26 | | | | | 10 |
Information Technology — 0.3% | | | | | | | |
Sasol | | 244 | | | | | 8,303 |
TOTAL SOUTH AFRICA | | | | | | | 39,126 |
| | | | | | | |
TAIWAN — 2.4% | | | | | | | |
Energy — 0.2% | | | | | | | |
Formosa Petrochemical | | 1,447 | | | | | 5,881 |
Information Technology — 1.0% | | | | | | | |
Taiwan Semiconductor Manufacturing | | 3,163 | | | | | 26,469 |
46
Schedule of Investments March 29, 2018^
KraneShares FTSE Emerging Markets Plus ETF (continued)
| | | | | | |
COMMON STOCK (continued) | | | | | | | |
Materials — 1.2% | | | | | | | |
Formosa Chemicals & Fibre | | 2,556 | | | | $ | 9,555 |
Formosa Plastics | | 3,312 | | | | | 11,700 |
Nan Ya Plastics | | 4,403 | | | | | 12,353 |
| | | | | | | 33,608 |
TOTAL TAIWAN | | | | | | | 65,958 |
| | | | | | | |
THAILAND — 2.4% | | | | | | | |
Consumer Staples — 0.4% | | | | | | | |
CP ALL | | 4,096 | | | | | 11,429 |
Energy — 0.9% | | | | | | | |
PTT | | 865 | | | | | 15,159 |
Thai Oil | | 3,342 | | | | | 9,699 |
| | | | | | | 24,858 |
Health Care — 0.2% | | | | | | | |
Bumrungrad Hospital | | 824 | | | | | 5,454 |
Industrials — 0.4% | | | | | | | |
Airports of Thailand | | 4,700 | | | | | 9,920 |
Telecommunication Services — 0.5% | | | | | | | |
Advanced Info Service | | 1,805 | | | | | 11,891 |
TOTAL THAILAND | | | | | | | 63,552 |
| | | | | | | |
TURKEY — 2.3% | | | | | | | |
Consumer Discretionary — 0.2% | | | | | | | |
Arcelik | | 986 | | | | | 4,450 |
Consumer Staples — 0.3% | | | | | | | |
BIM Birlesik Magazalar | | 496 | | | | | 8,934 |
Energy — 0.5% | | | | | | | |
Tupras Turkiye Petrol Rafinerileri | | 505 | | | | | 14,010 |
Financials — 0.6% | | | | | | | |
Akbank | | 2,892 | | | | | 6,979 |
Turkiye Garanti Bankasi | | 3,481 | | | | | 9,578 |
| | | | | | | 16,557 |
Industrials — 0.4% | | | | | | | |
KOC Holding | | 2,195 | | | | | 9,021 |
Telecommunication Services — 0.3% | | | | | | | |
Turkcell Iletisim Hizmetleri | | 2,250 | | | | | 8,554 |
TOTAL TURKEY | | | | | | | 61,526 |
| | | | | | | |
UNITED ARAB EMIRATES — 0.5% | | | | | | | |
Financials — 0.2% | | | | | | | |
Abu Dhabi Commercial Bank | | 1,164 | | | | | 2,091 |
First Abu Dhabi Bank | | 669 | | | | | 2,131 |
| | | | | | | 4,222 |
Real Estate — 0.3% | | | | | | | |
Emaar Properties | | 5,130 | | | | | 8,101 |
Telecommunication Services — 0.0% | | | | | | | |
Emirates Telecommunications Group | | 186 | | | | | 894 |
TOTAL UNITED ARAB EMIRATES | | | | | | | 13,217 |
TOTAL COMMON STOCK
(Cost $1,826,126) | | | | | | | 2,207,797 |
47
Schedule of Investments March 29, 2018^
KraneShares FTSE Emerging Markets Plus ETF (continued)
| | | | | | |
OTHER INVESTMENT COMPANY — 13.4% | | | | | | | |
KraneShares Bosera MSCI China A Share ETF** | | 10,342 | | | | $ | 360,832 |
TOTAL OTHER INVESTMENT COMPANY
(Cost $380,589) | | | | | | | 360,832 |
| | | | | | | |
PREFERRED STOCK — 3.3% | | | | | | | |
BRAZIL— 3.3% | | | | | | | |
Energy — 0.8% | | | | | | | |
Petroleo Brasileiro* | | 3,200 | | | | | 20,614 |
Financials — 2.2% | | | | | | | |
Banco Bradesco(D) | | 1,742 | | | | | 20,714 |
Itau Unibanco Holding(D) | | 1,672 | | | | | 25,978 |
Itausa — Investimentos Itau(D) | | 3,391 | | | | | 14,192 |
| | | | | | | 60,884 |
Telecommunication Services — 0.3% | | | | | | | |
Telefonica Brasil(D) | | 500 | | | | | 7,626 |
TOTAL PREFERRED STOCK
(Cost $58,948) | | | | | | | 89,124 |
TOTAL INVESTMENTS — 98.6%
(Cost $2,265,663) | | | | | | | 2,657,753 |
OTHER ASSETS LESS LIABILITIES – 1.4% | | | | | | | 38,716 |
NET ASSETS - 100% | | | | | | $ | 2,696,469 |
| | Value
of Shares Held as
of 3/31/17 | | | | | | Change in Unrealized Appreciation (Depreciation) | | | | Value
of Shares Held as
of 3/29/18 | | Number of Shares Held as
of 3/29/18 | | | | Capital Gain Distributions |
KraneShares Bosera MSCI China A Share ETF | | |
| | $325,969 | | $— | | $(34,189) | | $81,248 | | $(12,196) | | $360,832 | | 10,342 | | $1,880 | | $1,663 |
48
Schedule of Investments March 29, 2018^
KraneShares FTSE Emerging Markets Plus ETF (concluded)
The following is a list of the inputs used, as of March 29, 2018, in valuing the Fund’s investments carried at value:
| | | | | | | | |
Investments in Securities | | | | | | | | | | | | |
Common Stock | | | | | | | | | | | | |
Brazil | | $ | 119,641 | | $ | — | | $ | — | | $ | 119,641 |
Chile | | | 30,107 | | | — | | | — | | | 30,107 |
China | | | | | | | | | | | | |
Consumer Discretionary | | | 36,395 | | | — | | | — | | | 36,395 |
Consumer Staples | | | 5,187 | | | — | | | — | | | 5,187 |
Energy | | | 48,869 | | | — | | | — | | | 48,869 |
Financials | | | 176,716 | | | — | | | — | | | 176,716 |
Health Care | | | 7,584 | | | — | | | — | | | 7,584 |
Industrials | | | 32,233 | | | — | | | — | | | 32,233 |
Information Technology | | | 302,023 | | | — | | | 6 | | | 302,029 |
Real Estate | | | 17,911 | | | — | | | — | | | 17,911 |
Telecommunication Services | | | 27,246 | | | — | | | — | | | 27,246 |
Utilities | | | 13,973 | | | — | | | — | | | 13,973 |
Colombia | | | 36,060 | | | — | | | — | | | 36,060 |
Czech Republic | | | 17,407 | | | — | | | — | | | 17,407 |
Egypt | | | 58,986 | | | — | | | — | | | 58,986 |
Hong Kong | | | 31,948 | | | — | | | — | | | 31,948 |
Hungary | | | 9,448 | | | — | | | — | | | 9,448 |
India | | | 392,758 | | | — | | | — | | | 392,758 |
Indonesia | | | 155,851 | | | — | | | — | | | 155,851 |
Malaysia | | | 37,582 | | | — | | | — | | | 37,582 |
Mexico | | | 97,567 | | | — | | | — | | | 97,567 |
Pakistan | | | 39,151 | | | — | | | — | | | 39,151 |
Peru | | | 31,485 | | | — | | | — | | | 31,485 |
Philippines | | | 34,851 | | | — | | | — | | | 34,851 |
Poland | | | 37,748 | | | — | | | — | | | 37,748 |
Russia | | | 165,685 | | | — | | | — | | | 165,685 |
South Africa | | | 39,126 | | | — | | | — | | | 39,126 |
Taiwan | | | 65,958 | | | — | | | — | | | 65,958 |
Thailand | | | 63,552 | | | — | | | — | | | 63,552 |
Turkey | | | 61,526 | | | — | | | — | | | 61,526 |
United Arab Emirates | | | 13,217 | | | — | | | — | | | 13,217 |
Total Common Stock | | | 2,207,791 | | | — | | | 6 | | | 2,207,797 |
Other Investment Company | | | 360,832 | | | — | | | — | | | 360,832 |
Preferred Stock | | | 89,124 | | | — | | | — | | | 89,124 |
Total Investments in Securities | | $ | 2,657,747 | | $ | — | | $ | 6 | | $ | 2,657,753 |
For the year ended March 29, 2018, there have been no transfers between Level 1 and Level 2 investments.
For the year ended March 29, 2018, there have been no transfers between Level 2 and Level 3 investments.
For the year ended March 29, 2018, there have been no transfers between Level 1 and Level 3 investments. Transfers between levels are recognized at period end.
Amounts designated as “—” are $0 or have been rounded to $0.
49
Schedule of Investments March 29, 2018^
KraneShares MSCI One Belt One Road Index ETF
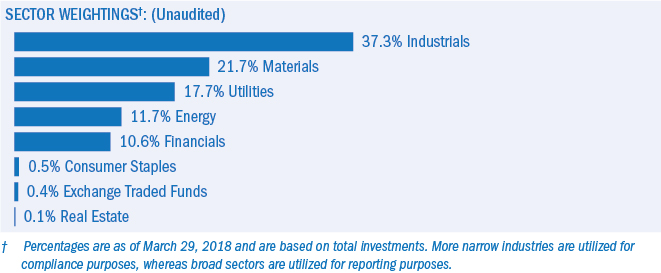
| | | | | | |
COMMON STOCK — 92.5%‡ | | | | | | | |
CHINA — 39.5% | | | | | | | |
Financials — 3.2% | | | | | | | |
Bank of Guiyang, Cl A | | 52,935 | | | | $ | 122,163 |
Bank of Jiangsu, Cl A | | 114,455 | | | | | 133,526 |
Bank of Nanjing, Cl A | | 208,391 | | | | | 272,590 |
Bank of Ningbo, Cl A | | 115,432 | | | | | 355,009 |
Chongqing Rural Commercial Bank, Cl H | | 201,925 | | | | | 154,628 |
| | | | | | | 1,037,916 |
Industrials — 19.1% | | | | | | | |
Beijing New Building Materials, Cl A | | 30,908 | | | | | 122,665 |
China Gezhouba Group, Cl A | | 143,050 | | | | | 196,896 |
China Railway Construction, Cl H | | 194,500 | | | | | 194,790 |
China Railway Group, Cl H | | 374,500 | | | | | 259,582 |
China Railway Hi-tech Industry, Cl A | | 70,777 | | | | | 130,491 |
China State Construction Engineering, Cl A | | 828,657 | | | | | 1,155,065 |
CRRC, Cl H | | 355,850 | | | | | 303,331 |
Daqin Railway, Cl A | | 384,132 | | | | | 506,746 |
Guangshen Railway, Cl A | | 157,000 | | | | | 114,287 |
Guoxuan High-Tech, Cl A | | 33,645 | | | | | 116,576 |
Han’s Laser Technology Industry Group, Cl A | | 22,500 | | | | | 189,178 |
Jiangsu Expressway, Cl H | | 106,000 | | | | | 149,918 |
Jiangsu Zhongtian Technology, Cl A | | 78,349 | | | | | 148,935 |
Metallurgical Corp of China, Cl A | | 445,000 | | | | | 266,646 |
NARI Technology, Cl A | | 65,731 | | | | | 174,887 |
Ningbo Zhoushan Port, Cl | | 128,001 | | | | | 108,436 |
Northcom Group, Cl A* | | 22,940 | | | | | 99,538 |
Shanghai Construction Group, Cl A | | 242,900 | | | | | 144,774 |
Shanghai Electric Group, Cl H | | 274,000 | | | | | 94,961 |
Shanghai International Port Group, Cl A | | 208,610 | | | | | 235,742 |
Suzhou Gold Mantis Construction Decoration, Cl A | | 54,984 | | | | | 112,647 |
TangShan Port Group, Cl A | | 132,820 | | | | | 100,696 |
TBEA, Cl A | | 88,875 | | | | | 124,447 |
XCMG Construction Machinery, Cl A | | 164,700 | | | | | 102,615 |
Xinjiang Goldwind Science & Technology, Cl A | | 56,789 | | | | | 160,393 |
Yangzijiang Shipbuilding Holdings | | 165,100 | | | | | 152,346 |
50
Schedule of Investments March 29, 2018^
KraneShares MSCI One Belt One Road Index ETF (continued)
| | | | | | |
COMMON STOCK (continued) | | | | | | | |
Industrials (continued) | | | | | | | |
Zhejiang Expressway, Cl H | | 126,000 | | | | $ | 128,596 |
Zhengzhou Yutong Bus, Cl A | | 54,347 | | | | | 194,612 |
Zhuzhou CRRC Times Electric, Cl H | | 46,300 | | | | | 224,176 |
Zoomlion Heavy Industry Science and Technology, Cl A | | 173,035 | | | | | 115,784 |
| | | | | | | 6,129,756 |
Materials — 4.3% | | | | | | | |
Anhui Conch Cement, Cl H | | 86,500 | | | | | 471,169 |
BBMG, Cl H | | 222,780 | | | | | 100,486 |
Beijing Oriental Yuhong Waterproof Technology, Cl A | | 20,803 | | | | | 137,349 |
China National Building Material, Cl H | | 118,000 | | | | | 128,099 |
China Northern Rare Earth Group High-Tech, Cl A | | 178,824 | | | | | 368,352 |
Tangshan Jidong Cement, Cl A* | | 34,601 | | | | | 77,432 |
Yunnan Chihong Zinc & Germanium, Cl A | | 91,359 | | | | | 92,932 |
| | | | | | | 1,375,819 |
Utilities — 12.9% | | | | | | | |
CGN Power, Cl H | | 966,875 | | | | | 250,087 |
China Longyuan Power Group, Cl H | | 304,000 | | | | | 233,182 |
China National Nuclear Power, Cl A | | 364,642 | | | | | 388,306 |
China Yangtze Power, Cl A | | 378,843 | | | | | 969,432 |
Datang International Power Generation, Cl H | | 276,000 | | | | | 82,642 |
ENN Energy Holdings | | 58,700 | | | | | 524,301 |
GD Power Development, Cl A | | 600,402 | | | | | 284,374 |
Huadian Power International, Cl A | | 267,600 | | | | | 161,197 |
Huaneng Power International, Cl H | | 391,000 | | | | | 262,550 |
Huaneng Renewables, Cl H | | 414,860 | | | | | 154,879 |
SDIC Power Holdings, Cl A | | 190,506 | | | | | 213,769 |
Shanghai Electric Power, Cl A | | 73,575 | | | | | 103,492 |
Shenergy, Cl A | | 126,919 | | | | | 116,193 |
Sichuan Chuantou Energy, Cl A | | 119,284 | | | | | 169,493 |
Zhejiang Zheneng Electric Power, Cl A | | 239,041 | | | | | 210,101 |
| | | | | | | 4,123,998 |
TOTAL CHINA | | | | | | | 12,667,489 |
| | | | | | | |
HONG KONG — 4.2% | | | | | | | |
Industrials — 0.5% | | | | | | | |
Shenzhen International Holdings | | 74,600 | | | | | 163,300 |
Utilities — 3.7% | | | | | | | |
China Gas Holdings | | 141,600 | | | | | 515,102 |
China Power International Development | | 359,000 | | | | | 92,400 |
China Resources Gas Group | | 77,500 | | | | | 269,087 |
China Resources Power Holdings | | 170,135 | | | | | 310,428 |
| | | | | | | 1,187,017 |
TOTAL HONG KONG | | | | | | | 1,350,317 |
| | | | | | | |
INDONESIA — 1.9% | | | | | | | |
Energy — 1.9% | | | | | | | |
Adaro Energy | | 3,270,100 | | | | | 505,925 |
Bumi Resources* | | 5,480,100 | | | | | 113,841 |
TOTAL INDONESIA | | | | | | | 619,766 |
51
Schedule of Investments March 29, 2018^
KraneShares MSCI One Belt One Road Index ETF (continued)
| | | | | | |
COMMON STOCK (continued) | | | | | | | |
ISRAEL — 6.1% | | | | | | | |
Industrials — 2.0% | | | | | | | |
Elbit Systems | | 5,376 | | | | $ | 644,657 |
Materials — 4.1% | | | | | | | |
Frutarom Industries | | 9,001 | | | | | 823,226 |
Israel Chemicals | | 118,051 | | | | | 497,644 |
| | | | | | | 1,320,870 |
TOTAL ISRAEL | | | | | | | 1,965,527 |
| | | | | | | |
KAZAKHSTAN — 1.7% | | | | | | | |
Energy — 1.7% | | | | | | | |
KazMunaiGas Exploration Production GDR | | 38,510 | | | | | 531,438 |
TOTAL KAZAKHSTAN | | | | | | | 531,438 |
| | | | | | | |
KUWAIT — 0.5% | | | | | | | |
Industrials — 0.5% | | | | | | | |
Agility Public Warehousing KSC | | 58,672 | | | | | 169,397 |
TOTAL KUWAIT | | | | | | | 169,397 |
| | | | | | | |
MALAYSIA — 6.5% | | | | | | | |
Consumer Staples — 0.5% | | | | | | | |
Sime Darby Plantation | | 109,200 | | | | | 155,274 |
Energy — 0.5% | | | | | | | |
Sapura Energy | | 1,117,000 | | | | | 145,834 |
Industrials — 2.7% | | | | | | | |
Sime Darby | | 1,272,000 | | | | | 861,593 |
Materials — 2.7% | | | | | | | |
Petronas Chemicals Group | | 414,300 | | | | | 872,943 |
Real Estate — 0.1% | | | | | | | |
Sime Darby Property | | 109,200 | | | | | 40,089 |
TOTAL MALAYSIA | | | | | | | 2,075,733 |
| | | | | | | |
PHILIPPINES — 3.8% | | | | | | | |
Industrials — 3.8% | | | | | | | |
DMCI Holdings | | 927,600 | | | | | 216,178 |
International Container Terminal Services | | 116,000 | | | | | 222,318 |
JG Summit Holdings | | 653,500 | | | | | 785,289 |
TOTAL PHILIPPINES | | | | | | | 1,223,785 |
| | | | | | | |
POLAND — 2.6% | | | | | | | |
Materials — 2.6% | | | | | | | |
KGHM Polska Miedz | | 32,726 | | | | | 829,496 |
TOTAL POLAND | | | | | | | 829,496 |
| | | | | | | |
RUSSIA — 4.4% | | | | | | | |
Energy — 4.4% | | | | | | | |
Rosneft | | 255,540 | | | | | 1,405,914 |
TOTAL RUSSIA | | | | | | | 1,405,914 |
52
Schedule of Investments March 29, 2018^
KraneShares MSCI One Belt One Road Index ETF (continued)
| | | | | | |
COMMON STOCK (continued) | | | | | | | |
SINGAPORE — 11.2% | | | | | | | |
Financials — 6.7% | | | | | | | |
Oversea-Chinese Banking | | 220,400 | | | | $ | 2,154,753 |
Industrials — 4.5% | | | | | | | |
Hutchison Port Holdings Trust, Cl U | | 500,100 | | | | | 147,530 |
Keppel | | 97,600 | | | | | 578,321 |
Singapore Airlines | | 48,000 | | | | | 396,797 |
Singapore Technologies Engineering | | 107,600 | | | | | 294,581 |
| | | | | | | 1,417,229 |
TOTAL SINGAPORE | | | | | | | 3,571,982 |
| | | | | | | |
SOUTH AFRICA — 1.9% | | | | | | | |
Materials — 1.9% | | | | | | | |
Anglo American Platinum | | 12,224 | | | | | 334,261 |
Impala Platinum Holdings* | | 142,524 | | | | | 283,154 |
TOTAL SOUTH AFRICA | | | | | | | 617,415 |
| | | | | | | |
THAILAND — 6.3% | | | | | | | |
Energy — 1.6% | | | | | | | |
IRPC | | 2,265,000 | | | | | 525,144 |
Materials — 4.7% | | | | | | | |
PTT Global Chemical | | 497,500 | | | | | 1,507,455 |
TOTAL THAILAND | | | | | | | 2,032,599 |
| | | | | | | |
TURKEY — 1.9% | | | | | | | |
Industrials — 1.9% | | | | | | | |
Turk Hava Yollari AO* | | 120,973 | | | | | 592,741 |
TOTAL TURKEY | | | | | | | 592,741 |
TOTAL COMMON STOCK
(Cost $30,700,869) | | | | | | | 29,653,599 |
| | | | | | | |
PREFERRED STOCK — 0.9% | | | | | | | |
RUSSIA— 0.9% | | | | | | | |
Energy — 0.9% | | | | | | | |
Transneft(A) | | 96 | | | | | 294,678 |
TOTAL PREFERRED STOCK
(Cost $304,950) | | | | | | | 294,678 |
| | | | | | | |
OTHER INVESTMENT COMPANIES — 0.4% | | | | | | | |
Columbia India Infrastructure ETF | | 3,800 | | | | | 53,694 |
iShares MSCI India ETF | | 1,675 | | | | | 57,168 |
TOTAL OTHER INVESTMENT COMPANIES
(Cost $115,147) | | | | | | | 110,862 |
TOTAL INVESTMENTS — 93.8%
(Cost $31,120,966) | | | | | | | 30,059,139 |
OTHER ASSETS LESS LIABILITIES — 6.2% | | | | | | | 1,988,626 |
NET ASSETS — 100% | | | | | | $ | 32,047,765 |
53
Schedule of Investments March 29, 2018^
KraneShares MSCI One Belt One Road Index ETF (concluded)
As of March 29, 2018, all of the Fund’s investments were considered Level 1 of the fair value hierarchy, in accordance with the authoritative guidance under U.S. GAAP.
For the period ended March 29, 2018, there have been no transfers between Level 1 and Level 2 investments.
For the period ended March 29, 2018, there have been no transfers between Level 2 and Level 3 investments.
For the period ended March 29, 2018, there have been no transfers between Level 1 and Level 3 investments. Transfers between levels are recognized at period end.
Amounts designated as “—” are $0 or have been rounded to $0.
54
Schedule of Investments March 29, 2018^
KraneShares Emerging Markets Consumer Technology Index ETF
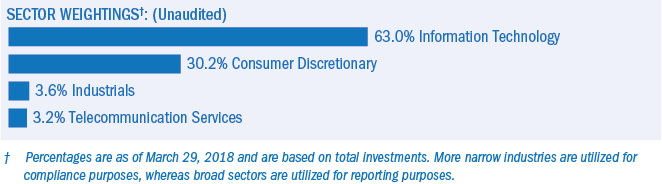
| | | | | | |
COMMON STOCK — 94.9%‡ | | | | | | | |
ARGENTINA — 2.7% | | | | | | | |
Information Technology — 2.7% | | | | | | | |
MercadoLibre | | 1,800 | | | | $ | 641,502 |
TOTAL ARGENTINA | | | | | | | 641,502 |
| | | | | | | |
BRAZIL — 4.6% | | | | | | | |
Consumer Discretionary — 2.7% | | | | | | | |
B2W Cia Digital* | | 53,400 | | | | | 409,706 |
CVC Brasil Operadora e Agencia de Viagens | | 7,200 | | | | | 131,344 |
Somos Educacao* | | 21,980 | | | | | 99,001 |
| | | | | | | 640,051 |
Information Technology — 1.9% | | | | | | | |
Cielo | | 73,100 | | | | | 455,501 |
TOTAL BRAZIL | | | | | | | 1,095,552 |
| | | | | | | |
CHINA — 58.7% | | | | | | | |
Consumer Discretionary — 17.5% | | | | | | | |
Bright Scholar Education Holdings ADR* | | 7,020 | | | | | 108,389 |
China Maple Leaf Educational Systems | | 155,000 | | | | | 207,765 |
Cogobuy Group | | 255,000 | | | | | 129,315 |
Ctrip.com International ADR* | | 14,400 | | | | | 671,328 |
JD.com ADR* | | 18,252 | | | | | 739,023 |
New Oriental Education & Technology Group ADR | | 5,544 | | | | | 485,931 |
TAL Education Group ADR | | 15,966 | | | | | 592,179 |
Vipshop Holdings ADR* | | 63,684 | | | | | 1,058,428 |
Virscend Education | | 272,768 | | | | | 169,605 |
| | | | | | | 4,161,963 |
Industrials — 3.4% | | | | | | | |
51job ADR* | | 9,468 | | | | | 814,627 |
| | | | | | | |
Information Technology — 37.8% | | | | | | | |
58.com ADR* | | 7,794 | | | | | 622,429 |
Alibaba Group Holding ADR* | | 4,176 | | | | | 766,463 |
Autohome ADR | | 8,784 | | | | | 754,897 |
Baidu ADR* | | 3,060 | | | | | 682,961 |
Bitauto Holdings ADR* | | 12,006 | | | | | 253,927 |
Cheetah Mobile ADR* | | 18,306 | | | | | 244,751 |
Fang Holdings ADR* | | 37,008 | | | | | 190,221 |
Kingdee International Software Group* | | 324,000 | | | | | 326,134 |
Momo ADR* | | 16,272 | | | | | 608,247 |
NetEase ADR | | 1,800 | | | | | 504,702 |
55
Schedule of Investments March 29, 2018^
KraneShares Emerging Markets Consumer Technology Index ETF (continued)
| | | | | | |
COMMON STOCK (continued) | | | | | | | |
Information Technology (continued) | | | | | | | |
SINA* | | 4,914 | | | | $ | 512,383 |
Sohu.com* | | 2,934 | | | | | 90,719 |
Tencent Holdings | | 18,000 | | | | | 939,414 |
Weibo ADR* | | 5,220 | | | | | 623,999 |
Yirendai ADR | | 11,880 | | | | | 477,932 |
YY ADR* | | 6,390 | | | | | 672,228 |
ZTE, Cl H* | | 223,400 | | | | | 727,275 |
| | | | | | | 8,998,682 |
TOTAL CHINA | | | | | | | 13,975,272 |
| | | | | | | |
HONG KONG — 0.4% | | | | | | | |
Information Technology — 0.4% | | | | | | | |
NetDragon Websoft Holdings | | 36,000 | | | | | 87,611 |
TOTAL HONG KONG | | | | | | | 87,611 |
| | | | | | | |
INDIA — 0.8% | | | | | | | |
Consumer Discretionary — 0.8% | | | | | | | |
MakeMyTrip* | | 5,400 | | | | | 187,380 |
TOTAL INDIA | | | | | | | 187,380 |
| | | | | | | |
MALAYSIA — 3.0% | | | | | | | |
Information Technology — 0.8% | | | | | | | |
My EG Services | | 266,000 | | | | | 195,305 |
Telecommunication Services — 2.2% | | | | | | | |
Telekom Malaysia | | 384,600 | | | | | 518,037 |
TOTAL MALAYSIA | | | | | | | 713,342 |
| | | | | | | |
POLAND — 3.3% | | | | | | | |
Consumer Discretionary — 2.5% | | | | | | | |
Cyfrowy Polsat | | 81,000 | | | | | 589,770 |
Telecommunication Services — 0.8% | | | | | | | |
Orange Polska* | | 122,544 | | | | | 207,502 |
TOTAL POLAND | | | | | | | 797,272 |
| | | | | | | |
PUERTO RICO — 0.6% | | | | | | | |
Information Technology — 0.6% | | | | | | | |
EVERTEC | | 9,162 | | | | | 149,799 |
TOTAL PUERTO RICO | | | | | | | 149,799 |
| | | | | | | |
RUSSIA — 2.8% | | | | | | | |
Information Technology — 2.8% | | | | | | | |
Mail.Ru Group GDR* | | 19,314 | | | | | 675,604 |
TOTAL RUSSIA | | | | | | | 675,604 |
| | | | | | | |
SOUTH AFRICA — 4.3% | | | | | | | |
Consumer Discretionary — 4.3% | | | | | | | |
Curro Holdings* | | 65,682 | | | | | 176,778 |
Naspers, Cl N | | 3,420 | | | | | 834,695 |
| | | | | | | 1,011,473 |
56
Schedule of Investments March 29, 2018^
KraneShares Emerging Markets Consumer Technology Index ETF (concluded)
| | | | | | |
COMMON STOCK (continued) | | | | | | | |
Industrials — 0.0% | | | | | | | |
Novus Holdings | | 1,080 | | | | $ | 418 |
TOTAL SOUTH AFRICA | | | | | | | 1,011,891 |
| | | | | | | |
SOUTH KOREA — 10.9% | | | | | | | |
Consumer Discretionary — 0.9% | | | | | | | |
Loen Entertainment | | 2,200 | | | | | 228,070 |
Information Technology — 10.0% | | | | | | | |
Com2uSCorp | | 1,552 | | | | | 271,698 |
Kakao | | 4,710 | | | | | 572,235 |
NAVER | | 1,261 | | | | | 929,867 |
NCSoft | | 1,265 | | | | | 486,584 |
NHN Entertainment* | | 1,825 | | | | | 115,572 |
| | | | | | | 2,375,956 |
TOTAL SOUTH KOREA | | | | | | | 2,604,026 |
| | | | | | | |
TAIWAN — 2.8% | | | | | | | |
Information Technology — 2.8% | | | | | | | |
Accton Technology | | 39,000 | | | | | 127,071 |
WPG Holdings | | 416,000 | | | | | 537,888 |
TOTAL TAIWAN | | | | | | | 664,959 |
TOTAL COMMON STOCK
(Cost $22,668,509) | | | | | | | 22,604,210 |
TOTAL INVESTMENTS — 94.9%
(Cost $22,668,509) | | | | | | | 22,604,210 |
OTHER ASSETS LESS LIABILITIES — 5.1% | | | | | | | 1,224,070 |
NET ASSETS - 100% | | | | | | $ | 23,828,280 |
As of March 29, 2018, all of the Fund’s investments were considered Level 1 of the fair value hierarchy, in accordance with the authoritative guidance under U.S. GAAP.
For the period ended March 29, 2018, there have been no transfers between Level 1 and Level 2 investments.
For the period ended March 29, 2018, there have been no transfers between Level 2 and Level 3 investments.
For the period ended March 29, 2018, there have been no transfers between Level 1 and Level 3 investments. Transfers between levels are recognized at period end.
57
Schedule of Investments March 29, 2018^
KraneShares MSCI China Environment Index ETF
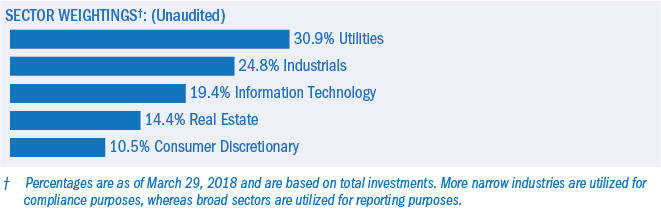
| | | | | | |
COMMON STOCK — 95.6%‡ | | | | | | | |
CHINA — 72.8% | | | | | | | |
Consumer Discretionary — 9.9% | | | | | | | |
Chaowei Power Holdings | | 322,000 | | | | $ | 173,959 |
TCL Multimedia Technology Holdings | | 227,000 | | | | | 105,860 |
Tianneng Power International | | 249,885 | | | | | 295,788 |
Yadea Group Holdings | | 396,694 | | | | | 134,956 |
| | | | | | | 710,563 |
Industrials — 15.9% | | | | | | | |
Beijing Urban Construction Design & Development Group, Cl H | | 127,000 | | | | | 70,553 |
Capital Environment Holdings* | | 2,156,000 | | | | | 76,919 |
China Energine International Holdings* | | 770,000 | | | | | 33,848 |
China Everbright International | | 424,900 | | | | | 595,530 |
China Singyes Solar Technologies Holdings | | 244,000 | | | | | 89,227 |
Dongjiang Environmental, Cl H | | 86,800 | | | | | 116,569 |
Dynagreen Environmental Protection Group, Cl H | | 150,000 | | | | | 75,112 |
Tianjin Capital Environmental Protection Group, Cl H | | 142,000 | | | | | 80,152 |
| | | | | | | 1,137,910 |
Information Technology — 8.9% | | | | | | | |
JA Solar Holdings ADR* | | 16,392 | | | | | 107,532 |
JinkoSolar Holding ADR* | | 10,392 | | | | | 189,654 |
Xinyi Solar Holdings | | 842,000 | | | | | 340,091 |
| | | | | | | 637,277 |
Real Estate — 13.8% | | | | | | | |
China Vanke, Cl H | | 142,400 | | | | | 649,557 |
Shui On Land | | 1,242,000 | | | | | 337,074 |
| | | | | | | 986,631 |
Utilities — 24.3% | | | | | | | |
Beijing Enterprises Water Group* | | 960,500 | | | | | 536,038 |
China Datang Renewable Power, Cl H | | 940,000 | | | | | 126,958 |
China Everbright Water | | 97,600 | | | | | 31,633 |
China Longyuan Power Group, Cl H | | 431,800 | | | | | 331,210 |
China Power Clean Energy Development | | 170,000 | | | | | 92,491 |
CT Environmental Group | | 900,000 | | | | | 161,691 |
Huaneng Renewables, Cl H | | 916,000 | | | | | 341,970 |
Kangda International Environmental | | 313,000 | | | | | 58,625 |
Yunnan Water Investment, Cl H | | 148,000 | | | | | 60,533 |
| | | | | | | 1,741,149 |
TOTAL CHINA | | | | | | | 5,213,530 |
58
Schedule of Investments March 29, 2018^
KraneShares MSCI China Environment Index ETF (concluded)
| | | | | | |
COMMON STOCK (continued) | | | | | | | |
HONG KONG — 22.8% | | | | | | | |
Industrials — 7.8% | | | | | | | |
China High Speed Transmission Equipment Group | | 137,000 | | | | $ | 215,407 |
Concord New Energy Group | | 2,524,000 | | | | | 114,167 |
FDG Electric Vehicles* | | 6,962,000 | | | | | 230,639 |
| | | | | | | 560,213 |
Information Technology — 9.7% | | | | | | | |
GCL-Poly Energy Holdings* | | 4,739,000 | | | | | 585,710 |
Wasion Group Holdings | | 210,000 | | | | | 107,030 |
| | | | | | | 692,740 |
Utilities — 5.3% | | | | | | | |
Canvest Environmental Protection Group | | 254,000 | | | | | 145,637 |
Kong Sun Holdings* | | 1,931,000 | | | | | 55,359 |
Panda Green Energy Group* | | 1,657,000 | | | | | 177,348 |
| | | | | | | 378,344 |
TOTAL HONG KONG | | | | | | | 1,631,297 |
| | | | | | | |
TOTAL COMMON STOCK
(Cost $7,003,891) | | | | | | | 6,844,827 |
TOTAL INVESTMENTS — 95.6%
(Cost $7,003,891) | | | | | | | 6,844,827 |
OTHER ASSETS LESS LIABILITIES – 4.4% | | | | | | | 313,526 |
NET ASSETS - 100% | | | | | | $ | 7,158,353 |
As of March 29, 2018, all of the Fund’s investments were considered Level 1 of the fair value hierarchy, in accordance with the authoritative guidance under U.S. GAAP.
For the period ended March 29, 2018, there have been no transfers between Level 1, Level 2 and Level 3 investments. Transfers between levels are recognized at period end.
Amounts designated as “—” are $0 or have been rounded to $0.
59
Schedule of Investments March 29, 2018^
KraneShares Electric Vehicles and Future Mobility Index ETF
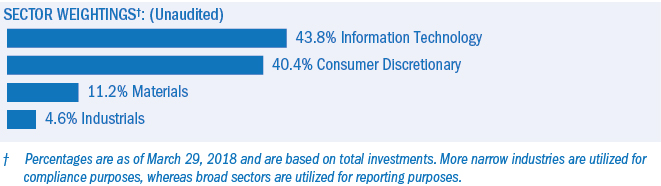
| | | | | | |
COMMON STOCK — 93.6%‡ | | | | | | | |
AUSTRALIA — 1.6% | | | | | | | |
Materials — 1.6% | | | | | | | |
Galaxy Resources* | | 95,567 | | | | $ | 216,981 |
Pilbara Minerals* | | 352,791 | | | | | 223,251 |
TOTAL AUSTRALIA | | | | | | | 440,232 |
| | | | | | | |
AUSTRIA — 1.6% | | | | | | | |
Information Technology — 1.6% | | | | | | | |
Ams* | | 3,998 | | | | | 416,918 |
TOTAL AUSTRIA | | | | | | | 416,918 |
| | | | | | | |
CANADA — 1.6% | | | | | | | |
Materials — 1.6% | | | | | | | |
First Quantum Minerals | | 29,831 | | | | | 418,571 |
TOTAL CANADA | | | | | | | 418,571 |
| | | | | | | |
CHILE — 2.5% | | | | | | | |
Materials — 2.5% | | | | | | | |
Antofagasta | | 31,732 | | | | | 409,971 |
Sociedad Quimica y Minera de Chile ADR | | 5,315 | | | | | 261,232 |
TOTAL CHILE | | | | | | | 671,203 |
| | | | | | | |
CHINA — 20.3% | | | | | | | |
Consumer Discretionary — 10.1% | | | | | | | |
Aerospace Hi-Tech Holdings, Cl A* | | 75,000 | | | | | 258,913 |
BAIC Motor, Cl H | | 186,500 | | | | | 228,601 |
BYD, Cl H* | | 44,000 | | | | | 343,106 |
Changzhou Xingyu Automotive Lighting Systems, Cl A | | 29,736 | | | | | 251,908 |
China Shipbuilding Industry Group Power, Cl A | | 63,856 | | | | | 246,322 |
Dongfeng Motor Group, Cl H | | 194,000 | | | | | 225,188 |
FAW CAR, Cl A* | | 148,000 | | | | | 238,524 |
Great Wall Motor, Cl H | | 229,000 | | | | | 229,633 |
Jiangsu Yunyi Electric, Cl A* | | 234,960 | | | | | 241,992 |
Kuang-Chi Technologies, Cl A | | 58,084 | | | | | 229,596 |
Ningbo Joyson Electronic, Cl A | | 50,800 | | | | | 232,939 |
| | | | | | | 2,726,722 |
Industrials — 2.7% | | | | | | | |
Camel Group, Cl A | | 116,401 | | | | | 238,104 |
Guoxuan High-Tech, Cl A | | 70,310 | | | | | 243,616 |
Zhejiang Narada Power Source, Cl A | | 94,000 | | | | | 232,920 |
| | | | | | | 714,640 |
60
Schedule of Investments March 29, 2018^
KraneShares Electric Vehicles and Future Mobility Index ETF (continued)
| | | | | | |
COMMON STOCK (continued) | | | | | | | |
Information Technology — 7.5% | | | | | | | |
AAC Technologies Holdings | | 27,500 | | | | $ | 496,158 |
Baidu ADR* | | 3,926 | | | | | 876,244 |
GoerTek, Cl A | | 177,028 | | | | | 384,348 |
Shanghai Belling, Cl A | | 114,900 | | | | | 251,652 |
| | | | | | | 2,008,402 |
TOTAL CHINA | | | | | | | 5,449,764 |
| | | | | | | |
GERMANY — 11.0% | | | | | | | |
Consumer Discretionary — 9.0% | | | | | | | |
Bayerische Motoren Werke | | 9,431 | | | | | 1,022,423 |
Daimler | | 11,578 | | | | | 982,075 |
Hella GmbH & KGaA | | 6,236 | | | | | 409,542 |
| | | | | | | 2,414,040 |
Information Technology — 2.0% | | | | | | | |
Infineon Technologies | | 20,402 | | | | | 545,485 |
TOTAL GERMANY | | | | | | | 2,959,525 |
| | | | | | | |
JAPAN — 0.9% | | | | | | | |
Industrials — 0.9% | | | | | | | |
GS Yuasa | | 44,000 | | | | | 236,239 |
TOTAL JAPAN | | | | | | | 236,239 |
| | | | | | | |
NETHERLANDS — 3.5% | | | | | | | |
Information Technology — 3.5% | | | | | | | |
NXP Semiconductors* | | 8,017 | | | | | 937,989 |
TOTAL NETHERLANDS | | | | | | | 937,989 |
| | | | | | | |
PERU — 2.1% | | | | | | | |
Materials — 2.1% | | | | | | | |
Southern Copper | | 10,283 | | | | | 557,133 |
TOTAL PERU | | | | | | | 557,133 |
| | | | | | | |
SOUTH KOREA — 2.3% | | | | | | | |
Information Technology — 2.3% | | | | | | | |
Samsung SDI | | 2,156 | | | | | 386,337 |
Silicon Works | | 6,720 | | | | | 239,887 |
TOTAL SOUTH KOREA | | | | | | | 626,224 |
| | | | | | | |
SWEDEN — 2.1% | | | | | | | |
Consumer Discretionary — 2.1% | | | | | | | |
Autoliv | | 3,812 | | | | | 556,323 |
TOTAL SWEDEN | | | | | | | 556,323 |
| | | | | | | |
SWITZERLAND — 2.1% | | | | | | | |
Information Technology — 2.1% | | | | | | | |
STMicroelectronics | | 24,936 | | | | | 551,554 |
TOTAL SWITZERLAND | | | | | | | 551,554 |
61
Schedule of Investments March 29, 2018^
KraneShares Electric Vehicles and Future Mobility Index ETF (continued)
| | | | | | |
COMMON STOCK (continued) | | | | | | | |
TAIWAN — 2.2% | | | | | | | |
Information Technology — 2.2% | | | | | | | |
On-Bright Electronics | | 23,000 | | | | $ | 250,060 |
Parade Technologies | | 17,000 | | | | | 331,173 |
TOTAL TAIWAN | | | | | | | 581,233 |
| | | | | | | |
UNITED KINGDOM — 0.7% | | | | | | | |
Information Technology — 0.7% | | | | | | | |
Dialog Semiconductor* | | 8,382 | | | | | 198,904 |
TOTAL UNITED KINGDOM | | | | | | | 198,904 |
| | | | | | | |
UNITED STATES — 40.0% | | | | | | | |
Consumer Discretionary — 14.4% | | | | | | | |
Aptiv | | 6,465 | | | | | 549,331 |
Ford Motor | | 89,129 | | | | | 987,548 |
General Motors | | 26,747 | | | | | 971,986 |
Gentherm* | | 7,360 | | | | | 249,872 |
Tesla* | | 3,278 | | | | | 872,374 |
Visteon* | | 2,061 | | | | | 227,205 |
| | | | | | | 3,858,316 |
Industrials — 0.9% | | | | | | | |
EnerSys | | 3,530 | | | | | 244,876 |
Information Technology — 20.7% | | | | | | | |
Alphabet, Cl A* | | 920 | | | | | 954,169 |
Ambarella* | | 4,488 | | | | | 219,867 |
Analog Devices | | 5,873 | | | | | 535,206 |
Cirrus Logic* | | 5,754 | | | | | 233,785 |
Integrated Device Technology* | | 7,462 | | | | | 228,039 |
Knowles* | | 18,528 | | | | | 233,268 |
Maxim Integrated Products | | 9,006 | | | | | 542,341 |
MaxLinear, Cl A* | | 10,287 | | | | | 234,029 |
NVIDIA | | 3,998 | | | | | 925,897 |
Skyworks Solutions | | 5,105 | | | | | 511,827 |
Texas Instruments | | 8,882 | | | | | 922,751 |
| | | | | | | 5,541,179 |
Materials — 3.1% | | | | | | | |
Albemarle | | 4,467 | | | | | 414,270 |
FMC | | 5,307 | | | | | 406,357 |
| | | | | | | 820,627 |
TOTAL UNITED STATES | | | | | | | 10,726,230 |
TOTAL COMMON STOCK
(Cost $26,238,723) | | | | | | | 25,066,810 |
62
Schedule of Investments March 29, 2018^
KraneShares Electric Vehicles and Future Mobility Index ETF (concluded)
| | | | | | |
PREFERRED STOCK — 3.6% | | | | | | | |
GERMANY— 3.6% | | | | | | | |
Consumer Discretionary — 3.6% | | | | | | | |
Porsche Automobil Holding(A) | | 5,014 | | | | $ | 416,235 |
Volkswagen(A) | | 2,815 | | | | | 558,700 |
TOTAL PREFERRED STOCK
(Cost $1,019,308) | | | | | | | 974,935 |
TOTAL INVESTMENTS — 97.2%
(Cost $27,258,031) | | | | | | | 26,041,745 |
OTHER ASSETS LESS LIABILITIES — 2.8% | | | | | | | 755,884 |
NET ASSETS — 100% | | | | | | $ | 26,797,629 |
As of March 29, 2018, all of the Fund’s investments were considered Level 1 of the fair value hierarchy, in accordance with the authoritative guidance under U.S. GAAP.
For the period ended March 29, 2018, there have been no transfers between Level 1, Level 2 and Level 3 investments. Transfers between levels are recognized at period end.
Amounts designated as “—” are $0 or have been rounded to $0.
63
Schedule of Investments March 29, 2018^
KraneShares MSCI All China Health Care Index ETF
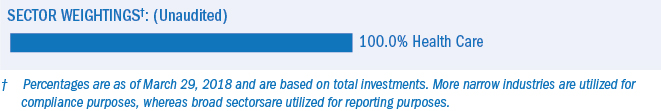
| | | | | | |
COMMON STOCK — 97.8%‡ | | | | | | | |
CHINA — 90.9% | | | | | | | |
Health Care — 90.9% | | | | | | | |
3SBio* | | 30,000 | | | | $ | 67,581 |
Alibaba Health Information Technology* | | 102,000 | | | | | 50,686 |
Beijing SL Pharmaceutical, Cl A | | 6,300 | | | | | 34,846 |
Beijing Tiantan Biological Products, Cl A | | 5,913 | | | | | 26,691 |
Beijing Tongrentang, Cl A | | 12,647 | | | | | 67,700 |
Changchun High & New Technology Industries, Cl A | | 1,500 | | | | | 43,200 |
China Medical System Holdings | | 45,000 | | | | | 102,175 |
China National Accord Medicines, Cl A | | 3,400 | | | | | 32,359 |
China National Medicines, Cl A | | 6,655 | | | | | 31,161 |
China Resources Pharmaceutical Group | | 58,500 | | | | | 81,992 |
China Resources Sanjiu Medical & Pharmaceutical, Cl A | | 8,800 | | | | | 37,904 |
China Traditional Chinese Medicine Holdings | | 36,000 | | | | | 26,559 |
CSPC Pharmaceutical Group | | 150,000 | | | | | 398,494 |
Da An Gene of Sun Yat-Sen University, Cl A | | 6,900 | | | | | 17,339 |
Dong-E-E-Jiao, Cl E | | 6,100 | | | | | 59,103 |
Guangzhou Baiyunshan Pharmaceutical Holdings, Cl A | | 13,600 | | | | | 62,794 |
Guizhou Bailing Group Pharmaceutical, Cl A | | 13,300 | | | | | 30,356 |
Harbin Gloria Pharmaceuticals, Cl A(A)(B)(C) | | 13,800 | | | | | 13,730 |
Huadong Medicine, Cl A | | 9,000 | | | | | 90,548 |
Hualan Biological Engineering, Cl A | | 8,400 | | | | | 39,318 |
Hubei Jumpcan Pharmaceutical, Cl A | | 6,300 | | | | | 43,327 |
Humanwell Healthcare Group, Cl A | | 13,470 | | | | | 32,649 |
Jiangsu Hengrui Medicine, Cl A | | 26,937 | | | | | 354,496 |
Jiangsu Yuyue Medical Equipment & Supply, Cl A | | 9,000 | | | | | 34,016 |
Jilin Aodong Pharmaceutical Group, Cl A | | 10,900 | | | | | 35,463 |
Jinyu Bio-Technology, Cl A | | 8,100 | | | | | 36,189 |
Joincare Pharmaceutical Group Industry, Cl A | | 14,700 | | | | | 28,060 |
Jointown Pharmaceutical Group, Cl A* | | 17,931 | | | | | 53,864 |
Kangmei Pharmaceutical, Cl A | | 48,000 | | | | | 170,892 |
Livzon Pharmaceutical Group, Cl A | | 3,400 | | | | | 37,417 |
Luye Pharma Group | | 34,500 | | | | | 33,013 |
Meinian Onehealth Healthcare Holdings, Cl A | | 22,800 | | | | | 92,263 |
Realcan Pharmaceutical, Cl A | | 14,200 | | | | | 33,741 |
Shandong Weigao Group Medical Polymer, Cl H | | 48,000 | | | | | 31,987 |
Shanghai Fosun Pharmaceutical Group, Cl H | | 18,000 | | | | | 110,546 |
Shanghai Fosun Pharmaceutical Group, Cl A | | 18,983 | | | | | 126,841 |
Shanghai Pharmaceuticals Holding, Cl H | | 21,300 | | | | | 56,993 |
Shanghai Pharmaceuticals Holding, Cl A | | 18,300 | | | | | 70,592 |
Shenzhen Hepalink Pharmaceutical Group, Cl A | | 9,400 | | | | | 25,503 |
Shenzhen Salubris Pharmaceuticals, Cl A | | 10,141 | | | | | 67,180 |
Shijiazhuang Yiling Pharmaceutical, Cl A | | 13,600 | | | | | 33,029 |
Sichuan Kelun Pharmaceutical, Cl A | | 13,600 | | | | | 62,491 |
64
Schedule of Investments March 29, 2018^
KraneShares MSCI All China Health Care Index ETF (continued)
| | | | | | |
COMMON STOCK (continued) | | | | | | | |
Health Care (continued) | | | | | | | |
Sihuan Pharmaceutical Holdings Group | | 153,000 | | | | $ | 45,228 |
Sinopharm Group, Cl H | | 40,800 | | | | | 204,304 |
Tasly Pharmaceutical Group, Cl A | | 10,261 | | | | | 70,111 |
Tong Ren Tang Technologies, Cl H | | 18,000 | | | | | 29,999 |
Tonghua Dongbao Pharmaceutical, Cl A | | 16,293 | | | | | 64,792 |
Wuxi Biologics Cayman* | | 10,500 | | | | | 100,942 |
Yifan Pharmaceutical, Cl A | | 11,100 | | | | | 38,443 |
Zhangzhou Pientzehuang Pharmaceutical, Cl A | | 5,700 | | | | | 73,564 |
Zhejiang Huahai Pharmaceutical, Cl A | | 12,300 | | | | | 58,903 |
Zhejiang NHU, Cl A | | 11,800 | | | | | 63,241 |
TOTAL CHINA | | | | | | | 3,634,615 |
| | | | | | | |
HONG KONG — 6.9% | | | | | | | |
Health Care — 6.9% | | | | | | | |
Sino Biopharmaceutical | | 141,000 | | | | | 276,671 |
TOTAL HONG KONG | | | | | | | 276,671 |
TOTAL COMMON STOCK
(Cost $3,741,656) | | | | | | | 3,911,286 |
TOTAL INVESTMENTS — 97.8%
(Cost $3,741,656) | | | | | | | 3,911,286 |
OTHER ASSETS LESS LIABILITIES — 2.2% | | | | | | | 86,725 |
NET ASSETS — 100% | | | | | | $ | 3,998,011 |
65
Schedule of Investments March 29, 2018^
KraneShares MSCI All China Health Care Index ETF (concluded)
The following is a list of the inputs used, as of March 29, 2018, in valuing the Fund’s investments carried at value:
| | | | | | | | |
Investments in Securities | | | | | | | | | | | | |
Common Stock | | | | | | | | | | | | |
China | | | | | | | | | | | | |
Health Care | | $ | 3,620,885 | | $ | — | | $ | 13,730 | | $ | 3,634,615 |
Hong Kong | | | 276,671 | | | — | | | — | | | 276,671 |
Total Common Stock | | | 3,897,556 | | | — | | | 13,730 | | | 3,911,286 |
Total Investments in Securities | | $ | 3,897,556 | | $ | — | | $ | 13,730 | | $ | 3,911,286 |
For the period ended March 29, 2018, there have been no transfers between Level 1 and Level 2 investments.
For the period ended March 29, 2018, there have been no transfers between Level 2 and Level 3 investments.
For the period ended March 29, 2018, the transfers in and out of Level 3 occurred due to a halt in trading of these securities. Transfers between levels are recognized at period end.
Amounts designated as “—” are $0 or have been rounded to $0.
66
Statements of Assets and Liabilities
March 29, 2018^
| | KraneShares Bosera MSCI China A Share
ETF | | KraneShares
Zacks New
China
ETF | | KraneShares
CSI China
Internet
ETF |
Assets: | | | | | | | | | | | | |
Investments at Value | | $ | 350,011,394 | | | $ | 4,975,504 | | | $ | 1,708,103,438* | |
Foreign Currency at Value | | | 2,907,558 | | | | 3 | | | | 678,174 | |
Cash and Cash Equivalents | | | 466,567 | | | | 109,626 | | | | 4,831,209 | |
Collateral for Investment Trading | | | 146,860 | | | | — | | | | — | |
Prepaid Expenses | | | 7,615 | | | | 111 | | | | 34,433 | |
Receivable for Capital Shares Sold | | | — | | | | — | | | | 118,377 | |
Receivable for Investment Securities
Sold | | | — | | | | — | | | | 661,805 | |
Dividend and Interest Receivable | | | — | | | | — | | | | 325,595 | |
Total Assets | | | 353,539,994 | | | | 5,085,244 | | | | 1,714,753,031 | |
| | | | | | | | | | | | |
Liabilities: | | | | | | | | | | | | |
Payable for Investment Securities Purchased | | | — | | | | — | | | | 1,339,978 | |
Obligation to Return Securities Lending Collateral | | | — | | | | — | | | | 83,019,440 | |
Payable for Capital Shares Redeemed | | | — | | | | — | | | | 748,155 | |
Payable for Management Fees | | | 178,868 | | | | 2,978 | | | | 984,641 | |
Payable for Foreign Capital Gains Tax | | | 34,549 | | | | — | | | | — | |
Payable for Trustees’ Fee | | | 2,990 | | | | 48 | | | | 14,330 | |
Payable for Securities Lending Fees | | | — | | | | — | | | | 24,248 | |
Total Liabilities | | | 216,407 | | | | 3,026 | | | | 86,130,792 | |
| | | | | | | | | | | | |
Net Assets | | $ | 353,323,587 | | | $ | 5,082,218 | | | $ | 1,628,622,239 | |
| | | | | | | | | | | | |
Net Assets Consist of: | | | | | | | | | | | | |
Paid-in Capital | | $ | 317,282,548 | | | $ | 4,666,658 | | | $ | 1,495,848,226 | |
Distributions in Excess of Net
Investment Income | | | (6,771 | ) | | | (6,954 | ) | | | (11,487,930 | ) |
Accumulated Net Realized Gain on Investments and Foreign Currency Translations | | | 3,956,304 | | | | 109,787 | | | | 26,593,971 | |
Net Unrealized Appreciation on Investments | | | 32,083,789 | | | | 312,727 | | | | 117,667,946 | |
Net Unrealized Appreciation on Foreign Currency Translations | | | 7,717 | | | | — | | | | 26 | |
| | | | | | | | | | | | |
Net Assets | | $ | 353,323,587 | | | $ | 5,082,218 | | | $ | 1,628,622,239 | |
Outstanding Shares of Beneficial Interest (unlimited authorization - no
par value) | | | 10,250,000 | | | | 150,000 | | | | 26,650,000 | |
Net Asset Value, Offering and Redemption Price Per Share | | $ | 34.47 | | | $ | 33.88 | | | $ | 61.11 | |
| | | | | | | | | | | | |
Cost of Investments | | $ | 317,927,605 | | | $ | 4,662,777 | | | $ | 1,590,435,492 | |
Cost of Foreign Currency | | | 3,046,701 | | | | 3 | | | | — | |
*Includes Market Value of Securities on Loan | | | — | | | | — | | | | 77,291,418 | |
67
Statements of Assets and Liabilities (continued)
March 29, 2018^
| | KraneShares E Fund China Commercial Paper ETF | | KraneShares FTSE Emerging Markets Plus
ETF | | KraneShares MSCI One Belt One Road Index ETF |
Assets: | | | | | | | | | | | | |
Investments at Value | | $ | 12,738,381 | | | $ | 2,296,921 | | | $ | 30,059,139 | |
Affiliated Investments at Value | | | 23,714 | | | | 360,832 | | | | — | |
Foreign Currency at Value | | | 23,729 | | | | 531 | | | | 26,018 | |
Cash and Cash Equivalents | | | 9,196 | | | | 34,598 | | | | 1,943,388 | |
Dividend and Interest Receivable | | | 240,870 | | | | 4,261 | | | | 60,676 | |
Prepaid Expenses | | | 268 | | | | 542 | | | | 542 | |
Receivable from Adviser for Withholding/Value Added Tax | | | 26,214 | | | | — | | | | — | |
Reclaim Receivable | | | — | | | | 296 | | | | 100 | |
Total Assets | | | 13,062,372 | | | | 2,697,981 | | | | 32,089,863 | |
| | | | | | | | | | | | |
Liabilities: | | | | | | | | | | | | |
Payable for Capital Shares Redeemed | | | — | | | | — | | | | 20,294 | |
Payable for Withholding/Value Added
Tax | | | 26,214 | | | | — | | | | — | |
Payable for Management Fees | | | 5,750 | | | | 1,408 | | | | 21,597 | |
Payable for Trustees’ Fee | | | 125 | | | | 104 | | | | 207 | |
Total Liabilities | | | 32,089 | | | | 1,512 | | | | 42,098 | |
| | | | | | | | | | | | |
Net Assets | | $ | 13,030,283 | | | $ | 2,696,469 | | | $ | 32,047,765 | |
| | | | | | | | | | | | |
Net Assets Consist of: | | | | | | | | | | | | |
Paid-in Capital | | $ | 12,240,899 | | | $ | 2,483,561 | | | $ | 33,080,732 | |
Undistributed Net Investment Income | | | 324,836 | | | | 12,531 | | | | 25,520 | |
Accumulated Net Realized Gain (Loss) on Investments, Affiliated Investments and Foreign Currency Translations | | | (41,661 | ) | | | (191,723 | ) | | | 3,079 | |
Net Unrealized Appreciation (Depreciation) on Investments and Affiliated Investments | | | 499,333 | | | | 392,090 | | | | (1,061,827 | ) |
Net Unrealized Appreciation on Foreign Currency Translations | | | 6,876 | | | | 10 | | | | 261 | |
| | | | | | | | | | | | |
Net Assets | | $ | 13,030,283 | | | $ | 2,696,469 | | | $ | 32,047,765 | |
Outstanding Shares of Beneficial
Interest (unlimited authorization - no par value) | | | 350,000 | | | | 100,000 | | | | 1,250,002 | |
Net Asset Value, Offering and Redemption Price Per Share | | $ | 37.23 | | | $ | 26.96 | | | $ | 25.64 | |
| | | | | | | | | | | | |
Cost of Investments | | $ | 12,253,488 | | | $ | 1,885,074 | | | $ | 31,120,966 | |
Cost of Affiliated Investments | | | 9,274 | | | | 380,589 | | | | — | |
Cost of Foreign Currency | | | 23,729 | | | | 595 | | | | 25,944 | |
68
Statements of Assets and Liabilities (continued)
March 29, 2018^
| | KraneShares Emerging Markets Consumer Technology
Index ETF | | KraneShares
MSCI China Environment
Index ETF |
Assets: | | | | | | | | |
Investments at Value | | $ | 22,604,210 | | | $ | 6,844,827 | |
Cash and Cash Equivalents | | | 1,152,791 | | | | 1,216,566 | |
Foreign Currency at Value | | | 5,776 | | | | — | |
Receivable for Capital Shares Sold | | | 987,979 | | | | — | |
Dividend and Interest Receivable | | | 10,377 | | | | — | |
Reclaim Receivable | | | 87 | | | | — | |
Prepaid Expenses | | | 58 | | | | 148 | |
Receivable for Investment Securities Sold | | | — | | | | 493,211 | |
Total Assets | | | 24,761,278 | | | | 8,554,752 | |
| | | | | | | | |
Liabilities: | | | | | | | | |
Payable for Investment Securities Purchased | | | 919,024 | | | | 267,084 | |
Payable for Management Fees | | | 12,088 | | | | 4,804 | |
Unrealized Depreciation on Spot Contracts | | | 1,856 | | | | 6 | |
Payable for Trustees’ Fee | | | 30 | | | | — | |
Payable to Custodian | | | — | | | | 1,124,505 | |
Total Liabilities | | | 932,998 | | | | 1,396,399 | |
| | | | | | | | |
Net Assets | | $ | 23,828,280 | | | $ | 7,158,353 | |
| | | | | | | | |
Net Assets Consist of: | | | | | | | | |
Paid-in Capital | | $ | 23,899,284 | | | $ | 7,544,443 | |
Accumulated Net Investment Loss | | | (4,566 | ) | | | (13,176 | ) |
Accumulated Net Realized Loss on Investments and Foreign Currency Translations | | | (326 | ) | | | (213,829 | ) |
Net Unrealized Depreciation on Investments | | | (64,299 | ) | | | (159,064 | ) |
Net Unrealized Depreciation on Foreign Currency Translations | | | (1,813 | ) | | | (21 | ) |
| | | | | | | | |
Net Assets | | $ | 23,828,280 | | | $ | 7,158,353 | |
Outstanding Shares of Beneficial Interest (unlimited authorization - no par value) | | | 900,002 | | | | 300,002 | |
Net Asset Value, Offering and Redemption
Price Per Share | | $ | 26.48 | | | $ | 23.86 | |
Cost of Investments | | $ | 22,668,509 | | | $ | 7,003,891 | |
69
Statements of Assets and Liabilities (concluded)
March 29, 2018^
| | KraneShares Electric Vehicles and Future Mobility Index
ETF | | Kraneshares MSCI All China Healthcare
Index
ETF |
Assets: | | | | | | | | |
Investments at Value | | $ | 26,041,745 | | | $ | 3,911,286 | |
Cash and Cash Equivalents | | | 958,424 | | | | 88,735 | |
Receivable for Investment Securities Sold | | | 513,874 | | | | — | |
Receivable for Capital Shares Sold | | | 122,903 | | | | — | |
Dividend and Interest Receivable | | | 4,847 | | | | — | |
Prepaid Expenses | | | 46 | | | | 45 | |
Total Assets | | | 27,641,839 | | | | 4,000,066 | |
| | | | | | | | |
Liabilities: | | | | | | | | |
Payable for Investment Securities Purchased | | | 555,798 | | | | — | |
Payable for Capital Shares Redeemed | | | 273,936 | | | | — | |
Payable for Management Fees | | | 14,268 | | | | 2,033 | |
Payable for Trustees’ Fee | | | 208 | | | | 22 | |
Total Liabilities | | | 844,210 | | | | 2,055 | |
| | | | | | | | |
Net Assets | | $ | 26,797,629 | | | $ | 3,998,011 | |
| | | | | | | | |
Net Assets Consist of: | | | | | | | | |
Paid-in Capital | | $ | 28,078,846 | | | $ | 3,832,495 | |
Undistributed Net Investment Income/Accumulated Net Investment Loss | | | 3,098 | | | | (4,114 | ) |
Accumulated Net Realized Loss on Investments and Foreign Currency Translations | | | (67,891 | ) | | | — | |
Net Unrealized Appreciation (Depreciation) on Investments | | | (1,216,286 | ) | | | 169,630 | |
Net Unrealized Depreciation on Foreign Currency Translations | | | (138 | ) | | | — | |
| | | | | | | | |
Net Assets | | $ | 26,797,629 | | | $ | 3,998,011 | |
Outstanding Shares of Beneficial Interest (unlimited authorization - no par value) | | | 1,150,002 | | | | 150,002 | |
Net Asset Value, Offering and Redemption Price Per Share | | $ | 23.30 | | | $ | 26.65 | |
Cost of Investments | | $ | 27,258,031 | | | $ | 3,741,656 | |
70
Statements of Operations
For the year ended March 29, 2018^
| | KraneShares Bosera MSCI China A Share
ETF | | KraneShares
Zacks New
China ETF | | KraneShares
CSI China
Internet ETF |
Investment Income: | | | | | | | | | | | | |
Dividend Income | | $ | 3,247,147 | | | $ | 73,286 | | | $ | 3,310,074 | |
Interest Income | | | 24,204 | | | | 738 | | | | 80,829 | |
Security Lending Income | | | — | | | | — | | | | 242,476 | |
Less: Foreign Taxes Withheld | | | (335,888 | ) | | | (5,783 | ) | | | (9,278 | ) |
Total Investment Income | | | 2,935,463 | | | | 68,241 | | | | 3,624,101 | |
| | | | | | | | | | | | |
Expenses: | | | | | | | | | | | | |
Management Fees† | | | 1,887,689 | | | | 34,379 | | | | 6,697,691 | |
Trustees’ Fees | | | 51,980 | | | | 1,494 | | | | 215,652 | |
Security Lending Fees† | | | — | | | | — | | | | 24,248 | |
Total Expenses | | | 1,939,669 | | | | 35,873 | | | | 6,937,591 | |
Management Fee Waiver† | | | (484,026 | ) | | | — | | | | — | |
Reimbursement for Trustees’ Fees† | | | — | | | | (143 | ) | | | (31,347 | ) |
Net Expenses | | | 1,455,643 | | | | 35,730 | | | | 6,906,244 | |
| | | | | | | | | | | | |
Net Investment Income (Loss) | | | 1,479,820 | | | | 32,511 | | | | (3,282,143 | ) |
| | | | | | | | | | | | |
Net Realized Gain (Loss) on: | | | | | | | | | | | | |
Investments | | | 6,741,758 | | | | 1,243,646 | | | | 116,711,328 | (1) |
Foreign Currency Translations | | | (249,467 | ) | | | (7,100 | ) | | | (41,314 | ) |
| | | | | | | | | | | | |
Net Realized Gain on Investments and Foreign Currency Translations | | | 6,492,291 | | | | 1,236,546 | | | | 116,670,014 | |
| | | | | | | | | | | | |
Net Change in Unrealized Appreciation (Depreciation) on: | | | | | | | | | | | | |
Investments | | | 32,240,981 | | | | (457,296 | ) | | | 103,486,976 | |
Foreign Currency Translations | | | 7,717 | | | | — | | | | 26 | |
| | | | | | | | | | | | |
Net Change in Unrealized Appreciation (Depreciation) on Investments and Foreign Currency Translations | | | 32,248,698 | | | | (457,296 | ) | | | 103,487,002 | |
| | | | | | | | | | | | |
Net Realized and Unrealized Gain on Investments and Foreign Currency Translations | | | 38,740,989 | | | | 779,250 | | | | 220,157,016 | |
| | | | | | | | | | | | |
Net Increase in Net Assets Resulting from Operations | | $ | 40,220,809 | | | $ | 811,761 | | | $ | 216,874,873 | |
71
Statements of Operations (continued)
For the year ended March 29, 2018^
| | KraneShares E Fund China Commercial
Paper ETF | | KraneShares
FTSE Emerging
Markets Plus
ETF | | KraneShares
MSCI One Belt
One Road
Index ETF(1) |
Investment Income: | | | | | | | | | | | | |
Dividend Income | | $ | — | | | $ | 64,819 | | | $ | 113,498 | |
Less: Foreign Taxes Withheld | | | — | | | | (6,022 | ) | | | (11,824 | ) |
Income Distributions Received from Affiliated Fund | | | — | | | | 1,880 | | | | — | |
Interest Income | | | 443,446 | | | | 274 | | | | — | |
Less: Foreign Withholding/Value Added Tax | | | (26,214 | ) | | | — | | | | — | |
Reimbursement of Foreign Withholding/Value Added Tax | | | 26,214 | | | | — | | | | — | |
Total Investment Income | | | 443,446 | | | | 60,951 | | | | 101,674 | |
Expenses: | | | | | | | | | | | | |
Management Fees† | | | 77,973 | | | | 17,409 | | | | 59,931 | |
Trustees’ Fees | | | 24,278 | | | | 938 | | | | 611 | |
Interest Expense | | | — | | | | — | | | | 1,002 | |
Total Expenses | | | 102,251 | | | | 18,347 | | | | 61,544 | |
Management Fee Waiver† | | | (13,760 | ) | | | (2,146 | ) | | | — | |
Reimbursement for Trustees’ Fees† | | | (300 | ) | | | (65 | ) | | | (257 | ) |
Net Expenses | | | 88,191 | | | | 16,136 | | | | 61,287 | |
| | | | | | | | | | | | |
Net Investment Income | | | 355,255 | | | | 44,815 | | | | 40,387 | |
| | | | | | | | | | | | |
Net Realized Gain (Loss) on: | | | | | | | | | | | | |
Investments | | | (39,431 | ) | | | 971 | | | | 3,079 | |
Affiliated Investments | | | 58,812 | | | | (12,196 | ) | | | — | |
Capital Gain Distributions Received From Affiliated Fund | | | — | | | | 1,663 | | | | — | |
Foreign Currency Translations | | | 447,469 | | | | (38 | ) | | | (8,180 | ) |
Net Realized Gain (Loss) on Investments, Affiliated Investments and Foreign Currency Translations | | | 466,850 | | | | (9,600 | ) | | | (5,101 | ) |
| | | | | | | | | | | | |
Net Change in Unrealized Appreciation (Depreciation) on: | | | | | | | | | | | | |
Investments | | | 638,412 | | | | 356,311 | | | | (1,061,827 | ) |
Affiliated Investments | | | 6,539 | | | | 81,248 | | | | — | |
Foreign Currency Translations | | | 7,739 | | | | (3 | ) | | | 261 | |
| | | | | | | | | | | | |
Net Change in Unrealized Appreciation (Depreciation) on Investments, Affiliated Investments and Foreign Currency Translations | | | 652,690 | | | | 437,556 | | | | (1,061,566 | ) |
| | | | | | | | | | | | |
Net Realized and Unrealized Gain (Loss) on Investments, Affiliated Investments and Foreign Currency Translations | | | 1,119,540 | | | | 427,956 | | | | (1,066,667 | ) |
| | | | | | | | | | | | |
Net Increase (Decrease) in Net Assets Resulting from Operations | | $ | 1,474,795 | | | $ | 472,771 | | | $ | (1,026,280 | ) |
72
Statements of Operations (continued)
For the year ended March 29, 2018^
| | KraneShares Emerging
Markets
Consumer Technology
Index ETF(1) | | KraneShares
MSCI China Environment
Index ETF(2) |
Investment Income: | | | | | | | | |
Dividend Income | | $ | 17,883 | | | $ | — | |
Less: Foreign Taxes Withheld | | | (296 | ) | | | — | |
Total Investment Income | | | 17,587 | | | | — | |
| | | | | | | | |
Expenses: | | | | | | | | |
Management Fees† | | | 24,688 | | | | 20,568 | |
Trustees’ Fees | | | 242 | | | | 237 | |
Interest Expense | | | 144 | | | | 7 | |
Total Expenses | | | 25,074 | | | | 20,812 | |
Reimbursement for Trustees’ Fees† | | | (139 | ) | | | (113 | ) |
Net Expenses | | | 24,935 | | | | 20,699 | |
| | | | | | | | |
Net Investment Loss | | | (7,348 | ) | | | (20,699 | ) |
| | | | | | | | |
Net Realized Gain (Loss) on: | | | | | | | | |
Investments | | | (325 | ) | | | (213,979 | )(3) |
Foreign Currency Translations | | | 2,781 | | | | (175 | ) |
| | | | | | | | |
Net Realized Gain (Loss) on Investments and Foreign Currency Translations | | | 2,456 | | | | (214,154 | ) |
| | | | | | | | |
Net Change in Unrealized Depreciation on: | | | | | | | | |
Investments | | | (64,299 | ) | | | (159,064 | ) |
Foreign Currency Translations | | | (1,813 | ) | | | (21 | ) |
| | | | | | | | |
Net Change in Unrealized Depreciation on Investments and Foreign Currency Translations | | | (66,112 | ) | | | (159,085 | ) |
| | | | | | | | |
Net Realized and Unrealized Loss on Investments and Foreign Currency Translations | | | (63,656 | ) | | | (373,239 | ) |
| | | | | | | | |
Net Decrease in Net Assets Resulting from Operations | | $ | (71,004 | ) | | $ | (393,938 | ) |
73
Statements of Operations (concluded)
For the year ended March 29, 2018^
| | KraneShares
Electric Vehicles
and Future Mobility
Index ETF(1) | | Kraneshares
MSCI All China Healthcare
Index ETF(2) |
Investment Income: | | | | | | | | |
Dividend Income | | $ | 41,827 | | | $ | — | |
Less: Foreign Taxes Withheld | | | (707 | ) | | | — | |
Total Investment Income | | | 41,120 | | | | — | |
| | | | | | | | |
Expenses: | | | | | | | | |
Management Fees† | | | 24,763 | | | | 3,413 | |
Trustees’ Fees | | | 309 | | | | 29 | |
Interest Expense | | | 262 | | | | 143 | |
Total Expenses | | | 25,334 | | | | 3,585 | |
| | | | | | | | |
Net Expenses | | | 25,334 | | | | 3,585 | |
| | | | | | | | |
Net Investment Income (Loss) | | | 15,786 | | | | (3,585 | ) |
| | | | | | | | |
Net Realized Loss on: | | | | | | | | |
Investments | | | (53,236 | ) | | | — | |
Foreign Currency Translations | | | (27,343 | ) | | | (529 | ) |
| | | | | | | | |
Net Realized Loss on Investments and Foreign Currency Translations | | | (80,579 | ) | | | (529 | ) |
| | | | | | | | |
Net Change in Unrealized Appreciation (Depreciation) on: | | | | | | | | |
Investments | | | (1,216,286 | ) | | | 169,630 | |
Foreign Currency Translations | | | (138 | ) | | | — | |
| | | | | | | | |
Net Change in Unrealized Appreciation (Depreciation) on Investments and Foreign Currency Translations | | | (1,216,424 | ) | | | 169,630 | |
| | | | | | | | |
Net Realized and Unrealized Gain (Loss) on Investments and Foreign Currency Translations | | | (1,297,003 | ) | | | 169,101 | |
| | | | | | | | |
Net Increase (Decrease) in Net Assets Resulting from Operations | | $ | (1,281,217 | ) | | $ | 165,516 | |
74
Statements of Changes in Net Assets
| | KraneShares Bosera
MSCI China A Share ETF |
| | | | |
Operations: | | | | | | | | |
Net Investment Income (Loss) | | $ | 1,479,820 | | | $ | (7,689 | ) |
Net Realized Gain (Loss) on Investments and Foreign Currency Translations | | | 6,492,291 | | | | (866,910 | ) |
Net Change in Unrealized Appreciation (Depreciation) on Investments and Foreign Currency Translations | | | 32,248,698 | | | | 433,959 | |
Net Increase (Decrease) in Net Assets Resulting from
Operations | | | 40,220,809 | | | | (440,640 | ) |
| | | | | | | | |
Dividends and Distributions from: | | | | | | | | |
Net Investment Income | | | (1,563,342 | ) | | | — | |
Net Realized Gains | | | (1,383,104 | ) | | | (127,486 | ) |
Return of Capital | | | — | | | | (437,353 | ) |
Total Dividends and Distributions | | | (2,946,446 | ) | | | (564,839 | ) |
| | | | | | | | |
Capital Share Transactions:(1) | | | | | | | | |
Issued | | | 273,881,297 | | | | 58,784,489 | |
Redeemed | | | (10,325,858 | ) | | | (9,840,619 | ) |
Increase in Net Assets from Capital Share Transactions | | | 263,555,439 | | | | 48,943,870 | |
| | | | | | | | |
Total Increase in Net Assets | | | 300,829,802 | | | | 47,938,391 | |
| | | | | | | | |
Net Assets: | | | | | | | | |
Beginning of Year | | | 52,493,785 | | | | 4,555,394 | |
End of Year | | $ | 353,323,587 | | | $ | 52,493,785 | |
Distributions in Excess of Net Investment Income | | $ | (6,771 | ) | | $ | (142,152 | ) |
| | | | | | | | |
Share Transactions: | | | | | | | | |
Issued | | | 8,700,000 | | | | 2,050,000 | |
Redeemed | | | (300,000 | ) | | | (350,000 | ) |
| | | | | | | | |
Net Increase in Shares Outstanding from Share Transactions | | | 8,400,000 | | | | 1,700,000 | |
75
Statements of Changes in Net Assets (continued)
| | KraneShares Zacks New China ETF |
| | Year Ended
March 29, 2018^ | | |
Operations: | | | | | | | | |
Net Investment Income | | $ | 32,511 | | | $ | 16,561 | |
Net Realized Gain on Investments and Foreign Currency Translations | | | 1,236,546 | | | | 170,452 | |
Net Change in Unrealized Appreciation (Depreciation) on Investments and Foreign Currency Translations | | | (457,296 | ) | | | 486,702 | |
| | | | | | | | |
Net Increase in Net Assets Resulting from Operations | | | 811,761 | | | | 673,715 | |
| | | | | | | | |
Dividends and Distributions from: | | | | | | | | |
Net Investment Income | | | (44,526 | ) | | | (32,656 | ) |
Net Realized Gains | | | (1,101,598 | ) | | | — | |
Return of Capital | | | — | | | | (38,008 | ) |
| | | | | | | | |
Total Dividends and Distributions | | | (1,146,124 | ) | | | (70,664 | ) |
| | | | | | | | |
Capital Share Transactions:(1) | | | | | | | | |
Issued | | | 2,010,914 | | | | — | |
Increase in Net Assets from Capital Share Transactions | | | 2,010,914 | | | | — | |
| | | | | | | | |
Total Increase in Net Assets | | | 1,676,551 | | | | 603,051 | |
| | | | | | | | |
Net Assets: | | | | | | | | |
Beginning of Year | | | 3,405,667 | | | | 2,802,616 | |
End of Year | | $ | 5,082,218 | | | $ | 3,405,667 | |
| | | | | | | | |
Distributions in Excess of Net Investment Income | | $ | (6,954 | ) | | $ | (17,940 | ) |
| | | | | | | | |
Share Transactions: | | | | | | | | |
Issued | | | 50,000 | | | | — | # |
| | | | | | | | |
Net Increase in Shares Outstanding from Share Transactions | | | 50,000 | | | | — | |
76
Statements of Changes in Net Assets (continued)
| | KraneShares CSI China Internet ETF |
| | | | |
Operations: | | | | | | | | |
Net Investment Loss | | $ | (3,282,143 | ) | | $ | (1,499,799 | ) |
Net Realized Gain on Investments and Foreign Currency Translations | | | 116,670,014 | | | | 1,506,042 | |
Net Change in Unrealized Appreciation (Depreciation) on Investments and Foreign Currency Translations | | | 103,487,002 | | | | 33,149,248 | |
| | | | | | | | |
Net Increase in Net Assets Resulting from Operations | | | 216,874,873 | | | | 33,155,491 | |
| | | | | | | | |
Dividends and Distributions from: | | | | | | | | |
Net Investment Income | | | (7,001,175 | ) | | | (1,721,413 | ) |
Return of Capital | | | — | | | | (656,632 | ) |
Total Dividends and Distributions | | | (7,001,175 | ) | | | (2,378,045 | ) |
| | | | | | | | |
Capital Share Transactions:(1) | | | | | | | | |
Issued | | | 1,335,264,104 | | | | 235,861,086 | |
Redeemed | | | (207,772,539 | ) | | | (170,250,484 | ) |
Increase in Net Assets from Capital Share Transactions | | | 1,127,491,565 | | | | 65,610,602 | |
| | | | | | | | |
Total Increase in Net Assets | | | 1,337,365,263 | | | | 96,388,048 | |
| | | | | | | | |
Net Assets: | | | | | | | | |
Beginning of Year | | | 291,256,976 | | | | 194,868,928 | |
End of Year | | $ | 1,628,622,239 | | | $ | 291,256,976 | |
| | | | | | | | |
Distributions in Excess of Net Investment Income | | $ | (11,487,930 | ) | | $ | (2,689,036 | ) |
| | | | | | | | |
Share Transactions: | | | | | | | | |
Issued | | | 23,350,000 | | | | 6,300,000 | |
Redeemed | | | (3,600,000 | ) | | | (4,850,000 | ) |
| | | | | | | | |
Net Increase in Shares Outstanding from Share Transactions | | | 19,750,000 | | | | 1,450,000 | |
77
Statements of Changes in Net Assets (continued)
| | KraneShares E Fund China Commercial Paper ETF |
| | Year Ended March 29,
2018^ | | |
Operations: | | | | | | | |
Net Investment Income | | $ | 355,255 | | $ | 255,903 | |
Net Realized Gain (Loss) on Investments, Affiliated Investments and Foreign Currency Translations | | | 466,850 | | | (957,019 | ) |
Net Change in Unrealized Appreciation (Depreciation) on Investments, Affiliated Investments and Foreign Currency Translations | | | 652,690 | | | (1,797 | ) |
| | | | | | | |
Net Increase (Decrease) in Net Assets Resulting from
Operations | | | 1,474,795 | | | (702,913 | ) |
| | | | | | | |
Dividends and Distributions from: | | | | | | | |
Return of Capital | | | — | | | (6,584 | ) |
Total Dividends and Distributions | | | — | | | (6,584 | ) |
| | | | | | | |
Capital Share Transactions:(1) | | | | | | | |
Issued | | | 1,710,233 | | | — | |
Reinvestment of Distributions | | | — | | | 50,500 | |
Redeemed | | | — | | | (8,294,993 | ) |
Increase (Decrease) in Net Assets from Capital Share Transactions | | | 1,710,233 | | | (8,244,493 | ) |
| | | | | | | |
Total Increase (Decrease) in Net Assets | | | 3,185,028 | | | (8,953,990 | ) |
| | | | | | | |
Net Assets: | | | | | | | |
Beginning of Year | | | 9,845,255 | | | 18,799,245 | |
End of Year | | $ | 13,030,283 | | $ | 9,845,255 | |
| | | | | | | |
Undistributed (Distributions in Excess of) Net Investment
Income | | $ | 324,836 | | $ | (477,888 | ) |
| | | | | | | |
Share Transactions: | | | | | | | |
Issued | | | 50,000 | | | — | |
Redeemed | | | — | | | (250,000 | ) |
| | | | | | | |
Net Increase (Decrease) in Shares Outstanding from Share Transactions | | | 50,000 | | | (250,000 | ) |
78
Statements of Changes in Net Assets (continued)
| | KraneShares FTSE Emerging Markets Plus ETF |
| | Year Ended March 29,
2018^ | | |
Operations: | | | | | | | | |
Net Investment Income | | $ | 44,815 | | | $ | 36,660 | |
Net Realized Loss on Investments, Affiliated Investments and Foreign Currency Translations | | | (9,600 | ) | | | (186,670 | ) |
Net Change in Unrealized Appreciation (Depreciation) on Investments, Affiliated Investments and Foreign Currency Translations | | | 437,556 | | | | 375,822 | |
| | | | | | | | |
Net Increase in Net Assets Resulting from Operations | | | 472,771 | | | | 225,812 | |
| | | | | | | | |
Dividends and Distributions from: | | | | | | | | |
Net Investment Income | | | (32,628 | ) | | | (70,606 | ) |
Net Realized Gains | | | — | | | | (46,996 | ) |
Return of Capital | | | — | | | | (17,872 | ) |
Total Dividends and Distributions | | | (32,628 | ) | | | (135,474 | ) |
Total Increase in Net Assets | | | 440,143 | | | | 90,338 | |
| | | | | | | | |
Net Assets: | | | | | | | | |
Beginning of Year | | | 2,256,326 | | | | 2,165,988 | |
End of Year | | $ | 2,696,469 | | | $ | 2,256,326 | |
Undistributed (Distributions in Excess of) Net Investment Income | | $ | 12,531 | | | $ | (1,289 | ) |
79
Statements of Changes in Net Assets (continued)
| | KraneShares MSCI One Belt One Road Index
ETF | | KraneShares Emerging Markets Consumer Technology Index ETF | | KraneShares MSCI China Environment Index ETF |
| | Period Ended
March 29,
2018(1)^ | | Period Ended
March 29,
2018(2)^ | | Period Ended
March 29,
2018(3)^ |
Operations: | | | | | | | | | | | | |
Net Investment Income (Loss) | | $ | 40,387 | | | $ | (7,348 | ) | | $ | (20,699 | ) |
Net Realized Gain (Loss) on Investments and Foreign Currency Translations | | | (5,101 | ) | | | 2,456 | | | | (214,154 | ) |
Net Change in Unrealized Appreciation (Depreciation) on Investments and Foreign Currency Translations | | | (1,061,566 | ) | | | (66,112 | ) | | | (159,085 | ) |
| | | | | | | | | | | | |
Net Decrease in Net Assets Resulting from Operations | | | (1,026,280 | ) | | | (71,004 | ) | | | (393,938 | ) |
| | | | | | | | | | | | |
Dividends and Distributions from: | | | | | | | | | | | | |
Net Investment Income | | | (6,687 | ) | | | — | | | | — | |
| | | | | | | | | | | | |
Total Dividends and Distributions | | | (6,687 | ) | | | — | | | | — | |
| | | | | | | | | | | | |
Capital Share Transactions:(4) | | | | | | | | | | | | |
Issued | | | 33,080,732 | | | | 23,899,284 | | | | 8,730,662 | |
Redeemed | | | — | | | | — | | | | (1,178,371 | ) |
Increase in Net Assets from Capital Share Transactions | | | 33,080,732 | | | | 23,899,284 | | | | 7,552,291 | |
| | | | | | | | | | | | |
Total Increase in Net Assets | | | 32,047,765 | | | | 23,828,280 | | | | 7,158,353 | |
| | | | | | | | | | | | |
Net Assets: | | | | | | | | | | | | |
Beginning of Period | | | — | | | | — | | | | — | |
End of Period | | $ | 32,047,765 | | | $ | 23,828,280 | | | $ | 7,158,353 | |
| | | | | | | | | | | | |
Undistributed Net Investment Income/ Accumulated Net Investment Loss | | $ | 25,520 | | | $ | (4,566 | ) | | $ | (13,176 | ) |
| | | | | | | | | | | | |
Share Transactions: | | | | | | | | | | | | |
Issued | | | 1,250,002 | | | | 900,002 | | | | 350,002 | |
Redeemed | | | — | | | | — | | | | (50,000 | ) |
| | | | | | | | | | | | |
Net Increase in Shares Outstanding from Share Transactions | | | 1,250,002 | | | | 900,002 | | | | 300,002 | |
80
Statements of Changes in Net Assets (concluded)
| | KraneShares Electric Vehicles and Future Mobility Index ETF | | Kraneshares MSCI All China Healthcare Index ETF |
| | Period Ended March 29,
2018(1)^ | | Period Ended March 29,
2018(2)^ |
Operations: | | | | | | | | |
Net Investment Income (Loss) | | $ | 15,786 | | | $ | (3,585 | ) |
Net Realized Loss on Investments and Foreign Currency Translations | | | (80,579 | ) | | | (529 | ) |
Net Change in Unrealized Appreciation (Depreciation) on Investments and Foreign Currency Translations | | | (1,216,424 | ) | | | 169,630 | |
| | | | | | | | |
Net Increase (Decrease) in Net Assets Resulting from Operations | | | (1,281,217 | ) | | | 165,516 | |
| | | | | | | | |
Capital Share Transactions:(3) | | | | | | | | |
Issued | | | 28,078,846 | | | | 3,832,495 | |
Increase in Net Assets from Capital Share Transactions | | | 28,078,846 | | | | 3,832,495 | |
Total Increase in Net Assets | | | 26,797,629 | | | | 3,998,011 | |
| | | | | | | | |
Net Assets: | | | | | | | | |
Beginning of Period | | | — | | | | — | |
End of Period | | $ | 26,797,629 | | | $ | 3,998,011 | |
| | | | | | | | |
Undistributed Net Investment Income/Accumulated Net Investment Loss | | $ | 3,098 | | | $ | (4,114 | ) |
| | | | | | | | |
Share Transactions: | | | | | | | | |
Issued | | | 1,150,002 | | | | 150,002 | |
| | | | | | | | |
Net Increase in Shares Outstanding from Share Transactions | | | 1,150,002 | | | | 150,002 | |
81
Financial Highlights
Selected Per Share Data & Ratios
For the Years/Periods Ended March 31 (unless otherwise indicated)
For a Share Outstanding Throughout Each Period
| | Net Asset Value, Beginning
of Period
($) | | Net
Investment Income (Loss)
($)* | | Net Realized and Unrealized Gain (Loss) on Investments
($) | | Total from Operations ($) | | Distribution from Net Investment Income
($) | | Distribution from Capital Gains
($) | | |
KraneShares Bosera MSCI China A Share ETF |
2018(1) | | 28.38 | | 0.21 | | | 6.22 | | | 6.43 | | | (0.18 | ) | | (0.16 | ) | | — | |
2017 | | 30.37 | | (0.01 | ) | | (0.67 | ) | | (0.68 | ) | | — | | | (0.85 | ) | | (0.46 | ) |
2016 | | 53.55 | | 0.62 | | | (13.67 | ) | | (13.05 | ) | | (0.41 | ) | | (9.72 | ) | | — | |
2015 | | 28.92 | | (0.22 | ) | | 24.90 | | | 24.68 | | | (0.05 | ) | | — | | | — | |
2014(2) | | 30.00 | | (0.02 | ) | | (1.06 | ) | | (1.08 | ) | | — | | | — | | | — | |
KraneShares Zacks New China ETF(6)# |
2018(1) | | 34.06 | | 0.24 | | | 7.22 | | | 7.46 | | | (0.30 | ) | | (7.34 | ) | | — | |
2017 | | 28.02 | | 0.21 | | | 6.54 | | | 6.75 | | | (0.33 | ) | | — | | | (0.38 | ) |
2016 | | 34.20 | | 0.18 | | | (3.21 | ) | | (3.03 | ) | | (0.25 | ) | | (2.89 | ) | | (0.01 | ) |
2015 | | 31.42 | | 0.12 | | | 2.97 | | | 3.09 | | | (0.31 | ) | | — | | | — | |
2014(3) | | 25.00 | | (0.03 | ) | | 6.45 | | | 6.42 | | | — | | | — | | | — | |
KraneShares CSI China Internet ETF |
2018(1) | | 42.21 | | (0.19 | ) | | 19.43 | | | 19.24 | | | (0.34 | ) | | — | | | — | |
2017 | | 35.76 | | (0.27 | ) | | 7.13 | | | 6.86 | | | (0.30 | ) | | — | | | (0.11 | ) |
2016 | | 34.18 | | (0.20 | ) | | 1.84 | | | 1.64 | | | (0.06 | ) | | — | | | — | (7) |
2015 | | 35.93 | | (0.14 | ) | | (1.32 | ) | | (1.46 | ) | | (0.29 | ) | | — | | | — | |
2014(4) | | 25.00 | | (0.02 | ) | | 11.05 | | | 11.03 | | | (0.06 | ) | | (0.04 | ) | | — | |
KraneShares E Fund China Commercial Paper ETF |
2018(1) | | 32.82 | | 1.07 | | | 3.34 | | | 4.41 | | | — | | | — | | | — | |
2017 | | 34.18 | | 0.61 | | | (1.96 | ) | | (1.35 | ) | | — | | | — | | | (0.01 | ) |
2016 | | 34.81 | | 1.01 | | | (1.39 | ) | | (0.38 | ) | | (0.21 | ) | | (0.01 | ) | | (0.03 | ) |
2015(5) | | 35.00 | | 0.39 | | | (0.35 | ) | | 0.04 | | | (0.23 | ) | | — | | | — | |
82
Total from Distributions ($) | | Net Asset Value, End of Period
($) | | | | Net Assets End of Period ($)(000) | | Ratio of Expenses to Average Net Assets
(%) | | Ratio of Expenses to Average Net Assets (Excluding Waivers)
(%) | | Ratio of Net Investment Income (Loss) to Average Net Assets
(%) | | |
| | | | | | | | | | | | | | | | | | | | |
(0.34 | ) | | 34.47 | | 22.68 | | | 353,324 | | 0.60 | | | 0.80 | | | 0.61 | | | 52 | |
(1.31 | ) | | 28.38 | | (2.04 | ) | | 52,494 | | 0.72 | (9) | | 0.84 | (9) | | (0.04 | ) | | 95 | |
(10.13 | ) | | 30.37 | | (27.18 | ) | | 4,555 | | 0.93 | (8) | | 1.18 | (8) | | 1.18 | | | 116 | |
(0.05 | ) | | 53.55 | | 85.37 | | | 26,774 | | 1.31 | | | 1.51 | | | (0.55 | ) | | 110 | |
— | | | 28.92 | | (3.60 | ) | | 11,566 | | 1.10 | † | | 1.10 | † | | (0.84 | )† | | — | †† |
| | | | | | | | | | | | | | | | | | | | |
(7.64 | ) | | 33.88 | | 22.57 | | | 5,082 | | 0.71 | (10) | | 0.71 | (10) | | 0.64 | | | 105 | |
(0.71 | ) | | 34.06 | | 24.54 | | | 3,406 | | 0.84 | | | 0.84 | | | 0.55 | | | 86 | |
(3.15 | ) | | 28.02 | | (9.71 | ) | | 2,803 | | 0.73 | | | 0.73 | | | 0.60 | | | 575 | |
(0.31 | ) | | 34.20 | | 9.92 | | | 3,421 | | 0.71 | | | 0.71 | | | 0.37 | | | 36 | |
— | | | 31.42 | | 25.70 | | | 3,143 | | 0.68 | † | | 0.68 | † | | (0.15 | )† | | 7 | †† |
| | | | | | | | | | | | | | | | | | | | |
(0.34 | ) | | 61.11 | | 45.62 | | | 1,628,622 | | 0.70 | (10) | | 0.70 | (10) | | (0.33 | ) | | 29 | |
(0.41 | ) | | 42.21 | | 19.44 | | | 291,257 | | 0.81 | | | 0.81 | | | (0.72 | ) | | 35 | |
(0.06 | ) | | 35.76 | | 4.77 | | | 194,869 | | 0.72 | | | 0.72 | | | (0.56 | ) | | 27 | |
(0.29 | ) | | 34.18 | | (4.09 | ) | | 131,612 | | 0.71 | | | 0.71 | | | (0.39 | ) | | 43 | |
(0.10 | ) | | 35.93 | | 44.18 | | | 77,243 | | 0.68 | † | | 0.68 | † | | (0.90 | )† | | 8 | †† |
| | | | | | | | | | | | | | | | | | | | |
— | | | 37.23 | | 13.44 | | | 13,030 | | 0.77^ | (10)(12) | | 0.89^ | (10)(12) | | 3.10^ | | | — | |
(0.01 | ) | | 32.82 | | (3.95 | )(11) | | 9,845 | | 0.95^ | | | 1.07^ | | | 1.84^ | | | — | |
(0.25 | ) | | 34.18 | | (1.11 | ) | | 18,799 | | 0.57^ | | | 0.69^ | | | 2.92^ | | | 717 | |
(0.23 | ) | | 34.81 | | 0.13 | | | 8,702 | | 0.60†^ | | | 0.72†^ | | | 3.46†^ | | | — | †† |
83
Financial Highlights (concluded)
Selected Per Share Data & Ratios
For the Years/Periods Ended March 31 (unless otherwise indicated)
For a Share Outstanding Throughout Each Period
| | Net Asset Value, Beginning of Period ($) | | Net Investment Income (Loss) ($)* | | Net Realized and Unrealized Gain (Loss) on Investments ($) | | Total from Operations ($) | | Distribution from Net Investment Income
($) | | Distribution from Capital Gains
($) | | |
KraneShares FTSE Emerging Markets Plus ETF |
2018(1) | | 22.56 | | 0.45 | | | 4.28 | | | 4.73 | | | (0.33 | ) | | — | | | — |
2017 | | 21.66 | | 0.37 | | | 1.88 | | | 2.25 | | | (0.70 | ) | | (0.47 | ) | | (0.18) |
2016 | | 25.63 | | 0.29 | | | (3.86 | ) | | (3.57 | ) | | (0.35 | ) | | (0.05 | ) | | — |
2015(2) | | 25.00 | | — | | | 0.63 | | | 0.63 | | | — | | | — | | | — |
KraneShares MSCI One Belt One Road Index ETF |
2018(1)(3) | | 25.00 | | 0.08 | | | 0.59^ | | | 0.67 | | | (0.03 | ) | | — | | | — |
KraneShares Emerging Markets Consumer Technology Index ETF |
2018(1)(4) | | 25.00 | | (0.03 | ) | | 1.51^ | | | 1.48 | | | — | | | — | | | — |
KraneShares MSCI China Environment Index ETF |
2018(1)(5) | | 25.00 | | (0.09 | ) | | (1.05 | ) | | (1.14 | ) | | — | | | — | | | — |
KraneShares Electric Vehicles and Future Mobility Index ETF |
2018(1)(6) | | 25.00 | | 0.02 | | | (1.72 | ) | | (1.70 | ) | | — | | | — | | | — |
Kraneshares MSCI All China Healthcare Index ETF |
2018(1)(7) | | 25.00 | | (0.03 | ) | | 1.68 | | | 1.65 | | | — | | | — | | | — |
84
Total from Distributions ($) | | Net Asset Value, End of Period ($) | | | | Net Assets End of Period
($)(000) | | Ratio of
Expenses to
Average Net
Assets
(%) | | Ratio of
Expenses
to Average
Net Assets
(Excluding
Waivers)
(%) | | Ratio of Net Investment Income
(Loss) to
Average Net
Assets
(%) | | |
| | | | | | | | | | | | | | | | | | | | |
(0.33 | ) | | 26.96 | | 20.99 | | | 2,696 | | 0.63 | ‡‡(8) | | 0.72 | ‡‡(8) | | 1.75 | ‡‡ | | 3 | |
(1.35 | ) | | 22.56 | | 11.24 | | | 2,256 | | 0.37 | ‡‡ | | 0.73 | ‡‡ | | 1.70 | ‡‡ | | 25 | |
(0.40 | ) | | 21.66 | | (14.00 | ) | | 2,166 | | 0.91 | ‡ | | 1.12 | ‡ | | 1.27 | ‡ | | 1 | |
— | | | 25.63 | | 2.52 | | | 2,563 | | 0.88 | †‡ | | 0.88 | †‡ | | (0.07 | )†‡ | | 8†† | |
| | | | | | | | | | | | | | | | | | | | |
(0.03 | ) | | 25.64 | | 2.67 | | | 32,048 | | 0.79 | †‡‡(8)(9) | | 0.80 | †‡‡(8)(9) | | 0.52 | †(9) | | 1 | †† |
| | | | | | | | | | | | | | | | | | | | |
— | | | 26.48 | | 5.92 | | | 23,828 | | 0.79 | †(8)(10) | | 0.79 | †(8)(10) | | (0.23 | )†(10) | | — | †† |
| | | | | | | | | | | | | | | | | | | | |
— | | | 23.86 | | (4.56 | ) | | 7,158 | | 0.78 | †(8)(11) | | 0.79 | †(8)(11) | | (0.78 | )†(11) | | 36 | †† |
| | | | | | | | | | | | | | | | | | | | |
— | | | 23.30 | | (6.80 | ) | | 26,798 | | 0.70 | †(12) | | 0.70 | †(12) | | 0.43 | †(12) | | 18 | †† |
| | | | | | | | | | | | | | | | | | | | |
— | | | 26.65 | | 6.60 | | | 3,998 | | 0.82 | †(13) | | 0.82 | †(13) | | (0.82 | )†(13) | | — | †† |
85
Notes to Financial Statements
1. ORGANIZATION
KraneShares Trust (the “Trust”) is a Delaware Statutory Trust formed on February 3, 2012. The Trust is registered under the Investment Company Act of 1940, as amended, as an open-end management investment company. As of March 29, 2018, the Trust had ten operational series. The financial statements herein and the related notes pertain to the KraneShares Bosera MSCI China A Share ETF, KraneShares Zacks New China ETF (formerly, KraneShares CSI New China ETF), KraneShares CSI China Internet ETF, KraneShares E Fund China Commercial Paper ETF, KraneShares FTSE Emerging Markets Plus ETF, KraneShares MSCI One Belt One Road Index ETF, KraneShares Emerging Markets Consumer Technology Index ETF, KraneShares MSCI China Environment Index ETF, KraneShares Electric Vehicles and Future Mobility Index ETF and KraneShares MSCI All China Health Care Index ETF (each, a “Fund” and collectively, the “Funds”). KraneShares Bosera MSCI China A Share ETF and KraneShares FTSE Emerging Markets Plus ETF are diversified Funds, as defined under Section 5(b)(1) of the Investment Company Act of 1940; while the KraneShares Zacks New China ETF, KraneShares CSI China Internet ETF, KraneShares E Fund China Commercial Paper ETF, KraneShares MSCI One Belt One Road Index ETF, KraneShares Emerging Markets Consumer Technology Index ETF, KraneShares MSCI China Environment Index ETF, KraneShares Electric Vehicles and Future Mobility Index ETF and KraneShares MSCI All China Health Care Index ETF are non-diversified Funds. Krane Funds Advisors, LLC (“Krane” or the ‘‘Adviser’’), a Delaware limited liability company, serves as the investment adviser for the Funds and is subject to the supervision of the Board of Trustees (the ‘‘Board’’). The Adviser is responsible for managing the investment activities of the Funds, the Funds’ business affairs and other administrative matters. The Adviser may use sub-advisers (each, a “Sub-Adviser” or collectively, the “Sub-Advisers”) to perform the day-to-day management of the Funds.
China International Capital Corporation (USA) Holdings Inc., a wholly-owned, indirect subsidiary of China International Capital Corporation Limited owns a majority stake in Krane. Central Huijin Investment Limited, a mainland Chinese-domiciled entity, currently holds approximately 55.7% of the shares of China International Capital Corporation Limited. Central Huijin Investment Limited is a wholly-owned subsidiary of China Investment Corporation, which is a mainland Chinese sovereign wealth fund. KFA One Holdings, LLC, located at 1270 Avenue of the Americas, 22nd Floor, New York, NY 10020, holds the remaining equity interests in Krane and Jonathan Krane, through his equity interests in KFA One Holdings, LLC, beneficially owns more than 10% of the equity interests in Krane.
Shares of KraneShares Bosera MSCI China A Share ETF, KraneShares Zacks New China ETF, KraneShares CSI China Internet ETF, KraneShares E Fund China Commercial Paper ETF, KraneShares MSCI One Belt One Road Index ETF, KraneShares Emerging Markets Consumer Technology Index ETF, KraneShares MSCI China Environment Index ETF, KraneShares Electric Vehicles and Future Mobility Index ETF and KraneShares MSCI All China Health Care Index ETF are listed and traded on the NYSE Arca, Inc. (“NYSE Arca”). Shares of KraneShares FTSE Emerging Markets Plus ETF are listed and traded on BATS Exchange (now known as Cboe Global Markets) (each, with respect to Funds listed thereon, the “Exchange”). Market prices for Fund shares (“Shares”) may be different from their net asset value (“NAV”). The Funds issue and redeem Shares on a continuous basis at NAV only in large blocks of Shares, typically 50,000 Shares or multiples thereof, called “Creation Units”. This does not mean, however, that individual investors will be able to redeem and purchase Shares directly with the series of the Trust. Only Authorized Participants can redeem and purchase Creation Units of Shares directly. Each Fund will issue and redeem Shares for a basket
86
Notes to Financial Statements (continued)
of securities and/or a balancing cash amount. Individual shares trade in the secondary market at market prices that change throughout the day.
The investment objective of each Fund is to seek investment results that generally correspond (before fees and expenses) to its respective index listed below (each, an “Underlying Index”):
| | |
KraneShares Bosera MSCI China A Share ETF | | MSCI China A Inclusion Index |
KraneShares Zacks New China ETF | | Zacks New China Index |
KraneShares CSI China Internet ETF | | CSI Overseas China Internet Index |
KraneShares E Fund China Commercial Paper ETF | | CSI Diversified High Grade Commercial Paper Index |
KraneShares FTSE Emerging Markets Plus ETF | | FTSE Emerging incl. China Overseas non-R/QFII GDP Weighted Index |
KraneShares MSCI One Belt One Road Index ETF | | MSCI Global China Infrastructure Exposure Index |
KraneShares Emerging Markets Consumer Technology Index ETF | | Solactive Emerging Market Consumer Technology Index |
KraneShares MSCI China Environment Index ETF | | MSCI China IMI Environment 10/40 Index |
KraneShares Electric Vehicles and Future Mobility Index ETF | | Solactive Electric Vehicles and Future Mobility Index |
KraneShares MSCI All China Health Care Index ETF | | MSCI China All Shares Health Care 10/40 Index |
2. SIGNIFICANT ACCOUNTING POLICIES
The following is a summary of the significant accounting policies followed by the Funds. The Funds are investment companies that apply the accounting and reporting guidance issued in Topic 946 by the U.S. Financial Accounting Standards Board (FASB”).
USE OF ESTIMATES — The preparation of financial statements in conformity with U.S. generally accepted accounting principles (“U.S. GAAP”) requires management to make estimates and assumptions that affect the reported amounts of assets and liabilities and disclosure of contingent assets and liabilities at the date of the financial statements and the reported amounts of increases and decreases in net assets from operations during the reporting period. Actual results could differ from those estimates, and could have a material impact to the Funds.
REPORTING PERIOD END DATE — The Funds’ fiscal year end is March 31. The last day of the Funds’ reporting period, however, is the last day the Exchange was open for trading during the fiscal period. The Funds’ financial statements have been presented through that date to maintain consistency with the Funds’ net asset value calculations used for shareholder transactions.
SECURITY VALUATION — The NAV per share of each Fund is computed by dividing the value of the net assets of the Fund (i.e., the current market value of its total assets less any liabilities and withholdings (if any) for applicable capital gains) by the total number of shares of the Fund outstanding, rounded to the nearest cent. Expenses and fees, including without limitation, the management fees and expenses of the Independent Trustees (including any Trustee counsel fees), are accrued daily and taken into account for purposes of determining NAV. The NAV per share for each Fund normally is calculated as of the regularly scheduled close of the normal trading on each day that the NYSE is open for business (a “Business Day”) (normally, 4:00 p.m., Eastern Time).
In calculating the values of each Fund’s portfolio securities, securities listed on a securities exchange, market or automated quotation system for which quotations are readily available (except for securities traded on NASDAQ), including securities traded over the counter, are valued
87
Notes to Financial Statements (continued)
at the last reported sale price on the primary exchange or market (foreign or domestic) on which they are traded on the valuation date (or at the time as of which the Fund’s NAV is calculated if a security’s exchange is normally open at that time). If there is no such reported sale on the valuation date, such securities are valued at the most recently reported bid price. For securities traded on NASDAQ, the NASDAQ Official Closing Price will be used. If available, debt securities are priced based upon valuations provided by independent, third-party pricing agents. Such values generally reflect the last reported sales price if the security is actively traded. The third-party pricing agents may also value debt securities at an evaluated bid price by employing methodologies that utilize actual market transactions (if the security is actively traded), broker-dealer supplied valuations, or other methodologies designed to identify the market value for such securities. Debt obligations with remaining maturities of sixty days or less may be valued at their amortized cost, which is an approximation of market value. The prices for foreign securities are reported in their local currencies and converted to U.S. dollars using prevailing currency exchange rates. The value of a swap contract is equal to the obligation (or rights) under the swap contract, which will generally be equal to the net amounts to be paid (or received) under the contract based upon the relative values of the positions held by each party to the contract as determined by the applicable independent, third party pricing agent. Exchange-traded options are valued at the last reported sales price on the valuation date on the exchange on which they are listed. Futures are valued at the settlement price established by the board of trade on which they are traded. Foreign currency forward contracts are valued at the current day’s interpolated foreign exchange rate, as calculated using the current day’s spot rate. The exchange rates used for valuation are captured as of the close of the London Stock Exchange each day, normally at 4:00 p.m. Greenwich Mean Time. Prices for most securities held by each Fund are provided daily by independent pricing agents. If a security price cannot be obtained from an independent, third-party pricing agent, the Fund seeks to obtain bid and ask prices from two broker-dealers who make a market in the portfolio instrument and determine the average of the two.
Securities for which market prices are not ��‘readily available,’’ or are not deemed to reflect current market values, or are debt securities where no evaluated price is available from the Trust’s third-party pricing agents pursuant to established methodologies, are fair valued by the Trust’s Fair Value Pricing Committee in accordance with the Trust’s valuation policies and procedures approved by the Board of Trustees. Some of the more common reasons that may necessitate that a security be valued using ‘‘fair value’’ pricing may include, but are not limited to: the security’s trading has been halted or suspended; the security’s primary trading market is temporarily closed; or the security has not been traded for an extended period of time. Each Fund may fair value certain of the foreign securities held by the Fund each day the Fund calculates its NAV.
In addition, each Fund may fair value its securities if an event that may materially affect the value of the Fund’s securities that trade outside of the United States (a ‘‘Significant Event’’) has occurred between the time of the security’s last close and the time that the Fund calculates its NAV. A Significant Event may relate to a single issuer or to an entire market sector. Events that may be Significant Events may include: government actions, natural disasters, armed conflict, acts of terrorism and significant market fluctuations. If the Adviser becomes aware of a Significant Event that has occurred with respect to a portfolio instrument or group of portfolio instruments after the closing of the exchange or market on which the portfolio instrument or portfolio instruments principally trade, but before the time at which a Fund calculates its NAV, it will notify the Fund’s administrator and request that an ad hoc meeting of the Fair Value Pricing Committee be called.
88
Notes to Financial Statements (continued)
With respect to trade-halted securities, the Trust typically will fair value a trade-halted security by adjusting the security’s last market close price by the security’s sector performance, as measured by a predetermined index, unless the Adviser recommends and the Trust’s Fair Value Pricing Committee determines to make additional adjustments. Certain foreign securities exchanges have mechanisms in place that confine one day’s price movement in an individual security to a pre-determined price range based on that day’s opening price (“Collared Securities”). Fair value determinations for Collared Securities will generally be capped based on any applicable pre-determined “limit down” or “limit up” prices established by the relevant foreign securities exchange. As an example, China A-Shares can only be plus or minus ten percent in one day of trading in the relevant mainland China equity market. As a result, the fair value price determination on a given day will generally be capped plus or minus ten percent.
Investments in open-end investment companies that do not trade on an exchange are valued at an applicable investment company’s end of day NAV. Investments in open-end investment companies that trade on an exchange are valued at the last reported sale price or official closing price as of the close of the customary trading session on the exchange where the security is principally traded on the valuation date. If there is no such reported sale on the valuation date, such securities are valued at the most recently reported bid price. Fair value pricing involves subjective judgments and it is possible that a fair value determination for a security is materially different than the value that could actually be realized upon the sale of the security or that another fund that uses market quotations or its own fair value procedures to price the same securities. In addition, fair value pricing could result in a difference between the prices used to calculate each Fund’s NAV and the prices used by the Underlying Index. This may adversely affect each Fund’s ability to track the Underlying Index.
Trading in securities on many foreign exchanges is normally completed before the close of business in the United States on each Business Day. In addition, securities trading in a particular country or countries may not take place on each Business Day or may take place on days that are not Business Days. Changes in valuations of certain securities may occur at times or on days on which a Fund’s NAV is not calculated and on which Funds do not trade and sales and redemptions of shares do not occur. As a result, the value of a Fund’s portfolio securities and the net asset value of its shares may change on days when investors are not able to purchase or sell shares.
As of March 29, 2018, the total market value of securities valued in accordance with Fair Value Procedures is as follows:
| | | | |
KraneShares Bosera MSCI China A Share ETF | | $6,103,566 | | 1.7 | % |
KraneShares Zacks New China ETF | | 97 | | 0.0 | % |
KraneShares FTSE Emerging Markets Plus ETF | | 6 | | 0.0 | % |
KraneShares MSCI All China Health Care Index ETF | | 13,730 | | 0.3 | % |
In accordance with the authoritative guidance on fair value measurements and disclosure under U.S. GAAP, the Funds disclose the fair value of their investments in a hierarchy that prioritizes the inputs to valuation techniques used to measure the fair value. The objective of a fair value measurement is to determine the price that would be received to sell an asset or paid to transfer a liability in an orderly transaction between market participants at the measurement date (an exit price). Accordingly, the fair value hierarchy gives the highest priority to quoted prices (unadjusted)
89
Notes to Financial Statements (continued)
in active markets for identical assets or liabilities (Level 1) and the lowest priority to unobservable inputs (Level 3). The three levels of the fair value hierarchy are described below:
Level 1 — Unadjusted quoted prices in active markets for identical, unrestricted assets or liabilities that the Funds have the ability to access at the measurement date.
Level 2 — Other significant observable inputs (including quoted prices in non-active markets, quoted prices for similar investments, fair value of investments for which the Funds have the ability to fully redeem tranches at net asset value as of the measurement date or within the near term, and short-term investments valued at amortized cost).
Level 3 — Significant unobservable inputs (including the Funds’ own assumptions in determining the fair value of investments, broker quotes, fair value of investments for which the Funds do not have the ability to fully redeem tranches at net asset value as of the measurement date or within the near term).
Investments are classified within the level of the lowest significant input considered in determining fair value. Investments classified within Level 3 whose fair value measurement considers several inputs may include Level 1 or Level 2 inputs as components of the overall fair value measurement. For details of the investment classification, refer to each Fund’s Schedule of Investments.
For the year ended March 29, 2018, there have been no significant changes to the Funds’ fair valuation methodologies.
The following table summarizes the quantitative inputs and assumptions used for items categorized as material Level 3 investments as of March 29, 2018. The disclosures below also include qualitative information on the sensitivity of the fair value measurements to changes in the significant unobservable inputs.
KraneShares Bosera MSCI China A Share ETF
Quantitative information about Level 3 fair value measurements |
| | | | | | | | |
Common Stock | | $6,103,566 | | Sector Movement | | Sector Performance | | +/-10% |
The unobservable input used to determine fair value of the Level 3 asset may have similar or diverging impacts on valuation. Significant increases and decreases in this input could result in significantly higher or lower fair value measurement.
FEDERAL INCOME TAXES — It is each Fund’s intention to qualify or continue to qualify as a regulated investment company for federal income tax purposes by complying with the appropriate provisions of Subchapter M of the Internal Revenue Code of 1986, as amended, and to distribute annually all or substantially all of its taxable income and gains to shareholders. Accordingly, no provisions for federal income taxes have been made in the financial statements.
90
Notes to Financial Statements (continued)
The Funds evaluate tax positions taken or expected to be taken in the course of preparing the Funds’ tax returns to determine whether it is “more-likely-than-not” (i.e., greater than 50 percent) that each tax position will be sustained upon examination by a taxing authority based on the technical merits of the position. Tax positions not deemed to meet the more-likely-than-not threshold are recorded as a tax benefit or expense in the current year. The Funds did not record any tax provisions in the current period. However, management’s conclusions regarding tax positions may be subject to review and adjustment at a later date based on factors including, but not limited to, examination by tax authorities (i.e., the last three tax year ends, as applicable), on-going analysis of and changes to tax laws, regulations and interpretations thereof.
As of March 29, 2018, management of the Funds has reviewed all open tax years since inception and concluded that there is no tax liability resulting from unrecognized tax benefits relating to uncertain income tax positions taken or expected to be taken in future tax returns. The Funds are also not aware of any tax positions for which it is reasonably possible that the total amounts of unrecognized tax benefits will significantly change in the next 12 months.
SECURITY TRANSACTIONS AND INVESTMENT INCOME — Security transactions are accounted for on the trade date for financial reporting purposes. Costs used in determining realized gains and losses on the sale of investment securities are based on specific identification. Dividend income is recorded, net of any applicable withholding tax, on the ex-dividend date, or for certain foreign securities, when the information becomes available to the Funds. Interest income is recognized on the accrual basis from the settlement date.
Dividend income received from affiliated funds is recognized on the ex-dividend date and is recorded as income distributions in the Statement of Operations. Capital gain distributions received from affiliated funds are recognized on ex-dividend date and are recorded on the Statement of Operations as such. Costs used in determining realized gains and losses on the sales of affiliated funds are on the basis of specific identification. For the year ended March 29, 2018, the KraneShares E Fund China Commercial Paper ETF incurred withholding/value added tax of $26,214 which was voluntarily reimbursed by the Adviser. See details on the Statements of Operations.
FOREIGN CURRENCY — The books and records of the Funds are maintained in U.S. dollars. Investment securities and other assets and liabilities denominated in a foreign currency are translated into U.S. dollars on the date of valuation. Purchases and sales of investment securities, income and expenses are translated into U.S. dollars at the relevant rates of exchange prevailing on the respective dates of such transactions. The Funds do not isolate that portion of realized or unrealized gains and losses resulting from changes in the foreign exchange rate from fluctuations arising from changes in the market prices of the securities. These gains and losses are included in net realized and unrealized gains and losses on foreign currency translations on the Statements of Operations. Net realized and unrealized gains and losses on foreign currency transactions and translations represent net foreign exchange gains or losses from foreign currency exchange contracts, disposition of foreign currencies, currency gains or losses realized between trade and settlement dates on securities transactions and the difference between the amount of the investment income and foreign withholding taxes recorded on the Funds’ books and the U.S. dollar equivalent amounts actually received or paid.
DIVIDENDS AND DISTRIBUTIONS TO SHAREHOLDERS — The Funds distribute their net investment income at least annually. Any net realized capital gains are distributed annually. All distributions are recorded on the ex-dividend date.
91
Notes to Financial Statements (continued)
CASH OVERDRAFT CHARGES — Per the terms of an agreement with BBH, if a Fund has a cash overdraft on a given day, it will be assessed an overdraft charge of LIBOR plus 2.00%. Cash overdraft charges are included in “Interest Expense” on the Statements of Operations.
SECURITIES LENDING — The Funds may lend securities from their portfolios to brokers, dealers and other financial institutions. In connection with such loans, a Fund remains the beneficial owner of the loaned securities and continues to receive payments in amounts approximately equal to the interest, dividends or other distributions payable on the loaned securities. A Fund also has the right to terminate a loan at any time. A Fund does not have the right to vote on securities while they are on loan. Loans of portfolio securities will not exceed 33 1/3% of the value of a Fund’s total assets (including the value of all assets received as collateral for the loan). A Fund will receive collateral consisting of cash in the form of U.S. dollars, foreign currency, or securities issued or fully guaranteed by the U.S. Government which will be maintained at all times in an amount equal to at least 102% of the current market value of the loaned securities. If the collateral consists of cash, a Fund will reinvest the cash and pay the borrower a pre-negotiated fee or “rebate” from any return earned on the investment. Should the borrower of the securities fail financially, a Fund may experience delays in recovering the loaned securities or exercising its rights in the collateral. In a loan transaction, a Fund will also bear the risk of any decline in value of securities acquired with cash collateral. Krane and a sub-adviser are subject to potential conflicts of interest because the compensation paid to them increases in connection with any net income received by a Fund from a securities lending program. Each Fund pays Krane 10% of any net monthly income received from the investment of cash collateral and loan fees received from borrowers in respect of each securities loan (net of any amounts paid to the custodian and/or securities lending agent or rebated to borrowers). (See Note 3).
The following table discloses the securities on loan as of March 29, 2018:
| | Market Value of Securities on Loan | | Cash Collateral for Securities on Loan |
KraneShares CSI China Internet ETF | | $77,291,418 | | $83,019,440 |
CREATION UNITS — The Funds issue and redeem Shares at NAV and only in large blocks of Shares (each block of Shares for a Fund is a Creation Unit of 50,000 Shares, or multiples thereof).
The standard creation and redemption fees for each Fund are listed below. These fees are subject to adjustment from time to time by the Adviser.
| | | | Maximum Variable Transaction Fee |
KraneShares Bosera MSCI China A Share ETF | | $ | 8,500 | | 2.00 | % |
KraneShares Zacks New China ETF | | | 1,500 | | 2.00 | % |
KraneShares CSI China Internet ETF | | | 500 | | 2.00 | % |
KraneShares E Fund China Commercial Paper ETF | | | 500 | | 2.00 | % |
KraneShares FTSE Emerging Markets Plus ETF | | | 8,500 | | 2.00 | % |
KraneShares MSCI One Belt One Road Index ETF | | | 750 | | 2.00 | % |
KraneShares Emerging Markets Consumer Technology Index ETF | | | 750 | | 2.00 | % |
KraneShares MSCI China Environment Index ETF | | | 750 | | 2.00 | % |
KraneShares Electric Vehicles and Future Mobility Index ETF | | | 1,100 | | 2.00 | % |
KraneShares MSCI All China Healthcare Index ETF | | | 1,320 | | 2.00 | % |
Except when aggregated in Creation Units, Shares are not redeemable securities of a Fund. Shares of a Fund may only be purchased or redeemed by certain Authorized Participants. An Authorized
92
Notes to Financial Statements (continued)
Participant is either (i) a broker-dealer or other participant in the clearing process through the Continuous Net Settlement System of the National Securities Clearing Corporation or (ii) a Depository Trust Company (‘‘DTC’’) participant and, in each case, must have executed a Participant Agreement with the Distributor. Most retail investors will not qualify as Authorized Participants or have the resources to buy and sell whole Creation Units. Therefore, they will be unable to purchase or redeem the Shares directly from a Fund. Rather, most retail investors will purchase Shares in the secondary market with the assistance of a broker and will be subject to customary brokerage commissions or fees when buying or selling Shares. If a Creation Unit is purchased or redeemed for cash, a higher transaction fee will be charged.
The following table discloses Creation Unit breakdown for the year ended March 29, 2018:
| | | | Standard Transaction
Fee – Subscriptions | | | | Standard
Transaction
Fee – Redemptions |
KraneShares Bosera MSCI China A Share ETF | | 8,400,000 | | $255,000 | | $ | 263,555,439 | | $8,500 |
KraneShares Zacks New
China ETF | | 50,000 | | 1,500 | | | 2,010,914 | | — |
KraneShares CSI China
Internet ETF | | 19,750,000 | | 74,000 | | | 1,127,491,565 | | 9,000 |
KraneShares E Fund China Commercial Paper ETF | | 50,000 | | 500 | | | 1,710,233 | | — |
KraneShares MSCI One Belt One Road Index ETF | | 1,250,002 | | 8,250 | | | 33,080,732 | | — |
KraneShares Emerging Markets Consumer Technology Index ETF | | 900,002 | | 4,500 | | | 23,899,284 | | — |
KraneShares MSCI China Environment Index ETF | | 300,002 | | 3,750 | | | 7,552,291 | | 750 |
KraneShares Electric Vehicles and Future Mobility Index ETF | | 1,150,002 | | 16,500 | | | 28,078,846 | | — |
KraneShares MSCI All China Health Care Index ETF | | 150,002 | | 2,640 | | | 3,832,495 | | — |
CASH AND CASH EQUIVALENTS — Idle cash and currency balances may be swept into various overnight sweep accounts and are classified as cash equivalents on the Statement of Assets and Liabilities. These amounts, at times, may exceed United States federally insured limits. Amounts swept are available on the next business day.
3. RELATED PARTY TRANSACTIONS
INVESTMENT ADVISORY AGREEMENT — The Adviser serves as investment adviser to each Fund pursuant to an Investment Advisory Agreement between the Trust on behalf of each Fund and the Adviser (the “Agreement”). Under the Agreement, Krane is responsible for reviewing, supervising and administering each Fund’s investment program and the general management and administration of the Trust. In addition to these services, to the extent a Fund engages in securities lending, Krane will: (i) assist the securities lending agent of the Fund (the “Agent”) to determine which securities are available for loan, (ii) monitor the Agent’s activities to ensure that securities loans are effected in accordance with Krane’s instructions and in accordance with applicable procedures and guidelines adopted by the Board, (iii) make recommendations to the Board regarding the Fund’s participation in securities lending; (iv) prepare appropriate periodic
93
Notes to Financial Statements (continued)
reports for, and seek appropriate periodic approvals from, the Board with respect to securities lending activities, (v) respond to Agent inquiries concerning the Agent’s activities, and (vi) such other related duties as Krane deems necessary or appropriate (this provision became effective with respect to the Funds on the later of October 5, 2017, or the date the Fund commenced operations). The Board of Trustees of the Trust supervises Krane and establishes policies that Krane must follow in its management activities.
The Agreement requires require the Adviser to pay all operating expenses of the Funds, except: (a) interest and taxes (including, but not limited to, income, excise, transaction, transfer and withholding taxes); (b) expenses of the Funds incurred with respect to the acquisition and disposition of portfolio securities and the execution of portfolio transactions, including brokerage commissions and short sale dividend or interest expense; (c) expenses incurred in connection with any distribution plan adopted by the Trust in compliance with Rule 12b-1 under the Investment Company Act, including distribution fees; (d) “Acquired Fund Fees and Expenses” (as defined by Form N-1A under the 1940 Act); (e) litigation expenses; (f) the compensation payable to the Adviser under the Agreement; (g) compensation and expenses of the Independent Trustees (including any fees of independent legal counsel to the Independent Trustees); and (h) any expenses determined to be extraordinary expenses by the Board. In addition, effective on the later of October 5, 2017, or the date the Fund commenced operations, under the Agreement, while the fees and expenses related to the Funds’ securities lending-related activities reduce the gross revenues and income of the Funds from such activities, they are not fees and expenses for which Krane is responsible.
Each Agreement provides that each Fund pays a unitary (or unified) fee to the Adviser for advisory and management services provided to the Fund, subject to the exceptions noted herein. In this context, there exists a risk that a Trust service provider will seek recourse against the Trust if is not timely paid by Krane for the fees and expenses for which it is responsible, which could materially adversely affect the Funds. Pursuant to the Agreement between the Trust and the Adviser, the Funds below pay the Adviser a fee, which is calculated daily and paid monthly, at the following annual rates, based on a percentage of the average daily net assets of each Fund. In addition, as compensation for the services provided by the Adviser in connection with any securities lending-related activities, each Fund pays the Adviser 10% of the monthly investment income received from the investment of cash collateral and loan fees received from borrowers in respect to securities loans (net of any amounts paid to the custodian and/or securities lending agent or rebated to borrowers), included on the Statements of Operations as “Security Lending Fees”.
| | |
KraneShares Bosera MSCI China A Share ETF | | 0.78 | % |
KraneShares Zacks New China ETF | | 0.68 | % |
KraneShares CSI China Internet ETF | | 0.68 | % |
KraneShares E Fund China Commercial Paper ETF | | 0.68 | % |
KraneShares FTSE Emerging Markets Plus ETF | | 0.68 | % |
KraneShares MSCI One Belt One Road Index ETF | | 0.78 | % |
KraneShares Emerging Markets Consumer Technology Index ETF | | 0.78 | % |
KraneShares MSCI China Environment Index ETF | | 0.78 | % |
KraneShares Electric Vehicles and Future Mobility Index ETF | | 0.68 | % |
KraneShares MSCI All China Health Care Index ETF | | 0.78 | % |
94
Notes to Financial Statements (continued)
Effective July 28, 2017, pursuant to the terms of an Expense Limitation Agreement, the Adviser has contractually agreed to reduce its management fee and/or reimburse the Funds, except for KraneShares Bosera MSCI China A Share ETF, KraneShares Electric Vehicles and Future Mobility Index ETF and KraneShares MSCI All China Health Care Index ETF, in an amount equal to the fees paid by the Funds to counsel to the independent Trustees of the Trust until July 31, 2018. The Expense Limitation Agreement may only be terminated prior to July 31, 2018 by the Board.
Pursuant to the terms of an Expense Limitation Agreement, the Adviser has contractually agreed to reduce its management fee for the KraneShares Bosera MSCI China A Share ETF by 0.20% of the Fund’s average daily net assets until October 4, 2019. The Expense Limitation Agreement may only be terminated prior to October 4, 2019 by the Board.
Pursuant to the terms of an Expense Limitation Agreement, the Adviser has contractually agreed to reduce its management fee for the KraneShares E Fund China Commercial Paper ETF by 0.12% of the Fund’s average daily net assets until October 4, 2019. The Expense Limitation Agreement may only be terminated prior thereto by the Board.
Pursuant to the terms of an Expense Limitation Agreement, Krane has contractually agreed to reduce its management fee for the KraneShares FTSE Emerging Markets Plus ETF in an amount equal to any Acquired Fund Fees and Expenses incurred by the Fund from its investments in the KraneShares Bosera MSCI China A Share ETF. This Expense Limitation Agreement will continue until October 4, 2019. The Expense Limitation Agreement may only be terminated by the Board.
The Adviser and each Sub-Adviser bear all of their own costs associated with providing these advisory services. As part of its agreement with the Trust, the Adviser has contractually agreed to pay all operating expenses of the Funds, including the cost of index licensing fees, transfer agency, custody, fund administration, legal, audit and other services, except as set forth above and as otherwise indicated in those agreements.
SUB-ADVISORY AGREEMENT — Bosera Asset Management (International) Co., Ltd. (“Bosera”), operating out of Hong Kong, serves as the Sub-Adviser to the KraneShares Bosera MSCI China A Share ETF and is responsible for the day-to-day management of the Fund, subject to the supervision by the Adviser and the Board. For the services Bosera provides to KraneShares Bosera MSCI China A Share ETF, the Adviser pays Bosera a fee equal to 50% of the net revenue the Adviser receives from the Fund.
E Fund Management (Hong Kong) Co., Limited (‘‘E Fund”), operating out of Hong Kong, serves as the Sub-Adviser to the KraneShares E Fund China Commercial Paper ETF and is responsible for the day-to-day management of the Fund, subject to the supervision by the Adviser and the Board. For the services E Fund provides to KraneShares E Fund China Commercial Paper ETF, the Adviser pays E Fund a fee equal to 50% of the net revenue the Adviser receives from the Fund.
DISTRIBUTION AGREEMENT — SEI Investments Distribution Co. (the “Distributor”), a wholly-owned subsidiary of SEI Investments Company, and an affiliate of the administrator, serves as the Funds’ distributor of Creation Units pursuant to a Distribution Agreement. The Distributor does not maintain any secondary market in Fund shares.
The Trust has adopted a Distribution and Service Plan (“Plan”) pursuant to Rule 12b-1 under the 1940 Act. In accordance with its Plan, each Fund is authorized to pay an amount up to 0.25% of its average daily net assets each year for certain distribution-related activities. For the year ended
95
Notes to Financial Statements (continued)
March 29, 2018 no fees were charged under the Plan. Fees would only be charged under the Plan upon approval by the Board.
ADMINISTRATOR, CUSTODIAN AND TRANSFER AGENT — SEI Investments Global Funds Services (the “Administrator”) serves as the Funds’ Administrator pursuant to an Administration Agreement. Brown Brothers Harriman & Co. serves as the Funds’ Custodian and Transfer Agent pursuant to a Custodian and Transfer Agent Agreement.
4. INVESTMENT TRANSACTIONS
For the year ended March 29, 2018, the purchases and sales of investments in securities excluding in-kind transactions, long-term U.S. Government and short-term securities were:
| | | | |
KraneShares Bosera MSCI China A Share ETF | | $385,107,547 | | $126,273,035 |
KraneShares Zacks New China ETF | | 5,180,998 | | 5,687,403 |
KraneShares CSI China Internet ETF | | 301,127,233 | | 286,051,410 |
KraneShares E Fund China Commercial Paper ETF | | — | | — |
KraneShares FTSE Emerging Markets Plus ETF | | 84,749 | | 67,637 |
KraneShares MSCI One Belt One Road Index ETF | | 17,583,477 | | 149,420 |
KraneShares Emerging Markets Consumer Technology
Index ETF | | 7,175,903 | | — |
KraneShares MSCI China Environment Index ETF | | 4,225,002 | | 2,101,452 |
KraneShares Electric Vehicles and Future Mobility Index ETF | | 9,300,057 | | 3,651,108 |
KraneShares MSCI All China Health Care Index ETF | | 2,758,443 | | — |
For the year ended March 29, 2018, in-kind transactions associated with creations and redemptions were:
| | | | | | |
KraneShares Zacks New China ETF | | $ | 1,297,118 | | $ | — | | $ | — | |
KraneShares CSI China Internet ETF | | | 1,297,582,053 | | | 199,135,952 | | | 75,513,040 | |
KraneShares MSCI One Belt One Road Index ETF | | | 13,683,676 | | | — | | | — | |
KraneShares Emerging Markets Consumer Technology Index ETF | | | 15,492,605 | | | — | | | — | |
KraneShares MSCI China Environment Index ETF | | | 5,147,901 | | | 53,866 | | | (150 | ) |
KraneShares Electric Vehicles and Future Mobility Index ETF | | | 21,602,473 | | | — | | | — | |
KraneShares MSCI All China Health Care Index ETF | | | 983,213 | | | — | | | — | |
During the year ended March 29, 2018, there were no purchases or sales of long-term U.S. government securities for the Funds.
96
Notes to Financial Statements (continued)
5. TAX INFORMATION
The amount and character of income and capital gain distributions to be paid, if any, are determined in accordance with Federal income tax regulations, which may differ from U.S. GAAP. As a result, net investment income (loss) and net realized gain (loss) on investment transactions for a reporting period may differ significantly from distributions during such period. These book/tax differences may be temporary or permanent. To the extent these differences are permanent in nature, they are charged or credited to undistributed net investment income (loss), accumulated net realized gain (loss) or paid-in capital, as appropriate, in the period that the differences arise.
The following differences, primarily attributable to foreign currency, redemptions in-kind, reclass of distributions, sales of passive foreign investment companies, REIT reclass, and net operating losses, have been reclassified to/from the following accounts during the fiscal year ended March 29, 2018.
| | | | Undistributed (Distributions in Excess of) Net Investment Income | | Accumulated Net Realized Gain
(Loss) |
KraneShares Bosera MSCI China A Share ETF | | $ | — | | | $ | 218,903 | | | $ | (218,903 | ) |
KraneShares Zacks New China ETF | | | — | | | | 23,001 | | | | (23,001 | ) |
KraneShares CSI China Internet ETF | | | 72,817,011 | | | | 1,484,424 | | | | (74,301,435 | ) |
KraneShares E Fund China Commercial
Paper ETF | | | — | | | | 447,469 | | | | (447,469 | ) |
KraneShares FTSE Emerging Markets Plus ETF | | | — | | | | 1,633 | | | | (1,633 | ) |
KraneShares MSCI One Belt One Road Index ETF | | | — | | | | (8,180 | ) | | | 8,180 | |
KraneShares Emerging Markets Consumer Technology Index ETF | | | — | | | | 2,782 | | | | (2,782 | ) |
KraneShares MSCI China Environment Index ETF | | | (7,848 | ) | | | 7,523 | | | | 325 | |
KraneShares Electric Vehicles and Future Mobility Index ETF | | | — | | | | (12,688 | ) | | | 12,688 | |
KraneShares MSCI All China Health Care
Index ETF | | | — | | | | (529 | ) | | | 529 | |
These reclassifications have no impact on net assets or net asset value per share.
97
Notes to Financial Statements (continued)
The tax character of dividends and distributions paid during the years ended March 29, 2018 and March 31, 2017 were as follows:
| | | | | | | | |
KraneShares Bosera MSCI China A Share ETF | | | | | | | | | | | | |
2018 | | $ | 2,946,446 | | $ | — | | $ | — | | $ | 2,946,446 |
2017 | | | — | | | 127,486 | | | 437,353 | | | 564,839 |
| | | | | | | | | | | | |
KraneShares Zacks New China ETF | | | | | | | | | | | | |
2018 | | $ | 44,526 | | $ | 1,101,598 | | $ | — | | $ | 1,146,124 |
2017 | | | 32,656 | | | — | | | 38,008 | | | 70,664 |
| | | | | | | | | | | | |
KraneShares CSI China Internet ETF | | | | | | | | | | | | |
2018 | | $ | 7,001,175 | | $ | — | | $ | — | | $ | 7,001,175 |
2017 | | | 1,721,413 | | | — | | | 656,632 | | | 2,378,045 |
| | | | | | | | | | | | |
KraneShares E Fund China Commercial
Paper ETF | | | | | | | | | | | | |
2018 | | $ | — | | $ | — | | $ | — | | $ | — |
2017 | | | — | | | — | | | 6,584 | | | 6,584 |
| | | | | | | | | | | | |
KraneShares FTSE Emerging Markets
Plus ETF | | | | | | | | | | | | |
2018 | | $ | 32,628 | | $ | — | | $ | — | | $ | 32,628 |
2017 | | | 70,606 | | | 46,996 | | | 17,872 | | | 135,474 |
| | | | | | | | | | | | |
KraneShares MSCI One Belt One Road
Index ETF | | | | | | | | | | | | |
2018 | | $ | 6,687 | | $ | — | | $ | — | | $ | 6,687 |
| | | | | | | | | | | | |
KraneShares Emerging Markets Consumer Technology Index ETF | | | | | | | | | | | | |
2018 | | $ | — | | $ | — | | $ | — | | $ | — |
| | | | | | | | | | | | |
KraneShares MSCI China Environment Index ETF | | | | | | | | | | | | |
2018 | | $ | — | | $ | — | | $ | — | | $ | — |
| | | | | | | | | | | | |
KraneShares Electric Vehicles and Future Mobility Index ETF | | | | | | | | | | | | |
2018 | | $ | — | | $ | — | | $ | — | | $ | — |
| | | | | | | | | | | | |
KraneShares MSCI All China Health Care Index ETF | | | | | | | | | | | | |
2018 | | $ | — | | $ | — | | $ | — | | $ | — |
98
Notes to Financial Statements (continued)
As of March 29, 2018, the components of tax basis distributable earnings (accumulated losses) were as follows:
| | KraneShares
Bosera MSCI
China A
Share ETF | | KraneShares
Zacks New
China ETF | | KraneShares
CSI China
Internet ETF | | KraneShares
E Fund
China Commercial
Paper ETF | | KraneShares
FTSE
Emerging
Markets
Plus ETF |
Undistributed Ordinary
Income | | $ | 4,041,554 | | | $ | 21,899 | | | $ | — | | | $ | 324,836 | | | $ | 13,639 | |
Undistributed Long-Term Capital Gain | | | 712,126 | | | | 87,888 | | | | 44,976,086 | | | | — | | | | — | |
Capital Loss Carryforwards | | | — | | | | — | | | | — | | | | (41,317 | ) | | | (195,033 | ) |
Qualified Late-Year Loss Deferrals | | | — | | | | (6,954 | ) | | | (6,042,559 | ) | | | — | | | | — | |
Unrealized Appreciation (Depreciation) on Investments and Foreign Currency | | | 31,287,363 | | | | 312,727 | | | | 93,840,479 | | | | 505,868 | | | | 394,302 | |
Other Temporary Differences | | | (4 | ) | | | — | | | | 7 | | | | (3 | ) | | | — | |
Total Distributable Earnings (Accumulated Losses) | | $ | 36,041,039 | | | $ | 415,560 | | | $ | 132,774,013 | | | $ | 789,384 | | | $ | 212,908 | |
| | KraneShares MSCI
One Belt One Road Index ETF | | KraneShares Emerging Markets Consumer Technology Index ETF | | KraneShares MSCI
China Environment Index ETF | | KraneShares Electric Vehicles and Future Mobility Index ETF | | KraneShares MSCI
All China Health Care Index ETF |
Undistributed Ordinary Income | | $ | 73,891 | | | $ | — | | | $ | — | | | $ | 34,872 | | | $ | — | |
Undistributed Long-Term Capital Gain | | | — | | | | — | | | | — | | | | — | | | | — | |
Capital Loss Carryforwards | | | — | | | | (325 | ) | | | (10,254 | ) | | | (1,967 | ) | | | — | |
Qualified Late-Year Loss Deferrals | | | — | | | | (3,209 | ) | | | (13,176 | ) | | | — | | | | (4,114 | ) |
Unrealized Appreciation (Depreciation) on Investments and Foreign Currency | | | (1,106,858 | ) | | | (67,469 | ) | | | (362,660 | ) | | | (1,314,122 | ) | | | 169,630 | |
Other Temporary Differences | | | — | | | | (1 | ) | | | — | | | | — | | | | — | |
Total Distributable Earnings (Accumulated Losses) | | $ | (1,032,967 | ) | | $ | (71,004 | ) | | $ | (386,090 | ) | | $ | (1,281,217 | ) | | $ | 165,516 | |
Qualified late year ordinary and Post-October capital losses (including currency and specified gain/loss items) represent losses realized from Jan. 1, 2018 through March 29, 2018 and November 1, 2017 through March 29, 2018, respectively, that in accordance with federal income tax regulations, the Funds have elected to defer and treat as having arisen in the following fiscal year.
Under the Regulated Investment Company Modernization Act of 2010, the Funds are permitted to carry forward capital losses incurred in taxable years beginning after December 22, 2010 for an unlimited period. Post-enactment capital losses that are carried forward will retain their character
99
Notes to Financial Statements (continued)
as either short-term or long-term capital losses rather than being considered all short-term as under previous law. Losses carried forward under these new provisions are as follows:
| | | | | | |
KraneShares E Fund China Commercial Paper ETF | | $ | 41,317 | | $ | — | | $ | 41,317 |
KraneShares FTSE Emerging Markets Plus ETF | | | 3,107 | | | 191,926 | | | 195,033 |
KraneShares Emerging Markets Consumer Technology Index ETF | | | 325 | | | — | | | 325 |
KraneShares MSCI China Environment Index ETF | | | 10,254 | | | — | | | 10,254 |
KraneShares Electric Vehicles and Future Mobility Index ETF | | | 1,967 | | | — | | | 1,967 |
During the year ended March 29, 2018, KraneShares Bosera MSCI China A Share ETF, KraneShares Zacks New China ETF, KraneShares CSI China Internet ETF and KraneShares E Fund China Commercial Paper ETF utilized $511,878, $1,116, $9,490,738 and $17,034 of capital loss carryforwards, respectively, to offset capital gains.
The differences between book and tax-basis unrealized appreciation and depreciation are attributable primarily to the tax deferral of losses on wash sales and investments in passive foreign investment companies. The federal tax cost and aggregate gross unrealized appreciation and depreciation on investments held by the Funds at March 29, 2018 were as follows:
| | | | Aggregated Gross
Unrealized Appreciation | | Aggregated Gross
Unrealized Depreciation | | Net Unrealized Appreciation |
KraneShares Bosera MSCI China A Share ETF | | $ | 318,731,748 | | $ | 40,375,585 | | $ | (9,088,222 | ) | | $ | 31,287,363 | |
KraneShares Zacks New China ETF | | | 4,662,777 | | | 572,435 | | | (259,708 | ) | | | 312,727 | |
KraneShares CSI China Internet ETF | | | 1,614,262,985 | | | 183,656,778 | | | (89,816,299 | ) | | | 93,840,479 | |
KraneShares E Fund China Commercial Paper ETF | | | 12,263,103 | | | 508,202 | | | (2,334 | ) | | | 505,868 | |
KraneShares FTSE Emerging Markets Plus ETF | | | 2,263,461 | | | 578,255 | | | (183,953 | ) | | | 394,302 | |
KraneShares MSCI One Belt
One Road Index ETF | | | 31,166,258 | | | 830,068 | | | (1,936,926 | ) | | | (1,106,858 | ) |
KraneShares Emerging Markets Consumer Technology
Index ETF | | | 22,669,866 | | | 780,695 | | | (848,164 | ) | | | (67,469 | ) |
KraneShares MSCI China Environment Index ETF | | | 7,207,466 | | | 367,743 | | | (730,403 | ) | | | (362,660 | ) |
KraneShares Electric Vehicles and Future Mobility
Index ETF | | | 27,355,729 | | | 246,423 | | | (1,560,545 | ) | | | (1,314,122 | ) |
Kraneshares MSCI All China Healthcare Index ETF | | | 3,741,656 | | | 210,880 | | | (41,250 | ) | | | 169,630 | |
Uncertainties in the Chinese tax rules governing the taxation of income distributions and capital gains from investments in A Shares could result in unexpected tax liabilities for the Funds. China generally imposes withholding tax at a rate of 10% on dividends and interest derived by non-Chinese resident investors (including, for example, Qualified Foreign Institutional Investors (QFII)) from Chinese companies and those companies which are not Chinese tax residents, but which are deemed to be Chinese tax residents (e.g., under Notice 7). China also imposes withholding tax at a rate of 10% on capital gains derived by non-residents from investment in actual and constructive Chinese resident companies. The Chinese withholding taxes applied to
100
Notes to Financial Statements (continued)
dividends, interest and capital gains may, in principle, be subject to a reduced rate under an applicable Chinese tax treaty, but the application of such treaties in the case of a non-resident (e.g., in the case of a QFII acting on behalf of non-resident investors, such as the Funds) is also uncertain. The imposition of such taxes could have a material adverse effect on the Funds’ returns. The People’s Republic of China (the “PRC”) rules regarding the taxation of non-resident investors are quickly evolving and certain of the tax regulations to be issued by the PRC State Administration of Taxation and/or the PRC Ministry of Finance to clarify matters may apply retrospectively. Such retroactively applied rules may be adverse to the Funds and their shareholders. KraneShares E Fund China Commercial Paper ETF does not currently accrue or withhold taxes. The fund has adopted this general administrative practice due to the lack of clarity for application and remittance of the taxes. It is also unclear how China’s value added tax (“VAT”) may be affected by tax treaty provisions. If such a tax is collected, the expenses will be passed on and borne by the Funds. The imposition of such taxes, as well as future changes in applicable PRC tax law, may adversely affect the Funds. If the Funds expect VAT to be imposed, they reserve the right to establish a reserve for such tax. If the Funds establish such a reserve but are not ultimately subject to the tax, shareholders who redeemed or sold their shares while the reserve was in place will effectively bear the tax and may not benefit from the later release, if any, of the reserve. Conversely, if the Funds do not establish such a reserve but ultimately are subject to the tax, shareholders who redeemed or sold their shares prior to the tax being withheld, reserved or paid will have effectively avoided the tax, even if they benefited from investments in a Fund. Effective November 17, 2014, QFIIs, RQFIIs (i.e., QFIIs investing in Yuan, rather than foreign currency) and non-Chinese resident investors investing through the Hong Kong-Shanghai Stock Connect are exempted temporarily from the 10% capital gains tax that normally applies to sales of A Shares on a public Chinese exchange (such as the Shanghai Stock Exchange). However, such investors are still required to pay capital gains tax for gains realized on trades executed before November 17, 2014. The Funds have recorded capital gains tax for gains realized prior to November 17, 2014, and have reflected such taxes in the Statement of Assets and Liabilities.
6. CONCENTRATION OF RISKS
As with all ETFs, shareholders of the Funds are subject to the risk that their investment could lose money. The Funds are subject to the principal risks noted below, any of which may adversely affect a Fund’s NAV, trading price, yield, total return and ability to meet its investment objective. A more complete description of principal risks is included in each Fund’s prospectus under the heading “Principal Risks.”
CHINESE CREDIT RATINGS RISK — The debt securities included in Underlying Index securities, and therefore the securities held by the KraneShares E Fund China Commercial Paper ETF Fund, will generally be rated by Chinese ratings agencies (and not by U.S. nationally recognized statistical ratings organizations (“NRSROs”)). The rating criteria and methodology used by Chinese rating agencies may be different from those adopted by NRSROs and international credit rating agencies. Therefore, such rating systems may not provide an equivalent standard for comparison with securities rated by NRSROs or other international credit rating agencies.
FIXED INCOME SECURITIES RISK — Fixed income securities are subject to credit risk and interest rate risk. Credit risk refers to the possibility that the issuer of a security will not make timely interest payments or repay the principal of the debt issued (i.e., it defaults on its obligations).
101
Notes to Financial Statements (continued)
Interest rate risk refers to fluctuations in the value of a debt resulting from changes in the level of interest rates. When interest rates go up, the prices of most debt instruments go down; and when interest rates go down, the prices of most debt instruments go up. Debt instruments with longer durations tend to be more sensitive to interest rate changes, typically making them more volatile. The current low-interest-rate environment heightens the risks associated with rising interest rates.
FOREIGN SECURITIES RISK — Investments in securities of non-U.S. issuers may be less liquid than investments in U.S. issuers as foreign trading markets are not typically as active as U.S. markets and may have less governmental regulation and oversight. For example, non-U.S. issuers may be subject to different accounting, auditing, financial reporting and investor protection standards than U.S. issuers. As a result, there may be less information publicly available about non-U.S. issuers. Investments in non-U.S. securities also involve risk of loss due to foreign currency fluctuations and political or economic instability. Foreign markets also may have clearance and settlement procedures that make it difficult for the Funds to buy and sell securities. These factors could result in a loss to the Funds by causing the Funds to be unable to dispose of an investment or to miss an attractive investment opportunity, or by causing the Funds’ assets to be uninvested for some period of time.
GEOGRAPHIC FOCUS — The Funds’ investments will be focused in a particular country, countries, or region and therefore a Fund may be susceptible to adverse market, political, regulatory, and geographic events affecting that country, countries or region. Such geographic focus also may subject the Fund to a higher degree of volatility than a more geographically diversified fund.
INDEX RISK — Unlike many investment companies, the Funds do not utilize an investing strategy that seeks returns in excess of each Fund’s respective Underlying Index. Therefore, a Fund would not necessarily buy or sell a security unless that security is added or removed, respectively, from its respective Underlying Index, even if that security generally is underperforming.
INDUSTRY CONCENTRATION RISK — In following its methodology, each Fund’s Underlying Index from time to time may be concentrated to a significant degree in securities of issuers located in a single industry or group of industries. To the extent that an Underlying Index concentrates in the securities of issuers in a particular industry or group of industries, each Fund also is expected to concentrate its investments to approximately the same extent. If a Fund concentrates its investments in an industry, the Fund may face more risks than if it were diversified broadly over industries. In addition, at times, an industry or sector may be out of favor and underperforms other industries or the market as a whole. Any factors detrimental to the performance of such industry or sector may disproportionately impact a Fund’s NAV.
INVESTMENTS IN OTHER INVESTMENT COMPANIES — The Funds utilize a cash sweep program (the ‘‘Cash Sweep Program’’), whereby at least a portion of the Funds’ uninvested cash balances are expected to be used to purchase shares of money market funds. In addition, under the Cash Sweep Program, the KraneShares E Fund China Commercial Paper ETF is expected to invest at least a portion of its uninvested cash balance to purchase shares of funds that are registered in China, but not the United States (‘‘PRC Investment Companies’’). Investments in money market funds and the PRC Investment Companies are subject to the risks faced by them, which include credit risk and interest rate risk. Investments in PRC Investment Companies are also subject to currency risk, foreign investment risk, and custody risk. The PRC Investment Companies are PRC-domiciled funds, and to the extent that they or any fund is not registered pursuant to the
102
Notes to Financial Statements (continued)
1940 Act, the Funds will not enjoy the protections of the United States securities laws, including the 1940 Act, with respect to its investments in the PRC Investment Companies or other funds not registered in the United States.
The Funds may also invest in other investment companies. By doing so, the Funds are exposed to the risks of investments by such companies. Moreover, the Funds will incur their pro rata share of the underlying investment companies’ expenses.
The Funds may invest in investment companies that are sponsored or advised by the Adviser and/or Sub-Adviser. The Adviser and/or Sub-Adviser may be subject to conflicts of interest in allocating Fund assets to such funds if they derive fees or other benefits from the underlying funds.
LIQUIDITY RISK — Certain of the Funds’ investments may be or become difficult to purchase or sell at a reasonable time or price. If a transaction is particularly large or if the relevant market is or becomes illiquid, it may not be possible to initiate a transaction or liquidate a position at an advantageous time or price, which may cause the Funds to suffer significant losses and difficulties in meeting redemptions. If a number of securities held by the Funds halt trading, it may have a cascading effect and cause the Funds to halt trading. Volatility in market prices will increase the risk of the Funds being subject to a trading halt.
MARKET RISK — The values of the Funds’ holdings could decline generally or could underperform other investments. In addition, there is a risk that policy changes by the U.S. Government, Federal Reserve, and/or other government actors, such as continuing to raise interest rates, could cause increased volatility in global financial markets and higher levels of Fund redemptions, which could have a negative impact on the Funds. Further, the Funds are susceptible to the risk that certain investments may be difficult or impossible to sell at a favorable time or price. Market developments may cause the Funds’ investments to become less liquid and subject to erratic price movements. Such market developments may also cause the Funds to encounter difficulties in timely honoring redemptions, especially if market events cause an increased incidence of shareholder redemptions.
NON-CORRELATION RISK — Each Fund’s return may not match the return of its Underlying Index for a number of reasons. For example, each Fund incurs operating expenses not applicable to the Underlying Index, and incurs costs in buying and selling securities, especially when rebalancing the Fund’s securities holdings to reflect changes in the composition of its Underlying Index. The performance of each Fund and its Underlying Index may vary due to asset valuation differences and differences between each Fund’s portfolio and its Underlying Index resulting from legal restrictions, cost or liquidity constraints. Further, performance may diverge when a Fund employs a representative sampling, rather than a replication strategy.
NON-DIVERSIFICATION RISK — The KraneShares Zacks New China ETF, KraneShares CSI China Internet ETF, KraneShares E Fund China Commercial Paper ETF, KraneShares MSCI One Belt One Road Index ETF, KraneShares Emerging Markets Consumer Technology Index ETF, KraneShares MSCI China Environment Index ETF, KraneShares Electric Vehicles and Future Mobility Index ETF and KraneShares MSCI All China Health Care Index ETF are considered to be non-diversified, which means that they may invest more of their assets in the securities of a single issuer or a smaller number of issuers than if they were diversified funds. To the extent a Fund invests a significant percentage of its assets in a limited number of issuers, the Fund is subject to the risks of investing in those few issuers, and may be more susceptible to a single adverse economic or
103
Notes to Financial Statements (continued)
regulatory occurrence. As a result, changes in the market value of a single security could cause greater fluctuations in the value of Fund shares than would occur in a diversified fund.
VALUATION RISK — Independent market quotations for the non-U.S. securities held by the Funds may not be readily available and such securities may be fair valued. Fair valuation is subjective and different market participants may assign different prices to the same security. As a result, there is a risk that the Funds may not be able to sell a security at the price assigned to the security by the Fund. In addition, the securities in which the Funds invest may trade on days that the Funds do not price their shares; as a result, the value of Fund shares may change on days when investors cannot purchase or sell their holdings.
SECURITIES LENDING RISK — To the extent a Fund lends its securities, it may be subject to the following risks: (1) borrowers of the Funds’ securities typically provide collateral in the form of cash that is reinvested in securities; (2) the securities in which the collateral is invested may not perform sufficiently to cover the return collateral payments owed to borrowers; (3) delays may occur in the recovery of securities from borrowers, which could interfere with the Funds’ ability to vote proxies or to settle transactions; and (4) there is the risk of possible loss of rights in the collateral should the borrower fail financially.
7. OTHER
At March 29, 2018, the records of the Trust reflect all Shares outstanding created by Authorized Participants are in the form of Creation Units. However, the individual shares comprising such Creation Units are listed and traded on either the NYSE Arca or BATS Exchange, and a portion thereof have been purchased and sold by persons other than Authorized Participants. Each Authorized Participant has entered into an agreement with the Funds’ Distributor.
After the close of the markets on September 13, 2016, the KraneShares Zacks New China ETF effected a split of its issued and outstanding shares for shareholders of record on September 12, 2016. The effect of this transaction was to increase the number of outstanding shares of the Fund by a ratio of two-to-one, resulting in a corresponding decrease in the net asset value per share. The capital share activity presented in the Statements of Changes in Net Assets for the year ended March 31, 2017, and per share data in the financial highlights for the periods presented through March 31, 2017, have been given retroactive effect to reflect these share splits. There were no changes in net assets, results of operations or total return as a result of these transactions.
8. INDEMNIFICATIONS
In the normal course of business, the Funds enter into contracts that provide general indemnifications. The Funds’ maximum exposure under these arrangements is dependent on future claims that may be made against the Funds and, therefore, cannot be established; however, based on experience, the risk of loss from such claims is considered remote.
104
Notes to Financial Statements (concluded)
9. SUBSEQUENT EVENTS
As of May 17, 2018, the standard creation and redemption fees for each Fund are listed below.
| | | | Maximum variable transaction fee* |
KraneShares Bosera MSCI China A Share ETF | | | $5,800 | | 2.00 | % |
KraneShares Zacks New China ETF | | | 800 | | 2.00 | % |
KraneShares CSI China Internet ETF | | | 500 | | 2.00 | % |
KraneShares E Fund China Commercial Paper ETF | | | 1,000 | | 2.00 | % |
KraneShares FTSE Emerging Markets Plus ETF | | | 8,500 | | 2.00 | % |
KraneShares MSCI One Belt One Road Index ETF | | | 3,900 | | 2.00 | % |
KraneShares Emerging Markets Consumer Technology Index ETF | | | 1,500 | | 2.00 | % |
KraneShares MSCI China Environment Index ETF | | | 750 | | 2.00 | % |
KraneShares Electric Vehicles and Future Mobility Index ETF | | | 1,100 | | 2.00 | % |
KraneShares MSCI All China Healthcare Index ETF | | | 1,320 | | 2.00 | % |
The Funds have evaluated the need for additional disclosures and/or adjustments resulting from subsequent events. Based on this evaluation, other than the above, no additional disclosures or adjustments were required to the financial statements as of the date the financial statements were issued.
105
Report of Independent Registered Public Accounting Firm
To the Shareholders and Board of Trustees KraneShares Trust:
Opinion on the Financial Statements
We have audited the accompanying statements of assets and liabilities of KraneShares Bosera MSCI China A Share ETF, KraneShares Zacks New China ETF, KraneShares CSI China Internet ETF, KraneShares E Fund China Commercial Paper ETF, KraneShares FTSE Emerging Markets Plus ETF, KraneShares MSCI One Belt One Road Index ETF, KraneShares Emerging Markets Consumer Technology Index ETF, KraneShares MSCI China Environment Index ETF, KraneShares Electric Vehicles and Future Mobility Index ETF and KraneShares MSCI All China Health Care Index ETF (collectively, the Funds), including the schedules of investments, as of March 29, 2018, the related statements of operations for the year then ended and the statements of changes in net assets for each of the years in the two year period then ended for KraneShares Bosera MSCI China A Share ETF, KraneShares Zacks New China ETF, KraneShares CSI China Internet ETF, KraneShares E Fund China Commercial Paper ETF and KraneShares FTSE Emerging Markets Plus ETF, the statements of operations and changes in net assets from September 7, 2017 (commencement of operations) through March 29, 2018, for KraneShares MSCI One Belt One Road Index ETF, the statements of operations and changes in net assets from October 11, 2017 (commencement of operations) through March 29, 2018, for KraneShares Emerging Markets Consumer Technology Index ETF, the statements of operations and changes in net assets from October 12, 2017 (commencement of operations) through March 29, 2018, for KraneShares MSCI China Environment Index ETF, the statements of operations and changes in net assets from January 18, 2018 (commencement of operations) through March 29, 2018, for KraneShares Electric Vehicles and Future Mobility Index ETF, the statements of operations and changes in net assets from January 31, 2018 (commencement of operations) through March 29, 2018, for KraneShares MSCI All China Health Care Index ETF and the related notes (collectively, the financial statements) and the financial highlights for each of the years or periods in the two year period then ended. In our opinion, the financial statements and financial highlights present fairly, in all material respects, the financial position of each of the Funds comprising KraneShares Trust as of March 29, 2018, the results of their operations for the year or period then ended, the changes in their net assets for each of the years or periods in the two year period then ended, and the financial highlights for each of the years or periods in the two year period then ended, in conformity with U.S. generally accepted accounting principles. The financial highlights for the periods presented through March 31, 2016 were audited by other independent registered public accountants whose report, dated May 31, 2016, expressed an unqualified opinion on those financial highlights.
Basis for Opinion
These financial statements and financial highlights are the responsibility of the Funds’ management. Our responsibility is to express an opinion on these financial statements and financial highlights based on our audits. We are a public accounting firm registered with the Public Company Accounting Oversight Board (United States) (PCAOB) and are required to be independent with respect to the Funds in accordance with the U.S. federal securities laws and the applicable rules and regulations of the Securities and Exchange Commission and the PCAOB.
We conducted our audits in accordance with the standards of the PCAOB. Those standards require that we plan and perform the audit to obtain reasonable assurance about whether the financial statements and financial highlights are free of material misstatement, whether due to error or fraud. Our audits included performing procedures to assess the risks of material misstatement of
106
Report of Independent Registered Public Accounting Firm (concluded)
the financial statements and financial highlights, whether due to error or fraud, and performing procedures that respond to those risks. Such procedures included examining, on a test basis, evidence regarding the amounts and disclosures in the financial statements and financial highlights. Such procedures also included confirmation of securities owned as of March 29, 2018, by correspondence with the custodian, transfer agent, and brokers or by other appropriate auditing procedures where replies from brokers were not received. Our audits also included evaluating the accounting principles used and significant estimates made by management, as well as evaluating the overall presentation of the financial statements and financial highlights. We believe that our audits provide a reasonable basis for our opinion.

We have served as the auditor of one or more KraneShares investment companies since 2017.
Philadelphia, Pennsylvania
May 25, 2018
107
Trustees and Officers of the Trust (Unaudited)
March 29, 2018
Set forth below are the names, addresses, years of birth, positions with the Trust, terms of office and lengths of time served; the principal occupations for the last five years; number of Funds in fund complex overseen; and other directorships outside the fund complex of each of the persons currently serving as Trustees and Officers of the Trust. The Trust’s Statement of Additional Information (“SAI”) includes additional information about the Trustees and Officers. The SAI may be obtained without charge, upon request, by calling 1-855-857-2638. The following chart lists Trustees and Officers as of March 29, 2018.
Name, Address
(Year of Birth) | | Position(s) Held
with Funds | | Principal Occupation(s) During the Past 5 Years | | Number of
Funds in Trust Overseen by Trustee | | Other Directorships Held by Trustee |
Interested Trustee(2) |
Jonathan Krane1
1270 Avenue of the Americas, 22nd Floor
New York, NY 10020 (1968) | | Trustee and Chairman of the Board, No set
term; served
since 2012 | | Chief Executive Officer of Krane Funds Advisors, LLC from May 2011 to present. Principal of Krane Capital LLC from June 2009 to 2011. | | 15 | | None |
|
Independent Trustees(2) |
John Ferguson
1270 Avenue of the Americas, 22nd Floor
New York, NY 10020 (1966) | | Trustee, No set
term; served
since 2012 | | Chief Operating Officer of Shrewsbury River Capital from 2017 to present. Chief Operating Officer of Kang Global Investors LP (hedge fund adviser) from May 2014 to 2016. President of Alden Global Capital, LLC (hedge fund adviser) from April 2012 to April 2014 (formerly, Chief Operating Officer from November 2011 to April 2012). | | 15 | | None |
| | | | | | | | |
Matthew Stroyman
1270 Avenue of the Americas, 22nd Floor New York, NY 10020 (1968) | | Trustee, No set
term; served
since 2012 | | Co-Founder, President and Chief Operating Officer of Arcturus (real estate asset and investment management services firm) from September 2007 to present. | | 15 | | None |
| | | | | | | | |
Patrick P. Campo
1270 Avenue of the Americas, 22nd Floor New York, NY 10020 (1970) | | Trustee, No set
term; served
since 2017 | | From 2013 to present, Director of Long Short Equity, Titan Advisors; from 2009 to 2013, Director of Hedge Fund Research, Alternative Investment Management, LLC. | | 15 | | None |
108
Trustees and Officers of the Trust (Unaudited) (concluded)
March 29, 2018
Name, Address
(Year of Birth) | | Position(s) Held
with Funds | | Principal Occupation(s)
During the Past 5 Years | | Number of
Funds
in Trust
Overseen by
Officer | | Other Directorships Held by
Officer |
Officers(2) |
Jonathan Krane
1270 Avenue of the Americas, 22nd Floor New York, NY 10020 (1968) | | Principal Executive Officer and Principal Financial Officer, No set term; served since 2012 | | Chief Executive Officer of Krane Funds Advisors, LLC from May 2011 to present. Principal of Krane Capital LLC from June 2009 to 2011. | | 15 | | None |
| | | | | | | | |
Jennifer Tarleton
(formerly Krane)
1270 Avenue of the Americas, 22nd Floor New York, NY 10020 (1966) | | Vice President and Secretary,
No set term; served
since 2012 | | Principal of Krane Capital LLC from June 2009 to 2011. Vice President of Krane Funds Advisors, LLC from May 2011 to present. | | 15 | | None |
| | | | | | | | |
Michael Quain
1270 Avenue of the Americas, 22nd Floor New York, NY 10020 (1957) | | Chief
Compliance Officer and Anti-Money Laundering Officer, No
set term;
served since
June 2015 | | Principal/President of Quain Compliance Consulting, LLC from February 2014 to present. First Vice President of Aberdeen Asset Management Inc. from May 2013 to September 2013. First Vice President and Chief Compliance Officer of Artio Global Management, LLC from September 2004 to May 2013. | | 15 | | None |
| | | | | | | | |
James Hoffmayer (3)
SEI Investments
Company One Freedom Valley Drive Oaks, PA 19456 (1973) | | Assistant Treasurer, No set term; served since 2017 | | Controller and Chief Financial Officer of SEI Investments Global Funds Services from 2016 to present. Senior Director, Funds Accounting and Fund Administration of SEI Investments Global Funds Services from September 2016 to present. Senior Director of Fund Administration of SEI Investments Global Funds Services from October 2014 to present. Director of Financial Reporting of SEI Investments Global Funds Services from November 2004 to October 2014. | | 15 | | None |
109
Approval of Advisory Agreements & Board Considerations (Unaudited)
At an in-person meeting on June 7, 2017, the Board of Trustees (“Board”) of the KraneShares Trust (“Trust”), including a majority of the Trustees who are not “interested persons” of the Trust (“Independent Trustees”), approved the advisory agreement between Krane Funds Advisors, LLC (“Krane”) and the Trust with respect to the KraneShares MSCI China Environment Index ETF, KraneShares Emerging Markets Consumer Focus Index ETF (on July 25, 2017, the Board approved a name change, renaming the Fund the KraneShares FTSE Emerging Markets Consumer Technology ETF), KraneShares MSCI One Belt One Road Index ETF and KraneShares Bloomberg Barclays China Aggregate Bond Index ETF (collectively, “New Funds”) (“Agreement”). In advance of the meeting, the Board received and considered information relating to the Agreement, and was given the opportunity to ask questions and request additional information. In reviewing the Agreement, the Board considered that the evaluation process with respect to Krane is an ongoing one and, in this regard, noted that it considers information at each regularly scheduled meeting regarding, among other matters, the services provided by Krane to the operational series of the Trust, and information provided outside of the Board meetings. In this regard, the Board’s consideration of the Agreement included information previously received at such meetings, including its meeting on October 5, 2016, at which the Board considered and renewed the existing advisory agreement between Krane and the Trust with respect to the operational series of the Trust, and outside of the meetings.
In evaluating the Agreement, the Board considered, among other matters: (1) the nature, extent and quality of the services to be provided by Krane; (2) the proposed advisory fees and estimated total expense ratios of the New Funds; (3) the estimated costs of the services to be provided by Krane and Krane’s profitability expectations with respect to its relationship with the New Funds; (4) the extent to which economies of scale would be realized as the New Funds grow and whether the Agreement would enable investors to share in the benefits of economies of scale; and (5) other benefits Krane anticipated it may receive from its relationship with the New Funds.
Nature, Extent and Quality of Services. Based on the written and oral reports received by the Board prior to and at the June 7, 2017 meeting and a presentation from senior representatives of Krane at the June 7, 2017 meeting, the Board considered the nature, quality and extent of the overall services to be provided by Krane under the Agreement. In this connection, the Board considered the responsibilities of Krane. The Board discussed Krane’s resources available to the management of the New Funds and recognized that Krane had invested significant time and effort in structuring the Trust and the New Funds, obtaining the necessary exemptive relief from the Securities and Exchange Commission (“SEC”), assessing the market appeal of each New Fund’s investment strategy and arranging service providers. In addition, the Board observed that Krane had agreed to bear many of the New Funds’ expenses under a unitary fee arrangement. The Board considered that Krane would be responsible for establishing and monitoring each New Fund’s investment program and carrying out directives of the Board and that Krane will manage the day-to-day investment activities of the New Funds. Further, the Board considered the securities-lending services that Krane may provide to the New Funds under the Agreement. In addition, the Board evaluated its experience with and the information previously provided by Krane regarding Krane’s services to the operational series of the Trust and the resources and financial condition of Krane. The Board noted that it also would continue to routinely monitor such matters. Based on its review and other considerations, the Board determined, in the exercise of its reasonable business judgment, that the nature, quality and extent of the services to be provided by Krane are appropriate for the New Funds.
110
Approval of Advisory Agreements & Board Considerations (Unaudited) (continued)
Investment Performance. The Board noted that, because the New Funds had not yet commenced investment operations, they had no investment performance. The Board considered that, at its future regular meetings, it would monitor and receive reports regarding the performance of the New Funds once they commence operations. The Board also considered its experience with Krane’s management of the operational series of the Trust that pursue different investment strategies.
Based on the information provided to it, the Board determined, in its reasonable business judgment, that engaging Krane could benefit the New Funds and their shareholders
Fees and Expenses. The Board reviewed and considered Krane’s proposed advisory fees in light of the nature, quality and extent of the services to be provided by Krane. The Board considered that Krane had agreed to entered into a unitary advisory fee arrangement with respect to the New Funds, under which Krane, and not the New Funds, will be responsible for paying many of the New Funds’ expenses, including those of the New Funds’ principal service providers.
The Board considered Krane’s proposed compensation under the Agreement with respect to each New Fund. It also considered information provided to it by Krane comparing such compensation to the compensation paid by funds (“peer group funds”) identified by Krane as comparable, which indicated that Krane’s proposed compensation with respect to each New Fund was on the high end of the range of compensation paid by each New Fund’s peer group funds. In this regard, the Board noted Krane’s representation that each New Fund would pursue a relatively specialized strategy and would offer unique investment exposure for shareholders. The Board also considered the compensation paid and to be paid to Krane by the operational series of the Trust, which currently are Krane’s only advisory clients, as compared to the New Funds. In addition, the Board contemplated the compensation Krane may receive under the Agreement related to the securities lending-related services it provides to the New Funds.
The Board also analyzed the anticipated impact of the proposed “unitary” advisory fee arrangement on the New Funds’ anticipated total expense ratios, with consideration being given to the level of non-advisory expenses borne by the operational series of the Trust.
Based on these and other considerations, the Board, in the exercise of its reasonable business judgment, determined that the fees and estimated expenses of the New Funds under the Agreement are reasonable.
Costs and Profitability. The Board considered the estimated cost of services and profitability of Krane with respect to the New Funds. The Board noted that, because the New Funds had not yet launched, it was difficult to estimate how profitable they would be to Krane. The Board, however, received information from Krane regarding when Krane expected its services to the New Funds to become profitable. The Board also considered the information previously provided to it by Krane regarding its cost of services and profitability with respect to the operational series of the Trust and the similarities and differences between those series and the New Funds. The Board noted Krane’s commitment to the New Funds and its proposal of a unitary fee structure under which it bears many of the New Funds’ expenses.
Under the totality of the circumstances, the Board concluded in the exercise of its reasonable business judgment, that Krane’s profitability with respect to the New Funds is reasonable.
Other Benefits. The Board considered the extent to which Krane would derive ancillary benefits from the New Funds’ operations, including potential benefits to Krane as a result of its ability to
111
Approval of Advisory Agreements & Board Considerations (Unaudited) (continued)
use New Fund assets to engage in soft dollar transactions and its ability to earn fees related to securities lending transactions. In considering such matters, the Board considered the information provided by Krane at the October 5, 2016 meeting regarding the ancillary benefits received by Krane with respect to the operational series of the Trust and Krane’s representation that the nature of the ancillary benefits Krane expected to receive from its relationship with the New Funds was expected to be similar. In addition, the Board considered that Krane could potentially benefit from any New Fund trades conducted through a broker-dealer affiliated with Krane.
Based on the materials provided to the Board, the Board determined that any other benefits realized by Krane from its relationship with the New Funds were not a material factor to be considered in connection with the approval of the Agreement.
Economies of Scale. The Board considered whether Krane would realize economies of scale with respect to its services to the New Funds as they grow larger, including the extent to which this would be reflected in the level of fees to be paid by the New Funds to Krane. The Board noted that the proposed advisory fees for the New Funds do not include breakpoints, but that it was not possible - before the commencement of investment operations - to accurately evaluate potential economies of scale. Based on these and other considerations, including that the New Funds were newly organized, the Board generally concluded that it would monitor for potential economies of scale in the future.
The Board thus determined to continue monitoring for potential economies of scale, and concluded that, at present, they were not a material factor for the Board to consider..
Conclusion. The Board did not identify any single factor as being of paramount importance, and different Trustees may have given different weight to different factors. The Board reviewed a memorandum from Trustee counsel discussing the legal standards applicable to its consideration of the Agreement. The Board noted that, once the New Funds become operational, it would continue to monitor the New Funds at its regular meetings and outside of the Board meetings. Based on its review, including consideration of each of the factors referenced above, the Board determined, in the exercise of its reasonable business judgment, that the advisory arrangements, as outlined in the Agreement, were reasonable in light of the factors considered by the Board.
* * *
At an in-person meeting on November 15, 2017, the Board of Trustees (“Board”) of the KraneShares Trust (“Trust”), including a majority of the Trustees who are not “interested persons” of the Trust, approved the advisory agreement between Krane Funds Advisors, LLC (“Krane”) and the Trust with respect to the KraneShares CCBS China Corporate High Yield Bond USD Index ETF (“KCCB”), KraneShares MSCI All China Consumer Discretionary Index ETF, KraneShares MSCI All China Consumer Staples Index ETF, KraneShares MSCI All China Health Care Index ETF, KraneShares Future Vehicle Index ETF (on January 4, 2018, the Board approved a name change, renaming the Fund the KraneShares Electric Vehicles and Future Mobility Index ETF) and KraneShares Emerging Markets Healthcare Index ETF (collectively, the “New Funds”) (the “Advisory Agreement”) and the portfolio management agreement between Krane and CCB Securities Ltd. (“CCBS”) with respect to KCCB (“Subadvisory Agreement” and, together with the Advisory Agreement, the “Agreements”). In advance of the meeting, the Board received and considered information relating to the Agreements, and was given the opportunity to ask questions and request additional information. In reviewing the Agreements, the Board considered that the evaluation process with respect to
112
Approval of Advisory Agreements & Board Considerations (Unaudited) (continued)
Krane and CCBS is an ongoing one and, in this regard, noted that it considers information at each regularly scheduled meeting regarding, among other matters, the services provided by Krane to the operational series of the Trust and would continue to consider similar information regarding Krane and CCBS at future meetings of the Board. The Board also considered information provided outside of the Board meetings.
In evaluating the Agreements, the Board considered, among other matters: (1) the nature, extent and quality of the services to be provided by Krane and CCBS, as applicable; (2) the proposed advisory and sub-advisory fees and estimated total expense ratios of the New Funds; (3) the estimated costs of the services to be provided by Krane and Krane’s profitability expectations with respect to its relationship with the New Funds; (4) the extent to which economies of scale would be realized as the New Funds grow and whether the Advisory Agreement would enable investors to share in the benefits of economies of scale; and (5) other benefits Krane and CCBS anticipated they may receive from their relationship with the New Funds.
Nature, Extent and Quality of Services. Based on the written and oral reports received by the Board prior to and at the November 15, 2017 meeting and a presentation from senior representatives of Krane at the November 15, 2017 meeting, the Board considered the nature, quality and extent of the overall services to be provided by Krane under the Advisory Agreement and CCBS under the Sub-Advisory Agreement. In this connection, the Board considered the responsibilities of Krane and CCBS under such Agreements. The Board discussed Krane’s and CCBS’s resources available to the management of the New Funds. It recognized that Krane had invested significant time and effort in structuring the Trust and the New Funds, obtaining the necessary exemptive relief from the Securities and Exchange Commission, assessing the market appeal of each New Fund’s investment strategy and arranging service providers. It also considered the financial conditions of Krane and CCBS.
The Board observed that Krane had agreed to bear many of the New Funds’ expenses under a unitary fee arrangement. The Board considered that Krane would be responsible for establishing and monitoring each New Fund’s investment program and carrying out directives of the Board and that Krane and CCBS, as applicable, would be responsible for the day-to-day investment activities of the New Funds. Further, the Board considered the securities-lending services that Krane may provide to the New Funds under the Advisory Agreement.
In considering the Agreements, the Board evaluated its experience with and the information previously provided by Krane. The Board also considered Krane’s analysis and recommendation of CCBS to serve as the sub-adviser for KCCB. Based on its review and other considerations, the Board determined, in the exercise of its reasonable business judgment, that the nature, quality and extent of the services to be provided by Krane and CCBS are appropriate for the New Funds.
Investment Performance. The Board noted that, because the New Funds had not yet commenced investment operations, they had no investment performance. The Board considered that, once the New Funds commence operations, it will receive regular reports regarding the performance of each New Fund and the tracking error of each New Fund compared to its peer funds. The Board also considered its experience with Krane’s management of the operational series of the Trust that pursue different investment strategies and Krane’s and CCBS’s representations regarding CCBS’s experience in the investment management industry.
113
Approval of Advisory Agreements & Board Considerations (Unaudited) (continued)
Based on the information provided to it, the Board determined, in its reasonable business judgment, that engaging Krane and CCBS could benefit the New Funds and their shareholders.
Fees and Expenses. The Board reviewed and considered the compensation to be received by Krane and CCBS under the Agreements in light of the nature, quality and extent of the services to be provided by each of them. The Board received written and oral presentations from Krane prior to and at the November 15, 2017 meeting and had the opportunity to ask questions of senior representatives of Krane at the November 15, 2017 meeting. In this regard, the Board noted Krane’s representation that each New Fund would offer unique investment exposure for shareholders. The Board considered that Krane had agreed to enter into a unitary advisory fee arrangement with respect to the New Funds, under which Krane, and not the New Funds, will be responsible for paying many of the New Funds’ expenses, including those of the New Funds’ principal service providers and CCBS.
The Board considered Krane’s representations regarding the competitive marketplace for the New Funds, including Krane’s evaluation of its fees compared to other market participants. The Board also considered the compensation paid and to be paid to Krane by the operational series of the Trust, which currently are Krane’s only advisory clients, as compared to the New Funds. The Board recognized that Krane may receive additional compensation under the Advisory Agreement resulting from any securities lending-related services it provides to the New Funds. With respect to CCBS, the Board considered that CCBS does not currently manage any accounts comparable to KCCB.
In light of their experience with Krane’s management of the operational series of the Trust, the Board evaluated the impact of the proposed “unitary” advisory fee arrangement on the New Funds’ anticipated total expense ratios. They noted that historically Krane has carefully monitored the level of expenses borne by the series of the Trust and that the Board routinely receives reports detailing the expense ratios of the operational series of the Trust and that similar routine reports will be provided for the New Funds.
Based on these and other considerations, the Board, in the exercise of its reasonable business judgment, determined that the compensation to be received by Krane and CCBS under the Agreements and the estimated expenses of the New Funds were reasonable.
Costs and Profitability. The Board considered the estimated cost of services and profitability of Krane with respect to the New Funds. The Board noted that, because the New Funds had not yet launched, it was difficult to estimate how profitable they would be to Krane. The Board, however, received information from Krane regarding the range of assets each New Fund was expected to gather, Krane’s anticipated profitability within those ranges and at what level of assets Krane expected its services to the New Funds to become profitable. The Board also considered the information previously provided to it by Krane regarding the cost of its services and profitability with respect to the operational series of the Trust and the similarities and differences between those series and the New Funds. The Board noted Krane’s commitment to the New Funds and its proposal of a unitary fee structure under which it bears many of the New Funds’ expenses.
The Board did not consider information regarding the anticipated costs of services provided or profits to be realized by CCBS from its relationship with KCCB, noting instead the arm’s-length nature of the relationship between Krane and CCBS with respect to the negotiation of the sub-advisory fee rate with respect to KCCB and that Krane, and not KCCB, was responsible for paying CCBS’s compensation under the Subadvisory Agreement.
114
Approval of Advisory Agreements & Board Considerations (Unaudited) (concluded)
Under the totality of the circumstances, the Board concluded in the exercise of its reasonable business judgment, that Krane’s anticipated profitability with respect to the New Funds was reasonable.
Other Benefits. The Board considered the extent to which Krane and CCBS would derive ancillary benefits from the New Funds’ operations, including potential benefits to Krane as a result of its ability to use New Fund assets to engage in soft dollar transactions. In considering such matters, the Board considered Krane’s representation that the nature of the ancillary benefits Krane expected to receive from its relationship with the New Funds was expected to be similar as those it received with respect to the operational series of the Trust. In addition, the Board considered that Krane could potentially benefit from any New Fund trades conducted in the future through a broker-dealer affiliated with the majority owner of Krane.
Based on the materials provided to the Board, the Board determined that any other benefits realized by Krane and CCBS from their relationship with the New Funds were not a material factor to be considered in connection with the approval of the Agreements.
Economies of Scale. The Board considered whether Krane would realize economies of scale with respect to its services to the New Funds as they grow larger, including the extent to which this would be reflected in the level of fees to be paid by the New Funds to Krane. The Board noted that the proposed advisory fees for the New Funds do not include breakpoints, but that it was not possible - before the commencement of investment operations - to accurately evaluate potential economies of scale. Based on these and other considerations, including that the New Funds were newly organized, the Board generally concluded that it would monitor for potential economies of scale with respect to Krane’s services to the New Funds under the Advisory Agreement in the future. The Board did not consider whether CCBS would realize economies of scale with respect to its services to KCCB given the arm’s-length nature of the relationship between Krane and CCBS and that Krane, and not KCCB, would pay CCBS’s compensation under the Subadvisory Agreement.
The Board thus determined to continue monitoring for potential economies of scale, and concluded that, at present, they were not a material factor for the Board to consider.
Conclusion. The Board did not identify any single factor as being of paramount importance, and different Trustees may have given different weight to different factors. The Board reviewed a memorandum from Trustee counsel discussing the legal standards applicable to its consideration of the Agreements. The Board noted that, once the New Funds become operational, it would continue to monitor the New Funds at its regular meetings and outside of the Board meetings. Based on its review, including consideration of each of the factors referenced above, the Board determined, in the exercise of its reasonable business judgment, that the advisory and sub-advisory arrangements, as outlined in the Agreements, were reasonable in light of the factors considered by the Board.
115
Disclosure of Fund Expenses (Unaudited)
As a shareholder of a Fund, you incur two types of costs: (1) transaction costs, including brokerage expenses; and (2) ongoing costs. All Exchange Traded Funds (“ETFs”) have operating expenses. As a shareholder of an ETF, your investment is affected by these ongoing costs, which include (among others) costs for ETF management, administrative services, commissions, and shareholder reports like this one. It is important for you to understand the impact of these costs on your investment returns. In addition, a shareholder is responsible for brokerage fees as a result of their investment in the Fund.
Operating expenses such as these are deducted from an ETF’s gross income and directly reduce its final investment return. These expenses are expressed as a percentage of the ETF’s average net assets; this percentage is known as the ETF’s expense ratio.
The following examples use the expense ratio and are intended to help you understand the ongoing costs (in dollars) of investing in your Fund and to compare these costs with those of other funds. The examples are based on an investment of $1,000 made at the beginning of the period shown and held for the entire period (October 1, 2017 to March 29, 2018).
The table on the next page illustrates your Fund’s costs in two ways:
Actual Fund Return. This section helps you to estimate the actual expenses that your Fund incurred over the period. The “Expenses Paid During Period” column shows the actual dollar expense cost incurred by a $1,000 investment in the Fund, and the “Ending Account Value” number is derived from deducting that expense cost from the Fund’s gross investment return.
You can use this information, together with the actual amount you invested in the Fund, to estimate the expenses you paid over that period. Simply divide your actual account value by $1,000 to arrive at a ratio (for example, an $8,600 account value divided by $1,000 = 8.6), then multiply that ratio by the number shown for your Fund under “Expenses Paid During Period.”
Hypothetical 5% Return. This section helps you compare your Fund’s costs with those of other funds. It assumes that the Fund had an annual 5% return before expenses during the year, but that the expense ratio (Column 3) for the period is unchanged. This example is useful in making comparisons because the Securities and Exchange Commission requires all funds to make this 5% calculation. You can assess your Fund’s comparative cost by comparing the hypothetical result for your Fund in the “Expenses Paid During Period” column with those that appear in the same charts in the shareholder reports for other funds.
NOTE: Because the return is set at 5% for comparison purposes — NOT your Fund’s actual return — the account values shown may not apply to your specific investment.
Please note that the expenses shown in the table are meant to highlight your ongoing costs only and do not reflect any transactional costs, including brokerage commissions on the purchases and sale of Fund shares. Therefore, the expense examples are useful in comparing ongoing costs only, and will not help you determine the relative total costs of owning different funds. If these transactional costs had been included, your costs would have been higher.
116
Disclosure of Fund Expenses (Unaudited) (concluded)
| | Beginning
Account Value 10/1/2017 | | Ending
Account Value 3/29/2018 | | | | Expenses
Paid During Period(1) |
KraneShares Bosera MSCI China A Share ETF | | | | | | | | | | | | | |
Actual Fund Return | | $ | 1,000.00 | | $ | 1,052.20 | | 0.60 | % | | $ | 3.07 | |
Hypothetical 5% Return | | | 1,000.00 | | | 1,021.94 | | 0.60 | | | | 3.02 | |
| | | | | | | | | | | | | |
KraneShares Zacks New China ETF | | | | | | | | | | | | | |
Actual Fund Return | | $ | 1,000.00 | | $ | 1,036.90 | | 0.69 | % | | $ | 3.50 | |
Hypothetical 5% Return | | | 1,000.00 | | | 1,021.49 | | 0.69 | | | | 3.48 | |
| | | | | | | | | | | | | |
KraneShares CSI China Internet ETF | | | | | | | | | | | | | |
Actual Fund Return | | $ | 1,000.00 | | $ | 1,084.20 | | 0.69 | % | | $ | 3.59 | |
Hypothetical 5% Return | | | 1,000.00 | | | 1,021.49 | | 0.69 | | | | 3.48 | |
| | | | | | | | | | | | | |
KraneShares E Fund China Commercial Paper ETF | | | | | | | | | | | | | |
Actual Fund Return | | $ | 1,000.00 | | $ | 1,076.60 | | 0.56 | % | | $ | 2.90 | |
Hypothetical 5% Return | | | 1,000.00 | | | 1,022.14 | | 0.56 | | | | 2.82 | |
| | | | | | | | | | | | | |
KraneShares FTSE Emerging Markets Plus ETF | | | | | | | | | | | | | |
Actual Fund Return | | $ | 1,000.00 | | $ | 1,060.50 | | 0.61 | % | | $ | 3.13 | |
Hypothetical 5% Return | | | 1,000.00 | | | 1,021.89 | | 0.61 | | | | 3.07 | |
| | | | | | | | | | | | | |
KraneShares MSCI One Belt One Road Index ETF | | | | | | | | | | | | | |
Actual Fund Return | | $ | 1,000.00 | | $ | 1,048.50 | | 0.79 | % | | $ | 3.98 | |
Hypothetical 5% Return | | | 1,000.00 | | | 1,021.04 | | 0.79 | % | | | 3.93 | |
| | | | | | | | | | | | | |
KraneShares Emerging Markets Consumer Technology Index ETF | | | | | | | | | | | | | |
Actual Fund Return | | $ | 1,000.00 | | $ | 1,059.20 | | 0.78 | % | | $ | 3.74 | (2) |
Hypothetical 5% Return | | | 1,000.00 | | | 1,019.65 | | 0.78 | | | | 3.93 | |
| | | | | | | | | | | | | |
KraneShares MSCI China Environment Index ETF | | | | | | | | | | | | | |
Actual Fund Return | | $ | 1,000.00 | | $ | 954.40 | | 0.78 | % | | $ | 3.53 | (3) |
Hypothetical 5% Return | | | 1,000.00 | | | 1,019.54 | | 0.78 | | | | 3.93 | |
| | | | | | | | | | | | | |
KraneShares Electric Vehicles and Future Mobility Index ETF | | | | | | | | | | | | | |
Actual Fund Return | | $ | 1,000.00 | | $ | 932.00 | | 0.69 | % | | $ | 1.30 | (4) |
Hypothetical 5% Return | | | 1,000.00 | | | 1,008.38 | | 0.69 | | | | 3.45 | |
| | | | | | | | | | | | | |
Kraneshares MSCI All China Healthcare Index ETF | | | | | | | | | | | | | |
Actual Fund Return | | $ | 1,000.00 | | $ | 1,066.00 | | 0.79 | % | | $ | 1.30 | (5) |
Hypothetical 5% Return | | | 1,000.00 | | | 1,006.69 | | 0.79 | | | | 3.95 | |
117
Notice to Shareholders (Unaudited)
For shareholders that do not have a March 29, 2018 tax year end, this notice is for informational purposes only. For shareholders with a March 29, 2018 tax year end, please consult your tax advisor as to the pertinence of this notice. For the fiscal year ended March 29, 2018, the Funds are designating the following items with regard to distributions paid during the year.
| | Long-Term Capital Gain Distributions | | Ordinary Income Distributions | | | | Qualifying for Corporate Dividends Received Deduction(2) | | Qualifying Dividend Income(3) | | U.S. Government Interest(4) | | Interest Related Dividends(5) | | Short Term Capital Gain Dividends(6) | | |
KraneShares Bosera MSCI China A Share ETF(7) |
0.00% | | 0.00 | % | | 100.00 | % | | 100.00 | % | | 0.00 | % | | 43.75 | % | | 0.00 | % | | 0.28 | % | | 100.00 | % | | 10.22 | % |
KraneShares Zacks New China ETF(7) |
0.00% | | 95.63 | % | | 4.37 | % | | 100.00 | % | | 0.00 | % | | 80.78 | % | | 0.00 | % | | 0.68 | % | | 0.00 | % | | 0.50 | % |
KraneShares CSI China Internet ETF |
0.00% | | 0.00 | % | | 100.00 | % | | 100.00 | % | | 0.00 | % | | 20.51 | % | | 0.00 | % | | 0.58 | % | | 0.00 | % | | 0.00 | % |
KraneShares E Fund China Commercial Paper ETF |
0.00% | | 0.00 | % | | 0.00 | % | | 0.00 | % | | 0.00 | % | | 0.00 | % | | 0.00 | % | | 0.00 | % | | 0.00 | % | | 0.00 | % |
KraneShares FTSE Emerging Markets Plus ETF(7) |
0.00% | | 0.00 | % | | 100.00 | % | | 100.00 | % | | 6.78 | % | | 100.00 | % | | 0.00 | % | | 0.39 | % | | 0.00 | % | | 15.58 | % |
KraneShares MSCI One Belt One Road Index ETF(7) |
0.00% | | 0.00 | % | | 100.00 | % | | 100.00 | % | | 0.41 | % | | 85.92 | % | | 0.00 | % | | 0.00 | % | | 0.00 | % | | 63.88 | % |
KraneShares Emerging Markets Consumer Technology Index ETF |
0.00% | | 0.00 | % | | 0.00 | % | | 0.00 | % | | 0.00 | % | | 0.00 | % | | 0.00 | % | | 0.00 | % | | 0.00 | % | | 0.00 | % |
KraneShares MSCI China Environment Index ETF |
0.00% | | 0.00 | % | | 0.00 | % | | 0.00 | % | | 0.00 | % | | 0.00 | % | | 0.00 | % | | 0.00 | % | | 0.00 | % | | 0.00 | % |
KraneShares Electric Vehicles and Future Mobility Index ETF(7) |
0.00% | | 0.00 | % | | 100.00 | % | | 100.00 | % | | 77.41 | % | | 89.52 | % | | 0.00 | % | | 0.00 | % | | 0.00 | % | | 100.00 | % |
KraneShares MSCI All China Health Care Index ETF |
0.00% | | 0.00 | % | | 0.00 | % | | 0.00 | % | | 0.00 | % | | 0.00 | % | | 0.00 | % | | 0.00 | % | | 0.00 | % | | 0.00 | % |
118
Supplemental Information (Unaudited)
Net asset value, or “NAV”, is the price per Share at which the Funds issue and redeem Shares to Authorized Participants. It is calculated in accordance with the policies described in Note 2 in Notes to Financial Statements.) The “Market Price” of the Funds generally is determined using the midpoint between the highest bid and the lowest offer on the stock exchange on which the Shares of the Funds are listed for trading, as of the time that the Funds’ NAV is calculated. The Funds’ Market Price may be at, above or below their NAV. The NAV of the Funds will fluctuate with changes in the market value of their holdings. The Market Price of the Funds will fluctuate in accordance with changes in their NAV, as well as market supply and demand of Fund Shares.
Premiums or discounts are the differences (expressed as a percentage) between the NAV and Market Price of the Funds on a given day, generally at the time NAV is calculated. A premium is the amount that the Funds are trading above the reported NAV, expressed as a percentage of the NAV. A discount is the amount that the Funds are trading below the reported NAV, expressed as a percentage of the NAV. Shareholders may pay more than NAV when they buy Fund Shares and receive less than NAV when they sell those Shares, because Shares are bought and sold at Market Price.
Further information regarding premiums and discounts is available on the Funds’ website at http://kraneshares.com. The premium and discount information contained on the website represents past performance and cannot be used to predict future results.
119
(This page intentionally left blank.)
KraneShares Trust:
1270 Avenue of the Americas, 22nd Floor
New York, New York 10020
1-855-857-2638
http://kraneshares.com/
Investment Adviser:
Krane Funds Advisors, LLC
1270 Avenue of the Americas, 22nd Floor
New York, New York 10020
Distributor:
SEI Investments Distribution Co.
One Freedom Valley Drive
Oaks, PA 19456
Administrator:
SEI Investments Global Funds Services
One Freedom Valley Drive
Oaks, PA 19456
This information must be preceded or accompanied by a current prospectus for the Funds described.
KraneShares Trust:
1270 Avenue of the Americas, 22nd Floor
New York, New York 10020
KRS-AR-001-0500
KRS-AR-001-0500
The Registrant has adopted a code of ethics that applies to the Registrant's principal executive officer, principal financial officer, controller or principal accounting officer or any person who performs a similar function. During the period covered by the report, there were no amendments to the code of ethics, and the Registrant did not grant any waivers from a provision of the code of ethics.
(a) (1) The Registrant’s Board of Trustees has determined that the Registrant has an audit committee financial expert serving on the audit committee.
(a) (2) The audit committee financial expert, John Ferguson, is an independent trustee as defined in Form N-CSR Item 3 (a) (2)
Item 4. Principal Accountant Fees and Services.
Fees billed by KPMG LLP (“KPMG”) related to the Registrant.
KPMG billed the Registrant aggregate fees for services rendered to the Registrant for the last two fiscal years as follows:
(1) These services included tax return preparation for the Funds.
(e)(1) Pursuant to the requirements of the Sarbanes Act, the SEC adopted Rule 2-01 under Regulation S-X, which, among other things, requires a fund’s audit committee to pre-approve certain audit and non-audit services that are provided by its independent auditors in order to ensure the auditors’ independence. The Registrant’s Board of Trustees has established an Audit Committee that has been charged with, among other things, assisting the Board of Trustees in its oversight of: the Registrant’s independent auditors; preapproving all audit and non-audit services provided by the Registrant’s independent auditors; the integrity of the Funds’ financial statements; the independent auditors’ qualifications and independence; and the use of appropriate accounting principles.
(e)(2) Percentage of fees billed applicable to non-audit services approved pursuant to the “de minimis” exception of Rule 2-01(c)(7)(i)(C) were as follows for KPMG:
(f) Not applicable.
(g) The aggregate non-audit fees and services billed by KPMG for the last two fiscal years were $33,280 and $20,000, respectively.
(h) During the past fiscal year, all non-audit services provided by the Registrant’s principal accountant to either the Registrant's investment adviser or to entities controlling, controlled by, or under common control with the Registrant’s investment adviser that provides ongoing services to the Registrant were pre-approved by the Audit Committee of the Registrant's Board of Trustees. Included in the audit committee’s pre-approval was the review and consideration as to whether the provision of these non-audit services is compatible with maintaining the principal accountant’s independence.
The Registrant has a separately-designated standing Audit Committee, which is composed of the Registrant's Independent Trustees, Messrs. Patrick Campo, John Ferguson and Matthew Stroyman.
Schedule of Investments is included as part of the Report to Shareholders filed under Item 1 of this form.
Item 7. Disclosure of Proxy Voting Policies and Procedures for Closed-End Management Investment Companies.
Not applicable to open-end management investment companies.
Not applicable to open-end management investment companies.
Not applicable to open-end management investment companies.
There have been no changes to the procedures by which shareholders may recommend nominees to the Registrant’s Board of Trustees during the period covered by this report.
(a) Based on the evaluation required by Rule 30a-3(b) under the 1940 Act (17 CFR 270.30a-3(b)) and Rules 13a-15(b) or 15d-15(b) under the Securities Exchange Act of 1934 (17 CFR 240.13a-15(b) or 240.15d-15(b)), the Registrant’s principal executive and principal financial officers, or persons performing similar functions, have concluded that the Registrant’s disclosure controls and procedures (as defined in Rule 30a-3(c) under the Investment Company Act of 1940 (the “1940 Act”) (17 CFR 270.30a-3(c))) as of a date within 90 days of the filing date of the report, are effective.
(b) There has been no change in the Registrant’s internal control over financial reporting (as defined in Rule 30a-3(d) under the 1940 Act (17 CFR 270.30a-3(d)) that occurred during the last fiscal quarter of the period covered by this report that has materially affected, or is reasonably likely to materially affect, the Registrant’s internal control over financial reporting.
Not applicable to open-end management investment companies.
Items 13. Exhibits.
(a)(1) Code of Ethics attached hereto.
(a)(2) A certification for the principal executive officer and the principal financial officer of the Registrant as required by Rule 30a-2(a) under the 1940 Act, as amended (17 CFR 270.30a-2(a)), is filed herewith.
(b) Officer certification as required by Rule 30a-2(b) under the 1940 Act, as amended (17 CFR 270.30a-2(b)) also accompany this filing as an exhibit.
Pursuant to the requirements of the Securities Exchange Act of 1934 and the Investment Company Act of 1940, the Registrant has duly caused this report to be signed on its behalf by the undersigned, thereunto duly authorized.
Pursuant to the requirements of the Securities Exchange Act of 1934 and the Investment Company Act of 1940, this report has been signed below by the following persons on behalf of the registrant and in the capacities and on the dates indicated.