As filed with the Securities and Exchange Commission on March 1, 2016
UNITED STATES
SECURITIES AND EXCHANGE COMMISSION
Washington, D.C. 20549
FORM N-CSR
CERTIFIED SHAREHOLDER REPORT OF REGISTERED
MANAGEMENT INVESTMENT COMPANIES
Investment Company Act file number | 811-22696 |
|
Victory Portfolios II |
(Exact name of registrant as specified in charter) |
|
4900 Tiedeman Road, 4th Floor
Brooklyn, OH | | 44144 |
(Address of principal executive offices) | | (Zip code) |
|
Christopher K. Dyer 4900 Tiedeman Road, 4th Floor Brooklyn, OH 44144 |
(Name and address of agent for service) |
|
Registrant’s telephone number, including area code: | 216-898-2411 | |
|
Date of fiscal year end: | June 30 | |
|
Date of reporting period: | December 31, 2015 | |
| | | | | | | | |
Updated August 1, 2011
Item 1. Reports to Stockholders.

December 31, 2015
Semi Annual Report
Victory CEMP US 500 Volatility Wtd Index ETF
Victory CEMP US Discovery Enhanced Volatility Wtd Index ETF
Victory CEMP US 500 Enhanced Volatility Wtd Index ETF
Victory CEMP Developed Enhanced Volatility Wtd Index ETF
Victory CEMP US EQ Income Enhanced Volatility Wtd Index ETF
Victory CEMP US Small Cap Volatility Wtd Index ETF
Victory CEMP International Volatility Wtd Index ETF
Victory CEMP US Large Cap High Div Volatility Wtd Index ETF
Victory CEMP US Small Cap High Div Volatility Wtd Index ETF
Victory CEMP International High Div Volatility Wtd Index ETF
Table of Contents
Shareholder Letter | | | 5 | | |
Financial Statements | |
Victory Portfolios II Exchange Traded Funds | |
Victory CEMP US 500 Volatility Wtd Index ETF | |
Schedule of Investments | | | 8-21 | | |
Statement of Assets and Liabilities | | | 101 | | |
Statement of Operations | | | 105 | | |
Statements of Changes in Net Assets | | | 109 | | |
Financial Highlights | | | 119 | | |
Victory CEMP US Discovery Enhanced Volatility
Wtd Index ETF | |
Schedule of Investments | | | 22-35 | | |
Statement of Assets and Liabilities | | | 101 | | |
Statement of Operations | | | 105 | | |
Statements of Changes in Net Assets | | | 110 | | |
Financial Highlights | | | 120 | | |
Victory CEMP US 500 Enhanced Volatility Wtd
Index ETF | |
Schedule of Investments | | | 36-49 | | |
Statement of Assets and Liabilities | | | 101 | | |
Statement of Operations | | | 105 | | |
Statements of Changes in Net Assets | | | 111 | | |
Financial Highlights | | | 121 | | |
Victory CEMP Developed Enhanced Volatility Wtd
Index ETF | |
Schedule of Investments | | | 50-60 | | |
Statement of Assets and Liabilities | | | 102 | | |
Statement of Operations | | | 106 | | |
Statements of Changes in Net Assets | | | 112 | | |
Financial Highlights | | | 122 | | |
Victory CEMP US EQ Income Enhanced Volatility
Wtd Index ETF | |
Schedule of Investments | | | 61-64 | | |
Statement of Assets and Liabilities | | | 102 | | |
Statement of Operations | | | 106 | | |
Statements of Changes in Net Assets | | | 113 | | |
Financial Highlights | | | 123 | | |
Victory CEMP US Small Cap Volatility Wtd Index ETF | |
Schedule of Investments | | | 65-77 | | |
Statement of Assets and Liabilities | | | 102 | | |
Statement of Operations | | | 106 | | |
Statements of Changes in Net Assets | | | 114 | | |
Financial Highlights | | | 124 | | |
1
Table of Contents (continued)
Victory CEMP International Volatility Wtd Index ETF | |
Schedule of Investments | | | 78-88 | | |
Statement of Assets and Liabilities | | | 103 | | |
Statement of Operations | | | 107 | | |
Statements of Changes in Net Assets | | | 115 | | |
Financial Highlights | | | 125 | | |
Victory CEMP US Large Cap High Div Volatility Wtd
Index ETF | |
Schedule of Investments | | | 89-92 | | |
Statement of Assets and Liabilities | | | 103 | | |
Statement of Operations | | | 107 | | |
Statements of Changes in Net Assets | | | 116 | | |
Financial Highlights | | | 126 | | |
Victory CEMP US Small Cap High Div Volatility Wtd
Index ETF | |
Schedule of Investments | | | 93-96 | | |
Statement of Assets and Liabilities | | | 103 | | |
Statement of Operations | | | 107 | | |
Statements of Changes in Net Assets | | | 117 | | |
Financial Highlights | | | 127 | | |
Victory CEMP International High Div Volatility Wtd
Index ETF | |
Schedule of Investments | | | 97-100 | | |
Statement of Assets and Liabilities | | | 104 | | |
Statement of Operations | | | 108 | | |
Statements of Changes in Net Assets | | | 118 | | |
Financial Highlights | | | 128 | | |
Notes to Financial Statements | | | 129 | | |
Supplemental Information | | | 146 | | |
Trustee and Officer Information | | | 146 | | |
Additional Federal Income Tax Information | | | 149 | | |
Proxy Voting and Form N-Q Information | | | 150 | | |
Expense Examples | | | 150-152 | | |
Portfolio Allocation | | | 153-155 | | |
Frequency Distribution of Premiums &
Discounts | | | 156-163 | | |
2
Table of Contents (continued)
The Victory Portfolios II ETFs are distributed by Quasar Distributors, LLC. Victory Capital Management Inc. is the investment adviser to the Funds and receives fees from the Funds for performing services for the Funds.
This report is not authorized for distribution to prospective investors unless preceded or accompanied by a current prospectus of the Victory Portfolio II ETFs.
For additional information about any Victory Portfolios II ETF, including fees, expenses, and risks, view our prospectus online at compassempetf.com or call 866-376-7890. Read it carefully before you invest or send money.
The information in this semi annual report is based on data obtained from recognized services and sources and is believed to be reliable. Any opinions, projections, or recommendations in this report are subject to change without notice and are not intended as individual investment advice. Past investment performance of the ETFs, markets or securities mentioned herein should not be considered to be indicative of future results.
• NOT FDIC INSURED • NO BANK GUARANTEE • MAY LOSE VALUE

Call Compass EMP at:
866-376-7890
Visit our website at:
www.compassempetf.com
3
This page is intentionally left blank.
4
The Victory Funds Letter to Shareholders
Dear Shareholder:
It has been somewhat of a rollercoaster ride for U.S. stocks this year, culminating in August's correction, as investor worry over geopolitical turmoil in Europe, recessions in Brazil and Russia, slowing economic growth in Asia, and anticipated changes in domestic monetary policy, provided turbulence. Still, the market recovered most of its losses, delivering a relatively flat, to slightly negative, equity return to investors for the second half of 2015. Large capitalization stocks led the way, benefiting from investor rotation during the most recent sell-off, while growth has continued to materially outpace value across all capitalizations.
With both 2015 and 2016 estimate revisions trending consistently negative over the past year, leaving calendar 2015 growth estimates close to flat, a muted return over the past six months could be considered as a marginal victory for the equity market. Easy monetary policy has driven bond yields to record lows, helping equities; but it also stands to reason that investors are optimistic the U.S. can once again regain the lead position in the global growth story. Specifically, slowing growth in China and the end of the commodity super-cycle, might just portend a revitalization for the U.S. and other developed nations on two fronts: 1) the consumer strengthens from improved real wages, but improved frugality sets the stage for lower, but longer expansion, and 2) a larger portion of investment gets channeled back to developed markets as investors reassess the long-term growth and risk profile of emerging markets, driving the improved productivity that has been missing in this recovery.
The second half of 2015 was dominated by weak growth centered in China, plunging energy and commodity prices, a strong U.S. dollar, and the long anticipated change in monetary policy by the Federal Reserve. GDP slowed heading into the second half of the year, falling from just under 4% in the second quarter, to approximately 2% in the third. Estimates for the final quarter have also been revised downward to nearly 2%. The U.S. consumer continued to provide leadership in the economy, albeit at a slower pace, as personal consumption dipped slightly from the second, to the third quarter. Retail sales slowed in the late summer, but climbed again in November, as consumers put to work some of the money conserved from less expensive gasoline. In contrast, the U.S. manufacturing sector fell into contraction in December, held in check by a strong dollar and weak overseas demand. Weakness overseas also temporarily derailed the Fed's plans to increase interest rates until the fourth quarter, which subsequently brought an end to an extraordinary period, in which the Federal Funds rate was held near zero for seven years. While the Fed action was indeed important, many of the themes we experienced at the start of the year persisted until year-end — steady job gains, subdued inflation, falling commodity prices, and a strong dollar that pushed the U.S. manufacturing sector into contraction. As a result, the tug of war for investors between risky assets and treasuries, continued to dominate throughout the year.
International equity markets declined during the period as slow growth in China, the world's second largest economy, weighed heavily on global markets. In particular, emerging economies struggled, largely impacted by depressed commodity prices and a strong U.S. dollar, which has led to further local currency
5
devaluations. Brazil and Russia have been staggered by contracting economies and elevated inflation. Central bank policy has continued to have a significant impact on global markets as investors focus on the implications of monetary policy divergence. The European Central Bank has signaled continued monetary easing to increase its stimulus program, while the Federal Reserve began its rate hike cycle after raising interest rates in December. International developed stocks outperformed their emerging peers, with international developed small capitalization stocks, in particular, posting the highest relative returns among foreign equity asset classes. Although global GDP forecasts have declined, it is unclear how much spillover from decelerating growth in emerging markets will impact the world's developed economies.
We continue to believe that the markets provide tactical challenges for investors to navigate. As we have stated in the past, we also believe that maintaining a long-term view and building a portfolio that is diversified across asset classes is an appropriate strategy for investors seeking to weather possible market turbulence.
On the following pages, you will find information relating to your Victory Funds investment. If you have any questions, we encourage you to contact your financial advisor. Or, if you invest with us directly, you may call (800) 539-3863, or visit our website at www.vcm.com. My colleagues and I sincerely appreciate the confidence you have placed in the Victory Funds and we value the opportunity to help meet your investment goals.

Christopher K. Dyer, CFA
President,
Victory Funds
Opinions expressed are subject to change, are not guaranteed and should not be considered investment advice.
Investments involve risk including possible loss of principal. ETFs have the same risks as the underlying securities traded on the exchange throughout the day. Redemptions are limited and often commissions are charged on each trade, and ETFs may trade at a premium or discount to their net asset value. The Funds are new exchange traded funds ("ETFs") and have a limited history of operations for investors to evaluate. The Funds are not actively managed and do not, therefore, seek returns in excess of their respective Index. The Funds' returns may not match the returns of their respective Index for a number of reasons, including: the Fund incurs operating expenses not applicable to the Index and incurs costs in buying and selling securities; the Fund may not be fully invested at times; differences in the valuation of securities and differences between the Fund's portfolio and the Index resulting from legal restrictions, cost, or liquidity constraints. The Victory CEMP US 500 Volatility Wtd Index ETF, Victory CEMP US Small Cap High Div Volatility Wtd Index ETF, and Victory CEMP US Discovery Enhanced Volatility Wtd Index ETF may invest in Small Cap companies. The earnings and prospects of smaller-sized companies are more volatile than larger companies. Small-sized
6
companies may have limited markets, product lines, or financial resources and lack management experience and may experience higher failure rates than larger companies. The Victory CEMP US 500 Volatility Wtd Index ETF and the Victory CEMP US 500 Enhanced Volatility Wtd Index ETF may invest in medium cap companies which involves additional risks such as limited liquidity and greater volatility than large cap companies. Victory CEMP US Discovery Enhanced Volatility Wtd Index ETF, Victory CEMP US 500 Enhanced Volatility Wtd Index ETF, Victory CEMP Developed Enhanced Volatility Wtd Index ETF, and the Victory CEMP US EQ Income Enhanced Volatility Wtd Index ETF may invest, directly or indirectly, in "junk bonds". Such securities are speculative investments that carry greater risks than higher quality debt securities. In general the price of a fixed income security falls when interest rates rise. The Victory CEMP US Large Cap High Div Volatility Wtd Index ETF, Victory CEMP US Small Cap High Div Volatility Wtd Index ETF, Victory CEMP US Small Cap High Div Volatility Wtd Index ETF, and Victory CEMP International High Div Volatility Wtd Index ETF high dividend strategies may not be successful. Dividend paying stocks may fall out of favor relative to the overall market. Victory CEMP Developed Enhanced Volatility Wtd Index ETF may invest in securities included in, or representative of securities included in, the index, regardless of their investment merits. Victory CEMP International High Div Volatility Wtd Index ETF and Victory CEMP International Volatility Wtd Index ETF special risks associated with investments in foreign markets may include less liquidity, greater volatility, less developed or less efficient trading markets, lack of comprehensive company information, political instability and differing auditing and legal standards. The Fund's net asset value could decline as a result of changes in the exchange rates between foreign currencies and the U.S. dollar. Additionally, certain foreign countries may impose restrictions on the ability of issuers of foreign securities to make payment of principal and interest to investors located outside the country, due to blockage of foreign currency exchanges or otherwise.
Diversification does not assure a profit or protect against loss in a declining market.
One cannot invest directly in an index.
7
Victory Portfolios II
Victory CEMP US 500 Volatility Wtd Index ETF | | Schedule of Investments
December 31, 2015 | |
(Unaudited)
Security Description | | Shares | | Value | |
Common Stocks (99.7%) | |
Aerospace & Defense (3.0%): | |
General Dynamics Corporation | | | 394 | | | $ | 54,120 | | |
Hexcel Corporation | | | 1,013 | | | | 47,054 | | |
Honeywell International, Inc. | | | 571 | | | | 59,139 | | |
Huntington Ingalls Industries, Inc. | | | 324 | | | | 41,099 | | |
L-3 Communications Holdings, Inc. | | | 497 | | | | 59,396 | | |
Lockheed Martin Corporation | | | 312 | | | | 67,751 | | |
Northrop Grumman Corporation | | | 320 | | | | 60,419 | | |
Precision Castparts Corporation | | | 141 | | | | 32,713 | | |
Raytheon Company | | | 493 | | | | 61,393 | | |
Rockwell Collins, Inc. | | | 738 | | | | 68,117 | | |
Textron, Inc. | | | 1,079 | | | | 45,329 | | |
The Boeing Company | | | 362 | | | | 52,342 | | |
United Technologies Corporation | | | 583 | | | | 56,009 | | |
| | | | 704,881 | | |
Air Freight & Logistics (0.6%): | |
CH Robinson Worldwide, Inc. | | | 600 | | | | 37,212 | | |
Expeditors International of Washington, Inc. | | | 1,082 | | | | 48,798 | | |
United Parcel Service, Inc. | | | 521 | | | | 50,136 | | |
| | | | 136,146 | | |
Airlines (0.6%): | |
Alaska Air Group, Inc. | | | 424 | | | | 34,136 | | |
American Airlines Group, Inc. | | | 639 | | | | 27,062 | | |
JetBlue Airways Corporation* | | | 1,154 | | | | 26,138 | | |
Southwest Airlines Company | | | 824 | | | | 35,482 | | |
United Continental Holdings, Inc.* | | | 471 | | | | 26,988 | | |
| | | | 149,806 | | |
Auto Components (0.9%): | |
BorgWarner, Inc. | | | 931 | | | | 40,247 | | |
Gentex Corporation | | | 2,953 | | | | 47,278 | | |
Goodyear Tire & Rubber Company | | | 1,239 | | | | 40,478 | | |
Johnson Controls, Inc. | | | 1,080 | | | | 42,649 | | |
Lear Corporation | | | 406 | | | | 49,869 | | |
| | | | 220,521 | | |
Automobiles (0.6%): | |
Ford Motor Company | | | 3,665 | | | | 51,640 | | |
General Motors Company | | | 1,451 | | | | 49,348 | | |
Harley-Davidson, Inc. | | | 686 | | | | 31,138 | | |
| | | | 132,126 | | |
Banks (4.4%): | |
BB&T Corporation | | | 1,380 | | | | 52,178 | | |
CIT Group, Inc. | | | 1,308 | | | | 51,928 | | |
Citigroup, Inc. | | | 877 | | | | 45,385 | | |
Citizens Financial Group, Inc. | | | 1,912 | | | | 50,075 | | |
Comerica, Inc. | | | 884 | | | | 36,978 | | |
See notes to financial statements.
8
Victory Portfolios II
Victory CEMP US 500 Volatility Wtd Index ETF | | Schedule of Investments — continued
December 31, 2015 | |
(Unaudited)
Security Description | | Shares | | Value | |
East West Bancorp, Inc. | | | 1,082 | | | $ | 44,968 | | |
Fifth Third Bancorp | | | 2,268 | | | | 45,587 | | |
First Republic Bank | | | 775 | | | | 51,196 | | |
Huntington Bancshares, Inc. | | | 4,439 | | | | 49,095 | | |
JPMorgan Chase & Company | | | 780 | | | | 51,503 | | |
KeyCorporation | | | 3,001 | | | | 39,583 | | |
M&T Bank Corporation | | | 780 | | | | 94,520 | | |
People's United Financial, Inc. | | | 3,891 | | | | 62,840 | | |
Regions Financial Corporation | | | 4,176 | | | | 40,090 | | |
Signature Bank* | | | 334 | | | | 51,226 | | |
SunTrust Banks, Inc. | | | 1,126 | | | | 48,238 | | |
SVB Financial Group* | | | 259 | | | | 30,795 | | |
The PNC Financial Services Group, Inc. | | | 586 | | | | 55,852 | | |
US Bancorp | | | 1,323 | | | | 56,452 | | |
Wells Fargo & Company | | | 1,043 | | | | 56,697 | | |
| | | | 1,015,186 | | |
Beverages (1.9%): | |
Brown-Forman Corporation | | | 659 | | | | 65,426 | | |
Coca-Cola Enterprises, Inc. | | | 819 | | | | 40,328 | | |
Constellation Brands, Inc. | | | 421 | | | | 59,967 | | |
Dr Pepper Snapple Group, Inc. | | | 796 | | | | 74,187 | | |
Monster Beverage Corporation* | | | 239 | | | | 35,601 | | |
PepsiCo, Inc. | | | 726 | | | | 72,542 | | |
The Coca-Cola Company | | | 1,964 | | | | 84,373 | | |
| | | | 432,424 | | |
Biotechnology (0.9%): | |
Alexion Pharmaceuticals, Inc.* | | | 172 | | | | 32,809 | | |
Amgen, Inc. | | | 249 | | | | 40,420 | | |
Biogen, Inc.* | | | 74 | | | | 22,670 | | |
Celgene Corporation* | | | 273 | | | | 32,694 | | |
Gilead Sciences, Inc. | | | 343 | | | | 34,708 | | |
Regeneron Pharmaceuticals, Inc.* | | | 65 | | | | 35,287 | | |
| | | | 198,588 | | |
Building Products (0.8%): | |
AO Smith Corporation | | | 606 | | | | 46,426 | | |
Lennox International, Inc. | | | 476 | | | | 59,452 | | |
Masco Corporation | | | 1,435 | | | | 40,611 | | |
Owens Corning | | | 783 | | | | 36,824 | | |
| | | | 183,313 | | |
Capital Markets (3.3%): | |
Affiliated Managers Group, Inc.* | | | 286 | | | | 45,691 | | |
Ameriprise Financial, Inc. | | | 427 | | | | 45,441 | | |
BlackRock, Inc. | | | 177 | | | | 60,272 | | |
E*TRADE Financial Corporation* | | | 1,238 | | | | 36,694 | | |
Franklin Resources, Inc. | | | 1,323 | | | | 48,713 | | |
Invesco Ltd. | | | 1,444 | | | | 48,345 | | |
Legg Mason, Inc. | | | 1,159 | | | | 45,468 | | |
Northern Trust Corporation | | | 651 | | | | 46,931 | | |
See notes to financial statements.
9
Victory Portfolios II
Victory CEMP US 500 Volatility Wtd Index ETF | | Schedule of Investments — continued
December 31, 2015 | |
(Unaudited)
Security Description | | Shares | | Value | |
Raymond James Financial, Inc. | | | 902 | | | $ | 52,289 | | |
SEI Investments Company | | | 971 | | | | 50,881 | | |
State Street Corporation | | | 613 | | | | 40,679 | | |
T. Rowe Price Group, Inc. | | | 848 | | | | 60,624 | | |
TD Ameritrade Holding Corporation | | | 1,344 | | | | 46,650 | | |
The Bank of New York Mellon Corporation | | | 1,177 | | | | 48,516 | | |
The Charles Schwab Corporation | | | 1,281 | | | | 42,183 | | |
The Goldman Sachs Group, Inc. | | | 275 | | | | 49,563 | | |
| | | | 768,940 | | |
Chemicals (3.8%): | |
Air Products & Chemicals, Inc. | | | 344 | | | | 44,758 | | |
Airgas, Inc. | | | 577 | | | | 79,811 | | |
Ashland, Inc. | | | 485 | | | | 49,810 | | |
CF Industries Holdings, Inc. | | | 583 | | | | 23,792 | | |
Eastman Chemical Company | | | 571 | | | | 38,548 | | |
Ecolab, Inc. | | | 494 | | | | 56,504 | | |
EI du Pont de Nemours & Company | | | 910 | | | | 60,606 | | |
International Flavors & Fragrances, Inc. | | | 452 | | | | 54,077 | | |
LyondellBasell Industries NV | | | 389 | | | | 33,804 | | |
NewMarket Corporation | | | 122 | | | | 46,449 | | |
PPG Industries, Inc. | | | 541 | | | | 53,462 | | |
Praxair, Inc. | | | 631 | | | | 64,615 | | |
The Dow Chemical Company | | | 942 | | | | 48,494 | | |
The Mosaic Company | | | 1,232 | | | | 33,991 | | |
The Sherwin-Williams Company | | | 194 | | | | 50,362 | | |
The Valspar Corporation | | | 754 | | | | 62,544 | | |
W.R. Grace & Company* | | | 456 | | | | 45,413 | | |
Westlake Chemical Corporation | | | 595 | | | | 32,320 | | |
| | | | 879,360 | | |
Commercial Services & Supplies (2.1%): | |
Cintas Corporation | | | 722 | | | | 65,738 | | |
Copart, Inc.* | | | 1,875 | | | | 71,269 | | |
KAR Auction Services, Inc. | | | 1,704 | | | | 63,099 | | |
Republic Services, Inc. | | | 1,588 | | | | 69,856 | | |
Rollins, Inc. | | | 1,749 | | | | 45,299 | | |
Stericycle, Inc.* | | | 457 | | | | 55,114 | | |
The ADT Corporation | | | 1,270 | | | | 41,885 | | |
Waste Connections, Inc. | | | 1,272 | | | | 71,639 | | |
| | | | 483,899 | | |
Communications Equipment (1.1%): | |
Arista Networks, Inc.* | | | 396 | | | | 30,825 | | |
Brocade Communications Systems, Inc. | | | 3,213 | | | | 29,495 | | |
Cisco Systems, Inc. | | | 1,716 | | | | 46,598 | | |
CommScope Holding Company, Inc.* | | | 877 | | | | 22,705 | | |
F5 Networks, Inc.* | | | 332 | | | | 32,191 | | |
Motorola Solutions, Inc. | | | 720 | | | | 49,284 | | |
QUALCOMM, Inc. | | | 746 | | | | 37,289 | | |
| | | | 248,387 | | |
See notes to financial statements.
10
Victory Portfolios II
Victory CEMP US 500 Volatility Wtd Index ETF | | Schedule of Investments — continued
December 31, 2015 | |
(Unaudited)
Security Description | | Shares | | Value | |
Construction & Engineering (0.5%): | |
Fluor Corporation | | | 854 | | | $ | 40,326 | | |
Jacobs Engineering Group, Inc.* | | | 978 | | | | 41,027 | | |
Quanta Services, Inc.* | | | 1,266 | | | | 25,636 | | |
| | | | 106,989 | | |
Construction Materials (0.1%): | |
Martin Marietta Materials, Inc. | | | 193 | | | | 26,360 | | |
Consumer Finance (1.0%): | |
American Express Company | | | 624 | | | | 43,399 | | |
Capital One Financial Corporation | | | 535 | | | | 38,616 | | |
Discover Financial Services | | | 935 | | | | 50,135 | | |
Navient Corporation | | | 2,720 | | | | 31,144 | | |
Santander Consumer USA Holdings, Inc.* | | | 1,686 | | | | 26,723 | | |
Synchrony Financial* | | | 1,588 | | | | 48,291 | | |
| | | | 238,308 | | |
Containers & Packaging (0.9%): | |
Avery Dennison Corporation | | | 844 | | | | 52,885 | | |
Ball Corporation | | | 667 | | | | 48,511 | | |
Crown Holdings, Inc.* | | | 895 | | | | 45,376 | | |
Packaging Corporation of America | | | 564 | | | | 35,560 | | |
Sealed Air Corporation | | | 786 | | | | 35,056 | | |
| | | | 217,388 | | |
Distributors (0.4%): | |
Genuine Parts Company | | | 665 | | | | 57,117 | | |
LKQ Corporation* | | | 1,368 | | | | 40,534 | | |
| | | | 97,651 | | |
Diversified Consumer Services (0.2%): | |
Service Corporation International | | | 1,872 | | | | 48,709 | | |
Diversified Financial Services (2.2%): | |
Berkshire Hathaway, Inc.* | | | 547 | | | | 72,226 | | |
CBOE Holdings, Inc. | | | 877 | | | | 56,917 | | |
CME Group, Inc. | | | 576 | | | | 52,185 | | |
FactSet Research Systems, Inc. | | | 370 | | | | 60,151 | | |
Intercontinental Exchange, Inc. | | | 215 | | | | 55,096 | | |
Moody's Corporation | | | 520 | | | | 52,177 | | |
MSCI, Inc. | | | 844 | | | | 60,878 | | |
Nasdaq, Inc. | | | 1,060 | | | | 61,660 | | |
Voya Financial, Inc. | | | 1,209 | | | | 44,624 | | |
| | | | 515,914 | | |
Diversified Telecommunication Services (0.2%): | |
CenturyLink, Inc. | | | 1,560 | | | | 39,250 | | |
Electric Utilities (3.3%): | |
American Electric Power Company, Inc. | | | 973 | | | | 56,697 | | |
Duke Energy Corporation | | | 773 | | | | 55,184 | | |
Edison International | | | 842 | | | | 49,855 | | |
Entergy Corporation | | | 802 | | | | 54,825 | | |
See notes to financial statements.
11
Victory Portfolios II
Victory CEMP US 500 Volatility Wtd Index ETF | | Schedule of Investments — continued
December 31, 2015 | |
(Unaudited)
Security Description | | Shares | | Value | |
Eversource Energy | | | 1,109 | | | $ | 56,637 | | |
Exelon Corporation | | | 1,400 | | | | 38,878 | | |
ITC Holdings Corporation | | | 1,479 | | | | 58,051 | | |
NextEra Energy, Inc. | | | 562 | | | | 58,386 | | |
OGE Energy Corporation | | | 1,855 | | | | 48,768 | | |
Pepco Holdings, Inc. | | | 1,731 | | | | 45,023 | | |
Pinnacle West Capital Corporation | | | 915 | | | | 58,999 | | |
Southern Company | | | 1,338 | | | | 62,605 | | |
Westar Energy, Inc. | | | 1,450 | | | | 61,495 | | |
Xcel Energy, Inc. | | | 1,606 | | | | 57,671 | | |
| | | | 763,074 | | |
Electrical Equipment (1.4%): | |
Acuity Brands, Inc. | | | 238 | | | | 55,644 | | |
AMETEK, Inc. | | | 985 | | | | 52,786 | | |
Eaton Corporation PLC | | | 815 | | | | 42,412 | | |
Emerson Electric Company | | | 1,114 | | | | 53,283 | | |
Hubbell, Inc.* | | | 669 | | | | 67,596 | | |
Rockwell Automation, Inc. | | | 436 | | | | 44,738 | | |
| | | | 316,459 | | |
Electronic Equipment, Instruments & Components (1.5%): | |
Amphenol Corporation | | | 966 | | | | 50,454 | | |
Arrow Electronics, Inc.* | | | 690 | | | | 37,384 | | |
Avnet, Inc. | | | 1,022 | | | | 43,783 | | |
CDW Corporation | | | 1,175 | | | | 49,397 | | |
Corning, Inc. | | | 2,653 | | | | 48,497 | | |
Flextronics International Ltd.* | | | 3,753 | | | | 42,071 | | |
IPG Photonics Corporation* | | | 382 | | | | 34,059 | | |
Trimble Navigation Ltd.* | | | 1,760 | | | | 37,752 | | |
| | | | 343,397 | | |
Energy Equipment & Services (0.6%): | |
Cameron International Corporation* | | | 287 | | | | 18,139 | | |
FMC Technologies, Inc.* | | | 837 | | | | 24,281 | | |
Helmerich & Payne, Inc. | | | 495 | | | | 26,507 | | |
National Oilwell Varco, Inc. | | | 790 | | | | 26,457 | | |
Schlumberger Ltd. | | | 558 | | | | 38,921 | | |
| | | | 134,305 | | |
Food & Staples Retailing (1.6%): | |
Costco Wholesale Corporation | | | 405 | | | | 65,408 | | |
CVS Health Corporation | | | 637 | | | | 62,279 | | |
Rite Aid Corporation* | | | 3,822 | | | | 29,964 | | |
Sysco Corporation | | | 1,401 | | | | 57,441 | | |
The Kroger Company | | | 1,504 | | | | 62,912 | | |
Wal-Mart Stores, Inc. | | | 874 | | | | 53,576 | | |
Whole Foods Market, Inc. | | | 1,175 | | | | 39,363 | | |
| | | | 370,943 | | |
See notes to financial statements.
12
Victory Portfolios II
Victory CEMP US 500 Volatility Wtd Index ETF | | Schedule of Investments — continued
December 31, 2015 | |
(Unaudited)
Security Description | | Shares | | Value | |
Food Products (3.2%): | |
Archer-Daniels-Midland Company | | | 1,141 | | | $ | 41,852 | | |
Campbell Soup Company | | | 1,341 | | | | 70,470 | | |
Flowers Foods, Inc. | | | 1,835 | | | | 39,434 | | |
General Mills, Inc. | | | 1,259 | | | | 72,594 | | |
Hain Celestial Group, Inc.* | | | 734 | | | | 29,646 | | |
Hormel Foods Corporation | | | 884 | | | | 69,907 | | |
Ingredion, Inc. | | | 610 | | | | 58,462 | | |
Keurig Green Mountain, Inc. | | | 326 | | | | 29,333 | | |
McCormick & Company, Inc. | | | 826 | | | | 70,673 | | |
Mead Johnson Nutrition Company | | | 741 | | | | 58,502 | | |
Mondelez International, Inc. | | | 1,257 | | | | 56,364 | | |
Pilgrim's Pride Corporation | | | 976 | | | | 21,560 | | |
Pinnacle Foods, Inc. | | | 1,229 | | | | 52,183 | | |
The WhiteWave Foods Company* | | | 854 | | | | 33,229 | | |
Tyson Foods, Inc. | | | 938 | | | | 50,024 | | |
| | | | 754,233 | | |
Gas Utilities (0.3%): | |
Atmos Energy Corporation | | | 970 | | | | 61,149 | | |
Health Care Equipment & Supplies (3.4%): | |
Abbott Laboratories | | | 1,169 | | | | 52,500 | | |
Align Technology, Inc.* | | | 651 | | | | 42,868 | | |
Baxter International, Inc. | | | 1,535 | | | | 58,560 | | |
Becton, Dickinson and Company | | | 459 | | | | 70,727 | | |
DENTSPLY International, Inc. | | | 1,033 | | | | 62,858 | | |
Edwards Lifesciences Corporation* | | | 559 | | | | 44,150 | | |
Hologic, Inc.* | | | 1,111 | | | | 42,985 | | |
IDEXX Laboratories, Inc.* | | | 387 | | | | 28,220 | | |
Intuitive Surgical, Inc.* | | | 89 | | | | 48,608 | | |
ResMed, Inc. | | | 623 | | | | 33,449 | | |
Sirona Dental Systems, Inc.* | | | 622 | | | | 68,153 | | |
St. Jude Medical, Inc. | | | 668 | | | | 41,263 | | |
Stryker Corporation | | | 573 | | | | 53,255 | | |
Teleflex, Inc. | | | 474 | | | | 62,307 | | |
The Cooper Companies, Inc. | | | 336 | | | | 45,091 | | |
Varian Medical Systems, Inc.* | | | 584 | | | | 47,187 | | |
| | | | 802,181 | | |
Health Care Providers & Services (3.6%): | |
Acadia Healthcare Company, Inc.* | | | 462 | | | | 28,856 | | |
Aetna, Inc. | | | 348 | | | | 37,626 | | |
Anthem, Inc. | | | 314 | | | | 43,784 | | |
Cardinal Health, Inc. | | | 644 | | | | 57,490 | | |
Centene Corporation* | | | 536 | | | | 35,274 | | |
Cigna Corporation | | | 267 | | | | 39,070 | | |
Community Health Systems, Inc.* | | | 601 | | | | 15,945 | | |
Express Scripts Holdings Company* | | | 568 | | | | 49,649 | | |
HCA Holdings, Inc.* | | | 468 | | | | 31,651 | | |
Henry Schein, Inc.* | | | 439 | | | | 69,445 | | |
Humana, Inc. | | | 160 | | | | 28,562 | | |
See notes to financial statements.
13
Victory Portfolios II
Victory CEMP US 500 Volatility Wtd Index ETF | | Schedule of Investments — continued
December 31, 2015 | |
(Unaudited)
Security Description | | Shares | | Value | |
Laboratory Corporation of America Holdings* | | | 492 | | | $ | 60,831 | | |
McKesson Corporation | | | 267 | | | | 52,660 | | |
MEDNAX, Inc.* | | | 732 | | | | 52,455 | | |
Patterson Companies, Inc. | | | 1,222 | | | | 55,247 | | |
Quest Diagnostics, Inc. | | | 680 | | | | 48,375 | | |
Team Health Holdings, Inc.* | | | 468 | | | | 20,540 | | |
UnitedHealth Group Inc. | | | 370 | | | | 43,527 | | |
Universal Health Services, Inc. | | | 293 | | | | 35,011 | | |
VCA, Inc.* | | | 740 | | | | 40,700 | | |
| | | | 846,698 | | |
Health Care Technology (0.2%): | |
Cerner Corporation* | | | 737 | | | | 44,345 | | |
Hotels, Restaurants & Leisure (2.6%): | |
Aramark | | | 1,770 | | | | 57,082 | | |
Chipotle Mexican Grill, Inc.* | | | 58 | | | | 27,831 | | |
Domino's Pizza, Inc. | | | 380 | | | | 42,275 | | |
Dunkin' Brands Group, Inc. | | | 977 | | | | 41,610 | | |
Hilton Worldwide Holdings, Inc. | | | 1,766 | | | | 37,792 | | |
Hyatt Hotels Corporation* | | | 926 | | | | 43,540 | | |
Las Vegas Sands Corporation | | | 659 | | | | 28,891 | | |
Marriott International, Inc. | | | 595 | | | | 39,889 | | |
McDonald's Corporation | | | 577 | | | | 68,167 | | |
Panera Bread Company* | | | 210 | | | | 40,904 | | |
Royal Caribbean Cruises Ltd. | | | 370 | | | | 37,448 | | |
Starbucks Corporation | | | 822 | | | | 49,345 | | |
Starwood Hotels & Resorts Worldwide, Inc. | | | 543 | | | | 37,619 | | |
Wyndham Worldwide Corporation | | | 615 | | | | 44,680 | | |
| | | | 597,073 | | |
Household Durables (1.5%): | |
DR Horton, Inc. | | | 1,108 | | | | 35,489 | | |
Harman International Industries, Inc. | | | 237 | | | | 22,328 | | |
Lennar Corporation | | | 702 | | | | 34,335 | | |
Mohawk Industries, Inc.* | | | 228 | | | | 43,181 | | |
Newell Rubbermaid, Inc. | | | 1,289 | | | | 56,819 | | |
NVR, Inc.* | | | 38 | | | | 62,434 | | |
PulteGroup, Inc. | | | 1,645 | | | | 29,314 | | |
Toll Brothers, Inc.* | | | 1,092 | | | | 36,363 | | |
Whirlpool Corporation | | | 233 | | | | 34,221 | | |
| | | | 354,484 | | |
Household Products (1.5%): | |
Church & Dwight Company, Inc. | | | 829 | | | | 70,366 | | |
Colgate-Palmolive Company | | | 954 | | | | 63,555 | | |
Procter & Gamble Company | | | 952 | | | | 75,598 | | |
Spectrum Brands Holdings, Inc. | | | 573 | | | | 58,331 | | |
The Clorox Company | | | 638 | | | | 80,918 | | |
| | | | 348,768 | | |
Independent Power Producers & Energy Traders (0.1%): | |
AES Corporation | | | 3,439 | | | | 32,911 | | |
See notes to financial statements.
14
Victory Portfolios II
Victory CEMP US 500 Volatility Wtd Index ETF | | Schedule of Investments — continued
December 31, 2015 | |
(Unaudited)
Security Description | | Shares | | Value | |
Industrial Conglomerates (1.0%): | |
| 3M Company | | | 430 | | | $ | 64,775 | | |
Carlisle Companies, Inc. | | | 499 | | | | 44,256 | | |
Danaher Corporation | | | 719 | | | | 66,781 | | |
Roper Technologies, Inc. | | | 349 | | | | 66,237 | | |
| | | | 242,049 | | |
Insurance (5.8%): | |
Aflac, Inc. | | | 1,007 | | | | 60,319 | | |
Alleghany Corporation* | | | 131 | | | | 62,609 | | |
American Financial Group, Inc. | | | 1,042 | | | | 75,107 | | |
American International Group, Inc. | | | 898 | | | | 55,649 | | |
AmTrust Financial Services, Inc. | | | 691 | | | | 42,552 | | |
Arthur J Gallagher & Company | | | 1,665 | | | | 68,165 | | |
Assurant, Inc. | | | 692 | | | | 55,734 | | |
Brown & Brown, Inc. | | | 2,091 | | | | 67,121 | | |
Chubb Corporation | | | 271 | | | | 35,945 | | |
Cincinnati Financial Corporation | | | 1,102 | | | | 65,205 | | |
CNA Financial Corporation | | | 1,599 | | | | 56,205 | | |
Lincoln National Corporation | | | 794 | | | | 39,906 | | |
Loews Corporation | | | 1,717 | | | | 65,933 | | |
Markel Corporation* | | | 71 | | | | 62,718 | | |
Marsh & McLennan Companies, Inc. | | | 1,208 | | | | 66,984 | | |
MetLife, Inc. | | | 924 | | | | 44,546 | | |
Principal Financial Group, Inc. | | | 922 | | | | 41,472 | | |
Progressive Corporation | | | 2,026 | | | | 64,427 | | |
Reinsurance Group of America, Inc. | | | 632 | | | | 54,068 | | |
StanCorp Financial Group, Inc. | | | 176 | | | | 20,043 | | |
The Allstate Corporation | | | 844 | | | | 52,404 | | |
The Travelers Companies, Inc. | | | 597 | | | | 67,377 | | |
Torchmark Corporation | | | 1,063 | | | | 60,761 | | |
W.R. Berkley Corporation | | | 1,019 | | | | 55,790 | | |
| | | | 1,341,040 | | |
Internet & Catalog Retail (0.5%): | |
Expedia, Inc. | | | 235 | | | | 29,211 | | |
Netflix, Inc.* | | | 208 | | | | 23,791 | | |
The Priceline Group, Inc.* | | | 31 | | | | 39,523 | | |
TripAdvisor, Inc.* | | | 355 | | | | 30,264 | | |
| | | | 122,789 | | |
Internet Software & Services (1.0%): | |
Akamai Technologies, Inc.* | | | 606 | | | | 31,894 | | |
Alphabet, Inc.* | | | 53 | | | | 41,234 | | |
eBay, Inc.* | | | 1,744 | | | | 47,925 | | |
Facebook, Inc.* | | | 448 | | | | 46,888 | | |
VeriSign, Inc.* | | | 767 | | | | 67,005 | | |
| | | | 234,946 | | |
IT Services (4.3%): | |
Alliance Data Systems Corporation* | | | 186 | | | | 51,442 | | |
Amdocs Ltd. | | | 1,166 | | | | 63,629 | | |
See notes to financial statements.
15
Victory Portfolios II
Victory CEMP US 500 Volatility Wtd Index ETF | | Schedule of Investments — continued
December 31, 2015 | |
(Unaudited)
Security Description | | Shares | | Value | |
Automatic Data Processing, Inc. | | | 688 | | | $ | 58,287 | | |
Broadridge Financial Solutions, Inc. | | | 975 | | | | 52,387 | | |
Cognizant Technology Solutions Corporation* | | | 645 | | | | 38,713 | | |
Fidelity National Information Services, Inc. | | | 682 | | | | 41,329 | | |
Fiserv, Inc.* | | | 640 | | | | 58,534 | | |
FleetCor Technologies, Inc.* | | | 319 | | | | 45,595 | | |
Gartner, Inc.* | | | 615 | | | | 55,780 | | |
Genpact Ltd.* | | | 2,168 | | | | 54,157 | | |
Global Payments, Inc. | | | 806 | | | | 51,995 | | |
International Business Machines Corporation | | | 346 | | | | 47,616 | | |
Jack Henry & Associates, Inc. | | | 914 | | | | 71,347 | | |
MasterCard, Inc. | | | 561 | | | | 54,619 | | |
Paychex, Inc. | | | 1,334 | | | | 70,555 | | |
The Western Union Company | | | 2,271 | | | | 40,674 | | |
Total System Services, Inc. | | | 1,028 | | | | 51,194 | | |
Visa, Inc. | | | 689 | | | | 53,432 | | |
Xerox Corporation | | | 3,744 | | | | 39,799 | | |
| | | | 1,001,084 | | |
Leisure Products (0.3%): | |
Hasbro, Inc. | | | 514 | | | | 34,623 | | |
Polaris Industries, Inc. | | | 308 | | | | 26,473 | | |
| | | | 61,096 | | |
Life Sciences Tools & Services (1.6%): | |
Agilent Technologies, Inc. | | | 1,352 | | | | 56,527 | | |
Illumina, Inc.* | | | 181 | | | | 34,742 | | |
Mettler-Toledo International, Inc.* | | | 174 | | | | 59,009 | | |
PerkinElmer, Inc. | | | 1,214 | | | | 65,034 | | |
Quintiles Transnational Holdings, Inc.* | | | 714 | | | | 49,023 | | |
Thermo Fisher Scientific, Inc. | | | 418 | | | | 59,293 | | |
Waters Corporation* | | | 433 | | | | 58,273 | | |
| | | | 381,901 | | |
Machinery (3.8%): | |
Allison Transmission Holdings, Inc. | | | 1,979 | | | | 51,236 | | |
Caterpillar, Inc. | | | 603 | | | | 40,980 | | |
Colfax Corporation* | | | 1,084 | | | | 25,311 | | |
Cummins, Inc. | | | 424 | | | | 37,316 | | |
Deere & Company | | | 625 | | | | 47,669 | | |
Dover Corporation | | | 710 | | | | 43,530 | | |
Flowserve Corporation | | | 964 | | | | 40,565 | | |
IDEX Corporation | | | 887 | | | | 67,953 | | |
Illinois Tool Works, Inc. | | | 697 | | | | 64,598 | | |
Ingersoll-Rand PLC | | | 954 | | | | 52,747 | | |
Lincoln Electric Holdings, Inc. | | | 794 | | | | 41,201 | | |
Middleby Corporation* | | | 382 | | | | 41,206 | | |
PACCAR, Inc. | | | 810 | | | | 38,394 | | |
Parker-Hannifin Corporation | | | 462 | | | | 44,805 | | |
Snap-On, Inc. | | | 355 | | | | 60,858 | | |
Stanley Black & Decker, Inc. | | | 561 | | | | 59,876 | | |
See notes to financial statements.
16
Victory Portfolios II
Victory CEMP US 500 Volatility Wtd Index ETF | | Schedule of Investments — continued
December 31, 2015 | |
(Unaudited)
Security Description | | Shares | | Value | |
WABCO Holdings, Inc.* | | | 355 | | | $ | 36,302 | | |
Wabtec Corporation | | | 482 | | | | 34,280 | | |
Xylem, Inc. | | | 1,644 | | | | 60,006 | | |
| | | | 888,833 | | |
Media (3.1%): | |
AMC Networks, Inc.* | | | 527 | | | | 39,356 | | |
Cablevision Systems Corporation | | | 982 | | | | 31,326 | | |
CBS Corporation | | | 1,017 | | | | 47,931 | | |
Comcast Corporation | | | 867 | | | | 48,925 | | |
Discovery Communications, Inc.* | | | 1,203 | | | | 32,096 | | |
DISH Network Corporation* | | | 737 | | | | 42,142 | | |
Lions Gate Entertainment Corporation | | | 940 | | | | 30,447 | | |
MSG Network, Inc.* | | | 2,600 | | | | 54,080 | | |
Omnicom Group, Inc. | | | 930 | | | | 70,364 | | |
Scripps Networks Interact, Inc. | | | 867 | | | | 47,867 | | |
Sirius XM Holdings, Inc.* | | | 14,087 | | | | 57,334 | | |
TEGNA, Inc. | | | 1,508 | | | | 38,484 | | |
The Walt Disney Company | | | 435 | | | | 45,710 | | |
Time Warner Cable, Inc. | | | 227 | | | | 42,129 | | |
Time Warner, Inc. | | | 644 | | | | 41,647 | | |
Twenty-First Century Fox, Inc. | | | 1,597 | | | | 43,374 | | |
| | | | 713,212 | | |
Metals & Mining (0.4%): | |
Alcoa, Inc. | | | 3,171 | | | | 31,298 | | |
Newmont Mining Corporation | | | 1,535 | | | | 27,615 | | |
Nucor Corporation | | | 925 | | | | 37,277 | | |
| | | | 96,190 | | |
Multiline Retail (0.6%): | |
Dollar General Corporation | | | 747 | | | | 53,687 | | |
Kohl's Corporation | | | 670 | | | | 31,912 | | |
Macy's, Inc. | | | 703 | | | | 24,591 | | |
Nordstrom, Inc. | | | 700 | | | | 34,867 | | |
| | | | 145,057 | | |
Multi-Utilities (3.0%): | |
Alliant Energy Corporation | | | 952 | | | | 59,452 | | |
Ameren Corporation | | | 1,320 | | | | 57,064 | | |
CenterPoint Energy, Inc. | | | 2,596 | | | | 47,663 | | |
CMS Energy Corporation | | | 1,470 | | | | 53,038 | | |
Consolidated Edison, Inc. | | | 889 | | | | 57,136 | | |
Dominion Resources, Inc. | | | 835 | | | | 56,479 | | |
DTE Energy Company | | | 675 | | | | 54,128 | | |
PG&E Corporation | | | 1,052 | | | | 55,956 | | |
Public Service Enterprise Group, Inc. | | | 1,169 | | | | 45,229 | | |
SCANA Corporation | | | 960 | | | | 58,070 | | |
Sempra Energy | | | 573 | | | | 53,868 | | |
TECO Energy, Inc. | | | 1,480 | | | | 39,442 | | |
WEC Energy Group, Inc. | | | 1,020 | | | | 52,336 | | |
| | | | 689,861 | | |
See notes to financial statements.
17
Victory Portfolios II
Victory CEMP US 500 Volatility Wtd Index ETF | | Schedule of Investments — continued
December 31, 2015 | |
(Unaudited)
Security Description | | Shares | | Value | |
Oil, Gas & Consumable Fuels (1.6%): | |
Cheniere Energy Partners LP Holdings LLC | | | 2,116 | | | $ | 36,819 | | |
Chevron Corporation | | | 541 | | | | 48,668 | | |
Exxon Mobil Corporation | | | 680 | | | | 53,006 | | |
Kinder Morgan, Inc. | | | 1,676 | | | | 25,006 | | |
Marathon Petroleum Corporation | | | 632 | | | | 32,763 | | |
ONEOK, Inc. | | | 782 | | | | 19,284 | | |
Phillips 66 | | | 433 | | | | 35,419 | | |
Plains GP Holdings LP | | | 1,212 | | | | 11,453 | | |
Spectra Energy Corporation | | | 1,565 | | | | 37,466 | | |
Tesoro Corporation | | | 296 | | | | 31,190 | | |
Valero Energy Corporation | | | 529 | | | | 37,406 | | |
Williams Companies, Inc. | | | 559 | | | | 14,366 | | |
| | | | 382,846 | | |
Paper & Forest Products (0.2%): | |
International Paper Company | | | 1,091 | | | | 41,131 | | |
Personal Products (0.3%): | |
Estee Lauder Companies, Inc. | | | 606 | | | | 53,365 | | |
Herbalife Ltd.* | | | 318 | | | | 17,051 | | |
| | | | 70,416 | | |
Pharmaceuticals (1.1%): | |
Eli Lilly and Company | | | 551 | | | | 46,427 | | |
Johnson & Johnson | | | 664 | | | | 68,206 | | |
Merck & Company, Inc. | | | 924 | | | | 48,806 | | |
Mylan NV* | | | 519 | | | | 28,062 | | |
Pfizer, Inc. | | | 1,862 | | | | 60,106 | | |
| | | | 251,607 | | |
Professional Services (1.4%): | |
Equifax, Inc. | | | 522 | | | | 58,135 | | |
IHS, Inc.* | | | 379 | | | | 44,885 | | |
ManpowerGroup, Inc. | | | 412 | | | | 34,727 | | |
Nielsen Holdings PLC | | | 1,052 | | | | 49,023 | | |
Robert Half International, Inc. | | | 897 | | | | 42,285 | | |
Towers Watson & Company | | | 402 | | | | 51,641 | | |
Verisk Analytics, Inc.* | | | 669 | | | | 51,433 | | |
| | | | 332,129 | | |
Real Estate Management & Development (0.4%): | |
CBRE Group, Inc.* | | | 1,372 | | | | 47,444 | | |
Jones Lang LaSalle, Inc. | | | 264 | | | | 42,203 | | |
| | | | 89,647 | | |
Road & Rail (1.4%): | |
AMERCO | | | 134 | | | | 52,193 | | |
CSX Corporation | | | 1,477 | | | | 38,328 | | |
JB Hunt Transport Services, Inc. | | | 711 | | | | 52,159 | | |
Kansas City Southern | | | 407 | | | | 30,391 | | |
Norfolk Southern Corporation | | | 604 | | | | 51,092 | | |
Old Dominion Freight Line, Inc.* | | | 726 | | | | 42,885 | | |
See notes to financial statements.
18
Victory Portfolios II
Victory CEMP US 500 Volatility Wtd Index ETF | | Schedule of Investments — continued
December 31, 2015 | |
(Unaudited)
Security Description | | Shares | | Value | |
Ryder System, Inc. | | | 549 | | | $ | 31,200 | | |
Union Pacific Corporation | | | 495 | | | | 38,709 | | |
| | | | 336,957 | | |
Semiconductors & Semiconductor Equipment (2.3%): | |
Analog Devices, Inc. | | | 610 | | | | 33,745 | | |
Applied Materials, Inc. | | | 2,381 | | | | 44,453 | | |
Intel Corporation | | | 2,182 | | | | 75,170 | | |
KLA-Tencor Corporation | | | 787 | | | | 54,578 | | |
Lam Research Corporation | | | 528 | | | | 41,934 | | |
Linear Technology Corporation | | | 1,106 | | | | 46,972 | | |
Microchip Technology, Inc. | | | 988 | | | | 45,982 | | |
Micron Technology, Inc.* | | | 1,243 | | | | 17,601 | | |
NVIDIA Corporation | | | 1,394 | | | | 45,946 | | |
NXP Semiconductors NV* | | | 1 | | | | 61 | | |
Skyworks Solutions, Inc. | | | 320 | | | | 24,586 | | |
Texas Instruments, Inc. | | | 873 | | | | 47,849 | | |
Xilinx, Inc. | | | 1,017 | | | | 47,768 | | |
| | | | 526,645 | | |
Software (2.8%): | |
Adobe Systems, Inc.* | | | 603 | | | | 56,646 | | |
ANSYS, Inc.* | | | 585 | | | | 54,112 | | |
CA, Inc. | | | 1,804 | | | | 51,522 | | |
Cadence Design System, Inc.* | | | 2,021 | | | | 42,057 | | |
Citrix Systems, Inc.* | | | 554 | | | | 41,910 | | |
Electronic Arts, Inc.* | | | 526 | | | | 36,147 | | |
Oracle Corporation | | | 1,390 | | | | 50,777 | | |
Red Hat, Inc.* | | | 596 | | | | 49,355 | | |
SS&C Technologies Holdings, Inc. | | | 547 | | | | 37,344 | | |
Symantec Corporation | | | 1,968 | | | | 41,328 | | |
Synopsys, Inc.* | | | 1,200 | | | | 54,732 | | |
Tyler Technologies, Inc.* | | | 299 | | | | 52,122 | | |
Ultimate Software Group, Inc.* | | | 234 | | | | 45,749 | | |
VMware, Inc.* | | | 497 | | | | 28,115 | | |
| | | | 641,916 | | |
Specialty Retail (3.8%): | |
Advance Auto Parts, Inc. | | | 236 | | | | 35,520 | | |
AutoNation, Inc.* | | | 805 | | | | 48,026 | | |
AutoZone, Inc.* | | | 83 | | | | 61,579 | | |
Bed Bath & Beyond, Inc.* | | | 747 | | | | 36,043 | | |
Best Buy Company, Inc. | | | 769 | | | | 23,416 | | |
CarMax, Inc.* | | | 710 | | | | 38,319 | | |
Dick's Sporting Goods, Inc. | | | 761 | | | | 26,901 | | |
Foot Locker, Inc. | | | 688 | | | | 44,782 | | |
GameStop Corporation | | | 743 | | | | 20,834 | | |
L Brands, Inc. | | | 511 | | | | 48,964 | | |
Lowe's Companies, Inc. | | | 736 | | | | 55,965 | | |
O'Reilly Automotive, Inc.* | | | 196 | | | | 49,670 | | |
Penske Automotive Group, Inc. | | | 726 | | | | 30,739 | | |
Ross Stores, Inc. | | | 861 | | | | 46,330 | | |
See notes to financial statements.
19
Victory Portfolios II
Victory CEMP US 500 Volatility Wtd Index ETF | | Schedule of Investments — continued
December 31, 2015 | |
(Unaudited)
Security Description | | Shares | | Value | |
The Gap, Inc. | | | 1,558 | | | $ | 38,483 | | |
The Home Depot, Inc. | | | 444 | | | | 58,719 | | |
The TJX Companies, Inc. | | | 705 | | | | 49,992 | | |
Tiffany & Company | | | 383 | | | | 29,219 | | |
Tractor Supply Company | | | 507 | | | | 43,348 | | |
Ulta Salon, Cosmetics & Fragrances, Inc.* | | | 321 | | | | 59,385 | | |
Williams-Sonoma, Inc. | | | 611 | | | | 35,689 | | |
| | | | 881,923 | | |
Technology Hardware, Storage & Peripherals (0.8%): | |
Apple, Inc. | | | 349 | | | | 36,736 | | |
EMC Corporation | | | 1,680 | | | | 43,142 | | |
HP, Inc. | | | 2,872 | | | | 34,005 | | |
SanDisk Corporation | | | 393 | | | | 29,864 | | |
Seagate Technology PLC | | | 699 | | | | 25,625 | | |
Western Digital Corporation | | | 428 | | | | 25,701 | | |
| | | | 195,073 | | |
Textiles, Apparel & Luxury Goods (1.4%): | |
Carter's, Inc. | | | 499 | | | | 44,426 | | |
Coach, Inc. | | | 1,268 | | | | 41,502 | | |
Hanesbrands, Inc. | | | 1,255 | | | | 36,935 | | |
NIKE, Inc. | | | 962 | | | | 60,125 | | |
PVH Corporation | | | 327 | | | | 24,084 | | |
Ralph Lauren Corporation | | | 296 | | | | 32,998 | | |
Skechers U.S.A., Inc.* | | | 578 | | | | 17,461 | | |
Under Armour, Inc.* | | | 386 | | | | 31,115 | | |
VF Corporation | | | 729 | | | | 45,380 | | |
| | | | 334,026 | | |
Thrifts & Mortgage Finance (0.6%): | |
New York Community Bancorp, Inc. | | | 3,343 | | | | 54,558 | | |
TFS Financial Corporation | | | 4,194 | | | | 78,973 | | |
| | | | 133,531 | | |
Tobacco (0.8%): | |
Altria Group, Inc. | | | 1,062 | | | | 61,819 | | |
Philip Morris International, Inc. | | | 681 | | | | 59,867 | | |
Reynolds American, Inc. | | | 1,152 | | | | 53,165 | | |
| | | | 174,851 | | |
Trading Companies & Distributors (0.5%): | |
Fastenal Company | | | 1,179 | | | | 48,127 | | |
United Rentals, Inc.* | | | 371 | | | | 26,912 | | |
W.W. Grainger, Inc. | | | 258 | | | | 52,268 | | |
| | | | 127,307 | | |
Water Utilities (0.6%): | |
American Water Works Company, Inc. | | | 1,143 | | | | 68,294 | | |
Aqua America, Inc. | | | 2,116 | | | | 63,056 | | |
| | | | 131,350 | | |
Total Common Stocks (Cost $23,464,975) | | | 23,183,579 | | |
See notes to financial statements.
20
Victory Portfolios II
Victory CEMP US 500 Volatility Wtd Index ETF | | Schedule of Investments — continued
December 31, 2015 | |
(Unaudited)
Security Description | | Shares | | Value | |
Short-Term Investments (0.3%) | |
Money Market Funds (0.3%): | |
Short Term Investment Trust Liquid Assets Portfolio, 0.29%^ | | | 77,649 | | | $ | 77,649 | | |
Total Short-Term Investments — (Cost $77,649) | | | 77,649 | | |
Total Investments — 100.0% (Cost $23,542,624) | | | 23,261,228 | | |
Liabilities in excess of other assets — 0.0%# | | | (3,158 | ) | |
NET ASSETS — 100.0% | | $ | 23,258,070 | | |
* Non-income producing security.
^ Annualized seven-day yield as of December 31, 2015.
# Less than 0.05%.
The Global Industry Classification Standard (GICS®) was developed by and/or is the exclusive property of MSCI, Inc. and Standard & Poor's Financial Services LLC ("S&P"). GICS® is a service mark of MSCI, Inc. and S&P and has been licensed for use by the Fund's Administrator, U.S. Bancorp Fund Services, LLC.
Schedule of Open Futures Contracts
Number of
Contracts
Purchased | | Description | | Notional Amount | | Unrealized
Depreciation | |
| | 1 | | | S&P 500 E-Mini Future, March 2016 | | $ | 101,770 | | | $ | (445 | ) | |
| | | $ | (445 | ) | |
See notes to financial statements.
21
Victory Portfolios II
Victory CEMP US Discovery Enhanced Volatility Wtd Index ETF | | Schedule of Investments
December 31, 2015 | |
(Unaudited)
Security Description | | Shares | | Value | |
Common Stocks (99.3%) | |
Aerospace & Defense (0.7%): | |
Astronics Corporation* | | | 752 | | | $ | 30,614 | | |
Moog, Inc.* | | | 1,103 | | | | 66,842 | | |
National Presto Industries, Inc. | | | 773 | | | | 64,051 | | |
TASER International, Inc.* | | | 1,174 | | | | 20,298 | | |
| | | | 181,805 | | |
Air Freight & Logistics (0.8%): | |
Air Transport Services Group, Inc.* | | | 5,808 | | | | 58,545 | | |
Atlas Air Worldwide Holdings, Inc.* | | | 1,047 | | | | 43,283 | | |
Forward Air Corporation | | | 1,352 | | | | 58,149 | | |
Hub Group, Inc.* | | | 1,321 | | | | 43,527 | | |
| | | | 203,504 | | |
Airlines (0.1%): | |
Hawaiian Holdings, Inc.* | | | 1,066 | | | | 37,662 | | |
Auto Components (1.8%): | |
American Axle & Manufacturing Holdings, Inc.* | | | 2,714 | | | | 51,403 | | |
Cooper Tire & Rubber Company | | | 1,211 | | | | 45,836 | | |
Dana Holding Corporation | | | 3,187 | | | | 43,981 | | |
Dorman Products, Inc.* | | | 1,199 | | | | 56,917 | | |
Drew Industries, Inc. | | | 1,063 | | | | 64,726 | | |
Gentherm, Inc.* | | | 919 | | | | 43,561 | | |
Motorcar Parts of America, Inc.* | | | 1,098 | | | | 37,123 | | |
Standard Motor Products, Inc. | | | 1,372 | | | | 52,205 | | |
Tenneco, Inc.* | | | 1,229 | | | | 56,423 | | |
| | | | 452,175 | | |
Automobiles (0.3%): | |
Thor Industries, Inc. | | | 1,279 | | | | 71,816 | | |
Banks (15.3%): | |
1st Source Corporation | | | 2,003 | | | | 61,833 | | |
Ameris Bancorp | | | 2,266 | | | | 77,021 | | |
Associated Banc-Corp | | | 3,455 | | | | 64,781 | | |
BancFirst Corporation | | | 1,087 | | | | 63,720 | | |
BancorpSouth, Inc. | | | 2,248 | | | | 53,930 | �� | |
Bank of Hawaii Corporation | | | 1,246 | | | | 78,373 | | |
Banner Corporation | | | 1,365 | | | | 62,599 | | |
BBCN Bancorp, Inc. | | | 3,903 | | | | 67,210 | | |
Berkshire Hills Bancorp, Inc. | | | 2,931 | | | | 85,321 | | |
BNC Bancorp | | | 3,046 | | | | 77,308 | | |
Boston Private Financial Holdings, Inc. | | | 4,186 | | | | 47,469 | | |
Capital Bank Financial Corporation | | | 2,079 | | | | 66,486 | | |
Cathay General Bancorp | | | 1,914 | | | | 59,966 | | |
Chemical Financial Corporation | | | 2,161 | | | | 74,058 | | |
Columbia Banking Systems, Inc. | | | 2,044 | | | | 66,450 | | |
Community Bank Systems, Inc. | | | 1,988 | | | | 79,401 | | |
CVB Financial Corporation | | | 3,798 | | | | 64,262 | | |
Eagle Bancorp, Inc.* | | | 1,709 | | | | 86,253 | | |
See notes to financial statements.
22
Victory Portfolios II
Victory CEMP US Discovery Enhanced Volatility Wtd Index ETF | | Schedule of Investments — continued
December 31, 2015 | |
(Unaudited)
Security Description | | Shares | | Value | |
First Citizens Bancshares, Inc. | | | 282 | | | $ | 72,804 | | |
First Financial Bancorp | | | 3,246 | | | | 58,655 | | |
First Financial Bankshares, Inc. | | | 1,813 | | | | 54,698 | | |
First Interstate BancSystem, Inc. | | | 2,455 | | | | 71,367 | | |
First Merchants Corporation | | | 2,812 | | | | 71,481 | | |
First Midwest Bancorp, Inc. | | | 3,698 | | | | 68,154 | | |
FirstMerit Corporation | | | 3,333 | | | | 62,160 | | |
FNB Corporation | | | 5,131 | | | | 68,448 | | |
Fulton Financial Corporation | | | 6,013 | | | | 78,229 | | |
Glacier Bancorp, Inc. | | | 2,056 | | | | 54,546 | | |
Hancock Holdings Company | | | 1,697 | | | | 42,714 | | |
Hilltop Holdings, Inc.* | | | 2,857 | | | | 54,912 | | |
Home BancShares, Inc. | | | 1,547 | | | | 62,684 | | |
IBERIABANK Corporation | | | 933 | | | | 51,380 | | |
Independent Bank Corporation | | | 1,425 | | | | 66,291 | | |
International Bancshares Corporation | | | 2,055 | | | | 52,814 | | |
LegacyTexas Financial Group, Inc. | | | 1,535 | | | | 38,406 | | |
MB Financial, Inc. | | | 1,760 | | | | 56,971 | | |
National Penn Bancshares, Inc. | | | 4,385 | | | | 54,067 | | |
NBT Bancorp, Inc. | | | 2,558 | | | | 71,317 | | |
Old National Bancorp | | | 4,505 | | | | 61,088 | | |
Opus Bank | | | 1,511 | | | | 55,862 | | |
Park National Corporation | | | 828 | | | | 74,917 | | |
Pinnacle Financial Partners, Inc. | | | 1,151 | | | | 59,115 | | |
PrivateBancorp, Inc. | | | 1,444 | | | | 59,233 | | |
Renasant Corporation | | | 2,277 | | | | 78,352 | | |
S&T Bancorp, Inc. | | | 2,095 | | | | 64,568 | | |
ServisFirst Bancshares, Inc. | | | 1,719 | | | | 81,704 | | |
Simmons First National Corporation | | | 1,409 | | | | 72,366 | | |
South State Corporation | | | 893 | | | | 64,251 | | |
Talmer Bancorp, Inc. | | | 4,353 | | | | 78,833 | | |
TCF Financial Corporation | | | 4,003 | | | | 56,522 | | |
Texas Capital BancShares, Inc.* | | | 905 | | | | 44,725 | | |
Towne Bank | | | 3,515 | | | | 73,358 | | |
Trustmark Corporation | | | 2,819 | | | | 64,950 | | |
UMB Financial Corporation | | | 1,129 | | | | 52,555 | | |
Union Bankshares Corporation | | | 2,587 | | | | 65,296 | | |
United Bankshares, Inc. | | | 1,694 | | | | 62,661 | | |
United Community Banks, Inc. | | | 3,157 | | | | 61,530 | | |
Valley National Bancorp | | | 8,648 | | | | 85,183 | | |
WesBanco, Inc. | | | 2,164 | | | | 64,963 | | |
Westamerica Bancorp | | | 1,456 | | | | 68,068 | | |
Wintrust Financial Corporation | | | 1,366 | | | | 66,278 | | |
| | | | 3,964,917 | | |
Beverages (0.4%): | |
Boston Beer Company, Inc.* | | | 231 | | | | 46,641 | | |
Coca-Cola Bottling Company Consolidated | | | 292 | | | | 53,293 | | |
| | | | 99,934 | | |
See notes to financial statements.
23
Victory Portfolios II
Victory CEMP US Discovery Enhanced Volatility Wtd Index ETF | | Schedule of Investments — continued
December 31, 2015 | |
(Unaudited)
Security Description | | Shares | | Value | |
Biotechnology (0.5%): | |
Insys Therapeutics, Inc.* | | | 866 | | | $ | 24,793 | | |
Ligand Pharmaceuticals, Inc.* | | | 342 | | | | 37,080 | | |
Myriad Genetics, Inc.* | | | 1,007 | | | | 43,462 | | |
PDL BioPharma, Inc. | | | 9,430 | | | | 33,382 | | |
| | | | 138,717 | | |
Building Products (1.7%): | |
AAON, Inc. | | | 2,691 | | | | 62,485 | | |
American Woodmark Corporation* | | | 614 | | | | 49,108 | | |
Apogee Enterprises, Inc. | | | 738 | | | | 32,110 | | |
Griffon Corporation | | | 3,449 | | | | 61,392 | | |
Patrick Industries, Inc.* | | | 954 | | | | 41,499 | | |
PGT, Inc.* | | | 2,339 | | | | 26,641 | | |
Simpson Manufacturing Company, Inc. | | | 2,097 | | | | 71,613 | | |
Trex Company, Inc.* | | | 948 | | | | 36,062 | | |
Universal Forest Products, Inc. | | | 799 | | | | 54,628 | | |
| | | | 435,538 | | |
Capital Markets (1.7%): | |
Cohen & Steers, Inc. | | | 2,142 | | | | 65,288 | | |
Evercore Partners, Inc. | | | 1,140 | | | | 61,640 | | |
Financial Engines, Inc. | | | 1,273 | | | | 42,862 | | |
Gamco Investors, Inc. | | | 1,637 | | | | 50,812 | | |
Greenhill & Company, Inc. | | | 1,602 | | | | 45,833 | | |
HFF, Inc. | | | 1,305 | | | | 40,546 | | |
Janus Capital Group, Inc. | | | 3,290 | | | | 46,356 | | |
Manning & Napier, Inc. | | | 3,650 | | | | 30,989 | | |
Virtus Investment Partners, Inc. | | | 347 | | | | 40,759 | | |
WisdomTree Investments, Inc. | | | 1,622 | | | | 25,433 | | |
| | | | 450,518 | | |
Chemicals (2.4%): | |
Balchem Corporation | | | 774 | | | | 47,059 | | |
Calgon Carbon Corporation | | | 3,298 | | | | 56,890 | | |
Chemtura Corporation* | | | 1,813 | | | | 49,441 | | |
Ferro Corporation* | | | 3,816 | | | | 42,434 | | |
HB Fuller Company | | | 1,929 | | | | 70,351 | | |
Innophos Holdings, Inc. | | | 1,264 | | | | 36,631 | | |
Innospec, Inc. | | | 1,291 | | | | 70,114 | | |
Minerals Technologies, Inc. | | | 808 | | | | 37,055 | | |
Olin Corporation | | | 2,215 | | | | 38,231 | | |
Quaker Chemical Corporation | | | 600 | | | | 46,356 | | |
Sensient Technologies Corporation | | | 1,070 | | | | 67,217 | | |
Stepan Company | | | 1,081 | | | | 53,715 | | |
| | | | 615,494 | | |
Commercial Services & Supplies (3.4%): | |
ABM Industries, Inc. | | | 2,672 | | | | 76,072 | | |
Deluxe Corporation | | | 1,007 | | | | 54,922 | | |
G&K Services, Inc. | | | 1,048 | | | | 65,919 | | |
Herman Miller, Inc. | | | 2,403 | | | | 68,966 | | |
See notes to financial statements.
24
Victory Portfolios II
Victory CEMP US Discovery Enhanced Volatility Wtd Index ETF | | Schedule of Investments — continued
December 31, 2015 | |
(Unaudited)
Security Description | | Shares | | Value | |
HNI Corporation | | | 1,069 | | | $ | 38,548 | | |
Knoll, Inc. | | | 2,480 | | | | 46,624 | | |
Matthews International Corporation | | | 1,444 | | | | 77,182 | | |
McGrath RentCorp | | | 2,298 | | | | 57,887 | | |
MSA Safety, Inc. | | | 963 | | | | 41,862 | | |
Multi-Color Corporation | | | 724 | | | | 43,302 | | |
Steelcase, Inc. | | | 3,507 | | | | 52,254 | | |
Team, Inc.* | | | 1,378 | | | | 44,041 | | |
Tetra Tech, Inc. | | | 2,448 | | | | 63,697 | | |
UniFirst Corporation | | | 665 | | | | 69,293 | | |
US Ecology, Inc. | | | 1,069 | | | | 38,954 | | |
West Corporation | | | 1,801 | | | | 38,847 | | |
| | | | 878,370 | | |
Communications Equipment (1.2%): | |
ADTRAN, Inc. | | | 3,266 | | | | 56,240 | | |
CalAmp Corporation* | | | 2,098 | | | | 41,813 | | |
Infinera Corporation* | | | 1,541 | | | | 27,923 | | |
InterDigital, Inc. | | | 1,170 | | | | 57,377 | | |
Plantronics, Inc. | | | 1,149 | | | | 54,486 | | |
Polycom, Inc.* | | | 5,030 | | | | 63,328 | | |
| | | | 301,167 | | |
Construction & Engineering (1.1%): | |
Argan, Inc. | | | 1,015 | | | | 32,886 | | |
Comfort Systems USA, Inc. | | | 1,510 | | | | 42,914 | | |
Dycom Industries, Inc.* | | | 410 | | | | 28,684 | | |
EMCOR Group, Inc. | | | 1,514 | | | | 72,732 | | |
MYR Group, Inc.* | | | 1,893 | | | | 39,015 | | |
Primoris Services Corporation | | | 1,829 | | | | 40,293 | | |
Tutor Perini Corporation* | | | 1,934 | | | | 32,375 | | |
| | | | 288,899 | | |
Consumer Finance (0.7%): | |
Encore Capital Group, Inc.* | | | 1,500 | | | | 43,620 | | |
First Cash Financial Services, Inc.* | | | 1,358 | | | | 50,830 | | |
Nelnet, Inc. | | | 1,679 | | | | 56,364 | | |
PRA Group, Inc.* | | | 1,044 | | | | 36,216 | | |
| | | | 187,030 | | |
Containers & Packaging (0.2%): | |
Greif, Inc. | | | 1,238 | | | | 38,143 | | |
Distributors (0.2%): | |
Core-Mark Holding Company, Inc. | | | 757 | | | | 62,028 | | |
Diversified Consumer Services (0.7%): | |
Capella Education Company | | | 948 | | | | 43,817 | | |
DeVry Education Group, Inc. | | | 1,250 | | | | 31,637 | | |
Grand Canyon Education, Inc.* | | | 1,653 | | | | 66,318 | | |
Strayer Education, Inc.* | | | 622 | | | | 37,395 | | |
| | | | 179,167 | | |
See notes to financial statements.
25
Victory Portfolios II
Victory CEMP US Discovery Enhanced Volatility Wtd Index ETF | | Schedule of Investments — continued
December 31, 2015 | |
(Unaudited)
Security Description | | Shares | | Value | |
Diversified Telecommunication Services (0.5%): | |
Inteliquent, Inc. | | | 1,506 | | | $ | 26,761 | | |
Iridium Communications, Inc.* | | | 6,364 | | | | 53,521 | | |
Vonage Holdings Corporation* | | | 6,459 | | | | 37,075 | | |
| | | | 117,357 | | |
Electric Utilities (2.0%): | |
ALLETE, Inc. | | | 1,464 | | | | 74,415 | | |
El Paso Electric Company | | | 1,952 | | | | 75,152 | | |
IdaCorp, Inc. | | | 1,177 | | | | 80,036 | | |
MGE Energy, Inc. | | | 1,646 | | | | 76,374 | | |
Otter Tail Corporation | | | 2,374 | | | | 63,220 | | |
PNM Resources, Inc. | | | 2,447 | | | | 74,805 | | |
The Empire District Electric Company | | | 2,937 | | | | 82,441 | | |
| | | | 526,443 | | |
Electrical Equipment (1.2%): | |
AZZ, Inc. | | | 1,052 | | | | 58,460 | | |
Encore Wire Corporation | | | 1,222 | | | | 45,324 | | |
EnerSys | | | 1,128 | | | | 63,089 | | |
Franklin Electric Company, Inc. | | | 2,154 | | | | 58,223 | | |
Generac Holdings, Inc.* | | | 1,373 | | | | 40,874 | | |
Thermon Group Holdings, Inc.* | | | 2,560 | | | | 43,315 | | |
| | | | 309,285 | | |
Electronic Equipment, Instruments & Components (4.6%): | |
Anixter International, Inc.* | | | 948 | | | | 57,250 | | |
AVX Corporation | | | 4,277 | | | | 51,923 | | |
Badger Meter, Inc. | | | 1,011 | | | | 59,235 | | |
Benchmark Electronics, Inc.* | | | 3,164 | | | | 65,400 | | |
Coherent, Inc.* | | | 903 | | | | 58,794 | | |
CTS Corporation | | | 3,646 | | | | 64,315 | | |
ePlus, Inc.* | | | 532 | | | | 49,614 | | |
FARO Technologies, Inc.* | | | 837 | | | | 24,708 | | |
II-VI, Inc.* | | | 2,700 | | | | 50,112 | | |
Insight Enterprises, Inc.* | | | 2,040 | | | | 51,245 | | |
Littelfuse, Inc. | | | 645 | | | | 69,021 | | |
Methode Electronics, Inc. | | | 923 | | | | 29,379 | | |
MTS Systems Corporation | | | 1,080 | | | | 68,483 | | |
Newport Corporation* | | | 3,590 | | | | 56,973 | | |
OSI Systems, Inc.* | | | 926 | | | | 82,099 | | |
Plexus Corporation* | | | 1,582 | | | | 55,243 | | |
Rofin-Sinar Technologies, Inc.* | | | 1,941 | | | | 51,980 | | |
Rogers Corporation* | | | 935 | | | | 48,218 | | |
Sanmina Corporation* | | | 2,075 | | | | 42,704 | | |
ScanSource, Inc.* | | | 1,300 | | | | 41,886 | | |
Tech Data Corporation* | | | 659 | | | | 43,744 | | |
Vishay Intertechnology, Inc. | | | 6,470 | | | | 77,964 | | |
| | | | 1,200,290 | | |
See notes to financial statements.
26
Victory Portfolios II
Victory CEMP US Discovery Enhanced Volatility Wtd Index ETF | | Schedule of Investments — continued
December 31, 2015 | |
(Unaudited)
Security Description | | Shares | | Value | |
Energy Equipment & Services (0.5%): | |
Atwood Oceanics, Inc. | | | 1,675 | | | $ | 17,135 | | |
Dril-Quip, Inc.* | | | 635 | | | | 37,611 | | |
Forum Energy Technologies, Inc.* | | | 1,918 | | | | 23,898 | | |
Hornbeck Offshore Services, Inc.* | | | 1,395 | | | | 13,867 | | |
U.S. Silica Holdings, Inc. | | | 1,234 | | | | 23,113 | | |
| | | | 115,624 | | |
Food & Staples Retailing (1.4%): | |
Ingles Markets, Inc. | | | 613 | | | | 27,021 | | |
PriceSmart, Inc. | | | 632 | | | | 52,450 | | |
Smart & Final Stores, Inc.* | | | 2,547 | | | | 46,381 | | |
SpartanNash Company | | | 2,096 | | | | 45,357 | | |
SUPERVALU, Inc.* | | | 5,275 | | | | 35,764 | | |
The Andersons, Inc. | | | 1,151 | | | | 36,406 | | |
The Fresh Market, Inc.* | | | 1,414 | | | | 33,116 | | |
United Natural Foods, Inc.* | | | 828 | | | | 32,590 | | |
Weis Markets, Inc. | | | 1,382 | | | | 61,223 | | |
| | | | 370,308 | | |
Food Products (1.6%): | |
Cal-Maine Foods, Inc. | | | 613 | | | | 28,407 | | |
J&J Snack Foods Corporation | | | 478 | | | | 55,768 | | |
John B. Sanfilippo & Son, Inc. | | | 769 | | | | 41,549 | | |
Lancaster Colony Corporation | | | 846 | | | | 97,679 | | |
Sanderson Farms, Inc. | | | 700 | | | | 54,264 | | |
Snyder's-Lance, Inc. | | | 2,204 | | | | 75,597 | | |
Tootsie Roll Industries, Inc. | | | 2,073 | | | | 65,486 | | |
| | | | 418,750 | | |
Gas Utilities (0.8%): | |
Chesapeake Utilities Corporation | | | 1,010 | | | | 57,317 | | |
ONE Gas, Inc. | | | 1,621 | | | | 81,326 | | |
Southwest Gas Corporation | | | 1,316 | | | | 72,591 | | |
| | | | 211,234 | | |
Health Care Equipment & Supplies (3.8%): | |
Abaxis, Inc. | | | 899 | | | | 50,056 | | |
Analogic Corporation | | | 782 | | | | 64,593 | | |
Atrion Corporation | | | 164 | | | | 62,517 | | |
Cantel Medical Corporation | | | 1,045 | | | | 64,936 | | |
CONMED Corporation | | | 1,183 | | | | 52,111 | | |
Globus Medical, Inc.* | | | 2,483 | | | | 69,077 | | |
Greatbatch, Inc.* | | | 913 | | | | 47,933 | | |
Hill-Rom Holdings, Inc. | | | 1,576 | | | | 75,743 | | |
ICU Medical, Inc.* | | | 413 | | | | 46,578 | | |
Inogen, Inc.* | | | 622 | | | | 24,936 | | |
Integra LifeSciences Holdings Corporation* | | | 973 | | | | 65,950 | | |
LivaNova PLC* | | | 738 | | | | 43,815 | | |
Masimo Corporation* | | | 1,204 | | | | 49,978 | | |
Meridian Bioscience, Inc. | | | 3,664 | | | | 75,185 | | |
Merit Medical Systems, Inc.* | | | 1,992 | | | | 37,031 | | |
See notes to financial statements.
27
Victory Portfolios II
Victory CEMP US Discovery Enhanced Volatility Wtd Index ETF | | Schedule of Investments — continued
December 31, 2015 | |
(Unaudited)
Security Description | | Shares | | Value | |
Natus Medical, Inc.* | | | 1,255 | | | $ | 60,303 | | |
Neogen Corporation* | | | 807 | | | | 45,612 | | |
Vascular Solutions, Inc.* | | | 1,126 | | | | 38,723 | | |
| | | | 975,077 | | |
Health Care Providers & Services (2.8%): | |
Aceto Corporation | | | 1,790 | | | | 48,294 | | |
Air Methods Corporation* | | | 1,063 | | | | 44,572 | | |
AMN Healthcare Services, Inc.* | | | 1,171 | | | | 36,360 | | |
Chemed Corporation | | | 526 | | | | 78,795 | | |
CorVel Corporation* | | | 1,534 | | | | 67,373 | | |
Hanger, Inc.* | | | 2,861 | | | | 47,063 | | |
HealthEquity, Inc.* | | | 1,198 | | | | 30,034 | | |
LHC Group, Inc.* | | | 756 | | | | 34,239 | | |
Magellan Health, Inc.* | | | 843 | | | | 51,979 | | |
Owens & Minor, Inc. | | | 2,369 | | | | 85,237 | | |
Providence Service Corporation* | | | 749 | | | | 35,143 | | |
Select Medical Holdings Corporation | | | 3,576 | | | | 42,590 | | |
The Ensign Group, Inc. | | | 2,280 | | | | 51,596 | | |
U.S. Physical Therapy, Inc. | | | 1,138 | | | | 61,088 | | |
| | | | 714,363 | | |
Health Care Technology (0.5%): | |
HealthStream, Inc.* | | | 1,823 | | | | 40,106 | | |
Omnicell, Inc.* | | | 1,618 | | | | 50,287 | | |
Quality Systems, Inc. | | | 3,047 | | | | 49,118 | | |
| | | | 139,511 | | |
Hotels, Restaurants & Leisure (3.0%): | |
Biglari Holdings, Inc.* | | | 141 | | | | 45,941 | | |
BJ's Restaurants, Inc.* | | | 1,032 | | | | 44,861 | | |
Choice Hotels International, Inc. | | | 1,370 | | | | 69,062 | | |
Denny's Corporation* | | | 3,936 | | | | 38,691 | | |
Fiesta Restaurant Group, Inc.* | | | 838 | | | | 28,157 | | |
Interval Leisure Group, Inc. | | | 3,179 | | | | 49,624 | | |
Jack In The Box, Inc, | | | 706 | | | | 54,157 | | |
Krispy Kreme Doughnuts, Inc.* | | | 2,560 | | | | 38,579 | | |
Marriott Vacations Worldwide Corporation | | | 784 | | | | 44,649 | | |
Papa John's International, Inc. | | | 858 | | | | 47,936 | | |
Popeyes Louisiana Kitchen, Inc.* | | | 917 | | | | 53,644 | | |
Red Robin Gourmet Burgers, Inc.* | | | 511 | | | | 31,549 | | |
Sonic Corporation | | | 1,441 | | | | 46,559 | | |
Texas Roadhouse, Inc. | | | 1,708 | | | | 61,095 | | |
The Cheesecake Factory, Inc. | | | 1,241 | | | | 57,223 | | |
Wendy's Company | | | 6,166 | | | | 66,408 | | |
| | | | 778,135 | | |
Household Durables (2.9%): | |
CalAtlantic Group, Inc. | | | 2,142 | | | | 81,225 | | |
Cavco Industries, Inc.* | | | 639 | | | | 53,235 | | |
Ethan Allen Interiors, Inc. | | | 1,466 | | | | 40,784 | | |
Installed Building Products, Inc.* | | | 1,389 | | | | 34,489 | | |
See notes to financial statements.
28
Victory Portfolios II
Victory CEMP US Discovery Enhanced Volatility Wtd Index ETF | | Schedule of Investments — continued
December 31, 2015 | |
(Unaudited)
Security Description | | Shares | | Value | |
iRobot Corporation* | | | 1,700 | | | $ | 60,180 | | |
KB Home | | | 2,405 | | | | 29,654 | | |
La-Z-Boy, Inc. | | | 2,259 | | | | 55,165 | | |
M/I Homes, Inc.* | | | 2,109 | | | | 46,229 | | |
MDC Holdings, Inc. | | | 1,992 | | | | 50,856 | | |
Meritage Homes Corporation* | | | 1,047 | | | | 35,587 | | |
Taylor Morrison Home Corporation* | | | 2,161 | | | | 34,576 | | |
TRI Pointe Homes, Inc.* | | | 3,512 | | | | 44,497 | | |
Tupperware Brands Corporation | | | 968 | | | | 53,869 | | |
Universal Electronics, Inc.* | | | 1,134 | | | | 58,231 | | |
WCI Communities, Inc.* | | | 1,956 | | | | 43,580 | | |
William Lyon Homes* | | | 1,679 | | | | 27,703 | | |
| | | | 749,860 | | |
Household Products (0.3%): | |
WD-40 Company | | | 765 | | | | 75,467 | | |
Independent Power Producers & Energy Traders (0.2%): | |
Ormat Technologies, Inc. | | | 1,392 | | | | 50,766 | | |
Industrial Conglomerates (0.2%): | |
Raven Industries, Inc. | | | 2,466 | | | | 38,470 | | |
Insurance (3.9%): | |
American Equity Investment Life Holding Company | | | 2,080 | | | | 49,982 | | |
American National Insurance Company | | | 639 | | | | 65,351 | | |
AMERISAFE, Inc. | | | 1,321 | | | | 67,239 | | |
FBL Financial Group, Inc. | | | 1,075 | | | | 68,413 | | |
Horace Mann Educators Corporation | | | 2,065 | | | | 68,517 | | |
Infinity Property & Casualty Corporation | | | 938 | | | | 77,132 | | |
Kemper Corporation | | | 2,023 | | | | 75,357 | | |
MBIA, Inc.* | | | 3,927 | | | | 25,447 | | |
National General Holdings Corporation | | | 3,091 | | | | 67,569 | | |
Navigators Group, Inc.* | | | 1,072 | | | | 91,967 | | |
Primerica, Inc. | | | 1,279 | | | | 60,407 | | |
ProAssurance Corporation | | | 2,246 | | | | 108,998 | | |
RLI Corporation | | | 1,214 | | | | 74,964 | | |
Selective Insurance Group, Inc. | | | 2,303 | | | | 77,335 | | |
Universal Insurance Holdings, Inc. | | | 1,365 | | | | 31,641 | | |
| | | | 1,010,319 | | |
Internet & Catalog Retail (0.4%): | |
FTD Companies, Inc.* | | | 1,635 | | | | 42,788 | | |
Lands' End, Inc.* | | | 1,156 | | | | 27,096 | | |
Nutrisystem, Inc. | | | 1,167 | | | | 25,254 | | |
| | | | 95,138 | | |
Internet Software & Services (1.3%): | |
Constant Contact, Inc.* | | | 1,260 | | | | 36,842 | | |
Envestnet, Inc.* | | | 715 | | | | 21,343 | | |
GrubHub, Inc.* | | | 1,446 | | | | 34,993 | | |
LogMeIn, Inc.* | | | 697 | | | | 46,769 | | |
NIC, Inc. | | | 2,392 | | | | 47,075 | | |
See notes to financial statements.
29
Victory Portfolios II
Victory CEMP US Discovery Enhanced Volatility Wtd Index ETF | | Schedule of Investments — continued
December 31, 2015 | |
(Unaudited)
Security Description | | Shares | | Value | |
Shutterstock, Inc.* | | | 739 | | | $ | 23,899 | | |
SPS Commerce, Inc.* | | | 814 | | | | 57,151 | | |
WebMD Health Corporation* | | | 1,361 | | | | 65,736 | | |
| | | | 333,808 | | |
IT Services (3.1%): | |
Blackhawk Network Holdings, Inc.* | | | 1,058 | | | | 46,774 | | |
CACI International, Inc.* | | | 1,002 | | | | 92,965 | | |
Cardtronics, Inc.* | | | 1,572 | | | | 52,898 | | |
Convergys Corporation | | | 2,830 | | | | 70,439 | | |
CSG Systems International, Inc. | | | 2,101 | | | | 75,594 | | |
ExlService Holdings, Inc.* | | | 1,615 | | | | 72,562 | | |
ManTech International Corporation | | | 2,403 | | | | 72,667 | | |
NeuStar, Inc.* | | | 1,448 | | | | 34,708 | | |
Perficient, Inc.* | | | 2,588 | | | | 44,306 | | |
Science Applications International Corporation | | | 1,211 | | | | 55,440 | | |
Sykes Enterprises, Inc.* | | | 2,455 | | | | 75,565 | | |
TeleTech Holdings, Inc. | | | 2,149 | | | | 59,979 | | |
Virtusa Corporation* | | | 1,132 | | | | 46,797 | | |
| | | | 800,694 | | |
Leisure Products (0.2%): | |
Smith & Wesson Holdings Corporation* | | | 1,970 | | | | 43,301 | | |
Life Sciences Tools & Services (0.3%): | |
Cambrex Corporation* | | | 627 | | | | 29,525 | | |
Luminex Corporation* | | | 2,196 | | | | 46,973 | | |
| | | | 76,498 | | |
Machinery (5.8%): | |
Alamo Group, Inc. | | | 931 | | | | 48,505 | | |
Altra Industrial Motion Corporation | | | 2,509 | | | | 62,926 | | |
American Railcar Industries, Inc. | | | 953 | | | | 44,105 | | |
Astec Industries, Inc. | | | 1,454 | | | | 59,178 | | |
Barnes Group, Inc. | | | 1,782 | | | | 63,065 | | |
Chart Industries, Inc.* | | | 1,197 | | | | 21,498 | | |
CIRCOR International, Inc. | | | 1,120 | | | | 47,208 | | |
CLARCOR, Inc. | | | 1,411 | | | | 70,098 | | |
ESCO Technologies, Inc. | | | 1,948 | | | | 70,401 | | |
Federal Signal Corporation | | | 3,739 | | | | 59,263 | | |
Greenbrier Companies, Inc. | | | 808 | | | | 26,357 | | |
Hillenbrand, Inc. | | | 2,160 | | | | 64,001 | | |
Hyster-Yale Materials Handling, Inc. | | | 934 | | | | 48,988 | | |
John Bean Technologies Corporation | | | 1,411 | | | | 70,310 | | |
Joy Global, Inc. | | | 2,330 | | | | 29,381 | | |
Lindsay Corporation | | | 741 | | | | 53,648 | | |
Meritor, Inc.* | | | 3,341 | | | | 27,897 | | |
Mueller Industries, Inc. | | | 2,236 | | | | 60,595 | | |
Proto Labs, Inc.* | | | 617 | | | | 39,297 | | |
RBC Bearings, Inc.* | | | 764 | | | | 49,347 | | |
See notes to financial statements.
30
Victory Portfolios II
Victory CEMP US Discovery Enhanced Volatility Wtd Index ETF | | Schedule of Investments — continued
December 31, 2015 | |
(Unaudited)
Security Description | | Shares | | Value | |
Rexnord Corporation* | | | 2,981 | | | $ | 54,016 | | |
Standex International Corporation | | | 773 | | | | 64,275 | | |
Sun Hydraulics Corporation | | | 1,992 | | | | 63,206 | | |
Tennant Company | | | 1,177 | | | | 66,218 | | |
Terex Corporation | | | 1,471 | | | | 27,184 | | |
TriMas Corporation* | | | 1,966 | | | | 36,666 | | |
Valmont Industries, Inc. | | | 689 | | | | 73,048 | | |
Wabash National Corporation* | | | 3,864 | | | | 45,711 | | |
Woodward, Inc. | | | 1,257 | | | | 62,423 | | |
| | | | 1,508,815 | | |
Marine (0.2%): | |
Matson, Inc. | | | 1,417 | | | | 60,407 | | |
Media (1.4%): | |
AMC Entertainment Holdings, Inc. | | | 1,736 | | | | 41,664 | | |
Entravision Communications Corporation | | | 4,879 | | | | 37,617 | | |
Gray Television, Inc.* | | | 2,880 | | | | 46,944 | | |
Meredith Corporation | | | 1,188 | | | | 51,381 | | |
Nexstar Broadcasting Group, Inc. | | | 1,201 | | | | 70,499 | | |
Regal Entertainment Group | | | 3,337 | | | | 62,969 | | |
Sinclair Broadcast Group, Inc. | | | 1,931 | | | | 62,835 | | |
| | | | 373,909 | | |
Metals & Mining (0.4%): | |
Commercial Metals Company | | | 2,947 | | | | 40,344 | | |
Ferroglobe PLC | | | 2,697 | | | | 28,993 | | |
Materion Corporation | | | 1,428 | | | | 39,984 | | |
| | | | 109,321 | | |
Multi-Utilities (0.6%): | |
Avista Corporation | | | 2,292 | | | | 81,068 | | |
NorthWestern Corporation | | | 1,459 | | | | 79,151 | | |
| | | | 160,219 | | |
Oil, Gas & Consumable Fuels (0.2%): | |
World Fuel Services Corporation | | | 1,441 | | | | 55,421 | | |
Paper & Forest Products (1.4%): | |
Boise Cascade Company* | | | 1,395 | | | | 35,614 | | |
Deltic Timber Corporation | | | 1,227 | | | | 72,233 | | |
KapStone Paper & Packaging Corporation | | | 2,428 | | | | 54,849 | | |
Neenah Paper, Inc. | | | 1,142 | | | | 71,295 | | |
PH Glatfelter Company | | | 3,657 | | | | 67,435 | | |
Schweitzer-Mauduit International, Inc. | | | 1,725 | | | | 72,433 | | |
| | | | 373,859 | | |
Personal Products (0.4%): | |
Inter Parfums, Inc. | | | 1,748 | | | | 41,637 | | |
Nu Skin Enterprises, Inc. | | | 721 | | | | 27,319 | | |
USANA Health Sciences, Inc.* | | | 184 | | | | 23,506 | | |
| | | | 92,462 | | |
See notes to financial statements.
31
Victory Portfolios II
Victory CEMP US Discovery Enhanced Volatility Wtd Index ETF | | Schedule of Investments — continued
December 31, 2015 | |
(Unaudited)
Security Description | | Shares | | Value | |
Pharmaceuticals (0.5%): | |
Lannet Company, Inc.* | | | 575 | | | $ | 23,069 | | |
Prestige Brands Holdings, Inc.* | | | 1,132 | | | | 58,275 | | |
Sucampo Pharmaceuticals, Inc.* | | | 822 | | | | 14,212 | | |
Supernus Pharmaceuticals, Inc.* | | | 1,506 | | | | 20,241 | | |
| | | | 115,797 | | |
Professional Services (2.3%): | |
Exponent, Inc. | | | 1,466 | | | | 73,227 | | |
FTI Consulting, Inc.* | | | 1,261 | | | | 43,706 | | |
Huron Consulting Group, Inc.* | | | 626 | | | | 37,184 | | |
ICF International, Inc.* | | | 1,585 | | | | 56,363 | | |
Insperity, Inc. | | | 1,007 | | | | 48,487 | | |
Kforce, Inc. | | | 1,539 | | | | 38,906 | | |
Korn/Ferry International | | | 1,825 | | | | 60,554 | | |
On Assignment, Inc.* | | | 1,275 | | | | 57,311 | | |
Resources Connection, Inc. | | | 3,423 | | | | 55,932 | | |
| RPX Corporation* | | | 3,590 | | | | 39,490 | | |
TrueBlue, Inc.* | | | 1,544 | | | | 39,773 | | |
WageWorks, Inc.* | | | 770 | | | | 34,935 | | |
| | | | 585,868 | | |
Real Estate Management & Development (0.3%): | |
Alexander & Baldwin, Inc. | | | 1,746 | | | | 61,651 | | |
Marcus & Millichap, Inc.* | | | 781 | | | | 22,759 | | |
| | | | 84,410 | | |
Road & Rail (1.3%): | |
ArcBest Corporation | | | 1,405 | | | | 30,053 | | |
Heartland Express, Inc. | | | 2,908 | | | | 49,494 | | |
Knight Transportation, Inc. | | | 1,693 | | | | 41,021 | | |
Landstar System, Inc. | | | 1,052 | | | | 61,700 | | |
Marten Transport Ltd. | | | 2,398 | | | | 42,445 | | |
Roadrunner Transportation Systems, Inc.* | | | 1,948 | | | | 18,370 | | |
Saia, Inc.* | | | 1,177 | | | | 26,188 | | |
Swift Transportation Company* | | | 2,217 | | | | 30,639 | | |
Werner Enterprises, Inc. | | | 2,054 | | | | 48,043 | | |
| | | | 347,953 | | |
Semiconductors & Semiconductor Equipment (3.0%): | |
Ambarella, Inc.* | | | 358 | | | | 19,955 | | |
Amkor Technology, Inc.* | | | 5,023 | | | | 30,540 | | |
Cabot Microelectronics Corporation* | | | 1,491 | | | | 65,276 | | |
Cirrus Logic, Inc.* | | | 1,173 | | | | 34,639 | | |
Diodes, Inc.* | | | 2,422 | | | | 55,657 | | |
Integrated Device Technology, Inc.* | | | 1,799 | | | | 47,404 | | |
MKS Instrument, Inc. | | | 2,036 | | | | 73,296 | | |
Monolithic Power Systems, Inc. | | | 1,109 | | | | 70,654 | | |
OmniVision Technologies, Inc.* | | | 2,522 | | | | 73,188 | | |
Photronics, Inc.* | | | 5,995 | | | | 74,638 | | |
See notes to financial statements.
32
Victory Portfolios II
Victory CEMP US Discovery Enhanced Volatility Wtd Index ETF | | Schedule of Investments — continued
December 31, 2015 | |
(Unaudited)
Security Description | | Shares | | Value | |
Power Integrations, Inc. | | | 1,298 | | | $ | 63,122 | | |
Rambus, Inc.* | | | 3,399 | | | | 39,394 | | |
Silicon Laboratories, Inc.* | | | 1,077 | | | | 52,278 | | |
Synaptics, Inc.* | | | 577 | | | | 46,356 | | |
Tessera Technologies, Inc. | | | 1,278 | | | | 38,353 | | |
| | | | 784,750 | | |
Software (1.7%): | |
Blackbaud, Inc. | | | 1,017 | | | | 66,980 | | |
Ebix, Inc. | | | 1,139 | | | | 37,348 | | |
Ellie Mae, Inc.* | | | 477 | | | | 28,730 | | |
Fair Isaac Corporation | | | 663 | | | | 62,441 | | |
Monotype Imaging Holdings, Inc. | | | 2,147 | | | | 50,755 | | |
Pegasystems, Inc. | | | 1,750 | | | | 48,125 | | |
Qualys, Inc.* | | | 691 | | | | 22,865 | | |
Synchronoss Technologies, Inc.* | | | 947 | | | | 33,363 | | |
TiVo, Inc.* | | | 7,022 | | | | 60,600 | | |
VASCO Data Security International, Inc.* | | | 1,432 | | | | 23,957 | | |
| | | | 435,164 | | |
Specialty Retail (4.3%): | |
Aaron's, Inc. | | | 1,247 | | | | 27,920 | | |
Asbury Automotive Group, Inc.* | | | 684 | | | | 46,129 | | |
Ascena Retail Group, Inc.* | | | 3,345 | | | | 32,948 | | |
Caleres, Inc. | | | 1,467 | | | | 39,345 | | |
CST Brands, Inc. | | | 1,960 | | | | 76,715 | | |
DSW, Inc. | | | 1,770 | | | | 42,232 | | |
Express, Inc.* | | | 1,848 | | | | 31,934 | | |
Finish Line, Inc. | | | 1,533 | | | | 27,717 | | |
Five Below, Inc.* | | | 1,082 | | | | 34,732 | | |
Genesco, Inc.* | | | 988 | | | | 56,148 | | |
Group 1 Automotive, Inc. | | | 653 | | | | 49,432 | | |
Guess?, Inc. | | | 1,814 | | | | 34,248 | | |
Hibbett Sports, Inc.* | | | 1,396 | | | | 42,215 | | |
Lithia Motors, Inc. | | | 485 | | | | 51,735 | | |
Mattress Firm Holding Corporation* | | | 801 | | | | 35,749 | | |
Monro Muffler Brake, Inc. | | | 1,074 | | | | 71,120 | | |
Murphy USA, Inc.* | | | 1,097 | | | | 66,632 | | |
Pier 1 Imports, Inc. | | | 3,082 | | | | 15,688 | | |
Rent-A-Center, Inc. | | | 1,405 | | | | 21,033 | | |
Select Comfort Corporation* | | | 1,932 | | | | 41,364 | | |
Sonic Automotive, Inc. | | | 2,886 | | | | 65,685 | | |
The Buckle, Inc. | | | 1,268 | | | | 39,029 | | |
The Cato Corporation | | | 1,604 | | | | 59,059 | | |
Tile Shop Holdings, Inc.* | | | 2,173 | | | | 35,637 | | |
Vitamin Shoppe, Inc.* | | | 1,379 | | | | 45,093 | | |
Zumiez, Inc.* | | | 1,486 | | | | 22,468 | | |
| | | | 1,112,007 | | |
See notes to financial statements.
33
Victory Portfolios II
Victory CEMP US Discovery Enhanced Volatility Wtd Index ETF | | Schedule of Investments — continued
December 31, 2015 | |
(Unaudited)
Security Description | | Shares | | Value | |
Technology Hardware, Storage & Peripherals (0.5%): | |
Electronics For Imaging, Inc.* | | | 1,435 | | | $ | 67,072 | | |
QLogic Corporation* | | | 2,912 | | | | 35,526 | | |
Super Micro Computer, Inc.* | | | 1,293 | | | | 31,692 | | |
| | | | 134,290 | | |
Textiles, Apparel & Luxury Goods (0.7%): | |
Fossil Group, Inc.* | | | 740 | | | | 27,054 | | |
Iconix Brand Group, Inc.* | | | 2,071 | | | | 14,145 | | |
Movado Group, Inc. | | | 1,186 | | | | 30,492 | | |
Steven Madden Ltd.* | | | 1,337 | | | | 40,404 | | |
Tumi Holdings, Inc.* | | | 2,201 | | | | 36,603 | | |
Wolverine World Wide, Inc. | | | 2,084 | | | | 34,824 | | |
| | | | 183,522 | | |
Thrifts & Mortgage Finance (2.5%): | |
Astoria Financial Corporation | | | 4,378 | | | | 69,391 | | |
Beneficial Bancorp, Inc.* | | | 7,741 | | | | 103,110 | | |
BofI Holding, Inc.* | | | 2,019 | | | | 42,500 | | |
Capitol Federal Financial, Inc. | | | 8,449 | | | | 106,120 | | |
EverBank Financial Corporation | | | 4,128 | | | | 65,966 | | |
Northwest Bancshares, Inc. | | | 7,190 | | | | 96,274 | | |
Provident Financial Services, Inc. | | | 3,869 | | | | 77,960 | | |
Washington Federal, Inc. | | | 3,081 | | | | 73,420 | | |
| | | | 634,741 | | |
Tobacco (0.3%): | |
Vector Group Ltd. | | | 3,703 | | | | 87,354 | | |
Trading Companies & Distributors (1.7%): | |
Aircastle Ltd. | | | 2,401 | | | | 50,157 | | |
Applied Industrial Technologies, Inc. | | | 1,511 | | | | 61,180 | | |
GATX Corporation | | | 1,190 | | | | 50,634 | | |
H&E Equipment Services, Inc. | | | 1,133 | | | | 19,805 | | |
Kaman Corporation | | | 2,422 | | | | 98,842 | | |
MRC Global, Inc.* | | | 2,321 | | | | 29,941 | | |
Rush Enterprises, Inc.* | | | 2,131 | | | | 46,648 | | |
TAL International Group, Inc. | | | 2,192 | | | | 34,853 | | |
Wesco International, Inc.* | | | 1,077 | | | | 47,043 | | |
| | | | 439,103 | | |
Transportation Infrastructure (0.2%): | |
Wesco Aircraft Holdings, Inc.* | | | 4,079 | | | | 48,826 | | |
Water Utilities (0.7%): | |
American States Water Company | | | 1,590 | | | | 66,701 | | |
California Water Service Group | | | 2,647 | | | | 61,596 | | |
SJW Corporation | | | 1,893 | | | | 56,127 | | |
| | | | 184,424 | | |
Wireless Telecommunication Services (0.2%): | |
Shenandoah Telecommunications Company | | | 932 | | | | 40,123 | | |
Total Common Stocks (Cost $26,524,292) | | | 25,690,327 | | |
See notes to financial statements.
34
Victory Portfolios II
Victory CEMP US Discovery Enhanced Volatility Wtd Index ETF | | Schedule of Investments — continued
December 31, 2015 | |
(Unaudited)
Security Description | | Shares | | Value | |
Short-Term Investments (0.5%) | |
Money Market Funds (0.5%): | |
Short Term Investment Trust Liquid Assets Portfolio, 0.29%^ | | | 124,854 | | | $ | 124,854 | | |
Total Short-Term Investments — (Cost $124,854) | | | 124,854 | | |
Total Investments — 99.8% (Cost $26,649,146) | | | 25,815,181 | | |
Other assets in excess of liabilities — 0.2% | | | 50,419 | | |
NET ASSETS — 100.0% | | $ | 25,865,600 | | |
* Non-income producing security.
^ Annualized seven-day yield as of December 31, 2015.
The Global Industry Classification Standard (GICS®) was developed by and/or is the exclusive property of MSCI, Inc. and Standard & Poor's Financial Services LLC ("S&P"). GICS® is a service mark of MSCI, Inc. and S&P and has been licensed for use by the Fund's Administrator, U.S. Bancorp Fund Services, LLC.
Schedule of Open Futures Contracts
Number of
Contracts
Purchased | | Description | | Notional Amount | | Unrealized
Depreciation | |
| | 1 | | | Russell 2000 Mini Future, March 2016 | | $ | 113,150 | | | $ | (574 | ) | |
| | | $ | (574 | ) | |
See notes to financial statements.
35
Victory Portfolios II
Victory CEMP US 500 Enhanced Volatility Wtd Index ETF | | Schedule of Investments
December 31, 2015 | |
(Unaudited)
Security Description | | Shares | | Value | |
Common Stocks (99.6%) | |
Aerospace & Defense (3.0%): | |
General Dynamics Corporation | | | 1,938 | | | $ | 266,204 | | |
Hexcel Corporation | | | 4,977 | | | | 231,182 | | |
Honeywell International, Inc. | | | 2,806 | | | | 290,617 | | |
Huntington Ingalls Industries, Inc. | | | 1,594 | | | | 202,199 | | |
L-3 Communications Holdings, Inc. | | | 2,440 | | | | 291,604 | | |
Lockheed Martin Corporation | | | 1,537 | | | | 333,759 | | |
Northrop Grumman Corporation | | | 1,574 | | | | 297,187 | | |
Precision Castparts Corporation | | | 691 | | | | 160,319 | | |
Raytheon Company | | | 2,421 | | | | 301,487 | | |
Rockwell Collins, Inc. | | | 3,627 | | | | 334,772 | | |
Textron, Inc. | | | 5,300 | | | | 222,653 | | |
The Boeing Company | | | 1,779 | | | | 257,226 | | |
United Technologies Corporation | | | 2,866 | | | | 275,337 | | |
| | | | 3,464,546 | | |
Air Freight & Logistics (0.6%): | |
CH Robinson Worldwide, Inc. | | | 2,944 | | | | 182,587 | | |
Expeditors International of Washington, Inc. | | | 5,316 | | | | 239,751 | | |
United Parcel Service, Inc. | | | 2,560 | | | | 246,349 | | |
| | | | 668,687 | | |
Airlines (0.6%): | |
Alaska Air Group, Inc. | | | 2,085 | | | | 167,863 | | |
American Airlines Group, Inc. | | | 3,137 | | | | 132,852 | | |
JetBlue Airways Corporation* | | | 5,673 | | | | 128,494 | | |
Southwest Airlines Company | | | 4,050 | | | | 174,393 | | |
United Continental Holdings, Inc.* | | | 2,313 | | | | 132,535 | | |
| | | | 736,137 | | |
Auto Components (0.9%): | |
BorgWarner, Inc. | | | 4,577 | | | | 197,864 | | |
Gentex Corporation | | | 14,512 | | | | 232,337 | | |
Goodyear Tire & Rubber Company | | | 6,088 | | | | 198,895 | | |
Johnson Controls, Inc. | | | 5,307 | | | | 209,573 | | |
Lear Corporation | | | 1,997 | | | | 245,292 | | |
| | | | 1,083,961 | | |
Automobiles (0.6%): | |
Ford Motor Company | | | 18,012 | | | | 253,789 | | |
General Motors Company | | | 7,132 | | | | 242,559 | | |
Harley-Davidson, Inc. | | | 3,376 | | | | 153,237 | | |
| | | | 649,585 | | |
Banks (4.4%): | |
BB&T Corporation | | | 6,780 | | | | 256,352 | | |
CIT Group, Inc. | | | 6,430 | | | | 255,271 | | |
Citigroup, Inc. | | | 4,313 | | | | 223,198 | | |
Citizens Financial Group, Inc. | | | 9,394 | | | | 246,029 | | |
Comerica, Inc. | | | 4,345 | | | | 181,751 | | |
See notes to financial statements.
36
Victory Portfolios II
Victory CEMP US 500 Enhanced Volatility Wtd Index ETF | | Schedule of Investments — continued
December 31, 2015 | |
(Unaudited)
Security Description | | Shares | | Value | |
East West Bancorp, Inc. | | | 5,313 | | | $ | 220,808 | | |
Fifth Third Bancorp | | | 11,150 | | | | 224,115 | | |
First Republic Bank | | | 3,813 | | | | 251,887 | | |
Huntington Bancshares, Inc. | | | 21,818 | | | | 241,307 | | |
JPMorgan Chase & Company | | | 3,835 | | | | 253,225 | | |
KeyCorp | | | 14,749 | | | | 194,539 | | |
M&T Bank Corporation | | | 3,834 | | | | 464,604 | | |
People's United Financial, Inc. | | | 19,129 | | | | 308,933 | | |
Regions Financial Corporation | | | 20,531 | | | | 197,098 | | |
Signature Bank* | | | 1,642 | | | | 251,834 | | |
SunTrust Banks, Inc. | | | 5,540 | | | | 237,334 | | |
SVB Financial Group* | | | 1,275 | | | | 151,598 | | |
The PNC Financial Services Group, Inc. | | | 2,879 | | | | 274,397 | | |
US Bancorp | | | 6,505 | | | | 277,568 | | |
Wells Fargo & Company | | | 5,125 | | | | 278,595 | | |
| | | | 4,990,443 | | |
Beverages (1.9%): | |
Brown-Forman Corporation | | | 3,244 | | | | 322,064 | | |
Coca-Cola Enterprises, Inc. | | | 4,026 | | | | 198,240 | | |
Constellation Brands, Inc. | | | 2,066 | | | | 294,281 | | |
Dr Pepper Snapple Group, Inc. | | | 3,912 | | | | 364,599 | | |
Monster Beverage Corporation* | | | 1,176 | | | | 175,177 | | |
PepsiCo, Inc. | | | 3,572 | | | | 356,914 | | |
The Coca-Cola Company | | | 9,653 | | | | 414,693 | | |
| | | | 2,125,968 | | |
Biotechnology (0.9%): | |
Alexion Pharmaceuticals, Inc.* | | | 842 | | | | 160,611 | | |
Amgen, Inc. | | | 1,227 | | | | 199,179 | | |
Biogen, Inc.* | | | 363 | | | | 111,205 | | |
Celgene Corporation* | | | 1,343 | | | | 160,838 | | |
Gilead Sciences, Inc. | | | 1,686 | | | | 170,606 | | |
Regeneron Pharmaceuticals, Inc.* | | | 317 | | | | 172,090 | | |
| | | | 974,529 | | |
Building Products (0.8%): | |
AO Smith Corporation | | | 2,979 | | | | 228,221 | | |
Lennox International, Inc. | | | 2,340 | | | | 292,266 | | |
Masco Corporation | | | 7,050 | | | | 199,515 | | |
Owens Corning | | | 3,849 | | | | 181,019 | | |
| | | | 901,021 | | |
Capital Markets (3.3%): | |
Affiliated Managers Group, Inc.* | | | 1,405 | | | | 224,463 | | |
Ameriprise Financial, Inc. | | | 2,102 | | | | 223,695 | | |
BlackRock, Inc. | | | 869 | | | | 295,912 | | |
E*TRADE Financial Corporation* | | | 6,086 | | | | 180,389 | | |
Franklin Resources, Inc. | | | 6,501 | | | | 239,367 | | |
Invesco Ltd. | | | 7,094 | | | | 237,507 | | |
Legg Mason, Inc. | | | 5,697 | | | | 223,493 | | |
Northern Trust Corporation | | | 3,197 | | | | 230,472 | | |
See notes to financial statements.
37
Victory Portfolios II
Victory CEMP US 500 Enhanced Volatility Wtd Index ETF | | Schedule of Investments — continued
December 31, 2015 | |
(Unaudited)
Security Description | | Shares | | Value | |
Raymond James Financial, Inc. | | | 4,431 | | | $ | 256,865 | | |
SEI Investments Company | | | 4,771 | | | | 250,000 | | |
State Street Corporation | | | 3,007 | | | | 199,545 | | |
T. Rowe Price Group, Inc. | | | 4,166 | | | | 297,827 | | |
TD Ameritrade Holding Corporation | | | 6,608 | | | | 229,364 | | |
The Bank of New York Mellon Corporation | | | 5,789 | | | | 238,623 | | |
The Charles Schwab Corporation | | | 6,297 | | | | 207,360 | | |
The Goldman Sachs Group, Inc. | | | 1,354 | | | | 244,031 | | |
| | | | 3,778,913 | | |
Chemicals (3.8%): | |
Air Products & Chemicals, Inc. | | | 1,689 | | | | 219,756 | | |
Airgas, Inc. | | | 2,831 | | | | 391,584 | | |
Ashland, Inc. | | | 2,382 | | | | 244,631 | | |
CF Industries Holdings, Inc. | | | 2,863 | | | | 116,839 | | |
Eastman Chemical Company | | | 2,803 | | | | 189,231 | | |
Ecolab, Inc. | | | 2,428 | | | | 277,715 | | |
EI du Pont de Nemours & Company | | | 4,469 | | | | 297,635 | | |
International Flavors & Fragrances, Inc. | | | 2,222 | | | | 265,840 | | |
LyondellBasell Industries NV | | | 1,913 | | | | 166,240 | | |
NewMarket Corporation | | | 596 | | | | 226,915 | | |
PPG Industries, Inc. | | | 2,660 | | | | 262,861 | | |
Praxair, Inc. | | | 3,101 | | | | 317,542 | | |
The Dow Chemical Company | | | 4,633 | | | | 238,507 | | |
The Mosaic Company | | | 6,057 | | | | 167,113 | | |
The Sherwin-Williams Company | | | 959 | | | | 248,956 | | |
The Valspar Corporation | | | 3,706 | | | | 307,413 | | |
W.R. Grace & Company* | | | 2,238 | | | | 222,882 | | |
Westlake Chemical Corporation | | | 2,922 | | | | 158,723 | | |
| | | | 4,320,383 | | |
Commercial Services & Supplies (2.1%): | |
Cintas Corporation | | | 3,554 | | | | 323,592 | | |
Copart, Inc.* | | | 9,211 | | | | 350,110 | | |
KAR Auction Services, Inc. | | | 8,374 | | | | 310,089 | | |
Republic Services, Inc. | | | 7,807 | | | | 343,430 | | |
Rollins, Inc. | | | 8,597 | | | | 222,663 | | |
Stericycle, Inc.* | | | 2,245 | | | | 270,747 | | |
The ADT Corporation | | | 6,243 | | | | 205,894 | | |
Waste Connections, Inc. | | | 6,254 | | | | 352,225 | | |
| | | | 2,378,750 | | |
Communications Equipment (1.1%): | |
Arista Networks, Inc.* | | | 1,943 | | | | 151,243 | | |
Brocade Communications Systems, Inc. | | | 15,788 | | | | 144,934 | | |
Cisco Systems, Inc. | | | 8,434 | | | | 229,025 | | |
CommScope Holding Company, Inc.* | | | 4,314 | | | | 111,689 | | |
F5 Networks, Inc.* | | | 1,635 | | | | 158,530 | | |
Motorola Solutions, Inc. | | | 3,538 | | | | 242,176 | | |
QUALCOMM, Inc. | | | 3,666 | | | | 183,245 | | |
| | | | 1,220,842 | | |
See notes to financial statements.
38
Victory Portfolios II
Victory CEMP US 500 Enhanced Volatility Wtd Index ETF | | Schedule of Investments — continued
December 31, 2015 | |
(Unaudited)
Security Description | | Shares | | Value | |
Construction & Engineering (0.5%): | |
Fluor Corporation | | | 4,198 | | | $ | 198,229 | | |
Jacobs Engineering Group, Inc.* | | | 4,807 | | | | 201,654 | | |
Quanta Services, Inc.* | | | 6,220 | | | | 125,955 | | |
| | | | 525,838 | | |
Construction Materials (0.1%): | |
Martin Marietta Materials, Inc. | | | 954 | | | | 130,297 | | |
Consumer Finance (1.0%): | |
American Express Company | | | 3,066 | | | | 213,240 | | |
Capital One Financial Corporation | | | 2,630 | | | | 189,834 | | |
Discover Financial Services | | | 4,594 | | | | 246,330 | | |
Navient Corporation | | | 13,367 | | | | 153,052 | | |
Santander Consumer USA Holdings, Inc.* | | | 8,289 | | | | 131,381 | | |
Synchrony Financial* | | | 7,805 | | | | 237,350 | | |
| | | | 1,171,187 | | |
Containers & Packaging (0.9%): | |
Avery Dennison Corporation | | | 4,146 | | | | 259,788 | | |
Ball Corporation | | | 3,278 | | | | 238,409 | | |
Crown Holdings, Inc.* | | | 4,397 | | | | 222,928 | | |
Packaging Corporation of America | | | 2,771 | | | | 174,711 | | |
Sealed Air Corporation | | | 3,866 | | | | 172,424 | | |
| | | | 1,068,260 | | |
Distributors (0.4%): | |
Genuine Parts Company | | | 3,269 | | | | 280,774 | | |
LKQ Corporation* | | | 6,723 | | | | 199,203 | | |
| | | | 479,977 | | |
Diversified Consumer Services (0.2%): | |
Service Corporation International | | | 9,198 | | | | 239,332 | | |
Diversified Financial Services (2.2%): | |
Berkshire Hathaway, Inc.* | | | 2,685 | | | | 354,528 | | |
CBOE Holdings, Inc. | | | 4,315 | | | | 280,044 | | |
CME Group, Inc. | | | 2,827 | | | | 256,126 | | |
FactSet Research Systems, Inc. | | | 1,823 | | | | 296,365 | | |
Intercontinental Exchange, Inc. | | | 1,059 | | | | 271,379 | | |
Moody's Corporation | | | 2,556 | | | | 256,469 | | |
MSCI, Inc. | | | 4,148 | | | | 299,195 | | |
Nasdaq, Inc. | | | 5,211 | | | | 303,124 | | |
Voya Financial, Inc. | | | 5,942 | | | | 219,319 | | |
| | | | 2,536,549 | | |
Diversified Telecommunication Services (0.2%): | |
CenturyLink, Inc. | | | 7,671 | | | | 193,002 | | |
Electric Utilities (3.3%): | |
American Electric Power Company, Inc. | | | 4,781 | | | | 278,589 | | |
Duke Energy Corporation | | | 3,804 | | | | 271,568 | | |
Edison International | | | 4,140 | | | | 245,129 | | |
Entergy Corporation | | | 3,943 | | | | 269,543 | | |
See notes to financial statements.
39
Victory Portfolios II
Victory CEMP US 500 Enhanced Volatility Wtd Index ETF | | Schedule of Investments — continued
December 31, 2015 | |
(Unaudited)
Security Description | | Shares | | Value | |
Eversource Energy | | | 5,451 | | | $ | 278,383 | | |
Exelon Corporation | | | 6,879 | | | | 191,030 | | |
ITC Holdings Corporation | | | 7,266 | | | | 285,191 | | |
NextEra Energy, Inc. | | | 2,760 | | | | 286,736 | | |
OGE Energy Corporation | | | 9,120 | | | | 239,765 | | |
Pepco Holdings, Inc. | | | 8,508 | | | | 221,293 | | |
Pinnacle West Capital Corporation | | | 4,495 | | | | 289,838 | | |
Southern Company | | | 6,578 | | | | 307,785 | | |
Westar Energy, Inc. | | | 7,128 | | | | 302,298 | | |
Xcel Energy, Inc. | | | 7,895 | | | | 283,509 | | |
| | | | 3,750,657 | | |
Electrical Equipment (1.4%): | |
Acuity Brands, Inc. | | | 1,169 | | | | 273,312 | | |
AMETEK, Inc. | | | 4,841 | | | | 259,429 | | |
Eaton Corporation PLC | | | 4,007 | | | | 208,524 | | |
Emerson Electric Company | | | 5,478 | | | | 262,013 | | |
Hubbell, Inc.* | | | 3,290 | | | | 332,422 | | |
Rockwell Automation, Inc. | | | 2,144 | | | | 219,996 | | |
| | | | 1,555,696 | | |
Electronic Equipment, Instruments & Components (1.5%): | |
Amphenol Corporation | | | 4,747 | | | | 247,936 | | |
Arrow Electronics, Inc.* | | | 3,394 | | | | 183,887 | | |
Avnet, Inc. | | | 5,023 | | | | 215,185 | | |
CDW Corporation | | | 5,781 | | | | 243,033 | | |
Corning, Inc. | | | 13,039 | | | | 238,353 | | |
Flextronics International Ltd.* | | | 18,447 | | | | 206,791 | | |
IPG Photonics Corporation* | | | 1,876 | | | | 167,264 | | |
Trimble Navigation Ltd.* | | | 8,653 | | | | 185,607 | | |
| | | | 1,688,056 | | |
Energy Equipment & Services (0.6%): | |
Cameron International Corporation* | | | 1,412 | | | | 89,239 | | |
FMC Technologies, Inc.* | | | 4,112 | | | | 119,289 | | |
Helmerich & Payne, Inc. | | | 2,433 | | | | 130,287 | | |
National Oilwell Varco, Inc. | | | 3,886 | | | | 130,142 | | |
Schlumberger Ltd. | | | 2,743 | | | | 191,324 | | |
| | | | 660,281 | | |
Food & Staples Retailing (1.6%): | |
Costco Wholesale Corporation | | | 1,990 | | | | 321,385 | | |
CVS Health Corporation | | | 3,127 | | | | 305,727 | | |
Rite Aid Corporation* | | | 18,787 | | | | 147,290 | | |
Sysco Corporation | | | 6,884 | | | | 282,244 | | |
The Kroger Company | | | 7,391 | | | | 309,166 | | |
Wal-Mart Stores, Inc. | | | 4,297 | | | | 263,406 | | |
Whole Foods Market, Inc. | | | 5,780 | | | | 193,630 | | |
| | | | 1,822,848 | | |
Food Products (3.2%): | |
Archer-Daniels-Midland Company | | | 5,611 | | | | 205,811 | | |
See notes to financial statements.
40
Victory Portfolios II
Victory CEMP US 500 Enhanced Volatility Wtd Index ETF | | Schedule of Investments — continued
December 31, 2015 | |
(Unaudited)
Security Description | | Shares | | Value | |
Campbell Soup Company | | | 6,592 | | | $ | 346,410 | | |
Flowers Foods, Inc. | | | 9,018 | | | | 193,797 | | |
General Mills, Inc. | | | 6,189 | | | | 356,858 | | |
Hain Celestial Group, Inc.* | | | 3,613 | | | | 145,929 | | |
Hormel Foods Corporation | | | 4,345 | | | | 343,603 | | |
Ingredion, Inc. | | | 2,997 | | | | 287,232 | | |
Keurig Green Mountain, Inc. | | | 1,602 | | | | 144,148 | | |
McCormick & Company, Inc. | | | 4,063 | | | | 347,630 | | |
Mead Johnson Nutrition Company | | | 3,644 | | | | 287,694 | | |
Mondelez International, Inc. | | | 6,178 | | | | 277,022 | | |
Pilgrim's Pride Corporation | | | 4,798 | | | | 105,988 | | |
Pinnacle Foods, Inc. | | | 6,044 | | | | 256,628 | | |
The WhiteWave Foods Company* | | | 4,197 | | | | 163,305 | | |
Tyson Foods, Inc. | | | 4,610 | | | | 245,851 | | |
| | | | 3,707,906 | | |
Gas Utilities (0.3%): | |
Atmos Energy Corporation | | | 4,766 | | | | 300,449 | | |
Health Care Equipment & Supplies (3.4%): | |
Abbott Laboratories | | | 5,745 | | | | 258,008 | | |
Align Technology, Inc.* | | | 3,196 | | | | 210,456 | | |
Baxter International, Inc. | | | 7,544 | | | | 287,803 | | |
Becton, Dickinson and Company | | | 2,252 | | | | 347,011 | | |
DENTSPLY International, Inc. | | | 5,072 | | | | 308,631 | | |
Edwards Lifesciences Corporation* | | | 2,747 | | | | 216,958 | | |
Hologic, Inc.* | | | 5,467 | | | | 211,518 | | |
IDEXX Laboratories, Inc.* | | | 1,901 | | | | 138,621 | | |
Intuitive Surgical, Inc.* | | | 436 | | | | 238,126 | | |
ResMed, Inc. | | | 3,062 | | | | 164,399 | | |
Sirona Dental Systems, Inc.* | | | 3,054 | | | | 334,627 | | |
St. Jude Medical, Inc. | | | 3,283 | | | | 202,791 | | |
Stryker Corporation | | | 2,815 | | | | 261,626 | | |
Teleflex, Inc. | | | 2,326 | | | | 305,753 | | |
The Cooper Companies, Inc. | | | 1,653 | | | | 221,833 | | |
Varian Medical Systems, Inc.* | | | 2,870 | | | | 231,896 | | |
| | | | 3,940,057 | | |
Health Care Providers & Services (3.6%): | |
Acadia Healthcare Company, Inc.* | | | 2,273 | | | | 141,972 | | |
Aetna, Inc. | | | 1,710 | | | | 184,885 | | |
Anthem, Inc. | | | 1,544 | | | | 215,295 | | |
Cardinal Health, Inc. | | | 3,163 | | | | 282,361 | | |
Centene Corporation* | | | 2,634 | | | | 173,344 | | |
Cigna Corporation | | | 1,317 | | | | 192,717 | | |
Community Health Systems, Inc.* | | | 2,949 | | | | 78,237 | | |
Express Scripts Holdings Company* | | | 2,790 | | | | 243,874 | | |
HCA Holdings, Inc.* | | | 2,300 | | | | 155,549 | | |
Henry Schein, Inc.* | | | 2,156 | | | | 341,058 | | |
Humana, Inc. | | | 785 | | | | 140,130 | | |
Laboratory Corporation of America Holdings* | | | 2,418 | | | | 298,962 | | |
McKesson Corporation | | | 1,315 | | | | 259,357 | | |
See notes to financial statements.
41
Victory Portfolios II
Victory CEMP US 500 Enhanced Volatility Wtd Index ETF | | Schedule of Investments — continued
December 31, 2015 | |
(Unaudited)
Security Description | | Shares | | Value | |
MEDNAX, Inc.* | | | 3,596 | | | $ | 257,689 | | |
Patterson Companies, Inc. | | | 6,007 | | | | 271,576 | | |
Quest Diagnostics, Inc. | | | 3,342 | | | | 237,750 | | |
Team Health Holdings, Inc.* | | | 2,301 | | | | 100,991 | | |
UnitedHealth Group Inc. | | | 1,822 | | | | 214,340 | | |
Universal Health Services, Inc. | | | 1,443 | | | | 172,424 | | |
VCA, Inc.* | | | 3,638 | | | | 200,090 | | |
| | | | 4,162,601 | | |
Health Care Technology (0.2%): | |
Cerner Corporation* | | | 3,623 | | | | 217,996 | | |
Hotels, Restaurants & Leisure (2.6%): | |
Aramark | | | 8,699 | | | | 280,543 | | |
Chipotle Mexican Grill, Inc.* | | | 285 | | | | 136,757 | | |
Domino's Pizza, Inc. | | | 1,865 | | | | 207,481 | | |
Dunkin' Brands Group, Inc. | | | 4,799 | | | | 204,389 | | |
Hilton Worldwide Holdings, Inc. | | | 8,679 | | | | 185,731 | | |
Hyatt Hotels Corporation* | | | 4,549 | | | | 213,894 | | |
Las Vegas Sands Corporation | | | 3,241 | | | | 142,086 | | |
Marriott International, Inc. | | | 2,922 | | | | 195,891 | | |
McDonald's Corporation | | | 2,835 | | | | 334,927 | | |
Panera Bread Company* | | | 1,035 | | | | 201,597 | | |
Royal Caribbean Cruises Ltd. | | | 1,823 | | | | 184,506 | | |
Starbucks Corporation | | | 4,042 | | | | 242,641 | | |
Starwood Hotels & Resorts Worldwide, Inc. | | | 2,669 | | | | 184,908 | | |
Wyndham Worldwide Corporation | | | 3,018 | | | | 219,258 | | |
| | | | 2,934,609 | | |
Household Durables (1.5%): | |
DR Horton, Inc. | | | 5,446 | | | | 174,435 | | |
Harman International Industries, Inc. | | | 1,165 | | | | 109,755 | | |
Lennar Corporation | | | 3,452 | | | | 168,837 | | |
Mohawk Industries, Inc.* | | | 1,124 | | | | 212,874 | | |
Newell Rubbermaid, Inc. | | | 6,337 | | | | 279,335 | | |
NVR, Inc.* | | | 186 | | | | 305,598 | | |
PulteGroup, Inc. | | | 8,086 | | | | 144,093 | | |
Toll Brothers, Inc.* | | | 5,370 | | | | 178,821 | | |
Whirlpool Corporation | | | 1,150 | | | | 168,901 | | |
| | | | 1,742,649 | | |
Household Products (1.5%): | |
Church & Dwight Company, Inc. | | | 4,076 | | | | 345,971 | | |
Colgate-Palmolive Company | | | 4,688 | | | | 312,314 | | |
Procter & Gamble Company | | | 4,678 | | | | 371,480 | | |
Spectrum Brands Holdings, Inc. | | | 2,812 | | | | 286,262 | | |
The Clorox Company | | | 3,134 | | | | 397,485 | | |
| | | | 1,713,512 | | |
Independent Power Producers & Energy Traders (0.1%): | |
AES Corporation | | | 16,904 | | | | 161,771 | | |
See notes to financial statements.
42
Victory Portfolios II
Victory CEMP US 500 Enhanced Volatility Wtd Index ETF | | Schedule of Investments — continued
December 31, 2015 | |
(Unaudited)
Security Description | | Shares | | Value | |
Industrial Conglomerates (1.0%): | |
| 3M Company | | | 2,113 | | | $ | 318,302 | | |
Carlisle Companies, Inc. | | | 2,448 | | | | 217,113 | | |
Danaher Corporation | | | 3,534 | | | | 328,238 | | |
Roper Technologies, Inc. | | | 1,719 | | | | 326,249 | | |
| | | | 1,189,902 | | |
Insurance (5.8%): | |
Aflac, Inc. | | | 4,951 | | | | 296,565 | | |
Alleghany Corporation* | | | 643 | | | | 307,309 | | |
American Financial Group, Inc. | | | 5,121 | | | | 369,122 | | |
American International Group, Inc. | | | 4,412 | | | | 273,412 | | |
AmTrust Financial Services, Inc. | | | 3,398 | | | | 209,249 | | |
Arthur J. Gallagher & Company | | | 8,184 | | | | 335,053 | | |
Assurant, Inc. | | | 3,401 | | | | 273,917 | | |
Brown & Brown, Inc. | | | 10,281 | | | | 330,020 | | |
Chubb Corporation | | | 1,334 | | | | 176,942 | | |
Cincinnati Financial Corporation | | | 5,419 | | | | 320,642 | | |
CNA Financial Corporation | | | 7,860 | | | | 276,279 | | |
Lincoln National Corporation | | | 3,904 | | | | 196,215 | | |
Loews Corporation | | | 8,440 | | | | 324,096 | | |
Markel Corporation* | | | 347 | | | | 306,522 | | |
Marsh & McLennan Companies, Inc. | | | 5,938 | | | | 329,262 | | |
MetLife, Inc. | | | 4,540 | | | | 218,873 | | |
Principal Financial Group, Inc. | | | 4,530 | | | | 203,759 | | |
Progressive Corporation | | | 9,961 | | | | 316,760 | | |
Reinsurance Group of America, Inc. | | | 3,107 | | | | 265,804 | | |
StanCorp Financial Group, Inc. | | | 868 | | | | 98,848 | | |
The Allstate Corporation | | | 4,148 | | | | 257,549 | | |
The Travelers Companies, Inc. | | | 2,932 | | | | 330,905 | | |
Torchmark Corporation | | | 5,226 | | | | 298,718 | | |
W.R. Berkley Corporation | | | 5,005 | | | | 274,024 | | |
| | | | 6,589,845 | | |
Internet & Catalog Retail (0.5%): | |
Expedia, Inc. | | | 1,158 | | | | 143,939 | | |
Netflix, Inc.* | | | 1,026 | | | | 117,354 | | |
The Priceline Group, Inc.* | | | 151 | | | | 192,517 | | |
TripAdvisor, Inc.* | | | 1,742 | | | | 148,506 | | |
| | | | 602,316 | | |
Internet Software & Services (1.0%): | |
Akamai Technologies, Inc.* | | | 2,978 | | | | 156,732 | | |
Alphabet, Inc.* | | | 259 | | | | 201,504 | | |
eBay, Inc.* | | | 8,570 | | | | 235,504 | | |
Facebook, Inc.* | | | 2,198 | | | | 230,043 | | |
VeriSign, Inc.* | | | 3,770 | | | | 329,347 | | |
| | | | 1,153,130 | | |
IT Services (4.3%): | |
Alliance Data Systems Corporation* | | | 910 | | | | 251,679 | | |
Amdocs Ltd. | | | 5,734 | | | | 312,904 | | |
Automatic Data Processing, Inc. | | | 3,382 | | | | 286,523 | | |
See notes to financial statements.
43
Victory Portfolios II
Victory CEMP US 500 Enhanced Volatility Wtd Index ETF | | Schedule of Investments — continued
December 31, 2015 | |
(Unaudited)
Security Description | | Shares | | Value | |
Broadridge Financial Solutions, Inc. | | | 4,788 | | | $ | 257,259 | | |
Cognizant Technology Solutions Corporation* | | | 3,168 | | | | 190,143 | | |
Fidelity National Information Services, Inc. | | | 3,356 | | | | 203,374 | | |
Fiserv, Inc.* | | | 3,141 | | | | 287,276 | | |
FleetCor Technologies, Inc.* | | | 1,569 | | | | 224,257 | | |
Gartner, Inc.* | | | 3,020 | | | | 273,914 | | |
Genpact Ltd.* | | | 10,657 | | | | 266,212 | | |
Global Payments, Inc. | | | 3,963 | | | | 255,653 | | |
International Business Machines Corporation | | | 1,705 | | | | 234,642 | | |
Jack Henry & Associates, Inc. | | | 4,492 | | | | 350,646 | | |
MasterCard, Inc. | | | 2,754 | | | | 268,129 | | |
Paychex, Inc. | | | 6,556 | | | | 346,747 | | |
The Western Union Company | | | 11,162 | | | | 199,911 | | |
Total System Services, Inc. | | | 5,048 | | | | 251,390 | | |
Visa, Inc. | | | 3,387 | | | | 262,662 | | |
Xerox Corporation | | | 18,404 | | | | 195,635 | | |
| | | | 4,918,956 | | |
Leisure Products (0.3%): | |
Hasbro, Inc. | | | 2,528 | | | | 170,286 | | |
Polaris Industries, Inc. | | | 1,519 | | | | 130,558 | | |
| | | | 300,844 | | |
Life Sciences Tools & Services (1.6%): | |
Agilent Technologies, Inc. | | | 6,647 | | | | 277,911 | | |
Illumina, Inc.* | | | 886 | | | | 170,063 | | |
Mettler-Toledo International, Inc.* | | | 850 | | | | 288,261 | | |
PerkinElmer, Inc. | | | 5,965 | | | | 319,545 | | |
Quintiles Transnational Holdings, Inc.* | | | 3,511 | | | | 241,065 | | |
Thermo Fisher Scientific, Inc. | | | 2,054 | | | | 291,360 | | |
Waters Corporation* | | | 2,129 | | | | 286,521 | | |
| | | | 1,874,726 | | |
Machinery (3.8%): | |
Allison Transmission Holdings, Inc. | | | 9,728 | | | | 251,858 | | |
Caterpillar, Inc. | | | 2,961 | | | | 201,230 | | |
Colfax Corporation* | | | 5,322 | | | | 124,269 | | |
Cummins, Inc. | | | 2,084 | | | | 183,413 | | |
Deere & Company | | | 3,068 | | | | 233,996 | | |
Dover Corporation | | | 3,493 | | | | 214,156 | | |
Flowserve Corporation | | | 4,738 | | | | 199,375 | | |
IDEX Corporation | | | 4,358 | | | | 333,866 | | |
Illinois Tool Works, Inc. | | | 3,431 | | | | 317,985 | | |
Ingersoll-Rand PLC | | | 4,687 | | | | 259,144 | | |
Lincoln Electric Holdings, Inc. | | | 3,902 | | | | 202,475 | | |
Middleby Corporation* | | | 1,878 | | | | 202,580 | | |
PACCAR, Inc. | | | 3,981 | | | | 188,699 | | |
Parker-Hannifin Corporation | | | 2,272 | | | | 220,339 | | |
Snap-On, Inc. | | | 1,745 | | | | 299,145 | | |
Stanley Black & Decker, Inc. | | | 2,756 | | | | 294,148 | | |
WABCO Holdings, Inc.* | | | 1,743 | | | | 178,239 | | |
See notes to financial statements.
44
Victory Portfolios II
Victory CEMP US 500 Enhanced Volatility Wtd Index ETF | | Schedule of Investments — continued
December 31, 2015 | |
(Unaudited)
Security Description | | Shares | | Value | |
Wabtec Corporation | | | 2,367 | | | $ | 168,341 | | |
Xylem, Inc. | | | 8,084 | | | | 295,066 | | |
| | | | 4,368,324 | | |
Media (3.1%): | |
AMC Networks, Inc.* | | | 2,590 | | | | 193,421 | | |
Cablevision Systems Corporation | | | 4,828 | | | | 154,013 | | |
CBS Corporation | | | 4,996 | | | | 235,461 | | |
Comcast Corporation | | | 4,261 | | | | 240,448 | | |
Discovery Communications, Inc.* | | | 5,913 | | | | 157,759 | | |
DISH Network Corporation* | | | 3,623 | | | | 207,163 | | |
Lions Gate Entertainment Corporation | | | 4,617 | | | | 149,545 | | |
MSG Network, Inc.* | | | 12,776 | | | | 265,741 | | |
Omnicom Group, Inc. | | | 4,572 | | | | 345,918 | | |
Scripps Networks Interact, Inc. | | | 4,261 | | | | 235,250 | | |
Sirius XM Holdings, Inc.* | | | 69,248 | | | | 281,839 | | |
TEGNA, Inc. | | | 7,408 | | | | 189,052 | | |
The Walt Disney Company | | | 2,136 | | | | 224,451 | | |
Time Warner Cable, Inc. | | | 1,120 | | | | 207,861 | | |
Time Warner, Inc. | | | 3,167 | | | | 204,810 | | |
Twenty-First Century Fox, Inc. | | | 7,850 | | | | 213,206 | | |
| | | | 3,505,938 | | |
Metals & Mining (0.4%): | |
Alcoa, Inc. | | | 15,584 | | | | 153,814 | | |
Newmont Mining Corporation | | | 7,548 | | | | 135,789 | | |
Nucor Corporation | | | 4,545 | | | | 183,163 | | |
| | | | 472,766 | | |
Multiline Retail (0.6%): | |
Dollar General Corporation | | | 3,677 | | | | 264,266 | | |
Kohl's Corporation | | | 3,295 | | | | 156,941 | | |
Macy's, Inc. | | | 3,458 | | | | 120,961 | | |
Nordstrom, Inc. | | | 3,444 | | | | 171,545 | | |
| | | | 713,713 | | |
Multi-Utilities (3.0%): | |
Alliant Energy Corporation | | | 4,676 | | | | 292,016 | | |
Ameren Corporation | | | 6,489 | | | | 280,520 | | |
CenterPoint Energy, Inc. | | | 12,760 | | | | 234,274 | | |
CMS Energy Corporation | | | 7,224 | | | | 260,642 | | |
Consolidated Edison, Inc. | | | 4,370 | | | | 280,860 | | |
Dominion Resources, Inc. | | | 4,103 | | | | 277,527 | | |
DTE Energy Company | | | 3,320 | | | | 266,231 | | |
PG&E Corporation | | | 5,169 | | | | 274,939 | | |
Public Service Enterprise Group, Inc. | | | 5,747 | | | | 222,351 | | |
SCANA Corporation | | | 4,717 | | | | 285,331 | | |
Sempra Energy | | | 2,815 | | | | 264,638 | | |
TECO Energy, Inc. | | | 7,273 | | | | 193,826 | | |
WEC Energy Group, Inc. | | | 5,007 | | | | 256,909 | | |
| | | | 3,390,064 | | |
See notes to financial statements.
45
Victory Portfolios II
Victory CEMP US 500 Enhanced Volatility Wtd Index ETF | | Schedule of Investments — continued
December 31, 2015 | |
(Unaudited)
Security Description | | Shares | | Value | |
Oil, Gas & Consumable Fuels (1.6%): | |
Cheniere Energy Partners LP Holdings LLC | | | 10,399 | | | $ | 180,943 | | |
Chevron Corporation | | | 2,661 | | | | 239,383 | | |
Exxon Mobil Corporation | | | 3,344 | | | | 260,665 | | |
Kinder Morgan, Inc. | | | 8,239 | | | | 122,926 | | |
Marathon Petroleum Corporation | | | 3,103 | | | | 160,859 | | |
ONEOK, Inc. | | | 3,845 | | | | 94,818 | | |
Phillips 66 | | | 2,129 | | | | 174,152 | | |
Plains GP Holdings LP | | | 5,956 | | | | 56,284 | | |
Spectra Energy Corporation | | | 7,694 | | | | 184,194 | | |
Tesoro Corporation | | | 1,456 | | | | 153,419 | | |
Valero Energy Corporation | | | 2,600 | | | | 183,846 | | |
Williams Companies, Inc. | | | 2,744 | | | | 70,521 | | |
| | | | 1,882,010 | | |
Paper & Forest Products (0.2%): | |
International Paper Company | | | 5,364 | | | | 202,223 | | |
Personal Products (0.3%): | |
Estee Lauder Companies, Inc. | | | 2,977 | | | | 262,155 | | |
Herbalife Ltd.* | | | 1,568 | | | | 84,076 | | |
| | | | 346,231 | | |
Pharmaceuticals (1.1%): | |
Eli Lilly and Company | | | 2,705 | | | | 227,924 | | |
Johnson & Johnson | | | 3,267 | | | | 335,586 | | |
Merck & Company, Inc. | | | 4,543 | | | | 239,961 | | |
Mylan NV* | | | 2,548 | | | | 137,771 | | |
Pfizer, Inc. | | | 9,151 | | | | 295,394 | | |
| | | | 1,236,636 | | |
Professional Services (1.4%): | |
Equifax, Inc. | | | 2,566 | | | | 285,775 | | |
IHS, Inc.* | | | 1,864 | | | | 220,754 | | |
ManpowerGroup, Inc. | | | 2,026 | | | | 170,772 | | |
Nielsen Holdings PLC | | | 5,170 | | | | 240,922 | | |
Robert Half International, Inc. | | | 4,409 | | | | 207,840 | | |
Towers Watson & Company | | | 1,977 | | | | 253,965 | | |
Verisk Analytics, Inc.* | | | 3,292 | | | | 253,089 | | |
| | | | 1,633,117 | | |
Real Estate Management & Development (0.4%): | |
CBRE Group, Inc.* | | | 6,743 | | | | 233,173 | | |
Jones Lang LaSalle Inc. | | | 1,299 | | | | 207,658 | | |
| | | | 440,831 | | |
Road & Rail (1.4%): | |
AMERCO | | | 656 | | | | 255,512 | | |
CSX Corporation | | | 7,260 | | | | 188,397 | | |
JB Hunt Transport Services, Inc. | | | 3,497 | | | | 256,540 | | |
Kansas City Southern | | | 2,001 | | | | 149,415 | | |
Norfolk Southern Corporation | | | 2,971 | | | | 251,317 | | |
Old Dominion Freight Line, Inc.* | | | 3,570 | | | | 210,880 | | |
See notes to financial statements.
46
Victory Portfolios II
Victory CEMP US 500 Enhanced Volatility Wtd Index ETF | | Schedule of Investments — continued
December 31, 2015 | |
(Unaudited)
Security Description | | Shares | | Value | |
Ryder System, Inc. | | | 2,697 | | | $ | 153,270 | | |
Union Pacific Corporation | | | 2,430 | | | | 190,026 | | |
| | | | 1,655,357 | | |
Semiconductors & Semiconductor Equipment (2.3%): | |
Analog Devices, Inc. | | | 2,996 | | | | 165,739 | | |
Applied Materials, Inc. | | | 11,698 | | | | 218,401 | | |
Intel Corporation | | | 10,723 | | | | 369,407 | | |
KLA-Tencor Corporation | | | 3,871 | | | | 268,454 | | |
Lam Research Corporation | | | 2,597 | | | | 206,254 | | |
Linear Technology Corporation | | | 5,440 | | | | 231,037 | | |
Microchip Technology, Inc. | | | 4,855 | | | | 225,952 | | |
Micron Technology, Inc.* | | | 6,113 | | | | 86,560 | | |
NVIDIA Corporation | | | 6,850 | | | | 225,776 | | |
NXP Semiconductors NV* | | | — | + | | | 1 | | |
Skyworks Solutions, Inc. | | | 1,575 | | | | 121,007 | | |
Texas Instruments, Inc. | | | 4,291 | | | | 235,190 | | |
Xilinx, Inc. | | | 4,997 | | | | 234,709 | | |
| | | | 2,588,487 | | |
Software (2.8%): | |
Adobe Systems, Inc.* | | | 2,962 | | | | 278,250 | | |
ANSYS, Inc.* | | | 2,873 | | | | 265,753 | | |
CA, Inc. | | | 8,868 | | | | 253,270 | | |
Cadence Design System, Inc.* | | | 9,935 | | | | 206,747 | | |
Citrix Systems, Inc.* | | | 2,721 | | | | 205,844 | | |
Electronic Arts, Inc.* | | | 2,582 | | | | 177,435 | | |
Oracle Corporation | | | 6,831 | | | | 249,536 | | |
Red Hat, Inc.* | | | 2,927 | | | | 242,385 | | |
SS&C Technologies Holdings, Inc. | | | 2,685 | | | | 183,305 | | |
Symantec Corporation | | | 9,676 | | | | 203,196 | | |
Synopsys, Inc.* | | | 5,899 | | | | 269,053 | | |
Tyler Technologies, Inc.* | | | 1,471 | | | | 256,425 | | |
Ultimate Software Group, Inc.* | | | 1,152 | | | | 225,228 | | |
VMware, Inc.* | | | 2,441 | | | | 138,087 | | |
| | | | 3,154,514 | | |
Specialty Retail (3.8%): | |
Advance Auto Parts, Inc. | | | 1,162 | | | | 174,893 | | |
AutoNation, Inc.* | | | 3,958 | | | | 236,134 | | |
AutoZone, Inc.* | | | 407 | | | | 301,957 | | |
Bed Bath & Beyond, Inc.* | | | 3,675 | | | | 177,319 | | |
Best Buy Company, Inc. | | | 3,781 | | | | 115,131 | | |
CarMax, Inc.* | | | 3,494 | | | | 188,571 | | |
Dick's Sporting Goods, Inc. | | | 3,741 | | | | 132,244 | | |
Foot Locker, Inc. | | | 3,381 | | | | 220,069 | | |
GameStop Corporation | | | 3,651 | | | | 102,374 | | |
L Brands, Inc. | | | 2,507 | | | | 240,221 | | |
Lowe's Companies, Inc. | | | 3,620 | | | | 275,265 | | |
O'Reilly Automotive, Inc.* | | | 966 | | | | 244,804 | | |
Penske Automotive Group, Inc. | | | 3,570 | | | | 151,154 | | |
Ross Stores, Inc. | | | 4,233 | | | | 227,778 | | |
See notes to financial statements.
47
Victory Portfolios II
Victory CEMP US 500 Enhanced Volatility Wtd Index ETF | | Schedule of Investments — continued
December 31, 2015 | |
(Unaudited)
Security Description | | Shares | | Value | |
The Gap, Inc. | | | 7,661 | | | $ | 189,227 | | |
The Home Depot, Inc. | | | 2,181 | | | | 288,437 | | |
The TJX Companies, Inc. | | | 3,469 | | | | 245,987 | | |
Tiffany & Company | | | 1,886 | | | | 143,883 | | |
Tractor Supply Company | | | 2,492 | | | | 213,066 | | |
Ulta Salon, Cosmetics & Fragrances, Inc.* | | | 1,579 | | | | 292,115 | | |
Williams-Sonoma, Inc. | | | 3,002 | | | | 175,347 | | |
| | | | 4,335,976 | | |
Technology Hardware, Storage & Peripherals (0.8%): | |
Apple, Inc. | | | 1,718 | | | | 180,837 | | |
EMC Corporation | | | 8,259 | | | | 212,091 | | |
HP, Inc. | | | 14,116 | | | | 167,133 | | |
SanDisk Corporation | | | 1,931 | | | | 146,737 | | |
Seagate Technology PLC | | | 3,438 | | | | 126,037 | | |
Western Digital Corporation | | | 2,105 | | | | 126,405 | | |
| | | | 959,240 | | |
Textiles, Apparel & Luxury Goods (1.4%): | |
Carter's, Inc. | | | 2,451 | | | | 218,212 | | |
Coach, Inc. | | | 6,233 | | | | 204,006 | | |
Hanesbrands, Inc. | | | 6,170 | | | | 181,583 | | |
NIKE, Inc. | | | 4,730 | | | | 295,625 | | |
PVH Corporation | | | 1,606 | | | | 118,282 | | |
Ralph Lauren Corporation | | | 1,456 | | | | 162,315 | | |
Skechers U.S.A., Inc.* | | | 2,836 | | | | 85,676 | | |
Under Armour, Inc.* | | | 1,898 | | | | 152,998 | | |
VF Corporation | | | 3,582 | | | | 222,979 | | |
| | | | 1,641,676 | | |
Thrifts & Mortgage Finance (0.6%): | |
New York Community Bancorp, Inc. | | | 16,430 | | | | 268,138 | | |
TFS Financial Corporation | | | 20,618 | | | | 388,237 | | |
| | | | 656,375 | | |
Tobacco (0.7%): | |
Altria Group, Inc. | | | 5,219 | | | | 303,798 | | |
Philip Morris International, Inc. | | | 3,353 | | | | 294,762 | | |
Reynolds American, Inc. | | | 5,667 | | | | 261,532 | | |
| | | | 860,092 | | |
Trading Companies & Distributors (0.5%): | |
Fastenal Company | | | 5,799 | | | | 236,715 | | |
United Rentals, Inc.* | | | 1,825 | | | | 132,385 | | |
W.W. Grainger, Inc. | | | 1,269 | | | | 257,087 | | |
| | | | 626,187 | | |
Water Utilities (0.6%): | |
American Water Works Company, Inc. | | | 5,620 | | | | 335,795 | | |
Aqua America, Inc. | | | 10,400 | | | | 309,920 | | |
| | | | 645,715 | | |
Total Common Stocks (Cost $116,883,957) | | | 113,942,486 | | |
See notes to financial statements.
48
Victory Portfolios II
Victory CEMP US 500 Enhanced Volatility Wtd Index ETF | | Schedule of Investments — continued
December 31, 2015 | |
(Unaudited)
Security Description | | Shares | | Value | |
Short-Term Investments (0.3%) | |
Money Market Funds (0.3%): | |
Short Term Investment Trust Liquid Assets Portfolio, 0.29%^ | | | 372,147 | | | $ | 372,147 | | |
Total Short-Term Investments — (Cost $372,147) | | | 372,147 | | |
Total Investments — 99.9% (Cost $117,256,104) | | | 114,314,633 | | |
Other assets in excess of liabilities — 0.1% | | | 85,298 | | |
NET ASSETS — 100.0% | | $ | 114,399,931 | | |
* Non-income producing security.
^ Annualized seven-day yield as of December 31, 2015.
+ Less than 0.5 shares.
The Global Industry Classification Standard (GICS®) was developed by and/or is the exclusive property of MSCI, Inc. and Standard & Poor's Financial Services LLC ("S&P"). GICS® is a service mark of MSCI, Inc. and S&P and has been licensed for use by the Fund's Administrator, U.S. Bancorp Fund Services, LLC.
Schedule of Open Futures Contracts
Number of
Contracts
Purchased | | Description | | Notional Amount | | Unrealized
Appreciation | |
| | 3 | | | S&P 500 E-Mini Future, March 2016 | | $ | 305,310 | | | $ | 1,823 | | |
| | | $ | 1,823 | | |
See notes to financial statements.
49
Victory Portfolios II
Victory CEMP Developed Enhanced Volatility Wtd Index ETF | | Schedule of Investments
December 31, 2015 | |
(Unaudited)
Security Description | | Shares | | Value | |
Common Stocks (98.6%) | |
Australia (4.7%): | |
Amcor Ltd. | | | 7,184 | | | $ | 70,358 | | |
AMP Ltd. | | | 15,365 | | | | 65,275 | | |
Aurizon Holdings Ltd. | | | 18,582 | | | | 59,308 | | |
Australia & New Zealand Banking Group Ltd. | | | 3,216 | | | | 65,454 | | |
Brambles Ltd. | | | 10,570 | | | | 89,116 | | |
Commonwealth Bank of Australia | | | 1,448 | | | | 90,247 | | |
CSL Ltd. | | | 1,091 | | | | 83,723 | | |
Insurance Australia Group Ltd. | | | 17,604 | | | | 71,324 | | |
Macquarie Group Ltd. | | | 1,222 | | | | 73,704 | | |
National Australia Bank Ltd. | | | 3,573 | | | | 78,630 | | |
Newcrest Mining Ltd.* | | | 4,890 | | | | 46,216 | | |
Oil Search Ltd. | | | 7,241 | | | | 35,353 | | |
QBE Insurance Group Ltd. | | | 6,206 | | | | 56,936 | | |
Ramsay Health Care Ltd. | | | 1,505 | | | | 74,509 | | |
Suncorp Group Ltd. | | | 9,121 | | | | 80,688 | | |
Telstra Corporation Ltd. | | | 22,531 | | | | 92,107 | | |
Wesfarmers Ltd. | | | 3,067 | | | | 92,992 | | |
Westpac Banking Corporation | | | 2,896 | | | | 70,822 | | |
Woodside Petroleum Ltd. | | | 2,332 | | | | 48,805 | | |
Woolworths Ltd. | | | 3,197 | | | | 57,076 | | |
| | | | 1,402,643 | | |
Austria (0.1%): | |
Voestalpine AG | | | 1,128 | | | | 34,747 | | |
Belgium (2.1%): | |
Ageas | | | 2,125 | | | | 98,840 | | |
Anheuser-Busch InBev SA/NV | | | 527 | | | | 65,519 | | |
Colruyt SA | | | 1,617 | | | | 83,374 | | |
Groupe Bruxelles Lambert SA | | | 1,110 | | | | 95,093 | | |
KBC Groep NV | | | 846 | | | | 53,022 | | |
Proximus SADP | | | 1,787 | | | | 58,261 | | |
Solvay SA | | | 470 | | | | 50,276 | | |
Telenet Group Holding NV* | | | 1,241 | | | | 67,123 | | |
UCB SA | | | 677 | | | | 61,235 | | |
| | | | 632,743 | | |
Canada (8.9%): | |
Alimentation Couche-Tard, Inc. | | | 1,900 | | | | 83,637 | | |
Bank of Montreal | | | 1,900 | | | | 107,214 | | |
Bank of Nova Scotia | | | 1,900 | | | | 76,854 | | |
BCE, Inc. | | | 1,900 | | | | 73,407 | | |
Brookfield Asset Management, Inc. | | | 2,850 | | | | 89,906 | | |
Canadian National Railway Company | | | 1,900 | | | | 106,212 | | |
Canadian Utilities Ltd. | | | 3,800 | | | | 87,716 | | |
CGI Group, Inc.* | | | 1,900 | | | | 76,071 | | |
Empire Company Ltd. | | | 3,800 | | | | 70,689 | | |
Fortis, Inc. | | | 3,800 | | | | 102,738 | | |
Franco-Nevada Corporation | | | 1,900 | | | | 86,919 | | |
See notes to financial statements.
50
Victory Portfolios II
Victory CEMP Developed Enhanced Volatility Wtd Index ETF | | Schedule of Investments — continued
December 31, 2015 | |
(Unaudited)
Security Description | | Shares | | Value | |
Gildan Activewear, Inc. | | | 3,800 | | | $ | 108,038 | | |
Great-West Lifeco, Inc. | | | 3,800 | | | | 94,828 | | |
Imperial Oil Ltd. | | | 1,900 | | | | 61,901 | | |
Inter Pipeline Ltd. | | | 3,800 | | | | 60,994 | | |
Loblaw Companies Ltd. | | | 1,900 | | | | 89,720 | | |
lululemon athletica, Inc.* | | | 809 | | | | 42,448 | | |
Magna International, Inc. | | | 1,900 | | | | 77,060 | | |
Manulife Financial Corporation | | | 5,600 | | | | 83,937 | | |
Metro, Inc. | | | 3,800 | | | | 106,390 | | |
National Bank Of Canada | | | 1,900 | | | | 55,351 | | |
Pembina Pipeline Corporation | | | 3,800 | | | | 82,800 | | |
Potash Corporation of Saskatchewan, Inc. | | | 3,800 | | | | 65,086 | | |
Power Corporation of Canada | | | 3,800 | | | | 79,477 | | |
Power Financial Corporation | | | 3,800 | | | | 87,358 | | |
Rogers Communications, Inc. | | | 1,900 | | | | 65,526 | | |
Royal Bank Of Canada | | | 1,900 | | | | 101,818 | | |
Saputo, Inc. | | | 3,800 | | | | 90,901 | | |
Shaw Communications, Inc. | | | 5,600 | | | | 96,321 | | |
Sun Life Financial, Inc. | | | 1,900 | | | | 59,251 | | |
TELUS Corporation | | | 1,900 | | | | 52,536 | | |
Toronto-Dominion Bank | | | 1,900 | | | | 74,479 | | |
TransCanada Corporation | | | 1,900 | | | | 62,052 | | |
| | | | 2,659,635 | | |
Denmark (1.7%): | |
A.P. Moeller - Maersk A/S | | | 19 | | | | 24,832 | | |
Chr Hansen Holding A/S | | | 1,204 | | | | 75,688 | | |
Coloplast A/S | | | 734 | | | | 59,535 | | |
DSV A/S | | | 1,937 | | | | 76,637 | | |
ISS A/S | | | 1,806 | | | | 65,405 | | |
Novo Nordisk A/S | | | 865 | | | | 50,372 | | |
Novozymes A/S | | | 1,110 | | | | 53,437 | | |
Pandora A/S | | | 376 | | | | 47,745 | | |
Vestas Wind System A/S | | | 809 | | | | 56,995 | | |
| | | | 510,646 | | |
Finland (1.2%): | |
Fortum OYJ | | | 3,179 | | | | 48,091 | | |
Kone OYJ | | | 1,373 | | | | 58,446 | | |
Nokia OYJ | | | 6,376 | | | | 45,698 | | |
Sampo OYJ | | | 1,467 | | | | 74,931 | | |
UPM-Kymmene OYJ | | | 3,047 | | | | 57,054 | | |
Wartsila OYJ Abp | | | 1,505 | | | | 68,939 | | |
| | | | 353,159 | | |
France (9.3%): | |
Accor SA | | | 1,166 | | | | 50,693 | | |
Aeroports de Paris | | | 658 | | | | 76,657 | | |
Air Liquide SA | | | 545 | | | | 61,390 | | |
Airbus Group SE | | | 715 | | | | 48,176 | | |
Atos SE | | | 809 | | | | 68,093 | | |
See notes to financial statements.
51
Victory Portfolios II
Victory CEMP Developed Enhanced Volatility Wtd Index ETF | | Schedule of Investments — continued
December 31, 2015 | |
(Unaudited)
Security Description | | Shares | | Value | |
AXA SA | | | 2,069 | | | $ | 56,730 | | |
BNP Paribas SA | | | 790 | | | | 44,841 | | |
Bollore SA | | | 9,761 | | | | 45,582 | | |
Bureau Veritas SA | | | 3,047 | | | | 60,896 | | |
Cap Gemini SA | | | 639 | | | | 59,444 | | |
Carrefour SA | | | 1,900 | | | | 55,028 | | |
Casino Guichard Perrachon SA | | | 922 | | | | 42,499 | | |
Christian Dior SE | | | 282 | | | | 48,038 | | |
Cie de Saint-Gobain | | | 1,241 | | | | 53,744 | | |
Cie Generale des Etablissements Michelin | | | 583 | | | | 55,692 | | |
CNP Assurances | | | 4,157 | | | | 56,199 | | |
Credit Agricole SA | | | 3,404 | | | | 40,249 | | |
Danone SA | | | 1,185 | | | | 80,205 | | |
Dassault Systemes | | | 903 | | | | 72,393 | | |
Eiffage SA | | | 809 | | | | 52,338 | | |
Electricite de France SA | | | 2,896 | | | | 42,724 | | |
Essilor International SA | | | 451 | | | | 56,389 | | |
Eutelsat Communications SA | | | 2,445 | | | | 73,336 | | |
Groupe Eurotunnel SE | | | 5,191 | | | | 64,650 | | |
Hermes International | | | 169 | | | | 57,257 | | |
Iliad SA | | | 226 | | | | 54,034 | | |
Ingenico Group SA | | | 376 | | | | 47,604 | | |
JCDecaux SA | | | 1,824 | | | | 69,973 | | |
Kering | | | 357 | | | | 61,280 | | |
Legrand SA | | | 1,091 | | | | 61,891 | | |
L'Oreal SA | | | 320 | | | | 54,007 | | |
LVMH Moet Hennessy Louis Vuitton SE | | | 263 | | | | 41,415 | | |
Natixis SA | | | 7,580 | | | | 42,976 | | |
Orange SA | | | 2,990 | | | | 50,317 | | |
Pernod Ricard SA | | | 583 | | | | 66,652 | | |
Publicis Groupe SA | | | 940 | | | | 62,703 | | |
Renault SA | | | 451 | | | | 45,400 | | |
Sanofi | | | 545 | | | | 46,553 | | |
Schneider Electric SE | | | 884 | | | | 50,494 | | |
Societe BIC SA | | | 395 | | | | 65,099 | | |
Societe Generale SA | | | 978 | | | | 45,245 | | |
Sodexo SA | | | 959 | | | | 93,944 | | |
Suez Environnement Company | | | 2,483 | | | | 46,575 | | |
Thales SA | | | 959 | | | | 72,016 | | |
Valeo SA | | | 320 | | | | 49,573 | | |
Veolia Environnement SA | | | 2,633 | | | | 62,565 | | |
Vinci SA | | | 978 | | | | 62,857 | | |
Vivendi SA | | | 2,915 | | | | 62,914 | | |
Zodiac Aerospace | | | 1,561 | | | | 37,279 | | |
| | | | 2,776,609 | | |
Germany (6.0%): | |
Allianz SE | | | 395 | | | | 70,207 | | |
BASF SE | | | 677 | | | | 52,031 | | |
Bayer AG | | | 357 | | | | 44,927 | | |
Bayerische Motoren Werk AG | | | 489 | | | | 51,883 | | |
See notes to financial statements.
52
Victory Portfolios II
Victory CEMP Developed Enhanced Volatility Wtd Index ETF | | Schedule of Investments — continued
December 31, 2015 | |
(Unaudited)
Security Description | | Shares | | Value | |
Beiersdorf AG | | | 809 | | | $ | 73,992 | | |
Brenntag AG | | | 1,147 | | | | 60,181 | | |
Continental AG | | | 188 | | | | 45,878 | | |
Daimler AG | | | 621 | | | | 52,357 | | |
Deutsche Boerse AG | | | 752 | | | | 66,515 | | |
Deutsche Post AG | | | 2,332 | | | | 65,778 | | |
Evonik Industries AG | | | 1,655 | | | | 55,064 | | |
Fresenius Medical Care AG & Company KGaA | | | 771 | | | | 65,129 | | |
Fresenius SE & KGaA | | | 790 | | | | 56,638 | | |
Hannover Rueck SE | | | 677 | | | | 77,730 | | |
HUGO BOSS AG | | | 527 | | | | 43,870 | | |
Infineon Technologies AG | | | 4,947 | | | | 72,605 | | |
K+S AG | | | 809 | | | | 20,766 | | |
Kabel Deutschland Holding AG | | | 621 | | | | 77,037 | | |
Linde AG | | | 414 | | | | 60,244 | | |
Merck KGaA | | | 583 | | | | 56,750 | | |
Muenchener Rueckversicherungs-Gesellschaft AG | | | 470 | | | | 94,264 | | |
ProSiebenSat.1 Media AG | | | 1,091 | | | | 55,447 | | |
SAP SE | | | 1,034 | | | | 82,458 | | |
Siemens AG | | | 734 | | | | 71,695 | | |
Symrise AG | | | 1,034 | | | | 68,917 | | |
Talanx AG | | | 2,088 | | | | 64,773 | | |
United Internet AG | | | 1,053 | | | | 58,259 | | |
Volkswagen AG | | | 245 | | | | 37,888 | | |
Vonovia SE | | | 1,580 | | | | 49,022 | | |
Zalando SE* | | | 1,185 | | | | 46,876 | | |
| | | | 1,799,181 | | |
Hong Kong (5.6%): | |
Bank Of East Asia Ltd. | | | 22,600 | | | | 84,130 | | |
Beijing Enterprise Holdings Ltd. | | | 9,500 | | | | 57,551 | | |
BOC Hong Kong Holdings Ltd. | | | 19,000 | | | | 58,103 | | |
Cathay Pacific Airways Ltd. | | | 38,000 | | | | 65,801 | | |
China Gas Holdings Ltd. | | | 38,000 | | | | 54,818 | | |
China Mobile Ltd. | | | 9,500 | | | | 107,257 | | |
China Taiping Insurance Holdings Company Ltd.* | | | 7,600 | | | | 23,535 | | |
China Unicom Hong Kong Ltd. | | | 38,000 | | | | 46,335 | | |
Chow Tai Fook Jewellery Group Ltd. | | | 52,600 | | | | 33,935 | | |
CITIC Ltd. | | | 38,000 | | | | 67,272 | | |
CLP Holdings Ltd. | | | 9,500 | | | | 80,719 | | |
Hanergy Thin Film Power Group Ltd.*+ | | | 26,000 | | | | 570 | | |
Hong Kong & China Gas Company Ltd. | | | 41,800 | | | | 81,981 | | |
Hongkong Land Holdings Ltd. | | | 9,400 | | | | 65,800 | | |
Jardine Matheson Holdings Ltd. | | | 1,900 | | | | 92,587 | | |
Jardine Strategic Holdings Ltd. | | | 3,800 | | | | 103,854 | | |
MTR Corporation Ltd. | | | 19,000 | | | | 94,141 | | |
New World Development Company Ltd. | | | 75,000 | | | | 74,129 | | |
Power Assets Holdings Ltd. | | | 9,500 | | | | 87,400 | | |
Sino Land Company Ltd. | | | 38,000 | | | | 55,700 | | |
Swire Pacific Ltd. | | | 9,500 | | | | 106,890 | | |
Swire Properties Ltd. | | | 22,600 | | | | 65,321 | | |
See notes to financial statements.
53
Victory Portfolios II
Victory CEMP Developed Enhanced Volatility Wtd Index ETF | | Schedule of Investments — continued
December 31, 2015 | |
(Unaudited)
Security Description | | Shares | | Value | |
Techtronic Industries Company Ltd. | | | 9,500 | | | $ | 38,735 | | |
WH Group Ltd.* | | | 66,000 | | | | 36,875 | | |
Wheelock & Company, Ltd. | | | 19,000 | | | | 80,045 | | |
| | | | 1,663,484 | | |
Ireland (2.0%): | |
Accenture PLC | | | 715 | | | | 74,717 | | |
Bank Of Ireland* | | | 99,231 | | | | 36,666 | | |
CRH PLC | | | 1,603 | | | | 46,578 | | |
DCC PLC | | | 865 | | | | 72,176 | | |
Experian PLC | | | 3,912 | | | | 69,263 | | |
Jazz Pharmaceuticals PLC* | | | 282 | | | | 39,638 | | |
Kerry Group PLC | | | 1,034 | | | | 86,345 | | |
Shire PLC | | | 677 | | | | 46,888 | | |
Smurfit Kappa Group PLC | | | 1,542 | | | | 39,532 | | |
XL Group PLC | | | 2,502 | | | | 98,028 | | |
| | | | 609,831 | | |
Israel (0.6%): | |
Check Point Software Technologies Ltd.* | | | 752 | | | | 61,198 | | |
Israel Chemicals Ltd. | | | 11,492 | | | | 46,694 | | |
Teva Pharmaceutical Industries Ltd. | | | 922 | | | | 60,306 | | |
| | | | 168,198 | | |
Italy (1.9%): | |
Assicurazioni Generali SpA | | | 3,028 | | | | 55,679 | | |
Atlantia SpA | | | 2,201 | | | | 58,603 | | |
EXOR SpA | | | 1,166 | | | | 53,335 | | |
Finmeccanica SpA* | | | 3,197 | | | | 44,819 | | |
Intesa Sanpaolo SpA | | | 11,943 | | | | 40,080 | | |
Luxottica Group SpA | | | 771 | | | | 50,609 | | |
Mediobanca SpA | | | 4,514 | | | | 43,586 | | |
Prada SpA | | | 11,300 | | | | 35,139 | | |
Snam SpA | | | 12,056 | | | | 63,282 | | |
Terna Rete Elettrica Nazionale SpA | | | 14,764 | | | | 76,309 | | |
UniCredit SpA | | | 6,526 | | | | 36,418 | | |
| | | | 557,859 | | |
Japan (20.0%): | |
Aeon Company Ltd. | | | 3,800 | | | | 59,057 | | |
Aisin Seiki Company Ltd. | | | 1,900 | | | | 82,832 | | |
Asahi Glass Company Ltd. | | | 19,000 | | | | 110,021 | | |
Asahi Group Holdings Ltd. | | | 1,900 | | | | 60,053 | | |
Astellas Pharma, Inc. | | | 5,600 | | | | 80,672 | | |
Bridgestone Corporation | | | 1,900 | | | | 65,981 | | |
Canon, Inc. | | | 3,800 | | | | 116,186 | | |
Chugai Pharmaceutical Company, Ltd. | | | 1,900 | | | | 67,024 | | |
Dai-ichi Life Insurance Company Ltd. | | | 3,800 | | | | 64,337 | | |
Daiichi Sankyo Company, Ltd. | | | 3,800 | | | | 79,370 | | |
Daiwa House Industry Company, Ltd. | | | 3,800 | | | | 110,748 | | |
Dentsu, Inc. | | | 1,900 | | | | 105,595 | | |
Eisai Company Ltd. | | | 1,900 | | | | 127,457 | | |
See notes to financial statements.
54
Victory Portfolios II
Victory CEMP Developed Enhanced Volatility Wtd Index ETF | | Schedule of Investments — continued
December 31, 2015 | |
(Unaudited)
Security Description | | Shares | | Value | |
Fuji Heavy Industries Ltd. | | | 1,900 | | | $ | 79,465 | | |
FUJIFILM Holdings Corporation | | | 1,900 | | | | 80,303 | | |
Hitachi Ltd. | | | 19,000 | | | | 109,310 | | |
Honda Motor Company Ltd. | | | 1,900 | | | | 61,808 | | |
Hoya Corporation | | | 1,900 | | | | 78,738 | | |
Isuzu Motors Ltd. | | | 5,600 | | | | 61,220 | | |
ITOCHU Corporation | | | 5,600 | | | | 67,184 | | |
Japan Airlines Company Ltd. | | | 1,900 | | | | 68,858 | | |
Japan Exchange Group, Inc. | | | 3,800 | | | | 60,385 | | |
Japan Tobacco, Inc. | | | 1,900 | | | | 70,676 | | |
JFE Holdings, Inc. | | | 3,800 | | | | 60,701 | | |
Kao Corporation | | | 1,900 | | | | 98,877 | | |
KDDI Corporation | | | 3,800 | | | | 99,715 | | |
Kirin Holdings Company Ltd. | | | 5,600 | | | | 76,759 | | |
Komatsu Ltd. | | | 3,800 | | | | 62,978 | | |
Kyocera Corporation | | | 1,900 | | | | 89,376 | | |
M3, Inc. | | | 3,800 | | | | 79,734 | | |
Mazda Motor Corporation | | | 3,800 | | | | 79,797 | | |
Mitsubishi Corporation | | | 3,800 | | | | 64,116 | | |
Mitsubishi Heavy Industries Ltd. | | | 19,000 | | | | 84,302 | | |
Mitsubishi Motors Corporation | | | 7,500 | | | | 64,271 | | |
Mitsubishi UFJ Financial Group, Inc. | | | 9,400 | | | | 59,210 | | |
Mitsui & Company Ltd. | | | 5,600 | | | | 67,347 | | |
Mizuho Financial Group, Inc. | | | 30,100 | | | | 60,979 | | |
Nippon Steel & Sumitomo Metal Corporation | | | 3,800 | | | | 76,383 | | |
Nippon Telegraph & Telephone Corporation | | | 1,900 | | | | 76,446 | | |
Nissan Motor Company, Ltd. | | | 7,500 | | | | 79,839 | | |
Nomura Holdings, Inc. | | | 11,300 | | | | 63,845 | | |
Nomura Research Institute Ltd. | | | 2,090 | | | | 81,204 | | |
NTT Data Corporation | | | 1,900 | | | | 92,949 | | |
NTT DOCOMO, Inc. | | | 3,800 | | | | 78,532 | | |
Omron Corporation | | | 1,900 | | | | 64,258 | | |
ORIX Corporation | | | 3,800 | | | | 54,236 | | |
Osaka Gas Company Ltd. | | | 19,000 | | | | 69,301 | | |
Otsuka Holdings Company, Ltd. | | | 1,900 | | | | 68,242 | | |
Panasonic Corporation | | | 5,600 | | | | 57,796 | | |
Rakuten, Inc. | | | 3,800 | | | | 44,356 | | |
Recruit Holdings Company Ltd. | | | 1,900 | | | | 56,275 | | |
Renesas Electronics Corporation | | | 7,500 | | | | 48,047 | | |
Resona Holdings, Inc. | | | 11,300 | | | | 55,581 | | |
Ricoh Company Ltd. | | | 5,600 | | | | 58,285 | | |
Seibu Holdings, Inc. | | | 3,800 | | | | 78,438 | | |
Sekisui House Ltd. | | | 5,600 | | | | 95,348 | | |
Seven & i Holdings Company, Ltd. | | | 1,900 | | | | 87,732 | | |
Shin-Etsu Chemical Company Ltd. | | | 1,900 | | | | 104,599 | | |
Shiseido Company Ltd. | | | 3,800 | | | | 79,955 | | |
Sompo Japan Nipponkoa Holdings, Inc. | | | 1,900 | | | | 63,404 | | |
Sony Financial Holdings, Inc. | | | 3,800 | | | | 68,890 | | |
Sumitomo Chemical Company Ltd. | | | 19,000 | | | | 110,812 | | |
Sumitomo Electric Industries Ltd. | | | 5,600 | | | | 80,323 | | |
See notes to financial statements.
55
Victory Portfolios II
Victory CEMP Developed Enhanced Volatility Wtd Index ETF | | Schedule of Investments — continued
December 31, 2015 | |
(Unaudited)
Security Description | | Shares | | Value | |
Sumitomo Mitsui Financial Group, Inc. | | | 1,900 | | | $ | 72,810 | | |
Sumitomo Mitsui Trust Holdings, Inc. | | | 19,000 | | | | 72,873 | | |
Suntory Beverage & Food Ltd. | | | 1,900 | | | | 84,097 | | |
Suzuki Motor Corporation | | | 1,900 | | | | 58,536 | | |
T&D Holdings, Inc. | | | 3,800 | | | | 50,869 | | |
Terumo Corporation | | | 1,900 | | | | 59,753 | | |
Tokio Marine Holdings, Inc. | | | 1,900 | | | | 74,486 | | |
Tokyo Electron Ltd. | | | 1,900 | | | | 115,744 | | |
Toshiba Corporation | | | 19,000 | | | | 39,503 | | |
Toyota Industries Corporation | | | 1,900 | | | | 103,224 | | |
Toyota Motor Corporation | | | 1,900 | | | | 118,368 | | |
Toyota Tsusho Corporation | | | 3,800 | | | | 90,072 | | |
Unicharm Corporation | | | 3,800 | | | | 78,311 | | |
Yahoo Japan Corporation | | | 13,200 | | | | 54,252 | | |
Yakult Honsha Company Ltd. | | | 1,900 | | | | 94,214 | | |
| | | | 5,977,630 | | |
Netherlands (2.5%): | |
Aegon NV | | | 8,313 | | | | 47,249 | | |
AerCap Holdings NV* | | | 1,448 | | | | 62,496 | | |
Akzo Nobel NV | | | 922 | | | | 61,803 | | |
| ASML Holding NV | | | 470 | | | | 42,164 | | |
Boskalis Westminster | | | 1,016 | | | | 41,549 | | |
Gemalto NV | | | 809 | | | | 48,592 | | |
Heineken NV | | | 846 | | | | 72,421 | | |
Koninklijke Ahold NV | | | 2,915 | | | | 61,695 | | |
NN Group NV | | | 2,614 | | | | 92,467 | | |
OCI NV* | | | 1,241 | | | | 30,749 | | |
QIAGEN NV* | | | 2,445 | | | | 67,604 | | |
Randstad Holding NV | | | 865 | | | | 54,081 | | |
Wolters Kluwer NV | | | 2,012 | | | | 67,707 | | |
| | | | 750,577 | | |
Norway (0.9%): | |
DNB ASA | | | 4,533 | | | | 56,229 | | |
Gjensidige Forsikring ASA | | | 5,379 | | | | 86,352 | | |
Telenor ASA | | | 3,291 | | | | 55,137 | | |
Yara International ASA | | | 1,354 | | | | 58,571 | | |
| | | | 256,289 | | |
Portugal (0.3%): | |
EDP-Energias de Portugal SA | | | 15,329 | | | | 55,324 | | |
Jeronimo Martins SGPS SA | | | 2,765 | | | | 36,044 | | |
| | | | 91,368 | | |
Singapore (3.2%): | |
Avago Technologies Ltd. | | | 282 | | | | 40,932 | | |
CapitaLand Ltd. | | | 33,900 | | | | 80,094 | | |
DBS Group Holdings Ltd. | | | 5,600 | | | | 65,917 | | |
Global Logistic Properties Ltd. | | | 41,400 | | | | 62,776 | | |
Jardine Cycle & Carriage Ltd. | | | 3,800 | | | | 93,399 | | |
Keppel Corporation Ltd. | | | 15,000 | | | | 68,870 | | |
See notes to financial statements.
56
Victory Portfolios II
Victory CEMP Developed Enhanced Volatility Wtd Index ETF | | Schedule of Investments — continued
December 31, 2015 | |
(Unaudited)
Security Description | | Shares | | Value | |
Oversea-Chinese Banking Corporation, Ltd. | | | 15,000 | | | $ | 93,095 | | |
Singapore Airlines Ltd. | | | 11,300 | | | | 89,259 | | |
Singapore Technologies Engineering Ltd. | | | 33,900 | | | | 71,965 | | |
Singapore Telecommunications Ltd. | | | 30,100 | | | | 77,909 | | |
United Overseas Bank Ltd. | | | 7,500 | | | | 103,727 | | |
Wilmar International Ltd. | | | 45,100 | | | | 93,514 | | |
| | | | 941,457 | | |
Spain (3.4%): | |
ACS Actividades de Construccion y Servicios SA | | | 1,693 | | | | 49,704 | | |
Amadeus IT Holding SA | | | 1,599 | | | | 70,699 | | |
Banco Bilbao Vizcaya Argentaria SA | | | 6,367 | | | | 46,630 | | |
Banco de Sabadell SA | | | 22,908 | | | | 40,704 | | |
Banco Popular Espanol SA | | | 10,927 | | | | 36,136 | | |
Banco Santander SA | | | 7,372 | | | | 36,517 | | |
Bankia SA | | | 27,403 | | | | 31,984 | | |
CaixaBank SA | | | 12,263 | | | | 42,833 | | |
Enagas SA | | | 2,520 | | | | 71,204 | | |
Endesa SA | | | 3,367 | | | | 67,785 | | |
Ferrovial SA | | | 3,141 | | | | 71,189 | | |
Gas Natural SDG SA | | | 3,536 | | | | 72,302 | | |
Grifols SA | | | 1,392 | | | | 64,489 | | |
Iberdrola SA | | | 11,285 | | | | 80,329 | | |
Industria de Diseno Textil SA | | | 1,749 | | | | 60,234 | | |
Mapfre SA | | | 19,673 | | | | 49,430 | | |
Red Electrica Corporation SA | | | 884 | | | | 74,079 | | |
Telefonica SA | | | 4,721 | | | | 52,511 | | |
| | | | 1,018,759 | | |
Sweden (3.5%): | |
Alfa Laval AB | | | 3,273 | | | | 60,098 | | |
Assa Abloy AB | | | 3,198 | | | | 67,434 | | |
Atlas Copco AB | | | 2,013 | | | | 49,696 | | |
Autoliv, Inc. | | | 527 | | | | 65,754 | | |
Electrolux AB | | | 1,561 | | | | 37,946 | | |
Hennes & Mauritz AB | | | 1,806 | | | | 64,633 | | |
Hexagon AB | | | 1,674 | | | | 62,427 | | |
ICA Gruppen AB | | | 1,975 | | | | 71,921 | | |
Nordea Bank AB | | | 4,683 | | | | 51,759 | | |
Sandvik AB | | | 5,191 | | | | 45,536 | | |
Skandinaviska Enskilda Banken AB | | | 5,944 | | | | 62,950 | | |
Skanska AB | | | 3,160 | | | | 61,692 | | |
| SKF AB | | | 2,615 | | | | 42,502 | | |
Svenska Cellulosa AB SCA | | | 1,843 | | | | 53,818 | | |
Svenska Handelsbanken AB | | | 4,495 | | | | 60,118 | | |
Swedbank AB | | | 3,122 | | | | 69,197 | | |
Telefonaktiebolaget LM Ericsson | | | 5,267 | | | | 51,351 | | |
TeliaSonera AB | | | 12,903 | | | | 64,489 | | |
| | | | 1,043,321 | | |
See notes to financial statements.
57
Victory Portfolios II
Victory CEMP Developed Enhanced Volatility Wtd Index ETF | | Schedule of Investments — continued
December 31, 2015 | |
(Unaudited)
Security Description | | Shares | | Value | |
Switzerland (6.4%): | |
ABB Ltd. | | | 3,442 | | | $ | 61,720 | | |
ACE Ltd. | | | 865 | | | | 101,075 | | |
Actelion Ltd. | | | 301 | | | | 41,953 | | |
Adecco SA | | | 715 | | | | 49,185 | | |
Cie Financiere Richemont SA | | | 639 | | | | 45,998 | | |
Clariant AG | | | 2,859 | | | | 54,263 | | |
Coca-Cola HBC AG | | | 2,407 | | | | 51,381 | | |
Credit Suisse Group AG | | | 1,693 | | | | 36,663 | | |
EMS-Chemie Holding AG | | | 132 | | | | 58,119 | | |
Galenica AG | | | 38 | | | | 59,717 | | |
Geberit AG | | | 188 | | | | 63,856 | | |
Givaudan SA | | | 38 | | | | 69,163 | | |
Julius Baer Group Ltd. | | | 940 | | | | 45,667 | | |
Kuehne + Nagel International AG | | | 564 | | | | 77,595 | | |
LafargeHolcim Ltd. | | | 959 | | | | 48,161 | | |
Lonza Group AG | | | 282 | | | | 45,921 | | |
Nestle SA | | | 959 | | | | 71,379 | | |
Novartis AG | | | 564 | | | | 48,877 | | |
Partners Group Holding AG | | | 150 | | | | 54,101 | | |
Roche Holdings AG | | | 188 | | | | 51,880 | | |
Schindler Holding AG | | | 451 | | | | 75,647 | | |
SGS SA | | | 38 | | | | 72,502 | | |
Sika AG | | | 19 | | | | 68,670 | | |
Sonova Holding AG | | | 395 | | | | 50,203 | | |
Swatch Group AG | | | 94 | | | | 32,866 | | |
Swiss Life Holding AG | | | 282 | | | | 76,384 | | |
Swiss Re AG | | | 978 | | | | 95,837 | | |
Swisscom AG | | | 150 | | | | 75,330 | | |
Syngenta AG | | | 94 | | | | 36,817 | | |
TE Connectivity Ltd. | | | 1,166 | | | | 75,335 | | |
UBS Group AG | | | 2,746 | | | | 53,516 | | |
Zurich Insurance Group AG | | | 226 | | | | 58,305 | | |
| | | | 1,908,086 | | |
United Kingdom (14.1%): | |
Aon PLC | | | 846 | | | | 78,010 | | |
ARM Holdings PLC | | | 3,254 | | | | 49,842 | | |
Ashtead Group PLC | | | 3,367 | | | | 55,543 | | |
Associated British Foods PLC | | | 1,298 | | | | 63,950 | | |
Aviva PLC | | | 8,388 | | | | 63,807 | | |
Babcock International Group PLC | | | 4,232 | | | | 63,387 | | |
BAE Systems PLC | | | 11,981 | | | | 88,242 | | |
Barratt Developments PLC | | | 5,736 | | | | 52,935 | | |
Berkeley Group Holdings PLC | | | 884 | | | | 48,062 | | |
British American Tobacco PLC | | | 1,317 | | | | 73,215 | | |
BT Group PLC | | | 10,627 | | | | 73,898 | | |
Bunzl PLC | | | 3,385 | | | | 94,065 | | |
Burberry Group PLC | | | 2,708 | | | | 47,706 | | |
Capita PLC | | | 3,912 | | | | 69,667 | | |
| CNH Industrial NV | | | 5,959 | | | | 40,760 | | |
Compass Group PLC | | | 4,984 | | | | 86,333 | | |
See notes to financial statements.
58
Victory Portfolios II
Victory CEMP Developed Enhanced Volatility Wtd Index ETF | | Schedule of Investments — continued
December 31, 2015 | |
(Unaudited)
Security Description | | Shares | | Value | |
Delphi Automotive PLC | | | 640 | | | $ | 54,867 | | |
Diageo PLC | | | 2,596 | | | | 71,049 | | |
Direct Line Insurance Group PLC | | | 17,266 | | | | 103,724 | | |
easyJet PLC | | | 1,900 | | | | 48,737 | | |
Fiat Chrysler Automobiles NV* | | | 2,840 | | | | 39,732 | | |
G4S PLC | | | 21,667 | | | | 72,028 | | |
GlaxoSmithKline PLC | | | 3,348 | | | | 67,766 | | |
Hargreaves Lansdown PLC | | | 2,708 | | | | 60,122 | | |
HSBC Holdings PLC | | | 8,351 | | | | 66,012 | | |
Imperial Tobacco Group PLC | | | 1,298 | | | | 68,628 | | |
Inmarsat PLC | | | 4,476 | | | | 75,026 | | |
InterContinental Hotels Group PLC | | | 1,749 | | | | 68,534 | | |
Intertek Group PLC | | | 1,373 | | | | 56,209 | | |
ITV PLC | | | 16,984 | | | | 69,255 | | |
Johnson Matthey PLC | | | 1,429 | | | | 55,974 | | |
Kingfisher PLC | | | 11,492 | | | | 55,823 | | |
Legal & General Group PLC | | | 19,466 | | | | 76,850 | | |
London Stock Exchange Group PLC | | | 1,655 | | | | 66,949 | | |
Marks & Spencer Group PLC | | | 8,576 | | | | 57,196 | | |
Michael Kors Holdings Ltd.* | | | 752 | | | | 30,125 | | |
National Grid PLC | | | 6,150 | | | | 84,997 | | |
Next PLC | | | 696 | | | | 74,799 | | |
Old Mutual PLC | | | 18,263 | | | | 48,166 | | |
Persimmon PLC* | | | 1,768 | | | | 52,832 | | |
Prudential PLC | | | 2,915 | | | | 65,792 | | |
Reckitt Benckiser Group PLC | | | 790 | | | | 73,150 | | |
RELX NV | | | 4,401 | | | | 74,325 | | |
RELX PLC | | | 4,890 | | | | 86,290 | | |
Rio Tinto PLC | | | 1,335 | | | | 38,958 | | |
Royal Mail PLC | | | 8,200 | | | | 53,673 | | |
RSA Insurance Group PLC | | | 6,301 | | | | 39,618 | | |
SABMiller PLC | | | 1,241 | | | | 74,451 | | |
Sage Group PLC | | | 8,576 | | | | 76,299 | | |
Schroders PLC | | | 1,298 | | | | 56,946 | | |
Severn Trent PLC | | | 2,445 | | | | 78,469 | | |
Sky PLC | | | 4,834 | | | | 79,245 | | |
Smith & Nephew PLC | | | 3,461 | | | | 61,635 | | |
Smiths Group PLC | | | 3,310 | | | | 45,844 | | |
Sports Direct International PLC* | | | 5,210 | | | | 44,317 | | |
SSE PLC | | | 2,878 | | | | 64,830 | | |
St James's Place PLC | | | 3,762 | | | | 55,903 | | |
Standard Chartered PLC | | | 3,987 | | | | 33,132 | | |
Standard Life PLC | | | 9,612 | | | | 55,220 | | |
Taylor Wimpey PLC | | | 18,921 | | | | 56,652 | | |
Travis Perkins PLC | | | 2,351 | | | | 68,381 | | |
Unilever PLC | | | 1,655 | | | | 71,401 | | |
United Utilities Group PLC | | | 5,304 | | | | 73,149 | | |
Vodafone Group PLC | | | 17,661 | | | | 57,540 | | |
Whitbread PLC | | | 1,166 | | | | 75,650 | | |
WPP PLC | | | 3,517 | | | | 81,038 | | |
| | | | 4,216,730 | | |
See notes to financial statements.
59
Victory Portfolios II
Victory CEMP Developed Enhanced Volatility Wtd Index ETF | | Schedule of Investments — continued
December 31, 2015 | |
(Unaudited)
Security Description | | Shares | | Value | |
United States (0.2%): | |
Sensata Technologies Holding NV* | | | 1,429 | | | $ | 65,821 | | |
Total Common Stocks (Cost $29,918,320) | | | 29,438,773 | | |
Short-Term Investments (1.1%) | |
Money Market Funds (1.1%): | |
Short Term Investment Trust Liquid Assets Portfolio, 0.29%^ | | | 336,794 | | | | 336,794 | | |
Total Short-Term Investments — (Cost $336,794) | | | 336,794 | | |
Total Investments — 99.7% (Cost $30,255,114) | | | 29,775,567 | | |
Other assets in excess of liabilities — 0.3% | | | 75,280 | | |
NET ASSETS — 100.0% | | $ | 29,850,847 | | |
* Non-income producing security.
+ As of December 31, 2015, the Fund has fair valued this security. This security is deemed illiquid according to the Fund's liquidity guidelines. The value of this security was $570 or 0.00% of net assets.
^ Annualized seven-day yield as of December 31, 2015.
Schedule of Open Futures Contracts
Number of
Contracts
Purchased | | Description | | Notional Amount | | Unrealized
Appreciation | |
| | 5 | | | Mini MSCI EAFE Future, March 2016 | | $ | 424,550 | | | $ | 105 | | |
| | | $ | 105 | | |
See notes to financial statements.
60
Victory Portfolios II
Victory CEMP US EQ Income Enhanced Volatility Wtd Index ETF | | Schedule of Investments
December 31, 2015 | |
(Unaudited)
Security Description | | Shares | | Value | |
Common Stocks (99.5%) | |
Aerospace & Defense (1.4%): | |
Lockheed Martin Corporation | | | 6,134 | | | $ | 1,331,998 | | |
Air Freight & Logistics (1.0%): | |
United Parcel Service, Inc. | | | 10,222 | | | | 983,663 | | |
Automobiles (2.1%): | |
Ford Motor Company | | | 71,884 | | | | 1,012,845 | | |
General Motors Company | | | 28,457 | | | | 967,823 | | |
| | | | 1,980,668 | | |
Banks (1.3%): | |
People's United Financial, Inc. | | | 76,332 | | | | 1,232,762 | | |
Beverages (1.7%): | |
The Coca-Cola Company | | | 38,530 | | | | 1,655,249 | | |
Capital Markets (2.2%): | |
Invesco Ltd. | | | 28,311 | | | | 947,853 | | |
T. Rowe Price Group, Inc. | | | 16,629 | | | | 1,188,807 | | |
| | | | 2,136,660 | | |
Chemicals (2.9%): | |
EI du Pont de Nemours & Company | | | 17,839 | | | | 1,188,078 | | |
LyondellBasell Industries NV | | | 7,637 | | | | 663,655 | | |
The Dow Chemical Company | | | 18,482 | | | | 951,453 | | |
| | | | 2,803,186 | | |
Communications Equipment (1.7%): | |
Cisco Systems, Inc. | | | 33,662 | | | | 914,092 | | |
QUALCOMM, Inc. | | | 14,636 | | | | 731,580 | | |
| | | | 1,645,672 | | |
Consumer Finance (0.6%): | |
Navient Corporation | | | 53,352 | | | | 610,880 | | |
Diversified Financial Services (1.1%): | |
CME Group, Inc. | | | 11,287 | | | | 1,022,602 | | |
Diversified Telecommunication Services (0.8%): | |
CenturyLink, Inc. | | | 30,618 | | | | 770,349 | | |
Electric Utilities (12.3%): | |
American Electric Power Company, Inc. | | | 19,081 | | | | 1,111,850 | | |
Duke Energy Corporation | | | 15,173 | | | | 1,083,200 | | |
Entergy Corporation | | | 15,733 | | | | 1,075,508 | | |
Eversource Energy | | | 21,761 | | | | 1,111,334 | | |
Exelon Corporation | | | 27,451 | | | | 762,314 | | |
OGE Energy Corporation | | | 36,391 | | | | 956,719 | | |
Pepco Holdings, Inc. | | | 33,960 | | | | 883,300 | | |
Pinnacle West Capital Corporation | | | 17,945 | | | | 1,157,094 | | |
Southern Company | | | 26,249 | | | | 1,228,191 | | |
Westar Energy, Inc. | | | 28,441 | | | | 1,206,183 | | |
Xcel Energy, Inc. | | | 31,505 | | | | 1,131,344 | | |
| | | | 11,707,037 | | |
See notes to financial statements.
61
Victory Portfolios II
Victory CEMP US EQ Income Enhanced Volatility Wtd Index ETF | | Schedule of Investments — continued
December 31, 2015 | |
(Unaudited)
Security Description | | Shares | | Value | |
Electrical Equipment (2.0%): | |
Eaton Corporation PLC | | | 15,989 | | | $ | 832,068 | | |
Emerson Electric Company | | | 21,859 | | | | 1,045,516 | | |
| | | | 1,877,584 | | |
Energy Equipment & Services (1.1%): | |
Helmerich & Payne, Inc. | | | 9,715 | | | | 520,238 | | |
National Oilwell Varco, Inc. | | | 15,509 | | | | 519,397 | | |
| | | | 1,039,635 | | |
Food & Staples Retailing (3.6%): | |
Costco Wholesale Corporation | | | 7,946 | | | | 1,283,279 | | |
Sysco Corporation | | | 27,471 | | | | 1,126,311 | | |
Wal-Mart Stores, Inc. | | | 17,151 | | | | 1,051,356 | | |
| | | | 3,460,946 | | |
Food Products (1.9%): | |
General Mills, Inc. | | | 24,702 | | | | 1,424,318 | | |
Pilgrim's Pride Corporation | | | 19,148 | | | | 422,979 | | |
| | | | 1,847,297 | | |
Health Care Equipment & Supplies (1.2%): | |
Baxter International, Inc. | | | 30,111 | | | | 1,148,735 | | |
Hotels, Restaurants & Leisure (2.8%): | |
Las Vegas Sands Corporation | | | 12,931 | | | | 566,895 | | |
McDonald's Corporation | | | 11,320 | | | | 1,337,345 | | |
Starwood Hotels & Resorts Worldwide, Inc. | | | 10,646 | | | | 737,555 | | |
| | | | 2,641,795 | | |
Household Products (1.6%): | |
Procter & Gamble Company | | | 18,670 | | | | 1,482,585 | | |
Insurance (7.2%): | |
American Financial Group, Inc. | | | 20,440 | | | | 1,473,315 | | |
Arthur J. Gallagher & Company | | | 32,665 | | | | 1,337,305 | | |
Cincinnati Financial Corporation | | | 21,628 | | | | 1,279,729 | | |
CNA Financial Corporation | | | 31,368 | | | | 1,102,585 | | |
MetLife, Inc. | | | 18,122 | | | | 873,662 | | |
Principal Financial Group, Inc. | | | 18,079 | | | | 813,193 | | |
| | | | 6,879,789 | | |
IT Services (3.3%): | |
International Business Machines Corporation | | | 6,800 | | | | 935,816 | | |
Paychex, Inc. | | | 26,159 | | | | 1,383,550 | | |
The Western Union Company | | | 44,539 | | | | 797,694 | | |
| | | | 3,117,060 | | |
Machinery (2.6%): | |
Caterpillar, Inc. | | | 11,820 | | | | 803,287 | | |
Deere & Company | | | 12,245 | | | | 933,926 | | |
PACCAR, Inc. | | | 15,894 | | | | 753,376 | | |
| | | | 2,490,589 | | |
See notes to financial statements.
62
Victory Portfolios II
Victory CEMP US EQ Income Enhanced Volatility Wtd Index ETF | | Schedule of Investments — continued
December 31, 2015 | |
(Unaudited)
Security Description | | Shares | | Value | |
Media (2.2%): | |
Omnicom Group, Inc. | | | 18,241 | | | $ | 1,380,114 | | |
TEGNA, Inc. | | | 29,564 | | | | 754,473 | | |
| | | | 2,134,587 | | |
Metals & Mining (0.8%): | |
Nucor Corporation | | | 18,139 | | | | 731,002 | | |
Multiline Retail (0.7%): | |
Kohl's Corporation | | | 13,143 | | | | 626,001 | | |
Multi-Utilities (13.1%): | |
Alliant Energy Corporation | | | 18,664 | | | | 1,165,567 | | |
Ameren Corporation | | | 25,891 | | | | 1,119,268 | | |
CenterPoint Energy, Inc. | | | 50,922 | | | | 934,928 | | |
CMS Energy Corporation | | | 28,830 | | | | 1,040,186 | | |
Consolidated Edison, Inc. | | | 17,446 | | | | 1,121,254 | | |
Dominion Resources, Inc. | | | 16,377 | | | | 1,107,740 | | |
DTE Energy Company | | | 13,251 | | | | 1,062,598 | | |
PG&E Corporation | | | 20,628 | | | | 1,097,203 | | |
Public Service Enterprise Group, Inc. | | | 22,939 | | | | 887,510 | | |
SCANA Corporation | | | 18,824 | | | | 1,138,664 | | |
TECO Energy, Inc. | | | 29,027 | | | | 773,570 | | |
WEC Energy Group, Inc. | | | 19,993 | | | | 1,025,841 | | |
| | | | 12,474,329 | | |
Oil, Gas & Consumable Fuels (4.3%): | |
Chevron Corporation | | | 10,613 | | | | 954,745 | | |
Exxon Mobil Corporation | | | 13,352 | | | | 1,040,788 | | |
Kinder Morgan, Inc. | | | 32,879 | | | | 490,555 | | |
ONEOK, Inc. | | | 15,350 | | | | 378,531 | | |
Plains GP Holdings LP | | | 23,771 | | | | 224,636 | | |
Spectra Energy Corporation | | | 30,699 | | | | 734,934 | | |
Williams Companies, Inc. | | | 10,954 | | | | 281,518 | | |
| | | | 4,105,707 | | |
Paper & Forest Products (0.8%): | |
International Paper Company | | | 21,408 | | | | 807,082 | | |
Pharmaceuticals (3.6%): | |
Johnson & Johnson | | | 13,040 | | | | 1,339,469 | | |
Merck & Company, Inc. | | | 18,130 | | | | 957,626 | | |
Pfizer, Inc. | | | 36,525 | | | | 1,179,027 | | |
| | | | 3,476,122 | | |
Road & Rail (1.0%): | |
Norfolk Southern Corporation | | | 11,846 | | | | 1,002,053 | | |
Semiconductors & Semiconductor Equipment (6.7%): | |
Analog Devices, Inc. | | | 11,957 | | | | 661,461 | | |
Intel Corporation | | | 27,368 | | | | 942,828 | | |
KLA-Tencor Corporation | | | 15,442 | | | | 1,070,903 | | |
Linear Technology Corporation | | | 21,712 | | | | 922,109 | | |
Microchip Technology, Inc. | | | 19,377 | | | | 901,805 | | |
See notes to financial statements.
63
Victory Portfolios II
Victory CEMP US EQ Income Enhanced Volatility Wtd Index ETF | | Schedule of Investments — continued
December 31, 2015 | |
(Unaudited)
Security Description | | Shares | | Value | |
Texas Instruments, Inc. | | | 17,127 | | | $ | 938,731 | | |
Xilinx, Inc. | | | 19,949 | | | | 937,004 | | |
| | | | 6,374,841 | | |
Software (1.9%): | |
CA, Inc. | | | 35,389 | | | | 1,010,710 | | |
Symantec Corporation | | | 38,608 | | | | 810,768 | | |
| | | | 1,821,478 | | |
Specialty Retail (1.9%): | |
Best Buy Company, Inc. | | | 15,089 | | | | 459,460 | | |
GameStop Corporation | | | 14,577 | | | | 408,739 | | |
L Brands, Inc. | | | 10,013 | | | | 959,446 | | |
| | | | 1,827,645 | | |
Technology Hardware, Storage & Peripherals (0.5%): | |
Seagate Technology PLC | | | 13,720 | | | | 502,975 | | |
Textiles, Apparel & Luxury Goods (0.9%): | |
Coach, Inc. | | | 24,869 | | | | 813,962 | | |
Thrifts & Mortgage Finance (1.1%): | |
New York Community Bancorp, Inc. | | | 65,576 | | | | 1,070,199 | | |
Tobacco (3.6%): | |
Altria Group, Inc. | | | 20,824 | | | | 1,212,165 | | |
Philip Morris International, Inc. | | | 13,373 | | | | 1,175,621 | | |
Reynolds American, Inc. | | | 22,613 | | | | 1,043,590 | | |
| | | | 3,431,376 | | |
Total Common Stocks (Cost $98,031,276) | | | 95,066,100 | | |
Short-Term Investments (0.2%) | |
Money Market Funds (0.2%): | |
Short Term Investment Trust Liquid Assets Portfolio, 0.29%^ | | | 160,334 | | | | 160,334 | | |
Total Short-Term Investments — (Cost $160,334) | | | 160,334 | | |
Total Investments — 99.7% (Cost $98,191,610) | | | 95,226,434 | | |
Other assets in excess of liabilities — 0.3% | | | 275,639 | | |
NET ASSETS — 100.0% | | $ | 95,502,073 | | |
^ Annualized seven-day yield as of December 31, 2015.
The Global Industry Classification Standard (GICS®) was developed by and/or is the exclusive property of MSCI, Inc. and Standard & Poor's Financial Services LLC ("S&P"). GICS® is a service mark of MSCI, Inc. and S&P and has been licensed for use by the Fund's Administrator, U.S. Bancorp Fund Services, LLC.
Schedule of Open Futures Contracts
Number of
Contracts
Purchased | | Description | | Notional Amount | | Unrealized
Appreciation | |
| | 3 | | | S&P 500 E-Mini Future, March 2016 | | $ | 305,310 | | | $ | 1,337 | | |
| | | $ | 1,337 | | |
See notes to financial statements.
64
Victory Portfolios II
Victory CEMP US Small Cap Volatility Wtd Index ETF | | Schedule of Investments
December 31, 2015 | |
(Unaudited)
Security Description | | Shares | | Value | |
Common Stocks (99.5%) | |
Aerospace & Defense (0.7%): | |
Astronics Corporation* | | | 287 | | | $ | 11,684 | | |
Moog, Inc.* | | | 421 | | | | 25,512 | | |
National Presto Industries, Inc. | | | 295 | | | | 24,444 | | |
TASER International, Inc.* | | | 449 | | | | 7,763 | | |
| | | | 69,403 | | |
Air Freight & Logistics (0.8%): | |
Air Transport Services Group, Inc.* | | | 2,220 | | | | 22,378 | | |
Atlas Air Worldwide Holdings, Inc.* | | | 400 | | | | 16,536 | | |
Forward Air Corporation | | | 518 | | | | 22,279 | | |
Hub Group, Inc.* | | | 505 | | | | 16,640 | | |
| | | | 77,833 | | |
Airlines (0.1%): | |
Hawaiian Holdings, Inc.* | | | 407 | | | | 14,379 | | |
Auto Components (1.8%): | |
American Axle & Manufacturing Holdings, Inc.* | | | 1,036 | | | | 19,622 | | |
Cooper Tire & Rubber Company | | | 463 | | | | 17,525 | | |
Dana Holding Corporation | | | 1,217 | | | | 16,795 | | |
Dorman Products, Inc.* | | | 458 | | | | 21,741 | | |
Drew Industries, Inc. | | | 406 | | | | 24,721 | | |
Gentherm, Inc.* | | | 351 | | | | 16,637 | | |
Motorcar Parts of America, Inc.* | | | 419 | | | | 14,166 | | |
Standard Motor Products, Inc. | | | 525 | | | | 19,976 | | |
Tenneco, Inc.* | | | 469 | | | | 21,532 | | |
| | | | 172,715 | | |
Automobiles (0.3%): | |
Thor Industries, Inc. | | | 489 | | | | 27,457 | | |
Banks (15.4%): | |
1st Source Corporation | | | 764 | | | | 23,585 | | |
Ameris Bancorp | | | 865 | | | | 29,401 | | |
Associated Banc-Corp | | | 1,320 | | | | 24,750 | | |
BancFirst Corporation | | | 415 | | | | 24,327 | | |
BancorpSouth, Inc. | | | 858 | | | | 20,583 | | |
Bank of Hawaii Corporation | | | 477 | | | | 30,003 | | |
Banner Corporation | | | 522 | | | | 23,939 | | |
BBCN Bancorp, Inc. | | | 1,491 | | | | 25,675 | | |
Berkshire Hills Bancorp, Inc. | | | 1,120 | | | | 32,603 | | |
BNC Bancorp | | | 1,163 | | | | 29,517 | | |
Boston Private Financial Holdings, Inc. | | | 1,599 | | | | 18,133 | | |
Capital Bank Financial Corporation | | | 793 | | | | 25,360 | | |
Cathay General Bancorp | | | 730 | | | | 22,871 | | |
Chemical Financial Corporation | | | 825 | | | | 28,273 | | |
Columbia Banking Systems, Inc. | | | 780 | | | | 25,358 | | |
Community Bank Systems, Inc. | | | 759 | | | | 30,314 | | |
CVB Financial Corporation | | | 1,450 | | | | 24,534 | | |
Eagle Bancorp, Inc.* | | | 652 | | | | 32,906 | | |
See notes to financial statements.
65
Victory Portfolios II
Victory CEMP US Small Cap Volatility Wtd Index ETF | | Schedule of Investments — continued
December 31, 2015 | |
(Unaudited)
Security Description | | Shares | | Value | |
First Citizens Bancshares, Inc. | | | 107 | | | $ | 27,624 | | |
First Financial Bancorp | | | 1,239 | | | | 22,389 | | |
First Financial Bankshares, Inc. | | | 691 | | | | 20,847 | | |
First Interstate BancSystem, Inc. | | | 937 | | | | 27,239 | | |
First Merchants Corporation | | | 1,073 | | | | 27,276 | | |
First Midwest Bancorp, Inc. | | | 1,413 | | | | 26,042 | | |
FirstMerit Corporation | | | 1,273 | | | | 23,741 | | |
FNB Corporation | | | 1,960 | | | | 26,146 | | |
Fulton Financial Corporation | | | 2,297 | | | | 29,884 | | |
Glacier Bancorp, Inc. | | | 785 | | | | 20,826 | | |
Hancock Holdings Company | | | 648 | | | | 16,310 | | |
Hilltop Holdings, Inc.* | | | 1,091 | | | | 20,969 | | |
Home BancShares, Inc. | | | 592 | | | | 23,988 | | |
IBERIABANK Corporation | | | 356 | | | | 19,605 | | |
Independent Bank Corporation | | | 545 | | | | 25,353 | | |
International Bancshares Corporation | | | 784 | | | | 20,149 | | |
LegacyTexas Financial Group, Inc. | | | 587 | | | | 14,687 | | |
MB Financial, Inc. | | | 672 | | | | 21,753 | | |
National Penn Bancshares, Inc. | | | 1,676 | | | | 20,665 | | |
NBT Bancorp, Inc. | | | 976 | | | | 27,211 | | |
Old National Bancorp | | | 1,721 | | | | 23,337 | | |
Opus Bank | | | 577 | | | | 21,332 | | |
Park National Corporation | | | 317 | | | | 28,682 | | |
Pinnacle Financial Partners, Inc. | | | 440 | | | | 22,598 | | |
PrivateBancorp, Inc. | | | 552 | | | | 22,643 | | |
Renasant Corporation | | | 869 | | | | 29,902 | | |
S&T Bancorp, Inc. | | | 800 | | | | 24,656 | | |
ServisFirst Bancshares, Inc. | | | 656 | | | | 31,180 | | |
Simmons First National Corporation | | | 539 | | | | 27,683 | | |
South State Corporation | | | 342 | | | | 24,607 | | |
Talmer Bancorp, Inc. | | | 1,663 | | | | 30,117 | | |
TCF Financial Corporation | | | 1,529 | | | | 21,589 | | |
Texas Capital BancShares, Inc.* | | | 346 | | | | 17,099 | | |
Towne Bank | | | 1,342 | | | | 28,008 | | |
Trustmark Corporation | | | 1,076 | | | | 24,791 | | |
UMB Financial Corporation | | | 432 | | | | 20,110 | | |
Union Bankshares Corporation | | | 988 | | | | 24,937 | | |
United Bankshares, Inc. | | | 646 | | | | 23,896 | | |
United Community Banks, Inc. | | | 1,206 | | | | 23,505 | | |
Valley National Bancorp | | | 3,303 | | | | 32,535 | | |
WesBanco, Inc. | | | 826 | | | | 24,796 | | |
Westamerica Bancorp | | | 557 | | | | 26,040 | | |
Wintrust Financial Corporation | | | 523 | | | | 25,376 | | |
| | | | 1,514,255 | | |
Beverages (0.4%): | |
Boston Beer Company, Inc.* | | | 89 | | | | 17,970 | | |
Coca-Cola Bottling Company Consolidated | | | 111 | | | | 20,259 | | |
| | | | 38,229 | | |
See notes to financial statements.
66
Victory Portfolios II
Victory CEMP US Small Cap Volatility Wtd Index ETF | | Schedule of Investments — continued
December 31, 2015 | |
(Unaudited)
Security Description | | Shares | | Value | |
Biotechnology (0.5%): | |
Insys Therapeutics, Inc.* | | | 330 | | | $ | 9,448 | | |
Ligand Pharmaceuticals, Inc.* | | | 130 | | | | 14,095 | | |
Myriad Genetics, Inc.* | | | 384 | | | | 16,573 | | |
PDL BioPharma, Inc. | | | 3,600 | | | | 12,744 | | |
| | | | 52,860 | | |
Building Products (1.7%): | |
AAON, Inc. | | | 1,028 | | | | 23,870 | | |
American Woodmark Corporation* | | | 234 | | | | 18,715 | | |
Apogee Enterprises, Inc. | | | 283 | | | | 12,313 | | |
Griffon Corporation | | | 1,317 | | | | 23,443 | | |
Patrick Industries, Inc.* | | | 365 | | | | 15,878 | | |
PGT, Inc.* | | | 894 | | | | 10,183 | | |
Simpson Manufacturing Company, Inc. | | | 801 | | | | 27,354 | | |
Trex Company, Inc.* | | | 362 | | | | 13,770 | | |
Universal Forest Products, Inc. | | | 306 | | | | 20,921 | | |
| | | | 166,447 | | |
Capital Markets (1.7%): | |
Cohen & Steers, Inc. | | | 818 | | | | 24,933 | | |
Evercore Partners, Inc. | | | 436 | | | | 23,574 | | |
Financial Engines, Inc. | | | 486 | | | | 16,364 | | |
Gamco Investors, Inc. | | | 625 | | | | 19,400 | | |
Greenhill & Company, Inc. | | | 612 | | | | 17,509 | | |
HFF, Inc. | | | 498 | | | | 15,473 | | |
Janus Capital Group, Inc. | | | 1,256 | | | | 17,697 | | |
Manning & Napier, Inc. | | | 1,395 | | | | 11,843 | | |
Virtus Investment Partners, Inc. | | | 132 | | | | 15,505 | | |
WisdomTree Investments, Inc. | | | 620 | | | | 9,722 | | |
| | | | 172,020 | | |
Chemicals (2.4%): | |
Balchem Corporation | | | 296 | | | | 17,997 | | |
Calgon Carbon Corporation | | | 1,259 | | | | 21,718 | | |
Chemtura Corporation* | | | 692 | | | | 18,871 | | |
Ferro Corporation* | | | 1,459 | | | | 16,224 | | |
HB Fuller Company | | | 736 | | | | 26,842 | | |
Innophos Holdings, Inc. | | | 483 | | | | 13,997 | | |
Innospec, Inc. | | | 494 | | | | 26,829 | | |
Minerals Technologies, Inc. | | | 309 | | | | 14,171 | | |
Olin Corporation | | | 845 | | | | 14,585 | | |
Quaker Chemical Corporation | | | 229 | | | | 17,692 | | |
Sensient Technologies Corporation | | | 409 | | | | 25,693 | | |
Stepan Company | | | 413 | | | | 20,522 | | |
| | | | 235,141 | | |
Commercial Services & Supplies (3.4%): | |
ABM Industries, Inc. | | | 1,021 | | | | 29,068 | | |
Deluxe Corporation | | | 385 | | | | 20,998 | | |
G&K Services, Inc. | | | 400 | | | | 25,160 | | |
Herman Miller, Inc. | | | 918 | | | | 26,347 | | |
See notes to financial statements.
67
Victory Portfolios II
Victory CEMP US Small Cap Volatility Wtd Index ETF | | Schedule of Investments — continued
December 31, 2015 | |
(Unaudited)
Security Description | | Shares | | Value | |
HNI Corporation | | | 409 | | | $ | 14,748 | | |
Knoll, Inc. | | | 947 | | | | 17,804 | | |
Matthews International Corporation | | | 552 | | | | 29,504 | | |
McGrath RentCorp | | | 877 | | | | 22,092 | | |
MSA Safety, Inc. | | | 369 | | | | 16,040 | | |
Multi-Color Corporation | | | 277 | | | | 16,567 | | |
Steelcase, Inc. | | | 1,340 | | | | 19,966 | | |
Team, Inc.* | | | 527 | | | | 16,843 | | |
Tetra Tech, Inc. | | | 935 | | | | 24,329 | | |
UniFirst Corporation | | | 255 | | | | 26,571 | | |
US Ecology, Inc. | | | 409 | | | | 14,904 | | |
West Corporation | | | 687 | | | | 14,819 | | |
| | | | 335,760 | | |
Communications Equipment (1.2%): | |
ADTRAN, Inc. | | | 1,247 | | | | 21,473 | | |
CalAmp Corporation* | | | 802 | | | | 15,984 | | |
Infinera Corporation* | | | 589 | | | | 10,673 | | |
InterDigital, Inc. | | | 447 | | | | 21,921 | | |
Plantronics, Inc. | | | 439 | | | | 20,817 | | |
Polycom, Inc.* | | | 1,921 | | | | 24,186 | | |
| | | | 115,054 | | |
Construction & Engineering (1.1%): | |
Argan, Inc. | | | 388 | | | | 12,571 | | |
Comfort Systems USA, Inc. | | | 577 | | | | 16,398 | | |
Dycom Industries, Inc.* | | | 156 | | | | 10,914 | | |
EMCOR Group, Inc. | | | 578 | | | | 27,767 | | |
MYR Group, Inc.* | | | 723 | | | | 14,901 | | |
Primoris Services Corporation | | | 697 | | | | 15,355 | | |
Tutor Perini Corporation* | | | 739 | | | | 12,371 | | |
| | | | 110,277 | | |
Consumer Finance (0.7%): | |
Encore Capital Group, Inc.* | | | 573 | | | | 16,663 | | |
First Cash Financial Services, Inc.* | | | 520 | | | | 19,464 | | |
Nelnet, Inc. | | | 641 | | | | 21,518 | | |
PRA Group, Inc.* | | | 399 | | | | 13,841 | | |
| | | | 71,486 | | |
Containers & Packaging (0.1%): | |
Greif, Inc. | | | 473 | | | | 14,573 | | |
Distributors (0.2%): | |
Core-Mark Holding Company, Inc. | | | 289 | | | | 23,681 | | |
Diversified Consumer Services (0.7%): | |
Capella Education Company | | | 363 | | | | 16,778 | | |
DeVry Education Group, Inc. | | | 478 | | | | 12,098 | | |
Grand Canyon Education, Inc.* | | | 631 | | | | 25,316 | | |
Strayer Education, Inc.* | | | 237 | | | | 14,248 | | |
| | | | 68,440 | | |
See notes to financial statements.
68
Victory Portfolios II
Victory CEMP US Small Cap Volatility Wtd Index ETF | | Schedule of Investments — continued
December 31, 2015 | |
(Unaudited)
Security Description | | Shares | | Value | |
Diversified Telecommunication Services (0.5%): | |
Inteliquent, Inc. | | | 576 | | | $ | 10,236 | | |
Iridium Communications, Inc.* | | | 2,431 | | | | 20,445 | | |
Vonage Holdings Corporation* | | | 2,468 | | | | 14,166 | | |
| | | | 44,847 | | |
Electric Utilities (2.0%): | |
ALLETE, Inc. | | | 560 | | | | 28,465 | | |
El Paso Electric Company | | | 745 | | | | 28,682 | | |
IdaCorp, Inc. | | | 450 | | | | 30,600 | | |
MGE Energy, Inc. | | | 628 | | | | 29,139 | | |
Otter Tail Corporation | | | 907 | | | | 24,153 | | |
PNM Resources, Inc. | | | 935 | | | | 28,583 | | |
The Empire District Electric Company | | | 1,122 | | | | 31,495 | | |
| | | | 201,117 | | |
Electrical Equipment (1.2%): | |
AZZ, Inc. | | | 402 | | | | 22,339 | | |
Encore Wire Corporation | | | 467 | | | | 17,321 | | |
EnerSys | | | 432 | | | | 24,162 | | |
Franklin Electric Company, Inc. | | | 822 | | | | 22,219 | | |
Generac Holdings, Inc.* | | | 525 | | | | 15,629 | | |
Thermon Group Holdings, Inc.* | | | 978 | | | | 16,548 | | |
| | | | 118,218 | | |
Electronic Equipment, Instruments & Components (4.7%): | |
Anixter International, Inc.* | | | 363 | | | | 21,921 | | |
AVX Corporation | | | 1,634 | | | | 19,837 | | |
Badger Meter, Inc. | | | 386 | | | | 22,616 | | |
Benchmark Electronics, Inc.* | | | 1,209 | | | | 24,990 | | |
Coherent, Inc.* | | | 346 | | | | 22,528 | | |
CTS Corporation | | | 1,392 | | | | 24,555 | | |
ePlus, Inc.* | | | 203 | | | | 18,932 | | |
FARO Technologies, Inc.* | | | 320 | | | | 9,446 | | |
II-VI, Inc.* | | | 1,031 | | | | 19,135 | | |
Insight Enterprises, Inc.* | | | 778 | | | | 19,543 | | |
Littelfuse, Inc. | | | 247 | | | | 26,431 | | |
Methode Electronics, Inc. | | | 353 | | | | 11,236 | | |
MTS Systems Corporation | | | 412 | | | | 26,125 | | |
Newport Corporation* | | | 1,372 | | | | 21,774 | | |
OSI Systems, Inc.* | | | 354 | | | | 31,386 | | |
Plexus Corporation* | | | 604 | | | | 21,092 | | |
Rofin-Sinar Technologies, Inc.* | | | 741 | | | | 19,844 | | |
Rogers Corporation* | | | 358 | | | | 18,462 | | |
Sanmina Corporation* | | | 792 | | | | 16,299 | | |
ScanSource, Inc.* | | | 497 | | | | 16,013 | | |
Tech Data Corporation* | | | 252 | | | | 16,728 | | |
Vishay Intertechnology, Inc. | | | 2,472 | | | | 29,788 | | |
| | | | 458,681 | | |
Energy Equipment & Services (0.4%): | |
Atwood Oceanics, Inc. | | | 639 | | | | 6,537 | | |
Dril-Quip, Inc.* | | | 243 | | | | 14,393 | | |
See notes to financial statements.
69
Victory Portfolios II
Victory CEMP US Small Cap Volatility Wtd Index ETF | | Schedule of Investments — continued
December 31, 2015 | |
(Unaudited)
Security Description | | Shares | | Value | |
Forum Energy Technologies, Inc.* | | | 732 | | | $ | 9,121 | | |
Hornbeck Offshore Services, Inc.* | | | 534 | | | | 5,308 | | |
U.S. Silica Holdings, Inc. | | | 472 | | | | 8,840 | | |
| | | | 44,199 | | |
Food & Staples Retailing (1.4%): | |
Ingles Markets, Inc. | | | 234 | | | | 10,315 | | |
PriceSmart, Inc. | | | 242 | | | | 20,083 | | |
Smart & Final Stores, Inc.* | | | 973 | | | | 17,718 | | |
SpartanNash Company | | | 801 | | | | 17,334 | | |
SUPERVALU, Inc.* | | | 2,014 | | | | 13,655 | | |
The Andersons, Inc. | | | 440 | | | | 13,917 | | |
The Fresh Market, Inc.* | | | 541 | | | | 12,670 | | |
United Natural Foods, Inc.* | | | 316 | | | | 12,438 | | |
Weis Markets, Inc. | | | 529 | | | | 23,435 | | |
| | | | 141,565 | | |
Food Products (1.6%): | |
Cal-Maine Foods, Inc. | | | 234 | | | | 10,843 | | |
J&J Snack Foods Corporation | | | 183 | | | | 21,351 | | |
John B. Sanfilippo & Son, Inc. | | | 294 | | | | 15,885 | | |
Lancaster Colony Corporation | | | 323 | | | | 37,293 | | |
Sanderson Farms, Inc. | | | 268 | | | | 20,775 | | |
Snyder's-Lance, Inc. | | | 842 | | | | 28,881 | | |
Tootsie Roll Industries, Inc. | | | 791 | | | | 24,988 | | |
| | | | 160,016 | | |
Gas Utilities (0.8%): | |
Chesapeake Utilities Corporation | | | 386 | | | | 21,906 | | |
ONE Gas, Inc. | | | 619 | | | | 31,055 | | |
Southwest Gas Corporation | | | 503 | | | | 27,745 | | |
| | | | 80,706 | | |
Health Care Equipment & Supplies (3.8%): | |
Abaxis, Inc. | | | 344 | | | | 19,154 | | |
Analogic Corporation | | | 298 | | | | 24,615 | | |
Atrion Corporation | | | 63 | | | | 24,016 | | |
Cantel Medical Corporation | | | 399 | | | | 24,794 | | |
CONMED Corporation | | | 452 | | | | 19,911 | | |
Globus Medical, Inc.* | | | 948 | | | | 26,373 | | |
Greatbatch, Inc.* | | | 349 | | | | 18,323 | | |
Hill-Rom Holdings, Inc. | | | 602 | | | | 28,932 | | |
ICU Medical, Inc.* | | | 157 | | | | 17,706 | | |
Inogen, Inc.* | | | 238 | | | | 9,541 | | |
Integra LifeSciences Holdings Corporation* | | | 372 | | | | 25,214 | | |
LivaNova PLC* | | | 283 | | | | 16,802 | | |
Masimo Corporation* | | | 461 | | | | 19,136 | | |
Meridian Bioscience, Inc. | | | 1,399 | | | | 28,707 | | |
Merit Medical Systems, Inc.* | | | 760 | | | | 14,128 | | |
Natus Medical, Inc.* | | | 479 | | | | 23,016 | | |
Neogen Corporation* | | | 308 | | | | 17,408 | | |
Vascular Solutions, Inc.* | | | 430 | | | | 14,788 | | |
| | | | 372,564 | | |
See notes to financial statements.
70
Victory Portfolios II
Victory CEMP US Small Cap Volatility Wtd Index ETF | | Schedule of Investments — continued
December 31, 2015 | |
(Unaudited)
Security Description | | Shares | | Value | |
Health Care Providers & Services (2.8%): | |
Aceto Corporation | | | 683 | | | $ | 18,427 | | |
Air Methods Corporation* | | | 406 | | | | 17,024 | | |
AMN Healthcare Services, Inc.* | | | 448 | | | | 13,910 | | |
Chemed Corporation | | | 201 | | | | 30,110 | | |
CorVel Corporation* | | | 586 | | | | 25,737 | | |
Hanger, Inc.* | | | 1,093 | | | | 17,980 | | |
HealthEquity, Inc.* | | | 458 | | | | 11,482 | | |
LHC Group, Inc.* | | | 289 | | | | 13,089 | | |
Magellan Health, Inc.* | | | 321 | | | | 19,793 | | |
Owens & Minor, Inc. | | | 905 | | | | 32,562 | | |
Providence Service Corporation* | | | 286 | | | | 13,419 | | |
Select Medical Holdings Corporation | | | 1,367 | | | | 16,281 | | |
The Ensign Group, Inc. | | | 872 | | | | 19,733 | | |
U.S. Physical Therapy, Inc. | | | 435 | | | | 23,351 | | |
| | | | 272,898 | | |
Health Care Technology (0.5%): | |
HealthStream, Inc.* | | | 695 | | | | 15,290 | | |
Omnicell, Inc.* | | | 618 | | | | 19,207 | | |
Quality Systems, Inc. | | | 1,163 | | | | 18,748 | | |
| | | | 53,245 | | |
Hotels, Restaurants & Leisure (3.0%): | |
Biglari Holdings, Inc.* | | | 55 | | | | 17,920 | | |
BJ's Restaurants, Inc.* | | | 394 | | | | 17,127 | | |
Choice Hotels International, Inc. | | | 524 | | | | 26,415 | | |
Denny's Corporation* | | | 1,504 | | | | 14,784 | | |
Fiesta Restaurant Group, Inc.* | | | 320 | | | | 10,752 | | |
Interval Leisure Group, Inc. | | | 1,214 | | | | 18,951 | | |
Jack In The Box, Inc, | | | 270 | | | | 20,712 | | |
Krispy Kreme Doughnuts, Inc.* | | | 978 | | | | 14,738 | | |
Marriott Vacations Worldwide Corporation | | | 299 | | | | 17,028 | | |
Papa John's International, Inc. | | | 327 | | | | 18,270 | | |
Popeyes Louisiana Kitchen, Inc.* | | | 351 | | | | 20,534 | | |
Red Robin Gourmet Burgers, Inc.* | | | 195 | | | | 12,039 | | |
Sonic Corporation | | | 551 | | | | 17,803 | | |
Texas Roadhouse, Inc. | | | 652 | | | | 23,322 | | |
The Cheesecake Factory, Inc. | | | 474 | | | | 21,856 | | |
Wendy's Company | | | 2,356 | | | | 25,374 | | |
| | | | 297,625 | | |
Household Durables (2.9%): | |
CalAtlantic Group, Inc. | | | 818 | | | | 31,019 | | |
Cavco Industries, Inc.* | | | 245 | | | | 20,411 | | |
Ethan Allen Interiors, Inc. | | | 560 | | | | 15,579 | | |
Installed Building Products, Inc.* | | | 531 | | | | 13,185 | | |
iRobot Corporation* | | | 649 | | | | 22,975 | | |
KB Home | | | 918 | | | | 11,319 | | |
La-Z-Boy, Inc. | | | 862 | | | | 21,050 | | |
M/I Homes, Inc.* | | | 805 | | | | 17,646 | | |
See notes to financial statements.
71
Victory Portfolios II
Victory CEMP US Small Cap Volatility Wtd Index ETF | | Schedule of Investments — continued
December 31, 2015 | |
(Unaudited)
Security Description | | Shares | | Value | |
MDC Holdings, Inc. | | | 761 | | | $ | 19,428 | | |
Meritage Homes Corporation* | | | 400 | | | | 13,596 | | |
Taylor Morrison Home Corporation* | | | 825 | | | | 13,200 | | |
TRI Pointe Homes, Inc.* | | | 1,341 | | | | 16,990 | | |
Tupperware Brands Corporation | | | 370 | | | | 20,590 | | |
Universal Electronics, Inc.* | | | 434 | | | | 22,286 | | |
WCI Communities, Inc.* | | | 747 | | | | 16,643 | | |
William Lyon Homes* | | | 640 | | | | 10,560 | | |
| | | | 286,477 | | |
Household Products (0.3%): | |
WD-40 Company | | | 292 | | | | 28,806 | | |
Independent Power Producers & Energy Traders (0.2%): | |
Ormat Technologies, Inc. | | | 532 | | | | 19,402 | | |
Industrial Conglomerates (0.2%): | |
Raven Industries, Inc. | | | 942 | | | | 14,695 | | |
Insurance (3.9%): | |
American Equity Investment Life Holding Company | | | 793 | | | | 19,056 | | |
American National Insurance Company | | | 245 | | | | 25,056 | | |
AMERISAFE, Inc. | | | 504 | | | | 25,654 | | |
FBL Financial Group, Inc. | | | 411 | | | | 26,156 | | |
Horace Mann Educators Corporation | | | 788 | | | | 26,146 | | |
Infinity Property & Casualty Corporation | | | 359 | | | | 29,520 | | |
Kemper Corporation | | | 772 | | | | 28,757 | | |
MBIA, Inc.* | | | 1,500 | | | | 9,720 | | |
National General Holdings Corporation | | | 1,181 | | | | 25,817 | | |
Navigators Group, Inc.* | | | 410 | | | | 35,174 | | |
Primerica, Inc. | | | 489 | | | | 23,095 | | |
ProAssurance Corporation | | | 858 | | | | 41,639 | | |
RLI Corporation | | | 464 | | | | 28,652 | | |
Selective Insurance Group, Inc. | | | 879 | | | | 29,517 | | |
Universal Insurance Holdings, Inc. | | | 523 | | | | 12,123 | | |
| | | | 386,082 | | |
Internet & Catalog Retail (0.4%): | |
FTD Companies, Inc.* | | | 625 | | | | 16,356 | | |
Lands' End, Inc.* | | | 442 | | | | 10,361 | | |
Nutrisystem, Inc. | | | 446 | | | | 9,651 | | |
| | | | 36,368 | | |
Internet Software & Services (1.3%): | |
Constant Contact, Inc.* | | | 481 | | | | 14,064 | | |
Envestnet, Inc.* | | | 274 | | | | 8,179 | | |
GrubHub, Inc.* | | | 553 | | | | 13,383 | | |
LogMeIn, Inc.* | | | 267 | | | | 17,916 | | |
NIC, Inc. | | | 913 | | | | 17,968 | | |
Shutterstock, Inc.* | | | 283 | | | | 9,152 | | |
SPS Commerce, Inc.* | | | 311 | | | | 21,835 | | |
WebMD Health Corporation* | | | 520 | | | | 25,116 | | |
| | | | 127,613 | | |
See notes to financial statements.
72
Victory Portfolios II
Victory CEMP US Small Cap Volatility Wtd Index ETF | | Schedule of Investments — continued
December 31, 2015 | |
(Unaudited)
Security Description | | Shares | | Value | |
IT Services (3.1%): | |
Blackhawk Network Holdings, Inc.* | | | 404 | | | $ | 17,861 | | |
CACI International, Inc.* | | | 383 | | | | 35,535 | | |
Cardtronics, Inc.* | | | 600 | | | | 20,190 | | |
Convergys Corporation | | | 1,080 | | | | 26,881 | | |
CSG Systems International, Inc. | | | 803 | | | | 28,892 | | |
ExlService Holdings, Inc.* | | | 618 | | | | 27,767 | | |
ManTech International Corporation | | | 918 | | | | 27,760 | | |
NeuStar, Inc.* | | | 553 | | | | 13,255 | | |
Perficient, Inc.* | | | 989 | | | | 16,932 | | |
Science Applications International Corporation | | | 463 | | | | 21,196 | | |
Sykes Enterprises, Inc.* | | | 937 | | | | 28,841 | | |
TeleTech Holdings, Inc. | | | 820 | | | | 22,886 | | |
Virtusa Corporation* | | | 433 | | | | 17,900 | | |
| | | | 305,896 | | |
Leisure Products (0.2%): | |
Smith & Wesson Holdings Corporation* | | | 752 | | | | 16,529 | | |
Life Sciences Tools & Services (0.3%): | |
Cambrex Corporation* | | | 239 | | | | 11,255 | | |
Luminex Corporation* | | | 839 | | | | 17,946 | | |
| | | | 29,201 | | |
Machinery (5.8%): | |
Alamo Group, Inc. | | | 356 | | | | 18,548 | | |
Altra Industrial Motion Corporation | | | 958 | | | | 24,027 | | |
American Railcar Industries, Inc. | | | 365 | | | | 16,892 | | |
Astec Industries, Inc. | | | 555 | | | | 22,588 | | |
Barnes Group, Inc. | | | 680 | | | | 24,065 | | |
Chart Industries, Inc.* | | | 458 | | | | 8,226 | | |
CIRCOR International, Inc. | | | 429 | | | | 18,082 | | |
CLARCOR, Inc. | | | 539 | | | | 26,778 | | |
ESCO Technologies, Inc. | | | 743 | | | | 26,852 | | |
Federal Signal Corporation | | | 1,428 | | | | 22,634 | | |
Greenbrier Companies, Inc. | | | 309 | | | | 10,080 | | |
Hillenbrand, Inc. | | | 825 | | | | 24,445 | | |
Hyster-Yale Materials Handling, Inc. | | | 358 | | | | 18,777 | | |
John Bean Technologies Corporation | | | 539 | | | | 26,858 | | |
Joy Global, Inc. | | | 889 | | | | 11,210 | | |
Lindsay Corporation | | | 284 | | | | 20,562 | | |
Meritor, Inc.* | | | 1,277 | | | | 10,663 | | |
Mueller Industries, Inc. | | | 854 | | | | 23,143 | | |
Proto Labs, Inc.* | | | 235 | | | | 14,967 | | |
RBC Bearings, Inc.* | | | 292 | | | | 18,860 | | |
Rexnord Corporation* | | | 1,139 | | | | 20,639 | | |
Standex International Corporation | | | 295 | | | | 24,529 | | |
Sun Hydraulics Corporation | | | 760 | | | | 24,115 | | |
Tennant Company | | | 450 | | | | 25,317 | | |
Terex Corporation | | | 562 | | | | 10,386 | | |
TriMas Corporation* | | | 751 | | | | 14,006 | | |
Valmont Industries, Inc. | | | 263 | | | | 27,883 | | |
See notes to financial statements.
73
Victory Portfolios II
Victory CEMP US Small Cap Volatility Wtd Index ETF | | Schedule of Investments — continued
December 31, 2015 | |
(Unaudited)
Security Description | | Shares | | Value | |
Wabash National Corporation* | | | 1,476 | | | $ | 17,461 | | |
Woodward, Inc. | | | 480 | | | | 23,837 | | |
| | | | 576,430 | | |
Marine (0.2%): | |
Matson, Inc. | | | 542 | | | | 23,106 | | |
Media (1.5%): | |
AMC Entertainment Holdings, Inc. | | | 662 | | | | 15,888 | | |
Entravision Communications Corporation | | | 1,864 | | | | 14,372 | | |
Gray Television, Inc.* | | | 1,100 | | | | 17,930 | | |
Meredith Corporation | | | 455 | | | | 19,679 | | |
Nexstar Broadcasting Group, Inc. | | | 459 | | | | 26,943 | | |
Regal Entertainment Group | | | 1,275 | | | | 24,059 | | |
Sinclair Broadcast Group, Inc. | | | 737 | | | | 23,982 | | |
| | | | 142,853 | | |
Metals & Mining (0.4%): | |
Commercial Metals Company | | | 1,125 | | | | 15,401 | | |
Ferroglobe PLC | | | 1,030 | | | | 11,073 | | |
Materion Corporation | | | 546 | | | | 15,288 | | |
| | | | 41,762 | | |
Multi-Utilities (0.6%): | |
Avista Corporation | | | 875 | | | | 30,949 | | |
NorthWestern Corporation | | | 558 | | | | 30,271 | | |
| | | | 61,220 | | |
Oil, Gas & Consumable Fuels (0.2%): | |
World Fuel Services Corporation | | | 551 | | | | 21,191 | | |
Paper & Forest Products (1.5%): | |
Boise Cascade Company* | | | 533 | | | | 13,608 | | |
Deltic Timber Corporation | | | 469 | | | | 27,610 | | |
KapStone Paper & Packaging Corporation | | | 927 | | | | 20,941 | | |
Neenah Paper, Inc. | | | 436 | | | | 27,219 | | |
PH Glatfelter Company | | | 1,397 | | | | 25,761 | | |
Schweitzer-Mauduit International, Inc. | | | 659 | | | | 27,671 | | |
| | | | 142,810 | | |
Personal Products (0.4%): | |
Inter Parfums, Inc. | | | 667 | | | | 15,888 | | |
Nu Skin Enterprises, Inc. | | | 276 | | | | 10,458 | | |
USANA Health Sciences, Inc.* | | | 70 | | | | 8,942 | | |
| | | | 35,288 | | |
Pharmaceuticals (0.5%): | |
Lannet Company, Inc.* | | | 219 | | | | 8,786 | | |
Prestige Brands Holdings, Inc.* | | | 433 | | | | 22,291 | | |
Sucampo Pharmaceuticals, Inc.* | | | 314 | | | | 5,429 | | |
Supernus Pharmaceuticals, Inc.* | | | 576 | | | | 7,742 | | |
| | | | 44,248 | | |
See notes to financial statements.
74
Victory Portfolios II
Victory CEMP US Small Cap Volatility Wtd Index ETF | | Schedule of Investments — continued
December 31, 2015 | |
(Unaudited)
Security Description | | Shares | | Value | |
Professional Services (2.3%): | |
Exponent, Inc. | | | 560 | | | $ | 27,972 | | |
FTI Consulting, Inc.* | | | 482 | | | | 16,706 | | |
Huron Consulting Group, Inc.* | | | 240 | | | | 14,256 | | |
ICF International, Inc.* | | | 605 | | | | 21,514 | | |
Insperity, Inc. | | | 384 | | | | 18,489 | | |
Kforce, Inc. | | | 588 | | | | 14,865 | | |
Korn/Ferry International | | | 696 | | | | 23,093 | | |
On Assignment, Inc.* | | | 487 | | | | 21,891 | | |
Resources Connection, Inc. | | | 1,307 | | | | 21,356 | | |
| RPX Corporation* | | | 1,372 | | | | 15,092 | | |
TrueBlue, Inc.* | | | 589 | | | | 15,173 | | |
WageWorks, Inc.* | | | 294 | | | | 13,339 | | |
| | | | 223,746 | | |
Real Estate Management & Development (0.3%): | |
Alexander & Baldwin, Inc. | | | 666 | | | | 23,516 | | |
Marcus & Millichap, Inc.* | | | 298 | | | | 8,684 | | |
| | | | 32,200 | | |
Road & Rail (1.3%): | |
ArcBest Corporation | | | 537 | | | | 11,486 | | |
Heartland Express, Inc. | | | 1,111 | | | | 18,909 | | |
Knight Transportation, Inc. | | | 646 | | | | 15,653 | | |
Landstar System, Inc. | | | 402 | | | | 23,577 | | |
Marten Transport Ltd. | | | 916 | | | | 16,213 | | |
Roadrunner Transportation Systems, Inc.* | | | 744 | | | | 7,016 | | |
Saia, Inc.* | | | 450 | | | | 10,013 | | |
Swift Transportation Company* | | | 846 | | | | 11,692 | | |
Werner Enterprises, Inc. | | | 784 | | | | 18,338 | | |
| | | | 132,897 | | |
Semiconductors & Semiconductor Equipment (3.0%): | |
Ambarella, Inc.* | | | 136 | | | | 7,581 | | |
Amkor Technology, Inc.* | | | 1,919 | | | | 11,668 | | |
Cabot Microelectronics Corporation* | | | 570 | | | | 24,955 | | |
Cirrus Logic, Inc.* | | | 449 | | | | 13,259 | | |
Diodes, Inc.* | | | 925 | | | | 21,256 | | |
Integrated Device Technology, Inc.* | | | 686 | | | | 18,076 | | |
MKS Instrument, Inc. | | | 777 | | | | 27,972 | | |
Monolithic Power Systems, Inc. | | | 424 | | | | 27,013 | | |
OmniVision Technologies, Inc.* | | | 963 | | | | 27,946 | | |
Photronics, Inc.* | | | 2,291 | | | | 28,523 | | |
Power Integrations, Inc. | | | 496 | | | | 24,120 | | |
Rambus, Inc.* | | | 1,298 | | | | 15,044 | | |
Silicon Laboratories, Inc.* | | | 411 | | | | 19,950 | | |
Synaptics, Inc.* | | | 221 | | | | 17,755 | | |
Tessera Technologies, Inc. | | | 489 | | | | 14,675 | | |
| | | | 299,793 | | |
Software (1.7%): | |
Blackbaud, Inc. | | | 388 | | | | 25,554 | | |
Ebix, Inc. | | | 436 | | | | 14,296 | | |
See notes to financial statements.
75
Victory Portfolios II
Victory CEMP US Small Cap Volatility Wtd Index ETF | | Schedule of Investments — continued
December 31, 2015 | |
(Unaudited)
Security Description | | Shares | | Value | |
Ellie Mae, Inc.* | | | 183 | | | $ | 11,022 | | |
Fair Isaac Corporation | | | 254 | | | | 23,922 | | |
Monotype Imaging Holdings, Inc. | | | 820 | | | | 19,385 | | |
Pegasystems, Inc. | | | 668 | | | | 18,370 | | |
Qualys, Inc.* | | | 264 | | | | 8,736 | | |
Synchronoss Technologies, Inc.* | | | 363 | | | | 12,788 | | |
TiVo, Inc.* | | | 2,683 | | | | 23,154 | | |
VASCO Data Security International, Inc.* | | | 548 | | | | 9,168 | | |
| | | | 166,395 | | |
Specialty Retail (4.3%): | |
Aaron's, Inc. | | | 477 | | | | 10,680 | | |
Asbury Automotive Group, Inc.* | | | 262 | | | | 17,669 | | |
Ascena Retail Group, Inc.* | | | 1,278 | | | | 12,588 | | |
Caleres, Inc. | | | 561 | | | | 15,046 | | |
CST Brands, Inc. | | | 748 | | | | 29,277 | | |
DSW, Inc. | | | 676 | | | | 16,129 | | |
Express, Inc.* | | | 706 | | | | 12,200 | | |
Finish Line, Inc. | | | 586 | | | | 10,595 | | |
Five Below, Inc.* | | | 413 | | | | 13,257 | | |
Genesco, Inc.* | | | 377 | | | | 21,425 | | |
Group 1 Automotive, Inc. | | | 250 | | | | 18,925 | | |
Guess?, Inc. | | | 692 | | | | 13,065 | | |
Hibbett Sports, Inc.* | | | 534 | | | | 16,148 | | |
Lithia Motors, Inc. | | | 185 | | | | 19,734 | | |
Mattress Firm Holding Corporation* | | | 306 | | | | 13,657 | | |
Monro Muffler Brake, Inc. | | | 410 | | | | 27,150 | | |
Murphy USA, Inc.* | | | 419 | | | | 25,450 | | |
Pier 1 Imports, Inc. | | | 1,177 | | | | 5,991 | | |
Rent-A-Center, Inc. | | | 537 | | | | 8,039 | | |
Select Comfort Corporation* | | | 737 | | | | 15,779 | | |
Sonic Automotive, Inc. | | | 1,102 | | | | 25,082 | | |
The Buckle, Inc. | | | 485 | | | | 14,928 | | |
The Cato Corporation | | | 613 | | | | 22,571 | | |
Tile Shop Holdings, Inc.* | | | 830 | | | | 13,612 | | |
Vitamin Shoppe, Inc.* | | | 527 | | | | 17,233 | | |
Zumiez, Inc.* | | | 568 | | | | 8,588 | | |
| | | | 424,818 | | |
Technology Hardware, Storage & Peripherals (0.5%): | |
Electronics For Imaging, Inc.* | | | 549 | | | | 25,660 | | |
QLogic Corporation* | | | 1,112 | | | | 13,567 | | |
Super Micro Computer, Inc.* | | | 494 | | | | 12,108 | | |
| | | | 51,335 | | |
Textiles, Apparel & Luxury Goods (0.7%): | |
Fossil Group, Inc.* | | | 283 | | | | 10,347 | | |
Iconix Brand Group, Inc.* | | | 790 | | | | 5,396 | | |
Movado Group, Inc. | | | 454 | | | | 11,672 | | |
Steven Madden Ltd.* | | | 511 | | | | 15,442 | | |
Tumi Holdings, Inc.* | | | 841 | | | | 13,986 | | |
Wolverine World Wide, Inc. | | | 795 | | | | 13,284 | | |
| | | | 70,127 | | |
See notes to financial statements.
76
Victory Portfolios II
Victory CEMP US Small Cap Volatility Wtd Index ETF | | Schedule of Investments — continued
December 31, 2015 | |
(Unaudited)
Security Description | | Shares | | Value | |
Thrifts & Mortgage Finance (2.5%): | |
Astoria Financial Corporation | | | 1,672 | | | $ | 26,501 | | |
Beneficial Bancorp, Inc.* | | | 2,958 | | | | 39,401 | | |
BofI Holding, Inc.* | | | 770 | | | | 16,209 | | |
Capitol Federal Financial, Inc. | | | 3,227 | | | | 40,531 | | |
EverBank Financial Corporation | | | 1,577 | | | | 25,200 | | |
Northwest Bancshares, Inc. | | | 2,747 | | | | 36,782 | | |
Provident Financial Services, Inc. | | | 1,478 | | | | 29,782 | | |
Washington Federal, Inc. | | | 1,177 | | | | 28,048 | | |
| | | | 242,454 | | |
Tobacco (0.3%): | |
Vector Group Ltd. | | | 1,414 | | | | 33,356 | | |
Trading Companies & Distributors (1.7%): | |
Aircastle Ltd. | | | 917 | | | | 19,156 | | |
Applied Industrial Technologies, Inc. | | | 577 | | | | 23,363 | | |
GATX Corporation | | | 455 | | | | 19,360 | | |
H&E Equipment Services, Inc. | | | 434 | | | | 7,586 | | |
Kaman Corporation | | | 925 | | | | 37,749 | | |
MRC Global, Inc.* | | | 885 | | | | 11,417 | | |
Rush Enterprises, Inc.* | | | 814 | | | | 17,818 | | |
TAL International Group, Inc. | | | 837 | | | | 13,308 | | |
Wesco International, Inc.* | | | 411 | | | | 17,953 | | |
| | | | 167,710 | | |
Transportation Infrastructure (0.2%): | |
Wesco Aircraft Holdings, Inc.* | | | 1,558 | | | | 18,648 | | |
Water Utilities (0.7%): | |
American States Water Company | | | 607 | | | | 25,464 | | |
California Water Service Group | | | 1,011 | | | | 23,526 | | |
SJW Corporation | | | 723 | | | | 21,437 | | |
| | | | 70,427 | | |
Wireless Telecommunication Services (0.2%): | |
Shenandoah Telecommunications Company | | | 357 | | | | 15,369 | | |
Total Common Stocks (Cost $10,219,275) | | | 9,814,943 | | |
Short-Term Investments (0.6%) | |
Money Market Funds (0.6%): | |
Short Term Investment Trust Liquid Assets Portfolio, 0.29%^ | | | 54,419 | | | | 54,419 | | |
Total Short-Term Investments — (Cost $54,419) | | | 54,419 | | |
Total Investments — 100.1% (Cost $10,273,694) | | | 9,869,362 | | |
Liabilities in excess of other assets — (0.1)% | | | (9,788 | ) | |
NET ASSETS — 100.0% | | $ | 9,859,574 | | |
* Non-income producing security.
^ Annualized seven-day yield as of December 31, 2015.
The Global Industry Classification Standard (GICS®) was developed by and/or is the exclusive property of MSCI, Inc. and Standard & Poor's Financial Services LLC ("S&P"). GICS® is a service mark of MSCI, Inc. and S&P and has been licensed for use by the Fund's Administrator, U.S. Bancorp Fund Services, LLC.
See notes to financial statements.
77
Victory Portfolios II
Victory CEMP International Volatility Wtd Index ETF | | Schedule of Investments
December 31, 2015 | |
(Unaudited)
Security Description | | Shares | | Value | |
Common Stocks (99.2%) | |
Australia (4.6%): | |
Amcor Ltd. | | | 2,388 | | | $ | 23,387 | | |
AMP Ltd. | | | 5,082 | | | | 21,590 | | |
Aurizon Holdings Ltd. | | | 6,183 | | | | 19,734 | | |
Australia & New Zealand Banking Group Ltd. | | | 1,149 | | | | 23,385 | | |
Brambles Ltd. | | | 3,496 | | | | 29,475 | | |
Commonwealth Bank of Australia | | | 473 | | | | 29,480 | | |
CSL Ltd. | | | 359 | | | | 27,549 | | |
Insurance Australia Group Ltd. | | | 5,806 | | | | 23,523 | | |
Macquarie Group Ltd. | | | 401 | | | | 24,186 | | |
National Australia Bank Ltd. | | | 1,161 | | | | 25,550 | | |
Newcrest Mining Ltd.* | | | 1,514 | | | | 14,309 | | |
Oil Search Ltd. | | | 2,544 | | | | 12,421 | | |
QBE Insurance Group Ltd. | | | 2,071 | | | | 19,000 | | |
Ramsay Health Care Ltd. | | | 503 | | | | 24,903 | | |
Suncorp Group Ltd. | | | 2,993 | | | | 26,477 | | |
Telstra Corporation Ltd. | | | 7,458 | | | | 30,488 | | |
Wesfarmers Ltd. | | | 1,006 | | | | 30,503 | | |
Westpac Banking Corporation | | | 1,024 | | | | 25,042 | | |
Woodside Petroleum Ltd. | | | 820 | | | | 17,161 | | |
Woolworths Ltd. | | | 1,059 | | | | 18,907 | | |
| | | | 467,070 | | |
Austria (0.1%): | |
Voestalpine AG | | | 390 | | | | 12,014 | | |
Belgium (2.1%): | |
Ageas | | | 660 | | | | 30,699 | | |
Anheuser-Busch InBev NV | | | 174 | | | | 21,632 | | |
Colruyt SA | | | 516 | | | | 26,605 | | |
Groupe Bruxelles Lambert SA | | | 366 | | | | 31,355 | | |
KBC Groep NV | | | 300 | | | | 18,802 | | |
Proximus SADP | | | 600 | | | | 19,562 | | |
Solvay SA | | | 162 | | | | 17,329 | | |
Telenet Group Holding NV* | | | 408 | | | | 22,068 | | |
UCB SA | | | 240 | | | | 21,708 | | |
| | | | 209,760 | | |
Canada (9.2%): | |
Alimentation Couche-Tard, Inc. | | | 600 | | | | 26,412 | | |
Bank Of Montreal | | | 600 | | | | 33,857 | | |
Bank Of Nova Scotia | | | 600 | | | | 24,270 | | |
BCE, Inc. | | | 600 | | | | 23,181 | | |
Brookfield Asset Management, Inc. | | | 600 | | | | 18,927 | | |
Canadian National Railway Company | | | 600 | | | | 33,540 | | |
Canadian Utilities Ltd. | | | 600 | | | | 13,850 | | |
CGI Group, Inc.* | | | 600 | | | | 24,023 | | |
Dollarama, Inc. | | | 600 | | | | 34,664 | | |
Empire Company Ltd. | | | 1,800 | | | | 33,484 | | |
Fortis, Inc. | | | 1,200 | | | | 32,443 | | |
See notes to financial statements.
78
Victory Portfolios II
Victory CEMP International Volatility Wtd Index ETF | | Schedule of Investments — continued
December 31, 2015 | |
(Unaudited)
Security Description | | Shares | | Value | |
Franco-Nevada Corporation | | | 600 | | | $ | 27,448 | | |
Gildan Activewear, Inc. | | | 1,200 | | | | 34,117 | | |
Great-West Lifeco, Inc. | | | 1,200 | | | | 29,946 | | |
Imperial Oil Ltd. | | | 1,200 | | | | 39,095 | | |
Inter Pipeline Ltd. ' | | | 1,200 | | | | 19,261 | | |
Loblaw Companies Ltd. | | | 600 | | | | 28,333 | | |
lululemon athletica, Inc.* | | | 283 | | | | 14,849 | | |
Manulife Financial Corporation | | | 1,800 | | | | 26,980 | | |
Metro, Inc. | | | 1,200 | | | | 33,597 | | |
National Bank Of Canada | | | 1,200 | | | | 34,958 | | |
Pembina Pipeline Corporation | | | 600 | | | | 13,074 | | |
Potash Corporation of Saskatchewan, Inc. | | | 1,200 | | | | 20,554 | | |
Power Corporation of Canada | | | 1,800 | | | | 37,647 | | |
Power Financial Corporation | | | 1,200 | | | | 27,587 | | |
Rogers Communications, Inc. | | | 600 | | | | 20,692 | | |
Royal Bank Of Canada | | | 600 | | | | 32,153 | | |
Saputo, Inc. | | | 1,200 | | | | 28,706 | | |
Shaw Communications, Inc. | | | 1,800 | | | | 30,960 | | |
Sun Life Financial, Inc. | | | 1,200 | | | | 37,421 | | |
TELUS Corporation | | | 1,200 | | | | 33,181 | | |
Toronto-Dominion Bank | | | 600 | | | | 23,520 | | |
TransCanada Corporation | | | 1,200 | | | | 39,191 | | |
| | | | 931,921 | | |
Denmark (1.7%): | |
A.P. Moeller - Maersk A/S | | | 6 | | | | 7,842 | | |
Chr Hansen Holding A/S | | | 420 | | | | 26,403 | | |
Coloplast A/S | | | 282 | | | | 22,873 | | |
DSV A/S | | | 672 | | | | 26,588 | | |
ISS A/S | | | 612 | | | | 22,164 | | |
Novo Nordisk A/S | | | 300 | | | | 17,470 | | |
Novozymes A/S | | | 390 | | | | 18,775 | | |
Pandora A/S | | | 126 | | | | 15,999 | | |
Vestas Wind System A/S | | | 258 | | | | 18,176 | | |
| | | | 176,290 | | |
Finland (1.2%): | |
Fortum OYJ | | | 1,151 | | | | 17,412 | | |
Kone OYJ | | | 462 | | | | 19,666 | | |
Nokia OYJ | | | 2,147 | | | | 15,388 | | |
Sampo OYJ | | | 486 | | | | 24,824 | | |
UPM-Kymmene OYJ | | | 995 | | | | 18,631 | | |
Wartsila OYJ Abp | | | 498 | | | | 22,812 | | |
| | | | 118,733 | | |
France (9.2%): | |
Accor SA | | | 384 | | | | 16,695 | | |
Aeroports de Paris | | | 216 | | | | 25,164 | | |
Air Liquide SA | | | 180 | | | | 20,276 | | |
Airbus Group SE | | | 252 | | | | 16,979 | | |
Atos SE | | | 270 | | | | 22,726 | | |
See notes to financial statements.
79
Victory Portfolios II
Victory CEMP International Volatility Wtd Index ETF | | Schedule of Investments — continued
December 31, 2015 | |
(Unaudited)
Security Description | | Shares | | Value | |
AXA SA | | | 738 | | | $ | 20,235 | | |
BNP Paribas SA | | | 264 | | | | 14,985 | | |
Bollore SA | | | 3,268 | | | | 15,261 | | |
Bureau Veritas SA | | | 1,007 | | | | 20,125 | | |
Cap Gemini SA | | | 204 | | | | 18,977 | | |
Carrefour SA | | | 648 | | | | 18,767 | | |
Casino Guichard Perrachon SA | | | 312 | | | | 14,382 | | |
Christian Dior SE | | | 96 | | | | 16,353 | | |
Cie de Saint-Gobain | | | 396 | | | | 17,150 | | |
Cie Generale des Etablissements Michelin | | | 210 | | | | 20,060 | | |
CNP Assurances | | | 1,463 | | | | 19,779 | | |
Credit Agricole SA | | | 1,199 | | | | 14,177 | | |
Danone SA | | | 384 | | | | 25,990 | | |
Dassault Systemes | | | 300 | | | | 24,051 | | |
Eiffage SA | | | 246 | | | | 15,915 | | |
Electricite de France SA | | | 1,025 | | | | 15,122 | | |
Essilor International SA | | | 156 | | | | 19,505 | | |
Eutelsat Communications SA | | | 810 | | | | 24,295 | | |
Groupe Eurotunnel SE | | | 1,793 | | | | 22,330 | | |
Hermes International | | | 48 | | | | 16,262 | | |
Iliad SA | | | 78 | | | | 18,649 | | |
Ingenico Group SA | | | 144 | | | | 18,231 | | |
JCDecaux SA | | | 606 | | | | 23,248 | | |
Kering | | | 108 | | | | 18,538 | | |
Legrand SA | | | 354 | | | | 20,082 | | |
L'Oreal SA | | | 114 | | | | 19,240 | | |
LVMH Moet Hennessy Louis Vuitton SE | | | 90 | | | | 14,172 | | |
Natixis SA | | | 2,662 | | | | 15,092 | | |
Orange SA | | | 977 | | | | 16,441 | | |
Pernod Ricard SA | | | 192 | | | | 21,951 | | |
Publicis Groupe SA | | | 312 | | | | 20,812 | | |
Renault SA | | | 168 | | | | 16,912 | | |
Sanofi | | | 192 | | | | 16,400 | | |
Schneider Electric SE | | | 312 | | | | 17,821 | | |
Societe BIC SA | | | 120 | | | | 19,777 | | |
Societe Generale SA | | | 348 | | | | 16,100 | | |
Sodexo SA | | | 306 | | | | 29,976 | | |
Suez Environnement Company | | | 822 | | | | 15,419 | | |
Thales SA | | | 318 | | | | 23,880 | | |
Valeo SA | | | 114 | | | | 17,661 | | |
Veolia Environnement SA | | | 858 | | | | 20,388 | | |
Vinci SA | | | 318 | | | | 20,438 | | |
Vivendi SA | | | 941 | | | | 20,310 | | |
Zodiac Aerospace | | | 552 | | | | 13,183 | | |
| | | | 930,282 | | |
Germany (6.0%): | |
Allianz SE | | | 138 | | | | 24,528 | | |
BASF SE | | | 234 | | | | 17,984 | | |
Bayer AG | | | 126 | | | | 15,857 | | |
Bayerische Motoren Werk AG | | | 174 | | | | 18,461 | | |
See notes to financial statements.
80
Victory Portfolios II
Victory CEMP International Volatility Wtd Index ETF | | Schedule of Investments — continued
December 31, 2015 | |
(Unaudited)
Security Description | | Shares | | Value | |
Beiersdorf AG | | | 252 | | | $ | 23,048 | | |
Brenntag AG | | | 378 | | | | 19,833 | | |
Continental AG | | | 72 | | | | 17,570 | | |
Daimler AG | | | 222 | | | | 18,717 | | |
Deutsche Boerse AG | | | 252 | | | | 22,290 | | |
Deutsche Post AG | | | 774 | | | | 21,832 | | |
Evonik Industries AG | | | 552 | | | | 18,366 | | |
Fresenius Medical Care AG & Company KGaA | | | 252 | | | | 21,287 | | |
Fresenius SE & KGaA | | | 276 | | | | 19,787 | | |
Hannover Rueck SE | | | 222 | | | | 25,489 | | |
HUGO BOSS AG | | | 174 | | | | 14,485 | | |
Infineon Technologies AG | | | 1,589 | | | | 23,321 | | |
K+S AG | | | 270 | | | | 6,931 | | |
Kabel Deutschland Holding AG | | | 222 | | | | 27,540 | | |
Linde AG | | | 126 | | | | 18,335 | | |
Merck KGaA | | | 204 | | | | 19,858 | | |
Muenchener Rueckversicherungs-Gesellschaft AG | | | 144 | | | | 28,881 | | |
ProSiebenSat.1 Media AG | | | 366 | | | | 18,601 | | |
SAP SE | | | 342 | | | | 27,273 | | |
Siemens AG | | | 228 | | | | 22,271 | | |
Symrise AG | | | 342 | | | | 22,795 | | |
Talanx AG | | | 702 | | | | 21,777 | | |
United Internet AG | | | 348 | | | | 19,254 | | |
Volkswagen AG | | | 84 | | | | 12,990 | | |
Vonovia SE | | | 522 | | | | 16,196 | | |
Zalando SE (Acquired 09/18/2015 through 11/24/2015, Cost $13,486)*+# | | | 414 | | | | 16,377 | | |
| | | | 601,934 | | |
Hong Kong (5.6%): | |
Bank Of East Asia Ltd. | | | 7,200 | | | | 26,802 | | |
Beijing Enterprise Holdings Ltd. | | | 3,000 | | | | 18,174 | | |
BOC Hong Kong Holdings Ltd. | | | 6,000 | | | | 18,348 | | |
Cathay Pacific Airways Ltd. | | | 12,000 | | | | 20,779 | | |
China Mobile Ltd. | | | 3,000 | | | | 33,871 | | |
China Overseas Land & Investment Ltd. | | | 12,000 | | | | 42,116 | | |
China Overseas Property Holdings Ltd.* | | | 1,333 | | | | 219 | | |
China Taiping Insurance Holdings Company Ltd.* | | | 2,400 | | | | 7,432 | | |
China Unicom Hong Kong Ltd. | | | 12,000 | | | | 14,632 | | |
Chow Tai Fook Jewellery Group Ltd. | | | 18,000 | | | | 11,613 | | |
CITIC Ltd. | | | 12,000 | | | | 21,244 | | |
CLP Holdings Ltd. | | | 3,000 | | | | 25,490 | | |
Galaxy Entertainment Group Ltd. | | | 6,000 | | | | 18,929 | | |
Guangdong Investment Ltd. | | | 12,000 | | | | 17,001 | | |
Hong Kong & China Gas Company Ltd. | | | 18,000 | | | | 35,303 | | |
Hong Kong Exchanges and Clearing Ltd. | | | 600 | | | | 15,368 | | |
Hongkong Land Holdings Ltd. | | | 3,000 | | | | 21,000 | | |
Jardine Strategic Holdings Ltd. | | | 1,200 | | | | 32,796 | | |
MTR Corporation Ltd. | | | 3,000 | | | | 14,864 | | |
New World Development Company Ltd. | | | 24,000 | | | | 23,721 | | |
Power Assets Holdings Ltd. | | | 3,000 | | | | 27,600 | | |
Swire Pacific Ltd. | | | 3,000 | | | | 33,755 | | |
See notes to financial statements.
81
Victory Portfolios II
Victory CEMP International Volatility Wtd Index ETF | | Schedule of Investments — continued
December 31, 2015 | |
(Unaudited)
Security Description | | Shares | | Value | |
Swire Properties Ltd. | | | 8,400 | | | $ | 24,279 | | |
Techtronic Industries Company Ltd. | | | 3,000 | | | | 12,232 | | |
WH Group Ltd. (Acquired 09/18/2015 through 11/24/2015, Cost $13,934)*+# | | | 27,000 | | | | 15,085 | | |
Wharf Holdings Ltd. | | | 6,000 | | | | 33,290 | | |
| | | | 565,943 | | |
Ireland (2.0%): | |
Accenture PLC | | | 216 | | | | 22,572 | | |
Bank Of Ireland* | | | 40,982 | | | | 15,143 | | |
CRH PLC | | | 522 | | | | 15,168 | | |
DCC PLC | | | 264 | | | | 22,028 | | |
Experian PLC | | | 1,386 | | | | 24,539 | | |
Jazz Pharmaceuticals PLC* | | | 108 | | | | 15,181 | | |
Kerry Group PLC | | | 342 | | | | 28,559 | | |
Shire PLC | | | 234 | | | | 16,206 | | |
Smurfit Kappa Group PLC | | | 528 | | | | 13,536 | | |
XL Group PLC | | | 776 | | | | 30,404 | | |
| | | | 203,336 | | |
Israel (0.6%): | |
Check Point Software Technologies Ltd.* | | | 277 | | | | 22,542 | | |
Israel Chemicals Ltd. | | | 3,650 | | | | 14,831 | | |
Teva Pharmaceutical Industries Ltd. | | | 300 | | | | 19,622 | | |
| | | | 56,995 | | |
Italy (1.9%): | |
Assicurazioni Generali SpA | | | 1,073 | | | | 19,730 | | |
Atlantia SpA | | | 738 | | | | 19,650 | | |
EXOR SpA | | | 390 | | | | 17,839 | | |
Finmeccanica SpA* | | | 1,073 | | | | 15,043 | | |
Intesa Sanpaolo SpA | | | 4,216 | | | | 14,148 | | |
Luxottica Group SpA | | | 252 | | | | 16,541 | | |
Mediobanca SpA | | | 1,499 | | | | 14,474 | | |
Prada SpA | | | 4,200 | | | | 13,061 | | |
Snam SpA | | | 3,910 | | | | 20,524 | | |
Terna Rete Elettrica Nazionale SpA | | | 4,803 | | | | 24,825 | | |
UniCredit SpA | | | 2,279 | | | | 12,718 | | |
| | | | 188,553 | | |
Japan (20.7%): | |
Aeon Company Ltd. | | | 1,200 | | | | 18,650 | | |
Aisin Seiki Company Ltd. | | | 600 | | | | 26,157 | | |
Asahi Glass Company Ltd. | | | 6,000 | | | | 34,744 | | |
Asahi Group Holdings Ltd. | | | 600 | | | | 18,964 | | |
Astellas Pharma, Inc. | | | 1,200 | | | | 17,287 | | |
Bank of Yokohama Ltd. | | | 6,000 | | | | 37,244 | | |
Bridgestone Corporation | | | 600 | | | | 20,836 | | |
Canon, Inc. | | | 1,200 | | | | 36,690 | | |
Chugai Pharmaceutical Company, Ltd. | | | 600 | | | | 21,166 | | |
Dai-ichi Life Insurance Company Ltd. | | | 1,200 | | | | 20,317 | | |
Daiichi Sankyo Company, Ltd. | | | 1,200 | | | | 25,064 | | |
Daiwa House Industry Company, Ltd. | | | 600 | | | | 17,487 | | |
See notes to financial statements.
82
Victory Portfolios II
Victory CEMP International Volatility Wtd Index ETF | | Schedule of Investments — continued
December 31, 2015 | |
(Unaudited)
Security Description | | Shares | | Value | |
Denso Corporation | | | 600 | | | $ | 29,043 | | |
Dentsu, Inc. | | | 600 | | | | 33,346 | | |
Fuji Heavy Industries Ltd. | | | 600 | | | | 25,094 | | |
FUJIFILM Holdings Corporation | | | 600 | | | | 25,359 | | |
Hankyu Hanshin Holdings, Inc. | | | 6,000 | | | | 39,386 | | |
Hitachi Ltd. | | | 6,000 | | | | 34,519 | | |
Honda Motor Company Ltd. | | | 1,200 | | | | 39,037 | | |
Hoya Corporation | | | 600 | | | | 24,865 | | |
Isuzu Motors Ltd. | | | 1,800 | | | | 19,678 | | |
ITOCHU Corporation | | | 1,800 | | | | 21,595 | | |
Japan Airlines Company Ltd. | | | 600 | | | | 21,745 | | |
Japan Exchange Group, Inc. | | | 1,200 | | | | 19,069 | | |
Japan Tobacco, Inc. | | | 600 | | | | 22,319 | | |
JFE Holdings, Inc. | | | 600 | | | | 9,584 | | |
Kao Corporation | | | 600 | | | | 31,224 | | |
KDDI Corporation | | | 1,200 | | | | 31,489 | | |
Kirin Holdings Company Ltd. | | | 1,800 | | | | 24,672 | | |
Komatsu Ltd. | | | 1,200 | | | | 19,888 | | |
Kyocera Corporation | | | 600 | | | | 28,224 | | |
M3, Inc. | | | 1,200 | | | | 25,179 | | |
Makita Corporation | | | 600 | | | | 35,093 | | |
Mazda Motor Corporation | | | 1,200 | | | | 25,199 | | |
Mitsubishi Corporation | | | 1,200 | | | | 20,247 | | |
Mitsubishi Heavy Industries Ltd. | | | 6,000 | | | | 26,622 | | |
Mitsubishi Motors Corporation | | | 2,400 | | | | 20,567 | | |
Mitsubishi UFJ Financial Group, Inc. | | | 3,000 | | | | 18,897 | | |
Mitsui & Company Ltd. | | | 1,800 | | | | 21,647 | | |
Mizuho Financial Group, Inc. | | | 9,600 | | | | 19,448 | | |
Nippon Steel & Sumitomo Metal Corporation | | | 1,200 | | | | 24,121 | | |
Nippon Telegraph & Telephone Corporation | | | 600 | | | | 24,141 | | |
Nissan Motor Company, Ltd. | | | 2,400 | | | | 25,548 | | |
Nitto Denko Corporation | | | 600 | | | | 44,488 | | |
Nomura Holdings, Inc. | | | 3,600 | | | | 20,340 | | |
Nomura Research Institute Ltd. | | | 660 | | | | 25,643 | | |
NTT Data Corporation | | | 600 | | | | 29,352 | | |
NTT DOCOMO, Inc. | | | 1,200 | | | | 24,800 | | |
Omron Corporation | | | 600 | | | | 20,292 | | |
ORIX Corporation | | | 1,200 | | | | 17,127 | | |
Otsuka Holdings Company, Ltd. | | | 600 | | | | 21,550 | | |
Panasonic Corporation | | | 1,800 | | | | 18,577 | | |
Rakuten, Inc. | | | 1,200 | | | | 14,007 | | |
Recruit Holdings Company Ltd. | | | 1,200 | | | | 35,542 | | |
Renesas Electronics Corporation | | | 3,000 | | | | 19,219 | | |
Resona Holdings, Inc. | | | 4,200 | | | | 20,658 | | |
Ricoh Company Ltd. | | | 2,400 | | | | 24,979 | | |
Secom Company, Ltd. | | | 600 | | | | 41,133 | | |
Seibu Holdings, Inc. | | | 1,200 | | | | 24,770 | | |
Sekisui House Ltd. | | | 1,200 | | | | 20,432 | | |
Seven & i Holdings Company, Ltd. | | | 600 | | | | 27,705 | | |
Shin-Etsu Chemical Company Ltd. | | | 600 | | | | 33,031 | | |
See notes to financial statements.
83
Victory Portfolios II
Victory CEMP International Volatility Wtd Index ETF | | Schedule of Investments — continued
December 31, 2015 | |
(Unaudited)
Security Description | | Shares | | Value | |
Shiseido Company Ltd. | | | 600 | | | $ | 12,624 | | |
SoftBank Group Corporation | | | 600 | | | | 30,645 | | |
Sompo Japan Nipponkoa Holdings, Inc. | | | 600 | | | | 20,022 | | |
Sony Financial Holdings, Inc. | | | 1,200 | | | | 21,755 | | |
Sumitomo Chemical Company Ltd. | | | 6,000 | | | | 34,993 | | |
Sumitomo Electric Industries Ltd. | | | 1,800 | | | | 25,818 | | |
Sumitomo Mitsui Financial Group, Inc. | | | 600 | | | | 22,993 | | |
Sumitomo Mitsui Trust Holdings, Inc. | | | 6,000 | | | | 23,013 | | |
Suntory Beverage & Food Ltd. | | | 600 | | | | 26,557 | | |
Suzuki Motor Corporation | | | 600 | | | | 18,485 | | |
Sysmex Corporation | | | 600 | | | | 39,086 | | |
T&D Holdings, Inc. | | | 1,200 | | | | 16,064 | | |
TDK Corporation | | | 600 | | | | 39,037 | | |
Terumo Corporation | | | 600 | | | | 18,869 | | |
Tokio Marine Holdings, Inc. | | | 600 | | | | 23,522 | | |
Toshiba Corporation | | | 6,000 | | | | 12,475 | | |
Toyota Industries Corporation | | | 600 | | | | 32,597 | | |
Toyota Motor Corporation | | | 600 | | | | 37,379 | | |
Toyota Tsusho Corporation | | | 1,200 | | | | 28,444 | | |
Unicharm Corporation | | | 1,200 | | | | 24,730 | | |
Yahoo Japan Corporation | | | 4,200 | | | | 17,262 | | |
| | | | 2,091,466 | | |
Netherlands (2.5%): | |
Aegon NV | | | 2,962 | | | | 16,835 | | |
AerCap Holdings NV* | | | 463 | | | | 19,983 | | |
Akzo Nobel NV | | | 306 | | | | 20,512 | | |
| ASML Holding NV | | | 162 | | | | 14,533 | | |
Boskalis Westminster | | | 318 | | | | 13,005 | | |
Gemalto NV | | | 264 | | | | 15,857 | | |
Heineken NV | | | 276 | | | | 23,627 | | |
Koninklijke Ahold NV | | | 971 | | | | 20,551 | | |
NN Group NV | | | 905 | | | | 32,013 | | |
OCI NV* | | | 408 | | | | 10,109 | | |
QIAGEN NV* | | | 848 | | | | 23,447 | | |
Randstad Holding NV | | | 288 | | | | 18,006 | | |
Wolters Kluwer NV | | | 672 | | | | 22,614 | | |
| | | | 251,092 | | |
Norway (0.8%): | |
DNB ASA | | | 1,456 | | | | 18,061 | | |
Gjensidige Forsikring ASA | | | 1,858 | | | | 29,827 | | |
Telenor ASA | | | 1,085 | | | | 18,178 | | |
Yara International ASA | | | 443 | | | | 19,163 | | |
| | | | 85,229 | | |
Portugal (0.3%): | |
EDP-Energias de Portugal SA | | | 5,361 | | | | 19,348 | | |
Jeronimo Martins SGPS SA | | | 971 | | | | 12,658 | | |
| | | | 32,006 | | |
See notes to financial statements.
84
Victory Portfolios II
Victory CEMP International Volatility Wtd Index ETF | | Schedule of Investments — continued
December 31, 2015 | |
(Unaudited)
Security Description | | Shares | | Value | |
Singapore (2.8%): | |
Avago Technologies Ltd. | | | 90 | | | $ | 13,064 | | |
CapitaLand Ltd. | | | 11,400 | | | | 26,934 | | |
DBS Group Holdings Ltd. | | | 2,400 | | | | 28,250 | | |
Global Logistic Properties Ltd. | | | 13,800 | | | | 20,925 | | |
Jardine Cycle & Carriage Ltd. | | | 600 | | | | 14,747 | | |
Keppel Corporation Ltd. | | | 4,200 | | | | 19,283 | | |
Oversea-Chinese Banking Corporation, Ltd | | | 4,800 | | | | 29,791 | | |
Singapore Airlines Ltd. | | | 3,600 | | | | 28,436 | | |
Singapore Technologies Engineering Ltd. | | | 10,800 | | | | 22,927 | | |
Singapore Telecommunications Ltd. | | | 10,200 | | | | 26,401 | | |
United Overseas Bank Ltd. | | | 1,800 | | | | 24,895 | | |
Wilmar International Ltd. | | | 13,800 | | | | 28,614 | | |
| | | | 284,267 | | |
Spain (3.5%): | |
ACS Actividades de Construccion y Servicios SA | | | 606 | | | | 17,791 | | |
Amadeus IT Holding SA | | | 534 | | | | 23,611 | | |
Banco Bilbao Vizcaya Argentaria SA | | | 2,202 | | | | 16,127 | | |
Banco de Sabadell SA | | | 7,945 | | | | 14,117 | | |
Banco Popular Espanol SA | | | 3,933 | | | | 13,006 | | |
Banco Santander SA | | | 2,575 | | | | 12,755 | | |
Bankia SA | | | 16,923 | | | | 19,752 | | |
CaixaBank SA | | | 4,389 | | | | 15,330 | | |
Enagas SA | | | 834 | | | | 23,565 | | |
Endesa SA | | | 1,103 | | | | 22,206 | | |
Ferrovial SA | | | 1,001 | | | | 22,687 | | |
Gas Natural SDG SA | | | 1,145 | | | | 23,412 | | |
Grifols SA | | | 462 | | | | 21,404 | | |
Iberdrola SA | | | 3,760 | | | | 26,765 | | |
Industria de Diseno Textil SA | | | 582 | | | | 20,044 | | |
Mapfre SA | | | 6,926 | | | | 17,402 | | |
Red Electrica Corporation SA | | | 282 | | | | 23,631 | | |
Telefonica SA | | | 1,673 | | | | 18,609 | | |
| | | | 352,214 | | |
Sweden (3.5%): | |
Alfa Laval AB | | | 1,073 | | | | 19,702 | | |
Assa Abloy AB | | | 1,079 | | | | 22,752 | | |
Atlas Copco AB | | | 671 | | | | 16,565 | | |
Autoliv, Inc. | | | 180 | | | | 22,459 | | |
Electrolux AB | | | 539 | | | | 13,102 | | |
Hennes & Mauritz AB | | | 593 | | | | 21,222 | | |
Hexagon AB | | | 551 | | | | 20,548 | | |
ICA Gruppen AB | | | 659 | | | | 23,998 | | |
Nordea Bank AB | | | 1,642 | | | | 18,148 | | |
Sandvik AB | | | 1,720 | | | | 15,088 | | |
Skandinaviska Enskilda Banken AB | | | 1,930 | | | | 20,440 | | |
Skanska AB | | | 1,043 | | | | 20,362 | | |
| SKF AB | | | 863 | | | | 14,027 | | |
Svenska Cellulosa AB SCA | | | 665 | | | | 19,419 | | |
See notes to financial statements.
85
Victory Portfolios II
Victory CEMP International Volatility Wtd Index ETF | | Schedule of Investments — continued
December 31, 2015 | |
(Unaudited)
Security Description | | Shares | | Value | |
Svenska Handelsbanken AB | | | 1,462 | | | $ | 19,554 | | |
Swedbank AB | | | 1,007 | | | | 22,320 | | |
Telefonaktiebolaget LM Ericsson | | | 1,876 | | | | 18,290 | | |
TeliaSonera AB | | | 4,213 | | | | 21,056 | | |
| | | | 349,052 | | |
Switzerland (6.6%): | |
ABB Ltd. | | | 1,139 | | | | 20,424 | | |
ACE Ltd. | | | 295 | | | | 34,471 | | |
Actelion Ltd. | | | 114 | | | | 15,889 | | |
Adecco SA | | | 240 | | | | 16,510 | | |
Cie Financiere Richemont SA | | | 210 | | | | 15,117 | | |
Clariant AG | | | 989 | | | | 18,771 | | |
Coca-Cola HBC AG | | | 840 | | | | 17,931 | | |
Credit Suisse Group AG | | | 635 | | | | 13,751 | | |
EMS-Chemie Holding AG | | | 42 | | | | 18,492 | | |
Galenica AG | | | 18 | | | | 28,287 | | |
Geberit AG | | | 60 | | | | 20,379 | | |
Givaudan SA | | | 18 | | | | 32,762 | | |
Julius Baer Group Ltd. | | | 306 | | | | 14,866 | | |
Kuehne + Nagel International AG | | | 192 | | | | 26,415 | | |
LafargeHolcim Ltd. | | | 318 | | | | 15,970 | | |
Lonza Group AG | | | 114 | | | | 18,564 | | |
Nestle SA | | | 318 | | | | 23,669 | | |
Novartis AG | | | 192 | | | | 16,639 | | |
Partners Group Holding AG | | | 48 | | | | 17,312 | | |
Roche Holdings AG | | | 72 | | | | 19,869 | | |
Schindler Holding AG | | | 150 | | | | 25,160 | | |
SGS SA | | | 12 | | | | 22,895 | | |
Sika AG | | | 6 | | | | 21,685 | | |
Sonova Holding AG | | | 132 | | | | 16,777 | | |
Swatch Group AG | | | 36 | | | | 12,587 | | |
Swiss Life Holding AG | | | 84 | | | | 22,753 | | |
Swiss Re AG | | | 318 | | | | 31,162 | | |
Swisscom AG | | | 48 | | | | 24,105 | | |
Syngenta AG | | | 42 | | | | 16,450 | | |
TE Connectivity Ltd. | | | 409 | | | | 26,426 | | |
UBS Group AG | | | 929 | | | | 18,105 | | |
Zurich Insurance Group AG | | | 84 | | | | 21,671 | | |
| | | | 665,864 | | |
United Kingdom (14.1%): | |
Aon PLC | | | 295 | | | | 27,202 | | |
ARM Holdings PLC | | | 1,134 | | | | 17,369 | | |
Ashtead Group PLC | | | 1,170 | | | | 19,301 | | |
Associated British Foods PLC | | | 420 | | | | 20,693 | | |
Aviva PLC | | | 2,976 | | | | 22,638 | | |
Babcock International Group PLC | | | 1,380 | | | | 20,670 | | |
BAE Systems PLC | | | 3,895 | | | | 28,687 | | |
Barratt Developments PLC | | | 1,926 | | | | 17,774 | | |
Berkeley Group Holdings PLC | | | 300 | | | | 16,311 | | |
See notes to financial statements.
86
Victory Portfolios II
Victory CEMP International Volatility Wtd Index ETF | | Schedule of Investments — continued
December 31, 2015 | |
(Unaudited)
Security Description | | Shares | | Value | |
British American Tobacco PLC | | | 426 | | | $ | 23,682 | | |
BT Group PLC | | | 3,468 | | | | 24,116 | | |
Bunzl PLC | | | 1,116 | | | | 31,012 | | |
Burberry Group PLC | | | 954 | | | | 16,806 | | |
Capita PLC | | | 1,290 | | | | 22,973 | | |
| CNH Industrial NV | | | 2,032 | | | | 13,899 | | |
Compass Group PLC | | | 1,644 | | | | 28,477 | | |
Delphi Automotive PLC | | | 222 | | | | 19,032 | | |
Diageo PLC | | | 858 | | | | 23,482 | | |
Direct Line Insurance Group PLC | | | 5,413 | | | | 32,518 | | |
easyJet PLC | | | 666 | | | | 17,084 | | |
Fiat Chrysler Automobiles NV* | | | 968 | | | | 13,542 | | |
G4S PLC | | | 7,429 | | | | 24,697 | | |
GlaxoSmithKline PLC | | | 1,158 | | | | 23,439 | | |
Hargreaves Lansdown PLC | | | 936 | | | | 20,781 | | |
HSBC Holdings PLC | | | 2,934 | | | | 23,192 | | |
Imperial Tobacco Group PLC | | | 432 | | | | 22,841 | | |
Inmarsat PLC | | | 1,548 | | | | 25,947 | | |
InterContinental Hotels Group PLC | | | 582 | | | | 22,805 | | |
Intertek Group PLC | | | 426 | | | | 17,440 | | |
ITV PLC | | | 5,647 | | | | 23,027 | | |
Johnson Matthey PLC | | | 504 | | | | 19,742 | | |
Kingfisher PLC | | | 3,804 | | | | 18,478 | | |
Legal & General Group PLC | | | 6,859 | | | | 27,079 | | |
London Stock Exchange Group PLC | | | 552 | | | | 22,330 | | |
Marks & Spencer Group PLC | | | 2,850 | | | | 19,008 | | |
Michael Kors Holdings Ltd.* | | | 228 | | | | 9,134 | | |
National Grid PLC | | | 2,052 | | | | 28,360 | | |
Next PLC | | | 234 | | | | 25,148 | | |
Old Mutual PLC | | | 6,469 | | | | 17,061 | | |
Persimmon PLC* | | | 594 | | | | 17,750 | | |
Prudential PLC | | | 1,032 | | | | 23,292 | | |
Reckitt Benckiser Group PLC | | | 276 | | | | 25,556 | | |
RELX NV | | | 1,529 | | | | 25,822 | | |
RELX PLC | | | 1,608 | | | | 28,375 | | |
Rio Tinto PLC | | | 468 | | | | 13,657 | | |
Royal Mail PLC | | | 2,862 | | | | 18,733 | | |
RSA Insurance Group PLC | | | 2,136 | | | | 13,430 | | |
SABMiller PLC | | | 432 | | | | 25,917 | | |
Sage Group PLC | | | 2,886 | | | | 25,676 | | |
Schroders PLC | | | 462 | | | | 20,269 | | |
Severn Trent PLC | | | 810 | | | | 25,996 | | |
Sky PLC | | | 1,596 | | | | 26,164 | | |
Smith & Nephew PLC | | | 1,164 | | | | 20,729 | | |
Smiths Group PLC | | | 1,170 | | | | 16,205 | | |
Sports Direct International PLC* | | | 1,626 | | | | 13,831 | | |
SSE PLC | | | 1,074 | | | | 24,193 | | |
St. James's Place PLC | | | 1,272 | | | | 18,902 | | |
Standard Chartered PLC | | | 1,392 | | | | 11,568 | | |
Standard Life PLC | | | 3,384 | | | | 19,441 | | |
See notes to financial statements.
87
Victory Portfolios II
Victory CEMP International Volatility Wtd Index ETF | | Schedule of Investments — continued
December 31, 2015 | |
(Unaudited)
Security Description | | Shares | | Value | |
Taylor Wimpey PLC | | | 6,301 | | | $ | 18,866 | | |
Travis Perkins PLC | | | 780 | | | | 22,687 | | |
Unilever PLC | | | 600 | | | | 25,886 | | |
United Utilities Group PLC | | | 1,752 | | | | 24,162 | | |
Vodafone Group PLC | | | 6,265 | | | | 20,411 | | |
Whitbread PLC | | | 384 | | | | 24,914 | | |
WPP PLC | | | 1,152 | | | | 26,544 | | |
| | | | 1,426,753 | | |
United States (0.2%): | |
Sensata Technologies Holding NV* | | | 451 | | | | 20,775 | | |
Total Common Stocks (Cost $10,196,569) | | | 10,021,549 | | |
Short-Term Investments (0.6%) | |
Money Market Funds (0.6%): | |
Short Term Investment Trust Liquid Assets Portfolio, 0.29%^ | | | 60,697 | | | | 60,697 | | |
Total Short-Term Investments — (Cost $60,697) | | | 60,697 | | |
Total Investments — 99.8% (Cost $10,257,266) | | | 10,082,246 | | |
Other assets in excess of liabilities — 0.2% | | | 21,851 | | |
NET ASSETS — 100.0% | | $ | 10,104,097 | | |
* Non-income producing security.
+ Restricted securities as defined in Regulation S under the Securities Act of 1933. Such securities are treated as liquid securities according to the Fund's liquidity guidelines. The value of those securities total $31,462.
# Restricted securities as defined in Rule 144(a) under the Securities Act of 1933. Such securities are treated as liquid securities according to the Fund's liquidity guidelines. The value of those securities total $31,462.
^ Annualized seven-day yield as of December 31, 2015.
Schedule of Open Futures Contracts
Number of
Contracts
Purchased | | Description | | Notional Amount | | Unrealized
Appreciation | |
| | 1 | | | Mini MSCI EAFE Future, March 2016 | | $ | 84,910 | | | $ | 21 | | |
| | | $ | 21 | | |
See notes to financial statements.
88
Victory Portfolios II
Victory CEMP US Large Cap High Div Volatility Wtd Index ETF | | Schedule of Investments
December 31, 2015 | |
(Unaudited)
Security Description | | Shares | | Value | |
Common Stocks (99.8%) | |
Aerospace & Defense (1.4%): | |
Lockheed Martin Corporation | | | 1,884 | | | $ | 409,111 | | |
Air Freight & Logistics (1.0%): | |
United Parcel Service, Inc. | | | 3,138 | | | | 301,970 | | |
Automobiles (2.1%): | |
Ford Motor Company | | | 22,068 | | | | 310,938 | | |
General Motors Company | | | 8,736 | | | | 297,112 | | |
| | | | 608,050 | | |
Banks (1.3%): | |
People's United Financial, Inc. | | | 23,436 | | | | 378,491 | | |
Beverages (1.7%): | |
The Coca-Cola Company | | | 11,828 | | | | 508,131 | | |
Capital Markets (2.2%): | |
Invesco Ltd. | | | 8,692 | | | | 291,008 | | |
T. Rowe Price Group, Inc. | | | 5,107 | | | | 365,100 | | |
| | | | 656,108 | | |
Chemicals (2.9%): | |
EI du Pont de Nemours & Company | | | 5,476 | | | | 364,702 | | |
LyondellBasell Industries NV | | | 2,345 | | | | 203,780 | | |
The Dow Chemical Company | | | 5,674 | | | | 292,098 | | |
| | | | 860,580 | | |
Communications Equipment (1.7%): | |
Cisco Systems, Inc. | | | 10,333 | | | | 280,593 | | |
QUALCOMM, Inc. | | | 4,494 | | | | 224,632 | | |
| | | | 505,225 | | |
Consumer Finance (0.6%): | |
Navient Corporation | | | 16,378 | | | | 187,528 | | |
Diversified Financial Services (1.1%): | |
CME Group, Inc. | | | 3,465 | | | | 313,929 | | |
Diversified Telecommunication Services (0.8%): | |
CenturyLink, Inc. | | | 9,399 | | | | 236,479 | | |
Electric Utilities (12.3%): | |
American Electric Power Company, Inc. | | | 5,857 | | | | 341,287 | | |
Duke Energy Corporation | | | 4,658 | | | | 332,535 | | |
Entergy Corporation | | | 4,829 | | | | 330,110 | | |
Eversource Energy | | | 6,679 | | | | 341,097 | | |
Exelon Corporation | | | 8,426 | | | | 233,990 | | |
OGE Energy Corporation | | | 11,174 | | | | 293,764 | | |
Pepco Holdings, Inc. | | | 10,426 | | | | 271,180 | | |
Pinnacle West Capital Corporation | | | 5,508 | | | | 355,156 | | |
Southern Company | | | 8,057 | | | | 376,987 | | |
Westar Energy, Inc. | | | 8,732 | | | | 370,324 | | |
Xcel Energy, Inc. | | | 9,671 | | | | 347,286 | | |
| | | | 3,593,716 | | |
See notes to financial statements.
89
Victory Portfolios II
Victory CEMP US Large Cap High Div Volatility Wtd Index ETF | | Schedule of Investments — continued
December 31, 2015 | |
(Unaudited)
Security Description | | Shares | | Value | |
Electrical Equipment (2.0%): | |
Eaton Corporation PLC | | | 4,908 | | | $ | 255,412 | | |
Emerson Electric Company | | | 6,711 | | | | 320,987 | | |
| | | | 576,399 | | |
Energy Equipment & Services (1.1%): | |
Helmerich & Payne, Inc. | | | 2,983 | | | | 159,740 | | |
National Oilwell Varco, Inc. | | | 4,760 | | | | 159,412 | | |
| | | | 319,152 | | |
Food & Staples Retailing (3.6%): | |
Costco Wholesale Corporation | | | 2,440 | | | | 394,060 | | |
Sysco Corporation | | | 8,434 | | | | 345,794 | | |
Wal-Mart Stores, Inc. | | | 5,265 | | | | 322,745 | | |
| | | | 1,062,599 | | |
Food Products (1.9%): | |
General Mills, Inc. | | | 7,585 | | | | 437,351 | | |
Pilgrim's Pride Corporation | | | 5,878 | | | | 129,845 | | |
| | | | 567,196 | | |
Health Care Equipment & Supplies (1.2%): | |
Baxter International, Inc. | | | 9,243 | | | | 352,620 | | |
Hotels, Restaurants & Leisure (2.8%): | |
Las Vegas Sands Corporation | | | 3,971 | | | | 174,089 | | |
McDonald's Corporation | | | 3,476 | | | | 410,655 | | |
Starwood Hotels & Resorts Worldwide, Inc. | | | 3,266 | | | | 226,268 | | |
| | | | 811,012 | | |
Household Products (1.6%): | |
Procter & Gamble Company | | | 5,730 | | | | 455,019 | | |
Insurance (7.2%): | |
American Financial Group, Inc. | | | 6,274 | | | | 452,230 | | |
Arthur J Gallagher & Company | | | 10,027 | | | | 410,505 | | |
Cincinnati Financial Corporation | | | 6,640 | | | | 392,889 | | |
CNA Financial Corporation | | | 9,630 | | | | 338,495 | | |
MetLife, Inc. | | | 5,564 | | | | 268,240 | | |
Principal Financial Group, Inc. | | | 5,551 | | | | 249,684 | | |
| | | | 2,112,043 | | |
IT Services (3.3%): | |
International Business Machines Corporation | | | 2,089 | | | | 287,488 | | |
Paychex, Inc. | | | 8,032 | | | | 424,813 | | |
The Western Union Company | | | 13,674 | | | | 244,901 | | |
| | | | 957,202 | | |
Machinery (2.6%): | |
Caterpillar, Inc. | | | 3,631 | | | | 246,763 | | |
Deere & Company | | | 3,759 | | | | 286,699 | | |
PACCAR, Inc. | | | 4,879 | | | | 231,264 | | |
| | | | 764,726 | | |
See notes to financial statements.
90
Victory Portfolios II
Victory CEMP US Large Cap High Div Volatility Wtd Index ETF | | Schedule of Investments — continued
December 31, 2015 | |
(Unaudited)
Security Description | | Shares | | Value | |
Media (2.2%): | |
Omnicom Group, Inc. | | | 5,600 | | | $ | 423,696 | | |
TEGNA, Inc. | | | 9,075 | | | | 231,594 | | |
| | | | 655,290 | | |
Metals & Mining (0.8%): | |
Nucor Corporation | | | 5,569 | | | | 224,431 | | |
Multiline Retail (0.7%): | |
Kohl's Corporation | | | 4,037 | | | | 192,282 | | |
Multi-Utilities (13.1%): | |
Alliant Energy Corporation | | | 5,728 | | | | 357,714 | | |
Ameren Corporation | | | 7,948 | | | | 343,592 | | |
CenterPoint Energy, Inc. | | | 15,632 | | | | 287,004 | | |
CMS Energy Corporation | | | 8,851 | | | | 319,344 | | |
Consolidated Edison, Inc. | | | 5,355 | | | | 344,166 | | |
Dominion Resources, Inc. | | | 5,027 | | | | 340,026 | | |
DTE Energy Company | | | 4,070 | | | | 326,373 | | |
PG&E Corporation | | | 6,334 | | | | 336,905 | | |
Public Service Enterprise Group, Inc. | | | 7,043 | | | | 272,494 | | |
SCANA Corporation | | | 5,778 | | | | 349,511 | | |
TECO Energy, Inc. | | | 8,913 | | | | 237,531 | | |
WEC Energy Group, Inc. | | | 6,137 | | | | 314,890 | | |
| | | | 3,829,550 | | |
Oil, Gas & Consumable Fuels (4.3%): | |
Chevron Corporation | | | 3,258 | | | | 293,090 | | |
Exxon Mobil Corporation | | | 4,098 | | | | 319,439 | | |
Kinder Morgan, Inc. | | | 10,093 | | | | 150,588 | | |
ONEOK, Inc. | | | 4,711 | | | | 116,173 | | |
Plains GP Holdings LP | | | 7,299 | | | | 68,976 | | |
Spectra Energy Corporation | | | 9,425 | | | | 225,634 | | |
Williams Companies, Inc. | | | 3,363 | | | | 86,429 | | |
| | | | 1,260,329 | | |
Paper & Forest Products (0.9%): | |
International Paper Company | | | 6,573 | | | | 247,802 | | |
Pharmaceuticals (3.7%): | |
Johnson & Johnson | | | 4,005 | | | | 411,393 | | |
Merck & Company, Inc. | | | 5,566 | | | | 293,996 | | |
Pfizer, Inc. | | | 11,213 | | | | 361,956 | | |
| | | | 1,067,345 | | |
Road & Rail (1.1%): | |
Norfolk Southern Corporation | | | 3,637 | | | | 307,654 | | |
Semiconductors & Semiconductor Equipment (6.7%): | |
Analog Devices, Inc. | | | 3,671 | | | | 203,080 | | |
Intel Corporation | | | 8,402 | | | | 289,449 | | |
KLA-Tencor Corporation | | | 4,740 | | | | 328,719 | | |
Linear Technology Corporation | | | 6,664 | | | | 283,020 | | |
Microchip Technology, Inc. | | | 5,948 | | | | 276,820 | | |
See notes to financial statements.
91
Victory Portfolios II
Victory CEMP US Large Cap High Div Volatility Wtd Index ETF | | Schedule of Investments — continued
December 31, 2015 | |
(Unaudited)
Security Description | | Shares | | Value | |
Texas Instruments, Inc. | | | 5,259 | | | $ | 288,246 | | |
Xilinx, Inc. | | | 6,126 | | | | 287,738 | | |
| | | | 1,957,072 | | |
Software (1.9%): | |
CA, Inc. | | | 10,865 | | | | 310,304 | | |
Symantec Corporation | | | 11,854 | | | | 248,934 | | |
| | | | 559,238 | | |
Specialty Retail (1.9%): | |
Best Buy Company, Inc. | | | 4,634 | | | | 141,105 | | |
GameStop Corporation | | | 4,477 | | | | 125,535 | | |
L Brands, Inc. | | | 3,074 | | | | 294,551 | | |
| | | | 561,191 | | |
Technology Hardware, Storage & Peripherals (0.5%): | |
Seagate Technology PLC | | | 4,212 | | | | 154,412 | | |
Textiles, Apparel & Luxury Goods (0.9%): | |
Coach, Inc. | | | 7,637 | | | | 249,959 | | |
Thrifts & Mortgage Finance (1.1%): | |
New York Community Bancorp, Inc. | | | 20,131 | | | | 328,538 | | |
Tobacco (3.6%): | |
Altria Group, Inc. | | | 6,392 | | | | 372,078 | | |
Philip Morris International, Inc. | | | 4,107 | | | | 361,046 | | |
Reynolds American, Inc. | | | 6,943 | | | | 320,420 | | |
| | | | 1,053,544 | | |
Total Common Stocks (Cost $29,349,048) | | | 29,185,923 | | |
SHORT-TERM INVESTMENTS (0.3%) | |
Money Market Funds (0.3%): | |
Short Term Investment Trust Liquid Assets Portfolio, 0.29%^ | | | 98,072 | | | | 98,072 | | |
Total Short-Term Investments — (Cost $98,072) | | | 98,072 | | |
Total Investments — 100.1% (Cost $29,447,120) | | | 29,283,995 | | |
Liabilities in excess of other assets — (0.1)% | | | (14,989 | ) | |
NET ASSETS — 100.0% | | $ | 29,269,006 | | |
^ Annualized seven-day yield as of December 31, 2015.
The Global Industry Classification Standard (GICS®) was developed by and/or is the exclusive property of MSCI, Inc. and Standard & Poor's Financial Services LLC ("S&P"). GICS® is a service mark of MSCI, Inc. and S&P and has been licensed for use by the Fund's Administrator, U.S. Bancorp Fund Services, LLC.
Schedule of Open Futures Contracts
Number of
Contracts
Sold | | Description | | Notional Amount | | Unrealized
Appreciation | |
| | 2 | | | S&P 500 E-Mini Future, March 2016 | | $ | (203,540 | ) | | $ | 1,977 | | |
| | | $ | 1,977 | | |
See notes to financial statements.
92
Victory Portfolios II
Victory CEMP US Small Cap High Div Volatility Wtd Index ETF | | Schedule of Investments
December 31, 2015 | |
(Unaudited)
Security Description | | Shares | | Value | |
Common Stocks (99.5%) | |
Aerospace & Defense (1.2%): | |
National Presto Industries, Inc. | | | 1,655 | | | $ | 137,133 | | |
Auto Components (1.2%): | |
Drew Industries, Inc. | | | 2,297 | | | | 139,864 | | |
Banks (7.8%): | |
Columbia Banking Systems, Inc. | | | 4,395 | | | | 142,881 | | |
FNB Corporation | | | 11,086 | | | | 147,887 | | |
Glacier Bancorp, Inc. | | | 4,445 | | | | 117,926 | | |
Park National Corporation | | | 1,754 | | | | 158,702 | | |
Trustmark Corporation | | | 6,072 | | | | 139,899 | | |
Valley National Bancorp. | | | 18,620 | | | | 183,407 | | |
| | | | 890,702 | | |
Biotechnology (0.6%): | |
PDL BioPharma, Inc. | | | 20,271 | | | | 71,759 | | |
Capital Markets (3.4%): | |
Cohen & Steers, Inc. | | | 4,577 | | | | 139,507 | | |
Greenhill & Company, Inc. | | | 3,442 | | | | 98,476 | | |
HFF, Inc. | | | 2,810 | | | | 87,307 | | |
Manning & Napier, Inc. | | | 7,840 | | | | 66,561 | | |
| | | | 391,851 | | |
Chemicals (1.4%): | |
Innophos Holdings, Inc. | | | 2,727 | | | | 79,028 | | |
Olin Corporation | | | 4,756 | | | | 82,089 | | |
| | | | 161,117 | | |
Commercial Services & Supplies (5.6%): | |
Herman Miller, Inc. | | | 5,163 | | | | 148,178 | | |
HNI Corporation | | | 2,283 | | | | 82,325 | | |
McGrath RentCorporation | | | 4,970 | | | | 125,194 | | |
MSA Safety, Inc. | | | 2,085 | | | | 90,635 | | |
Steelcase, Inc. | | | 7,600 | | | | 113,240 | | |
West Corporation | | | 3,920 | | | | 84,555 | | |
| | | | 644,127 | | |
Communications Equipment (1.1%): | |
ADTRAN, Inc. | | | 7,060 | | | | 121,573 | | |
Containers & Packaging (0.7%): | |
Greif, Inc. | | | 2,657 | | | | 81,862 | | |
Diversified Consumer Services (0.8%): | |
Capella Education Company | | | 2,047 | | | | 94,612 | | |
Diversified Telecommunication Services (0.5%): | |
Inteliquent, Inc. | | | 3,260 | | | | 57,930 | | |
Electric Utilities (9.9%): | |
ALLETE, Inc. | | | 3,155 | | | | 160,369 | | |
El Paso Electric Company | | | 4,217 | | | | 162,354 | | |
IdaCorp, Inc. | | | 2,546 | | | | 173,128 | | |
See notes to financial statements.
93
Victory Portfolios II
Victory CEMP US Small Cap High Div Volatility Wtd Index ETF | | Schedule of Investments — continued
December 31, 2015 | |
(Unaudited)
Security Description | | Shares | | Value | |
MGE Energy, Inc. | | | 3,562 | | | $ | 165,277 | | |
Otter Tail Corporation | | | 5,139 | | | | 136,852 | | |
PNM Resources, Inc. | | | 5,293 | | | | 161,807 | | |
The Empire District Electric Company | | | 6,362 | | | | 178,581 | | |
| | | | 1,138,368 | | |
Electronic Equipment, Instruments & Components (2.4%): | |
AVX Corporation | | | 9,251 | | | | 112,307 | | |
Vishay Intertechnology, Inc. | | | 13,896 | | | | 167,447 | | |
| | | | 279,754 | | |
Energy Equipment & Services (0.8%): | |
Atwood Oceanics, Inc. | | | 3,609 | | | | 36,920 | | |
US Silica Holdings, Inc. | | | 2,670 | | | | 50,009 | | |
| | | | 86,929 | | |
Food & Staples Retailing (1.2%): | |
Weis Markets, Inc. | | | 3,005 | | | | 133,122 | | |
Food Products (1.3%): | |
Cal-Maine Foods, Inc. | | | 1,325 | | | | 61,400 | | |
John B Sanfilippo & Son, Inc. | | | 1,659 | | | | 89,636 | | |
| | | | 151,036 | | |
Gas Utilities (4.0%): | |
Chesapeake Utilities Corporation | | | 2,182 | | | | 123,829 | | |
ONE Gas, Inc. | | | 3,484 | | | | 174,792 | | |
Southwest Gas Corporation | | | 2,844 | | | | 156,875 | | |
| | | | 455,496 | | |
Health Care Equipment & Supplies (1.4%): | |
Meridian Bioscience, Inc. | | | 7,859 | | | | 161,267 | | |
Health Care Providers & Services (2.4%): | |
Owens & Minor, Inc. | | | 5,095 | | | | 183,318 | | |
Select Medical Holdings Corporation | | | 7,723 | | | | 91,981 | | |
| | | | 275,299 | | |
Health Care Technology (0.9%): | |
Quality Systems, Inc. | | | 6,603 | | | | 106,440 | | |
Hotels, Restaurants & Leisure (2.2%): | |
Interval Leisure Group, Inc. | | | 6,829 | | | | 106,601 | | |
Wendy's Company | | | 13,305 | | | | 143,295 | | |
| | | | 249,896 | | |
Household Durables (2.0%): | |
MDC Holdings, Inc. | | | 4,302 | | | | 109,830 | | |
Tupperware Brands Corporation | | | 2,068 | | | | 115,084 | | |
| | | | 224,914 | | |
Industrial Conglomerates (0.7%): | |
Raven Industries, Inc. | | | 5,322 | | | | 83,023 | | |
See notes to financial statements.
94
Victory Portfolios II
Victory CEMP US Small Cap High Div Volatility Wtd Index ETF | | Schedule of Investments — continued
December 31, 2015 | |
(Unaudited)
Security Description | | Shares | | Value | |
Insurance (4.7%): | |
FBL Financial Group, Inc. | | | 2,322 | | | $ | 147,772 | | |
ProAssurance Corporation | | | 4,842 | | | | 234,983 | | |
RLI Corporation | | | 2,619 | | | | 161,723 | | |
| | | | 544,478 | | |
Internet & Catalog Retail (0.5%): | |
Nutrisystem, Inc. | | | 2,531 | | | | 54,771 | | |
Internet Software & Services (0.9%): | |
NIC, Inc. | | | 5,151 | | | | 101,372 | | |
IT Services (3.7%): | |
CSG Systems International, Inc. | | | 4,552 | | | | 163,781 | | |
ManTech International Corporation | | | 5,144 | | | | 155,554 | | |
Science Applications International Corporation | | | 2,433 | | | | 111,383 | | |
| | | | 430,718 | | |
Machinery (4.9%): | |
Altra Industrial Motion Corporation | | | 5,317 | | | | 133,350 | | |
American Railcar Industries, Inc. | | | 2,071 | | | | 95,846 | | |
Hillenbrand, Inc. | | | 4,665 | | | | 138,224 | | |
Joy Global, Inc. | | | 4,969 | | | | 62,659 | | |
Sun Hydraulics Corporation | | | 4,317 | | | | 136,979 | | |
| | | | 567,058 | | |
Media (4.1%): | |
AMC Entertainment Holdings, Inc. | | | 3,769 | | | | 90,456 | | |
Meredith Corporation | | | 2,553 | | | | 110,417 | | |
Regal Entertainment Group | | | 7,258 | | | | 136,959 | | |
Sinclair Broadcast Group, Inc. | | | 4,189 | | | | 136,310 | | |
| | | | 474,142 | | |
Metals & Mining (1.3%): | |
Commercial Metals Company | | | 6,325 | | | | 86,589 | | |
Ferroglobe PLC | | | 5,842 | | | | 62,802 | | |
| | | | 149,391 | | |
Multi-Utilities (3.0%): | |
Avista Corporation | | | 4,940 | | | | 174,728 | | |
NorthWestern Corporation | | | 3,147 | | | | 170,725 | | |
| | | | 345,453 | | |
Paper & Forest Products (2.6%): | |
PH Glatfelter Company | | | 7,873 | | | | 145,178 | | |
Schweitzer-Mauduit International, Inc. | | | 3,709 | | | | 155,741 | | |
| | | | 300,919 | | |
Personal Products (0.5%): | |
Nu Skin Enterprises, Inc. | | | 1,558 | | | | 59,033 | | |
Professional Services (2.0%): | |
Insperity, Inc. | | | 2,174 | | | | 104,678 | | |
Resources Connection, Inc. | | | 7,453 | | | | 121,782 | | |
| | | | 226,460 | | |
See notes to financial statements.
95
Victory Portfolios II
Victory CEMP US Small Cap High Div Volatility Wtd Index ETF | | Schedule of Investments — continued
December 31, 2015 | |
(Unaudited)
Security Description | | Shares | | Value | |
Semiconductors & Semiconductor Equipment (0.7%): | |
Tessera Technologies, Inc. | | | 2,767 | | | $ | 83,038 | | |
Specialty Retail (4.0%): | |
DSW, Inc. | | | 3,833 | | | | 91,456 | | |
Guess?, Inc. | | | 3,923 | | | | 74,066 | | |
Pier 1 Imports, Inc. | | | 6,661 | | | | 33,905 | | |
Rent-A-Center, Inc. | | | 3,030 | | | | 45,359 | | |
The Buckle, Inc. | | | 2,744 | | | | 84,460 | | |
The Cato Corporation | | | 3,477 | | | | 128,023 | | |
| | | | 457,269 | | |
Thrifts & Mortgage Finance (3.9%): | |
Capitol Federal Financial, Inc. | | | 18,286 | | | | 229,672 | | |
Northwest Bancshares, Inc. | | | 16,008 | | | | 214,347 | | |
| | | | 444,019 | | |
Tobacco (1.7%): | |
Vector Group Ltd. | | | 8,054 | | | | 189,993 | | |
Trading Companies & Distributors (4.0%): | |
Aircastle Ltd. | | | 5,162 | | | | 107,834 | | |
Applied Industrial Technologies, Inc. | | | 3,225 | | | | 130,580 | | |
GATX Corporation | | | 2,589 | | | | 110,162 | | |
H&E Equipment Services, Inc. | | | 2,432 | | | | 42,511 | | |
TAL International Group, Inc. | | | 4,653 | | | | 73,983 | | |
| | | | 465,070 | | |
Water Utilities (3.5%): | |
American States Water Company | | | 3,433 | | | | 144,014 | | |
California Water Service Group | | | 5,703 | | | | 132,709 | | |
SJW Corporation | | | 4,188 | | | | 124,174 | | |
| | | | 400,897 | | |
Total Common Stocks (Cost $11,646,699) | | | 11,432,155 | | |
Short-Term Investments (0.3%) | |
Money Market Funds (0.3%): | |
Short Term Investment Trust Liquid Assets Portfolio, 0.29%^ | | | 36,137 | | | | 36,137 | | |
Total Short-Term Investments — (Cost $36,137) | | | 36,137 | | |
Total Investments — 99.8% (Cost $11,682,836) | | | 11,468,292 | | |
Other assets in excess of liabilities — 0.2% | | | 24,590 | | |
NET ASSETS — 100.0% | | $ | 11,492,882 | | |
^ Annualized seven-day yield as of December 31, 2015.
The Global Industry Classification Standard (GICS®) was developed by and/or is the exclusive property of MSCI, Inc. and Standard & Poor's Financial Services LLC ("S&P"). GICS® is a service mark of MSCI, Inc. and S&P and has been licensed for use by the Fund's Administrator, U.S. Bancorp Fund Services, LLC.
See notes to financial statements.
96
Victory Portfolios II
Victory CEMP International High Div Volatility Wtd Index ETF | | Schedule of Investments
December 31, 2015 | |
(Unaudited)
Security Description | | Shares | | Value | |
Common Stocks (99.9%) | |
Australia (14.4%): | |
AMP Ltd. | | | 33,006 | | | $ | 140,220 | | |
Aurizon Holdings Ltd. | | | 40,556 | | | | 129,442 | | |
Australia & New Zealand Banking Group Ltd. | | | 7,463 | | | | 151,891 | | |
Commonwealth Bank of Australia | | | 3,066 | | | | 191,090 | | |
Insurance Australia Group Ltd. | | | 38,355 | | | | 155,398 | | |
Macquarie Group Ltd. | | | 2,527 | | | | 152,414 | | |
National Australia Bank Ltd. | | | 7,575 | | | | 166,701 | | |
Suncorp Group Ltd. | | | 19,890 | | | | 175,955 | | |
Telstra Corporation Ltd. | | | 50,422 | | | | 206,125 | | |
Wesfarmers Ltd. | | | 6,973 | | | | 211,429 | | |
Westpac Banking Corporation | | | 6,648 | | | | 162,578 | | |
Woodside Petroleum Ltd. | | | 5,872 | | | | 122,890 | | |
Woolworths Ltd. | | | 7,178 | | | | 128,150 | | |
| | | | 2,094,283 | | |
Belgium (0.9%): | |
Proximus SADP | | | 4,059 | | | | 132,334 | | |
Canada (9.7%): | |
BCE, Inc. | | | 5,300 | | | | 204,768 | | |
Fortis, Inc. | | | 6,200 | | | | 167,625 | | |
Inter Pipeline Ltd. | | | 5,500 | | | | 88,282 | | |
Pembina Pipeline Corporation | | | 4,500 | | | | 98,052 | | |
Potash Corporation of Saskatchewan, Inc. | | | 6,300 | | | | 107,906 | | |
Rogers Communications, Inc. | | | 5,500 | | | | 189,680 | | |
Shaw Communications, Inc. | | | 11,700 | | | | 201,243 | | |
TELUS Corporation | | | 6,300 | | | | 174,198 | | |
TransCanada Corporation | | | 5,300 | | | | 173,092 | | |
| | | | 1,404,846 | | |
Denmark (0.6%): | |
A.P. Moeller - Maersk A/S | | | 65 | | | | 84,951 | | |
Finland (1.7%): | |
Fortum OYJ | | | 7,960 | | | | 120,416 | | |
UPM-Kymmene OYJ | | | 6,625 | | | | 124,052 | | |
| | | | 244,468 | | |
France (8.6%): | |
Casino Guichard Perrachon SA | | | 2,259 | | | | 104,128 | | |
CNP Assurances | | | 10,376 | | | | 140,276 | | |
Electricite de France SA | | | 7,233 | | | | 106,706 | | |
Eutelsat Communications SA | | | 5,504 | | | | 165,089 | | |
Natixis SA | | | 18,412 | | | | 104,389 | | |
Orange SA | | | 6,709 | | | | 112,902 | | |
Suez Environnement Company | | | 5,643 | | | | 105,848 | | |
Veolia Environnement SA | | | 5,894 | | | | 140,053 | | |
Vinci SA | | | 2,103 | | | | 135,161 | | |
Vivendi SA | | | 6,359 | | | | 137,246 | | |
| | | | 1,251,798 | | |
See notes to financial statements.
97
Victory Portfolios II
Victory CEMP International High Div Volatility Wtd Index ETF | | Schedule of Investments — continued
December 31, 2015 | |
(Unaudited)
Security Description | | Shares | | Value | |
Germany (4.4%): | |
BASF SE | | | 1,631 | | | $ | 125,351 | | |
Bayerische Motoren Werk AG | | | 1,196 | | | | 126,895 | | |
HUGO BOSS AG | | | 1,208 | | | | 100,561 | | |
ProSiebenSat.1 Media AG | | | 2,453 | | | | 124,667 | | |
Siemens AG | | | 1,610 | | | | 157,261 | | |
| | | | 634,735 | | |
Hong Kong (5.0%): | |
China Resources Power Holdings Company Ltd. | | | 36,000 | | | | 70,049 | | |
Chow Tai Fook Jewellery Group Ltd. | | | 117,000 | | | | 75,483 | | |
CLP Holdings Ltd. | | | 31,500 | | | | 267,647 | | |
New World Development Company Ltd. | | | 143,000 | | | | 141,338 | | |
Power Assets Holdings Ltd. | | | 18,000 | | | | 165,599 | | |
| | | | 720,116 | | |
Israel (0.7%): | |
Israel Chemicals Ltd. | | | 25,428 | | | | 103,319 | | |
Italy (2.3%): | |
Snam Spa | | | 28,402 | | | | 149,083 | | |
Terna Rete Elettrica Nazionale SpA | | | 34,178 | | | | 176,653 | | |
| | | | 325,736 | | |
Japan (2.1%): | |
Canon, Inc. | | | 5,400 | | | | 165,107 | | |
Mitsui & Company Ltd. | | | 11,800 | | | | 141,910 | | |
| | | | 307,017 | | |
Netherlands (0.6%): | |
Boskalis Westminster | | | 2,280 | | | | 93,240 | | |
Norway (3.0%): | |
Gjensidige Forsikring ASA | | | 11,965 | | | | 192,080 | | |
Telenor ASA | | | 7,186 | | | | 120,394 | | |
Yara International ASA | | | 2,928 | | | | 126,658 | | |
| | | | 439,132 | | |
Portugal (0.9%): | |
EDP-Energias de Portugal SA | | | 37,282 | | | | 134,555 | | |
Singapore (4.5%): | |
Jardine Cycle & Carriage Ltd. | | | 7,100 | | | | 174,508 | | |
Keppel Corporation Ltd. | | | 30,800 | | | | 141,412 | | |
Singapore Technologies Engineering Ltd. | | | 76,300 | | | | 161,974 | | |
Singapore Telecommunications Ltd. | | | 67,900 | | | | 175,748 | | |
| | | | 653,642 | | |
Spain (8.8%): | |
ACS Actividades de Construccion y Servicios SA | | | 4,090 | | | | 120,077 | | |
Banco Santander SA | | | 17,570 | | | | 87,032 | | |
Enagas SA | | | 5,729 | | | | 161,877 | | |
Endesa SA | | | 7,568 | | | | 152,360 | | |
See notes to financial statements.
98
Victory Portfolios II
Victory CEMP International High Div Volatility Wtd Index ETF | | Schedule of Investments — continued
December 31, 2015 | |
(Unaudited)
Security Description | | Shares | | Value | |
Gas Natural SDG SA | | | 7,982 | | | $ | 163,210 | | |
Iberdrola SA | | | 25,556 | | | | 181,914 | | |
Mapfre SA | | | 48,331 | | | | 121,436 | | |
Red Electrica Corporation SA | | | 1,992 | | | | 166,929 | | |
Telefonica SA | | | 11,504 | | | | 127,958 | | |
| | | | 1,282,793 | | |
Sweden (6.2%): | |
Atlas Copco AB | | | 4,448 | | | | 109,811 | | |
Nordea Bank AB | | | 11,095 | | | | 122,629 | | |
Sandvik AB | | | 11,431 | | | | 100,275 | | |
Skanska AB | | | 6,911 | | | | 134,921 | | |
Swedbank AB | | | 6,913 | | | | 153,223 | | |
Telefonaktiebolaget LM Ericsson | | | 12,703 | | | | 123,848 | | |
TeliaSonera AB | | | 30,346 | | | | 151,668 | | |
| | | | 896,375 | | |
Switzerland (5.8%): | |
Kuehne + Nagel International AG | | | 1,293 | | | | 177,894 | | |
SGS SA | | | 74 | | | | 141,188 | | |
Swiss Re AG | | | 2,190 | | | | 214,605 | | |
Swisscom AG | | | 317 | | | | 159,196 | | |
Zurich Insurance Group AG | | | 566 | | | | 146,021 | | |
| | | | 838,904 | | |
United Kingdom (19.7%): | |
BAE Systems PLC | | | 26,359 | | | | 194,138 | | |
Berkeley Group Holdings PLC | | | 2,168 | | | | 117,872 | | |
British American Tobacco PLC | | | 3,059 | | | | 170,057 | | |
Direct Line Insurance Group PLC | | | 38,724 | | | | 232,630 | | |
GlaxoSmithKline PLC | | | 8,073 | | | | 163,405 | | |
HSBC Holdings PLC | | | 19,958 | | | | 157,762 | | |
ITV PLC | | | 37,248 | | | | 151,885 | | |
Legal & General Group PLC | | | 46,504 | | | | 183,594 | | |
National Grid PLC | | | 13,940 | | | | 192,661 | | |
Next PLC | | | 1,591 | | | | 170,984 | | |
Old Mutual PLC | | | 43,790 | | | | 115,490 | | |
Rio Tinto PLC | | | 3,173 | | | | 92,594 | | |
Royal Mail PLC | | | 18,229 | | | | 119,318 | | |
SSE PLC | | | 6,991 | | | | 157,479 | | |
Standard Chartered PLC | | | 9,540 | | | | 79,278 | | |
Standard Life PLC | | | 23,246 | | | | 133,548 | | |
Taylor Wimpey PLC | | | 41,362 | | | | 123,843 | | |
United Utilities Group PLC | | | 11,760 | | | | 162,185 | | |
Vodafone Group PLC | | | 41,896 | | | | 136,497 | | |
| | | | 2,855,220 | | |
Total Common Stocks (Cost $14,996,428) | | | 14,497,464 | | |
See notes to financial statements.
99
Victory Portfolios II
Victory CEMP International High Div Volatility Wtd Index ETF | | Schedule of Investments — continued
December 31, 2015 | |
(Unaudited)
Security Description | | Shares | | Value | |
SHORT-TERM INVESTMENTS (0.3%) | |
Money Market Funds (0.3%): | |
Short Term Investment Trust Liquid Assets Portfolio, 0.29%^ | | | 48,385 | | | $ | 48,385 | | |
Total Short-Term Investments — (Cost $48,385) | | | 48,385 | | |
Total Investments — 100.2% (Cost $15,044,813) | | | 14,545,849 | | |
Liabilities in excess of other assets — (0.2)% | | | (23,507 | ) | |
NET ASSETS — 100.0% | | $ | 14,522,342 | | |
* Non-income producing security.
^ Annualized seven-day yield as of December 31, 2015.
See notes to financial statements.
100
Victory Portfolios II | | Statements of Assets and Liabilities
December 31, 2015 | |
(Unaudited)
| | | Victory CEMP
US 500 Volatility
Wtd Index ETF | | Victory CEMP
US Discovery
Enhanced Volatility
Wtd Index ETF | | Victory CEMP
US 500
Enhanced Volatility
Wtd Index ETF | |
ASSETS: | |
Investments in securities, at value* | | $ | 23,261,228 | | | $ | 25,815,181 | | | $ | 114,314,633 | | |
Cash | | | — | | | | 5,203 | | | | — | | |
Deposit at broker for futures | | | 22,141 | | | | 26,662 | | | | 63,041 | | |
Receivable for fund shares sold | | | — | | | | — | | | | 7,214,880 | | |
Receivable for investment sold | | | — | | | | 3,524,806 | | | | — | | |
Interest and dividends receivable | | | 27,529 | | | | 24,531 | | | | 126,821 | | |
Due from adviser, net | | | 640 | | | | 1,322 | | | | — | | |
Prepaid expenses and other assets | | | 5,110 | | | | 12,350 | | | | 32,982 | | |
Total Assets | | | 23,316,648 | | | | 29,410,055 | | | | 121,752,357 | | |
LIABILITIES: | |
Payable for investments purchased | | | 27,118 | | | | — | | | | 7,323,413 | | |
Payable for fund shares redeemed | | | — | | | | 3,530,110 | | | | — | | |
Due to adviser, net | | | — | | | | — | | | | 1,237 | | |
Variation margin on futures contracts | | | 960 | | | | 1,150 | | | | 3,755 | | |
Payable to custodian | | | 15,412 | | | | — | | | | 451 | | |
Other liabilities and accrued expenses | | | 15,088 | | | | 13,195 | | | | 23,570 | | |
Total Liabilities | | | 58,578 | | | | 3,544,455 | | | | 7,352,426 | | |
Net Assets | | $ | 23,258,070 | | | $ | 25,865,600 | | | $ | 114,399,931 | | |
NET ASSETS CONSIST OF: | |
Paid-in capital | | $ | 23,344,759 | | | $ | 28,822,622 | | | $ | 117,268,998 | | |
Undistributed net investment income | | | 20,608 | | | | 201 | | | | 20,324 | | |
Accumulated net realized gain (loss) on
investments in securities and futures | | | 174,544 | | | | (2,122,684 | ) | | | 50,257 | | |
Net unrealized appreciation
(depreciation) on: | |
Investments in securities | | | (281,396 | ) | | | (833,965 | ) | | | (2,941,471 | ) | |
Investments in futures | | | (445 | ) | | | (574 | ) | | | 1,823 | | |
Net Assets | | | 23,258,070 | | | | 25,865,600 | | | | 114,399,931 | | |
*Identified Cost: | | $ | 23,542,624 | | | $ | 26,649,146 | | | $ | 117,256,104 | | |
Net Asset Value
(unlimited shares authorized): | |
Net Assets | | $ | 23,258,070 | | | $ | 25,865,600 | | | $ | 114,399,931 | | |
Shares Outstanding^ | | | 650,000 | | | | 750,000 | | | | 3,200,000 | | |
Net Asset Value | | $ | 35.78 | | | $ | 34.49 | | | $ | 35.75 | | |
^ No Par Value
See notes to financial statements.
101
Victory Portfolios II | | Statements of Assets and Liabilities
December 31, 2015 | |
(Unaudited)
| | | Victory CEMP
Developed
Enhanced Volatility
Wtd Index ETF | | Victory CEMP
US EQ Income
Enhanced Volatility
Wtd Index ETF | | Victory CEMP
US Small Cap
Volatility
Wtd Index ETF | |
ASSETS: | |
Investments in securities, at value* | | $ | 29,775,567 | | | $ | 95,226,434 | | | $ | 9,869,362 | | |
Cash | | | 78 | | | | — | | | | — | | |
Foreign currency, at value (cost $3,244,
$0, and $0, respectively) | | | 3,247 | | | | — | | | | — | | |
Deposit at broker for futures | | | 36,989 | | | | 72,908 | | | | 7,229 | | |
Interest and dividends receivable | | | 37,879 | | | | 203,014 | | | | 8,154 | | |
Due from adviser, net | | | 8,294 | | | | — | | | | 2,834 | | |
Prepaid expenses and other assets | | | 10,567 | | | | 32,308 | | | | 9,329 | | |
Total Assets | | | 29,872,621 | | | | 95,534,664 | | | | 9,896,908 | | |
LIABILITIES: | |
Due to adviser, net | | | — | | | | 2,242 | | | | — | | |
Variation margin on futures contracts | | | 5,625 | | | | 2,795 | | | | — | | |
Payable to custodian | | | — | | | | — | | | | 26,781 | | |
Other liabilities and accrued expenses | | | 16,149 | | | | 27,554 | | | | 10,553 | | |
Total Liabilities | | | 21,774 | | | | 32,591 | | | | 37,334 | | |
Net Assets | | $ | 29,850,847 | | | $ | 95,502,073 | | | $ | 9,859,574 | | |
NET ASSETS CONSIST OF: | |
Paid-in capital | | $ | 33,344,679 | | | $ | 99,485,124 | | | $ | 10,247,260 | | |
Undistributed net investment
income (loss) | | | (5,104 | ) | | | 15,574 | | | | (109 | ) | |
Accumulated net realized gain (loss) on
investments in securities and futures | | | (3,008,713 | ) | | | (1,034,786 | ) | | | 16,755 | | |
Net unrealized appreciation
(depreciation) on: | |
Investments in securities | | | (479,547 | ) | | | (2,965,176 | ) | | | (404,332 | ) | |
Investments in futures | | | 105 | | | | 1,337 | | | | — | | |
Foreign currencies | | | (573 | ) | | | — | | | | — | | |
Net Assets | | | 29,850,847 | | | | 95,502,073 | | | | 9,859,574 | | |
*Identified Cost: | | $ | 30,255,114 | | | $ | 98,191,610 | | | $ | 10,273,694 | | |
Net Asset Value
(unlimited shares authorized): | |
Net Assets | | $ | 29,850,847 | | | $ | 95,502,073 | | | $ | 9,859,574 | | |
Shares Outstanding^ | | | 950,000 | | | | 2,700,000 | | | | 300,000 | | |
Net Asset Value | | $ | 31.42 | | | $ | 35.37 | | | $ | 32.87 | | |
^ No Par Value
See notes to financial statements.
102
Victory Portfolios II | | Statements of Assets and Liabilities
December 31, 2015 | |
(Unaudited)
| | | Victory CEMP
International
Volatility
Wtd Index ETF | | Victory CEMP
US Large Cap
High Div Volatility
Wtd Index ETF | | Victory CEMP
US Small Cap
High Div Volatility
Wtd Index ETF | |
ASSETS: | |
Investments in securities, at value* | | $ | 10,082,246 | | | $ | 29,283,995 | | | $ | 11,468,292 | | |
Cash | | | 75 | | | | — | | | | — | | |
Foreign currency, at value (cost $897,
$0, and $0, respectively) | | | 899 | | | | — | | | | — | | |
Variation margin on futures contracts | | | — | | | | 2,005 | | | | — | | |
Deposit at broker for futures | | | 7,848 | | | | 12,207 | | | | 9,996 | | |
Receivable for fund shares sold | | | — | | | | 5,216,760 | | | | — | | |
Interest and dividends receivable | | | 9,560 | | | | 47,557 | | | | 19,362 | | |
Due from adviser, net | | | 7,276 | | | | — | | | | — | | |
Prepaid expenses and other assets | | | 7,619 | | | | 9,896 | | | | 9,635 | | |
Total Assets | | | 10,115,523 | | | | 34,572,420 | | | | 11,507,285 | | |
LIABILITIES: | |
Payable for investments purchased | | | — | | | | 5,207,265 | | | | — | | |
Due to adviser, net | | | — | | | | 2,789 | | | | 322 | | |
Variation margin on futures contracts | | | 1,125 | | | | — | | | | — | | |
Payable to custodian | | | — | | | | 80,034 | | | | 862 | | |
Other liabilities and accrued expenses | | | 10,301 | | | | 13,326 | | | | 13,219 | | |
Total Liabilities | | | 11,426 | | | | 5,303,414 | | | | 14,403 | | |
Net Assets | | $ | 10,104,097 | | | $ | 29,269,006 | | | $ | 11,492,882 | | |
NET ASSETS CONSIST OF: | |
Paid-in capital | | $ | 10,324,200 | | | $ | 29,483,140 | | | $ | 11,843,420 | | |
Undistributed net investment income (loss) | | | (9,481 | ) | | | 54 | | | | (161 | ) | |
Accumulated net realized loss on
investments in securities and futures | | | (35,546 | ) | | | (53,040 | ) | | | (135,833 | ) | |
Net unrealized appreciation
(depreciation) on: | |
Investments in securities | | | (175,020 | ) | | | (163,125 | ) | | | (214,544 | ) | |
Investments in futures | | | 20 | | | | 1,977 | | | | — | | |
Foreign currencies | | | (76 | ) | | | — | | | | — | | |
Net Assets | | | 10,104,097 | | | | 29,269,006 | | | | 11,492,882 | | |
*Identified Cost: | | $ | 10,257,266 | | | $ | 29,447,120 | | | $ | 11,682,836 | | |
Net Asset Value
(unlimited shares authorized): | |
Net Assets | | $ | 10,104,097 | | | $ | 29,269,006 | | | $ | 11,492,882 | | |
Shares Outstanding^ | | | 300,000 | | | | 850,000 | | | | 350,000 | | |
Net Asset Value | | $ | 33.68 | | | $ | 34.43 | | | $ | 32.84 | | |
^ No Par Value
See notes to financial statements.
103
Victory Portfolios II | | Statements of Assets and Liabilities
December 31, 2015 | |
(Unaudited)
| | | Victory CEMP
International
High Div Volatility
Wtd Index ETF | |
ASSETS: | |
Investments in securities, at value* | | $ | 14,545,849 | | |
Foreign currency, at value (cost $1,275) | | | 1,281 | | |
Deposit at broker for futures | | | 11,339 | | |
Receivable for fund shares sold | | | 1,613,595 | | |
Interest and dividends receivable | | | 26,548 | | |
Due from adviser, net | | | 1,020 | | |
Prepaid expenses and other assets | | | 3,518 | | |
Total Assets | | | 16,203,150 | | |
LIABILITIES: | |
Payable for investments purchased | | | 1,611,200 | | |
Payable to custodian | | | 56,835 | | |
Other liabilities and accrued expenses | | | 12,773 | | |
Total Liabilities | | | 1,680,808 | | |
Net Assets | | $ | 14,522,342 | | |
NET ASSETS CONSIST OF: | |
Paid-in capital | | $ | 15,066,725 | | |
Undistributed net investment loss | | | (8,363 | ) | |
Accumulated net realized loss on investments in securities and futures | | | (36,709 | ) | |
Net unrealized depreciation on: | |
Investments in securities | | | (498,964 | ) | |
Foreign currencies | | | (347 | ) | |
Net Assets | | | 14,522,342 | | |
*Identified Cost: | | $ | 15,044,813 | | |
Net Asset Value (unlimited shares authorized): | |
Net Assets | | $ | 14,522,343 | | |
Shares Outstanding^ | | | 450,000 | | |
Net Asset Value | | $ | 32.27 | | |
^ No Par Value
See notes to financial statements.
104
Victory Portfolios II | | Statements of Operations
Period Ended December 31, 2015 | |
(Unaudited)
| | | Victory CEMP
US 500 Volatility
Wtd Index ETF | | Victory CEMP
US Discovery
Enhanced Volatility
Wtd Index ETF | | Victory CEMP
US 500
Enhanced Volatility
Wtd Index ETF | |
Investment Income: | |
Dividend income (net of $19, $0 and $122,
respectively, in foreign withholding taxes) | | $ | 153,915 | | | $ | 211,514 | | | $ | 1,017,767 | | |
Interest income | | | 100 | | | | 2,999 | | | | 552 | | |
Total Investment Income | | | 154,015 | | | | 214,513 | | | | 1,018,319 | | |
Expenses: | |
Advisory fees | | | 23,889 | | | | 41,386 | | | | 163,957 | | |
Administration, fund accounting and
transfer agent fees | | | 19,543 | | | | 27,431 | | | | 69,689 | | |
Professional fees | | | 7,382 | | | | 7,779 | | | | 27,238 | | |
Custody expense | | | 2,483 | | | | 3,697 | | | | 6,230 | | |
Service fees | | | 2,024 | | | | 2,015 | | | | 2,224 | | |
Compliance expense | | | 924 | | | | 1,024 | | | | 1,301 | | |
Shareholder reporting expenses | | | 693 | | | | 409 | | | | 4,385 | | |
Trustees' fees and expenses | | | 504 | | | | 1,131 | | | | 4,543 | | |
Insurance expenses | | | 436 | | | | 872 | | | | 2,632 | | |
Registration fees | | | 155 | | | | 18 | | | | 27 | | |
Miscellaneous expenses | | | 1,656 | | | | 469 | | | | 184 | | |
Total Expenses | | | 59,689 | | | | 86,231 | | | | 282,410 | | |
Less: Fees waived and reimbursed
by Adviser | | | (31,818 | ) | | | (37,946 | ) | | | (91,117 | ) | |
Net Expenses | | | 27,871 | | | | 48,285 | | | | 191,293 | | |
Net Investment Income | | | 126,144 | | | | 166,228 | | | | 827,026 | | |
Realized & Unrealized Gain (Loss)
on Investments: | |
Net realized gain (loss) on: | |
Investments in securities | | | (270,602 | ) | | | (3,084,283 | ) | | | (2,636,814 | ) | |
In-kind redemptions | | | 456,365 | | | | 1,116,030 | | | | 3,309,387 | | |
Investments in futures | | | (11,275 | ) | | | (39,987 | ) | | | (83,553 | ) | |
Net realized gain (loss) on investments in
securities and futures | | | 174,488 | | | | (2,008,240 | ) | | | 589,020 | | |
Net change in unrealized appreciation
(depreciation) of: | |
Investments in securities | | | (556,513 | ) | | | (1,156,951 | ) | | | (3,533,059 | ) | |
Investments in futures | | | (388 | ) | | | 3,318 | | | | 17,603 | | |
Net change in unrealized depreciation
of investments in securities and futures | | | (556,901 | ) | | | (1,153,633 | ) | | | (3,515,456 | ) | |
Net realized and unrealized loss
on investments | | | (382,413 | ) | | | (3,161,873 | ) | | | (2,926,436 | ) | |
Net decrease in net assets resulting
from operations | | $ | (256,269 | ) | | $ | (2,995,645 | ) | | $ | (2,099,410 | ) | |
See notes to financial statements.
105
Victory Portfolios II | | Statements of Operations
Period Ended December 31, 2015 | |
(Unaudited)
| | | Victory CEMP
Developed
Enhanced Volatility
Wtd Index ETF | | Victory CEMP
US EQ Income
Enhanced Volatility
Wtd Index ETF | | Victory CEMP
US Small Cap
Volatility
Wtd Index ETF | |
Investment Income: | |
Dividend income (net of $22,639, $0 and $0,
respectively, in foreign withholding taxes) | | $ | 239,005 | | | $ | 1,726,044 | | | $ | 43,888 | | |
Interest income | | | 3,190 | | | | 320 | | | | 34 | | |
Total Investment Income | | | 242,195 | | | | 1,726,364 | | | | 43,922 | | |
Expenses: | |
Advisory fees | | | 57,535 | | | | 141,136 | | | | 7,008 | | |
Administration, fund accounting and
transfer agent fees | | | 41,068 | | | | 57,682 | | | | 15,362 | | |
Custody expense | | | 24,535 | | | | 4,104 | | | | 2,768 | | |
Professional fees | | | 10,657 | | | | 30,161 | | | | 5,431 | | |
Shareholder reporting expenses | | | 3,898 | | | | 5,053 | | | | 1,561 | | |
Service fees | | | 2,024 | | | | 2,024 | | | | 1,958 | | |
Trustees' fees and expenses | | | 1,322 | | | | 4,575 | | | | 357 | | |
Compliance expense | | | 1,024 | | | | 1,392 | | | | 531 | | |
Insurance expenses | | | 604 | | | | 3,472 | | | | 262 | | |
Registration fees | | | 19 | | | | 18 | | | | 261 | | |
Miscellaneous expenses | | | 193 | | | | 1,656 | | | | 921 | | |
Total Expenses | | | 142,879 | | | | 251,273 | | | | 36,420 | | |
Less: Fees waived and reimbursed
by Adviser | | | (78,152 | ) | | | (86,614 | ) | | | (28,244 | ) | |
Net Expenses | | | 64,727 | | | | 164,659 | | | | 8,176 | | |
Net Investment Income | | | 177,468 | | | | 1,561,705 | | | | 35,746 | | |
Realized & Unrealized Gain (Loss)
on Investments: | |
Net realized gain (loss) on: | |
Investments in securities | | | (2,955,156 | ) | | | (2,474,393 | ) | | | (67,327 | ) | |
In-kind redemptions | | | — | | | | 2,203,773 | | | | 85,817 | | |
Investments in futures | | | (52,790 | ) | | | (45,721 | ) | | | (1,735 | ) | |
Foreign currencies | | | (4,403 | ) | | | — | | | | — | | |
Net realized gain (loss) on investments in
securities, futures, and foreign currencies | | | (3,012,349 | ) | | | (316,341 | ) | | | 16,755 | | |
Net change in unrealized appreciation
(depreciation) of: | |
Investments in securities | | | (220,132 | ) | | | (21,948 | ) | | | (404,332 | ) | |
Investments in futures | | | 7,647 | | | | 11,269 | | | | — | | |
Foreign currencies | | | (536 | ) | | | — | | | | — | | |
Net change in unrealized depreciation
of investments in securities, futures,
and foreign currencies | | | (213,021 | ) | | | (10,679 | ) | | | (404,332 | ) | |
Net realized and unrealized loss
on investments | | | (3,225,370 | ) | | | (327,020 | ) | | | (387,577 | ) | |
Net increase (decrease) in net assets
resulting from operations | | $ | (3,047,902 | ) | | $ | 1,234,685 | | | $ | (351,831 | ) | |
See notes to financial statements.
106
Victory Portfolios II | | Statements of Operations
Period Ended December 31, 2015 | |
(Unaudited)
| | | Victory CEMP
International
Volatility
Wtd Index ETF | | Victory CEMP
US Large Cap
High Div Volatility
Wtd Index ETF | | Victory CEMP
US Small Cap
High Div Volatility
Wtd Index ETF | |
Investment Income: | |
Dividend income (net of $3,607, $0 and $0,
respectively, in foreign withholding taxes) | | $ | 32,681 | | | $ | 151,214 | | | $ | 122,361 | | |
Interest income | | | 57 | | | | 32 | | | | 21 | | |
Total Investment Income | | | 32,738 | | | | 151,246 | | | | 122,382 | | |
Expenses: | |
Administration, fund accounting and
transfer agent fees | | | 19,613 | | | | 10,099 | | | | 10,099 | | |
Custody expense | | | 9,186 | | | | 2,883 | | | | 2,049 | | |
Advisory fees | | | 7,492 | | | | 10,702 | | | | 7,841 | | |
Professional fees | | | 4,974 | | | | 5,221 | | | | 5,194 | | |
Service fees | | | 1,474 | | | | 1,958 | | | | 1,958 | | |
Shareholder reporting expenses | | | 1,400 | | | | 1,477 | | | | 1,552 | | |
Trustees' fees and expenses | | | 234 | | | | 366 | | | | 366 | | |
Insurance expenses | | | 218 | | | | 262 | | | | 262 | | |
Registration fees | | | 129 | | | | 279 | | | | 261 | | |
Compliance expense | | | 90 | | | | 456 | | | | 465 | | |
Miscellaneous expenses | | | 534 | | | | 921 | | | | 921 | | |
Total Expenses | | | 45,344 | | | | 34,624 | | | | 30,968 | | |
Less: fees waived and reimbursed
by Adviser | | | (36,916 | ) | | | (22,138 | ) | | | (21,820 | ) | |
Net Expenses | | | 8,428 | | | | 12,486 | | | | 9,148 | | |
Net Investment Income | | | 24,310 | | | | 138,760 | | | | 113,234 | | |
Realized & Unrealized Gain (Loss)
on Investments: | |
Net realized gain (loss) on: | |
Investments in securities | | | (42,927 | ) | | | (50,787 | ) | | | (137,735 | ) | |
Investments in futures | | | (1,549 | ) | | | (2,253 | ) | | | 1,902 | | |
Foreign currencies | | | 8,930 | | | | — | | | | — | | |
Net realized loss on investments in
securities, futures, and foreign currencies | | | (35,546 | ) | | | (53,040 | ) | | | (135,833 | ) | |
Net change in unrealized appreciation
(depreciation) of: | |
Investments in securities | | | (175,020 | ) | | | (163,125 | ) | | | (214,544 | ) | |
Investments in futures | | | 20 | | | | 1,977 | | | | — | | |
Foreign currencies | | | (76 | ) | | | — | | | | — | | |
Net change in unrealized depreciation
of investments in securities, futures,
and foreign currencies | | | (175,076 | ) | | | (161,148 | ) | | | (214,544 | ) | |
Net realized and unrealized loss
on investments | | | (210,622 | ) | | | (214,188 | ) | | | (350,377 | ) | |
Net decrease in net assets resulting
from operations | | $ | (186,312 | ) | | $ | (75,428 | ) | | $ | (237,143 | ) | |
See notes to financial statements.
107
Victory Portfolios II | | Statements of Operations
Period Ended December 31, 2015 | |
(Unaudited)
| | | Victory CEMP
International
High Div Volatility
Wtd Index ETF | |
Investment Income: | |
Dividend income (net of $7,811 in foreign withholding taxes) | | $ | 78,709 | | |
Interest income | | | 43 | | |
Total Investment Income | | | 78,752 | | |
Expenses: | |
Advisory fees | | | 9,207 | | |
Custody expense | | | 8,295 | | |
Administration, fund accounting and transfer agent fees | | | 8,120 | | |
Professional fees | | | 4,956 | | |
Service fees | | | 1,474 | | |
Shareholder reporting expenses | | | 1,400 | | |
Compliance expense | | | 447 | | |
Trustees' fees and expenses | | | 234 | | |
Insurance expenses | | | 218 | | |
Registration fees | | | 129 | | |
Miscellaneous expenses | | | 534 | | |
Total Expenses | | | 35,014 | | |
Less: fees waived and reimbursed by Adviser | | | (24,656 | ) | |
Net Expenses | | | 10,358 | | |
Net Investment Income | | | 68,394 | | |
Realized & Unrealized Gain (Loss) on Investments: | |
Net realized gain (loss) on: | |
Investments in securities | | | (47,752 | ) | |
Investments in futures | | | 3,786 | | |
Foreign currencies | | | 7,257 | | |
Net realized loss on investments in securities, futures, and foreign currencies | | | (36,709 | ) | |
Net change in unrealized depreciation of: | |
Investments in securities | | | (498,964 | ) | |
Foreign currencies | | | (347 | ) | |
Net change in unrealized depreciation of investments in securities, futures,
and foreign currencies | | | (499,311 | ) | |
Net realized and unrealized loss on investments | | | (536,020 | ) | |
Net decrease in net assets resulting from operations | | $ | (467,626 | ) | |
See notes to financial statements.
108
Victory Portfolios II | | Statement of Changes in Net Assets | |
| | | Victory CEMP
US 500 Volatility
Wtd Index ETF | |
| | | Six-Months Ended
December 31, 2015 | | Period Ended
June 30, 20151 | |
| | | (Unaudited) | | | |
Operations: | |
Net investment income | | $ | 126,144 | | | $ | 98,571 | | |
Net realized gain on investments in securities
and futures | | | 174,488 | | | | 67,272 | | |
Change in unrealized appreciation (depreciation)
of investments in securities and futures | | | (556,901 | ) | | | 275,059 | | |
Net increase (decrease) in net assets resulting
from operations | | $ | (256,269 | ) | | $ | 440,902 | | |
Distributions to Shareholders: | |
From net investment income | | | (110,271 | ) | | | (93,836 | ) | |
From net realized gains | | | (15,411 | ) | | | — | | |
Total Distributions to Shareholders | | | (125,682 | ) | | | (93,836 | ) | |
Capital Share Transactions: | |
Proceeds from shares sold | | | 18,013,815 | | | | 10,609,205 | | |
Cost of shares redeemed | | | (3,568,065 | ) | | | (1,762,000 | ) | |
Net increase in net assets resulting from capital
share transactions (a) | | | 14,445,750 | | | | 8,847,205 | | |
Net increase in net assets | | $ | 14,063,799 | | | $ | 9,194,271 | | |
Net Assets: | |
Beginning of period | | $ | 9,194,271 | | | $ | — | | |
End of period | | $ | 23,258,070 | | | $ | 9,194,271 | | |
Undistributed net investment income | | $ | 20,608 | | | $ | 4,735 | | |
(a) Summary of capital shares transactions is as follows:
| | | Six-Months Ended
December 31, 2015 | | Period Ended
June 30, 20151 | |
| | | Shares | | Shares | |
Shares sold | | | 500,000 | | | | 300,000 | | |
Shares redeemed | | | (100,000 | ) | | | (50,000 | ) | |
Net increase | | | 400,000 | | | | 250,000 | | |
1 Fund commenced operations on July 1, 2014.
See notes to financial statements.
109
Victory Portfolios II | | Statement of Changes in Net Assets | |
| | | Victory CEMP
US Discovery
Enhanced Volatility
Wtd Index ETF | |
| | | Six-Months Ended
December 31, 2015 | | Period Ended
June 30, 20151 | |
| | | (Unaudited) | | | |
Operations: | |
Net investment income | | $ | 166,228 | | | $ | 142,722 | | |
Net realized gain (loss) on investments in securities
and futures | | | (2,008,240 | ) | | | 1,057,363 | | |
Change in unrealized appreciation (depreciation)
of investments in securities and futures | | | (1,153,633 | ) | | | 319,094 | | |
Net increase (decrease) in net assets resulting
from operations | | $ | (2,995,645 | ) | | $ | 1,519,179 | | |
Distributions to Shareholders: | |
From net investment income | | | (176,040 | ) | | | (132,709 | ) | |
Total Distributions to Shareholders | | | (176,040 | ) | | | (132,709 | ) | |
Capital Share Transactions: | |
Proceeds from shares sold | | | 12,686,970 | | | | 31,800,665 | | |
Cost of shares redeemed | | | (7,187,200 | ) | | | (9,649,620 | ) | |
Net increase in net assets resulting from capital
share transactions (a) | | | 5,499,770 | | | | 22,151,045 | | |
Net increase in net assets | | $ | 2,328,085 | | | $ | 23,537,515 | | |
Net Assets: | |
Beginning of period | | $ | 23,537,515 | | | $ | — | | |
End of period | | $ | 25,865,600 | | | $ | 23,537,515 | | |
Undistributed net investment income | | $ | 201 | | | $ | 10,013 | | |
(a) Summary of capital shares transactions is as follows:
| | | Six-Months Ended
December 31, 2015 | | Period Ended
June 30, 20151 | |
| | | Shares | | Shares | |
Shares sold | | | 350,000 | | | | 850,000 | | |
Shares redeemed | | | (200,000 | ) | | | (250,000 | ) | |
Net increase | | | 150,000 | | | | 600,000 | | |
1 Fund commenced operations on August 1, 2014.
See notes to financial statements.
110
Victory Portfolios II | | Statement of Changes in Net Assets | |
| | | Victory CEMP
US 500 Enhanced Volatility
Wtd Index ETF | |
| | | Six-Months Ended
December 31, 2015 | | Period Ended
June 30, 20151 | |
| | | (Unaudited) | | | |
Operations: | |
Net investment income | | $ | 827,026 | | | $ | 651,484 | | |
Net realized gain on investments in securities
and futures | | | 589,020 | | | | 1,319,990 | | |
Change in unrealized appreciation (depreciation)
of investments in securities and futures | | | (3,515,456 | ) | | | 575,808 | | |
Net increase (decrease) in net assets resulting
from operations | | $ | (2,099,410 | ) | | $ | 2,547,282 | | |
Distributions to Shareholders: | |
From net investment income | | | (851,036 | ) | | | (607,150 | ) | |
Total Distributions to Shareholders | | | (851,036 | ) | | | (607,150 | ) | |
Capital Share Transactions: | |
Proceeds from shares sold | | | 59,663,855 | | | | 104,473,400 | | |
Cost of shares redeemed | | | (28,710,310 | ) | | | (20,016,700 | ) | |
Net increase in net assets resulting from capital
share transactions (a) | | | 30,953,545 | | | | 84,456,700 | | |
Net increase in net assets | | $ | 28,003,099 | | | $ | 86,396,832 | | |
Net Assets: | |
Beginning of period | | $ | 86,396,832 | | | $ | — | | |
End of period | | $ | 114,399,931 | | | $ | 86,396,832 | | |
Undistributed net investment income | | $ | 20,324 | | | $ | 44,334 | | |
(a) Summary of capital shares transactions is as follows:
| | | Six-Months Ended
December 31, 2015 | | Period Ended
June 30, 20151 | |
| | | Shares | | Shares | |
Shares sold | | | 1,650,000 | | | | 2,900,000 | | |
Shares redeemed | | | (800,000 | ) | | | (550,000 | ) | |
Net increase | | | 850,000 | | | | 2,350,000 | | |
1 Fund commenced operations on July 1, 2014.
See notes to financial statements.
111
Victory Portfolios II | | Statement of Changes in Net Assets | |
| | | Victory CEMP
Developed
Enhanced Volatility
Wtd Index ETF | |
| | | Six-Months Ended
December 31, 2015 | | Period Ended
June 30, 20151 | |
| | | (Unaudited) | | | |
Operations: | |
Net investment income | | $ | 177,468 | | | $ | 262,230 | | |
Net realized gain (loss) on investments in securities,
futures, and foreign currencies | | | (3,012,349 | ) | | | 2,121 | | |
Change in unrealized depreciation of investments in
securities, futures, and foreign currencies | | | (213,021 | ) | | | (266,994 | ) | |
Net decrease in net assets resulting from operations | | $ | (3,047,902 | ) | | $ | (2,643 | ) | |
Distributions to Shareholders: | |
From net investment income | | | (199,437 | ) | | | (243,379 | ) | |
From net realized gains | | | — | | | | (471 | ) | |
Total Distributions to Shareholders | | | (199,437 | ) | | | (243,850 | ) | |
Capital Share Transactions: | |
Proceeds from shares sold | | | 8,465,135 | | | | 24,879,145 | | |
Transaction Fees | | | 54 | | | | 345 | | |
Net increase in net assets resulting from capital
share transactions (a) | | | 8,465,189 | | | | 24,879,490 | | |
Net increase in net assets | | $ | 5,217,850 | | | $ | 24,632,997 | | |
Net Assets: | |
Beginning of period | | $ | 24,632,997 | | | $ | — | | |
End of period | | $ | 29,850,847 | | | $ | 24,632,997 | | |
Undistributed net investment income (Loss) | | $ | (5,104 | ) | | $ | 16,865 | | |
(a) Summary of capital shares transactions is as follows:
| | | Six-Months Ended
December 31, 2015 | | Period Ended
June 30, 20151 | |
| | | Shares | | Shares | |
Shares sold | | | 250,000 | | | | 700,000 | | |
1 Fund commenced operations on September 30, 2014.
See notes to financial statements.
112
Victory Portfolios II | | Statement of Changes in Net Assets | |
| | | Victory CEMP
US EQ Income
Enhanced Volatility
Wtd Index ETF | |
| | | Six-Months Ended
December 31, 2015 | | Period Ended
June 30, 20151 | |
| | | (Unaudited) | | | |
Operations: | |
Net investment income | | $ | 1,561,705 | | | $ | 1,610,779 | | |
Net realized gain (loss) on investments in securities
and futures | | | (316,341 | ) | | | 1,853,334 | | |
Change in unrealized depreciation of investments in
securities and futures | | | (10,679 | ) | | | (2,953,160 | ) | |
Net increase in net assets resulting from operations | | $ | 1,234,685 | | | $ | 510,953 | | |
Distributions to Shareholders: | |
From net investment income | | | (1,642,992 | ) | | | (1,513,918 | ) | |
Total Distributions to Shareholders | | | (1,642,992 | ) | | | (1,513,918 | ) | |
Capital Share Transactions: | |
Proceeds from shares sold | | | 28,358,155 | | | | 122,352,335 | | |
Cost of shares redeemed | | | (19,125,550 | ) | | | (34,671,595 | ) | |
Net increase in net assets resulting from capital
share transactions (a) | | | 9,232,605 | | | | 87,680,740 | | |
Net increase in net assets | | $ | 8,824,298 | | | $ | 86,677,775 | | |
Net Assets: | |
Beginning of period | | $ | 86,677,775 | | | $ | — | | |
End of period | | $ | 95,502,073 | | | $ | 86,677,775 | | |
Undistributed net investment income | | $ | 15,574 | | | $ | 96,861 | | |
(a) Summary of capital shares transactions is as follows:
| | | Six-Months Ended
December 31, 2015 | | Period Ended
June 30, 20151 | |
| | | Shares | | Shares | |
Shares sold | | | 800,000 | | | | 3,400,000 | | |
Shares redeemed | | | (550,000 | ) | | | (950,000 | ) | |
Net increase | | | 250,000 | | | | 2,450,000 | | |
1 Fund commenced operations on July 1, 2014.
See notes to financial statements.
113
Victory Portfolios II | | Statement of Changes in Net Assets | |
| | | Victory CEMP
US Small Cap
Volatility
Wtd Index ETF | |
| | | Period Ended
December 31, 20151 | |
| | | (Unaudited) | |
Operations: | |
Net investment income | | $ | 35,746 | | |
Net realized gain on investments in securities and futures | | | 16,755 | | |
Change in unrealized depreciation of investments in securities and futures | | | (404,332 | ) | |
Net decrease in net assets resulting from operations | | $ | (351,831 | ) | |
Distributions to Shareholders: | |
From net investment income | | | (35,855 | ) | |
Total Distributions to Shareholders | | | (35,855 | ) | |
Capital Share Transactions: | |
Proceeds from shares sold | | | 11,929,705 | | |
Cost of shares redeemed | | | (1,682,445 | ) | |
Net increase in net assets resulting from capital share transactions (a) | | | 10,247,260 | | |
Net increase in net assets | | $ | 9,859,574 | | |
Net Assets: | |
Beginning of period | | $ | — | | |
End of period | | $ | 9,859,574 | | |
Undistributed net investment loss | | $ | (109 | ) | |
(a) Summary of capital shares transactions is as follows:
| | | Period Ended
December 31, 20151 | |
| | | Shares | |
Shares sold | | | 350,000 | | |
Shares redeemed | | | (50,000 | ) | |
Net increase | | | 300,000 | | |
1 Fund commenced operations on July 8, 2015.
See notes to financial statements.
114
Victory Portfolios II | | Statement of Changes in Net Assets | |
| | | Victory CEMP
International
Volatility
Wtd Index ETF | |
| | | Period Ended
December 31, 20151 | |
| | | (Unaudited) | |
Operations: | |
Net investment income | | $ | 24,310 | | |
Net realized loss on investments in securities, futures,
and foreign currencies | | | (35,546 | ) | |
Change in unrealized depreciation of investments in securities,
futures, and foreign currencies | | | (175,076 | ) | |
Net decrease in net assets resulting from operations | | $ | (186,312 | ) | |
Distributions to Shareholders: | |
From net investment income | | | (33,791 | ) | |
Total Distributions to Shareholders | | | (33,791 | ) | |
Capital Share Transactions: | |
Proceeds from shares sold | | | 10,324,200 | | |
Net increase in net assets resulting from capital share transactions (a) | | | 10,324,200 | | |
Net increase in net assets | | $ | 10,104,097 | | |
Net Assets: | |
Beginning of period | | $ | — | | |
End of period | | $ | 10,104,097 | | |
Undistributed net investment loss | | $ | (9,481 | ) | |
(a) Summary of capital shares transactions is as follows:
| | | Period Ended
December 31, 20151 | |
| | | Shares | |
Shares sold | | | 300,000 | | |
1 Fund commenced operations on August 21, 2015.
See notes to financial statements.
115
Victory Portfolios II | | Statement of Changes in Net Assets | |
| | | Victory CEMP
US Large Cap
High Div Volatility
Wtd Index ETF | |
| | | Period Ended
December 31, 20151 | |
| | | (Unaudited) | |
Operations: | |
Net investment income | | $ | 138,760 | | |
Net realized loss on investments in securities and futures | | | (53,040 | ) | |
Change in unrealized depreciation of investments in securities and futures | | | (161,148 | ) | |
Net decrease in net assets resulting from operations | | $ | (75,428 | ) | |
Distributions to Shareholders: | |
From net investment income | | | (138,706 | ) | |
Total Distributions to Shareholders | | | (138,706 | ) | |
Capital Share Transactions: | |
Proceeds from shares sold | | | 29,483,140 | | |
Net increase in net assets resulting from capital share transactions (a) | | | 29,483,140 | | |
Net increase in net assets | | $ | 29,269,006 | | |
Net Assets: | |
Beginning of period | | $ | — | | |
End of period | | $ | 29,269,006 | | |
Undistributed net investment income | | $ | 54 | | |
(a) Summary of capital shares transactions is as follows:
| | | Period Ended
December 31, 20151 | |
| | | Shares | |
Shares sold | | | 850,000 | | |
1 Fund commenced operations on July 8, 2015.
See notes to financial statements.
116
Victory Portfolios II | | Statement of Changes in Net Assets | |
| | | Victory CEMP
US Small Cap
High Div Volatility
Wtd Index ETF | |
| | | Period Ended
December 31, 20151 | |
| | | (Unaudited) | |
Operations: | |
Net investment income | | $ | 113,234 | | |
Net realized loss on investments in securities and futures | | | (135,833 | ) | |
Change in unrealized depreciation of investments in securities and futures | | | (214,544 | ) | |
Net decrease in net assets resulting from operations | | $ | (237,143 | ) | |
Distributions to Shareholders: | |
From net investment income | | | (113,395 | ) | |
Total Distributions to Shareholders | | | (113,395 | ) | |
Capital Share Transactions: | |
Proceeds from shares sold | | | 11,843,420 | | |
Net increase in net assets resulting from capital share transactions (a) | | | 11,843,420 | | |
Net increase in net assets | | $ | 11,492,882 | | |
Net Assets: | |
Beginning of period | | $ | — | | |
End of period | | $ | 11,492,882 | | |
Undistributed net investment loss | | $ | (161 | ) | |
(a) Summary of capital shares transactions is as follows:
| | | Period Ended
December 31, 20151 | |
| | | Shares | |
Shares sold | | | 350,000 | | |
1 Fund commenced operations on July 8, 2015.
See notes to financial statements.
117
Victory Portfolios II | | Statement of Changes in Net Assets | |
| | | Victory CEMP
International
High Div Volatility
Wtd Index ETF | |
| | | Period Ended
December 31, 20151 | |
| | | (Unaudited) | |
Operations: | |
Net investment income | | $ | 68,394 | | |
Net realized loss on investments in securities, futures,
and foreign currencies | | | (36,709 | ) | |
Change in unrealized depreciation of investments in securities,
futures, and foreign currencies | | | (499,311 | ) | |
Net decrease in net assets resulting from operations | | $ | (467,626 | ) | |
Distributions to Shareholders: | |
From net investment income | | | (76,757 | ) | |
Total Distributions to Shareholders | | | (76,757 | ) | |
Capital Share Transactions: | |
Proceeds from shares sold | | | 15,066,725 | | |
Net increase in net assets resulting from capital share transactions (a) | | | 15,066,725 | | |
Net increase in net assets | | $ | 14,522,342 | | |
Net Assets: | |
Beginning of period | | $ | — | | |
End of period | | $ | 14,522,342 | | |
Undistributed net investment loss | | $ | (8,363 | ) | |
(a) Summary of capital shares transactions is as follows:
| | | Period Ended
December 31, 20151 | |
| | | Shares | |
Shares sold | | | 450,000 | | |
1 Fund commenced operations on August 21, 2015.
See notes to financial statements.
118
Victory Portfolios II | | Financial Highlights | |
For a capital share outstanding throughout the period
| | Victory CEMP
US 500 Volatility
Wtd Index ETF | |
| | | Six-Months
Ended
December 31,
2015 | | Period
Ended
June 30,
20151 | |
| | | (Unaudited) | | | |
Net Asset Value, Beginning of Period | | $ | 36.78 | | | $ | 35.00 | | |
Income from Investment Operations: | |
Net investment income2 | | | 0.29 | | | | 0.49 | | |
Net realized and unrealized gain (loss)
on investments in securities and futures3 | | | (1.04 | ) | | | 1.73 | | |
Total from Investment Operations | | | (0.75 | ) | | | 2.22 | | |
Less Distributions: | |
Distributions from net investment income | | | (0.23 | ) | | | (0.44 | ) | |
Distributions from net realized gain | | | (0.02 | ) | | | — | | |
Total Distributions | | | (0.25 | ) | | | (0.44 | ) | |
Net Asset Value, End of Period | | $ | 35.78 | | | $ | 36.78 | | |
Total Return5 | | | (2.01 | )%4 | | | 6.38 | %4 | |
Supplemental Data: | |
Net assets at end of period (000's) | | $ | 23,258 | | | $ | 9,194 | | |
Ratios of expenses to average net assets: | |
Before fees waived | | | 0.75 | %6 | | | 1.39 | %6 | |
After fees waived | | | 0.35 | %6 | | | 0.54 | %6 | |
Ratios of net investment income to average net assets: | |
Before fees waived | | | 1.18 | %6 | | | 0.52 | %6 | |
After fees waived | | | 1.58 | %6 | | | 1.37 | %6 | |
Portfolio Turnover Rate7 | | | 11 | %4 | | | 23 | %4 | |
1 Commenced operations on July 1, 2014.
2 Calculated based on average shares outstanding during the period.
3 The amounts reported for a share outstanding may not accord with the change in aggregate gains and losses in securities for the fiscal period due to the timing of capital share transactions in relation to the fluctuating market values of the Fund's underlying securities.
4 Not annualized.
5 Total return is calculated assuming an initial investment made at net asset value at the beginning of the period, reinvestment of all dividends and distributions at net asset value during the period, and redemption at net asset value on the last day of the period. Total return calculated for a period of less than one year is not annualized. The total return would have been lower if certain expenses had not been reimbursed/waived by the Adviser.
6 Annualized.
7 Excludes impact of in-kind transactions.
See notes to financial statements.
119
Victory Portfolios II | | Financial Highlights | |
For a capital share outstanding throughout the period
| | Victory CEMP
US Discovery Enhanced Volatility
Wtd Index ETF | |
| | | Six-Months
Ended
December 31,
2015 | | Period
Ended
June 30,
20151 | |
| | | (Unaudited) | | | |
Net Asset Value, Beginning of Period | | $ | 39.23 | | | $ | 35.00 | | |
Income from Investment Operations: | |
Net investment income2 | | | 0.22 | | | | 0.40 | | |
Net realized and unrealized gain (loss) on investments
in securities and futures3 | | | (4.75 | ) | | | 4.16 | | |
Total from Investment Operations | | | (4.53 | ) | | | 4.56 | | |
Less Distributions: | |
Distributions from net investment income | | | (0.21 | ) | | | (0.33 | ) | |
Total Distributions | | | (0.21 | ) | | | (0.33 | ) | |
Net Asset Value, End of Period | | $ | 34.49 | | | $ | 39.23 | | |
Total Return5 | | | (11.56 | )%4 | | | 13.06 | %4 | |
Supplemental Data: | |
Net assets at end of period (000's) | | $ | 25,866 | | | $ | 23,538 | | |
Ratios of expenses to average net assets: | |
Before fees waived | | | 0.62 | %6 | | | 0.59 | %6 | |
After fees waived | | | 0.35 | %6 | | | 1.07 | %6 | |
Ratios of net investment income to average net assets: | |
Before fees waived | | | 0.93 | %6 | | | 0.67 | %6 | |
After fees waived | | | 1.20 | %6 | | | 1.15 | %6 | |
Portfolio Turnover Rate7 | | | 121 | %4 | | | 10 | %4 | |
1 Commenced operations on August 1, 2014.
2 Calculated based on average shares outstanding during the period.
3 The amounts reported for a share outstanding may not accord with the change in aggregate gains and losses in securities for the fiscal period due to the timing of capital share transactions in relation to the fluctuating market values of the Fund's underlying securities.
4 Not annualized.
5 Total return is calculated assuming an initial investment made at net asset value at the beginning of the period, reinvestment of all dividends and distributions at net asset value during the period, and redemption at net asset value on the last day of the period. Total return calculated for a period of less than one year is not annualized. The total return would have been lower if certain expenses had not been reimbursed/waived by the Adviser.
6 Annualized.
7 Excludes impact of in-kind transactions.
See notes to financial statements.
120
Victory Portfolios II | | Financial Highlights | |
For a capital share outstanding throughout the period
| | Victory CEMP
US 500 Enhanced Volatility
Wtd Index ETF | |
| | | Six-Months
Ended
December 31,
2015 | | Period
Ended
June 30,
20151 | |
| | | (Unaudited) | | | |
Net Asset Value, Beginning of Period | | $ | 36.76 | | | $ | 35.00 | | |
Income from Investment Operations: | |
Net investment income2 | | | 0.27 | | | | 0.49 | | |
Net realized and unrealized gain on investments
in securities and futures3 | | | (1.01 | ) | | | 1.65 | | |
Total from Investment Operations | | | (0.74 | ) | | | 2.14 | | |
Less Distributions: | |
Distributions from net investment income | | | (0.27 | ) | | | (0.38 | ) | |
Total Distributions | | | (0.27 | ) | | | (0.38 | ) | |
Net Asset Value, End of Period | | $ | 35.75 | | | $ | 36.76 | | |
Total Return5 | | | (2.01 | )%4 | | | 6.15 | %4 | |
Supplemental Data: | |
Net assets at end of period (000's) | | $ | 114,400 | | | $ | 86,397 | | |
Ratios of expenses to average net assets: | |
Before fees waived | | | 0.52 | %6 | | | 0.81 | %6 | |
After fees waived | | | 0.35 | %6 | | | 0.59 | %6 | |
Ratios of net investment income to average net assets: | |
Before fees waived | | | 1.34 | %6 | | | 1.12 | %6 | |
After fees waived | | | 1.51 | %6 | | | 1.34 | %6 | |
Portfolio Turnover Rate7 | | | 17 | %4 | | | 13 | %4 | |
1 Commenced operations on July 1, 2014.
2 Calculated based on average shares outstanding during the period.
3 The amounts reported for a share outstanding may not accord with the change in aggregate gains and losses in securities for the fiscal period due to the timing of capital share transactions in relation to the fluctuating market values of the Fund's underlying securities.
4 Not annualized.
5 Total return is calculated assuming an initial investment made at net asset value at the beginning of the period, reinvestment of all dividends and distributions at net asset value during the period, and redemption at net asset value on the last day of the period. Total return calculated for a period of less than one year is not annualized. The total return would have been lower if certain expenses had not been reimbursed/waived by the Adviser.
6 Annualized.
7 Excludes impact of in-kind transactions.
See notes to financial statements.
121
Victory Portfolios II | | Financial Highlights | |
For a capital share outstanding throughout the period
| | Victory CEMP
Developed Enhanced Volatility
Wtd Index ETF | |
| | | Six-Months
Ended
December 31,
2015 | | Period
Ended
June 30,
20151 | |
| | | (Unaudited) | | | |
Net Asset Value, Beginning of Period | | $ | 35.19 | | | $ | 35.00 | | |
Income from Investment Operations: | |
Net investment income2 | | | 0.20 | | | | 0.80 | | |
Net realized and unrealized loss on investments
in securities and futures3 | | | (3.75 | ) | | | (0.18 | ) | |
Total from Investment Operations | | | (3.55 | ) | | | 0.62 | | |
Less Distributions: | |
Distributions from net investment income | | | (0.22 | ) | | | (0.42 | ) | |
Distributions from net realized gain | | | — | | | | (0.01 | ) | |
Total Distributions | | | (0.22 | ) | | | (0.43 | ) | |
Net Asset Value, End of Period | | $ | 31.42 | | | $ | 35.19 | | |
Total Return5 | | | (10.08 | )%4 | | | 1.77 | %4 | |
Supplemental Data: | |
Net assets at end of period (000's) | | $ | 29,851 | | | $ | 24,633 | | |
Ratios of expenses to average net assets: | |
Before fees waived | | | 0.99 | %6 | | | 1.58 | %6 | |
After fees waived | | | 0.45 | %6 | | | 0.63 | %6 | |
Ratios of net investment income to average net assets: | |
Before fees waived | | | 0.69 | %6 | | | 2.04 | %6 | |
After fees waived | | | 1.23 | %6 | | | 2.99 | %6 | |
Portfolio Turnover Rate7 | | | 108 | %4 | | | 31 | %4 | |
1 Commenced operations on September 30, 2014.
2 Calculated based on average shares outstanding during the period.
3 The amounts reported for a share outstanding may not accord with the change in aggregate gains and losses in securities for the fiscal period due to the timing of capital share transactions in relation to the fluctuating market values of the Fund's underlying securities.
4 Not annualized.
5 Total return is calculated assuming an initial investment made at net asset value at the beginning of the period, reinvestment of all dividends and distributions at net asset value during the period, and redemption at net asset value on the last day of the period. Total return calculated for a period of less than one year is not annualized. The total return would have been lower if certain expenses had not been reimbursed/waived by the Adviser.
6 Annualized.
7 Excludes impact of in-kind transactions.
See notes to financial statements.
122
Victory Portfolios II | | Financial Highlights | |
For a capital share outstanding throughout the period
| | Victory CEMP
US EQ Income Enhanced Volatility
Wtd Index ETF | |
| | | Six-Months
Ended
December 31,
2015 | | Period
Ended
June 30,
20151 | |
| | | (Unaudited) | | | |
Net Asset Value, Beginning of Period | | $ | 35.38 | | | $ | 35.00 | | |
Income from Investment Operations: | |
Net investment income2 | | | 0.59 | | | | 1.12 | | |
Net realized and unrealized gain on investments
in securities and futures3 | | | 0.02 | | | | 0.20 | | |
Total from Investment Operations | | | 0.61 | | | | 1.32 | | |
Less Distributions: | |
Distributions from net investment income | | | (0.62 | ) | | | (0.94 | ) | |
Total Distributions | | | (0.62 | ) | | | (0.94 | ) | |
Net Asset Value, End of Period | | $ | 35.37 | | | $ | 35.38 | | |
Total Return5 | | | 1.75 | %4 | | | 3.77 | %4 | |
Supplemental Data: | |
Net assets at end of period (000's) | | $ | 95,502 | | | $ | 86,678 | | |
Ratios of expenses to average net assets: | |
Before fees waived | | | 0.53 | %6 | | | 0.77 | %6 | |
After fees waived | | | 0.35 | %6 | | | 0.59 | %6 | |
Ratios of net investment income to average net assets: | |
Before fees waived | | | 3.31 | %6 | | | 2.91 | %6 | |
After fees waived | | | 3.13 | %6 | | | 3.09 | %6 | |
Portfolio Turnover Rate7 | | | 25 | %4 | | | 17 | %4 | |
1 Commenced operations on July 1, 2014.
2 Calculated based on average shares outstanding during the period.
3 The amounts reported for a share outstanding may not accord with the change in aggregate gains and losses in securities for the fiscal period due to the timing of capital share transactions in relation to the fluctuating market values of the Fund's underlying securities.
4 Not annualized.
5 Total return is calculated assuming an initial investment made at net asset value at the beginning of the period, reinvestment of all dividends and distributions at net asset value during the period, and redemption at net asset value on the last day of the period. Total return calculated for a period of less than one year is not annualized. The total return would have been lower if certain expenses had not been reimbursed/waived by the Adviser.
6 Annualized.
7 Excludes impact of in-kind transactions.
See notes to financial statements.
123
Victory Portfolios II | | Financial Highlights | |
For a capital share outstanding throughout the period
| | | Victory CEMP
US Small Cap
Volatility
Wtd Index ETF | |
| | | Period Ended
December 31, 20151 | |
| | | (Unaudited) | |
Net Asset Value, Beginning of Period | | $ | 35.00 | | |
Income from Investment Operations: | |
Net investment income2 | | | 0.25 | | |
Net realized and unrealized loss on investments in securities and futures3 | | | (2.21 | ) | |
Total from Investment Operations | | | (1.96 | ) | |
Less Distributions: | |
Distributions from net investment income | | | (0.17 | ) | |
Total Distributions | | | (0.17 | ) | |
Net Asset Value, End of Period | | $ | 32.87 | | |
Total Return5 | | | (5.62 | )%4 | |
Supplemental Data: | |
Net assets at end of period (000's) | | $ | 9,860 | | |
Ratios of expenses to average net assets: | |
Before fees waived | | | 1.56 | %6 | |
After fees waived | | | 0.35 | %6 | |
Ratios of net investment income to average net assets: | |
Before fees waived | | | 0.32 | %6 | |
After fees waived | | | 1.53 | %6 | |
Portfolio Turnover Rate7 | | | 19 | %4 | |
1 Commenced operations on July 8, 2015.
2 Calculated based on average shares outstanding during the period.
3 The amounts reported for a share outstanding may not accord with the change in aggregate gains and losses in securities for the fiscal period due to the timing of capital share transactions in relation to the fluctuating market values of the Fund's underlying securities.
4 Not annualized.
5 Total return is calculated assuming an initial investment made at net asset value at the beginning of the period, reinvestment of all dividends and distributions at net asset value during the period, and redemption at net asset value on the last day of the period. Total return calculated for a period of less than one year is not annualized. The total return would have been lower if certain expenses had not been reimbursed/waived by the Adviser.
6 Annualized.
7 Excludes impact of in-kind transactions.
See notes to financial statements.
124
Victory Portfolios II | | Financial Highlights | |
For a capital share outstanding throughout the period
| | | Victory CEMP
International
Volatility
Wtd Index ETF | |
| | | Period Ended
December 31, 20151 | |
| | | (Unaudited) | |
Net Asset Value, Beginning of Period | | $ | 35.00 | | |
Income from Investment Operations: | |
Net investment income2 | | | 0.16 | | |
Net realized and unrealized loss on investments in securities and futures3 | | | (1.33 | ) | |
Total from Investment Operations | | | (1.17 | ) | |
Less Distributions: | |
Distributions from net investment income | | | (0.15 | ) | |
Total Distributions | | | (0.15 | ) | |
Net Asset Value, End of Period | | $ | 33.68 | | |
Total Return5 | | | (3.35 | )%4 | |
Supplemental Data: | |
Net assets at end of period (000's) | | $ | 10,104 | | |
Ratios of expenses to average net assets: | |
Before fees waived | | | 2.41 | %6 | |
After fees waived | | | 0.45 | %6 | |
Ratios of net investment income to average net assets: | |
Before fees waived | | | (0.67 | )%6 | |
After fees waived | | | 1.29 | %6 | |
Portfolio Turnover Rate7 | | | 14 | %4 | |
1 Commenced operations on August 21, 2015.
2 Calculated based on average shares outstanding during the period.
3 The amounts reported for a share outstanding may not accord with the change in aggregate gains and losses in securities for the fiscal period due to the timing of capital share transactions in relation to the fluctuating market values of the Fund's underlying securities.
4 Not annualized.
5 Total return is calculated assuming an initial investment made at net asset value at the beginning of the period, reinvestment of all dividends and distributions at net asset value during the period, and redemption at net asset value on the last day of the period. Total return calculated for a period of less than one year is not annualized. The total return would have been lower if certain expenses had not been reimbursed/waived by the Adviser.
6 Annualized.
7 Excludes impact of in-kind transactions.
See notes to financial statements.
125
Victory Portfolios II | | Financial Highlights | |
For a capital share outstanding throughout the period
| | | Victory CEMP
US Large Cap
High Div Volatility
Wtd Index ETF | |
| | | Period Ended
December 31, 20151 | |
| | | (Unaudited) | |
Net Asset Value, Beginning of Period | | $ | 35.00 | | |
Income from Investment Operations: | |
Net investment income2 | | | 0.65 | | |
Net realized and unrealized loss on investments in securities and futures3 | | | (0.78 | ) | |
Total from Investment Operations | | | (0.13 | ) | |
Less Distributions: | |
Distributions from net investment income | | | (0.44 | ) | |
Total Distributions | | | (0.44 | ) | |
Net Asset Value, End of Period | | $ | 34.43 | | |
Total Return5 | | | (0.37 | )%4 | |
Supplemental Data: | |
Net assets at end of period (000's) | | $ | 29,269 | | |
Ratios of expenses to average net assets: | |
Before fees waived | | | 0.97 | %6 | |
After fees waived | | | 0.35 | %6 | |
Ratios of net investment income to average net assets: | |
Before fees waived | | | 3.88 | %6 | |
After fees waived | | | 3.26 | %6 | |
Portfolio Turnover Rate7 | | | 13 | %4 | |
1 Commenced operations on July 8, 2015.
2 Calculated based on average shares outstanding during the period.
3 The amounts reported for a share outstanding may not accord with the change in aggregate gains and losses in securities for the fiscal period due to the timing of capital share transactions in relation to the fluctuating market values of the Fund's underlying securities.
4 Not annualized.
5 Total return is calculated assuming an initial investment made at net asset value at the beginning of the period, reinvestment of all dividends and distributions at net asset value during the period, and redemption at net asset value on the last day of the period. Total return calculated for a period of less than one year is not annualized. The total return would have been lower if certain expenses had not been reimbursed/waived by the Adviser.
6 Annualized.
7 Excludes impact of in-kind transactions.
See notes to financial statements.
126
Victory Portfolios II | | Financial Highlights | |
For a capital share outstanding throughout the period
| | | Victory CEMP
US Small Cap
High Div Volatility
Wtd Index ETF | |
| | | Period Ended
December 31, 20151 | |
| | | (Unaudited) | |
Net Asset Value, Beginning of Period | | $ | 35.00 | | |
Income from Investment Operations: | |
Net investment income2 | | | 0.70 | | |
Net realized and unrealized loss on investments in securities and futures3 | | | (2.34 | ) | |
Total from Investment Operations | | | (1.64 | ) | |
Less Distributions: | |
Distributions from net investment income | | | (0.52 | ) | |
Total Distributions | | | (0.52 | ) | |
Net Asset Value, End of Period | | $ | 32.84 | | |
Total Return5 | | | (4.72 | )%4 | |
Supplemental Data: | |
Net assets at end of period (000's) | | $ | 11,493 | | |
Ratios of expenses to average net assets: | |
Before fees waived | | | 1.18 | %6 | |
After fees waived | | | 0.35 | %6 | |
Ratios of net investment income to average net assets: | |
Before fees waived | | | 4.32 | %6 | |
After fees waived | | | 3.49 | %6 | |
Portfolio Turnover Rate7 | | | 32 | %4 | |
1 Commenced operations on July 8, 2015.
2 Calculated based on average shares outstanding during the period.
3 The amounts reported for a share outstanding may not accord with the change in aggregate gains and losses in securities for the fiscal period due to the timing of capital share transactions in relation to the fluctuating market values of the Fund's underlying securities.
4 Not annualized.
5 Total return is calculated assuming an initial investment made at net asset value at the beginning of the period, reinvestment of all dividends and distributions at net asset value during the period, and redemption at net asset value on the last day of the period. Total return calculated for a period of less than one year is not annualized. The total return would have been lower if certain expenses had not been reimbursed/waived by the Adviser.
6 Annualized.
7 Excludes impact of in-kind transactions.
See notes to financial statements.
127
Victory Portfolios II | | Financial Highlights | |
For a capital share outstanding throughout the period
| | | Victory CEMP
International
Volatility
Wtd Index ETF | |
| | | Period Ended
December 31, 20151 | |
| | | (Unaudited) | |
Net Asset Value, Beginning of Period | | $ | 35.00 | | |
Income from Investment Operations: | |
Net investment income2 | | | 0.36 | | |
Net realized and unrealized loss on investments in securities and futures3 | | | (2.75 | ) | |
Total from Investment Operations | | | (2.39 | ) | |
Less Distributions: | |
Distributions from net investment income | | | (0.34 | ) | |
Total Distributions | | | (0.34 | ) | |
Net Asset Value, End of Period | | $ | 32.27 | | |
Total Return5 | | | (6.82 | )%4 | |
Supplemental Data: | |
Net assets at end of period (000's) | | $ | 14,522 | | |
Ratios of expenses to average net assets: | |
Before fees waived | | | 1.52 | %6 | |
After fees waived | | | 0.45 | %6 | |
Ratios of net investment income to average net assets: | |
Before fees waived | | | 1.89 | %6 | |
After fees waived | | | 2.96 | %6 | |
Portfolio Turnover Rate7 | | | 13 | %4 | |
1 Commenced operations on August 21, 2015.
2 Calculated based on average shares outstanding during the period.
3 The amounts reported for a share outstanding may not accord with the change in aggregate gains and losses in securities for the fiscal period due to the timing of capital share transactions in relation to the fluctuating market values of the Fund's underlying securities.
4 Not annualized.
5 Total return is calculated assuming an initial investment made at net asset value at the beginning of the period, reinvestment of all dividends and distributions at net asset value during the period, and redemption at net asset value on the last day of the period. Total return calculated for a period of less than one year is not annualized. The total return would have been lower if certain expenses had not been reimbursed/waived by the Adviser.
6 Annualized.
7 Excludes impact of in-kind transactions.
See notes to financial statements.
128
Victory Portfolios II | | Notes to Financial Statements
December 31, 2015 | |
(Unaudited)
1. Organization:
Victory Portfolios II Trust (formerly Compass EMP Funds Trust) (the "Trust"), was organized on April 11, 2012 as a Delaware statutory trust (formerly a Delaware business trust). The Trust is registered under the Investment Company Act of 1940, as amended (the "1940 Act"), as an open-end investment company and thus follows accounting and reporting guidance for investment companies.
The Trust is authorized to issue an unlimited number of shares, which are units of beneficial interest with no par value. As of December 31, 2015, the Trust offered shares of 26 funds (each a "Fund" and collectively, the "Funds"). Each Fund is classified as diversified under the 1940 Act.
Funds | | Diversification
Classification | |
Victory CEMP US 500 Volatility Wtd Index ETF | | Diversified | |
Victory CEMP US Discovery Enhanced Volatility Wtd Index ETF | | Diversified | |
Victory CEMP US 500 Enhanced Volatility Wtd Index ETF | | Diversified | |
Victory CEMP Developed Enhanced Volatility Wtd Index ETF | | Diversified | |
Victory CEMP US EQ Income Enhanced Volatility Wtd Index ETF | | Diversified | |
Victory CEMP US Small Cap Volatility Wtd Index ETF | | Diversified | |
Victory CEMP International Volatility Wtd Index ETF | | Diversified | |
Victory CEMP US Large Cap High Div Volatility Wtd Index ETF | | Diversified | |
Victory CEMP US Small Cap High Div Volatility Wtd Index ETF | | Diversified | |
Victory CEMP International High Div Volatility Wtd Index ETF | | Diversified | |
The following Funds commenced operations on July 1, 2014 and their objectives are as follows:
Victory CEMP US 500 Volatility Wtd Index ETF — seeks to match the performance of the CEMP US Large Cap 500 Volatility Weighted Index before fees and expenses.
Victory CEMP US 500 Enhanced Volatility Wtd Index ETF — seeks to match the performance of the CEMP US Large Cap 500 Long/Cash Volatility Weighted Index before fees and expenses.
Victory CEMP US EQ Income Enhanced Volatility Wtd Index ETF — seeks to match the performance of the CEMP US Large Cap High Dividend 100 Long/Cash Volatility Weighted Index before fees and expenses.
The following Fund commenced operations on August 1, 2014 and its objective is as follows:
Victory CEMP US Discovery Enhanced Volatility Wtd Index ETF — seeks to match the performance of the CEMP US Small Cap 500 Long/Cash Volatility Weighted Index before fees and expenses.
The following Fund commenced operations on September 30, 2014 and its objective is as follows:
Victory CEMP Developed Enhanced Volatility Wtd Index ETF — seeks to match the performance of the CEMP International 500 Long/Cash Volatility Weighted Index before fees and expenses.
The following Funds commenced operations on July 8, 2015 and their objectives are as follows:
Victory CEMP US Small Cap Volatility Wtd Index ETF — seeks to match the performance of the CEMP US Small Cap 500 Volatility Weighted Index before fees and expenses.
Victory CEMP US Large Cap High Div Volatility Wtd Index ETF — seeks to match the performance of the CEMP US Large Cap High Dividend 100 Volatility Weighted Index before fees and expenses.
Victory CEMP US Small Cap High Div Volatility Wtd Index ETF — seeks to match the performance of the CEMP US Small Cap High Dividend 100 Volatility Weighted Index before fees and expenses.
The following Funds commenced operations on August 21, 2015 and their objectives are as follows:
Victory CEMP International Volatility Wtd Index ETF — seeks to match the performance of the CEMP International 500 Volatility Weighted Index before fees and expenses.
Victory CEMP International High Div Volatility Wtd Index ETF — seeks to match the performance of the CEMP International High Dividend 100 Volatility Weighted Index before fees and expenses.
129
Victory Portfolios II | | Notes to Financial Statements — continued
December 31, 2015 | |
(Unaudited)
Under the Trust's organizational documents, its officers and trustees are indemnified against certain liabilities arising out of the performance of their duties to the Trust. In addition, in the normal course of business, the Trust enters into contracts with its vendors and others that provide for general indemnifications. The Trust and Funds' maximum exposure under these arrangements is unknown, as this would involve future claims that may be made against the Funds. However, based on experience, the Funds expect that risk of loss to be remote.
2. Significant Accounting Policies:
Shares of the Funds are listed and traded on NASDAQ Stock Market, LLC ("Exchange"). The Funds will issue and redeem shares of a Fund ("Shares") at net asset value ("NAV") only in aggregations of 50,000 Shares (each a "Creation Unit"). The Funds will issue and redeem Creation Units principally in exchange for a basket of securities included in the respective Fund's Index (the "Deposit Securities"), together with the deposit of a specified cash payment (the "Cash Component"), plus a transaction fee. Shares will trade on the Exchange at market prices that may be below, at, or above NAV. Shares of a fund may only be purchased or redeemed by certain financial institutions ("Authorized Participants"). An Authorized Participant is either (i) a broker-dealer or other participant in the clearing process through the Continuous Net Settlement System of the National Securities Clearing Corporation or (ii) a DTC participant and, in each case, must have executed a Participant Agreement with the Distributor. Most retail investors do not qualify as Authorized Participants nor have the resources to buy and sell whole Creation Units. Therefore, they are unable to purchase or redeem the shares directly from a fund. In addition, shares may be issued in advance of receipt of Deposit Securities subject to various conditions, including a requirement to maintain on deposit with the Trust cash equal to up to 105% of the market value of the missing Deposit Securities. In each instance of such cash creations or redemptions, transaction fees may be imposed and may be higher than the transaction fees associated with in-kind creations or redemptions.
Each Fund may issue an unlimited number of shares of beneficial interest, with no par value. Shares of each Fund have equal rights and privileges.
The following is a summary of significant accounting policies followed by each Fund in the preparation of its financial statements. These policies are in conformity with accounting principles generally accepted in the United States of America ("GAAP"). The preparation of financial statements requires management to make estimates and assumptions that affect the reported amounts of assets and liabilities and disclosure of contingent assets and liabilities at the date of the financial statements and the reported amounts of income and expenses for the period. Actual results could differ from those estimates. The Funds follow the specialized accounting and reporting requirements under GAAP that are applicable to investment companies.
Securities Valuation:
The net asset values per share of the Funds are determined as of the close of regular trading on the New York Stock Exchange ("NYSE") (normally 4:00 p.m., Eastern Time) on each day when the NYSE is open for trading. Securities for which market quotations are available are valued as follows: (a) each listed security is valued at its closing price obtained from the respective primary exchange on which the security is listed, or, if there were no sales on that day, at its last reported current mean price; (b) each unlisted security is valued at the last current bid price obtained from the NASDAQ System; (c) United States Government and Agency obligations are valued based upon bid quotations from the Federal Reserve Bank for identical or similar obligations; (d) short-term money market instruments (such as certificates of deposit, bankers' acceptances and commercial paper) are most often valued by bid quotations or by reference to bid quotations of available yields for similar instruments of issuers with similar credit ratings. All these prices are obtained from services, which collect and disseminate such market prices. Bid quotations for short-term money market instruments reported by such a service are the bid quotations reported to it by the major dealers. Short-term securities with remaining maturities of sixty days or less for which market quotations and information pricing services are not readily available are valued either at amortized cost or at original cost plus accrued interest, both of which approximate current value. When approved by
130
Victory Portfolios II | | Notes to Financial Statements — continued
December 31, 2015 | |
(Unaudited)
the Trustees, certain securities may be valued on the basis of valuations provided by an independent pricing service when such prices the Trustees believe reflect the fair value of such securities. In the absence of an ascertainable market value, or if an event occurs after the close of trading on the domestic or foreign exchange or market on which the security is principally traded (prior to the time the NAV is calculated) that materially affects fair value, assets are valued at their fair value as determined by the Adviser using methods and procedures reviewed and approved by the Trustees. Options contracts listed on a securities exchange or board of trade for which market quotations are readily available shall be valued at the last quoted sales price or, in the absence of a sale, at the mean between the current bid and ask prices on the day of valuation.
In accordance with the Trust's good faith pricing guidelines, the Adviser is required to consider all appropriate factors relevant to the value of securities for which it has determined other pricing sources are not available or reliable. No single standard for determining fair value exists, since fair value depends upon the circumstances of each individual case. As a general principle, the current fair value of securities being valued by the Adviser would appear to be the amount which the owner might reasonably expect to receive for them upon their current sale. Methods which are in accord with this principle may, for example, be based on (i) a multiple of earnings; (ii) a discount from market of a similar freely traded security (including a derivative security or a basket of securities traded on other markets, exchanges or among dealers); or (iii) yield to maturity with respect to debt issues, or a combination of these and other methods.
Trading in securities on Far Eastern securities exchanges and over-the-counter markets is normally completed well before the close of business on each business day in New York (i.e., a day on which the NYSE is open). In addition, Far Eastern securities trading generally or in a particular country or countries may not take place on all business days in New York. Furthermore, trading takes place in Japanese markets on certain Saturdays in various foreign markets on days, which are not business days in New York, and on which a Fund's net asset value is not calculated. Each Fund calculates net asset value per share, and therefore effects sales, redemptions and repurchases of its shares, as of the close of regular trading on the NYSE once on each day on which the NYSE is open. Such calculation may not take place contemporaneously with the determination of the prices of the majority of the portfolio securities used in such calculation. Futures are valued at the settlement price established each day by the board of exchange on which they are traded. The daily settlement prices for financial futures are provided by an independent source. On days when there is excessive volume or market volatility, the settlement price may not be available at the time at which a Fund calculates its NAV. On such days, the best available price (which is typically the last sales price) may be used to value the Fund's futures position, in which case the Fund will not consider any difference between the eventual settlement price and the best available price used to be a basis for determining that an incorrect NAV calculation has occurred.
Other securities and assets for which market quotations are not readily available or for which valuation cannot be provided are valued as determined in good faith in accordance with procedures approved by the Board of Trustees of the Trust.
In accordance with the authoritative guidance on fair value measurements and disclosure under GAAP, the Funds disclose fair value of their investments in a hierarchy that prioritizes the inputs to valuation techniques used to measure fair value. The objective of a fair value measurement is to determine the price that would be received to sell an asset or paid to transfer a liability in an orderly transaction between market participants at the measurement date (an exit price). Accordingly, the fair value hierarchy gives the highest priority to quoted prices (unadjusted) in active markets for identical assets or liabilities (Level 1) and the lowest priority to unobservable inputs (Level 3). The three levels of the fair value hierarchy under GAAP are described below:
• Level 1 — quoted prices in active markets for identical securities
• Level 2 — other significant observable inputs (including quoted prices for similar securities and identical securities in inactive markets, interest rates, amortized cost, credit risk, etc.)
• Level 3 — significant unobservable inputs (including the Funds' own assumptions in determining the fair value of investments)
131
Victory Portfolios II | | Notes to Financial Statements — continued
December 31, 2015 | |
(Unaudited)
The inputs or methodology used for valuing securities are not necessarily an indication of the risk associated with investing in those securities.
The following is a summary of the valuation inputs, representing 100% of the Funds' investments, used to value the Funds' assets and liabilities as of December 31, 2015:
Description^ | | Level 1 | | Level 2 | | Level 3 | | Total | |
Victory CEMP US 500 Volatility Wtd Index ETF | |
Common Stocks* | | $ | 23,183,579 | | | $ | — | | | $ | — | | | $ | 23,183,579 | | |
Short-Term Investments | | | 77,649 | | | | — | | | | — | | | | 77,649 | | |
Total | | $ | 23,261,228 | | | $ | — | | | $ | — | | | $ | 23,261,228 | | |
Other Financial Instruments^ | |
Futures | | $ | (445 | ) | | $ | — | | | $ | — | | | $ | (445 | ) | |
Victory CEMP US Discovery Enhanced Volatility Wtd Index ETF | |
Common Stocks* | | $ | 25,690,327 | | | $ | — | | | $ | — | | | $ | 25,690,327 | | |
Short-Term Investments | | | 124,854 | | | | — | | | | — | | | | 124,854 | | |
Total | | $ | 25,815,181 | | | $ | — | | | $ | — | | | $ | 25,815,181 | | |
Other Financial Instruments^ | |
Futures | | $ | (574 | ) | | $ | — | | | $ | — | | | $ | (574 | ) | |
Victory CEMP US 500 Enhanced Volatility Wtd Index ETF | |
Common Stocks* | | $ | 113,942,486 | | | $ | — | | | $ | — | | | $ | 113,942,486 | | |
Short-Term Investments | | | 372,147 | | | | — | | | | — | | | | 372,147 | | |
Total | | $ | 114,314,633 | | | $ | — | | | $ | — | | | $ | 114,314,633 | | |
Other Financial Instruments^ | |
Futures | | $ | 1,823 | | | $ | — | | | $ | — | | | $ | 1,823 | | |
Victory CEMP Developed Enhanced Volatility Wtd Index ETF | |
Common Stocks* | | $ | 29,438,203 | | | $ | — | | | $ | 570 | | | $ | 29,438,773 | | |
Short-Term Investments | | | 336,794 | | | | — | | | | — | | | | 336,794 | | |
Total | | $ | 29,774,997 | | | $ | — | | | $ | 570 | | | $ | 29,775,567 | | |
Other Financial Instruments^ | |
Futures | | $ | 105 | | | $ | — | | | $ | — | | | $ | 105 | | |
Victory CEMP US EQ Income Enhanced Volatility Wtd Index ETF | |
Common Stocks* | | $ | 95,066,100 | | | $ | — | | | $ | — | | | $ | 95,066,100 | | |
Short-Term Investments | | | 160,334 | | | | — | | | | — | | | | 160,334 | | |
Total | | $ | 95,226,434 | | | $ | — | | | $ | — | | | $ | 95,226,434 | | |
Other Financial Instruments^ | |
Futures | | $ | 1,337 | | | $ | — | | | $ | — | | | $ | 1,337 | | |
Victory CEMP US Small Cap Volatility Wtd Index ETF | |
Common Stocks* | | $ | 9,814,943 | | | $ | — | | | $ | — | | | $ | 9,814,943 | | |
Short-Term Investments | | | 54,419 | | | | — | | | | — | | | | 54,419 | | |
Total | | $ | 9,869,362 | | | $ | — | | | $ | — | | | $ | 9,869,362 | | |
Victory CEMP International Volatility Wtd Index ETF | |
Common Stocks* | | $ | 10,021,549 | | | $ | — | | | $ | — | | | $ | 10,021,549 | | |
Short-Term Investments | | | 60,697 | | | | — | | | | — | | | | 60,697 | | |
Total | | $ | 10,082,246 | | | $ | — | | | $ | — | | | $ | 10,082,246 | | |
Other Financial Instruments^ | |
Futures | | $ | 21 | | | $ | — | | | $ | — | | | $ | 21 | | |
132
Victory Portfolios II | | Notes to Financial Statements — continued
December 31, 2015 | |
(Unaudited)
Description^ | | Level 1 | | Level 2 | | Level 3 | | Total | |
Victory CEMP US Large Cap High Div Volatility Wtd Index ETF | |
Common Stocks* | | $ | 29,185,923 | | | $ | — | | | $ | — | | | $ | 29,185,923 | | |
Short-Term Investments | | | 98,072 | | | | — | | | | — | | | | 98,072 | | |
Total | | $ | 29,283,995 | | | $ | — | | | $ | — | | | $ | 29,283,995 | | |
Other Financial Instruments^ | |
Futures | | $ | 1,977 | | | $ | — | | | $ | — | | | $ | 1,977 | | |
Victory CEMP US Small Cap High Div Volatility Wtd Index ETF | |
Common Stocks* | | $ | 11,432,155 | | | $ | — | | | $ | — | | | $ | 11,432,155 | | |
Short-Term Investments | | | 36,137 | | | | — | | | | — | | | | 36,137 | | |
Total | | $ | 11,468,292 | | | $ | — | | | $ | — | | | $ | 11,468,292 | | |
Victory CEMP International High Div Volatility Wtd Index ETF | |
Common Stocks* | | $ | 14,497,464 | | | $ | — | | | $ | — | | | $ | 14,497,464 | | |
Short-Term Investments | | | 48,385 | | | | — | | | | — | | | | 48,385 | | |
Total | | $ | 14,545,849 | | | $ | — | | | $ | — | | | $ | 14,545,849 | | |
* Please refer to the Schedules of Investments for industry classifications.
^ Other Financial instruments are derivative instruments not reflected in the Schedule of Investments, such as futures. These instruments are reflected at the unrealized appreciation (depreciation) on the instrument.
For the period ended December 31, 2015, there were no transfers into or out of Level 1, 2, or 3 during the current period presented. It is the Funds' policy to record transfers into or out of Fair Value Levels at the end of the period.
The following is a reconciliation of investments in which significant unobservable inputs (Level 3) were used in determining fair value:
Victory CEMP
Developed
Enhanced
Volatility Wtd
Index ETF | | Balance
as of
06/30/2015 | | Net
Realized
Gain
(Loss) | | Change in
Net
Unrealized
Appreciation
(Depreciation) | | Purchases | | Sales | | Transfers
Into
Level 3 | | Transfers
Out of
Level 3 | | Balance
as of
12/31/2015 | | Net
Change in
Unrealized
Depreciation
on securities
held at
12/31/2015 | |
Common Stocks | | $ | 6,138 | | | $ | — | | | $ | (20,976 | ) | | $ | — | | | $ | — | | | $ | — | | | $ | — | | | $ | 570 | | | $ | (20,976 | ) | |
The following is a summary of quantitative information about Level 3 Fair Value Measurements:
Victory CEMP
Developed
Enhanced
Volatility Wtd
Index ETF | | Fair Value
as of
12/31/2015* | | Valuation
Techniques | | Unobservable
Input | | Input Values | | Impact to valuation from an increase to input | |
Common Stocks
| | $ | 570
| | | Market
Comparables
| | U.S. OTC
Equivalent
| | $ | 0.17 - $1.83
| | | Significant changes in the U.S. OTC
equivalent quotes would result in direct
and proportional changes in the fair value
of the security | |
* Level 3 securities are typically valued by the Adviser. The appropriateness of fair values for these securities is monitored on an ongoing basis, by the Adviser, which may include back testing, results of vendor due diligence, unchanged price review and consideration of market and/or sector events.
133
Victory Portfolios II | | Notes to Financial Statements — continued
December 31, 2015 | |
(Unaudited)
Foreign Currency:
Investment securities and other assets and liabilities denominated in foreign currencies are translated into U.S. dollar amounts at the date of valuation. Purchases and sales of investment securities and income and expense items denominated in foreign currencies are translated into U.S. dollar amounts on the respective dates of such transactions.
The Funds do not isolate that portion of the results of operations resulting from changes in foreign exchange rates on investments from the fluctuations arising from changes in market prices of securities held. Such fluctuations are included with the net realized and unrealized gain or loss from investments.
The Funds report net realized foreign exchange gains or losses that arise from sales of foreign currencies, currency gains or losses realized between the trade and settlement dates on securities transactions, and the difference between the amounts of dividends, interest, and foreign withholding taxes recorded on the Funds' books and the U.S. dollar equivalent of the amounts actually received or paid. Net unrealized foreign gains and losses arise from changes in the fair values of assets and liabilities, other than investments in securities at fiscal period end, resulting from changes in exchange rates.
Futures Contracts:
Each Fund may invest in futures contracts to hedge or manage risks associated with the Funds' securities investments or to gain exposure to certain asset classes or markets. As required by the 1940 Act, the Funds may purchase or sell futures contracts only if the Funds' liabilities for the futures position are "covered" by an offsetting position in a futures contract or by the Funds segregating liquid assets equal to the Funds' liabilities on the futures contract. Upon entering into a financial futures contract, a Fund is required to pledge to the broker an amount of cash, U.S. government securities or other assets, equal to a certain percentage of the contract amount (initial margin deposit). Subsequent payments, known as "variation margin," are made or received by the Funds on a daily basis. The Funds record an unrealized gain or loss by marking each futures contract to market. A realized gain or loss is recorded when the contract is closed. Should market conditions move unexpectedly, the Funds may not achieve the anticipated benefits of the financial futures contracts and may realize a loss. The use of futures transactions involves the risk of imperfect correlation in movements in the price of futures contracts, interest rates and the underlying assets. Futures contracts may have off-balance sheet risk. Off-balance sheet risk exists when the maximum potential loss on a particular financial instrument is greater than the value of such financial instrument, as reflected in the Statements of Assets and Liabilities.
Positions in futures contracts may be closed out only on an exchange that provides a secondary market for such futures. However, there can be no assurance that a liquid secondary market will exist for any particular futures contract at any specific time. Thus, it may not be possible to close a futures position. In the event of adverse price movements, the Funds may be required to make cash payments to maintain their required margin. In such situations, if the Funds had insufficient cash, they might have to sell portfolio securities to meet margin requirements at a time when it would be disadvantageous to do so. In addition, the Funds might be required to make delivery of the underlying instruments of futures contracts they hold. The inability to close positions in futures could also have an adverse impact on the Funds' ability to hedge or manage risks effectively.
Successful use of futures by the Funds is also subject to the Adviser's ability to predict movements correctly in the direction of the market. There is typically an imperfect correlation between movements in the price of the future and movements in the price of the assets that are the subject of the hedge. In addition, the price of futures may not correlate perfectly with movement in the cash market due to certain market distortions. Due to the possibility of price distortion in the futures market and because of the imperfect correlation between the movements in the cash market and movements in the price of futures, a correct forecast of general market trends or interest rate
134
Victory Portfolios II | | Notes to Financial Statements — continued
December 31, 2015 | |
(Unaudited)
movements by the Adviser may still not result in a successful hedging transaction over a short time frame.
The trading of futures contracts is also subject to the risk of trading halts, suspension, exchange or clearing house equipment failures, government intervention, insolvency of a commodities or brokerage firm or clearing house or other disruption of normal trading activity, which could at times make it difficult or impossible to liquidate existing positions or to recover excess variation margin payments.
The Funds will purchase or sell futures contracts in accordance with the Commodity Futures Trading Commission ("CFTC") regulations.
GAAP requires disclosures about the Funds' derivative and hedging activities, including how such activities are accounted for and their effect on the Funds' financial position, performance and cash flows.
Derivatives Disclosure —
Fair Values of Derivative Instruments in the Funds* as of December 31, 2015:
Victory CEMP US 500 Volatility Wtd Index ETF
| | | Asset Derivatives | | Liability Derivatives | |
| | | Balance Sheet Location | | Value | | Balance Sheet Location | | Value | |
Equity Contracts —
Futures* | | Unrealized appreciation
on futures contracts | | $ | — | | | Unrealized depreciation
on futures contracts | | $ | 445 | | |
* Includes cumulative appreciation/depreciation as reported on Schedule of Investments.
Amount of Realized Loss on Derivatives
Recognized in Income | |
Value | | Change in Unrealized Depreciation on
Derivatives Recognized in Income | | Value | |
Equity Contracts — Futures | | $ | (11,275 | ) | | Equity Contracts — Futures | | $ | (388 | ) | |
Victory CEMP US Discovery Enhanced Volatility Wtd Index ETF
| | | Asset Derivatives | | Liability Derivatives | |
| | | Balance Sheet Location | | Value | | Balance Sheet Location | | Value | |
Equity Contracts —
Futures* | | Unrealized appreciation
on futures contracts | | $ | — | | | Unrealized depreciation
on futures contracts | | $ | 574 | | |
* Includes cumulative appreciation/depreciation as reported on Schedule of Investments.
Amount of Realized Loss on Derivatives
Recognized in Income | | Value | | Change in Unrealized Appreciation on
Derivatives Recognized in Income | | Value | |
Equity Contracts — Futures | | $ | (39,987 | ) | | Equity Contracts — Futures | | $ | 3,318 | | |
Victory CEMP US 500 Enhanced Volatility Wtd Index ETF
| | | Asset Derivatives | | Liability Derivatives | |
| | | Balance Sheet Location | | Value | | Balance Sheet Location | | Value | |
Equity Contracts —
Futures* | | Unrealized appreciation
on futures contracts | | $ | 1,823 | | | Unrealized depreciation
on futures contracts | | $ | — | | |
* Includes cumulative appreciation/depreciation as reported on Schedule of Investments.
Amount of Realized Loss on Derivatives
Recognized in Income | | Value | | Change in Unrealized Appreciation on
Derivatives Recognized in Income | | Value | |
Equity Contracts — Futures | | $ | (83,553 | ) | | Equity Contracts — Futures | | $ | 17,603 | | |
135
Victory Portfolios II | | Notes to Financial Statements — continued
December 31, 2015 | |
(Unaudited)
Victory CEMP Developed Enhanced Volatility Wtd Index ETF
| | | Asset Derivatives | | Liability Derivatives | |
| | | Balance Sheet Location | | Value | | Balance Sheet Location | | Value | |
Equity Contracts —
Futures* | | Unrealized appreciation
on futures contracts | | $ | 105 | | | Unrealized depreciation
on futures contracts | | $ | — | | |
* Includes cumulative appreciation/depreciation as reported on Schedule of Investments.
Amount of Realized Loss on Derivatives
Recognized in Income | |
Value | | Change in Unrealized Appreciation on
Derivatives Recognized in Income | | Value | |
Equity Contracts — Futures | | $ | (52,790 | ) | | Equity Contracts — Futures | | $ | 7,647 | | |
Victory CEMP US EQ Income Enhanced Volatility Wtd Index ETF
| | | Asset Derivatives | | Liability Derivatives | |
| | | Balance Sheet Location | | Value | | Balance Sheet Location | | Value | |
Equity Contracts —
Futures* | | Unrealized appreciation
on futures contracts | | $ | 1,337 | | | Unrealized depreciation
on futures contracts | | $ | — | | |
* Includes cumulative appreciation/depreciation as reported on Schedule of Investments.
Amount of Realized Loss on Derivatives
Recognized in Income | |
Value | | Change in Unrealized Appreciation on
Derivatives Recognized in Income | | Value | |
Equity Contracts — Futures | | $ | (45,721 | ) | | Equity Contracts — Futures | | $ | 11,269 | | |
Victory CEMP International Volatility Wtd Index ETF
| | | Asset Derivatives | | Liability Derivatives | |
| | | Balance Sheet Location | | Value | | Balance Sheet Location | | Value | |
Equity Contracts —
Futures* | | Unrealized appreciation
on futures contracts | | $ | 20 | | | Unrealized depreciation
on futures contracts | | $ | — | | |
* Includes cumulative appreciation/depreciation as reported on Schedule of Investments.
Amount of Realized Loss on Derivatives
Recognized in Income | |
Value | | Change in Unrealized Appreciation on
Derivatives Recognized in Income | | Value | |
Equity Contracts — Futures | | $ | (1,549 | ) | | Equity Contracts — Futures | | $ | 20 | | |
Victory CEMP US Large Cap High Div Volatility Wtd Index ETF
| | | Asset Derivatives | | Liability Derivatives | |
| | | Balance Sheet Location | | Value | | Balance Sheet Location | | Value | |
Equity Contracts —
Futures* | | Unrealized appreciation
on futures contracts | | $ | 1,977 | | | Unrealized depreciation
on futures contracts | | $ | — | | |
* Includes cumulative appreciation/depreciation as reported on Schedule of Investments.
Amount of Realized Loss on Derivatives
Recognized in Income | | Value | | Change in Unrealized Appreciation on
Derivatives Recognized in Income | | Value | |
Equity Contracts — Futures | | $ | (2,253 | ) | | Equity Contracts — Futures | | $ | 1,977 | | |
136
Victory Portfolios II | | Notes to Financial Statements — continued
December 31, 2015 | |
(Unaudited)
Offsetting of Financial Assets and Derivatives Assets
The Funds are subject to various Master Netting Arrangements, which govern the terms of certain transactions with select counterparties. The Master Netting Arrangements allow the Funds to close out and net total exposure to a counterparty in the event of a default with respect to all the transactions governed under a single agreement with a counterparty. The Master Netting Arrangements also specify collateral posting arrangements at pre-arranged exposure levels. Under the Master Netting Arrangements, collateral is routinely transferred if the total net exposure to certain transactions (net of existing collateral already in place) governed under the relevant Master Netting Arrangement with a counterparty in a given account exceeds a specified threshold depending on the counterparty and the type of Master Netting Arrangement.
The table below, as of December 31, 2015, discloses both gross information and net information about instruments and transactions eligible for offset in the Statements of Assets and Liabilities' and instruments and transactions that are subject to an agreement similar to a master netting agreement as well as amounts related to collateral held at clearing brokers and counterparties.
| Assets | | Gross Amounts not
offset in the
Statement of Assets
and Liabilities | |
| | Gross Amounts
of Recognized
Assets | | Gross
Amounts
Offset in the
Statement
of Assets
and
Liabilities | | Net
Amounts
Presented in
the
Statement
of Assets
and Liabilities | | Financial
Instruments | | Collateral
Received | | Net Amount | |
Victory CEMP US 500 Volatility Wtd Index ETF | |
Description / Counterparty | |
Futures
Collins &
Company LLC | | $ | 445 | | | $ | — | | | $ | 445 | | | $ | — | | | $ | 445 | | | $ | — | | |
Victory CEMP US Discovery Enhanced Volatility Wtd Index ETF | |
Description / Counterparty | |
Futures
Collins &
Company LLC | | $ | 574 | | | $ | — | | | $ | 574 | | | $ | — | | | $ | 574 | | | $ | — | | |
Victory CEMP International Volatility Wtd Index ETF | |
Description / Counterparty | |
Futures
Collins &
Company LLC | | $ | 20 | | | $ | — | | | $ | 20 | | | $ | — | | | $ | 20 | | | $ | — | | |
Victory CEMP US Large Cap High Div Volatility Wtd Index ETF | |
Description / Counterparty | |
Futures
Collins &
Company LLC | | $ | 1,977 | | | $ | — | | | $ | 1,977 | | | $ | — | | | $ | 1,977 | | | $ | — | | |
137
Victory Portfolios II | | Notes to Financial Statements — continued
December 31, 2015 | |
(Unaudited)
| Liabilities | | Gross Amounts not
offset in the
Statement of Assets
and Liabilities | |
| | Gross Amounts
of Recognized
Liabilities | | Gross
Amounts
Offset in the
Statement
of Assets
and
Liabilities | | Net
Amounts
Presented in
the
Statement
of Assets
and Liabilities | | Financial
Instruments | | Collateral
Received | | Net Amount | |
Victory CEMP US 500 Enhanced Volatility Wtd Index ETF | |
Description / Counterparty | |
Futures
Collins &
Company LLC | | $ | 1,823 | | | $ | — | | | $ | 1,823 | | | $ | — | | | $ | 1,823 | | | $ | — | | |
Victory CEMP Developed Enhanced Volatility Wtd Index ETF | |
Description / Counterparty | |
Futures
Collins &
Company LLC | | $ | 105 | | | $ | — | | | $ | 105 | | | $ | — | | | $ | 105 | | | $ | — | | |
Victory CEMP US EQ Income Enhanced Volatility Wtd Index ETF | |
Description / Counterparty | |
Futures
Collins &
Company LLC | | $ | 1,337 | | | $ | — | | | $ | 1,337 | | | $ | — | | | $ | 1,337 | | | $ | — | | |
In some instances, the collateral amounts disclosed in the tables were adjusted due to the requirement to limit the collateral amounts to avoid the effect of overcollateralization. Actual collateral received/pledged may be more than the amounts disclosed herein.
Federal Income Tax:
The Funds comply with the requirements of subchapter M of the Internal Revenue Code of 1986, as amended, necessary to qualify as regulated investment companies and distribute substantially all net taxable investment income and net realized gains to shareholders in a manner which results in no tax cost to the Funds. Therefore, no federal income tax provision is required. As of and during the period ended December 31, 2015, the Funds have not yet determined if any tax positions did not meet the "more-likely-than-not" threshold of being sustained by the applicable tax authority. As of and during the period ended December 31, 2015, the Funds did not have liabilities for any unrecognized tax benefits. The Funds recognized interest and penalties, if any, related to unrecognized tax benefits on uncertain tax positions as income tax expense in the Statements of Operations. During the period ended December 31, 2015, the Funds did not incur any interest or penalties. The Funds are subject to examination by U.S. taxing authorities for the tax periods since each Fund's commencement of operations.
Distribution to Shareholders:
The Funds, with the exception of the US EQ Income Enhanced Volatility Wtd Index ETF, US Large Cap High Div Volatility Wtd Index ETF, US Small Cap High Div Volatility Wtd Index ETF, and International High Div Volatility Wtd Index ETF distribute any net investment income quarterly. The US EQ Income Enhanced Volatility Wtd Index ETF, US Large Cap High Div Volatility Wtd Index ETF, US Small Cap High Div Volatility Wtd Index ETF, and International High Div Volatility Wtd Index ETF distribute any net investment income monthly. All of the Funds distribute any net realized long or short-term capital gains at least annually. Dividends and distributions paid by each Fund are recorded on the ex-dividend dates. Distributions are determined, on a tax basis and may differ from net investment income and net realized capital gains for reporting purposes.
138
Victory Portfolios II | | Notes to Financial Statements — continued
December 31, 2015 | |
(Unaudited)
Other:
Investment and shareholder transactions are recorded on trade date. The Funds determine the gain or loss realized from the investment transactions by comparing the original cost of the security lot sold with the net sales proceeds. Dividend income is recognized on the ex-dividend date or as soon as information is available to the Funds and interest income is recognized on an accrual basis. Discounts and premiums on debt securities are accreted or amortized over their respective lives using the effective interest method.
Share Valuation:
The NAV per share of each Fund is calculated by dividing the sum of the value of the securities held by the Fund, plus cash and other assets, minus all liabilities (including estimated accrued expenses) by the total number of shares outstanding for the Fund, rounded to the nearest cent. The Funds' shares will not be priced on days on which the NYSE is closed for trading. The offering and redemption price per share for each Fund is equal to the Fund's net asset value per share.
Recent Accounting Pronouncement:
In June 2014, the Financial Accounting Standard Board issued ASU No. 2014-11 "Repurchase-to-Maturity Transactions, Repurchase Financings, and Disclosures." ASU No. 2014-11 makes limited changes to the accounting for repurchase agreements, clarifies when repurchase agreements and securities lending transactions should be accounted for as secured borrowings, and requires additional disclosures regarding these types of transactions. The guidance is effective for fiscal years beginning on or after December 15, 2014, and for interim periods within those fiscal years. Management is currently evaluating the impact these changes will have on the Funds' financial statement disclosures.
Subsequent Events:
The trust has evaluated the need for disclosures and/or adjustments resulting from subsequent events through the date the financial statements were issued. Based on this evaluation, no adjustments were requires to the financial statements.
3. Purchase and Sales of Securities:
Purchases and sales of securities (excluding short-term services and in-kind transactions) for the period ended December 31, 2015 were as follows:
Fund | | Purchases | | Sales | |
Victory CEMP US 500 Volatility Wtd Index ETF | | $ | 1,849,225 | | | $ | 1,722,576 | | |
Victory CEMP US Discovery Enhanced Volatility Wtd Index ETF | | | 29,021,330 | | | | 28,935,099 | | |
Victory CEMP US 500 Enhanced Volatility Wtd Index ETF | | | 19,164,086 | | | | 18,410,286 | | |
Victory CEMP Developed Enhanced Volatility Wtd Index ETF | | | 29,181,762 | | | | 26,884,874 | | |
| Victory CEMP US EQ Income Enhanced Volatility Wtd Index ETF | | | 23,060,174 | | | | 22,750,270 | | |
Victory CEMP US Small Cap Volatility Wtd Index ETF | | | 1,089,017 | | | | 1,009,240 | | |
Victory CEMP International Volatility Wtd Index ETF | | | 4,307,899 | | | | 823,770 | | |
Victory CEMP US Large Cap High Div Volatility Wtd Index ETF | | | 1,338,237 | | | | 1,313,359 | | |
Victory CEMP US Small Cap High Div Volatility Wtd Index ETF | | | 1,977,367 | | | | 1,972,476 | | |
Victory CEMP International High Div Volatility Wtd Index ETF | | | 4,473,979 | | | | 991,898 | | |
In-kind transactions associated with purchases and sales for the period ended December 31, 2015 were as follows:
Fund | | Purchases | | Sales | |
Victory CEMP US 500 Volatility Wtd Index ETF | | $ | 17,815,171 | | | $ | 3,527,712 | | |
Victory CEMP US Discovery Enhanced Volatility Wtd Index ETF | | | 12,559,926 | | | | 7,124,304 | | |
Victory CEMP US 500 Enhanced Volatility Wtd Index ETF | | | 58,861,557 | | | | 28,344,452 | | |
Victory CEMP Developed Enhanced Volatility Wtd Index ETF | | | 5,986,832 | | | | — | | |
| Victory CEMP US EQ Income Enhanced Volatility Wtd Index ETF | | | 28,171,500 | | | | 18,947,859 | | |
139
Victory Portfolios II | | Notes to Financial Statements — continued
December 31, 2015 | |
(Unaudited)
Fund | | Purchases | | Sales | |
Victory CEMP US Small Cap Volatility Wtd Index ETF | | $ | 11,793,684 | | | $ | 1,662,246 | | |
Victory CEMP International Volatility Wtd Index ETF | | | 6,755,960 | | | | — | | |
Victory CEMP US Large Cap High Div Volatility Wtd Index ETF | | | 29,374,957 | | | | — | | |
Victory CEMP US Small Cap High Div Volatility Wtd Index ETF | | | 11,803,078 | | | | — | | |
Victory CEMP International High Div Volatility Wtd Index ETF | | | 11,566,131 | | | | — | | |
4. Investment Advisory, Administration and Distribution Agreements:
Investment advisory services are provided to the Funds by Victory Capital Management Inc. ("Victory Capital" or the "Adviser"), a New York corporation registered as an investment adviser with the Securities and Exchange Commission. The Adviser is a wholly owned subsidiary of Victory Capital Holdings, Inc. ("VCH"). A majority of the interest in VCH is owned by Crestview Partners II, L.P. and its affiliated funds with the remaining portion owned by Victory employees and a limited number of outside investors.
Under the terms of the Investment Advisory Agreement (the "Advisory Agreement"), the Adviser is entitled to receive fees for its services, computed daily and payable monthly based on a percentage of the average daily net assets of each Fund. For its services, the Funds pay to the Adviser, as of the last day of each month, an annualized fee equal to 0.30% of average net assets of the US 500 Volatility Wtd Index ETF, US Discovery Enhanced Volatility Wtd Index ETF, US 500 Enhanced Volatility Wtd Index ETF, US EQ Income Enhanced Volatility Wtd Index ETF, US Small Cap Volatility Wtd Index ETF, US Large Cap High Div Volatility Wtd Index ETF, US Small Cap High Div Volatility Wtd Index ETF and, 0.40% of the of average net assets of the Developed Enhanced Volatility Wtd Index ETF, International Volatility Wtd Index ETF, and International High Div Volatility Wtd Index ETF, with such fees to be computed daily based upon daily average net assets of the Funds. The Adviser pays expenses incurred by it in connection with acting as investment Adviser to the Funds other than costs (including taxes and brokerage commissions, borrowing costs, costs of investing in underlying funds and extraordinary expenses, if any) of securities purchased for the Funds and certain other expenses paid by the Funds (as detailed in the Advisory Agreement). The Adviser pays for all employees, office space and facilities required by it to provide services under the Advisory Agreement, with the exception of specific items of expense (as detailed in the Advisory Agreement).
Prior to May 1, 2015, Compass Efficient Model Portfolios, LLC ("CEMP") provided investment advisory services to the Funds. For its services, the Funds paid to CEMP, as of the last day of each month, an annualized fee equal to 0.50% of average net assets of the US 500 Volatility Wtd Index ETF, 0.60% of average net assets of the of the US 500 Enhanced Volatility Wtd Index ETF, US EQ Income 100 Enhanced Volatility Wtd Index ETF, and US Discovery 500 Enhanced Volatility Wtd Index ETF, and 0.70% of the of average net assets of the Developed 500 Enhanced Volatility Wtd Index ETF, with such fees to be computed daily based upon daily average assets of the Funds.
For the period ended December 31, 2015, Advisory fees incurred by the Funds as well as amounts due to or from the Adviser at December 31, 2015 were as follows:
Fund | | Advisory Fees | | Due To/(From)
Adviser at
December 31, 2015 | |
Victory CEMP US 500 Volatility Wtd Index ETF | | $ | 23,889 | | | $ | 640 | | |
Victory CEMP US Discovery Enhanced Volatility
Wtd Index ETF | | | 41,386 | | | | 1,332 | | |
Victory CEMP US 500 Enhanced Volatility Wtd Index ETF | | | 163,957 | | | | (1,237 | ) | |
Victory CEMP Developed Enhanced Volatility Wtd Index ETF | | | 57,535 | | | | 8,294 | | |
Victory CEMP US EQ Income Enhanced Volatility
Wtd Index ETF | | | 141,136 | | | | (2,242 | ) | |
Victory CEMP US Small Cap Volatility Wtd Index ETF | | | 7,008 | | | | 2,834 | | |
Victory CEMP International Volatility Wtd Index ETF | | | 7,492 | | | | 7,277 | | |
Victory CEMP US Large Cap High Div Volatility
Wtd Index ETF | | | 10,702 | | | | (2,789 | ) | |
140
Victory Portfolios II | | Notes to Financial Statements — continued
December 31, 2015 | |
(Unaudited)
Fund | | Advisory Fees | | Due To/(From)
Adviser at
December 31, 2015 | |
Victory CEMP US Small Cap High Div Volatility
Wtd Index ETF | | $ | 7,841 | | | $ | (322 | ) | |
Victory CEMP International High Div Volatility
Wtd Index ETF | | | 9,207 | | | | 1,020 | | |
The Adviser has contractually agreed to waive its Advisory fee and/or reimburse expenses an additional amount through at least October 31, 2017 so that the total annual fund operating expenses after fee waiver and expense reimbursement (excluding Acquired Fund Fees and Expenses, and certain other items such as interest, taxes and brokerage commissions) do not exceed 0.35% for the US 500 Volatility Wtd Index ETF, US 500 Enhanced Volatility Wtd Index ETF, US EQ Income Enhanced Volatility Wtd Index ETF, US Discovery Enhanced Volatility Wtd Index ETF, US Small Cap Volatility Wtd Index ETF, US Large Cap High Div Volatility Wtd Index ETF, and US Small Cap High Div Volatility Wtd Index ETF, and 0.45% for the Developed Enhanced Volatility Wtd Index ETF, International Volatility Wtd Index ETF, and International High Div Volatility Wtd Index ETF. The Adviser is permitted to recoup Advisory fees waived and expenses reimbursed by it or by the Fund's predecessor Adviser for up to three years after the fiscal year in which the waiver or reimbursement took place, subject to any operating expense limits in effect at the time of the original waiver or expense reimbursement and at the time of recoupment or reimbursement.
For the period ended December 31, 2015, the Adviser waived Advisory fees and reimbursed expenses were as follows:
Fund | | Advisory Fees
Waived/Expense
Reimbursed | |
Victory CEMP US 500 Volatility Wtd Index ETF | | $ | (31,818 | ) | |
Victory CEMP US Discovery Enhanced Volatility Wtd Index ETF | | | (37,946 | ) | |
Victory CEMP US 500 Enhanced Volatility Wtd Index ETF | | | (91,117 | ) | |
Victory CEMP Developed Enhanced Volatility Wtd Index ETF | | | (78,152 | ) | |
Victory CEMP US EQ Income Enhanced Volatility Wtd Index ETF | | | (86,614 | ) | |
Victory CEMP US Small Cap Volatility Wtd Index ETF | | | (28,244 | ) | |
Victory CEMP International Volatility Wtd Index ETF | | | (36,916 | ) | |
Victory CEMP US Large Cap High Div Volatility Wtd Index ETF | | | (22,138 | ) | |
Victory CEMP US Small Cap High Div Volatility Wtd Index ETF | | | (21,820 | ) | |
Victory CEMP International High Div Volatility Wtd Index ETF | | | (24,656 | ) | |
As of December 31, 2015, the Adviser may recapture a portion of the waived and/or reimbursed amounts no later than the dates as stated below:
Fund | | June 30, 2018 | | June 30, 2019 | |
Victory CEMP US 500 Volatility Wtd Index ETF | | $ | 61,304 | | | $ | 31,818 | | |
Victory CEMP US Discovery Enhanced Volatility Wtd Index ETF | | | 59,513 | | | | 37,746 | | |
Victory CEMP US 500 Enhanced Volatility Wtd Index ETF | | | 110,009 | | | | 91,117 | | |
Victory CEMP Developed Enhanced Volatility Wtd Index ETF | | | 82,842 | | | | 78,152 | | |
Victory CEMP US EQ Income Enhanced Volatility Wtd Index ETF | | | 92,663 | | | | 86,614 | | |
Victory CEMP US Small Cap Volatility Wtd Index ETF | | | — | | | | 28,244 | | |
Victory CEMP International Volatility Wtd Index ETF | | | — | | | | 36,916 | | |
Victory CEMP US Large Cap High Div Volatility Wtd Index ETF | | | — | | | | 22,138 | | |
Victory CEMP US Small Cap High Div Volatility Wtd Index ETF | | | — | | | | 21,820 | | |
Victory CEMP International High Div Volatility Wtd Index ETF | | | — | | | | 24,656 | | |
U.S. Bank National Association ("U.S. Bank") serves as custodian for the Funds' assets. For its custody services to the Funds, U.S. Bank receives fees at an annualized rate of .004% of the Funds' aggregate average daily net assets, plus applicable per transaction fees. The Funds reimburses U.S. Bank for all of its reasonable out-of-pocket expenses incurred in providing custody services.
141
Victory Portfolios II | | Notes to Financial Statements — continued
December 31, 2015 | |
(Unaudited)
U.S. Bancorp Fund Services, LLC ("USB") serves as the Funds' administrator, fund accountant and transfer agent. Under an Administration, Accounting and Transfer Agent Agreement, USB receives for its services the greater of $25 thousand per fund, or at the following annual rates based on the average daily net assets of the Trust:
Trust AUM | | Annual Fee | |
First $100 million | | | 0.0575 | % | |
Next $150 million | | | 0.0525 | % | |
Next $250 million | | | 0.0450 | % | |
Next $250 million | | | 0.0350 | % | |
Thereafter | | | 0.0225 | % | |
The Funds reimburses USB for all of its reasonable out-of-pocket expenses incurred in providing these services.
Quasar Distributors, LLC (the "Distributor") serves as distributor for the shares of the Funds pursuant to a Distribution Agreement between the Distributor and the Trust.
Pursuant to the Distribution and Service Plans adopted in accordance with Rule 12b-1 under the 1940 Act, the Distributor may receive a monthly distribution and service fee, at an annual rate of up to 0.25% of average daily net assets. No distribution or service fees are currently paid by the Funds and there are no current plans to impose these fees.
5. Risks:
In the normal course of business, each Fund's investment activities expose it to various types of risk associated with the financial instruments and markets in which it invests. The significant types of financial risks each Fund is exposed to include market risk and credit risk. Each Fund's prospectus provides details of these and other types of risk.
Market risk arises mainly from uncertainty about future values of financial instruments influenced by price, currency and interest rate movements. It represents the potential loss each Fund may suffer through holding market positions in the face of market movements. Each Fund is exposed to market risk by virtue of its investment in equity instruments. The fair value of securities held by the Funds may decline due to general market conditions, economic trends or events that are not specifically related to the issuers of the securities including local, regional or global political, social or economic instability or to factors that affect a particular industry or group of industries. The extent of each Fund's exposure to market risk is the market value of the investments held as shown in the Fund's schedule of investments.
A diversified portfolio, where this is appropriate and consistent with a fund's objectives, minimizes the risk that a price change of a particular investment will have a material impact on the NAV of a fund. The investment concentrations within each Fund's portfolio are disclosed in its Schedule of Investments. The Victory CEMP Developed 500 Enhanced Volatility Wtd Index ETF, Victory CEMP International Volatility Wtd Index ETF, and Victory CEMP International High Div Volatility Wtd Index ETF invests in securities of foreign issuers in various countries. Investing on an international basis involves certain risks not involved in domestic investments including the risk of nationalization or expropriation of assets, imposition of currency exchange controls or restrictions on the repatriation of foreign currency, confiscatory taxation, political or financial instability and diplomatic developments, which could affect the value of a Fund's investments in certain foreign countries. Governments of many countries have exercised and continue to exercise substantial influence over many aspects of the private sector through the ownership or control of many companies, including some of the largest in these countries. As a result, government actions in the future could have a significant effect on economic conditions which may adversely affect prices of certain portfolio securities. There is also generally less government supervision and regulation of stock exchanges, brokers, and listed companies than in the U.S. Dividends or interest on, or proceeds from the sale
142
Victory Portfolios II | | Notes to Financial Statements — continued
December 31, 2015 | |
(Unaudited)
of, foreign securities may be subject to foreign withholding taxes, and special U.S. tax considerations may apply. Moreover, foreign economies may differ favorably or unfavorably from the U.S. economy in such respects as growth of gross national product, rate of inflation, capital re-investment, resource self-sufficiency and balance of payments position. The Schedule of Investments includes information on each Fund's holdings, including industry and/or geographical composition, as relevant.
Credit risk is the risk that an issuer or guarantor of debt instruments or the counterparty to a financial transaction, including derivatives contracts, repurchase agreements or loans of portfolio securities, is unable or unwilling to make timely interest and/or principal payments to otherwise honor its obligations. The Funds may be negatively impacted if a counterparty becomes bankrupt or otherwise fails to perform its obligations due to financial difficulties. The Funds may experience significant delays in obtaining any recovery in bankruptcy or other reorganization proceeding and the Funds may obtain only limited recovery or may obtain no recovery in such circumstances. The Funds typically enter into transactions with counterparties whose credit ratings are investment grade, as determined by a nationally recognized statistical rating organization or, if unrated, judged by the Adviser to be of comparable quality.
6. Line of Credit:
The Trust, Victory Institutional Funds, Victory Portfolios and Victory Variable Insurance Funds, (collectively, the "Victory Trusts") participate in a short-term, demand note "Line of Credit" agreement with Citibank N.A. ("Citibank"). Under the agreement with Citibank, the Trusts may borrow up to $100 million, of which $50 million is committed and $50 million is uncommitted. The purpose of the agreement is to meet temporary or emergency cash needs, including redemption requests that might otherwise require the untimely disposition of securities. Citibank receives an annual commitment fee of 0.10% on $50 million for providing the Line of Credit. During the six-months ended December 31, 2015, Citibank earned approximately $25,000 for Line of Credit fees. Each Fund covered by the facility pays a pro-rata portion of this commitment fee plus any interest on amounts borrowed. During the six-months ended December 31, 2015, none of the ETFs borrowed on the line of credit. As of December 31, 2015, there were no outstanding balances in the ETFs.
7. Federal Income Tax Information:
The tax character of distributions for the following periods was as follows:
For the period ended June 30, 2015:
| | | Ordinary
Income | | Realized
Gain | |
Victory CEMP US 500 Volatility Wtd Index ETF | | $ | 93,836 | | | | — | | |
Victory CEMP US 500 Enhanced Volatility Wtd Index ETF | | | 607,150 | | | | — | | |
Victory CEMP US EQ Income Enhanced Volatility Wtd Index ETF | | | 1,513,918 | | | | — | | |
Victory CEMP US Discovery Enhanced Volatility Wtd Index ETF | | | 132,709 | | | | — | | |
Victory CEMP Developed Enhanced Volatility Wtd Index ETF | | | 243,567 | | | $ | 283 | | |
The Fund designated as long-term capital gain dividend, pursuant to Internal Revenue Code Section 852(b)(3), the amount necessary to reduce the earnings and profits of the Fund related to net capital gain to zero for the tax year ended June 30, 2015.
*The following funds were not active as of June 30, 2015: Victory CEMP US Small Cap Volatility Wtd Index ETF, Victory CEMP International Volatility Wtd Index ETF, Victory CEMP Large Cap High Div Volatility Wtd Index ETF, Victory CEMP Small Cap High Div Volatility Wtd Index ETF, and Victory CEMP International High Div Volatility Wtd Index ETF.
143
Victory Portfolios II | | Notes to Financial Statements — continued
December 31, 2015 | |
(Unaudited)
As of June 30, 2015, the components of accumulated earnings (losses) for income tax purposes were as follows:
| | | Victory
CEMP
US 500
Volatility
Wtd Index
ETF | | Victory
CEMP
US 500
Enhanced
Volatility
Wtd Index
ETF | | Victory
CEMP
US EQ Income
Enhanced
Volatility
Wtd Index
ETF | | Victory
CEMP
US Discovery
Enhanced
Volatility
Wtd Index
ETF | | Victory
CEMP
Developed
Enhanced
Volatility
Wtd Index
ETF | |
Tax cost of investments | | $ | 8,889,101 | | | $ | 85,536,942 | | | $ | 89,258,208 | | | $ | 23,181,430 | | | $ | 24,835,526 | | |
Unrealized appreciation | | | 652,595 | | | | 3,937,810 | | | | 2,046,139 | | | | 1,477,562 | | | | 847,473 | | |
Unrealized depreciation | | | (376,640 | ) | | | (3,346,222 | ) | | | (4,989,670 | ) | | | (1,154,642 | ) | | | (1,114,637 | ) | |
Net unrealized appreciation
(depreciation) | | | 275,955 | | | | 591,588 | | | | (2,943,531 | ) | | | 322,920 | | | | (267,164 | ) | |
Undistributed OI | | | 10,540 | | | | 44,334 | | | | 96,861 | | | | 10,079 | | | | 24,614 | | |
Undistributed LTG | | | 8,766 | | | | — | | | | — | | | | — | | | | 5,861 | | |
Distributable earnings | | | 19,306 | | | | 44,334 | | | | 96,861 | | | | 10,079 | | | | 30,475 | | |
Other accumulated loss | | | — | | | | (554,543 | ) | | | (728,074 | ) | | | (118,336 | ) | | | (9,804 | ) | |
Total accumulated
gain/(loss) | | $ | 295,261 | | | $ | 81,379 | | | $ | (3,574,744 | ) | | $ | 214,663 | | | $ | (246,493 | ) | |
The difference between book basis and tax basis unrealized appreciation/(depreciation) is primarily attributable to the tax deferral of losses on wash sales, the mark to market on open futures contracts and adjustments for C-Corporation return of capital distributions, and passive foreign investment companies.
Capital losses incurred after October 31 within the fiscal year are deemed to arise on the first business day of the following fiscal year for tax purposes. The Funds incurred and elected to defer such late year losses as follows:
| | | Post October
Losses | |
Victory CEMP US 500 Volatility Wtd Index ETF | | | — | | |
Victory CEMP US 500 Enhanced Volatility Wtd Index ETF | | $ | 498,681 | | |
Victory CEMP US EQ Income Enhanced Volatility Wtd Index ETF | | | 697,895 | | |
Victory CEMP US Discovery Enhanced Volatility Wtd Index ETF | | | 110,845 | | |
Victory CEMP Developed Enhanced Volatility Wtd Index ETF | | | 9,767 | | |
At June 30, 2015, the Funds had capital loss carry-forwards (no expiration) for federal income tax purposes available to offset future capital gains as follows:
| | | Short Term | |
Victory CEMP US 500 Volatility Wtd Index ETF | | | — | | |
Victory CEMP US 500 Enhanced Volatility Wtd Index ETF | | $ | 55,862 | | |
Victory CEMP US EQ Income Enhanced Volatility Wtd Index ETF | | | 30,179 | | |
Victory CEMP US Discovery Enhanced Volatility Wtd Index ETF | | | 7,491 | | |
Victory CEMP Developed Enhanced Volatility Wtd Index ETF | | | — | | |
144
Victory Portfolios II | | Notes to Financial Statements — continued
December 31, 2015 | |
(Unaudited)
Permanent book and tax differences, primarily due to gains in-kind distributions not taxable and foreign currency gains (losses) resulted in reclassifications for the period ended June 30, 2015 as follows:
| | | Paid
In
Capital | | Accumulated
Net Realized
Gain (Loss) | | Undistributed
Net Investment
Income | |
Victory CEMP US 500 Volatility Wtd Index ETF | | $ | 51,805 | | | $ | (51,805 | ) | | | — | | |
Victory CEMP US 500 Enhanced Volatility Wtd
Index ETF | | | 1,858,753 | | | | (1,858,753 | ) | | | — | | |
Victory CEMP US EQ Income Enhanced Volatility
Wtd Index ETF | | | 2,571,779 | | | | (2,571,779 | ) | | | — | | |
Victory CEMP US Discovery Enhanced Volatility
Wtd Index ETF | | | 1,171,807 | | | | (1,171,807 | ) | | | — | | |
Victory CEMP Developed Enhanced Volatility
Wtd Index ETF | | | — | | | | 1,986 | | | $ | (1,986 | ) | |
145
| Victory Portfolios II | | Supplemental Information
December 31, 2015 | |
(Unaudited)
Trustee and Officer Information
Board of Trustees:
Overall responsibility for management of the Trust rests with the Board. The Trust in managed by the Board in accordance with the laws of the State of Delaware. There are currently eight Trustees, seven of whom are not "interested persons" of the Trust within the meaning of that term under the 1940 Act ("Independent Trustees") and one of whom is an "interested person" of the Trust within the meaning of that term under that 1940 Act ("Interested Trustee"). The Trustees, in turn, elect the officers of the Trust to actively supervise its day-to-day operations.
The following tables list the Trustees, their ages, positions with the Trust, commencement of service, principal occupations during the past five years and any directorships of other investment companies or companies whose securities are registered under the Securities Exchange Act of 1934, as amended, or who file reports under that Act.
Each Trustee oversees 26 portfolios in the Trust, 25 portfolios in The Victory Portfolios, one portfolio in The Victory Variable Insurance Funds and one portfolio in The Victory Institutional Funds, each a registered investment company that, together with the Trust, comprise the Victory Fund Complex. Each Trustee's address is c/o The Victory Portfolios II, 615 East Michigan Street, Milwaukee, Wisconsin 53202. Each Trustee has an indefinite term.
Name, Address, and Age | | Positions
Held with
the Trust | | Date
Commenced
Service and
Term of Office | | Principal Occupation
During Past 5 Years | | Other Directorships
Held by Trustee
During Past 5 Years | |
Independent Trustees | |
David Brooks Adcock, 64 | | Trustee | | May 2015 | | Consultant (since 2006). | | FBR Funds (2011-2012). | |
Nigel D. T. Andrews, 68 | | Vice Chair and Trustee | | May 2015 | | Retired. | | Carlyle GMS Finance, Inc. (since 2012); Old Mutual plc. (2002-2011); Old Mutual US Asset Management (2002-2014). | |
E. Lee Beard, 64 | | Trustee | | May 2015 | | Retired (since 2015); Consultant, The Henlee Group, LLC (consulting) (2005-2015). | | Penn Millers Holding Corporation (January 2011 to November 2011). | |
Sally M. Dungan, 61 | | Trustee | | May 2015 | | Chief Investment Officer, Tufts University (since 2002). | | ProCredit Holding Supervisory Board (2006-2011). | |
John L. Kelly, 62 | | Trustee | | May 2015 | | Bulk physical commodities broker, Endgate Commodities LLC (since 2014); Chief Operating Officer, Liquidnet Holdings, Inc. (2011-2014); Managing Member, Crossroad LLC (Consultants) (2009-2011). | | Director, Caledonia Mining Corporation (since May 2012); Managing Member, Crossroad LLC (since May 2009 to present). | |
146
| Victory Portfolios II | | Supplemental Information — continued
December 31, 2015 | |
(Unaudited)
Name, Address, and Age | | Positions
Held with
the Trust | | Date
Commenced
Service and
Term of Office | | Principal Occupation
During Past 5 Years | | Other Directorships
Held by Trustee
During Past 5 Years | |
David L. Meyer, 58 | | Chair and Trustee | | May 2015 | | Retired. | | None. | |
Leigh A. Wilson, 71 | | Trustee | | May 2015 | | Private Investor. | | Chair (since 2013) and Director (since 2012 and March-October 2008), Caledonia Mining Corporation; Director, The Mutual Fund Directors Forum (2004-2013). | |
Interested Trustees | |
David C. Brown, 43 | | Trustee | | May 2015 | | Chief Executive Officer (since August 2013), Co-Chief Executive Officer (2011-2013), President — Investments and Operations (2010-2011) and Chief Operating Officer (2004-2011), the Adviser; Chief Executive Officer (since 2013), Victory Capital Holdings, Inc. | | None. | |
Mr. Brown is an "Interested Person" by reason of his relationship with the Adviser.
The Board has designated Mr. Meyer and Ms. Beard as its Audit Committee Financial Experts.
The Statement of Additional Information includes additional information about the Trustees of the Trust and is available, without charge, by calling 866-376-7890.
147
| Victory Portfolios II | | Supplemental Information — continued
December 31, 2015 | |
(Unaudited)
Officers:
The officers of the Trust, their ages, commencement of service and their principal occupations during the past five years, are detailed in the following table. Each officer serves until the earlier of his or her resignation, removal, retirement, death, or the election of a successor. The mailing address of each officer of the Trust is c/o The Victory Portfolios II Trust, 615 East Michigan Street, Milwaukee, Wisconsin 53202. Except for the Chief Compliance Officer, the officers of the Trust receive no compensation directly from the Trust for performing the duties of their offices.
Name, Address,
and Age | | Positions
Held with
the Trust | | Date
Commenced
Service and
Term of Office | | Principal Occupation During Past 5 Years | |
Christopher K. Dyer, 54 | | President | | May 2015 | | Director of Mutual Fund Administration, the Adviser. | |
Scott A. Stahorsky, 46 | | Vice President | | May 2015 | | Manager, Fund Administration, the Adviser (since 2015). Senior Analyst, Fund Administration, the Adviser (prior to 2015). | |
Erin G. Wagner, 42 | | Secretary | | May 2015 | | Associate General Counsel, the Adviser (since 2013). | |
Christopher A. Ponte, 31 | | Treasurer | | May 2015 | | Senior Analyst, Fund Administration, the Adviser; Registered Principal, Victory Capital Advisers, Inc. (since 2011). | |
Jay G. Baris, 62 | | Assistant Secretary | | May 2015 | | Partner, Morrison & Foerster LLP (since 2011). | |
Edward J. Veilleux, 72 | | Chief Compliance Officer | | May 2015 | | President of EJV Financial Services (mutual fund consulting) | |
Chuck Booth, 55 | | Anti-Money Laundering Compliance Officer and Identity Theft Officer | | May 2015 | | Director, Regulatory Administration and CCO Support Services, Citi Fund Services Ohio, Inc. | |
148
| Victory Portfolios II | | Supplemental Information — continued
December 31, 2015 | |
(Unaudited)
Additional Federal Income Tax Information
For the fiscal year ended June 30, 2015, certain dividends paid by the Funds may be subject to a maximum tax rate of 15%, as provided for by the Jobs and Growth Reconciliation Act of 2003.
The percentage of dividends declared from ordinary income designated as qualified dividend income was as follows:
Victory CEMP US 500 Volatility Wtd Index ETF | | | 100.00 | % | |
Victory CEMP US 500 Enhanced Volatility Wtd Index ETF | | | 100.00 | % | |
Victory CEMP US EQ Income Enhanced Volatility Wtd Index ETF | | | 100.00 | % | |
Victory CEMP US Discovery Enhanced Volatility Wtd Index ETF | | | 100.00 | % | |
Victory CEMP Developed Enhanced Volatility Wtd Index ETF | | | 100.00 | % | |
For corporate shareholders, the percent of ordinary income distributions qualifying for the corporate dividends received deduction for the fiscal year ended June 30, 2015 was as follows:
Victory CEMP US 500 Volatility Wtd Index ETF | | | 100.00 | % | |
Victory CEMP US 500 Enhanced Volatility Wtd Index ETF | | | 100.00 | % | |
Victory CEMP US EQ Income Enhanced Volatility Wtd Index ETF | | | 100.00 | % | |
Victory CEMP US Discovery Enhanced Volatility Wtd Index ETF | | | 100.00 | % | |
Victory CEMP Developed Enhanced Volatility Wtd Index ETF | | | 0.00 | % | |
The percentage of taxable ordinary income distributions that are designated as short-term capital gain distributions under Internal Revenue Section 871(k)(2)(C) for each Fund were as follows:
Victory CEMP US 500 Volatility Wtd Index ETF | | | 0.00 | % | |
Victory CEMP US 500 Enhanced Volatility Wtd Index ETF | | | 0.00 | % | |
Victory CEMP US EQ Income Enhanced Volatility Wtd Index ETF | | | 0.00 | % | |
Victory CEMP US Discovery Enhanced Volatility Wtd Index ETF | | | 0.00 | % | |
Victory CEMP Developed Enhanced Volatility Wtd Index ETF | | | 0.08 | % | |
For the year ended June 30, 2015 the Victory CEMP Developed Enhanced Volatility Wtd Index ETF earned foreign source income and paid foreign taxes which they intend to pass through to their shareholders pursuant to section 853 of the Internal Revenue Code as follows:
Country | | Gross
Dividend | | Taxes
Withheld | |
Australia | | | 19,764 | | | | 237 | | |
Belgium | | | 5,843 | | | | 877 | | |
Bermuda | | | 1,703 | | | | — | | |
Canada | | | 29,482 | | | | 4,422 | | |
Switzerland | | | 26,558 | | | | 2,005 | | |
Germany | | | 30,978 | | | | 4,233 | | |
Denmark | | | 7,516 | | | | 1,127 | | |
Spain | | | 11,562 | | | | 1,734 | | |
Finland | | | 6,360 | | | | 954 | | |
France | | | 44,324 | | | | 6,648 | | |
Ireland | | | 1,383 | | | | — | | |
Israel | | | 1,397 | | | | 223 | | |
Italy | | | 11,321 | | | | 1,734 | | |
Jersey | | | 4,446 | | | | 139 | | |
Japan | | | 36,951 | | | | 3,695 | | |
Netherlands | | | 7,246 | | | | 990 | | |
Norway | | | 3,971 | | | | 596 | | |
Portugal | | | 2,430 | | | | 607 | | |
Sweden | | | 21,412 | | | | 3,367 | | |
Total | | | 274,647 | | | | 33,588 | | |
149
| Victory Portfolios II | | Supplemental Information — continued
December 31, 2015 | |
(Unaudited)
Proxy Voting and Form N-Q Information
Proxy Voting:
Information regarding the policies and procedures that the Fund uses to determine how to vote proxies relating to portfolio securities is available without charge, upon request, by calling 800-539-3863. The information is also included in the Fund's Statement of Additional Information, which is available on the Security and Exchange Commission's ("SEC") website at www.sec.gov.
Information relating to how the Fund voted proxies relating to portfolio securities held during the most recent twelve months ended June 30th is available on the SEC's website at www.sec.gov.
Availability of Schedules of Investments:
The Trust files a complete schedule of portfolio holdings with the SEC for the first and third quarters of each fiscal year on Form N-Q. Form N-Q is available on the SEC's website at http://www.sec.gov. You may also review or, for a fee, copy those documents by visiting the SEC's Public Reference Room in Washington, D.C. Information on the operation of the Public Reference Room can be obtained by calling the SEC at 202-551-8090.
Expense Examples
As a shareholder of a Fund, you pay ongoing expenses, such as advisory fees, distribution and service fees (12b-1), and other fund expenses. The following examples are intended to help you understand the ongoing cost (in dollars) of investing in a Fund and to compare these costs with the ongoing costs of investing in other mutual funds. Please note, the expenses shown in the tables are meant to highlight ongoing costs only and do not reflect any transactional costs, such as sales charges (loads), or contingent deferred sales charges on redemptions which may be assessed by mutual funds. This Example is based on an investment of $1,000 invested at the beginning of the period and held for the entire period as indicated below.
Actual Expenses:
The columns under the heading entitled "Actual" help you estimate the actual expenses you paid over the period. The "Actual Ending Account Value" shown is derived from a Fund's actual return and the "Actual Expenses Paid During Period" show the dollar amount that would have been paid by an investor who started with $1,000 in a Fund. To estimate the expenses you paid on your account during this period, simply divide your account value by $1,000 (for example, an $8,600 account value divided by $1,000=8.6), then multiply the result by the number in the column under the heading untitled "Actual Expenses Paid During Period".
Hypothetical Example for Comparison Purposes:
The columns under the heading entitled "Hypothetical" provide information about hypothetical account value and hypothetical expenses based on a Fund's actual expense ratio and an assumed rate of return of 5% per year before expenses, which is not the Fund's return. The hypothetical account values and expenses may not be used to estimate the actual ending account balance or expenses you paid for the period. You may use this information to compare the ongoing costs of investing in a Fund and other funds. To do so, compare this 5% hypothetical example with the 5% hypothetical examples that appear in the shareholder reports of other funds.
Please note that the expenses shown in the table are meant to highlight your ongoing costs only and do not reflect any transactional costs which may be applicable to your account. Therefore, the last column of the table (Hypothetical Expenses Paid During Period) is useful in comparing ongoing costs only, and will not help you determine the relative total costs of owning different funds. In addition, if these transactional costs were included, your costs would have been higher.
150
| Victory Portfolios II | | Supplemental Information — continued
December 31, 2015 | |
(Unaudited)
| | | | | | | Actual | | Hypothetical
(5% return before expenses) | |
| | | Fund's
Annual
Expense Ratio | | Beginning
Account Value
07/01/15 | | Ending
Account Value
12/31/15 | | Expenses
Paid During
Period(a) | | Ending
Account Value
12/31/15 | | Expenses
Paid During
Period | |
Victory CEMP
US 500 Volatility
Wtd Index ETF | | | 0.35 | % | | $ | 1,000.00 | | | $ | 979.90 | | | $ | 1.74 | | | $ | 1,023.38 | | | $ | 1.78 | | |
Victory CEMP
US Discovery
Enhanced Volatility
Wtd Index ETF | | | 0.35 | % | | | 1,000.00 | | | | 884.40 | | | | 1.66 | | | | 1,023.38 | | | | 1.78 | | |
Victory CEMP
US 500
Enhanced Volatility
Wtd Index ETF | | | 0.35 | % | | | 1,000.00 | | | | 979.90 | | | | 1.74 | | | | 1,023.38 | | | | 1.78 | | |
Victory CEMP
Developed
Enhanced Volatility
Wtd Index ETF | | | 0.45 | % | | | 1,000.00 | | | | 899.20 | | | | 2.15 | | | | 1,022.87 | | | | 2.29 | | |
Victory CEMP
US EQ Income
Enhanced Volatility
Wtd Index ETF | | | 0.35 | % | | | 1,000.00 | | | | 1,017.50 | | | | 1.77 | | | | 1,023.38 | | | | 1.78 | | |
(a) Actual Expenses Paid During Period are equal to each Fund's annualized expense ratio multiplied by the average account value over the period, multiplied by days in period (184), and divided by 366.
| | | | | | | Actual | | Hypothetical
(5% return before expenses) | |
| | | Fund's
Annual
Expense Ratio | | Beginning
Account Value
07/08/15(a) | | Ending
Account Value
12/31/15 | | Expenses
Paid During
Period(b) | | Ending
Account Value
12/31/15 | | Expenses
Paid During
Period | |
Victory CEMP
US Small Cap
Volatility
Wtd Index ETF | | | 0.35 | % | | $ | 1,000.00 | | | $ | 943.8 | | | $ | 1.65 | | | $ | 1,022.49 | | | $ | 1.71 | | |
Victory CEMP
US Large Cap High
Div Volatility
Wtd Index ETF | | | 0.35 | % | | | 1,000.00 | | | | 996.30 | | | | 1.69 | | | | 1,022.49 | | | | 1.71 | | |
Victory CEMP
US Small Cap High
Div Volatility
Wtd Index ETF | | | 0.35 | % | | | 1,000.00 | | | | 952.80 | | | | 1.65 | | | | 1,022.49 | | | | 1.71 | | |
(a) Inception date of the Fund.
(b) Actual Expenses Paid During Period are equal to each Fund's annualized expense ratio multiplied by the average account value over the period, multiplied by days in period (177), and divided by 366.
151
| Victory Portfolios II | | Supplemental Information — continued
December 31, 2015 | |
(Unaudited)
| | | | | | | Actual | | Hypothetical
(5% return before expenses) | |
| | | Fund's
Annual
Expense Ratio | | Beginning
Account Value
08/21/15(a) | | Ending
Account Value
12/31/15 | | Expenses
Paid During
Period(b) | | Ending
Account Value
12/31/15 | | Expenses
Paid During
Period | |
Victory CEMP
International
Volatility
Wtd Index ETF | | | 0.45 | % | | $ | 1,000.00 | | | $ | 966.50 | | | $ | 1.61 | | | $ | 1,016.53 | | | $ | 1.65 | | |
Victory CEMP
International High
Div Volatility
Wtd Index ETF | | | 0.45 | % | | | 1,000.00 | | | | 931.80 | | | | 1.58 | | | | 1,016.53 | | | | 1.65 | | |
(a) Inception date of the Fund.
(b) Actual Expenses Paid During Period are equal to each Fund's annualized expense ratio multiplied by the average account value over the period, multiplied by days in period (133), and divided by 366.
152
| Victory Portfolios II | | Supplemental Information — continued
December 31, 2015 | |
(Unaudited)
Victory CEMP US 500 Volatility Wtd Index ETF
Portfolio Holdings
As a Percentage of Total Investments
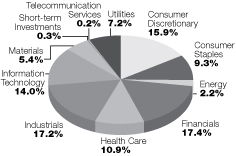
Victory CEMP US Discovery Enhanced Volatility Wtd Index ETF
Portfolio Holdings
As a Percentage of Total Investments

Victory CEMP US 500 Enhanced Volatility Wtd Index ETF
Portfolio Holdings
As a Percentage of Total Investments

Victory CEMP Developed Enhanced Volatility Wtd Index ETF
Portfolio Holdings
As a Percentage of Total Investments
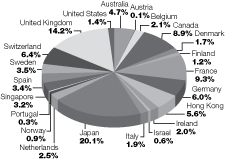
153
| Victory Portfolios II | | Supplemental Information — continued
December 31, 2015 | |
(Unaudited)
Victory CEMP US EQ Income Enhanced Volatility Wtd Index ETF
Portfolio Holdings
As a Percentage of Total Investments
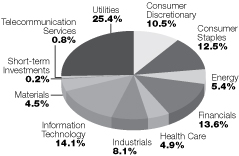
Victory CEMP US Small Cap Volatility Wtd Index ETF
Portfolio Holdings
As a Percentage of Total Investments
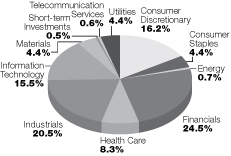
Victory CEMP International Volatility Wtd Index ETF
Portfolio Holdings
As a Percentage of Total Investments
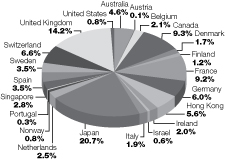
Victory CEMP US Large Cap High Div Volatility Wtd Index ETF
Portfolio Holdings
As a Percentage of Total Investments

154
| Victory Portfolios II | | Supplemental Information — continued
December 31, 2015 | |
(Unaudited)
Victory CEMP US Small Cap High Div Volatility Wtd Index ETF
Portfolio Holdings
As a Percentage of Total Investments
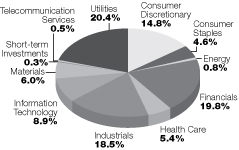
Victory CEMP International High Div Volatility Wtd Index ETF
Portfolio Holdings
As a Percentage of Total Investments
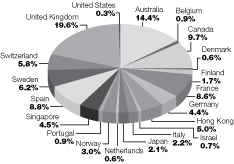
Change in Independent Registered Public Accounting Firm:
BBD LLP was previously the principal accountant for Compass EMP Funds. On August 19, 2015 that firm resigned and Cohen Fund Audit Services, LTD was engaged as principal accountants. The decision to change accountants was approved by the audit committee of the Board of Trustees.
During the fiscal year ended June 30, 2015, there were no: (1) disagreements with BBD LLP on any matter of accounting principles or practices, financial statement disclosure or auditing scope or procedures, which disagreements if not resolved to their satisfaction would have caused them to make reference in connection with their opinion to the subject matter of the disagreements, or (2) reportable events.
The audit reports of BBD LLP on the financial statements of Compass EMP Funds as of and for the year ended June 30, 2015 did not contain any adverse opinion or disclaimer of opinion, nor were they qualified or modified as to uncertainty, audit scope or accounting principles.
155
| Victory Portfolios II | | Supplemental Information — continued
December 31, 2015 | |
(Unaudited)
Frequency Distribution of Premiums and Discounts
Closing Price vs. NAV
The following Frequency Distribution of Premiums and Discounts chart is provided to show the frequency at which the closing price for the Funds were at a premium or discount to their daily net asset value (NAV). The chart presented represents past performance and cannot be used to predict future results.
Victory CEMP US 500 Volatility Wtd Index ETF
Period Covered July 01, 2014 through June 30, 2015
Premium/Discount Range | | Number of
Trading Days | | % of Total
Trade Days | |
| | 1.00 | % or more | | | 16 | | | | 6.35 | % | |
| | 0.75 | % to 0.999% | | | 7 | | | | 2.78 | % | |
| | 0.50 | % to 0.749% | | | 11 | | | | 4.37 | % | |
| | 0.25 | % to 0.499% | | | 20 | | | | 7.94 | % | |
| | 0.00 | % to 0.249% | | | 72 | | | | 28.57 | % | |
| | -0.001 | % to -0.249% | | | 88 | | | | 34.92 | % | |
| | -0.25 | % to -0.499% | | | 18 | | | | 7.14 | % | |
| | -0.50 | % to -0.749% | | | 6 | | | | 2.38 | % | |
| | -0.75 | % to -0.999% | | | 6 | | | | 2.38 | % | |
| | -1.00 | % or more | | | 8 | | | | 3.17 | % | |
| | | | | | 252 | | | | 100.00 | % | |
Period Covered July 01, 2015 through December 31, 2015
Premium/Discount Range | | Number of
Trading Days | | % of Total
Trade Days | |
| | 1.00 | % or more | | | 5 | | | | 3.91 | % | |
| | 0.75 | % to 0.999% | | | 3 | | | | 2.34 | % | |
| | 0.50 | % to 0.749% | | | 6 | | | | 4.69 | % | |
| | 0.25 | % to 0.499% | | | 6 | | | | 4.69 | % | |
| | 0.00 | % to 0.249% | | | 46 | | | | 35.94 | % | |
| | -0.001 | % to -0.249% | | | 44 | | | | 34.38 | % | |
| | -0.25 | % to -0.499% | | | 7 | | | | 5.47 | % | |
| | -0.50 | % to -0.749% | | | 5 | | | | 3.91 | % | |
| | -0.75 | % to -0.999% | | | 3 | | | | 2.34 | % | |
| | -1.00 | % or more | | | 3 | | | | 2.34 | % | |
| | | | | | 128 | | | | 100.00 | % | |
156
| Victory Portfolios II | | Supplemental Information — continued
December 31, 2015 | |
(Unaudited)
Victory CEMP US Discovery Enhanced Volatility Wtd Index ETF
Period Covered August 01, 2014 through June 30, 2015
Premium/Discount Range | | Number of
Trading Days | | % of Total
Trade Days | |
| | 1.00 | % or more | | | 8 | | | | 3.46 | % | |
| | 0.75 | % to 0.999% | | | 3 | | | | 1.30 | % | |
| | 0.50 | % to 0.749% | | | 6 | | | | 2.60 | % | |
| | 0.25 | % to 0.499% | | | 18 | | | | 7.79 | % | |
| | 0.00 | % to 0.249% | | | 112 | | | | 48.49 | % | |
| | -0.001 | % to -0.249% | | | 56 | | | | 24.24 | % | |
| | -0.25 | % to -0.499% | | | 22 | | | | 9.52 | % | |
| | -0.50 | % to -0.749% | | | 3 | | | | 1.30 | % | |
| | -0.75 | % to -0.999% | | | 1 | | | | 0.43 | % | |
| | -1.00 | % or more | | | 2 | | | | 0.87 | % | |
| | | | | | 231 | | | | 100.00 | % | |
Period Covered July 01, 2015 through December 31, 2015
Premium/Discount Range | | Number of
Trading Days | | % of Total
Trade Days | |
| | 1.00 | % or more | | | 1 | | | | 0.78 | % | |
| | 0.75 | % to 0.999% | | | 1 | | | | 0.78 | % | |
| | 0.50 | % to 0.749% | | | 2 | | | | 1.56 | % | |
| | 0.25 | % to 0.499% | | | 10 | | | | 7.81 | % | |
| | 0.00 | % to 0.249% | | | 70 | | | | 54.69 | % | |
| | -0.001 | % to -0.249% | | | 36 | | | | 28.13 | % | |
| | -0.25 | % to -0.499% | | | 4 | | | | 3.13 | % | |
| | -0.50 | % to -0.749% | | | 2 | | | | 1.56 | % | |
| | -0.75 | % to -0.999% | | | 0 | | | | 0.00 | % | |
| | -1.00 | % or more | | | 2 | | | | 1.56 | % | |
| | | | | | 128 | | | | 100.00 | % | |
157
| Victory Portfolios II | | Supplemental Information — continued
December 31, 2015 | |
(Unaudited)
Victory CEMP US 500 Enhanced Volatility Wtd Index ETF
Period Covered August 01, 2014 through June 30, 2015
Premium/Discount Range | | Number of
Trading Days | | % of Total
Trade Days | |
| | 1.00 | % or more | | | 0 | | | | 0.00 | % | |
| | 0.75 | % to 0.999% | | | 0 | | | | 0.00 | % | |
| | 0.50 | % to 0.749% | | | 2 | | | | 0.79 | % | |
| | 0.25 | % to 0.499% | | | 11 | | | | 4.37 | % | |
| | 0.00 | % to 0.249% | | | 184 | | | | 73.01 | % | |
| | -0.001 | % to -0.249% | | | 51 | | | | 20.24 | % | |
| | -0.25 | % to -0.499% | | | 3 | | | | 1.19 | % | |
| | -0.50 | % to -0.749% | | | 0 | | | | 0.00 | % | |
| | -0.75 | % to -0.999% | | | 0 | | | | 0.00 | % | |
| | -1.00 | % or more | | | 1 | | | | 0.40 | % | |
| | | | | | 252 | | | | 100.00 | % | |
Period Covered July 01, 2015 through December 31, 2015
Premium/Discount Range | | Number of
Trading Days | | % of Total
Trade Days | |
| | 1.00 | % or more | | | 0 | | | | 0.00 | % | |
| | 0.75 | % to 0.999% | | | 0 | | | | 0.00 | % | |
| | 0.50 | % to 0.749% | | | 0 | | | | 0.00 | % | |
| | 0.25 | % to 0.499% | | | 6 | | | | 4.69 | % | |
| | 0.00 | % to 0.249% | | | 89 | | | | 69.53 | % | |
| | -0.001 | % to -0.249% | | | 28 | | | | 21.88 | % | |
| | -0.25 | % to -0.499% | | | 5 | | | | 3.91 | % | |
| | -0.50 | % to -0.749% | | | 0 | | | | 0.00 | % | |
| | -0.75 | % to -0.999% | | | 0 | | | | 0.00 | % | |
| | -1.00 | % or more | | | 0 | | | | 0.00 | % | |
| | | | | | 128 | | | | 100.00 | % | |
158
| Victory Portfolios II | | Supplemental Information — continued
December 31, 2015 | |
(Unaudited)
Victory CEMP Developed Enhanced Volatility Wtd Index ETF
Period Covered September 30, 2014 through June 30, 2015
Premium/Discount Range | | Number of
Trading Days | | % of Total
Trade Days | |
| | 1.00 | % or more | | | 39 | | | | 20.63 | % | |
| | 0.75 | % to 0.999% | | | 26 | | | | 13.76 | % | |
| | 0.50 | % to 0.749% | | | 27 | | | | 14.29 | % | |
| | 0.25 | % to 0.499% | | | 41 | | | | 21.69 | % | |
| | 0.00 | % to 0.249% | | | 35 | | | | 18.52 | % | |
| | -0.001 | % to -0.249% | | | 10 | | | | 5.29 | % | |
| | -0.25 | % to -0.499% | | | 6 | | | | 3.17 | % | |
| | -0.50 | % to -0.749% | | | 2 | | | | 1.06 | % | |
| | -0.75 | % to -0.999% | | | 2 | | | | 1.06 | % | |
| | -1.00 | % or more | | | 1 | | | | 0.53 | % | |
| | | | | | 189 | | | | 100.00 | % | |
Period Covered July 01, 2015 through December 31, 2015
Premium/Discount Range | | Number of
Trading Days | | % of Total
Trade Days | |
| | 1.00 | % or more | | | 30 | | | | 23.44 | % | |
| | 0.75 | % to 0.999% | | | 20 | | | | 15.63 | % | |
| | 0.50 | % to 0.749% | | | 29 | | | | 22.66 | % | |
| | 0.25 | % to 0.499% | | | 23 | | | | 17.97 | % | |
| | 0.00 | % to 0.249% | | | 12 | | | | 9.38 | % | |
| | -0.001 | % to -0.249% | | | 6 | | | | 4.69 | % | |
| | -0.25 | % to -0.499% | | | 3 | | | | 2.34 | % | |
| | -0.50 | % to -0.749% | | | 3 | | | | 2.34 | % | |
| | -0.75 | % to -0.999% | | | 1 | | | | 0.78 | % | |
| | -1.00 | % or more | | | 1 | | | | 0.78 | % | |
| | | | | | 128 | | | | 100.00 | % | |
159
| Victory Portfolios II | | Supplemental Information — continued
December 31, 2015 | |
(Unaudited)
Victory CEMP US EQ Income Enhanced Volatility Wtd Index ETF
Period Covered July 01, 2014 through June 30, 2015
Premium/Discount Range | | Number of
Trading Days | | % of Total
Trade Days | |
| | 1.00 | % or more | | | 0 | | | | 0.00 | % | |
| | 0.75 | % to 0.999% | | | 0 | | | | 0.00 | % | |
| | 0.50 | % to 0.749% | | | 1 | | | | 0.40 | % | |
| | 0.25 | % to 0.499% | | | 5 | | | | 1.98 | % | |
| | 0.00 | % to 0.249% | | | 188 | | | | 74.60 | % | |
| | -0.001 | % to -0.249% | | | 56 | | | | 22.22 | % | |
| | -0.25 | % to -0.499% | | | 1 | | | | 0.40 | % | |
| | -0.50 | % to -0.749% | | | 0 | | | | 0.00 | % | |
| | -0.75 | % to -0.999% | | | 1 | | | | 0.40 | % | |
| | -1.00 | % or more | | | 0 | | | | 0.00 | % | |
| | | | | | 252 | | | | 100.00 | % | |
Period Covered July 01, 2015 through December 31, 2015
Premium/Discount Range | | Number of
Trading Days | | % of Total
Trade Days | |
| | 1.00 | % or more | | | 0 | | | | 0.00 | % | |
| | 0.75 | % to 0.999% | | | 1 | | | | 0.78 | % | |
| | 0.50 | % to 0.749% | | | 1 | | | | 0.78 | % | |
| | 0.25 | % to 0.499% | | | 6 | | | | 4.69 | % | |
| | 0.00 | % to 0.249% | | | 73 | | | | 57.03 | % | |
| | -0.001 | % to -0.249% | | | 37 | | | | 28.91 | % | |
| | -0.25 | % to -0.499% | | | 8 | | | | 6.25 | % | |
| | -0.50 | % to -0.749% | | | 2 | | | | 1.56 | % | |
| | -0.75 | % to -0.999% | | | 0 | | | | 0.00 | % | |
| | -1.00 | % or more | | | 0 | | | | 0.00 | % | |
| | | | | | 128 | | | | 100.00 | % | |
160
| Victory Portfolios II | | Supplemental Information — continued
December 31, 2015 | |
(Unaudited)
Victory CEMP US Small Cap High Div Volatility Wtd Index ETF
Period Covered July 08, 2015 through December 31, 2015
Premium/Discount Range | | Number of
Trading Days | | % of Total
Trade Days | |
| | 1.00 | % or more | | | 19 | | | | 15.20 | % | |
| | 0.75 | % to 0.999% | | | 1 | | | | 0.80 | % | |
| | 0.50 | % to 0.749% | | | 9 | | | | 7.20 | % | |
| | 0.25 | % to 0.499% | | | 18 | | | | 14.40 | % | |
| | 0.00 | % to 0.249% | | | 28 | | | | 22.40 | % | |
| | -0.001 | % to -0.249% | | | 17 | | | | 13.60 | % | |
| | -0.25 | % to -0.499% | | | 9 | | | | 7.20 | % | |
| | -0.50 | % to -0.749% | | | 9 | | | | 7.20 | % | |
| | -0.75 | % to -0.999% | | | 3 | | | | 2.40 | % | |
| | -1.00 | % or more | | | 12 | | | | 9.60 | % | |
| | | | | | 125 | | | | 100.00 | % | |
Victory CEMP International Volatility Wtd Index ETF
Period Covered August 21, 2015 through December 31, 2015
Premium/Discount Range | | Number of
Trading Days | | % of Total
Trade Days | |
| | 1.00 | % or more | | | 23 | | | | 24.47 | % | |
| | 0.75 | % to 0.999% | | | 6 | | | | 6.38 | % | |
| | 0.50 | % to 0.749% | | | 9 | | | | 9.57 | % | |
| | 0.25 | % to 0.499% | | | 16 | | | | 17.02 | % | |
| | 0.00 | % to 0.249% | | | 18 | | | | 19.15 | % | |
| | -0.001 | % to -0.249% | | | 7 | | | | 7.45 | % | |
| | -0.25 | % to -0.499% | | | 4 | | | | 4.26 | % | |
| | -0.50 | % to -0.749% | | | 2 | | | | 2.13 | % | |
| | -0.75 | % to -0.999% | | | 4 | | | | 4.26 | % | |
| | -1.00 | % or more | | | 5 | | | | 5.32 | % | |
| | | | | | 94 | | | | 100.00 | % | |
161
| Victory Portfolios II | | Supplemental Information — continued
December 31, 2015 | |
(Unaudited)
Victory CEMP US Large Cap High Div Volatility Wtd Index ETF
Period Covered July 08, 2015 through December 31, 2015
Premium/Discount Range | | Number of
Trading Days | | % of Total
Trade Days | |
| | 1.00 | % or more | | | 11 | | | | 8.80 | % | |
| | 0.75 | % to 0.999% | | | 1 | | | | 0.80 | % | |
| | 0.50 | % to 0.749% | | | 9 | | | | 7.20 | % | |
| | 0.25 | % to 0.499% | | | 15 | | | | 12.00 | % | |
| | 0.00 | % to 0.249% | | | 37 | | | | 29.60 | % | |
| | -0.001 | % to -0.249% | | | 25 | | | | 20.00 | % | |
| | -0.25 | % to -0.499% | | | 11 | | | | 8.80 | % | |
| | -0.50 | % to -0.749% | | | 2 | | | | 1.60 | % | |
| | -0.75 | % to -0.999% | | | 5 | | | | 4.00 | % | |
| | -1.00 | % or more | | | 9 | | | | 7.20 | % | |
| | | | | | 125 | | | | 100.00 | % | |
Victory CEMP US Small Cap Volatility Wtd Index ETF
Period Covered July 08, 2015 through December 31, 2015
Premium/Discount Range | | Number of
Trading Days | | % of Total
Trade Days | |
| | 1.00 | % or more | | | 14 | | | | 11.20 | % | |
| | 0.75 | % to 0.999% | | | 4 | | | | 3.20 | % | |
| | 0.50 | % to 0.749% | | | 4 | | | | 3.20 | % | |
| | 0.25 | % to 0.499% | | | 14 | | | | 11.20 | % | |
| | 0.00 | % to 0.249% | | | 37 | | | | 29.60 | % | |
| | -0.001 | % to -0.249% | | | 15 | | | | 12.00 | % | |
| | -0.25 | % to -0.499% | | | 9 | | | | 7.20 | % | |
| | -0.50 | % to -0.749% | | | 6 | | | | 4.80 | % | |
| | -0.75 | % to -0.999% | | | 4 | | | | 3.20 | % | |
| | -1.00 | % or more | | | 18 | | | | 14.40 | % | |
| | | | | | 125 | | | | 100.00 | % | |
162
| Victory Portfolios II | | Supplemental Information — continued
December 31, 2015 | |
(Unaudited)
Victory CEMP International High Div Volatility Wtd Index ETF
Period Covered August 21, 2015 through December 31, 2015
Premium/Discount Range | | Number of
Trading Days | | % of Total
Trade Days | |
| | 1.00 | % or more | | | 16 | | | | 17.02 | % | |
| | 0.75 | % to 0.999% | | | 8 | | | | 8.51 | % | |
| | 0.50 | % to 0.749% | | | 12 | | | | 12.77 | % | |
| | 0.25 | % to 0.499% | | | 19 | | | | 20.21 | % | |
| | 0.00 | % to 0.249% | | | 15 | | | | 15.96 | % | |
| | -0.001 | % to -0.249% | | | 10 | | | | 10.64 | % | |
| | -0.25 | % to -0.499% | | | 3 | | | | 3.19 | % | |
| | -0.50 | % to -0.749% | | | 5 | | | | 5.32 | % | |
| | -0.75 | % to -0.999% | | | 3 | | | | 3.19 | % | |
| | -1.00 | % or more | | | 3 | | | | 3.19 | % | |
| | | | | | 94 | | | | 100.00 | % | |
163
Victory CEMP Funds
c/o U.S. Bancorp Fund Services, LLC
615 East Michigan Street
Milwaukee, Wisconsin 53202

Visit our website at: | | Call Victory at: | |
www.compassempetf.com | | 866-376-7890 | |
VP-COMPASSETF-SAR (12/15)
Item 2. Code of Ethics.
Not applicable for semi-annual reports.
Item 3. Audit Committee Financial Expert.
Not applicable for semi-annual reports.
Item 4. Principal Accountant Fees and Services.
Not applicable for semi-annual reports.
Item 5. Audit Committee of Listed Registrants.
The registrant is an issuer as defined in Rule 10A-3 under the Securities Exchange Act of 1934, (the “Act”) and has a separately-designated standing audit committee established in accordance with Section 3(a)(58)(A) of the Act. The independent members of the committee are as follows: David Adcock, E. Lee Beard, David Meyers, and Leigh Wilson.
Item 6. Investments.
Schedule of Investments is included as part of the report to shareholders filed under Item 1 of this Form.
Item 7. Disclosure of Proxy Voting Policies and Procedures for Closed-End Management Investment Companies.
Not applicable to open-end investment companies.
Item 8. Portfolio Managers of Closed-End Management Investment Companies.
Not applicable to open-end investment companies.
Item 9. Purchases of Equity Securities by Closed-End Management Investment Company and Affiliated Purchasers.
Not applicable to open-end investment companies.
Item 10. Submission of Matters to a Vote of Security Holders.
Not Applicable.
Item 11. Controls and Procedures.
(a) The Registrant’s President and Treasurer have reviewed the Registrant’s disclosure controls and procedures (as defined in Rule 30a-3(c) under the Investment Company Act of 1940
1
(the “Act”)) as of a date within 90 days of the filing of this report, as required by Rule 30a-3(b) under the Act and Rules 13a-15(b) or 15d-15(b) under the Securities Exchange Act of 1934. Based on their review, such officers have concluded that the disclosure controls and procedures are effective in ensuring that information required to be disclosed in this report is appropriately recorded, processed, summarized and reported and made known to them by others within the Registrant and by the Registrant’s service provider.
(b) There were no changes in the Registrant’s internal control over financial reporting (as defined in Rule 30a-3(d) under the Act) that occurred during the second fiscal quarter of the period covered by this report that has materially affected, or is reasonably likely to materially affect, the Registrant’s internal control over financial reporting.
Item 12. Exhibits.
(a) (1) Any code of ethics or amendment thereto, that is the subject of the disclosure required by Item 2, to the extent that the registrant intends to satisfy Item 2 requirements through filing an exhibit. Not applicable to semi-annual reports.
(2) A separate certification for each principal executive and principal financial officer pursuant to Section 302 of the Sarbanes-Oxley Act of 2002. Filed herewith.
(3) Any written solicitation to purchase securities under Rule 23c-1 under the Act sent or given during the period covered by the report by or on behalf of the registrant to 10 or more persons. Not applicable to open-end investment companies.
(b) Certifications pursuant to Section 906 of the Sarbanes-Oxley Act of 2002. Furnished herewith.
2
SIGNATURES
Pursuant to the requirements of the Securities Exchange Act of 1934 and the Investment Company Act of 1940, the registrant has duly caused this report to be signed on its behalf by the undersigned, thereunto duly authorized.
(Registrant) | Victory Portfolios II | |
| | |
By (Signature and Title)* | /s/ Christopher K. Dyer | |
| Christopher K. Dyer, President | |
| | |
Date | March 1, 2016 | |
| | | | |
Pursuant to the requirements of the Securities Exchange Act of 1934 and the Investment Company Act of 1940, this report has been signed below by the following persons on behalf of the registrant and in the capacities and on the dates indicated.
By (Signature and Title)* | /s/ Christopher K. Dyer | |
| Christopher K. Dyer, President | |
| | |
Date | March 1, 2016 | |
| | |
By (Signature and Title)* | /s/ Christopher A. Ponte | |
| Christopher A. Ponte, Treasurer | |
| | |
Date | March 1, 2016 | |
| | | |
* Print the name and title of each signing officer under his or her signature.
3