UNITED STATES
SECURITIES AND EXCHANGE COMMISSION
Washington, D.C. 20549
FORM N-CSR
CERTIFIED SHAREHOLDER REPORT OF REGISTERED
MANAGEMENT INVESTMENT COMPANIES
Investment Company Act file number | 811-22696 |
|
Victory Portfolios II |
(Exact name of registrant as specified in charter) |
|
4900 Tiedeman Road, 4th Floor Brooklyn, OH | | 44144 |
(Address of principal executive offices) | | (Zip code) |
|
Christopher K. Dyer 4900 Tiedeman Road, 4th Floor Brooklyn, OH 44144 |
(Name and address of agent for service) |
|
Registrant’s telephone number, including area code: | (216) 898-2411 | |
|
Date of fiscal year end: | June 30 | |
|
Date of reporting period: | December 31, 2016 | |
| | | | | | | | |
Item 1. Reports to Stockholders.

December 31, 2016
Semi Annual Report
VictoryShares US 500 Volatility Wtd ETF
(formerly, Victory CEMP US 500 Volatility Wtd Index ETF)
VictoryShares US Discovery Enhanced Volatility Wtd ETF
(formerly, Victory CEMP Discovery Enhanced Volatility Wtd Index ETF)
VictoryShares US 500 Enhanced Volatility Wtd ETF
(formerly, Victory CEMP US 500 Enhanced Volatility Wtd Index ETF)
VictoryShares Developed Enhanced Volatility Wtd ETF
(formerly, Victory CEMP Developed Enhanced Volatility Wtd Index ETF)
VictoryShares US EQ Income Enhanced Volatility Wtd ETF
(formerly, Victory CEMP US EQ Income Enhanced Volatility Wtd Index ETF)
VictoryShares US Small Cap Volatility Wtd ETF
(formerly, Victory CEMP US Small Cap Volatility Wtd Index ETF)
VictoryShares International Volatility Wtd ETF
(formerly, Victory CEMP International Volatility Wtd Index ETF)
VictoryShares Emerging Market Volatility Wtd ETF
(formerly, Victory CEMP Emerging Market Volatility Wtd Index ETF)
VictoryShares US Large Cap High Div Volatility Wtd ETF
(formerly, Victory CEMP US Large Cap High Div Volatility Wtd
Index ETF)
VictoryShares US Small Cap High Div Volatility Wtd ETF
(formerly, Victory CEMP US Small Cap High Div Volatility Wtd
Index ETF)
VictoryShares International High Div Volatility Wtd ETF
(formerly, Victory CEMP International High Div Volatility Wtd Index ETF)
compassempetf.com
News, Information And Education 24 Hours A Day, 7 Days A Week
The Compass EMP site gives fund shareholders, prospective shareholders, and investment professionals a convenient way to access fund information, get guidance, and track fund performance anywhere they can access the Internet. The site includes:
• Detailed performance records
• Daily share prices
• The latest fund news
• Investment resources to help you become a better investor
• A section dedicated to investment professionals
Whether you're a potential investor searching for the fund that matches your investment philosophy, a seasoned investor interested in planning tools, or an investment professional, compassempetf.com has what you seek. Visit us anytime. We're always open.
Table of Contents
Shareholder Letter | | | 5-6 | | |
Financial Statements | |
Victory Portfolios II Exchange Traded Funds | |
VictoryShares US 500 Volatility Wtd ETF | |
Schedule of Investments | | | 7-20 | | |
Statements of Assets and Liabilities | | | 113 | | |
Statements of Operations | | | 117 | | |
Statements of Changes in Net Assets | | | 121 | | |
Financial Highlights | | | 132 | | |
VictoryShares US Discovery Enhanced Volatility
Wtd ETF | |
Schedule of Investments | | | 21-34 | | |
Statements of Assets and Liabilities | | | 113 | | |
Statements of Operations | | | 117 | | |
Statements of Changes in Net Assets | | | 122 | | |
Financial Highlights | | | 133 | | |
VictoryShares US 500 Enhanced Volatility Wtd ETF | |
Schedule of Investments | | | 35-48 | | |
Statements of Assets and Liabilities | | | 113 | | |
Statements of Operations | | | 117 | | |
Statements of Changes in Net Assets | | | 123 | | |
Financial Highlights | | | 134 | | |
VictoryShares Developed Enhanced Volatility
Wtd ETF | |
Schedule of Investments | | | 49-57 | | |
Statements of Assets and Liabilities | | | 114 | | |
Statements of Operations | | | 118 | | |
Statements of Changes in Net Assets | | | 124 | | |
Financial Highlights | | | 135 | | |
VictoryShares US EQ Income Enhanced Volatility
Wtd ETF | |
Schedule of Investments | | | 58-62 | | |
Statements of Assets and Liabilities | | | 114 | | |
Statements of Operations | | | 118 | | |
Statements of Changes in Net Assets | | | 125 | | |
Financial Highlights | | | 136 | | |
VictoryShares US Small Cap Volatility Wtd ETF | |
Schedule of Investments | | | 63-76 | | |
Statements of Assets and Liabilities | | | 114 | | |
Statements of Operations | | | 118 | | |
Statements of Changes in Net Assets | | | 126 | | |
Financial Highlights | | | 137 | | |
VictoryShares International Volatility Wtd ETF | |
Schedule of Investments | | | 77-87 | | |
Statements of Assets and Liabilities | | | 115 | | |
Statements of Operations | | | 119 | | |
Statements of Changes in Net Assets | | | 127 | | |
Financial Highlights | | | 138 | | |
1
Table of Contents (continued)
VictoryShares Emerging Market Volatility Wtd ETF | |
Schedule of Investments | | | 88-99 | | |
Statements of Assets and Liabilities | | | 115 | | |
Statements of Operations | | | 119 | | |
Statements of Changes in Net Assets | | | 128 | | |
Financial Highlights | | | 139 | | |
VictoryShares US Large Cap High Div Volatility
Wtd ETF | |
Schedule of Investments | | | 100-103 | | |
Statements of Assets and Liabilities | | | 115 | | |
Statements of Operations | | | 119 | | |
Statements of Changes in Net Assets | | | 129 | | |
Financial Highlights | | | 140 | | |
VictoryShares US Small Cap High Div Volatility
Wtd ETF | |
Schedule of Investments | | | 104-108 | | |
Statements of Assets and Liabilities | | | 116 | | |
Statements of Operations | | | 120 | | |
Statements of Changes in Net Assets | | | 130 | | |
Financial Highlights | | | 141 | | |
VictoryShares International High Div Volatility
Wtd ETF | |
Schedule of Investments | | | 109-112 | | |
Statements of Assets and Liabilities | | | 116 | | |
Statements of Operations | | | 120 | | |
Statements of Changes in Net Assets | | | 131 | | |
Financial Highlights | | | 142 | | |
Notes to Financial Statements | | | 143 | | |
Supplemental Information | | | 161 | | |
Trustee and Officer Information | | | 161 | | |
Additional Federal Income Tax Information | | | 165 | | |
Proxy Voting and Form N-Q Information | | | 169 | | |
Expense Examples | | | 169 | | |
Portfolio Allocation | | | 171-173 | | |
Frequency Distribution of Premiums &
Discounts | | | 174 | | |
Advisory Contract Approval | | | 174-179 | | |
2
Table of Contents (continued)
The Victory Portfolios II ETFs are distributed by Quasar Distributors, LLC. Victory Capital Management Inc. is the investment adviser to the Funds and receives fees from the Funds for performing services for the Funds.
This report is not authorized for distribution to prospective investors unless preceded or accompanied by a current prospectus of the Victory Portfolios II ETFs.
For additional information about any Victory Portfolios II ETF, including fees, expenses, and risks, view our prospectus online at compassempetf.com or call 866-376-7890. Read it carefully before you invest or send money.
The information in this semi-annual report is based on data obtained from recognized services and sources and is believed to be reliable. Any opinions, projections, or recommendations in this report are subject to change without notice and are not intended as individual investment advice. Past investment performance of the ETFs, markets or securities mentioned herein should not be considered to be indicative of future results.
• NOT FDIC INSURED • NO BANK GUARANTEE • MAY LOSE VALUE

Call Compass EMP at:
866-376-7890
Visit our website at:
www.compassempetf.com
3
This page is intentionally left blank.
4
The Victory Funds Letter to Shareholders
Dear Shareholder,
As we head full-steam into 2017, we are brimming with excitement. For starters, we launched a new brand — VictoryShares — which builds on the success of the firm's Victory CEMP volatility-weighted ETFs. The names of the existing 11 Victory CEMP ETFs have been changed to reflect the VictoryShares branding. And in conjunction with the new brand, our next generation VictoryShares ETF platform will soon include new products that will track indexes developed in partnership with Nasdaq.
The CEMP investment team provided us with an enviable doorway into the ETF world, and now our VictoryShares platform carries that forward, boasting more than $1 billion in assets under management. This is an important benchmark, and we are poised to continue helping investors bridge the gap between the active and passive elements of their portfolios with new ETFs in the years ahead.
In terms of the general investment environment, we are closely monitoring the state of the markets and the seemingly heightened level of the political and economic risk. Investors perpetually appear to be waiting for the next big surprise. Maybe that's a reflection of an aging bull market. Or maybe it's persistent worries over growth rates in emerging markets or the specter of rising U.S. interest rates that finally appears to be here.
There are plenty of other issues to ponder as well. Investors have had to grapple with the fallout from the Brexit referendum, the surprising results of the U.S. presidential election, and even negative bond yields in several major global developed markets. All this activity simply underscores that investing today is no easy task, and there are many cross-currents that need deciphering.
Yet despite all the question marks and the now-fashionable anti-globalization rhetoric, it's important to remember that equity markets in the U.S., key global developed markets, and emerging markets all moved higher during the course of 2016. In fact, as 2016 drew to a close there was a fair bit of encouraging economic news. Domestically, we are benefitting from relatively strong personal consumption, continuing job creation, and even some wage growth. Solid employment and healthier finances are underpinning household spending, and the prospect of less regulation and fiscal stimulus in the U.S. helped fuel a robust post-U.S. election rally. Equities certainly ushered in 2017 on a positive note. Nevertheless, more volatility should be expected, and catalysts could come domestically or from any corner of the globe.
While markets will continue to provide tactical challenges for investors, we believe that maintaining a long-term view and maintaining a portfolio that is diversified across strategies and asset classes is still appropriate for investors seeking to weather market turbulence and achieve goals. Of this thinking, we have no doubt.
To help investors maintain their longer-term conviction, we are committed to offering an eclectic mix of investment products. In conjunction with our efforts, in July 2016 Victory Capital completed its acquisition of RS Investments (including the recently renamed Sophus Capital). The acquisition expands Victory Capital's
5
multi-boutique model to include 11 distinct investment franchises with $54.9 billion in assets under management and advisement as of December 31, 2016.
On the following pages, you will find information relating to your Victory Funds investment. If you have any questions, we encourage you to contact your financial advisor. Or, if you invest with us directly, you may call (866) 376-7890, or visit our website at www.vcm.com.
My colleagues and I sincerely appreciate the confidence you have placed in the Victory Funds and we value the opportunity to help meet your investment goals.

Christopher K. Dyer, CFA
President,
Victory Funds
Must be preceded or accompanied by a Prospectus
Opinions expressed are subject to change, are not guaranteed and should not be considered investment advice.
Investments involve risk including possible loss of principal. ETFs have the same risks as the underlying securities traded on the exchange throughout the day. Redemptions are limited and often commissions are charged on each trade, and ETFs may trade at a premium or discount to their net asset value. The Funds are not actively managed and do not, therefore, seek returns in excess of their respective Index. The Funds' returns may not match the returns of their respective Index for a number of reasons, including: the Fund incurs operating expenses not applicable to the Index and incurs costs in buying and selling securities; the Fund may not be fully invested at times; differences in the valuation of securities and differences between the Fund's portfolio and the Index resulting from legal restrictions, cost, or liquidity constraints. The ETFs may invest in small and medium-sized companies. The earnings and prospects of these companies are more volatile than larger companies. Small and medium-sized companies may have limited markets, product lines, or financial resources and lack management experience and may experience higher failure rates than larger companies. In general the price of a fixed income security falls when interest rates rise. ETFs focused on high dividend strategies may not be successful. Dividend paying stocks may fall out of favor relative to the overall market. ETFs may invest in securities included in, or representative of securities included in, the index, regardless of their investment merits. ETFs with a foreign focus are subject to the special risks associated with investments in foreign markets which may include less liquidity, exchange rate risk, greater volatility, less developed or less efficient trading markets, lack of comprehensive company information, political instability and differing auditing and legal standards.
One cannot invest directly in an index.
The ETFs are distributed by Quasar Distributors, LLC. Victory Capital Management Inc., the adviser to the ETFs, is not affiliated with Quasar Distributors, LLC.
6
Victory Portfolios II
VictoryShares US 500 Volatility Wtd ETF | | Schedule of Investments
December 31, 2016 | |
(Unaudited)
Security Description | | Shares | | Value | |
Common Stocks (99.8%) | |
Aerospace & Defense (2.9%): | |
B/E Aerospace, Inc. | | | 3,455 | | | $ | 207,956 | | |
General Dynamics Corporation | | | 1,836 | | | | 317,004 | | |
Huntington Ingalls Industries, Inc. | | | 1,581 | | | | 291,204 | | |
Lockheed Martin Corporation | | | 1,472 | | | | 367,912 | | |
Northrop Grumman Corporation | | | 1,576 | | | | 366,546 | | |
Orbital ATK, Inc. | | | 1,821 | | | | 159,756 | | |
Raytheon Company | | | 2,219 | | | | 315,098 | | |
Rockwell Collins, Inc. | | | 3,026 | | | | 280,692 | | |
Spirit AeroSystems Holdings, Inc. — Class A | | | 3,830 | | | | 223,481 | | |
Textron, Inc. | | | 4,195 | | | | 203,709 | | |
TransDigm Group, Inc. | | | 598 | | | | 148,878 | | |
United Technologies Corporation | | | 2,744 | | | | 300,797 | | |
| | | | 3,183,033 | | |
Air Freight & Logistics (0.9%): | |
CH Robinson Worldwide, Inc. | | | 3,901 | | | | 285,787 | | |
Expeditors International of Washington, Inc. | | | 5,656 | | | | 299,542 | | |
United Parcel Service, Inc. — Class B | | | 3,493 | | | | 400,438 | | |
| | | | 985,767 | | |
Airlines (1.0%): | |
Alaska Air Group, Inc. | | | 2,333 | | | | 207,007 | | |
American Airlines Group, Inc. | | | 3,360 | | | | 156,878 | | |
Delta Air Lines, Inc. | | | 3,885 | | | | 191,103 | | |
JetBlue Airways Corporation (a) | | | 8,257 | | | | 185,122 | | |
Southwest Airlines Company | | | 4,208 | | | | 209,727 | | |
United Continental Holdings, Inc. (a) | | | 2,279 | | | | 166,094 | | |
| | | | 1,115,931 | | |
Auto Components (0.7%): | |
BorgWarner, Inc. | | | 3,563 | | | | 140,525 | | |
Gentex Corporation | | | 11,216 | | | | 220,843 | | |
Johnson Controls International PLC | | | 4,705 | | | | 193,799 | | |
Lear Corporation | | | 1,364 | | | | 180,552 | | |
| | | | 735,719 | | |
Automobiles (0.7%): | |
Ford Motor Company | | | 14,364 | | | | 174,235 | | |
General Motors Company | | | 6,579 | | | | 229,213 | | |
Harley-Davidson, Inc. | | | 2,483 | | | | 144,858 | | |
Thor Industries, Inc. | | | 2,419 | | | | 242,021 | | |
| | | | 790,327 | | |
Banks (5.4%): | |
Bank of America Corporation | | | 9,499 | | | | 209,928 | | |
Bank of the Ozarks, Inc. | | | 3,729 | | | | 196,108 | | |
BB&T Corporation | | | 5,413 | | | | 254,519 | | |
BOK Financial Corporation | | | 2,206 | | | | 183,186 | | |
CIT Group, Inc. | | | 4,147 | | | | 176,994 | | |
See notes to financial statements.
7
Victory Portfolios II
VictoryShares US 500 Volatility Wtd ETF | | Schedule of Investments — continued
December 31, 2016 | |
(Unaudited)
Security Description | | Shares | | Value | |
Banks (5.4%) cont'd | |
Citigroup, Inc. | | | 3,060 | | | $ | 181,856 | | |
Citizens Financial Group, Inc. | | | 6,092 | | | | 217,058 | | |
Comerica, Inc. | | | 3,084 | | | | 210,051 | | |
Commerce Bancshares, Inc. | | | 4,806 | | | | 277,832 | | |
Cullen/Frost Bankers, Inc. | | | 1,888 | | | | 166,578 | | |
East West Bancorp, Inc. | | | 3,978 | | | | 202,202 | | |
Fifth Third Bancorp | | | 7,670 | | | | 206,860 | | |
First Republic Bank | | | 2,378 | | | | 219,109 | | |
Huntington Bancshares, Inc. | | | 15,799 | | | | 208,863 | | |
JPMorgan Chase & Company | | | 2,852 | | | | 246,099 | | |
KeyCorp | | | 13,910 | | | | 254,136 | | |
M&T Bank Corporation | | | 1,668 | | | | 260,925 | | |
PacWest Bancorp | | | 3,498 | | | | 190,431 | | |
People's United Financial, Inc. | | | 12,947 | | | | 250,654 | | |
PNC Financial Services Group, Inc. | | | 2,467 | | | | 288,540 | | |
Regions Financial Corporation | | | 14,418 | | | | 207,042 | | |
Signature Bank (a) | | | 1,358 | | | | 203,972 | | |
SunTrust Banks, Inc. | | | 3,791 | | | | 207,936 | | |
SVB Financial Group (a) | | | 1,036 | | | | 177,840 | | |
U.S. Bancorp | | | 5,243 | | | | 269,333 | | |
Wells Fargo & Company | | | 4,532 | | | | 249,759 | | |
Zions Bancorporation | | | 4,737 | | | | 203,880 | | |
| | | | 5,921,691 | | |
Beverages (1.7%): | |
Brown-Forman Corporation — Class B | | | 5,710 | | | | 256,493 | | |
Constellation Brands, Inc. — Class A | | | 1,394 | | | | 213,714 | | |
Dr Pepper Snapple Group, Inc. | | | 3,278 | | | | 297,216 | | |
Molson Coors Brewing Company — Class B | | | 2,251 | | | | 219,045 | | |
Monster Beverage Corporation (a) | | | 3,708 | | | | 164,413 | | |
PepsiCo, Inc. | | | 3,719 | | | | 389,119 | | |
The Coca-Cola Company | | | 8,354 | | | | 346,357 | | |
| | | | 1,886,357 | | |
Biotechnology (0.9%): | |
AbbVie, Inc. | | | 2,856 | | | | 178,843 | | |
Amgen, Inc. | | | 1,341 | | | | 196,068 | | |
Biogen, Inc. (a) | | | 438 | | | | 124,208 | | |
Gilead Sciences, Inc. | | | 2,222 | | | | 159,117 | | |
Regeneron Pharmaceuticals, Inc. (a) | | | 325 | | | | 119,304 | | |
United Therapeutics Corporation (a) | | | 1,120 | | | | 160,642 | | |
| | | | 938,182 | | |
Building Products (0.9%): | |
AO Smith Corporation | | | 4,200 | | | | 198,870 | | |
Fortune Brands Home & Security, Inc. | | | 3,679 | | | | 196,679 | | |
Lennox International, Inc. | | | 1,674 | | | | 256,407 | | |
Masco Corporation | | | 5,603 | | | | 177,167 | | |
Owens Corning | | | 3,899 | | | | 201,032 | | |
| | | | 1,030,155 | | |
See notes to financial statements.
8
Victory Portfolios II
VictoryShares US 500 Volatility Wtd ETF | | Schedule of Investments — continued
December 31, 2016 | |
(Unaudited)
Security Description | | Shares | | Value | |
Capital Markets (4.8%): | |
Affiliated Managers Group, Inc. (a) | | | 911 | | | $ | 132,368 | | |
Ameriprise Financial, Inc. | | | 1,575 | | | | 174,731 | | |
BlackRock, Inc. | | | 500 | | | | 190,270 | | |
CBOE Holdings, Inc. | | | 4,142 | | | | 306,052 | | |
Charles Schwab Corporation | | | 4,384 | | | | 173,037 | | |
CME Group, Inc. | | | 2,414 | | | | 278,455 | | |
Eaton Vance Corporation | | | 4,537 | | | | 190,010 | | |
FactSet Research Systems, Inc. | | | 1,301 | | | | 212,623 | | |
Franklin Resources, Inc. | | | 4,629 | | | | 183,216 | | |
Interactive Brokers Group, Inc. | | | 4,632 | | | | 169,114 | | |
Intercontinental Exchange, Inc. | | | 3,850 | | | | 217,217 | | |
Invesco Ltd. | | | 4,414 | | | | 133,921 | | |
MarketAxess Holdings, Inc. | | | 1,183 | | | | 173,806 | | |
Moody's Corporation | | | 1,688 | | | | 159,128 | | |
Morgan Stanley | | | 4,536 | | | | 191,646 | | |
MSCI, Inc. | | | 2,978 | | | | 234,607 | | |
Nasdaq, Inc. | | | 3,551 | | | | 238,343 | | |
Northern Trust Corporation | | | 2,537 | | | | 225,920 | | |
Raymond James Financial, Inc. | | | 2,630 | | | | 182,180 | | |
S&P Global, Inc. | | | 1,560 | | | | 167,762 | | |
SEI Investments Company | | | 3,065 | | | | 151,288 | | |
State Street Corporation | | | 2,150 | | | | 167,098 | | |
T. Rowe Price Group, Inc. | | | 3,185 | | | | 239,703 | | |
TD Ameritrade Holding Corporation | | | 4,800 | | | | 209,280 | | |
The Bank of New York Mellon Corporation | | | 4,540 | | | | 215,105 | | |
The Goldman Sachs Group, Inc. | | | 1,087 | | | | 260,282 | | |
| | | | 5,177,162 | | |
Chemicals (2.4%): | |
Axalta Coating Systems Ltd. (a) | | | 6,137 | | | | 166,926 | | |
CF Industries Holdings, Inc. | | | 3,731 | | | | 117,452 | | |
Eastman Chemical Company | | | 2,844 | | | | 213,897 | | |
Ecolab, Inc. | | | 1,847 | | | | 216,505 | | |
Huntsman Corporation | | | 5,612 | | | | 107,077 | | |
International Flavors & Fragrances, Inc. | | | 1,407 | | | | 165,787 | | |
LyondellBasell Industries NV — Class A | | | 2,003 | | | | 171,817 | | |
NewMarket Corporation | | | 494 | | | | 209,377 | | |
PPG Industries, Inc. | | | 2,092 | | | | 198,238 | | |
Praxair, Inc. | | | 2,168 | | | | 254,068 | | |
RPM International, Inc. | | | 4,427 | | | | 238,306 | | |
The Dow Chemical Company | | | 4,200 | | | | 240,324 | | |
The Sherwin-Williams Company | | | 799 | | | | 214,723 | | |
Westlake Chemical Corporation | | | 2,429 | | | | 136,000 | | |
| | | | 2,650,497 | | |
Commercial Services & Supplies (1.8%): | |
Cintas Corporation | | | 2,112 | | | | 244,063 | | |
Copart, Inc. (a) | | | 4,419 | | | | 244,857 | | |
KAR Auction Services, Inc. | | | 5,283 | | | | 225,161 | | |
Republic Services, Inc. | | | 6,845 | | | | 390,507 | | |
See notes to financial statements.
9
Victory Portfolios II
VictoryShares US 500 Volatility Wtd ETF | | Schedule of Investments — continued
December 31, 2016 | |
(Unaudited)
Security Description | | Shares | | Value | |
Commercial Services & Supplies (1.8%) cont'd | |
Rollins, Inc. | | | 7,882 | | | $ | 266,254 | | |
Stericycle, Inc. (a) | | | 1,549 | | | | 119,335 | | |
Waste Management, Inc. | | | 5,932 | | | | 420,638 | | |
| | | | 1,910,815 | | |
Communications Equipment (1.2%): | |
Arista Networks, Inc. (a) | | | 1,451 | | | | 140,413 | | |
Brocade Communications Systems, Inc. | | | 13,045 | | | | 162,932 | | |
Cisco Systems, Inc. | | | 6,799 | | | | 205,466 | | |
F5 Networks, Inc. (a) | | | 1,500 | | | | 217,080 | | |
Juniper Networks, Inc. | | | 6,385 | | | | 180,440 | | |
Motorola Solutions, Inc. | | | 3,083 | | | | 255,550 | | |
Ubiquiti Networks, Inc. (a) | | | 2,906 | | | | 167,967 | | |
| | | | 1,329,848 | | |
Construction & Engineering (0.2%): | |
Jacobs Engineering Group, Inc. (a) | | | 3,823 | | | | 217,911 | | |
Construction Materials (0.4%): | |
Martin Marietta Materials, Inc. | | | 975 | | | | 215,992 | | |
Vulcan Materials Company | | | 1,789 | | | | 223,893 | | |
| | | | 439,885 | | |
Consumer Finance (1.0%): | |
American Express Company | | | 3,027 | | | | 224,240 | | |
Capital One Financial Corporation | | | 2,385 | | | | 208,067 | | |
Discover Financial Services | | | 3,399 | | | | 245,034 | | |
Navient Corporation | | | 8,211 | | | | 134,907 | | |
Santander Consumer USA Holdings, Inc. (a) | | | 7,221 | | | | 97,484 | | |
Synchrony Financial | | | 5,771 | | | | 209,314 | | |
| | | | 1,119,046 | | |
Containers & Packaging (1.9%): | |
AptarGroup, Inc. | | | 3,511 | | | | 257,883 | | |
Avery Dennison Corporation | | | 2,898 | | | | 203,497 | | |
Bemis Company, Inc. | | | 4,812 | | | | 230,110 | | |
Berry Plastics Group, Inc. (a) | | | 3,679 | | | | 179,278 | | |
Crown Holdings, Inc. (a) | | | 3,999 | | | | 210,227 | | |
Graphic Packaging Holding Company | | | 12,672 | | | | 158,147 | | |
International Paper Company | | | 3,716 | | | | 197,171 | | |
Packaging Corporation of America | | | 1,993 | | | | 169,046 | | |
Sealed Air Corporation | | | 3,676 | | | | 166,670 | | |
Sonoco Products Company | | | 4,869 | | | | 256,596 | | |
| | | | 2,028,625 | | |
Distributors (0.6%): | |
Genuine Parts Company | | | 2,756 | | | | 263,308 | | |
LKQ Corporation (a) | | | 5,116 | | | | 156,806 | | |
Pool Corporation | | | 2,710 | | | | 282,761 | | |
| | | | 702,875 | | |
See notes to financial statements.
10
Victory Portfolios II
VictoryShares US 500 Volatility Wtd ETF | | Schedule of Investments — continued
December 31, 2016 | |
(Unaudited)
Security Description | | Shares | | Value | |
Diversified Consumer Services (0.4%): | |
Service Corporation International | | | 8,637 | | | $ | 245,291 | | |
ServiceMaster Global Holdings, Inc. (a) | | | 4,707 | | | | 177,312 | | |
| | | | 422,603 | | |
Diversified Financial Services (0.4%): | |
Berkshire Hathaway, Inc. — Class B (a) | | | 2,386 | | | | 388,870 | | |
Diversified Telecommunication Services (0.8%): | |
AT&T, Inc. | | | 9,674 | | | | 411,435 | | |
CenturyLink, Inc. | | | 5,953 | | | | 141,562 | | |
Verizon Communications, Inc. | | | 6,104 | | | | 325,832 | | |
| | | | 878,829 | | |
Electric Utilities (3.3%): | |
Alliant Energy Corporation | | | 7,770 | | | | 294,405 | | |
American Electric Power Company, Inc. | | | 4,646 | | | | 292,512 | | |
Duke Energy Corporation | | | 3,892 | | | | 302,097 | | |
Eversource Energy | | | 5,791 | | | | 319,837 | | |
Exelon Corporation | | | 7,348 | | | | 260,781 | | |
NextEra Energy, Inc. | | | 2,655 | | | | 317,166 | | |
OGE Energy Corporation | | | 7,235 | | | | 242,011 | | |
PG&E Corporation | | | 5,132 | | | | 311,872 | | |
Pinnacle West Capital Corporation | | | 4,046 | | | | 315,709 | | |
PPL Corporation | | | 8,248 | | | | 280,844 | | |
Southern Company | | | 6,704 | | | | 329,770 | | |
Xcel Energy, Inc. | | | 7,714 | | | | 313,960 | | |
| | | | 3,580,964 | | |
Electrical Equipment (1.4%): | |
Acuity Brands, Inc. | | | 584 | | | | 134,822 | | |
AMETEK, Inc. | | | 4,913 | | | | 238,772 | | |
Eaton Corporation PLC | | | 3,085 | | | | 206,973 | | |
Emerson Electric Company | | | 4,116 | | | | 229,467 | | |
Hubbell, Inc. | | | 2,423 | | | | 282,764 | | |
Rockwell Automation, Inc. | | | 1,893 | | | | 254,419 | | |
Sensata Technologies Holding NV (a) | | | 3,768 | | | | 146,764 | | |
| | | | 1,493,981 | | |
Electronic Equipment, Instruments & Components (2.3%): | |
Amphenol Corporation — Class A | | | 4,602 | | | | 309,254 | | |
Arrow Electronics, Inc. (a) | | | 2,766 | | | | 197,216 | | |
Avnet, Inc. | | | 5,071 | | | | 241,430 | | |
CDW Corporation | | | 4,686 | | | | 244,094 | | |
Cognex Corporation | | | 2,864 | | | | 182,208 | | |
Dolby Laboratories, Inc. | | | 3,671 | | | | 165,892 | | |
Flex Ltd. (a) | | | 14,046 | | | | 201,841 | | |
FLIR Systems, Inc. | | | 6,629 | | | | 239,904 | | |
IPG Photonics Corporation (a) | | | 1,775 | | | | 175,210 | | |
Keysight Technologies, Inc. (a) | | | 5,502 | | | | 201,208 | | |
See notes to financial statements.
11
Victory Portfolios II
VictoryShares US 500 Volatility Wtd ETF | | Schedule of Investments — continued
December 31, 2016 | |
(Unaudited)
Security Description | | Shares | | Value | |
Electronic Equipment, Instruments & Components (2.3%) cont'd | |
SYNNEX Corporation | | | 1,680 | | | $ | 203,314 | | |
Trimble Navigation Ltd. (a) | | | 5,986 | | | | 180,478 | | |
| | | | 2,542,049 | | |
Energy Equipment & Services (0.2%): | |
FMC Technologies, Inc. (a) | | | 4,628 | | | | 164,433 | | |
Food & Staples Retailing (1.8%): | |
Casey's General Stores, Inc. | | | 1,515 | | | | 180,103 | | |
Costco Wholesale Corporation | | | 1,845 | | | | 295,403 | | |
CVS Health Corporation | | | 3,145 | | | | 248,172 | | |
Sysco Corporation | | | 5,574 | | | | 308,632 | | |
The Kroger Company | | | 6,487 | | | | 223,866 | | |
Walgreens Boots Alliance, Inc. | | | 2,862 | | | | 236,859 | | |
Wal-Mart Stores, Inc. | | | 3,547 | | | | 245,169 | | |
Whole Foods Market, Inc. | | | 6,198 | | | | 190,651 | | |
| | | | 1,928,855 | | |
Food Products (2.6%): | |
Archer-Daniels-Midland Company | | | 3,901 | | | | 178,081 | | |
Blue Buffalo Pet Products, Inc. (a) | | | 4,803 | | | | 115,464 | | |
Bunge Ltd. | | | 2,175 | | | | 157,122 | | |
Campbell Soup Company | | | 4,492 | | | | 271,631 | | |
General Mills, Inc. | | | 4,800 | | | | 296,496 | | |
Hormel Foods Corporation | | | 5,440 | | | | 189,366 | | |
Ingredion, Inc. | | | 1,635 | | | | 204,310 | | |
McCormick & Company, Inc. | | | 3,073 | | | | 286,803 | | |
Mead Johnson Nutrition Company | | | 2,424 | | | | 171,522 | | |
Pilgrim's Pride Corporation | | | 6,947 | | | | 131,924 | | |
Pinnacle Foods, Inc. | | | 4,898 | | | | 261,798 | | |
The Hershey Company | | | 1,827 | | | | 188,967 | | |
The J.M. Smucker Company | | | 1,772 | | | | 226,922 | | |
Tyson Foods, Inc. — Class A | | | 2,907 | | | | 179,304 | | |
| | | | 2,859,710 | | |
Gas Utilities (0.3%): | |
Atmos Energy Corporation | | | 4,111 | | | | 304,831 | | |
Health Care Equipment & Supplies (3.3%): | |
Abbott Laboratories | | | 4,812 | | | | 184,829 | | |
ABIOMED, Inc. (a) | | | 1,125 | | | | 126,765 | | |
Align Technology, Inc. (a) | | | 1,743 | | | | 167,555 | | |
Becton, Dickinson and Company | | | 1,661 | | | | 274,979 | | |
Danaher Corporation | | | 4,474 | | | | 348,256 | | |
DENTSPLY SIRONA, Inc. | | | 4,009 | | | | 231,440 | | |
Edwards Lifesciences Corporation (a) | | | 1,340 | | | | 125,558 | | |
Hologic, Inc. (a) | | | 4,682 | | | | 187,842 | | |
IDEXX Laboratories, Inc. (a) | | | 1,713 | | | | 200,883 | | |
Intuitive Surgical, Inc. (a) | | | 372 | | | | 235,911 | | |
ResMed, Inc. | | | 3,277 | | | | 203,338 | | |
Stryker Corporation | | | 2,750 | | | | 329,477 | | |
Teleflex, Inc. | | | 1,399 | | | | 225,449 | | |
See notes to financial statements.
12
Victory Portfolios II
VictoryShares US 500 Volatility Wtd ETF | | Schedule of Investments — continued
December 31, 2016 | |
(Unaudited)
Security Description | | Shares | | Value | |
Health Care Equipment & Supplies (3.3%) cont'd | |
The Cooper Companies, Inc. | | | 1,290 | | | $ | 225,660 | | |
Varian Medical Systems, Inc. (a) | | | 2,644 | | | | 237,378 | | |
West Pharmaceutical Services, Inc. | | | 2,899 | | | | 245,922 | | |
| | | | 3,551,242 | | |
Health Care Providers & Services (3.6%): | |
Acadia Healthcare Company, Inc. (a) | | | 2,382 | | | | 78,844 | | |
Aetna, Inc. | | | 1,737 | | | | 215,405 | | |
AmerisourceBergen Corporation | | | 2,592 | | | | 202,669 | | |
Anthem, Inc. | | | 1,577 | | | | 226,725 | | |
Cardinal Health, Inc. | | | 2,581 | | | | 185,755 | | |
Cigna Corporation | | | 1,470 | | | | 196,083 | | |
Express Scripts Holdings Company (a) | | | 3,078 | | | | 211,736 | | |
HCA Holdings, Inc. (a) | | | 2,848 | | | | 210,809 | | |
Henry Schein, Inc. (a) | | | 1,417 | | | | 214,973 | | |
Humana, Inc. | | | 981 | | | | 200,153 | | |
Laboratory Corporation of America Holdings (a) | | | 1,931 | | | | 247,902 | | |
McKesson Corporation | | | 963 | | | | 135,253 | | |
MEDNAX, Inc. (a) | | | 3,093 | | | | 206,179 | | |
Patterson Companies, Inc. | | | 4,816 | | | | 197,600 | | |
Quest Diagnostics, Inc. | | | 3,399 | | | | 312,368 | | |
UnitedHealth Group, Inc. | | | 2,199 | | | | 351,928 | | |
Universal Health Services, Inc. — Class B | | | 1,613 | | | | 171,591 | | |
VCA, Inc. — Class A (a) | | | 2,650 | | | | 181,923 | | |
WellCare Health Plans, Inc. (a) | | | 1,457 | | | | 199,726 | | |
| | | | 3,947,622 | | |
Health Care Technology (0.3%): | |
Cerner Corporation (a) | | | 3,008 | | | | 142,489 | | |
Veeva Systems, Inc. (a) | | | 3,711 | | | | 151,038 | | |
| | | | 293,527 | | |
Hotels, Restaurants & Leisure (3.0%): | |
Aramark | | | 6,584 | | | | 235,181 | | |
Carnival Corporation | | | 3,882 | | | | 202,097 | | |
Darden Restaurants, Inc. | | | 3,880 | | | | 282,154 | | |
Domino's Pizza, Inc. | | | 1,226 | | | | 195,228 | | |
Hilton Worldwide Holdings, Inc. | | | 7,186 | | | | 195,459 | | |
Hyatt Hotels Corporation — Class A (a) | | | 3,069 | | | | 169,593 | | |
Las Vegas Sands Corporation | | | 2,580 | | | | 137,798 | | |
Marriott International, Inc. — Class A | | | 2,697 | | | | 222,988 | | |
McDonald's Corporation | | | 2,715 | | | | 330,470 | | |
Norwegian Cruise Line Holdings Ltd. (a) | | | 3,399 | | | | 144,559 | | |
Panera Bread Company — Class A (a) | | | 1,026 | | | | 210,422 | | |
Royal Caribbean Cruises Ltd. | | | 1,768 | | | | 145,047 | | |
Starbucks Corporation | | | 4,163 | | | | 231,130 | | |
Wyndham Worldwide Corporation | | | 2,543 | | | | 194,209 | | |
Wynn Resorts Ltd. | | | 1,067 | | | | 92,306 | | |
Yum! Brands, Inc. | | | 3,683 | | | | 233,244 | | |
| | | | 3,221,885 | | |
See notes to financial statements.
13
Victory Portfolios II
VictoryShares US 500 Volatility Wtd ETF | | Schedule of Investments — continued
December 31, 2016 | |
(Unaudited)
Security Description | | Shares | | Value | |
Household Durables (1.8%): | |
CalAtlantic Group, Inc. | | | 4,151 | | | $ | 141,175 | | |
D.R. Horton, Inc. | | | 5,611 | | | | 153,349 | | |
Harman International Industries, Inc. | | | 1,310 | | | | 145,620 | | |
Leggett & Platt, Inc. | | | 4,861 | | | | 237,606 | | |
Lennar Corporation — Class A | | | 4,152 | | | | 178,245 | | |
Mohawk Industries, Inc. (a) | | | 976 | | | | 194,888 | | |
Newell Rubbermaid, Inc. | | | 3,330 | | | | 148,684 | | |
NVR, Inc. (a) | | | 159 | | | | 265,371 | | |
PulteGroup, Inc. | | | 8,473 | | | | 155,734 | | |
Toll Brothers, Inc. (a) | | | 5,127 | | | | 158,937 | | |
Whirlpool Corporation | | | 1,041 | | | | 189,222 | | |
| | | | 1,968,831 | | |
Household Products (1.3%): | |
Church & Dwight Company, Inc. | | | 5,982 | | | | 264,344 | | |
Kimberly-Clark Corporation | | | 2,530 | | | | 288,724 | | |
Procter & Gamble Company | | | 4,385 | | | | 368,691 | | |
Spectrum Brands Holdings, Inc. | | | 1,684 | | | | 206,004 | | |
The Clorox Company | | | 2,497 | | | | 299,690 | | |
| | | | 1,427,453 | | |
Industrial Conglomerates (1.1%): | |
| 3M Company | | | 1,889 | | | | 337,319 | | |
Carlisle Companies, Inc. | | | 2,379 | | | | 262,380 | | |
Honeywell International, Inc. | | | 2,640 | | | | 305,844 | | |
Roper Technologies, Inc. | | | 1,292 | | | | 236,539 | | |
| | | | 1,142,082 | | |
Insurance (6.1%): | |
Aflac, Inc. | | | 4,158 | | | | 289,397 | | |
Alleghany Corporation (a) | | | 532 | | | | 323,520 | | |
American Financial Group, Inc. | | | 4,089 | | | | 360,323 | | |
AmTrust Financial Services, Inc. | | | 6,838 | | | | 187,224 | | |
Arthur J Gallagher & Company | | | 5,706 | | | | 296,484 | | |
Brown & Brown, Inc. | | | 7,669 | | | | 344,031 | | |
Cincinnati Financial Corporation | | | 4,008 | | | | 303,606 | | |
Erie Indemnity Company — Class A | | | 2,550 | | | | 286,748 | | |
First American Financial Corporation | | | 5,196 | | | | 190,329 | | |
Hartford Financial Services Group, Inc. | | | 4,791 | | | | 228,291 | | |
Lincoln National Corporation | | | 2,593 | | | | 171,838 | | |
Markel Corporation (a) | | | 309 | | | | 279,491 | | |
Marsh & McLennan Companies, Inc. | | | 4,978 | | | | 336,463 | | |
MetLife, Inc. | | | 3,280 | | | | 176,759 | | |
Old Republic International Corporation | | | 16,310 | | | | 309,890 | | |
Principal Financial Group, Inc. | | | 3,234 | | | | 187,119 | | |
Progressive Corporation | | | 9,457 | | | | 335,724 | | |
Prudential Financial, Inc. | | | 1,999 | | | | 208,016 | | |
Reinsurance Group of America, Inc. | | | 2,363 | | | | 297,336 | | |
The Allstate Corporation | | | 4,911 | | | | 364,003 | | |
The Travelers Companies, Inc. | | | 2,552 | | | | 312,416 | | |
See notes to financial statements.
14
Victory Portfolios II
VictoryShares US 500 Volatility Wtd ETF | | Schedule of Investments — continued
December 31, 2016 | |
(Unaudited)
Security Description | | Shares | | Value | |
Insurance (6.1%) cont'd | |
Torchmark Corporation | | | 3,888 | | | $ | 286,779 | | |
Unum Group | | | 4,640 | | | | 203,835 | | |
W.R. Berkley Corporation | | | 5,030 | | | | 334,545 | | |
| | | | 6,614,167 | | |
Internet & Catalog Retail (0.4%): | |
Netflix, Inc. (a) | | | 1,134 | | | | 140,389 | | |
The Priceline Group, Inc. (a) | | | 107 | | | | 156,869 | | |
TripAdvisor, Inc. (a) | | | 2,090 | | | | 96,913 | | |
| | | | 394,171 | | |
Internet & Direct Marketing Retail (0.1%): | |
Amazon.com, Inc. (a) | | | 209 | | | | 156,723 | | |
Internet Software & Services (0.8%): | |
Akamai Technologies, Inc. (a) | | | 2,201 | | | | 146,763 | | |
Alphabet, Inc. — Class A (a) | | | 286 | | | | 226,641 | | |
eBay, Inc. (a) | | | 4,964 | | | | 147,381 | | |
Facebook, Inc. — Class A (a) | | | 1,299 | | | | 149,450 | | |
VeriSign, Inc. (a) | | | 2,703 | | | | 205,617 | | |
| | | | 875,852 | | |
IT Services (5.0%): | |
Alliance Data Systems Corporation | | | 594 | | | | 135,729 | | |
Amdocs Ltd. | | | 4,743 | | | | 276,280 | | |
Automatic Data Processing, Inc. | | | 3,228 | | | | 331,774 | | |
Black Knight Financial Services, Inc. (a) | | | 4,324 | | | | 163,447 | | |
Booz Allen Hamilton Holding Corporation | | | 7,841 | | | | 282,825 | | |
Broadridge Financial Solutions, Inc. | | | 4,001 | | | | 265,266 | | |
Cognizant Technology Solutions Corporation — Class A (a) | | | 3,200 | | | | 179,296 | | |
Fidelity National Information Services, Inc. | | | 2,915 | | | | 220,491 | | |
Fiserv, Inc. (a) | | | 2,691 | | | | 285,999 | | |
FleetCor Technologies, Inc. (a) | | | 1,033 | | | | 146,190 | | |
Gartner, Inc. (a) | | | 2,602 | | | | 262,984 | | |
Genpact Ltd. (a) | | | 10,427 | | | | 253,793 | | |
Global Payments, Inc. | | | 2,112 | | | | 146,594 | | |
International Business Machines Corporation | | | 1,497 | | | | 248,487 | | |
Jack Henry & Associates, Inc. | | | 3,388 | | | | 300,787 | | |
Leidos Holdings, Inc. | | | 2,602 | | | | 133,066 | | |
MasterCard, Inc. — Class A | | | 2,336 | | | | 241,192 | | |
Paychex, Inc. | | | 4,417 | | | | 268,907 | | |
PayPal Holdings, Inc. (a) | | | 4,588 | | | | 181,088 | | |
Sabre Corporation | | | 6,547 | | | | 163,348 | | |
The Western Union Company | | | 10,101 | | | | 219,394 | | |
Total System Services, Inc. | | | 3,178 | | | | 155,817 | | |
Vantiv, Inc. — Class A (a) | | | 3,732 | | | | 222,502 | | |
Visa, Inc. — Class A | | | 2,703 | | | | 210,888 | | |
WEX, Inc. (a) | | | 1,343 | | | | 149,879 | | |
| | | | 5,446,023 | | |
See notes to financial statements.
15
Victory Portfolios II
VictoryShares US 500 Volatility Wtd ETF | | Schedule of Investments — continued
December 31, 2016 | |
(Unaudited)
Security Description | | Shares | | Value | |
Leisure Products (0.3%): | |
Hasbro, Inc. | | | 2,694 | | | $ | 209,566 | | |
Polaris Industries, Inc. | | | 1,713 | | | | 141,134 | | |
| | | | 350,700 | | |
Life Sciences Tools & Services (1.5%): | |
Agilent Technologies, Inc. | | | 4,594 | | | | 209,303 | | |
Bio-Rad Laboratories, Inc. (a) | | | 1,669 | | | | 304,225 | | |
Illumina, Inc. (a) | | | 606 | | | | 77,592 | | |
Mettler-Toledo International, Inc. (a) | | | 582 | | | | 243,602 | | |
PerkinElmer, Inc. | | | 3,617 | | | | 188,627 | | |
Quintiles Transnational Holdings, Inc. (a) | | | 2,866 | | | | 217,959 | | |
Thermo Fisher Scientific, Inc. | | | 1,618 | | | | 228,300 | | |
Waters Corporation (a) | | | 1,603 | | | | 215,427 | | |
| | | | 1,685,035 | | |
Machinery (3.6%): | |
Allison Transmission Holdings, Inc. | | | 7,506 | | | | 252,877 | | |
Cummins, Inc. | | | 1,604 | | | | 219,219 | | |
Deere & Company | | | 2,175 | | | | 224,112 | | |
Donaldson Company, Inc. | | | 5,511 | | | | 231,903 | | |
Dover Corporation | | | 2,745 | | | | 205,683 | | |
Flowserve Corporation | | | 3,290 | | | | 158,085 | | |
IDEX Corporation | | | 2,871 | | | | 258,562 | | |
Illinois Tool Works, Inc. | | | 2,468 | | | | 302,231 | | |
Ingersoll-Rand PLC | | | 3,116 | | | | 233,825 | | |
Middleby Corporation (a) | | | 1,393 | | | | 179,432 | | |
Nordson Corporation | | | 1,604 | | | | 179,728 | | |
Parker-Hannifin Corporation | | | 1,729 | | | | 242,060 | | |
Snap-on, Inc. | | | 1,509 | | | | 258,446 | | |
Stanley Black & Decker, Inc. | | | 1,985 | | | | 227,660 | | |
The Toro Company | | | 5,076 | | | | 284,002 | | |
Wabtec Corporation | | | 2,324 | | | | 192,938 | | |
Xylem, Inc. | | | 5,440 | | | | 269,389 | | |
| | | | 3,920,152 | | |
Media (2.7%): | |
CBS Corporation — Class B | | | 3,715 | | | | 236,348 | | |
Cinemark Holdings, Inc. | | | 5,170 | | | | 198,321 | | |
Comcast Corporation — Class A | | | 4,426 | | | | 305,615 | | |
Discovery Communications, Inc. (a) | | | 6,299 | | | | 172,656 | | |
Omnicom Group, Inc. | | | 3,076 | | | | 261,798 | | |
Scripps Networks Interactive, Inc. — Class A | | | 2,967 | | | | 211,755 | | |
Sirius XM Holdings, Inc. | | | 61,529 | | | | 273,804 | | |
TEGNA, Inc. | | | 7,979 | | | | 170,671 | | |
The Interpublic Group of Companies. Inc. | | | 10,147 | | | | 237,541 | | |
The Walt Disney Company | | | 2,926 | | | | 304,948 | | |
Time Warner, Inc. | | | 2,815 | | | | 271,732 | | |
Twenty-First Century Fox, Inc. — Class A | | | 8,810 | | | | 247,033 | | |
Viacom, Inc. | | | 2,539 | | | | 89,119 | | |
| | | | 2,981,341 | | |
See notes to financial statements.
16
Victory Portfolios II
VictoryShares US 500 Volatility Wtd ETF | | Schedule of Investments — continued
December 31, 2016 | |
(Unaudited)
Security Description | | Shares | | Value | |
Metals & Mining (0.2%): | |
Reliance Steel & Aluminum Company | | | 2,537 | | | $ | 201,793 | | |
Multiline Retail (0.8%): | |
Dollar General Corporation | | | 2,149 | | | | 159,176 | | |
Dollar Tree, Inc. (a) | | | 2,105 | | | | 162,464 | | |
Kohl's Corporation | | | 2,538 | | | | 125,327 | | |
Macy's, Inc. | | | 3,449 | | | | 123,509 | | |
Nordstrom, Inc. | | | 2,543 | | | | 121,886 | | |
Target Corporation | | | 3,071 | | | | 221,818 | | |
| | | | 914,180 | | |
Multi-Utilities (2.6%): | |
Ameren Corporation | | | 6,204 | | | | 325,462 | | |
CMS Energy Corporation | | | 7,510 | | | | 312,566 | | |
Consolidated Edison, Inc. | | | 4,006 | | | | 295,162 | | |
Dominion Resources, Inc. | | | 4,321 | | | | 330,945 | | |
DTE Energy Company | | | 3,352 | | | | 330,206 | | |
Public Service Enterprise Group, Inc. | | | 7,029 | | | | 308,433 | | |
SCANA Corporation | | | 4,378 | | | | 320,820 | | |
Sempra Energy | | | 2,646 | | | | 266,293 | | |
WEC Energy Group, Inc. | | | 5,033 | | | | 295,185 | | |
| | | | 2,785,072 | | |
Oil, Gas & Consumable Fuels (1.1%): | |
Cheniere Energy Partners LP Holdings LLC | | | 6,759 | | | | 151,199 | | |
Exxon Mobil Corporation | | | 2,856 | | | | 257,783 | | |
Marathon Petroleum Corporation | | | 2,538 | | | | 127,788 | | |
ONEOK, Inc. | | | 2,000 | | | | 114,820 | | |
Phillips 66 | | | 2,428 | | | | 209,803 | | |
Plains GP Holdings LP | | | 2,124 | | | | 73,660 | | |
Tesoro Corporation | | | 1,510 | | | | 132,050 | | |
Valero Energy Corporation | | | 2,549 | | | | 174,148 | | |
| | | | 1,241,251 | | |
Personal Products (0.2%): | |
Estee Lauder Companies, Inc. | | | 3,030 | | | | 231,765 | | |
Pharmaceuticals (1.4%): | |
Eli Lilly and Company | | | 3,030 | | | | 222,856 | | |
Johnson & Johnson | | | 3,246 | | | | 373,972 | | |
Mallinckrodt PLC (a) | | | 1,292 | | | | 64,367 | | |
Merck & Company, Inc. | | | 3,999 | | | | 235,421 | | |
Mylan NV (a) | | | 2,959 | | | | 112,886 | | |
Pfizer, Inc. | | | 8,477 | | | | 275,333 | | |
Zoetis, Inc. | | | 4,430 | | | | 237,138 | | |
| | | | 1,521,973 | | |
Professional Services (1.1%): | |
Dun & Bradstreet Corporation | | | 1,447 | | | | 175,550 | | |
Equifax, Inc. | | | 1,797 | | | | 212,459 | | |
ManpowerGroup, Inc. | | | 2,060 | | | | 183,072 | | |
Nielsen Holdings PLC | | | 5,301 | | | | 222,377 | | |
See notes to financial statements.
17
Victory Portfolios II
VictoryShares US 500 Volatility Wtd ETF | | Schedule of Investments — continued
December 31, 2016 | |
(Unaudited)
Security Description | | Shares | | Value | |
Professional Services (1.1%) cont'd | |
Robert Half International, Inc. | | | 3,816 | | | $ | 186,145 | | |
Verisk Analytics, Inc. (a) | | | 3,174 | | | | 257,634 | | |
| | | | 1,237,237 | | |
Real Estate Management & Development (0.4%): | |
CBRE Group, Inc. — Class A (a) | | | 4,575 | | | | 144,067 | | |
Jones Lang LaSalle, Inc. | | | 1,016 | | | | 102,656 | | |
The Howard Hughes Corporation (a) | | | 1,339 | | | | 152,780 | | |
| | | | 399,503 | | |
Road & Rail (1.4%): | |
AMERCO | | | 536 | | | | 198,100 | | |
CSX Corporation | | | 6,570 | | | | 236,060 | | |
JB Hunt Transport Services, Inc. | | | 2,956 | | | | 286,939 | | |
Kansas City Southern | | | 1,953 | | | | 165,712 | | |
Norfolk Southern Corporation | | | 1,903 | | | | 205,657 | | |
Old Dominion Freight Line, Inc. (a) | | | 2,592 | | | | 222,368 | | |
Union Pacific Corporation | | | 2,163 | | | | 224,260 | | |
| | | | 1,539,096 | | |
Semiconductors & Semiconductor Equipment (1.9%): | |
Analog Devices, Inc. | | | 3,556 | | | | 258,237 | | |
Applied Materials, Inc. | | | 5,284 | | | | 170,515 | | |
Intel Corporation | | | 5,977 | | | | 216,786 | | |
Lam Research Corporation | | | 1,950 | | | | 206,173 | | |
NVIDIA Corporation | | | 2,386 | | | | 254,682 | | |
ON Semiconductor Corporation (a) | | | 12,097 | | | | 154,358 | | |
QUALCOMM, Inc. | | | 2,818 | | | | 183,733 | | |
Skyworks Solutions, Inc. | | | 1,718 | | | | 128,266 | | |
Texas Instruments, Inc. | | | 3,291 | | | | 240,144 | | |
Xilinx, Inc. | | | 3,730 | | | | 225,180 | | |
| | | | 2,038,074 | | |
Software (2.8%): | |
Activision Blizzard, Inc. | | | 3,513 | | | | 126,854 | | |
Adobe Systems, Inc. (a) | | | 1,905 | | | | 196,120 | | |
ANSYS, Inc. (a) | | | 2,370 | | | | 219,201 | | |
CA, Inc. | | | 7,342 | | | | 233,255 | | |
Cadence Design Systems, Inc. (a) | | | 8,790 | | | | 221,684 | | |
CDK Global, Inc. | | | 3,724 | | | | 222,286 | | |
Citrix Systems, Inc. (a) | | | 2,012 | | | | 179,692 | | |
Manhattan Associates, Inc. (a) | | | 2,165 | | | | 114,810 | | |
Microsoft Corporation | | | 3,621 | | | | 225,009 | | |
Oracle Corporation | | | 6,353 | | | | 244,273 | | |
Red Hat, Inc. (a) | | | 2,535 | | | | 176,690 | | |
Symantec Corporation | | | 5,818 | | | | 138,992 | | |
Synopsys, Inc. (a) | | | 4,841 | | | | 284,941 | | |
Tyler Technologies, Inc. (a) | | | 864 | | | | 123,353 | | |
Ultimate Software Group, Inc. (a) | | | 764 | | | | 139,315 | | |
VMware, Inc. — Class A (a) | | | 2,148 | | | | 169,112 | | |
| | | | 3,015,587 | | |
See notes to financial statements.
18
Victory Portfolios II
VictoryShares US 500 Volatility Wtd ETF | | Schedule of Investments — continued
December 31, 2016 | |
(Unaudited)
Security Description | | Shares | | Value | |
Specialty Retail (3.8%): | |
Advance Auto Parts, Inc. | | | 1,363 | | | $ | 230,511 | | |
AutoNation, Inc. (a) | | | 2,977 | | | | 144,831 | | |
AutoZone, Inc. (a) | | | 376 | | | | 296,961 | | |
Bed Bath & Beyond, Inc. | | | 4,260 | | | | 173,126 | | |
Best Buy Company, Inc. | | | 3,404 | | | | 145,249 | | |
Burlington Stores, Inc. (a) | | | 1,829 | | | | 155,008 | | |
CarMax, Inc. (a) | | | 2,334 | | | | 150,286 | | |
Dick's Sporting Goods, Inc. | | | 2,685 | | | | 142,573 | | |
Foot Locker, Inc. | | | 2,685 | | | | 190,340 | | |
L Brands, Inc. | | | 2,205 | | | | 145,177 | | |
Lowe's Companies, Inc. | | | 3,115 | | | | 221,539 | | |
Michaels Companies, Inc. (a) | | | 6,312 | | | | 129,080 | | |
O'Reilly Automotive, Inc. (a) | | | 851 | | | | 236,927 | | |
Ross Stores, Inc. | | | 3,613 | | | | 237,013 | | |
Signet Jewelers Ltd. | | | 1,514 | | | | 142,710 | | |
The Gap, Inc. | | | 4,904 | | | | 110,046 | | |
The Home Depot, Inc. | | | 2,053 | | | | 275,266 | | |
The TJX Companies, Inc. | | | 3,277 | | | | 246,201 | | |
Tiffany & Company | | | 2,655 | | | | 205,577 | | |
Tractor Supply Company | | | 2,688 | | | | 203,777 | | |
Ulta Salon, Cosmetics & Fragrances, Inc. (a) | | | 643 | | | | 163,926 | | |
Urban Outfitters, Inc. (a) | | | 3,397 | | | | 96,747 | | |
Williams-Sonoma, Inc. | | | 2,803 | | | | 135,637 | | |
| | | | 4,178,508 | | |
Technology Hardware, Storage & Peripherals (0.3%): | |
Apple, Inc. | | | 1,883 | | | | 218,089 | | |
HP, Inc. | | | 10,618 | | | | 157,571 | | |
| | | | 375,660 | | |
Textiles, Apparel & Luxury Goods (0.8%): | |
Carter's, Inc. | | | 1,836 | | | | 158,612 | | |
Coach, Inc. | | | 4,415 | | | | 154,613 | | |
Hanesbrands, Inc. | | | 5,449 | | | | 117,535 | | |
NIKE, Inc. — Class B | | | 3,737 | | | | 189,952 | | |
PVH Corporation | | | 1,338 | | | | 120,741 | | |
VF Corporation | | | 3,193 | | | | 170,347 | | |
| | | | 911,800 | | |
Thrifts & Mortgage Finance (0.3%): | |
TFS Financial Corporation | | | 15,278 | | | | 290,893 | | |
Tobacco (0.9%): | |
Altria Group, Inc. | | | 5,439 | | | | 367,785 | | |
Philip Morris International, Inc. | | | 3,387 | | | | 309,876 | | |
Reynolds American, Inc. | | | 5,568 | | | | 312,031 | | |
| | | | 989,692 | | |
Trading Companies & Distributors (1.1%): | |
Fastenal Company | | | 5,009 | | | | 235,323 | | |
MSC Industrial Direct Company, Inc. | | | 3,358 | | | | 310,246 | | |
See notes to financial statements.
19
Victory Portfolios II
VictoryShares US 500 Volatility Wtd ETF | | Schedule of Investments — continued
December 31, 2016 | |
(Unaudited)
Security Description | | Shares | | Value | |
Trading Companies & Distributors (1.1%) cont'd | |
United Rentals, Inc. (a) | | | 1,235 | | | $ | 130,391 | | |
W.W. Grainger, Inc. | | | 1,077 | | | | 250,133 | | |
Watsco, Inc. | | | 1,714 | | | | 253,878 | | |
| | | | 1,179,971 | | |
Transportation Infrastructure (0.2%): | |
Macquarie Infrastructure Company LLC | | | 2,096 | | | | 171,243 | | |
Water Utilities (0.5%): | |
American Water Works Company, Inc. | | | 3,496 | | | | 252,971 | | |
Aqua America, Inc. | | | 9,379 | | | | 281,745 | | |
| | | | 534,716 | | |
Wireless Telecommunication Services (0.2%): | |
T-Mobile US, Inc. (a) | | | 4,004 | | | | 230,270 | | |
Total Common Stocks (Cost $103,172,149) | | | 108,694,041 | | |
Short-Term Investments (0.1%) | |
Money Market Funds (0.1%): | |
Short-Term Investments Trust Government & Agency Portfolio —
Institutional Class, 0.43% (b) | | | 130,818 | | | | 130,818 | | |
Total Short-Term Investments (Cost $130,818) | | | 130,818 | | |
Total Investments — 99.9% (Cost $103,302,967) | | | 108,824,859 | | |
Other assets in excess of liabilities — 0.1% | | | 102,872 | | |
NET ASSETS — 100.0% | | $ | 108,927,731 | | |
(a) Non-income producing security.
(b) Annualized seven-day yield as of December 31, 2016.
The Global Industry Classification Standard (GICS®) was developed by and/or is the exclusive property of MSCI, Inc. and Standard & Poor's Financial Services LLC ("S&P"). GICS® is a service mark of MSCI, Inc. and S&P and has been licensed for use by the Fund's Administrator, U.S. Bancorp Fund Services, LLC.
Schedule of Open Futures Contracts
Number of
Contracts
Purchased | | Description | | Notional Value | | Unrealized
Appreciation | |
| | 1 | | | S&P 500 E-Mini Future, March 2017 | | $ | 111,810 | | | $ | 233 | | |
| | | $ | 233 | | |
See notes to financial statements.
20
Victory Portfolios II
VictoryShares US Discovery Enhanced Volatility Wtd ETF | | Schedule of Investments
December 31, 2016 | |
(Unaudited)
Security Description | | Shares | | Value | |
Common Stocks (100.0%) | |
Aerospace & Defense (1.3%): | |
AAR Corporation | | | 2,068 | | | $ | 68,347 | | |
Astronics Corporation (a) | | | 137 | | | | 4,617 | | |
Astronics Corporation (a) | | | 980 | | | | 33,163 | | |
DigitalGlobe, Inc. (a) | | | 1,787 | | | | 51,198 | | |
Mercury Systems, Inc. (a) | | | 2,702 | | | | 81,654 | | |
Moog, Inc. — Class A (a) | | | 978 | | | | 64,235 | | |
National Presto Industries, Inc. | | | 930 | | | | 98,952 | | |
TASER International, Inc. (a) | | | 2,173 | | | | 52,674 | | |
| | | | 454,840 | | |
Air Freight & Logistics (0.5%): | |
Air Transport Services Group, Inc. (a) | | | 3,855 | | | | 61,526 | | |
Echo Global Logistics, Inc. (a) | | | 2,397 | | | | 60,045 | | |
Hub Group, Inc. — Class A (a) | | | 1,669 | | | | 73,018 | | |
| | | | 194,589 | | |
Airlines (0.7%): | |
Allegiant Travel Company | | | 429 | | | | 71,386 | | |
Hawaiian Holdings, Inc. (a) | | | 1,070 | | | | 60,990 | | |
SkyWest, Inc. | | | 1,697 | | | | 61,856 | | |
Spirit Airlines, Inc. (a) | | | 1,183 | | | | 68,448 | | |
| | | | 262,680 | | |
Auto Components (2.1%): | |
American Axle & Manufacturing Holdings, Inc. (a) | | | 2,277 | | | | 43,946 | | |
Cooper Standard Holding, Inc. (a) | | | 720 | | | | 74,434 | | |
Cooper Tire & Rubber Company | | | 1,843 | | | | 71,601 | | |
Dorman Products, Inc. (a) | | | 1,157 | | | | 84,530 | | |
Drew Industries, Inc. | | | 764 | | | | 82,321 | | |
Fox Factory Holdings Corporation (a) | | | 2,972 | | | | 82,473 | | |
Gentherm, Inc. (a) | | | 1,412 | | | | 47,796 | | |
Metaldyne Performance Group, Inc. | | | 2,953 | | | | 67,771 | | |
Standard Motor Products, Inc. | | | 1,245 | | | | 66,259 | | |
Stoneridge, Inc. (a) | | | 2,965 | | | | 52,451 | | |
Superior Industries International, Inc. | | | 2,272 | | | | 59,867 | | |
Visteon Corporation | | | 430 | | | | 34,546 | | |
| | | | 767,995 | | |
Automobiles (0.2%): | |
Winnebago Industries, Inc. | | | 2,748 | | | | 86,974 | | |
Banks (16.3%): | |
1st Source Corporation | | | 2,654 | | | | 118,528 | | |
Ameris Bancorp | | | 2,282 | | | | 99,495 | | |
Associated Banc-Corp | | | 3,722 | | | | 91,933 | | |
Banc of California, Inc. | | | 2,815 | | | | 48,840 | | |
BancFirst Corporation | | | 1,191 | | | | 110,823 | | |
BancorpSouth, Inc. | | | 2,808 | | | | 87,188 | | |
Banner Corporation | | | 1,763 | | | | 98,393 | | |
BNC Bancorp | | | 3,282 | | | | 104,696 | | |
See notes to financial statements.
21
Victory Portfolios II
VictoryShares US Discovery Enhanced Volatility Wtd ETF | | Schedule of Investments — continued
December 31, 2016 | |
(Unaudited)
Security Description | | Shares | | Value | |
Banks (16.3%) cont'd | |
Boston Private Financial Holdings, Inc. | | | 5,805 | | | $ | 96,073 | | |
Capital Bank Financial Corporation | | | 2,912 | | | | 114,296 | | |
Cathay General Bancorp | | | 2,410 | | | | 91,652 | | |
Chemical Financial Corporation | | | 2,020 | | | | 109,423 | | |
Columbia Banking System, Inc. | | | 2,262 | | | | 101,066 | | |
Community Bank Systems, Inc. | | | 1,915 | | | | 118,328 | | |
CVB Financial Corporation | | | 4,358 | | | | 99,929 | | |
Eagle Bancorp, Inc. (a) | | | 1,427 | | | | 86,976 | | |
FCB Financial Holdings, Inc. (a) | | | 1,957 | | | | 93,349 | | |
First Busey Corporation | | | 4,327 | | | | 133,185 | | |
First Commonwealth Financial Corporation | | | 7,640 | | | | 108,335 | | |
First Financial Bancorp | | | 3,954 | | | | 112,491 | | |
First Financial Bankshares, Inc. | | | 1,837 | | | | 83,032 | | |
First Interstate BancSystem, Inc. — Class A | | | 3,002 | | | | 127,735 | | |
First Merchants Corporation | | | 3,182 | | | | 119,802 | | |
First Midwest Bancorp, Inc. | | | 3,890 | | | | 98,145 | | |
FNB Corporation | | | 5,936 | | | | 95,154 | | |
Fulton Financial Corporation | | | 5,705 | | | | 107,254 | | |
Glacier Bancorp, Inc. | | | 2,597 | | | | 94,089 | | |
Great Western Bancorp, Inc. | | | 2,160 | | | | 94,154 | | |
Hancock Holding Company | | | 1,812 | | | | 78,097 | | |
Heartland Financial USA, Inc. | | | 1,764 | | | | 84,672 | | |
Hilltop Holdings, Inc. | | | 2,808 | | | | 83,678 | | |
Hope Bancorp, Inc. | | | 4,215 | | | | 92,266 | | |
IBERIABANK Corporation | | | 934 | | | | 78,223 | | |
Independent Bank Corporation | | | 1,481 | | | | 104,337 | | |
International Bancshares Corporation | | | 2,275 | | | | 92,820 | | |
Lakeland Financial Corporation | | | 2,796 | | | | 132,419 | | |
LegacyTexas Financial Group, Inc. | | | 1,732 | | | | 74,580 | | |
MB Financial, Inc. | | | 1,946 | | | | 91,910 | | |
NBT Bancorp, Inc. | | | 2,811 | | | | 117,725 | | |
Old National Bancorp | | | 5,701 | | | | 103,473 | | |
Opus Bank | | | 1,741 | | | | 52,317 | | |
Park National Corporation | | | 790 | | | | 94,531 | | |
Pinnacle Financial Partners, Inc. | | | 1,250 | | | | 86,625 | | |
Renasant Corporation | | | 2,301 | | | | 97,148 | | |
S&T Bancorp, Inc. | | | 2,525 | | | | 98,576 | | |
ServisFirst Bancshares, Inc. | | | 2,660 | | | | 99,590 | | |
Simmons First National Corporation — Class A | | | 1,445 | | | | 89,807 | | |
South State Corporation | | | 1,092 | | | | 95,441 | | |
Sterling Bancorp | | | 4,481 | | | | 104,855 | | |
TCF Financial Corporation | | | 4,399 | | | | 86,176 | | |
Texas Capital Bancshares, Inc. (a) | | | 861 | | | | 67,502 | | |
Tompkins Financial Corporation | | | 1,064 | | | | 100,591 | | |
Towne Bank | | | 3,802 | �� | | | 126,417 | | |
Trustmark Corporation | | | 3,165 | | | | 112,832 | | |
Union Bankshares Corporation | | | 3,151 | | | | 112,617 | | |
United Community Banks, Inc. | | | 3,722 | | | | 110,246 | | |
Valley National Bancorp | | | 8,343 | | | | 97,113 | | |
WesBanco, Inc. | | | 3,080 | | | | 132,625 | | |
See notes to financial statements.
22
Victory Portfolios II
VictoryShares US Discovery Enhanced Volatility Wtd ETF | | Schedule of Investments — continued
December 31, 2016 | |
(Unaudited)
Security Description | | Shares | | Value | |
Banks (16.3%) cont'd | |
Westamerica Bancorporation | | | 1,658 | | | $ | 104,338 | | |
Wintrust Financial Corporation | | | 1,310 | | | | 95,067 | | |
| | | | 5,942,978 | | |
Beverages (0.4%): | |
MGP Ingredients, Inc. | | | 960 | | | | 47,981 | | |
National Beverage Corporation | | | 1,059 | | | | 54,093 | | |
The Boston Beer Company, Inc. — Class A (a) | | | 294 | | | | 49,936 | | |
| | | | 152,010 | | |
Biotechnology (0.4%): | |
Insys Therapeutics, Inc. (a) | | | 1,793 | | | | 16,495 | | |
MiMedx Group, Inc. (a) | | | 6,437 | | | | 57,032 | | |
Myriad Genetics, Inc. (a) | | | 1,764 | | | | 29,406 | | |
Repligen Corporation (a) | | | 1,273 | | | | 39,234 | | |
| | | | 142,167 | | |
Building Products (2.6%): | |
AAON, Inc. | | | 2,359 | | | | 77,965 | | |
American Woodmark Corporation (a) | | | 580 | | | | 43,645 | | |
Apogee Enterprises, Inc. | | | 1,369 | | | | 73,324 | | |
Continental Building Products, Inc. (a) | | | 2,654 | | | | 61,307 | | |
CSW Industrials, Inc. (a) | | | 2,620 | | | | 96,547 | | |
Gibraltar Industries, Inc. (a) | | | 1,166 | | | | 48,564 | | |
Griffon Corporation | | | 4,873 | | | | 127,673 | | |
Insteel Industries, Inc. | | | 1,564 | | | | 55,741 | | |
NCI Building Systems, Inc. (a) | | | 3,565 | | | | 55,792 | | |
Patrick Industries, Inc. (a) | | | 727 | | | | 55,470 | | |
PGT, Inc. (a) | | | 3,857 | | | | 44,163 | | |
Simpson Manufacturing Company, Inc. | | | 2,250 | | | | 98,437 | | |
Trex Company, Inc. (a) | | | 856 | | | | 55,126 | | |
Universal Forest Products, Inc. | | | 564 | | | | 57,630 | | |
| | | | 951,384 | | |
Capital Markets (2.4%): | |
Artisan Partners Asset Management, Inc. — Class A | | | 2,099 | | | | 62,445 | | |
BGC Partners, Inc. — Class A | | | 10,278 | | | | 105,144 | | |
Cohen & Steers, Inc. | | | 1,750 | | | | 58,800 | | |
Evercore Partners, Inc. — Class A | | | 1,066 | | | | 73,234 | | |
Financial Engines, Inc. | | | 1,527 | | | | 56,117 | | |
Houlihan Lokey, Inc. | | | 2,784 | | | | 86,638 | | |
Janus Capital Group, Inc. | | | 4,126 | | | | 54,752 | | |
LPL Financial Holdings, Inc. | | | 976 | | | | 34,365 | | |
Moelis & Company — Class A | | | 2,436 | | | | 82,580 | | |
NorthStar Asset Management Group, Inc. | | | 3,807 | | | | 56,800 | | |
Stifel Financial Corporation (a) | | | 1,231 | | | | 61,489 | | |
Virtu Financial, Inc. | | | 4,401 | | | | 70,196 | | |
Waddell & Reed Financial, Inc. — Class A | | | 2,321 | | | | 45,283 | | |
WisdomTree Investments, Inc. | | | 3,520 | | | | 39,213 | | |
| | | | 887,056 | | |
See notes to financial statements.
23
Victory Portfolios II
VictoryShares US Discovery Enhanced Volatility Wtd ETF | | Schedule of Investments — continued
December 31, 2016 | |
(Unaudited)
Security Description | | Shares | | Value | |
Chemicals (2.3%): | |
American Vanguard Corporation | | | 2,212 | | | $ | 42,360 | | |
Balchem Corporation | | | 907 | | | | 76,116 | | |
Calgon Carbon Corporation | | | 3,842 | | | | 65,314 | | |
FutureFuel Corporation | | | 4,470 | | | | 62,133 | | |
HB Fuller Company | | | 1,752 | | | | 84,639 | | |
Innospec, Inc. | | | 1,294 | | | | 88,639 | | |
Minerals Technologies, Inc. | | | 817 | | | | 63,113 | | |
PolyOne Corporation | | | 1,909 | | | | 61,164 | | |
Quaker Chemical Corporation | | | 823 | | | | 105,295 | | |
Rayonier Advanced Materials, Inc. | | | 2,459 | | | | 38,016 | | |
Stepan Company | | | 984 | | | | 80,176 | | |
Trinseo SA | | | 992 | | | | 58,826 | | |
| | | | 825,791 | | |
Commercial Services & Supplies (3.6%): | |
ABM Industries, Inc. | | | 2,791 | | | | 113,984 | | |
ACCO Brands Corporation (a) | | | 4,960 | | | | 64,728 | | |
Healthcare Services Group, Inc. | | | 2,624 | | | | 102,782 | | |
Herman Miller, Inc. | | | 1,977 | | | | 67,613 | | |
HNI Corporation | | | 1,170 | | | | 65,426 | | |
Interface, Inc. | | | 3,189 | | | | 59,156 | | |
Knoll, Inc. | | | 2,835 | | | | 79,182 | | |
Matthews International Corporation — Class A | | | 1,529 | | | | 117,504 | | |
McGrath RentCorp | | | 2,355 | | | | 92,292 | | |
Mobile Mini, Inc. | | | 1,971 | | | | 59,623 | | |
MSA Safety, Inc. | | | 1,320 | | | | 91,516 | | |
Multi-Color Corporation | | | 756 | | | | 58,666 | | |
Steelcase, Inc. — Class A | | | 5,035 | | | | 90,126 | | |
UniFirst Corporation | | | 717 | | | | 102,997 | | |
US Ecology, Inc. | | | 1,347 | | | | 66,205 | | |
West Corporation | | | 2,617 | | | | 64,797 | | |
| | | | 1,296,597 | | |
Communications Equipment (1.1%): | |
ADTRAN, Inc. | | | 3,806 | | | | 85,064 | | |
Finisar Corporation (a) | | | 2,136 | | | | 64,657 | | |
Infinera Corporation (a) | | | 3,274 | | | | 27,796 | | |
InterDigital, Inc. | | | 1,097 | | | | 100,211 | | |
NETGEAR, Inc. (a) | | | 1,261 | | | | 68,535 | | |
Plantronics, Inc. | | | 846 | | | | 46,327 | | |
| | | | 392,590 | | |
Construction & Engineering (1.0%): | |
Argan, Inc. | | | 1,248 | | | | 88,046 | | |
Comfort Systems USA, Inc. | | | 2,236 | | | | 74,459 | | |
Dycom Industries, Inc. (a) | | | 534 | | | | 42,875 | | |
KBR, Inc. | | | 3,544 | | | | 59,149 | | |
Primoris Services Corporation | | | 3,024 | | | | 68,887 | | |
Tutor Perini Corporation (a) | | | 1,541 | | | | 43,148 | | |
| | | | 376,564 | | |
See notes to financial statements.
24
Victory Portfolios II
VictoryShares US Discovery Enhanced Volatility Wtd ETF | | Schedule of Investments — continued
December 31, 2016 | |
(Unaudited)
Security Description | | Shares | | Value | |
Construction Materials (0.2%): | |
Headwaters, Inc. (a) | | | 3,318 | | | $ | 78,039 | | |
Consumer Finance (0.5%): | |
FirstCash, Inc. | | | 956 | | | | 44,932 | | |
Nelnet, Inc. — Class A | | | 1,711 | | | | 86,833 | | |
PRA Group, Inc. (a) | | | 1,122 | | | | 43,870 | | |
| | | | 175,635 | | |
Containers & Packaging (0.3%): | |
Silgan Holdings, Inc. | | | 1,995 | | | | 102,104 | | |
Distributors (0.2%): | |
Core-Mark Holding Company, Inc. | | | 1,526 | | | | 65,725 | | |
Diversified Consumer Services (0.8%): | |
Capella Education Company | | | 1,218 | | | | 106,940 | | |
Grand Canyon Education, Inc. (a) | | | 1,745 | | | | 101,995 | | |
Strayer Education, Inc. (a) | | | 1,096 | | | | 88,371 | | |
| | | | 297,306 | | |
Diversified Telecommunication Services (0.5%): | |
Cincinnati Bell, Inc. (a) | | | 2,596 | | | | 58,020 | | |
Cogent Communications Holdings, Inc. | | | 1,779 | | | | 73,562 | | |
Inteliquent, Inc. | | | 2,900 | | | | 66,468 | | |
| | | | 198,050 | | |
Electric Utilities (1.0%): | |
ALLETE, Inc. | | | 1,851 | | | | 118,816 | | |
MGE Energy, Inc. | | | 1,821 | | | | 118,911 | | |
Otter Tail Corporation | | | 2,802 | | | | 114,322 | | |
| | | | 352,049 | | |
Electrical Equipment (0.7%): | |
AZZ, Inc. | | | 1,231 | | | | 78,661 | | |
Encore Wire Corporation | | | 1,513 | | | | 65,588 | | |
Generac Holdings, Inc. (a) | | | 1,424 | | | | 58,014 | | |
Thermon Group Holdings, Inc. (a) | | | 3,354 | | | | 64,028 | | |
| | | | 266,291 | | |
Electronic Equipment, Instruments & Components (3.7%): | |
Anixter International, Inc. (a) | | | 833 | | | | 67,515 | | |
AVX Corporation | | | 6,690 | | | | 104,565 | | |
Badger Meter, Inc. | | | 2,221 | | | | 82,066 | | |
Benchmark Electronics, Inc. (a) | | | 2,831 | | | | 86,345 | | |
Coherent, Inc. (a) | | | 526 | | | | 72,265 | | |
ePlus, Inc. (a) | | | 602 | | | | 69,350 | | |
II-VI, Inc. (a) | | | 2,762 | | | | 81,893 | | |
Insight Enterprises, Inc. (a) | | | 1,793 | | | | 72,509 | | |
Littelfuse, Inc. | | | 644 | | | | 97,740 | | |
Methode Electronics, Inc. | | | 1,831 | | | | 75,712 | | |
MTS Systems Corporation | | | 994 | | | | 56,360 | | |
OSI Systems, Inc. (a) | | | 518 | | | | 39,430 | | |
Plexus Corporation (a) | | | 1,559 | | | | 84,248 | | |
See notes to financial statements.
25
Victory Portfolios II
VictoryShares US Discovery Enhanced Volatility Wtd ETF | | Schedule of Investments — continued
December 31, 2016 | |
(Unaudited)
Security Description | | Shares | | Value | |
Electronic Equipment, Instruments & Components (3.7%) cont'd | |
Rogers Corporation (a) | | | 870 | | | $ | 66,825 | | |
Sanmina Corporation (a) | | | 2,087 | | | | 76,489 | | |
ScanSource, Inc. (a) | | | 1,547 | | | | 62,421 | | |
Tech Data Corporation (a) | | | 872 | | | | 73,841 | | |
Universal Display Corporation (a) | | | 726 | | | | 40,874 | | |
VeriFone Systems, Inc. (a) | | | 2,648 | | | | 46,949 | | |
| | | | 1,357,397 | | |
Energy Equipment & Services (0.4%): | |
Atwood Oceanics, Inc. | | | 2,785 | | | | 36,567 | | |
Dril-Quip, Inc. (a) | | | 1,114 | | | | 66,895 | | |
Oceaneering International, Inc. | | | 1,770 | | | | 49,932 | | |
| | | | 153,394 | | |
Food & Staples Retailing (1.2%): | |
Ingles Markets, Inc. — Class A | | | 1,381 | | | | 66,426 | | |
Performance Food Group Company (a) | | | 2,648 | | | | 63,552 | | |
PriceSmart, Inc. | | | 892 | | | | 74,482 | | |
SpartanNash Company | | | 1,692 | | | | 66,902 | | |
SUPERVALU, Inc. (a) | | | 6,443 | | | | 30,089 | | |
United Natural Foods, Inc. (a) | | | 974 | | | | 46,479 | | |
Weis Markets, Inc. | | | 1,541 | | | | 103,000 | | |
| | | | 450,930 | | |
Food Products (1.5%): | |
Calavo Growers, Inc. | | | 888 | | | | 54,523 | | |
Dean Foods Company | | | 4,198 | | | | 91,432 | | |
J&J Snack Foods Corporation | | | 1,036 | | | | 138,233 | | |
John B Sanfilippo & Son, Inc. | | | 881 | | | | 62,014 | | |
Omega Protein Corporation (a) | | | 1,578 | | | | 39,529 | | |
Sanderson Farms, Inc. | | | 698 | | | | 65,780 | | |
Tootsie Roll Industries, Inc. | | | 2,714 | | | | 107,882 | | |
| | | | 559,393 | | |
Gas Utilities (0.2%): | |
Chesapeake Utilities Corporation | | | 1,096 | | | | 73,377 | | |
Health Care Equipment & Supplies (2.6%): | |
Abaxis, Inc. | | | 1,100 | | | | 58,047 | | |
Anika Therapeutics, Inc. (a) | | | 1,356 | | | | 66,390 | | |
Atrion Corporation | | | 218 | | | | 110,569 | | |
CryoLife, Inc. (a) | | | 3,449 | | | | 66,048 | | |
Cynosure, Inc. (a) | | | 1,052 | | | | 47,971 | | |
Globus Medical, Inc. (a) | | | 2,487 | | | | 61,702 | | |
ICU Medical, Inc. (a) | | | 577 | | | | 85,021 | | |
Inogen, Inc. (a) | | | 840 | | | | 56,423 | | |
Masimo Corporation (a) | | | 1,244 | | | | 83,846 | | |
Meridian Bioscience, Inc. | | | 4,194 | | | | 74,234 | | |
Merit Medical Systems, Inc. (a) | | | 2,806 | | | | 74,359 | | |
Natus Medical, Inc. (a) | | | 1,085 | | | | 37,758 | | |
Neogen Corporation (a) | | | 1,099 | | | | 72,534 | | |
Penumbra, Inc. (a) | | | 737 | | | | 47,021 | | |
| | | | 941,923 | | |
See notes to financial statements.
26
Victory Portfolios II
VictoryShares US Discovery Enhanced Volatility Wtd ETF | | Schedule of Investments — continued
December 31, 2016 | |
(Unaudited)
Security Description | | Shares | | Value | |
Health Care Providers & Services (3.2%): | |
Aceto Corporation | | | 2,198 | | | $ | 48,290 | | |
Adeptus Health, Inc. (a) | | | 906 | | | | 6,922 | | |
Air Methods Corporation (a) | | | 1,579 | | | | 50,291 | | |
Amedisys, Inc. (a) | | | 1,076 | | | | 45,870 | | |
AMN Healthcare Services, Inc. (a) | | | 1,335 | | | | 51,331 | | |
BioTelemetry, Inc. (a) | | | 2,378 | | | �� | 53,148 | | |
Chemed Corporation | | | 650 | | | | 104,267 | | |
CorVel Corporation (a) | | | 1,663 | | | | 60,866 | | |
Diplomat Pharmacy, Inc. (a) | | | 1,198 | | | | 15,095 | | |
HealthEquity, Inc. (a) | | | 1,375 | | | | 55,715 | | |
LHC Group, Inc. (a) | | | 1,823 | | | | 83,311 | | |
Lifepoint Health, Inc. (a) | | | 1,093 | | | | 62,082 | | |
National HealthCare Corporation | | | 1,740 | | | | 131,875 | | |
Owens & Minor, Inc. | | | 2,522 | | | | 89,001 | | |
PharMerica Corporation (a) | | | 1,369 | | | | 34,430 | | |
Select Medical Holdings Corporation (a) | | | 3,485 | | | | 46,176 | | |
Surgical Care Affiliates, Inc. (a) | | | 1,481 | | | | 68,526 | | |
The Ensign Group, Inc. | | | 2,940 | | | | 65,298 | | |
US Physical Therapy, Inc. | | | 1,132 | | | | 79,466 | | |
| | | | 1,151,960 | | |
Health Care Technology (0.3%): | |
HealthStream, Inc. (a) | | | 2,035 | | | | 50,977 | | |
HMS Holdings Corporation (a) | | | 2,199 | | | | 39,934 | | |
Inovalon Holdings, Inc. — Class A (a) | | | 2,210 | | | | 22,763 | | |
| | | | 113,674 | | |
Hotels, Restaurants & Leisure (5.3%): | |
BJ's Restaurants, Inc. (a) | | | 1,786 | | | | 70,190 | | |
Bob Evans Farms, Inc. | | | 2,005 | | | | 106,686 | | |
Bojangles', Inc. (a) | | | 2,975 | | | | 55,484 | | |
Brinker International, Inc. | | | 1,329 | | | | 65,825 | | |
Buffalo Wild Wings, Inc. (a) | | | 359 | | | | 55,429 | | |
Choice Hotels International, Inc. | | | 1,678 | | | | 94,052 | | |
Churchill Downs, Inc. | | | 541 | | | | 81,393 | | |
Chuy's Holdings, Inc. (a) | | | 1,937 | | | | 62,856 | | |
Dave & Buster's Entertainment, Inc. (a) | | | 1,330 | | | | 74,879 | | |
DineEquity, Inc. | | | 1,101 | | | | 84,777 | | |
El Pollo Loco Holdings, Inc. (a) | | | 3,236 | | | | 39,803 | | |
Eldorado Resorts, Inc. (a) | | | 4,943 | | | | 83,784 | | |
Fiesta Restaurant Group, Inc. (a) | | | 1,789 | | | | 53,402 | | |
ILG, Inc | | | 3,599 | | | | 65,394 | | |
Isle of Capri Casinos, Inc. (a) | | | 3,349 | | | | 82,687 | | |
Marriott Vacations Worldwide Corporation | | | 706 | | | | 59,904 | | |
Papa John's International, Inc. | | | 934 | | | | 79,932 | | |
Popeyes Louisiana Kitchen, Inc. (a) | | | 1,537 | | | | 92,958 | | |
Red Robin Gourmet Burgers, Inc. (a) | | | 1,019 | | | | 57,471 | | |
Ruth's Hospitality Group, Inc. | | | 4,952 | | | | 90,622 | | |
Shake Shack, Inc. (a) | | | 1,172 | | | | 41,946 | | |
Sonic Corporation | | | 2,229 | | | | 59,091 | | |
See notes to financial statements.
27
Victory Portfolios II
VictoryShares US Discovery Enhanced Volatility Wtd ETF | | Schedule of Investments — continued
December 31, 2016 | |
(Unaudited)
Security Description | | Shares | | Value | |
Hotels, Restaurants & Leisure (5.3%) cont'd | |
The Cheesecake Factory, Inc. | | | 1,824 | | | $ | 109,221 | | |
The Marcus Corporation | | | 3,241 | | | | 102,091 | | |
Wendy's Company | | | 6,960 | | | | 94,099 | | |
Wingstop, Inc. | | | 1,766 | | | | 52,256 | | |
| | | | 1,916,232 | | |
Household Durables (2.9%): | |
Cavco Industries, Inc. (a) | | | 634 | | | | 63,305 | | |
Ethan Allen Interiors, Inc. | | | 1,994 | | | | 73,479 | | |
Helen of Troy Ltd. (a) | | | 936 | | | | 79,045 | | |
Installed Building Products, Inc. (a) | | | 1,453 | | | | 60,009 | | |
iRobot Corporation (a) | | | 1,583 | | | | 92,526 | | |
KB Home | | | 3,325 | | | | 52,568 | | |
La-Z-Boy, Inc. | | | 2,014 | | | | 62,535 | | |
LGI Homes, Inc. (a) | | | 1,103 | | | | 31,689 | | |
M/I Homes, Inc. (a) | | | 2,829 | | | | 71,234 | | |
MDC Holdings, Inc. | | | 2,803 | | | | 71,928 | | |
Meritage Homes Corporation (a) | | | 1,386 | | | | 48,233 | | |
Taylor Morrison Home Corporation — Class A (a) | | | 3,113 | | | | 59,956 | | |
TopBuild Corporation (a) | | | 1,816 | | | | 64,650 | | |
TRI Pointe Group, Inc. (a) | | | 4,340 | | | | 49,823 | | |
Universal Electronics, Inc. (a) | | | 890 | | | | 57,450 | | |
WCI Communities, Inc. (a) | | | 2,876 | | | | 67,442 | | |
William Lyon Homes (a) | | | 1,842 | | | | 35,053 | | |
| | | | 1,040,925 | | |
Household Products (0.3%): | |
WD-40 Company | | | 850 | | | | 99,365 | | |
Independent Power and Renewable Electricity Producers (0.1%): | |
8Point3 Energy Partners LP | | | 3,967 | | | | 51,492 | | |
Independent Power and Renewable Electricity Producers (0.3%): | |
Ormat Technologies, Inc. | | | 1,963 | | | | 105,256 | | |
Insurance (4.2%): | |
AMERISAFE, Inc. | | | 1,484 | | | | 92,527 | | |
CNO Financial Group, Inc. | | | 3,771 | | | | 72,215 | | |
Employers Holdings, Inc. | | | 2,038 | | | | 80,705 | | |
FBL Financial Group, Inc. — Class A | | | 1,256 | | | | 98,156 | | |
Fidelity & Guaranty Life | | | 5,703 | | | | 135,161 | | |
Horace Mann Educators Corporation | | | 2,466 | | | | 105,545 | | |
Infinity Property & Casualty Corporation | | | 1,311 | | | | 115,237 | | |
Mercury General Corporation | | | 1,753 | | | | 105,548 | | |
National General Holdings Corporation | | | 3,339 | | | | 83,442 | | |
Navigators Group, Inc. | | | 994 | | | | 117,044 | | |
Primerica, Inc. | | | 1,097 | | | | 75,858 | | |
ProAssurance Corporation | | | 2,326 | | | | 130,721 | | |
Safety Insurance Group, Inc. | | | 1,730 | | | | 127,501 | | |
Selective Insurance Group, Inc. | | | 2,305 | | | | 99,230 | | |
United Fire Group, Inc. | | | 1,873 | | | | 92,095 | | |
| | | | 1,530,985 | | |
See notes to financial statements.
28
Victory Portfolios II
VictoryShares US Discovery Enhanced Volatility Wtd ETF | | Schedule of Investments — continued
December 31, 2016 | |
(Unaudited)
Security Description | | Shares | | Value | |
Internet & Catalog Retail (0.3%): | |
HSN, Inc. | | | 1,585 | | | $ | 54,365 | | |
Nutrisystem, Inc. | | | 1,690 | | | | 58,559 | | |
| | | | 112,924 | | |
Internet Software & Services (0.7%): | |
Alarm.com Holdings, Inc. (a) | | | 1,682 | | | | 46,810 | | |
NIC, Inc. | | | 3,366 | | | | 80,447 | | |
Shutterstock, Inc. (a) | | | 755 | | | | 35,878 | | |
SPS Commerce, Inc. (a) | | | 722 | | | | 50,460 | | |
WebMD Health Corporation (a) | | | 1,161 | | | | 57,551 | | |
| | | | 271,146 | | |
IT Services (2.7%): | |
CACI International, Inc. — Class A (a) | | | 602 | | | | 74,829 | | |
Cass Information Systems, Inc. | | | 1,445 | | | | 106,309 | | |
Convergys Corporation | | | 2,738 | | | | 67,245 | | |
CSG Systems International, Inc. | | | 1,572 | | | | 76,085 | | |
ExlService Holdings, Inc. (a) | | | 1,501 | | | | 75,710 | | |
Forrester Research, Inc. | | | 2,001 | | | | 85,943 | | |
ManTech International Corporation — Class A | | | 1,834 | | | | 77,486 | | |
NeuStar, Inc. — Class A (a) | | | 2,178 | | | | 72,745 | | |
Perficient, Inc. (a) | | | 3,459 | | | | 60,498 | | |
Science Applications International Corporation | | | 1,146 | | | | 97,181 | | |
Sykes Enterprises, Inc. (a) | | | 2,898 | | | | 83,636 | | |
TeleTech Holdings, Inc. | | | 3,092 | | | | 94,306 | | |
| | | | 971,973 | | |
Leisure Products (0.5%): | |
Nautilus, Inc. (a) | | | 1,571 | | | | 29,063 | | |
Smith & Wesson Holdings Corporation (a) | | | 1,586 | | | | 33,433 | | |
Sturm Ruger & Company, Inc. | | | 858 | | | | 45,217 | | |
Vista Outdoor, Inc. (a) | | | 1,614 | | | | 59,557 | | |
| | | | 167,270 | | |
Life Sciences Tools & Services (0.5%): | |
Cambrex Corporation (a) | | | 1,082 | | | | 58,374 | | |
INC Research Holdings, Inc. — Class A (a) | | | 1,395 | | | | 73,377 | | |
Luminex Corporation (a) | | | 3,304 | | | | 66,840 | | |
| | | | 198,591 | | |
Machinery (5.2%): | |
Alamo Group, Inc. | | | 1,113 | | | | 84,699 | | |
Albany International Corporation | | | 1,662 | | | | 76,951 | | |
Altra Industrial Motion Corporation | | | 2,992 | | | | 110,405 | | |
American Railcar Industries, Inc. | | | 1,201 | | | | 54,393 | | |
Astec Industries, Inc. | | | 1,089 | | | | 73,464 | | |
Barnes Group, Inc. | | | 1,745 | | | | 82,748 | | |
Douglas Dynamics, Inc | | | 1,994 | | | | 67,098 | | |
ESCO Technologies, Inc. | | | 2,389 | | | | 135,337 | | |
Federal Signal Corporation | | | 3,639 | | | | 56,805 | | |
Franklin Electric Company, Inc. | | | 1,698 | | | | 66,052 | | |
See notes to financial statements.
29
Victory Portfolios II
VictoryShares US Discovery Enhanced Volatility Wtd ETF | | Schedule of Investments — continued
December 31, 2016 | |
(Unaudited)
Security Description | | Shares | | Value | |
Machinery (5.2%) cont'd | |
Global Brass & Copper Holdings, Inc. | | | 2,107 | | | $ | 72,270 | | |
Greenbrier Companies, Inc. | | | 1,068 | | | | 44,375 | | |
Hillenbrand, Inc. | | | 2,843 | | | | 109,029 | | |
Hyster-Yale Materials Handling, Inc. | | | 1,096 | | | | 69,892 | | |
John Bean Technologies Corporation | | | 790 | | | | 67,900 | | |
Kadant, Inc. | | | 1,510 | | | | 92,412 | | |
Lydall, Inc. (a) | | | 1,221 | | | | 75,519 | | |
Mueller Industries, Inc. | | | 2,460 | | | | 98,302 | | |
Mueller Water Products, Inc. | | | 6,104 | | | | 81,244 | | |
Proto Labs, Inc. (a) | | | 788 | | | | 40,464 | | |
RBC Bearings, Inc. (a) | | | 1,071 | | | | 99,400 | | |
Standex International Corporation | | | 980 | | | | 86,093 | | |
Sun Hydraulics Corporation | | | 2,148 | | | | 85,856 | | |
Wabash National Corporation (a) | | | 3,887 | | | | 61,492 | | |
| | | | 1,892,200 | | |
Marine (0.3%): | |
Kirby Corporation (a) | | | 1,075 | | | | 71,487 | | |
Matson, Inc. | | | 1,448 | | | | 51,245 | | |
| | | | 122,732 | | |
Media (1.1%): | |
AMC Entertainment Holdings, Inc. | | | 1,984 | | | | 66,762 | | |
Entravision Communications Corporation — Class A | | | 7,826 | | | | 54,782 | | |
Gannett Company, Inc. | | | 4,969 | | | | 48,249 | | |
Gray Television, Inc. (a) | | | 3,937 | | | | 42,716 | | |
New Media Investment Group, Inc. | | | 3,590 | | | | 57,404 | | |
Nexstar Broadcasting Group, Inc. — Class A | | | 912 | | | | 57,730 | | |
Sinclair Broadcast Group, Inc. — Class A | | | 2,189 | | | | 73,003 | | |
| | | | 400,646 | | |
Metals & Mining (0.8%): | |
Compass Minerals International, Inc. | | | 1,082 | | | | 84,775 | | |
Kaiser Aluminum Corporation | | | 904 | | | | 70,232 | | |
Materion Corporation | | | 1,665 | | | | 65,934 | | |
Worthington Industries, Inc. | | | 1,348 | | | | 63,949 | | |
| | | | 284,890 | | |
Multiline Retail (0.3%): | |
Dillard's, Inc. | | | 947 | | | | 59,368 | | |
Ollie's Bargain Outlet Holdings, Inc. (a) | | | 1,985 | | | | 56,473 | | |
| | | | 115,841 | | |
Multi-Utilities (0.9%): | |
Avista Corporation | | | 2,763 | | | | 110,492 | | |
NorthWestern Corporation | | | 2,049 | | | | 116,527 | | |
Unitil Corporation | | | 2,313 | | | | 104,871 | | |
| | | | 331,890 | | |
See notes to financial statements.
30
Victory Portfolios II
VictoryShares US Discovery Enhanced Volatility Wtd ETF | | Schedule of Investments — continued
December 31, 2016 | |
(Unaudited)
Security Description | | Shares | | Value | |
Oil, Gas & Consumable Fuels (0.4%): | |
REX American Resources Corporation (a) | | | 768 | | | $ | 75,840 | | |
Western Refining, Inc. | | | 1,428 | | | | 54,050 | | |
| | | | 129,890 | | |
Paper & Forest Products (1.1%): | |
Boise Cascade Company (a) | | | 1,272 | | | | 28,620 | | |
Clearwater Paper Corporation (a) | | | 941 | | | | 61,683 | | |
Domtar Corporation | | | 1,654 | | | | 64,556 | | |
KapStone Paper & Packaging Corporation — Class A | | | 1,489 | | | | 32,832 | | |
Neenah Paper, Inc. | | | 1,096 | | | | 93,379 | | |
PH Glatfelter Company | | | 2,072 | | | | 49,500 | | |
Schweitzer-Mauduit International, Inc. | | | 1,593 | | | | 72,529 | | |
| | | | 403,099 | | |
Personal Products (0.4%): | |
Inter Parfums, Inc. | | | 1,652 | | | | 54,103 | | |
Revlon, Inc. (a) | | | 1,475 | | | | 42,996 | | |
USANA Health Sciences, Inc. (a) | | | 622 | | | | 38,067 | | |
| | | | 135,166 | | |
Pharmaceuticals (0.5%): | |
ANI Pharmaceuticals, Inc. (a) | | | 665 | | | | 40,312 | | |
Phibro Animal Health Corporation — Class A | | | 1,688 | | | | 49,459 | | |
SciClone Pharmaceuticals, Inc. (a) | | | 4,165 | | | | 44,982 | | |
Supernus Pharmaceuticals, Inc. (a) | | | 1,808 | | | | 45,652 | | |
| | | | 180,405 | | |
Professional Services (3.0%): | |
CEB, Inc. | | | 1,190 | | | | 72,114 | | |
Exponent, Inc. | | | 1,625 | | | | 97,987 | | |
FTI Consulting, Inc. (a) | | | 1,515 | | | | 68,296 | | |
Huron Consulting Group, Inc. (a) | | | 1,081 | | | | 54,753 | | |
ICF International, Inc. (a) | | | 1,888 | | | | 104,218 | | |
Insperity, Inc. | | | 860 | | | | 61,017 | | |
Kelly Services, Inc. — Class A | | | 3,543 | | | | 81,206 | | |
Kforce, Inc. | | | 2,442 | | | | 56,410 | | |
Mistras Group, Inc. (a) | | | 1,967 | | | | 50,513 | | |
Navigant Consulting, Inc. (a) | | | 3,644 | | | | 95,400 | | |
On Assignment, Inc. (a) | | | 1,442 | | | | 63,679 | | |
Resources Connection, Inc. | | | 4,228 | | | | 81,389 | | |
| RPX Corporation (a) | | | 4,717 | | | | 50,944 | | |
TriNet Group, Inc. (a) | | | 2,567 | | | | 65,766 | | |
WageWorks, Inc. (a) | | | 1,115 | | | | 80,837 | | |
| | | | 1,084,529 | | |
Real Estate Management & Development (0.3%): | |
HFF, Inc. — Class A | | | 2,090 | | | | 63,223 | | |
Marcus & Millichap, Inc. (a) | | | 2,146 | | | | 57,341 | | |
| | | | 120,564 | | |
See notes to financial statements.
31
Victory Portfolios II
VictoryShares US Discovery Enhanced Volatility Wtd ETF | | Schedule of Investments — continued
December 31, 2016 | |
(Unaudited)
Security Description | | Shares | | Value | |
Road & Rail (1.4%): | |
Heartland Express, Inc. | | | 3,684 | | | $ | 75,006 | | |
Knight Transportation, Inc. | | | 2,108 | | | | 69,670 | | |
Landstar System, Inc. | | | 1,347 | | | | 114,899 | | |
Marten Transport Ltd. | | | 3,291 | | | | 76,680 | | |
Saia, Inc. (a) | | | 1,502 | | | | 66,313 | | |
Swift Transportation Company (a) | | | 2,047 | | | | 49,865 | | |
Werner Enterprises, Inc. | | | 2,518 | | | | 67,860 | | |
| | | | 520,293 | | |
Semiconductors & Semiconductor Equipment (3.1%): | |
Advanced Energy Industries, Inc. (a) | | | 1,567 | | | | 85,793 | | |
Ambarella, Inc. (a) | | | 593 | | | | 32,099 | | |
Cabot Microelectronics Corporation | | | 1,565 | | | | 98,861 | | |
CEVA, Inc. (a) | | | 1,589 | | | | 53,311 | | |
Entegris, Inc. (a) | | | 3,969 | | | | 71,045 | | |
Integrated Device Technology, Inc. (a) | | | 1,853 | | | | 43,657 | | |
Intersil Corporation | | | 2,797 | | | | 62,373 | | |
MKS Instrument, Inc. | | | 1,618 | | | | 96,109 | | |
NeoPhotonics Corporation (a) | | | 2,037 | | | | 22,020 | | |
PDF Solutions, Inc. (a) | | | 3,184 | | | | 71,799 | | |
Photronics, Inc. (a) | | | 6,487 | | | | 73,303 | | |
Power Integrations, Inc. | | | 1,191 | | | | 80,809 | | |
Rambus, Inc. (a) | | | 5,407 | | | | 74,454 | | |
Rudolph Technologies, Inc. (a) | | | 3,624 | | | | 84,621 | | |
Silicon Laboratories, Inc. (a) | | | 1,214 | | | | 78,910 | | |
Tessera Holding Corporation | | | 2,197 | | | | 97,108 | | |
| | | | 1,126,272 | | |
Software (1.0%): | |
Ebix, Inc. | | | 871 | | | | 49,690 | | |
Gigamon, Inc. (a) | | | 903 | | | | 41,132 | | |
MicroStrategy, Inc. (a) | | | 317 | | | | 62,576 | | |
Monotype Imaging Holdings, Inc. | | | 2,516 | | | | 49,943 | | |
Pegasystems, Inc. | | | 2,504 | | | | 90,144 | | |
Qualys, Inc. (a) | | | 1,099 | | | | 34,783 | | |
VASCO Data Security International, Inc. (a) | | | 3,018 | | | | 41,196 | | |
| | | | 369,464 | | |
Specialty Retail (3.3%): | |
Aaron's, Inc. | | | 2,133 | | | | 68,235 | | |
Asbury Automotive Group, Inc. (a) | | | 851 | | | | 52,507 | | |
Caleres, Inc. | | | 2,293 | | | | 75,256 | | |
DSW, Inc. — Class A | | | 2,245 | | | | 50,849 | | |
Express, Inc. (a) | | | 3,578 | | | | 38,499 | | |
Five Below, Inc. (a) | | | 1,501 | | | | 59,980 | | |
Francesca's Holdings Corporation (a) | | | 2,459 | | | | 44,336 | | |
GameStop Corporation | | | 2,077 | | | | 52,465 | | |
Genesco, Inc. (a) | | | 1,258 | | | | 78,122 | | |
GNC Holdings, Inc. | | | 1,477 | | | | 16,306 | | |
Hibbett Sports, Inc. (a) | | | 1,608 | | | | 59,978 | | |
See notes to financial statements.
32
Victory Portfolios II
VictoryShares US Discovery Enhanced Volatility Wtd ETF | | Schedule of Investments — continued
December 31, 2016 | |
(Unaudited)
Security Description | | Shares | | Value | |
Specialty Retail (3.3%) cont'd | |
Lithia Motors, Inc. — Class A | | | 577 | | | $ | 55,871 | | |
MarineMax, Inc. (a) | | | 2,214 | | | | 42,841 | | |
Monro Muffler Brake, Inc. | | | 1,281 | | | | 73,273 | | |
Murphy USA, Inc. (a) | | | 991 | | | | 60,917 | | |
Office Depot, Inc. | | | 7,272 | | | | 32,869 | | |
Shoe Carnival, Inc. | | | 2,301 | | | | 62,081 | | |
Sonic Automotive, Inc. — Class A | | | 2,733 | | | | 62,586 | | |
The Buckle, Inc. | | | 2,262 | | | | 51,573 | | |
The Cato Corporation — Class A | | | 1,946 | | | | 58,536 | | |
Tile Shop Holdings, Inc. (a) | | | 3,145 | | | | 61,485 | | |
Vitamin Shoppe, Inc. (a) | | | 1,811 | | | | 43,011 | | |
| | | | 1,201,576 | | |
Technology Hardware, Storage & Peripherals (0.3%): | |
Electronics For Imaging, Inc. (a) | | | 1,411 | | | | 61,886 | | |
Super Micro Computer, Inc. (a) | | | 1,452 | | | | 40,729 | | |
| | | | 102,615 | | |
Textiles, Apparel & Luxury Goods (0.8%): | |
Fossil Group, Inc. (a) | | | 1,095 | | | | 28,317 | | |
Kate Spade & Company (a) | | | 2,177 | | | | 40,645 | | |
Movado Group, Inc. | | | 2,382 | | | | 68,482 | | |
Steven Madden Ltd. (a) | | | 2,078 | | | | 74,288 | | |
Vera Bradley, Inc. (a) | | | 3,225 | | | | 37,797 | | |
Wolverine World Wide, Inc. | | | 2,519 | | | | 55,292 | | |
| | | | 304,821 | | |
Thrifts & Mortgage Finance (3.1%): | |
Beneficial Bancorp, Inc. | | | 7,696 | | | | 141,606 | | |
BofI Holding, Inc. (a) | | | 1,747 | | | | 49,877 | | |
Capitol Federal Financial, Inc. | | | 10,024 | | | | 164,995 | | |
Essent Group Ltd. (a) | | | 2,401 | | | | 77,720 | | |
Flagstar Bancorp, Inc. (a) | | | 2,668 | | | | 71,876 | | |
Kearny Financial Corporation | | | 8,545 | | | | 132,875 | | |
LendingTree, Inc (a) | | | 288 | | | | 29,189 | | |
MGIC Investment Corporation (a) | | | 5,712 | | | | 58,205 | | |
Provident Financial Services, Inc. | | | 4,912 | | | | 139,010 | | |
Radian Group, Inc. | | | 3,996 | | | | 71,848 | | |
Washington Federal, Inc. | | | 3,296 | | | | 113,218 | | |
WSFS Financial Corporation | | | 2,043 | | | | 94,693 | | |
| | | | 1,145,112 | | |
Tobacco (0.3%): | |
Vector Group Ltd. | | | 5,528 | | | | 125,707 | | |
Trading Companies & Distributors (1.4%): | |
Air Lease Corporation | | | 1,766 | | | | 60,627 | | |
GATX Corporation | | | 1,280 | | | | 78,823 | | |
H&E Equipment Services, Inc. | | | 2,143 | | | | 49,825 | | |
Kaman Corporation | | | 2,411 | | | | 117,970 | | |
Rush Enterprises, Inc. — Class A (a) | | | 2,128 | | | | 67,883 | | |
See notes to financial statements.
33
Victory Portfolios II
VictoryShares US Discovery Enhanced Volatility Wtd ETF | | Schedule of Investments — continued
December 31, 2016 | |
(Unaudited)
Security Description | | Shares | | Value | |
Trading Companies & Distributors (1.4%) cont'd | |
Veritiv Corporation (a) | | | 895 | | | $ | 48,106 | | |
WESCO International, Inc. (a) | | | 1,020 | | | | 67,881 | | |
| | | | 491,115 | | |
Water Utilities (1.0%): | |
American States Water Company | | | 1,843 | | | | 83,967 | | |
Connecticut Water Service, Inc. | | | 1,902 | | | | 106,227 | | |
Middlesex Water Company | | | 2,093 | | | | 89,873 | | |
SJW Corporation | | | 1,709 | | | | 95,670 | | |
| | | | 375,737 | | |
Total Common Stocks (Cost $31,174,416) | | | 36,502,185 | | |
Short-Term Investments (0.0%) (b) | |
Money Market Funds (0.0%): (b) | |
Short-Term Investments Trust Government & Agency Portfolio —
Institutional Class, 0.43% (c) | | | 15,358 | | | | 15,358 | | |
Total Short-Term Investments (Cost $15,358) | | | 15,358 | | |
Total Investments — 100.0% (Cost $31,189,774) | | | 36,517,543 | | |
Other assets in excess of liabilities — 0.0% (b) | | | 13,987 | | |
NET ASSETS — 100.0% | | $ | 36,531,530 | | |
(a) Non-income producing security.
(b) Less than 0.05%.
(c) Annualized seven-day yield as of December 31, 2016.
The Global Industry Classification Standard (GICS®) was developed by and/or is the exclusive property of MSCI, Inc. and Standard & Poor's Financial Services LLC ("S&P"). GICS® is a service mark of MSCI, Inc. and S&P and has been licensed for use by the Fund's Administrator, U.S. Bancorp Fund Services, LLC.
Schedule of Open Futures Contracts
Number of
Contracts
Purchased | | Description | | Notional Value | | Unrealized
Depreciation | |
| | 1 | | | Russell 2000 Mini Future, March 2017 | | $ | 67,845 | | | $ | (44 | ) | |
| | | $ | (44 | ) | |
See notes to financial statements.
34
Victory Portfolios II
VictoryShares US 500 Enhanced Volatility Wtd ETF | | Schedule of Investments
December 31, 2016 | |
(Unaudited)
Security Description | | Shares | | Value | |
Common Stocks (99.8%) | |
Aerospace & Defense (2.9%): | |
B/E Aerospace, Inc. | | | 7,614 | | | $ | 458,287 | | |
General Dynamics Corporation | | | 4,045 | | | | 698,410 | | |
Huntington Ingalls Industries, Inc. | | | 3,489 | | | | 642,639 | | |
Lockheed Martin Corporation | | | 3,249 | | | | 812,055 | | |
Northrop Grumman Corporation | | | 3,477 | | | | 808,681 | | |
Orbital ATK, Inc. | | | 4,008 | | | | 351,622 | | |
Raytheon Company | | | 4,891 | | | | 694,522 | | |
Rockwell Collins, Inc. | | | 6,669 | | | | 618,616 | | |
Spirit AeroSystems Holdings, Inc. — Class A | | | 8,438 | | | | 492,357 | | |
Textron, Inc. | | | 9,239 | | | | 448,646 | | |
TransDigm Group, Inc. | | | 1,320 | | | | 328,627 | | |
United Technologies Corporation | | | 6,042 | | | | 662,324 | | |
| | | | 7,016,786 | | |
Air Freight & Logistics (0.9%): | |
CH Robinson Worldwide, Inc. | | | 8,602 | | | | 630,182 | | |
Expeditors International of Washington, Inc. | | | 12,459 | | | | 659,829 | | |
United Parcel Service, Inc. — Class B | | | 7,692 | | | | 881,811 | | |
| | | | 2,171,822 | | |
Airlines (1.0%): | |
Alaska Air Group, Inc. | | | 5,146 | | | | 456,605 | | |
American Airlines Group, Inc. | | | 7,408 | | | | 345,879 | | |
Delta Air Lines, Inc. | | | 8,560 | | | | 421,066 | | |
JetBlue Airways Corporation (a) | | | 18,192 | | | | 407,865 | | |
Southwest Airlines Company | | | 9,270 | | | | 462,017 | | |
United Continental Holdings, Inc. (a) | | | 5,025 | | | | 366,222 | | |
| | | | 2,459,654 | | |
Auto Components (0.7%): | |
BorgWarner, Inc. | | | 7,850 | | | | 309,604 | | |
Gentex Corporation | | | 24,710 | | | | 486,540 | | |
Johnson Controls International PLC | | | 10,368 | | | | 427,058 | | |
Lear Corporation | | | 3,009 | | | | 398,301 | | |
| | | | 1,621,503 | | |
Automobiles (0.7%): | |
Ford Motor Company | | | 31,652 | | | | 383,939 | | |
General Motors Company | | | 14,495 | | | | 505,006 | | |
Harley-Davidson, Inc. | | | 5,472 | | | | 319,236 | | |
Thor Industries, Inc. | | | 5,326 | | | | 532,866 | | |
| | | | 1,741,047 | | |
Banks (5.4%): | |
Bank of America Corporation | | | 20,931 | | | | 462,575 | | |
Bank of the Ozarks, Inc. | | | 8,218 | | | | 432,185 | | |
BB&T Corporation | | | 11,934 | | | | 561,137 | | |
BOK Financial Corporation | | | 4,858 | | | | 403,408 | | |
CIT Group, Inc. | | | 9,133 | | | | 389,796 | | |
See notes to financial statements.
35
Victory Portfolios II
VictoryShares US 500 Enhanced Volatility Wtd ETF | | Schedule of Investments — continued
December 31, 2016 | |
(Unaudited)
Security Description | | Shares | | Value | |
Banks (5.4%) cont'd | |
Citigroup, Inc. | | | 6,703 | | | $ | 398,359 | | |
Citizens Financial Group, Inc. | | | 13,420 | | | | 478,155 | | |
Comerica, Inc. | | | 6,797 | | | | 462,944 | | |
Commerce Bancshares, Inc. | | | 10,587 | | | | 612,052 | | |
Cullen/Frost Bankers, Inc. | | | 4,159 | | | | 366,949 | | |
East West Bancorp, Inc. | | | 8,724 | | | | 443,441 | | |
Fifth Third Bancorp | | | 16,903 | | | | 455,874 | | |
First Republic Bank | | | 5,241 | | | | 482,906 | | |
Huntington Bancshares, Inc. | | | 34,772 | | | | 459,686 | | |
JPMorgan Chase & Company | | | 6,280 | | | | 541,901 | | |
KeyCorp | | | 30,609 | | | | 559,226 | | |
M&T Bank Corporation | | | 3,673 | | | | 574,567 | | |
PacWest Bancorp | | | 7,705 | | | | 419,460 | | |
People's United Financial, Inc. | | | 28,524 | | | | 552,225 | | |
PNC Financial Services Group, Inc. | | | 5,394 | | | | 630,882 | | |
Regions Financial Corporation | | | 31,772 | | | | 456,246 | | |
Signature Bank (a) | | | 2,996 | | | | 449,999 | | |
SunTrust Banks, Inc. | | | 8,357 | | | | 458,381 | | |
SVB Financial Group (a) | | | 2,286 | | | | 392,415 | | |
U.S. Bancorp | | | 11,556 | | | | 593,632 | | |
Wells Fargo & Company | | | 9,985 | | | | 550,273 | | |
Zions Bancorporation | | | 10,432 | | | | 448,993 | | |
| | | | 13,037,667 | | |
Beverages (1.7%): | |
Brown-Forman Corporation — Class B | | | 12,576 | | | | 564,914 | | |
Constellation Brands, Inc. — Class A | | | 3,068 | | | | 470,355 | | |
Dr Pepper Snapple Group, Inc. | | | 7,218 | | | | 654,456 | | |
Molson Coors Brewing Company — Class B | | | 4,920 | | | | 478,765 | | |
Monster Beverage Corporation (a) | | | 8,163 | | | | 361,948 | | |
PepsiCo, Inc. | | | 8,193 | | | | 857,234 | | |
The Coca-Cola Company | | | 18,403 | | | | 762,988 | | |
| | | | 4,150,660 | | |
Biotechnology (0.9%): | |
AbbVie, Inc. | | | 6,290 | | | | 393,880 | | |
Amgen, Inc. | | | 2,952 | | | | 431,612 | | |
Biogen, Inc. (a) | | | 968 | | | | 274,505 | | |
Gilead Sciences, Inc. | | | 4,898 | | | | 350,746 | | |
Regeneron Pharmaceuticals, Inc. (a) | | | 717 | | | | 263,204 | | |
United Therapeutics Corporation (a) | | | 2,463 | | | | 353,268 | | |
| | | | 2,067,215 | | |
Building Products (0.9%): | |
AO Smith Corporation | | | 9,250 | | | | 437,987 | | |
Fortune Brands Home & Security, Inc. | | | 8,108 | | | | 433,454 | | |
Lennox International, Inc. | | | 3,688 | | | | 564,891 | | |
Masco Corporation | | | 12,341 | | | | 390,222 | | |
Owens Corning | | | 8,596 | | | | 443,210 | | |
| | | | 2,269,764 | | |
See notes to financial statements.
36
Victory Portfolios II
VictoryShares US 500 Enhanced Volatility Wtd ETF | | Schedule of Investments — continued
December 31, 2016 | |
(Unaudited)
Security Description | | Shares | | Value | |
Capital Markets (4.8%): | |
Affiliated Managers Group, Inc. (a) | | | 2,006 | | | $ | 291,472 | | |
Ameriprise Financial, Inc. | | | 3,474 | | | | 385,406 | | |
BlackRock, Inc. | | | 1,107 | | | | 421,258 | | |
CBOE Holdings, Inc. | | | 9,123 | | | | 674,098 | | |
Charles Schwab Corporation | | | 9,665 | | | | 381,478 | | |
CME Group, Inc. | �� | | 5,314 | | | | 612,970 | | |
Eaton Vance Corporation | | | 9,998 | | | | 418,716 | | |
FactSet Research Systems, Inc. | | | 2,870 | | | | 469,044 | | |
Franklin Resources, Inc. | | | 10,195 | | | | 403,518 | | |
Interactive Brokers Group, Inc. | | | 10,204 | | | | 372,548 | | |
Intercontinental Exchange, Inc. | | | 8,510 | | | | 480,134 | | |
Invesco Ltd. | | | 9,721 | | | | 294,935 | | |
MarketAxess Holdings, Inc. | | | 2,605 | | | | 382,727 | | |
Moody's Corporation | | | 3,724 | | | | 351,061 | | |
Morgan Stanley | | | 9,996 | | | | 422,331 | | |
MSCI, Inc. | | | 6,564 | | | | 517,112 | | |
Nasdaq, Inc. | | | 7,820 | | | | 524,878 | | |
Northern Trust Corporation | | | 5,590 | | | | 497,790 | | |
Raymond James Financial, Inc. | | | 5,789 | | | | 401,004 | | |
S&P Global, Inc. | | | 3,436 | | | | 369,507 | | |
SEI Investments Company | | | 6,749 | | | | 333,131 | | |
State Street Corporation | | | 4,734 | | | | 367,926 | | |
T. Rowe Price Group, Inc. | | | 7,019 | | | | 528,250 | | |
TD Ameritrade Holding Corporation | | | 10,576 | | | | 461,114 | | |
The Bank of New York Mellon Corporation | | | 10,006 | | | | 474,084 | | |
The Goldman Sachs Group, Inc. | | | 2,397 | | | | 573,962 | | |
| | | | 11,410,454 | | |
Chemicals (2.4%): | |
Axalta Coating Systems Ltd. (a) | | | 13,482 | | | | 366,710 | | |
CF Industries Holdings, Inc. | | | 8,224 | | | | 258,892 | | |
Eastman Chemical Company | | | 6,227 | | | | 468,333 | | |
Ecolab, Inc. | | | 4,074 | | | | 477,554 | | |
Huntsman Corporation | | | 12,365 | | | | 235,924 | | |
International Flavors & Fragrances, Inc. | | | 3,100 | | | | 365,273 | | |
LyondellBasell Industries NV — Class A | | | 4,416 | | | | 378,804 | | |
NewMarket Corporation | | | 1,091 | | | | 462,409 | | |
PPG Industries, Inc. | | | 4,606 | | | | 436,465 | | |
Praxair, Inc. | | | 4,779 | | | | 560,051 | | |
RPM International, Inc. | | | 9,755 | | | | 525,112 | | |
The Dow Chemical Company | | | 9,252 | | | | 529,399 | | |
The Sherwin-Williams Company | | | 1,757 | | | | 472,176 | | |
Westlake Chemical Corporation | | | 5,352 | | | | 299,659 | | |
| | | | 5,836,761 | | |
Commercial Services & Supplies (1.8%): | |
Cintas Corporation | | | 4,655 | | | | 537,932 | | |
Copart, Inc. (a) | | | 9,735 | | | | 539,416 | | |
KAR Auction Services, Inc. | | | 11,637 | | | | 495,969 | | |
Republic Services, Inc. | | | 15,080 | | | | 860,314 | | |
See notes to financial statements.
37
Victory Portfolios II
VictoryShares US 500 Enhanced Volatility Wtd ETF | | Schedule of Investments — continued
December 31, 2016 | |
(Unaudited)
Security Description | | Shares | | Value | |
Commercial Services & Supplies (1.8%) cont'd | |
Rollins, Inc. | | | 17,367 | | | $ | 586,657 | | |
Stericycle, Inc. (a) | | | 3,408 | | | | 262,552 | | |
Waste Management, Inc. | | | 13,069 | | | | 926,723 | | |
| | | | 4,209,563 | | |
Communications Equipment (1.2%): | |
Arista Networks, Inc. (a) | | | 3,194 | | | | 309,083 | | |
Brocade Communications Systems, Inc. | | | 28,703 | | | | 358,500 | | |
Cisco Systems, Inc. | | | 14,982 | | | | 452,756 | | |
F5 Networks, Inc. (a) | | | 3,300 | | | | 477,576 | | |
Juniper Networks, Inc. | | | 14,073 | | | | 397,703 | | |
Motorola Solutions, Inc. | | | 6,795 | | | | 563,238 | | |
Ubiquiti Networks, Inc. (a) | | | 6,401 | | | | 369,978 | | |
| | | | 2,928,834 | | |
Construction & Engineering (0.2%): | |
Jacobs Engineering Group, Inc. (a) | | | 8,421 | | | | 479,997 | | |
Construction Materials (0.4%): | |
Martin Marietta Materials, Inc. | | | 2,150 | | | | 476,289 | | |
Vulcan Materials Company | | | 3,946 | | | | 493,842 | | |
| | | | 970,131 | | |
Consumer Finance (1.0%): | |
American Express Company | | | 6,672 | | | | 494,262 | | |
Capital One Financial Corporation | | | 5,258 | | | | 458,708 | | |
Discover Financial Services | | | 7,490 | | | | 539,954 | | |
Navient Corporation | | | 18,095 | | | | 297,301 | | |
Santander Consumer USA Holdings, Inc. (a) | | | 15,908 | | | | 214,758 | | |
Synchrony Financial | | | 12,716 | | | | 461,209 | | |
| | | | 2,466,192 | | |
Containers & Packaging (1.9%): | |
AptarGroup, Inc. | | | 7,737 | | | | 568,283 | | |
Avery Dennison Corporation | | | 6,346 | | | | 445,616 | | |
Bemis Company, Inc. | | | 10,605 | | | | 507,131 | | |
Berry Plastics Group, Inc. (a) | | | 8,109 | | | | 395,151 | | |
Crown Holdings, Inc. (a) | | | 8,812 | | | | 463,247 | | |
Graphic Packaging Holding Company | | | 27,918 | | | | 348,417 | | |
International Paper Company | | | 8,184 | | | | 434,243 | | |
Packaging Corporation of America | | | 4,390 | | | | 372,360 | | |
Sealed Air Corporation | | | 8,101 | | | | 367,299 | | |
Sonoco Products Company | | | 10,731 | | | | 565,524 | | |
| | | | 4,467,271 | | |
Distributors (0.6%): | |
Genuine Parts Company | | | 6,073 | | | | 580,215 | | |
LKQ Corporation (a) | | | 11,268 | | | | 345,364 | | |
Pool Corporation | | | 5,974 | | | | 623,327 | | |
| | | | 1,548,906 | | |
See notes to financial statements.
38
Victory Portfolios II
VictoryShares US 500 Enhanced Volatility Wtd ETF | | Schedule of Investments — continued
December 31, 2016 | |
(Unaudited)
Security Description | | Shares | | Value | |
Diversified Consumer Services (0.4%): | |
Service Corporation International | | | 19,031 | | | $ | 540,480 | | |
ServiceMaster Global Holdings, Inc. (a) | | | 10,374 | | | | 390,789 | | |
| | | | 931,269 | | |
Diversified Financial Services (0.4%): | |
Berkshire Hathaway, Inc. — Class B (a) | | | 5,260 | | | | 857,275 | | |
Diversified Telecommunication Services (0.8%): | |
AT&T, Inc. | | | 21,321 | | | | 906,782 | | |
CenturyLink, Inc. | | | 13,122 | | | | 312,041 | | |
Verizon Communications, Inc. | | | 13,452 | | | | 718,068 | | |
| | | | 1,936,891 | | |
Electric Utilities (3.3%): | |
Alliant Energy Corporation | | | 17,118 | | | | 648,601 | | |
American Electric Power Company, Inc. | | | 10,238 | | | | 644,585 | | |
Duke Energy Corporation | | | 8,577 | | | | 665,747 | | |
Eversource Energy | | | 12,765 | | | | 705,011 | | |
Exelon Corporation | | | 16,193 | | | | 574,690 | | |
NextEra Energy, Inc. | | | 5,853 | | | | 699,199 | | |
OGE Energy Corporation | | | 15,943 | | | | 533,293 | | |
PG&E Corporation | | | 11,308 | | | | 687,187 | | |
Pinnacle West Capital Corporation | | | 8,916 | | | | 695,715 | | |
PPL Corporation | | | 18,170 | | | | 618,689 | | |
Southern Company | | | 14,775 | | | | 726,782 | | |
Xcel Energy, Inc. | | | 16,997 | | | | 691,778 | | |
| | | | 7,891,277 | | |
Electrical Equipment (1.4%): | |
Acuity Brands, Inc. | | | 1,283 | | | | 296,194 | | |
AMETEK, Inc. | | | 10,827 | | | | 526,192 | | |
Eaton Corporation PLC | | | 6,802 | | | | 456,346 | | |
Emerson Electric Company | | | 9,075 | | | | 505,931 | | |
Hubbell, Inc. | | | 5,336 | | | | 622,711 | | |
Rockwell Automation, Inc. | | | 4,173 | | | | 560,851 | | |
Sensata Technologies Holding NV (a) | | | 8,299 | | | | 323,246 | | |
| | | | 3,291,471 | | |
Electronic Equipment, Instruments & Components (2.3%): | |
Amphenol Corporation — Class A | | | 10,146 | | | | 681,811 | | |
Arrow Electronics, Inc. (a) | | | 6,098 | | | | 434,787 | | |
Avnet, Inc. | | | 11,173 | | | | 531,946 | | |
CDW Corporation | | | 10,321 | | | | 537,621 | | |
Cognex Corporation | | | 6,311 | | | | 401,506 | | |
Dolby Laboratories, Inc. | | | 8,089 | | | | 365,542 | | |
Flex Ltd. (a) | | | 30,953 | | | | 444,795 | | |
FLIR Systems, Inc. | | | 14,604 | | | | 528,519 | | |
IPG Photonics Corporation (a) | | | 3,908 | | | | 385,759 | | |
Keysight Technologies, Inc. (a) | | | 12,123 | | | | 443,338 | | |
SYNNEX Corporation | | | 3,704 | | | | 448,258 | | |
Trimble Navigation Ltd. (a) | | | 13,189 | | | | 397,648 | | |
| | | | 5,601,530 | | |
See notes to financial statements.
39
Victory Portfolios II
VictoryShares US 500 Enhanced Volatility Wtd ETF | | Schedule of Investments — continued
December 31, 2016 | |
(Unaudited)
Security Description | | Shares | | Value | |
Energy Equipment & Services (0.2%): | |
FMC Technologies, Inc. (a) | | | 10,192 | | | $ | 362,122 | | |
Food & Staples Retailing (1.8%): | |
Casey's General Stores, Inc. | | | 3,340 | | | | 397,059 | | |
Costco Wholesale Corporation | | | 4,069 | | | | 651,488 | | |
CVS Health Corporation | | | 6,935 | | | | 547,241 | | |
Sysco Corporation | | | 12,288 | | | | 680,387 | | |
The Kroger Company | | | 14,297 | | | | 493,389 | | |
Walgreens Boots Alliance, Inc. | | | 6,306 | | | | 521,885 | | |
Wal-Mart Stores, Inc. | | | 7,811 | | | | 539,896 | | |
Whole Foods Market, Inc. | | | 13,653 | | | | 419,966 | | |
| | | | 4,251,311 | | |
Food Products (2.6%): | |
Archer-Daniels-Midland Company | | | 8,601 | | | | 392,636 | | |
Blue Buffalo Pet Products, Inc. (a) | | | 10,583 | | | | 254,415 | | |
Bunge Ltd. | | | 4,797 | | | | 346,535 | | |
Campbell Soup Company | | | 9,904 | | | | 598,895 | | |
General Mills, Inc. | | | 10,576 | | | | 653,280 | | |
Hormel Foods Corporation | | | 11,984 | | | | 417,163 | | |
Ingredion, Inc. | | | 3,608 | | | | 450,856 | | |
McCormick & Company, Inc. | | | 6,770 | | | | 631,844 | | |
Mead Johnson Nutrition Company | | | 5,342 | | | | 378,000 | | |
Pilgrim's Pride Corporation | | | 15,268 | | | | 289,939 | | |
Pinnacle Foods, Inc. | | | 10,788 | | | | 576,619 | | |
The Hershey Company | | | 4,023 | | | | 416,099 | | |
The J.M. Smucker Company | | | 3,901 | | | | 499,562 | | |
Tyson Foods, Inc. — Class A | | | 6,402 | | | | 394,875 | | |
| | | | 6,300,718 | | |
Gas Utilities (0.3%): | |
Atmos Energy Corporation | | | 9,060 | | | | 671,799 | | |
Health Care Equipment & Supplies (3.3%): | |
Abbott Laboratories | | | 10,606 | | | | 407,377 | | |
ABIOMED, Inc. (a) | | | 2,477 | | | | 279,108 | | |
Align Technology, Inc. (a) | | | 3,845 | | | | 369,620 | | |
Becton, Dickinson and Company | | | 3,656 | | | | 605,251 | | |
Danaher Corporation | | | 9,857 | | | | 767,269 | | |
DENTSPLY SIRONA, Inc. | | | 8,840 | | | | 510,333 | | |
Edwards Lifesciences Corporation (a) | | | 2,949 | | | | 276,321 | | |
Hologic, Inc. (a) | | | 10,312 | | | | 413,717 | | |
IDEXX Laboratories, Inc. (a) | | | 3,770 | | | | 442,108 | | |
Intuitive Surgical, Inc. (a) | | | 817 | | | | 518,117 | | |
ResMed, Inc. | | | 7,180 | | | | 445,519 | | |
Stryker Corporation | | | 6,059 | | | | 725,929 | | |
Teleflex, Inc. | | | 3,080 | | | | 496,342 | | |
The Cooper Companies, Inc. | | | 2,841 | | | | 496,976 | | |
Varian Medical Systems, Inc. (a) | | | 5,826 | | | | 523,058 | | |
West Pharmaceutical Services, Inc. | | | 6,347 | | | | 538,416 | | |
| | | | 7,815,461 | | |
See notes to financial statements.
40
Victory Portfolios II
VictoryShares US 500 Enhanced Volatility Wtd ETF | | Schedule of Investments — continued
December 31, 2016 | |
(Unaudited)
Security Description | | Shares | | Value | |
Health Care Providers & Services (3.6%): | |
Acadia Healthcare Company, Inc. (a) | | | 5,252 | | | $ | 173,841 | | |
Aetna, Inc. | | | 3,830 | | | | 474,958 | | |
AmerisourceBergen Corporation | | | 5,713 | | | | 446,699 | | |
Anthem, Inc. | | | 3,479 | | | | 500,176 | | |
Cardinal Health, Inc. | | | 5,683 | | | | 409,006 | | |
Cigna Corporation | | | 3,244 | | | | 432,717 | | |
Express Scripts Holdings Company (a) | | | 6,782 | | | | 466,534 | | |
HCA Holdings, Inc. (a) | | | 6,272 | | | | 464,253 | | |
Henry Schein, Inc. (a) | | | 3,127 | | | | 474,397 | | |
Humana, Inc. | | | 2,165 | | | | 441,725 | | |
Laboratory Corporation of America Holdings (a) | | | 4,251 | | | | 545,743 | | |
McKesson Corporation | | | 2,119 | | | | 297,614 | | |
MEDNAX, Inc. (a) | | | 6,820 | | | | 454,621 | | |
Patterson Companies, Inc. | | | 10,616 | | | | 435,575 | | |
Quest Diagnostics, Inc. | | | 7,490 | | | | 688,331 | | |
UnitedHealth Group, Inc. | | | 4,841 | | | | 774,754 | | |
Universal Health Services, Inc. — Class B | | | 3,551 | | | | 377,755 | | |
VCA, Inc. — Class A (a) | | | 5,841 | | | | 400,985 | | |
WellCare Health Plans, Inc. (a) | | | 3,211 | | | | 440,164 | | |
| | | | 8,699,848 | | |
Health Care Technology (0.3%): | |
Cerner Corporation (a) | | | 6,624 | | | | 313,779 | | |
Veeva Systems, Inc. (a) | | | 8,174 | | | | 332,682 | | |
| | | | 646,461 | | |
Hotels, Restaurants & Leisure (3.0%): | |
Aramark | | | 14,507 | | | | 518,190 | | |
Carnival Corporation | | | 8,553 | | | | 445,269 | | |
Darden Restaurants, Inc. | | | 8,548 | | | | 621,611 | | |
Domino's Pizza, Inc. | | | 2,697 | | | | 429,470 | | |
Hilton Worldwide Holdings, Inc. | | | 15,836 | | | | 430,739 | | |
Hyatt Hotels Corporation — Class A (a) | | | 6,761 | | | | 373,613 | | |
Las Vegas Sands Corporation | | | 5,681 | | | | 303,422 | | |
Marriott International, Inc. — Class A | | | 5,943 | | | | 491,367 | | |
McDonald's Corporation | | | 5,988 | | | | 728,859 | | |
Norwegian Cruise Line Holdings Ltd. (a) | | | 7,490 | | | | 318,550 | | |
Panera Bread Company — Class A (a) | | | 2,260 | | | | 463,504 | | |
Royal Caribbean Cruises Ltd. | | | 3,892 | | | | 319,300 | | |
Starbucks Corporation | | | 9,177 | | | | 509,507 | | |
Wyndham Worldwide Corporation | | | 5,606 | | | | 428,130 | | |
Wynn Resorts Ltd. | | | 2,346 | | | | 202,953 | | |
Yum! Brands, Inc. | | | 8,119 | | | | 514,176 | | |
| | | | 7,098,660 | | |
Household Durables (1.8%): | |
CalAtlantic Group, Inc. | | | 9,145 | | | | 311,021 | | |
D.R. Horton, Inc. | | | 12,363 | | | | 337,881 | | |
Harman International Industries, Inc. | | | 2,890 | | | | 321,252 | | |
Leggett & Platt, Inc. | | | 10,711 | | | | 523,554 | | |
See notes to financial statements.
41
Victory Portfolios II
VictoryShares US 500 Enhanced Volatility Wtd ETF | | Schedule of Investments — continued
December 31, 2016 | |
(Unaudited)
Security Description | | Shares | | Value | |
Household Durables (1.8%) cont'd | |
Lennar Corporation — Class A | | | 9,148 | | | $ | 392,724 | | |
Mohawk Industries, Inc. (a) | | | 2,151 | | | | 429,512 | | |
Newell Rubbermaid, Inc. | | | 7,296 | | | | 325,766 | | |
NVR, Inc. (a) | | | 350 | | | | 584,150 | | |
PulteGroup, Inc. | | | 18,671 | | | | 343,173 | | |
Toll Brothers, Inc. (a) | | | 11,297 | | | | 350,207 | | |
Whirlpool Corporation | | | 2,299 | | | | 417,889 | | |
| | | | 4,337,129 | | |
Household Products (1.3%): | |
Church & Dwight Company, Inc. | | | 13,178 | | | | 582,336 | | |
Kimberly-Clark Corporation | | | 5,572 | | | | 635,877 | | |
Procter & Gamble Company | | | 9,667 | | | | 812,801 | | |
Spectrum Brands Holdings, Inc. | | | 3,713 | | | | 454,211 | | |
The Clorox Company | | | 5,506 | | | | 660,830 | | |
| | | | 3,146,055 | | |
Industrial Conglomerates (1.1%): | |
| 3M Company | | | 4,161 | | | | 743,030 | | |
Carlisle Companies, Inc. | | | 5,243 | | | | 578,250 | | |
Honeywell International, Inc. | | | 5,814 | | | | 673,552 | | |
Roper Technologies, Inc. | | | 2,846 | | | | 521,046 | | |
| | | | 2,515,878 | | |
Insurance (6.1%): | |
Aflac, Inc. | | | 9,163 | | | | 637,745 | | |
Alleghany Corporation (a) | | | 1,169 | | | | 710,892 | | |
American Financial Group, Inc. | | | 9,004 | | | | 793,432 | | |
AmTrust Financial Services, Inc. | | | 15,027 | | | | 411,439 | | |
Arthur J Gallagher & Company | | | 12,533 | | | | 651,215 | | |
Brown & Brown, Inc. | | | 16,901 | | | | 758,179 | | |
Cincinnati Financial Corporation | | | 8,836 | | | | 669,327 | | |
Erie Indemnity Company — Class A | | | 5,624 | | | | 632,419 | | |
First American Financial Corporation | | | 11,454 | | | | 419,560 | | |
Hartford Financial Services Group, Inc. | | | 10,552 | | | | 502,803 | | |
Lincoln National Corporation | | | 5,714 | | | | 378,667 | | |
Markel Corporation (a) | | | 676 | | | | 611,442 | | |
Marsh & McLennan Companies, Inc. | | | 10,974 | | | | 741,733 | | |
MetLife, Inc. | | | 7,222 | | | | 389,194 | | |
Old Republic International Corporation | | | 35,941 | | | | 682,879 | | |
Principal Financial Group, Inc. | | | 7,124 | | | | 412,195 | | |
Progressive Corporation | | | 20,843 | | | | 739,926 | | |
Prudential Financial, Inc. | | | 4,405 | | | | 458,384 | | |
Reinsurance Group of America, Inc. | | | 5,204 | | | | 654,819 | | |
The Allstate Corporation | | | 10,820 | | | | 801,978 | | |
The Travelers Companies, Inc. | | | 5,628 | | | | 688,980 | | |
Torchmark Corporation | | | 8,567 | | | | 631,902 | | |
Unum Group | | | 10,223 | | | | 449,096 | | |
W.R. Berkley Corporation | | | 11,053 | | | | 735,135 | | |
| | | | 14,563,341 | | |
See notes to financial statements.
42
Victory Portfolios II
VictoryShares US 500 Enhanced Volatility Wtd ETF | | Schedule of Investments — continued
December 31, 2016 | |
(Unaudited)
Security Description | | Shares | | Value | |
Internet & Catalog Retail (0.4%): | |
Netflix, Inc. (a) | | | 2,500 | | | $ | 309,500 | | |
The Priceline Group, Inc. (a) | | | 236 | | | | 345,990 | | |
TripAdvisor, Inc. (a) | | | 4,601 | | | | 213,349 | | |
| | | | 868,839 | | |
Internet & Direct Marketing Retail (0.1%): | |
Amazon.com, Inc. (a) | | | 459 | | | | 344,190 | | |
Internet Software & Services (0.8%): | |
Akamai Technologies, Inc. (a) | | | 4,846 | | | | 323,132 | | |
Alphabet, Inc. — Class A (a) | | | 636 | | | | 503,998 | | |
eBay, Inc. (a) | | | 10,938 | | | | 324,749 | | |
Facebook, Inc. — Class A (a) | | | 2,863 | | | | 329,388 | | |
VeriSign, Inc. (a) | | | 5,958 | | | | 453,225 | | |
| | | | 1,934,492 | | |
IT Services (5.0%): | |
Alliance Data Systems Corporation | | | 1,309 | | | | 299,107 | | |
Amdocs Ltd. | | | 10,449 | | | | 608,654 | | |
Automatic Data Processing, Inc. | | | 7,109 | | | | 730,663 | | |
Black Knight Financial Services, Inc. (a) | | | 9,530 | | | | 360,234 | | |
Booz Allen Hamilton Holding Corporation | | | 17,282 | | | | 623,362 | | |
Broadridge Financial Solutions, Inc. | | | 8,818 | | | | 584,633 | | |
Cognizant Technology Solutions Corporation — Class A (a) | | | 7,056 | | | | 395,348 | | |
Fidelity National Information Services, Inc. | | | 6,424 | | | | 485,911 | | |
Fiserv, Inc. (a) | | | 5,926 | | | | 629,815 | | |
FleetCor Technologies, Inc. (a) | | | 2,280 | | | | 322,666 | | |
Gartner, Inc. (a) | | | 5,736 | | | | 579,738 | | |
Genpact Ltd. (a) | | | 22,979 | | | | 559,309 | | |
Global Payments, Inc. | | | 4,656 | | | | 323,173 | | |
International Business Machines Corporation | | | 3,294 | | | | 546,771 | | |
Jack Henry & Associates, Inc. | | | 7,462 | | | | 662,476 | | |
Leidos Holdings, Inc. | | | 5,738 | | | | 293,441 | | |
MasterCard, Inc. — Class A | | | 5,151 | | | | 531,841 | | |
Paychex, Inc. | | | 9,729 | | | | 592,302 | | |
PayPal Holdings, Inc. (a) | | | 10,108 | | | | 398,963 | | |
Sabre Corporation | | | 14,431 | | | | 360,053 | | |
The Western Union Company | | | 22,259 | | | | 483,465 | | |
Total System Services, Inc. | | | 7,001 | | | | 343,259 | | |
Vantiv, Inc. — Class A (a) | | | 8,226 | | | | 490,434 | | |
Visa, Inc. — Class A | | | 5,957 | | | | 464,765 | | |
WEX, Inc. (a) | | | 2,956 | | | | 329,890 | | |
| | | | 12,000,273 | | |
Leisure Products (0.3%): | |
Hasbro, Inc. | | | 5,934 | | | | 461,606 | | |
Polaris Industries, Inc. | | | 3,769 | | | | 310,528 | | |
| | | | 772,134 | | |
See notes to financial statements.
43
Victory Portfolios II
VictoryShares US 500 Enhanced Volatility Wtd ETF | | Schedule of Investments — continued
December 31, 2016 | |
(Unaudited)
Security Description | | Shares | | Value | |
Life Sciences Tools & Services (1.5%): | |
Agilent Technologies, Inc. | | | 10,124 | | | $ | 461,249 | | |
Bio-Rad Laboratories, Inc. (a) | | | 3,675 | | | | 669,879 | | |
Illumina, Inc. (a) | | | 1,340 | | | | 171,574 | | |
Mettler-Toledo International, Inc. (a) | | | 1,279 | | | | 535,338 | | |
PerkinElmer, Inc. | | | 7,970 | | | | 415,635 | | |
Quintiles Transnational Holdings, Inc. (a) | | | 6,316 | | | | 480,332 | | |
Thermo Fisher Scientific, Inc. | | | 3,566 | | | | 503,163 | | |
Waters Corporation (a) | | | 3,527 | | | | 473,994 | | |
| | | | 3,711,164 | | |
Machinery (3.6%): | |
Allison Transmission Holdings, Inc. | | | 16,540 | | | | 557,233 | | |
Cummins, Inc. | | | 3,529 | | | | 482,308 | | |
Deere & Company | | | 4,797 | | | | 494,283 | | |
Donaldson Company, Inc. | | | 12,144 | | | | 511,020 | | |
Dover Corporation | | | 6,046 | | | | 453,027 | | |
Flowserve Corporation | | | 7,248 | | | | 348,266 | | |
IDEX Corporation | | | 6,329 | | | | 569,990 | | |
Illinois Tool Works, Inc. | | | 5,434 | | | | 665,448 | | |
Ingersoll-Rand PLC | | | 6,861 | | | | 514,849 | | |
Middleby Corporation (a) | | | 3,066 | | | | 394,931 | | |
Nordson Corporation | | | 3,529 | | | | 395,424 | | |
Parker-Hannifin Corporation | | | 3,810 | | | | 533,400 | | |
Snap-on, Inc. | | | 3,325 | | | | 569,473 | | |
Stanley Black & Decker, Inc. | | | 4,368 | | | | 500,966 | | |
The Toro Company | | | 11,184 | | | | 625,745 | | |
Wabtec Corporation | | | 5,121 | | | | 425,145 | | |
Xylem, Inc. | | | 11,983 | | | | 593,398 | | |
| | | | 8,634,906 | | |
Media (2.7%): | |
CBS Corporation — Class B | | | 8,184 | | | | 520,666 | | |
Cinemark Holdings, Inc. | | | 11,387 | | | | 436,805 | | |
Comcast Corporation — Class A | | | 9,752 | | | | 673,376 | | |
Discovery Communications, Inc. (a) | | | 13,839 | | | | 379,327 | | |
Omnicom Group, Inc. | | | 6,778 | | | | 576,876 | | |
Scripps Networks Interactive, Inc. — Class A | | | 6,537 | | | | 466,546 | | |
Sirius XM Holdings, Inc. | | | 135,539 | | | | 603,148 | | |
TEGNA, Inc. | | | 17,577 | | | | 375,972 | | |
The Interpublic Group of Companies. Inc. | | | 22,359 | | | | 523,424 | | |
The Walt Disney Company | | | 6,450 | | | | 672,219 | | |
Time Warner, Inc. | | | 6,205 | | | | 598,969 | | |
Twenty-First Century Fox, Inc. — Class A | | | 19,416 | | | | 544,425 | | |
Viacom, Inc. | | | 5,595 | | | | 196,384 | | |
| | | | 6,568,137 | | |
Metals & Mining (0.2%): | |
Reliance Steel & Aluminum Company | | | 5,589 | | | | 444,549 | | |
See notes to financial statements.
44
Victory Portfolios II
VictoryShares US 500 Enhanced Volatility Wtd ETF | | Schedule of Investments — continued
December 31, 2016 | |
(Unaudited)
Security Description | | Shares | | Value | |
Multiline Retail (0.8%): | |
Dollar General Corporation | | | 4,734 | | | $ | 350,647 | | |
Dollar Tree, Inc. (a) | | | 4,637 | | | | 357,884 | | |
Kohl's Corporation | | | 5,594 | | | | 276,232 | | |
Macy's, Inc. | | | 7,598 | | | | 272,084 | | |
Nordstrom, Inc. | | | 5,605 | | | | 268,648 | | |
Target Corporation | | | 6,765 | | | | 488,636 | | |
| | | | 2,014,131 | | |
Multi-Utilities (2.6%): | |
Ameren Corporation | | | 13,670 | | | | 717,128 | | |
CMS Energy Corporation | | | 16,549 | | | | 688,769 | | |
Consolidated Edison, Inc. | | | 8,830 | | | | 650,595 | | |
Dominion Resources, Inc. | | | 9,521 | | | | 729,213 | | |
DTE Energy Company | | | 7,389 | | | | 727,890 | | |
Public Service Enterprise Group, Inc. | | | 15,491 | | | | 679,745 | | |
SCANA Corporation | | | 9,648 | | | | 707,006 | | |
Sempra Energy | | | 5,829 | | | | 586,631 | | |
WEC Energy Group, Inc. | | | 11,094 | | | | 650,663 | | |
| | | | 6,137,640 | | |
Oil, Gas & Consumable Fuels (1.1%): | |
Cheniere Energy Partners LP Holdings LLC | | | 14,898 | | | | 333,268 | | |
Exxon Mobil Corporation | | | 6,291 | | | | 567,826 | | |
Marathon Petroleum Corporation | | | 5,592 | | | | 281,557 | | |
ONEOK, Inc. | | | 4,408 | | | | 253,063 | | |
Phillips 66 | | | 5,349 | | | | 462,207 | | |
Plains GP Holdings LP | | | 4,686 | | | | 162,511 | | |
Tesoro Corporation | | | 3,327 | | | | 290,946 | | |
Valero Energy Corporation | | | 5,621 | | | | 384,027 | | |
| | | | 2,735,405 | | |
Personal Products (0.2%): | |
Estee Lauder Companies, Inc. | | | 6,679 | | | | 510,877 | | |
Pharmaceuticals (1.4%): | |
Eli Lilly and Company | | | 6,678 | | | | 491,167 | | |
Johnson & Johnson | | | 7,155 | | | | 824,328 | | |
Mallinckrodt PLC (a) | | | 2,846 | | | | 141,788 | | |
Merck & Company, Inc. | | | 8,813 | | | | 518,821 | | |
Mylan NV (a) | | | 6,516 | | | | 248,585 | | |
Pfizer, Inc. | | | 18,679 | | | | 606,694 | | |
Zoetis, Inc. | | | 9,763 | | | | 522,613 | | |
| | | | 3,353,996 | | |
Professional Services (1.1%): | |
Dun & Bradstreet Corporation | | | 3,185 | | | | 386,404 | | |
Equifax, Inc. | | | 3,965 | | | | 468,782 | | |
ManpowerGroup, Inc. | | | 4,542 | | | | 403,648 | | |
Nielsen Holdings PLC | | | 11,685 | | | | 490,186 | | |
Robert Half International, Inc. | | | 8,369 | | | | 408,240 | | |
Verisk Analytics, Inc. (a) | | | 6,991 | | | | 567,459 | | |
| | | | 2,724,719 | | |
See notes to financial statements.
45
Victory Portfolios II
VictoryShares US 500 Enhanced Volatility Wtd ETF | | Schedule of Investments — continued
December 31, 2016 | |
(Unaudited)
Security Description | | Shares | | Value | |
Real Estate Management & Development (0.4%): | |
CBRE Group, Inc. — Class A (a) | | | 10,077 | | | $ | 317,325 | | |
Jones Lang LaSalle, Inc. | | | 2,235 | | | | 225,824 | | |
The Howard Hughes Corporation (a) | | | 2,946 | | | | 336,139 | | |
| | | | 879,288 | | |
Road & Rail (1.4%): | |
AMERCO | | | 1,179 | | | | 435,747 | | |
CSX Corporation | | | 14,435 | | | | 518,649 | | |
JB Hunt Transport Services, Inc. | | | 6,508 | | | | 631,731 | | |
Kansas City Southern | | | 4,307 | | | | 365,449 | | |
Norfolk Southern Corporation | | | 4,197 | | | | 453,570 | | |
Old Dominion Freight Line, Inc. (a) | | | 5,712 | | | | 490,032 | | |
Union Pacific Corporation | | | 4,767 | | | | 494,243 | | |
| | | | 3,389,421 | | |
Semiconductors & Semiconductor Equipment (1.9%): | |
Analog Devices, Inc. | | | 7,833 | | | | 568,832 | | |
Applied Materials, Inc. | | | 11,641 | | | | 375,655 | | |
Intel Corporation | | | 13,166 | | | | 477,531 | | |
Lam Research Corporation | | | 4,299 | | | | 454,533 | | |
NVIDIA Corporation | | | 5,262 | | | | 561,666 | | |
ON Semiconductor Corporation (a) | | | 26,656 | | | | 340,131 | | |
QUALCOMM, Inc. | | | 6,213 | | | | 405,088 | | |
Skyworks Solutions, Inc. | | | 3,781 | | | | 282,289 | | |
Texas Instruments, Inc. | | | 7,251 | | | | 529,106 | | |
Xilinx, Inc. | | | 8,222 | | | | 496,362 | | |
| | | | 4,491,193 | | |
Software (2.8%): | |
Activision Blizzard, Inc. | | | 7,741 | | | | 279,528 | | |
Adobe Systems, Inc. (a) | | | 4,203 | | | | 432,699 | | |
ANSYS, Inc. (a) | | | 5,221 | | | | 482,891 | | |
CA, Inc. | | | 16,178 | | | | 513,975 | | |
Cadence Design Systems, Inc. (a) | | | 19,367 | | | | 488,436 | | |
CDK Global, Inc. | | | 8,206 | | | | 489,816 | | |
Citrix Systems, Inc. (a) | | | 4,439 | | | | 396,447 | | |
Manhattan Associates, Inc. (a) | | | 4,772 | | | | 253,059 | | |
Microsoft Corporation | | | 7,980 | | | | 495,877 | | |
Oracle Corporation | | | 13,958 | | | | 536,685 | | |
Red Hat, Inc. (a) | | | 5,586 | | | | 389,344 | | |
Symantec Corporation | | | 12,816 | | | | 306,174 | | |
Synopsys, Inc. (a) | | | 10,627 | | | | 625,505 | | |
Tyler Technologies, Inc. (a) | | | 1,905 | | | | 271,977 | | |
Ultimate Software Group, Inc. (a) | | | 1,686 | | | | 307,442 | | |
VMware, Inc. — Class A (a) | | | 4,730 | | | | 372,393 | | |
| | | | 6,642,248 | | |
Specialty Retail (3.8%): | |
Advance Auto Parts, Inc. | | | 3,007 | | | | 508,544 | | |
AutoNation, Inc. (a) | | | 6,563 | | | | 319,290 | | |
AutoZone, Inc. (a) | | | 829 | | | | 654,736 | | |
See notes to financial statements.
46
Victory Portfolios II
VictoryShares US 500 Enhanced Volatility Wtd ETF | | Schedule of Investments — continued
December 31, 2016 | |
(Unaudited)
Security Description | | Shares | | Value | |
Specialty Retail (3.8%) cont'd | |
Bed Bath & Beyond, Inc. | | | 9,385 | | | $ | 381,406 | | |
Best Buy Company, Inc. | | | 7,502 | | | | 320,110 | | |
Burlington Stores, Inc. (a) | | | 4,029 | | | | 341,458 | | |
CarMax, Inc. (a) | | | 5,148 | | | | 331,480 | | |
Dick's Sporting Goods, Inc. | | | 5,910 | | | | 313,821 | | |
Foot Locker, Inc. | | | 5,912 | | | | 419,102 | | |
L Brands, Inc. | | | 4,856 | | | | 319,719 | | |
Lowe's Companies, Inc. | | | 6,823 | | | | 485,252 | | |
Michaels Companies, Inc. (a) | | | 13,906 | | | | 284,378 | | |
O'Reilly Automotive, Inc. (a) | | | 1,871 | | | | 520,905 | | |
Ross Stores, Inc. | | | 7,960 | | | | 522,176 | | |
Signet Jewelers Ltd. | | | 3,336 | | | | 314,451 | | |
The Gap, Inc. | | | 10,804 | | | | 242,442 | | |
The Home Depot, Inc. | | | 4,526 | | | | 606,846 | | |
The TJX Companies, Inc. | | | 7,216 | | | | 542,138 | | |
Tiffany & Company | | | 5,855 | | | | 453,353 | | |
Tractor Supply Company | | | 5,919 | | | | 448,719 | | |
Ulta Salon, Cosmetics & Fragrances, Inc. (a) | | | 1,415 | | | | 360,740 | | |
Urban Outfitters, Inc. (a) | | | 7,483 | | | | 213,116 | | |
Williams-Sonoma, Inc. | | | 6,175 | | | | 298,808 | | |
| | | | 9,202,990 | | |
Technology Hardware, Storage & Peripherals (0.3%): | |
Apple, Inc. | | | 4,148 | | | | 480,421 | | |
HP, Inc. | | | 23,356 | | | | 346,603 | | |
| | | | 827,024 | | |
Textiles, Apparel & Luxury Goods (0.8%): | |
Carter's, Inc. | | | 4,046 | | | | 349,534 | | |
Coach, Inc. | | | 9,724 | | | | 340,534 | | |
Hanesbrands, Inc. | | | 12,005 | | | | 258,948 | | |
NIKE, Inc. — Class B | | | 8,239 | | | | 418,788 | | |
PVH Corporation | | | 2,944 | | | | 265,667 | | |
VF Corporation | | | 7,039 | | | | 375,531 | | |
| | | | 2,009,002 | | |
Thrifts & Mortgage Finance (0.3%): | |
TFS Financial Corporation | | | 33,665 | | | | 640,982 | | |
Tobacco (0.9%): | |
Altria Group, Inc. | | | 11,981 | | | | 810,155 | | |
Philip Morris International, Inc. | | | 7,458 | | | | 682,332 | | |
Reynolds American, Inc. | | | 12,271 | | | | 687,667 | | |
| | | | 2,180,154 | | |
Trading Companies & Distributors (1.1%): | |
Fastenal Company | | | 11,032 | | | | 518,283 | | |
MSC Industrial Direct Company, Inc. | | | 7,402 | | | | 683,871 | | |
United Rentals, Inc. (a) | | | 2,718 | | | | 286,966 | | |
W.W. Grainger, Inc. | | | 2,372 | | | | 550,897 | | |
Watsco, Inc. | | | 3,772 | | | | 558,709 | | |
| | | | 2,598,726 | | |
See notes to financial statements.
47
Victory Portfolios II
VictoryShares US 500 Enhanced Volatility Wtd ETF | | Schedule of Investments — continued
December 31, 2016 | |
(Unaudited)
Security Description | | Shares | | Value | |
Transportation Infrastructure (0.2%): | |
Macquarie Infrastructure Company LLC | | | 4,616 | | | $ | 377,127 | | |
Water Utilities (0.5%): | |
American Water Works Company, Inc. | | | 7,699 | | | | 557,100 | | |
Aqua America, Inc. | | | 20,663 | | | | 620,716 | | |
| | | | 1,177,816 | | |
Wireless Telecommunication Services (0.2%): | |
T-Mobile US, Inc. (a) | | | 8,826 | | | | 507,583 | | |
Total Common Stocks (Cost $223,322,546) | | | 239,451,729 | | |
Short-Term Investments (0.1%) | |
Money Market Funds (0.1%): | |
Short-Term Investments Trust Government & Agency Portfolio —
Institutional Class, 0.43% (b) | | | 244,890 | | | | 244,890 | | |
Total Short-Term Investments (Cost $244,890) | | | 244,890 | | |
Total Investments — 99.9% (Cost $223,567,436) | | | 239,696,619 | | |
Other assets in excess of liabilities — 0.1% | | | 218,942 | | |
NET ASSETS — 100.0% | | $ | 239,915,561 | | |
(a) Non-income producing security.
(b) Annualized seven-day yield as of December 31, 2016.
The Global Industry Classification Standard (GICS®) was developed by and/or is the exclusive property of MSCI, Inc. and Standard & Poor's Financial Services LLC ("S&P"). GICS® is a service mark of MSCI, Inc. and S&P and has been licensed for use by the Fund's Administrator, U.S. Bancorp Fund Services, LLC.
Schedule of Open Futures Contracts
Number of
Contracts
Purchased | | Description | | Notional Value | | Unrealized
Depreciation | |
| | 3 | | | S&P 500 E-Mini Future, March 2017 | | $ | 335,430 | | | $ | (1,682 | ) | |
| | | $ | (1,682 | ) | |
See notes to financial statements.
48
Victory Portfolios II
VictoryShares Developed Enhanced Volatility Wtd ETF | | Schedule of Investments
December 31, 2016 | |
(Unaudited)
Security Description | | Shares | | Value | |
Common Stocks (25.2%) | |
Australia (1.2%): | |
AMP Ltd. | | | 5,310 | | | $ | 19,313 | | |
Aristocrat Leisure Ltd. | | | 1,596 | | | | 17,852 | | |
ASX Ltd. | | | 748 | | | | 26,849 | | |
Australia & New Zealand Banking Group Ltd. | | | 972 | | | | 21,338 | | |
Brambles Ltd. | | | 2,618 | | | | 23,427 | | |
Caltex Australia Ltd. | | | 848 | | | | 18,640 | | |
CIMIC Group Ltd. | | | 524 | | | | 13,212 | | |
Commonwealth Bank of Australia | | | 449 | | | | 26,703 | | |
Crown Resorts Ltd. | | | 1,820 | | | | 15,209 | | |
CSL Ltd. | | | 324 | | | | 23,477 | | |
Fortescue Metals Group Ltd. | | | 2,019 | | | | 8,582 | | |
Insurance Australia Group Ltd. | | | 5,535 | | | | 23,926 | | |
Macquarie Group Ltd. | | | 274 | | | | 17,227 | | |
Newcrest Mining Ltd. | | | 648 | | | | 9,470 | | |
QBE Insurance Group Ltd. | | | 2,344 | | | | 21,009 | | |
Ramsay Health Care Ltd. | | | 374 | | | | 18,434 | | |
Sonic Healthcare Ltd. | | | 1,272 | | | | 19,644 | | |
Suncorp Group Ltd. | | | 2,518 | | | | 24,568 | | |
Telstra Corporation Ltd. | | | 7,604 | | | | 27,986 | | |
TPG Telecom Ltd. | | | 2,643 | | | | 13,008 | | |
Westpac Banking Corporation | | | 922 | | | | 21,691 | | |
| | | | 411,565 | | |
Austria (0.0%): (a) | |
Erste Group Bank AG | | | 448 | | | | 13,122 | | |
Belgium (0.3%): | |
Anheuser-Busch InBev SA/NV | | | 174 | | | | 18,417 | | |
Colruyt SA | | | 448 | | | | 22,167 | | |
Proximus SADP | | | 772 | | | | 22,234 | | |
Solvay SA — Class A | | | 149 | | | | 17,465 | | |
UCB SA | | | 199 | | | | 12,759 | | |
Umicore SA | | | 299 | | | | 17,043 | | |
| | | | 110,085 | | |
Canada (3.1%): | |
Brookfield Asset Management, Inc. — Class A (b) | | | 2,500 | | | | 82,486 | | |
Fortis, Inc. | | | 2,500 | | | | 77,198 | | |
Gildan Activewear, Inc. (b) | | | 2,500 | | | | 63,475 | | |
Great-West Lifeco, Inc. | | | 2,500 | | | | 65,486 | | |
Hydro One Ltd. (Acquired 09/16/16 through 12/20/16, Cost $97,118) (b) (c) | | | 5,000 | | | | 87,812 | | |
Inter Pipeline Ltd. (b) | | | 2,500 | | | | 55,189 | | |
Loblaw Companies Ltd. (b) | | | 2,500 | | | | 131,903 | | |
Lululemon Athletica, Inc. (b) | | | 523 | | | | 33,990 | | |
Manulife Financial Corporation (b) | | | 2,500 | | | | 44,520 | | |
National Bank of Canada (b) | | | 2,500 | | | | 101,534 | | |
Potash Corporation of Saskatchewan, Inc. (b) | | | 2,500 | | | | 45,228 | | |
Power Corporation of Canada | | | 2,500 | | | | 55,953 | | |
Power Financial Corporation | | | 2,500 | | | | 62,488 | | |
See notes to financial statements.
49
Victory Portfolios II
VictoryShares Developed Enhanced Volatility Wtd ETF | | Schedule of Investments — continued
December 31, 2016 | |
(Unaudited)
Security Description | | Shares | | Value | |
Canada (3.1%) cont'd | |
Rogers Communications, Inc. — Class B | | | 2,500 | | | $ | 96,433 | | |
Shaw Communications, Inc. — Class B (b) | | | 5,000 | | | | 100,324 | | |
| | | | 1,104,019 | | |
Denmark (0.4%): | |
Chr. Hansen Holding A/S | | | 349 | | | | 19,327 | | |
Danske Bank A/S | | | 598 | | | | 18,137 | | |
DSV A/S | | | 349 | | | | 15,526 | | |
ISS A/S | | | 623 | | | | 21,030 | | |
Novo Nordisk A/S — Class B | | | 349 | | | | 12,586 | | |
Novozymes A/S — Class B | | | 374 | | | | 12,895 | | |
Pandora A/S | | | 125 | | | | 16,354 | | |
Vestas Wind System A/S | | | 174 | | | | 11,308 | | |
| | | | 127,163 | | |
Finland (0.3%): | |
Kone OYJ — Class B | | | 374 | | | | 16,760 | | |
Neste Oyj | | | 423 | | | | 16,252 | | |
Sampo Oyj — Class A | | | 423 | | | | 18,964 | | |
Stora Enso Oyj — Class R | | | 1,544 | | | | 16,594 | | |
UPM-Kymmene Oyj | | | 697 | | | | 17,125 | | |
Wartsila Oyj Abp | | | 423 | | | | 19,004 | | |
| | | | 104,699 | | |
France (2.5%): | |
Accor SA | | | 349 | | | | 13,016 | | |
Aeroports de Paris | | | 249 | | | | 26,683 | | |
Air Liquide SA | | | 199 | | | | 22,131 | | |
Airbus Group SE | | | 274 | | | | 18,125 | | |
Arkema SA | | | 174 | | | | 17,023 | | |
Atos SE | | | 174 | | | | 18,362 | | |
AXA SA | | | 573 | | | | 14,467 | | |
BNP Paribas SA | | | 224 | | | | 14,277 | | |
Bollore SA | | | 5,305 | | | | 18,708 | | |
Bureau Veritas SA | | | 1,171 | | | | 22,693 | | |
Capgemini SA | | | 174 | | | | 14,680 | | |
Carrefour SA | | | 648 | | | | 15,614 | | |
Christian Dior SE | | | 125 | | | | 26,218 | | |
Cie de Saint-Gobain | | | 374 | | | | 17,423 | | |
Cie Generale des Etablissements Michelin | | | 199 | | | | 22,142 | | |
CNP Assurances | | | 897 | | | | 16,618 | | |
Credit Agricole SA | | | 1,220 | | | | 15,128 | | |
Danone SA | | | 324 | | | | 20,532 | | |
Dassault Aviation SA | | | 25 | | | | 27,937 | | |
Dassault Systemes SE | | | 249 | | | | 18,974 | | |
Eiffage SA | | | 274 | | | | 19,108 | | |
Essilor International SA | | | 174 | | | | 19,662 | | |
Hermes International | | | 50 | | | | 20,527 | | |
Iliad SA | | | 75 | | | | 14,420 | | |
Ingenico Group SA | | | 149 | | | | 11,900 | | |
JCDecaux SA | | | 448 | | | | 13,171 | | |
See notes to financial statements.
50
Victory Portfolios II
VictoryShares Developed Enhanced Volatility Wtd ETF | | Schedule of Investments — continued
December 31, 2016 | |
(Unaudited)
Security Description | | Shares | | Value | |
France (2.5%) cont'd | |
Kering | | | 100 | | | $ | 22,453 | | |
Legrand SA | | | 324 | | | | 18,400 | | |
L'Oreal SA | | | 125 | | | | 22,816 | | |
LVMH Moet Hennessy Louis Vuitton SE | | | 100 | | | | 19,095 | | |
Natixis SA | | | 2,391 | | | | 13,491 | | |
Orange SA | | | 1,220 | | | | 18,538 | | |
Pernod Ricard SA | | | 199 | | | | 21,566 | | |
Peugeot SA (b) | | | 697 | | | | 11,369 | | |
Publicis Groupe SA | | | 274 | | | | 18,906 | | |
Renault SA | | | 149 | | | | 13,255 | | |
Sanofi | | | 274 | | | | 22,180 | | |
Sartorius Stedim Biotech | | | 224 | | | | 14,141 | | |
Schneider Electric SE | | | 224 | | | | 15,588 | | |
SEB SA | | | 125 | | | | 16,941 | | |
Societe BIC SA | | | 149 | | | | 20,257 | | |
Societe Generale SA | | | 274 | | | | 13,483 | | |
Sodexo SA | | | 199 | | | | 22,875 | | |
Suez | | | 1,171 | | | | 17,276 | | |
Thales SA | | | 249 | | | | 24,148 | | |
Valeo SA | | | 249 | | | | 14,314 | | |
Veolia Environnement SA | | | 922 | | | | 15,699 | | |
Vinci SA | | | 299 | | | | 20,364 | | |
Zodiac Aerospace | | | 399 | | | | 9,163 | | |
| | | | 885,857 | | |
Germany (1.6%): | |
Allianz SE | | | 125 | | | | 20,658 | | |
BASF SE | | | 249 | | | | 23,147 | | |
Bayer AG | | | 174 | | | | 18,157 | | |
Bayerische Motoren Werk AG | | | 174 | | | | 16,256 | | |
Beiersdorf AG | | | 274 | | | | 23,247 | | |
Brenntag AG | | | 349 | | | | 19,397 | | |
Commerzbank AG | | | 1,619 | | | | 12,349 | | |
Continental AG | | | 75 | | | | 14,503 | | |
Daimler AG | | | 224 | | | | 16,675 | | |
Deutsche Boerse AG | | | 224 | | | | 18,019 | | |
Deutsche Post AG | | | 623 | | | | 20,484 | | |
Deutsche Telekom AG | | | 1,370 | | | | 23,586 | | |
Evonik Industries AG | | | 523 | | | | 15,624 | | |
Fielmann AG | | | 349 | | | | 23,053 | | |
Fresenius Medical Care AG & Company KGaA | | | 249 | | | | 21,087 | | |
Fresenius SE & Company KGaA | | | 274 | | | | 21,419 | | |
GEA Group AG | | | 324 | | | | 13,039 | | |
Hannover Rueck SE | | | 199 | | | | 21,534 | | |
HOCHTIEF AG | | | 125 | | | | 17,507 | | |
Infineon Technologies AG | | | 971 | | | | 16,875 | | |
Linde AG | | | 100 | | | | 16,432 | | |
Merck KGaA | | | 199 | | | | 20,770 | | |
Muenchener Rueckversicherungs-Gesellschaft AG — Class R | | | 125 | | | | 23,639 | | |
ProSiebenSat.1 Media SE | | | 448 | | | | 17,265 | | |
See notes to financial statements.
51
Victory Portfolios II
VictoryShares Developed Enhanced Volatility Wtd ETF | | Schedule of Investments — continued
December 31, 2016 | |
(Unaudited)
Security Description | | Shares | | Value | |
Germany (1.6%) cont'd | |
SAP SE | | | 274 | | | $ | 23,885 | | |
Siemens AG | | | 174 | | | | 21,393 | | |
Symrise AG | | | 274 | | | | 16,680 | | |
Talanx AG | | | 672 | | | | 22,474 | | |
Vonovia SE | | | 573 | | | | 18,641 | | |
| | | | 557,795 | | |
Hong Kong (2.4%): | |
AIA Group Ltd. | | | 5,000 | | | | 28,209 | | |
Bank Of East Asia Ltd. | | | 5,000 | | | | 19,150 | | |
Beijing Enterprise Holdings Ltd. | | | 12,500 | | | | 59,079 | | |
China Taiping Insurance Holdings Company Ltd. (b) | | | 5,000 | | | | 10,317 | | |
China Unicom Hong Kong Ltd. | | | 50,000 | | | | 58,224 | | |
Chow Tai Fook Jewellery Group Ltd. | | | 20,000 | | | | 15,294 | | |
CITIC Ltd. | | | 25,000 | | | | 35,786 | | |
Dairy Farm International Holdings Ltd. | | | 5,000 | | | | 35,950 | | |
Fullshare Holdings Ltd. | | | 125,000 | | | | 58,353 | | |
Guangdong Investment Ltd. | | | 50,000 | | | | 66,026 | | |
Hanergy Thin Film Power Group Ltd. (b) (d) | | | 26,000 | | | | 570 | | |
Hang Lung Properties Ltd. | | | 25,000 | | | | 53,002 | | |
Hang Seng Bank Ltd. | | | 2,500 | | | | 46,521 | | |
Hong Kong & China Gas Company Ltd. | | | 49,640 | | | | 87,956 | | |
Hongkong Land Holdings Ltd. | | | 2,500 | | | | 15,825 | | |
MTR Corporation Ltd. | | | 12,500 | | | | 60,771 | | |
New World Development Company Ltd. | | | 50,000 | | | | 52,873 | | |
Sino Land Company Ltd. | | | 50,000 | | | | 74,924 | | |
Swire Properties Ltd. | | | 15,000 | | | | 41,395 | | |
WH Group Ltd. (Acquired 09/18/15 through 12/20/16, Cost $15,359) (c) | | | 25,000 | | | | 20,214 | | |
| | | | 840,439 | | |
Ireland (0.4%): | |
Accenture PLC — Class A | | | 224 | | | | 26,237 | | |
Bank of Ireland (b) | | | 38,257 | | | | 9,464 | | |
CRH PLC | | | 448 | | | | 15,625 | | |
DCC PLC | | | 224 | | | | 16,674 | | |
Experian PLC | | | 1,219 | | | | 23,646 | | |
Jazz Pharmaceuticals PLC (b) | | | 125 | | | | 13,629 | | |
Kerry Group PLC — Class A | | | 274 | | | | 19,518 | | |
Medtronic PLC | | | 349 | | | | 24,859 | | |
| | | | 149,652 | | |
Israel (0.2%): | |
Bank Hapoalim BM | | | 4,997 | | | | 29,719 | | |
Check Point Software Technologies Ltd. (b) | | | 324 | | | | 27,365 | | |
Mobileye NV (b) | | | 199 | | | | 7,586 | | |
Teva Pharmaceutical Industries Ltd. | | | 373 | | | | 13,392 | | |
| | | | 78,062 | | |
Italy (0.6%): | |
Assicurazioni Generali SpA | | | 897 | | | | 13,332 | | |
Atlantia SpA | | | 747 | | | | 17,504 | | |
See notes to financial statements.
52
Victory Portfolios II
VictoryShares Developed Enhanced Volatility Wtd ETF | | Schedule of Investments — continued
December 31, 2016 | |
(Unaudited)
Security Description | | Shares | | Value | |
Italy (0.6%) cont'd | |
Davide Campari-Milano SpA | | | 1,694 | | | $ | 16,566 | | |
Enel SpA | | | 3,786 | | | | 16,691 | | |
EXOR NV | | | 274 | | | | 11,820 | | |
Intesa Sanpaolo SpA | | | 3,661 | | | | 9,349 | | |
Leonardo-Finmeccanica SpA (b) | | | 1,071 | | | | 15,039 | | |
Luxottica Group SpA | | | 374 | | | | 20,118 | | |
Mediobanca SpA | | | 1,171 | | | | 9,559 | | |
Prada SpA | | | 5,000 | | | | 16,958 | | |
Snam SpA | | | 4,832 | | | | 19,908 | | |
Terna Rete Elettrica Nazionale SpA | | | 3,985 | | | | 18,256 | | |
UniCredit SpA | | | 2,765 | | | | 7,958 | | |
| | | | 193,058 | | |
Japan (4.3%): | |
Astellas Pharma, Inc. | | | 2,500 | | | | 34,727 | | |
Canon, Inc. | | | 2,500 | | | | 70,481 | | |
Chubu Electric Power Company, Inc. | | | 2,500 | | | | 34,930 | | |
Hankyu Hanshin Holdings, Inc. | | | 2,500 | | | | 80,214 | | |
Isuzu Motors Ltd. | | | 2,500 | | | | 31,679 | | |
Japan Airlines Company Ltd. | | | 2,500 | | | | 73,048 | | |
Japan Exchange Group, Inc. | | | 2,500 | | | | 35,722 | | |
Japan Post Bank Company Ltd. | | | 2,500 | | | | 30,011 | | |
Japan Post Holdings Company Ltd. | | | 2,500 | | | | 31,209 | | |
Komatsu Ltd. | | | 2,500 | | | | 56,631 | | |
Kubota Corporation | | | 2,500 | | | | 35,690 | | |
Kyowa Hakko Kirin Company Ltd. | | | 2,500 | | | | 34,567 | | |
Mazda Motor Corporation | | | 2,500 | | | | 40,898 | | |
Mitsubishi Electric Corp. | | | 2,500 | | | | 34,856 | | |
Mitsubishi UFJ Financial Group, Inc. | | | 2,500 | | | | 15,405 | | |
Mizuho Financial Group, Inc. | | | 7,500 | | | | 13,463 | | |
NGK Insulators Ltd. | | | 2,500 | | | | 48,492 | | |
Nippon Paint Holdings Company Ltd. | | | 2,500 | | | | 68,128 | | |
Nissan Motor Company Ltd. | | | 2,500 | | | | 25,144 | | |
NTT DOCOMO, Inc. | | | 2,500 | | | | 56,963 | | |
Obayashi Corporation | | | 2,500 | | | | 23,893 | | |
Odakyu Electric Railway Company Ltd. | | | 2,500 | | | | 49,476 | | |
Ono Pharmaceutical Company Ltd. | | | 2,500 | | | | 54,663 | | |
ORIX Corporation | | | 2,500 | | | | 39,016 | | |
Panasonic Corporation | | | 2,500 | | | | 25,444 | | |
Rakuten, Inc. | | | 2,500 | | | | 24,503 | | |
Renesas Electronics Corporation | | | 5,000 | | | | 39,701 | | |
Resona Holdings, Inc. | | | 2,500 | | | | 12,823 | | |
Ricoh Company Ltd. | | | 5,000 | | | | 42,267 | | |
Sekisui Chemical Company Ltd. | | | 2,500 | | | | 39,872 | | |
Sekisui House Ltd. | | | 2,500 | | | | 41,615 | | |
Sumitomo Dainippon Pharma Company Ltd. | | | 2,500 | | | | 42,995 | | |
Sumitomo Electric Industries Ltd. | | | 2,500 | | | | 36,075 | | |
Suntory Beverage & Food Ltd. | | | 2,500 | | | | 103,850 | | |
Unicharm Corporation | | | 2,500 | | | | 54,706 | | |
Yahoo Japan Corporation | | | 10,000 | | | | 38,417 | | |
| | | | 1,521,574 | | |
See notes to financial statements.
53
Victory Portfolios II
VictoryShares Developed Enhanced Volatility Wtd ETF | | Schedule of Investments — continued
December 31, 2016 | |
(Unaudited)
Security Description | | Shares | | Value | |
Netherlands (0.7%): | |
AerCap Holdings NV (b) | | | 299 | | | $ | 12,441 | | |
Akzo Nobel NV | | | 274 | | | | 17,130 | | |
| ASML Holding NV | | | 174 | | | | 19,534 | | |
GrandVision NV (Acquired 09/16/16 through 12/20/16, Cost $19,764) (c) | | | 722 | | | | 15,888 | | |
Heineken Holding NV | | | 349 | | | | 24,298 | | |
Heineken NV | | | 324 | | | | 24,304 | | |
ING Groep NV | | | 971 | | | | 13,666 | | |
Koninklijke Ahold Delhaize NV | | | 996 | | | | 21,000 | | |
Koninklijke DSM NV | | | 324 | | | | 19,427 | | |
Koninklijke KPN NV | | | 5,753 | | | | 17,041 | | |
Koninklijke Vopak NV | | | 324 | | | | 15,305 | | |
NN Group NV | | | 523 | | | | 17,725 | | |
Randstad Holding NV | | | 274 | | | | 14,863 | | |
Wolters Kluwer NV | | | 598 | | | | 21,667 | | |
| | | | 254,289 | | |
New Zealand (0.1%): | |
Auckland International Airport Ltd. | �� | | 3,960 | | | | 17,194 | | |
Norway (0.3%): | |
DNB ASA | | | 1,195 | | | | 17,769 | | |
Gjensidige Forsikring ASA | | | 1,295 | | | | 20,545 | | |
Marine Harvest ASA | | | 1,270 | | | | 22,899 | | |
Orkla ASA | | | 2,714 | | | | 24,577 | | |
Yara International ASA | | | 498 | | | | 19,608 | | |
| | | | 105,398 | | |
Portugal (0.1%): | |
EDP-Energias de Portugal SA | | | 5,181 | | | | 15,784 | | |
Jeronimo Martins SGPS SA | | | 1,196 | | | | 18,557 | | |
| | | | 34,341 | | |
Singapore (0.6%): | |
CapitaLand Ltd. | | | 10,000 | | | | 20,854 | | |
DBS Group Holdings Ltd. | | | 2,500 | | | | 29,935 | | |
Keppel Corporation Ltd. | | | 2,500 | | | | 9,996 | | |
Oversea-Chinese Banking Corporation Ltd. | | | 5,000 | | | | 30,798 | | |
Singapore Airlines Ltd. | | | 5,000 | | | | 33,388 | | |
Singapore Technologies Engineering Ltd. | | | 7,500 | | | | 16,728 | | |
Singapore Telecommunications Ltd. | | | 7,500 | | | | 18,903 | | |
United Overseas Bank Ltd. | | | 2,500 | | | | 35,217 | | |
| | | | 195,819 | | |
South Africa (0.0%): (a) | |
Steinhoff International Holdings NV | | | 2,017 | | | | 10,412 | | |
Spain (0.8%): | |
Abertis Infraestructuras SA | | | 1,345 | | | | 18,823 | | |
ACS Actividades de Construccion y Servicios SA | | | 498 | | | | 15,737 | | |
Aena SA (Acquired 03/18/16 through 12/20/16, Cost $19,017) (c) | | | 149 | | | | 20,335 | | |
Amadeus IT Group SA | | | 448 | | | | 20,359 | | |
Banco de Sabadell SA | | | 7,597 | | | | 10,580 | | |
See notes to financial statements.
54
Victory Portfolios II
VictoryShares Developed Enhanced Volatility Wtd ETF | | Schedule of Investments — continued
December 31, 2016 | |
(Unaudited)
Security Description | | Shares | | Value | |
Spain (0.8%) cont'd | |
Banco Santander SA | | | 2,242 | | | $ | 11,704 | | |
Bankia SA | | | 12,155 | | | | 12,424 | | |
Bankinter SA | | | 2,341 | | | | 18,137 | | |
Enagas SA | | | 897 | | | | 22,780 | | |
Ferrovial SA | | | 897 | | | | 16,047 | | |
Gamesa Corp Tecnologica SA | | | 523 | | | | 10,609 | | |
Gas Natural SDG SA | | | 897 | | | | 16,911 | | |
Grifols SA | | | 1,046 | | | | 20,788 | | |
Iberdrola SA | | | 3,263 | | | | 21,413 | | |
Industria de Diseno Textil SA | | | 548 | | | | 18,707 | | |
Mapfre SA | | | 4,981 | | | | 15,205 | | |
Red Electrica Corp SA | | | 1,395 | | | | 26,322 | | |
| | | | 296,881 | | |
Sweden (0.8%): | |
Alfa Laval AB | | | 921 | | | | 15,245 | | |
Assa Abloy AB — Class B | | | 872 | | | | 16,185 | | |
Atlas Copco AB — Class A | | | 523 | | | | 15,930 | | |
Autoliv, Inc. | | | 149 | | | | 16,859 | | |
Hennes & Mauritz AB — Class B | | | 573 | | | | 15,937 | | |
Hexagon AB — Class B | | | 423 | | | | 15,113 | | |
ICA Gruppen AB | | | 523 | | | | 15,953 | | |
Investment AB Latour | | | 473 | | | | 17,766 | | |
L E Lundbergforetagen AB — Class B | | | 398 | | | | 24,398 | | |
Nordea Bank AB | | | 1,668 | | | | 18,546 | | |
Skanska AB — Class B | | | 772 | | | | 18,227 | | |
| SKF AB — Class B | | | 872 | | | | 16,042 | | |
Svenska Cellulosa AB SCA — Class B | | | 623 | | | | 17,595 | | |
Svenska Handelsbanken AB — Class A | | | 1,220 | | | | 16,953 | | |
Swedbank AB — Class A | | | 747 | | | | 18,063 | | |
Swedish Match AB | | | 598 | | | | 19,022 | | |
Telefonaktiebolaget LM Ericsson — Class B | | | 2,042 | | | | 11,991 | | |
Volvo AB — Class B | | | 1,370 | | | | 16,000 | | |
| | | | 305,825 | | |
Switzerland (1.8%): | |
ABB Ltd. | | | 1,045 | | | | 22,043 | | |
Actelion Ltd. | | | 149 | | | | 32,264 | | |
Barry Callebaut AG | | | 25 | | | | 30,590 | | |
Chubb Ltd. | | | 224 | | | | 29,595 | | |
Cie Financiere Richemont SA | | | 348 | | | | 23,051 | | |
Coca-Cola HBC AG | | | 871 | | | | 19,000 | | |
EMS-Chemie Holding AG | | | 100 | | | | 50,820 | | |
Garmin Ltd. | | | 424 | | | | 20,560 | | |
Geberit AG | | | 75 | | | | 30,065 | | |
Julius Baer Group Ltd. | | | 348 | | | | 15,457 | | |
Kuehne + Nagel International AG — Class R | | | 224 | | | | 29,609 | | |
Lonza Group AG | | | 149 | | | | 25,797 | | |
Nestle SA | | | 373 | | | | 26,758 | | |
Novartis AG | | | 323 | | | | 23,504 | | |
See notes to financial statements.
55
Victory Portfolios II
VictoryShares Developed Enhanced Volatility Wtd ETF | | Schedule of Investments — continued
December 31, 2016 | |
(Unaudited)
Security Description | | Shares | | Value | |
Switzerland (1.8%) cont'd | |
Partners Group Holding AG | | | 50 | | | $ | 23,434 | | |
Roche Holdings AG | | | 124 | | | | 28,324 | | |
Schindler Holding AG | | | 149 | | | | 26,279 | | |
Sonova Holding AG | | | 199 | | | | 24,115 | | |
Swatch Group AG | | | 75 | | | | 23,326 | | |
Swiss Life Holding AG | | | 75 | | | | 21,226 | | |
Swiss Re AG | | | 249 | | | | 23,597 | | |
Swisscom AG | | | 50 | | | | 22,395 | | |
TE Connectivity Ltd. | | | 598 | | | | 41,429 | | |
UBS Group AG | | | 920 | | | | 14,410 | | |
Wolseley PLC | | | 348 | | | | 21,281 | | |
| | | | 648,929 | | |
United Kingdom (2.7%): | |
| 3i Group PLC | | | 1,890 | | | | 16,398 | | |
Admiral Group PLC | | | 672 | | | | 15,131 | | |
Aon PLC | | | 274 | | | | 30,559 | | |
Ashtead Group PLC | | | 796 | | | | 15,500 | | |
Associated British Foods PLC | | | 373 | | | | 12,618 | | |
Aviva PLC | | | 2,214 | | | | 13,272 | | |
Babcock International Group PLC | | | 1,418 | | | | 16,654 | | |
BAE Systems PLC | | | 3,383 | | | | 24,661 | | |
Barratt Developments PLC | | | 1,393 | | | | 7,938 | | |
British American Tobacco PLC | | | 448 | | | | 25,516 | | |
BT Group PLC | | | 3,258 | | | | 14,732 | | |
Bunzl PLC | | | 895 | | | | 23,262 | | |
Burberry Group PLC | | | 871 | | | | 16,069 | | |
Coca-Cola European Partners PLC | | | 324 | | | | 10,174 | | |
Compass Group PLC | | | 1,368 | | | | 25,306 | | |
Delphi Automotive PLC | | | 199 | | | | 13,403 | | |
Diageo PLC | | | 995 | | | | 25,874 | | |
Direct Line Insurance Group PLC | | | 3,482 | | | | 15,852 | | |
GKN PLC | | | 3,830 | | | | 15,657 | | |
Hargreaves Lansdown PLC | | | 672 | | | | 10,046 | | |
IHS Markit Ltd. (b) | | | 523 | | | | 18,519 | | |
Imperial Brands PLC | | | 522 | | | | 22,789 | | |
InterContinental Hotels Group PLC | | | 348 | | | | 15,603 | | |
International Consolidated Airlines Group SA | | | 1,915 | | | | 10,406 | | |
ITV PLC | | | 4,402 | | | | 11,197 | | |
Johnson Matthey PLC | | | 423 | | | | 16,588 | | |
Kingfisher PLC | | | 3,830 | | | | 16,535 | | |
Legal & General Group PLC | | | 3,855 | | | | 11,763 | | |
Marks & Spencer Group PLC | | | 2,985 | | | | 12,876 | | |
Merlin Entertainments PLC (Acquired 08/01/16 through 12/20/16,
Cost $20,107) (c) | | | 3,233 | | | | 17,874 | | |
Michael Kors Holdings Ltd. (b) | | | 249 | | | | 10,702 | | |
National Grid PLC | | | 2,015 | | | | 23,631 | | |
Next PLC | | | 174 | | | | 10,685 | | |
Old Mutual PLC | | | 5,323 | | | | 13,599 | | |
Pentair PLC | | | 299 | | | | 16,765 | | |
See notes to financial statements.
56
Victory Portfolios II
VictoryShares Developed Enhanced Volatility Wtd ETF | | Schedule of Investments — continued
December 31, 2016 | |
(Unaudited)
Security Description | | Shares | | Value | |
United Kingdom (2.7%) cont'd | |
Persimmon PLC | | | 373 | | | $ | 8,164 | | |
Prudential PLC | | | 672 | | | | 13,479 | | |
Reckitt Benckiser Group PLC | | | 298 | | | | 25,289 | | |
RELX NV | | | 1,345 | | | | 22,639 | | |
RELX PLC | | | 1,393 | | | | 24,876 | | |
Royal Mail PLC | | | 2,985 | | | | 16,999 | | |
RSA Insurance Group PLC | | | 2,960 | | | | 21,377 | | |
Sage Group PLC | | | 2,039 | | | | 16,459 | | |
Schroders PLC | | | 348 | | | | 12,858 | | |
Severn Trent PLC | | | 945 | | | | 25,878 | | |
Sky PLC | | | 1,766 | | | | 21,568 | | |
Smith & Nephew PLC | | | 1,492 | | | | 22,451 | | |
Smiths Group PLC | | | 1,094 | | | | 19,091 | | |
SSE PLC | | | 1,020 | | | | 19,522 | | |
St James's Place PLC | | | 1,020 | | | | 12,747 | | |
Standard Life PLC | | | 2,736 | | | | 12,543 | | |
Taylor Wimpey PLC | | | 4,029 | | | | 7,622 | | |
Unilever PLC | | | 572 | | | | 23,210 | | |
United Utilities Group PLC | | | 2,139 | | | | 23,751 | | |
Whitbread PLC | | | 298 | | | | 13,868 | | |
WPP PLC | | | 970 | | | | 21,709 | | |
| | | | 964,254 | | |
Total Common Stocks (Cost $8,631,975) | | | 8,930,432 | | |
Short-Term Investments (74.8%) | |
Money Market Funds (74.8%): | |
Short-Term Investments Trust Government & Agency Portfolio —
Institutional Class, 0.43% (e) | | | 26,487,548 | | | | 26,487,548 | | |
Total Short-Term Investments (Cost $26,487,548) | | | 26,487,548 | | |
Total Investments — 100.0% (Cost $35,119,523) | | | 35,417,980 | | |
Other assets in excess of liabilities — 0.0% (a) | | | 4,351 | | |
NET ASSETS — 100.0% | | $ | 35,422,331 | | |
(a) Less than 0.05%.
(b) Non-income producing security.
(c) Restricted securities as defined in Rule 144(a) and Regulation S under the Securities Act of 1933. Such securities are treated as liquid securities according to the Fund's liquidity guidlelines. The value of those securities total $162,123 or 0.46% of net assets.
(d) As of December 31, 2016, the Fund has fair valued this security. This security is deemed illiquid according to the Fund's liquidity guidelines. The value of this security was $570 or 0.00% of net assets.
(e) Annualized seven-day yield as of December 31, 2016.
See notes to financial statements.
57
Victory Portfolios II
VictoryShares US EQ Income Enhanced Volatility Wtd ETF | | Schedule of Investments
December 31, 2016 | |
(Unaudited)
Security Description | | Shares | | Value | |
Common Stocks (99.7%) | |
Aerospace & Defense (1.6%): | |
Lockheed Martin Corporation | | | 19,473 | | | $ | 4,867,082 | | |
Air Freight & Logistics (1.7%): | |
United Parcel Service, Inc. — Class B | | | 45,735 | | | | 5,243,060 | | |
Automobiles (1.7%): | |
Ford Motor Company | | | 188,674 | | | | 2,288,616 | | |
General Motors Company | | | 86,356 | | | | 3,008,643 | | |
| | | | 5,297,259 | | |
Banks (5.6%): | |
BB&T Corporation | | | 71,208 | | | | 3,348,200 | | |
Cullen/Frost Bankers, Inc. | | | 24,761 | | | | 2,184,663 | | |
Huntington Bancshares, Inc. | | | 207,366 | | | | 2,741,379 | | |
PacWest Bancorp | | | 45,860 | | | | 2,496,618 | | |
People's United Financial, Inc. | | | 169,933 | | | | 3,289,903 | | |
Wells Fargo & Company | | | 59,516 | | | | 3,279,927 | | |
| | | | 17,340,690 | | |
Beverages (1.5%): | |
The Coca-Cola Company | | | 109,595 | | | | 4,543,809 | | |
Biotechnology (0.8%): | |
AbbVie, Inc. | | | 37,478 | | | | 2,346,872 | | |
Capital Markets (3.5%): | |
Ameriprise Financial, Inc. | | | 20,747 | | | | 2,301,672 | | |
CME Group, Inc. | | | 31,574 | | | | 3,642,061 | | |
Invesco Ltd. | | | 57,876 | | | | 1,755,958 | | |
T. Rowe Price Group, Inc. | | | 41,837 | | | | 3,148,653 | | |
| | | | 10,848,344 | | |
Chemicals (2.7%): | |
CF Industries Holdings, Inc. | | | 49,034 | | | | 1,543,590 | | |
Huntsman Corporation | | | 73,693 | | | | 1,406,062 | | |
LyondellBasell Industries NV — Class A | | | 26,357 | | | | 2,260,904 | | |
The Dow Chemical Company | | | 55,081 | | | | 3,151,735 | | |
| | | | 8,362,291 | | |
Communications Equipment (0.9%): | |
Cisco Systems, Inc. | | | 89,297 | | | | 2,698,555 | | |
Consumer Finance (0.6%): | |
Navient Corporation | | | 107,906 | | | | 1,772,896 | | |
Containers & Packaging (2.7%): | |
International Paper Company | | | 48,712 | | | | 2,584,659 | | |
Packaging Corporation of America | | | 26,160 | | | | 2,218,891 | | |
Sonoco Products Company | | | 64,026 | | | | 3,374,170 | | |
| | | | 8,177,720 | | |
See notes to financial statements.
58
Victory Portfolios II
VictoryShares US EQ Income Enhanced Volatility Wtd ETF | | Schedule of Investments — continued
December 31, 2016 | |
(Unaudited)
Security Description | | Shares | | Value | |
Diversified Telecommunication Services (3.8%): | |
AT&T, Inc. | | | 127,151 | | | $ | 5,407,732 | | |
CenturyLink, Inc. | | | 78,309 | | | | 1,862,188 | | |
Verizon Communications, Inc. | | | 80,220 | | | | 4,282,144 | | |
| | | | 11,552,064 | | |
Electric Utilities (13.9%): | |
Alliant Energy Corporation | | | 101,998 | | | | 3,864,704 | | |
American Electric Power Company, Inc. | | | 61,045 | | | | 3,843,393 | | |
Duke Energy Corporation | | | 51,173 | | | | 3,972,048 | | |
Eversource Energy | | | 76,192 | | | | 4,208,084 | | |
Exelon Corporation | | | 96,531 | | | | 3,425,885 | | |
OGE Energy Corporation | | | 95,023 | | | | 3,178,520 | | |
PG&E Corporation | | | 67,430 | | | | 4,097,721 | | |
Pinnacle West Capital Corporation | | | 53,135 | | | | 4,146,124 | | |
PPL Corporation | | | 108,234 | | | | 3,685,368 | | |
Southern Company | | | 88,132 | | | | 4,335,213 | | |
Xcel Energy, Inc. | | | 101,266 | | | | 4,121,526 | | |
| | | | 42,878,586 | | |
Electrical Equipment (1.9%): | |
Eaton Corporation PLC | | | 40,610 | | | | 2,724,525 | | |
Emerson Electric Company | | | 54,182 | | | | 3,020,646 | | |
| | | | 5,745,171 | | |
Food & Staples Retailing (1.0%): | |
Wal-Mart Stores, Inc. | | | 46,455 | | | | 3,210,970 | | |
Food Products (1.3%): | |
Archer-Daniels-Midland Company | | | 51,362 | | | | 2,344,675 | | |
Pilgrim's Pride Corporation | | | 91,111 | | | | 1,730,198 | | |
| | | | 4,074,873 | | |
Hotels, Restaurants & Leisure (4.1%): | |
Carnival Corporation | | | 50,939 | | | | 2,651,884 | | |
Darden Restaurants, Inc. | | | 50,913 | | | | 3,702,393 | | |
Las Vegas Sands Corporation | | | 33,792 | | | | 1,804,831 | | |
McDonald's Corporation | | | 35,772 | | | | 4,354,168 | | |
| | | | 12,513,276 | | |
Household Products (2.8%): | |
Kimberly-Clark Corporation | | | 33,176 | | | | 3,786,045 | | |
Procter & Gamble Company | | | 57,720 | | | | 4,853,098 | | |
| | | | 8,639,143 | | |
Insurance (10.5%): | |
American Financial Group, Inc. | | | 53,586 | | | | 4,721,998 | | |
Arthur J Gallagher & Company | | | 74,786 | | | | 3,885,881 | | |
Cincinnati Financial Corporation | | | 52,736 | | | | 3,994,752 | | |
Erie Indemnity Company — Class A | | | 33,619 | | | | 3,780,456 | | |
MetLife, Inc. | | | 42,984 | | | | 2,316,408 | | |
Old Republic International Corporation | | | 214,260 | | | | 4,070,940 | | |
Principal Financial Group, Inc. | | | 42,432 | | | | 2,455,115 | | |
See notes to financial statements.
59
Victory Portfolios II
VictoryShares US EQ Income Enhanced Volatility Wtd ETF | | Schedule of Investments — continued
December 31, 2016 | |
(Unaudited)
Security Description | | Shares | | Value | |
Insurance (10.5%) cont'd | |
Progressive Corporation | | | 124,306 | | | $ | 4,412,863 | | |
Prudential Financial, Inc. | | | 26,243 | | | | 2,730,847 | | |
| | | | 32,369,260 | | |
IT Services (3.7%): | |
International Business Machines Corporation | | | 19,532 | | | | 3,242,117 | | |
Leidos Holdings, Inc. | | | 34,263 | | | | 1,752,210 | | |
Paychex, Inc. | | | 57,925 | | | | 3,526,474 | | |
The Western Union Company | | | 132,696 | | | | 2,882,157 | | |
| | | | 11,402,958 | | |
Machinery (1.9%): | |
Cummins, Inc. | | | 20,956 | | | | 2,864,057 | | |
Deere & Company | | | 28,702 | | | | 2,957,454 | | |
| | | | 5,821,511 | | |
Media (2.0%): | |
Cinemark Holdings, Inc. | | | 67,779 | | | | 2,600,002 | | |
TEGNA, Inc. | | | 104,690 | | | | 2,239,319 | | |
Viacom, Inc. | | | 33,358 | | | | 1,170,866 | | |
| | | | 6,010,187 | | |
Multiline Retail (2.5%): | |
Kohl's Corporation | | | 33,349 | | | | 1,646,773 | | |
Macy's, Inc. | | | 45,254 | | | | 1,620,546 | | |
Nordstrom, Inc. | | | 33,460 | | | | 1,603,738 | | |
Target Corporation | | | 40,304 | | | | 2,911,158 | | |
| | | | 7,782,215 | | |
Multi-Utilities (9.4%): | |
Ameren Corporation | | | 81,449 | | | | 4,272,815 | | |
Consolidated Edison, Inc. | | | 52,702 | | | | 3,883,083 | | |
Dominion Resources, Inc. | | | 56,753 | | | | 4,346,712 | | |
DTE Energy Company | | | 44,073 | | | | 4,341,631 | | |
Public Service Enterprise Group, Inc. | | | 92,420 | | | | 4,055,390 | | |
SCANA Corporation | | | 57,515 | | | | 4,214,699 | | |
WEC Energy Group, Inc. | | | 66,218 | | | | 3,883,686 | | |
| | | | 28,998,016 | | |
Oil, Gas & Consumable Fuels (4.1%): | |
Exxon Mobil Corporation | | | 37,484 | | | | 3,383,306 | | |
Marathon Petroleum Corporation | | | 33,339 | | | | 1,678,619 | | |
ONEOK, Inc. | | | 26,308 | | | | 1,510,342 | | |
Phillips 66 | | | 31,868 | | | | 2,753,714 | | |
Plains GP Holdings LP | | | 27,957 | | | | 969,549 | | |
Valero Energy Corporation | | | 33,602 | | | | 2,295,688 | | |
| | | | 12,591,218 | | |
Pharmaceuticals (2.2%): | |
Merck & Company, Inc. | | | 52,554 | | | | 3,093,854 | | |
Pfizer, Inc. | | | 111,351 | | | | 3,616,680 | | |
| | | | 6,710,534 | | |
See notes to financial statements.
60
Victory Portfolios II
VictoryShares US EQ Income Enhanced Volatility Wtd ETF | | Schedule of Investments — continued
December 31, 2016 | |
(Unaudited)
Security Description | | Shares | | Value | |
Semiconductors & Semiconductor Equipment (1.7%): | |
Intel Corporation | | | 78,359 | | | $ | 2,842,081 | | |
QUALCOMM, Inc. | | | 37,090 | | | | 2,418,268 | | |
| | | | 5,260,349 | | |
Software (1.6%): | |
CA, Inc. | | | 96,445 | | | | 3,064,058 | | |
Symantec Corporation | | | 76,335 | | | | 1,823,643 | | |
| | | | 4,887,701 | | |
Specialty Retail (1.7%): | |
Best Buy Company, Inc. | | | 44,713 | | | | 1,907,904 | | |
L Brands, Inc. | | | 28,886 | | | | 1,901,854 | | |
The Gap, Inc. | | | 64,336 | | | | 1,443,700 | | |
| | | | 5,253,458 | | |
Technology Hardware, Storage & Peripherals (0.7%): | |
HP, Inc. | | | 139,327 | | | | 2,067,613 | | |
Textiles, Apparel & Luxury Goods (0.7%): | |
Coach, Inc. | | | 57,893 | | | | 2,027,413 | | |
Tobacco (4.2%): | |
Altria Group, Inc. | | | 71,327 | | | | 4,823,132 | | |
Philip Morris International, Inc. | | | 44,362 | | | | 4,058,679 | | |
Reynolds American, Inc. | | | 73,210 | | | | 4,102,688 | | |
| | | | 12,984,499 | | |
Transportation Infrastructure (0.7%): | |
Macquarie Infrastructure Company LLC | | | 27,439 | | | | 2,241,766 | | |
Total Common Stocks (Cost $288,899,001) | | | 306,521,359 | | |
Short-Term Investments (0.1%) | |
Money Market Funds (0.1%): | |
Short-Term Investments Trust Government & Agency Portfolio —
Institutional Class, 0.43% (a) | | | 443,461 | | | | 443,461 | | |
Total Short-Term Investments (Cost $443,461) | | | 443,461 | | |
Total Investments — 99.8% (Cost $289,342,462) | | | 306,964,820 | | |
Other assets in excess of liabilities — 0.2% | | | 553,202 | | |
NET ASSETS — 100.0% | | $ | 307,518,022 | | |
(a) Annualized seven-day yield as of December 31, 2016.
The Global Industry Classification Standard (GICS®) was developed by and/or is the exclusive property of MSCI, Inc. and Standard & Poor's Financial Services LLC ("S&P"). GICS® is a service mark of MSCI, Inc. and S&P and has been licensed for use by the Fund's Administrator, U.S. Bancorp Fund Services, LLC.
See notes to financial statements.
61
Victory Portfolios II
VictoryShares US EQ Income Enhanced Volatility Wtd ETF | | Schedule of Investments — continued
December 31, 2016 | |
(Unaudited)
Schedule of Open Futures Contracts
Number of
Contracts
Purchased | | Description | | Notional Value | | Unrealized
Depreciation | |
| | 5 | | | S&P 500 E-Mini Future, March 2017 | | $ | 559,050 | | | $ | (2,620 | ) | |
| | | $ | (2,620 | ) | |
See notes to financial statements.
62
Victory Portfolios II
VictoryShares US Small Cap Volatility Wtd ETF | | Schedule of Investments
December 31, 2016 | |
(Unaudited)
Security Description | | Shares | | Value | |
Common Stocks (100.0%) | |
Aerospace & Defense (1.3%): | |
AAR Corporation | | | 1,059 | | | $ | 35,000 | | |
Astronics Corporation (a) | | | 66 | | | | 2,224 | | |
Astronics Corporation (a) | | | 505 | | | | 17,089 | | |
DigitalGlobe, Inc. (a) | | | 916 | | | | 26,243 | | |
Mercury Systems, Inc. (a) | | | 1,384 | | | | 41,825 | | |
Moog, Inc. — Class A (a) | | | 501 | | | | 32,906 | | |
National Presto Industries, Inc. | | | 476 | | | | 50,646 | | |
TASER International, Inc. (a) | | | 1,113 | | | | 26,979 | | |
| | | | 232,912 | | |
Air Freight & Logistics (0.5%): | |
Air Transport Services Group, Inc. (a) | | | 1,974 | | | | 31,505 | | |
Echo Global Logistics, Inc. (a) | | | 1,227 | | | | 30,737 | | |
Hub Group, Inc. — Class A (a) | | | 855 | | | | 37,406 | | |
| | | | 99,648 | | |
Airlines (0.7%): | |
Allegiant Travel Company | | | 219 | | | | 36,442 | | |
Hawaiian Holdings, Inc. (a) | | | 548 | | | | 31,236 | | |
SkyWest, Inc. | | | 869 | | | | 31,675 | | |
Spirit Airlines, Inc. (a) | | | 606 | | | | 35,063 | | |
| | | | 134,416 | | |
Auto Components (2.1%): | |
American Axle & Manufacturing Holdings, Inc. (a) | | | 1,166 | | | | 22,504 | | |
Cooper Standard Holding, Inc. (a) | | | 369 | | | | 38,147 | | |
Cooper Tire & Rubber Company | | | 944 | | | | 36,674 | | |
Dorman Products, Inc. (a) | | | 593 | | | | 43,325 | | |
Drew Industries, Inc. | | | 391 | | | | 42,130 | | |
Fox Factory Holdings Corporation (a) | | | 1,522 | | | | 42,236 | | |
Gentherm, Inc. (a) | | | 723 | | | | 24,474 | | |
Metaldyne Performance Group, Inc. | | | 1,512 | | | | 34,700 | | |
Standard Motor Products, Inc. | | | 638 | | | | 33,954 | | |
Stoneridge, Inc. (a) | | | 1,519 | | | | 26,871 | | |
Superior Industries International, Inc. | | | 1,163 | | | | 30,645 | | |
Visteon Corporation | | | 220 | | | | 17,675 | | |
| | | | 393,335 | | |
Automobiles (0.2%): | |
Winnebago Industries, Inc. | | | 1,407 | | | | 44,532 | | |
Banks (16.3%): | |
1st Source Corporation | | | 1,360 | | | | 60,738 | | |
Ameris Bancorp | | | 1,169 | | | | 50,968 | | |
Associated Banc-Corp | | | 1,906 | | | | 47,078 | | |
Banc of California, Inc. | | | 1,442 | | | | 25,019 | | |
BancFirst Corporation | | | 610 | | | | 56,760 | | |
BancorpSouth, Inc. | | | 1,438 | | | | 44,650 | | |
Banner Corporation | | | 903 | | | | 50,396 | | |
See notes to financial statements.
63
Victory Portfolios II
VictoryShares US Small Cap Volatility Wtd ETF | | Schedule of Investments — continued
December 31, 2016 | |
(Unaudited)
Security Description | | Shares | | Value | |
Banks (16.3%) cont'd | |
BNC Bancorp | | | 1,681 | | | $ | 53,624 | | |
Boston Private Financial Holdings, Inc. | | | 2,973 | | | | 49,203 | | |
Capital Bank Financial Corporation | | | 1,492 | | | | 58,561 | | |
Cathay General Bancorp | | | 1,234 | | | | 46,929 | | |
Chemical Financial Corporation | | | 1,035 | | | | 56,066 | | |
Columbia Banking System, Inc. | | | 1,159 | | | | 51,784 | | |
Community Bank Systems, Inc. | | | 981 | | | | 60,616 | | |
CVB Financial Corporation | | | 2,232 | | | | 51,180 | | |
Eagle Bancorp, Inc. (a) | | | 731 | | | | 44,554 | | |
FCB Financial Holdings, Inc. (a) | | | 1,002 | | | | 47,795 | | |
First Busey Corporation | | | 2,216 | | | | 68,208 | | |
First Commonwealth Financial Corporation | | | 3,912 | | | | 55,472 | | |
First Financial Bancorp | | | 2,025 | | | | 57,611 | | |
First Financial Bankshares, Inc. | | | 940 | | | | 42,488 | | |
First Interstate BancSystem, Inc. — Class A | | | 1,538 | | | | 65,442 | | |
First Merchants Corporation | | | 1,630 | | | | 61,369 | | |
First Midwest Bancorp, Inc. | | | 1,992 | | | | 50,258 | | |
FNB Corporation | | | 3,039 | | | | 48,715 | | |
Fulton Financial Corporation | | | 2,921 | | | | 54,915 | | |
Glacier Bancorp, Inc. | | | 1,330 | | | | 48,186 | | |
Great Western Bancorp, Inc. | | | 1,106 | | | | 48,211 | | |
Hancock Holding Company | | | 927 | | | | 39,954 | | |
Heartland Financial USA, Inc. | | | 903 | | | | 43,344 | | |
Hilltop Holdings, Inc. | | | 1,438 | | | | 42,852 | | |
Hope Bancorp, Inc. | | | 2,159 | | | | 47,261 | | |
IBERIABANK Corporation | | | 478 | | | | 40,032 | | |
Independent Bank Corporation | | | 758 | | | | 53,401 | | |
International Bancshares Corporation | | | 1,165 | | | | 47,532 | | |
Lakeland Financial Corporation | | | 1,432 | | | | 67,820 | | |
LegacyTexas Financial Group, Inc. | | | 887 | | | | 38,194 | | |
MB Financial, Inc. | | | 997 | | | | 47,088 | | |
NBT Bancorp, Inc. | | | 1,440 | | | | 60,307 | | |
Old National Bancorp | | | 2,919 | | | | 52,980 | | |
Opus Bank | | | 892 | | | | 26,805 | | |
Park National Corporation | | | 404 | | | | 48,343 | | |
Pinnacle Financial Partners, Inc. | | | 640 | | | | 44,352 | | |
Renasant Corporation | | | 1,178 | | | | 49,735 | | |
S&T Bancorp, Inc. | | | 1,293 | | | | 50,479 | | |
ServisFirst Bancshares, Inc. | | | 1,362 | | | | 50,993 | | |
Simmons First National Corporation — Class A | | | 740 | | | | 45,991 | | |
South State Corporation | | | 559 | | | | 48,857 | | |
Sterling Bancorp | | | 2,295 | | | | 53,703 | | |
TCF Financial Corporation | | | 2,253 | | | | 44,136 | | |
Texas Capital Bancshares, Inc. (a) | | | 441 | | | | 34,574 | | |
Tompkins Financial Corporation | | | 544 | | | | 51,430 | | |
Towne Bank | | | 1,947 | | | | 64,738 | | |
Trustmark Corporation | | | 1,621 | | | | 57,789 | | |
Union Bankshares Corporation | | | 1,613 | | | | 57,649 | | |
United Community Banks, Inc. | | | 1,906 | | | | 56,456 | | |
Valley National Bancorp | | | 4,272 | | | | 49,726 | | |
See notes to financial statements.
64
Victory Portfolios II
VictoryShares US Small Cap Volatility Wtd ETF | | Schedule of Investments — continued
December 31, 2016 | |
(Unaudited)
Security Description | | Shares | | Value | |
Banks (16.3%) cont'd | |
WesBanco, Inc. | | | 1,577 | | | $ | 67,906 | | |
Westamerica Bancorporation | | | 849 | | | | 53,428 | | |
Wintrust Financial Corporation | | | 670 | | | | 48,622 | | |
| | | | 3,043,273 | | |
Beverages (0.4%): | |
MGP Ingredients, Inc. | | | 492 | | | | 24,590 | | |
National Beverage Corporation | | | 542 | | | | 27,686 | | |
The Boston Beer Company, Inc. — Class A (a) | | | 151 | | | | 25,647 | | |
| | | | 77,923 | | |
Biotechnology (0.4%): | |
Insys Therapeutics, Inc. (a) | | | 918 | | | | 8,446 | | |
MiMedx Group, Inc. (a) | | | 3,297 | | | | 29,211 | | |
Myriad Genetics, Inc. (a) | | | 903 | | | | 15,053 | | |
Repligen Corporation (a) | | | 652 | | | | 20,095 | | |
| | | | 72,805 | | |
Building Products (2.6%): | |
AAON, Inc. | | | 1,208 | | | | 39,924 | | |
American Woodmark Corporation (a) | | | 297 | | | | 22,349 | | |
Apogee Enterprises, Inc. | | | 701 | | | | 37,545 | | |
Continental Building Products, Inc. (a) | | | 1,359 | | | | 31,393 | | |
CSW Industrials, Inc. (a) | | | 1,342 | | | | 49,453 | | |
Gibraltar Industries, Inc. (a) | | | 597 | | | | 24,865 | | |
Griffon Corporation | | | 2,495 | | | | 65,369 | | |
Insteel Industries, Inc. | | | 801 | | | | 28,548 | | |
NCI Building Systems, Inc. (a) | | | 1,826 | | | | 28,577 | | |
Patrick Industries, Inc. (a) | | | 372 | | | | 28,383 | | |
PGT, Inc. (a) | | | 1,975 | | | | 22,614 | | |
Simpson Manufacturing Company, Inc. | | | 1,152 | | | | 50,400 | | |
Trex Company, Inc. (a) | | | 439 | | | | 28,272 | | |
Universal Forest Products, Inc. | | | 289 | | | | 29,530 | | |
| | | | 487,222 | | |
Capital Markets (2.4%): | |
Artisan Partners Asset Management, Inc. — Class A | | | 1,074 | | | | 31,952 | | |
BGC Partners, Inc. — Class A | | | 5,263 | | | | 53,840 | | |
Cohen & Steers, Inc. | | | 897 | | | | 30,139 | | |
Evercore Partners, Inc. — Class A | | | 546 | | | | 37,510 | | |
Financial Engines, Inc. | | | 782 | | | | 28,739 | | |
Houlihan Lokey, Inc. | | | 1,425 | | | | 44,346 | | |
Janus Capital Group, Inc. | | | 2,114 | | | | 28,053 | | |
LPL Financial Holdings, Inc. | | | 499 | | | | 17,570 | | |
Moelis & Company — Class A | | | 1,247 | | | | 42,273 | | |
NorthStar Asset Management Group, Inc. | | | 1,949 | | | | 29,079 | | |
Stifel Financial Corporation (a) | | | 630 | | | | 31,469 | | |
Virtu Financial, Inc. | | | 2,254 | | | | 35,951 | | |
Waddell & Reed Financial, Inc. — Class A | | | 1,188 | | | | 23,178 | | |
WisdomTree Investments, Inc. | | | 1,802 | | | | 20,074 | | |
| | | | 454,173 | | |
See notes to financial statements.
65
Victory Portfolios II
VictoryShares US Small Cap Volatility Wtd ETF | | Schedule of Investments — continued
December 31, 2016 | |
(Unaudited)
Security Description | | Shares | | Value | |
Chemicals (2.3%): | |
American Vanguard Corporation | | | 1,133 | | | $ | 21,697 | | |
Balchem Corporation | | | 465 | | | | 39,023 | | |
Calgon Carbon Corporation | | | 1,967 | | | | 33,439 | | |
FutureFuel Corporation | | | 2,289 | | | | 31,817 | | |
HB Fuller Company | | | 898 | | | | 43,382 | | |
Innospec, Inc. | | | 663 | | | | 45,415 | | |
Minerals Technologies, Inc. | | | 418 | | | | 32,291 | | |
PolyOne Corporation | | | 978 | | | | 31,335 | | |
Quaker Chemical Corporation | | | 422 | | | | 53,991 | | |
Rayonier Advanced Materials, Inc. | | | 1,259 | | | | 19,464 | | |
Stepan Company | | | 504 | | | | 41,066 | | |
Trinseo SA | | | 508 | | | | 30,124 | | |
| | | | 423,044 | | |
Commercial Services & Supplies (3.6%): | |
ABM Industries, Inc. | | | 1,430 | | | | 58,401 | | |
ACCO Brands Corporation (a) | | | 2,540 | | | | 33,147 | | |
Healthcare Services Group, Inc. | | | 1,343 | | | | 52,605 | | |
Herman Miller, Inc. | | | 1,012 | | | | 34,610 | | |
HNI Corporation | | | 600 | | | | 33,552 | | |
Interface, Inc. | | | 1,633 | | | | 30,292 | | |
Knoll, Inc. | | | 1,452 | | | | 40,554 | | |
Matthews International Corporation — Class A | | | 783 | | | | 60,174 | | |
McGrath RentCorp | | | 1,206 | | | | 47,263 | | |
Mobile Mini, Inc. | | | 1,010 | | | | 30,553 | | |
MSA Safety, Inc. | | | 676 | | | | 46,867 | | |
Multi-Color Corporation | | | 387 | | | | 30,031 | | |
Steelcase, Inc. — Class A | | | 2,578 | | | | 46,146 | | |
UniFirst Corporation | | | 367 | | | | 52,720 | | |
US Ecology, Inc. | | | 690 | | | | 33,914 | | |
West Corporation | | | 1,341 | | | | 33,203 | | |
| | | | 664,032 | | |
Communications Equipment (1.1%): | |
ADTRAN, Inc. | | | 1,949 | | | | 43,560 | | |
Finisar Corporation (a) | | | 1,093 | | | | 33,085 | | |
Infinera Corporation (a) | | | 1,677 | | | | 14,238 | | |
InterDigital, Inc. | | | 562 | | | | 51,339 | | |
NETGEAR, Inc. (a) | | | 646 | | | | 35,110 | | |
Plantronics, Inc. | | | 433 | | | | 23,711 | | |
| | | | 201,043 | | |
Construction & Engineering (1.0%): | |
Argan, Inc. | | | 639 | | | | 45,081 | | |
Comfort Systems USA, Inc. | | | 1,145 | | | | 38,129 | | |
Dycom Industries, Inc. (a) | | | 273 | | | | 21,919 | | |
KBR, Inc. | | | 1,814 | | | | 30,276 | | |
Primoris Services Corporation | | | 1,549 | | | | 35,286 | | |
Tutor Perini Corporation (a) | | | 789 | | | | 22,092 | | |
| | | | 192,783 | | |
See notes to financial statements.
66
Victory Portfolios II
VictoryShares US Small Cap Volatility Wtd ETF | | Schedule of Investments — continued
December 31, 2016 | |
(Unaudited)
Security Description | | Shares | | Value | |
Construction Materials (0.2%): | |
Headwaters, Inc. (a) | | | 1,700 | | | $ | 39,984 | | |
Consumer Finance (0.5%): | |
FirstCash, Inc. | | | 489 | | | | 22,983 | | |
Nelnet, Inc. — Class A | | | 876 | | | | 44,457 | | |
PRA Group, Inc. (a) | | | 575 | | | | 22,483 | | |
| | | | 89,923 | | |
Containers & Packaging (0.3%): | |
Silgan Holdings, Inc. | | | 1,021 | | | | 52,255 | | |
Distributors (0.2%): | |
Core-Mark Holding Company, Inc. | | | 782 | | | | 33,681 | | |
Diversified Consumer Services (0.8%): | |
Capella Education Company | | | 623 | | | | 54,699 | | |
Grand Canyon Education, Inc. (a) | | | 893 | | | | 52,196 | | |
Strayer Education, Inc. (a) | | | 561 | | | | 45,234 | | |
| | | | 152,129 | | |
Diversified Telecommunication Services (0.5%): | |
Cincinnati Bell, Inc. (a) | | | 1,329 | | | | 29,703 | | |
Cogent Communications Holdings, Inc. | | | 911 | | | | 37,670 | | |
Inteliquent, Inc. | | | 1,485 | | | | 34,036 | | |
| | | | 101,409 | | |
Electric Utilities (1.0%): | |
ALLETE, Inc. | | | 947 | | | | 60,788 | | |
MGE Energy, Inc. | | | 933 | | | | 60,925 | | |
Otter Tail Corporation | | | 1,434 | | | | 58,507 | | |
| | | | 180,220 | | |
Electrical Equipment (0.7%): | |
AZZ, Inc. | | | 630 | | | | 40,257 | | |
Encore Wire Corporation | | | 775 | | | | 33,596 | | |
Generac Holdings, Inc. (a) | | | 729 | | | | 29,699 | | |
Thermon Group Holdings, Inc. (a) | | | 1,718 | | | | 32,797 | | |
| | | | 136,349 | | |
Electronic Equipment, Instruments & Components (3.7%): | |
Anixter International, Inc. (a) | | | 426 | | | | 34,527 | | |
AVX Corporation | | | 3,426 | | | | 53,548 | | |
Badger Meter, Inc. | | | 1,138 | | | | 42,049 | | |
Benchmark Electronics, Inc. (a) | | | 1,450 | | | | 44,225 | | |
Coherent, Inc. (a) | | | 270 | | | | 37,094 | | |
ePlus, Inc. (a) | | | 308 | | | | 35,482 | | |
II-VI, Inc. (a) | | | 1,415 | | | | 41,955 | | |
Insight Enterprises, Inc. (a) | | | 918 | | | | 37,124 | | |
Littelfuse, Inc. | | | 330 | | | | 50,084 | | |
Methode Electronics, Inc. | | | 938 | | | | 38,786 | | |
MTS Systems Corporation | | | 510 | | | | 28,917 | | |
OSI Systems, Inc. (a) | | | 265 | | | | 20,172 | | |
See notes to financial statements.
67
Victory Portfolios II
VictoryShares US Small Cap Volatility Wtd ETF | | Schedule of Investments — continued
December 31, 2016 | |
(Unaudited)
Security Description | | Shares | | Value | |
Electronic Equipment, Instruments & Components (3.7%) cont'd | |
Plexus Corporation (a) | | | 798 | | | $ | 43,124 | | |
Rogers Corporation (a) | | | 445 | | | | 34,180 | | |
Sanmina Corporation (a) | | | 1,069 | | | | 39,179 | | |
ScanSource, Inc. (a) | | | 792 | | | | 31,957 | | |
Tech Data Corporation (a) | | | 447 | | | | 37,852 | | |
Universal Display Corporation (a) | | | 372 | | | | 20,944 | | |
VeriFone Systems, Inc. (a) | | | 1,356 | | | | 24,042 | | |
| | | | 695,241 | | |
Energy Equipment & Services (0.4%): | |
Atwood Oceanics, Inc. | | | 1,426 | | | | 18,723 | | |
Dril-Quip, Inc. (a) | | | 570 | | | | 34,229 | | |
Oceaneering International, Inc. | | | 907 | | | | 25,586 | | |
| | | | 78,538 | | |
Food & Staples Retailing (1.2%): | |
Ingles Markets, Inc. — Class A | | | 706 | | | | 33,959 | | |
Performance Food Group Company (a) | | | 1,357 | | | | 32,568 | | |
PriceSmart, Inc. | | | 457 | | | | 38,159 | | |
SpartanNash Company | | | 866 | | | | 34,242 | | |
SUPERVALU, Inc. (a) | | | 3,299 | | | | 15,406 | | |
United Natural Foods, Inc. (a) | | | 498 | | | | 23,764 | | |
Weis Markets, Inc. | | | 789 | | | | 52,737 | | |
| | | | 230,835 | | |
Food Products (1.5%): | |
Calavo Growers, Inc. | | | 455 | | | | 27,937 | | |
Dean Foods Company | | | 2,150 | | | | 46,827 | | |
J&J Snack Foods Corporation | | | 531 | | | | 70,851 | | |
John B Sanfilippo & Son, Inc. | | | 451 | | | | 31,746 | | |
Omega Protein Corporation (a) | | | 808 | | | | 20,240 | | |
Sanderson Farms, Inc. | | | 357 | | | | 33,644 | | |
Tootsie Roll Industries, Inc. | | | 1,389 | | | | 55,213 | | |
| | | | 286,458 | | |
Gas Utilities (0.2%): | |
Chesapeake Utilities Corporation | | | 561 | | | | 37,559 | | |
Health Care Equipment & Supplies (2.6%): | |
Abaxis, Inc. | | | 564 | | | | 29,762 | | |
Anika Therapeutics, Inc. (a) | | | 694 | | | | 33,978 | | |
Atrion Corporation | | | 111 | | | | 56,299 | | |
CryoLife, Inc. (a) | | | 1,766 | | | | 33,819 | | |
Cynosure, Inc. (a) | | | 539 | | | | 24,579 | | |
Globus Medical, Inc. (a) | | | 1,273 | | | | 31,583 | | |
ICU Medical, Inc. (a) | | | 295 | | | | 43,468 | | |
Inogen, Inc. (a) | | | 430 | | | | 28,883 | | |
Masimo Corporation (a) | | | 637 | | | | 42,934 | | |
Meridian Bioscience, Inc. | | | 2,147 | | | | 38,002 | | |
Merit Medical Systems, Inc. (a) | | | 1,437 | | | | 38,081 | | |
Natus Medical, Inc. (a) | | | 556 | | | | 19,349 | | |
See notes to financial statements.
68
Victory Portfolios II
VictoryShares US Small Cap Volatility Wtd ETF | | Schedule of Investments — continued
December 31, 2016 | |
(Unaudited)
Security Description | | Shares | | Value | |
Health Care Equipment & Supplies (2.6%) cont'd | |
Neogen Corporation (a) | | | 563 | | | $ | 37,158 | | |
Penumbra, Inc. (a) | | | 378 | | | | 24,116 | | |
| | | | 482,011 | | |
Health Care Providers & Services (3.2%): | |
Aceto Corporation | | | 1,125 | | | | 24,716 | | |
Adeptus Health, Inc. (a) | | | 465 | | | | 3,553 | | |
Air Methods Corporation (a) | | | 808 | | | | 25,735 | | |
Amedisys, Inc. (a) | | | 550 | | | | 23,446 | | |
AMN Healthcare Services, Inc. (a) | | | 684 | | | | 26,300 | | |
BioTelemetry, Inc. (a) | | | 1,218 | | | | 27,222 | | |
Chemed Corporation | | | 333 | | | | 53,417 | | |
CorVel Corporation (a) | | | 852 | | | | 31,183 | | |
Diplomat Pharmacy, Inc. (a) | | | 613 | | | | 7,724 | | |
HealthEquity, Inc. (a) | | | 704 | | | | 28,526 | | |
LHC Group, Inc. (a) | | | 934 | | | | 42,684 | | |
Lifepoint Health, Inc. (a) | | | 559 | | | | 31,751 | | |
National HealthCare Corporation | | | 891 | | | | 67,529 | | |
Owens & Minor, Inc. | | | 1,291 | | | | 45,559 | | |
PharMerica Corporation (a) | | | 701 | | | | 17,630 | | |
Select Medical Holdings Corporation (a) | | | 1,785 | | | | 23,651 | | |
Surgical Care Affiliates, Inc. (a) | | | 758 | | | | 35,073 | | |
The Ensign Group, Inc. | | | 1,506 | | | | 33,448 | | |
US Physical Therapy, Inc. | | | 579 | | | | 40,646 | | |
| | | | 589,793 | | |
Health Care Technology (0.3%): | |
HealthStream, Inc. (a) | | | 1,042 | | | | 26,102 | | |
HMS Holdings Corporation (a) | | | 1,126 | | | | 20,448 | | |
Inovalon Holdings, Inc. — Class A (a) | | | 1,132 | | | | 11,660 | | |
| | | | 58,210 | | |
Hotels, Restaurants & Leisure (5.3%): | |
BJ's Restaurants, Inc. (a) | | | 915 | | | | 35,959 | | |
Bob Evans Farms, Inc. | | | 1,027 | | | | 54,647 | | |
Bojangles', Inc. (a) | | | 1,523 | | | | 28,404 | | |
Brinker International, Inc. | | | 681 | | | | 33,730 | | |
Buffalo Wild Wings, Inc. (a) | | | 183 | | | | 28,255 | | |
Choice Hotels International, Inc. | | | 859 | | | | 48,147 | | |
Churchill Downs, Inc. | | | 278 | | | | 41,825 | | |
Chuy's Holdings, Inc. (a) | | | 991 | | | | 32,158 | | |
Dave & Buster's Entertainment, Inc. (a) | | | 682 | | | | 38,397 | | |
DineEquity, Inc. | | | 564 | | | | 43,428 | | |
El Pollo Loco Holdings, Inc. (a) | | | 1,657 | | | | 20,381 | | |
Eldorado Resorts, Inc. (a) | | | 2,531 | | | | 42,900 | | |
Fiesta Restaurant Group, Inc. (a) | | | 916 | | | | 27,343 | | |
ILG, Inc | | | 1,843 | | | | 33,487 | | |
Isle of Capri Casinos, Inc. (a) | | | 1,715 | | | | 42,343 | | |
Marriott Vacations Worldwide Corporation | | | 361 | | | | 30,631 | | |
Papa John's International, Inc. | | | 478 | | | | 40,907 | | |
See notes to financial statements.
69
Victory Portfolios II
VictoryShares US Small Cap Volatility Wtd ETF | | Schedule of Investments — continued
December 31, 2016 | |
(Unaudited)
Security Description | | Shares | | Value | |
Hotels, Restaurants & Leisure (5.3%) cont'd | |
Popeyes Louisiana Kitchen, Inc. (a) | | | 787 | | | $ | 47,598 | | |
Red Robin Gourmet Burgers, Inc. (a) | | | 522 | | | | 29,441 | | |
Ruth's Hospitality Group, Inc. | | | 2,537 | | | | 46,427 | | |
Shake Shack, Inc. (a) | | | 600 | | | | 21,474 | | |
Sonic Corporation | | | 1,142 | | | | 30,274 | | |
The Cheesecake Factory, Inc. | | | 934 | | | | 55,928 | | |
The Marcus Corporation | | | 1,659 | | | | 52,259 | | |
Wendy's Company | | | 3,565 | | | | 48,199 | | |
Wingstop, Inc. | | | 904 | | | | 26,749 | | |
| | | | 981,291 | | |
Household Durables (2.9%): | |
Cavco Industries, Inc. (a) | | | 325 | | | | 32,451 | | |
Ethan Allen Interiors, Inc. | | | 1,021 | | | | 37,624 | | |
Helen of Troy Ltd. (a) | | | 479 | | | | 40,452 | | |
Installed Building Products, Inc. (a) | | | 745 | | | | 30,768 | | |
iRobot Corporation (a) | | | 810 | | | | 47,345 | | |
KB Home | | | 1,702 | | | | 26,909 | | |
La-Z-Boy, Inc. | | | 1,032 | | | | 32,044 | | |
LGI Homes, Inc. (a) | | | 565 | | | | 16,232 | | |
M/I Homes, Inc. (a) | | | 1,449 | | | | 36,486 | | |
MDC Holdings, Inc. | | | 1,436 | | | | 36,843 | | |
Meritage Homes Corporation (a) | | | 710 | | | | 24,708 | | |
Taylor Morrison Home Corporation — Class A (a) | | | 1,594 | | | | 30,700 | | |
TopBuild Corporation (a) | | | 930 | | | | 33,108 | | |
TRI Pointe Group, Inc. (a) | | | 2,223 | | | | 25,520 | | |
Universal Electronics, Inc. (a) | | | 456 | | | | 29,435 | | |
WCI Communities, Inc. (a) | | | 1,472 | | | | 34,518 | | |
William Lyon Homes (a) | | | 944 | | | | 17,964 | | |
| | | | 533,107 | | |
Household Products (0.3%): | |
WD-40 Company | | | 435 | | | | 50,852 | | |
Independent Power and Renewable Electricity Producers (0.1%): | |
8Point3 Energy Partners LP | | | 2,032 | | | | 26,375 | | |
Independent Power and Renewable Electricity Producers (0.3%): | |
Ormat Technologies, Inc. | | | 1,006 | | | | 53,942 | | |
Insurance (4.2%): | |
AMERISAFE, Inc. | | | 760 | | | | 47,386 | | |
CNO Financial Group, Inc. | | | 1,931 | | | | 36,979 | | |
Employers Holdings, Inc. | | | 1,044 | | | | 41,342 | | |
FBL Financial Group, Inc. — Class A | | | 642 | | | | 50,172 | | |
Fidelity & Guaranty Life | | | 2,920 | | | | 69,204 | | |
Horace Mann Educators Corporation | | | 1,262 | | | | 54,014 | | |
Infinity Property & Casualty Corporation | | | 671 | | | | 58,981 | | |
Mercury General Corporation | | | 898 | | | | 54,069 | | |
National General Holdings Corporation | | | 1,710 | | | | 42,733 | | |
Navigators Group, Inc. | | | 508 | | | | 59,817 | | |
Primerica, Inc. | | | 562 | | | | 38,862 | | |
ProAssurance Corporation | | | 1,191 | | | | 66,934 | | |
See notes to financial statements.
70
Victory Portfolios II
VictoryShares US Small Cap Volatility Wtd ETF | | Schedule of Investments — continued
December 31, 2016 | |
(Unaudited)
Security Description | | Shares | | Value | |
Insurance (4.2%) cont'd | |
Safety Insurance Group, Inc. | | | 886 | | | $ | 65,298 | | |
Selective Insurance Group, Inc. | | | 1,180 | | | | 50,799 | | |
United Fire Group, Inc. | | | 960 | | | | 47,203 | | |
| | | | 783,793 | | |
Internet & Catalog Retail (0.3%): | |
HSN, Inc. | | | 812 | | | | 27,852 | | |
Nutrisystem, Inc. | | | 865 | | | | 29,972 | | |
| | | | 57,824 | | |
Internet Software & Services (0.7%): | |
Alarm.com Holdings, Inc. (a) | | | 862 | | | | 23,990 | | |
NIC, Inc. | | | 1,723 | | | | 41,180 | | |
Shutterstock, Inc. (a) | | | 387 | | | | 18,390 | | |
SPS Commerce, Inc. (a) | | | 370 | | | | 25,859 | | |
WebMD Health Corporation (a) | | | 595 | | | | 29,494 | | |
| | | | 138,913 | | |
IT Services (2.7%): | |
CACI International, Inc. — Class A (a) | | | 308 | | | | 38,284 | | |
Cass Information Systems, Inc. | | | 740 | | | | 54,442 | | |
Convergys Corporation | | | 1,402 | | | | 34,433 | | |
CSG Systems International, Inc. | | | 805 | | | | 38,962 | | |
ExlService Holdings, Inc. (a) | | | 769 | | | | 38,788 | | |
Forrester Research, Inc. | | | 1,025 | | | | 44,024 | | |
ManTech International Corporation — Class A | | | 939 | | | | 39,673 | | |
NeuStar, Inc. — Class A (a) | | | 1,115 | | | | 37,241 | | |
Perficient, Inc. (a) | | | 1,772 | | | | 30,992 | | |
Science Applications International Corporation | | | 586 | | | | 49,693 | | |
Sykes Enterprises, Inc. (a) | | | 1,484 | | | | 42,828 | | |
TeleTech Holdings, Inc. | | | 1,583 | | | | 48,282 | | |
| | | | 497,642 | | |
Leisure Products (0.5%): | |
Nautilus, Inc. (a) | | | 804 | | | | 14,874 | | |
Smith & Wesson Holdings Corporation (a) | | | 812 | | | | 17,117 | | |
Sturm Ruger & Company, Inc. | | | 440 | | | | 23,188 | | |
Vista Outdoor, Inc. (a) | | | 827 | | | | 30,516 | | |
| | | | 85,695 | | |
Life Sciences Tools & Services (0.5%): | |
Cambrex Corporation (a) | | | 553 | | | | 29,834 | | |
INC Research Holdings, Inc. — Class A (a) | | | 714 | | | | 37,557 | | |
Luminex Corporation (a) | | | 1,692 | | | | 34,229 | | |
| | | | 101,620 | | |
Machinery (5.2%): | |
Alamo Group, Inc. | | | 570 | | | | 43,377 | | |
Albany International Corporation | | | 851 | | | | 39,401 | | |
Altra Industrial Motion Corporation | | | 1,532 | | | | 56,531 | | |
American Railcar Industries, Inc. | | | 614 | | | | 27,808 | | |
Astec Industries, Inc. | | | 558 | | | | 37,643 | | |
See notes to financial statements.
71
Victory Portfolios II
VictoryShares US Small Cap Volatility Wtd ETF | | Schedule of Investments — continued
December 31, 2016 | |
(Unaudited)
Security Description | | Shares | | Value | |
Machinery (5.2%) cont'd | |
Barnes Group, Inc. | | | 894 | | | $ | 42,393 | | |
Douglas Dynamics, Inc | | | 1,021 | | | | 34,357 | | |
ESCO Technologies, Inc. | | | 1,223 | | | | 69,283 | | |
Federal Signal Corporation | | | 1,864 | | | | 29,097 | | |
Franklin Electric Company, Inc. | | | 870 | | | | 33,843 | | |
Global Brass & Copper Holdings, Inc. | | | 1,079 | | | | 37,010 | | |
Greenbrier Companies, Inc. | | | 547 | | | | 22,728 | | |
Hillenbrand, Inc. | | | 1,456 | | | | 55,837 | | |
Hyster-Yale Materials Handling, Inc. | | | 561 | | | | 35,775 | | |
John Bean Technologies Corporation | | | 404 | | | | 34,724 | | |
Kadant, Inc. | | | 773 | | | | 47,307 | | |
Lydall, Inc. (a) | | | 625 | | | | 38,656 | | |
Mueller Industries, Inc. | | | 1,260 | | | | 50,350 | | |
Mueller Water Products, Inc. | | | 3,126 | | | | 41,607 | | |
Proto Labs, Inc. (a) | | | 404 | | | | 20,745 | | |
RBC Bearings, Inc. (a) | | | 549 | | | | 50,953 | | |
Standex International Corporation | | | 502 | | | | 44,101 | | |
Sun Hydraulics Corporation | | | 1,100 | | | | 43,967 | | |
Wabash National Corporation (a) | | | 1,990 | | | | 31,482 | | |
| | | | 968,975 | | |
Marine (0.3%): | |
Kirby Corporation (a) | | | 550 | | | | 36,575 | | |
Matson, Inc. | | | 742 | | | | 26,259 | | |
| | | | 62,834 | | |
Media (1.1%): | |
AMC Entertainment Holdings, Inc. | | | 1,016 | | | | 34,188 | | |
Entravision Communications Corporation — Class A | | | 4,008 | | | | 28,056 | | |
Gannett Company, Inc. | | | 2,544 | | | | 24,702 | | |
Gray Television, Inc. (a) | | | 2,016 | | | | 21,874 | | |
New Media Investment Group, Inc. | | | 1,838 | | | | 29,390 | | |
Nexstar Broadcasting Group, Inc. — Class A | | | 467 | | | | 29,561 | | |
Sinclair Broadcast Group, Inc. — Class A | | | 1,121 | | | | 37,385 | | |
| | | | 205,156 | | |
Metals & Mining (0.8%): | |
Compass Minerals International, Inc. | | | 555 | | | | 43,484 | | |
Kaiser Aluminum Corporation | | | 463 | | | | 35,970 | | |
Materion Corporation | | | 853 | | | | 33,779 | | |
Worthington Industries, Inc. | | | 690 | | | | 32,734 | | |
| | | | 145,967 | | |
Multiline Retail (0.3%): | |
Dillard's, Inc. | | | 485 | | | | 30,404 | | |
Ollie's Bargain Outlet Holdings, Inc. (a) | | | 1,017 | | | | 28,934 | | |
| | | | 59,338 | | |
Multi-Utilities (0.9%): | |
Avista Corporation | | | 1,415 | | | | 56,586 | | |
NorthWestern Corporation | | | 1,049 | | | | 59,656 | | |
Unitil Corporation | | | 1,185 | | | | 53,728 | | |
| | | | 169,970 | | |
See notes to financial statements.
72
Victory Portfolios II
VictoryShares US Small Cap Volatility Wtd ETF | | Schedule of Investments — continued
December 31, 2016 | |
(Unaudited)
Security Description | | Shares | | Value | |
Oil, Gas & Consumable Fuels (0.4%): | |
REX American Resources Corporation (a) | | | 394 | | | $ | 38,908 | | |
Western Refining, Inc. | | | 731 | | | | 27,668 | | |
| | | | 66,576 | | |
Paper & Forest Products (1.1%): | |
Boise Cascade Company (a) | | | 651 | | | | 14,648 | | |
Clearwater Paper Corporation (a) | | | 483 | | | | 31,661 | | |
Domtar Corporation | | | 847 | | | | 33,058 | | |
KapStone Paper & Packaging Corporation — Class A | | | 763 | | | | 16,824 | | |
Neenah Paper, Inc. | | | 561 | | | | 47,797 | | |
PH Glatfelter Company | | | 1,061 | | | | 25,347 | | |
Schweitzer-Mauduit International, Inc. | | | 816 | | | | 37,153 | | |
| | | | 206,488 | | |
Personal Products (0.4%): | |
Inter Parfums, Inc. | | | 846 | | | | 27,707 | | |
Revlon, Inc. (a) | | | 756 | | | | 22,037 | | |
USANA Health Sciences, Inc. (a) | | | 320 | | | | 19,584 | | |
| | | | 69,328 | | |
Pharmaceuticals (0.5%): | |
ANI Pharmaceuticals, Inc. (a) | | | 341 | | | | 20,672 | | |
Phibro Animal Health Corporation — Class A | | | 864 | | | | 25,315 | | |
SciClone Pharmaceuticals, Inc. (a) | | | 2,133 | | | | 23,036 | | |
Supernus Pharmaceuticals, Inc. (a) | | | 926 | | | | 23,382 | | |
| | | | 92,405 | | |
Professional Services (3.0%): | |
CEB, Inc. | | | 610 | | | | 36,966 | | |
Exponent, Inc. | | | 832 | | | | 50,170 | | |
FTI Consulting, Inc. (a) | | | 776 | | | | 34,982 | | |
Huron Consulting Group, Inc. (a) | | | 553 | | | | 28,009 | | |
ICF International, Inc. (a) | | | 967 | | | | 53,378 | | |
Insperity, Inc. | | | 441 | | | | 31,289 | | |
Kelly Services, Inc. — Class A | | | 1,814 | | | | 41,577 | | |
Kforce, Inc. | | | 1,251 | | | | 28,898 | | |
Mistras Group, Inc. (a) | | | 1,007 | | | | 25,860 | | |
Navigant Consulting, Inc. (a) | | | 1,866 | | | | 48,852 | | |
On Assignment, Inc. (a) | | | 738 | | | | 32,590 | | |
Resources Connection, Inc. | | | 2,164 | | | | 41,657 | | |
| RPX Corporation (a) | | | 2,415 | | | | 26,082 | | |
TriNet Group, Inc. (a) | | | 1,314 | | | | 33,665 | | |
WageWorks, Inc. (a) | | | 570 | | | | 41,325 | | |
| | | | 555,300 | | |
Real Estate Management & Development (0.3%): | |
HFF, Inc. — Class A | | | 1,070 | | | | 32,368 | | |
Marcus & Millichap, Inc. (a) | | | 1,099 | | | | 29,365 | | |
| | | | 61,733 | | |
See notes to financial statements.
73
Victory Portfolios II
VictoryShares US Small Cap Volatility Wtd ETF | | Schedule of Investments — continued
December 31, 2016 | |
(Unaudited)
Security Description | | Shares | | Value | |
Road & Rail (1.4%): | |
Heartland Express, Inc. | | | 1,886 | | | $ | 38,399 | | |
Knight Transportation, Inc. | | | 1,080 | | | | 35,694 | | |
Landstar System, Inc. | | | 690 | | | | 58,857 | | |
Marten Transport Ltd. | | | 1,685 | | | | 39,261 | | |
Saia, Inc. (a) | | | 769 | | | | 33,951 | | |
Swift Transportation Company (a) | | | 1,048 | | | | 25,529 | | |
Werner Enterprises, Inc. | | | 1,289 | | | | 34,739 | | |
| | | | 266,430 | | |
Semiconductors & Semiconductor Equipment (3.1%): | |
Advanced Energy Industries, Inc. (a) | | | 803 | | | | 43,964 | | |
Ambarella, Inc. (a) | | | 304 | | | | 16,455 | | |
Cabot Microelectronics Corporation | | | 801 | | | | 50,599 | | |
CEVA, Inc. (a) | | | 814 | | | | 27,310 | | |
Entegris, Inc. (a) | | | 2,033 | | | | 36,391 | | |
Integrated Device Technology, Inc. (a) | | | 948 | | | | 22,335 | | |
Intersil Corporation | | | 1,432 | | | | 31,934 | | |
MKS Instrument, Inc. | | | 829 | | | | 49,243 | | |
NeoPhotonics Corporation (a) | | | 1,043 | | | | 11,275 | | |
PDF Solutions, Inc. (a) | | | 1,630 | | | | 36,756 | | |
Photronics, Inc. (a) | | | 3,322 | | | | 37,539 | | |
Power Integrations, Inc. | | | 610 | | | | 41,388 | | |
Rambus, Inc. (a) | | | 2,769 | | | | 38,129 | | |
Rudolph Technologies, Inc. (a) | | | 1,856 | | | | 43,338 | | |
Silicon Laboratories, Inc. (a) | | | 622 | | | | 40,430 | | |
Tessera Holding Corporation | | | 1,125 | | | | 49,725 | | |
| | | | 576,811 | | |
Software (1.0%): | |
Ebix, Inc. | | | 447 | | | | 25,501 | | |
Gigamon, Inc. (a) | | | 462 | | | | 21,044 | | |
MicroStrategy, Inc. (a) | | | 162 | | | | 31,979 | | |
Monotype Imaging Holdings, Inc. | | | 1,288 | | | | 25,567 | | |
Pegasystems, Inc. | | | 1,282 | | | | 46,152 | | |
Qualys, Inc. (a) | | | 562 | | | | 17,787 | | |
VASCO Data Security International, Inc. (a) | | | 1,546 | | | | 21,103 | | |
| | | | 189,133 | | |
Specialty Retail (3.3%): | |
Aaron's, Inc. | | | 1,092 | | | | 34,933 | | |
Asbury Automotive Group, Inc. (a) | | | 436 | | | | 26,901 | | |
Caleres, Inc. | | | 1,174 | | | | 38,531 | | |
DSW, Inc. — Class A | | | 1,150 | | | | 26,047 | | |
Express, Inc. (a) | | | 1,832 | | | | 19,712 | | |
Five Below, Inc. (a) | | | 768 | | | | 30,689 | | |
Francesca's Holdings Corporation (a) | | | 1,259 | | | | 22,700 | | |
GameStop Corporation | | | 1,064 | | | | 26,877 | | |
Genesco, Inc. (a) | | | 645 | | | | 40,055 | | |
GNC Holdings, Inc. | | | 757 | | | | 8,357 | | |
Hibbett Sports, Inc. (a) | | | 823 | | | | 30,698 | | |
See notes to financial statements.
74
Victory Portfolios II
VictoryShares US Small Cap Volatility Wtd ETF | | Schedule of Investments — continued
December 31, 2016 | |
(Unaudited)
Security Description | | Shares | | Value | |
Specialty Retail (3.3%) cont'd | |
Lithia Motors, Inc. — Class A | | | 296 | | | $ | 28,662 | | |
MarineMax, Inc. (a) | | | 1,134 | | | | 21,943 | | |
Monro Muffler Brake, Inc. | | | 656 | | | | 37,523 | | |
Murphy USA, Inc. (a) | | | 507 | | | | 31,165 | | |
Office Depot, Inc. | | | 3,723 | | | | 16,828 | | |
Shoe Carnival, Inc. | | | 1,179 | | | | 31,809 | | |
Sonic Automotive, Inc. — Class A | | | 1,399 | | | | 32,037 | | |
The Buckle, Inc. | | | 1,159 | | | | 26,425 | | |
The Cato Corporation — Class A | | | 997 | | | | 29,990 | | |
Tile Shop Holdings, Inc. (a) | | | 1,610 | | | | 31,476 | | |
Vitamin Shoppe, Inc. (a) | | | 927 | | | | 22,016 | | |
| | | | 615,374 | | |
Technology Hardware, Storage & Peripherals (0.3%): | |
Electronics For Imaging, Inc. (a) | | | 722 | | | | 31,667 | | |
Super Micro Computer, Inc. (a) | | | 744 | | | | 20,869 | | |
| | | | 52,536 | | |
Textiles, Apparel & Luxury Goods (0.8%): | |
Fossil Group, Inc. (a) | | | 560 | | | | 14,482 | | |
Kate Spade & Company (a) | | | 1,115 | | | | 20,817 | | |
Movado Group, Inc. | | | 1,220 | | | | 35,075 | | |
Steven Madden Ltd. (a) | | | 1,064 | | | | 38,038 | | |
Vera Bradley, Inc. (a) | | | 1,651 | | | | 19,350 | | |
Wolverine World Wide, Inc. | | | 1,290 | | | | 28,315 | | |
| | | | 156,077 | | |
Thrifts & Mortgage Finance (3.1%): | |
Beneficial Bancorp, Inc. | | | 3,942 | | | | 72,533 | | |
BofI Holding, Inc. (a) | | | 895 | | | | 25,552 | | |
Capitol Federal Financial, Inc. | | | 5,133 | | | | 84,489 | | |
Essent Group Ltd. (a) | | | 1,229 | | | | 39,783 | | |
Flagstar Bancorp, Inc. (a) | | | 1,367 | | | | 36,827 | | |
Kearny Financial Corporation | | | 4,376 | | | | 68,047 | | |
LendingTree, Inc (a) | | | 147 | | | | 14,898 | | |
MGIC Investment Corporation (a) | | | 2,926 | | | | 29,816 | | |
Provident Financial Services, Inc. | | | 2,515 | | | | 71,175 | | |
Radian Group, Inc. | | | 2,046 | | | | 36,787 | | |
Washington Federal, Inc. | | | 1,688 | | | | 57,983 | | |
WSFS Financial Corporation | | | 1,046 | | | | 48,482 | | |
| | | | 586,372 | | |
Tobacco (0.3%): | |
Vector Group Ltd. | | | 2,830 | | | | 64,354 | | |
Trading Companies & Distributors (1.4%): | |
Air Lease Corporation | | | 904 | | | | 31,034 | | |
GATX Corporation | | | 656 | | | | 40,396 | | |
H&E Equipment Services, Inc. | | | 1,097 | | | | 25,505 | | |
Kaman Corporation | | | 1,234 | | | | 60,380 | | |
Rush Enterprises, Inc. — Class A (a) | | | 1,090 | | | | 34,771 | | |
See notes to financial statements.
75
Victory Portfolios II
VictoryShares US Small Cap Volatility Wtd ETF | | Schedule of Investments — continued
December 31, 2016 | |
(Unaudited)
Security Description | | Shares | | Value | |
Trading Companies & Distributors (1.4%) cont'd | |
Veritiv Corporation (a) | | | 458 | | | $ | 24,618 | | |
WESCO International, Inc. (a) | | | 522 | | | | 34,739 | | |
| | | | 251,443 | | |
Water Utilities (1.0%): | |
American States Water Company | | | 944 | | | | 43,009 | | |
Connecticut Water Service, Inc. | | | 974 | | | | 54,398 | | |
Middlesex Water Company | | | 1,072 | | | | 46,032 | | |
SJW Corporation | | | 875 | | | | 48,982 | | |
| | | | 192,421 | | |
Total Common Stocks (Cost $16,468,434) | | | 18,691,811 | | |
Short-Term Investments (0.0%) (b) | |
Money Market Funds (0.0%) (b): | |
Short-Term Investments Trust Government & Agency Portfolio —
Institutional Class, 0.43% (c) | | | 8,523 | | | | 8,523 | | |
Total Short-Term Investments (Cost $8,523) | | | 8,523 | | |
Total Investments — 100.0% (Cost $16,476,957) | | | 18,700,334 | | |
Other assets in excess of liabilities — 0.0% (b) | | | 2,320 | | |
NET ASSETS — 100.0% | | $ | 18,702,654 | | |
(a) Non-income producing security.
(b) Less than 0.05%.
(c) Annualized seven-day yield as of December 31, 2016.
The Global Industry Classification Standard (GICS®) was developed by and/or is the exclusive property of MSCI, Inc. and Standard & Poor's Financial Services LLC ("S&P"). GICS® is a service mark of MSCI, Inc. and S&P and has been licensed for use by the Fund's Administrator, U.S. Bancorp Fund Services, LLC.
See notes to financial statements.
76
Victory Portfolios II
VictoryShares International Volatility Wtd ETF | | Schedule of Investments
December 31, 2016 | |
(Unaudited)
Security Description | | Shares | | Value | |
Common Stocks (99.7%) | |
Australia (4.6%): | |
AMP Ltd. | | | 6,788 | | | $ | 24,689 | | |
Aristocrat Leisure Ltd. | | | 2,032 | | | | 22,729 | | |
ASX Ltd. | | | 967 | | | | 34,710 | | |
Australia & New Zealand Banking Group Ltd. | | | 1,233 | | | | 27,068 | | |
Brambles Ltd. | | | 3,356 | | | | 30,031 | | |
Caltex Australia Ltd. | | | 1,065 | | | | 23,410 | | |
CIMIC Group Ltd. | | | 666 | | | | 16,793 | | |
Commonwealth Bank of Australia | | | 553 | | | | 32,888 | | |
Crown Resorts Ltd. | | | 2,312 | | | | 19,321 | | |
CSL Ltd. | | | 413 | | | | 29,926 | | |
Fortescue Metals Group Ltd. | | | 2,592 | | | | 11,017 | | |
Insurance Australia Group Ltd. | | | 7,048 | | | | 30,466 | | |
Macquarie Group Ltd. | | | 364 | | | | 22,885 | | |
Newcrest Mining Ltd. | | | 820 | | | | 11,983 | | |
QBE Insurance Group Ltd. | | | 2,977 | | | | 26,683 | | |
Ramsay Health Care Ltd. | | | 490 | | | | 24,151 | | |
Sonic Healthcare Ltd. | | | 1,639 | | | | 25,312 | | |
Suncorp Group Ltd. | | | 3,216 | | | | 31,378 | | |
Telstra Corporation Ltd. | | | 9,703 | | | | 35,711 | | |
TPG Telecom Ltd. | | | 3,363 | | | | 16,552 | | |
Westpac Banking Corporation | | | 1,163 | | | | 27,360 | | |
| | | | 525,063 | | |
Austria (0.1%): | |
Erste Group Bank AG | | | 561 | | | | 16,432 | | |
Belgium (1.3%): | |
Anheuser-Busch InBev SA/NV | | | 224 | | | | 23,709 | | |
Colruyt SA | | | 582 | | | | 28,797 | | |
Proximus SADP | | | 988 | | | | 28,455 | | |
Solvay SA — Class A | | | 189 | | | | 22,153 | | |
UCB SA | | | 266 | | | | 17,055 | | |
Umicore SA | | | 393 | | | | 22,402 | | |
| | | | 142,571 | | |
Canada (12.3%): | |
Alimentation Couche-Tard, Inc. — Class B (a) | | | 700 | | | | 31,740 | | |
Bank of Montreal (a) | | | 700 | | | | 50,347 | | |
Bank of Nova Scotia (a) | | | 700 | | | | 38,977 | | |
BCE, Inc. | | | 1,400 | | | | 60,509 | | |
Brookfield Asset Management, Inc. — Class A (a) | | | 700 | | | | 23,096 | | |
Canadian Imperial Bank of Commerce (a) | | | 700 | | | | 57,120 | | |
Canadian National Railway Company (a) | | | 700 | | | | 47,110 | | |
Canadian Utilities Ltd. — Class A (a) | | | 1,400 | | | | 37,736 | | |
CGI Group, Inc. — Class A (a) | | | 700 | | | | 33,596 | | |
Dollarama, Inc. (a) | | | 700 | | | | 51,291 | | |
Emera, Inc. (a) | | | 1,400 | | | | 47,329 | | |
Fortis, Inc. | | | 700 | | | | 21,615 | | |
George Weston Ltd. (a) | | | 700 | | | | 59,221 | | |
See notes to financial statements.
77
Victory Portfolios II
VictoryShares International Volatility Wtd ETF | | Schedule of Investments — continued
December 31, 2016 | |
(Unaudited)
Security Description | | Shares | | Value | |
Canada (12.3%) cont'd | |
Gildan Activewear, Inc. (a) | | | 700 | | | $ | 17,773 | | |
Great-West Lifeco, Inc. | | | 1,400 | | | | 36,672 | | |
Hydro One Ltd. (Acquired 09/16/16, Cost $54,608) (a) (b) | | | 2,800 | | | | 49,174 | | |
IGM Financial, Inc. (a) | | | 1,400 | | | | 39,832 | | |
Intact Financial Corporation (a) | | | 700 | | | | 50,102 | | |
Inter Pipeline Ltd. (a) | | | 1,400 | | | | 30,906 | | |
Loblaw Companies Ltd. (a) | | | 700 | | | | 36,933 | | |
Lululemon Athletica, Inc. (a) | | | 357 | | | | 23,201 | | |
Magna International, Inc. (a) | | | 700 | | | | 30,395 | | |
Manulife Financial Corporation (a) | | | 1,400 | | | | 24,931 | | |
Metro, Inc. (a) | | | 1,400 | | | | 41,875 | | |
National Bank of Canada (a) | | | 700 | | | | 28,430 | | |
Open Text Corporation (a) | | | 700 | | | | 43,231 | | |
Pembina Pipeline Corporation (a) | | | 700 | | | | 21,876 | | |
Potash Corporation of Saskatchewan, Inc. (a) | | | 1,400 | | | | 25,328 | | |
Power Corporation of Canada | | | 1,400 | | | | 31,334 | | |
Power Financial Corporation | | | 1,400 | | | | 34,994 | | |
Restaurant Brands International, Inc. (a) | | | 700 | | | | 33,341 | | |
Rogers Communications, Inc. — Class B | | | 700 | | | | 27,001 | | |
Royal Bank of Canada (a) | | | 700 | | | | 47,376 | | |
Saputo, Inc. (a) | | | 700 | | | | 24,770 | | |
Shaw Communications, Inc. — Class B (a) | | | 2,100 | | | | 42,136 | | |
Sun Life Financial, Inc. (a) | | | 700 | | | | 26,876 | | |
TELUS Corporation | | | 1,400 | | | | 44,576 | | |
Toronto-Dominion Bank (a) | | | 700 | | | | 34,524 | | |
| | | | 1,407,274 | | |
Denmark (1.4%): | |
Chr. Hansen Holding A/S | | | 435 | | | | 24,089 | | |
Danske Bank A/S | | | 764 | | | | 23,172 | | |
DSV A/S | | | 442 | | | | 19,664 | | |
ISS A/S | | | 785 | | | | 26,498 | | |
Novo Nordisk A/S — Class B | | | 449 | | | | 16,193 | | |
Novozymes A/S — Class B | | | 484 | | | | 16,687 | | |
Pandora A/S | | | 147 | | | | 19,232 | | |
Vestas Wind System A/S | | | 217 | | | | 14,103 | | |
| | | | 159,638 | | |
Finland (1.2%): | |
Kone OYJ — Class B | | | 477 | | | | 21,375 | | |
Neste Oyj | | | 533 | | | | 20,479 | | |
Sampo Oyj — Class A | | | 554 | | | | 24,837 | | |
Stora Enso Oyj — Class R | | | 1,977 | | | | 21,248 | | |
UPM-Kymmene Oyj | | | 883 | | | | 21,695 | | |
Wartsila Oyj Abp | | | 533 | | | | 23,946 | | |
| | | | 133,580 | | |
France (9.9%): | |
Accor SA | | | 442 | | | | 16,485 | | |
Aeroports de Paris | | | 322 | | | | 34,506 | | |
Air Liquide SA | | | 259 | | | | 28,804 | | |
See notes to financial statements.
78
Victory Portfolios II
VictoryShares International Volatility Wtd ETF | | Schedule of Investments — continued
December 31, 2016 | |
(Unaudited)
Security Description | | Shares | | Value | |
France (9.9%) cont'd | |
Airbus Group SE | | | 365 | | | $ | 24,144 | | |
Arkema SA | | | 224 | | | | 21,915 | | |
Atos SE | | | 224 | | | | 23,638 | | |
AXA SA | | | 743 | | | | 18,759 | | |
BNP Paribas SA | | | 294 | | | | 18,739 | | |
Bollore SA | | | 6,758 | | | | 23,831 | | |
Bureau Veritas SA | | | 1,479 | | | | 28,662 | | |
Capgemini SA | | | 210 | | | | 17,718 | | |
Carrefour SA | | | 841 | | | | 20,264 | | |
Christian Dior SE | | | 147 | | | | 30,832 | | |
Cie de Saint-Gobain | | | 484 | | | | 22,547 | | |
Cie Generale des Etablissements Michelin | | | 245 | | | | 27,260 | | |
CNP Assurances | | | 1,150 | | | | 21,306 | | |
Credit Agricole SA | | | 1,549 | | | | 19,208 | | |
Danone SA | | | 414 | | | | 26,235 | | |
Dassault Aviation SA | | | 21 | | | | 23,467 | | |
Dassault Systemes SE | | | 322 | | | | 24,537 | | |
Eiffage SA | | | 343 | | | | 23,920 | | |
Essilor International SA | | | 224 | | | | 25,313 | | |
Hermes International | | | 70 | | | | 28,737 | | |
Iliad SA | | | 105 | | | | 20,188 | | |
Ingenico Group SA | | | 196 | | | | 15,653 | | |
JCDecaux SA | | | 575 | | | | 16,905 | | |
Kering | | | 112 | | | | 25,147 | | |
Legrand SA | | | 407 | | | | 23,114 | | |
L'Oreal SA | | | 161 | | | | 29,387 | | |
LVMH Moet Hennessy Louis Vuitton SE | | | 140 | | | | 26,733 | | |
Natixis SA | | | 3,056 | | | | 17,243 | | |
Orange SA | | | 1,563 | | | | 23,750 | | |
Pernod Ricard SA | | | 245 | | | | 26,551 | | |
Peugeot SA (a) | | | 904 | | | | 14,745 | | |
Publicis Groupe SA | | | 351 | | | | 24,220 | | |
Renault SA | | | 182 | | | | 16,191 | | |
Sanofi | | | 358 | | | | 28,980 | | |
Sartorius Stedim Biotech | | | 294 | | | | 18,560 | | |
Schneider Electric SE | | | 287 | | | | 19,973 | | |
SEB SA | | | 161 | | | | 21,820 | | |
Societe BIC SA | | | 182 | | | | 24,743 | | |
Societe Generale SA | | | 351 | | | | 17,271 | | |
Sodexo SA | | | 252 | | | | 28,967 | | |
Suez | | | 1,633 | | | | 24,092 | | |
Thales SA | | | 322 | | | | 31,228 | | |
Valeo SA | | | 322 | | | | 18,510 | | |
Veolia Environnement SA | | | 1,269 | | | | 21,607 | | |
Vinci SA | | | 400 | | | | 27,243 | | |
Zodiac Aerospace | | | 526 | | | | 12,079 | | |
| | | | 1,125,727 | | |
Germany (6.2%): | |
Allianz SE | | | 147 | | | | 24,294 | | |
BASF SE | | | 315 | | | | 29,282 | | |
See notes to financial statements.
79
Victory Portfolios II
VictoryShares International Volatility Wtd ETF | | Schedule of Investments — continued
December 31, 2016 | |
(Unaudited)
Security Description | | Shares | | Value | |
Germany (6.2%) cont'd | |
Bayer AG | | | 224 | | | $ | 23,374 | | |
Bayerische Motoren Werk AG | | | 224 | | | | 20,927 | | |
Beiersdorf AG | | | 358 | | | | 30,374 | | |
Brenntag AG | | | 428 | | | | 23,788 | | |
Commerzbank AG | | | 2,047 | | | | 15,614 | | |
Continental AG | | | 98 | | | | 18,950 | | |
Daimler AG | | | 301 | | | | 22,408 | | |
Deutsche Boerse AG | | | 287 | | | | 23,087 | | |
Deutsche Post AG | | | 799 | | | | 26,271 | | |
Deutsche Telekom AG | | | 1,731 | | | | 29,801 | | |
Evonik Industries AG | | | 680 | | | | 20,315 | | |
Fielmann AG | | | 435 | | | | 28,733 | | |
Fresenius Medical Care AG & Company KGaA | | | 315 | | | | 26,676 | | |
Fresenius SE & Company KGaA | | | 351 | | | | 27,438 | | |
GEA Group AG | | | 414 | | | | 16,661 | | |
Hannover Rueck SE | | | 238 | | | | 25,755 | | |
HOCHTIEF AG | | | 154 | | | | 21,569 | | |
Infineon Technologies AG | | | 1,248 | | | | 21,689 | | |
Linde AG | | | 140 | | | | 23,005 | | |
Merck KGaA | | | 252 | | | | 26,301 | | |
Muenchener Rueckversicherungs-Gesellschaft AG — Class R | | | 147 | | | | 27,799 | | |
ProSiebenSat.1 Media SE | | | 589 | | | | 22,699 | | |
SAP SE | | | 336 | | | | 29,289 | | |
Siemens AG | | | 224 | | | | 27,541 | | |
Symrise AG | | | 358 | | | | 21,793 | | |
Talanx AG | | | 862 | | | | 28,828 | | |
Vonovia SE | | | 722 | | | | 23,488 | | |
| | | | 707,749 | | |
Hong Kong (9.3%): | |
AIA Group Ltd. | | | 2,800 | | | | 15,797 | | |
Bank Of East Asia Ltd. | | | 4,200 | | | | 16,086 | | |
Beijing Enterprise Holdings Ltd. | | | 3,500 | | | | 16,542 | | |
BOC Hong Kong Holdings Ltd. | | | 7,000 | | | | 25,050 | | |
Cheung Kong Infrastructure Holdings Ltd. | | | 7,000 | | | | 55,697 | | |
Cheung Kong Property Holdings Ltd. | | | 3,500 | | | | 21,462 | | |
China Gas Holdings Ltd. | | | 14,000 | | | | 18,993 | | |
China Mobile Ltd. | | | 3,500 | | | | 37,101 | | |
China Resources Beer Holdings Company Ltd. (a) | | | 14,000 | | | | 27,803 | | |
China Resources Power Holdings Company Ltd. | | | 14,000 | | | | 22,243 | | |
China Taiping Insurance Holdings Company Ltd. (a) | | | 7,000 | | | | 14,443 | | |
China Unicom Hong Kong Ltd. | | | 14,000 | | | | 16,303 | | |
Chow Tai Fook Jewellery Group Ltd. | | | 25,200 | | | | 19,271 | | |
CITIC Ltd. | | | 14,000 | | | | 20,040 | | |
CK Hutchison Holdings Ltd. | | | 3,500 | | | | 39,674 | | |
CLP Holdings Ltd. | | | 3,500 | | | | 32,159 | | |
Dairy Farm International Holdings Ltd. | | | 4,900 | | | | 35,231 | | |
Fullshare Holdings Ltd. | | | 35,000 | | | | 16,339 | | |
Galaxy Entertainment Group Ltd. | | | 7,000 | | | | 30,511 | | |
Guangdong Investment Ltd. | | | 14,000 | | | | 18,487 | | |
See notes to financial statements.
80
Victory Portfolios II
VictoryShares International Volatility Wtd ETF | | Schedule of Investments — continued
December 31, 2016 | |
(Unaudited)
Security Description | | Shares | | Value | |
Hong Kong (9.3%) cont'd | |
Hang Lung Properties Ltd. | | | 14,000 | | | $ | 29,681 | | |
Hang Seng Bank Ltd. | | | 2,100 | | | | 39,078 | | |
Henderson Land Development Company Ltd. | | | 6,800 | | | | 36,173 | | |
Hong Kong & China Gas Company Ltd. | | | 14,400 | | | | 25,515 | | |
Hong Kong Exchanges and Clearing Ltd. | | | 1,400 | | | | 33,075 | | |
Hongkong Land Holdings Ltd. | | | 4,200 | | | | 26,586 | | |
Jardine Matheson Holdings Ltd. | | | 700 | | | | 38,675 | | |
Jardine Strategic Holdings Ltd. | | | 700 | | | | 23,240 | | |
MTR Corporation Ltd. | | | 7,000 | | | | 34,032 | | |
New World Development Company Ltd. | | | 21,000 | | | | 22,206 | | |
NWS Holdings Ltd. | | | 14,000 | | | | 22,820 | | |
Power Assets Holdings Ltd. | | | 3,500 | | | | 30,850 | | |
Sino Land Company Ltd. | | | 14,000 | | | | 20,979 | | |
Swire Pacific Ltd. | | | 3,500 | | | | 33,422 | | |
Swire Properties Ltd. | | | 11,200 | | | | 30,908 | | |
Techtronic Industries Company Ltd. | | | 7,000 | | | | 25,095 | | |
WH Group Ltd. (Acquired 09/18/15 through 12/21/16, Cost $20,891) (b) | | | 31,500 | | | | 25,470 | | |
Wheelock & Company, Ltd. | | | 7,000 | | | | 39,403 | | |
Yue Yuen Industrial Holdings Ltd. | | | 7,000 | | | | 25,411 | | |
| | | | 1,061,851 | | |
Ireland (1.7%): | |
Accenture PLC — Class A | | | 273 | | | | 31,976 | | |
Bank of Ireland (a) | | | 48,776 | | | | 12,066 | | |
CRH PLC | | | 588 | | | | 20,508 | | |
DCC PLC | | | 301 | | | | 22,406 | | |
Experian PLC | | | 1,569 | | | | 30,435 | | |
Jazz Pharmaceuticals PLC (a) | | | 154 | | | | 16,791 | | |
Kerry Group PLC — Class A | | | 365 | | | | 26,000 | | |
Medtronic PLC | | | 448 | | | | 31,911 | | |
| | | | 192,093 | | |
Israel (0.9%): | |
Bank Hapoalim BM | | | 6,365 | | | | 37,856 | | |
Check Point Software Technologies Ltd. (a) | | | 413 | | | | 34,882 | | |
Mobileye NV (a) | | | 259 | | | | 9,873 | | |
Teva Pharmaceutical Industries Ltd. | | | 469 | | | | 16,838 | | |
| | | | 99,449 | | |
Italy (2.1%): | |
Assicurazioni Generali SpA | | | 1,157 | | | | 17,197 | | |
Atlantia SpA | | | 946 | | | | 22,167 | | |
Davide Campari-Milano SpA | | | 2,159 | | | | 21,113 | | |
Enel SpA | | | 5,335 | | | | 23,520 | | |
EXOR NV | | | 343 | | | | 14,796 | | |
Intesa Sanpaolo SpA | | | 4,683 | | | | 11,959 | | |
Leonardo-Finmeccanica SpA (a) | | | 1,353 | | | | 18,999 | | |
Luxottica Group SpA | | | 463 | | | | 24,905 | | |
Mediobanca SpA | | | 1,493 | | | | 12,188 | | |
Prada SpA | | | 4,900 | | | | 16,619 | | |
Snam SpA | | | 6,155 | | | | 25,359 | | |
See notes to financial statements.
81
Victory Portfolios II
VictoryShares International Volatility Wtd ETF | | Schedule of Investments — continued
December 31, 2016 | |
(Unaudited)
Security Description | | Shares | | Value | |
Italy (2.1%) cont'd | |
Terna Rete Elettrica Nazionale SpA | | | 5,608 | | | $ | 25,691 | | |
UniCredit SpA | | | 3,526 | | | | 10,148 | | |
| | | | 244,661 | | |
Japan (17.0%): | |
ANA Holdings, Inc. | | | 7,000 | | | | 18,854 | | |
Asahi Glass Company Ltd. | | | 7,000 | | | | 47,675 | | |
Asahi Group Holdings Ltd. | | | 700 | | | | 22,101 | | |
Asahi Kasei Corporation | | | 7,000 | | | | 61,061 | | |
Astellas Pharma, Inc. | | | 1,400 | | | | 19,447 | | |
Bridgestone Corporation | | | 700 | | | | 25,239 | | |
Canon, Inc. | | | 1,400 | | | | 39,470 | | |
Chubu Electric Power Company, Inc. | | | 1,400 | | | | 19,561 | | |
Chugai Pharmaceutical Company, Ltd. | | | 700 | | | | 20,094 | | |
Dai-ichi Life Insurance Company Ltd. | | | 700 | | | | 11,655 | | |
Daito Trust Construction Company Ltd. | | | 700 | | | | 105,292 | | |
Denso Corporation | | | 700 | | | | 30,324 | | |
Fuji Heavy Industries Ltd. | | | 700 | | | | 28,581 | | |
FUJIFILM Holdings Corporation | | | 700 | | | | 26,563 | | |
Hankyu Hanshin Holdings, Inc. | | | 700 | | | | 22,460 | | |
Hoya Corporation | | | 700 | | | | 29,413 | | |
Isuzu Motors Ltd. | | | 1,400 | | | | 17,740 | | |
Japan Airlines Company Ltd. | | | 700 | | | | 20,453 | | |
Japan Exchange Group, Inc. | | | 700 | | | | 10,002 | | |
Japan Post Bank Company Ltd. | | | 1,400 | | | | 16,806 | | |
Japan Post Holdings Company Ltd. | | | 1,400 | | | | 17,477 | | |
Japan Post Insurance Company Ltd. | | | 700 | | | | 14,991 | | |
Japan Tobacco, Inc. | | | 700 | | | | 23,023 | | |
Kajima Corporation | | | 7,000 | | | | 48,453 | | |
Kao Corporation | | | 700 | | | | 33,187 | | |
KDDI Corporation | | | 700 | | | | 17,725 | | |
Komatsu Ltd. | | | 700 | | | | 15,857 | | |
Kubota Corporation | | | 700 | | | | 9,993 | | |
Kyocera Corporation | | | 700 | | | | 34,810 | | |
Kyowa Hakko Kirin Company Ltd. | | | 700 | | | | 9,679 | | |
M3, Inc. | | | 700 | | | | 17,638 | | |
Makita Corporation | | | 700 | | | | 46,896 | | |
Mazda Motor Corporation | | | 700 | | | | 11,452 | | |
Mitsubishi UFJ Financial Group, Inc. | | | 2,800 | | | | 17,254 | | |
Mizuho Financial Group, Inc. | | | 9,800 | | | | 17,592 | | |
NGK Insulators Ltd. | | | 700 | | | | 13,578 | | |
Nippon Paint Holdings Company Ltd. | | | 700 | | | | 19,076 | | |
Nippon Telegraph & Telephone Corporation | | | 700 | | | | 29,419 | | |
Nissan Motor Company Ltd. | | | 1,400 | | | | 14,081 | | |
Nomura Research Institute Ltd. | | | 726 | | | | 22,114 | | |
NTT Data Corporation | | | 700 | | | | 33,840 | | |
NTT DOCOMO, Inc. | | | 700 | | | | 15,950 | | |
Obayashi Corporation | | | 2,100 | | | | 20,070 | | |
Odakyu Electric Railway Company Ltd. | | | 3,500 | | | | 69,266 | | |
Olympus Corporation | | | 700 | | | | 24,197 | | |
See notes to financial statements.
82
Victory Portfolios II
VictoryShares International Volatility Wtd ETF | | Schedule of Investments — continued
December 31, 2016 | |
(Unaudited)
Security Description | | Shares | | Value | |
Japan (17.0%) cont'd | |
Omron Corporation | | | 700 | | | $ | 26,862 | | |
Ono Pharmaceutical Company Ltd. | | | 700 | | | | 15,306 | | |
Oriental Land Company Ltd. | | | 700 | | | | 39,565 | | |
ORIX Corporation | | | 700 | | | | 10,924 | | |
Osaka Gas Company Ltd. | | | 7,000 | | | | 26,928 | | |
Panasonic Corporation | | | 1,400 | | | | 14,249 | | |
Rakuten, Inc. | | | 1,400 | | | | 13,721 | | |
Recruit Holdings Company Ltd. | | | 700 | | | | 28,090 | | |
Renesas Electronics Corporation | | | 2,800 | | | | 22,232 | | |
Resona Holdings, Inc. | | | 3,500 | | | | 17,953 | | |
Ricoh Company Ltd. | | | 3,500 | | | | 29,587 | | |
Sekisui Chemical Company Ltd. | | | 1,400 | | | | 22,328 | | |
Sekisui House Ltd. | | | 1,400 | | | | 23,304 | | |
Seven & i Holdings Company Ltd. | | | 700 | | | | 26,670 | | |
Shimizu Corporation | | | 351 | | | | 3,210 | | |
Shionogi & Company, Ltd. | | | 700 | | | | 33,534 | | |
Sompo Japan Nipponkoa Holdings, Inc. | | | 700 | | | | 23,718 | | |
Sumitomo Dainippon Pharma Company Ltd. | | | 1,400 | | | | 24,077 | | |
Sumitomo Electric Industries Ltd. | | | 1,400 | | | | 20,202 | | |
Sumitomo Mitsui Financial Group, Inc. | | | 700 | | | | 26,712 | | |
Sumitomo Mitsui Trust Holdings, Inc. | | | 700 | | | | 25,053 | | |
Suntory Beverage & Food Ltd. | | | 700 | | | | 29,078 | | |
Suzuki Motor Corporation | | | 700 | | | | 24,640 | | |
T&D Holdings, Inc. | | | 1,400 | | | | 18,513 | | |
Terumo Corporation | | | 700 | | | | 25,844 | | |
Tokyu Corporation | | | 7,000 | | | | 51,448 | | |
TOTO Ltd. | | | 700 | | | | 27,701 | | |
Unicharm Corporation | | | 700 | | | | 15,318 | | |
Yahoo Japan Corporation | | | 5,600 | | | | 21,514 | | |
Yakult Honsha Company Ltd. | | | 700 | | | | 32,462 | | |
Yamaha Corporation | | | 700 | | | | 21,382 | | |
Yamato Holdings Company, Ltd. | | | 700 | | | | 14,234 | | |
| | | | 1,946,768 | | |
Netherlands (2.8%): | |
AerCap Holdings NV (a) | | | 378 | | | | 15,729 | | |
Akzo Nobel NV | | | 358 | | | | 22,381 | | |
| ASML Holding NV | | | 231 | | | | 25,933 | | |
GrandVision NV (Acquired 09/16/16 through 12/21/16, Cost $25,674) (b) | | | 932 | | | | 20,509 | | |
Heineken Holding NV | | | 435 | | | | 30,286 | | |
Heineken NV | | | 400 | | | | 30,005 | | |
ING Groep NV | | | 1,241 | | | | 17,466 | | |
Koninklijke Ahold Delhaize NV | | | 1,255 | | | | 26,461 | | |
Koninklijke DSM NV | | | 400 | | | | 23,984 | | |
Koninklijke KPN NV | | | 7,326 | | | | 21,701 | | |
Koninklijke Vopak NV | | | 414 | | | | 19,556 | | |
NN Group NV | | | 673 | | | | 22,808 | | |
Randstad Holding NV | | | 365 | | | | 19,799 | | |
Wolters Kluwer NV | | | 750 | | | | 27,174 | | |
| | | | 323,792 | | |
See notes to financial statements.
83
Victory Portfolios II
VictoryShares International Volatility Wtd ETF | | Schedule of Investments — continued
December 31, 2016 | |
(Unaudited)
Security Description | | Shares | | Value | |
New Zealand (0.2%): | |
Auckland International Airport Ltd. | | | 5,055 | | | $ | 21,948 | | |
Norway (1.2%): | |
DNB ASA | | | 1,515 | | | | 22,527 | | |
Gjensidige Forsikring ASA | | | 1,662 | | | | 26,367 | | |
Marine Harvest ASA | | | 1,613 | | | | 29,083 | | |
Orkla ASA | | | 3,471 | | | | 31,433 | | |
Yara International ASA | | | 638 | | | | 25,120 | | |
| | | | 134,530 | | |
Portugal (0.4%): | |
EDP-Energias de Portugal SA | | | 6,618 | | | | 20,161 | | |
Jeronimo Martins SGPS SA | | | 1,528 | | | | 23,709 | | |
| | | | 43,870 | | |
Singapore (2.2%): | |
CapitaLand Ltd. | | | 14,000 | | | | 29,196 | | |
DBS Group Holdings Ltd. | | | 2,800 | | | | 33,527 | | |
Jardine Cycle & Carriage Ltd. | | | 700 | | | | 19,930 | | |
Keppel Corporation Ltd. | | | 4,900 | | | | 19,591 | | |
Oversea-Chinese Banking Corporation Ltd. | | | 4,200 | | | | 25,870 | | |
Singapore Airlines Ltd. | | | 4,900 | | | | 32,720 | | |
Singapore Technologies Engineering Ltd. | | | 10,500 | | | | 23,419 | | |
Singapore Telecommunications Ltd. | | | 10,500 | | | | 26,465 | | |
United Overseas Bank Ltd. | | | 2,800 | | | | 39,443 | | |
| | | | 250,161 | | |
South Africa (0.1%): | |
Steinhoff International Holdings NV | | | 2,559 | | | | 13,210 | | |
Spain (3.3%): | |
Abertis Infraestructuras SA | | | 1,724 | | | | 24,128 | | |
ACS Actividades de Construccion y Servicios SA | | | 645 | | | | 20,382 | | |
Aena SA (Acquired 03/18/16 through 12/21/16, Cost $24,301) (b) | | | 189 | | | | 25,794 | | |
Amadeus IT Group SA | | | 575 | | | | 26,130 | | |
Banco de Sabadell SA | | | 9,695 | | | | 13,502 | | |
Banco Santander SA | | | 2,860 | | | | 14,930 | | |
Bankia SA | | | 15,513 | | | | 15,856 | | |
Bankinter SA | | | 2,993 | | | | 23,188 | | |
Enagas SA | | | 1,157 | | | | 29,382 | | |
Ferrovial SA | | | 1,157 | | | | 20,699 | | |
Gamesa Corp Tecnologica SA | | | 659 | | | | 13,368 | | |
Gas Natural SDG SA | | | 1,150 | | | | 21,681 | | |
Grifols SA | | | 1,346 | | | | 26,751 | | |
Iberdrola SA | | | 4,171 | | | | 27,371 | | |
Industria de Diseno Textil SA | | | 708 | | | | 24,169 | | |
Mapfre SA | | | 6,365 | | | | 19,430 | | |
Red Electrica Corp SA | | | 1,767 | | | | 33,341 | | |
| | | | 380,102 | | |
Sweden (3.4%): | |
Alfa Laval AB | | | 1,185 | | | | 19,614 | | |
See notes to financial statements.
84
Victory Portfolios II
VictoryShares International Volatility Wtd ETF | | Schedule of Investments — continued
December 31, 2016 | |
(Unaudited)
Security Description | | Shares | | Value | |
Sweden (3.4%) cont'd | |
Assa Abloy AB — Class B | | | 1,093 | | | $ | 20,287 | | |
Atlas Copco AB — Class A | | | 666 | | | | 20,286 | | |
Autoliv, Inc. | | | 189 | | | | 21,385 | | |
Hennes & Mauritz AB — Class B | | | 729 | | | | 20,276 | | |
Hexagon AB — Class B | | | 540 | | | | 19,293 | | |
ICA Gruppen AB | | | 652 | | | | 19,888 | | |
Investment AB Latour | | | 596 | | | | 22,386 | | |
L E Lundbergforetagen AB — Class B | | | 512 | | | | 31,387 | | |
Nordea Bank AB | | | 2,131 | | | | 23,695 | | |
Skanska AB — Class B | | | 981 | | | | 23,161 | | |
| SKF AB — Class B | | | 1,129 | | | | 20,769 | | |
Svenska Cellulosa AB SCA — Class B | | | 806 | | | | 22,763 | | |
Svenska Handelsbanken AB — Class A | | | 1,549 | | | | 21,525 | | |
Swedbank AB — Class A | | | 960 | | | | 23,213 | | |
Swedish Match AB | | | 757 | | | | 24,080 | | |
Telefonaktiebolaget LM Ericsson — Class B | | | 2,615 | | | | 15,356 | | |
Volvo AB — Class B | | | 1,745 | | | | 20,379 | | |
| | | | 389,743 | | |
Switzerland (7.3%): | |
ABB Ltd. | | | 1,507 | | | | 31,789 | | |
Actelion Ltd. | | | 161 | | | | 34,862 | | |
Barry Callebaut AG | | | 21 | | | | 25,696 | | |
Chubb Ltd. | | | 301 | | | | 39,768 | | |
Cie Financiere Richemont SA | | | 385 | | | | 25,502 | | |
Coca-Cola HBC AG | | | 1,106 | | | | 24,126 | | |
EMS-Chemie Holding AG | | | 63 | | | | 32,017 | | |
Galenica AG | | | 14 | | | | 15,797 | | |
Garmin Ltd. | | | 420 | | | | 20,366 | | |
Geberit AG | | | 77 | | | | 30,867 | | |
Givaudan SA | | | 21 | | | | 38,482 | | |
Julius Baer Group Ltd. | | | 448 | | | | 19,899 | | |
Kuehne + Nagel International AG — Class R | | | 245 | | | | 32,384 | | |
Lonza Group AG | | | 147 | | | | 25,450 | | |
Nestle SA | | | 469 | | | | 33,645 | | |
Novartis AG | | | 413 | | | | 30,053 | | |
Partners Group Holding AG | | | 63 | | | | 29,526 | | |
Roche Holdings AG | | | 126 | | | | 28,781 | | |
Schindler Holding AG | | | 189 | | | | 33,334 | | |
SGS SA | | | 14 | | | | 28,487 | | |
Sika AG | | | 7 | | | | 33,629 | | |
Sonova Holding AG | | | 224 | | | | 27,145 | | |
Swatch Group AG | | | 84 | | | | 26,125 | | |
Swiss Life Holding AG | | | 105 | | | | 29,717 | | |
Swiss Re AG | | | 322 | | | | 30,515 | | |
Swisscom AG | | | 70 | | | | 31,353 | | |
TE Connectivity Ltd. | | | 434 | | | | 30,067 | | |
UBS Group AG | | | 1,184 | | | | 18,545 | | |
Wolseley PLC | | | 448 | | | | 27,396 | | |
| | | | 835,323 | | |
See notes to financial statements.
85
Victory Portfolios II
VictoryShares International Volatility Wtd ETF | | Schedule of Investments — continued
December 31, 2016 | |
(Unaudited)
Security Description | | Shares | | Value | |
United Kingdom (10.8%): | |
| 3i Group PLC | | | 2,430 | | | $ | 21,083 | | |
Admiral Group PLC | | | 875 | | | | 19,701 | | |
Aon PLC | | | 350 | | | | 39,035 | | |
Ashtead Group PLC | | | 1,022 | | | | 19,900 | | |
Associated British Foods PLC | | | 469 | | | | 15,866 | | |
Aviva PLC | | | 2,843 | | | | 17,042 | | |
Babcock International Group PLC | | | 1,828 | | | | 21,469 | | |
BAE Systems PLC | | | 4,349 | | | | 31,703 | | |
Barratt Developments PLC | | | 1,793 | | | | 10,218 | | |
British American Tobacco PLC | | | 567 | | | | 32,294 | | |
BT Group PLC | | | 4,180 | | | | 18,901 | | |
Bunzl PLC | | | 1,134 | | | | 29,474 | | |
Burberry Group PLC | | | 1,127 | | | | 20,792 | | |
Coca-Cola European Partners PLC | | | 427 | | | | 13,408 | | |
Compass Group PLC | | | 1,737 | | | | 32,132 | | |
Delphi Automotive PLC | | | 266 | | | | 17,915 | | |
Diageo PLC | | | 1,274 | | | | 33,129 | | |
Direct Line Insurance Group PLC | | | 4,468 | | | | 20,341 | | |
GKN PLC | | | 4,930 | | | | 20,153 | | |
Hargreaves Lansdown PLC | | | 868 | | | | 12,976 | | |
IHS Markit Ltd. (a) | | | 665 | | | | 23,548 | | |
Imperial Brands PLC | | | 658 | | | | 28,727 | | |
InterContinental Hotels Group PLC | | | 441 | | | | 19,772 | | |
International Consolidated Airlines Group SA | | | 2,458 | | | | 13,356 | | |
ITV PLC | | | 5,658 | | | | 14,392 | | |
Johnson Matthey PLC | | | 554 | | | | 21,712 | | |
Kingfisher PLC | | | 4,930 | | | | 21,283 | | |
Legal & General Group PLC | | | 4,937 | | | | 15,065 | | |
Marks & Spencer Group PLC | | | 3,844 | | | | 16,581 | | |
Merlin Entertainments PLC (Acquired 03/18/16 through 12/21/16,
Cost $27,553) (b) | | | 4,145 | | | | 22,916 | | |
Michael Kors Holdings Ltd. (a) | | | 315 | | | | 13,539 | | |
National Grid PLC | | | 2,570 | | | | 30,140 | | |
Next PLC | | | 238 | | | | 14,616 | | |
Old Mutual PLC | | | 6,841 | | | | 17,477 | | |
Pentair PLC | | | 378 | | | | 21,194 | | |
Persimmon PLC | | | 483 | | | | 10,572 | | |
Prudential PLC | | | 868 | | | | 17,410 | | |
Reckitt Benckiser Group PLC | | | 378 | | | | 32,078 | | |
RELX NV | | | 1,703 | | | | 28,665 | | |
RELX PLC | | | 1,772 | | | | 31,644 | | |
Royal Mail PLC | | | 3,837 | | | | 21,851 | | |
RSA Insurance Group PLC | | | 3,788 | | | | 27,357 | | |
Sage Group PLC | | | 2,619 | | | | 21,141 | | |
Schroders PLC | | | 462 | | | | 17,070 | | |
Severn Trent PLC | | | 1,197 | | | | 32,779 | | |
Sky PLC | | | 2,255 | | | | 27,541 | | |
Smith & Nephew PLC | | | 1,926 | | | | 28,982 | | |
Smiths Group PLC | | | 1,401 | | | | 24,449 | | |
See notes to financial statements.
86
Victory Portfolios II
VictoryShares International Volatility Wtd ETF | | Schedule of Investments — continued
December 31, 2016 | |
(Unaudited)
Security Description | | Shares | | Value | |
United Kingdom (10.8%) cont'd | |
SSE PLC | | | 1,302 | | | $ | 24,919 | | |
St James's Place PLC | | | 1,295 | | | | 16,183 | | |
Standard Life PLC | | | 3,508 | | | | 16,083 | | |
Taylor Wimpey PLC | | | 5,182 | | | | 9,803 | | |
Unilever PLC | | | 721 | | | | 29,256 | | |
United Utilities Group PLC | | | 2,738 | | | | 30,403 | | |
Whitbread PLC | | | 364 | | | | 16,939 | | |
WPP PLC | | | 1,232 | | | | 27,573 | | |
| | | | 1,234,548 | | |
Total Common Stocks (Cost $11,791,277) | | | 11,390,083 | | |
Short-Term Investments (0.1%) | |
Money Market Funds (0.1%): | |
Short-Term Investments Trust Government & Agency Portfolio —
Institutional Class, 0.43% (c) | | | 11,002 | | | | 11,002 | | |
Total Short-Term Investments (Cost $11,002) | | | 11,002 | | |
Total Investments — 99.8% (Cost $11,802,279) | | | 11,401,085 | | |
Other assets in excess of liabilities — 0.2% | | | 20,254 | | |
NET ASSETS — 100.0% | | $ | 11,421,339 | | |
(a) Non-income producing security.
(b) Restricted securities as defined in Rule 144(a) and Regulation S under the Securities Act of 1933. Such securities are treated as liquid securities according to the Fund's liquidity guidlelines. The value of those securities total $143,863 or 1.26% of net assets.
(c) Annualized seven-day yield as of December 31, 2016.
See notes to financial statements.
87
Victory Portfolios II
VictoryShares Emerging Market Volatility Wtd ETF | | Schedule of Investments
December 31, 2016 | |
(Unaudited)
Security Description | | Shares | | Value | |
Common Stocks (99.4%) | |
Brazil (3.6%): | |
Ambev SA | | | 11,900 | | | $ | 59,963 | | |
Banco do Brasil SA | | | 4,000 | | | | 34,522 | | |
BB Seguridade Participacoes SA | | | 2,000 | | | | 17,390 | | |
| BRF SA | | | 2,000 | | | | 29,649 | | |
CCR SA | | | 6,000 | | | | 29,422 | | |
CETIP SA — Mercados Organizados | | | 6,000 | | | | 82,220 | | |
Cielo SA | | | 3,960 | | | | 33,934 | | |
| CPFL Energia SA | | | 5,960 | | | | 46,165 | | |
EDP — Energias do Brasil SA | | | 12,000 | | | | 49,405 | | |
Engie Brasil Energia SA | | | 6,000 | | | | 64,522 | | |
Equatorial Energia SA | | | 4,000 | | | | 66,857 | | |
Hypermarcas SA | | | 6,000 | | | | 48,170 | | |
Kroton Educacional SA | | | 8,000 | | | | 32,765 | | |
Localiza Rent a Car SA | | | 2,000 | | | | 21,028 | | |
Lojas Renner SA | | | 6,000 | | | | 42,714 | | |
M Dias Branco SA | | | 2,000 | | | | 70,673 | | |
Raia Drogasil SA | | | 2,000 | | | | 37,601 | | |
Tim Participacoes SA | | | 13,900 | | | | 33,440 | | |
Ultrapar Participacoes SA | | | 2,000 | | | | 42,062 | | |
WEG SA | | | 8,000 | | | | 38,099 | | |
| | | | 880,601 | | |
Chile (3.6%): | |
AES Gener SA | | | 192,271 | | | | 68,668 | | |
Aguas Andinas SA — Class A | | | 168,576 | | | | 87,769 | | |
Banco de Chile | | | 967,432 | | | | 113,383 | | |
Banco do Credito e Inversiones | | | 1,813 | | | | 91,763 | | |
Banco Santander-Chile | | | 1,596,856 | | | | 88,832 | | |
Cia Cervecerias Unidas SA | | | 6,417 | | | | 67,016 | | |
Colbun SA | | | 328,841 | | | | 64,698 | | |
Empresas COPEC SA | | | 7,234 | | | | 69,321 | | |
Enel Americas SA | | | 331,153 | | | | 53,826 | | |
Enel Generacion Chile SA | | | 111,520 | | | | 73,581 | | |
SACI Falabella | | | 12,754 | | | | 100,911 | | |
| | | | 879,768 | | |
China (12.9%): | |
3SBio, Inc. (Acquired 03/22/16 through 10/26/16, Cost $33,412) (a) (b) | | | 30,000 | | | | 29,209 | | |
Anhui Conch Cement Company Ltd. — Class H | | | 10,000 | | | | 27,210 | | |
ANTA Sports Products Ltd. | | | 20,000 | | | | 59,707 | | |
AviChina Industry & Technology Company Ltd. — Class H | | | 60,000 | | | | 41,318 | | |
BAIC Motor Corporation Ltd. — Class H (Acquired 04/12/16 through 10/26/16,
Cost $27,694) (b) | | | 30,000 | | | | 26,694 | | |
Bank of China Ltd. — Class H | | | 120,000 | | | | 53,234 | | |
Bank of Communications Company Ltd. — Class H | | | 80,000 | | | | 57,876 | | |
BBMG Corporation — Class H | | | 80,000 | | | | 27,648 | | |
Beijing Capital International Airport Company Ltd. — Class H | | | 40,000 | | | | 40,441 | | |
Belle International Holdings Ltd. | | | 60,000 | | | | 33,735 | | |
See notes to financial statements.
88
Victory Portfolios II
VictoryShares Emerging Market Volatility Wtd ETF | | Schedule of Investments — continued
December 31, 2016 | |
(Unaudited)
Security Description | | Shares | | Value | |
China (12.9%) cont'd | |
BYD Company Ltd. — Class H | | | 10,000 | | | $ | 52,679 | | |
CAR, Inc. (a) | | | 40,000 | | | | 38,997 | | |
CGN Power Company Ltd. — Class H (Acquired 03/22/16 through 10/26/16,
Cost $43,004) (b) | | | 139,000 | | | | 38,180 | | |
China Cinda Asset Management Company Ltd. — Class H | | | 159,000 | | | | 57,617 | | |
China CITIC Bank Corporation Ltd. — Class H | | | 80,000 | | | | 50,861 | | |
China Communications Construction Company Ltd. — Class H | | | 40,000 | | | | 46,012 | | |
China Communications Services Corporation Ltd. — Class H | | | 80,000 | | | | 50,964 | | |
China Conch Venture Holdings Ltd. | | | 30,000 | | | | 53,388 | | |
China Construction Bank Corporation — Class H | | | 80,000 | | | | 61,590 | | |
China Evergrande Group | | | 60,000 | | | | 37,372 | | |
China Galaxy Securities Company Ltd. — Class H | | | 40,000 | | | | 36,056 | | |
China Hongqiao Group Ltd. | | | 40,000 | | | | 35,180 | | |
China Life Insurance Co Ltd. | | | 20,000 | | | | 52,099 | | |
China Longyuan Power Group Corporation Ltd. — Class H | | | 40,000 | | | | 31,259 | | |
China Machinery Engineering Corporation — Class H | | | 60,000 | | | | 38,068 | | |
China Medical System Holdings Ltd. | | | 20,000 | | | | 31,672 | | |
China Mengniu Dairy Company Ltd. | | | 20,000 | | | | 38,532 | | |
China Molybdenum Company Ltd. — Class H | | | 120,000 | | | | 29,248 | | |
China National Building Material Company Ltd. — Class H | | | 80,000 | | | | 38,894 | | |
China Petroleum & Chemical Corporation | | | 40,000 | | | | 28,371 | | |
China Railway Construction Corporation Ltd. — Class H | | | 30,000 | | | | 38,610 | | |
China Railway Group Ltd. — Class H | | | 40,000 | | | | 32,910 | | |
China Railway Signal & Communication Corporation Ltd. (Acquired 09/19/16
through 10/26/16, Cost $31,768) (b) | | | 40,000 | | | | 28,835 | | |
China Reinsurance Group Corporation | | | 179,000 | | | | 42,473 | | |
China Telecom Corporation Ltd. — Class H | | | 80,000 | | | | 36,933 | | |
China Vanke Company Ltd. — Class H | | | 13,900 | | | | 31,727 | | |
China Zhongwang Holdings Ltd. | | | 79,600 | | | | 33,875 | | |
Chongqing Rural Commercial Bank Company Ltd. — Class H | | | 80,000 | | | | 46,940 | | |
Country Garden Holdings Company Ltd. | | | 100,000 | | | | 55,967 | | |
CSPC Pharmaceutical Group Ltd. | | | 40,000 | | | | 42,711 | | |
Dongfeng Motor Group Company Ltd. — Class H | | | 40,000 | | | | 39,048 | | |
FIH Mobile Ltd. | | | 120,000 | | | | 37,913 | | |
Fosun International Ltd. | | | 30,000 | | | | 42,479 | | |
GOME Electrical Appliances Holding Ltd. | | | 299,000 | | | | 36,245 | | |
Great Wall Motor Company Ltd. — Class H | | | 30,000 | | | | 28,010 | | |
Guangzhou Automobile Group Company Ltd. | | | 40,000 | | | | 48,385 | | |
Guangzhou Baiyunshan Pharmaceutical Holdings Company Ltd. | | | 40,000 | | | | 103,424 | | |
Guangzhou R&F Properties Company Ltd. — Class H | | | 24,000 | | | | 29,031 | | |
Haitian International Holdings Ltd. | | | 20,000 | | | | 39,255 | | |
Hengan International Group Company Ltd. | | | 10,000 | | | | 73,441 | | |
Huaneng Power International, Inc. — Class H | | | 40,000 | | | | 26,514 | | |
Huaneng Renewables Corporation Ltd. — Class H | | | 80,000 | | | | 25,998 | | |
Intime Retail Group Company Ltd. (c) | | | 40,000 | | | | 36,263 | | |
Jiangsu Expressway Company Ltd. — Class H | | | 40,000 | | | | 50,551 | | |
Legend Holdings Corporation (Acquired 09/19/16 through 10/26/16,
Cost $50,912) (b) | | | 19,900 | | | | 44,140 | | |
Longfor Properties Company Ltd. | | | 30,000 | | | | 38,068 | | |
People's Insurance Company Group of China Ltd. — Class H | | | 100,000 | | | | 39,461 | | |
See notes to financial statements.
89
Victory Portfolios II
VictoryShares Emerging Market Volatility Wtd ETF | | Schedule of Investments — continued
December 31, 2016 | |
(Unaudited)
Security Description | | Shares | | Value | |
China (12.9%) cont'd | |
PICC Property & Casualty Company Ltd. | | | 40,000 | | | $ | 62,312 | | |
Ping An Insurance Group Company of China Ltd. — Class H | | | 10,000 | | | | 50,035 | | |
Shandong Weigao Group Medical Polymer Company Ltd. | | | 80,000 | | | | 53,440 | | |
Sihuan Pharmaceutical Holdings Group Ltd. | | | 40,000 | | | | 11,142 | | |
Sino-Ocean Land Holdings Ltd. | | | 79,500 | | | | 35,575 | | |
Sinopec Engineering Group Company Ltd. — Class H | | | 50,000 | | | | 41,718 | | |
Sinopharm Group Company Ltd. — Class H | | | 8,000 | | | | 32,961 | | |
Sinotrans Ltd. | | | 60,000 | | | | 26,772 | | |
Tencent Holdings Ltd. | | | 2,000 | | | | 48,926 | | |
Tong Ren Tang Technologies Company Ltd. — Class H | | | 40,000 | | | | 74,176 | | |
TravelSky Technology Ltd. — Class H | | | 20,000 | | | | 42,040 | | |
Uni-President China Holdings Ltd. | | | 60,000 | | | | 42,324 | | |
Want Want China Holdings Ltd. | | | 60,000 | | | | 38,455 | | |
Weichai Power Company Ltd. — Class H | | | 20,000 | | | | 30,795 | | |
Xinhua Winshare Publishing and Media Company Ltd. | | | 40,000 | | | | 37,294 | | |
Xinyi Solar Holdings Ltd. | | | 80,000 | | | | 25,998 | | |
Zall Group Ltd. (a) | | | 60,000 | | | | 46,425 | | |
Zhejiang Expressway Company Ltd. — Class H | | | 40,000 | | | | 38,171 | | |
Zhuzhou CRRC Times Electric Comapny Ltd. | | | 10,000 | | | | 50,745 | | |
| | | | 3,162,622 | | |
Colombia (0.8%): | |
Cementos Argos SA | | | 12,825 | | | | 50,668 | | |
Grupo de Inversiones Suramericana SA | | | 4,879 | | | | 62,084 | | |
Grupo Nutresa SA | | | 10,217 | | | | 84,745 | | |
| | | | 197,497 | | |
Czech Republic (0.4%): | |
CEZ AS | | | 2,989 | | | | 50,068 | | |
Komercni banka as | | | 1,395 | | | | 48,093 | | |
| | | | 98,161 | | |
Egypt (0.1%): | |
Commercial International Bank Egypt SAE | | | 8,465 | | | | 34,121 | | |
Greece (0.3%): | |
Hellenic Telecommunications Organization SA | | | 3,746 | | | | 35,213 | | |
OPAP SA | | | 3,946 | | | | 34,892 | | |
| | | | 70,105 | | |
Hungary (0.3%): | |
Richter Gedeon Nyrt | | | 2,929 | | | | 61,912 | | |
India (11.8%): | |
ACC Ltd. | | | 2,630 | | | | 51,579 | | |
Adani Ports & Special Economic Zone Ltd. | | | 8,409 | | | | 33,261 | | |
Ajanta Pharma Ltd | | | 1,893 | | | | 49,725 | | |
Amara Raja Batteries Ltd. | | | 3,607 | | | | 46,253 | | |
Asian Paints Ltd. | | | 3,746 | | | | 49,180 | | |
Aurobindo Pharma Ltd. | | | 3,507 | | | | 34,584 | | |
Bajaj Auto Ltd. | | | 1,475 | | | | 57,205 | | |
Bajaj Finserv Ltd. | | | 1,036 | | | | 44,188 | | |
Bank of Baroda (a) | | | 11,857 | | | | 26,799 | | |
See notes to financial statements.
90
Victory Portfolios II
VictoryShares Emerging Market Volatility Wtd ETF | | Schedule of Investments — continued
December 31, 2016 | |
(Unaudited)
Security Description | | Shares | | Value | |
India (11.8%) cont'd | |
Berger Paints India Ltd. | | | 11,319 | | | $ | 35,114 | | |
Bharti Airtel Ltd. | | | 11,219 | | | | 50,524 | | |
Bharti Infratel Ltd. | | | 8,290 | | | | 41,951 | | |
Biocon Ltd. | | | 3,348 | | | | 46,856 | | |
Bosch Ltd. | | | 159 | | | | 49,314 | | |
Britannia Industries Ltd. | | | 996 | | | | 42,357 | | |
Cadila Healthcare Ltd. | | | 7,453 | | | | 39,165 | | |
Castrol India Ltd. | | | 8,150 | | | | 45,709 | | |
Cipla Ltd. | | | 7,034 | | | | 58,950 | | |
Coal India Ltd. | | | 10,721 | | | | 47,389 | | |
Colgate-Palmolive India Ltd. | | | 4,703 | | | | 62,684 | | |
Cummins India Ltd. | | | 3,846 | | | | 46,396 | | |
Dabur India Ltd. | | | 12,953 | | | | 53,085 | | |
Divi's Laboratories Ltd. | | | 2,989 | | | | 34,514 | | |
DLF Ltd. | | | 13,770 | | | | 22,602 | | |
Dr Reddy's Laboratories Ltd. | | | 1,076 | | | | 48,519 | | |
Eicher Motors Ltd. | | | 159 | | | | 51,078 | | |
Emami Ltd. | | | 3,208 | | | | 44,977 | | |
GlaxoSmithKline Consumer Healthcare Ltd | | | 678 | | | | 49,982 | | |
Glenmark Pharmaceuticals Ltd. | | | 3,886 | | | | 50,870 | | |
Godrej Consumer Products Ltd. | | | 1,953 | | | | 43,450 | | |
HCL Technologies Ltd. | | | 5,062 | | | | 61,752 | | |
Hindustan Zinc Ltd. | | | 12,255 | | | | 46,116 | | |
Housing Development Finance Corporation Ltd. | | | 2,870 | | | | 53,391 | | |
ICICI Bank Ltd. | | | 9,545 | | | | 35,904 | | |
Idea Cellular Ltd. | | | 29,552 | | | | 32,286 | | |
Indiabulls Housing Finance Ltd. | | | 3,527 | | | | 33,792 | | |
Infosys Ltd. | | | 3,667 | | | | 54,602 | | |
ITC Ltd. | | | 14,387 | | | | 51,225 | | |
Kotak Mahindra Bank Ltd. | | | 5,540 | | | | 58,747 | | |
Larsen & Toubro Ltd. | | | 1,933 | | | | 38,424 | | |
Lupin Ltd. | | | 1,893 | | | | 41,473 | | |
Mahindra & Mahindra Ltd. | | | 2,650 | | | | 46,257 | | |
Marico Ltd. | | | 13,132 | | | | 50,394 | | |
Motherson Sumi Systems Ltd. | | | 6,636 | | | | 31,919 | | |
Nestle India Ltd. | | | 618 | | | | 54,892 | | |
Oracle Financial Services Software Ltd. | | | 1,315 | | | | 60,563 | | |
Page Industries Ltd. | | | 199 | | | | 40,025 | | |
Pidilite Industries Ltd. | | | 6,138 | | | | 53,340 | | |
Piramal Enterprises Ltd. | | | 1,475 | | | | 35,312 | | |
Reliance Industries Ltd. | | | 4,284 | | | | 68,322 | | |
Reliance Infrastructure Ltd. | | | 3,786 | | | | 26,062 | | |
Reliance Power Ltd. (a) | | | 55,816 | | | | 33,883 | | |
Shriram Transport Finance Company Ltd. | | | 2,072 | | | | 26,055 | | |
State Bank of India | | | 9,107 | | | | 33,573 | | |
Sun Pharmaceutical Industries Ltd. | | | 5,161 | | | | 47,907 | | |
Tata Consultancy Services Ltd. | | | 1,813 | | | | 63,191 | | |
Tata Power Company Ltd. | | | 45,255 | | | | 50,609 | | |
Tech Mahindra Ltd. | | | 7,433 | | | | 53,543 | | |
Torrent Pharmaceuticals Ltd. | | | 1,993 | | | | 38,678 | | |
See notes to financial statements.
91
Victory Portfolios II
VictoryShares Emerging Market Volatility Wtd ETF | | Schedule of Investments — continued
December 31, 2016 | |
(Unaudited)
Security Description | | Shares | | Value | |
India (11.8%) cont'd | |
UltraTech Cement Ltd. | | | 976 | | | $ | 46,739 | | |
UPL Ltd. | | | 4,304 | | | | 41,030 | | |
Wipro Ltd. | | | 9,924 | | | | 69,374 | | |
Zee Entertainment Enterprises Ltd. | | | 6,317 | | | | 42,168 | | |
| | | | 2,879,808 | | |
Indonesia (3.8%): | |
Astra International Tbk PT | | | 67,800 | | | | 41,644 | | |
Bank Central Asia Tbk PT | | | 91,700 | | | | 105,500 | | |
Bank Mandiri Persero Tbk PT | | | 53,800 | | | | 46,223 | | |
Bank Negara Indonesia Persero Tbk PT | | | 117,600 | | | | 48,227 | | |
Bank Rakyat Indonesia Persero Tbk PT | | | 53,800 | | | | 46,622 | | |
Charoen Pokphand Indonesia Tbk PT | | | 147,500 | | | | 33,830 | | |
Gudang Garam Tbk PT | | | 10,000 | | | | 47,430 | | |
Hanjaya Mandala Sampoerna Tbk PT | | | 139,500 | | | | 39,657 | | |
Indocement Tunggal Prakarsa Tbk PT | | | 33,900 | | | | 38,750 | | |
Indofood CBP Sukses Makmur Tbk PT | | | 69,700 | | | | 44,363 | | |
Jasa Marga Persero Tbk PT | | | 141,500 | | | | 45,372 | | |
Kalbe Farma Tbk PT | | | 338,800 | | | | 38,099 | | |
Matahari Department Store Tbk PT | | | 27,900 | | | | 31,322 | | |
Mitra Keluarga Karyasehat Tbk PT (Acquired 03/22/16 through 10/26/16,
Cost $34,846) (b) | | | 175,400 | | | | 33,459 | | |
Perusahaan Gas Negara Persero Tbk | | | 163,400 | | | | 32,747 | | |
Semen Indonesia Perero Tbk PT | | | 59,800 | | | | 40,725 | | |
Surya Citra Media Tbk PT | | | 171,400 | | | | 35,622 | | |
Telekomunikasi Indonesia Persero Tbk PT | | | 161,400 | | | | 47,680 | | |
Unilever Indonesia Tbk PT | | | 15,900 | | | | 45,791 | | |
Waskita Karya Persero Tbk PT | | | 281,000 | | | | 53,186 | | |
XL Axiata Tbk PT (a) | | | 193,300 | | | | 33,143 | | |
| | | | 929,392 | | |
Malaysia (8.7%): | |
Astro Malaysia Holdings Bhd | | | 75,700 | | | | 43,874 | | |
Axiata Group Bhd | | | 47,800 | | | | 50,293 | | |
British American Tobacco Malaysia Bhd | | | 4,000 | | | | 39,768 | | |
CIMB Group Holdings Bhd | | | 49,800 | | | | 50,066 | | |
DiGi.com Bhd | | | 71,700 | | | | 77,198 | | |
Fraser & Neave Holdings Bhd | | | 13,900 | | | | 72,753 | | |
Gamuda Bhd | | | 73,700 | | | | 78,530 | | |
Genting Bhd | | | 23,900 | | | | 42,622 | | |
Genting Malaysia Bhd | | | 53,800 | | | | 54,927 | | |
HAP Seng Consolidated Bhd | | | 55,800 | | | | 110,207 | | |
Hong Leong Bank Bhd | | | 39,900 | | | | 120,074 | | |
IHH Healthcare Bhd | | | 65,800 | | | | 93,141 | | |
IJM Corporation Bhd | | | 103,600 | | | | 73,901 | | |
Kuala Lumpur Kepong Bhd | | | 19,900 | | | | 106,465 | | |
Malayan Banking Bhd | | | 53,800 | | | | 98,342 | | |
Maxis Bhd | | | 43,800 | | | | 58,387 | | |
MISC Bhd | | | 33,900 | | | | 55,543 | | |
Petronas Chemicals Group Bhd | | | 39,900 | | | | 62,083 | | |
Petronas Dagangan Bhd | | | 15,900 | | | | 84,356 | | |
See notes to financial statements.
92
Victory Portfolios II
VictoryShares Emerging Market Volatility Wtd ETF | | Schedule of Investments — continued
December 31, 2016 | |
(Unaudited)
Security Description | | Shares | | Value | |
Malaysia (8.7%) cont'd | |
Petronas Gas Bhd | | | 15,900 | | | $ | 75,495 | | |
Public Bank Bhd | | | 35,900 | | | | 157,813 | | |
RHB Capital Bhd | | | 53,797 | | | | 56,483 | | |
Sime Darby Bhd | | | 31,900 | | | | 57,599 | | |
Telekom Malaysia Bhd | | | 113,600 | | | | 150,673 | | |
Tenaga Nasional Bhd | | | 37,900 | | | | 117,434 | | |
Westports Holdings Bhd | | | 73,700 | | | | 70,644 | | |
YTL Corporation Bhd | | | 167,400 | | | | 57,840 | | |
| | | | 2,116,511 | | |
Mexico (4.7%): | |
Alfa SAB de CV | | | 37,900 | | | | 46,914 | | |
Alpek SAB de CV | | | 35,900 | | | | 42,880 | | |
Alsea SAB de CV | | | 19,900 | | | | 56,850 | | |
Arca Continental SAB de CV | | | 12,000 | | | | 62,427 | | |
Coca-Cola Femsa SAB de CV | | | 10,000 | | | | 63,387 | | |
Grupo Aeroportuario del Centro Norte SAB de CV | | | 10,000 | | | | 43,045 | | |
Grupo Aeroportuario del Pacifico SAB de CV — Class B | | | 6,000 | | | | 49,321 | | |
Grupo Aeroportuario del Sureste SAB de CV — Class B | | | 4,785 | | | | 68,882 | | |
Grupo Bimbo SAB de CV — Class A | | | 21,900 | | | | 49,527 | | |
Grupo Carso SAB de CV — Class A | | | 13,900 | | | | 55,903 | | |
Grupo Financiero Banorte SAB de CV — Class O | | | 10,000 | | | | 49,253 | | |
Grupo Financiero Inbursa SAB de CV — Class O | | | 33,900 | | | | 51,382 | | |
Grupo Financiero Santander Mexico SAB de CV — Class B | | | 31,900 | | | | 45,873 | | |
Grupo Lala SAB de CV | | | 33,900 | | | | 49,305 | | |
Grupo Mexico SAB de CV — Class B | | | 21,900 | | | | 59,468 | | |
Industrias Bachoco SAB de CV — Class B | | | 15,900 | | | | 65,043 | | |
Infraestructura Energetica Nova SAB de CV | | | 17,900 | | | | 77,974 | | |
Kimberly-Clark de Mexico SAB de CV — Class A | | | 25,900 | | | | 46,641 | | |
Nemak SAB de CV (Acquired 09/19/16 through 10/26/16, Cost $69,539) (b) | | | 65,800 | | | | 58,977 | | |
OHL Mexico SAB de CV | | | 21,900 | | | | 21,541 | | |
Promotora y Operadora de Infraestructura SAB de CV | | | 5,280 | | | | 44,064 | | |
Wal-Mart de Mexico SAB de CV | | | 25,900 | | | | 46,353 | | |
| | | | 1,155,010 | | |
Philippines (4.6%): | |
Aboitiz Equity Ventures, Inc. | | | 38,440 | | | | 54,746 | | |
Aboitiz Power Corporation | | | 79,700 | | | | 66,854 | | |
Alliance Global Group, Inc. | | | 143,400 | | | | 36,865 | | |
Ayala Corporation | | | 2,990 | | | | 43,937 | | |
Ayala Land, Inc. | | | 61,700 | | | | 39,716 | | |
Bank of the Philippine Islands | | | 35,850 | | | | 64,038 | | |
BDO Unibank, Inc. | | | 27,090 | | | | 61,087 | | |
DMCI Holdings, Inc. | | | 197,200 | | | | 52,600 | | |
Energy Development Corporation | | | 396,400 | | | | 41,065 | | |
Globe Telecom, Inc. | | | 1,095 | | | | 33,238 | | |
GT Capital Holdings, Inc. | | | 1,990 | | | | 50,838 | | |
JG Summit Holdings, Inc. | | | 27,690 | | | | 37,681 | | |
Jollibee Foods Corporation | | | 12,750 | | | | 49,756 | | |
LT Group, Inc. | | | 153,400 | | | | 38,757 | | |
Manila Electric Company | | | 11,350 | | | | 60,503 | | |
See notes to financial statements.
93
Victory Portfolios II
VictoryShares Emerging Market Volatility Wtd ETF | | Schedule of Investments — continued
December 31, 2016 | |
(Unaudited)
Security Description | | Shares | | Value | |
Philippines (4.6%) cont'd | |
Metro Pacific Investments Corporation | | | 362,500 | | | $ | 48,564 | | |
Metropolitan Bank & Trust Company | | | 28,880 | | | | 42,176 | | |
Puregold Price Club, Inc. | | | 57,800 | | | | 45,345 | | |
Robinsons Retail Holdings, Inc. | | | 31,470 | | | | 47,003 | | |
Semirara Mining & Power Corporation | | | 22,510 | | | | 58,865 | | |
SM Investments Corporation | | | 3,587 | | | | 47,262 | | |
SM Prime Holdings, Inc. | | | 85,700 | | | | 48,873 | | |
Universal Robina Corporation | | | 15,740 | | | | 51,768 | | |
| | | | 1,121,537 | | |
Poland (1.1%): | |
Bank Pekao SA | | | 1,534 | | | | 46,115 | | |
Bank Zachodni WBK SA | | | 478 | | | | 36,096 | | |
Cyfrowy Polsat SA (a) | | | 7,791 | | | | 45,800 | | |
mBank SA (a) | | | 399 | | | | 31,966 | | |
Powszechna Kasa Oszczednosci Bank Polski SA (a) | | | 6,237 | | | | 41,941 | | |
Powszechny Zaklad Ubezpieczen SA | | | 7,193 | | | | 57,085 | | |
| | | | 259,003 | | |
Qatar (2.4%): | |
Ezdan Holding Group QSC | | | 8,408 | | | | 34,889 | | |
Industries Qatar QSC | | | 1,826 | | | | 58,921 | | |
Masraf Al Rayan QSC | | | 5,639 | | | | 58,227 | | |
Ooredoo QSC | | | 1,846 | | | | 51,607 | | |
Qatar Electricity & Water Company QSC | | | 1,064 | | | | 66,328 | | |
Qatar Fuel QSC | | | 1,244 | | | | 49,673 | | |
Qatar Gas Transport Company Ltd. | | | 8,248 | | | | 52,300 | | |
Qatar Insurance Company SAQ | | | 1,967 | | | | 45,807 | | |
Qatar Islamic Bank SAQ | | | 1,605 | | | | 45,795 | | |
Qatar National Bank SAQ | | | 1,646 | | | | 73,635 | | |
The Commercial Bank QSC | | | 4,395 | | | | 39,226 | | |
| | | | 576,408 | | |
Republic of Korea (9.5%): | |
Amorepacific Corporation | | | 139 | | | | 37,000 | | |
AMOREPACIFIC Group | | | 279 | | | | 30,723 | | |
BGF Retail Company Ltd. | | | 320 | | | | 21,672 | | |
Celltrion, Inc. (a) | | | 334 | | | | 29,691 | | |
CJ CheilJedang Corporation | | | 179 | | | | 52,983 | | |
CJ Corporation | | | 239 | | | | 37,004 | | |
CJ Korea Express Corporation (a) | | | 259 | | | | 38,385 | | |
Coway Compan Ltd. | | | 517 | | | | 37,797 | | |
Daelim Industrial Company Ltd. | | | 517 | | | | 37,283 | | |
Dongbu Insurance Company Ltd. | | | 756 | | | | 39,121 | | |
Dongsuh Companies, Inc. | | | 1,871 | | | | 42,678 | | |
GS Holdings Corporation | | | 1,174 | | | | 52,586 | | |
GS Retail Company Ltd. | | | 876 | | | | 34,524 | | |
Hankook Tire Company Ltd. | | | 796 | | | | 38,225 | | |
Hanon Systems | | | 3,165 | | | | 26,991 | | |
Hanssem Company Ltd. | | | 279 | | | | 45,969 | | |
Hanwha Chemical Corporation | | | 1,652 | | | | 33,784 | | |
See notes to financial statements.
94
Victory Portfolios II
VictoryShares Emerging Market Volatility Wtd ETF | | Schedule of Investments — continued
December 31, 2016 | |
(Unaudited)
Security Description | | Shares | | Value | |
Republic of Korea (9.5%) cont'd | |
Hanwha Techwin Company Ltd. | | | 756 | | | $ | 27,197 | | |
Hyundai Department Store Company Ltd. | | | 517 | | | | 46,657 | | |
Hyundai Development Co-Engineering & Construction | | | 776 | | | | 28,880 | | |
Hyundai Engineering & Construction Company Ltd. | | | 1,015 | | | | 35,968 | | |
Hyundai Glovis Company Ltd. | | | 299 | | | | 38,248 | | |
Hyundai Mobis Company Ltd. | | | 199 | | | | 43,497 | | |
Hyundai Motor Company | | | 458 | | | | 55,363 | | |
Hyundai Steel Company | | | 776 | | | | 36,622 | | |
Hyundai Wia Corporation | | | 478 | | | | 28,890 | | |
Industrial Bank of Korea | | | 4,856 | | | | 51,061 | | |
Kakao Corporation | | | 716 | | | | 45,647 | | |
Kangwon Land, Inc. | | | 1,513 | | | | 44,784 | | |
KB Financial Group, Inc. | | | 1,453 | | | | 51,489 | | |
KEPCO Plant Service & Engineering Company Ltd. | | | 577 | | | | 25,893 | | |
Kia Motors Corporation | | | 1,453 | | | | 47,218 | | |
Korea Aerospace Industries Ltd. | | | 577 | | | | 32,008 | | |
Korea Electric Power Corporation | | | 1,174 | | | | 42,817 | | |
Korea Zinc Company Ltd. | | | 119 | | | | 46,800 | | |
KT&G Corporation | | | 458 | | | | 38,299 | | |
LG Chemical Ltd. | | | 179 | | | | 38,681 | | |
LG Corporation | | | 856 | | | | 42,524 | | |
LG Household & Health Care Ltd. | | | 40 | | | | 28,382 | | |
LG Uplus Corporation | | | 4,996 | | | | 47,362 | | |
Lotte Chemical Corporation | | | 159 | | | | 48,577 | | |
Mando Corporation | | | 179 | | | | 34,754 | | |
Medy-Tox, Inc. | | | 80 | | | | 23,620 | | |
NAVER Corporation | | | 60 | | | | 38,500 | | |
NCSoft Corporation | | | 179 | | | | 36,680 | | |
Orion Corp/Republic of Korea | | | 60 | | | | 32,538 | | |
S-1 Corporation | | | 458 | | | | 33,256 | | |
Samsung Card Company Ltd. | | | 916 | | | | 30,109 | | |
Samsung Electronics Company Ltd. | | | 40 | | | | 59,679 | | |
Samsung Fire & Marine Insurance Company Ltd. | | | 199 | | | | 44,239 | | |
Samsung Life Insurance Company Ltd. | | | 478 | | | | 44,523 | | |
Samsung SDS Company Ltd. | | | 259 | | | | 29,914 | | |
Shinhan Financial Group Company Ltd. | | | 1,632 | | | | 61,142 | | |
| SK Holdings Co Ltd | | | 239 | | | | 45,413 | | |
SK Hynix, Inc. | | | 1,294 | | | | 47,890 | | |
SK Telecom Company Ltd. | | | 299 | | | | 55,453 | | |
Woori Bank | | | 5,851 | | | | 61,765 | | |
Yuhan Corporation | | | 167 | | | | 27,576 | | |
| | | | 2,316,331 | | |
Russian Federation (3.0%): | |
Bashneft PJSC | | | 956 | | | | 55,923 | | |
Federal Grid Co Unified Energy System PJSC | | | 12,950,000 | | | | 42,896 | | |
Inter RAO UES PJSC | | | 776,000 | | | | 48,626 | | |
Magnit PJSC | | | 279 | | | | 50,029 | | |
MegaFon PJSC | | | 5,380 | | | | 50,831 | | |
MMC Norilsk Nickel PJSC | | | 379 | | | | 62,535 | | |
See notes to financial statements.
95
Victory Portfolios II
VictoryShares Emerging Market Volatility Wtd ETF | | Schedule of Investments — continued
December 31, 2016 | |
(Unaudited)
Security Description | | Shares | | Value | |
Russian Federation (3.0%) cont'd | |
Mobile TeleSytems PJSC | | | 15,360 | | | $ | 64,850 | | |
Moscow Exchange MICEX-RTS PJSC | | | 26,100 | | | | 53,434 | | |
Novolipetsk Steel PJSC | | | 34,250 | | | | 64,195 | | |
Rosseti PJSC | | | 2,431,000 | | | | 45,331 | | |
Rostelecom PJSC | | | 49,010 | | | | 67,110 | | |
RusHydro PJSC | | | 3,985,000 | | | | 60,147 | | |
Tatneft PAO | | | 8,770 | | | | 61,045 | | |
| | | | 726,952 | | |
South Africa (5.5%): | |
Aspen Pharmacare Holdings Ltd. | | | 1,793 | | | | 37,023 | | |
Barclays Africa Group Ltd. | | | 3,587 | | | | 44,059 | | |
Capitec Bank Holdings, Ltd. | | | 1,136 | | | | 57,488 | | |
Discovery Ltd. | | | 4,782 | | | | 39,868 | | |
FirstRand Ltd. | | | 11,677 | | | | 45,207 | | |
Imperial Holdings Ltd. | | | 2,292 | | | | 30,447 | | |
Investec Ltd. | | | 7,094 | | | | 46,876 | | |
Life Healthcare Group Holdings Ltd. | | | 22,159 | | | | 52,599 | | |
Mondi Ltd. | | | 2,610 | | | | 53,210 | | |
Mr Price Group Ltd. | | | 2,531 | | | | 29,403 | | |
Naspers Ltd. — Class N | | | 259 | | | | 37,983 | | |
Nedbank Group Ltd. | | | 2,989 | | | | 51,826 | | |
Netcare Ltd. | | | 22,099 | | | | 51,234 | | |
Pick n Pay Stores Ltd | | | 9,266 | | | | 42,991 | | |
Pioneer Food Group Ltd. | | | 3,487 | | | | 39,093 | | |
Rand Merchant Investment Holdings Ltd. | | | 15,981 | | | | 46,312 | | |
Remgro Ltd. | | | 2,869 | | | | 46,595 | | |
RMB Holdings Ltd. | | | 9,684 | | | | 46,820 | | |
Sanlam Ltd. | | | 8,150 | | | | 37,327 | | |
Sappi Ltd. | | | 7,313 | | | | 47,897 | | |
Sasol Ltd. | | | 1,455 | | | | 42,261 | | |
Shoprite Holdings Ltd. | | | 3,388 | | | | 42,298 | | |
Sibanye Gold Ltd. | | | 6,018 | | | | 11,126 | | |
SPAR Group Ltd. | | | 3,447 | | | | 49,841 | | |
Standard Bank Group Ltd. | | | 4,045 | | | | 44,695 | | |
The Bidvest Group Ltd. | | | 4,384 | | | | 57,857 | | |
Tiger Brands Ltd. | | | 1,754 | | | | 50,809 | | |
Truworths International Ltd. | | | 7,114 | | | | 41,269 | | |
Vodacom Group Ltd. | | | 7,791 | | | | 86,455 | | |
Woolworths Holdings Ltd. | | | 7,473 | | | | 38,644 | | |
| | | | 1,349,513 | | |
Taiwan (11.8%): | |
Advanced Semiconductor Engineering, Inc. | | | 40,000 | | | | 41,019 | | |
Asia Cement Corporation | | | 60,000 | | | | 49,055 | | |
Cathay Financial Holding Company Ltd. | | | 20,000 | | | | 29,911 | | |
Chang Hwa Commercial Bank Ltd. | | | 159,600 | | | | 84,928 | | |
Cheng Shin Rubber Industry Company Ltd. | | | 20,000 | | | | 37,730 | | |
China Development Financial Holding Corporation | | | 259,000 | | | | 64,772 | | |
Chunghwa Telecom Company Ltd. | | | 40,000 | | | | 125,974 | | |
Compal Electronics, Inc. | | | 139,000 | | | | 79,573 | | |
See notes to financial statements.
96
Victory Portfolios II
VictoryShares Emerging Market Volatility Wtd ETF | | Schedule of Investments — continued
December 31, 2016 | |
(Unaudited)
Security Description | | Shares | | Value | |
Taiwan (11.8%) cont'd | |
CTBC Financial Holding Company Ltd. | | | 119,800 | | | $ | 65,608 | | |
Delta Electronics, Inc. | | | 20,000 | | | | 98,979 | | |
E.Sun Financial Holdings Company Ltd. | | | 120,000 | | | | 68,324 | | |
Far Eastern New Century Corporation | | | 60,000 | | | | 45,053 | | |
Far EasTone Telecommunications Company Ltd. | | | 40,000 | | | | 89,981 | | |
Feng TAY Enterprise Company Ltd. | | | 20,000 | | | | 74,777 | | |
First Financial Holding Company Company Ltd. | | | 199,445 | | | | 106,440 | | |
Formosa Chemicals & Fibre Corporation | | | 20,000 | | | | 59,760 | | |
Formosa Petrochemical Corporation | | | 20,000 | | | | 69,503 | | |
Formosa Plastics Corporation | | | 40,000 | | | | 110,708 | | |
Foxconn Technology Company Ltd. | | | 20,100 | | | | 53,198 | | |
Fubon Financial Holding Company Ltd. | | | 40,000 | | | | 63,297 | | |
Giant Manufacturing Company Ltd. | | | 20,000 | | | | 113,562 | | |
Hon Hai Precision Industry Company Ltd. | | | 40,000 | | | | 104,502 | | |
Hua Nan Financial Holdings Company Ltd. | | | 178,960 | | | | 90,232 | | |
Inventec Corporation | | | 80,000 | | | | 54,857 | | |
Lite-On Technology Corporation | | | 60,150 | | | | 90,703 | | |
Mega Financial Holding Company Ltd. | | | 100,000 | | | | 71,364 | | |
Nan Ya Plastics Corporation | | | 40,000 | | | | 88,368 | | |
Nanya Technology Corporation | | | 40,000 | | | | 59,946 | | |
Pegatron Corporation | | | 20,000 | | | | 47,783 | | |
Pou Chen Corporation | | | 40,000 | | | | 49,893 | | |
Quanta Computer, Inc. | | | 20,000 | | | | 37,420 | | |
Standard Foods Corporation | | | 100 | | | | 238 | | |
Taishin Financial Holding Comapny Ltd. | | | 179,000 | | | | 65,537 | | |
Taiwan Cement Corporation | | | 40,000 | | | | 43,625 | | |
Taiwan Cooperative Financial Holding Company Ltd. | | | 239,370 | | | | 104,352 | | |
Taiwan Mobile Company Ltd. | | | 20,000 | | | | 64,538 | | |
Taiwan Semicon Manufacturing Company Ltd. | | | 20,000 | | | | 112,631 | | |
Uni-President Enterprises Corporation | | | 40,000 | | | | 66,276 | | |
United Microelectronics Corporation | | | 199,000 | | | | 70,390 | | |
Vanguard International Semiconductor Corporation | | | 40,000 | | | | 69,751 | | |
Yuanta Financial Holding Company Ltd. | | | 159,000 | | | | 59,201 | | |
| | | | 2,883,759 | | |
Thailand (5.6%): | |
Advanced Info Service PCL | | | 8,000 | | | | 32,840 | | |
Airports of Thailand PCL | | | 6,000 | | | | 66,684 | | |
Bangkok Bank PCL | | | 12,000 | | | | 53,448 | | |
Bangkok Dusit Medical Services PCL | | | 123,500 | | | | 79,665 | | |
Berli Jucker PCL | | | 27,900 | | | | 39,150 | | |
BTS Group Holdings PCL | | | 298,800 | | | | 71,341 | | |
Bumrungrad Hospital PCL | | | 12,000 | | | | 60,653 | | |
Central Pattana PCL | | | 33,900 | | | | 53,722 | | |
Charoen Pokphand Foods PCL | | | 41,800 | | | | 34,434 | | |
| CP ALL PCL | | | 29,900 | | | | 52,184 | | |
Delta Electronics Thailand PCL | | | 21,900 | | | | 49,842 | | |
Energy Absolute PCL | | | 73,700 | | | | 61,227 | | |
Glow Energy PCL | | | 25,900 | | | | 57,137 | | |
Home Product Center PCL | | | 189,300 | | | | 53,919 | | |
Indorama Ventures PCL | | | 39,800 | | | | 37,232 | | |
See notes to financial statements.
97
Victory Portfolios II
VictoryShares Emerging Market Volatility Wtd ETF | | Schedule of Investments — continued
December 31, 2016 | |
(Unaudited)
Security Description | | Shares | | Value | |
Thailand (5.6%) cont'd | |
Intouch Holdings PCL | | | 25,900 | | | $ | 35,982 | | |
IRPC PCL | | | 430,300 | | | | 57,677 | | |
Kasikornbank PCL | | | 10,000 | | | | 49,566 | | |
Krung Thai Bank PCL | | | 121,500 | | | | 60,054 | | |
Minor International PCL | | | 47,800 | | | | 47,719 | | |
PTT Global Chemical PCL | | | 21,900 | | | | 38,528 | | |
Ratchaburi Electricity Generating Holding PCL | | | 57,800 | | | | 80,703 | | |
Siam Cement PCL | | | 4,000 | | | | 55,403 | | |
Siam Commercial Bank PCL | | | 12,000 | | | | 51,102 | | |
Thai Union Group PCL | | | 91,600 | | | | 53,716 | | |
Total Access Communication PCL | | | 29,900 | | | | 31,519 | | |
True Corporation PCL | | | 91 | | | | 18 | | |
| | | | 1,365,465 | | |
Turkey (3.2%): | |
Akbank TAS | | | 16,779 | | | | 37,203 | | |
Arcelik AS | | | 5,899 | | | | 35,459 | | |
BIM Birlesik Magazalar AS | | | 3,109 | | | | 43,194 | | |
Coca-Cola Icecek AS | | | 2,949 | | | | 27,676 | | |
Enka Insaat ve Sanayi AS | | | 32,405 | | | | 49,430 | | |
Eregli Demir ve Celik Fabrikalari TAS | | | 25,746 | | | | 37,521 | | |
Ford Otomotiv Sanayi AS | | | 4,165 | | | | 36,113 | | |
Haci Omer Sabanci Holding AS | | | 15,264 | | | | 39,600 | | |
KOC Holding AS | | | 11,240 | | | | 43,980 | | |
Petkim Petrokimya Holding AS | | | 33,560 | | | | 35,207 | | |
Tofas Turk Otomobil Fabrikasi AS | | | 5,540 | | | | 38,704 | | |
Tupras Turkiye Petrol Rafinerileri AS | | | 2,471 | | | | 49,569 | | |
Turkcell Iletisim Hizmetleri AS (a) | | | 16,182 | | | | 44,735 | | |
Turkiye Garanti Bankasi AS | | | 17,537 | | | | 37,889 | | |
Turkiye Halk Bankasi AS | | | 13,512 | | | | 35,783 | | |
Turkiye Is Bankasi | | | 31,326 | | | | 46,009 | | |
Turkiye Sise ve Cam Fabrikalari AS | | | 42,030 | | | | 45,642 | | |
Turkiye Vakiflar Bankasi TAO | | | 28,239 | | | | 34,829 | | |
Ulker Biskuvi Sanayi AS | | | 6,377 | | | | 29,219 | | |
Yapi ve Kredi Bankasi AS (a) | | | 37,284 | | | | 36,260 | | |
| | | | 784,022 | | |
United Arab Emirates (1.8%): | |
Abu Dhabi Commercial Bank | | | 23,760 | | | | 44,636 | | |
Aldar Properties PJSC | | | 65,883 | | | | 47,176 | | |
DAMAC Properties Dubai Company PJSC | | | 72,626 | | | | 50,027 | | |
DP World Ltd. | | | 2,609 | | | | 45,683 | | |
Dubai Islamic Bank PJSC | | | 36,343 | | | | 55,115 | | |
Emaar Malls PJSC | | | 59,260 | | | | 42,272 | | |
Emaar Properties PJSC | | | 23,746 | | | | 46,097 | | |
Emirates Telecommunications Group Company PJSC | | | 15,232 | | | | 77,966 | | |
National Bank of Abu Dhabi PJSC | | | 15,917 | | | | 43,293 | | |
| | | | 452,265 | | |
Total Common Stocks (Cost $25,443,539) | | | 24,300,763 | | |
See notes to financial statements.
98
Victory Portfolios II
VictoryShares Emerging Market Volatility Wtd ETF | | Schedule of Investments — continued
December 31, 2016 | |
(Unaudited)
Security Description | | Shares | | Value | |
Rights (0.0%) (d) | |
Russian Federation (0.0%): (d) | |
Rosseti PJSC — Rights (c) | | | 40,687 | | | $ | 68 | | |
Qatar (0.0%): (d) | |
The Commercial Bank QSC — Rights (c) | | | 799 | | | | 1,536 | | |
Total Rights (Cost $1,761) | | | 1,604 | | |
Total Investments — 99.5% (Cost $25,445,300) | | | 24,302,367 | | |
Other assets in excess of liabilities — 0.5% | | | 115,809 | | |
NET ASSETS — 100.0% | | $ | 24,418,176 | | |
(a) Non-income producing security.
(b) Restricted securities as defined in Rule 144(a) and Regulation S under the Securities Act of 1933. Such securities are treated as liquid securities according to the Fund's liquidity guidlelines. The value of these securities total $259,494 or 1.06% of net assets.
(c) As of December 31, 2016, the Fund has fair valued these securities. The value of these securities total $37,867 or 0.16% of net assets.
(d) Less than 0.05%.
See notes to financial statements.
99
Victory Portfolios II
VictoryShares US Large Cap High Div Volatility Wtd ETF | | Schedule of Investments
December 31, 2016 | |
(Unaudited)
Security Description | | Shares | | Value | |
Common Stocks (99.6%) | |
Aerospace & Defense (1.6%): | |
Lockheed Martin Corporation | | | 4,958 | | | $ | 1,239,202 | | |
Air Freight & Logistics (1.7%): | |
United Parcel Service, Inc. — Class B | | | 11,660 | | | | 1,336,702 | | |
Automobiles (1.7%): | |
Ford Motor Company | | | 48,096 | | | | 583,404 | | |
General Motors Company | | | 22,014 | | | | 766,968 | | |
| | | | 1,350,372 | | |
Banks (5.6%): | |
BB&T Corporation | | | 18,157 | | | | 853,742 | | |
Cullen/Frost Bankers, Inc. | | | 6,316 | | | | 557,261 | | |
Huntington Bancshares, Inc. | | | 52,853 | | | | 698,717 | | |
PacWest Bancorp | | | 11,690 | | | | 636,404 | | |
People's United Financial, Inc. | | | 43,326 | | | | 838,791 | | |
Wells Fargo & Company | | | 15,165 | | | | 835,743 | | |
| | | | 4,420,658 | | |
Beverages (1.5%): | |
The Coca-Cola Company | | | 27,939 | | | | 1,158,351 | | |
Biotechnology (0.8%): | |
AbbVie, Inc. | | | 9,548 | | | | 597,896 | | |
Capital Markets (3.5%): | |
Ameriprise Financial, Inc. | | | 5,296 | | | | 587,538 | | |
CME Group, Inc. | | | 8,053 | | | | 928,914 | | |
Invesco Ltd. | | | 14,745 | | | | 447,363 | | |
T. Rowe Price Group, Inc. | | | 10,667 | | | | 802,798 | | |
| | | | 2,766,613 | | |
Chemicals (2.7%): | |
CF Industries Holdings, Inc. | | | 12,506 | | | | 393,689 | | |
Huntsman Corporation | | | 18,784 | | | | 358,399 | | |
LyondellBasell Industries NV — Class A | | | 6,716 | | | | 576,098 | | |
The Dow Chemical Company | | | 14,038 | | | | 803,254 | | |
| | | | 2,131,440 | | |
Communications Equipment (0.9%): | |
Cisco Systems, Inc. | | | 22,758 | | | | 687,747 | | |
Consumer Finance (0.6%): | |
Navient Corporation | | | 27,504 | | | | 451,891 | | |
Containers & Packaging (2.7%): | |
International Paper Company | | | 12,422 | | | | 659,111 | | |
Packaging Corporation of America | | | 6,663 | | | | 565,156 | | |
Sonoco Products Company | | | 16,323 | | | | 860,222 | | |
| | | | 2,084,489 | | |
Diversified Telecommunication Services (3.8%): | |
AT&T, Inc. | | | 32,414 | | | | 1,378,568 | | |
CenturyLink, Inc. | | | 19,959 | | | | 474,625 | | |
See notes to financial statements.
100
Victory Portfolios II
VictoryShares US Large Cap High Div Volatility Wtd ETF | | Schedule of Investments — continued
December 31, 2016 | |
(Unaudited)
Security Description | | Shares | | Value | |
Diversified Telecommunication Services (3.8%) cont'd | |
Verizon Communications, Inc. | | | 20,448 | | | $ | 1,091,514 | | |
| | | | 2,944,707 | | |
Electric Utilities (13.9%): | |
Alliant Energy Corporation | | | 25,999 | | | | 985,102 | | |
American Electric Power Company, Inc. | | | 15,559 | | | | 979,595 | | |
Duke Energy Corporation | | | 13,042 | | | | 1,012,320 | | |
Eversource Energy | | | 19,415 | | | | 1,072,291 | | |
Exelon Corporation | | | 24,616 | | | | 873,622 | | |
OGE Energy Corporation | | | 24,229 | | | | 810,460 | | |
PG&E Corporation | | | 17,186 | | | | 1,044,393 | | |
Pinnacle West Capital Corporation | | | 13,538 | | | | 1,056,370 | | |
PPL Corporation | | | 27,589 | | | | 939,405 | | |
Southern Company | | | 22,461 | | | | 1,104,857 | | |
Xcel Energy, Inc. | | | 25,812 | | | | 1,050,548 | | |
| | | | 10,928,963 | | |
Electrical Equipment (1.9%): | |
Eaton Corporation PLC | | | 10,351 | | | | 694,449 | | |
Emerson Electric Company | | | 13,807 | | | | 769,740 | | |
| | | | 1,464,189 | | |
Food & Staples Retailing (1.0%): | |
Wal-Mart Stores, Inc. | | | 11,843 | | | | 818,588 | | |
Food Products (1.3%): | |
Archer-Daniels-Midland Company | | | 13,092 | | | | 597,650 | | |
Pilgrim's Pride Corporation | | | 23,224 | | | | 441,024 | | |
| | | | 1,038,674 | | |
Hotels, Restaurants & Leisure (4.1%): | |
Carnival Corporation | | | 12,985 | | | | 675,999 | | |
Darden Restaurants, Inc. | | | 12,977 | | | | 943,688 | | |
Las Vegas Sands Corporation | | | 8,613 | | | | 460,020 | | |
McDonald's Corporation | | | 9,122 | | | | 1,110,330 | | |
| | | | 3,190,037 | | |
Household Products (2.8%): | |
Kimberly-Clark Corporation | | | 8,454 | | | | 964,771 | | |
Procter & Gamble Company | | | 14,704 | | | | 1,236,312 | | |
| | | | 2,201,083 | | |
Insurance (10.5%): | |
American Financial Group, Inc. | | | 13,654 | | | | 1,203,190 | | |
Arthur J Gallagher & Company | | | 19,066 | | | | 990,669 | | |
Cincinnati Financial Corporation | | | 13,446 | | | | 1,018,535 | | |
Erie Indemnity Company — Class A | | | 8,568 | | | | 963,472 | | |
MetLife, Inc. | | | 10,951 | | | | 590,149 | | |
Old Republic International Corporation | | | 54,613 | | | | 1,037,647 | | |
Principal Financial Group, Inc. | | | 10,820 | | | | 626,045 | | |
Progressive Corporation | | | 31,684 | | | | 1,124,782 | | |
Prudential Financial, Inc. | | | 6,696 | | | | 696,786 | | |
| | | | 8,251,275 | | |
See notes to financial statements.
101
Victory Portfolios II
VictoryShares US Large Cap High Div Volatility Wtd ETF | | Schedule of Investments — continued
December 31, 2016 | |
(Unaudited)
Security Description | | Shares | | Value | |
IT Services (3.7%): | |
International Business Machines Corporation | | | 4,983 | | | $ | 827,128 | | |
Leidos Holdings, Inc. | | | 8,735 | | | | 446,708 | | |
Paychex, Inc. | | | 14,767 | | | | 899,015 | | |
The Western Union Company | | | 33,829 | | | | 734,766 | | |
| | | | 2,907,617 | | |
Machinery (1.9%): | |
Cummins, Inc. | | | 5,338 | | | | 729,544 | | |
Deere & Company | | | 7,315 | | | | 753,738 | | |
| | | | 1,483,282 | | |
Media (1.9%): | |
Cinemark Holdings, Inc. | | | 17,278 | | | | 662,784 | | |
TEGNA, Inc. | | | 26,690 | | | | 570,899 | | |
Viacom, Inc. | | | 8,502 | | | | 298,420 | | |
| | | | 1,532,103 | | |
Multiline Retail (2.5%): | |
Kohl's Corporation | | | 8,500 | | | | 419,730 | | |
Macy's, Inc. | | | 11,535 | | | | 413,068 | | |
Nordstrom, Inc. | | | 8,527 | | | | 408,699 | | |
Target Corporation | | | 10,264 | | | | 741,369 | | |
| | | | 1,982,866 | | |
Multi-Utilities (9.4%): | |
Ameren Corporation | | | 20,764 | | | | 1,089,279 | | |
Consolidated Edison, Inc. | | | 13,436 | | | | 989,964 | | |
Dominion Resources, Inc. | | | 14,467 | | | | 1,108,028 | | |
DTE Energy Company | | | 11,232 | | | | 1,106,464 | | |
Public Service Enterprise Group, Inc. | | | 23,551 | | | | 1,033,418 | | |
SCANA Corporation | | | 14,663 | | | | 1,074,505 | | |
WEC Energy Group, Inc. | | | 16,875 | | | | 989,719 | | |
| | | | 7,391,377 | | |
Oil, Gas & Consumable Fuels (4.1%): | |
Exxon Mobil Corporation | | | 9,550 | | | | 861,983 | | |
Marathon Petroleum Corporation | | | 8,497 | | | | 427,824 | | |
ONEOK, Inc. | | | 6,701 | | | | 384,705 | | |
Phillips 66 | | | 8,120 | | | | 701,649 | | |
Plains GP Holdings LP | | | 7,128 | | | | 247,199 | | |
Valero Energy Corporation | | | 8,563 | | | | 585,024 | | |
| | | | 3,208,384 | | |
Pharmaceuticals (2.2%): | |
Merck & Company, Inc. | | | 13,398 | | | | 788,740 | | |
Pfizer, Inc. | | | 28,380 | | | | 921,783 | | |
| | | | 1,710,523 | | |
Semiconductors & Semiconductor Equipment (1.7%): | |
Intel Corporation | | | 19,982 | | | | 724,747 | | |
QUALCOMM, Inc. | | | 9,459 | | | | 616,727 | | |
| | | | 1,341,474 | | |
See notes to financial statements.
102
Victory Portfolios II
VictoryShares US Large Cap High Div Volatility Wtd ETF | | Schedule of Investments — continued
December 31, 2016 | |
(Unaudited)
Security Description | | Shares | | Value | |
Software (1.6%): | |
CA, Inc. | | | 24,582 | | | $ | 780,970 | | |
Symantec Corporation | | | 19,452 | | | | 464,708 | | |
| | | | 1,245,678 | | |
Specialty Retail (1.7%): | |
Best Buy Company, Inc. | | | 11,406 | | | | 486,694 | | |
L Brands, Inc. | | | 7,364 | | | | 484,846 | | |
The Gap, Inc. | | | 16,403 | | | | 368,083 | | |
| | | | 1,339,623 | | |
Technology Hardware, Storage & Peripherals (0.7%): | |
HP, Inc. | | | 35,510 | | | | 526,968 | | |
Textiles, Apparel & Luxury Goods (0.7%): | |
Coach, Inc. | | | 14,757 | | | | 516,790 | | |
Tobacco (4.2%): | |
Altria Group, Inc. | | | 18,186 | | | | 1,229,737 | | |
Philip Morris International, Inc. | | | 11,306 | | | | 1,034,386 | | |
Reynolds American, Inc. | | | 18,659 | | | | 1,045,651 | | |
| | | | 3,309,774 | | |
Transportation Infrastructure (0.7%): | |
Macquarie Infrastructure Company LLC | | | 7,003 | | | | 572,145 | | |
Total Common Stocks (Cost $73,689,141) | | | 78,131,481 | | |
Short-Term Investments (0.2%) | |
Money Market Funds (0.2%): | |
Short-Term Investments Trust Government & Agency Portfolio —
Institutional Class, 0.43% (a) | | | 133,245 | | | | 133,245 | | |
Total Short-Term Investments (Cost $133,245) | | | 133,245 | | |
Total Investments — 99.8% (Cost $73,822,386) | | | 78,264,726 | | |
Other assets in excess of liabilities — 0.2% | | | 161,792 | | |
NET ASSETS — 100.0% | | $ | 78,426,518 | | |
(a) Annualized seven-day yield as of December 31, 2016.
The Global Industry Classification Standard (GICS®) was developed by and/or is the exclusive property of MSCI, Inc. and Standard & Poor's Financial Services LLC ("S&P"). GICS® is a service mark of MSCI, Inc. and S&P and has been licensed for use by the Fund's Administrator, U.S. Bancorp Fund Services, LLC.
Schedule of Open Futures Contracts
Number of
Contracts
Purchased | | Description | | Notional Value | | Unrealized
Depreciation | |
| | 1 | | | S&P 500 E-Mini Future, March 2017 | | $ | 111,810 | | | $ | (1,019 | ) | |
| | | $ | (1,019 | ) | |
See notes to financial statements.
103
Victory Portfolios II
VictoryShares US Small Cap High Div Volatility Wtd ETF | | Schedule of Investments
December 31, 2016 | |
(Unaudited)
Security Description | | Shares | | Value | |
Common Stocks (99.4%) | |
Aerospace & Defense (1.3%): | |
National Presto Industries, Inc. | | | 2,756 | | | $ | 293,238 | | |
Airlines (0.9%): | |
Allegiant Travel Company | | | 1,270 | | | | 211,328 | | |
Auto Components (2.1%): | |
Metaldyne Performance Group, Inc. | | | 8,750 | | | | 200,812 | | |
Superior Industries International, Inc. | | | 6,733 | | | | 177,415 | | |
Visteon Corporation | | | 1,275 | | | | 102,434 | | |
| | | | 480,661 | | |
Banks (7.6%): | |
Columbia Banking System, Inc. | | | 6,703 | | | | 299,490 | | |
FNB Corporation | | | 17,588 | | | | 281,936 | | |
Glacier Bancorp, Inc. | | | 7,697 | | | | 278,862 | | |
Old National Bancorp | | | 16,892 | | | | 306,590 | | |
Park National Corporation | | | 2,340 | | | | 280,005 | | |
Valley National Bancorp | | | 24,724 | | | | 287,787 | | |
| | | | 1,734,670 | | |
Building Products (0.7%): | |
Insteel Industries, Inc. | | | 4,635 | | | | 165,191 | | |
Capital Markets (7.2%): | |
Artisan Partners Asset Management, Inc. — Class A | | | 6,219 | | | | 185,015 | | |
BGC Partners, Inc. — Class A | | | 30,458 | | | | 311,585 | | |
Cohen & Steers, Inc. | | | 5,186 | | | | 174,250 | | |
LPL Financial Holdings, Inc. | | | 2,892 | | | | 101,827 | | |
Moelis & Company — Class A | | | 7,220 | | | | 244,758 | | |
NorthStar Asset Management Group, Inc. | | | 11,282 | | | | 168,328 | | |
Virtu Financial, Inc. | | | 13,044 | | | | 208,052 | | |
Waddell & Reed Financial, Inc. — Class A | | | 6,877 | | | | 134,170 | | |
WisdomTree Investments, Inc. | | | 10,431 | | | | 116,201 | | |
| | | | 1,644,186 | | |
Chemicals (0.5%): | |
Rayonier Advanced Materials, Inc. | | | 7,285 | | | | 112,626 | | |
Commercial Services & Supplies (6.2%): | |
Knoll, Inc. | | | 8,401 | | | | 234,640 | | |
McGrath RentCorp | | | 6,978 | | | | 273,468 | | |
Mobile Mini, Inc. | | | 5,844 | | | | 176,781 | | |
MSA Safety, Inc. | | | 3,912 | | | | 271,219 | | |
Steelcase, Inc. — Class A | | | 14,919 | | | | 267,050 | | |
West Corporation | | | 7,757 | | | | 192,063 | | |
| | | | 1,415,221 | | |
Construction & Engineering (0.8%): | |
KBR, Inc. | | | 10,502 | | | | 175,278 | | |
Diversified Consumer Services (1.4%): | |
Capella Education Company | | | 3,608 | | | | 316,782 | | |
See notes to financial statements.
104
Victory Portfolios II
VictoryShares US Small Cap High Div Volatility Wtd ETF | | Schedule of Investments — continued
December 31, 2016 | |
(Unaudited)
Security Description | | Shares | | Value | |
Diversified Telecommunication Services (1.8%): | |
Cogent Communications Holdings, Inc. | | | 5,273 | | | $ | 218,039 | | |
Inteliquent, Inc. | | | 8,595 | | | | 196,997 | | |
| | | | 415,036 | | |
Electric Utilities (4.5%): | |
ALLETE, Inc. | | | 5,483 | | | | 351,954 | | |
MGE Energy, Inc. | | | 5,397 | | | | 352,424 | | |
Otter Tail Corporation | | | 8,303 | | | | 338,762 | | |
| | | | 1,043,140 | | |
Electronic Equipment, Instruments & Components (2.1%): | |
AVX Corporation | | | 19,826 | | | | 309,880 | | |
MTS Systems Corporation | | | 2,947 | | | | 167,095 | | |
| | | | 476,975 | | |
Energy Equipment & Services (1.1%): | |
Atwood Oceanics, Inc. | | | 8,253 | | | | 108,362 | | |
Oceaneering International, Inc. | | | 5,245 | | | | 147,961 | | |
| | | | 256,323 | | |
Food & Staples Retailing (1.3%): | |
Weis Markets, Inc. | | | 4,566 | | | | 305,191 | | |
Food Products (0.8%): | |
John B Sanfilippo & Son, Inc. | | | 2,610 | | | | 183,718 | | |
Health Care Equipment & Supplies (1.0%): | |
Meridian Bioscience, Inc. | | | 12,428 | | | | 219,976 | | |
Health Care Providers & Services (2.9%): | |
National HealthCare Corporation | | | 5,155 | | | | 390,697 | | |
Owens & Minor, Inc. | | | 7,474 | | | | 263,758 | | |
| | | | 654,455 | | |
Hotels, Restaurants & Leisure (6.1%): | |
Bob Evans Farms, Inc. | | | 5,944 | | | | 316,280 | | |
Brinker International, Inc. | | | 3,936 | | | | 194,950 | | |
DineEquity, Inc. | | | 3,264 | | | | 251,328 | | |
ILG, Inc | | | 10,666 | | | | 193,801 | | |
Wendy's Company | | | 20,626 | | | | 278,864 | | |
Wingstop, Inc. | | | 5,233 | | | | 154,845 | | |
| | | | 1,390,068 | | |
Household Durables (0.9%): | |
MDC Holdings, Inc. | | | 8,310 | | | | 213,232 | | |
Independent Power and Renewable Electricity Producers (0.7%): | |
8Point3 Energy Partners LP | | | 11,758 | | | | 152,619 | | |
Insurance (7.2%): | |
AMERISAFE, Inc. | | | 4,400 | | | | 274,340 | | |
FBL Financial Group, Inc. — Class A | | | 3,720 | | | | 290,718 | | |
Mercury General Corporation | | | 5,196 | | | | 312,851 | | |
ProAssurance Corporation | | | 6,892 | | | | 387,331 | | |
See notes to financial statements.
105
Victory Portfolios II
VictoryShares US Small Cap High Div Volatility Wtd ETF | | Schedule of Investments — continued
December 31, 2016 | |
(Unaudited)
Security Description | | Shares | | Value | |
Insurance (7.2%) cont'd | |
Safety Insurance Group, Inc. | | | 5,129 | | | $ | 378,007 | | |
| | | | 1,643,247 | | |
Internet & Catalog Retail (1.5%): | |
HSN, Inc. | | | 4,698 | | | | 161,142 | | |
Nutrisystem, Inc. | | | 5,008 | | | | 173,527 | | |
| | | | 334,669 | | |
Internet Software & Services (1.0%): | |
NIC, Inc. | | | 9,975 | | | | 238,403 | | |
Leisure Products (0.6%): | |
Sturm Ruger & Company, Inc. | | | 2,542 | | | | 133,963 | | |
Machinery (6.6%): | |
Altra Industrial Motion Corporation | | | 8,867 | | | | 327,192 | | |
American Railcar Industries, Inc. | | | 3,557 | | | | 161,097 | | |
Douglas Dynamics, Inc | | | 5,910 | | | | 198,872 | | |
Federal Signal Corporation | | | 10,784 | | | | 168,338 | | |
Greenbrier Companies, Inc. | | | 3,166 | | | | 131,547 | | |
Hillenbrand, Inc. | | | 8,425 | | | | 323,099 | | |
Hyster-Yale Materials Handling, Inc. | | | 3,248 | | | | 207,125 | | |
| | | | 1,517,270 | | |
Media (3.2%): | |
AMC Entertainment Holdings, Inc. | | | 5,879 | | | | 197,828 | | |
Gannett Company, Inc. | | | 14,724 | | | | 142,970 | | |
New Media Investment Group, Inc. | | | 10,640 | | | | 170,134 | | |
Sinclair Broadcast Group, Inc. — Class A | | | 6,487 | | | | 216,341 | | |
| | | | 727,273 | | |
Metals & Mining (1.1%): | |
Compass Minerals International, Inc. | | | 3,208 | | | | 251,347 | | |
Multi-Utilities (4.3%): | |
Avista Corporation | | | 8,191 | | | | 327,558 | | |
NorthWestern Corporation | | | 6,071 | | | | 345,258 | | |
Unitil Corporation | | | 6,854 | | | | 310,760 | | |
| | | | 983,576 | | |
Oil, Gas & Consumable Fuels (0.7%): | |
Western Refining, Inc. | | | 4,233 | | | | 160,219 | | |
Paper & Forest Products (2.8%): | |
Domtar Corporation | | | 4,899 | | | | 191,208 | | |
KapStone Paper & Packaging Corporation — Class A | | | 4,412 | | | | 97,285 | | |
PH Glatfelter Company | | | 6,139 | | | | 146,661 | | |
Schweitzer-Mauduit International, Inc. | | | 4,723 | | | | 215,038 | | |
| | | | 650,192 | | |
Professional Services (2.7%): | |
CEB, Inc. | | | 3,526 | | | | 213,676 | | |
Kforce, Inc. | | | 7,235 | | | | 167,128 | | |
Resources Connection, Inc. | | | 12,527 | | | | 241,145 | | |
| | | | 621,949 | | |
See notes to financial statements.
106
Victory Portfolios II
VictoryShares US Small Cap High Div Volatility Wtd ETF | | Schedule of Investments — continued
December 31, 2016 | |
(Unaudited)
Security Description | | Shares | | Value | |
Real Estate Management & Development (0.8%): | |
HFF, Inc. — Class A | | | 6,193 | | | $ | 187,338 | | |
Semiconductors & Semiconductor Equipment (2.1%): | |
Intersil Corporation | | | 8,290 | | | | 184,867 | | |
Tessera Holding Corporation | | | 6,510 | | | | 287,742 | | |
| | | | 472,609 | | |
Specialty Retail (3.0%): | |
DSW, Inc. — Class A | | | 6,652 | | | | 150,668 | | |
GameStop Corporation | | | 6,157 | | | | 155,526 | | |
GNC Holdings, Inc. | | | 4,378 | | | | 48,333 | | |
The Buckle, Inc. | | | 6,703 | | | | 152,829 | | |
The Cato Corporation — Class A | | | 5,767 | | | | 173,471 | | |
| | | | 680,827 | | |
Textiles, Apparel & Luxury Goods (0.9%): | |
Movado Group, Inc. | | | 7,060 | | | | 202,975 | | |
Thrifts & Mortgage Finance (2.1%): | |
Capitol Federal Financial, Inc. | | | 29,704 | | | | 488,928 | | |
Tobacco (1.6%): | |
Vector Group Ltd. | | | 16,389 | | | | 372,686 | | |
Trading Companies & Distributors (1.7%): | |
GATX Corporation | | | 3,793 | | | | 233,573 | | |
H&E Equipment Services, Inc. | | | 6,349 | | | | 147,614 | | |
| | | | 381,187 | | |
Water Utilities (3.6%): | |
American States Water Company | | | 5,462 | | | | 248,848 | | |
Connecticut Water Service, Inc. | | | 5,634 | | | | 314,659 | | |
Middlesex Water Company | | | 6,203 | | | | 266,357 | | |
| | | | 829,864 | | |
Total Common Stocks (Cost $19,692,565) | | | 22,738,436 | | |
Short-Term Investments (0.3%) | |
Money Market Funds (0.3%): | |
Short-Term Investments Trust Government & Agency Portfolio —
Institutional Class, 0.43% (a) | | | 61,539 | | | | 61,539 | | |
Total Short-Term Investments (Cost $61,539) | | | 61,539 | | |
Total Investments — 99.7% (Cost $19,754,104) | | | 22,799,975 | | |
Other assets in excess of liabilities — 0.3% | | | 68,568 | | |
NET ASSETS — 100.0% | | $ | 22,868,543 | | |
(a) Annualized seven-day yield as of December 31, 2016.
The Global Industry Classification Standard (GICS®) was developed by and/or is the exclusive property of MSCI, Inc. and Standard & Poor's Financial Services LLC ("S&P"). GICS® is a service mark of MSCI, Inc. and S&P and has been licensed for use by the Fund's Administrator, U.S. Bancorp Fund Services, LLC.
See notes to financial statements.
107
Victory Portfolios II
VictoryShares US Small Cap High Div Volatility Wtd ETF | | Schedule of Investments — continued
December 31, 2016 | |
(Unaudited)
Schedule of Open Futures Contracts
Number of
Contracts
Purchased | | Description | | Notional Value | | Unrealized
Depreciation | |
| | 1 | | | Russell 2000 Mini Future, March 2017 | | $ | 67,845 | | | $ | (44 | ) | |
| | | $ | (44 | ) | |
See notes to financial statements.
108
Victory Portfolios II
VictoryShares International High Div Volatility Wtd ETF | | Schedule of Investments
December 31, 2016 | |
(Unaudited)
Security Description | | Shares | | Value | |
Common Stocks (99.4%) | |
Australia (13.4%): | |
AMP Ltd. | | | 66,991 | | | $ | 243,655 | | |
Australia & New Zealand Banking Group Ltd. | | | 12,134 | | | | 266,373 | | |
Caltex Australia Ltd. | | | 10,509 | | | | 231,004 | | |
CIMIC Group Ltd. | | | 6,589 | | | | 166,138 | | |
Commonwealth Bank of Australia | | | 5,501 | | | | 327,152 | | |
Crown Resorts Ltd. | | | 22,807 | | | | 190,592 | | |
Insurance Australia Group Ltd. | | | 69,555 | | | | 300,665 | | |
Macquarie Group Ltd. | | | 3,593 | | | | 225,893 | | |
QBE Insurance Group Ltd. | | | 29,411 | | | | 263,608 | | |
Suncorp Group Ltd. | | | 31,722 | | | | 309,503 | | |
Telstra Corporation Ltd. | | | 95,761 | | | | 352,441 | | |
Westpac Banking Corporation | | | 11,508 | | | | 270,735 | | |
| | | | 3,147,759 | | |
Belgium (1.2%): | |
Proximus SADP | | | 9,739 | | | | 280,489 | | |
Canada (11.8%): | |
BCE, Inc. | | | 12,000 | | | | 518,646 | | |
Emera, Inc. (a) | | | 13,400 | | | | 453,004 | | |
IGM Financial, Inc. (a) | | | 10,500 | | | | 298,738 | | |
Inter Pipeline Ltd. (a) | | | 10,500 | | | | 231,795 | | |
Pembina Pipeline Corporation (a) | | | 9,000 | | | | 281,265 | | |
Potash Corporation of Saskatchewan, Inc. (a) | | | 9,000 | | | | 162,820 | | |
Shaw Communications, Inc. — Class B (a) | | | 17,900 | | | | 359,160 | | |
TELUS Corporation | | | 14,900 | | | | 474,416 | | |
| | | | 2,779,844 | | |
Finland (2.9%): | |
Sampo Oyj — Class A | | | 5,467 | | | | 245,100 | | |
Stora Enso Oyj — Class R | | | 19,523 | | | | 209,825 | | |
UPM-Kymmene Oyj | | | 8,753 | | | | 215,052 | | |
| | | | 669,977 | | |
France (7.3%): | |
AXA SA | | | 7,364 | | | | 185,926 | | |
Credit Agricole SA | | | 15,400 | | | | 190,964 | | |
Natixis SA | | | 30,262 | | | | 170,745 | | |
Orange SA | | | 15,475 | | | | 235,143 | | |
Sanofi | | | 3,510 | | | | 284,131 | | |
Societe BIC SA | | | 1,778 | | | | 241,720 | | |
Societe Generale SA | | | 3,495 | | | | 171,976 | | |
Suez | | | 16,177 | | | | 238,658 | | |
| | | | 1,719,263 | | |
Germany (4.0%): | |
BASF SE | | | 3,137 | | | | 291,615 | | |
Bayerische Motoren Werk AG | | | 2,255 | | | | 210,669 | | |
Daimler AG | | | 2,943 | | | | 219,088 | | |
See notes to financial statements.
109
Victory Portfolios II
VictoryShares International High Div Volatility Wtd ETF | | Schedule of Investments — continued
December 31, 2016 | |
(Unaudited)
Security Description | | Shares | | Value | |
Germany (4.0%) cont'd | |
ProSiebenSat.1 Media SE | | | 5,796 | | | $ | 223,364 | | |
| | | | 944,736 | | |
Hong Kong (5.8%): | |
China Resources Beer Holdings Company Ltd. (a) | | | 60,000 | | | | 119,157 | | |
China Resources Power Holdings Company Ltd. | | | 120,000 | | | | 190,651 | | |
Chow Tai Fook Jewellery Group Ltd. | | | 233,000 | | | | 178,179 | | |
Hang Seng Bank Ltd. | | | 17,900 | | | | 333,093 | | |
MTR Corporation Ltd. | | | 60,000 | | | | 291,701 | | |
NWS Holdings Ltd. | | | 149,000 | | | | 242,873 | | |
| | | | 1,355,654 | | |
Italy (5.1%): | |
Assicurazioni Generali SpA | | | 11,427 | | | | 169,845 | | |
Enel SpA | | | 52,743 | | | | 232,518 | | |
Intesa Sanpaolo SpA | | | 46,260 | | | | 118,136 | | |
Prada SpA | | | 49,300 | | | | 167,205 | | |
Snam SpA | | | 59,911 | | | | 246,839 | | |
Terna Rete Elettrica Nazionale SpA | | | 55,401 | | | | 253,800 | | |
| | | | 1,188,343 | | |
Japan (3.2%): | |
Bridgestone Corporation | | | 4,500 | | | | 162,250 | | |
Canon, Inc. | | | 9,000 | | | | 253,733 | | |
Nissan Motor Company Ltd. | | | 19,400 | | | | 195,121 | | |
Oracle Corporation Japan | | | 3,000 | | | | 151,187 | | |
| | | | 762,291 | | |
Netherlands (4.6%): | |
ING Groep NV | | | 12,293 | | | | 173,011 | | |
Koninklijke Ahold Delhaize NV | | | 12,413 | | | | 261,724 | | |
Koninklijke KPN NV | | | 72,355 | | | | 214,328 | | |
NN Group NV | | | 6,647 | | | | 225,268 | | |
Randstad Holding NV | | | 3,585 | | | | 194,462 | | |
| | | | 1,068,793 | | |
Norway (3.4%): | |
Gjensidige Forsikring ASA | | | 16,375 | | | | 259,790 | | |
Marine Harvest ASA | | | 15,957 | | | | 287,713 | | |
Yara International ASA | | | 6,299 | | | | 248,011 | | |
| | | | 795,514 | | |
Portugal (1.9%): | |
EDP-Energias de Portugal SA | | | 65,394 | | | | 199,215 | | |
Jeronimo Martins SGPS SA | | | 15,131 | | | | 234,774 | | |
| | | | 433,989 | | |
Singapore (4.3%): | |
Keppel Corporation Ltd. | | | 46,300 | | | | 185,117 | | |
Singapore Airlines Ltd. | | | 49,300 | | | | 329,200 | | |
Singapore Technologies Engineering Ltd. | | | 106,000 | | | | 236,426 | | |
Singapore Telecommunications Ltd. | | | 101,500 | | | | 255,826 | | |
| | | | 1,006,569 | | |
See notes to financial statements.
110
Victory Portfolios II
VictoryShares International High Div Volatility Wtd ETF | | Schedule of Investments — continued
December 31, 2016 | |
(Unaudited)
Security Description | | Shares | | Value | |
Spain (6.3%): | |
Abertis Infraestructuras SA | | | 17,013 | | | $ | 238,098 | | |
ACS Actividades de Construccion y Servicios SA | | | 6,393 | | | | 202,023 | | |
Enagas SA | | | 11,427 | | | | 290,192 | | |
Ferrovial SA | | | 11,427 | | | | 204,427 | | |
Gas Natural SDG SA | | | 11,367 | | | | 214,302 | | |
Red Electrica Corp SA | | | 17,461 | | | | 329,468 | | |
| | | | 1,478,510 | | |
Sweden (4.6%): | |
Nordea Bank AB | | | 21,051 | | | | 234,064 | | |
Skanska AB — Class B | | | 9,711 | | | | 229,275 | | |
Swedbank AB — Class A | | | 9,487 | | | | 229,402 | | |
Swedish Match AB | | | 7,455 | | | | 237,137 | | |
Telefonaktiebolaget LM Ericsson — Class B | | | 25,862 | | | | 151,869 | | |
| | | | 1,081,747 | | |
Switzerland (4.2%): | |
Garmin Ltd. | | | 4,138 | | | | 200,652 | | |
Swiss Re AG | | | 3,210 | | | | 304,198 | | |
Swisscom AG | | | 672 | | | | 300,991 | | |
UBS Group AG | | | 11,720 | | | | 183,574 | | |
| | | | 989,415 | | |
United Kingdom (15.4%): | |
Admiral Group PLC | | | 8,657 | | | | 194,922 | | |
BAE Systems PLC | | | 43,015 | | | | 313,566 | | |
Barratt Developments PLC | | | 17,716 | | | | 100,957 | | |
Coca-Cola European Partners PLC | | | 4,228 | | | | 132,759 | | |
Direct Line Insurance Group PLC | | | 44,179 | | | | 201,126 | | |
InterContinental Hotels Group PLC | | | 4,388 | | | | 196,736 | | |
International Consolidated Airlines Group SA | | | 24,283 | | | | 131,946 | | |
ITV PLC | | | 55,910 | | | | 142,218 | | |
Johnson Matthey PLC | | | 5,478 | | | | 214,821 | | |
Legal & General Group PLC | | | 48,776 | | | | 148,837 | | |
Marks & Spencer Group PLC | | | 37,985 | | | | 163,846 | | |
National Grid PLC | | | 25,418 | | | | 298,092 | | |
Next PLC | | | 2,343 | | | | 143,886 | | |
Persimmon PLC | | | 4,791 | | | | 104,863 | | |
Royal Mail PLC | | | 37,925 | | | | 215,981 | | |
Sky PLC | | | 22,313 | | | | 272,512 | | |
SSE PLC | | | 12,910 | | | | 247,088 | | |
Taylor Wimpey PLC | | | 51,239 | | | | 96,931 | | |
United Utilities Group PLC | | | 27,045 | | | | 300,307 | | |
| | | | 3,621,394 | | |
Total Common Stocks (Cost $24,096,581) | | | 23,324,287 | | |
See notes to financial statements.
111
Victory Portfolios II
VictoryShares International High Div Volatility Wtd ETF | | Schedule of Investments — continued
December 31, 2016 | |
(Unaudited)
Security Description | | Shares | | Value | |
Short-Term Investments (0.4%) | |
Money Market Funds (0.4%): | |
Short-Term Investments Trust Government & Agency Portfolio —
Institutional Class, 0.43% (b) | | | 89,845 | | | $ | 89,845 | | |
Total Short-Term Investments (Cost $89,845) | | | 89,845 | | |
Total Investments — 99.8% (Cost $24,186,426) | | | 23,414,132 | | |
Other assets in excess of liabilities — 0.2% | | | 53,698 | | |
NET ASSETS — 100.0% | | $ | 23,467,830 | | |
(a) Non-income producing security.
(b) Annualized seven-day yield as of December 31, 2016.
Schedule of Open Futures Contracts
Number of
Contracts
Purchased | | Description | | Notional Value | | Unrealized
Depreciation | |
| | 1 | | | mini MSCI EAFE, March 2017 | | $ | 83,780 | | | $ | (1,209 | ) | |
| | | $ | (1,209 | ) | |
See notes to financial statements.
112
Victory Portfolios II | | Statements of Assets and Liabilities
December 31, 2016 | |
(Unaudited)
| | | VictoryShares
US 500 Volatility
Wtd ETF | | VictoryShares
US Discovery
Enhanced Volatility
Wtd ETF | | VictoryShares
US 500
Enhanced Volatility
Wtd ETF | |
ASSETS: | |
Investments in securities, at value* | | $ | 108,824,859 | | | $ | 36,517,543 | | | $ | 239,696,619 | | |
Cash | | | 1,650 | | | | 144 | | | | 3,252 | | |
Interest and dividends receivable | | | 112,486 | | | | 50,129 | | | | 253,993 | | |
Variation margin | | | 820 | | | | — | | | | — | | |
Deposit at broker for futures | | | 29,952 | | | | 4,705 | | | | 65,089 | | |
Receivable for capital shares sold | | | 4,068,435 | | | | — | | | | 6,090,885 | | |
Due from Adviser, net | | | — | | | | 297 | | | | — | | |
Prepaid expenses | | | 856 | | | | 305 | | | | 1,124 | | |
Total Assets | | | 113,039,058 | | | | 36,573,123 | | | | 246,110,962 | | |
LIABILITIES: | |
Payable for investment securities
purchased | | | 4,065,522 | | | | — | | | | 6,084,826 | | |
Payable for distributions to shareholders | | | — | | | | 6,596 | | | | — | | |
Variation margin | | | — | | | | 285 | | | | 722 | | |
Due to Adviser, net | | | 12,260 | | | | — | | | | 41,950 | | |
Other liabilities and accrued expenses | | | 33,545 | | | | 34,712 | | | | 67,903 | | |
Total Liabilities | | | 4,111,327 | | | | 41,593 | | | | 6,195,401 | | |
Net Assets | | $ | 108,927,731 | | | $ | 36,531,530 | | | $ | 239,915,561 | | |
NET ASSETS CONSIST OF: | |
Paid-in capital | | $ | 103,445,883 | | | $ | 35,642,525 | | | $ | 228,509,731 | | |
Undistributed net investment income | | | 4,693 | | | | 1,000 | | | | 46,567 | | |
Accumulated net realized loss on
Investments | | | (44,970 | ) | | | (4,439,720 | ) | | | (4,768,237 | ) | |
Net unrealized appreciation
(depreciation) on: | |
Investments in securities | | | 5,521,892 | | | | 5,327,769 | | | | 16,129,182 | | |
Investments in futures | | | 233 | | | | (44 | ) | | | (1,682 | ) | |
Net Assets | | $ | 108,927,731 | | | $ | 36,531,530 | | | $ | 239,915,561 | | |
*Identified Cost: | | $ | 103,302,967 | | | $ | 31,189,774 | | | $ | 223,567,436 | | |
Net Asset Value
(unlimited shares authorized): | |
Net Assets | | $ | 108,927,731 | | | $ | 36,531,530 | | | $ | 239,915,561 | | |
Shares Outstanding^ | | | 2,700,000 | | | | 900,000 | | | | 5,950,000 | | |
Net Asset Value, Offering and
Redemption Price per Share | | $ | 40.34 | | | $ | 40.59 | | | $ | 40.32 | | |
^ No Par Value
See notes to financial statements.
113
Victory Portfolios II | | Statements of Assets and Liabilities
December 31, 2016 | |
(Unaudited)
| | | VictoryShares
Developed
Enhanced Volatility
Wtd ETF | | VictoryShares
US EQ Income
Enhanced Volatility
Wtd ETF | | VictoryShares
US Small Cap
Volatility
Wtd ETF | |
ASSETS: | |
Investments in securities, at value* | | $ | 35,417,980 | | | $ | 306,964,820 | | | $ | 18,700,334 | | |
Cash | | | 7,143 | | | | 2,277 | | | | 14 | | |
Foreign currency, at value (cost $17, $0,
and $0 respectively) | | | 22 | | | | — | | | | — | | |
Interest and dividends receivable | | | 59,391 | | | | 652,434 | | | | 25,767 | | |
Deposit at broker for futures | | | 100 | | | | 115,989 | | | | 2,131 | | |
Receivable for capital shares sold | | | — | | | | 2,063,875 | | | | — | | |
Due from Adviser, net | | | 7,660 | | | | — | | | | 3,922 | | |
Prepaid expenses | | | 294 | | | | 2,489 | | | | 32 | | |
Total Assets | | | 35,492,590 | | | | 309,801,884 | | | | 18,732,200 | | |
LIABILITIES: | |
Payable for investment securities
purchased | | | — | | | | 2,058,846 | | | | — | | |
Payable for distributions to shareholders | | | — | | | | 115,051 | | | | 3,657 | | |
Variation margin | | | — | | | | 998 | | | | — | | |
Due to Adviser, net | | | — | | | | 64,780 | | | | — | | |
Other liabilities and accrued expenses | | | 70,259 | | | | 44,187 | | | | 25,889 | | |
Total Liabilities | | | 70,259 | | | | 2,283,862 | | | | 29,546 | | |
Net Assets | | $ | 35,422,331 | | | $ | 307,518,022 | | | $ | 18,702,654 | | |
NET ASSETS CONSIST OF: | |
Paid-in capital | | $ | 42,357,734 | | | $ | 290,923,944 | | | $ | 16,240,791 | | |
Undistributed net investment income | | | 14,105 | | | | 41,820 | | | | 1,586 | | |
Accumulated net realized gain (loss) on
investments | | | (7,245,166 | ) | | | (1,067,480 | ) | | | 236,900 | | |
Net unrealized appreciation
(depreciation) on: | |
Investments in securities | | | 298,457 | | | | 17,622,358 | | | | 2,223,377 | | |
Investments in futures | | | — | | | | (2,620 | ) | | | — | | |
Foreign currencies | | | (2,799 | ) | | | — | | | | — | | |
Net Assets | | $ | 35,422,331 | | | $ | 307,518,022 | | | $ | 18,702,654 | | |
*Identified Cost: | | $ | 35,119,523 | | | $ | 289,342,462 | | | $ | 16,476,957 | | |
Net Asset Value
(unlimited shares authorized): | |
Net Assets | | $ | 35,422,331 | | | $ | 307,518,022 | | | $ | 18,702,654 | | |
Shares Outstanding^ | | | 1,250,000 | | | | 7,450,000 | | | | 450,000 | | |
Net Asset Value, Offering and
Redemption Price per Share | | $ | 28.34 | | | $ | 41.28 | | | $ | 41.56 | | |
^ No Par Value
See notes to financial statements.
114
Victory Portfolios II | | Statements of Assets and Liabilities
December 31, 2016 | |
(Unaudited)
| | | VictoryShares
International
Volatility
Wtd ETF | | VictoryShares
Emerging Market
Volatility
Wtd ETF | | VictoryShares
US Large Cap
High Div Volatility
Wtd ETF | |
ASSETS: | |
Investments in securities, at value* | | $ | 11,401,085 | | | $ | 24,302,367 | | | $ | 78,264,726 | | |
Cash | | | 3,501 | | | | — | | | | 826 | | |
Foreign currency, at value (cost $16, $1,947,
and $0, respectively) | | | 23 | | | | 1,975 | | | | — | | |
Receivable for investment securities sold | | | — | | | | 157,744 | | | | — | | |
Interest and dividends receivable | | | 23,223 | | | | 47,864 | | | | 170,465 | | |
Variation margin | | | — | | | | — | | | | — | | |
Deposit at broker for futures | | | 18,224 | | | | 2,500 | | | | 34,451 | | |
Due from Adviser, net | | | 12,369 | | | | 22,686 | | | | — | | |
Prepaid expenses and other assets | | | 48 | | | | 5,456 | | | | 1,237 | | |
Total Assets | | | 11,458,473 | | | | 24,540,592 | | | | 78,471,705 | | |
LIABILITIES: | |
Payable for fund shares redeemed | | | — | | | | 2,471 | | | | — | | |
Payable for distributions to shareholders | | | — | | | | 8,948 | | | | — | | |
Variation margin | | | — | | | | — | | | | 445 | | |
Due to custodian | | | — | | | | 15,034 | | | | — | | |
Due to Adviser, net | | | — | | | | — | | | | 11,776 | | |
Other liabilities and accrued expenses | | | 37,134 | | | | 95,963 | | | | 32,966 | | |
Total Liabilities | | | 37,134 | | | | 122,416 | | | | 45,187 | | |
Net Assets | | $ | 11,421,339 | | | $ | 24,418,176 | | | $ | 78,426,518 | | |
NET ASSETS CONSIST OF: | |
Paid-in capital | | $ | 11,999,661 | | | $ | 25,603,258 | | | $ | 72,698,992 | | |
Undistributed net investment income (loss) | | | (2,442 | ) | | | (15,302 | ) | | | 42,012 | | |
Accumulated net realized gain (loss) on
investments | | | (173,889 | ) | | | (26,962 | ) | | | 1,244,193 | | |
Net unrealized appreciation
(depreciation) on: | |
Investments in securities | | | (401,194 | ) | | | (1,142,933 | ) | | | 4,442,340 | | |
Investments in futures | | | — | | | | — | | | | (1,019 | ) | |
Foreign currencies | | | (797 | ) | | | 115 | | | | — | | |
Net Assets | | $ | 11,421,339 | | | $ | 24,418,176 | | | $ | 78,426,518 | | |
*Identified Cost: | | $ | 11,802,279 | | | $ | 25,445,300 | | | $ | 73,822,386 | | |
Net Asset Value
(unlimited shares authorized): | |
Net Assets | | $ | 11,421,339 | | | $ | 24,418,176 | | | $ | 78,426,518 | | |
Shares Outstanding^ | | | 350,000 | | | | 1,000,000 | | | | 1,950,000 | | |
Net Asset Value, Offering and
Redemption Price per Share | | $ | 32.63 | | | $ | 24.42 | | | $ | 40.22 | | |
^ No Par Value
See notes to financial statements.
115
Victory Portfolios II | | Statements of Assets and Liabilities
December 31, 2016 | |
(Unaudited)
| | | VictoryShares
US Small Cap
High Div Volatility
Wtd ETF | | VictoryShares
International
High Div Volatility
Wtd ETF | |
ASSETS: | |
Investments in securities, at value* | | $ | 22,799,975 | | | $ | 23,414,132 | | |
Cash | | | — | | | | 1,828 | | |
Foreign currency, at value (cost $0 and $997, respectively) | | | — | | | | 999 | | |
Interest and dividends receivable | | | 73,590 | | | | 66,004 | | |
Variation margin | | | — | | | | 265 | | |
Deposit at broker for futures | | | 11,618 | | | | 5,180 | | |
Due from Adviser, net | | | — | | | | 1,325 | | |
Prepaid expenses and other assets | | | 101 | | | | 180 | | |
Total Assets | | | 22,885,284 | | | | 23,489,913 | | |
LIABILITIES: | |
Variation margin | | | 285 | | | | — | | |
Due to Adviser, net | | | 92 | | | | — | | |
Other liabilities and accrued expenses | | | 16,364 | | | | 22,083 | | |
Total Liabilities | | | 16,741 | | | | 22,083 | | |
Net Assets | | $ | 22,868,543 | | | $ | 23,467,830 | | |
NET ASSETS CONSIST OF: | | ` | | | |
Paid-in capital | | $ | 19,343,982 | | | $ | 24,464,548 | | |
Undistributed net investment income | | | 24,135 | | | | 7,100 | | |
Accumulated net realized gain (loss) on investments | | | 454,599 | | | | (228,303 | ) | |
Net unrealized appreciation (depreciation) on: | |
Investments in securities | | | 3,045,871 | | | | (772,294 | ) | |
Investments in futures | | | (44 | ) | | | (1,209 | ) | |
Foreign currencies | | | — | | | | (2,012 | ) | |
Net Assets | | $ | 22,868,543 | | | $ | 23,467,830 | | |
*Identified Cost: | | $ | 19,754,104 | | | $ | 24,186,426 | | |
Net Asset Value (unlimited shares authorized): | |
Net Assets | | $ | 22,868,543 | | | $ | 23,467,830 | | |
Shares Outstanding^ | | | 550,000 | | | | 750,000 | | |
Net Asset Value, Offering and Redemption Price per Share | | $ | 41.58 | | | $ | 31.29 | | |
^ No Par Value
See notes to financial statements.
116
Victory Portfolios II | | Statements of Operations
Period Ended December 31, 2016 | |
(Unaudited)
| | | VictoryShares
US 500 Volatility
Wtd ETF | | VictoryShares
US Discovery
Enhanced Volatility
Wtd ETF | | VictoryShares
US 500
Enhanced Volatility
Wtd ETF | |
Investment Income: | |
Dividend income | | $ | 659,333 | | | $ | 254,339 | | | $ | 1,614,751 | | |
Interest income | | | 230 | | | | 83 | | | | 488 | | |
Total Investment Income | | | 659,563 | | | | 254,422 | | | | 1,615,239 | | |
Expenses: | |
Advisory fees | | | 106,786 | | | | 46,888 | | | | 266,648 | | |
Administration, fund accounting and
transfer agent fees | | | 37,500 | | | | 30,192 | | | | 74,345 | | |
Custody expense | | | 22,844 | | | | 11,948 | | | | 21,578 | | |
Professional fees | | | 9,597 | | | | 9,002 | | | | 24,134 | | |
Shareholder reporting expenses | | | 5,625 | | | | 6,720 | | | | 15,158 | | |
Service fees | | | 2,114 | | | | 2,024 | | | | 2,114 | | |
Trustees' fees and expenses | | | 2,033 | | | | 1,736 | | | | 7,159 | | |
Registration fees | | | 800 | | | | 185 | | | | 980 | | |
Insurance expenses | | | 744 | | | | 1,016 | | | | 3,962 | | |
Compliance expense | | | 558 | | | | 460 | | | | 1,107 | | |
Miscellaneous expenses | | | 556 | | | | 552 | | | | 2,123 | | |
Total Expenses | | | 189,157 | | | | 110,723 | | | | 419,308 | | |
Less: Fees waived and reimbursed
by Adviser | | | (64,572 | ) | | | (56,020 | ) | | | (108,219 | ) | |
Net Expenses | | | 124,585 | | | | 54,703 | | | | 311,089 | | |
Net Investment Income | | | 534,978 | | | | 199,719 | | | | 1,304,150 | | |
Realized & Unrealized Gain (Loss)
on Investments: | |
Net realized gain on: | |
Investment in securities | | | 687,174 | | | | 1,222,881 | | | | 1,146,494 | | |
Investments in futures | | | 9,918 | | | | 15,294 | | | | 19,552 | | |
Net realized gain on investments in
securities and futures | | | 697,092 | | | | 1,238,175 | | | | 1,166,046 | | |
Net change in unrealized appreciation
(depreciation) of: | |
Investments in securities | | | 4,863,956 | | | | 4,758,964 | | | | 13,409,004 | | |
Investments in futures | | | 233 | | | | (44 | ) | | | (1,888 | ) | |
Net change in unrealized appreciation
of investments in securities and futures | | | 4,864,189 | | | | 4,758,920 | | | | 13,407,116 | | |
Net realized and unrealized gain
on investments | | | 5,561,281 | | | | 5,997,095 | | | | 14,573,162 | | |
Net increase in net assets resulting
from operations | | $ | 6,096,259 | | | $ | 6,196,814 | | | $ | 15,877,312 | | |
See notes to financial statements.
117
Victory Portfolios II | | Statements of Operations
Period Ended December 31, 2016 | |
(Unaudited)
| | | VictoryShares
Developed
Enhanced Volatility
Wtd ETF | | VictoryShares
US EQ Income
Enhanced Volatility
Wtd ETF | | VictoryShares
US Small Cap
Volatility
Wtd ETF | |
Investment Income: | |
Dividend income (net of $18,340, $0 and $0,
respectively, in foreign withholding taxes) | | $ | 264,648 | | | $ | 3,858,070 | | | $ | 121,583 | | |
Interest income | | | 15,468 | | | | 696 | | | | 41 | | |
Total Investment Income | | | 280,116 | | | | 3,858,766 | | | | 121,624 | | |
Expenses: | |
Advisory fees | | | 70,629 | | | | 332,781 | | | | 21,842 | | |
Custody expense | | | 59,779 | | | | 5,377 | | | | 10,207 | | |
Administration, fund accounting and
transfer agent fees | | | 52,302 | | | | 68,812 | | | | 23,271 | | |
Profesional fees | | | 12,951 | | | | 24,038 | | | | 6,468 | | |
Shareholder reporting expenses | | | 6,625 | | | | 14,191 | | | | 3,917 | | |
Trustees' fees and expenses | | | 2,102 | | | | 5,760 | | | | 735 | | |
Service fees | | | 2,024 | | | | 2,114 | | | | 2,024 | | |
Insurance expense | | | 1,107 | | | | 3,862 | | | | 368 | | |
Miscellaneous expenses | | | 644 | | | | 1,761 | | | | 274 | | |
Compliance expense | | | 552 | | | | 1,025 | | | | 282 | | |
Registration fees | | | 273 | | | | 2,160 | | | | 109 | | |
Total Expenses | | | 208,988 | | | | 461,881 | | | | 69,497 | | |
Less: Fees waived and reimbursed
by Adviser | | | (129,531 | ) | | | (73,636 | ) | | | (44,015 | ) | |
Net Expenses | | | 79,457 | | | | 388,245 | | | | 25,482 | | |
Net Investment Income | | | 200,659 | | | | 3,470,521 | | | | 96,142 | | |
Realized & Unrealized Gain (Loss)
on Investments: | |
Net Realized Gain (Loss) on: | |
Investment in securities | | | (1,928,865 | ) | | | 3,958,363 | | | | 527,705 | | |
Investments in futures | | | (11,188 | ) | | | 59,882 | | | | 574 | | |
Foreign currencies | | | 10,541 | | | | — | | | | — | | |
Net realized gain (loss) on investment
securities and futures | | | (1,929,512 | ) | | | 4,018,245 | | | | 528,279 | | |
Net change in unrealized appreciation
(depreciation) of: | |
Investments in securities | | | 1,176,712 | | | | 11,979,247 | | | | 2,205,422 | | |
Investments in futures | | | 2,139 | | | | (3,894 | ) | | | — | | |
Foreign currencies | | | (2,799 | ) | | | — | | | | — | | |
Net change in unrealized appreciation
of investments in securities, futures, and
foreign currencies | | | 1,176,052 | | | | 11,975,353 | | | | 2,205,422 | | |
Net realized and unrealized gain (loss)
on investments | | | (753,460 | ) | | | 15,993,598 | | | | 2,733,701 | | |
Net increase (decrease) in net assets
resulting from operations | | $ | (552,801 | ) | | $ | 19,464,119 | | | $ | 2,829,843 | | |
See notes to financial statements.
118
Victory Portfolios II | | Statements of Operations
Period Ended December 31, 2016 | |
(Unaudited)
| | | VictoryShares
International
Volatility
Wtd ETF | | VictoryShares
Emerging Market
Volatility
Wtd ETF | | VictoryShares
US Large Cap
High Div Volatility
Wtd ETF | |
Investment Income: | |
Dividend income (net of $8,851, $27,537
and $0, respectively, in foreign
withholding taxes) | | $ | 119,865 | | | $ | 182,882 | | | $ | 1,084,706 | | |
Interest income | | | 130 | | | | 170 | | | | 208 | | |
Total Investment Income | | | 119,995 | | | | 183,052 | | | | 1,084,914 | | |
Expenses: | |
Administration, fund accounting and
transfer agent fees | | | 43,459 | | | | 41,452 | | | | 26,807 | | |
Custody expense | | | 33,166 | | | | 141,663 | | | | 9,048 | | |
Advisory fees | | | 26,411 | | | | 39,087 | | | | 94,870 | | |
Professional fees | | | 7,554 | | | | 7,206 | | | | 8,428 | | |
Shareholder reporting expenses | | | 3,076 | | | | 3,076 | | | | 6,145 | | |
Service fees | | | 2,024 | | | | 1,931 | | | | 2,024 | | |
Trustees' fees and expenses | | | 643 | | | | 557 | | | | 2,121 | | |
Compliance expense | | | 461 | | | | 461 | | | | 645 | | |
Insurance expenses | | | 368 | | | | 182 | | | | 829 | | |
Miscellaneous expenses | | | 277 | | | | 829 | | | | 648 | | |
Registration fees | | | 182 | | | | 312 | | | | 830 | | |
Total Expenses | | | 117,621 | | | | 236,756 | | | | 152,395 | | |
Less: fees waived and reimbursed
by Adviser | | | (87,909 | ) | | | (193,327 | ) | | | (41,713 | ) | |
Net Expenses | | | 29,712 | | | | 43,429 | | | | 110,682 | | |
Net Investment Income | | | 90,283 | | | | 139,623 | | | | 974,232 | | |
Realized & Unrealized Gain (Loss)
on Investments: | |
Net realized gain (loss) on: | |
Investments in securities | | | 85,217 | | | | 102,777 | | | | 1,347,345 | | |
Investments in futures | | | 4,105 | | | | 9,129 | | | | 19,603 | | |
Foreign currencies | | | (7,551 | ) | | | (15,072 | ) | | | — | | |
Net realized gain on investments in
securities, futures, and foreign currencies | | | 81,771 | | | | 96,834 | | | | 1,366,948 | | |
Net change in unrealized appreciation
(depreciation) of: | |
Investments in securities | | | 193,539 | | | | (1,225,654 | ) | | | 2,821,413 | | |
Investments in futures | | | (2,561 | ) | | | (2,251 | ) | | | (1,019 | ) | |
Foreign currencies | | | (797 | ) | | | (24 | ) | | | — | | |
Net change in unrealized appreciation
(depreciation) of investments in
securities, foreign currencies and futures | | | 190,181 | | | | (1,227,929 | ) | | | 2,820,394 | | |
Net realized and unrealized gain (loss)
on investments | | | 271,952 | | | | (1,131,095 | ) | | | 4,187,342 | | |
Net increase (decrease) in net assets
resulting from operations | | $ | 362,235 | | | $ | (991,472 | ) | | $ | 5,161,574 | | |
See notes to financial statements.
119
Victory Portfolios II | | Statements of Operations
Period Ended December 31, 2016 | |
(Unaudited)
| | | VictoryShares
US Small Cap
High Div Volatility
Wtd ETF | | VictoryShares
International
High Div Volatility
Wtd ETF | |
Investment Income: | |
Dividend income (net of $0 and $16,376, respectively, in
foreign withholding taxes) | | $ | 404,467 | | | $ | 303,449 | | |
Interest income | | | 60 | | | | 132 | | |
Total Investment Income | | | 404,527 | | | | 303,581 | | |
Expenses: | |
Advisory fees | | | 29,938 | | | | 38,978 | | |
Administration, fund accounting and transfer agent fees | | | 14,365 | | | | 20,940 | | |
Professional fees | | | 6,480 | | | | 7,475 | | |
Shareholder reporting expenses | | | 4,300 | | | | 3,271 | | |
Custody expense | | | 3,310 | | | | 12,541 | | |
Service fees | | | 2,024 | | | | 2,024 | | |
Trustees' fees and expenses | | | 828 | | | | 836 | | |
Compliance expense | | | 461 | | | | 461 | | |
Insurance expenses | | | 371 | | | | 436 | | |
Miscellaneous expenses | | | 277 | | | | 392 | | |
Registration fees | | | 194 | | | | 279 | | |
Total Expenses | | | 62,548 | | | | 87,633 | | |
Less: Fees waived and reimbursed by Adviser | | | (27,621 | ) | | | (43,783 | ) | |
Net Expenses | | | 34,927 | | | | 43,850 | | |
Net Investment Income | | | 369,600 | | | | 259,731 | | |
Realized & Unrealized Gain (Loss) on Investments: | |
Net realized gain (loss) on: | |
Investments in securities | | | 709,162 | | | | 74,650 | | |
Investments in futures | | | (2,465 | ) | | | (241 | ) | |
Foreign currencies | | | — | | | | (6,567 | ) | |
Net realized gain on investments in securities, futures, and
foreign currencies | | | 706,697 | | | | 67,842 | | |
Net change in unrealized appreciation (depreciation) of: | |
Investments in securities | | | 2,635,302 | | | | 563,659 | | |
Investments in futures | | | (44 | ) | | | 930 | | |
Foreign currencies | | | — | | | | 1,280 | | |
Net change in unrealized appreciation of
investments in securities, futures, and foreign currencies | | | 2,635,258 | | | | 565,869 | | |
Net realized and unrealized gain on investments | | | 3,341,955 | | | | 633,711 | | |
Net increase in net assets resulting from operations | | $ | 3,711,555 | | | $ | 893,442 | | |
See notes to financial statements.
120
Victory Portfolios II | | Statements of Changes in Net Assets | |
| | | VictoryShares
US 500 Volatility
Wtd ETF | |
| | | Six-Months Ended
December 31, 2016 | | Year Ended
June 30, 2016 | |
| | | (Unaudited) | | | |
Operations: | |
Net investment income | | $ | 534,978 | | | $ | 406,406 | | |
Net realized gain on investments | | | 697,092 | | | | 682,219 | | |
Change in unrealized appreciation of investments | | | 4,864,189 | | | | 382,877 | | |
Net increase in net assets resulting from operations | | $ | 6,096,259 | | | $ | 1,471,502 | | |
Distributions to Shareholders: | |
From net investment income | | | (559,012 | ) | | | (382,228 | ) | |
From net realized gains | | | — | | | | (15,411 | ) | |
Total Distributions to Shareholders | | | (559,012 | ) | | | (397,639 | ) | |
Capital Share Transactions: | |
Proceeds from shares sold | | | 70,114,700 | | | | 50,209,415 | | |
Cost of shares redeemed | | | (11,413,290 | ) | | | (15,788,475 | ) | |
Net increase in net assets resulting from capital
share transactions (a) | | | 58,701,410 | | | | 34,420,940 | | |
Net increase in net assets | | $ | 64,238,657 | | | $ | 35,494,803 | | |
Net Assets: | |
Beginning of period | | $ | 44,689,074 | | | $ | 9,194,271 | | |
End of period | | $ | 108,927,731 | | | $ | 44,689,074 | | |
Undistributed net investment income | | $ | 4,693 | | | $ | 28,727 | | |
(a) Summary of capital share transactions is as follows:
| | | Six-Months Ended
December 31, 2016 | | Year Ended
June 30, 2016 | |
| | | Shares | | Shares | |
Shares sold | | | 1,800,000 | | | | 1,400,000 | | |
Shares redeemed | | | (300,000 | ) | | | (450,000 | ) | |
Net increase | | | 1,500,000 | | | | 950,000 | | |
See notes to financial statements.
121
Victory Portfolios II | | Statements of Changes in Net Assets | |
| | | VictoryShares
US Discovery
Enhanced Volatility
Wtd ETF | |
| | | Six-Months Ended
December 31, 2016 | | Year Ended
June 30, 2016 | |
| | | (Unaudited) | | | |
Operations: | |
Net investment income | | $ | 199,719 | | | $ | 275,553 | | |
Net realized gain (loss) on investments | | | 1,238,175 | | | | (4,070,245 | ) | |
Change in unrealized appreciation of investments | | | 4,758,920 | | | | 249,711.00 | | |
Net increase (decrease) in net assets resulting
from operations | | $ | 6,196,814 | | | $ | (3,544,981 | ) | |
Distributions to Shareholders: | |
From net investment income | | | (223,265 | ) | | | (263,363 | ) | |
Total Distributions to Shareholders | | | (223,265 | ) | | | (263,363 | ) | |
Capital Share Transactions: | |
Proceeds from shares sold | | | 10,748,920 | | | | 19,251,590 | | |
Cost of shares redeemed | | | (7,028,860 | ) | | | (12,142,840 | ) | |
Net increase in net assets resulting from capital
share transactions (a) | | | 3,720,060 | | | | 7,108,750 | | |
Net increase in net assets | | $ | 9,693,609 | | | $ | 3,300,406 | | |
Net Assets: | |
Beginning of period | | $ | 26,837,921 | | | $ | 23,537,515 | | |
End of period | | $ | 36,531,530 | | | $ | 26,837,921 | | |
Undistributed net investment income | | $ | 1,000 | | | $ | 24,546 | | |
(a) Summary of capital share transactions is as follows:
| | | Six-Months Ended
December 31, 2016 | | Year Ended
June 30, 2016 | |
| | | Shares | | Shares | |
Shares sold | | | 300,000 | | | | 550,000 | | |
Shares redeemed | | | (200,000 | ) | | | (350,000 | ) | |
Net increase | | | 100,000 | | | | 200,000 | | |
See notes to financial statements.
122
Victory Portfolios II | | Statements of Changes in Net Assets | |
| | | VictoryShares
US 500 Enhanced Volatility
Wtd ETF | |
| | | Six-Months Ended
December 31, 2016 | | Year Ended
June 30, 2016 | |
| | | (Unaudited) | | | |
Operations: | |
Net investment income | | $ | 1,304,150 | | | $ | 1,816,820 | | |
Net realized gain on investments | | | 1,166,046 | | | | 637,983 | | |
Change in unrealized appreciation of investments | | | 13,407,116 | | | | 2,144,576 | | |
Net increase in net assets resulting from operations | | $ | 15,877,312 | | | $ | 4,599,379 | | |
Distributions to Shareholders: | |
From net investment income | | | (1,341,276 | ) | | | (1,777,461 | ) | |
Total Distributions to Shareholders | | | (1,341,276 | ) | | | (1,777,461 | ) | |
Capital Share Transactions: | |
Proceeds from shares sold | | | 108,621,700 | | | | 95,529,045 | | |
Cost of shares redeemed | | | (24,712,220 | ) | | | (43,277,750 | ) | |
Net increase in net assets resulting from capital
share transactions (a) | | | 83,909,480 | | | | 52,251,295 | | |
Net increase in net assets | | $ | 98,445,516 | | | $ | 55,073,213 | | |
Net Assets: | |
Beginning of period | | $ | 141,470,045 | | | $ | 86,396,832 | | |
End of period | | $ | 239,915,561 | | | $ | 141,470,045 | | |
Undistributed net investment income | | $ | 46,567 | | | $ | 83,693 | | |
(a) Summary of capital share transactions is as follows:
| | | Six-Months Ended
December 31, 2016 | | Year Ended
June 30, 2016 | |
| | | Shares | | Shares | |
Shares sold | | | 2,800,000 | | | | 2,650,000 | | |
Shares redeemed | | | (650,000 | ) | | | (1,200,000 | ) | |
Net increase | | | 2,150,000 | | | | 1,450,000 | | |
See notes to financial statements.
123
Victory Portfolios II | | Statements of Changes in Net Assets | |
| | | VictoryShares
Developed
Enhanced Volatility
Wtd ETF | |
| | | Six-Months Ended
December 31, 2016 | | Year Ended
June 30, 2016 | |
| | | (Unaudited) | | | |
Operations: | |
Net investment income | | $ | 200,659 | | | $ | 674,452 | | |
Net realized loss on investments | | | (1,929,512 | ) | | | (5,322,119 | ) | |
Change in unrealized appreciation (depreciation)
of investments | | | 1,176,052 | | | | (613,400 | ) | |
Net decrease in net assets resulting from operations | | $ | (552,801 | ) | | $ | (5,261,067 | ) | |
Distributions to Shareholders: | |
From net investment income | | | (236,672 | ) | | | (638,370 | ) | |
Total Distributions to Shareholders | | | (236,672 | ) | | | (638,370 | ) | |
Capital Share Transactions: | |
Proceeds from shares sold | | | 1,414,970 | | | | 16,063,220 | | |
Transaction fees | | | — | | | | 54 | | |
Net increase in net assets resulting from capital
share transactions (a) | | | 1,414,970 | | | | 16,063,274 | | |
Net increase in net assets | | $ | 625,496 | | | $ | 10,163,837 | | |
Net Assets: | |
Beginning of period | | $ | 34,796,834 | | | $ | 24,632,997 | | |
End of period | | $ | 35,422,331 | | | $ | 34,796,834 | | |
Undistributed net investment income | | $ | 14,105 | | | $ | 50,118 | | |
(a) Summary of capital share transactions is as follows:
| | | Six-Months Ended
December 31, 2016 | | Year Ended
June 30, 2016 | |
| | | Shares | | Shares | |
Shares sold | | | 50,000 | | | | 500,000 | | |
Shares redeemed | | | — | | | | — | | |
Net increase | | | 50,000 | | | | 500,000 | | |
See notes to financial statements.
124
Victory Portfolios II | | Statements of Changes in Net Assets | |
| | | VictoryShares
US EQ Income
Enhanced Volatility
Wtd ETF | |
| | | Six-Months Ended
December 31, 2016 | | Year Ended
June 30, 2016 | |
| | | (Unaudited) | | | |
Operations: | |
Net investment income | | $ | 3,470,521 | | | $ | 3,654,963 | | |
Net realized gain on investments | | | 4,018,245 | | | | 1,725,975 | | |
Change in unrealized appreciation of investments | | | 11,975,353 | | | | 8,597,545 | | |
Net increase in net assets resulting from operations | | $ | 19,464,119 | | | $ | 13,978,483 | | |
Distributions to Shareholders: | |
From net investment income | | | (3,591,532 | ) | | | (3,588,993 | ) | |
Total Distributions to Shareholders | | | (3,591,532 | ) | | | (3,588,993 | ) | |
Capital Share Transactions: | |
Proceeds from shares sold | | | 182,428,100 | | | | 106,357,140 | | |
Cost of shares redeemed | | | (47,060,400 | ) | | | (47,146,670 | ) | |
Net increase in net assets resulting from capital
share transactions (a) | | | 135,367,700 | | | | 59,210,470 | | |
Net increase in net assets | | $ | 151,240,287 | | | $ | 69,599,960 | | |
Net Assets: | |
Beginning of period | | $ | 156,277,735 | | | $ | 86,677,775 | | |
End of period | | $ | 307,518,022 | | | $ | 156,277,735 | | |
Undistributed net investment income | | $ | 41,820 | | | $ | 162,831 | | |
(a) Summary of capital share transactions is as follows:
| | | Six-Months Ended
December 31, 2016 | | Year Ended
June 30, 2016 | |
| | | Shares | | Shares | |
Shares sold | | | 4,600,000 | | | | 2,900,000 | | |
Shares redeemed | | | (1,200,000 | ) | | | (1,300,000 | ) | |
Net increase | | | 3,400,000 | | | | 1,600,000 | | |
See notes to financial statements.
125
Victory Portfolios II | | Statements of Changes in Net Assets | |
| | | VictoryShares
US Small Cap
Volatility
Wtd ETF | |
| | | Six-Months Ended
December 31, 2016 | | Period Ended
June 30, 20161 | |
| | | (Unaudited) | | | |
Operations: | |
Net investment income | | $ | 96,142 | | | $ | 94,924 | | |
Net realized gain on investments | | | 528,279 | | | | 107,882 | | |
Change in unrealized appreciation of investments | | | 2,205,422 | | | | 17,955 | | |
Net increase in net assets resulting from operations | | $ | 2,829,843 | | | $ | 220,761 | | |
Distributions to Shareholders: | |
From net investment income | | | (104,298 | ) | | | (86,852 | ) | |
Total Distributions to Shareholders | | | (104,298 | ) | | | (86,852 | ) | |
Capital Share Transactions: | |
Proceeds from shares sold | | | 11,076,600 | | | | 18,310,060 | | |
Cost of shares redeemed | | | (5,403,010 | ) | | | (8,140,450 | ) | |
Net increase in net assets resulting from capital
share transactions (a) | | | 5,673,590 | | | | 10,169,610 | | |
Net increase in net assets | | $ | 8,399,135 | | | $ | 10,303,519 | | |
Net Assets: | |
Beginning of period | | $ | 10,303,519 | | | $ | — | | |
End of period | | $ | 18,702,654 | | | $ | 10,303,519 | | |
Undistributed net investment income | | $ | 1,586 | | | $ | 9,741 | | |
(a) Summary of capital share transactions is as follows:
| | | Six-Months Ended
December 31, 2016 | | Year Ended
June 30, 20161 | |
| | | Shares | | Shares | |
Shares sold | | | 300,000 | | | | 550,000 | | |
Shares redeemed | | | (150,000 | ) | | | (250,000 | ) | |
Net increase | | | 150,000 | | | | 300,000 | | |
1 Fund commenced operations on July 7, 2015.
See notes to financial statements.
126
Victory Portfolios II | | Statements of Changes in Net Assets | |
| | | VictoryShares
International
Volatility
Wtd ETF | |
| | | Six-Months Ended
December 31, 2016 | | Period Ended
June 30, 20161 | |
| | | (Unaudited) | | | |
Operations: | |
Net investment income | | $ | 90,283 | | | $ | 226,906 | | |
Net realized gain (loss) on investments | | | 81,771 | | | | (428,119 | ) | |
Change in unrealized appreciation (depreciation)
of investments | | | 190,181 | | | | (592,172 | ) | |
Net increase (decrease) in net assets resulting from
operations | | $ | 362,235 | | | $ | (793,385 | ) | |
Distributions to Shareholders: | |
From net investment income | | | (124,583 | ) | | | (205,538 | ) | |
Total Distributions to Shareholders | | | (124,583 | ) | | | (205,538 | ) | |
Capital Share Transactions: | |
Proceeds from shares sold | | | 1,616,150 | | | | 18,476,970 | | |
Cost of shares redeemed | | | (3,276,350 | ) | | | (4,634,160 | ) | |
Net increase (decrease) in net assets resulting from capital
share transactions (a) | | | (1,660,200 | ) | | | 13,842,810 | | |
Net increase (decrease) in net assets | | $ | (1,422,548 | ) | | $ | 12,843,887 | | |
Net Assets: | |
Beginning of period | | $ | 12,843,887 | | | $ | — | | |
End of period | | $ | 11,421,339 | | | $ | 12,843,887 | | |
Undistributed net investment income (loss) | | $ | (2,442 | ) | | $ | 31,858 | | |
(a) Summary of capital share transactions is as follows:
| | | Six-Months Ended
December 31, 2016 | | Year Ended
June 30, 20161 | |
| | | Shares | | Shares | |
Shares sold | | | 50,000 | | | | 550,000 | | |
Shares redeemed | | | (100,000 | ) | | | (150,000 | ) | |
Net increase (decrease) | | | (50,000 | ) | | | 400,000 | | |
1 Fund commenced operations on August 19, 2015.
See notes to financial statements.
127
Victory Portfolios II | | Statements of Changes in Net Assets | |
| | | VictoryShares
Emerging Market
Volatility Wtd ETF | |
| | | Six-Months Ended
December 31, 2016 | | Period Ended
June 30, 20161 | |
| | | (Unaudited) | | | |
Operations: | |
Net investment income | | $ | 139,623 | | | $ | 87,191 | | |
Net realized gain (loss) on investments | | | 96,834 | | | | (3,260 | ) | |
Change in unrealized appreciation (depreciation)
of investments | | | (1,227,929 | ) | | | 85,111 | | |
Net increase (decrease) in net assets resulting
from operations | | $ | (991,472 | ) | | $ | 169,042 | | |
Distributions to Shareholders: | |
From net investment income | | | (195,682 | ) | | | (51,870 | ) | |
From net realized gain | | | (115,100 | ) | | | — | | |
Total Distributions to Shareholders | | | (310,782 | ) | | | (51,870 | ) | |
Capital Share Transactions: | |
Proceeds from shares sold | | | 13,078,000 | | | | 12,512,580 | | |
Transaction fees | | | 871 | | | | 11,807 | | |
Net increase in net assets resulting from capital
share transaction (a) | | | 13,078,871 | | | | 12,524,387 | | |
Net increase in net assets | | $ | 11,776,617 | | | $ | 12,641,559 | | |
Net Assets: | |
Beginning of period | | $ | 12,641,559 | | | $ | — | | |
End of period | | $ | 24,418,176 | | | $ | 12,641,559 | | |
Undistributed net investment income (loss) | | $ | (15,302 | ) | | $ | 40,757 | | |
(a) Summary of capital share transactions is as follows:
| | | Six-Months Ended
December 31, 2016 | | Period Ended
June 30, 20161 | |
| | | Shares | | Shares | |
Shares sold | | | 500,000 | | | | 500,000 | | |
Net increase | | | 500,000 | | | | 500,000 | | |
1 Fund commenced operations on March 22, 2016.
See notes to financial statements.
128
Victory Portfolios II | | Statements of Changes in Net Assets | |
| | | VictoryShares
US Large Cap
High Div Volatility
Wtd ETF | |
| | | Six-Months Ended
December 31, 2016 | | Period Ended
June 30, 20161 | |
| | | (Unaudited) | | | |
Operations: | |
Net investment income | | $ | 974,232 | | | $ | 756,513 | | |
Net realized gain on investments | | | 1,366,948 | | | | 964,702 | | |
Change in unrealized appreciation of investments | | | 2,820,394 | | | | 1,620,927 | | |
Net increase in net assets resulting from operations | | $ | 5,161,574 | | | $ | 3,342,142 | | |
Distributions to Shareholders: | |
From net investment income | | | (982,577 | ) | | | (706,156 | ) | |
Total Distributions to Shareholders | | | (982,577 | ) | | | (706,156 | ) | |
Capital Share Transactions: | |
Proceeds from shares sold | | | 50,104,105 | | | | 54,608,905 | | |
Cost of shares redeemed | | | (17,189,775 | ) | | | (15,911,700 | ) | |
Net increase in net assets resulting from capital
share transactions (a) | | | 32,914,330 | | | | 38,697,205 | | |
Net increase in net assets | | $ | 37,093,327 | | | $ | 41,333,191 | | |
Net Assets: | |
Beginning of period | | $ | 41,333,191 | | | $ | — | | |
End of period | | $ | 78,426,518 | | | $ | 41,333,191 | | |
Undistributed net investment income | | $ | 42,012 | | | $ | 50,357 | | |
(a) Summary of capital share transactions is as follows:
| | | Six-Months Ended
December 31, 2016 | | Year Ended
June 30, 20161 | |
| | | Shares | | Shares | |
Shares sold | | | 1,300,000 | | | | 1,550,000 | | |
Shares redeemed | | | (450,000 | ) | | | (450,000 | ) | |
Net increase | | | 850,000 | | | | 1,100,000 | | |
1 Fund commenced operations on July 7, 2015.
See notes to financial statements.
129
Victory Portfolios II | | Statements of Changes in Net Assets | |
| | | VictoryShares
US Small Cap
High Div Volatility
Wtd ETF | |
| | | Six-Months Ended
December 31, 2016 | | Period Ended
June 30, 20161 | |
| | | (Unaudited) | | | |
Operations: | |
Net investment income | | $ | 369,600 | | | $ | 323,863 | | |
Net realized gain on investments | | | 706,697 | | | | 290,732 | | |
Change in unrealized appreciation of investments | | | 2,635,258 | | | | 410,569 | | |
Net increse in net assets resulting from operations | | $ | 3,711,555 | | | $ | 1,025,164 | | |
Distributions to Shareholders: | |
From net investment income | | | (390,692 | ) | | | (292,084 | ) | |
Total Distributions to Shareholders | | | (390,692 | ) | | | (292,084 | ) | |
Capital Share Transactions: | |
Proceeds from shares sold | | | 10,814,040 | | | | 23,404,945 | | |
Cost of shares redeemed | | | (5,426,145 | ) | | | (9,978,240 | ) | |
Net increase in net assets resulting from capital
share transactions (a) | | | 5,387,895 | | | | 13,426,705 | | |
Net increase in net assets | | $ | 8,708,758 | | | $ | 14,159,785 | | |
Net Assets: | |
Beginning of period | | $ | 14,159,785 | | | $ | — | | |
End of period | | $ | 22,868,543 | | | $ | 14,159,785 | | |
Undistributed net investment income | | $ | 24,135 | | | $ | 45,227 | | |
(a) Summary of capital share transactions is as follows:
| | | Six-Months Ended
December 31, 2016 | | Year Ended
June 30, 20161 | |
| | | Shares | | Shares | |
Shares sold | | | 300,000 | | | | 700,000 | | |
Shares redeemed | | | (150,000 | ) | | | (300,000 | ) | |
Net increase | | | 150,000 | | | | 400,000 | | |
1 Fund commenced operations on July 7, 2015.
See notes to financial statements.
130
Victory Portfolios II | | Statements of Changes in Net Assets | |
| | | VictoryShares
International
High Div Volatility
Wtd ETF | |
| | | Six-Months Ended
December 31, 2016 | | Period Ended
June 30, 20161 | |
| | | (Unaudited) | | | |
Operations: | |
Net investment income | | $ | 259,731 | | | $ | 509,063 | | |
Net realized gain (loss) on investments | | | 67,842 | | | | (396,939 | ) | |
Change in unrealized appreciation (depreciation)
of investments | | | 565,869 | | | | (1,341,384 | ) | |
Net increase (decrease) in net assets resulting
from operations | | $ | 893,442 | | | $ | (1,229,260 | ) | |
Distributions to Shareholders: | |
From net investment income | | | (345,480 | ) | | | (427,662 | ) | |
Total Distributions to Shareholders | | | (345,480 | ) | | | (427,662 | ) | |
Capital Share Transactions: | |
Proceeds from shares sold | | | 10,932,085 | | | | 23,079,605 | | |
Cost of shares redeemed | | | (4,867,290 | ) | | | (4,567,610 | ) | |
Net increase in net assets resulting from capital
share transactions (a) | | | 6,064,795 | | | | 18,511,995 | | |
Net increase in net assets | | $ | 6,612,757 | | | $ | 16,855,073 | | |
Net Assets: | |
Beginning of period | | $ | 16,855,073 | | | $ | — | | |
End of period | | $ | 23,467,830 | | | $ | 16,855,073 | | |
Undistributed net investment income | | $ | 7,100 | | | $ | 92,849 | | |
(a) Summary of capital share transactions is as follows:
| | | Six-Months Ended
December 31, 2016 | | Period Ended
June 30, 20161 | |
| | | Shares | | Shares | |
Shares sold | | | 350,000 | | | | 700,000 | | |
Shares redeemed | | | (150,000 | ) | | | (150,000 | ) | |
Net increase | | | 200,000 | | | | 550,000 | | |
1 Fund commenced operations on August 19, 2015.
See notes to financial statements.
131
Victory Portfolios II | | Financial Highlights | |
For a capital share outstanding throughout the period
| | | VictoryShares US 500 Volatility Wtd ETF | |
| | | Six-Months
Ended
December 31,
2016 | | Year
Ended
June 30,
2016 | | Period
Ended
June 30,
20151 | |
| | | (Unaudited) | | | | | |
Net Asset Value, Beginning of Period | | $ | 37.24 | | | $ | 36.78 | | | $ | 35.00 | | |
Income from Investment Operations: | |
Net investment income2 | | | 0.30 | | | | 0.57 | | | | 0.49 | | |
Net realized and unrealized gain
on investments3 | | | 3.07 | | | | 0.42 | | | | 1.73 | | |
Total from Investment Operations | | | 3.37 | | | | 0.99 | | | | 2.22 | | |
Less Distributions: | |
Distributions from net investment income | | | (0.27 | ) | | | (0.51 | ) | | | (0.44 | ) | |
Distributions from net realized gain | | | — | | | | (0.02 | ) | | | — | | |
Total Distributions | | | (0.27 | ) | | | (0.53 | ) | | | (0.44 | ) | |
Net Asset Value, End of Period | | $ | 40.34 | | | $ | 37.24 | | | $ | 36.78 | | |
Total Return4 | | | 9.07 | %5 | | | 2.78 | % | | | 6.38 | %5 | |
Supplemental Data: | |
Net assets at end of period (000's) | | $ | 108,928 | | | $ | 44,689 | | | $ | 9,194 | | |
Ratios of expenses to average net assets: | |
Before fees waived | | | 0.53 | %6 | | | 0.74 | % | | | 1.39 | %6 | |
After fees waived | | | 0.35 | %6 | | | 0.35 | % | | | 0.54 | %6 | |
Ratios of net investment income to
average net assets: | |
Before fees waived | | | 1.32 | %6 | | | 1.20 | % | | | 0.52 | %6 | |
After fees waived | | | 1.50 | %6 | | | 1.59 | % | | | 1.37 | %6 | |
Portfolio Turnover Rate7 | | | 13 | %5 | | | 31 | % | | | 23 | %5 | |
1 Commenced operations on July 1, 2014.
2 Calculated based on average shares outstanding during the period.
3 The amounts reported for a share outstanding may not accord with the change in aggregate gains and losses in securities for the fiscal period due as reflected in the Statement of Operations due to the timing of capital share transactions in relation to the fluctuating values of the Fund's underlying securities.
4 Total return is calculated assuming an initial investment made at net asset value at the beginning of the period, reinvestment of all dividends and distributions at net asset value during the period, and redemption at net asset value on the last day of the period. Total return calculated for a period of less than one year is not annualized. The total return would have been lower if certain expenses had not been reimbursed/waived by the Adviser.
5 Not annualized.
6 Annualized.
7 Excludes impact of in-kind transactions.
See notes to financial statements.
132
Victory Portfolios II | | Financial Highlights | |
For a capital share outstanding throughout the period
| | | VictoryShares US Discovery
Enhanced Volatility Wtd ETF | |
| | | Six-Months
Ended
December 31,
2016 | | Year
Ended
June 30,
2016 | | Period
Ended
June 30,
20151 | |
| | | (Unaudited) | | | | | |
Net Asset Value, Beginning of Period | | $ | 33.55 | | | $ | 39.23 | | | $ | 35.00 | | |
Income from Investment Operations: | |
Net investment income2 | | | 0.23 | | | | 0.34 | | | | 0.40 | | |
Net realized and unrealized gain
(loss) on investments3 | | | 7.07 | | | | (5.71 | )4 | | | 4.16 | | |
Total from Investment Operations | | | 7.30 | | | | (5.37 | ) | | | 4.56 | | |
Less Distributions: | |
Distributions from net investment income | | | (0.26 | ) | | | (0.31 | ) | | | (0.33 | ) | |
Total Distributions | | | (0.26 | ) | | | (0.31 | ) | | | (0.33 | ) | |
Net Asset Value, End of Period | | $ | 40.59 | | | $ | 33.55 | | | $ | 39.23 | | |
Total Return5 | | | 21.82 | %6 | | | -13.70 | %7 | | | 13.06 | %6 | |
Supplemental Data: | |
Net assets at end of period (000's) | | $ | 36,532 | | | $ | 26,838 | | | $ | 23,538 | | |
Ratios of expenses to average net assets: | |
Before fees waived | | | 0.71 | %8 | | | 0.80 | % | | | 0.59 | %8 | |
After fees waived | | | 0.35 | %8 | | | 0.35 | % | | | 1.07 | %8 | |
Ratios of net investment income to
average net assets: | |
Before fees waived | | | 0.92 | %8 | | | 0.55 | % | | | 0.67 | %8 | |
After fees waived | | | 1.28 | %8 | | | 1.00 | % | | | 1.15 | %8 | |
Portfolio Turnover Rate9 | | | 27 | %6 | | | 221 | % | | | 10 | %6 | |
1 Commenced operations on July 31, 2014.
2 Calculated based on average shares outstanding during the period.
3 The amounts reported for a share outstanding may not accord with the change in aggregate gains and losses in securities for the fiscal period due as reflected in the Statement of Operations due to the timing of capital share transactions in relation to the fluctuating values of the Fund's underlying securities.
4 Includes $0.07 gain derived from a payment from affiliate. See Note 3.
5 Total return is calculated assuming an initial investment made at net asset value at the beginning of the period, reinvestment of all dividends and distributions at net asset value during the period, and redemption at net asset value on the last day of the period. Total return calculated for a period of less than one year is not annualized. The total return would have been lower if certain expenses had not been reimbursed/waived by the Adviser.
6 Not annualized.
7 Before the payment from affiliate for the loss resulting from a trade error, the total return for the year would have been -13.88%. See Note 3.
8 Annualized.
9 Excludes impact of in-kind transactions.
See notes to financial statements.
133
Victory Portfolios II | | Financial Highlights | |
For a capital share outstanding throughout the period
| | | VictoryShares US 500
Enhanced Volatility Wtd ETF | |
| | | Six-Months
Ended
December 31,
2016 | | Year
Ended
June 30,
2016 | | Period
Ended
June 30,
20151 | |
| | | (Unaudited) | | | | | |
Net Asset Value, Beginning of Period | | $ | 37.23 | | | $ | 36.76 | | | $ | 35.00 | | |
Income from Investment Operations: | |
Net investment income2 | | | 0.29 | | | | 0.56 | | | | 0.49 | | |
Net realized and unrealized gain
on investments3 | | | 3.08 | | | | 0.45 | | | | 1.65 | | |
Total from Investment Operations | | | 3.37 | | | | 1.01 | | | | 2.14 | | |
Less Distributions: | |
Distributions from net investment income | | | (0.28 | ) | | | (0.54 | ) | | | (0.38 | ) | |
Total Distributions | | | (0.28 | ) | | | (0.54 | ) | | | (0.38 | ) | |
Net Asset Value, End of Period | | $ | 40.32 | | | $ | 37.23 | | | $ | 36.76 | | |
Total Return4 | | | 9.07 | %5 | | | 2.79 | % | | | 6.15 | %5 | |
Supplemental Data: | |
Net assets at end of period (000's) | | $ | 239,916 | | | $ | 141,470 | | | $ | 86,397 | | |
Ratios of expenses to average net assets: | |
Before fees waived | | | 0.47 | %6 | | | 0.58 | % | | | 0.81 | %6 | |
After fees waived | | | 0.35 | %6 | | | 0.35 | % | | | 0.59 | %6 | |
Ratios of net investment income to
average net assets: | |
Before fees waived | | | 1.35 | %6 | | | 1.33 | % | | | 1.12 | %6 | |
After fees waived | | | 1.47 | %6 | | | 1.56 | % | | | 1.34 | %6 | |
Portfolio Turnover Rate7 | | | 3 | %5 | | | 36 | % | | | 13 | %5 | |
1 Commenced operations on July 1, 2014.
2 Calculated based on average shares outstanding during the period.
3 The amounts reported for a share outstanding may not accord with the change in aggregate gains and losses in securities for the fiscal period due as reflected in the Statement of Operations due to the timing of capital share transactions in relation to the fluctuating values of the Fund's underlying securities.
4 Total return is calculated assuming an initial investment made at net asset value at the beginning of the period, reinvestment of all dividends and distributions at net asset value during the period, and redemption at net asset value on the last day of the period. Total return calculated for a period of less than one year is not annualized. The total return would have been lower if certain expenses had not been reimbursed/waived by the Adviser.
5 Not annualized.
6 Annualized.
7 Excludes impact of in-kind transactions.
See notes to financial statements.
134
Victory Portfolios II | | Financial Highlights | |
For a capital share outstanding throughout the period
| | | VictoryShares Developed
Enhanced Volatility Wtd ETF | |
| | | Six-Months
Ended
December 31,
2016 | | Year
Ended
June 30,
2016 | | Period
Ended
June 30,
20151 | |
| | | (Unaudited) | | | | | |
Net Asset Value, Beginning of Period | | $ | 29.00 | | | $ | 35.19 | | | $ | 35.00 | | |
Income from Investment Operations: | |
Net investment income2 | | | 0.17 | | | | 0.67 | | | | 0.80 | | |
Net realized and unrealized loss
on investments3 | | | (0.63 | ) | | | (6.27 | ) | | | (0.18 | ) | |
Total from Investment Operations | | | (0.46 | ) | | | (5.60 | ) | | | 0.62 | | |
Less Distributions: | |
Distributions from net investment income | | | (0.20 | ) | | | (0.59 | ) | | | (0.42 | ) | |
Distributions from net realized gain | | | — | | | | — | | | | (0.01 | ) | |
Total Distributions | | | (0.20 | ) | | | (0.59 | ) | | | (0.43 | ) | |
Net Asset Value, End of Period | | $ | 28.34 | | | $ | 29.00 | | | $ | 35.19 | | |
Total Return4 | | | -1.61 | %5 | | | -15.96 | % | | | 1.77 | %5 | |
Supplemental Data: | |
Net assets at end of period (000's) | | $ | 35,422 | | | $ | 34,797 | | | $ | 24,633 | | |
Ratios of expenses to average net assets: | |
Before fees waived | | | 1.18 | %6 | | | 1.36 | % | | | 1.58 | %6 | |
After fees waived | | | 0.45 | %6 | | | 0.45 | % | | | 0.63 | %6 | |
Ratios of net investment income to
average net assets: | |
Before fees waived | | | 0.40 | %6 | | | 1.25 | % | | | 2.04 | %6 | |
After fees waived | | | 1.13 | %6 | | | 2.16 | % | | | 2.99 | %6 | |
Portfolio Turnover Rate7 | | | 124 | %5 | | | 211 | % | | | 31 | %5 | |
1 Commenced operations on September 30, 2014.
2 Calculated based on average shares outstanding during the period.
3 The amounts reported for a share outstanding may not accord with the change in aggregate gains and losses in securities for the fiscal period due as reflected in the Statement of Operations due to the timing of capital share transactions in relation to the fluctuating values of the Fund's underlying securities.
4 Total return is calculated assuming an initial investment made at net asset value at the beginning of the period, reinvestment of all dividends and distributions at net asset value during the period, and redemption at net asset value on the last day of the period. Total return calculated for a period of less than one year is not annualized. The total return would have been lower if certain expenses had not been reimbursed/waived by the Adviser.
5 Not annualized.
6 Annualized.
7 Excludes impact of in-kind transactions.
See notes to financial statements.
135
Victory Portfolios II | | Financial Highlights | |
For a capital share outstanding throughout the period
| | | VictoryShares US EQ Income
Enhanced Volatility Wtd ETF | |
| | | Six-Months
Ended
December 31,
2016 | | Year
Ended
June 30,
2016 | | Period
Ended
June 30,
20151 | |
| | | (Unaudited) | | | | | |
Net Asset Value, Beginning of Period | | $ | 38.59 | | | $ | 35.38 | | | $ | 35.00 | | |
Income from Investment Operations: | |
Net investment income2 | | | 0.63 | | | | 1.27 | | | | 1.12 | | |
Net realized and unrealized gain
on investments3 | | | 2.68 | | | | 3.18 | | | | 0.20 | | |
Total from Investment Operations | | | 3.31 | | | | 4.45 | | | | 1.32 | | |
Less Distributions: | |
Distributions from net investment income | | | (0.62 | ) | | | (1.24 | ) | | | (0.94 | ) | |
Total Distributions | | | (0.62 | ) | | | (1.24 | ) | | | (0.94 | ) | |
Net Asset Value, End of Period | | $ | 41.28 | | | $ | 38.59 | | | $ | 35.38 | | |
Total Return4 | | | 8.62 | %5 | | | 12.89 | % | | | 3.77 | %5 | |
Supplemental Data: | |
Net assets at end of period (000's) | | $ | 307,518 | | | $ | 156,278 | | | $ | 86,678 | | |
Ratios of expenses to average net assets: | |
Before fees waived | | | 0.42 | %6 | | | 0.56 | % | | | 0.77 | %6 | |
After fees waived | | | 0.35 | %6 | | | 0.35 | % | | | 0.59 | %6 | |
Ratios of net investment income to
average net assets: | |
Before fees waived | | | 3.06 | %6 | | | 3.30 | % | | | 2.91 | %6 | |
After fees waived | | | 3.13 | %6 | | | 3.51 | % | | | 3.09 | %6 | |
Portfolio Turnover Rate7 | | | 18 | %5 | | | 52 | % | | | 17 | %5 | |
1 Commenced operations on July 1, 2014.
2 Calculated based on average shares outstanding during the period.
3 The amounts reported for a share outstanding may not accord with the change in aggregate gains and losses in securities for the fiscal period due as reflected in the Statement of Operations due to the timing of capital share transactions in relation to the fluctuating values of the Fund's underlying securities.
4 Total return is calculated assuming an initial investment made at net asset value at the beginning of the period, reinvestment of all dividends and distributions at net asset value during the period, and redemption at net asset value on the last day of the period. Total return calculated for a period of less than one year is not annualized. The total return would have been lower if certain expenses had not been reimbursed/waived by the Adviser.
5 Not annualized.
6 Annualized.
7 Excludes impact of in-kind transactions.
See notes to financial statements.
136
Victory Portfolios II | | Financial Highlights | |
For a capital share outstanding throughout the period
| | | VictoryShares US Small Cap
Volatility Wtd ETF | |
| | | Six-Months
Ended
December 31,
2016 | | Period
Ended
June 30,
20161 | |
| | | (Unaudited) | | | |
Net Asset Value, Beginning of Period | | $ | 34.35 | | | $ | 35.00 | | |
Income from Investment Operations: | |
Net investment income2 | | | 0.25 | | | | 0.41 | | |
Net realized and unrealized loss on investments3 | | | 7.21 | | | | (0.72 | ) | |
Total from Investment Operations | | | 7.46 | | | | (0.31 | ) | |
Less Distributions: | |
Distributions from net investment income | | | (0.25 | ) | | | (0.34 | ) | |
Total Distributions | | | (0.25 | ) | | | (0.34 | ) | |
Net Asset Value, End of Period | | $ | 41.56 | | | $ | 34.35 | | |
Total Return4 | | | 21.77 | %5 | | | -0.86 | %5 | |
Supplemental Data: | |
Net assets at end of period (000's) | | $ | 18,703 | | | $ | 10,304 | | |
Ratios of expenses to average net assets: | |
Before fees waived | | | 0.95 | %6 | | | 1.44 | %6 | |
After fees waived | | | 0.35 | %6 | | | 0.35 | %6 | |
Ratios of net investment income to average net assets: | |
Before fees waived | | | 0.72 | %6 | | | 0.18 | %6 | |
After fees waived | | | 1.32 | %6 | | | 1.28 | %6 | |
Portfolio Turnover Rate7 | | | 23 | %5 | | | 50 | %5 | |
1 Commenced operations on July 7, 2015.
2 Calculated based on average shares outstanding during the period.
3 The amounts reported for a share outstanding may not accord with the change in aggregate gains and losses in securities for the fiscal period due as reflected in the Statement of Operations due to the timing of capital share transactions in relation to the fluctuating values of the Fund's underlying securities.
4 Total return is calculated assuming an initial investment made at net asset value at the beginning of the period, reinvestment of all dividends and distributions at net asset value during the period, and redemption at net asset value on the last day of the period. Total return calculated for a period of less than one year is not annualized. The total return would have been lower if certain expenses had not been reimbursed/waived by the Adviser.
5 Not annualized.
6 Annualized.
7 Excludes impact of in-kind transactions.
See notes to financial statements.
137
Victory Portfolios II | | Financial Highlights | |
For a capital share outstanding throughout the period
| | | VictoryShares International
Volatility Wtd ETF | |
| | | Six-Months
Ended
December 31,
2016 | | Period
Ended
June 30,
20161 | |
| | | (Unaudited) | | | |
Net Asset Value, Beginning of Period | | $ | 32.11 | | | $ | 35.00 | | |
Income from Investment Operations: | |
Net investment income2 | | | 0.23 | | | | 0.85 | | |
Net realized and unrealized gain (loss) on investments3 | | | 0.61 | | | | (3.15 | ) | |
Total from Investment Operations | | | 0.84 | | | | (2.30 | ) | |
Less Distributions: | |
Distributions from net investment income | | | (0.32 | ) | | | (0.59 | ) | |
Total Distributions | | | (0.32 | ) | | | (0.59 | ) | |
Net Asset Value, End of Period | | $ | 32.63 | | | $ | 32.11 | | |
Total Return4 | | | 2.61 | %5 | | | -6.58 | %5 | |
Supplemental Data: | |
Net assets at end of period (000's) | | $ | 11,421 | | | $ | 12,844 | | |
Ratios of expenses to average net assets: | |
Before fees waived | | | 1.78 | %6 | | | 2.31 | %6 | |
After fees waived | | | 0.45 | %6 | | | 0.45 | %6 | |
Ratios of net investment income to average net assets: | |
Before fees waived | | | 0.04 | %6 | | | 1.13 | %6 | |
After fees waived | | | 1.37 | %6 | | | 2.99 | %6 | |
Portfolio Turnover Rate7 | | | 24 | %5 | | | 31 | %5 | |
1 Commenced operations on August 19, 2015.
2 Calculated based on average shares outstanding during the period.
3 The amounts reported for a share outstanding may not accord with the change in aggregate gains and losses in securities for the fiscal period due as reflected in the Statement of Operations due to the timing of capital share transactions in relation to the fluctuating values of the Fund's underlying securities.
4 Total return is calculated assuming an initial investment made at net asset value at the beginning of the period, reinvestment of all dividends and distributions at net asset value during the period, and redemption at net asset value on the last day of the period. Total return calculated for a period of less than one year is not annualized. The total return would have been lower if certain expenses had not been reimbursed/waived by the Adviser.
5 Not annualized.
6 Annualized.
7 Excludes impact of in-kind transactions.
See notes to financial statements.
138
Victory Portfolios II | | Financial Highlights | |
For a capital share outstanding throughout the period
| | | VictoryShares Emerging Market
Volatility Wtd ETF | |
| | | Six-Months
Ended
December 31,
2016 | | Period
Ended
June 30,
20161 | |
| | | (Unaudited) | | | |
Net Asset Value, Beginning of Period | | $ | 25.28 | | | $ | 25.00 | | |
Income from Investment Operations: | |
Net investment income2 | | | 0.21 | | | | 0.25 | | |
Net realized and unrealized gain (loss) on investments3 | | | (0.64 | ) | | | 0.13 | | |
Total from Investment Operations | | | (0.43 | ) | | | 0.38 | | |
Less Distributions: | |
Distributions from net investment income | | | (0.31 | ) | | | (0.10 | ) | |
Distributions from net realized gain | | | (0.12 | ) | | | — | | |
Total Distributions | | | (0.43 | ) | | | (0.10 | ) | |
Net Asset Value, End of Period | | $ | 24.42 | | | $ | 25.28 | | |
Total Return4 | | | (1.84 | )%5 | | | 1.56 | %5 | |
Supplemental Data: | |
Net assets at end of period (000's) | | $ | 24,418 | | | $ | 12,642 | | |
Ratios of expenses to average net assets: | |
Before fees waived | | | 2.73 | %6 | | | 6.26 | %6 | |
After fees waived | | | 0.50 | %6 | | | 0.50 | %6 | |
Ratios of net investment income to average net assets: | |
Before fees waived | | | -0.62 | %6 | | | -2.06 | %6 | |
After fees waived | | | 1.61 | %6 | | | 3.70 | %6 | |
Portfolio Turnover Rate7 | | | 17 | %5 | | | 1 | %5 | |
1 Commenced operations on March 22, 2016.
2 Calculated based on average shares outstanding during the period.
3 The amounts reported for a share outstanding may not accord with the change in aggregate gains and losses in securities for the fiscal period due as reflected in the Statement of Operations due to the timing of capital share transactions in relation to the fluctuating values of the Fund's underlying securities.
4 Total return is calculated assuming an initial investment made at net asset value at the beginning of the period, reinvestment of all dividends and distributions at net asset value during the period, and redemption at net asset value on the last day of the period. Total return calculated for a period of less than one year is not annualized. The total return would have been lower if certain expenses had not been reimbursed/waived by the Adviser.
5 Not annualized.
6 Annualized.
7 Excludes impact of in-kind transactions.
See notes to financial statements.
139
Victory Portfolios II | | Financial Highlights | |
For a capital share outstanding throughout the period
| | | VictoryShares US Large Cap
High Div Volatility Wtd ETF | |
| | | Six-Months
Ended
December 31,
2016 | | Period
Ended
June 30,
20161 | |
| | | (Unaudited) | | | |
Net Asset Value, Beginning of Period | | $ | 37.58 | | | $ | 35.00 | | |
Income from Investment Operations: | |
Net investment income2 | | | 0.60 | | | | 1.28 | | |
Net realized and unrealized gain on investments3 | | | 2.62 | | | | 2.35 | | |
Total from Investment Operations | | | 3.22 | | | | 3.63 | | |
Less Distributions: | |
Distributions from net investment income | | | (0.58 | ) | | | (1.05 | ) | |
Total Distributions | | | (0.58 | ) | | | (1.05 | ) | |
Net Asset Value, End of Period | | $ | 40.22 | | | $ | 37.58 | | |
Total Return4 | | | 8.63 | %5 | | | 10.62 | %5 | |
Supplemental Data: | |
Net assets at end of period (000's) | | $ | 78,427 | | | $ | 41,333 | | |
Ratios of expenses to average net assets: | |
Before fees waived | | | 0.48 | %6 | | | 0.72 | %6 | |
After fees waived | | | 0.35 | %6 | | | 0.35 | %6 | |
Ratios of net investment income to average net assets: | |
Before fees waived | | | 2.95 | %6 | | | 3.32 | %6 | |
After fees waived | | | 3.08 | %6 | | | 3.69 | %6 | |
Portfolio Turnover Rate7 | | | 19 | %5 | | | 46 | %5 | |
1 Commenced operations on July 7, 2015.
2 Calculated based on average shares outstanding during the period.
3 The amounts reported for a share outstanding may not accord with the change in aggregate gains and losses in securities for the fiscal period due as reflected in the Statement of Operations due to the timing of capital share transactions in relation to the fluctuating values of the Fund's underlying securities.
4 Total return is calculated assuming an initial investment made at net asset value at the beginning of the period, reinvestment of all dividends and distributions at net asset value during the period, and redemption at net asset value on the last day of the period. Total return calculated for a period of less than one year is not annualized. The total return would have been lower if certain expenses had not been reimbursed/waived by the Adviser.
5 Not annualized.
6 Annualized.
7 Excludes impact of in-kind transactions.
See notes to financial statements.
140
Victory Portfolios II | | Financial Highlights | |
For a capital share outstanding throughout the period
| | | VictoryShares US Small Cap
High Div Volatility Wtd ETF | |
| | | Six-Months
Ended
December 31,
2016 | | Period
Ended
June 30,
20161 | |
| | | (Unaudited) | | | |
Net Asset Value, Beginning of Period | | $ | 35.40 | | | $ | 35.00 | | |
Income from Investment Operations: | |
Net investment income2 | | | 0.70 | | | | 1.18 | | |
Net realized and unrealized gain on investments3 | | | 6.19 | | | | 0.21 | | |
Total from Investment Operations | | | 6.89 | | | | 1.39 | | |
Less Distributions: | |
Distributions from net investment income | | | (0.71 | ) | | | (0.99 | ) | |
Total Distributions | | | (0.71 | ) | | | (0.99 | ) | |
Net Asset Value, End of Period | | $ | 41.58 | | | $ | 35.40 | | |
Total Return4 | | | 19.62 | %5 | | | 4.15 | %5 | |
Supplemental Data: | |
Net assets at end of period (000's) | | $ | 22,869 | | | $ | 14,160 | | |
Ratios of expenses to average net assets: | |
Before fees waived | | | 0.63 | %6 | | | 0.92 | %6 | |
After fees waived | | | 0.35 | %6 | | | 0.35 | %6 | |
Ratios of net investment income to average net assets: | |
Before fees waived | | | 3.42 | %6 | | | 3.02 | %6 | |
After fees waived | | | 3.70 | %6 | | | 3.59 | %6 | |
Portfolio Turnover Rate7 | | | 29 | %5 | | | 78 | %5 | |
1 Commenced operations on July 7, 2015.
2 Calculated based on average shares outstanding during the period.
3 The amounts reported for a share outstanding may not accord with the change in aggregate gains and losses in securities for the fiscal period due as reflected in the Statement of Operations due to the timing of capital share transactions in relation to the fluctuating values of the Fund's underlying securities.
4 Total return is calculated assuming an initial investment made at net asset value at the beginning of the period, reinvestment of all dividends and distributions at net asset value during the period, and redemption at net asset value on the last day of the period. Total return calculated for a period of less than one year is not annualized. The total return would have been lower if certain expenses had not been reimbursed/waived by the Adviser.
5 Not annualized.
6 Annualized.
7 Excludes impact of in-kind transactions.
See notes to financial statements.
141
Victory Portfolios II | | Financial Highlights | |
For a capital share outstanding throughout the period
| | | VictoryShares International
High Div Volatility Wtd ETF | |
| | | Six-Months
Ended
December 31,
2016 | | Period
Ended
June 30,
20161 | |
| | | (Unaudited) | | | |
Net Asset Value, Beginning of Period | | $ | 30.65 | | | $ | 35.00 | | |
Income from Investment Operations: | |
Net investment income2 | | | 0.42 | | | | 1.37 | | |
Net realized and unrealized gain (loss) on investments3 | | | 0.78 | | | | (4.71 | ) | |
Total from Investment Operations | | | 1.20 | | | | (3.34 | ) | |
Less Distributions: | |
Distributions from net investment income | | | (0.56 | ) | | | (1.01 | ) | |
Total Distributions | | | (0.56 | ) | | | (1.01 | ) | |
Net Asset Value, End of Period | | $ | 31.29 | | | $ | 30.65 | | |
Total Return4 | | | 3.92 | %5 | | | -9.63 | %5 | |
Supplemental Data: | |
Net assets at end of period (000's) | | $ | 23,468 | | | $ | 16,855 | | |
Ratios of expenses to average net assets: | |
Before fees waived | | | 0.90 | %6 | | | 1.17 | %6 | |
After fees waived | | | 0.45 | %6 | | | 0.45 | %6 | |
Ratios of net investment income to average net assets: | |
Before fees waived | | | 2.22 | %6 | | | 4.26 | %6 | |
After fees waived | | | 2.67 | %6 | | | 4.98 | %6 | |
Portfolio Turnover Rate7 | | | 35 | %5 | | | 53 | %5 | |
1 Commenced operations on August 19, 2015.
2 Calculated based on average shares outstanding during the period.
3 The amounts reported for a share outstanding may not accord with the change in aggregate gains and losses in securities for the fiscal period due as reflected in the Statement of Operations due to the timing of capital share transactions in relation to the fluctuating values of the Fund's underlying securities.
4 Total return is calculated assuming an initial investment made at net asset value at the beginning of the period, reinvestment of all dividends and distributions at net asset value during the period, and redemption at net asset value on the last day of the period. Total return calculated for a period of less than one year is not annualized. The total return would have been lower if certain expenses had not been reimbursed/waived by the Adviser.
5�� Not annualized.
6 Annualized.
7 Excludes impact of in-kind transactions.
See notes to financial statements.
142
Victory Portfolios II | | Notes to Consolidated Financial Statements
December 31, 2016 | |
(Unaudited)
1. Organization:
Victory Portfolios II Trust (formerly Compass EMP Funds Trust) (the "Trust"), was organized on April 11, 2012 as a Delaware statutory trust (formerly a Delaware business trust). The Trust is registered under the Investment Company Act of 1940, as amended, (the "1940 Act"), as an open-end investment company and thus follows accounting and reporting guidance for investment companies. The Trust is comprised of seventeen Funds (each a "Fund" and collectively, the "Funds"), eleven of which are exchange-traded funds, and is authorized to issue an unlimited number of shares, which are units of beneficial interest with no par value. Each Fund is classified as diversified under the 1940 Act.
Funds | | Diversification
Classification | |
VictoryShares US 500 Volatility Wtd ETF | | Diversified | |
VictoryShares US Discovery Enhanced Volatility Wtd ETF | | Diversified | |
VictoryShares US 500 Enhanced Volatility Wtd ETF | | Diversified | |
VictoryShares Developed Enhanced Volatility Wtd ETF | | Diversified | |
VictoryShares US EQ Income Enhanced Volatility Wtd ETF | | Diversified | |
VictoryShares US Small Cap Volatility Wtd ETF | | Diversified | |
VictoryShares International Volatility Wtd ETF | | Diversified | |
VictoryShares Emerging Market Volatility Wtd ETF | | Diversified | |
VictoryShares US Large Cap High Div Volatility Wtd ETF | | Diversified | |
VictoryShares US Small Cap High Div Volatility Wtd ETF | | Diversified | |
VictoryShares International High Div Volatility Wtd ETF | | Diversified | |
The following Funds commenced operations on July 1, 2014 and their objectives are as follows:
VictoryShares US 500 Volatility Wtd ETF — seeks to match the performance of the CEMP U.S. Large Cap 500 Volatility Weighted Index before fees and expenses.
VictoryShares US 500 Enhanced Volatility Wtd ETF — seeks to match the performance of the CEMP U.S. Large Cap 500 Long/Cash Volatility Weighted Index before fees and expenses.
VictoryShares US EQ Income Enhanced Volatility Wtd ETF — seeks to match the performance of the CEMP U.S. Large Cap High Dividend 100 Long/Cash Volatility Weighted Index before fees and expenses.
The following Fund commenced operations on July 31, 2014 and its objective is as follows:
VictoryShares US Discovery Enhanced Volatility Wtd ETF — seeks to match the performance of the CEMP U.S. Small Cap 500 Long/Cash Volatility Weighted Index before fees and expenses.
The following Fund commenced operations on September 30, 2014 and its objective is as follows:
VictoryShares Developed Enhanced Volatility Wtd ETF — seeks to match the performance of the CEMP International 500 Long/Cash Volatility Weighted Index before fees and expenses.
The following Funds commenced operations on July 7, 2015 and their objectives are as follows:
VictoryShares US Small Cap Volatility Wtd ETF — seeks to match the performance of the CEMP U.S. Small Cap 500 Volatility Weighted Index before fees and expenses.
VictoryShares US Large Cap High Div Volatility Wtd ETF — seeks to match the performance of the CEMP U.S. Large Cap High Dividend 100 Volatility Weighted Index before fees and expenses.
VictoryShares US Small Cap High Div Volatility Wtd ETF — seeks to match the performance of the CEMP U.S. Small Cap High Dividend 100 Volatility Weighted Index before fees and expenses.
The following Funds commenced operations on August 19, 2015 and their objectives are as follows:
VictoryShares International Volatility Wtd ETF — seeks to match the performance of the CEMP International 500 Volatility Weighted Index before fees and expenses.
VictoryShares International High Div Volatility Wtd ETF — seeks to match the performance of the CEMP International High Dividend 100 Volatility Weighted Index before fees and expenses.
143
Victory Portfolios II | | Notes to Consolidated Financial Statements — continued
December 31, 2016 | |
(Unaudited)
The following Fund commenced operations on March 22, 2016 and its objective is as follows:
VictoryShares Emerging Market Volatility Wtd ETF — seeks to match the performance of the CEMP Emerging Market 500 Volatility Weighted Index before fees and expenses.
Under the Trust's organizational documents, its officers and trustees are indemnified against certain liabilities arising out of the performance of their duties to the Trust. In addition, in the normal course of business, the Trust enters into contracts with its vendors and others that provide for general indemnifications. The Trust and Funds' maximum exposure under these arrangements is unknown, as this would involve future claims that may be made against the Funds. However, based on experience, the Funds expect that risk of loss to be remote.
2. Significant Accounting Policies:
Shares of the Funds are listed and traded on NASDAQ Stock Market, LLC ("Exchange"). The Funds will issue and redeem shares of a Fund ("Shares") at net asset value ("NAV") only in aggregations of 50,000 Shares (each a "Creation Unit"). The Funds will issue and redeem Creation Units principally in exchange for a basket of securities included in the respective Fund's Index (the "Deposit Securities"), together with the deposit of a specified cash payment (the "Cash Component"), plus a transaction fee. Shares will trade on the Exchange at market prices that may be below, at, or above NAV. Shares of a Fund may only be purchased or redeemed by certain financial institutions ("Authorized Participants"). An Authorized Participant is either (i) a broker-dealer or other participant in the clearing process through the Continuous Net Settlement System of the National Securities Clearing Corporation or (ii) a DTC participant and, in each case, must have executed a Participant Agreement with the Distributor. Most retail investors do not qualify as Authorized Participants nor have the resources to buy and sell whole Creation Units. Therefore, they are unable to purchase or redeem the shares directly from a Fund. In addition, shares may be issued in advance of receipt of Deposit Securities subject to various conditions, including a requirement to maintain on deposit with the Trust cash equal to up to 105% of the market value of the missing Deposit Securities. In each instance of such cash creations or redemptions, transaction fees may be imposed and may be higher than the transaction fees associated with in-kind creations or redemptions.
Each Fund may issue an unlimited number of shares of beneficial interest, with no par value. Shares of each Fund have equal rights and privileges. A purchase (i.e., creation) transaction fee is imposed for the transfer and other transactional costs associated with the purchase of Creation Units. In addition, a variable fee may be charged on all cash transactions or substitutes for Creation Units of up to a maximum 2% as a percentage of the value of the Creation Units subject to the transaction. Variable fees received by each Fund are displayed in the Capital Share Transaction section of the Statements of Changes in Net Assets as an increase to Paid-In-Capital. The table below shows what each Fund Charges for the standard fixed creation fee.
Fund | | Fixed Fee | |
VictoryShares US 500 Volatility Wtd ETF | | $ | 750 | | |
VictoryShares US Discovery Enhanced Volatility Wtd ETF | | $ | 750 | | |
VictoryShares US 500 Enhanced Volatility Wtd ETF | | $ | 750 | | |
VictoryShares Developed Enhanced Volatility Wtd ETF | | $ | 5,000 | | |
VictoryShares US EQ Income Enhanced Volatility Wtd ETF | | $ | 250 | | |
VictoryShares US Small Cap Volatility Wtd ETF | | $ | 750 | | |
VictoryShares International Volatility Wtd ETF | | $ | 6,000 | | |
VictoryShares Emerging Market Volatility Wtd ETF | | $ | 9,000 | | |
VictoryShares US Large Cap High Div Volatility Wtd ETF | | $ | 250 | | |
VictoryShares US Small Cap High Div Volatility Wtd ETF | | $ | 250 | | |
VictoryShares International High Div Volatility Wtd ETF | | $ | 1,750 | | |
The following is a summary of significant accounting policies followed by each Fund in the preparation of its financial statements. These policies are in conformity with accounting principles generally accepted in the United States of America ("GAAP"). The preparation of financial statements requires management to make estimates and assumptions that affect the reported amounts of
144
Victory Portfolios II | | Notes to Consolidated Financial Statements — continued
December 31, 2016 | |
(Unaudited)
assets and liabilities and disclosure of contingent assets and liabilities at the date of the financial statements and the reported amounts of income and expenses for the period. Actual results could differ from those estimates. The Funds follow the specialized accounting and reporting requirements under GAAP that are applicable to investment companies (Financial Accounting Standards Board ("FASB") Accounting Standards Codification Topic 946 Financial Services — Investment Companies).
Securities Valuation:
The net asset values per share of the Funds are determined as of the close of regular trading on the New York Stock Exchange ("NYSE") (normally 4:00 p.m., Eastern Time) on each day when the NYSE is open for trading. Securities for which market quotations are available are valued as follows: (a) each listed security is valued at its closing price obtained from the respective primary exchange on which the security is listed, or, if there were no sales on that day, at its last reported current mean price; (b) each unlisted security is valued at the last current bid price obtained from the NASDAQ System; (c) United States Government and Agency obligations are valued based upon bid quotations from the Federal Reserve Bank for identical or similar obligations; (d) short-term money market instruments (such as certificates of deposit, bankers' acceptances and commercial paper) are most often valued by bid quotations or by reference to bid quotations of available yields for similar instruments of issuers with similar credit ratings. All these prices are obtained from services, which collect and disseminate such market prices. Bid quotations for short-term money market instruments reported by such a service are the bid quotations reported to it by the major dealers. Short-term securities with remaining maturities of sixty days or less for which market quotations and information from pricing services are not readily available are valued either at amortized cost or at original cost plus accrued interest, both of which approximate current value. When approved by the Trustees, certain securities may be valued on the basis of valuations provided by an independent pricing service when such prices the Trustees believe reflect the fair value of such securities. In the absence of an ascertainable market value, or if an event occurs after the close of trading on the domestic or foreign exchange or market on which the security is principally traded (prior to the time the NAV is calculated) that materially affects fair value, assets are valued at their fair value as determined by the Adviser using methods and procedures reviewed and approved by the Trustees. Options contracts listed on a securities exchange or board of trade for which market quotations are readily available shall be valued at the last quoted sales price or, in the absence of a sale, at the mean between the current bid and ask prices on the day of valuation.
In accordance with the Trust's good faith pricing guidelines, the Adviser is required to consider all appropriate factors relevant to the value of securities for which it has determined other pricing sources are not available or reliable. No single standard for determining fair value exists, since fair value depends upon the circumstances of each individual case. As a general principle, the current fair value of securities being valued by the Adviser would appear to be the amount which the owner might reasonably expect to receive for them upon their current sale. Methods which are in accord with this principle may, for example, be based on (i) a multiple of earnings; (ii) a discount from market of a similar freely traded security (including a derivative security or a basket of securities traded on other markets, exchanges or among dealers); or (iii) yield to maturity with respect to debt issues, or a combination of these and other methods.
Trading in securities on Far Eastern securities exchanges and over-the-counter markets is normally completed well before the close of business on each business day in New York (i.e., a day on which the NYSE is open). In addition, Far Eastern securities trading generally or in a particular country or countries may not take place on all business days in New York. Furthermore, trading takes place in Japanese markets on certain Saturdays in various foreign markets on days, which are not business days in New York, and on which a Fund's net asset value is not calculated. Each Fund calculates net asset value per share, and therefore effects sales, redemptions and repurchases of its shares, as of the close of regular trading on the NYSE once on each day on which the NYSE is open. Such calculation may not take place contemporaneously with the determination of the prices of the majority of the portfolio securities used in such calculation. Futures are valued at the settlement price established each day by the board of exchange on which they are traded. The daily
145
Victory Portfolios II | | Notes to Consolidated Financial Statements — continued
December 31, 2016 | |
(Unaudited)
settlement prices for financial futures are provided by an independent source. On days when there is excessive volume or market volatility, the settlement price may not be available at the time at which a Fund calculates its NAV. On such days, the best available price (which is typically the last sales price) may be used to value the Fund's futures position, in which case the Fund will not consider any difference between the eventual settlement price and the best available price used to be a basis for determining that an incorrect NAV calculation has occurred.
Other securities and assets for which market quotations are not readily available or for which valuation cannot be provided are valued as determined in good faith in accordance with procedures approved by the Board of Trustees of the Trust.
In accordance with the authoritative guidance on fair value measurements and disclosure under GAAP, the Funds disclose fair value of their investments in a hierarchy that prioritizes the inputs to valuation techniques used to measure fair value. The objective of a fair value measurement is to determine the price that would be received to sell an asset or paid to transfer a liability in an orderly transaction between market participants at the measurement date (an exit price). Accordingly, the fair value hierarchy gives the highest priority to quoted prices (unadjusted) in active markets for identical assets or liabilities (Level 1) and the lowest priority to unobservable inputs (Level 3). The three levels of the fair value hierarchy under GAAP are described below:
• Level 1 — quoted prices in active markets for identical securities
• Level 2 — other significant observable inputs (including quoted prices for similar securities and identical securities in inactive markets, interest rates, amortized cost, credit risk, etc.)
• Level 3 — significant unobservable inputs (including the Funds' own assumptions in determining the fair value of investments)
The inputs or methodology used for valuing securities are not necessarily an indication of the risk associated with investing in those securities.
The following is a summary of the valuation inputs, representing 100% of the Funds' investments, used to value the Funds' assets and liabilities as of December 31, 2016:
Description^ | | Level 1 | | Level 2 | | Level 3 | | Total | |
VictoryShares US 500 Volatility Wtd ETF | |
Common Stocks* | | $ | 108,694,041 | | | $ | — | | | $ | — | | | $ | 108,694,041 | | |
Short-Term Investments | | | 130,818 | | | | — | | | | — | | | | 130,818 | | |
Total | | $ | 108,824,859 | | | $ | — | | | $ | — | | | $ | 108,824,859 | | |
Other Financial Instruments^ | |
Futures | | $ | 233 | | | $ | — | | | $ | — | | | $ | 233 | | |
VictoryShares US Discovery Enhanced Volatility Wtd ETF | |
Common Stocks* | | $ | 36,502,185 | | | $ | — | | | $ | — | | | $ | 36,502,185 | | |
Short-Term Investments | | | 15,358 | | | | — | | | | — | | | | 15,358 | | |
Total | | $ | 36,517,543 | | | $ | — | | | $ | — | | | $ | 36,517,543 | | |
Other Financial Instruments^ | |
Futures | | $ | (44 | ) | | $ | — | | | $ | — | | | $ | (44 | ) | |
VictoryShares US 500 Enhanced Volatility Wtd ETF | |
Common Stocks* | | $ | 239,451,729 | | | $ | — | | | $ | — | | | $ | 239,451,729 | | |
Short-Term Investments | | | 244,890 | | | | — | | | | — | | | | 244,890 | | |
Total | | $ | 239,696,619 | | | $ | — | | | $ | — | | | $ | 239,696,619 | | |
Other Financial Instruments^ | |
Futures | | $ | (1,682 | ) | | $ | — | | | $ | — | | | $ | (1,682 | ) | |
VictoryShares Developed Enhanced Volatility Wtd ETF | |
Common Stocks* | | $ | 8,929,862 | | | $ | — | | | $ | 570 | | | $ | 8,930,432 | | |
Short-Term Investments | | | 26,487,548 | | | | — | | | | — | | | | 26,487,548 | | |
Total | | $ | 35,417,410 | | | $ | — | | | $ | 570 | | | $ | 35,417,980 | | |
146
Victory Portfolios II | | Notes to Consolidated Financial Statements — continued
December 31, 2016 | |
(Unaudited)
Description^ | | Level 1 | | Level 2 | | Level 3 | | Total | |
VictoryShares US EQ Income Enhanced Volatility Wtd ETF | |
Common Stocks* | | $ | 306,521,359 | | | $ | — | | | $ | — | | | $ | 306,521,359 | | |
Short-Term Investments | | | 443,461 | | | | — | | | | — | | | | 443,461 | | |
Total | | $ | 306,964,820 | | | $ | — | | | $ | — | | | $ | 306,964,820 | | |
Other Financial Instruments^ | |
Futures | | $ | (2,620 | ) | | $ | — | | | $ | — | | | $ | (2,620 | ) | |
VictoryShares US Small Cap Volatility Wtd ETF | |
Common Stocks* | | $ | 18,691,811 | | | $ | — | | | $ | — | | | $ | 18,691,811 | | |
Short-Term Investments | | | 8,523 | | | | — | | | | — | | | | 8,523 | | |
Total | | $ | 18,700,334 | | | $ | — | | | $ | — | | | $ | 18,700,334 | | |
VictoryShares International Volatility Wtd ETF | |
Common Stocks* | | $ | 11,390,083 | | | $ | — | | | $ | — | | | $ | 11,390,083 | | |
Short-Term Investments | | | 11,002 | | | | — | | | | — | | | | 11,002 | | |
Total | | $ | 11,401,085 | | | $ | — | | | $ | — | | | $ | 11,401,085 | | |
VictoryShares Emerging Market Volatility Wtd ETF | |
Common Stocks* | | $ | 24,264,500 | | | $ | 36,263 | | | $ | — | | | $ | 24,300,763 | | |
Rights | | | — | | | | 1,604 | | | | — | | | | 1,604 | | |
Total | | $ | 24,264,500 | | | $ | 37,867 | | | $ | — | | | $ | 24,302,367 | | |
VictoryShares US Large Cap High Div Volatility Wtd ETF | |
Common Stocks* | | $ | 78,131,481 | | | $ | — | | | $ | — | | | $ | 78,131,481 | | |
Short-Term Investments | | | 133,245 | | | | — | | | | — | | | | 133,245 | | |
Total | | $ | 78,264,726 | | | $ | — | | | $ | — | | | $ | 78,264,726 | | |
Other Financial Instruments^ | |
Futures | | $ | (1,019 | ) | | $ | — | | | $ | — | | | $ | (1,019 | ) | |
VictoryShares US Small Cap High Div Volatility Wtd ETF | |
Common Stocks* | | $ | 22,738,436 | | | $ | — | | | $ | — | | | $ | 22,738,436 | | |
Short-Term Investments | | | 61,539 | | | | — | | | | — | | | | 61,539 | | |
Total | | $ | 22,799,975 | | | $ | — | | | $ | — | | | $ | 22,799,975 | | |
Other Financial Instruments^ | |
Futures | | $ | (44 | ) | | $ | — | | | $ | — | | | $ | (44 | ) | |
VictoryShares International High Div Volatility Wtd ETF | |
Common Stocks* | | $ | 23,324,287 | | | $ | — | | | $ | — | | | $ | 23,324,287 | | |
Short-Term Investments | | | 89,845 | | | | — | | | | — | | | | 89,845 | | |
Total | | $ | 23,414,132 | | | $ | — | | | $ | — | | | $ | 23,414,132 | | |
Other Financial Instruments^ | |
Futures | | $ | (1,209 | ) | | $ | — | | | $ | — | | | $ | (1,209 | ) | |
* Please refer to the Schedules of Investments for industry classifications.
^ Other Financial instruments are derivative instruments not reflected in the Schedule of Investments, such as futures. These instruments are reflected at the unrealized appreciation (depreciation) on the instrument.
For the period ended December 31, 2016, there were no transfers into or out of Level 1, 2, or 3 during the current period presented. It is the Funds' policy to record transfers into or out of Fair Value Levels at the end of the period.
147
Victory Portfolios II | | Notes to Consolidated Financial Statements — continued
December 31, 2016 | |
(Unaudited)
The following is a reconciliation of investments in which significant unobservable inputs (Level 3) were used in determining fair value:
VictoryShares
Developed
Enhanced
Volatility Wtd
ETF | | Balance
as of
06/30/2016 | | Net
Realized
Gain
(Loss) | | Change in
Net
Unrealized
Appreciation
(Depreciation) | | Purchases | | Sales | | Transfers
Into
Level 3 | | Transfers
Out of
Level 3 | | Balance
as of
12/31/2016 | | Net
Change in
Unrealized
Depreciation
on securities
held at
12/31/2016 | |
Common Stocks | | $ | 570 | | | $ | — | | | $ | — | | | $ | — | | | $ | — | | | $ | — | | | $ | — | | | $ | 570 | | | $ | — | | |
The following is a summary of quantitative information about Level 3 Fair Value Measurements:
VictoryShares
Developed
Enhanced
Volatility Wtd
ETF | | Fair Value
as of
12/31/2016* | | Valuation
Techniques | | Unobservable
Input | | Input Values | | Impact to valuation from an increase to input | |
Common Stocks
| | $ | 570
| | | Market
Comparables
| | U.S. OTC
Equivalent
| | $ | 0.17
| | | Significant changes in the U.S. OTC
equivalent quotes would result in direct
and proportional changes in the fair value
of the security. | |
* Level 3 securities are typically valued by the Adviser. The appropriateness of fair values for these securities is monitored on an ongoing basis, by the Adviser, which may include back testing, results of vendor due diligence, unchanged price review and consideration of market and/or sector events.
Foreign Currency:
Investment securities and other assets and liabilities denominated in foreign currencies are translated into U.S. dollar amounts at the date of valuation. Purchases and sales of investment securities and income and expense items denominated in foreign currencies are translated into U.S. dollar amounts on the respective dates of such transactions.
The Funds do not isolate that portion of the results of operations resulting from changes in foreign exchange rates on investments from the fluctuations arising from changes in market prices of securities held. Such fluctuations are included with the net realized and unrealized gain or loss from investments.
The Funds report net realized foreign exchange gains or losses that arise from sales of foreign currencies, currency gains or losses realized between the trade and settlement dates on securities transactions, and the difference between the amounts of dividends, interest, and foreign withholding taxes recorded on the Funds' books and the U.S. dollar equivalent of the amounts actually received or paid. Net unrealized foreign gains and losses arise from changes in the fair values of assets and liabilities, other than investments in securities at fiscal period end, resulting from changes in exchange rates.
Futures Contracts:
Each Fund may invest in futures contracts to hedge or manage risks associated with the Funds' securities investments or to gain exposure to certain asset classes or markets. As required by the 1940 Act, the Funds may purchase or sell futures contracts only if the Funds' liabilities for the futures position are "covered" by an offsetting position in a futures contract or by the Funds segregating liquid assets equal to the Funds' liabilities on the futures contract. Upon entering into a financial futures contract, a Fund is required to pledge to the broker an amount of cash, U.S. government securities or other assets, equal to a certain percentage of the contract amount (initial margin deposit). Subsequent payments, known as "variation margin," are made or received by the
148
Victory Portfolios II | | Notes to Consolidated Financial Statements — continued
December 31, 2016 | |
(Unaudited)
Funds on a daily basis. The Funds record an unrealized gain or loss by marking each futures contract to market. A realized gain or loss is recorded when the contract is closed. Should market conditions move unexpectedly, the Funds may not achieve the anticipated benefits of the financial futures contracts and may realize a loss. The use of futures transactions involves the risk of imperfect correlation in movements in the price of futures contracts, interest rates and the underlying assets. Futures contracts may have off-balance sheet risk. Off-balance sheet risk exists when the maximum potential loss on a particular financial instrument is greater than the value of such financial instrument, as reflected in the Statements of Assets and Liabilities.
Positions in futures contracts may be closed out only on an exchange that provides a secondary market for such futures. However, there can be no assurance that a liquid secondary market will exist for any particular futures contract at any specific time. Thus, it may not be possible to close a futures position. In the event of adverse price movements, the Funds may be required to make cash payments to maintain their required margin. In such situations, if the Funds had insufficient cash, they might have to sell portfolio securities to meet margin requirements at a time when it would be disadvantageous to do so. In addition, the Funds might be required to make delivery of the underlying instruments of futures contracts they hold. The inability to close positions in futures could also have an adverse impact on the Funds' ability to hedge or manage risks effectively.
Successful use of futures by the Funds is also subject to the Adviser's ability to predict movements correctly in the direction of the market. There is typically an imperfect correlation between movements in the price of the future and movements in the price of the assets that are the subject of the hedge. In addition, the price of futures may not correlate perfectly with movement in the cash market due to certain market distortions. Due to the possibility of price distortion in the futures market and because of the imperfect correlation between the movements in the cash market and movements in the price of futures, a correct forecast of general market trends or interest rate movements by the Adviser may still not result in a successful hedging transaction over a short time frame.
The trading of futures contracts is also subject to the risk of trading halts, suspension, exchange or clearing house equipment failures, government intervention, insolvency of a commodities or brokerage firm or clearing house or other disruption of normal trading activity, which could at times make it difficult or impossible to liquidate existing positions or to recover excess variation margin payments.
The Funds will purchase or sell futures contracts in accordance with the Commodity Futures Trading Commission ("CFTC") regulations.
GAAP requires disclosures about the Funds' derivative and hedging activities, including how such activities are accounted for and their effect on the Funds' financial position, performance and cash flows.
Derivatives Disclosure —
Fair Values of Derivative Instruments in the Funds* as of December 31, 2016:
VictoryShares US 500 Volatility Wtd ETF
| | | Asset Derivatives | | Liability Derivatives | |
| | | Balance Sheet Location | | Value | | Balance Sheet Location | | Value | |
Equity Contracts —
Futures* | | Unrealized appreciation
on futures contracts | | $ | 233 | | | Unrealized depreciation
on futures contracts | | $ | — | | |
* Includes cumulative appreciation/depreciation as reported on Schedule of Investments.
Amount of Realized Gain on Derivatives
Recognized in Income | | Value | | Change in Unrealized Appreciation on
Derivatives Recognized in Income | | Value | |
Equity Contracts — Futures | | $ | 9,918 | | | Equity Contracts — Futures | | $ | 233 | | |
149
Victory Portfolios II | | Notes to Consolidated Financial Statements — continued
December 31, 2016 | |
(Unaudited)
VictoryShares US Discovery Enhanced Volatility Wtd ETF
| | | Asset Derivatives | | Liability Derivatives | |
| | | Balance Sheet Location | | Value | | Balance Sheet Location | | Value | |
Equity Contracts —
Futures* | | Unrealized appreciation
on futures contracts | | $ | — | | | Unrealized depreciation
on futures contracts | | $ | 44 | | |
* Includes cumulative appreciation/depreciation as reported on Schedule of Investments.
Amount of Realized Gain on Derivatives
Recognized in Income | | Value | | Change in Unrealized Depreciation on
Derivatives Recognized in Income | | Value | |
Equity Contracts — Futures | | $ | 15,294 | | | Equity Contracts — Futures | | $ | (44 | ) | |
VictoryShares US 500 Enhanced Volatility Wtd ETF
| | | Asset Derivatives | | Liability Derivatives | |
| | | Balance Sheet Location | | Value | | Balance Sheet Location | | Value | |
Equity Contracts —
Futures* | | Unrealized appreciation
on futures contracts | | $ | — | | | Unrealized depreciation
on futures contracts | | $ | 1,682 | | |
* Includes cumulative appreciation/depreciation as reported on Schedule of Investments.
Amount of Realized Gain on Derivatives
Recognized in Income | | Value | | Change in Unrealized Depreciation on
Derivatives Recognized in Income | | Value | |
Equity Contracts — Futures | | $ | 19,552 | | | Equity Contracts — Futures | | $ | (1,888 | ) | |
VictoryShares Developed Enhanced Volatility Wtd ETF
Amount of Realized Loss on Derivatives
Recognized in Income | | Value | | Change in Unrealized Appreciation on
Derivatives Recognized in Income | | Value | |
Equity Contracts — Futures | | $ | (11,188 | ) | | Equity Contracts — Futures | | $ | 2,139 | | |
VictoryShares US EQ Income Enhanced Volatility Wtd ETF
| | | Asset Derivatives | | Liability Derivatives | |
| | | Balance Sheet Location | | Value | | Balance Sheet Location | | Value | |
Equity Contracts —
Futures* | | Unrealized appreciation
on futures contracts | | $ | — | | | Unrealized depreciation
on futures contracts | | $ | 2,620 | | |
* Includes cumulative appreciation/depreciation as reported on Schedule of Investments.
Amount of Realized Gain on Derivatives
Recognized in Income | | Value | | Change in Unrealized Depreciation on
Derivatives Recognized in Income | | Value | |
Equity Contracts — Futures | | $ | 59,882 | | | Equity Contracts — Futures | | $ | (3,894 | ) | |
VictoryShares US Small Cap Volatility Wtd ETF
Amount of Realized Gain on Derivatives
Recognized in Income | | Value | | Change in Unrealized Appreciation on
Derivatives Recognized in Income | | Value | |
Equity Contracts — Futures | | $ | 574 | | | Equity Contracts — Futures | | $ | — | | |
VictoryShares International Volatility Wtd ETF
Amount of Realized Gain on Derivatives
Recognized in Income | | Value | | Change in Unrealized Depreciation on
Derivatives Recognized in Income | | Value | |
Equity Contracts — Futures | | $ | 4,105 | | | Equity Contracts — Futures | | $ | (2,561 | ) | |
150
Victory Portfolios II | | Notes to Consolidated Financial Statements — continued
December 31, 2016 | |
(Unaudited)
VictoryShares Emerging Market Volatility Wtd ETF
Amount of Realized Gain on Derivatives
Recognized in Income | | Value | | Change in Unrealized Depreciation on
Derivatives Recognized in Income | | Value | |
Equity Contracts — Futures | | $ | 9,129 | | | Equity Contracts — Futures | | $ | (2,251 | ) | |
VictoryShares US Large Cap High Div Volatility Wtd ETF
| | | Asset Derivatives | | Liability Derivatives | |
| | | Balance Sheet Location | | Value | | Balance Sheet Location | | Value | |
Equity Contracts —
Futures* | | Unrealized appreciation
on futures contracts | | $ | — | | | Unrealized depreciation
on futures contracts | | $ | 1,019 | | |
* Includes cumulative appreciation/depreciation as reported on Schedule of Investments.
Amount of Realized Gain on Derivatives
Recognized in Income | | Value | | Change in Unrealized Depreciation on
Derivatives Recognized in Income | | Value | |
Equity Contracts — Futures | | $ | 19,603 | | | Equity Contracts — Futures | | $ | (1,019 | ) | |
VictoryShares US Small Cap High Div Volatility Wtd ETF
| | | Asset Derivatives | | Liability Derivatives | |
| | | Balance Sheet Location | | Value | | Balance Sheet Location | | Value | |
Equity Contracts —
Futures* | | Unrealized appreciation
on futures contracts | | $ | — | | | Unrealized depreciation
on futures contracts | | $ | 44 | | |
* Includes cumulative appreciation/depreciation as reported on Schedule of Investments.
Amount of Realized Loss on Derivatives
Recognized in Income | | Value | | Change in Unrealized Depreciation on
Derivatives Recognized in Income | | Value | |
Equity Contracts — Futures | | $ | (2,465 | ) | | Equity Contracts — Futures | | $ | (44 | ) | |
VictoryShares International High Div Volatility Wtd ETF
| | | Asset Derivatives | | Liability Derivatives | |
| | | Balance Sheet Location | | Value | | Balance Sheet Location | | Value | |
Equity Contracts —
Futures* | | Unrealized appreciation
on futures contracts | | $ | — | | | Unrealized depreciation
on futures contracts | | $ | 1,209 | | |
* Includes cumulative appreciation/depreciation as reported on Schedule of Investments.
Amount of Realized Loss on Derivatives
Recognized in Income | | Value | | Change in Unrealized Appreciation on
Derivatives Recognized in Income | | Value | |
Equity Contracts — Futures | | $ | (241 | ) | | Equity Contracts — Futures | | $ | 930 | | |
The average monthly notional value of futures during the period ended December 31, 2016 were as follows:
Fund | | Long Futures | |
VictoryShares US 500 Volatility Wtd ETF | | $ | 145,504 | | |
VictoryShares US Discovery Enhanced Volatility Wtd ETF | | $ | 51,776 | | |
VictoryShares US 500 Enhanced Volatility Wtd ETF | | $ | 343,597 | | |
VictoryShares Developed Enhanced Volatility Wtd ETF | | $ | 154,444 | | |
VictoryShares US EQ Income Enhanced Volatility Wtd ETF | | $ | 452,968 | | |
VictoryShares US Small Cap Volatility Wtd ETF | | $ | — | | |
VictoryShares International Volatility Wtd ETF | | $ | 83,420 | | |
VictoryShares Emerging Market Volatility Wtd ETF | | $ | 59,009 | | |
151
Victory Portfolios II | | Notes to Consolidated Financial Statements — continued
December 31, 2016 | |
(Unaudited)
Fund | | Long Futures | |
VictoryShares US Large Cap High Div Volatility Wtd ETF | | $ | 126,368 | | |
VictoryShares US Small Cap High Div Volatility Wtd ETF | | $ | 11,308 | | |
VictoryShares International High Div Volatility Wtd ETF | | $ | 13,963 | | |
Offsetting of Financial Assets and Derivatives Assets
The Funds are subject to various Master Netting Arrangements, which govern the terms of certain transactions with select counterparties. The Master Netting Arrangements allow the Funds to close out and net total exposure to a counterparty in the event of a default with respect to all the transactions governed under a single agreement with a counterparty. The Master Netting Arrangements also specify collateral posting arrangements at pre-arranged exposure levels. Under the Master Netting Arrangements, collateral is routinely transferred if the total net exposure to certain transactions (net of existing collateral already in place) governed under the relevant Master Netting Arrangement with a counterparty in a given account exceeds a specified threshold depending on the counterparty and the type of Master Netting Arrangement.
The table below, as of December 31, 2016, discloses both gross information and net information about instruments and transactions eligible for offset in the Statements of Assets and Liabilities, and instruments and transactions that are subject to an agreement similar to a master netting agreement as well as amounts related to collateral held at clearing brokers and counterparties.
| Assets | | Gross Amounts not
offset in the
Statement of Assets
and Liabilities | |
| | Gross Amounts
of Recognized
Liabilities | | Gross
Amounts
Offset in the
Statement
of Assets
and
Liabilities | | Net
Amounts
Presented in
the
Statement
of Assets
and Liabilities | | Financial
Instruments | | Cash
Collateral | | Net Amount | |
VictoryShares US 500 Volatility Wtd ETF | |
Description / Counterparty | |
Futures
Goldman
Sachs & Co. | | $ | 233 | | | $ | — | | | $ | 233 | | | $ | — | | | $ | — | | | $ | 233 | | |
| Liabilities | | Gross Amounts not
offset in the
Statement of Assets
and Liabilities | |
| | Gross Amounts
of Recognized
Liabilities | | Gross
Amounts
Offset in the
Statement
of Assets
and
Liabilities | | Net
Amounts
Presented in
the
Statement
of Assets
and Liabilities | | Financial
Instruments | | Cash
Collateral | | Net Amount | |
VictoryShares US Discovery Enhanced Volatility Wtd ETF | |
Description / Counterparty | |
Futures
Goldman
Sachs & Co. | | $ | (44 | ) | | $ | — | | | $ | (44 | ) | | $ | — | | | $ | 44 | | | $ | — | | |
VictoryShares US 500 Enhanced Volatility Wtd ETF | |
Description / Counterparty | |
Futures
Goldman
Sachs & Co. | | $ | (1,682 | ) | | $ | — | | | $ | (1,682 | ) | | $ | — | | | $ | 1,682 | | | $ | — | | |
152
Victory Portfolios II | | Notes to Consolidated Financial Statements — continued
December 31, 2016 | |
(Unaudited)
Liabilities | | Gross Amounts not
offset in the
Statement of Assets
and Liabilities | |
| | | Gross Amounts
of Recognized
Liabilities | | Gross
Amounts
Offset in the
Statement
of Assets
and
Liabilities | | Net
Amounts
Presented in
the
Statement
of Assets
and Liabilities | | Financial
Instruments | | Cash
Collateral | | Net Amount | |
VictoryShares US EQ Income Enhanced Volatility Wtd ETF | |
Description / Counterparty | |
Futures
Goldman
Sachs & Co. | | $ | (2,620 | ) | | $ | — | | | $ | (2,620 | ) | | $ | — | | | $ | 2,620 | | | $ | — | | |
VictoryShares US Large Cap High Div Volatility Wtd ETF | |
Description / Counterparty | |
Futures
Goldman
Sachs & Co. | | $ | (1,019 | ) | | $ | — | | | $ | (1,019 | ) | | $ | — | | | $ | 1,019 | | | $ | — | | |
VictoryShares US Small Cap High Div Volatility Wtd ETF | |
Description / Counterparty | |
Futures | |
Goldman
Sachs & Co. | | $ | (44 | ) | | $ | — | | | $ | (44 | ) | | $ | — | | | $ | 44 | | | $ | — | | |
VictoryShares International High Div Volatility Wtd ETF | |
Description / Counterparty | |
Futures | |
Goldman
Sachs & Co. | | $ | (1,209 | ) | | $ | — | | | $ | (1,209 | ) | | $ | — | | | $ | 1,209 | | | $ | — | | |
In some instances, the collateral amounts disclosed in the tables were adjusted due to the requirement to limit the collateral amounts to avoid the effect of overcollateralization. Actual collateral received/pledged may be more than the amounts disclosed herein.
Federal Income Tax
The Funds comply with the requirements of subchapter M of the Internal Revenue Code of 1986, as amended, necessary to qualify as regulated investment companies and distribute substantially all net taxable investment income and net realized gains to shareholders in a manner which results in no tax cost to the Funds. Therefore, no federal income tax provision is required. As of and during the period ended June 30, 2016, the Funds have not yet determined if any tax positions did not meet the "more-likely-than-not" threshold of being sustained by the applicable tax authority. As of and during the period ended June 30, 2016, the Funds did not have liabilities for any unrecognized tax benefits. The Funds recognized interest and penalties, if any, related to unrecognized tax benefits on uncertain tax positions as income tax expense in the Statements of Operations. During the period ended June 30, 2016, the Funds did not incur any interest or penalties. The Funds are subject to examination by U.S. taxing authorities for the tax periods since each Fund's commencement of operations.
Distribution to Shareholders:
All of the Funds distribute any net investment income monthly. All of the Funds distribute any net realized long or short-term capital gains at least annually. Dividends and distributions paid by each Fund are recorded on the ex-dividend dates. Distributions are determined, on a tax basis and may differ from net investment income and net realized capital gains for reporting purposes.
153
Victory Portfolios II | | Notes to Consolidated Financial Statements — continued
December 31, 2016 | |
(Unaudited)
Other:
Investment and shareholder transactions are recorded on trade date. The Funds determine the gain or loss realized from the investment transactions by comparing the original cost of the security lot sold with the net sales proceeds. Dividend income is recognized on the ex-dividend date or as soon as information is available to the Funds and interest income is recognized on an accrual basis. Withholding taxes on foreign dividends have been provided for in accordance with the Funds' understanding of the applicable tax rules and regulations. Discounts and premiums on debt securities are accreted or amortized over their respective lives using the effective interest method. Payments received from certain investments held by the Funds may be comprised of dividends, capital gains and return of capital. The Funds originally estimate the expected classification of such payments. The amounts may subsequently be reclassified upon receipt of the information from the issuer. The actual character of distributions to the Funds' shareholders will be reflected in the Form 1099 received after the end of the calendar year.
Share valuation:
The NAV per share of each Fund is calculated by dividing the sum of the value of the securities held by the Fund, plus cash and other assets, minus all liabilities (including estimated accrued expenses) by the total number of shares outstanding for the Fund, rounded to the nearest cent. The Funds' shares will not be priced on days on which the NYSE is closed for trading. The offering and redemption price per share for each Fund is equal to the Fund's net asset value per share.
Subsequent Events:
The Trust has evaluated the need for disclosures and/or adjustments resulting from subsequent events through the date the financial statements were issued. Based on this evaluation, no adjustments were required to the financial statements.
3. Purchases and Sales of Securities:
Purchases and sales of securities (excluding short-term securities and in-kind transactions) for the period ended December 31, 2016 were as follows:
Fund | | Purchases | | Sales | |
VictoryShares US 500 Volatility Wtd ETF | | $ | 10,033,938 | | | $ | 2,996,890 | | |
VictoryShares US Discovery Enhanced Volatility Wtd ETF | | | 7,255,922 | | | | 7,202,257 | | |
VictoryShares US 500 Enhanced Volatility Wtd ETF | | | 44,130,862 | | | | 4,729,712 | | |
VictoryShares Developed Enhanced Volatility Wtd ETF | | | 33,799,800 | | | | 59,074,206 | | |
VictoryShares US EQ Income Enhanced Volatility Wtd ETF | | | 41,841,972 | | | | 42,135,762 | | |
VictoryShares US Small Cap Volatility Wtd ETF | | | 115,636,923 | | | | 3,445,878 | | |
VictoryShares International Volatility Wtd ETF | | | 3,282,440 | | | | 3,251,079 | | |
VictoryShares Emerging Market Volatility Wtd ETF | | | 10,033,938 | | | | 2,996,890 | | |
VictoryShares US Large Cap High Div Volatility Wtd ETF | | | 12,333,505 | | | | 12,477,847 | | |
VictoryShares US Small Cap High Div Volatility Wtd ETF | | | 5,644,236 | | | | 5,719,590 | | |
VictoryShares International High Div Volatility Wtd ETF | | | 6,831,649 | | | | 6,834,027 | | |
In-kind transactions associated with purchases and sales for the period ended December 31, 2016 were as follows:
Fund | | Purchases | | Sales | |
VictoryShares US 500 Volatility Wtd ETF | | $ | 69,947,514 | | | $ | 11,388,251 | | |
VictoryShares US Discovery Enhanced Volatility Wtd ETF | | | 10,735,777 | | | | 7,013,316 | | |
VictoryShares US 500 Enhanced Volatility Wtd ETF | | | 89,353,652 | | | | 43,593,853 | | |
VictoryShares Developed Enhanced Volatility Wtd ETF | | | 356,302 | | | | _ | | |
VictoryShares US EQ Income Enhanced Volatility Wtd ETF | | | 182,032,849 | | | | 47,005,895 | | |
VictoryShares US Small Cap Volatility Wtd ETF | | | 11,049,979 | | | | 5,395,028 | | |
VictoryShares International Volatility Wtd ETF | | | 1,609,049 | | | | 3,258,101 | | |
VictoryShares Emerging Market Volatility Wtd ETF | | | 5,862,064 | | | | _ | | |
154
Victory Portfolios II | | Notes to Consolidated Financial Statements — continued
December 31, 2016 | |
(Unaudited)
Fund | | Purchases | | Sales | |
VictoryShares US Large Cap High Div Volatility Wtd ETF | | $ | 49,987,358 | | | $ | 17,096,632 | | |
VictoryShares US Small Cap High Div Volatility Wtd ETF | | | 10,794,332 | | | | 5,429,351 | | |
VictoryShares International High Div Volatility Wtd ETF | | | 10,898,091 | | | | 4,856,668 | | |
During the fiscal year ended June 30, 2016, VictoryShares US Discovery Enhanced Volatility Wtd ETF had a trade error where a rebalancing was processed incorrectly due to positions not being in balance. This resulted in a loss to the Fund of $56,557, which affiliates subsequently reimbursed the Fund.
4. Investment Advisory, Administration and Distribution Agreements:
Investment advisory services are provided to the Funds by Victory Capital Management Inc. ("Victory Capital" or the "Adviser"), a New York corporation registered as an investment adviser with the Securities and Exchange Commission. The Adviser is a wholly owned subsidiary of Victory Capital Holdings, Inc. ("VCH"). A majority of the interest in VCH is owned by Crestview Partners II, L.P. and its affiliated funds with the remaining portion owned by Victory employees and a limited number of outside investors.
Under the terms of the Investment Advisory Agreement (the "Advisory Agreement"), the Adviser is entitled to receive fees for its services, computed daily and payable monthly based on a percentage of the average daily net assets of each Fund. For its services, the Funds pay to the Adviser, as of the last day of each month, an annualized fee equal to 0.30% of average net assets of each of the US 500 Volatility Wtd ETF, US Discovery Enhanced Volatility Wtd ETF, US 500 Enhanced Volatility Wtd ETF, US EQ Income Enhanced Volatility Wtd ETF, US Small Cap Volatility Wtd ETF, US Large Cap High Div Volatility Wtd ETF, and US Small Cap High Div Volatility Wtd ETF, 0.40% of the of average net assets of each of the Developed Enhanced Volatility Wtd ETF, International Volatility Wtd ETF, and International High Div Volatility Wtd ETF, and 0.45% of the average net assets of the Emerging Market Volatility Wtd ETF, with such fees to be computed daily based upon daily average net assets of each of the Funds, respectively. The Adviser pays expenses incurred by it in connection with acting as investment Adviser to the Funds other than costs (including taxes and brokerage commissions, borrowing costs, costs of investing in underlying funds and extraordinary expenses, if any) of securities purchased for the Funds and certain other expenses paid by the Funds (as detailed in the Advisory Agreement). The Adviser pays for all employees, office space and facilities required by it to provide services under the Advisory Agreement, with the exception of specific items of expense (as detailed in the Advisory Agreement).
For the period ended December 31, 2016, Advisory fees incurred by the Funds as well as amounts due to or from the Adviser at December 31, 2016 were as follows:
Fund | | Advisory Fees | | Due To/(From)
Adviser at
December 31, 2016 | |
VictoryShares US 500 Volatility Wtd ETF | | $ | 106,786 | | | $ | 12,260 | | |
VictoryShares US Discovery Enhanced Volatility Wtd ETF | | | 46,888 | | | | (297 | ) | |
VictoryShares US 500 Enhanced Volatility Wtd ETF | | | 266,648 | | | | 41,950 | | |
VictoryShares Developed Enhanced Volatility Wtd ETF | | | 70,629 | | | | (7,660 | ) | |
VictoryShares US EQ Income Enhanced Volatility Wtd ETF | | | 332,781 | | | | 64,780 | | |
VictoryShares US Small Cap Volatility Wtd ETF | | | 21,842 | | | | (3,922 | ) | |
VictoryShares International Volatility Wtd ETF | | | 43,459 | | | | (12,369 | ) | |
VictoryShares Emerging Market Volatility Wtd ETF | | | 41,452 | | | | (22,686 | ) | |
VictoryShares US Large Cap High Div Volatility Wtd ETF | | | 26,807 | | | | 11,776 | | |
VictoryShares US Small Cap High Div Volatility Wtd ETF | | | 29,938 | | | | 92 | | |
VictoryShares International High Div Volatility Wtd ETF | | | 38,978 | | | | (1,325 | ) | |
The Adviser has contractually agreed to waive its Advisory fee and/or reimburse expenses through at least October 31, 2017 so that the total annual fund operating expenses after fee waiver and expense reimbursement (excluding Acquired Fund Fees and Expenses, and certain other items such as interest, taxes and brokerage commissions) do not exceed 0.35% for each of the US 500
155
Victory Portfolios II | | Notes to Consolidated Financial Statements — continued
December 31, 2016 | |
(Unaudited)
Volatility Wtd ETF, US Discovery Enhanced Volatility Wtd ETF, US 500 Enhanced Volatility Wtd ETF, US EQ Income Enhanced Volatility Wtd ETF, US Small Cap Volatility Wtd ETF, US Large Cap High Div Volatility Wtd ETF, and US Small Cap High Div Volatility Wtd ETF, 0.45% for each of the Developed Enhanced Volatility Wtd ETF, International Volatility Wtd ETF, and International High Div Volatility Wtd ETF, and 0.50% for the Emerging Market Volatility Wtd ETF. The Adviser is permitted to recoup Advisory fees waived and expenses reimbursed by it or by each Fund's predecessor adviser for up to three years after the fiscal year in which the waiver or reimbursement took place, subject to the lesser of: (a) any operating expense limits in effect at the time of the original waiver or expense reimbursement; or (b) at the time of recoupment. This agreement may only be terminated by the Funds' Board of Trustees.
As of December 31, 2016, the Adviser waived Advisory fees and reimbursed expenses. The Adviser may recapture a portion of the waived and/or reimbursed amounts no later than the dates as stated below:
Fund | | June 30, 2018 | | June 30, 2019 | | June 30, 2020 | |
VictoryShares US 500 Volatility Wtd ETF | | $ | (61,304 | ) | | $ | (19,478 | ) | | $ | (64,572 | ) | |
VictoryShares US Discovery Enhanced Volatility
Wtd ETF | | | (59,513 | ) | | | (124,242 | ) | | | (56,020 | ) | |
VictoryShares US 500 Enhanced Volatility Wtd ETF | | | (110,009 | ) | | | (271,284 | ) | | | (108,219 | ) | |
VictoryShares Developed Enhanced Volatility Wtd ETF | | | (82,842 | ) | | | (285,869 | ) | | | (129,531 | ) | |
VictoryShares US EQ Income Enhanced Volatility
Wtd ETF | | | (92,663 | ) | | | (219,924 | ) | | | (73,636 | ) | |
VictoryShares US Small Cap Volatility Wtd ETF | | | — | | | | (81,175 | ) | | | (44,015 | ) | |
VictoryShares International Volatility Wtd ETF | | | — | | | | (141,495 | ) | | | (87,909 | ) | |
VictoryShares Emerging Market Volatility Wtd ETF | | | — | | | | (135,767 | ) | | | (193,327 | ) | |
VictoryShares US Large Cap High Div Volatility
Wtd ETF | | | — | | | | (76,158 | ) | | | (41,713 | ) | |
VictoryShares US Small Cap High Div Volatility
Wtd ETF | | | — | | | | (51,660 | ) | | | (27,621 | ) | |
VictoryShares International High Div Volatility
Wtd ETF | | | — | | | | (74,062 | ) | | | (43,783 | ) | |
U.S. Bank National Association ("U.S. Bank") serves as custodian for the Funds' assets. For its custody services to the Funds, U.S. Bank receives fees at an annualized rate of .004% of the Funds' aggregate average daily net assets, plus applicable per transaction fees. The Funds reimburse U.S. Bank for all of its reasonable out-of-pocket expenses incurred in providing custody services.
U.S. Bancorp Fund Services, LLC ("USB") serves as the Funds' administrator, fund accountant and transfer agent. Under an Administration, Accounting and Transfer Agent Agreement, USB receives for its services a monthly fee at an annualized rate based upon the average daily net assets of the Funds.
The Funds reimburse USB for all of its reasonable out-of-pocket expenses incurred in providing these services.
Quasar Distributors, LLC (the "Distributor") serves as distributor for the shares of the Funds pursuant to a Distribution Agreement between the Distributor and the Trust.
Pursuant to the Distribution and Service Plans adopted in accordance with Rule 12b-1 under the 1940 Act, the Distributor may receive a monthly distribution and service fee, at an annual rate of up to 0.25% of average daily net assets. No distribution or service fees are currently paid by the Funds and there are no current plans to impose these fees.
5. Risks
In the normal course of business, each Fund's investment activities expose it to various types of risk associated with the financial instruments and markets in which it invests. The significant types of financial risks each Fund is exposed to include market risk and credit risk. Each Fund's prospectus provides details of these and other types of risk.
156
Victory Portfolios II | | Notes to Consolidated Financial Statements — continued
December 31, 2016 | |
(Unaudited)
Market risk arises mainly from uncertainty about future values of financial instruments influenced by price, currency and interest rate movements. It represents the potential loss each Fund may suffer through holding market positions in the face of market movements. Each Fund is exposed to market risk by virtue of its investment in equity instruments. The fair value of securities held by the Funds may decline due to general market conditions, economic trends or events that are not specifically related to the issuers of the securities including local, regional or global political, social or economic instability or to factors that affect a particular industry or group of industries. The extent of each Fund's exposure to market risk is the market value of the investments held as shown in each Fund's Schedule of Investments.
A diversified portfolio, where this is appropriate and consistent with a Fund's objectives, minimizes the risk that a price change of a particular investment will have a material impact on the NAV of a Fund. The investment concentrations within each Fund's portfolio are disclosed in its Schedule of Investments. The VictoryShares Developed Enhanced Volatility Wtd ETF, VictoryShares International Volatility Wtd ETF, VictoryShares Emerging Market Volatility Wtd ETF, and VictoryShares International High Div Volatility Wtd ETF invest in securities of foreign issuers in various countries. Investing on an international basis involves certain risks not involved in domestic investments including the risk of nationalization or expropriation of assets, imposition of currency exchange controls or restrictions on the repatriation of foreign currency, confiscatory taxation, political or financial instability and diplomatic developments, which could affect the value of a Fund's investments in certain foreign countries. Governments of many countries have exercised and continue to exercise substantial influence over many aspects of the private sector through the ownership or control of many companies, including some of the largest in these countries. As a result, government actions in the future could have a significant effect on economic conditions which may adversely affect prices of certain portfolio securities. There is also generally less government supervision and regulation of stock exchanges, brokers, and listed companies than in the United States. Special U.S. tax considerations may apply to dividends or interest on, or proceeds from the sale of, foreign securities. Additionally, the Funds may be subject to taxes imposed by the governments of countries in which it invests and are generally based on income and/or capital gains earned or repatriated, a portion of which may be recoverable. Based upon the current interpretation of the tax rules and regulations, estimated tax liabilities and recoveries on certain foreign securities are recorded on an accrual basis and are reflected as components of interest income or net exchange in unrealized gain/loss on investments. Tax liabilities realized as a result of security sales are reflected as a component of net realized gain/loss on investments. Moreover, foreign economies may differ favorably or unfavorably from the U.S. economy in such respects as growth of gross national product, rate of inflation, capital re-investment, resource self-sufficiency and balance of payments position. The Schedule of Investments includes information on each Fund's holdings, including industry and/or geographical composition, as relevant.
Credit risk is the risk that an issuer or guarantor of debt instruments or the counterparty to a financial transaction, including derivatives contracts, repurchase agreements or loans of portfolio securities, is unable or unwilling to make timely interest and/or principal payments to otherwise honor its obligations. The Funds may be negatively impacted if a counterparty becomes bankrupt or otherwise fails to perform its obligations due to financial difficulties. The Funds may experience significant delays in obtaining any recovery in bankruptcy or other reorganization proceeding and the Funds may obtain only limited recovery or may obtain no recovery in such circumstances. The Funds typically enter into transactions with counterparties whose credit ratings are investment grade, as determined by a nationally recognized statistical rating organization or, if unrated, judged by the Adviser to be of comparable quality.
6. Line of Credit:
The Trust, Victory Portfolios, Victory Variable Insurance Funds and Victory Institutional Funds (the "Victory Trusts") participate in a short-term demand note "Line of Credit" agreement with Citibank. Under the agreement with Citibank, as of July 29, 2016, the Victory Trusts may borrow up to $250 million, of which $100 million is committed and $150 million is uncommitted. $40 million of the line of credit is reserved for use by the Victory RS Floating Rate Fund with that Fund paying the
157
Victory Portfolios II | | Notes to Consolidated Financial Statements — continued
December 31, 2016 | |
(Unaudited)
related commitment fees for that amount. The purpose of the agreement is to meet temporary or emergency cash needs, including redemption requests that might otherwise require the untimely disposition of securities. Citibank received a commitment fee of 0.10% on $50 million for providing the Line of Credit through July 28, 2016. As of July 29, 2016, Citibank receives an annual commitment fee of 0.15% on $100 million for providing the Line Credit. For the six months ended December 31, 2016, Citibank earned approximately $68 thousand for Line of Credit fees. Each fund in the Victory Trusts pays a pro-rata portion of this commitment fee plus any interest on amounts borrowed.
During the period ended December 31, 2016, none of the ETFs borrowed on the line of credit.
7. Federal Income Tax Information:
The tax character of distributions for the following periods was as follows:
| | | For the period
ended
June 30, 2016: | | For the period
ended
June 30, 2015:* | |
| | | Ordinary
Income | | Realized
Gain | | Ordinary
Income | | Realized
Gain | |
VictoryShares US 500 Volatility Wtd ETF | | $ | 388,873 | | | $ | 8,766 | | | $ | 93,836 | | | $ | — | | |
VictoryShares US Discovery Enhanced Volatility
Wtd ETF | | | 263,363 | | | | — | | | | 132,709 | | | | — | | |
VictoryShares US 500 Enhanced Volatility Wtd ETF | | | 1,777,461 | | | | — | | | | 607,150 | | | | — | | |
VictoryShares Developed Enhanced Volatility
Wtd ETF | | | 638,370 | | | | — | | | | 243,567 | | | | 283 | | |
VictoryShares US EQ Income Enhanced
Volatility Wtd ETF | | | 3,588,993 | | | | — | | | | 1,513,918 | | | | — | | |
VictoryShares US Small Cap Volatility Wtd ETF | | | 86,852 | | | | — | | | | — | | | | — | | |
VictoryShares International Volatility Wtd ETF | | | 205,538 | | | | — | | | | — | | | | — | | |
VictoryShares Emerging Market Volatility Wtd ETF | | | 51,870 | | | | — | | | | — | | | | — | | |
VictoryShares US Large Cap High Div Volatility
Wtd ETF | | | 706,156 | | | | — | | | | — | | | | — | | |
VictoryShares US Small Cap High Div Volatility
Wtd ETF | | | 292,084 | | | | — | | | | — | | | | — | | |
VictoryShares International High Div Volatility
Wtd ETF | | | 427,662 | | | | — | | | | — | | | | — | | |
The Fund designated as long-term capital gain dividend, pursuant to Internal Revenue Code Section 852(b)(3), the amount necessary to reduce the earnings and profits of the Fund related to net capital gain to zero for the tax year ended June 30, 2016.
*The following Funds were not active as of June 30, 2015: VictoryShares US Small Cap Volatility Wtd ETF, VictoryShares International Volatility Wtd ETF, VictoryShares Emerging Market Volatility Wtd ETF, VictoryShares US Large Cap High Div Volatility Wtd ETF, VictoryShares US Small Cap High Div Volatility Wtd ETF, and VictoryShares International High Div Volatility Wtd ETF.
158
Victory Portfolios II | | Notes to Consolidated Financial Statements — continued
December 31, 2016 | |
(Unaudited)
As of June 30, 2016, the components of accumulated earnings (losses) for income tax purposes were as follows:
| | | Victory
Shares
US 500
Volatility
Wtd ETF | | Victory
Shares
US Discovery
Enhanced
Volatility
Wtd ETF | | Victory
Shares
US 500
Enhanced
Volatility
Wtd ETF | | Victory
Shares
Developed
Enhanced
Volatility
Wtd ETF | | Victory
Shares
US EQ
Income
Enhanced
Volatility
Wtd ETF | |
Tax cost of investments | | $ | 44,287,439 | | | $ | 26,306,177 | | | $ | 138,694,104 | | | $ | 35,603,736 | | | $ | 150,460,112 | | |
Unrealized appreciation | | | 2,574,963 | | | | 1,701,384 | | | | 10,407,970 | | | | 1,251,320 | | | | 10,678,086 | | |
Unrealized depreciation | | | (2,201,653 | ) | | | (1,174,786 | ) | | | (7,739,311 | ) | | | (2,245,879 | ) | | | (5,063,409 | ) | |
Net unrealized appreciation
(depreciation) | | | 373,310 | | | | 526,598 | | | | 2,668,659 | | | | (994,559 | ) | | | 162,831 | | |
Undistributed ordinary
income | | | 27,894 | | | | 24,546 | | | | 83,693 | | | | 51,240 | | | | 162,831 | | |
Undistributed long-term
gain | | | — | | | | — | | | | — | | | | — | | | | — | | |
Distributable earnings | | | 27,894 | | | | 24,546 | | | | 83,693 | | | | 51,240 | | | | 162,831 | | |
Other accumulated loss | | | (456,603 | ) | | | (5,635,688 | ) | | | (5,882,558 | ) | | | (5,202,611 | ) | | | (5,056,017 | ) | |
Total accumulated
gain/(loss) | | $ | (55,399 | ) | | $ | (5,084,544 | ) | | $ | (3,130,206 | ) | | $ | (6,145,930 | ) | | $ | 721,491 | | |
| | | Victory
Shares
US Small
Cap
Volatility
Wtd ETF | | Victory
Shares
International
Volatility
Wtd ETF | | Victory
Shares
Emerging
Market
Volatility
Wtd ETF | | Victory
Shares US
Large Cap
High Div
Volatility
Wtd ETF | | Victory
Shares US
Small Cap
High Div
Volatility
Wtd ETF | | Victory
Shares
International
High Div
Volatility
Wtd ETF | |
Tax cost of investments | | $ | 10,339,163 | | | $ | 13,403,350 | | | $ | 12,510,809 | | | $ | 39,722,495 | | | $ | 13,831,086 | | | $ | 18,090,582 | | |
Unrealized appreciation | | | 666.978 | | | | 455,907 | | | | 508,965 | | | | 2,837,070 | | | | 1,021,280 | | | | 368,441 | | |
Unrealized depreciation | | | (699,932 | ) | | | (1,080,500 | ) | | | (436,050 | ) | | | (1,281,903 | ) | | | (700,100 | ) | | | (1,753,468 | ) | |
Net unrealized appreciation
(depreciation) | | | (32,954 | ) | | | (624,593 | ) | | | 72,915 | | | | 1,555,167 | | | | 321,180 | | | | (1,385,027 | ) | |
Undistributed ordinary
income | | | 9,741 | | | | 32,036 | | | | 49,803 | | | | 50,357 | | | | 45,227 | | | | 92,849 | | |
Undistributed long-term
gain | | | — | | | | — | | | | — | | | | — | | | | — | | | | — | | |
Distributable earnings | | | 9,741 | | | | 32,036 | | | | 49,803 | | | | 50,357 | | | | 45,227 | | | | 92,849 | | |
Other accumulated loss | | | (240,469 | ) | | | (223,417 | ) | | | (5,546 | ) | | | (56,995 | ) | | | (162,709 | ) | | | (252,502 | ) | |
Total accumulated
gain/(loss) | | $ | (263,682 | ) | | $ | (815,974 | ) | | $ | 117,172 | | | $ | 1,548,529 | | | $ | 203,698 | | | $ | (1,544,680 | ) | |
The difference between book basis and tax basis unrealized appreciation/(depreciation) is primarily attributable to the tax deferral of losses on wash sales, the mark to market on open futures contracts adjustments for C-Corporation return of capital distributions, and passive foreign investment companies.
Net capital losses incurred after October 31, and within the taxable year, are deemed to arise on the first business day of the Fund's next taxable year. Qualified late-year ordinary losses are the excess of the sum of the specified loss attributable to the portion of the taxable year after October 31st, and the late-year losses attributable to the portion of the taxable year after
159
Victory Portfolios II | | Notes to Consolidated Financial Statements — continued
December 31, 2016 | |
(Unaudited)
December 31st, over the sum of the specified gains attributable to the portion of the specified gains attributable to the portion of the taxable year after October 31st, and other ordinary income attributable to the portion of the taxable year after December 31st. For the fiscal year ended June 30, 2016, there were no post-October or late-year losses.
At June 30, 2016, the Funds had capital loss carry-forwards (no expiration) for federal income tax purposes available to offset future capital gains as follows:
| | | Short Term | | Long Term | |
VictoryShares US 500 Volatility Wtd ETF | | $ | 295,721 | | | $ | 160,882 | | |
VictoryShares US Discovery Enhanced Volatility Wtd ETF | | | 5,146,219 | | | | 489,469 | | |
VictoryShares US 500 Enhanced Volatility Wtd ETF | | | 4,242,770 | | | | 1,639,762 | | |
VictoryShares Developed Enhanced Volatility Wtd ETF | | | 4,850,441 | | | | 352,170 | | |
VictoryShares US EQ Income Enhanced Volatility Wtd ETF | | | 3,786,885 | | | | 1,269,132 | | |
VictoryShares US Small Cap Volatility Wtd ETF | | | 239,123 | | | | 1,346 | | |
VictoryShares International Volatility Wtd ETF | | | 217,988 | | | | 5,429 | | |
VictoryShares Emerging Market Volatility Wtd ETF | | | 4,394 | | | | 1,291 | | |
VictoryShares US Large Cap High Div Volatility Wtd ETF | | | 56,995 | | | | — | | |
VictoryShares US Small Cap High Div Volatility Wtd ETF | | | 162,709 | | | | — | | |
VictoryShares International High Div Volatility Wtd ETF | | | 236,996 | | | | — | | |
Permanent book and tax differences, primarily due to gains and losses, in-kind distributions that are not taxable, gains and losses on disposition of PFICs, and foreign currency gains (losses), resulted in reclassifications for the period ended June 30, 2016 as follows:
| | | Undistributed
Net Investment
Income | | Accumulated
Net Realized
Gain (Loss) | | Paid-In-Capital | |
VictoryShares US 500 Volatility Wtd ETF | | $ | (186 | ) | | $ | (1,424,337 | ) | | $ | 1,424523 | | |
VictoryShares US Discovery Enhanced Volatility
Wtd ETF | | | 2,343 | | | | (1,493,206 | ) | | | 1,490,863 | | |
VictoryShares US 500 Enhanced Volatility
Wtd ETF | | | — | | | | (6,033,503 | ) | | | 6,033,503 | | |
VictoryShares Developed Enhanced Volatility
Wtd ETF | | | (2,829 | ) | | | 2,829 | | | | — | | |
VictoryShares US EQ Income Enhanced
Volatility Wtd ETF | | | — | | | | (6,093,255 | ) | | | 6,093,255 | | |
VictoryShares US Small Cap Volatility Wtd ETF | | | 1,669 | | | | (399,260 | ) | | | 397,591 | | |
VictoryShares International Volatility Wtd ETF | | | 10,490 | | | | 172,459 | | | | (182,949 | ) | |
VictoryShares Emerging Market Volatility
Wtd ETF | | | 5,436 | | | | (5,436 | ) | | | — | | |
VictoryShares US Large Cap High Div Volatility
Wtd ETF | | | — | | | | (1,087,457 | ) | | | 1,087,457 | | |
VictoryShares US Small Cap High Div Volatility
Wtd ETF | | | 13,448 | | | | (542,830 | ) | | | 529,382 | | |
VictoryShares International High Div Volatility
Wtd ETF | | | 11,448 | | | | 100,794 | | | | (112,242 | ) | |
8. New Accounting Pronouncements:
In October 2016, the U.S. Securities and Exchange Commission adopted new rules and amended existing rules (together, "final rules") intended to modernize the reporting and disclosure of information by registered investment companies. In part, the final rules amend Regulation S-X and require standardized, enhanced disclosure about derivatives in investment company financial statements, as well as other amendments. The compliance date for the amendments to Regulation S-X is August 1, 2017. Management is currently evaluating the impact that the adoption of the amendments to Regulation S-X will have on the financial statements and related disclosures.
160
Victory Portfolios II | | Supplemental Information
December 31, 2016 | |
(Unaudited)
Trustee and Officer Information
Board of Trustees:
Overall responsibility for management of the Trust rests with the Board. The Trust is managed by the Board in accordance with the laws of the State of Delaware. There are currently ten Trustees, nine of whom are not "interested persons" of the Trust within the meaning of that term under the 1940 Act ("Independent Trustees") and one of whom is an "interested person" of the Trust within the meaning of that term under the 1940 Act ("Interested Trustee"). The Trustees, in turn, elect the officers of the Trust to actively supervise its day-to-day operations.
The following tables list the Trustees, their ages, position with the Trust, commencement of service, principal occupations during the past five years and any directorships of other investment companies or companies whose securities are registered under the Securities Exchange Act of 1934, as amended, or who file reports under that Act. Each Trustee oversees 17 portfolios in the Trust, 47 portfolios in Victory Portfolios, nine portfolios in Victory Variable Insurance Funds and one portfolio in Victory Institutional Funds, each a registered investment company that, together with the Trust, comprise the Victory Fund Complex. Each Trustee's address is c/o Victory Portfolios II, 615 East Michigan Street, Milwaukee, Wisconsin 53202. Each Trustee has an indefinite term.
Name and Age | | Position
Held with
the Trust | | Date
Commenced
Service | | Principal Occupation
During Past 5 Years | | Other Directorships
Held During
Past 5 Years | |
Independent Trustees. | |
David Brooks Adcock, 65 | | Trustee | | May 2015 | | Consultant (since 2006). | | FBR Funds (2011-2012); Chairman, Board of Trustees, Turner Funds (December 2016-present). | |
Nigel D. T. Andrews, 69 | | Vice Chair and Trustee | | May 2015 | | Retired. | | Carlyle GMS Finance, Inc. (since 2012); Old Mutual US Asset Management (2002-2014). | |
E. Lee Beard, 65 | | Trustee | | May 2015 | | Retired (since 2015); Consultant, The Henlee Group, LLC (consulting) (2005-2015). | | | None. | | |
Dennis M. Bushe, 73 | | Trustee | | July 2016 | | Retired since May 2010; Trustee, RS Investment Trust and RS Variable Products Trust (November 2011-July 2016). | | | None. | | |
Sally M. Dungan, 62 | | Trustee | | May 2015 | | Chief Investment Officer, Tufts University (since 2002). | | | None. | | |
161
Victory Portfolios II | | Supplemental Information — continued
December 31, 2016 | |
(Unaudited)
Name and Age | | Position
Held with
the Trust | | Date
Commenced
Service | | Principal Occupation
During Past 5 Years | | Other Directorships
Held During
Past 5 Years | |
John L. Kelly, 63 | | Trustee | | May 2015 | | Adviser, Endgate Commodities LLC (since January 2016); Managing Partner, Endgate Commodities LLC (August 2014 to January 2016); Chief Operating Officer, Liquidnet Holdings, Inc. (2011-2014); Managing Director, Crossroad LLC (Consultants) (April 2009 to December 2011). | | Director, Caledonia Mining Corporation (since May 2012). | |
David L. Meyer, 59 | | Trustee | | May 2015 | | Retired. | | | None. | | |
Gloria S. Nelund, 55 | | Trustee | | July 2016 | | Chair, CEO and Co-Founder of TriLinc Global, LLC, an investment firm; Trustee, RS Investment Trust and RS Variable Products Trust (November 2007-July 2016). | | TriLinc Global Impact Fund, LLC (2012-Present). | |
Leigh A. Wilson, 72 | | Chair and Trustee | | May 2015 | | Private Investor. | | Chair (since 2013) and Director (since 2012 and March-October 2008), Caledonia Mining Corporation. | |
162
Victory Portfolios II | | Supplemental Information — continued
December 31, 2016 | |
(Unaudited)
Name and Age | | Position
Held with
the Trust | | Date
Commenced
Service | | Principal Occupation
During Past 5 Years | | Other Directorships
Held During
Past 5 Years | |
Interested Trustee. | |
David C. Brown, 44 | | Trustee | | May 2015 | | Chairman and Chief Executive Officer (since August 2013), Co-Chief Executive Officer (2011-2013), President — Investments and Operations (2010-2011) and Chief Operating Officer (2004-2011), the Adviser; Chairman and Chief Executive Officer (since 2013), Victory Capital Holdings, Inc. | | | None. | | |
Mr. Brown is an "Interested Person" by reason of his relationship with the Adviser.
The Board has designated Mr. Meyer and Ms. Beard as its Audit Committee Financial Experts.
The Statement of Additional Information includes additional information about the Trustees of the Trust and is available, without charge, by calling 866-376-7890.
163
Victory Portfolios II | | Supplemental Information — continued
December 31, 2016 | |
(Unaudited)
Officers:
The officers of the Trust, their ages, commencement of service and their principal occupations during the past five years, are detailed in the following table. Each individual holds the same position with the other registered investment companies in the Victory Fund Complex, and each officer serves until the earlier of his or her resignation, removal, retirement, death, or the election of a successor. The mailing address of each officer of the Trust is c/o Victory Portfolios II Trust, 615 East Michigan Street, Milwaukee, Wisconsin 53202. Except for the Chief Compliance Officer, the officers of the Trust receive no compensation directly from the Trust for performing the duties of their offices.
Name and Age | | Position with
the Trust | | Date
Commenced
Service | | Principal Occupation During Past 5 Years | |
Christopher K. Dyer, 55 | | President | | May 2015 | | Director of Mutual Fund Administration, the Adviser. | |
Scott A. Stahorsky, 47 | | Vice President | | May 2015 | | Manager, Fund Administration, the Adviser (since 2015); Senior Analyst, Fund Administration, the Adviser (prior to 2015). | |
Erin G. Wagner, 42 | | Secretary | | May 2015 | | Associate General Counsel, the Adviser (since 2013); Associate, Dechert LLP (2001-2010). | |
Christopher A. Ponte, 32 | | Treasurer | | May 2015 | | Senior Analyst, Fund Administration, the Adviser; Registered Principal, Victory Capital Advisers, Inc. (since 2011). | |
Edward J. Veilleux, 73 | | Chief Compliance Officer | | May 2015 | | President of EJV Financial Services (mutual fund consulting). | |
Chuck Booth, 56 | | Anti-Money Laundering Compliance Officer and Identity Theft Officer | | May 2015 | | Director, Regulatory Administration and CCO Support Services, Citi Fund Services Ohio, Inc. | |
Jay G. Baris, 63 | | Assistant Secretary | | May 2015 | | Partner, Morrison & Foerster LLP. | |
164
Victory Portfolios II | | Supplemental Information — continued
December 31, 2016 | |
(Unaudited)
Additional Federal Income Tax Information
For the fiscal year ended June 30, 2016, certain dividends paid by the Funds may be subject to a maximum tax rate of 23.8%, as provided for by the Jobs and Growth Reconciliation Act of 2003.
The percentage of dividends declared from ordinary income designated as qualified dividend income was as follows:
VictoryShares US 500 Volatility Wtd ETF | | | 100.00 | % | |
VictoryShares US Discovery Enhanced Volatility Wtd ETF | | | 100.00 | % | |
VictoryShares US 500 Enhanced Volatility Wtd ETF | | | 100.00 | % | |
VictoryShares Developed Enhanced Volatility Wtd ETF | | | 99.52 | % | |
VictoryShares US EQ Income Enhanced Volatility Wtd ETF | | | 100.00 | % | |
VictoryShares US Small Cap Volatility Wtd ETF | | | 100.00 | % | |
VictoryShares International Volatility Wtd ETF | | | 95.40 | % | |
VictoryShares Emerging Market Volatility Wtd ETF | | | 56.24 | % | |
VictoryShares US Large Cap High Div Volatility Wtd ETF | | | 100.00 | % | |
VictoryShares US Small Cap High Div Volatility Wtd ETF | | | 100.00 | % | |
VictoryShares International High Div Volatility Wtd ETF | | | 95.04 | % | |
For corporate shareholders, the percent of ordinary income distributions qualifying for the corporate dividends received deduction for the fiscal year ended June 30, 2016 was as follows:
VictoryShares US 500 Volatility Wtd ETF | | | 100.00 | % | |
VictoryShares US Discovery Enhanced Volatility Wtd ETF | | | 100.00 | % | |
VictoryShares US 500 Enhanced Volatility Wtd ETF | | | 100.00 | % | |
VictoryShares Developed Enhanced Volatility Wtd ETF | | | 0.20 | % | |
VictoryShares US EQ Income Enhanced Volatility Wtd ETF | | | 100.00 | % | |
VictoryShares US Small Cap Volatility Wtd ETF | | | 100.00 | % | |
VictoryShares International Volatility Wtd ETF | | | 0.25 | % | |
VictoryShares Emerging Market Volatility Wtd ETF | | | 0.00 | % | |
VictoryShares US Large Cap High Div Volatility Wtd ETF | | | 100.00 | % | |
VictoryShares US Small Cap High Div Volatility Wtd ETF | | | 100.00 | % | |
VictoryShares International High Div Volatility Wtd ETF | | | 0.00 | % | |
The percentage of taxable ordinary income distributions that are designated as short-term capital gain distributions under Internal Revenue Section 871(k)(2)(C) for each Fund were as follows:
VictoryShares US 500 Volatility Wtd ETF | | | 1.71 | % | |
VictoryShares US Discovery Enhanced Volatility Wtd ETF | | | 0.00 | % | |
VictoryShares US 500 Enhanced Volatility Wtd ETF | | | 0.00 | % | |
VictoryShares Developed Enhanced Volatility Wtd ETF | | | 0.00 | % | |
VictoryShares US EQ Income Enhanced Volatility Wtd ETF | | | 0.00 | % | |
VictoryShares US Small Cap Volatility Wtd ETF | | | 0.00 | % | |
VictoryShares International Volatility Wtd ETF | | | 0.00 | % | |
VictoryShares Emerging Market Volatility Wtd ETF | | | 0.00 | % | |
VictoryShares US Large Cap High Div Volatility Wtd ETF | | | 0.00 | % | |
VictoryShares US Small Cap High Div Volatility Wtd ETF | | | 0.00 | % | |
VictoryShares International High Div Volatility Wtd ETF | | | 0.00 | % | |
165
Victory Portfolios II | | Supplemental Information — continued
December 31, 2016 | |
(Unaudited)
For the fiscal year ended June 30, 2016 the following VictoryShares ETFs earned foreign source income and paid foreign taxes which they intend to pass through to their shareholders pursuant to section 853 of the Internal Revenue Code as follows:
VictoryShares Developed Enhanced Volatility Wtd ETF | |
Country | | Gross
Dividend | | Taxes
Withheld | |
Austria | | | 2,621 | | | | 212 | | |
Australia | | | 47,542 | | | | 294 | | |
Belgium | | | 18,227 | | | | 2,831 | | |
Bermuda | | | 2,193 | | | | — | | |
Canada | | | 82,340 | | | | 12,351 | | |
Switzerland | | | 56,076 | | | | 5,816 | | |
Germany | | | 60,356 | | | | 7,542 | | |
Denmark | | | 5,575 | | | | 836 | | |
Spain | | | 47,400 | | | | 7,719 | | |
Finland | | | 13,394 | | | | 2,009 | | |
France | | | 92,902 | | | | 13,667 | | |
Great Britain | | | 140,506 | | | | 5,508 | | |
Hong Kong | | | 75,222 | | | | 352 | | |
Ireland | | | 3,990 | | | | — | | |
Israel | | | 4,608 | | | | 960 | | |
Italy | | | 23,197 | | | | 3,480 | | |
Jersey | | | 5,188 | | | | 100 | | |
Japan | | | 92,900 | | | | 9,290 | | |
Cayman Islands | | | 5,710 | | | | — | | |
Netherlands | | | 17,254 | | | | 2,592 | | |
Norway | | | 14,417 | | | | 2,019 | | |
Portugal | | | 7,422 | | | | 1,226 | | |
Sweden | | | 34,226 | | | | 5,134 | | |
Singapore | | | 30,239 | | | | — | | |
United States | | | 1,514 | | | | — | | |
| | | | 885,020 | | | | 83,939 | | |
| Less Ineligible Countries: Great Britain | | | 140,506 | | | | 5,508 | | |
Hong Kong | | | 75,222 | | | | 352 | | |
Singapore | | | 30,239 | | | | — | | |
Total FTC | | | | | | | 78,079 | | |
VictoryShares International Volatility Wtd ETF | |
Country | | Gross
Dividend | | Taxes
Withheld | |
Australia | | | 13,116 | | | | 125 | | |
Austria | | | 436 | | | | — | | |
Belgium | | | 6,514 | | | | 1,016 | | |
Bermuda | | | 525 | | | | — | | |
Canada | | | 25,436 | | | | 3,815 | | |
Cayman Islands | | | 1,903 | | | | — | | |
Chile | | | 20,040 | | | | 2,070 | | |
Denmark | | | 2,433 | | | | 365 | | |
Finland | | | 6,002 | | | | 900 | | |
France | | | 32,842 | | | | 4,834 | | |
Germany | | | 22,061 | | | | 2,738 | | |
Great Britain | | | 46,975 | | | | 1,314 | | |
Hong Kong | | | 22,832 | | | | 103 | | |
Ireland | | | 1,473 | | | | — | | |
166
Victory Portfolios II | | Supplemental Information — continued
December 31, 2016 | |
(Unaudited)
Country | | Gross
Dividend | | Taxes
Withheld | |
Israel | | | 1,454 | | | | 309 | | |
Italy | | | 7,587 | | | | 1,138 | | |
Japan | | | 33,313 | | | | 3,331 | | |
Jersey | | | 1,608 | | | | — | | |
Netherlands | | | 5,470 | | | | 822 | | |
Norway | | | 4,983 | | | | 704 | | |
Portugal | | | 2,692 | | | | 443 | | |
Singapore | | | 6,361 | | | | — | | |
Spain | | | 13,134 | | | | 2,065 | | |
Sweden | | | 14,062 | | | | 2,109 | | |
| | | | 293,250 | | | | 28,202 | | |
| Less Ineligible Countries: France | | | 32,842 | | | | 4,834 | | |
Great Britain | | | 46,975 | | | | 1,314 | | |
Total FTC | | | | | | | 22,054 | | |
VictoryShares Emerging Market Volatility Wtd ETF | |
Country | | Gross
Dividend | | Taxes
Withheld | |
Bermuda | | | 203 | | | | — | | |
Brazil | | | 2,184 | | | | 58 | | |
Cayman Islands | | | 1,455 | | | | — | | |
Chile | | | 7,334 | | | | 1,301 | | |
China | | | 19,308 | | | | 1,931 | | |
Colombia | | | 206 | | | | 22 | | |
Czech Republic | | | 4,337 | | | | 651 | | |
Greece | | | 1,321 | | | | 132 | | |
Hong Kong | | | 16,076 | | | | 56 | | |
Hungary | | | 412 | | | | — | | |
India | | | 3,382 | | | | — | | |
Indonesia | | | 4,984 | | | | 865 | | |
Malaysia | | | 7,119 | | | | — | | |
Mexico | | | 4,335 | | | | 128 | | |
Philippines | | | 3,049 | | | | 762 | | |
Poland | | | 2,325 | | | | 349 | | |
Russian Federation | | | 2,191 | | | | 329 | | |
Thailand | | | 3,483 | | | | 334 | | |
Turkey | | | 6,352 | | | | 917 | | |
Taiwan | | | 14,000 | | | | 2,796 | | |
Zambia | | | 4,723 | | | | 708 | | |
South Korea | | | 19 | | | | 3 | | |
United Arab Emirate | | | 1,719 | | | | — | | |
| | | | 110,516 | | | | 11,342 | | |
| Less Ineligible Countries: None | | | — | | | | — | | |
Total FTC | | | | | | | 11,342 | | |
VictoryShares International High Div Volatility Wtd ETF | |
Country | | Gross
Dividend | | Taxes
Withheld | |
Australia | | | 67,660 | | | | 769 | | |
Belgium | | | 11,616 | | | | 1,742 | | |
Canada | | | 57,645 | | | | 8,647 | | |
167
Victory Portfolios II | | Supplemental Information — continued
December 31, 2016 | |
(Unaudited)
Country | | Gross
Dividend | | Taxes
Withheld | |
Cayman Islands | | | 3,932 | | | | — | | |
Finland | | | 11,705 | | | | 1,756 | | |
France | | | 45,313 | | | | 6,797 | | |
Germany | | | 29,377 | | | | 3,440 | | |
Great Britain | | | 129,732 | | | | 2,829 | | |
Hong Kong | | | 32,052 | | | | — | | |
Israel | | | 6,299 | | | | 1,426 | | |
Italy | | | 21,518 | | | | 1,426 | | |
Jersey | | | 332 | | | | — | | |
Japan | | | 17,891 | | | | 1,789 | | |
Norway | | | 7,847 | | | | 1,177 | | |
Portugal | | | 14,421 | | | | 2,163 | | |
Singapore | | | 18,308 | | | | — | | |
Spain | | | 60,614 | | | | 10,040 | | |
Sweden | | | 39,673 | | | | 5,900 | | |
Switzerland | | | 35,157 | | | | 5,021 | | |
| | | | 611,091 | | | | 54,922 | | |
| Less Ineligible Countries: Great Britain | | | 129,732 | | | | 2,829 | | |
Total FTC | | | | | | | 52,093 | | |
168
Victory Portfolios II | | Supplemental Information — continued
December 31, 2016 | |
(Unaudited)
Proxy Voting and Form N-Q Information
Proxy Voting:
Information regarding the policies and procedures that the Fund uses to determine how to vote proxies relating to portfolio securities is available without charge, upon request, by calling 800-539-3863. The information is also included in the Fund's Statement of Additional Information, which is available on the Securities and Exchange Commission's ("SEC") website at www.sec.gov.
Information relating to how the Fund voted proxies relating to portfolio securities held during the most recent twelve months ended June 30th is available on the SEC's website at www.sec.gov.
Availability of Schedules of Investments:
The Trust files a complete schedule of portfolio holdings with the SEC for the first and third quarters of each fiscal year on Form N-Q. Form N-Q is available on the SEC's website at http://www.sec.gov. You may also review or, for a fee, copy those documents by visiting the SEC's Public Reference Room in Washington, D.C. Information on the operation of the Public Reference Room can be obtained by calling the SEC at 202-551-8090.
Expense Examples
As a shareholder of a Fund, you pay ongoing expenses, such as advisory fees, distribution and service fees (12b-1), and other Fund expenses. The following examples are intended to help you understand the ongoing cost (in dollars) of investing in a Fund and to compare these costs with the ongoing costs of investing in other mutual funds. Please note, the expenses shown in the tables are meant to highlight ongoing costs only and do not reflect any transactional costs, such as sales charges (loads), or contingent deferred sales charges on redemptions which may be assessed by mutual funds. This Example is based on an investment of $1,000 invested at the beginning of the period and held for the entire period as indicated below.
Actual Expenses:
The columns under the heading entitled "Actual" help you estimate the actual expenses you paid over the period. The "Actual Ending Account Value" shown is derived from a Fund's actual return and the "Actual Expenses Paid During Period" show the dollar amount that would have been paid by an investor who started with $1,000 in a Fund. To estimate the expenses you paid on your account during this period, simply divide your account value by $1,000 (for example, an $8,600 account value divided by $1,000=8.6), then multiply the result by the number in the column under the heading untitled "Actual Expenses Paid During Period".
Hypothetical Example for Comparison Purposes:
The columns under the heading entitled "Hypothetical" provide information about hypothetical account value and hypothetical expenses based on a Fund's actual expense ratio and an assumed rate of return of 5% per year before expenses, which is not the Fund's return. The hypothetical account values and expenses may not be used to estimate the actual ending account balance or expenses you paid for the period. You may use this information to compare the ongoing costs of investing in a Fund and other funds. To do so, compare this 5% hypothetical example with the 5% hypothetical examples that appear in the shareholder reports of other funds.
Please note that the expenses shown in the table are meant to highlight your ongoing costs only and do not reflect any transactional costs which may be applicable to your account. Therefore, the last column of the table (Hypothetical Expenses Paid During Period) is useful in comparing ongoing costs only, and will not help you determine the relative total costs of owning different funds. In addition, if these transactional costs were included, your costs would have been higher.
169
Victory Portfolios II | | Supplemental Information — continued
December 31, 2016 | |
(Unaudited)
| | | | | | | Actual | | Hypothetical
(5% return before expenses) | |
| | | Fund's
Annual
Expense Ratio | | Beginning
Account Value
07/01/16 | | Ending
Account Value
12/31/16 | | Expenses
Paid During
Period(a) | | Ending
Account Value
12/31/16 | | Expenses
Paid During
Period | |
VictoryShares US 500
Volatility Wtd ETF | | | 0.35 | % | | $ | 1,000.00 | | | $ | 1,090.70 | | | $ | 1.84 | | | $ | 1,023.44 | | | $ | 1.79 | | |
VictoryShares US
Discovery Enhanced
Volatility Wtd ETF | | | 0.35 | % | | | 1,000.00 | | | | 1,218.20 | | | | 1.96 | | | | 1,023.44 | | | | 1.79 | | |
VictoryShares US 500
Enhanced Volatility
Wtd ETF | | | 0.35 | % | | | 1,000.00 | | | | 1,090.70 | | | | 1.84 | | | | 1,023.44 | | | | 1.79 | | |
VictoryShares
Developed Enhanced
Volatility Wtd ETF | | | 0.45 | % | | | 1,000.00 | | | | 983.90 | | | | 2.25 | | | | 1,022.94 | | | | 2.29 | | |
VictoryShares US EQ
Income Enhanced
Volatility Wtd ETF | | | 0.35 | % | | | 1,000.00 | | | | 1,086.20 | | | | 1.84 | | | | 1,023.44 | | | | 1.79 | | |
VictoryShares US
Small Cap Volatility
Wtd ETF | | | 0.35 | % | | | 1,000.00 | | | | 1,217.70 | | | | 1.96 | | | | 1,023.44 | | | | 1.79 | | |
VictoryShares
International Volatility
Wtd ETF | | | 0.45 | % | | | 1,000.00 | | | | 1,026.10 | | | | 2.30 | | | | 1,022.94 | | | | 2.29 | | |
VictoryShares
Emerging Market
Volatility Wtd ETF | | | 0.50 | % | | | 1,000.00 | | | | 981.60 | | | | 2.50 | | | | 1,022.68 | | | | 2.55 | | |
VictoryShares US
Large Cap High Div
Volatility Wtd ETF | | | 0.35 | % | | | 1,000.00 | | | | 1,086.30 | | | | 1.84 | | | | 1,023.44 | | | | 1.79 | | |
VictoryShares US
Small Cap High Div
Volatility Wtd ETF | | | 0.35 | % | | | 1,000.00 | | | | 1,196.20 | | | | 1.94 | | | | 1,023.44 | | | | 1.79 | | |
VictoryShares
International High Div
Volatility Wtd ETF | | | 0.45 | % | | | 1,000.00 | | | | 1,039.20 | | | | 2.31 | | | | 1,022.94 | | | | 2.29 | | |
(a) Expenses are equal to the Funds' annualized expense ratios, multiplied by the average account value over the period, multiplied by 184/365 (to reflect the one-half year period).
170
Victory Portfolios II | | Supplemental Information — continued
December 31, 2016 | |
(Unaudited)
VictoryShares US 500 Volatility Wtd ETF
Portfolio Holdings
As a Percentage of Total Investments

VictoryShares US Discovery Enhanced Volatility Wtd ETF | |
Portfolio Holdings
As a Percentage of Total Investments
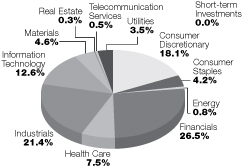
VictoryShares US 500 Enhanced Volatility Wtd ETF | |
Portfolio Holdings
As a Percentage of Total Investments
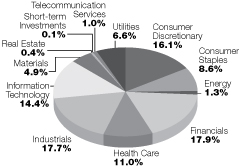
VictoryShares Developed Enhanced Volatility
Wtd ETF | |
Portfolio Holdings
As a Percentage of Total Investments
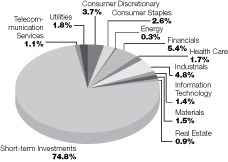
171
Victory Portfolios II | | Supplemental Information — continued
December 31, 2016 | |
(Unaudited)
VictoryShares US EQ Income Enhanced Volatility Wtd ETF
Portfolio Holdings
As a Percentage of Total Investments

VictoryShares US Small Cap Volatility Wtd ETF | |
Portfolio Holdings
As a Percentage of Total Investments
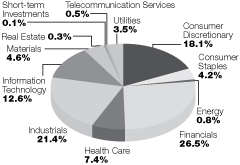
VictoryShares International Volatility Wtd ETF
Portfolio Holdings
As a Percentage of Total Investments
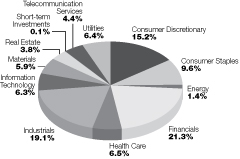
VictoryShares Emerging Market Volatility Wtd ETF
Portfolio Holdings
As a Percentage of Total Investments

172
Victory Portfolios II | | Supplemental Information — continued
December 31, 2016 | |
(Unaudited)
VictoryShares US Large Cap High Div Volatility
Wtd ETF
Portfolio Holdings
As a Percentage of Total Investments
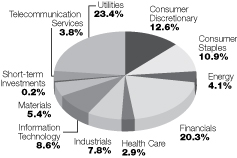
VictoryShares US Small Cap High Div Volatility
Wtd ETF
Portfolio Holdings
As a Percentage of Total Investments
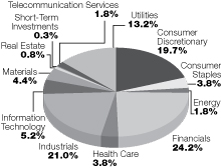
VictoryShares International High Div Volatility
Wtd ETF
Portfolio Holdings
As a Percentage of Total Investments
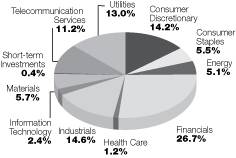
173
Victory Portfolios II | | Supplemental Information — continued
December 31, 2016 | |
(Unaudited)
Frequency Distribution of Premiums and Discounts
Closing Price vs. NAV
Information regarding how often shares of the Funds trade on the exchange at a price above (i.e., at a premium) or below (i.e., at a discount) the NAVs of the Funds are available, without charge, on the Funds' website at compassempetf.com.
Considerations of the Board in Continuing the Investment Advisory Agreement (the "Agreement")
The Board approved the Agreement on behalf of each of the Funds at a meeting, which was called for that purpose, on December 7, 2016. In considering whether to approve the Agreement, the Board requested, and the Adviser provided, information that the Board believed to be reasonably necessary to reach its conclusions. The Board, including the Independent Trustees, evaluated this information along with other information relating to the Funds and the Agreement provided throughout the year and at a meeting on October 25-26, 2016, and was advised by legal counsel to the Funds and by independent legal counsel to the Independent Trustees. The Board reviewed numerous factors with respect to each Fund. The Board considered each Fund's advisory fee, expense ratio and investment performance as significant factors in determining whether the Agreement should be continued. In considering whether the compensation paid to the Adviser was fair and reasonable, the Board also evaluated, among other things, the following factors:
• The requirements of the Funds for the services provided by the Adviser;
• The nature, quality and extent of the services provided and expected to be provided;
• Fees payable for the services and whether the fee arrangements provided for economies of scale that would benefit Fund shareholders as the Funds grow;
• Fees paid by other clients of the Adviser that are managed in a similar investment style and any differences in the services provided to the other clients compared to those provided to the Funds;
• Total expenses of each Fund;
• The Adviser's commitment to operating the Funds at competitive expense levels;
• The profitability of the Adviser (as reflected by comparing fees earned against an estimate of the Adviser's costs) with respect to the Adviser's relationship with the Funds;
• Research and other service benefits received by the Adviser obtained through payment of client commissions for securities transactions;
• Other benefits to be received by the Adviser, including revenues that may be paid by the Funds to affiliates of the Adviser;
• The capabilities and financial condition of the Adviser;
• Current economic and industry trends; and
• The historical relationship between each Fund and the Adviser.
The Board reviewed each Fund's current management fee in the context of the Adviser's profitability of the Fund. In addition, the Board compared each Fund's total expense ratio on a net and gross basis with a universe of comparable exchange-traded funds ("ETFs") compiled by FUSE Research Network, LLC ("FUSE") and a peer group of funds with similar investment strategies selected by FUSE from the universe. The Board reviewed the factors and methodology used by FUSE in the selection of each Fund's peer group. The Board also reviewed fees and other information related to the Adviser's management of similarly managed institutional or private accounts and the differences in the services provided to those other accounts. The Trustees also noted that there were no breakpoints in the advisory fee schedules for any of the Funds.
The Board reviewed each Fund's performance over a one-year period (where applicable) against the Fund's benchmark index noting that each Fund's investment objective is to track its proprietary benchmark index before fees and expenses and that the Funds generally underperform their benchmarks due to fees and expenses. The Board also considered each Fund's tracking error as a factor in evaluating performance. The Board
174
Victory Portfolios II | | Supplemental Information — continued
December 31, 2016 | |
(Unaudited)
considered the additional resources that the Adviser has committed to enhance portfolio analysis, compliance and trading systems.
The Board reviewed various other specific factors with respect to each Fund, as described below. In their deliberations, the Trustees did not rank the importance of any particular information or factor considered and each Trustee may have attributed different weights to various factors.
VictoryShares US 500 Volatility Wtd ETF
(formerly, Victory CEMP US 500 Volatility Wtd Index ETF)
The Board considered the VictoryShares US 500 Volatility Wtd ETF with the understanding that the Fund began operation on July 1, 2014. The Board considered that the Fund's gross annual management fee of 0.502% was higher than the median gross management fee of 0.298% charged to the funds in the Fund's peer group. The Board also noted that the Fund's net annual expense ratio of 0.350% was higher than the median expense ratio for the peer group of 0.280%. The Board considered the Adviser's contractual agreement to waive its fees and reimburse expenses for a specified period of time, as described in the Fund's prospectus. The Board then compared the Fund's total return of 4.70% for the one-year period ended July 31, 2016, to the 5.13% return of the benchmark index for the same period and noted the Fund's low tracking error of 0.04 for the period.
Having concluded, among other things, that: (1) the VictoryShares US 500 Volatility Wtd ETF's management fee, though higher, was within the range of advisory fees charged to comparable mutual funds; (2) the Fund's total expenses ratio was reasonable; (3) the Adviser's willingness to limit the expenses of the Fund for a period of time would provide stability to the Fund's expenses during that period; and (4) the Fund's performance in relation to its benchmark index was in an acceptable range, the Board agreed that the Agreement continued to be in the best interests of the Fund's shareholders.
VictoryShares US Discovery Enhanced Volatility Wtd ETF
(formerly, Victory CEMP US Discovery Enhanced Volatility Wtd Index ETF)
The Board considered the VictoryShares US Discovery Enhanced Volatility Wtd ETF with the understanding that the Fund began operation on August 1, 2014. The Board considered that the Fund's gross annual management fee of 0.512% was higher than the median gross management fee of 0.380% charged to the funds in the Fund's peer group. The Board also noted that the Fund's net annual expense ratio of 0.350% was lower than the median expense ratio for the peer group of 0.380%. The Board considered the Adviser's contractual agreement to waive its fees and reimburse expenses for a specified period of time, as described in the Fund's prospectus. The Board then compared the Fund's total return of -8.51% for the one-year period ended July 31, 2016, to -8.07% return of the benchmark index for the same period and noted the Fund's low tracking error of 0.05 for the period. The Board discussed the negative performance of benchmark index and the Fund with management.
Having concluded, among other things, that: (1) the VictoryShares US Discovery Enhanced Volatility Wtd ETF's management fee, though higher, was within the range of advisory fees charged to comparable mutual funds; (2) the Fund's total expenses ratio was reasonable; (3) the Adviser's willingness to limit the expenses of the Fund for a period of time would provide stability to the Fund's expenses during that period; and (4) the Fund's's performance in relation to its benchmark index was in an acceptable range, the Board agreed that the Agreement continued to be in the best interests of the Fund's shareholders.
VictoryShares US 500 Enhanced Volatility Wtd ETF
(formerly, Victory CEMP US 500 Enhanced Volatility Wtd Index ETF)
The Board considered the VictoryShares US 500 Enhanced Volatility Wtd ETF with the understanding that the Fund began operation on August 1, 2014. The Board considered that the Fund's gross annual management fee of 0..431% was higher than the median gross management fee of 0.280% charged to the funds in the Fund's peer group. The Board also noted that the Fund's net annual expense ratio of 0.350% was higher than the median expense ratio for the peer group of 0.280%. The Board considered the Adviser's contractual agreement to waive its fees and reimburse expenses for a specified period of time, as described in the Fund's prospectus. The Board then compared the Fund's total return of 4.74% for the one-year period ended July 31, 2016, to 5.13% return of the benchmark index for the same period and noted the Fund's low tracking error of 0.06 for the period.
175
Victory Portfolios II | | Supplemental Information — continued
December 31, 2016 | |
(Unaudited)
Having concluded, among other things, that: (1) the VictoryShares US 500 Enhanced Volatility Wtd ETF's management fee, though higher, was within the range of advisory fees charged to comparable mutual funds; (2) the Fund's total expenses ratio was reasonable; (3) the Adviser's willingness to limit the expenses of the Fund for a period of time would provide stability to the Fund's expenses during that period; and (4) the Fund's performance in relation to its benchmark index was within an acceptable range, the Board agreed that the Agreement continued to be in the best interests of the Fund's shareholders.
VictoryShares Developed Enhanced Volatility Wtd ETF
(formerly, Victory CEMP Developed Enhanced Volatility Wtd Index ETF)
The Board considered the VictoryShares Developed Enhanced Volatility Wtd ETF with the understanding that the Fund began operation on September 30 1, 2014. The Board considered that the Fund's gross annual management fee of 0.698% was higher than the median gross management fee of 0.351% charged to the funds in the Fund's peer group. The Board also noted that the Fund's net annual expense ratio of 0.450% was higher than the median expense ratio for the peer group of 0.380%. The Board considered the Adviser's contractual agreement to waive its fees and reimburse expenses for a specified period of time, as described in the Fund's prospectus. The Board then compared the Fund's total return of -15.02% for the one-year period ended July 31, 2016, to -14.14% return of the benchmark index for the same period and noted the Fund's tracking error of 0.66 for the period. The Board discussed the negative performance of benchmark index and the Fund with management.
Having concluded, among other things, that: (1) the VictoryShares Developed Enhanced Volatility Wtd ETF's management fee, though higher, was within the range of advisory fees charged to comparable mutual funds; (2) the Fund's total expenses ratio was reasonable; (3) the Adviser's willingness to limit the expenses of the Fund for a period of time would provide stability to the Fund's expenses during that period; and (4) the Fund's performance in relation to its benchmark index was in an acceptable range, the Board agreed that the Agreement continued to be in the best interests of the Fund's shareholders.
VictoryShares US EQ Income Enhanced Volatility Wtd ETF
(formerly, Victory CEMP US EQ Income Enhanced Volatility Wtd Index ETF)
The Board considered the VictoryShares US EQ Income Enhanced Volatility Wtd ETF with the understanding that the Fund began operation on July 1, 2014. The Board considered that the Fund's gross annual management fee of 0.415% was higher than the median gross management fee of 0.370% charged to the funds in the Fund's peer group. The Board also noted that the Fund's net annual expense ratio of 0.350% was lower than the median expense ratio for the peer group of 0.370%. The Board considered the Adviser's contractual agreement to waive its fees and reimburse expenses for a specified period of time, as described in the Fund's prospectus. The Board then compared the Fund's total return of 13.23% for the one-year period ended July 31, 2016, to 13.75% return of the benchmark index for the same period and noted the Fund's low tracking error of 0.05 for the period.
Having concluded, among other things, that: (1) the VictoryShares US EQ Income Enhanced Volatility Wtd ETF's management fee, though higher, was within the range of advisory fees charged to comparable mutual funds; (2) the Fund's total expenses ratio was reasonable; (3) the Adviser's willingness to limit the expenses of the Fund for a period of time would provide stability to the Fund's expenses during that period; and (4) the Fund's performance in relation to its benchmark index was within an acceptable range, the Board agreed that the Agreement continued to be in the best interests of the Fund's shareholders.
VictoryShares US Small Cap Volatility Wtd ETF
(formerly, Victory CEMP US Small Cap Volatility Wtd Index ETF)
The Board considered the VictoryShares US Small Cap Volatility Wtd ETF with the understanding that the Fund began operation on July 7, 2015. The Board considered that the Fund's gross annual management fee of 0.750% was higher than the median gross management fee of 0.440% charged to the funds in the Fund's peer group. The Board also noted that the Fund's net annual expense ratio of 0.350% was lower than the median expense ratio for the peer group of 0.380%. The Board considered the Adviser's contractual agreement to waive its fees and reimburse expenses for a specified period of time, as described in the Fund's prospectus. The Board then
176
Victory Portfolios II | | Supplemental Information — continued
December 31, 2016 | |
(Unaudited)
compared the Fund's total return of 4.49% for the one-year period ended July 31, 2016, to 4.68% return of the benchmark index for the same period and noted the Fund's tracking error of 0.19 for the period.
Having concluded, among other things, that: (1) the VictoryShares US Small Cap Volatility Wtd ETF's management fee, though higher, was within the range of advisory fees charged to comparable mutual funds; (2) the Fund's total expenses ratio was reasonable; (3) the Adviser's willingness to limit the expenses of the Fund for a period of time would provide stability to the Fund's expenses during that period; and (4) the Fund's performance in relation to its benchmark index was within an acceptable range, the Board agreed that the Agreement continued to be in the best interests of the Fund's shareholders.
VictoryShares International Volatility Wtd ETF
(formerly, Victory CEMP International Volatility Wtd Index ETF)
The Board considered the VictoryShares International Volatility Wtd ETF with the understanding that the Fund began operation on August 20, 2015 and, therefore, no one-year performance information was available. The Board considered that the Fund's gross annual management fee of 1.214% was higher than the median gross management fee of 0.376% charged to the funds in the Fund's peer group. The Board also noted that the Fund's net annual expense ratio of 0.450% was higher than the median expense ratio for the peer group of 0.430%. The Board considered the Adviser's contractual agreement to waive its fees and reimburse expenses for a specified period of time, as described in the Fund's prospectus.
Having concluded, among other things, that: (1) the VictoryShares International Volatility Wtd ETF's management fee, though higher, was within the range of advisory fees charged to comparable mutual funds; (2) the Fund's total expenses ratio was reasonable; and (3) the Adviser's willingness to limit the expenses of the Fund for a period of time would provide stability to the Fund's expenses during that period, the Board agreed that the Agreement continued to be in the best interests of the Fund's shareholders.
VictoryShares Emerging Market Volatility Wtd ETF
(formerly, Victory CEMP Emerging Market Volatility Wtd Index ETF)
The Board considered the VictoryShares Emerging Market Volatility Wtd ETF with the understanding that the Fund began operation on March 22, 2016 and, therefore, no one-year performance information was available. The Board considered that the Fund's gross annual management fee of 1.394%was higher than the median gross management fee of 0.601% charged to the funds in the Fund's peer group. The Board also noted that the Fund's net annual expense ratio of 0.500% was lower than the median expense ratio for the peer group of 0.590%. The Board considered the Adviser's contractual agreement to waive its fees and reimburse expenses for a specified period of time, as described in the Fund's prospectus.
Having concluded, among other things, that: (1) the VictoryShares Emerging Market Volatility Wtd ETF's management fee, though higher, was within the range of advisory fees charged to comparable mutual funds; (2) the Fund's total expenses ratio was reasonable; and (3) the Adviser's willingness to limit the expenses of the Fund for a period of time would provide stability to the Fund's expenses during that period, the Board agreed that the Agreement continued to be in the best interests of the Fund's shareholders.
VictoryShares US Large Cap High Div Volatility Wtd ETF
(formerly, Victory CEMP US Large Cap High Div Volatility Wtd Index ETF)
The Board considered the VictoryShares US Large Cap High Div Volatility Wtd ETF with the understanding that the Fund began operation on July 7, 2015. The Board considered that the Fund's gross annual management fee of 0.427% was higher than the median gross management fee of 0.374% charged to the funds in the Fund's peer group. The Board also noted that the Fund's net annual expense ratio of 0.350% was lower than the median expense ratio for the peer group of 0.375%. The Board considered the Adviser's contractual agreement to waive its fees and reimburse expenses for a specified period of time, as described in the Fund's prospectus. The Board then compared the Fund's total return of 13.36% for the one-year period ended July 31, 2016, to 13.75% return of the benchmark index for the same period and noted the Fund's low tracking error of 0.10 for the period.
177
Victory Portfolios II | | Supplemental Information — continued
December 31, 2016 | |
(Unaudited)
Having concluded, among other things, that: (1) the VictoryShares US Large Cap High Div Volatility Wtd ETF's management fee, though higher, was within the range of advisory fees charged to comparable mutual funds; (2) the Fund's total expenses ratio was reasonable; (3) the Adviser's willingness to limit the expenses of the Fund for a period of time would provide stability to the Fund's expenses during that period; and (4) the Fund's performance in relation to its benchmark index was within an acceptable range, the Board agreed that the Agreement continued to be in the best interests of the Fund's shareholders.
VictoryShares US Small Cap High Div Volatility Wtd ETF
(formerly, Victory CEMP US Small Cap High Div Volatility Wtd Index ETF)
The Board considered the VictoryShares US Small Cap High Div Volatility Wtd ETF with the understanding that the Fund began operation on July 7, 2015. The Board considered that the Fund's gross annual management fee of 0.466% was higher than the median gross management fee of 0.423% charged to the funds in the Fund's peer group. The Board also noted that the Fund's net annual expense ratio of 0.350% was lower than the median expense ratio for the peer group of 0.385%. The Board considered the Adviser's contractual agreement to waive its fees and reimburse expenses for a specified period of time, as described in the Fund's prospectus. The Board then compared the Fund's total return of 9.76% for the one-year period ended July 31, 2016, to 10.14% return of the benchmark index for the same period and noted the Fund's tracking error of 0.12 for the period.
Having concluded, among other things, that: (1) the VictoryShares US Small Cap High Div Volatility Wtd ETF's management fee, though higher, was within the range of advisory fees charged to comparable mutual funds; (2) the Fund's total expenses ratio was reasonable; (3) the Adviser's willingness to limit the expenses of the Fund for a period of time would provide stability to the Fund's expenses during that period; and (4) the Fund's performance in relation to its benchmark index was within an acceptable range, the Board agreed that the Agreement continued to be in the best interests of the Fund's shareholders.
VictoryShares International High Div Volatility Wtd ETF
(formerly, Victory CEMP International High Div Volatility Wtd Index ETF)
The Board considered the VictoryShares International High Div Volatility Wtd ETF with the understanding that the Fund began operation on August 20, 2015 and, therefore, no one-year performance information was available. The Board considered that the Fund's gross annual management fee of 0.636%was higher than the median gross management fee of 0.480% charged to the funds in the Fund's peer group. The Board also noted that the Fund's Class A net annual expense ratio, taking into account any shareholder servicing or distribution fees, of 0.450% was lower than the median expense ratio for the peer group of 0.470%. The Board considered the Adviser's contractual agreement to waive its fees and reimburse expenses for a specified period of time, as described in the Fund's prospectus.
Having concluded, among other things, that: (1) the VictoryShares International High Div Volatility Wtd ETF's management fee, though higher, was within the range of advisory fees charged to comparable mutual funds; (2) the Fund's total expenses ratio was reasonable; and (3) the Adviser's willingness to limit the expenses of the Fund for a period of time would provide stability to the Fund's expenses during that period, the Board agreed that the Agreement continued to be in the best interests of the Fund's shareholders.
Conclusion
Based on its review of the information requested and provided, and following extended discussions concerning the same, the Board determined that the Agreement, on behalf of the Funds discussed above, was consistent with the best interests of each Fund and its shareholders, and the Board approved the Agreement, on behalf of each Fund, for an additional annual period on the basis of the foregoing review and discussions and the following considerations, among others:
• The fairness and reasonableness of the investment advisory fee payable to the Adviser under the Agreement in light of the investment advisory services provided, the costs of these services, the profitability of the Adviser's relationship with the Fund and the comparability of the fee paid to the fees paid by other investment companies;
• The nature, quality and extent of the investment advisory services provided by the Adviser;
178
Victory Portfolios II | | Supplemental Information — continued
December 31, 2016 | |
(Unaudited)
• The Adviser's entrepreneurial commitment to the management of the Funds and the creation of a broad-based family of funds, which could entail a substantial commitment of the Adviser's resources to the successful operation of the Funds;
• The Adviser's representations regarding its staffing and capabilities to manage the Funds, including the retention of personnel with relevant portfolio management experience;
• The Adviser's efforts to enhance investment results by, among other things, developing quality portfolio management teams, committing substantial resources and implementing a risk management program aimed at measuring, managing and monitoring portfolio risk, and to reduce expenses across the complex; and
• The overall high quality of the personnel, operations, financial condition, investment management capabilities, methodologies and performance of the Adviser.
179
Victory CEMP Funds
c/o U.S. Bancorp Fund Services, LLC
615 East Michigan Street
Milwaukee, Wisconsin 53202

Visit our website at: | | Call Victory at: | |
www.compassempetf.com | | | 866-376-7890 | | |
VPII-VICTORYSHARESETF-SAR (12/16)
Item 2. Code of Ethics.
Not applicable for semi-annual reports.
Item 3. Audit Committee Financial Expert.
Not applicable for semi-annual reports.
Item 4. Principal Accountant Fees and Services.
Not applicable for semi-annual reports.
Item 5. Audit Committee of Listed Registrants.
Not applicable to registrants who are not listed issuers (as defined in Rule 10A-3 under the Securities Exchange Act of 1934).
Item 6. Investments.
Schedule of Investments is included as part of the report to shareholders filed under Item 1 of this Form.
Item 7. Disclosure of Proxy Voting Policies and Procedures for Closed-End Management Investment Companies.
Not applicable to open-end investment companies.
Item 8. Portfolio Managers of Closed-End Management Investment Companies.
Not applicable to open-end investment companies.
Item 9. Purchases of Equity Securities by Closed-End Management Investment Company and Affiliated Purchasers.
Not applicable to open-end investment companies.
Item 10. Submission of Matters to a Vote of Security Holders.
Not Applicable.
Item 11. Controls and Procedures.
(a) The Registrant’s President and Treasurer have reviewed the Registrant’s disclosure controls and procedures (as defined in Rule 30a-3(c) under the Investment Company Act of 1940 (the “Act”)) as of a date within 90 days of the filing of this report, as required by Rule 30a-3(b) under the Act and Rules 13a-15(b) or 15d-15(b) under the Securities Exchange Act of 1934. Based on their review, such officers have concluded that the disclosure controls and procedures are effective in ensuring that information required to be disclosed in this report is appropriately recorded, processed, summarized and reported and made known to them by others within the Registrant and by the Registrant’s service provider.
(b) There were no changes in the Registrant’s internal control over financial reporting (as defined in Rule 30a-3(d) under the Act) that occurred during the second fiscal quarter of the period covered by this report that has materially affected, or is reasonably likely to materially affect, the Registrant’s internal control over financial reporting.
Item 12. Exhibits.
(a) (1) Any code of ethics or amendment thereto, that is the subject of the disclosure required by Item 2, to the extent that the registrant intends to satisfy Item 2 requirements through filing an exhibit. Not Applicable.
(2) A separate certification for each principal executive officer and principal financial officer pursuant to Section 302 of the Sarbanes-Oxley Act of 2002. Filed herewith.
(3) Any written solicitation to purchase securities under Rule 23c-1 under the Act sent or given during the period covered by the report by or on behalf of the registrant to 10 or more persons. Not applicable to open-end investment companies.
(b) Certifications pursuant to Section 906 of the Sarbanes-Oxley Act of 2002. Furnished herewith.
SIGNATURES
Pursuant to the requirements of the Securities Exchange Act of 1934 and the Investment Company Act of 1940, the registrant has duly caused this report to be signed on its behalf by the undersigned, thereunto duly authorized.
(Registrant) | Victory Portfolios II |
| |
By (Signature and Title)* | /s/ Christopher K. Dyer |
| Christopher K. Dyer, President (Principal Executive Officer) |
| |
Date | February 24, 2017 | |
| | | | |
Pursuant to the requirements of the Securities Exchange Act of 1934 and the Investment Company Act of 1940, this report has been signed below by the following persons on behalf of the registrant and in the capacities and on the dates indicated.
By (Signature and Title)* | /s/ Christopher K. Dyer |
| Christopher K. Dyer, President (Principal Executive Officer) |
| |
Date | February 24, 2017 | |
|
By (Signature and Title)* | /s/ Christopher A. Ponte |
| Christopher A. Ponte, Treasurer (Principal Financial Officer) |
| |
Date | February 24, 2017 | | |
| | | | | | | |
* Print the name and title of each signing officer under his or her signature.