UNITED STATES
SECURITIES AND EXCHANGE COMMISSION
Washington, D.C. 20549
FORM N-CSR
CERTIFIED SHAREHOLDER REPORT OF REGISTERED
MANAGEMENT INVESTMENT COMPANIES
Investment Company Act file number | 811-22696 |
|
Victory Portfolios II |
(Exact name of registrant as specified in charter) |
|
3435 Stelzer Road, Columbus, Ohio | | 43219 |
(Address of principal executive offices) | | (Zip code) |
|
Citi Fund Services Ohio, Inc., 3435 Stelzer Road, Columbus, Ohio 43219 |
(Name and address of agent for service) |
|
Registrant’s telephone number, including area code: | 614-470-8000 | |
|
Date of fiscal year end: | June 30 | |
|
Date of reporting period: | December 31, 2015 | |
| | | | | | | | |
Item 1. Reports to Stockholders.

December 31, 2015
Semi Annual Report
Victory CEMP US 500 Volatility Wtd Index Fund
Victory CEMP US Small Cap Volatility Wtd Index Fund
Victory CEMP International Volatility Wtd Index Fund
Victory CEMP Emerging Market Volatility Wtd Index Fund
Victory CEMP US 500 Enhanced Volatility Wtd Index Fund
Victory CEMP International Enhanced Volatility Wtd Index Fund
Victory CEMP REC Enhanced Volatility Wtd Index Fund
Victory CEMP Commodity Volatility Wtd Index Strategy Fund
Victory CEMP Commodity Enhanced Volatility Wtd Index Strategy Fund
Victory CEMP Long/Short Strategy Fund
Victory CEMP Market Neutral Income Fund
Victory CEMP Enhanced Fixed Income Fund
Victory CEMP Ultra Short Term Fixed Income Fund
Victory CEMP Multi-Asset Balanced Fund
Victory CEMP Multi-Asset Growth Fund
Victory CEMP Alternative Strategies Fund
Victory
Portfolios II
Table of Contents
Shareholder Letter | | | 5 | | |
Financial Statements | |
The Victory Equity Funds | |
Victory CEMP US 500 Volatility Wtd Index Fund | |
Schedule of Investments | | | 7-17 | | |
Statement of Assets and Liabilities | | | 125-126 | | |
Statement of Operations | | | 133 | | |
Statements of Changes in Net Assets | | | 137-139 | | |
Financial Highlights | | | 155-157 | | |
Victory CEMP US Small Cap Volatility Wtd
Index Fund | |
Schedule of Investments | | | 18-28 | | |
Statement of Assets and Liabilities | | | 125-126 | | |
Statement of Operations | | | 133 | | |
Statements of Changes in Net Assets | | | 137-139 | | |
Financial Highlights | | | 158-160 | | |
Victory CEMP International Volatility Wtd Index Fund | |
Schedule of Investments | | | 29-46 | | |
Statement of Assets and Liabilities | | | 125-126 | | |
Statement of Operations | | | 133 | | |
Statements of Changes in Net Assets | | | 137-139 | | |
Financial Highlights | | | 161-163 | | |
Victory CEMP Emerging Market Volatility Wtd
Index Fund | |
Schedule of Investments | | | 47-64 | | |
Statement of Assets and Liabilities | | | 125-126 | | |
Statement of Operations | | | 133 | | |
Statements of Changes in Net Assets | | | 140-142 | | |
Financial Highlights | | | 164-166 | | |
The Victory Equity Long/Cash Funds | |
Victory CEMP US 500 Enhanced Volatility Wtd
Index Fund | |
Schedule of Investments | | | 65-75 | | |
Statement of Assets and Liabilities | | | 125-126 | | |
Statement of Operations | | | 133 | | |
Statements of Changes in Net Assets | | | 140-142 | | |
Financial Highlights | | | 167-169 | | |
Victory CEMP International Enhanced Volatility
Wtd Index Fund | |
Schedule of Investments | | | 76-93 | | |
Statement of Assets and Liabilities | | | 127-128 | | |
Statement of Operations | | | 134 | | |
Statements of Changes in Net Assets | | | 140-142 | | |
Financial Highlights | | | 170-172 | | |
1
Table of Contents (continued)
The Victory Real Estate Long/Cash Fund | |
Victory CEMP REC Enhanced Volatility Wtd
Index Fund | |
Schedule of Investments | | | 94-96 | | |
Statement of Assets and Liabilities | | | 127-128 | | |
Statement of Operations | | | 134 | | |
Statements of Changes in Net Assets | | | 143-145 | | |
Financial Highlights | | | 173-175 | | |
The Victory Commodity Fund | |
Victory CEMP Commodity Volatility Wtd Index
Strategy Fund | |
Schedule of Investments | | | 97 | | |
Statement of Assets and Liabilities | | | 127-128 | | |
Statement of Operations | | | 134 | | |
Statements of Changes in Net Assets | | | 143-145 | | |
Financial Highlights | | | 176-178 | | |
The Victory Commodity Long/Cash Fund | |
Victory CEMP Commodity Enhanced Volatility
Wtd Index Strategy Fund | |
Schedule of Investments | | | 98 | | |
Statement of Assets and Liabilities | | | 127-128 | | |
Statement of Operations | | | 134 | | |
Statements of Changes in Net Assets | | | 143-145 | | |
Financial Highlights | | | 179-181 | | |
The Victory Equity Long/Short Fund | |
Victory CEMP Long/Short Strategy Fund | |
Schedule of Investments | | | 99-109 | | |
Statement of Assets and Liabilities | | | 129-130 | | |
Statement of Operations | | | 135 | | |
Statements of Changes in Net Assets | | | 146-148 | | |
Financial Highlights | | | 182-184 | | |
The Victory Bond Replacement Fund | |
Victory CEMP Market Neutral Income Fund | |
Schedule of Investments | | | 110-119 | | |
Statement of Assets and Liabilities | | | 129-130 | | |
Statement of Operations | | | 135 | | |
Statements of Changes in Net Assets | | | 146-148 | | |
Financial Highlights | | | 185-187 | | |
The Victory Fixed Income Long/Cash Fund | |
Victory CEMP Enhanced Fixed Income Fund | |
Schedule of Investments | | | 120 | | |
Statement of Assets and Liabilities | | | 129-130 | | |
Statement of Operations | | | 135 | | |
Statements of Changes in Net Assets | | | 149-151 | | |
Financial Highlights | | | 188-190 | | |
2
Table of Contents (continued)
The Victory Fixed Income Ultra Short (12 months or less) Fund | |
Victory CEMP Ultra Short Term Fixed Income Fund | |
Schedule of Investments | | | 121 | | |
Statement of Assets and Liabilities | | | 129-130 | | |
Statement of Operations | | | 135 | | |
Statements of Changes in Net Assets | | | 149-151 | | |
Financial Highlights | | | 191-192 | | |
The Victory Multi-Asset Class Funds | |
Victory CEMP Multi-Asset Balanced Fund | |
Schedule of Investments | | | 122 | | |
Statement of Assets and Liabilities | | | 131-132 | | |
Statement of Operations | | | 136 | | |
Statements of Changes in Net Assets | | | 152-154 | | |
Financial Highlights | | | 193-194 | | |
Victory CEMP Multi-Asset Growth Fund | |
Schedule of Investments | | | 123 | | |
Statement of Assets and Liabilities | | | 131-132 | | |
Statement of Operations | | | 136 | | |
Statements of Changes in Net Assets | | | 152-154 | | |
Financial Highlights | | | 195-196 | | |
Victory CEMP Alternative Strategies Fund | |
Schedule of Investments | | | 124 | | |
Statement of Assets and Liabilities | | | 131-132 | | |
Statement of Operations | | | 136 | | |
Statements of Changes in Net Assets | | | 152-154 | | |
Financial Highlights | | | 197-198 | | |
Notes to Financial Statements | | | 199 | | |
Supplemental Information | | | 232 | | |
Board of Trustees | | | 232 | | |
Officers | | | 234 | | |
Proxy Voting and Form N-Q Information | | | 235 | | |
Expense Examples | | | 235 | | |
Portfolio Holdings | | | 239 | | |
3
The Funds are distributed by Victory Capital Advisers, Inc. Victory Capital Management Inc. is the investment adviser to the Funds and receives fees from the Funds for performing services for the Funds.
This report is not authorized for distribution to prospective investors unless preceded or accompanied by a current prospectus of the Compass EMP Funds.
For additional information about any Compass EMP Fund, including fees, expenses, and risks, view our prospectus online at compassempfunds.com or call 800-539-3863. Read it carefully before you invest or send money.
The information in this annual report is based on data obtained from recognized services and sources and is believed to be reliable. Any opinions, projections, or recommendations in this report are subject to change without notice and are not intended as individual investment advice. Past investment performance of the Funds, markets or securities mentioned herein should not be considered to be indicative of future results.
• NOT FDIC INSURED • NO BANK GUARANTEE • MAY LOSE VALUE

Call Compass EMP at:
800-539-FUND (800-539-3863)
Visit our website at:
compassempfunds.com
4
Victory Funds Letter to Shareholders
Dear Shareholder:
It has been somewhat of a rollercoaster ride for U.S. stocks this year, culminating in August's correction, as investor worry over geopolitical turmoil in Europe, recessions in Brazil and Russia, slowing economic growth in Asia, and anticipated changes in domestic monetary policy, provided turbulence. Still, the market recovered most of its losses by the end of the year, delivering a relatively flat, to slightly negative, equity return to investors for the second half of 2015. Large capitalization stocks led the way, benefitting from investor rotation during the most recent sell-off, while growth has — and continues to — materially outpace value across all capitalizations.
With both 2015 and 2016 estimate revisions trending consistently negative over the past year, leaving calendar 2015 growth estimates close to flat, the muted return over the past six months could be considered as a marginal victory for the equity market. Easy monetary policy has driven bond yields to record lows, helping equities, but it also stands to reason that investors are optimistic the U.S. can once again regain the lead position in the global growth story. Specifically, slowing growth in China and the end of the commodity super-cycle might just portend a revitalization for the U.S. and other developed nations on two fronts: 1) the consumer strengthens from improved real wages, but improved frugality sets the stage for a lower, but longer expansion, and 2) a larger portion of investment gets channeled back to developed markets as investors reassess the long term growth and risk profile of emerging markets, driving the improved productivity that has been missing in this recovery.
The second half of 2015 was dominated by weak growth centered in China, plunging energy and commodity prices, a strong U.S. dollar, and the long anticipated change in monetary policy by the Federal Reserve. U.S. GDP slowed heading into the second half of the year, falling from just under 4% in the second quarter, to approximately 2% in the third. Estimates for the final quarter have also been revised downward to nearly 2%. The U.S. consumer continued to provide leadership in the economy, albeit at a slower pace, as personal consumption dipped slightly from the second to the third quarter. Retail sales slowed in late summer, but climbed again in November, as consumers put to work some of the money conserved from less expensive gasoline. In contrast, the U.S. manufacturing sector fell into contraction in December, held in check by a strong dollar and weak overseas demand. Weakness overseas also temporarily delayed the Fed's plans to increase interest rates until the fourth quarter, which subsequently brought an end to an extraordinary period in which the Federal Funds rate was held near zero for seven years. While the Fed action was indeed important, many of the themes that we began the year with persisted until the end — steady job gains, subdued inflation, falling commodity prices, and a strong dollar that pushed the U.S. manufacturing sector into contraction. As a result, the tug of war for investors between risky assets and treasuries continued to dominate throughout the year.
International equity markets declined during the period as slow growth in China, the world's second largest economy, weighed heavily on global markets. In particular, emerging economies struggled, largely impacted by depressed commodity prices and a strong U.S. dollar, which has led to further local currency
5
devaluations. Brazil and Russia have been staggered by contracting economies and elevated inflation. Central bank policy continues to have a significant impact on global markets as investors focus on the implications of monetary policy divergence. The European Central Bank has signaled continued monetary easing to increase its stimulus program, in contrast to the Federal Reserve's December rate increase. International developed stocks outperformed their emerging peers, with international developed small capitalization stocks in particular posting the highest relative returns among foreign equity asset classes. Although global GDP forecasts have declined, it is unclear how much spillover from decelerating growth in emerging markets will impact the world's developed economies.
We continue to believe that the markets provide tactical challenges for investors to navigate. As we have stated in the past, we also believe that maintaining a long term view and building a portfolio that is diversified across asset classes is an appropriate strategy for investors seeking to weather possible market turbulence.
On the following pages, you will find information relating to your Victory Funds investment. If you have any questions, we encourage you to contact your financial advisor. Or, if you invest with us directly, you may call (800) 539-3863, or visit our website at www.vcm.com. My colleagues and I sincerely appreciate the confidence you have placed in the Victory Funds and we value the opportunity to help meet your investment goals.

Christopher K. Dyer, CFA
President,
Victory Funds
6
Victory Portfolios II
Victory CEMP US 500 Volatility Wtd Index Fund | | Schedule of Portfolio Investments
December 31, 2015 | |
(Unaudited)
Security Description | | Shares | | Value | |
Common Stocks (99.5%) | |
Consumer Discretionary (16.1%): | |
Advance Auto Parts, Inc. | | | 301 | | | $ | 45,304 | | |
AMC Networks, Inc., Class A (a) | | | 670 | | | | 50,036 | | |
Aramark | | | 2,252 | | | | 72,627 | | |
AutoNation, Inc. (a) | | | 1,024 | | | | 61,092 | | |
AutoZone, Inc. (a) | | | 105 | | | | 77,900 | | |
Bed Bath & Beyond, Inc. (a) | | | 950 | | | | 45,838 | | |
Best Buy Co., Inc. | | | 979 | | | | 29,811 | | |
BorgWarner, Inc. | | | 1,184 | | | | 51,184 | | |
Cablevision Systems Corp. | | | 1,250 | | | | 39,875 | | |
CarMax, Inc. (a) | | | 904 | | | | 48,789 | | |
Carter's, Inc. | | | 635 | | | | 56,534 | | |
CBS Corp., Class B | | | 1,294 | | | | 60,986 | | |
Chipotle Mexican Grill, Inc. (a) | | | 74 | | | | 35,509 | | |
Coach, Inc. | | | 1,613 | | | | 52,793 | | |
Comcast Corp., Class A | | | 1,103 | | | | 62,242 | | |
Dick's Sporting Goods, Inc. | | | 968 | | | | 34,219 | | |
Discovery Communications, Inc., Class A (a) | | | 1,530 | | | | 40,820 | | |
DISH Network Corp. (a) | | | 937 | | | | 53,578 | | |
Dollar General Corp. | | | 951 | | | | 68,348 | | |
Domino's Pizza, Inc. | | | 483 | | | | 53,734 | | |
DR Horton, Inc. | | | 1,410 | | | | 45,162 | | |
Dunkin' Brands Group, Inc. | | | 1,242 | | | | 52,897 | | |
Expedia, Inc. | | | 300 | | | | 37,290 | | |
Foot Locker, Inc. | | | 876 | | | | 57,019 | | |
Ford Motor Co. | | | 4,662 | | | | 65,688 | | |
GameStop Corp., Class A | | | 946 | | | | 26,526 | | |
General Motors Co. | | | 1,846 | | | | 62,782 | | |
Gentex Corp. | | | 3,757 | | | | 60,150 | | |
Genuine Parts Co. | | | 847 | | | | 72,749 | | |
Hanesbrands, Inc. | | | 1,597 | | | | 47,000 | | |
Harley-Davidson, Inc. | | | 874 | | | | 39,671 | | |
Harman International Industries, Inc. | | | 302 | | | | 28,451 | | |
Hasbro, Inc. | | | 654 | | | | 44,054 | | |
Hilton Worldwide Holdings, Inc. | | | 2,247 | | | | 48,086 | | |
Hyatt Hotels Corp., Class A (a) | | | 1,178 | | | | 55,390 | | |
Johnson Controls, Inc. | | | 1,374 | | | | 54,259 | | |
Kohl's Corp. | | | 852 | | | | 40,581 | | |
L Brands, Inc. | | | 649 | | | | 62,187 | | |
Las Vegas Sands Corp. | | | 839 | | | | 36,782 | | |
Lear Corp. | | | 517 | | | | 63,503 | | |
Lennar Corp., Class A | | | 893 | | | | 43,677 | | |
Lions Gate Entertainment Corp. | | | 1,195 | | | | 38,706 | | |
LKQ Corp. (a) | | | 1,741 | | | | 51,586 | | |
Lowe's Cos., Inc. | | | 936 | | | | 71,172 | | |
Macy's, Inc. | | | 895 | | | | 31,307 | | |
Marriott International, Inc., Class A | | | 756 | | | | 50,682 | | |
McDonald's Corp. | | | 734 | | | | 86,715 | | |
Mohawk Industries, Inc. (a) | | | 291 | | | | 55,112 | | |
See notes to financial statements.
7
Victory Portfolios II
Victory CEMP US 500 Volatility Wtd Index Fund | | Schedule of Portfolio Investments — continued
December 31, 2015 | |
(Unaudited)
Security Description | | Shares | | Value | |
MSG Networks, Inc., Class A (a) | | | 3,308 | | | $ | 68,806 | | |
Netflix, Inc. (a) | | | 265 | | | | 30,311 | | |
Newell Rubbermaid, Inc. | | | 1,640 | | | | 72,292 | | |
NIKE, Inc., Class B | | | 1,224 | | | | 76,500 | | |
Nordstrom, Inc. | | | 891 | | | | 44,381 | | |
NVR, Inc. (a) | | | 48 | | | | 78,865 | | |
Omnicom Group, Inc. | | | 1,182 | | | | 89,431 | | |
O'Reilly Automotive, Inc. (a) | | | 250 | | | | 63,355 | | |
Panera Bread Co., Class A (a) | | | 268 | | | | 52,201 | | |
Penske Automotive Group, Inc. | | | 925 | | | | 39,165 | | |
Polaris Industries, Inc. | | | 393 | | | | 33,778 | | |
PulteGroup, Inc. | | | 2,092 | | | | 37,279 | | |
PVH Corp. | | | 416 | | | | 30,638 | | |
Ralph Lauren Corp. | | | 377 | | | | 42,028 | | |
Ross Stores, Inc. | | | 1,096 | | | | 58,976 | | |
Royal Caribbean Cruises Ltd. | | | 472 | | | | 47,771 | | |
Scripps Networks Interactive, Inc., Class A | | | 1,102 | | | | 60,841 | | |
Service Corp. International | | | 2,380 | | | | 61,928 | | |
Sirius XM Holdings, Inc. (a) | | | 17,927 | | | | 72,963 | | |
Skechers U.S.A., Inc. (a) | | | 734 | | | | 22,174 | | |
Starbucks Corp. | | | 1,047 | | | | 62,851 | | |
Starwood Hotels & Resorts Worldwide, Inc. | | | 690 | | | | 47,803 | | |
TEGNA, Inc. | | | 1,918 | | | | 48,947 | | |
The Gap, Inc. | | | 1,983 | | | | 48,980 | | |
The Goodyear Tire & Rubber Co. | | | 1,577 | | | | 51,521 | | |
The Home Depot, Inc. | | | 565 | | | | 74,720 | | |
The Priceline Group, Inc. (a) | | | 40 | | | | 50,997 | | |
The Sherwin-Williams Co. | | | 248 | | | | 64,381 | | |
The TJX Cos., Inc. | | | 897 | | | | 63,606 | | |
The Walt Disney Co. | | | 553 | | | | 58,109 | | |
Tiffany & Co. | | | 488 | | | | 37,230 | | |
Time Warner Cable, Inc. | | | 289 | | | | 53,636 | | |
Time Warner, Inc. | | | 819 | | | | 52,965 | | |
Toll Brothers, Inc. (a) | | | 1,390 | | | | 46,287 | | |
Tractor Supply Co. | | | 644 | | | | 55,062 | | |
TripAdvisor, Inc. (a) | | | 451 | | | | 38,448 | | |
Twenty-First Century Fox, Inc. | | | 2,032 | | | | 55,189 | | |
Ulta Salon, Cosmetics & Fragrance, Inc. (a) | | | 408 | | | | 75,479 | | |
Under Armour, Inc. (a) | | | 491 | | | | 39,580 | | |
VF Corp. | | | 928 | | | | 57,768 | | |
Whirlpool Corp. | | | 298 | | | | 43,767 | | |
Williams-Sonoma, Inc. | | | 777 | | | | 45,385 | | |
Wyndham Worldwide Corp. | | | 782 | | | | 56,812 | | |
| | | | 4,783,609 | | |
Consumer Staples (9.2%): | |
Altria Group, Inc. | | | 1,350 | | | | 78,584 | | |
Archer-Daniels-Midland Co. | | | 1,453 | | | | 53,296 | | |
Brown-Forman Corp., Class B | | | 840 | | | | 83,395 | | |
Campbell Soup Co. | | | 1,707 | | | | 89,703 | | |
Church & Dwight Co., Inc. | | | 1,055 | | | | 89,548 | | |
See notes to financial statements.
8
Victory Portfolios II
Victory CEMP US 500 Volatility Wtd Index Fund | | Schedule of Portfolio Investments — continued
December 31, 2015 | |
(Unaudited)
Security Description | | Shares | | Value | |
Coca-Cola Enterprises, Inc. | | | 1,042 | | | $ | 51,308 | | |
Colgate-Palmolive Co. | | | 1,214 | | | | 80,877 | | |
Constellation Brands, Inc., Class A | | | 535 | | | | 76,205 | | |
Costco Wholesale Corp. | | | 515 | | | | 83,172 | | |
CVS Health Corp. | | | 809 | | | | 79,096 | | |
Dr Pepper Snapple Group, Inc. | | | 1,013 | | | | 94,412 | | |
Estee Lauder Cos., Inc., Class A | | | 769 | | | | 67,718 | | |
Flowers Foods, Inc. | | | 2,335 | | | | 50,179 | | |
General Mills, Inc. | | | 1,602 | | | | 92,371 | | |
Herbalife Ltd. (a) | | | 406 | | | | 21,770 | | |
Hormel Foods Corp. | | | 1,125 | | | | 88,965 | | |
Ingredion, Inc. | | | 776 | | | | 74,372 | | |
Keurig Green Mountain, Inc. | | | 415 | | | | 37,342 | | |
McCormick & Co., Inc. | | | 1,052 | | | | 90,009 | | |
Mead Johnson Nutrition Co. | | | 944 | | | | 74,529 | | |
Mondelez International, Inc. | | | 1,598 | | | | 71,654 | | |
Monster Beverage Corp. (a) | | | 305 | | | | 45,433 | | |
PepsiCo, Inc. | | | 925 | | | | 92,426 | | |
Philip Morris International, Inc. | | | 867 | | | | 76,218 | | |
Pilgrim's Pride Corp. | | | 1,242 | | | | 27,436 | | |
Pinnacle Foods, Inc. | | | 1,564 | | | | 66,407 | | |
Reynolds American, Inc. | | | 1,467 | | | | 67,702 | | |
Rite AID Corp. (a) | | | 4,864 | | | | 38,134 | | |
Spectrum Brands Holdings, Inc. | | | 728 | | | | 74,110 | | |
Sysco Corp. | | | 1,782 | | | | 73,062 | | |
The Clorox Co. | | | 811 | | | | 102,859 | | |
The Coca-Cola Co. | | | 2,500 | | | | 107,400 | | |
The Hain Celestial Group, Inc. (a) | | | 934 | | | | 37,724 | | |
The Kroger Co. | | | 1,913 | | | | 80,021 | | |
The Procter & Gamble Co. | | | 1,211 | | | | 96,166 | | |
Tyson Foods, Inc., Class A | | | 1,193 | | | | 63,623 | | |
Wal-Mart Stores, Inc. | | | 1,112 | | | | 68,166 | | |
WhiteWave Foods Co., Class A (a) | | | 1,087 | | | | 42,295 | | |
Whole Foods Market, Inc. | | | 1,496 | | | | 50,116 | | |
| | | | 2,737,803 | | |
Energy (2.2%): | |
Cameron International Corp. (a) | | | 366 | | | | 23,131 | | |
Cheniere Energy Partners LP Holdings LLC | | | 2,692 | | | | 46,841 | | |
Chevron Corp. | | | 688 | | | | 61,892 | | |
Exxon Mobil Corp. | | | 866 | | | | 67,506 | | |
FMC Technologies, Inc. (a) | | | 1,064 | | | | 30,867 | | |
Helmerich & Payne, Inc. | | | 630 | | | | 33,737 | | |
Kinder Morgan, Inc. | | | 2,132 | | | | 31,809 | | |
Marathon Petroleum Corp. | | | 804 | | | | 41,679 | | |
National Oilwell Varco, Inc. | | | 1,006 | | | | 33,691 | | |
ONEOK, Inc. | | | 996 | | | | 24,561 | | |
Phillips 66 | | | 551 | | | | 45,072 | | |
Plains GP Holdings LP, Class A | | | 1,542 | | | | 14,572 | | |
Schlumberger Ltd. | | | 711 | | | | 49,592 | | |
Spectra Energy Corp. | | | 1,992 | | | | 47,688 | | |
See notes to financial statements.
9
Victory Portfolios II
Victory CEMP US 500 Volatility Wtd Index Fund | | Schedule of Portfolio Investments — continued
December 31, 2015 | |
(Unaudited)
Security Description | | Shares | | Value | |
Tesoro Corp. | | | 376 | | | $ | 39,619 | | |
The Williams Cos., Inc. | | | 711 | | | | 18,273 | | |
Valero Energy Corp. | | | 673 | | | | 47,588 | | |
| | | | 658,118 | | |
Financials (17.6%): | |
Affiliated Managers Group, Inc. (a) | | | 364 | | | | 58,153 | | |
Aflac, Inc. | | | 1,281 | | | | 76,732 | | |
Alleghany Corp. (a) | | | 167 | | | | 79,814 | | |
American Express Co. | | | 794 | | | | 55,223 | | |
American Financial Group, Inc. | | | 1,326 | | | | 95,577 | | |
American International Group, Inc. | | | 1,142 | | | | 70,770 | | |
Ameriprise Financial, Inc. | | | 544 | | | | 57,892 | | |
AmTrust Financial Services, Inc. | | | 880 | | | | 54,190 | | |
Arthur J. Gallagher & Co. | | | 2,119 | | | | 86,752 | | |
Assurant, Inc. | | | 880 | | | | 70,875 | | |
Bank of New York Mellon Corp. | | | 1,498 | | | | 61,748 | | |
BB&T Corp. | | | 1,756 | | | | 66,394 | | |
Berkshire Hathaway, Inc., Class B (a) | | �� | 695 | | | | 91,768 | | |
BlackRock, Inc. | | | 225 | | | | 76,617 | | |
Brown & Brown, Inc. | | | 2,662 | | | | 85,450 | | |
Capital One Financial Corp. | | | 681 | | | | 49,155 | | |
CBOE Holdings, Inc. | | | 1,116 | | | | 72,428 | | |
CBRE Group, Inc., Class A (a) | | | 1,745 | | | | 60,342 | | |
Chubb Corp. | | | 346 | | | | 45,893 | | |
Cincinnati Financial Corp. | | | 1,402 | | | | 82,956 | | |
CIT Group, Inc. | | | 1,665 | | | | 66,101 | | |
Citigroup, Inc. | | | 1,116 | | | | 57,753 | | |
Citizens Financial Group, Inc. | | | 2,431 | | | | 63,668 | | |
CME Group, Inc. | | | 731 | | | | 66,229 | | |
CNA Financial Corp. | | | 2,034 | | | | 71,495 | | |
Comerica, Inc. | | | 1,125 | | | | 47,059 | | |
Discover Financial Services | | | 1,189 | | | | 63,754 | | |
E*Trade Financial Corp. (a) | | | 1,576 | | | | 46,713 | | |
East West BanCorp, Inc. | | | 1,376 | | | | 57,187 | | |
FactSet Research Systems, Inc. | | | 472 | | | | 76,733 | | |
Fifth Third BanCorp | | | 2,885 | | | | 57,989 | | |
First Republic Bank | | | 986 | | | | 65,135 | | |
Franklin Resources, Inc. | | | 1,683 | | | | 61,968 | | |
Goldman Sachs Group, Inc. | | | 352 | | | | 63,441 | | |
Huntington Bancshares, Inc. | | | 5,648 | | | | 62,467 | | |
Intercontinental Exchange, Inc. | | | 273 | | | | 69,959 | | |
Invesco, Ltd. | | | 1,836 | | | | 61,469 | | |
Jones Lang LaSalle, Inc. | | | 337 | | | | 53,873 | | |
JPMorgan Chase & Co. | | | 993 | | | | 65,568 | | |
KeyCorp | | | 3,819 | | | | 50,373 | | |
Legg Mason, Inc. | | | 1,474 | | | | 57,825 | | |
Lincoln National Corp. | | | 1,011 | | | | 50,813 | | |
Loews Corp. | | | 2,185 | | | | 83,904 | | |
M&T Bank Corp. | | | 993 | | | | 120,331 | | |
Markel Corp. (a) | | | 90 | | | | 79,502 | | |
See notes to financial statements.
10
Victory Portfolios II
Victory CEMP US 500 Volatility Wtd Index Fund | | Schedule of Portfolio Investments — continued
December 31, 2015 | |
(Unaudited)
Security Description | | Shares | | Value | |
Marsh & McLennan Cos., Inc. | | | 1,537 | | | $ | 85,227 | | |
MetLife, Inc. | | | 1,176 | | | | 56,695 | | |
Moody's Corp. | | | 661 | | | | 66,325 | | |
MSCI, Inc. | | | 1,074 | | | | 77,468 | | |
NASDAQ, Inc. | | | 1,348 | | | | 78,412 | | |
Navient Corp. | | | 3,460 | | | | 39,617 | | |
New York Community BanCorp, Inc. | | | 4,254 | | | | 69,425 | | |
Northern Trust Corp. | | | 828 | | | | 59,691 | | |
People's United Financial, Inc. | | | 4,951 | | | | 79,959 | | |
Principal Financial Group, Inc. | | | 1,173 | | | | 52,762 | | |
Raymond James Financial, Inc. | | | 1,147 | | | | 66,492 | | |
Regions Financial Corp. | | | 5,315 | | | | 51,024 | | |
Reinsurance Group of America, Inc. | | | 804 | | | | 68,782 | | |
Santander Consumer USA Holdings, Inc. (a) | | | 2,145 | | | | 33,998 | | |
SEI Investments Co. | | | 1,235 | | | | 64,714 | | |
Signature Bank (a) | | | 425 | | | | 65,182 | | |
StanCorp Financial Group, Inc. | | | 224 | | | | 25,509 | | |
State Street Corp. | | | 779 | | | | 51,694 | | |
SunTrust Banks, Inc. | | | 1,434 | | | | 61,433 | | |
SVB Financial Group (a) | | | 330 | | | | 39,237 | | |
Synchrony Financial (a) | | | 2,020 | | | | 61,428 | | |
T. Rowe Price Group, Inc. | | | 1,078 | | | | 77,065 | | |
TD Ameritrade Holding Corp. | | | 1,710 | | | | 59,354 | | |
TFS Financial Corp. | | | 5,337 | | | | 100,496 | | |
The Allstate Corp. | | | 1,074 | | | | 66,685 | | |
The Charles Schwab Corp. | | | 1,630 | | | | 53,676 | | |
The PNC Financial Services Group, Inc. | | | 746 | | | | 71,101 | | |
The Progressive Corp. | | | 2,579 | | | | 82,012 | | |
The Travelers Cos., Inc. | | | 759 | | | | 85,661 | | |
Torchmark Corp. | | | 1,352 | | | | 77,280 | | |
U.S. Bancorp | | | 1,684 | | | | 71,856 | | |
Voya Financial, Inc. | | | 1,538 | | | | 56,768 | | |
W.R. Berkley Corp. | | | 1,296 | | | | 70,956 | | |
Wells Fargo & Co. | | | 1,327 | | | | 72,135 | | |
| | | | 5,220,157 | | |
Health Care (10.6%): | |
Abbott Laboratories | | | 1,487 | | | | 66,781 | | |
Acadia Healthcare Co., Inc. (a) | | | 588 | | | | 36,726 | | |
Aetna, Inc. | | | 442 | | | | 47,789 | | |
Alexion Pharmaceuticals, Inc. (a) | | | 219 | | | | 41,774 | | |
Align Technology, Inc. (a) | | | 827 | | | | 54,458 | | |
Amgen, Inc. | | | 317 | | | | 51,459 | | |
Anthem, Inc. | | | 400 | | | | 55,776 | | |
Baxter International, Inc. | | | 1,953 | | | | 74,507 | | |
Becton, Dickinson & Co. | | | 584 | | | | 89,988 | | |
Biogen, Inc. (a) | | | 93 | | | | 28,491 | | |
Cardinal Health, Inc. | | | 818 | | | | 73,023 | | |
Celgene Corp. (a) | | | 348 | | | | 41,676 | | |
Centene Corp. (a) | | | 682 | | | | 44,882 | | |
Cerner Corp. (a) | | | 937 | | | | 56,379 | | |
See notes to financial statements.
11
Victory Portfolios II
Victory CEMP US 500 Volatility Wtd Index Fund | | Schedule of Portfolio Investments — continued
December 31, 2015 | |
(Unaudited)
Security Description | | Shares | | Value | |
Cigna Corp. | | | 341 | | | $ | 49,899 | | |
Community Health Systems, Inc. (a) | | | 764 | | | | 20,269 | | |
Cooper Companies, Inc. | | | 428 | | | | 57,438 | | |
DENTSPLY International, Inc. | | | 1,313 | | | | 79,896 | | |
Edwards Lifesciences Corp. (a) | | | 712 | | | | 56,234 | | |
ELI Lilly & Co. | | | 701 | | | | 59,066 | | |
Express Scripts Holding, Inc. (a) | | | 722 | | | | 63,110 | | |
Gilead Sciences, Inc. | | | 437 | | | | 44,220 | | |
HCA Holdings, Inc. (a) | | | 596 | | | | 40,307 | | |
Henry Schein, Inc. (a) | | | 558 | | | | 88,271 | | |
Hologic, Inc. (a) | | | 1,415 | | | | 54,746 | | |
Humana, Inc. | | | 204 | | | | 36,416 | | |
IDEXX Laboratories, Inc. (a) | | | 492 | | | | 35,877 | | |
Illumina, Inc. (a) | | | 229 | | | | 43,955 | | |
Intuitive Surgical, Inc. (a) | | | 113 | | | | 61,716 | | |
Johnson & Johnson | | | 846 | | | | 86,902 | | |
Laboratory Corp. of America Holdings (a) | | | 626 | | | | 77,400 | | |
McKesson Corp. | | | 340 | | | | 67,058 | | |
Mednax, Inc. (a) | | | 931 | | | | 66,715 | | |
Merck & Co., Inc. | | | 1,176 | | | | 62,116 | | |
Mettler-Toledo International, Inc. (a) | | | 221 | | | | 74,948 | | |
Mylan NV (a) | | | 659 | | | | 35,632 | | |
Patterson Cos., Inc. | | | 1,555 | | | | 70,302 | | |
PerkinElmer, Inc. | | | 1,544 | | | | 82,712 | | |
Pfizer, Inc. | | | 2,370 | | | | 76,504 | | |
Quest Diagnostics, Inc. | | | 865 | | | | 61,536 | | |
Quintiles Transnational Holdings, Inc. (a) | | | 909 | | | | 62,412 | | |
Regeneron Pharmaceuticals, Inc. (a) | | | 81 | | | | 43,972 | | |
ResMed, Inc. | | | 793 | | | | 42,576 | | |
Sirona Dental Systems, Inc. (a) | | | 790 | | | | 86,560 | | |
St. Jude Medical, Inc. | | | 850 | | | | 52,505 | | |
Stryker Corp. | | | 729 | | | | 67,753 | | |
Team Health Holdings, Inc. (a) | | | 596 | | | | 26,158 | | |
Teleflex, Inc. | | | 602 | | | | 79,133 | | |
Thermo Fisher Scientific, Inc. | | | 532 | | | | 75,464 | | |
UnitedHealth Group, Inc. | | | 471 | | | | 55,408 | | |
Universal Health Services, Inc., Class B | | | 373 | | | | 44,570 | | |
Varian Medical Systems, Inc. (a) | | | 743 | | | | 60,034 | | |
VCA, Inc. (a) | | | 942 | | | | 51,810 | | |
Waters Corp. (a) | | | 551 | | | | 74,154 | | |
| | | | 3,139,463 | | |
Industrials (17.4%): | |
3M Co. | | | 548 | | | | 82,551 | | |
A.O. Smith Corp. | | | 770 | | | | 58,990 | | |
Acuity Brands, Inc. | | | 303 | | | | 70,841 | | |
Alaska Air Group, Inc. | | | 539 | | | | 43,395 | | |
Allison Transmission Holdings, Inc. | | | 2,519 | | | | 65,217 | | |
AMERCO, Inc. | | | 171 | | | | 66,605 | | |
American Airlines Group, Inc. | | | 812 | | | | 34,388 | | |
AMETEK, Inc. | | | 1,254 | | | | 67,202 | | |
See notes to financial statements.
12
Victory Portfolios II
Victory CEMP US 500 Volatility Wtd Index Fund | | Schedule of Portfolio Investments — continued
December 31, 2015 | |
(Unaudited)
Security Description | | Shares | | Value | |
Avery Dennison Corp. | | | 1,074 | | | $ | 67,297 | | |
Boeing Co. | | | 461 | | | | 66,656 | | |
Carlisle Companies, Inc. | | | 635 | | | | 56,318 | | |
Caterpillar, Inc. | | | 767 | | | | 52,125 | | |
CH Robinson Worldwide, Inc. | | | 763 | | | | 47,321 | | |
Cintas Corp. | | | 920 | | | | 83,766 | | |
Colfax Corp. (a) | | | 1,379 | | | | 32,200 | | |
Copart, Inc. (a) | | | 2,384 | | | | 90,616 | | |
CSX Corp. | | | 1,880 | | | | 48,786 | | |
Cummins, Inc. | | | 539 | | | | 47,437 | | |
Danaher Corp. | | | 915 | | | | 84,985 | | |
Deere & Co. | | | 794 | | | | 60,558 | | |
Dover Corp. | | | 904 | | | | 55,424 | | |
Eaton Corp. PLC | | | 1,038 | | | | 54,018 | | |
Emerson Electric Co. | | | 1,418 | | | | 67,823 | | |
Equifax, Inc. | | | 664 | | | | 73,950 | | |
Expeditors International of Washington, Inc. | | | 1,377 | | | | 62,103 | | |
Fastenal Co. | | | 1,501 | | | | 61,271 | | |
Flowserve Corp. | | | 1,226 | | | | 51,590 | | |
Fluor Corp. | | | 1,087 | | | | 51,328 | | |
General Dynamics Corp. | | | 502 | | | | 68,955 | | |
Hexcel Corp. | | | 1,289 | | | | 59,874 | | |
Honeywell International, Inc. | | | 726 | | | | 75,192 | | |
Hubbell, Inc. (a) | | | 851 | | | | 85,984 | | |
Huntington Ingalls Industries, Inc. | | | 413 | | | | 52,389 | | |
IDEX Corp. | | | 1,129 | | | | 86,494 | | |
IHS, Inc., Class A (a) | | | 482 | | | | 57,083 | | |
Illinois Tool Works, Inc. | | | 888 | | | | 82,300 | | |
Ingersoll-Rand PLC | | | 1,214 | | | | 67,122 | | |
J.B. Hunt Transport Services, Inc. | | | 905 | | | | 66,391 | | |
Jacobs Engineering Group, Inc. (a) | | | 1,245 | | | | 52,228 | | |
JetBlue Airways Corp. (a) | | | 1,468 | | | | 33,250 | | |
Kansas City Southern | | | 517 | | | | 38,604 | | |
KAR Auction Services, Inc. | | | 2,168 | | | | 80,281 | | |
L-3 Communications Holdings, Inc. | | | 632 | | | | 75,530 | | |
Lennox International, Inc. | | | 604 | | | | 75,439 | | |
Lincoln Electric Holdings, Inc. | | | 1,011 | | | | 52,461 | | |
Lockheed Martin Corp. | | | 397 | | | | 86,209 | | |
Manpower, Inc. | | | 524 | | | | 44,168 | | |
Masco Corp. | | | 1,826 | | | | 51,676 | | |
Middleby Corp. (a) | | | 486 | | | | 52,425 | | |
Nielsen Holdings PLC | | | 1,339 | | | | 62,397 | | |
Norfolk Southern Corp. | | | 768 | | | | 64,965 | | |
Northrop Grumman Corp. | | | 407 | | | | 76,846 | | |
Old Dominion Freight Line, Inc. (a) | | | 925 | | | | 54,640 | | |
Owens Corning, Inc. | | | 997 | | | | 46,889 | | |
PACCAR, Inc. | | | 1,031 | | | | 48,869 | | |
Parker Hannifin Corp. | | | 587 | | | | 56,927 | | |
Precision Castparts Corp. | | | 179 | | | | 41,530 | | |
Quanta Services, Inc. (a) | | | 1,611 | | | | 32,623 | | |
See notes to financial statements.
13
Victory Portfolios II
Victory CEMP US 500 Volatility Wtd Index Fund | | Schedule of Portfolio Investments — continued
December 31, 2015 | |
(Unaudited)
Security Description | | Shares | | Value | |
Raytheon Co. | | | 627 | | | $ | 78,080 | | |
Republic Services, Inc., Class A | | | 2,021 | | | | 88,904 | | |
Robert Half International, Inc. | | | 1,141 | | | | 53,787 | | |
Rockwell Automation, Inc. | | | 555 | | | | 56,949 | | |
Rockwell Collins, Inc. | | | 938 | | | | 86,577 | | |
Rollins, Inc. | | | 2,225 | | | | 57,628 | | |
Roper Technologies, Inc. | | | 444 | | | | 84,267 | | |
Ryder System, Inc. | | | 698 | | | | 39,667 | | |
Snap-on, Inc. | | | 452 | | | | 77,486 | | |
Southwest Airlines Co. | | | 1,049 | | | | 45,170 | | |
Stanley Black & Decker, Inc. | | | 713 | | | | 76,098 | | |
Stericycle, Inc. (a) | | | 582 | | | | 70,189 | | |
Textron, Inc. | | | 1,372 | | | | 57,638 | | |
The ADT Corp. | | | 1,616 | | | | 53,296 | | |
Towers Watson & Co. | | | 513 | | | | 65,900 | | |
Union Pacific Corp. | | | 629 | | | | 49,188 | | |
United Continental Holdings, Inc. (a) | | | 600 | | | | 34,380 | | |
United Parcel Service, Inc. | | | 663 | | | | 63,800 | | |
United Rentals, Inc. (a) | | | 472 | | | | 34,239 | | |
United Technologies Corp. | | | 742 | | | | 71,284 | | |
Verisk Analytics, Inc., Class A (a) | | | 852 | | | | 65,502 | | |
W.W. Grainger, Inc. | | | 328 | | | | 66,449 | | |
WABCO Holdings, Inc. (a) | | | 452 | | | | 46,222 | | |
Wabtec Corp. | | | 612 | | | | 43,525 | | |
Waste Connections, Inc. | | | 1,619 | | | | 91,181 | | |
Xylem, Inc. | | | 2,092 | | | | 76,358 | | |
| | | | 5,168,266 | | |
Information Technology (13.9%): | |
Adobe Systems, Inc. (a) | | | 767 | | | | 72,052 | | |
Agilent Technologies, Inc. | | | 1,720 | | | | 71,913 | | |
Akamai Technologies, Inc. (a) | | | 770 | | | | 40,525 | | |
Alliance Data Systems Corp. (a) | | | 236 | | | | 65,271 | | |
Alphabet, Inc., Class A (a) | | | 67 | | | | 52,127 | | |
Amdocs Ltd. | | | 1,484 | | | | 80,982 | | |
Amphenol Corp., Class A | | | 1,229 | | | | 64,191 | | |
Analog Devices, Inc. | | | 775 | | | | 42,873 | | |
ANSYS, Inc. (a) | | | 744 | | | | 68,820 | | |
Apple, Inc. | | | 444 | | | | 46,735 | | |
Applied Materials, Inc. | | | 3,028 | | | | 56,533 | | |
Arista Networks, Inc. (a) | | | 503 | | | | 39,154 | | |
Arrow Electronics, Inc. (a) | | | 879 | | | | 47,624 | | |
Automatic Data Processing, Inc. | | | 876 | | | | 74,215 | | |
Avnet, Inc. | | | 1,300 | | | | 55,692 | | |
Broadridge Financial Solutions, Inc. | | | 1,239 | | | | 66,571 | | |
Brocade Communications Systems, Inc. | | | 4,087 | | | | 37,519 | | |
CA, Inc. | | | 2,296 | | | | 65,574 | | |
Cadence Design Systems, Inc. (a) | | | 2,572 | | | | 53,523 | | |
CDW Corp. | | | 1,496 | | | | 62,892 | | |
Cisco Systems, Inc. | | | 2,183 | | | | 59,279 | | |
Citrix Systems, Inc. (a) | | | 704 | | | | 53,258 | | |
See notes to financial statements.
14
Victory Portfolios II
Victory CEMP US 500 Volatility Wtd Index Fund | | Schedule of Portfolio Investments — continued
December 31, 2015 | |
(Unaudited)
Security Description | | Shares | | Value | |
Cognizant Technology Solutions Corp., Class A (a) | | | 820 | | | $ | 49,216 | | |
Commscope Holding Co., Inc. (a) | | | 1,116 | | | | 28,893 | | |
Corning, Inc. | | | 3,375 | | | | 61,695 | | |
eBay, Inc. (a) | | | 2,218 | | | | 60,951 | | |
Electronic Arts, Inc. (a) | | | 669 | | | | 45,974 | | |
EMC Corp. | | | 2,138 | | | | 54,905 | | |
F5 Networks, Inc. (a) | | | 423 | | | | 41,014 | | |
Facebook, Inc., Class A (a) | | | 569 | | | | 59,552 | | |
Fidelity National Information Services, Inc. | | | 868 | | | | 52,601 | | |
Fiserv, Inc. (a) | | | 813 | | | | 74,357 | | |
Fleetcor Technologies, Inc. (a) | | | 406 | | | | 58,030 | | |
Flextronics International Ltd. (a) | | | 4,776 | | | | 53,539 | | |
Gartner, Inc. (a) | | | 782 | | | | 70,927 | | |
Genpact Ltd. (a) | | | 2,758 | | | | 68,895 | | |
Global Payments, Inc. | | | 1,026 | | | | 66,187 | | |
HP, Inc. | | | 3,655 | | | | 43,275 | | |
Intel Corp. | | | 2,776 | | | | 95,633 | | |
International Business Machines Corp. | | | 441 | | | | 60,691 | | |
IPG Photonics Corp. (a) | | | 486 | | | | 43,332 | | |
Jack Henry & Associates, Inc. | | | 1,164 | | | | 90,862 | | |
KLA-Tencor Corp. | | | 1,002 | | | | 69,489 | | |
Lam Research Corp. | | | 672 | | | | 53,370 | | |
Linear Technology Corp. | | | 1,408 | | | | 59,798 | | |
Mastercard, Inc., Class A | | | 713 | | | | 69,418 | | |
Microchip Technology, Inc. | | | 1,257 | | | | 58,501 | | |
Micron Technology, Inc. (a) | | | 1,583 | | | | 22,415 | | |
Motorola Solutions, Inc. | | | 916 | | | | 62,700 | | |
NVIDIA Corp. | | | 1,773 | | | | 58,438 | | |
Oracle Corp. | | | 1,768 | | | | 64,585 | | |
Paychex, Inc. | | | 1,697 | | | | 89,753 | | |
Qualcomm, Inc. | | | 949 | | | | 47,436 | | |
Red Hat, Inc. (a) | | | 758 | | | | 62,770 | | |
SanDisk Corp. | | | 500 | | | | 37,995 | | |
Seagate Technology PLC | | | 890 | | | | 32,627 | | |
Skyworks Solutions, Inc. | | | 408 | | | | 31,347 | | |
Ssnc Technologies Holdings, Inc. | | | 695 | | | | 47,448 | | |
Symantec Corp. | | | 2,503 | | | | 52,563 | | |
Synopsys, Inc. (a) | | | 1,527 | | | | 69,646 | | |
Texas Instruments, Inc. | | | 1,110 | | | | 60,839 | | |
The Ultimate Software Group, Inc. (a) | | | 299 | | | | 58,457 | | |
The Western Union Co. | | | 2,889 | | | | 51,742 | | |
Total System Services, Inc. | | | 1,307 | | | | 65,089 | | |
Trimble Navigation Ltd. (a) | | | 2,240 | | | | 48,048 | | |
Tyler Technologies, Inc. (a) | | | 381 | | | | 66,416 | | |
VeriSign, Inc. (a) | | | 976 | | | | 85,262 | | |
Visa, Inc., Class A | | | 877 | | | | 68,011 | | |
VMware, Inc., Class A (a) | | | 633 | | | | 35,809 | | |
Western Digital Corp. | | | 545 | | | | 32,727 | | |
Xerox Corp. | | | 4,764 | | | | 50,641 | | |
Xilinx, Inc. | | | 1,294 | | | | 60,779 | | |
| | | | 4,131,971 | | |
See notes to financial statements.
15
Victory Portfolios II
Victory CEMP US 500 Volatility Wtd Index Fund | | Schedule of Portfolio Investments — continued
December 31, 2015 | |
(Unaudited)
Security Description | | Shares | | Value | |
Materials (5.0%): | |
Air Products & Chemicals, Inc. | | | 437 | | | $ | 56,858 | | |
Airgas, Inc. | | | 733 | | | | 101,388 | | |
Alcoa, Inc. | | | 4,035 | | | | 39,825 | | |
Ashland, Inc. | | | 617 | | | | 63,366 | | |
Ball Corp. | | | 849 | | | | 61,747 | | |
CF Industries Holdings, Inc. | | | 741 | | | | 30,240 | | |
Crown Holdings, Inc. (a) | | | 1,138 | | | | 57,697 | | |
E.I. du Pont de Nemours & Co. | | | 1,157 | | | | 77,056 | | |
Eastman Chemical Co. | | | 725 | | | | 48,945 | | |
Ecolab, Inc. | | | 629 | | | | 71,945 | | |
International Flavors & Fragrances, Inc. | | | 575 | | | | 68,793 | | |
International Paper Co. | | | 1,388 | | | | 52,328 | | |
LyondellBasell Industries NV, Class A | | | 496 | | | | 43,102 | | |
Martin Marietta Materials, Inc. | | | 246 | | | | 33,599 | | |
NewMarket Corp. | | | 154 | | | | 58,632 | | |
Newmont Mining Corp. | | | 1,955 | | | | 35,170 | | |
Nucor Corp. | | | 1,177 | | | | 47,434 | | |
Packaging Corp. of America | | | 718 | | | | 45,270 | | |
PPG Industries, Inc. | | | 688 | | | | 67,988 | | |
Praxair, Inc. | | | 803 | | | | 82,227 | | |
Sealed Air Corp. | | | 1,001 | | | | 44,645 | | |
The Dow Chemical Co. | | | 1,199 | | | | 61,725 | | |
The Mosaic Co. | | | 1,567 | | | | 43,234 | | |
The Valspar Corp. | | | 960 | | | | 79,632 | | |
W.R. Grace & Co. (a) | | | 580 | | | | 57,762 | | |
Westlake Chemical Corp. | | | 756 | | | | 41,066 | | |
| | | | 1,471,674 | | |
Telecommunication Services (0.2%): | |
CenturyLink, Inc. | | | 1,986 | | | | 49,968 | | |
Utilities (7.2%): | |
AES Corp. | | | 4,375 | | | | 41,869 | | |
Alliant Energy Corp. | | | 1,211 | | | | 75,627 | | |
Ameren Corp. | | | 1,679 | | | | 72,583 | | |
American Electric Power Co., Inc. | | | 1,237 | | | | 72,080 | | |
American Water Works Co., Inc. | | | 1,455 | | | | 86,936 | | |
Aqua America, Inc. | | | 2,692 | | | | 80,222 | | |
Atmos Energy Corp. | | | 1,233 | | | | 77,728 | | |
CenterPoint Energy, Inc. | | | 3,303 | | | | 60,643 | | |
CMS Energy Corp. | | | 1,870 | | | | 67,470 | | |
Consolidated Edison, Inc. | | | 1,132 | | | | 72,754 | | |
Dominion Resources, Inc. | | | 1,062 | | | | 71,834 | | |
DTE Energy Co. | | | 859 | | | | 68,883 | | |
Duke Energy Corp. | | | 984 | | | | 70,248 | | |
Edison International | | | 1,072 | | | | 63,473 | | |
Entergy Corp. | | | 1,020 | | | | 69,727 | | |
Eversource Energy | | | 1,412 | | | | 72,111 | | |
Exelon Corp. | | | 1,780 | | | | 49,431 | | |
ITC Holdings Corp. | | | 1,881 | | | | 73,829 | | |
See notes to financial statements.
16
Victory Portfolios II
Victory CEMP US 500 Volatility Wtd Index Fund | | Schedule of Portfolio Investments — continued
December 31, 2015 | |
(Unaudited)
Security Description | | Shares | | Value | |
NextEra Energy, Inc. | | | 715 | | | $ | 74,281 | | |
Oge Energy Corp. | | | 2,360 | | | | 62,044 | | |
Pepco Holdings, Inc. | | | 2,203 | | | | 57,300 | | |
PG&E Corp. | | | 1,338 | | | | 71,168 | | |
Pinnacle West Capital Corp. | | | 1,165 | | | | 75,119 | | |
Public Service Enterprise Group, Inc. | | | 1,488 | | | | 57,571 | | |
SCANA Corp. | | | 1,220 | | | | 73,798 | | |
Sempra Energy | | | 729 | | | | 68,533 | | |
TECO Energy, Inc. | | | 1,882 | | | | 50,155 | | |
The Southern Co. | | | 1,703 | | | | 79,684 | | |
WEC Energy Group, Inc. | | | 1,297 | | | | 66,549 | | |
Westar Energy, Inc. | | | 1,844 | | | | 78,204 | | |
Xcel Energy, Inc. | | | 2,044 | | | | 73,400 | | |
| | | | 2,135,254 | | |
Total Common Stocks (Cost $26,679,343) | | | 29,496,283 | | |
Cash Equivalents (0.7%) | |
Citibank Money Market Deposit Account, 0.02% (b) | | | 216,147 | | | | 216,147 | | |
Total Cash Equivalents (Cost $216,147) | | | 216,147 | | |
Total Investments (Cost $26,895,490) — 100.2% | | | 29,712,430 | | |
Segregated cash with broker — 0.5% (c) | | | 141,208 | | |
Liabilities in excess of other assets — (0.7)% | | | (196,181 | ) | |
NET ASSETS — 100.00% | | $ | 29,657,457 | | |
(a) Non-income producing security.
(b) Rate periodically changes. Rate disclosed is the daily yield on December 31, 2015.
(c) Segregated cash with broker represents collateral for futures contracts.
LLC — Limited Liability Co.
LP — Limited Partnership
PLC — Public Liability Co.
Futures Contracts Purchased
| | | Number
of
Contracts | | Expiration
Date | | Notional
Amount
at Value | | Unrealized
Depreciation | |
E-Mini S&P 500 Futures | | | 4 | | | 3/21/16 | | $ | 407,080 | | | $ | (6,986 | ) | |
See notes to financial statements.
17
Victory Portfolios II
Victory CEMP US Small Cap Volatility Wtd Index Fund | | Schedule of Portfolio Investments
December 31, 2015 | |
(Unaudited)
Security Description | | Shares | | Value | |
Common Stocks (93.8%) | |
Consumer Discretionary (15.0%): | |
Aaron's, Inc. | | | 334 | | | $ | 7,478 | | |
AMC Entertainment Holdings, Inc. | | | 464 | | | | 11,136 | | |
American Axle & Manufacturing Holdings, Inc. (a) | | | 725 | | | | 13,732 | | |
Asbury Automotive Group, Inc. (a) | | | 183 | | | | 12,342 | | |
Ascena Retail Group, Inc. (a) | | | 894 | | | | 8,806 | | |
Biglari Holdings, Inc. (a) | | | 38 | | | | 12,381 | | |
BJ's Restaurants, Inc. (a) | | | 275 | | | | 11,954 | | |
CalAtlantic Group, Inc. | | | 572 | | | | 21,691 | | |
Caleres, Inc. | | | 392 | | | | 10,513 | | |
Capella Education Co. | | | 253 | | | | 11,694 | | |
Cavco Industries, Inc. (a) | | | 171 | | | | 14,246 | | |
Choice Hotels International, Inc. | | | 366 | | | | 18,449 | | |
Cooper Tire & Rubber Co. | | | 324 | | | | 12,263 | | |
Core-Mark Holding Co., Inc. | | | 202 | | | | 16,552 | | |
CST Brands, Inc. | | | 524 | | | | 20,509 | | |
Dana Holding Corp. | | | 851 | | | | 11,744 | | |
Denny's Corp. (a) | | | 1,051 | | | | 10,331 | | |
DeVry Education Group, Inc. | | | 334 | | | | 8,454 | | |
Dorman Products, Inc. (a) | | | 320 | | | | 15,190 | | |
Drew Industries, Inc. | | | 284 | | | | 17,294 | | |
DSW, Inc. | | | 474 | | | | 11,310 | | |
Entravision Communications Corp. | | | 1,304 | | | | 10,054 | | |
Ethan Allen Interiors, Inc. | | | 392 | | | | 10,905 | | |
Express, Inc. (a) | | | 494 | | | | 8,536 | | |
Fiesta Restaurant Group, Inc. (a) | | | 224 | | | | 7,526 | | |
Five Below, Inc. (a) | | | 289 | | | | 9,277 | | |
Fossil Group, Inc. (a) | | | 198 | | | | 7,239 | | |
FTD Cos., Inc. (a) | | | 437 | | | | 11,436 | | |
Genesco, Inc. (a) | | | 263 | | | | 14,946 | | |
Gentherm, Inc. (a) | | | 245 | | | | 11,613 | | |
Grand Canyon Education, Inc. (a) | | | 442 | | | | 17,732 | | |
Gray Television, Inc. (a) | | | 770 | | | | 12,551 | | |
Group 1 Automotive, Inc. | | | 175 | | | | 13,248 | | |
Guess?, Inc. | | | 484 | | | | 9,138 | | |
Hibbett Sports, Inc. (a) | | | 374 | | | | 11,310 | | |
Iconix Brand Group, Inc. (a) | | | 554 | | | | 3,784 | | |
Installed Building Products, Inc. (a) | | | 371 | | | | 9,212 | | |
Interval Leisure Group, Inc. | | | 850 | | | | 13,269 | | |
iRobot Corp. (a) | | | 454 | | | | 16,072 | | |
Jack in the Box, Inc. | | | 189 | | | | 14,498 | | |
KB Home | | | 643 | | | | 7,928 | | |
Krispy Kreme Doughnuts, Inc. (a) | | | 685 | | | | 10,323 | | |
Lands' End, Inc. (a) | | | 309 | | | | 7,243 | | |
La-Z-Boy, Inc. | | | 604 | | | | 14,750 | | |
Lithia Motors, Inc. | | | 129 | | | | 13,760 | | |
M/I Homes, Inc. (a) | | | 564 | | | | 12,363 | | |
Marriott Vacations Worldwide Corp. | | | 209 | | | | 11,903 | | |
Mattress Firm Holding Corp. (a) | | | 214 | | | | 9,551 | | |
See notes to financial statements.
18
Victory Portfolios II
Victory CEMP US Small Cap Volatility Wtd Index Fund | | Schedule of Portfolio Investments — continued
December 31, 2015 | |
(Unaudited)
Security Description | | Shares | | Value | |
MDC Holdings, Inc. | | | 532 | | | $ | 13,582 | | |
Meredith Corp. | | | 318 | | | | 13,754 | | |
Meritage Homes Corp. (a) | | | 279 | | | | 9,483 | | |
Monro Muffler Brake, Inc. | | | 287 | | | | 19,005 | | |
Motorcar Parts of America, Inc. (a) | | | 293 | | | | 9,906 | | |
Movado Group, Inc. | | | 318 | | | | 8,176 | | |
Murphy USA, Inc. (a) | | | 293 | | | | 17,797 | | |
Nexstar Broadcasting Group, Inc. | | | 321 | | | | 18,842 | | |
Nutrisystem, Inc. | | | 312 | | | | 6,752 | | |
Papa John's International, Inc. | | | 229 | | | | 12,794 | | |
Pier 1 Imports, Inc. | | | 824 | | | | 4,194 | | |
Popeyes Louisiana Kitchen, Inc. (a) | | | 245 | | | | 14,333 | | |
Red Robin Gourmet Burgers, Inc. (a) | | | 136 | | | | 8,397 | | |
Regal Entertainment Group | | | 892 | | | | 16,832 | | |
Rent-A-Center, Inc. | | | 376 | | | | 5,629 | | |
Select Comfort Corp. (a) | | | 516 | | | | 11,048 | | |
Sinclair Broadcast Group, Inc. | | | 516 | | | | 16,791 | | |
Smith & Wesson Holding Corp. (a) | | | 526 | | | | 11,561 | | |
Sonic Automotive, Inc. | | | 771 | | | | 17,548 | | |
Sonic Corp. | | | 386 | | | | 12,472 | | |
Standard Motor Products, Inc. | | | 367 | | | | 13,964 | | |
Steven Madden Ltd. (a) | | | 358 | | | | 10,819 | | |
Strayer Education, Inc. (a) | | | 166 | | | | 9,980 | | |
Taylor Morrison Home Corp., Class A (a) | | | 578 | | | | 9,248 | | |
Tenneco, Inc. (a) | | | 328 | | | | 15,058 | | |
Texas Roadhouse, Inc. | | | 456 | | | | 16,311 | | |
The Buckle, Inc. | | | 339 | | | | 10,434 | | |
The Cato Corp., Class A | | | 428 | | | | 15,759 | | |
The Cheesecake Factory, Inc. | | | 332 | | | | 15,309 | | |
The Finish Line, Inc., Class A | | | 410 | | | | 7,413 | | |
The Wendy's Co. | | | 1,647 | | | | 17,738 | | |
Thor Industries, Inc. | | | 342 | | | | 19,203 | | |
Tile Shop Holdings, Inc. (a) | | | 581 | | | | 9,528 | | |
TRI Pointe Group, Inc. (a) | | | 939 | | | | 11,897 | | |
Tumi Holdings, Inc. (a) | | | 588 | | | | 9,778 | | |
Tupperware Brands Corp. | | | 259 | | | | 14,413 | | |
Universal Electronics, Inc. (a) | | | 303 | | | | 15,559 | | |
Vitamin Shoppe, Inc. (a) | | | 368 | | | | 12,034 | | |
WCI Communities, Inc. (a) | | | 523 | | | | 11,652 | | |
William Lyon Homes (a) | | | 448 | | | | 7,392 | | |
Wolverine World Wide, Inc. | | | 557 | | | | 9,307 | | |
Zumiez, Inc. (a) | | | 397 | | | | 6,003 | | |
| | | | 1,095,931 | | |
Consumer Staples (4.2%): | |
Cal-Maine Foods, Inc. | | | 164 | | | | 7,600 | | |
Coca-Cola Bottling Co. Consolidated | | | 77 | | | | 14,054 | | |
Ingles Markets, Inc. | | | 164 | | | | 7,229 | | |
Inter Parfums, Inc. | | | 467 | | | | 11,124 | | |
J&J Snack Foods Corp. | | | 128 | | | | 14,934 | | |
John B. Sanfilippo & Son, Inc. | | | 205 | | | | 11,076 | | |
See notes to financial statements.
19
Victory Portfolios II
Victory CEMP US Small Cap Volatility Wtd Index Fund | | Schedule of Portfolio Investments — continued
December 31, 2015 | |
(Unaudited)
Security Description | | Shares | | Value | |
Lancaster Colony Corp. | | | 226 | | | $ | 26,093 | | |
Nu Skin Enterprises, Inc. | | | 193 | | | | 7,313 | | |
PriceSmart, Inc. | | | 169 | | | | 14,025 | | |
Sanderson Farms, Inc. | | | 187 | | | | 14,496 | | |
Smart & Final Stores, Inc. (a) | | | 681 | | | | 12,401 | | |
Snyder's-Lance, Inc. | | | 589 | | | | 20,202 | | |
SpartanNash Co. | | | 560 | | | | 12,118 | | |
SUPERVALU, Inc. (a) | | | 1,409 | | | | 9,553 | | |
The Andersons, Inc. | | | 307 | | | | 9,710 | | |
The Boston Beer Co., Inc. (a) | | | 62 | | | | 12,518 | | |
The Fresh Market, Inc. (a) | | | 378 | | | | 8,853 | | |
Tootsie Roll Industries, Inc. | | | 554 | | | | 17,501 | | |
United Natural Foods, Inc. (a) | | | 221 | | | | 8,699 | | |
USANA Health Sciences, Inc. (a) | | | 48 | | | | 6,132 | | |
Vector Group Ltd. | | | 990 | | | | 23,354 | | |
WD-40 Co. | | | 204 | | | | 20,125 | | |
Weis Markets, Inc. | | | 370 | | | | 16,392 | | |
| | | | 305,502 | | |
Energy (0.6%): | |
Atwood Oceanics, Inc. | | | 448 | | | | 4,583 | | |
Dril-Quip, Inc. (a) | | | 169 | | | | 10,009 | | |
Forum Energy Technologies, Inc. (a) | | | 512 | | | | 6,380 | | |
Hornbeck Offshore Services, Inc. (a) | | | 374 | | | | 3,718 | | |
US Silica Holdings, Inc. | | | 330 | | | | 6,181 | | |
World Fuel Services Corp. | | | 385 | | | | 14,807 | | |
| | | | 45,678 | | |
Financials (23.1%): | |
1st Source Corp. | | | 535 | | | | 16,515 | | |
Alexander & Baldwin, Inc. | | | 466 | | | | 16,455 | | |
American Equity Investment Life Holding Co. | | | 556 | | | | 13,361 | | |
American National Insurance Co. | | | 171 | | | | 17,488 | | |
Ameris Bancorp | | | 606 | | | | 20,598 | | |
AMERISAFE, Inc. | | | 353 | | | | 17,968 | | |
Associated Banc-Corp. | | | 923 | | | | 17,306 | | |
Astoria Financial Corp. | | | 1,170 | | | | 18,545 | | |
BancFirst Corp. | | | 291 | | | | 17,058 | | |
BancorpSouth, Inc. | | | 601 | | | | 14,418 | | |
Bank of Hawaii Corp. | | | 334 | | | | 21,009 | | |
Banner Corp. | | | 365 | | | | 16,739 | | |
BBCN Bancorp, Inc. | | | 1,043 | | | | 17,960 | | |
Beneficial Bancorp, Inc. (a) | | | 2,069 | | | | 27,559 | | |
Berkshire Hills Bancorp, Inc. | | | 784 | | | | 22,823 | | |
BNC Bancorp | | | 814 | | | | 20,659 | | |
BofI Holding, Inc. (a) | | | 540 | | | | 11,367 | | |
Boston Private Financial Holdings, Inc. | | | 1,120 | | | | 12,701 | | |
Capital Bank Financial Corp. | | | 556 | | | | 17,781 | | |
Capitol Federal Financial, Inc. | | | 2,258 | | | | 28,360 | | |
Cathay General Bancorp | | | 511 | | | | 16,010 | | |
Chemical Financial Corp. | | | 578 | | | | 19,808 | | |
See notes to financial statements.
20
Victory Portfolios II
Victory CEMP US Small Cap Volatility Wtd Index Fund | | Schedule of Portfolio Investments — continued
December 31, 2015 | |
(Unaudited)
Security Description | | Shares | | Value | |
Cohen & Steers, Inc. | | | 572 | | | $ | 17,435 | | |
Columbia Banking System, Inc. | | | 546 | | | | 17,750 | | |
Community Bank System, Inc. | | | 531 | | | | 21,208 | | |
CVB Financial Corp. | | | 1,015 | | | | 17,174 | | |
Eagle Bancorp, Inc. (a) | | | 456 | | | | 23,015 | | |
Encore Capital Group, Inc. (a) | | | 401 | | | | 11,661 | | |
EverBank Financial Corp. | | | 1,104 | | | | 17,642 | | |
Evercore Partners, Inc. | | | 304 | | | | 16,437 | | |
FBL Financial Group, Inc., Class A | | | 287 | | | | 18,265 | | |
Financial Engines, Inc. | | | 340 | | | | 11,448 | | |
First Cash Financial Services, Inc. (a) | | | 363 | | | | 13,587 | | |
First Citizens BancShares, Inc. | | | 75 | | | | 19,363 | | |
First Financial Bancorp | | | 867 | | | | 15,667 | | |
First Financial Bankshares, Inc. | | | 484 | | | | 14,602 | | |
First Interstate BancSystem, Inc. | | | 656 | | | | 19,070 | | |
First Merchants Corp. | | | 752 | | | | 19,116 | | |
First Midwest Bancorp, Inc. | | | 989 | | | | 18,227 | | |
FirstMerit Corp. | | | 891 | | | | 16,617 | | |
FNB Corp. | | | 1,371 | | | | 18,289 | | |
Fulton Financial Corp. | | | 1,606 | | | | 20,894 | | |
GAMCO Investors, Inc., Class A | | | 438 | | | | 13,596 | | |
Glacier Bancorp, Inc. | | | 550 | | | | 14,592 | | |
Greenhill & Co., Inc. | | | 428 | | | | 12,245 | | |
Hancock Holding Co. | | | 454 | | | | 11,427 | | |
HFF, Inc. | | | 349 | | | | 10,843 | | |
Hilltop Holdings, Inc. (a) | | | 763 | | | | 14,665 | | |
Home BancShares, Inc. | | | 414 | | | | 16,775 | | |
Horace Mann Educators Corp. | | | 552 | | | | 18,315 | | |
IBERIABANK Corp. | | | 249 | | | | 13,712 | | |
Independent Bank Corp. | | | 381 | | | | 17,724 | | |
Infinity Property & Casualty Corp. | | | 251 | | | | 20,640 | | |
International Bancshares Corp. | | | 550 | | | | 14,135 | | |
Janus Capital Group, Inc. | | | 879 | | | | 12,385 | | |
Kemper Corp. | | | 541 | | | | 20,152 | | |
LegacyTexas Financial Group, Inc. | | | 410 | | | | 10,258 | | |
Main Street Capital Corp. | | | 6 | | | | 174 | | |
Manning & Napier, Inc. | | | 975 | | | | 8,278 | | |
Marcus & Millichap, Inc. (a) | | | 208 | | | | 6,061 | | |
MB Financial, Inc. | | | 470 | | | | 15,214 | | |
MBIA, Inc. (a) | | | 1,049 | | | | 6,798 | | |
National General Holdings Corp. | | | 826 | | | | 18,056 | | |
National Penn Bancshares, Inc. | | | 1,172 | | | | 14,451 | | |
NBT Bancorp, Inc. | | | 683 | | | | 19,042 | | |
Nelnet, Inc. | | | 449 | | | | 15,073 | | |
Northwest Bancshares, Inc. | | | 1,921 | | | | 25,722 | | |
Old National Bancorp | | | 1,204 | | | | 16,326 | | |
Opus Bank | | | 404 | | | | 14,936 | | |
Park National Corp. | | | 221 | | | | 19,996 | | |
Pinnacle Financial Partners, Inc. | | | 308 | | | | 15,819 | | |
PRA Group, Inc. (a) | | | 279 | | | | 9,679 | | |
See notes to financial statements.
21
Victory Portfolios II
Victory CEMP US Small Cap Volatility Wtd Index Fund | | Schedule of Portfolio Investments — continued
December 31, 2015 | |
(Unaudited)
Security Description | | Shares | | Value | |
Primerica, Inc. | | | 342 | | | $ | 16,153 | | |
PrivateBancorp, Inc. | | | 386 | | | | 15,834 | | |
ProAssurance Corp. | | | 600 | | | | 29,117 | | |
Provident Financial Services, Inc. | | | 1,034 | | | | 20,835 | | |
Renasant Corp. | | | 608 | | | | 20,921 | | |
RLI Corp. | | | 324 | | | | 20,007 | | |
S&T Bancorp, Inc. | | | 560 | | | | 17,259 | | |
Selective Insurance Group, Inc. | | | 615 | | | | 20,652 | | |
ServisFirst Bancshares, Inc. | | | 459 | | | | 21,816 | | |
Simmons First National Corp. | | | 376 | | | | 19,311 | | |
South State Corp. | | | 239 | | | | 17,196 | | |
Talmer Bancorp, Inc. | | | 1,164 | | | | 21,080 | | |
TCF Financial Corp. | | | 1,070 | | | | 15,108 | | |
Texas Capital Bancshares, Inc. (a) | | | 242 | | | | 11,960 | | |
The Navigators Group, Inc. (a) | | | 287 | | | | 24,621 | | |
Towne Bank | | | 939 | | | | 19,597 | | |
Trustmark Corp. | | | 754 | | | | 17,372 | | |
UMB Financial Corp. | | | 301 | | | | 14,012 | | |
Union Bankshares Corp. | | | 692 | | | | 17,466 | | |
United Bankshares, Inc. | | | 452 | | | | 16,719 | | |
United Community Banks, Inc. | | | 844 | | | | 16,450 | | |
Universal Insurance Holdings, Inc. | | | 365 | | | | 8,461 | | |
Valley National Bancorp | | | 2,311 | | | | 22,764 | | |
Virtus Investment Partners, Inc. | | | 92 | | | | 10,806 | | |
Washington Federal, Inc. | | | 823 | | | | 19,612 | | |
WesBanco, Inc. | | | 578 | | | | 17,352 | | |
Westamerica BanCorp | | | 389 | | | | 18,186 | | |
Wintrust Financial Corp. | | | 366 | | | | 17,758 | | |
WisdomTree Investments, Inc. | | | 434 | | | | 6,805 | | |
| | | | 1,692,274 | | |
Health Care (7.9%): | |
Abaxis, Inc. | | | 240 | | | | 13,363 | | |
Aceto Corp. | | | 478 | | | | 12,896 | | |
Air Methods Corp. (a) | | | 284 | | | | 11,908 | | |
AMN Healthcare Services, Inc. (a) | | | 314 | | | | 9,750 | | |
Analogic Corp. | | | 209 | | | | 17,263 | | |
Atrion Corp. | | | 44 | | | | 16,773 | | |
Cambrex Corp. (a) | | | 167 | | | | 7,864 | | |
Cantel Medical Corp. | | | 279 | | | | 17,337 | | |
Chemed Corp. | | | 140 | | | | 20,972 | | |
CONMED Corp. | | | 316 | | | | 13,920 | | |
CorVel Corp. (a) | | | 410 | | | | 18,007 | | |
Globus Medical, Inc. (a) | | | 664 | | | | 18,472 | | |
Greatbatch, Inc. (a) | | | 244 | | | | 12,810 | | |
Hanger, Inc. (a) | | | 765 | | | | 12,584 | | |
HealthEquity, Inc. (a) | | | 320 | | | | 8,022 | | |
HealthStream, Inc. (a) | | | 487 | | | | 10,714 | | |
Hill-Rom Holdings, Inc. | | | 422 | | | | 20,282 | | |
ICU Medical, Inc. (a) | | | 110 | | | | 12,406 | | |
Inogen, Inc. (a) | | | 167 | | | | 6,695 | | |
See notes to financial statements.
22
Victory Portfolios II
Victory CEMP US Small Cap Volatility Wtd Index Fund | | Schedule of Portfolio Investments — continued
December 31, 2015 | |
(Unaudited)
Security Description | | Shares | | Value | |
Insys Therapeutics, Inc. (a) | | | 231 | | | $ | 6,614 | | |
Integra LifeSciences Holdings Corp. (a) | | | 260 | | | | 17,623 | | |
Lannett Co., Inc. (a) | | | 153 | | | | 6,138 | | |
LHC Group, Inc. (a) | | | 202 | | | | 9,149 | | |
Ligand Pharmaceuticals, Inc. (a) | | | 91 | | | | 9,866 | | |
LivaNova PLC (a) | | | 197 | | | | 11,696 | | |
Luminex Corp. (a) | | | 587 | | | | 12,556 | | |
Magellan Health, Inc. (a) | | | 225 | | | | 13,874 | | |
Masimo Corp. (a) | | | 322 | | | | 13,366 | | |
Meridian Bioscience, Inc. | | | 979 | | | | 20,089 | | |
Merit Medical Systems, Inc. (a) | | | 532 | | | | 9,890 | | |
Myriad Genetics, Inc. (a) | | | 269 | | | | 11,610 | | |
Natus Medical, Inc. (a) | | | 336 | | | | 16,145 | | |
Neogen Corp. (a) | | | 215 | | | | 12,152 | | |
Omnicell, Inc. (a) | | | 433 | | | | 13,457 | | |
Owens & Minor, Inc. | | | 633 | | | | 22,776 | | |
PDL BioPharma, Inc. | | | 2,519 | | | | 8,917 | | |
Prestige Brands Holdings, Inc. (a) | | | 303 | | | | 15,598 | | |
Quality Systems, Inc. | | | 815 | | | | 13,138 | | |
Select Medical Holdings Corp. | | | 956 | | | | 11,386 | | |
Sucampo Pharmaceuticals, Inc. (a) | | | 219 | | | | 3,787 | | |
Supernus Pharmaceuticals, Inc. (a) | | | 402 | | | | 5,403 | | |
The Ensign Group, Inc. | | | 610 | | | | 13,804 | | |
The Providence Service Corp. (a) | | | 200 | | | | 9,384 | | |
US Physical Therapy, Inc. | | | 304 | | | | 16,319 | | |
Vascular Solutions, Inc. (a) | | | 301 | | | | 10,351 | | |
| | | | 577,126 | | |
Industrials (19.6%): | |
AAON, Inc. | | | 719 | | | | 16,695 | | |
ABM Industries, Inc. | | | 714 | | | | 20,328 | | |
Air Transport Services Group, Inc. (a) | | | 1,552 | | | | 15,644 | | |
Aircastle Ltd. | | | 642 | | | | 13,411 | | |
Alamo Group, Inc. | | | 249 | | | | 12,973 | | |
Altra Industrial Motion Corp. | | | 670 | | | | 16,804 | | |
American Railcar Industries, Inc. | | | 255 | | | | 11,801 | | |
American Woodmark Corp. (a) | | | 164 | | | | 13,117 | | |
Apogee Enterprises, Inc. | | | 197 | | | | 8,571 | | |
Applied Industrial Technologies, Inc. | | | 404 | | | | 16,358 | | |
ArcBest Corp. | | | 376 | | | | 8,043 | | |
Argan, Inc. | | | 271 | | | | 8,780 | | |
Astec Industries, Inc. | | | 388 | | | | 15,792 | | |
Astronics Corp. (a) | | | 201 | | | | 8,183 | | |
Atlas Air Worldwide Holdings, Inc. (a) | | | 280 | | | | 11,575 | | |
AZZ, Inc. | | | 281 | | | | 15,615 | | |
Barnes Group, Inc. | | | 476 | | | | 16,846 | | |
Chart Industries, Inc. (a) | | | 320 | | | | 5,747 | | |
CIRCOR International, Inc. | | | 299 | | | | 12,603 | | |
CLARCOR, Inc. | | | 377 | | | | 18,729 | | |
Comfort Systems USA, Inc. | | | 404 | | | | 11,482 | | |
Deluxe Corp. | | | 269 | | | | 14,671 | | |
See notes to financial statements.
23
Victory Portfolios II
Victory CEMP US Small Cap Volatility Wtd Index Fund | | Schedule of Portfolio Investments — continued
December 31, 2015 | |
(Unaudited)
Security Description | | Shares | | Value | |
Dycom Industries, Inc. (a) | | | 110 | | | $ | 7,696 | | |
EMCOR Group, Inc. | | | 404 | | | | 19,407 | | |
Encore Wire Corp. | | | 326 | | | | 12,091 | | |
EnerSys | | | 301 | | | | 16,836 | | |
ESCO Technologies, Inc. | | | 520 | | | | 18,792 | | |
Exponent, Inc. | | | 392 | | | | 19,581 | | |
Federal Signal Corp. | | | 999 | | | | 15,834 | | |
Forward Air Corp. | | | 362 | | | | 15,570 | | |
Franklin Electric Co., Inc. | | | 576 | | | | 15,569 | | |
FTI Consulting, Inc. (a) | | | 338 | | | | 11,715 | | |
G&K Services, Inc. | | | 280 | | | | 17,612 | | |
GATX Corp. | | | 318 | | | | 13,531 | | |
Generac Holdings, Inc. (a) | | | 367 | | | | 10,926 | | |
Griffon Corp. | | | 922 | | | | 16,412 | | |
H&E Equipment Services, Inc. | | | 303 | | | | 5,296 | | |
Hawaiian Holdings, Inc. (a) | | | 285 | | | | 10,069 | | |
Heartland Express, Inc. | | | 777 | | | | 13,225 | | |
Herman Miller, Inc. | | | 642 | | | | 18,425 | | |
Hillenbrand, Inc. | | | 577 | | | | 17,097 | | |
HNI Corp. | | | 286 | | | | 10,313 | | |
Hub Group, Inc., Class A (a) | | | 354 | | | | 11,664 | | |
Huron Consulting Group, Inc. (a) | | | 167 | | | | 9,920 | | |
Hyster-Yale Materials Handling, Inc. | | | 250 | | | | 13,113 | | |
ICF International, Inc. (a) | | | 424 | | | | 15,077 | | |
Insperity, Inc. | | | 269 | | | | 12,952 | | |
John Bean Technologies Corp. | | | 377 | | | | 18,786 | | |
Joy Global, Inc. | | | 623 | | | | 7,856 | | |
Kaman Corp. | | | 647 | | | | 26,405 | | |
Kforce, Inc. | | | 412 | | | | 10,415 | | |
Knight Transportation, Inc. | | | 452 | | | | 10,952 | | |
Knoll, Inc. | | | 662 | | | | 12,446 | | |
Korn/Ferry International | | | 488 | | | | 16,192 | | |
Landstar System, Inc. | | | 281 | | | | 16,480 | | |
Lindsay Corp. | | | 198 | | | | 14,335 | | |
Marten Transport Ltd. | | | 641 | | | | 11,346 | | |
Matson, Inc. | | | 379 | | | | 16,157 | | |
Matthews International Corp. | | | 386 | | | | 20,631 | | |
McGrath RentCorp | | | 614 | | | | 15,467 | | |
Meritor, Inc. (a) | | | 893 | | | | 7,457 | | |
Moog, Inc. (a) | | | 295 | | | | 17,877 | | |
MRC Global, Inc. (a) | | | 621 | | | | 8,011 | | |
MSA Safety, Inc. | | | 257 | | | | 11,172 | | |
Mueller Industries, Inc. | | | 598 | | | | 16,206 | | |
Multi-Color Corp. | | | 193 | | | | 11,543 | | |
MYR Group, Inc. (a) | | | 506 | | | | 10,429 | | |
National Presto Industries, Inc. | | | 207 | | | | 17,152 | | |
On Assignment, Inc. (a) | | | 341 | | | | 15,328 | | |
Patrick Industries, Inc. (a) | | | 255 | | | | 11,093 | | |
PGT, Inc. (a) | | | 625 | | | | 7,119 | | |
Primoris Services Corp. | | | 488 | | | | 10,751 | | |
See notes to financial statements.
24
Victory Portfolios II
Victory CEMP US Small Cap Volatility Wtd Index Fund | | Schedule of Portfolio Investments — continued
December 31, 2015 | |
(Unaudited)
Security Description | | Shares | | Value | |
Proto Labs, Inc. (a) | | | 165 | | | $ | 10,509 | | |
Raven Industries, Inc. | | | 659 | | | | 10,280 | | |
RBC Bearings, Inc. (a) | | | 204 | | | | 13,176 | | |
Resources Connection, Inc. | | | 915 | | | | 14,951 | | |
Rexnord Corp. (a) | | | 797 | | | | 14,442 | | |
Roadrunner Transportation Systems, Inc. (a) | | | 521 | | | | 4,913 | | |
RPX Corp. (a) | | | 960 | | | | 10,560 | | |
Rush Enterprises, Inc., Class A (a) | | | 570 | | | | 12,477 | | |
Saia, Inc. (a) | | | 315 | | | | 7,009 | | |
Simpson Manufacturing Co., Inc. | | | 560 | | | | 19,124 | | |
Standex International Corp. | | | 207 | | | | 17,212 | | |
Steelcase, Inc. | | | 937 | | | | 13,961 | | |
Sun Hydraulics Corp. | | | 532 | | | | 16,880 | | |
Swift Transportation Co. (a) | | | 592 | | | | 8,181 | | |
TAL International Group, Inc. | | | 586 | | | | 9,317 | | |
TASER International, Inc. (a) | | | 314 | | | | 5,429 | | |
Team, Inc. (a) | | | 368 | | | | 11,761 | | |
Tennant Co. | | | 315 | | | | 17,722 | | |
Terex Corp. | | | 394 | | | | 7,281 | | |
Tetra Tech, Inc. | | | 654 | | | | 17,017 | | |
The Greenbrier Cos., Inc. | | | 216 | | | | 7,046 | | |
Thermon Group Holdings, Inc. (a) | | | 685 | | | | 11,590 | | |
Trex Co., Inc. (a) | | | 253 | | | | 9,624 | | |
TriMas Corp. (a) | | | 526 | | | | 9,810 | | |
TrueBlue, Inc. (a) | | | 413 | | | | 10,639 | | |
Tutor Perini Corp. (a) | | | 517 | | | | 8,655 | | |
UniFirst Corp. | | | 178 | | | | 18,548 | | |
Universal Forest Products, Inc. | | | 214 | | | | 14,631 | | |
US Ecology, Inc. | | | 286 | | | | 10,422 | | |
Valmont Industries, Inc. | | | 184 | | | | 19,507 | | |
Wabash National Corp. (a) | | | 1,033 | | | | 12,220 | | |
WageWorks, Inc. (a) | | | 206 | | | | 9,346 | | |
Werner Enterprises, Inc. | | | 549 | | | | 12,841 | | |
Wesco Aircraft Holdings, Inc. (a) | | | 1,090 | | | | 13,047 | | |
WESCO International, Inc. (a) | | | 288 | | | | 12,580 | | |
West Corp. | | | 482 | | | | 10,397 | | |
Woodward, Inc. | | | 336 | | | | 16,686 | | |
| | | | 1,433,888 | | |
Information Technology (14.6%): | |
ADTRAN, Inc. | | | 873 | | | | 15,033 | | |
Ambarella, Inc. (a) | | | 95 | | | | 5,295 | | |
Amkor Technology, Inc. (a) | | | 1,343 | | | | 8,165 | | |
Anixter International, Inc. (a) | | | 253 | | | | 15,279 | | |
AVX Corp. | | | 1,144 | | | | 13,888 | | |
Badger Meter, Inc. | | | 270 | | | | 15,819 | | |
Benchmark Electronics, Inc. (a) | | | 846 | | | | 17,487 | | |
Blackbaud, Inc. | | | 271 | | | | 17,848 | | |
Blackhawk Network Holdings, Inc. (a) | | | 283 | | | | 12,511 | | |
Cabot Microelectronics Corp. (a) | | | 398 | | | | 17,424 | | |
CACI International, Inc., Class A (a) | | | 267 | | | | 24,772 | | |
See notes to financial statements.
25
Victory Portfolios II
Victory CEMP US Small Cap Volatility Wtd Index Fund | | Schedule of Portfolio Investments — continued
December 31, 2015 | |
(Unaudited)
Security Description | | Shares | | Value | |
CalAmp Corp. (a) | | | 561 | | | $ | 11,181 | | |
Cardtronics, Inc. (a) | | | 420 | | | | 14,133 | | |
Cirrus Logic, Inc. (a) | | | 314 | | | | 9,272 | | |
Coherent, Inc. (a) | | | 241 | | | | 15,692 | | |
Constant Contact, Inc. (a) | | | 337 | | | | 9,854 | | |
Convergys Corp. | | | 757 | | | | 18,842 | | |
CSG Systems International, Inc. | | | 562 | | | | 20,221 | | |
CTS Corp. | | | 974 | | | | 17,181 | | |
Diodes, Inc. (a) | | | 647 | | | | 14,868 | | |
Ebix, Inc. | | | 304 | | | | 9,968 | | |
Electronics For Imaging, Inc. (a) | | | 384 | | | | 17,948 | | |
Ellie Mae, Inc. (a) | | | 127 | | | | 7,649 | | |
Envestnet, Inc. (a) | | | 191 | | | | 5,701 | | |
ePlus, Inc. (a) | | | 142 | | | | 13,243 | | |
ExlService Holdings, Inc. (a) | | | 432 | | | | 19,410 | | |
Fair Isaac Corp. | | | 177 | | | | 16,670 | | |
FARO Technologies, Inc. (a) | | | 223 | | | | 6,583 | | |
GrubHub, Inc. (a) | | | 386 | | | | 9,341 | | |
II-VI, Inc. (a) | | | 722 | | | | 13,400 | | |
Infinera Corp. (a) | | | 412 | | | | 7,465 | | |
Insight Enterprises, Inc. (a) | | | 545 | | | | 13,690 | | |
Integrated Device Technology, Inc. (a) | | | 481 | | | | 12,674 | | |
InterDigital, Inc. | | | 313 | | | | 15,350 | | |
Littelfuse, Inc. | | | 172 | | | | 18,406 | | |
LogMeIn, Inc. (a) | | | 186 | | | | 12,481 | | |
ManTech International Corp. | | | 642 | | | | 19,414 | | |
Methode Electronics, Inc. | | | 247 | | | | 7,862 | | |
MKS Instruments, Inc. | | | 544 | | | | 19,585 | | |
Monolithic Power Systems, Inc. | | | 296 | | | | 18,858 | | |
Monotype Imaging Holdings, Inc. | | | 574 | | | | 13,569 | | |
MTS Systems Corp. | | | 289 | | | | 18,325 | | |
NeuStar, Inc. (a) | | | 387 | | | | 9,276 | | |
Newport Corp. (a) | | | 960 | | | | 15,235 | | |
NIC, Inc. | | | 639 | | | | 12,576 | | |
OmniVision Technologies, Inc. (a) | | | 674 | | | | 19,559 | | |
OSI Systems, Inc. (a) | | | 247 | | | | 21,900 | | |
Pegasystems, Inc. | | | 468 | | | | 12,870 | | |
Perficient, Inc. (a) | | | 692 | | | | 11,847 | | |
Photronics, Inc. (a) | | | 1,602 | | | | 19,946 | | |
Plantronics, Inc. | | | 307 | | | | 14,558 | | |
Plexus Corp. (a) | | | 423 | | | | 14,771 | | |
Polycom, Inc. (a) | | | 1,343 | | | | 16,908 | | |
Power Integrations, Inc. | | | 347 | | | | 16,875 | | |
QLogic Corp. (a) | | | 779 | | | | 9,504 | | |
Qualys, Inc. (a) | | | 185 | | | | 6,122 | | |
Rambus, Inc. (a) | | | 909 | | | | 10,535 | | |
Rofin-Sinar Technologies, Inc. (a) | | | 518 | | | | 13,872 | | |
Rogers Corp. (a) | | | 250 | | | | 12,893 | | |
Sanmina Corp. (a) | | | 554 | | | | 11,401 | | |
ScanSource, Inc. (a) | | | 348 | | | | 11,213 | | |
See notes to financial statements.
26
Victory Portfolios II
Victory CEMP US Small Cap Volatility Wtd Index Fund | | Schedule of Portfolio Investments — continued
December 31, 2015 | |
(Unaudited)
Security Description | | Shares | | Value | |
Science Applications International Corp. | | | 324 | | | $ | 14,833 | | |
Shutterstock, Inc. (a) | | | 197 | | | | 6,371 | | |
Silicon Laboratories, Inc. (a) | | | 288 | | | | 13,980 | | |
SPS Commerce, Inc. (a) | | | 217 | | | | 15,236 | | |
Super Micro Computer, Inc. (a) | | | 346 | | | | 8,480 | | |
Sykes Enterprises, Inc. (a) | | | 656 | | | | 20,192 | | |
Synaptics, Inc. (a) | | | 155 | | | | 12,453 | | |
Synchronoss Technologies, Inc. (a) | | | 253 | | | | 8,913 | | |
Tech Data Corp. (a) | | | 176 | | | | 11,683 | | |
TeleTech Holdings, Inc. | | | 574 | | | | 16,020 | | |
Tessera Technologies, Inc. | | | 342 | | | | 10,263 | | |
TiVo, Inc. (a) | | | 1,876 | | | | 16,190 | | |
VASCO Data Security International, Inc. (a) | | | 383 | | | | 6,408 | | |
Virtusa Corp. (a) | | | 303 | | | | 12,526 | | |
Vishay Intertechnology, Inc. | | | 1,729 | | | | 20,835 | | |
WebMD Health Corp. (a) | | | 364 | | | | 17,580 | | |
| | | | 1,066,181 | | |
Materials (4.2%): | |
Balchem Corp. | | | 207 | | | | 12,586 | | |
Boise Cascade Co. (a) | | | 373 | | | | 9,523 | | |
Calgon Carbon Corp. | | | 881 | | | | 15,197 | | |
Chemtura Corp. (a) | | | 485 | | | | 13,226 | | |
Commercial Metals Co. | | | 787 | | | | 10,774 | | |
Deltic Timber Corp. | | | 328 | | | | 19,309 | | |
Ferro Corp. (a) | | | 1,020 | | | | 11,342 | | |
Ferroglobe PLC | | | 721 | | | | 7,751 | | |
Greif, Inc., Class A | | | 331 | | | | 10,198 | | |
H.B. Fuller Co. | | | 516 | | | | 18,819 | | |
Innophos Holdings, Inc. | | | 338 | | | | 9,795 | | |
Innospec, Inc. | | | 346 | | | | 18,791 | | |
KapStone Paper and Packaging Corp. | | | 649 | | | | 14,661 | | |
Materion Corp. | | | 382 | | | | 10,696 | | |
Minerals Technologies, Inc. | | | 216 | | | | 9,906 | | |
Neenah Paper, Inc. | | | 305 | | | | 19,041 | | |
Olin Corp. | | | 592 | | | | 10,218 | | |
P.H. Glatfelter Co. | | | 977 | | | | 18,016 | | |
Quaker Chemical Corp. | | | 160 | | | | 12,362 | | |
Schweitzer-Mauduit International, Inc. | | | 461 | | | | 19,357 | | |
Sensient Technologies Corp. | | | 286 | | | | 17,967 | | |
Stepan Co. | | | 289 | | | | 14,360 | | |
| | | | 303,895 | | |
Telecommunication Services (0.6%): | |
Inteliquent, Inc. | | | 402 | | | | 7,144 | | |
Iridium Communications, Inc. (a) | | | 1,700 | | | | 14,297 | | |
Shenandoah Telecommunications Co. | | | 249 | | | | 10,719 | | |
Vonage Holdings Corp. (a) | | | 1,727 | | | | 9,913 | | |
| | | | 42,073 | | |
See notes to financial statements.
27
Victory Portfolios II
Victory CEMP US Small Cap Volatility Wtd Index Fund | | Schedule of Portfolio Investments — continued
December 31, 2015 | |
(Unaudited)
Security Description | | Shares | | Value | |
Utilities (4.1%): | |
ALLETE, Inc. | | | 392 | | | $ | 19,925 | | |
American States Water Co. | | | 425 | | | | 17,829 | | |
Avista Corp. | | | 612 | | | | 21,646 | | |
California Water Service Group | | | 707 | | | | 16,452 | | |
Chesapeake Utilities Corp. | | | 270 | | | | 15,323 | | |
El Paso Electric Co. | | | 522 | | | | 20,097 | | |
IDACORP, Inc. | | | 315 | | | | 21,420 | | |
MGE Energy, Inc. | | | 440 | | | | 20,416 | | |
NorthWestern Corp. | | | 390 | | | | 21,158 | | |
ONE Gas, Inc. | | | 434 | | | | 21,773 | | |
Ormat Technologies, Inc. | | | 372 | | | | 13,567 | | |
Otter Tail Corp. | | | 634 | | | | 16,883 | | |
PNM Resources, Inc. | | | 654 | | | | 19,993 | | |
SJW Corp. | | | 506 | | | | 15,003 | | |
Southwest Gas Corp. | | | 352 | | | | 19,416 | | |
The Empire District Electric Co. | | | 785 | | | | 22,035 | | |
| | | | 302,936 | | |
Total Common Stocks (Cost $6,581,885) | | | 6,865,484 | | |
Cash Equivalents (6.3%) | |
Citibank Money Market Deposit Account, 0.02% (b) | | | 458,059 | | | | 458,059 | | |
Total Cash Equivalents (Cost $458,059) | | | 458,059 | | |
Total Investments (Cost $7,039,944) — 100.0% | | | 7,323,543 | | |
Segregated cash with broker — 1.0% (c) | | | 74,577 | | |
Liabilities in excess of other assets — (1.0)% | | | (74,272 | ) | |
NET ASSETS — 100.00% | | $ | 7,323,848 | | |
(a) Non-income producing security.
(b) Rate periodically changes. Rate disclosed is the daily yield on December 31, 2015.
(c) Segregated cash with broker represents collateral for futures contracts.
PLC — Public Liability Co.
Futures Contracts Purchased
| | | Number
of
Contracts | | Expiration
Date | | Notional
Amount
at Value | | Unrealized
Depreciation | |
Russell 2000 Mini Index Futures | | | 5 | | | 3/21/16 | | $ | 565,750 | | | $ | (1,609 | ) | |
See notes to financial statements.
28
Victory Portfolios II
Victory CEMP International Volatility Wtd Index Fund | | Schedule of Portfolio Investments
December 31, 2015 | |
(Unaudited)
Security Description | | Shares | | Fair
Value(a) | |
Common Stocks (92.8%) | |
Australia (4.2%): | |
Consumer Staples (0.5%): | |
Wesfarmers Ltd. | | | 884 | | | $ | 26,644 | | |
Woolworths Ltd. | | | 914 | | | | 16,212 | | |
| | | | 42,856 | | |
Energy (0.3%): | |
Oil Search Ltd. | | | 2,158 | | | | 10,501 | | |
Woodside Petroleum Ltd. | | | 737 | | | | 15,350 | | |
| | | | 25,851 | | |
Financials (1.9%): | |
AMP Ltd. | | | 4,211 | | | | 17,738 | | |
Australia & New Zealand Banking Group Ltd. | | | 954 | | | | 19,246 | | |
Commonwealth Bank of Australia | | | 390 | | | | 24,105 | | |
Insurance Australia Group Ltd. | | | 4,890 | | | | 19,633 | | |
Macquarie Group Ltd. | | | 320 | | | | 19,138 | | |
National Australia Bank Ltd. | | | 965 | | | | 21,053 | | |
QBE Insurance Group Ltd. | | | 1,695 | | | | 15,412 | | |
Suncorp Group Ltd. | | | 2,517 | | | | 22,093 | | |
Westpac Banking Corp. | | | 855 | | | | 20,720 | | |
| | | | 179,138 | | |
Health Care (0.5%): | |
CSL Ltd. | | | 300 | | | | 22,866 | | |
Ramsay Health Care Ltd. | | | 426 | | | | 20,941 | | |
| | | | 43,807 | | |
Industrials (0.4%): | |
Aurizon Holdings Ltd. | | | 5,164 | | | | 16,389 | | |
Brambles Ltd. | | | 2,910 | | | | 24,364 | | |
| | | | 40,753 | | |
Materials (0.3%): | |
Amcor Ltd. | | | 1,977 | | | | 19,202 | | |
Newcrest Mining Ltd. (b) | | | 1,314 | | | | 12,430 | | |
| | | | 31,632 | | |
Telecommunication Services (0.3%): | |
Telstra Corp. Ltd. | | | 6,435 | | | | 26,143 | | |
| | | | 390,180 | | |
Austria (0.1%): | |
Materials (0.1%): | |
Voestalpine AG | | | 345 | | | | 10,551 | | |
Belgium (2.0%): | |
Consumer Discretionary (0.2%): | |
Telenet Group Holding NV (b) | | | 343 | | | | 18,535 | | |
See notes to financial statements.
29
Victory Portfolios II
Victory CEMP International Volatility Wtd Index Fund | | Schedule of Portfolio Investments — continued
December 31, 2015 | |
(Unaudited)
Security Description | | Shares | | Fair
Value(a) | |
Consumer Staples (0.5%): | |
Anheuser-Busch InBev NV | | | 152 | | | $ | 18,913 | | |
Colruyt SA | | | 478 | | | | 24,587 | | |
| | | | 43,500 | | |
Financials (0.7%): | |
Ageas | | | 591 | | | | 27,427 | | |
Groupe Bruxelles Lambert SA | | | 309 | | | | 26,436 | | |
KBC Groep NV | | | 255 | | | | 15,942 | | |
| | | | 69,805 | | |
Health Care (0.2%): | |
UCB SA | | | 207 | | | | 18,682 | | |
Materials (0.2%): | |
Solvay SA | | | 155 | | | | 16,541 | | |
Telecommunication Services (0.2%): | |
Proximus SADP | | | 514 | | | | 16,724 | | |
| | | | 183,787 | | |
Bermuda (0.4%): | |
Financials (0.2%): | |
Hongkong Land Holdings Ltd. | | | 2,500 | | | | 17,457 | | |
Industrials (0.2%): | |
Jardine Matheson Holdings Ltd. | | | 400 | | | | 19,371 | | |
| | | | 36,828 | | |
Canada (8.7%): | |
Consumer Discretionary (1.0%): | |
Canadian Tire Corp. Ltd. | | | 221 | | | | 18,875 | | |
Dollarama, Inc. | | | 360 | | | | 20,801 | | |
Gildan Activewear, Inc. | | | 609 | | | | 17,317 | | |
Magna International, Inc. | | | 323 | | | | 13,102 | | |
Shaw Communications, Inc., Class B | | | 1,504 | | | | 25,873 | | |
| | | | 95,968 | | |
Consumer Staples (1.3%): | |
Alimentation Couche-Tard, Inc., Class B | | | 325 | | | | 14,309 | | |
Empire Co. Ltd. | | | 1,037 | | | | 19,293 | | |
George Weston Ltd. | | | 281 | | | | 21,721 | | |
Loblaw Cos. Ltd. | | | 488 | | | | 23,047 | | |
Metro, Inc. | | | 867 | | | | 24,277 | | |
Saputo, Inc. | | | 892 | | | | 21,341 | | |
| | | | 123,988 | | |
Energy (0.7%): | |
Imperial Oil Ltd. | | | 499 | | | | 16,260 | | |
Inter Pipeline Ltd. | | | 732 | | | | 11,751 | | |
Pembina Pipeline Corp. | | | 581 | | | | 12,662 | | |
TransCanada Corp. | | | 629 | | | | 20,545 | | |
| | | | 61,218 | | |
See notes to financial statements.
30
Victory Portfolios II
Victory CEMP International Volatility Wtd Index Fund | | Schedule of Portfolio Investments — continued
December 31, 2015 | |
(Unaudited)
Security Description | | Shares | | Fair
Value(a) | |
Financials (3.3%): | |
Bank of Montreal | | | 490 | | | $ | 27,654 | | |
Brookfield Asset Management, Inc. | | | 659 | | | | 20,792 | | |
Canadian Imperial Bank of Commerce | | | 348 | | | | 22,937 | | |
Great-West Lifeco, Inc. | | | 992 | | | | 24,759 | | |
Intact Financial Corp. | | | 398 | | | | 25,511 | | |
Manulife Financial Corp. | | | 1,328 | | | | 19,908 | | |
National Bank of Canada | | | 646 | | | | 18,822 | | |
Power Corp. of Canada | | | 1,021 | | | | 21,357 | | |
Power Financial Corp. | | | 973 | | | | 22,372 | | |
Royal Bank of Canada | | | 500 | | | | 26,798 | | |
Sun Life Financial, Inc. | | | 596 | | | | 18,589 | | |
The Bank of Nova Scotia | | | 574 | | | | 23,221 | | |
The Toronto-Dominion Bank | | | 680 | | | | 26,659 | | |
| | | | 299,379 | | |
Industrials (0.4%): | |
Canadian National Railway Co. | | | 380 | | | | 21,245 | | |
Canadian Pacific Railway Ltd. | | | 114 | | | | 14,563 | | |
| | | | 35,808 | | |
Information Technology (0.4%): | |
CGI Group, Inc. (b) | | | 464 | | | | 18,580 | | |
Constellation Software, Inc. | | | 35 | | | | 14,594 | | |
| | | | 33,174 | | |
Materials (0.4%): | |
Agrium, Inc. | | | 170 | | | | 15,196 | | |
Franco-Nevada Corp. | | | 269 | | | | 12,308 | | |
Potash Corp. of Saskatchewan, Inc. | | | 808 | | | | 13,841 | | |
| | | | 41,345 | | |
Telecommunication Services (0.8%): | |
BCE, Inc. | | | 654 | | | | 25,271 | | |
Rogers Communications, Inc. | | | 714 | | | | 24,627 | | |
TELUS Corp. | | | 809 | | | | 22,373 | | |
| | | | 72,271 | | |
Utilities (0.4%): | |
Canadian Utilities Ltd., Class A | | | 719 | | | | 16,599 | | |
Fortis, Inc. | | | 759 | | | | 20,524 | | |
| | | | 37,123 | | |
| | | | 800,274 | | |
Denmark (1.7%): | |
Consumer Discretionary (0.2%): | |
Pandora A/S | | | 103 | | | | 12,989 | | |
Health Care (0.4%): | |
Coloplast A/S | | | 239 | | | | 19,300 | | |
Novo Nordisk A/S, Class B | | | 269 | | | | 15,577 | | |
| | | | 34,877 | | |
See notes to financial statements.
31
Victory Portfolios II
Victory CEMP International Volatility Wtd Index Fund | | Schedule of Portfolio Investments — continued
December 31, 2015 | |
(Unaudited)
Security Description | | Shares | | Fair
Value(a) | |
Industrials (0.7%): | |
A.P. Moeller-Maersk A/S, Class B | | | 9 | | | $ | 11,741 | | |
DSV A/S | | | 543 | | | | 21,378 | | |
ISS A/S | | | 508 | | | | 18,315 | | |
Vestas Wind Systems A/S | | | 215 | | | | 15,018 | | |
| | | | 66,452 | | |
Materials (0.4%): | |
Christian Hansen Holding A/S | | | 339 | | | | 21,208 | | |
Novozymes A/S, B Shares | | | 337 | | | | 16,138 | | |
| | | | 37,346 | | |
| | | | 151,664 | | |
Finland (1.1%): | |
Financials (0.2%): | |
Sampo Oyj, Class A | | | 402 | | | | 20,411 | | |
Industrials (0.4%): | |
Kone Oyj, Class B | | | 374 | | | | 15,833 | | |
Wartsila Oyj ABP | | | 412 | | | | 18,809 | | |
| | | | 34,642 | | |
Information Technology (0.1%): | |
Nokia Oyj | | | 1,845 | | | | 13,051 | | |
Materials (0.2%): | |
UPM-Kymmene Oyj | | | 823 | | | | 15,277 | | |
Utilities (0.2%): | |
Fortum Oyj | | | 976 | | | | 14,703 | | |
| | | | 98,084 | | |
France (8.6%): | |
Consumer Discretionary (2.4%): | |
Accor SA | | | 322 | | | | 13,944 | | |
Christian Dior SE | | | 86 | | | | 14,606 | | |
Compagnie Generale DES Etablissements Michelin | | | 178 | | | | 16,940 | | |
Eutelsat Communications SA | | | 691 | | | | 20,686 | | |
Hermes International | | | 44 | | | | 14,871 | | |
JCDecaux SA | | | 509 | | | | 19,510 | | |
Kering | | | 95 | | | | 16,240 | | |
LVMH Moet Hennessy Louis Vuitton SA | | | 81 | | | | 12,721 | | |
Publicis Groupe SA | | | 256 | | | | 17,021 | | |
Renault SA | | | 136 | | | | 13,611 | | |
Sodexo SA | | | 275 | | | | 26,863 | | |
Valeo SA | | | 96 | | | | 14,799 | | |
Vivendi Universal SA | | | 798 | | | | 17,136 | | |
| | | | 218,948 | | |
Consumer Staples (0.9%): | |
Carrefour SA | | | 531 | | | | 15,322 | | |
Casino Guichard Perrachon SA | | | 284 | | | | 13,046 | | |
Danone SA | | | 339 | | | | 22,904 | | |
See notes to financial statements.
32
Victory Portfolios II
Victory CEMP International Volatility Wtd Index Fund | | Schedule of Portfolio Investments — continued
December 31, 2015 | |
(Unaudited)
Security Description | | Shares | | Fair
Value(a) | |
L'Oreal SA | | | 104 | | | $ | 17,491 | | |
Pernod Ricard SA | | | 165 | | | | 18,815 | | |
| | | | 87,578 | | |
Financials (0.9%): | |
AXA SA | | | 609 | | | | 16,638 | | |
BNP Paribas SA | | | 230 | | | | 13,011 | | |
CNP Assurances | | | 1,284 | | | | 17,318 | | |
Credit Agricole SA | | | 995 | | | | 11,724 | | |
Natixis SA | | | 2,254 | | | | 12,749 | | |
Societe Generale SA | | | 288 | | | | 13,270 | | |
| | | | 84,710 | | |
Health Care (0.3%): | |
Essilor International SA | | | 130 | | | | 16,201 | | |
Sanofi | | | 162 | | | | 13,804 | | |
| | | | 30,005 | | |
Industrials (2.3%): | |
Aeroports de Paris | | | 181 | | | | 21,060 | | |
Airbus Group SE | | | 210 | | | | 14,149 | | |
Bollore SA | | | 2,715 | | | | 12,649 | | |
Bureau Veritas SA | | | 875 | | | | 17,438 | | |
Compagnie de Saint-Gobain | | | 330 | | | | 14,299 | | |
Eiffage SA | | | 218 | | | | 14,087 | | |
Groupe Eurotunnel SE | | | 1,437 | | | | 17,875 | | |
Legrand SA | | | 297 | | | | 16,798 | | |
Schneider Electric SA | | | 265 | | | | 15,051 | | |
Societe BIC SA | | | 107 | | | | 17,605 | | |
Thales SA | | | 259 | | | | 19,384 | | |
Vinci SA | | | 260 | | | | 16,662 | | |
Zodiac Aerospace | | | 465 | | | | 11,070 | | |
| | | | 208,127 | | |
Information Technology (0.8%): | |
Atos SE | | | 222 | | | | 18,635 | | |
Cap Gemini SA | | | 172 | | | | 15,957 | | |
Dassault Systemes SA | | | 252 | | | | 20,140 | | |
Ingenico Group | | | 116 | | | | 14,639 | | |
| | | | 69,371 | | |
Materials (0.2%): | |
Air Liquide SA | | | 148 | | | | 16,613 | | |
Telecommunication Services (0.3%): | |
Iliad SA | | | 62 | | | | 14,777 | | |
Orange SA | | | 828 | | | | 13,847 | | |
| | | | 28,624 | | |
See notes to financial statements.
33
Victory Portfolios II
Victory CEMP International Volatility Wtd Index Fund | | Schedule of Portfolio Investments — continued
December 31, 2015 | |
(Unaudited)
Security Description | | Shares | | Fair
Value(a) | |
Utilities (0.5%): | |
Electricite de France SA | | | 893 | | | $ | 13,150 | | |
Suez Environnement Co. | | | 697 | | | | 13,034 | | |
Veolia Environnement SA | | | 736 | | | | 17,460 | | |
| | | | 43,644 | | |
| | | | 787,620 | | |
Germany (5.5%): | |
Consumer Discretionary (1.3%): | |
Bayerische Motoren Werke AG | | | 148 | | | | 15,590 | | |
Continental AG | | | 62 | | | | 14,996 | | |
Daimler AG, Registered Shares | | | 181 | | | | 15,121 | | |
Hugo Boss AG | | | 151 | | | | 12,457 | | |
Kabel Deutschland Holding AG | | | 181 | | | | 22,362 | | |
ProSiebenSat.1 Media SE | | | 308 | | | | 15,537 | | |
Volkswagen AG | | | 74 | | | | 11,370 | | |
Zalando SE (b) | | | 329 | | | | 12,992 | | |
| | | | 120,425 | | |
Consumer Staples (0.2%): | |
Beiersdorf AG | | | 230 | | | | 20,902 | | |
Financials (1.3%): | |
Allianz SE | | | 119 | | | | 20,974 | | |
Deutsche Boerse AG | | | 203 | | | | 17,842 | | |
Hannover Rueck SE | | | 186 | | | | 21,236 | | |
Muenchener Rueckversicherungs-Gesellschaft AG | | | 127 | | | | 25,300 | | |
Talanx AG | | | 647 | | | | 19,896 | | |
Vonovia SE | | | 438 | | | | 13,529 | | |
| | | | 118,777 | | |
Health Care (0.7%): | |
Bayer AG | | | 108 | | | | 13,486 | | |
Fresenius Medical Care AG & Co. KGaA | | | 221 | | | | 18,569 | | |
Fresenius SE & Co. KGaA | | | 225 | | | | 16,025 | | |
Merck KGaA | | | 177 | | | | 17,135 | | |
| | | | 65,215 | | |
Industrials (0.6%): | |
Brenntag AG | | | 317 | | | | 16,516 | | |
Deutsche Post AG | | | 645 | | | | 18,030 | | |
Siemens AG | | | 196 | | | | 18,960 | | |
| | | | 53,506 | | |
Information Technology (0.6%): | |
Infineon Technologies AG | | | 1,347 | | | | 19,635 | | |
SAP SE | | | 286 | | | | 22,692 | | |
United Internet AG | | | 291 | | | | 15,997 | | |
| | | | 58,324 | | |
Materials (0.8%): | |
BASF SE | | | 201 | | | | 15,310 | | |
Evonik Industries AG | | | 466 | | | | 15,412 | | |
See notes to financial statements.
34
Victory Portfolios II
Victory CEMP International Volatility Wtd Index Fund | | Schedule of Portfolio Investments — continued
December 31, 2015 | |
(Unaudited)
Security Description | | Shares | | Fair
Value(a) | |
K+S AG | | | 237 | | | $ | 6,040 | | |
Linde AG | | | 111 | | | | 16,033 | | |
Symrise AG | | | 285 | | | | 18,864 | | |
| | | | 71,659 | | |
| | | | 508,808 | | |
Hong Kong (4.8%): | |
Consumer Discretionary (0.5%): | |
Chow Tai Fook Jewellery Group Ltd. | | | 14,800 | | | | 9,539 | | |
Galaxy Entertainment Group Ltd. | | | 3,000 | | | | 9,400 | | |
Michael Kors Holdings Ltd. (b) | | | 212 | | | | 8,493 | | |
Techtronic Industries Co. Ltd. | | | 3,500 | | | | 14,169 | | |
| | | | 41,601 | | |
Consumer Staples (0.1%): | |
WH Group Ltd. (b) | | | 20,500 | | | | 11,410 | | |
Financials (1.9%): | |
BOC Hong Kong Holdings Ltd. | | | 4,500 | | | | 13,694 | | |
China Overseas Land & Investment Ltd. | | | 4,000 | | | | 13,926 | | |
China Taiping Insurance Holdings Co. Ltd. (b) | | | 2,400 | | | | 7,367 | | |
Goldin Financial Holdings Ltd. (b) | | | 2,000 | | | | 3,916 | | |
Hong Kong Exchanges and Clearing Ltd. | | | 371 | | | | 9,451 | | |
New World Development Co. Ltd. | | | 18,000 | | | | 17,675 | | |
Sino Land Co. Ltd. | | | 10,000 | | | | 14,568 | | |
Swire Pacific Ltd., Class A | | | 2,000 | | | | 22,341 | | |
Swire Properties Ltd. | | | 6,200 | | | | 17,828 | | |
The Bank of East Asia Ltd. | | | 6,200 | | | | 23,000 | | |
The Wharf Holdings Ltd. | | | 3,000 | | | | 16,541 | | |
Wheelock & Co. Ltd. | | | 3,000 | | | | 12,589 | | |
| | | | 172,896 | | |
Industrials (0.9%): | |
Beijing Enterprises Holdings Ltd. | | | 2,500 | | | | 15,071 | | |
Cathay Pacific Airways Ltd. | | | 8,000 | | | | 13,766 | | |
CITIC Ltd. | | | 8,000 | | | | 14,106 | | |
Jardine Strategic Holdings Ltd. | | | 700 | | | | 19,080 | | |
MTR Corp. Ltd. | | | 5,000 | | | | 24,690 | | |
| | | | 86,713 | | |
Information Technology (0.0%): (c) | |
Hanergy Thin Film Power Group Ltd. (b) (d) | | | 22,000 | | | | 483 | | |
Telecommunication Services (0.2%): | |
China Mobile Ltd. | | | 1,000 | | | | 11,257 | | |
China Unicom Hong Kong Ltd. | | | 8,000 | | | | 9,664 | | |
| | | | 20,921 | | |
Utilities (1.2%): | |
China Gas Holdings Ltd. | | | 6,000 | | | | 8,621 | | |
China Resources Power Holdings Co. Ltd. | | | 4,000 | | | | 7,739 | | |
CLP Holdings Ltd. | | | 4,000 | | | | 33,905 | | |
Guangdong Investment Ltd. | | | 8,000 | | | | 11,298 | | |
See notes to financial statements.
35
Victory Portfolios II
Victory CEMP International Volatility Wtd Index Fund | | Schedule of Portfolio Investments — continued
December 31, 2015 | |
(Unaudited)
Security Description | | Shares | | Fair
Value(a) | |
Hong Kong & China Gas Co. Ltd. | | | 15,930 | | | $ | 31,177 | | |
Power Assets Holdings Ltd. | | | 2,000 | | | | 18,336 | | |
| | | | 111,076 | | |
| | | | 445,100 | | |
Ireland (2.2%): | |
Consumer Discretionary (0.2%): | |
WPP PLC | | | 960 | | | | 22,079 | | |
Consumer Staples (0.3%): | |
Kerry Group PLC | | | 288 | | | | 24,039 | | |
Financials (0.4%): | |
Bank of Ireland (b) | | | 29,604 | | | | 10,926 | | |
XL Group PLC | | | 729 | | | | 28,562 | | |
| | | | 39,488 | | |
Health Care (0.3%): | |
Jazz Pharmaceuticals PLC (b) | | | 89 | | | | 12,510 | | |
Shire PLC | | | 204 | | | | 13,994 | | |
| | | | 26,504 | | |
Industrials (0.4%): | |
DCC PLC | | | 236 | | | | 19,713 | | |
Experian PLC | | | 1,170 | | | | 20,676 | | |
| | | | 40,389 | | |
Information Technology (0.3%): | |
Accenture PLC, Class A | | | 216 | | | | 22,572 | | |
Materials (0.3%): | |
CRH PLC | | | 432 | | | | 12,505 | | |
Smurfit Kappa Group PLC | | | 424 | | | | 10,911 | | |
| | | | 23,416 | | |
| | | | 198,487 | | |
Israel (0.5%): | |
Health Care (0.2%): | |
Teva Pharmaceutical Industries Ltd. | | | 250 | | | | 16,314 | | |
Information Technology (0.2%): | |
Check Point Software Technologies Ltd. (b) | | | 249 | | | | 20,264 | | |
Materials (0.1%): | |
Israel Chemicals Ltd. | | | 3,205 | | | | 13,013 | | |
| | | | 49,591 | | |
Italy (1.8%): | |
Consumer Discretionary (0.3%): | |
Luxottica Group SpA | | | 214 | | | | 13,944 | | |
Prada SpA | | | 4,052 | | | | 12,572 | | |
| | | | 26,516 | | |
See notes to financial statements.
36
Victory Portfolios II
Victory CEMP International Volatility Wtd Index Fund | | Schedule of Portfolio Investments — continued
December 31, 2015 | |
(Unaudited)
Security Description | | Shares | | Fair
Value(a) | |
Financials (0.7%): | |
Assicurazioni Generali SpA | | | 888 | | | $ | 16,219 | | |
EXOR SpA | | | 335 | | | | 15,202 | | |
Intesa Sanpaolo SpA | | | 3,352 | | | | 11,130 | | |
Mediobanca SpA | | | 1,294 | | | | 12,403 | | |
UniCredit SpA | | | 1,795 | | | | 9,923 | | |
| | | | 64,877 | | |
Industrials (0.3%): | |
Atlantia SpA | | | 612 | | | | 16,190 | | |
Finmeccanica SpA (b) | | | 920 | | | | 12,790 | | |
| | | | 28,980 | | |
Utilities (0.5%): | |
Snam SpA | | | 3,526 | | | | 18,400 | | |
Terna Rete Elettrica Nazionale SpA | | | 4,264 | | | | 21,926 | | |
| | | | 40,326 | | |
| | | | 160,699 | | |
Japan (18.6%): | |
Consumer Discretionary (3.4%): | |
Aisin Seiki Co. Ltd. | | | 390 | | | | 16,787 | | |
Bridgestone Corp. | | | 487 | | | | 16,707 | | |
Denso Corp. | | | 361 | | | | 17,253 | | |
Dentsu, Inc. | | | 200 | | | | 10,944 | | |
Fuji Heavy Industries Ltd. | | | 363 | | | | 14,956 | | |
Honda Motor Co. Ltd. | | | 502 | | | | 16,047 | | |
Isuzu Motors Ltd. | | | 1,259 | | | | 13,565 | | |
Mazda Motor Corp. | | | 900 | | | | 18,574 | | |
Mitsubishi Motors Corp. | | | 1,900 | | | | 16,077 | | |
Nissan Motor Co. Ltd. | | | 1,643 | | | | 17,206 | | |
Nitori Holdings Co. Ltd. | | | 100 | | | | 8,399 | | |
Oriental Land Co. Ltd. | | | 260 | | | | 15,731 | | |
Panasonic Corp. | | | 1,400 | | | | 14,194 | | |
Rakuten, Inc. | | | 900 | | | | 10,367 | | |
Sekisui House Ltd. | | | 1,149 | | | | 19,321 | | |
Shimano, Inc. | | | 153 | | | | 23,497 | | |
Sumitomo Electric Industries Ltd. | | | 1,104 | | | | 15,591 | | |
Suzuki Motor Corp. | | | 371 | | | | 11,274 | | |
Toyota Industries Corp. | | | 305 | | | | 16,311 | | |
Toyota Motor Corp. | | | 361 | | | | 22,233 | | |
| | | | 315,034 | | |
Consumer Staples (1.8%): | |
Aeon Co. Ltd. | | | 1,000 | | | | 15,409 | | |
Asahi Group Holdings Ltd. | | | 600 | | | | 18,785 | | |
Japan Tobacco, Inc. | | | 435 | | | | 15,972 | | |
Kao Corp. | | | 362 | | | | 18,605 | | |
Kirin Holdings Co. Ltd. | | | 1,200 | | | | 16,295 | | |
MEIJI Holdings Co. Ltd. | | | 100 | | | | 8,261 | | |
Seven & i Holdings Co. Ltd. | | | 426 | | | | 19,507 | | |
See notes to financial statements.
37
Victory Portfolios II
Victory CEMP International Volatility Wtd Index Fund | | Schedule of Portfolio Investments — continued
December 31, 2015 | |
(Unaudited)
Security Description | | Shares | | Fair
Value(a) | |
Shiseido Co. Ltd. | | | 500 | | | $ | 10,376 | | |
Suntory Beverage & Food Ltd. | | | 400 | | | | 17,513 | | |
Uni-Charm Corp. | | | 800 | | | | 16,339 | | |
Yakult Honsha Co. Ltd. | | | 217 | | | | 10,622 | | |
| | | | 167,684 | | |
Financials (2.9%): | |
Daito Trust Construction Co. Ltd. | | | 178 | | | | 20,563 | | |
Daiwa House Industry Co. Ltd. | | | 600 | | | | 17,250 | | |
Daiwa Securities Group, Inc. | | | 2,000 | | | | 12,229 | | |
Japan Exchange Group, Inc. | | | 800 | | | | 12,507 | | |
Mitsubishi UFJ Financial Group, Inc. | | | 2,197 | | | | 13,610 | | |
Mitsui Fudosan Co. Ltd. | | | 571 | | | | 14,333 | | |
Mizuho Financial Group, Inc. | | | 8,045 | | | | 16,092 | | |
Nomura Holdings, Inc. | | | 2,750 | | | | 15,319 | | |
ORIX Corp. | | | 969 | | | | 13,595 | | |
Resona Holdings, Inc. | | | 3,190 | | | | 15,493 | | |
Sompo Japan Nipponkoa Holdings, Inc. | | | 400 | | | | 13,135 | | |
Sony Financial Holdings, Inc. | | | 800 | | | | 14,312 | | |
Sumitomo Mitsui Financial Group, Inc. | | | 339 | | | | 12,796 | | |
Sumitomo Mitsui Trust Holdings, Inc. | | | 4,024 | | | | 15,242 | | |
Sumitomo Realty & Development | | | 417 | | | | 11,904 | | |
T&D Holdings, Inc. | | | 900 | | | | 11,876 | | |
The Bank of Yokohama Ltd. | | | 2,000 | | | | 12,261 | | |
The Dai-ichi Life Insurance Co. Ltd. | | | 700 | | | | 11,648 | | |
Tokio Marine Holdings, Inc. | | | 300 | | | | 11,589 | | |
| | | | 265,754 | | |
Health Care (1.5%): | |
Astellas Pharma, Inc. | | | 1,200 | | | | 17,085 | | |
Chugai Pharmaceutical Co. Ltd. | | | 371 | | | | 12,933 | | |
Daiichi Sankyo Co. Ltd. | | | 800 | | | | 16,514 | | |
Eisai Co. Ltd. | | | 96 | | | | 6,351 | | |
Hoya Corp. | | | 361 | | | | 14,764 | | |
Kyowa Hakko Kirin Co. Ltd. | | | 1,000 | | | | 15,737 | | |
M3, Inc. | | | 600 | | | | 12,442 | | |
Otsuka Holdings Co. Ltd. | | | 459 | | | | 16,310 | | |
Sysmex Corp. | | | 200 | | | | 12,830 | | |
Terumo Corp. | | | 500 | | | | 15,499 | | |
| | | | 140,465 | | |
Industrials (4.4%): | |
Asahi Glass Co. Ltd. | | | 2,000 | | | | 11,459 | | |
Central Japan Railway Co. | | | 114 | | | | 20,241 | | |
Daikin Industries Ltd. | | | 300 | | | | 21,849 | | |
FANUC Corp. | | | 97 | | | | 16,714 | | |
Hankyu Hanshin Holdings, Inc. | | | 3,000 | | | | 19,502 | | |
ITOCHU Corp. | | | 1,185 | | | | 14,019 | | |
Japan Airlines Co. Ltd. | | | 400 | | | | 14,319 | | |
Komatsu Ltd. | | | 970 | | | | 15,874 | | |
Kubota Corp. | | | 558 | | | | 8,621 | | |
See notes to financial statements.
38
Victory Portfolios II
Victory CEMP International Volatility Wtd Index Fund | | Schedule of Portfolio Investments — continued
December 31, 2015 | |
(Unaudited)
Security Description | | Shares | | Fair
Value(a) | |
Makita Corp. | | | 200 | | | $ | 11,527 | | |
Mitsubishi Corp. | | | 940 | | | | 15,637 | | |
Mitsubishi Electric Corp. | | | 1,679 | | | | 17,626 | | |
Mitsubishi Heavy Industries Ltd. | | | 3,000 | | | | 13,119 | | |
Mitsui & Co. Ltd. | | | 1,473 | | | | 17,505 | | |
NGK Insulators Ltd. | | | 1,000 | | | | 22,543 | | |
Nidec Corp. | | | 200 | | | | 14,505 | | |
Recruit Holdings Co. Ltd. | | | 500 | | | | 14,699 | | |
Secom Co. Ltd. | | | 300 | | | | 20,334 | | |
Seibu Holdings, Inc. | | | 600 | | | | 12,255 | | |
Shimizu Corp. | | | 2,000 | | | | 16,311 | | |
SMC Corp. | | | 98 | | | | 25,457 | | |
TAISEI Corp. | | | 3,000 | | | | 19,763 | | |
Tokyu Corp. | | | 1,664 | | | | 13,151 | | |
Toshiba Corp. | | | 4,000 | | | | 8,222 | | |
Toyota Tsusho Corp. | | | 609 | | | | 14,248 | | |
| | | | 399,500 | | |
Information Technology (2.6%): | |
Canon, Inc. | | | 683 | | | | 20,663 | | |
FUJIFILM Holdings Corp. | | | 476 | | | | 19,867 | | |
Hitachi Ltd. | | | 2,739 | | | | 15,522 | | |
Keyence Corp. | | | 72 | | | | 39,577 | | |
Kyocera Corp. | | | 330 | | | | 15,327 | | |
Murata Manufacturing Co. Ltd. | | | 100 | | | | 14,390 | | |
Nomura Research Institute Ltd. | | | 390 | | | | 14,979 | | |
NTT Data Corp. | | | 300 | | | | 14,506 | | |
Omron Corp. | | | 400 | | | | 13,341 | | |
Renesas Electronics Corp. (b) | | | 2,000 | | | | 12,561 | | |
Ricoh Co. Ltd. | | | 1,600 | | | | 16,477 | | |
TDK Corp. | | | 200 | | | | 12,810 | | |
Tokyo Electron Ltd. | | | 200 | | | | 12,119 | | |
Yahoo Japan Corp. | | | 3,200 | | | | 13,009 | | |
| | | | 235,148 | | |
Materials (1.1%): | |
Asahi Kasei Corp. | | | 2,390 | | | | 16,163 | | |
JFE Holdings, Inc. | | | 800 | | | | 12,563 | | |
Nippon Steel & Sumitomo Metal | | | 700 | | | | 13,849 | | |
Nitto Denko Corp. | | | 171 | | | | 12,486 | | |
Shin-Etsu Chemical Co. Ltd. | | | 294 | | | | 15,986 | | |
Sumitomo Chemical Co. Ltd. | | | 2,000 | | | | 11,488 | | |
Toray Industries, Inc. | | | 1,842 | | | | 17,119 | | |
| | | | 99,654 | | |
Telecommunication Services (0.7%): | |
KDDI Corp. | | | 642 | | | | 16,675 | | |
Nippon Telegraph & Telephone Corp. | | | 398 | | | | 15,842 | | |
NTT DOCOMO, Inc. | | | 800 | | | | 16,411 | | |
SoftBank Group Corp. | | | 379 | | | | 19,131 | | |
| | | | 68,059 | | |
See notes to financial statements.
39
Victory Portfolios II
Victory CEMP International Volatility Wtd Index Fund | | Schedule of Portfolio Investments — continued
December 31, 2015 | |
(Unaudited)
Security Description | | Shares | | Fair
Value(a) | |
Utilities (0.2%): | |
Osaka Gas Co. Ltd. | | | 5,000 | | | $ | 18,062 | | |
| | | | 1,709,360 | | |
Netherlands (2.5%): | |
Consumer Discretionary (0.4%): | |
RELX NV | | | 1,256 | | | | 21,151 | | |
Wolters Kluwer NV | | | 549 | | | | 18,435 | | |
| | | | 39,586 | | |
Consumer Staples (0.4%): | |
Heineken NV | | | 238 | | | | 20,279 | | |
Koninklijke Ahold NV | | | 827 | | | | 17,442 | | |
| | | | 37,721 | | |
Financials (0.4%): | |
Aegon NV | | | 2,453 | | | | 13,871 | | |
NN Group NV | | | 721 | | | | 25,435 | | |
| | | | 39,306 | | |
Industrials (0.7%): | |
AerCap Holdings NV (b) | | | 412 | | | | 17,782 | | |
Boskalis Westminster | | | 282 | | | | 11,502 | | |
Randstad Holding NV | | | 236 | | | | 14,694 | | |
Sensata Technologies Holding NV (b) | | | 410 | | | | 18,884 | | |
| | | | 62,862 | | |
Information Technology (0.3%): | |
ASML Holding NV | | | 138 | | | | 12,260 | | |
Gemalto NV | | | 219 | | | | 13,139 | | |
| | | | 25,399 | | |
Materials (0.3%): | |
AKZO Nobel NV | | | 250 | | | | 16,702 | | |
OCI NV | | | 335 | | | | 8,271 | | |
| | | | 24,973 | | |
| | | | 229,847 | | |
Norway (0.8%): | |
Financials (0.4%): | |
DNB ASA | | | 1,212 | | | | 14,938 | | |
Gjensidige Forsikring ASA | | | 1,488 | | | | 23,824 | | |
| | | | 38,762 | | |
Materials (0.2%): | |
Yara International ASA | | | 363 | | | | 15,618 | | |
Telecommunication Services (0.2%): | |
Telenor ASA | | | 906 | | | | 15,107 | | |
| | | | 69,487 | | |
Portugal (0.3%): | |
Consumer Staples (0.1%): | |
Jeronimo Martins SGPS SA | | | 838 | | | | 10,903 | | |
See notes to financial statements.
40
Victory Portfolios II
Victory CEMP International Volatility Wtd Index Fund | | Schedule of Portfolio Investments — continued
December 31, 2015 | |
(Unaudited)
Security Description | | Shares | | Fair
Value(a) | |
Utilities (0.2%): | |
EDP — Energias de Portugal SA | | | 4,659 | | | $ | 16,786 | | |
| | | | 27,689 | | |
Singapore (2.8%): | |
Consumer Discretionary (0.2%): | |
Jardine Cycle & Carriage Ltd. | | | 923 | | | | 22,575 | | |
Consumer Staples (0.3%): | |
Wilmar International Ltd. | | | 12,822 | | | | 26,467 | | |
Financials (1.2%): | |
CapitaLand Ltd. | | | 9,576 | | | | 22,518 | | |
DBS Group Holdings Ltd. | | | 1,916 | | | | 22,464 | | |
Global Logistic Properties Ltd. | | | 11,799 | | | | 17,826 | | |
Oversea-Chinese Banking Corp. Ltd. | | | 4,269 | | | | 26,404 | | |
United Overseas Bank Ltd. | | | 1,753 | | | | 24,178 | | |
| | | | 113,390 | | |
Industrials (0.7%): | |
Keppel Corp. Ltd. | | | 4,038 | | | | 18,454 | | |
Singapore Airlines Ltd. | | | 2,800 | | | | 22,072 | | |
Singapore Technologies Engineering Ltd. | | | 9,541 | | | | 20,177 | | |
| | | | 60,703 | | |
Information Technology (0.1%): | |
Avago Technologies Ltd. | | | 88 | | | | 12,773 | | |
Telecommunication Services (0.3%): | |
Singapore Telecommunications Ltd. | | | 8,809 | | | | 22,722 | | |
| | | | 258,630 | | |
Spain (3.2%): | |
Consumer Discretionary (0.2%): | |
Industria de Diseno Textil SA | | | 491 | | | | 16,866 | | |
Financials (0.9%): | |
Banco Bilbao Vizcaya Argentaria SA | | | 1,824 | | | | 13,326 | | |
Banco de Sabadell SA | | | 6,750 | | | | 11,961 | | |
Banco Popular Espanol SA | | | 3,230 | | | | 10,641 | | |
Banco Santander SA | | | 2,149 | | | | 10,570 | | |
Bankia SA | | | 12,399 | | | | 14,427 | | |
CaixaBank SA | | | 3,687 | | | | 12,831 | | |
Mapfre SA | | | 5,976 | | | | 14,957 | | |
| | | | 88,713 | | |
Health Care (0.2%): | |
Grifols SA | | | 416 | | | | 19,226 | | |
Industrials (0.4%): | |
ACS Actividades de Construccion y Servicios SA | | | 502 | | | | 14,685 | | |
Ferrovial SA | | | 848 | | | | 19,174 | | |
| | | | 33,859 | | |
See notes to financial statements.
41
Victory Portfolios II
Victory CEMP International Volatility Wtd Index Fund | | Schedule of Portfolio Investments — continued
December 31, 2015 | |
(Unaudited)
Security Description | | Shares | | Fair
Value(a) | |
Information Technology (0.2%): | |
Amadeus IT Holding SA | | | 441 | | | $ | 19,434 | | |
Telecommunication Services (0.2%): | |
Telefonica SA | | | 1,419 | | | | 15,740 | | |
Utilities (1.1%): | |
Enagas SA | | | 722 | | | | 20,364 | | |
Endesa SA | | | 944 | | | | 18,962 | | |
Gas Natural SDG SA | | | 999 | | | | 20,369 | | |
Iberdrola SA | | | 3,184 | | | | 22,568 | | |
Red Electrica Corp. SA | | | 251 | | | | 20,963 | | |
| | | | 103,226 | | |
| | | | 297,064 | | |
Sweden (3.0%): | |
Consumer Discretionary (0.3%): | |
Electrolux AB | | | 422 | | | | 10,189 | | |
Hennes & Mauritz AB | | | 521 | | | | 18,545 | | |
| | | | 28,734 | | |
Consumer Staples (0.4%): | |
ICA Gruppen AB | | | 567 | | | | 20,606 | | |
Svenska Cellulosa AB SCA, B Shares | | | 564 | | | | 16,356 | | |
| | | | 36,962 | | |
Financials (0.7%): | |
Nordea Bank AB | | | 1,373 | | | | 15,075 | | |
Skandinaviska Enskilda Banken AB, Class A | | | 1,623 | | | | 17,080 | | |
Svenska Handelsbanken AB | | | 1,203 | | | | 15,989 | | |
Swedbank AB, A Shares | | | 858 | | | | 18,909 | | |
| | | | 67,053 | | |
Industrials (1.0%): | |
ALFA Laval AB | | | 899 | | | | 16,424 | | |
ASSA Abloy AB | | | 867 | | | | 18,161 | | |
Atlas Copco AB, A Shares | | | 546 | | | | 13,400 | | |
Sandvik AB | | | 1,405 | | | | 12,256 | | |
Skanska AB, Clas B | | | 861 | | | | 16,709 | | |
SKF AB, B Shares | | | 704 | | | | 11,378 | | |
| | | | 88,328 | | |
Information Technology (0.4%): | |
Hexagon AB, B Shares | | | 459 | | | | 16,991 | | |
Telefonaktiebolaget LM Ericsson, B Shares | | | 1,562 | | | | 15,070 | | |
| | | | 32,061 | | |
Telecommunication Services (0.2%): | |
TeliaSonera AB | | | 3,756 | | | | 18,665 | | |
| | | | 271,803 | | |
See notes to financial statements.
42
Victory Portfolios II
Victory CEMP International Volatility Wtd Index Fund | | Schedule of Portfolio Investments — continued
December 31, 2015 | |
(Unaudited)
Security Description | | Shares | | Fair
Value(a) | |
Switzerland (6.8%): | |
Consumer Discretionary (0.3%): | |
CIE Financiere Richemont SA | | | 176 | | | $ | 12,600 | | |
The Swatch Group AG | | | 32 | | | | 11,116 | | |
| | | | 23,716 | | |
Consumer Staples (1.2%): | |
Chocoladefabriken Lindt & Spruengli AG, Registered Shares | | | 1 | | | | 74,603 | | |
Coca-Cola HBC AG | | | 676 | | | | 14,394 | | |
Nestle SA, Registered Shares | | | 284 | | | | 21,089 | | |
| | | | 110,086 | | |
Financials (1.6%): | |
ACE Ltd. | | | 258 | | | | 30,147 | | |
Credit Suisse Group AG, Registered Shares | | | 649 | | | | 13,985 | | |
Julius Baer Group Ltd. | | | 253 | | | �� | 12,243 | | |
Partners Group Holding AG | | | 37 | | | | 13,310 | | |
Swiss Life Holding AG | | | 78 | | | | 21,016 | | |
Swiss Re AG | | | 274 | | | | 26,769 | | |
UBS Group AG, Registered Shares | | | 710 | | | | 13,778 | | |
Zurich Insurance Group AG | | | 71 | | | | 18,245 | | |
| | | | 149,493 | | |
Health Care (1.0%): | |
Actelion Ltd. | | | 93 | | | | 12,926 | | |
Galenica AG | | | 13 | | | | 20,345 | | |
Lonza Group AG, Registered Shares | | | 89 | | | | 14,479 | | |
Novartis AG | | | 169 | | | | 14,541 | | |
Roche Holding AG | | | 62 | | | | 17,186 | | |
Sonova Holding AG, Registered Shares | | | 116 | | | | 14,743 | | |
| | | | 94,220 | | |
Industrials (1.2%): | |
ABB Ltd. | | | 937 | | | | 16,728 | | |
Adecco SA, Registered Shares | | | 196 | | | | 13,419 | | |
Geberit AG | | | 51 | | | | 17,279 | | |
Kuehne + Nagel International AG | | | 162 | | | | 22,200 | | |
Schindler Holding AG | | | 124 | | | | 20,751 | | |
SGS SA | | | 10 | | | | 19,011 | | |
| | | | 109,388 | | |
Information Technology (0.3%): | |
TE Connectivity Ltd. | | | 352 | | | | 22,743 | | |
Materials (1.0%): | |
Clariant AG | | | 785 | | | | 14,889 | | |
EMS-Chemie Holding AG | | | 34 | | | | 14,968 | | |
Givaudan SA, Registered shares | | | 10 | | | | 18,155 | | |
LafargeHolcim Ltd. | | | 259 | | | | 12,973 | | |
Sika AG | | | 5 | | | | 18,074 | | |
Syngenta AG | | | 29 | | | | 11,354 | | |
| | | | 90,413 | | |
See notes to financial statements.
43
Victory Portfolios II
Victory CEMP International Volatility Wtd Index Fund | | Schedule of Portfolio Investments — continued
December 31, 2015 | |
(Unaudited)
Security Description | | Shares | | Fair
Value(a) | |
Telecommunication Services (0.2%): | |
Swisscom AG | | | 41 | | | $ | 20,523 | | |
| | | | 620,582 | | |
United Kingdom (12.5%): | |
Consumer Discretionary (3.1%): | |
Barratt Developments PLC | | | 1,576 | | | | 14,520 | | |
Berkeley Group Holdings PLC | | | 269 | | | | 14,622 | | |
Burberry Group PLC | | | 816 | | | | 14,355 | | |
Compass Group PLC | | | 1,411 | | | | 24,447 | | |
Delphi Automotive PLC | | | 223 | | | | 19,118 | | |
InterContinental Hotels Group PLC | | | 498 | | | | 19,408 | | |
ITV PLC | | | 4,716 | | | | 19,198 | | |
Kingfisher PLC | | | 3,238 | | | | 15,681 | | |
Marks & Spencer Group PLC | | | 2,413 | | | | 16,064 | | |
Next PLC | | | 199 | | | | 21,364 | | |
Persimmon PLC (b) | | | 491 | | | | 14,646 | | |
RELX PLC | | | 1,339 | | | | 23,611 | | |
Sky PLC | | | 1,321 | | | | 21,652 | | |
Sports Direct International PLC (b) | | | 1,454 | | | | 12,354 | | |
Taylor Wimpey PLC | | | 5,158 | | | | 15,417 | | |
Whitbread PLC | | | 326 | | | | 21,127 | | |
| | | | 287,584 | | |
Consumer Staples (1.6%): | |
Associated British Foods PLC | | | 363 | | | | 17,860 | | |
British American Tobacco PLC | | | 383 | | | | 21,267 | | |
Diageo PLC | | | 748 | | | | 20,423 | | |
Imperial Tobacco Group PLC | | | 369 | | | | 19,487 | | |
Reckitt Benckiser Group PLC | | | 250 | | | | 23,128 | | |
SABMiller PLC | | | 377 | | | | 22,550 | | |
Unilever PLC | | | 528 | | | | 22,644 | | |
| | | | 147,359 | | |
Financials (2.8%): | |
Aon PLC | | | 259 | | | | 23,882 | | |
Aviva PLC | | | 2,453 | | | | 18,617 | | |
Direct Line Insurance Group PLC | | | 4,819 | | | | 28,882 | | |
Hargreaves Lansdown PLC | | | 746 | | | | 16,559 | | |
HSBC Holdings PLC | | | 2,456 | | | | 19,386 | | |
Legal & General Group PLC | | | 5,709 | | | | 22,524 | | |
London Stock Exchange Group PLC | | | 436 | | | | 17,637 | | |
Old Mutual PLC | | | 5,412 | | | | 14,235 | | |
Prudential PLC | | | 848 | | | | 19,102 | | |
RSA Insurance Group PLC | | | 1,859 | | | | 11,666 | | |
Schroders PLC | | | 385 | | | | 16,860 | | |
St James's Place PLC | | | 1,110 | | | | 16,450 | | |
Standard Chartered PLC | | | 1,238 | | | | 10,271 | | |
Standard Life PLC | | | 2,854 | | | | 16,341 | | |
| | | | 252,412 | | |
See notes to financial statements.
44
Victory Portfolios II
Victory CEMP International Volatility Wtd Index Fund | | Schedule of Portfolio Investments — continued
December 31, 2015 | |
(Unaudited)
Security Description | | Shares | | Fair
Value(a) | |
Health Care (0.4%): | |
GlaxoSmithKline PLC | | | 1,007 | | | $ | 20,334 | | |
Smith & Nephew PLC | | | 1,007 | | | | 17,944 | | |
| | | | 38,278 | | |
Industrials (2.3%): | |
Ashtead Group PLC | | | 986 | | | | 16,225 | | |
Babcock International Group PLC | | | 1,172 | | | | 17,537 | | |
BAE Systems PLC | | | 3,282 | | | | 24,160 | | |
Bunzl PLC | | | 932 | | | | 25,854 | | |
Capita PLC | | | 1,086 | | | | 19,320 | | |
CNH Industrial NV | | | 1,895 | | | | 12,962 | | |
easyJet PLC | | | 518 | | | | 13,283 | | |
G4S PLC | | | 5,999 | | | | 19,925 | | |
Intertek Group PLC | | | 382 | | | | 15,624 | | |
Royal Mail PLC | | | 2,274 | | | | 14,892 | | |
Smiths Group PLC | | | 995 | | | | 13,758 | | |
Travis Perkins PLC | | | 644 | | | | 18,680 | | |
| | | | 212,220 | | |
Information Technology (0.4%): | |
ARM Holdings PLC | | | 964 | | | | 14,691 | | |
The Sage Group PLC | | | 2,371 | | | | 21,064 | | |
| | | | 35,755 | | |
Materials (0.3%): | |
Johnson Matthey PLC | | | 428 | | | | 16,740 | | |
Rio Tinto PLC | | | 392 | | | | 11,412 | | |
| | | | 28,152 | | |
Telecommunication Services (0.7%): | |
BT Group PLC | | | 2,953 | | | | 20,501 | | |
Inmarsat PLC | | | 1,258 | | | | 21,087 | | |
Vodafone Group PLC | | | 5,287 | | | | 17,142 | | |
| | | | 58,730 | | |
Utilities (0.9%): | |
National Grid PLC | | | 1,735 | | | | 23,925 | | |
Severn Trent PLC | | | 690 | | | | 22,054 | | |
SSE PLC | | | 874 | | | | 19,622 | | |
United Utilities Group PLC | | | 1,487 | | | | 20,472 | | |
| | | | 86,073 | | |
| | | | 1,146,563 | | |
United States (0.7%): | |
Consumer Discretionary (0.5%): | |
Autoliv, Inc. | | | 179 | | | | 22,334 | | |
Fiat DaimlerChrysler Automobiles NV (b) | | | 883 | | | | 12,353 | | |
lululemon athletica, Inc. (b) | | | 224 | | | | 11,753 | | |
| | | | 46,440 | | |
See notes to financial statements.
45
Victory Portfolios II
Victory CEMP International Volatility Wtd Index Fund | | Schedule of Portfolio Investments — continued
December 31, 2015 | |
(Unaudited)
Security Description | | Shares | | Fair
Value(a) | |
Health Care (0.2%): | |
QIAGEN NV (b) | | | 724 | | | $ | 20,019 | | |
| | | | 66,459 | | |
Total Common Stocks (Cost $8,606,614) | | | 8,519,157 | | |
Total Investments (Cost $8,606,614) — 92.8% | | | 8,519,157 | | |
Segregated cash with broker — 0.7% (e) | | | 68,499 | | |
Other assets in excess of liabilities — 6.5% | | | 591,954 | | |
NET ASSETS — 100.00% | | $ | 9,179,610 | | |
(a) All securities, except those traded on exchanges in the United States (including ADRs), Brazil, Canada, Cayman Islands, Columbia, and Mexico were fair valued at December 31, 2015.
(b) Non-income producing security.
(c) Amount represents less than 0.05% of net assets.
(d) The Fund's Adviser has deemed this security to be illiquid based upon procedures approved by the Board of Trustees. At December 31, 2015, illiquid securities were less than 0.005% of the Fund's net assets.
(e) Segregated cash with broker represents collateral for futures contracts.
PLC — Public Liability Co.
Futures Contracts Purchased
| | | Number
of
Contracts | | Expiration
Date | | Notional
Amount
at Value | | Unrealized
Depreciation | |
Mini MSCI EAFE Index Futures | | | 9 | | | 3/21/16 | | $ | 764,190 | | | $ | (9,321 | ) | |
See notes to financial statements.
46
Victory Portfolios II
Victory CEMP Emerging Market Volatility Wtd Index Fund | | Schedule of Portfolio Investments
December 31, 2015 | |
(Unaudited)
Security Description | | Shares | | Fair
Value(a) | |
Common Stocks (92.8%) | |
Bermuda (0.1%): | |
Consumer Discretionary (0.1%): | |
GOME Electrical Appliances Holding Ltd. | | | 48,000 | | | $ | 7,957 | | |
Brazil (3.3%): | |
Consumer Discretionary (0.3%): | |
Kroton Educacional SA | | | 4,800 | | | | 11,485 | | |
Lojas Renner SA | | | 4,510 | | | | 19,380 | | |
| | | | 30,865 | | |
Consumer Staples (1.2%): | |
Ambev SA | | | 6,700 | | | | 30,115 | | |
| BRF SA | | | 1,327 | | | | 18,515 | | |
Hypermarcas SA (b) | | | 6,700 | | | | 36,582 | | |
JBS SA | | | 3,800 | | | | 11,739 | | |
Natura Cosmeticos SA | | | 3,118 | | | | 18,443 | | |
Raia Drogasil SA | | | 1,983 | | | | 17,750 | | |
| | | | 133,144 | | |
Energy (0.2%): | |
Ultrapar Participacoes SA | | | 1,696 | | | | 25,782 | | |
Financials (0.4%): | |
Banco do Brasil SA | | | 3,203 | | | | 11,866 | | |
BB Seguridade Participacoes SA | | | 2,900 | | | | 17,728 | | |
BM&FBovespa SA — Bolsa de Valores Mercadorias e Futuros | | | 6,918 | | | | 18,922 | | |
| | | | 48,516 | | |
Industrials (0.4%): | |
CCR SA | | | 4,908 | | | | 15,512 | | |
WEG SA | | | 6,828 | | | | 25,789 | | |
| | | | 41,301 | | |
Information Technology (0.2%): | |
Cielo SA | | | 2,468 | | | | 20,829 | | |
Telecommunication Services (0.1%): | |
TIM Participacoes SA | | | 7,870 | | | | 13,558 | | |
Utilities (0.5%): | |
Cia de Saneamento Basico do Estado de Sao Paulo | | | 3,899 | | | | 18,448 | | |
| CPFL Energia SA (b) | | | 4,302 | | | | 16,421 | | |
Tractebel Energia SA | | | 2,536 | | | | 21,390 | | |
| | | | 56,259 | | |
| | | | 370,254 | | |
Cayman Islands (0.1%): | |
Information Technology (0.1%): | |
| FIH Mobile Ltd. | | | 37,000 | | | | 14,082 | | |
Chile (3.4%): | |
Consumer Discretionary (0.3%): | |
SACI Falabella | | | 4,602 | | | | 29,303 | | |
See notes to financial statements.
47
Victory Portfolios II
Victory CEMP Emerging Market Volatility Wtd Index Fund | | Schedule of Portfolio Investments — continued
December 31, 2015 | |
(Unaudited)
Security Description | | Shares | | Fair
Value(a) | |
Consumer Staples (0.5%): | |
Cencosud SA | | | 10,634 | | | $ | 21,264 | | |
Cia Cervecerias Unidas SA | | | 2,727 | | | | 29,925 | | |
| | | | 51,189 | | |
Energy (0.3%): | |
Empresas COPEC SA | | | 4,086 | | | | 34,761 | | |
Financials (1.0%): | |
Banco de Chile | | | 501,414 | | | | 50,688 | | |
Banco de Credito e Inversiones | | | 728 | | | | 27,306 | | |
Banco Santander Chile | | | 704,849 | | | | 31,822 | | |
| | | | 109,816 | | |
Utilities (1.3%): | |
AES Gener SA | | | 72,211 | | | | 31,898 | | |
Aguas Andinas SA | | | 92,516 | | | | 46,751 | | |
Empresa Nacional de Electricid SA | | | 31,311 | | | | 38,824 | | |
Enersis SA | | | 119,590 | | | | 28,998 | | |
| | | | 146,471 | | |
| | | | 371,540 | | |
China (11.2%): | |
Consumer Discretionary (1.5%): | |
ANTA Sports Products Ltd. | | | 6,000 | | | | 16,404 | | |
BAIC Motor Corp. Ltd. | | | 16,000 | | | | 15,979 | | |
Byd Co. Ltd. (b) | | | 2,000 | | | | 10,910 | | |
Cosmo Lady China Holdings Co. Ltd. | | | 13,000 | | | | 10,872 | | |
Dongfeng Motor Group Co. Ltd. | | | 18,000 | | | | 23,846 | | |
Golden Eagle Retail Group Ltd. | | | 22,000 | | | | 26,549 | | |
Great Wall Motor Co. Ltd., Class H | | | 12,882 | | | | 14,880 | | |
Guangzhou Automobile Group Co. | | | 26,000 | | | | 23,100 | | |
Intime Retail Group Co. Ltd. | | | 8,000 | | | | 7,843 | | |
Shenzhou International Group Holdings Ltd. | | | 3,000 | | | | 17,193 | | |
| | | | 167,576 | | |
Consumer Staples (0.8%): | |
China Huishan Dairy Holdings Co. Ltd. | | | 35,000 | | | | 13,385 | | |
China Mengniu Dairy Co. Ltd. | | | 15,000 | | | | 24,351 | | |
Sun Art Retail Group Ltd. | | | 16,500 | | | | 12,415 | | |
Tingyi Cayman Islands Holding Corp. | | | 13,013 | | | | 18,488 | | |
Want Want China Holdings Ltd. | | | 24,000 | | | | 17,813 | | |
| | | | 86,452 | | |
Energy (0.4%): | |
China Shenhua Energy Co. Ltd. | | | 11,004 | | | | 17,183 | | |
PetroChina Co. Ltd. | | | 25,075 | | | | 16,416 | | |
Yanzhou Coal Mining Co. Ltd. | | | 22,000 | | | | 10,202 | | |
| | | | 43,801 | | |
Financials (2.8%): | |
Bank of China Ltd. | | | 44,857 | | | | 19,904 | | |
Bank of Communications Co. Ltd., Class H | | | 25,599 | | | | 17,953 | | |
See notes to financial statements.
48
Victory Portfolios II
Victory CEMP Emerging Market Volatility Wtd Index Fund | | Schedule of Portfolio Investments — continued
December 31, 2015 | |
(Unaudited)
Security Description | | Shares | | Fair
Value(a) | |
China Cinda Asset Management Co. | | | 45,000 | | | $ | 16,563 | | |
China CITIC Bank Corp. Ltd. (b) | | | 36,103 | | | | 23,270 | | |
China Construction Bank Corp. | | | 32,952 | | | | 22,479 | | |
China Galaxy Securities Co. Ltd. | | | 11,000 | | | | 9,998 | | |
China Life Insurance Co. Ltd. | | | 4,000 | | | | 12,841 | | |
China Vanke Co. Ltd. (c) | | | 6,400 | | | | 19,021 | | |
Chongqing Rural Commercial Bank Co. Ltd. | | | 24,894 | | | | 14,952 | | |
Country Garden Holdings Co. Ltd. | | | 51,000 | | | | 20,786 | | |
Dalian Wanda Commercial Properties Co. Ltd. | | | 2,000 | | | | 11,608 | | |
Evergrande Real Estate Group Ltd. | | | 14,000 | | | | 12,257 | | |
Huishang Bank Corp. Ltd. | | | 48,000 | | | | 21,681 | | |
Longfor Properties Co. Ltd. | | | 13,500 | | | | 20,079 | | |
People's Insurance Co. Group of China Ltd. | | | 29,000 | | | | 14,120 | | |
PICC Property & Casualty Co. Ltd. | | | 8,000 | | | | 15,789 | | |
Ping An Insurance Group Co. of China Ltd. | | | 3,514 | | | | 19,379 | | |
Shengjing Bank Co. Ltd. | | | 11,500 | | | | 14,788 | | |
| | | | 307,468 | | |
Health Care (0.8%): | |
China Medical System Holdings Ltd. | | | 11,000 | | | | 16,122 | | |
Guangzhou Baiyunshan Pharmaceutical Holdings Co. Ltd. | | | 5,494 | | | | 15,496 | | |
Luye Pharma Group Ltd. (b) | | | 17,500 | | | | 18,208 | | |
Shandong Weigao Group Medical Polymer Co. Ltd., Class H | | | 20,000 | | | | 13,676 | | |
Sihuan Pharmaceutical Holdings Group Ltd. (c) | | | 34,000 | | | | 11,933 | | |
Sinopharm Group Co. Ltd. | | | 4,000 | | | | 15,969 | | |
| | | | 91,404 | | |
Industrials (2.4%): | |
Anhui Expressway Co. Ltd. | | | 12,000 | | | | 10,173 | | |
AviChina Industry & Technology Co. Ltd. | | | 11,000 | | | | 8,595 | | |
Beijing Capital International Airport Co. Ltd. | | | 14,000 | | | | 15,037 | | |
CAR, Inc. (b) | | | 8,000 | | | | 13,183 | | |
China Communications Construction Co. Ltd. | | | 8,619 | | | | 8,733 | | |
China Conch Venture Holdings Ltd. | | | 6,000 | | | | 12,413 | | |
China Eastern Airlines Corp. Ltd. (b) | | | 18,000 | | | | 10,183 | | |
China Lesso Group Holdings Ltd. | | | 17,000 | | | | 11,798 | | |
China Machinery Engineering Corp. | | | 12,000 | | | | 8,756 | | |
China Railway Construction Corp. Ltd. | | | 6,889 | | | | 8,479 | | |
China Railway Group Ltd. | | | 11,031 | | | | 8,320 | | |
China Southern Airlines Co. Ltd. | | | 14,000 | | | | 10,793 | | |
Dalian Port PDA Co. Ltd. | | | 26,000 | | | | 13,313 | | |
Fosun International Ltd. | | | 6,000 | | | | 9,324 | | |
Haitian International Holdings Ltd. | | | 9,000 | | | | 13,058 | | |
Jiangsu Expressway Co. Ltd. | | | 16,838 | | | | 22,599 | | |
Qingdao Port International Co. Ltd. | | | 24,000 | | | | 10,688 | | |
Sinopec Engineering Group Co. Ltd., H Shares | | | 14,500 | | | | 12,335 | | |
Sinotrans Ltd. | | | 22,000 | | | | 11,711 | | |
Weichai Power Co. Ltd. | | | 12,612 | | | | 13,889 | | |
Zhejiang Expressway Co. Ltd., Class H | | | 14,589 | | | | 17,432 | | |
Zhuzhou CSR Times Electric Co. Ltd. | | | 1,500 | | | | 8,650 | | |
| | | | 259,462 | | |
See notes to financial statements.
49
Victory Portfolios II
Victory CEMP Emerging Market Volatility Wtd Index Fund | | Schedule of Portfolio Investments — continued
December 31, 2015 | |
(Unaudited)
Security Description | | Shares | | Fair
Value(a) | |
Information Technology (0.8%): | |
AAC Technologies Holdings, Inc. | | | 2,327 | | | $ | 15,138 | | |
Kingsoft Corp. Ltd. | | | 4,000 | | | | 9,714 | | |
Lenovo Group Ltd. | | | 18,822 | | | | 18,996 | | |
Tencent Holdings Ltd. | | | 1,055 | | | | 20,658 | | |
TravelSky Technology Ltd. | | | 7,000 | | | | 11,461 | | |
Xinyi Solar Holdings Ltd. | | | 30,000 | | | | 12,163 | | |
| | | | 88,130 | | |
Materials (0.7%): | |
Anhui Conch Cement Co. Ltd. | | | 5,573 | | | | 14,898 | | |
BBMG Corp. | | | 13,500 | | | | 9,119 | | |
China Hongqiao Group Ltd. | | | 19,000 | | | | 11,253 | | |
China Molybdenum Co. Ltd. | | | 49,168 | | | | 9,145 | | |
China National Building Material Co. Ltd. | | | 23,632 | | | | 11,242 | | |
Jiangxi Copper Co. Ltd. | | | 11,906 | | | | 14,053 | | |
Zijin Mining Group Co. Ltd. | | | 47,550 | | | | 12,449 | | |
| | | | 82,159 | | |
Telecommunication Services (0.3%): | |
China Communications Services Corp. Ltd. | | | 42,000 | | | | 15,711 | | |
China Telecom Corp. Ltd. | | | 34,000 | | | | 15,861 | | |
| | | | 31,572 | | |
Utilities (0.7%): | |
CGN Power Co. Ltd. | | | 26,000 | | | | 9,681 | | |
China Longyuan Power Group Corp. Ltd. | | | 15,844 | | | | 11,915 | | |
ENN Energy Holdings Ltd. | | | 4,000 | | | | 21,219 | | |
Huadian Fuxin Energy Corp. Ltd., Class H | | | 34,000 | | | | 9,676 | | |
Huaneng Power International, Inc. | | | 14,000 | | | | 11,989 | | |
Huaneng Renewables Corp. Ltd. | | | 36,000 | | | | 10,684 | | |
| | | | 75,164 | | |
| | | | 1,233,188 | | |
Colombia (0.5%): | |
Consumer Staples (0.1%): | |
Almacenes Exito SA | | | 3,170 | | | | 13,502 | | |
Financials (0.2%): | |
Bancolombia SA | | | 2,890 | | | | 19,130 | | |
Materials (0.2%): | |
Grupo Argos SA | | | 3,591 | | | | 18,354 | | |
| | | | 50,986 | | |
Czech Republic (0.6%): | |
Financials (0.2%): | |
Komercni Banka AS | | | 120 | | | | 23,841 | | |
Telecommunication Services (0.1%): | |
O2 Czech Republic AS | | | 1,309 | | | | 13,247 | | |
See notes to financial statements.
50
Victory Portfolios II
Victory CEMP Emerging Market Volatility Wtd Index Fund | | Schedule of Portfolio Investments — continued
December 31, 2015 | |
(Unaudited)
Security Description | | Shares | | Fair
Value(a) | |
Utilities (0.3%): | |
CEZ AS | | | 1,382 | | | $ | 24,664 | | |
| | | | 61,752 | | |
Egypt (0.2%): | |
Financials (0.2%): | |
Commercial International Bank | | | 4,973 | | | | 24,188 | | |
Greece (0.1%): | |
Consumer Discretionary (0.1%): | |
OPAP SA | | | 1,034 | | | | 9,072 | | |
Hong Kong (0.8%): | |
Consumer Discretionary (0.3%): | |
Belle International Holdings Ltd. | | | 17,000 | | | | 12,720 | | |
Geely Automobile Holdings Ltd. | | | 30,000 | | | | 15,853 | | |
| | | | 28,573 | | |
Consumer Staples (0.2%): | |
Hengan International Group Co. Ltd. | | | 2,500 | | | | 23,471 | | |
Energy (0.1%): | |
CNOOC Ltd. | | | 14,000 | | | | 14,571 | | |
Health Care (0.2%): | |
CSPC Pharmaceutical Group Ltd. | | | 20,000 | | | | 20,391 | | |
| | | | 87,006 | | |
Hungary (0.2%): | |
Financials (0.2%): | |
OTP Bank Public Co. Ltd. | | | 1,042 | | | | 21,484 | | |
India (10.1%): | |
Consumer Discretionary (1.5%): | |
Bajaj Auto Ltd. | | | 674 | | | | 25,715 | | |
Bosch Ltd. | | | 56 | | | | 15,751 | | |
Mahindra & Mahindra Ltd. | | | 1,257 | | | | 24,131 | | |
Motherson Sumi Systems Ltd. | | | 3,967 | | | | 17,517 | | |
Page Industries Ltd. | | | 80 | | | | 16,146 | | |
Rajesh Exports Ltd. | | | 1,519 | | | | 15,611 | | |
Tata Motors Ltd. (b) | | | 3,654 | | | | 21,599 | | |
ZEE Entertainment Enterprises Ltd. | | | 3,830 | | | | 25,249 | | |
| | | | 161,719 | | |
Consumer Staples (1.5%): | |
Britannia Industries Ltd. | | | 479 | | | | 21,400 | | |
Colgate-Palmolive (India) Ltd. | | | 2,121 | | | | 31,122 | | |
Dabur India Ltd. | | | 5,426 | | | | 22,672 | | |
Emami Ltd. | | | 899 | | | | 13,544 | | |
Glaxo Smithkline Consumer Healthcare Ltd. | | | 346 | | | | 33,477 | | |
Godrej Consumer Products Ltd. | | | 942 | | | | 18,733 | | |
Marico Ltd. | | | 6,466 | | | | 22,072 | | |
| | | | 163,020 | | |
See notes to financial statements.
51
Victory Portfolios II
Victory CEMP Emerging Market Volatility Wtd Index Fund | | Schedule of Portfolio Investments — continued
December 31, 2015 | |
(Unaudited)
Security Description | | Shares | | Fair
Value(a) | |
Energy (0.4%): | |
Coal India Ltd. | | | 4,375 | | | $ | 21,706 | | |
Reliance Industries Ltd. | | | 1,732 | | | | 26,521 | | |
| | | | 48,227 | | |
Financials (0.9%): | |
Bajaj Finserv Ltd. | | | 699 | | | | 20,962 | | |
Housing Development Finance Corp. Ltd. | | | 1,116 | | | | 21,227 | | |
ICICI Bank Ltd. | | | 4,867 | | | | 19,225 | | |
Indiabulls Housing Finance Ltd. | | | 1,671 | | | | 18,534 | | |
State Bank of India | | | 5,527 | | | | 18,678 | | |
| | | | 98,626 | | |
Health Care (1.7%): | |
Aurobindo Pharma Ltd. | | | 1,449 | | | | 19,113 | | |
Cadila Healthcare Ltd. | | | 3,660 | | | | 18,085 | | |
Cipla Ltd. | | | 2,072 | | | | 20,313 | | |
Divi's Laboratories Ltd. | | | 1,484 | | | | 25,857 | | |
Dr. Reddy's Laboratories Ltd. | | | 392 | | | | 18,404 | | |
Glenmark Pharmaceuticals Ltd. | | | 1,171 | | | | 16,258 | | |
Lupin Ltd. | | | 748 | | | | 20,697 | | |
Sun Pharmaceutical Industries Ltd. | | | 1,328 | | | | 16,428 | | |
Torrent Pharmaceuticals Ltd. | | | 841 | | | | 18,406 | | |
Wockhardt Ltd. (b) | | | 575 | | | | 13,213 | | |
| | | | 186,774 | | |
Industrials (0.8%): | |
Adani Ports And Special Economic Zone | | | 3,458 | | | | 13,597 | | |
Aditya Birla Nuvo Ltd. | | | 646 | | | | 21,058 | | |
Amara Raja Batteries Ltd. | | | 1,294 | | | | 16,799 | | �� |
Eicher Motors Ltd. | | | 67 | | | | 17,009 | | |
Larsen & Toubro Ltd. | | | 987 | | | | 18,973 | | |
| | | | 87,436 | | |
Information Technology (1.3%): | |
HCL Technologies Ltd. | | | 1,429 | | | | 18,431 | | |
Infosys Ltd. | | | 1,447 | | | | 24,113 | | |
Oracle Financial Services | | | 515 | | | | 29,053 | | |
Tata Consultancy Services Ltd. | | | 794 | | | | 29,192 | | |
Tech Mahindra Ltd. | | | 2,445 | | | | 19,198 | | |
Wipro Ltd. | | | 3,085 | | | | 26,002 | | |
| | | | 145,989 | | |
Materials (1.3%): | |
ACC Ltd. | | | 1,206 | | | | 24,733 | | |
Asian Paints Ltd. | | | 1,703 | | | | 22,688 | | |
Berger Paints India Ltd. | | | 5,334 | | | | 21,623 | | |
Hindustan Zinc Ltd. | | | 10,143 | | | | 22,341 | | |
Pidilite Industries Ltd. | | | 2,696 | | | | 22,463 | | |
Ultra Tech Cement Ltd. | | | 472 | | | | 19,788 | | |
UPL Ltd. | | | 2,075 | | | | 13,666 | | |
| | | | 147,302 | | |
See notes to financial statements.
52
Victory Portfolios II
Victory CEMP Emerging Market Volatility Wtd Index Fund | | Schedule of Portfolio Investments — continued
December 31, 2015 | |
(Unaudited)
Security Description | | Shares | | Fair
Value(a) | |
Telecommunication Services (0.7%): | |
Bharti Airtel Ltd. | | | 3,861 | | | $ | 19,785 | | |
Bharti Infratel Ltd. | | | 2,628 | | | | 16,956 | | |
Idea Cellular Ltd. | | | 8,278 | | | | 17,914 | | |
Reliance Communications Ltd. (b) | | | 13,626 | | | | 18,129 | | |
| | | | 72,784 | | |
| | | | 1,111,877 | | |
Indonesia (3.8%): | |
Consumer Discretionary (0.5%): | |
PT Astra International TBK | | | 49,341 | | | | 21,261 | | |
PT Matahari Department Store TBK | | | 13,400 | | | | 16,970 | | |
PT Surya Citra Media TBK | | | 68,100 | | | | 15,191 | | |
| | | | 53,422 | | |
Consumer Staples (0.9%): | |
PT Charoen Pokphand Indonesia TBK | | | 93,477 | | | | 17,425 | | |
PT Gudang Garam TBK | | | 5,793 | | | | 23,000 | | |
PT Indofood CBP Sukses Makmur TBK | | | 24,434 | | | | 23,646 | | |
PT Indofood Sukses Makmur TBK | | | 54,154 | | | | 20,165 | | |
PT Unilever Indonesia TBK | | | 7,055 | | | | 18,840 | | |
| | | | 103,076 | | |
Financials (0.7%): | |
PT Bank Central Asia TBK | | | 34,601 | | | | 33,163 | | |
PT Bank Mandiri Persero TBK | | | 37,089 | | | | 24,637 | | |
PT Bank Rakyat Indonesia Persero TBK | | | 27,977 | | | | 22,969 | | |
| | | | 80,769 | | |
Health Care (0.2%): | |
PT Kalbe Farma TBK | | | 201,264 | | | | 19,156 | | |
Industrials (0.4%): | |
PT Jasa Marga Persero TBK | | | 57,525 | | | | 21,649 | | |
PT United Tractors TBK | | | 13,652 | | | | 16,629 | | |
| | | | 38,278 | | |
Materials (0.4%): | |
PT Indocement Tunggal Prakarsa TBK | | | 15,248 | | | | 24,460 | | |
PT Semen Indonesia Persero TBK | | | 26,577 | | | | 21,785 | | |
| | | | 46,245 | | |
Telecommunication Services (0.5%): | |
PT Telekomunikasi Indonesia Persero TBK | | | 152,065 | | | | 34,072 | | |
PT Tower Bersama Infrastructure TBK (b) | | | 45,675 | | | | 19,328 | | |
| | | | 53,400 | | |
Utilities (0.2%): | |
PT Perusahaan Gas Negara Persero TBK | | | 111,227 | | | | 21,938 | | |
| | | | 416,284 | | |
See notes to financial statements.
53
Victory Portfolios II
Victory CEMP Emerging Market Volatility Wtd Index Fund | | Schedule of Portfolio Investments — continued
December 31, 2015 | |
(Unaudited)
Security Description | | Shares | | Fair
Value(a) | |
Korea, Republic Of (8.9%): | |
Consumer Discretionary (2.1%): | |
Coway Co. Ltd. | | | 241 | | | $ | 17,163 | | |
Cuckoo Electronics Co. Ltd. | | | 58 | | | | 11,262 | | |
Hankook Tire Co. Ltd. | | | 674 | | | | 26,889 | | |
Hanon Systems | | | 553 | | | | 24,291 | | |
Hanssem Co. Ltd. | | | 53 | | | | 10,387 | | |
Hotel Shilla Co. Ltd. | | | 140 | | | | 9,169 | | |
Hyundai Department Store Co. Ltd. | | | 150 | | | | 16,080 | | |
Hyundai Mobis Co. Ltd. | | | 108 | | | | 22,602 | | |
Hyundai Motor Co. | | | 153 | | | | 19,301 | | |
Hyundai Wia Corp. | | | 146 | | | | 13,807 | | |
Kangwon Land, Inc. | | | 639 | | | | 20,861 | | |
Kia Motors Corp. | | | 528 | | | | 23,549 | | |
Youngone Corp. | | | 269 | | | | 9,588 | | |
| | | | 224,949 | | |
Consumer Staples (1.7%): | |
Amorepacific Corp. | | | 51 | | | | 17,901 | | |
AMOREPACIFIC Group | | | 105 | | | | 13,121 | | |
BGF Retail Co. Ltd. | | | 84 | | | | 12,163 | | |
CJ CheilJedang Corp. | | | 59 | | | | 18,876 | | |
Dongsuh Cos., Inc. | | | 398 | | | | 10,517 | | |
GS Retail Co. Ltd. | | | 265 | | | | 12,076 | | |
Hyundai Greenfood Co. Ltd. | | | 860 | | | | 18,068 | | |
KT&G Corp. | | | 221 | | | | 19,643 | | |
LG Household & Health Care Ltd. | | | 22 | | | | 19,540 | | |
Orion Corp. | | | 19 | | | | 18,771 | | |
Ottogi Corp. | | | 17 | | | | 17,622 | | |
Samlip General Foods Co. Ltd. | | | 50 | | | | 11,692 | | |
| | | | 189,990 | | |
Financials (1.5%): | |
Hana Financial Group, Inc. | | | 1,018 | | | | 20,347 | | |
Hanwha Life Insurance Co. Ltd. | | | 3,196 | | | | 20,084 | | |
Industrial Bank of Korea | | | 1,603 | | | | 16,765 | | |
KB Financial Group, Inc. | | | 791 | | | | 22,290 | | |
Samsung Fire & Marine Insurance Co. Ltd. | | | 77 | | | | 20,133 | | |
Samsung Life Insurance Co. Ltd. | | | 254 | | | | 23,741 | | |
Shinhan Financial Group Co. Ltd. | | | 622 | | | | 20,899 | | |
Woori Bank | | | 2,597 | | | | 19,428 | | |
| | | | 163,687 | | |
Health Care (0.5%): | |
Hanmi Pharm Co. Ltd. (b) | | | 29 | | | | 17,768 | | |
Hanmi Science Co. Ltd. (b) | | | 66 | | | | 7,157 | | |
Medy-Tox, Inc. | | | 27 | | | | 11,670 | | |
Yuhan Corp. | | | 76 | | | | 17,536 | | |
| | | | 54,131 | | |
See notes to financial statements.
54
Victory Portfolios II
Victory CEMP Emerging Market Volatility Wtd Index Fund | | Schedule of Portfolio Investments — continued
December 31, 2015 | |
(Unaudited)
Security Description | | Shares | | Fair
Value(a) | |
Industrials (1.4%): | |
CJ Corp. | | | 64 | | | $ | 13,597 | | |
CJ Korea Express Co. Ltd. (b) | | | 105 | | | | 17,014 | | |
Hyundai Development Co. — Enginee | | | 269 | | | | 8,792 | | |
Hyundai Engineering & Construction Co. Ltd. | | | 542 | | | | 13,014 | | |
Hyundai Glovis Co. Ltd. | | | 85 | | | | 13,852 | | |
KCC Corp. | | | 47 | | | | 16,584 | | |
KEPCO Plant Service & Engineering Co. Ltd. | | | 132 | | | | 9,987 | | |
Korea Aerospace Industries Ltd. | | | 224 | | | | 14,790 | | |
LG Corp. | | | 406 | | | | 24,411 | | |
S-1 Corp. | | | 306 | | | | 25,969 | | |
| | | | 158,010 | | |
Information Technology (0.6%): | |
LG Display Co. Ltd. | | | 910 | | | | 18,852 | | |
NAVER Corp. | | | 40 | | | | 22,310 | | |
NCSoft Corp. | | | 81 | | | | 14,605 | | |
Samsung SDS Co. Ltd. | | | 57 | | | | 12,263 | | |
| | | | 68,030 | | |
Materials (0.6%): | |
Hyundai Steel Co. | | | 464 | | | | 19,557 | | |
Korea Zinc Co. Ltd. | | | 59 | | | | 23,505 | | |
LG Chem Ltd. | | | 78 | | | | 21,539 | | |
| | | | 64,601 | | |
Telecommunication Services (0.3%): | |
LG Uplus Corp. | | | 1,833 | | | | 16,189 | | |
SK Telecom Co. Ltd. | | | 109 | | | | 19,953 | | |
| | | | 36,142 | | |
Utilities (0.2%): | |
Korea Electric Power Corp. | | | 497 | | | | 21,061 | | |
| | | | 980,601 | | |
Malaysia (7.6%): | |
Consumer Discretionary (1.0%): | |
Astro Malaysia Holdings BHD | | | 32,300 | | | | 20,718 | | |
Genting BHD | | | 14,895 | | | | 25,424 | | |
Genting Malaysia BHD | | | 26,096 | | | | 26,607 | | |
UMW Holdings BHD | | | 18,215 | | | | 33,347 | | |
| | | | 106,096 | | |
Consumer Staples (0.8%): | |
British American Tobacco Malaysia BHD | | | 2,170 | | | | 28,326 | | |
Kuala Lumpur Kepong BHD | | | 5,808 | | | | 30,917 | | |
PPB Group BHD | | | 7,457 | | | | 27,552 | | |
| | | | 86,795 | | |
Energy (0.4%): | |
Petronas Dagangan BHD | | | 5,448 | | | | 31,595 | | |
SapuraKencana Petroleum BHD | | | 33,200 | | | | 15,589 | | |
| | | | 47,184 | | |
See notes to financial statements.
55
Victory Portfolios II
Victory CEMP Emerging Market Volatility Wtd Index Fund | | Schedule of Portfolio Investments — continued
December 31, 2015 | |
(Unaudited)
Security Description | | Shares | | Fair
Value(a) | |
Financials (1.0%): | |
CIMB Group Holdings BHD | | | 19,406 | | | $ | 20,478 | | |
Hong Leong Bank BHD | | | 16,472 | | | | 51,369 | | |
Malayan Banking BHD | | | 18,294 | | | | 35,754 | | |
| | | | 107,601 | | |
Health Care (0.3%): | |
IHH Healthcare BHD | | | 24,800 | | | | 38,025 | | |
Industrials (1.6%): | |
Gamuda BHD | | | 29,020 | | | | 31,461 | | |
HAP Seng Consolidated BHD | | | 18,800 | | | | 28,348 | | |
IJM Corp. BHD | | | 50,300 | | | | 39,579 | | |
MISC BHD | | | 12,900 | | | | 28,068 | | |
Sime Darby BHD | | | 19,470 | | | | 35,013 | | |
Westports Holdings BHD | | | 19,800 | | | | 18,960 | | |
| | | | 181,429 | | |
Materials (0.2%): | |
Petronas Chemicals Group BHD | | | 14,463 | | | | 24,450 | | |
Telecommunication Services (1.3%): | |
Axiata Group BHD | | | 26,063 | | | | 38,872 | | |
DiGi.Com BHD | | | 29,798 | | | | 37,443 | | |
Maxis BHD | | | 20,234 | | | | 31,997 | | |
Telekom Malaysia BHD | | | 22,759 | | | | 35,893 | | |
| | | | 144,205 | | |
Utilities (1.0%): | |
Petronas Gas BHD | | | 7,465 | | | | 39,520 | | |
Tenaga Nasional BHD | | | 12,300 | | | | 38,114 | | |
YTL Corp. BHD | | | 83,731 | | | | 30,575 | | |
| | | | 108,209 | | |
| | | | 843,994 | | |
Mexico (4.4%): | |
Consumer Discretionary (0.3%): | |
Alsea SAB de CV | | | 8,900 | | | | 30,919 | | |
Consumer Staples (1.9%): | |
Arca Continental SAB de CV | | | 5,673 | | | | 34,470 | | |
Coca-Cola Femsa SAB de CV | | | 4,179 | | | | 30,054 | | |
Gruma SAB de CV, Class B | | | 1,675 | | | | 23,504 | | |
Grupo Comercial Chedraui SA de CV | | | 8,176 | | | | 21,802 | | |
Grupo Lala SAB de CV | | | 11,200 | | | | 26,050 | | |
Industrias Bachoco SAB de CV | | | 5,600 | | | | 22,799 | | |
Kimberly-Clark de Mexico SAB de CV | | | 11,105 | | | | 26,022 | | |
Wal-Mart de Mexico SAB de CV | | | 10,267 | | | | 25,918 | | |
| | | | 210,619 | | |
Financials (0.8%): | |
Grupo Financiero Banorte SAB de CV | | | 6,036 | | | | 33,281 | | |
Grupo Financiero Inbursa SAB de CV | | | 12,452 | | | | 22,478 | | |
See notes to financial statements.
56
Victory Portfolios II
Victory CEMP Emerging Market Volatility Wtd Index Fund | | Schedule of Portfolio Investments — continued
December 31, 2015 | |
(Unaudited)
Security Description | | Shares | | Fair
Value(a) | |
Grupo Financiero Santander Mexico SAB de CV | | | 16,141 | | | $ | 28,341 | | |
| | | | 84,100 | | |
Industrials (1.0%): | |
Grupo Aeroportuario del Pacifico SAB de CV | | | 2,950 | | | | 26,036 | | |
Grupo Aeroportuario del Sureste SAB de CV | | | 1,890 | | | | 26,756 | | |
Grupo Carso SAB de CV | | | 5,001 | | | | 20,604 | | |
OHL Mexico SAB de CV (b) | | | 10,885 | | | | 11,398 | | |
Promotora y Operadora de Infraestructura SAB de CV (b) | | | 2,431 | | | | 28,607 | | |
| | | | 113,401 | | |
Materials (0.2%): | |
Grupo Mexico SAB de CV | | | 10,028 | | | | 21,415 | | |
Telecommunication Services (0.2%): | |
America Movil SAB de CV | | | 33,850 | | | | 23,814 | | |
Telesites SAB (b) | | | 1,693 | | | | 1,101 | | |
| | | | 24,915 | | |
| | | | 485,369 | | |
Philippines (4.8%): | |
Consumer Discretionary (0.3%): | |
Jollibee Foods Corp. | | | 6,487 | | | | 30,124 | | |
Consumer Staples (0.2%): | |
Universal Robina Corp. | | | 5,078 | | | | 20,044 | | |
Energy (0.2%): | |
Semirara Mining and Power Corp. | | | 6,580 | | | | 19,055 | | |
Financials (1.7%): | |
Ayala Corp. | | | 1,917 | | | | 30,733 | | |
Ayala Land, Inc. | | | 31,025 | | | | 22,686 | | |
Bank of the Philippine Islands | | | 17,735 | | | | 31,597 | | |
BDO Unibank, Inc. | | | 14,108 | | | | 31,370 | | |
GT Capital Holdings, Inc. | | | 800 | | | | 22,420 | | |
Metropolitan Bank & Trust Co. | | | 16,549 | | | | 28,237 | | |
SM Prime Holdings, Inc. | | | 52,981 | | | | 24,372 | | |
| | | | 191,415 | | |
Industrials (1.5%): | |
Aboitiz Equity Ventures, Inc. | | | 23,098 | | | | 28,344 | | |
Alliance Global Group, Inc. | | | 47,520 | | | | 16,202 | | |
DMCI Holdings, Inc. | | | 88,040 | | | | 25,752 | | |
International Container Terminal Services, Inc. | | | 15,878 | | | | 23,658 | | |
JG Summit Holdings, Inc. | | | 14,683 | | | | 22,857 | | |
LT Group, Inc. | | | 71,383 | | | | 22,455 | | |
SM Investments Corp. | | | 1,615 | | | | 29,511 | | |
| | | | 168,779 | | |
Telecommunication Services (0.4%): | |
Globe Telecom, Inc. | | | 439 | | | | 17,251 | | |
Philippine Long Distance Telephone Co. | | | 617 | | | | 26,982 | | |
| | | | 44,233 | | |
See notes to financial statements.
57
Victory Portfolios II
Victory CEMP Emerging Market Volatility Wtd Index Fund | | Schedule of Portfolio Investments — continued
December 31, 2015 | |
(Unaudited)
Security Description | | Shares | | Fair
Value(a) | |
Utilities (0.5%): | |
Aboitiz Power Corp. | | | 35,844 | | | $ | 31,744 | | |
Energy Development Corp. | | | 199,600 | | | | 26,225 | | |
| | | | 57,969 | | |
| | | | 531,619 | | |
Poland (1.6%): | |
Consumer Discretionary (0.2%): | |
Cyfrowy Polsat SA (b) | | | 3,417 | | | | 18,196 | | |
Energy (0.1%): | |
Polskie Gornictwo Naftowe i Gazownictwo SA | | | 11,459 | | | | 14,983 | | |
Financials (0.9%): | |
Bank Pekao SA | | | 639 | | | | 23,380 | | |
Bank Zachodni WBK SA | | | 247 | | | | 17,830 | | |
mBank SA (b) | | | 212 | | | | 16,961 | | |
Powszechna Kasa Oszczednosci Bank Polski SA (b) | | | 2,916 | | | | 20,290 | | |
Powszechny Zaklad Ubezpieczen na Zycie SA | | | 2,600 | | | | 22,470 | | |
| | | | 100,931 | | |
Materials (0.1%): | |
KGHM Polska Miedz SA | | | 749 | | | | 12,103 | | |
Telecommunication Services (0.2%): | |
Orange Polska SA | | | 10,914 | | | | 18,255 | | |
Utilities (0.1%): | |
Energa SA | | | 4,300 | | | | 13,868 | | |
| | | | 178,336 | | |
Qatar (2.2%): | |
Energy (0.3%): | |
Gulf International Services QSC | | | 898 | | | | 12,637 | | |
Qatar Fuel Co. QSC | | | 599 | | | | 24,186 | | |
| | | | 36,823 | | |
Financials (1.2%): | |
Barwa Real Estate Co. | | | 1,456 | | | | 15,931 | | |
Ezdan Holding Group QSC | | | 3,168 | | | | 13,781 | | |
Masraf Al Rayan QSC | | | 1,959 | | | | 20,177 | | |
Qatar Insurance Co. SAQ (b) | | | 578 | | | | 13,050 | | |
Qatar Islamic Bank SAQ | | | 721 | | | | 21,065 | | |
Qatar National Bank SAQ | | | 551 | | | | 26,430 | | |
The Commercial Bank QSC | | | 1,934 | | | | 24,300 | | |
| | | | 134,734 | | |
Industrials (0.2%): | |
Industries Qatar QSC | | | 621 | | | | 18,889 | | |
Telecommunication Services (0.2%): | |
Ooredoo QSC | | | 1,127 | | | | 23,174 | | |
See notes to financial statements.
58
Victory Portfolios II
Victory CEMP Emerging Market Volatility Wtd Index Fund | | Schedule of Portfolio Investments — continued
December 31, 2015 | |
(Unaudited)
Security Description | | Shares | | Fair
Value(a) | |
Utilities (0.3%): | |
Qatar Electricity & Water Co. QSC | | | 450 | | | $ | 26,749 | | |
| | | | 240,369 | | |
Republic of Korea (South) (0.4%): | |
Information Technology (0.4%): | |
Samsung Electronics Co. Ltd. | | | 26 | | | | 27,737 | | |
SK Hynix, Inc. | | | 594 | | | | 15,348 | | |
| | | | 43,085 | | |
Russian Federation (0.8%): | |
Consumer Staples (0.1%): | |
Magnit PJSC | | | 99 | | | | 15,247 | | |
Energy (0.1%): | |
Tatneft PAO | | | 3,040 | | | | 13,270 | | |
Materials (0.3%): | |
MMC Norilsk Nickel PJSC | | | 90 | | | | 11,303 | | |
Novolipetsk Steel OJSC | | | 16,010 | | | | 13,762 | | |
Uralkali PJSC | | | 4,740 | | | | 11,518 | | |
| | | | 36,583 | | |
Telecommunication Services (0.1%): | |
Mobile TeleSystems PJSC | | | 4,330 | | | | 12,472 | | |
Utilities (0.2%): | |
RusHydro PJSC | | | 1,770,000 | | | | 16,504 | | |
| | | | 94,076 | | |
South Africa (6.2%): | |
Consumer Discretionary (1.1%): | |
Imperial Holdings Ltd. | | | 1,562 | | | | 12,119 | | |
Mr. Price Group Ltd. | | | 1,237 | | | | 16,013 | | |
Naspers Ltd. | | | 141 | | | | 19,291 | | |
Steinhoff International Holdings NV | | | 5,028 | | | | 25,549 | | |
The Foschini Group Ltd. | | | 1,723 | | | | 13,552 | | |
Truworths International Ltd. | | | 2,831 | | | | 16,705 | | |
Woolworths Holdings Ltd. | | | 3,305 | | | | 21,401 | | |
| | | | 124,630 | | |
Consumer Staples (1.2%): | |
AVI Ltd. | | | 4,728 | | | | 23,646 | | |
Pick n Pay Stores Ltd. | | | 5,543 | | | | 23,305 | | |
Pioneer Foods Group Ltd. | | | 1,496 | | | | 15,360 | | |
Shoprite Holdings Ltd. | | | 1,980 | | | | 18,366 | | |
The SPAR Group Ltd. | | | 2,074 | | | | 24,701 | | |
Tiger Brands Ltd. | | | 1,138 | | | | 23,332 | | |
| | | | 128,710 | | |
Energy (0.1%): | |
Sasol Ltd. | | | 537 | | | | 14,512 | | |
See notes to financial statements.
59
Victory Portfolios II
Victory CEMP Emerging Market Volatility Wtd Index Fund | | Schedule of Portfolio Investments — continued
December 31, 2015 | |
(Unaudited)
Security Description | | Shares | | Fair
Value(a) | |
Financials (2.0%): | |
Barclays Africa Group Ltd. | | | 1,987 | | | $ | 18,454 | | |
Capitec Bank Holdings Ltd. | | | 575 | | | | 20,015 | | |
Discovery Ltd. | | | 2,322 | | | | 19,934 | | |
FirstRand Ltd. | | | 6,424 | | | | 17,573 | | |
Investec Ltd. | | | 3,413 | | | | 24,133 | | |
Nedbank Group Ltd. | | | 1,508 | | | | 18,439 | | |
Rand Merchant Insurance Holdings Ltd. | | | 7,915 | | | | 19,805 | | |
Remgro Ltd. | | | 1,409 | | | | 22,325 | | |
RMB Holdings Ltd. | | | 4,880 | | | | 17,513 | | |
Sanlam Ltd. | | | 4,994 | | | | 19,554 | | |
Standard Bank Group Ltd. | | | 2,415 | | | | 17,719 | | |
| | | | 215,464 | | |
Health Care (0.7%): | |
Aspen Pharmacare Holdings Ltd. | | | 998 | | | | 19,944 | | |
Life Healthcare Group Holdings Ltd. | | | 8,135 | | | | 18,483 | | |
Mediclinic International Ltd. | | | 2,708 | | | | 20,850 | | |
Netcare Ltd. | | | 8,405 | | | | 18,426 | | |
| | | | 77,703 | | |
Industrials (0.2%): | |
The Bidvest Group Ltd. | | | 1,251 | | | | 26,578 | | |
Materials (0.3%): | |
Anglo American Platinum Ltd. (b) | | | 622 | | | | 7,498 | | |
Kumba Iron Ore Ltd. | | | 1,710 | | | | 4,559 | | |
Mondi Ltd. | | | 1,080 | | | | 21,393 | | |
| | | | 33,450 | | |
Telecommunication Services (0.6%): | |
MTN Group Ltd. | | | 1,646 | | | | 14,193 | | |
Telkom SA SOC Ltd. | | | 3,904 | | | | 16,235 | | |
Vodacom Group Ltd. | | | 2,967 | | | | 29,270 | | |
| | | | 59,698 | | |
| | | | 680,745 | | |
Taiwan (10.7%): | |
Consumer Discretionary (1.3%): | |
Cheng Shin Rubber Industry Co. Ltd. | | | 21,152 | | | | 34,193 | | |
Eclat Textile Co. Ltd. | | | 1,000 | | | | 13,744 | | |
Feng TAY Enterprise Co. Ltd. | | | 2,000 | | | | 10,173 | | |
Giant Manufacturing Co. Ltd. | | | 3,000 | | | | 19,891 | | |
Hotai Motor Co. Ltd. | | | 1,824 | | | | 20,981 | | |
Pou Chen Corp. | | | 10,317 | | | | 13,465 | | |
Yulon Nissan Motor Co. Ltd. | | | 3,651 | | | | 30,992 | | |
| | | | 143,439 | | |
Consumer Staples (0.5%): | |
President Chain Store Corp. | | | 4,094 | | | | 25,556 | | |
Uni-President Enterprises Corp. | | | 14,941 | | | | 24,910 | | |
| | | | 50,466 | | |
See notes to financial statements.
60
Victory Portfolios II
Victory CEMP Emerging Market Volatility Wtd Index Fund | | Schedule of Portfolio Investments — continued
December 31, 2015 | |
(Unaudited)
Security Description | | Shares | | Fair
Value(a) | |
Financials (3.1%): | |
Cathay Financial Holding Co. Ltd. | | | 18,185 | | | $ | 25,481 | | |
Chang Hwa Commercial Bank Ltd. | | | 77,240 | | | | 36,791 | | |
China Development Financial Holding Corp. | | | 77,000 | | | | 19,209 | | |
CTBC Financial Holding Co. Ltd. | | | 46,019 | | | | 23,566 | | |
E.Sun Financial Holding Co. Ltd. | | | 49,292 | | | | 28,623 | | |
First Financial Holding Co. Ltd. | | | 106,853 | | | | 49,640 | | |
Fubon Financial Holding Co. Ltd. | | | 13,000 | | | | 17,686 | | |
Hua Nan Financial Holdings Co. Ltd. | | | 90,919 | | | | 42,093 | | |
Mega Financial Holding Co. Ltd. | | | 41,773 | | | | 26,937 | | |
Taiwan Cooperative Financial Holding Co. Ltd. | | | 124,746 | | | | 51,970 | | |
Yuanta Financial Holding Co. Ltd. | | | 59,002 | | | | 21,646 | | |
| | | | 343,642 | | |
Industrials (0.2%): | |
Far Eastern New Century Corp. | | | 33,443 | | | | 26,132 | | |
Information Technology (3.4%): | |
Advanced Semiconductor Engineering, Inc. | | | 15,414 | | | | 17,710 | | |
Advantech Co. Ltd. | | | 3,098 | | | | 19,843 | | |
Asustek Computer, Inc. | | | 2,635 | | | | 21,761 | | |
AU Optronics Corp. | | | 46,000 | | | | 13,564 | | |
Catcher Technology Co. Ltd. | | | 1,170 | | | | 9,755 | | |
Compal Electronics, Inc. | | | 29,000 | | | | 16,231 | | |
Delta Electronics, Inc. | | | 3,837 | | | | 18,051 | | |
Foxconn Technology Co. Ltd. | | | 6,220 | | | | 13,105 | | |
Hon Hai Precision Industry Co. Ltd. | | | 11,363 | | | | 27,814 | | |
Innolux Corp. | | | 41,000 | | | | 12,326 | | |
Inotera Memories, Inc. (b) | | | 17,000 | | | | 14,342 | | |
Largan Precision Co. Ltd. | | | 208 | | | | 14,235 | | |
Lite-On Technology Corp. | | | 26,684 | | | | 25,738 | | |
MediaTek, Inc. | | | 1,819 | | | | 13,760 | | |
Nanya Technology Corp. | | | 9,000 | | | | 12,448 | | |
Pegatron Corp. | | | 6,962 | | | | 15,145 | | |
Quanta Computer, Inc. | | | 13,944 | | | | 22,374 | | |
Siliconware Precision Industries Co. Ltd. | | | 15,000 | | | | 23,692 | | |
Taiwan Semiconductor Manufacturing Co. Ltd. | | | 5,681 | | | | 24,514 | | |
United Microelectronics Corp. | | | 71,242 | | | | 26,039 | | |
Zhen Ding Technology Holding Ltd. | | | 6,000 | | | | 13,683 | | |
| | | | 376,130 | | |
Materials (1.0%): | |
Asia Cement Corp. | | | 38,969 | | | | 32,432 | | |
China Steel Corp. | | | 65,380 | | | | 35,650 | | |
Nan Ya Plastics Corp. | | | 13,000 | | | | 24,021 | | |
Taiwan Cement Corp. | | | 28,555 | | | | 23,644 | | |
| | | | 115,747 | | |
Telecommunication Services (1.2%): | |
Chunghwa Telecom Co. Ltd. | | | 22,828 | | | | 68,782 | | |
Far EasTone Telecommunications Co. Ltd. | | | 14,465 | | | | 29,734 | | |
See notes to financial statements.
61
Victory Portfolios II
Victory CEMP Emerging Market Volatility Wtd Index Fund | | Schedule of Portfolio Investments — continued
December 31, 2015 | |
(Unaudited)
Security Description | | Shares | | Fair
Value(a) | |
Taiwan Mobile Co. Ltd. | | | 10,491 | | | $ | 31,866 | | |
| | | | 130,382 | | |
| | | | 1,185,938 | | |
Thailand (5.4%): | |
Consumer Discretionary (0.4%): | |
Home Product Center Public Co. Ltd. | | | 121,178 | | | | 22,809 | | |
Minor International Public Co. Ltd. | | | 26,825 | | | | 25,576 | | |
| | | | 48,385 | | |
Consumer Staples (0.8%): | |
Big C Supercenter Public Co. Ltd. | | | 4,409 | | | | 24,652 | | |
Charoen Pokphand Foods Public Co. Ltd. | | | 40,588 | | | | 20,513 | | |
CP ALL Public Co. Ltd. | | | 18,687 | | | | 20,301 | | |
Thai Union Group Public Co. Ltd. | | | 37,400 | | | | 17,773 | | |
| | | | 83,239 | | |
Energy (0.2%): | |
Energy Absolute Public Co. Ltd. | | | 29,800 | | | | 18,549 | | |
Financials (1.2%): | |
Bangkok Bank Public Co. Ltd. | | | 8,224 | | | | 34,686 | | |
Bank of Ayudhya Public Co. Ltd. | | | 13,100 | | | | 10,788 | | |
Central Pattana Public Co. Ltd. | | | 19,766 | | | | 25,694 | | |
Kasikornbank Public Co. Ltd. | | | 4,918 | | | | 20,420 | | |
Krung Thai Bank Public Co. ltd. | | | 48,535 | | | | 22,393 | | |
Land & Houses Public Co. Ltd. (b) | | | 10,540 | | | | 1,641 | | |
The Siam Commercial Bank Public Co. Ltd. | | | 6,832 | | | | 22,546 | | |
| | | | 138,168 | | |
Health Care (0.4%): | |
Bangkok Dusit Medical Services Public Co. Ltd. | | | 50,520 | | | | 31,231 | | |
Bumrungrad Hospital Public Co. Ltd. | | | 2,600 | | | | 15,187 | | |
| | | | 46,418 | | |
Industrials (0.6%): | |
Airports of Thailand Public Co. Ltd. | | | 2,748 | | | | 26,284 | | |
BTS Group Holdings Public Co. Ltd. | | | 137,601 | | | | 34,739 | | |
| | | | 61,023 | | |
Information Technology (0.1%): | |
Delta Electronics Thailand Public Co. Ltd. | | | 6,900 | | | | 14,586 | | |
Materials (0.5%): | |
Siam City Cement Public Co. Ltd. | | | 2,886 | | | | 25,525 | | |
The Siam Cement Public Co. Ltd. | | | 2,070 | | | | 26,351 | | |
| | | | 51,876 | | |
Telecommunication Services (0.5%): | |
Advanced Info Service Public Co. Ltd. | | | 4,993 | | | | 21,017 | | |
Intouch Holdings Public Co. Ltd. | | | 18,776 | | | | 27,053 | | |
Total Access Communication Public Co. Ltd. | | | 11,671 | | | | 9,746 | | |
| | | | 57,816 | | |
See notes to financial statements.
62
Victory Portfolios II
Victory CEMP Emerging Market Volatility Wtd Index Fund | | Schedule of Portfolio Investments — continued
December 31, 2015 | |
(Unaudited)
Security Description | | Shares | | Fair
Value(a) | |
Utilities (0.7%): | |
Electricity Generating Public Co. Ltd. | | | 8,400 | | | $ | 35,285 | | |
Glow Energy Public Co. Ltd. | | | 6,777 | | | | 13,846 | | |
Ratchaburi Electricity Generating Holdings Public Co. Ltd. | | | 24,100 | | | | 31,726 | | |
| | | | 80,857 | | |
| | | | 600,917 | | |
Turkey (3.9%): | |
Consumer Discretionary (0.7%): | |
Arcelik AS | | | 5,781 | | | | 27,681 | | |
Ford Otomotiv Sanayi AS | | | 2,147 | | | | 22,276 | | |
Tofas Turk Otomobil Fabrikasi AS | | | 3,623 | | | | 23,526 | | |
| | | | 73,483 | | |
Consumer Staples (0.5%): | |
BIM Birlesik Magazalar AS | | | 1,583 | | | | 27,871 | | |
Ulker Biskuvi Sanayi AS | | | 3,558 | | | | 21,479 | | |
| | | | 49,350 | | |
Energy (0.2%): | |
Tupras Turkiye Petrol Rafinerileri AS (b) | | | 935 | | | | 22,306 | | |
Financials (1.1%): | |
Akbank TAS | | | 9,109 | | | | 20,892 | | |
Haci Omer Sabanci Holding AS | | | 8,745 | | | | 24,797 | | |
Turkiye Garanti Bankasi AS | | | 7,975 | | | | 19,433 | | |
Turkiye Halk Bankasi AS | | | 5,327 | | | | 18,938 | | |
Turkiye Is Bankasi | | | 12,266 | | | | 19,306 | | |
Yapi ve Kredi Bankasi AS | | | 19,512 | | | | 21,963 | | |
| | | | 125,329 | | |
Industrials (0.8%): | |
Enka Insaat ve Sanayi AS | | | 16,777 | | | | 25,990 | | |
KOC Holding AS | | | 7,172 | | | | 26,867 | | |
TAV Havalimanlari Holding AS | | | 3,055 | | | | 19,048 | | |
Turk Hava Yollari Anonium Ortakligi (b) | | | 7,226 | | | | 18,282 | | |
| | | | 90,187 | | |
Materials (0.2%): | |
Eregli Demir ve Celik Fabrikalari TAS | | | 18,533 | | | | 19,290 | | |
Telecommunication Services (0.4%): | |
Turk Telekomunikasyon AS | | | 12,454 | | | | 23,298 | | |
Turkcell Iletisim Hizmetleri AS | | | 6,742 | | | | 22,859 | | |
| | | | 46,157 | | |
| | | | 426,102 | | |
United Arab Emirates (1.5%): | |
Financials (1.3%): | |
Abu Dhabi Commercial Bank PJSC | | | 8,510 | | | | 15,183 | | |
Aldar Properties PJSC | | | 24,281 | | | | 15,188 | | |
DAMAC Properties Dubai Co. PJSC | | | 11,049 | | | | 6,907 | | |
Dubai Islamic Bank PJSC | | | 12,031 | | | | 20,135 | | |
See notes to financial statements.
63
Victory Portfolios II
Victory CEMP Emerging Market Volatility Wtd Index Fund | | Schedule of Portfolio Investments — continued
December 31, 2015 | |
(Unaudited)
Security Description | | Shares | | Fair
Value(a) | |
Emaar Malls Group PJSC (b) | | | 28,388 | | | $ | 21,247 | | |
Emaar Properties PJSC | | | 9,926 | | | | 15,263 | | |
First Gulf Bank PJSC | | | 6,960 | | | | 23,902 | | |
National Bank of Abu Dhabi PJSC | | | 7,096 | | | | 15,341 | | |
Union National Bank PJSC | | | 13,773 | | | | 17,511 | | |
| | | | 150,677 | | |
Industrials (0.2%): | |
DP World Ltd. | | | 962 | | | | 19,514 | | |
| | | | 170,191 | | |
Total Common Stocks (Cost $12,199,718) | | | 10,241,012 | | |
Rights (0.0%) (e) | |
Taiwan (0.0%): (d) | |
Information Technology (0.0%): (d) | |
Nanya Technology Corp. Expires 01/11/16 @ $36.50 (b) | | | 948 | | | | 266 | | |
Total Rights (Cost $—) | | | 266 | | |
Cash Equivalents (14.9%) | |
United States (14.9%): | |
Citibank Money Market Deposit Account, 0.02% (e) | | | 1,640,043 | | | | 1,640,043 | | |
Total Cash Equivalents (Cost $1,640,043) | | | 1,640,043 | | |
Total Investments (Cost $13,839,761) — 107.7% | | | 11,881,321 | | |
Segregated cash with broker — 1.1% (f) | | | 121,794 | | |
Liabilities in excess of other assets — (8.8)% | | | (970,895 | ) | |
NET ASSETS — 100.00% | | $ | 11,032,220 | | |
(a) All securities, except those traded on exchanges in the United States (including ADRs), Brazil, Canada, Cayman Islands, Columbia, and Mexico were fair valued at December 31, 2015.
(b) Non-income producing security.
(c) The Fund's Adviser has deemed this security to be illiquid based upon procedures approved by the Board of Trustees. At December 31, 2015, illiquid securities were 0.28% of the Fund's net assets.
(d) Amount represents less than 0.05% of net assets.
(e) Rate periodically changes. Rate disclosed is the daily yield on December 31, 2015.
(f) Segregated cash with broker represents collateral for futures contracts.
Futures Contracts Purchased
| | | Number
of
Contracts | | Expiration
Date | | Notional
Amount
at Value | | Unrealized
Depreciation | |
E-Mini MSCI Index Futures | | | 17 | | | 3/21/16 | | $ | 669,375 | | | $ | (2,162 | ) | |
See notes to financial statements.
64
Victory Portfolios II
Victory CEMP US 500 Enhanced Volatility Wtd Index Fund | | Schedule of Portfolio Investments
December 31, 2015 | |
(Unaudited)
Security Description | | Shares | | Value | |
Common Stocks (99.2%) | |
Consumer Discretionary (15.9%): | |
Advance Auto Parts, Inc. | | | 1,962 | | | $ | 295,301 | | |
AMC Networks, Inc., Class A (a) | | | 4,363 | | | | 325,829 | | |
Aramark | | | 14,670 | | | | 473,108 | | |
AutoNation, Inc. (a) | | | 6,675 | | | | 398,231 | | |
AutoZone, Inc. (a) | | | 688 | | | | 510,433 | | |
Bed Bath & Beyond, Inc. (a) | | | 6,192 | | | | 298,764 | | |
Best Buy Co., Inc. | | | 6,375 | | | | 194,119 | | |
BorgWarner, Inc. | | | 7,715 | | | | 333,519 | | |
Cablevision Systems Corp. | | | 8,139 | | | | 259,634 | | |
CarMax, Inc. (a) | | | 5,888 | | | | 317,775 | | |
Carter's, Inc. | | | 4,135 | | | | 368,139 | | |
CBS Corp., Class B | | | 8,426 | | | | 397,117 | | |
Chipotle Mexican Grill, Inc. (a) | | | 484 | | | | 232,247 | | |
Coach, Inc. | | | 10,507 | | | | 343,894 | | |
Comcast Corp., Class A | | | 7,183 | | | | 405,337 | | |
Dick's Sporting Goods, Inc. | | | 6,305 | | | | 222,882 | | |
Discovery Communications, Inc., Class A (a) | | | 9,968 | | | | 265,946 | | |
DISH Network Corp. (a) | | | 6,108 | | | | 349,255 | | |
Dollar General Corp. | | | 6,197 | | | | 445,379 | | |
Domino's Pizza, Inc. | | | 3,149 | | | | 350,326 | | |
DR Horton, Inc. | | | 9,183 | | | | 294,131 | | |
Dunkin' Brands Group, Inc. | | | 8,093 | | | | 344,681 | | |
Expedia, Inc. | | | 1,955 | | | | 243,007 | | |
Foot Locker, Inc. | | | 5,701 | | | | 371,078 | | |
Ford Motor Co. | | | 30,370 | | | | 427,914 | | |
GameStop Corp., Class A | | | 6,158 | | | | 172,670 | | |
General Motors Co. | | | 12,022 | | | | 408,868 | | |
Gentex Corp. | | | 24,471 | | | | 391,781 | | |
Genuine Parts Co. | | | 5,513 | | | | 473,511 | | |
Hanesbrands, Inc. | | | 10,400 | | | | 306,072 | | |
Harley-Davidson, Inc. | | | 5,691 | | | | 258,314 | | |
Harman International Industries, Inc. | | | 1,965 | | | | 185,123 | | |
Hasbro, Inc. | | | 4,260 | | | | 286,954 | | |
Hilton Worldwide Holdings, Inc. | | | 14,631 | | | | 313,103 | | |
Hyatt Hotels Corp., Class A (a) | | | 7,671 | | | | 360,690 | | |
Johnson Controls, Inc. | | | 8,948 | | | | 353,357 | | |
Kohl's Corp. | | | 5,553 | | | | 264,489 | | |
L Brands, Inc. | | | 4,230 | | | | 405,319 | | |
Las Vegas Sands Corp. | | | 5,462 | | | | 239,454 | | |
Lear Corp. | | | 3,369 | | | | 413,814 | | |
Lennar Corp., Class A | | | 5,821 | | | | 284,705 | | |
Lions Gate Entertainment Corp. | | | 7,786 | | | | 252,189 | | |
LKQ Corp. (a) | | | 11,339 | | | | 335,975 | | |
Lowe's Cos., Inc. | | | 6,101 | | | | 463,920 | | |
Macy's, Inc. | | | 5,833 | | | | 204,038 | | |
Marriott International, Inc., Class A | | | 4,924 | | | | 330,105 | | |
McDonald's Corp. | | | 4,783 | | | | 565,064 | | |
Mohawk Industries, Inc. (a) | | | 1,893 | | | | 358,515 | | |
See notes to financial statements.
65
Victory Portfolios II
Victory CEMP US 500 Enhanced Volatility Wtd Index Fund | | Schedule of Portfolio Investments — continued
December 31, 2015 | |
(Unaudited)
Security Description | | Shares | | Value | |
MSG Networks, Inc., Class A (a) | | | 21,543 | | | $ | 448,094 | | |
Netflix, Inc. (a) | | | 1,731 | | | | 197,992 | | |
Newell Rubbermaid, Inc. | | | 10,686 | | | | 471,039 | | |
NIKE, Inc., Class B | | | 7,976 | | | | 498,501 | | |
Nordstrom, Inc. | | | 5,806 | | | | 289,197 | | |
NVR, Inc. (a) | | | 314 | | | | 515,902 | | |
Omnicom Group, Inc. | | | 7,706 | | | | 583,036 | | |
O'Reilly Automotive, Inc. (a) | | | 1,628 | | | | 412,568 | | |
Panera Bread Co., Class A (a) | | | 1,745 | | | | 339,891 | | |
Penske Automotive Group, Inc. | | | 6,021 | | | | 254,929 | | |
Polaris Industries, Inc. | | | 2,559 | | | | 219,946 | | |
PulteGroup, Inc. | | | 13,631 | | | | 242,904 | | |
PVH Corp. | | | 2,711 | | | | 199,665 | | |
Ralph Lauren Corp. | | | 2,453 | | | | 273,460 | | |
Ross Stores, Inc. | | | 7,139 | | | | 384,150 | | |
Royal Caribbean Cruises Ltd. | | | 3,070 | | | | 310,715 | | |
Scripps Networks Interactive, Inc., Class A | | | 7,182 | | | | 396,518 | | |
Service Corp. International | | | 15,507 | | | | 403,492 | | |
Sirius XM Holdings, Inc. (a) | | | 116,752 | | | | 475,181 | | |
Skechers U.S.A., Inc. (a) | | | 4,784 | | | | 144,525 | | |
Starbucks Corp. | | | 6,817 | | | | 409,225 | | |
Starwood Hotels & Resorts Worldwide, Inc. | | | 4,498 | | | | 311,621 | | |
TEGNA, Inc. | | | 12,490 | | | | 318,745 | | |
The Gap, Inc. | | | 12,916 | | | | 319,025 | | |
The Goodyear Tire & Rubber Co. | | | 10,267 | | | | 335,423 | | |
The Home Depot, Inc. | | | 3,680 | | | | 486,680 | | |
The Priceline Group, Inc. (a) | | | 258 | | | | 328,936 | | |
The TJX Cos., Inc. | | | 5,850 | | | | 414,824 | | |
The Walt Disney Co. | | | 3,604 | | | | 378,708 | | |
Tiffany & Co. | | | 3,177 | | | | 242,373 | | |
Time Warner Cable, Inc. | | | 1,884 | | | | 349,652 | | |
Time Warner, Inc. | | | 5,336 | | | | 345,079 | | |
Toll Brothers, Inc. (a) | | | 9,055 | | | | 301,532 | | |
Tractor Supply Co. | | | 4,202 | | | | 359,271 | | |
TripAdvisor, Inc. (a) | | | 2,940 | | | | 250,635 | | |
Twenty-First Century Fox, Inc. | | | 13,235 | | | | 359,463 | | |
Ulta Salon, Cosmetics & Fragrance, Inc. (a) | | | 2,661 | | | | 492,285 | | |
Under Armour, Inc. (a) | | | 3,199 | | | | 257,871 | | |
VF Corp. | | | 6,041 | | | | 376,052 | | |
Whirlpool Corp. | | | 1,939 | | | | 284,781 | | |
Williams-Sonoma, Inc. | | | 5,062 | | | | 295,671 | | |
Wyndham Worldwide Corp. | | | 5,090 | | | | 369,789 | | |
| | | | 30,745,422 | | |
Consumer Staples (9.2%): | |
Altria Group, Inc. | | | 8,798 | | | | 512,131 | | |
Archer-Daniels-Midland Co. | | | 9,461 | | | | 347,029 | | |
Brown-Forman Corp., Class B | | | 5,468 | | | | 542,863 | | |
Campbell Soup Co. | | | 11,116 | | | | 584,146 | | |
Church & Dwight Co., Inc. | | | 6,871 | | | | 583,210 | | |
Coca-Cola Enterprises, Inc. | | | 6,789 | | | | 334,290 | | |
See notes to financial statements.
66
Victory Portfolios II
Victory CEMP US 500 Enhanced Volatility Wtd Index Fund | | Schedule of Portfolio Investments — continued
December 31, 2015 | |
(Unaudited)
Security Description | | Shares | | Value | |
Colgate-Palmolive Co. | | | 7,907 | | | $ | 526,764 | | |
Constellation Brands, Inc., Class A | | | 3,486 | | | | 496,546 | | |
Costco Wholesale Corp. | | | 3,357 | | | | 542,155 | | |
CVS Health Corp. | | | 5,273 | | | | 515,541 | | |
Dr Pepper Snapple Group, Inc. | | | 6,598 | | | | 614,934 | | |
Flowers Foods, Inc. | | | 15,207 | | | | 326,798 | | |
General Mills, Inc. | | | 10,436 | | | | 601,740 | | |
Herbalife Ltd. (a) | | | 2,641 | | | | 141,610 | | |
Hormel Foods Corp. | | | 7,328 | | | | 579,498 | | |
Ingredion, Inc. | | | 5,053 | | | | 484,280 | | |
Keurig Green Mountain, Inc. | | | 2,702 | | | | 243,126 | | |
McCormick & Co., Inc. | | | 6,848 | | | | 585,915 | | |
Mead Johnson Nutrition Co. | | | 6,146 | | | | 485,227 | | |
Mondelez International, Inc. | | | 10,415 | | | | 467,009 | | |
Monster Beverage Corp. (a) | | | 1,984 | | | | 295,537 | | |
PepsiCo, Inc. | | | 6,023 | | | | 601,818 | | |
Philip Morris International, Inc. | | | 5,650 | | | | 496,692 | | |
Pilgrim's Pride Corp. | | | 8,090 | | | | 178,708 | | |
Pinnacle Foods, Inc. | | | 10,188 | | | | 432,582 | | |
Reynolds American, Inc. | | | 9,553 | | | | 440,871 | | |
Rite Aid Corp. (a) | | | 31,677 | | | | 248,348 | | |
Spectrum Brands Holdings, Inc. | | | 4,742 | | | | 482,736 | | |
Sysco Corp. | | | 11,606 | | | | 475,846 | | |
The Clorox Co. | | | 5,285 | | | | 670,297 | | |
The Coca-Cola Co. | | | 16,278 | | | | 699,303 | | |
The Estee Lauder Cos., Inc., Class A | | | 5,017 | | | | 441,797 | | |
The Hain Celestial Group, Inc. (a) | | | 6,089 | | | | 245,935 | | |
The Kroger Co. | | | 12,461 | | | | 521,244 | | |
The Procter & Gamble Co. | | | 7,888 | | | | 626,386 | | |
Tyson Foods, Inc., Class A | | | 7,773 | | | | 414,534 | | |
Wal-Mart Stores, Inc. | | | 7,246 | | | | 444,180 | | |
WhiteWave Foods Co., Class A (a) | | | 7,075 | | | | 275,288 | | |
Whole Foods Market, Inc. | | | 9,742 | | | | 326,357 | | |
| | | | 17,833,271 | | |
Energy (2.2%): | |
Cameron International Corp. (a) | | | 2,383 | | | | 150,606 | | |
Cheniere Energy Partners LP Holdings LLC | | | 17,532 | | | | 305,057 | | |
Chevron Corp. | | | 4,484 | | | | 403,380 | | |
Exxon Mobil Corp. | | | 5,641 | | | | 439,715 | | |
FMC Technologies, Inc. (a) | | | 6,934 | | | | 201,155 | | |
Helmerich & Payne, Inc. | | | 4,104 | | | | 219,769 | | |
Kinder Morgan, Inc. | | | 13,891 | | | | 207,254 | | |
Marathon Petroleum Corp. | | | 5,229 | | | | 271,071 | | |
National Oilwell Varco, Inc. | | | 6,553 | | | | 219,460 | | |
ONEOK, Inc. | | | 6,485 | | | | 159,920 | | |
Phillips 66 | | | 3,591 | | | | 293,744 | | |
Plains GP Holdings LP, Class A | | | 10,042 | | | | 94,897 | | |
Schlumberger Ltd. | | | 4,625 | | | | 322,594 | | |
Spectra Energy Corp. | | | 12,970 | | | | 310,502 | | |
Tesoro Corp. | | | 2,452 | | | | 258,367 | | |
See notes to financial statements.
67
Victory Portfolios II
Victory CEMP US 500 Enhanced Volatility Wtd Index Fund | | Schedule of Portfolio Investments — continued
December 31, 2015 | |
(Unaudited)
Security Description | | Shares | | Value | |
The Williams Cos., Inc. | | | 4,628 | | | $ | 118,940 | | |
Valero Energy Corp. | | | 4,381 | | | | 309,781 | | |
| | | | 4,286,212 | | |
Financials (17.6%): | |
Affiliated Managers Group, Inc. (a) | | | 2,370 | | | | 378,631 | | |
Aflac, Inc. | | | 8,344 | | | | 499,806 | | |
Alleghany Corp. (a) | | | 1,084 | | | | 518,076 | | |
American Express Co. | | | 5,171 | | | | 359,643 | | |
American Financial Group, Inc. | | | 8,635 | | | | 622,412 | | |
American International Group, Inc. | | | 7,441 | | | | 461,119 | | |
Ameriprise Financial, Inc. | | | 3,543 | | | | 377,046 | | |
AmTrust Financial Services, Inc. | | | 5,731 | | | | 352,915 | | |
Arthur J. Gallagher & Co. | | | 13,801 | | | | 565,014 | | |
Assurant, Inc. | | | 5,735 | | | | 461,897 | | |
BB&T Corp. | | | 11,433 | | | | 432,282 | | |
Berkshire Hathaway, Inc., Class B (a) | | | 4,528 | | | | 597,876 | | |
BlackRock, Inc. | | | 1,461 | | | | 497,500 | | |
Brown & Brown, Inc. | | | 17,334 | | | | 556,421 | | |
Capital One Financial Corp. | | | 4,436 | | | | 320,190 | | |
CBOE Holdings, Inc. | | | 7,272 | | | | 471,953 | | |
CBRE Group, Inc., Class A (a) | | | 11,368 | | | | 393,105 | | |
Cincinnati Financial Corp. | | | 9,137 | | | | 540,636 | | |
CIT Group, Inc. | | | 10,840 | | | | 430,348 | | |
Citigroup, Inc. | | | 7,269 | | | | 376,171 | | |
Citizens Financial Group, Inc. | | | 15,840 | | | | 414,850 | | |
CME Group, Inc. | | | 4,768 | | | | 431,981 | | |
CNA Financial Corp. | | | 13,253 | | | | 465,843 | | |
Comerica, Inc. | | | 7,328 | | | | 306,530 | | |
Discover Financial Services | | | 7,745 | | | | 415,287 | | |
E*TRADE Financial Corp. (a) | | | 10,262 | | | | 304,166 | | |
East West Bancorp, Inc. | | | 8,960 | | | | 372,378 | | |
FactSet Research Systems, Inc. | | | 3,068 | | | | 498,765 | | |
Fifth Third Bancorp | | | 18,797 | | | | 377,820 | | |
First Republic Bank | | | 6,427 | | | | 424,568 | | |
Franklin Resources, Inc. | | | 10,961 | | | | 403,584 | | |
Huntington Bancshares, Inc. | | | 36,785 | | | | 406,842 | | |
Intercontinental Exchange, Inc. | | | 1,783 | | | | 456,912 | | |
Invesco Ltd. | | | 11,961 | | | | 400,454 | | |
Jones Lang LaSalle, Inc. | | | 2,195 | | | | 350,893 | | |
JPMorgan Chase & Co. | | | 6,466 | | | | 426,950 | | |
KeyCorp | | | 24,869 | | | | 328,022 | | |
Legg Mason, Inc. | | | 9,606 | | | | 376,843 | | |
Lincoln National Corp. | | | 6,585 | | | | 330,962 | | |
Loews Corp. | | | 14,231 | | | | 546,470 | | |
M&T Bank Corp. | | | 6,465 | | | | 783,428 | | |
Markel Corp. (a) | | | 588 | | | | 519,410 | | |
Marsh & McLennan Cos., Inc. | | | 10,012 | | | | 555,165 | | |
MetLife, Inc. | | | 7,656 | | | | 369,096 | | |
Moody's Corp. | | | 4,311 | | | | 432,566 | | |
MSCI, Inc. | | | 6,994 | | | | 504,477 | | |
See notes to financial statements.
68
Victory Portfolios II
Victory CEMP US 500 Enhanced Volatility Wtd Index Fund | | Schedule of Portfolio Investments — continued
December 31, 2015 | |
(Unaudited)
Security Description | | Shares | | Value | |
NASDAQ, Inc. | | | 8,783 | | | $ | 510,907 | | |
Navient Corp. | | | 22,541 | | | | 258,094 | | |
New York Community Bancorp, Inc. | | | 27,704 | | | | 452,129 | | |
Northern Trust Corp. | | | 5,391 | | | | 388,637 | | |
People's United Financial, Inc. | | | 32,249 | | | | 520,821 | | |
Principal Financial Group, Inc. | | | 7,638 | | | | 343,557 | | |
Raymond James Financial, Inc. | | | 7,474 | | | | 433,268 | | |
Regions Financial Corp. | | | 34,614 | | | | 332,294 | | |
Reinsurance Group of America, Inc. | | | 5,237 | | | | 448,025 | | |
Santander Consumer USA Holdings, Inc. (a) | | | 13,976 | | | | 221,520 | | |
SEI Investments Co. | | | 8,043 | | | | 421,453 | | |
Signature Bank (a) | | | 2,766 | | | | 424,221 | | |
StanCorp Financial Group, Inc. | | | 1,459 | | | | 166,151 | | |
State Street Corp. | | | 5,073 | | | | 336,644 | | |
SunTrust Banks, Inc. | | | 9,338 | | | | 400,040 | | |
SVB Financial Group (a) | | | 2,149 | | | | 255,516 | | |
Synchrony Financial (a) | | | 13,161 | | | | 400,226 | | |
T. Rowe Price Group, Inc. | | | 7,026 | | | | 502,289 | | |
TD Ameritrade Holding Corp. | | | 11,138 | | | | 386,600 | | |
TFS Financial Corp. | | | 34,761 | | | | 654,550 | | |
The Allstate Corp. | | | 6,995 | | | | 434,320 | | |
The Bank of New York Mellon Corp. | | | 9,757 | | | | 402,184 | | |
The Charles Schwab Corp. | | | 10,615 | | | | 349,552 | | |
The Chubb Corp. | | | 2,249 | | | | 298,307 | | |
The Goldman Sachs Group, Inc. | | | 2,286 | | | | 412,006 | | |
The PNC Financial Services Group, Inc. | | | 4,856 | | | | 462,825 | | |
The Progressive Corp. | | | 16,795 | | | | 534,081 | | |
The Travelers Cos., Inc. | | | 4,943 | | | | 557,867 | | |
Torchmark Corp. | | | 8,809 | | | | 503,522 | | |
U.S. Bancorp | | | 10,968 | | | | 468,005 | | |
Voya Financial, Inc. | | | 10,019 | | | | 369,801 | | |
W.R. Berkley Corp. | | | 8,442 | | | | 462,200 | | |
Wells Fargo & Co. | | | 8,642 | | | | 469,779 | | |
| | | | 33,998,694 | | |
Health Care (10.8%): | |
Abbott Laboratories | | | 9,687 | | | | 435,043 | | |
Acadia Healthcare Co., Inc. (a) | | | 3,829 | | | | 239,159 | | |
Aetna, Inc. | | | 2,881 | | | | 311,494 | | |
Agilent Technologies, Inc. | | | 11,207 | | | | 468,565 | | |
Alexion Pharmaceuticals, Inc. (a) | | | 1,422 | | | | 271,247 | | |
Align Technology, Inc. (a) | | | 5,389 | | | | 354,866 | | |
Amgen, Inc. | | | 2,070 | | | | 336,022 | | |
Anthem, Inc. | | | 2,605 | | | | 363,241 | | |
Baxter International, Inc. | | | 12,721 | | | | 485,306 | | |
Becton, Dickinson & Co. | | | 3,800 | | | | 585,541 | | |
Biogen, Inc. (a) | | | 608 | | | | 186,261 | | |
Cardinal Health, Inc. | | | 5,330 | | | | 475,809 | | |
Celgene Corp. (a) | | | 2,266 | | | | 271,376 | | |
Centene Corp. (a) | | | 4,444 | | | | 292,460 | | |
Cerner Corp. (a) | | | 6,107 | | | | 367,458 | | |
See notes to financial statements.
69
Victory Portfolios II
Victory CEMP US 500 Enhanced Volatility Wtd Index Fund | | Schedule of Portfolio Investments — continued
December 31, 2015 | |
(Unaudited)
Security Description | | Shares | | Value | |
Cigna Corp. | | | 2,217 | | | $ | 324,414 | | |
Community Health Systems, Inc. (a) | | | 4,975 | | | | 131,987 | | |
DENTSPLY International, Inc. | | | 8,555 | | | | 520,572 | | |
Edwards Lifesciences Corp. (a) | | | 4,633 | | | | 365,914 | | |
Eli Lilly & Co. | | | 4,564 | | | | 384,563 | | |
Express Scripts Holding Co. (a) | | | 4,702 | | | | 411,002 | | |
Gilead Sciences, Inc. | | | 2,845 | | | | 287,886 | | |
HCA Holdings, Inc. (a) | | | 3,878 | | | | 262,269 | | |
Henry Schein, Inc. (a) | | | 3,635 | | | | 575,020 | | |
Hologic, Inc. (a) | | | 9,214 | | | | 356,490 | | |
Humana, Inc. | | | 1,326 | | | | 236,704 | | |
IDEXX Laboratories, Inc. (a) | | | 3,205 | | | | 233,709 | | |
Illumina, Inc. (a) | | | 1,494 | | | | 286,766 | | |
Intuitive Surgical, Inc. (a) | | | 734 | | | | 400,881 | | |
Johnson & Johnson | | | 5,509 | | | | 565,884 | | |
Laboratory Corp. of America Holdings (a) | | | 4,078 | | | | 504,203 | | |
McKesson Corp. | | | 2,213 | | | | 436,470 | | |
MEDNAX, Inc. (a) | | | 6,065 | | | | 434,618 | | |
Merck & Co., Inc. | | | 7,659 | | | | 404,548 | | |
Mettler-Toledo International, Inc. (a) | | | 1,437 | | | | 487,330 | | |
Mylan NV (a) | | | 4,295 | | | | 232,231 | | |
Patterson Cos., Inc. | | | 10,127 | | | | 457,842 | | |
PerkinElmer, Inc. | | | 10,061 | | | | 538,967 | | |
Pfizer, Inc. | | | 15,431 | | | | 498,113 | | |
Quest Diagnostics, Inc. | | | 5,637 | | | | 401,016 | | |
Quintiles Transnational Holdings, Inc. (a) | | | 5,919 | | | | 406,399 | | |
Regeneron Pharmaceuticals, Inc. (a) | | | 533 | | | | 289,350 | | |
ResMed, Inc. | | | 5,162 | | | | 277,148 | | |
Sirona Dental Systems, Inc. (a) | | | 5,150 | | | | 564,286 | | |
St. Jude Medical, Inc. | | | 5,538 | | | | 342,082 | | |
Stryker Corp. | | | 4,748 | | | | 441,279 | | |
Team Health Holdings, Inc. (a) | | | 3,881 | | | | 170,337 | | |
Teleflex, Inc. | | | 3,924 | | | | 515,810 | | |
The Cooper Cos., Inc. | | | 2,788 | | | | 374,150 | | |
Thermo Fisher Scientific, Inc. | | | 3,464 | | | | 491,368 | | |
UnitedHealth Group, Inc. | | | 3,068 | | | | 360,920 | | |
Universal Health Services, Inc., Class B | | | 2,430 | | | | 290,361 | | |
Varian Medical Systems, Inc. (a) | | | 4,838 | | | | 390,910 | | |
VCA, Inc. (a) | | | 6,134 | | | | 337,370 | | |
Waters Corp. (a) | | | 3,590 | | | | 483,142 | | |
| | | | 20,918,159 | | |
Industrials (17.2%): | |
3M Co. | | | 3,563 | | | | 536,730 | | |
A.O. Smith Corp. | | | 5,019 | | | | 384,506 | | |
Acuity Brands, Inc. | | | 1,973 | | | | 461,287 | | |
Alaska Air Group, Inc. | | | 3,512 | | | | 282,751 | | |
Allison Transmission Holdings, Inc. | | | 16,405 | | | | 424,725 | | |
AMERCO, Inc. | | | 1,108 | | | | 431,566 | | |
American Airlines Group, Inc. | | | 5,290 | | | | 224,032 | | |
AMETEK, Inc. | | | 8,162 | | | | 437,402 | | |
See notes to financial statements.
70
Victory Portfolios II
Victory CEMP US 500 Enhanced Volatility Wtd Index Fund | | Schedule of Portfolio Investments — continued
December 31, 2015 | |
(Unaudited)
Security Description | | Shares | | Value | |
C.H. Robinson Worldwide, Inc. | | | 4,966 | | | $ | 307,991 | | |
Carlisle Cos., Inc. | | | 4,131 | | | | 366,378 | | |
Caterpillar, Inc. | | | 4,994 | | | | 339,392 | | |
Cintas Corp. | | | 5,989 | | | | 545,298 | | |
Colfax Corp. (a) | | | 8,976 | | | | 209,590 | | |
Copart, Inc. (a) | | | 15,532 | | | | 590,371 | | |
CSX Corp. | | | 12,239 | | | | 317,602 | | |
Cummins, Inc. | | | 3,510 | | | | 308,915 | | |
Danaher Corp. | | | 5,961 | | | | 553,659 | | |
Deere & Co. | | | 5,173 | | | | 394,545 | | |
Dover Corp. | | | 5,887 | | | | 360,932 | | |
Eaton Corp. PLC | | | 6,755 | | | | 351,530 | | |
Emerson Electric Co. | | | 9,235 | | | | 441,710 | | |
Equifax, Inc. | | | 4,328 | | | | 482,010 | | |
Expeditors International of Washington, Inc. | | | 8,965 | | | | 404,322 | | |
Fastenal Co. | | | 9,777 | | | | 399,097 | | |
Flowserve Corp. | | | 7,990 | | | | 336,219 | | |
Fluor Corp. | | | 7,077 | | | | 334,176 | | |
General Dynamics Corp. | | | 3,269 | | | | 449,030 | | |
Hexcel Corp. | | | 8,392 | | | | 389,808 | | |
Honeywell International, Inc. | | | 4,732 | | | | 490,093 | | |
Hubbell, Inc. (a) | | | 5,544 | | | | 560,166 | | |
Huntington Ingalls Industries, Inc. | | | 2,688 | | | | 340,973 | | |
IDEX Corp. | | | 7,347 | | | | 562,855 | | |
IHS, Inc., Class A (a) | | | 3,145 | | | | 372,462 | | |
Illinois Tool Works, Inc. | | | 5,783 | | | | 535,968 | | |
Ingersoll-Rand PLC | | | 7,904 | | | | 437,012 | | |
J.B. Hunt Transport Services, Inc. | | | 5,894 | | | | 432,384 | | |
Jacobs Engineering Group, Inc. (a) | | | 8,106 | | | | 340,046 | | |
JetBlue Airways Corp. (a) | | | 9,566 | | | | 216,670 | | |
Kansas City Southern | | | 3,375 | | | | 252,011 | | |
KAR Auction Services, Inc. | | | 14,119 | | | | 522,827 | | |
L-3 Communications Holdings, Inc. | | | 4,116 | | | | 491,903 | | |
Lennox International, Inc. | | | 3,941 | | | | 492,231 | | |
Lincoln Electric Holdings, Inc. | | | 6,582 | | | | 341,540 | | |
Lockheed Martin Corp. | | | 2,591 | | | | 562,636 | | |
Manpowergroup, Inc. | | | 3,413 | | | | 287,682 | | |
Masco Corp. | | | 11,891 | | | | 336,515 | | |
Nielsen Holdings PLC | | | 8,717 | | | | 406,212 | | |
Norfolk Southern Corp. | | | 5,005 | | | | 423,373 | | |
Northrop Grumman Corp. | | | 2,652 | | | | 500,724 | | |
Old Dominion Freight Line, Inc. (a) | | | 6,019 | | | | 355,542 | | |
Owens Corning | | | 6,493 | | | | 305,366 | | |
PACCAR, Inc. | | | 6,715 | | | | 318,291 | | |
Parker-Hannifin Corp. | | | 3,828 | | | | 371,239 | | |
Precision Castparts Corp. | | | 1,162 | | | | 269,596 | | |
Quanta Services, Inc. (a) | | | 10,490 | | | | 212,423 | | |
Raytheon Co. | | | 4,083 | | | | 508,456 | | |
Republic Services, Inc., Class A | | | 13,164 | | | | 579,084 | | |
Robert Half International, Inc. | | | 7,436 | | | | 350,533 | | |
See notes to financial statements.
71
Victory Portfolios II
Victory CEMP US 500 Enhanced Volatility Wtd Index Fund | | Schedule of Portfolio Investments — continued
December 31, 2015 | |
(Unaudited)
Security Description | | Shares | | Value | |
Rockwell Automation, Inc. | | | 3,612 | | | $ | 370,627 | | |
Rockwell Collins, Inc. | | | 6,114 | | | | 564,322 | | |
Rollins, Inc. | | | 14,493 | | | | 375,369 | | |
Roper Technologies, Inc. | | | 2,898 | | | | 550,011 | | |
Ryder System, Inc. | | | 4,549 | | | | 258,520 | | |
Snap-on, Inc. | | | 2,945 | | | | 504,861 | | |
Southwest Airlines Co. | | | 6,831 | | | | 294,142 | | |
Stanley Black & Decker, Inc. | | | 4,648 | | | | 496,081 | | |
Stericycle, Inc. (a) | | | 3,788 | | | | 456,833 | | |
Textron, Inc. | | | 8,937 | | | | 375,443 | | |
The ADT Corp. | | | 10,525 | | | | 347,115 | | |
The Boeing Co. | | | 2,998 | | | | 433,481 | | |
The Middleby Corp. (a) | | | 3,170 | | | | 341,948 | | |
Towers Watson & Co. | | | 3,333 | | | | 428,157 | | |
Union Pacific Corp. | | | 4,098 | | | | 320,464 | | |
United Continental Holdings, Inc. (a) | | | 3,902 | | | | 223,585 | | |
United Parcel Service, Inc. | | | 4,319 | | | | 415,617 | | |
United Rentals, Inc. (a) | | | 3,073 | | | | 222,915 | | |
United Technologies Corp. | | | 4,831 | | | | 464,114 | | |
Verisk Analytics, Inc., Class A (a) | | | 5,549 | | | | 426,607 | | |
W.W. Grainger, Inc. | | | 2,139 | | | | 433,341 | | |
WABCO Holdings, Inc. (a) | | | 2,942 | | | | 300,849 | | |
Wabtec Corp. | | | 3,991 | | | | 283,840 | | |
Waste Connections, Inc. | | | 10,546 | | | | 593,950 | | |
Xylem, Inc. | | | 13,627 | | | | 497,386 | | |
| | | | 33,221,965 | | |
Information Technology (13.7%): | |
Adobe Systems, Inc. (a) | | | 4,995 | | | | 469,229 | | |
Akamai Technologies, Inc. (a) | | | 5,017 | | | | 264,045 | | |
Alliance Data Systems Corp. (a) | | | 1,536 | | | | 424,812 | | |
Alphabet, Inc., Class A (a) | | | 437 | | | | 339,990 | | |
Amdocs Ltd. | | | 9,668 | | | | 527,583 | | |
Amphenol Corp., Class A | | | 8,006 | | | | 418,154 | | |
Analog Devices, Inc. | | | 5,051 | | | | 279,421 | | |
ANSYS, Inc. (a) | | | 4,845 | | | | 448,163 | | |
Apple, Inc. | | | 2,896 | | | | 304,833 | | |
Applied Materials, Inc. | | | 19,725 | | | | 368,266 | | |
Arista Networks, Inc. (a) | | | 3,279 | | | | 255,237 | | |
Arrow Electronics, Inc. (a) | | | 5,724 | | | | 310,126 | | |
Automatic Data Processing, Inc. | | | 5,703 | | | | 483,158 | | |
Avnet, Inc. | | | 8,466 | | | | 362,683 | | |
Broadridge Financial Solutions, Inc. | | | 8,074 | | | | 433,816 | | |
Brocade Communications Systems, Inc. | | | 26,620 | | | | 244,372 | | |
CA, Inc. | | | 14,951 | | | | 427,001 | | |
Cadence Design Systems, Inc. (a) | | | 16,749 | | | | 348,547 | | |
CDW Corp. of Delaware | | | 9,743 | | | | 409,596 | | |
Cisco Systems, Inc. | | | 14,222 | | | | 386,198 | | |
Citrix Systems, Inc. (a) | | | 4,585 | | | | 346,855 | | |
Cognizant Technology Solutions Corp., Class A (a) | | | 5,338 | | | | 320,387 | | |
CommScope Holding Co., Inc. (a) | | | 7,270 | | | | 188,220 | | |
See notes to financial statements.
72
Victory Portfolios II
Victory CEMP US 500 Enhanced Volatility Wtd Index Fund | | Schedule of Portfolio Investments — continued
December 31, 2015 | |
(Unaudited)
Security Description | | Shares | | Value | |
Corning, Inc. | | | 21,986 | | | $ | 401,904 | | |
eBay, Inc. (a) | | | 14,452 | | | | 397,141 | | |
Electronic Arts, Inc. (a) | | | 4,357 | | | | 299,413 | | |
EMC Corp. | | | 13,928 | | | | 357,671 | | |
F5 Networks, Inc. (a) | | | 2,753 | | | | 266,931 | | |
Facebook, Inc., Class A (a) | | | 3,709 | | | | 388,184 | | |
Fidelity National Information Services, Inc. | | | 5,656 | | | | 342,754 | | |
Fiserv, Inc. (a) | | | 5,299 | | | | 484,647 | | |
FleetCor Technologies, Inc. (a) | | | 2,643 | | | | 377,764 | | |
Flextronics International Ltd. (a) | | | 31,103 | | | | 348,665 | | |
Gartner, Inc. (a) | | | 5,094 | | | | 462,026 | | |
Genpact Ltd. (a) | | | 17,966 | | | | 448,791 | | |
Global Payments, Inc. | | | 6,684 | | | | 431,185 | | |
HP, Inc. | | | 23,803 | | | | 281,828 | | |
Intel Corp. | | | 18,085 | | | | 623,029 | | |
International Business Machines Corp. | | | 2,873 | | | | 395,382 | | |
IPG Photonics Corp. (a) | | | 3,165 | | | | 282,191 | | |
Jack Henry & Associates, Inc. | | | 7,575 | | | | 591,304 | | |
KLA-Tencor Corp. | | | 6,524 | | | | 452,440 | | |
Lam Research Corp. | | | 4,377 | | | | 347,621 | | |
Linear Technology Corp. | | | 9,173 | | | | 389,577 | | |
MasterCard, Inc., Class A | | | 4,645 | | | | 452,237 | | |
Microchip Technology, Inc. | | | 8,186 | | | | 380,976 | | |
Micron Technology, Inc. (a) | | | 10,305 | | | | 145,919 | | |
Motorola Solutions, Inc. | | | 5,968 | | | | 408,510 | | |
NVIDIA Corp. | | | 11,550 | | | | 380,688 | | |
Oracle Corp. | | | 11,517 | | | | 420,716 | | |
Paychex, Inc. | | | 11,052 | | | | 584,540 | | |
QUALCOMM, Inc. | | | 6,183 | | | | 309,057 | | |
Red Hat, Inc. (a) | | | 4,933 | | | | 408,502 | | |
SanDisk Corp. | | | 3,259 | | | | 247,651 | | |
Seagate Technology PLC | | | 5,797 | | | | 212,518 | | |
Skyworks Solutions, Inc. | | | 2,654 | | | | 203,907 | | |
SS&C Technologies Holdings, Inc. | | | 4,527 | | | | 309,058 | | |
Symantec Corp. | | | 16,311 | | | | 342,531 | | |
Synopsys, Inc. (a) | | | 9,948 | | | | 453,728 | | |
Texas Instruments, Inc. | | | 7,236 | | | | 396,605 | | |
The Ultimate Software Group, Inc. (a) | | | 1,943 | | | | 379,876 | | |
The Western Union Co. | | | 18,817 | | | | 337,012 | | |
Total System Services, Inc. | | | 8,513 | | | | 423,947 | | |
Trimble Navigation Ltd. (a) | | | 14,586 | | | | 312,870 | | |
Tyler Technologies, Inc. (a) | | | 2,481 | | | | 432,488 | | |
VeriSign, Inc. (a) | | | 6,357 | | | | 555,348 | | |
Visa, Inc., Class A | | | 5,712 | | | | 442,966 | | |
VMware, Inc., Class A (a) | | | 4,119 | | | | 233,012 | | |
Western Digital Corp. | | | 3,549 | | | | 213,117 | | |
Xerox Corp. | | | 31,032 | | | | 329,870 | | |
Xilinx, Inc. | | | 8,428 | | | | 395,863 | | |
| | | | 26,444,652 | | |
See notes to financial statements.
73
Victory Portfolios II
Victory CEMP US 500 Enhanced Volatility Wtd Index Fund | | Schedule of Portfolio Investments — continued
December 31, 2015 | |
(Unaudited)
Security Description | | Shares | | Value | |
Materials (5.4%): | |
Air Products & Chemicals, Inc. | | | 2,851 | | | $ | 370,944 | | |
Airgas, Inc. | | | 4,776 | | | | 660,616 | | |
Alcoa, Inc. | | | 26,277 | | | | 259,354 | | |
Ashland, Inc. | | | 4,017 | | | | 412,546 | | |
Avery Dennison Corp. | | | 6,991 | | | | 438,056 | | |
Ball Corp. | | | 5,530 | | | | 402,197 | | |
CF Industries Holdings, Inc. | | | 4,826 | | | | 196,949 | | |
Crown Holdings, Inc. (a) | | | 7,413 | | | | 375,839 | | |
E.I. du Pont de Nemours & Co. | | | 7,537 | | | | 501,964 | | |
Eastman Chemical Co. | | | 4,727 | | | | 319,120 | | |
Ecolab, Inc. | | | 4,094 | | | | 468,272 | | |
International Flavors & Fragrances, Inc. | | | 3,746 | | | | 448,171 | | |
International Paper Co. | | | 9,044 | | | | 340,959 | | |
LyondellBasell Industries NV, Class A | | | 3,226 | | | | 280,339 | | |
Martin Marietta Materials, Inc. | | | 1,607 | | | | 219,484 | | |
NewMarket Corp. | | | 1,008 | | | | 383,776 | | |
Newmont Mining Corp. | | | 12,729 | | | | 228,995 | | |
Nucor Corp. | | | 7,663 | | | | 308,819 | | |
Packaging Corp. of America | | | 4,676 | | | | 294,822 | | |
PPG Industries, Inc. | | | 4,482 | | | | 442,911 | | |
Praxair, Inc. | | | 5,224 | | | | 534,938 | | |
Sealed Air Corp. | | | 6,515 | | | | 290,569 | | |
The Dow Chemical Co. | | | 7,808 | | | | 401,956 | | |
The Mosaic Co. | | | 10,211 | | | | 281,721 | | |
The Sherwin-Williams Co. | | | 1,617 | | | | 419,773 | | |
The Valspar Corp. | | | 6,250 | | | | 518,438 | | |
W.R. Grace & Co. (a) | | | 3,775 | | | | 375,952 | | |
Westlake Chemical Corp. | | | 4,925 | | | | 267,526 | | |
| | | | 10,445,006 | | |
Telecommunication Services (0.2%): | |
CenturyLink, Inc. | | | 12,935 | | | | 325,445 | | |
Utilities (7.2%): | |
AES Corp. | | | 28,498 | | | | 272,726 | | |
Alliant Energy Corp. | | | 7,885 | | | | 492,418 | | |
Ameren Corp. | | | 10,938 | | | | 472,850 | | |
American Electric Power Co., Inc. | | | 8,061 | | | | 469,714 | | |
American Water Works Co., Inc. | | | 9,478 | | | | 566,311 | | |
Aqua America, Inc. | | | 17,535 | | | | 522,543 | | |
Atmos Energy Corp. | | | 8,034 | | | | 506,463 | | |
CenterPoint Energy, Inc. | | | 21,514 | | | | 394,997 | | |
CMS Energy Corp. | | | 12,180 | | | | 439,454 | | |
Consolidated Edison, Inc. | | | 7,371 | | | | 473,734 | | |
Dominion Resources, Inc. | | | 6,919 | | | | 468,001 | | |
DTE Energy Co. | | | 5,598 | | | | 448,904 | | |
Duke Energy Corp. | | | 6,410 | | | | 457,610 | | |
Edison International | | | 6,979 | | | | 413,227 | | |
Entergy Corp. | | | 6,647 | | | | 454,389 | | |
Eversource Energy | | | 9,193 | | | | 469,487 | | |
See notes to financial statements.
74
Victory Portfolios II
Victory CEMP US 500 Enhanced Volatility Wtd Index Fund | | Schedule of Portfolio Investments — continued
December 31, 2015 | |
(Unaudited)
Security Description | | Shares | | Value | |
Exelon Corp. | | | 11,597 | | | $ | 322,049 | | |
ITC Holdings Corp. | | | 12,251 | | | | 480,852 | | |
NextEra Energy, Inc. | | | 4,656 | | | | 483,712 | | |
OGE Energy Corp. | | | 15,374 | | | | 404,182 | | |
Pepco Holdings, Inc. | | | 14,347 | | | | 373,165 | | |
PG&E Corp. | | | 8,715 | | | | 463,551 | | |
Pinnacle West Capital Corp. | | | 7,581 | | | | 488,823 | | |
Public Service Enterprise Group, Inc. | | | 9,690 | | | | 374,906 | | |
SCANA Corp. | | | 7,953 | | | | 481,077 | | |
Sempra Energy | | | 4,748 | | | | 446,359 | | |
TECO Energy, Inc. | | | 12,263 | | | | 326,809 | | |
The Southern Co. | | | 11,090 | | | | 518,900 | | |
WEC Energy Group, Inc. | | | 8,447 | | | | 433,416 | | |
Westar Energy, Inc. | | | 12,016 | | | | 509,599 | | |
Xcel Energy, Inc. | | | 13,310 | | | | 477,962 | | |
| | | | 13,908,190 | | |
Total Common Stocks (Cost $180,397,050) | | | 192,127,016 | | |
Cash Equivalents (0.8%) | |
Citibank Money Market Deposit Account, 0.02% (b) | | | 1,453,405 | | | | 1,453,405 | | |
Total Cash Equivalents (Cost $1,453,405) | | | 1,453,405 | | |
Total Investments (Cost $181,850,455) — 99.9% | | | 193,580,421 | | |
Segregated cash with broker — 0.1% (c) | | | 202,913 | | |
Liabilities in excess of other assets — (0.0)% (d) | | | (72,161 | ) | |
NET ASSETS — 100.00% | | $ | 193,711,173 | | |
(a) Non-income producing security.
(b) Rate periodically changes. Rate disclosed is the daily yield on December 31, 2015.
(c) Segregated cash with broker represents collateral for futures contracts.
(d) Less than 0.05% of net assets.
LLC — Limited Liability Co.
LP — Limited Partnership
PLC — Public Liability Co.
Futures Contracts Purchased
| | | Number
of
Contracts | | Expiration
Date | | Notional
Amount
at Value | | Unrealized
Depreciation | |
E-Mini S&P 500 Futures | | | 16 | | | 3/21/16 | | $ | 1,628,320 | | | $ | (5,530 | ) | |
See notes to financial statements.
75
Victory Portfolios II
Victory CEMP International Enhanced Volatility Wtd Index Fund | | Schedule of Portfolio Investments
December 31, 2015 | |
(Unaudited)
Security Description | | Shares | | Fair
Value(a) | |
Common Stocks (97.7%) | |
Australia (4.5%): | |
Consumer Staples (0.5%): | |
Wesfarmers Ltd. | | | 3,581 | | | $ | 107,931 | | |
Woolworths Ltd. | | | 3,702 | | | | 65,665 | | |
| | | | 173,596 | | |
Energy (0.3%): | |
Oil Search Ltd. | | | 8,742 | | | | 42,539 | | |
Woodside Petroleum Ltd. | | | 2,981 | | | | 62,089 | | |
| | | | 104,628 | | |
Financials (2.0%): | |
AMP Ltd. | | | 17,051 | | | | 71,825 | | |
Australia & New Zealand Banking Group Ltd. | | | 3,862 | | | | 77,913 | | |
Commonwealth Bank of Australia | | | 1,579 | | | | 97,594 | | |
Insurance Australia Group Ltd. | | | 19,804 | | | | 79,512 | | |
Macquarie Group Ltd. | | | 1,298 | | | | 77,629 | | |
National Australia Bank Ltd. | | | 3,907 | | | | 85,235 | | |
QBE Insurance Group Ltd. | | | 6,864 | | | | 62,412 | | |
Suncorp Group Ltd. | | | 10,194 | | | | 89,479 | | |
Westpac Banking Corp. | | | 3,462 | | | | 83,895 | | |
| | | | 725,494 | | |
Health Care (0.5%): | |
CSL Ltd. | | | 1,216 | | | | 92,682 | | |
Ramsay Health Care Ltd. | | | 1,726 | | | | 84,848 | | |
| | | | 177,530 | | |
Industrials (0.5%): | |
Aurizon Holdings Ltd. | | | 20,912 | | | | 66,369 | | |
Brambles Ltd. | | | 11,785 | | | | 98,672 | | |
| | | | 165,041 | | |
Materials (0.4%): | |
Amcor Ltd. | | | 8,005 | | | | 77,749 | | |
Newcrest Mining Ltd. (b) | | | 5,321 | | | | 50,335 | | |
| | | | 128,084 | | |
Telecommunication Services (0.3%): | |
Telstra Corp. Ltd. | | | 26,061 | | | | 105,875 | | |
| | | | 1,580,248 | | |
Austria (0.1%): | |
Materials (0.1%): | |
Voestalpine AG | | | 1,395 | | | | 42,665 | | |
Belgium (2.1%): | |
Consumer Discretionary (0.2%): | |
Telenet Group Holding NV (b) | | | 1,389 | | | | 75,057 | | |
See notes to financial statements.
76
Victory Portfolios II
Victory CEMP International Enhanced Volatility Wtd Index Fund | | Schedule of Portfolio Investments — continued
December 31, 2015 | |
(Unaudited)
Security Description | | Shares | | Fair
Value(a) | |
Consumer Staples (0.5%): | |
Anheuser-Busch InBev NV | | | 614 | | | $ | 76,400 | | |
Colruyt SA | | | 1,935 | | | | 99,530 | | |
| | | | 175,930 | | |
Financials (0.8%): | |
Ageas | | | 2,393 | | | | 111,053 | | |
Groupe Bruxelles Lambert SA | | | 1,252 | | | | 107,116 | | |
KBC Groep NV | | | 1,034 | | | | 64,643 | | |
| | | | 282,812 | | |
Health Care (0.2%): | |
UCB SA | | | 838 | | | | 75,630 | | |
Materials (0.2%): | |
Solvay SA | | | 627 | | | | 66,910 | | |
Telecommunication Services (0.2%): | |
Proximus SADP | | | 2,081 | | | | 67,709 | | |
| | | | 744,048 | | |
Bermuda (0.4%): | |
Financials (0.2%): | |
Hongkong Land Holdings Ltd. | | | 10,200 | | | | 71,224 | | |
Industrials (0.2%): | |
Jardine Matheson Holdings Ltd. | | | 1,600 | | | | 77,484 | | |
| | | | 148,708 | | |
Canada (9.2%): | |
Consumer Discretionary (1.1%): | |
Canadian Tire Corp. Ltd. | | | 893 | | | | 76,268 | | |
Dollarama, Inc. | | | 1,457 | | | | 84,187 | | |
Gildan Activewear, Inc. | | | 2,466 | | | | 70,121 | | |
Magna International, Inc. | | | 1,307 | | | | 53,017 | | |
Shaw Communications, Inc., Class B | | | 6,093 | | | | 104,816 | | |
| | | | 388,409 | | |
Consumer Staples (1.4%): | |
Alimentation Couche-Tard, Inc., Class B | | | 1,315 | | | | 57,894 | | |
Empire Co. Ltd. | | | 4,201 | | | | 78,159 | | |
George Weston Ltd. | | | 1,139 | | | | 88,041 | | |
Loblaw Cos. Ltd. | | | 1,976 | | | | 93,323 | | |
Metro, Inc. | | | 3,510 | | | | 98,285 | | |
Saputo, Inc. | | | 3,610 | | | | 86,369 | | |
| | | | 502,071 | | |
Energy (0.7%): | |
Imperial Oil Ltd. | | | 2,020 | | | | 65,820 | | |
Inter Pipeline Ltd. | | | 2,961 | | | | 47,534 | | |
Pembina Pipeline Corp. | | | 2,355 | | | | 51,321 | | |
TransCanada Corp. | | | 2,545 | | | | 83,129 | | |
| | | | 247,804 | | |
See notes to financial statements.
77
Victory Portfolios II
Victory CEMP International Enhanced Volatility Wtd Index Fund | | Schedule of Portfolio Investments — continued
December 31, 2015 | |
(Unaudited)
Security Description | | Shares | | Fair
Value(a) | |
Financials (3.5%): | |
Bank of Montreal | | | 1,987 | | | $ | 112,140 | | |
Brookfield Asset Management, Inc. | | | 2,667 | | | | 84,145 | | |
Canadian Imperial Bank of Commerce | | | 1,408 | | | | 92,805 | | |
Great-West Lifeco, Inc. | | | 4,015 | | | | 100,208 | | |
Intact Financial Corp. | | | 1,610 | | | | 103,198 | | |
Manulife Financial Corp. | | | 5,380 | | | | 80,651 | | |
National Bank of Canada | | | 2,616 | | | | 76,220 | | |
Power Corp. of Canada | | | 4,134 | | | | 86,475 | | |
Power Financial Corp. | | | 3,938 | | | | 90,544 | | |
Royal Bank of Canada | | | 2,024 | | | | 108,478 | | |
Sun Life Financial, Inc. | | | 2,412 | | | | 75,228 | | |
The Bank of Nova Scotia | | | 2,327 | | | | 94,140 | | |
The Toronto-Dominion Bank | | | 2,752 | | | | 107,892 | | |
| | | | 1,212,124 | | |
Industrials (0.4%): | |
Canadian National Railway Co. | | | 1,541 | | | | 86,156 | | |
Canadian Pacific Railway Ltd. | | | 462 | | | | 59,016 | | |
| | | | 145,172 | | |
Information Technology (0.4%): | |
CGI Group, Inc. (b) | | | 1,879 | | | | 75,241 | | |
Constellation Software, Inc. | | | 144 | | | | 60,044 | | |
| | | | 135,285 | | |
Materials (0.5%): | |
Agrium, Inc. | | | 689 | | | | 61,589 | | |
Franco-Nevada Corp. | | | 1,089 | | | | 49,826 | | |
Potash Corp. of Saskatchewan, Inc. | | | 3,268 | | | | 55,982 | | |
| | | | 167,397 | | |
Telecommunication Services (0.8%): | |
BCE, Inc. | | | 2,646 | | | | 102,244 | | |
Rogers Communications, Inc. | | | 2,892 | | | | 99,752 | | |
TELUS Corp. | | | 3,275 | | | | 90,569 | | |
| | | | 292,565 | | |
Utilities (0.4%): | |
Canadian Utilities Ltd., Class A | | | 2,909 | | | | 67,159 | | |
Fortis, Inc. | | | 3,072 | | | | 83,067 | | |
| | | | 150,226 | | |
| | | | 3,241,053 | | |
Denmark (1.7%): | |
Consumer Discretionary (0.1%): | |
Pandora A/S | | | 417 | | | | 52,586 | | |
Health Care (0.4%): | |
Coloplast A/S | | | 968 | | | | 78,167 | | |
Novo Nordisk A/S, Class B | | | 1,089 | | | | 63,062 | | |
| | | | 141,229 | | |
See notes to financial statements.
78
Victory Portfolios II
Victory CEMP International Enhanced Volatility Wtd Index Fund | | Schedule of Portfolio Investments — continued
December 31, 2015 | |
(Unaudited)
Security Description | | Shares | | Fair
Value(a) | |
Industrials (0.8%): | |
A.P. Moeller-Maersk A/S, Class B | | | 36 | | | $ | 46,963 | | |
DSV A/S | | | 2,199 | | | | 86,576 | | |
ISS A/S | | | 2,055 | | | | 74,089 | | |
Vestas Wind Systems A/S | | | 868 | | | | 60,631 | | |
| | | | 268,259 | | |
Materials (0.4%): | |
Christian Hansen Holding A/S | | | 1,372 | | | | 85,834 | | |
Novozymes A/S, B Shares | | | 1,366 | | | | 65,414 | | |
| | | | 151,248 | | |
| | | | 613,322 | | |
Finland (1.1%): | |
Financials (0.2%): | |
Sampo Oyj, Class A | | | 1,627 | | | | 82,611 | | |
Industrials (0.4%): | |
Kone Oyj, Class B | | | 1,513 | | | | 64,053 | | |
Wartsila Oyj ABP | | | 1,667 | | | | 76,102 | | |
| | | | 140,155 | | |
Information Technology (0.1%): | |
Nokia Oyj | | | 7,475 | | | | 52,875 | | |
Materials (0.2%): | |
UPM-Kymmene Oyj | | | 3,331 | | | | 61,833 | | |
Utilities (0.2%): | |
Fortum Oyj | | | 3,953 | | | | 59,549 | | |
| | | | 397,023 | | |
France (9.1%): | |
Consumer Discretionary (2.5%): | |
Accor SA | | | 1,303 | | | | 56,425 | | |
Christian Dior SE | | | 348 | | | | 59,104 | | |
Compagnie Generale DES Etablissements Michelin | | | 721 | | | | 68,617 | | |
Eutelsat Communications SA | | | 2,797 | | | | 83,732 | | |
Hermes International | | | 180 | | | | 60,836 | | |
JCDecaux SA | | | 2,059 | | | | 78,921 | | |
Kering | | | 387 | | | | 66,158 | | |
LVMH Moet Hennessy Louis Vuitton SA | | | 329 | | | | 51,669 | | |
Publicis Groupe SA | | | 1,037 | | | | 68,946 | | |
Renault SA | | | 549 | | | | 54,945 | | |
Sodexo SA | | | 1,113 | | | | 108,722 | | |
Valeo SA | | | 389 | | | | 59,966 | | |
Vivendi Universal SA | | | 3,232 | | | | 69,405 | | |
| | | | 887,446 | | |
Consumer Staples (1.0%): | |
Carrefour SA | | | 2,149 | | | | 62,011 | | |
Casino Guichard Perrachon SA | | | 1,147 | | | | 52,687 | | |
Danone SA | | | 1,371 | | | | 92,631 | | |
See notes to financial statements.
79
Victory Portfolios II
Victory CEMP International Enhanced Volatility Wtd Index Fund | | Schedule of Portfolio Investments — continued
December 31, 2015 | |
(Unaudited)
Security Description | | Shares | | Fair
Value(a) | |
L'Oreal SA | | | 420 | | | $ | 70,636 | | |
Pernod Ricard SA | | | 668 | | | | 76,171 | | |
| | | | 354,136 | | |
Financials (1.0%): | |
AXA SA | | | 2,463 | | | | 67,289 | | |
BNP Paribas SA | | | 930 | | | | 52,610 | | |
CNP Assurances | | | 5,200 | | | | 70,135 | | |
Credit Agricole SA | | | 4,032 | | | | 47,507 | | |
Natixis SA | | | 9,127 | | | | 51,625 | | |
Societe Generale SA | | | 1,167 | | | | 53,771 | | |
| | | | 342,937 | | |
Health Care (0.4%): | |
Essilor International SA | | | 529 | | | | 65,924 | | |
Sanofi | | | 658 | | | | 56,068 | | |
| | | | 121,992 | | |
Industrials (2.4%): | |
Aeroports de Paris | | | 733 | | | | 85,287 | | |
Airbus Group SE | | | 852 | | | | 57,406 | | |
Bollore SA | | | 10,997 | | | | 51,235 | | |
Bureau Veritas SA | | | 3,545 | | | | 70,647 | | |
Compagnie de Saint-Gobain | | | 1,336 | | | | 57,888 | | |
Eiffage SA | | | 880 | | | | 56,865 | | |
Groupe Eurotunnel SE | | | 5,820 | | | | 72,397 | | |
Legrand SA | | | 1,203 | | | | 68,039 | | |
Schneider Electric SA | | | 1,073 | | | | 60,942 | | |
Societe BIC SA | | | 436 | | | | 71,736 | | |
Thales SA | | | 1,052 | | | | 78,731 | | |
Vinci SA | | | 1,055 | | | | 67,611 | | |
Zodiac Aerospace | | | 1,883 | | | | 44,829 | | |
| | | | 843,613 | | |
Information Technology (0.8%): | |
Atos SE | | | 900 | | | | 75,547 | | |
Cap Gemini SA | | | 698 | | | | 64,756 | | |
Dassault Systemes SA | | | 1,019 | | | | 81,438 | | |
Ingenico Group | | | 469 | | | | 59,190 | | |
| | | | 280,931 | | |
Materials (0.2%): | |
Air Liquide SA | | | 597 | | | | 67,014 | | |
Telecommunication Services (0.3%): | |
Iliad SA | | | 252 | | | | 60,063 | | |
Orange SA | | | 3,356 | | | | 56,124 | | |
| | | | 116,187 | | |
Utilities (0.5%): | |
Electricite de France SA | | | 3,618 | | | | 53,277 | | |
Suez Environnement Co. | | | 2,823 | | | | 52,792 | | |
See notes to financial statements.
80
Victory Portfolios II
Victory CEMP International Enhanced Volatility Wtd Index Fund | | Schedule of Portfolio Investments — continued
December 31, 2015 | |
(Unaudited)
Security Description | | Shares | | Fair
Value(a) | |
Veolia Environnement SA | | | 2,980 | | | $ | 70,693 | | |
| | | | 176,762 | | |
| | | | 3,191,018 | | |
Germany (5.9%): | |
Consumer Discretionary (1.4%): | |
Bayerische Motoren Werke AG | | | 597 | | | | 62,886 | | |
Continental AG | | | 250 | | | | 60,469 | | |
Daimler AG, Registered Shares | | | 733 | | | | 61,237 | | |
Hugo Boss AG | | | 612 | | | | 50,489 | | |
Kabel Deutschland Holding AG | | | 732 | | | | 90,437 | | |
ProSiebenSat.1 Media SE | | | 1,249 | | | | 63,005 | | |
Volkswagen AG | | | 300 | | | | 46,094 | | |
Zalando SE (b) | | | 1,332 | | | | 52,599 | | |
| | | | 487,216 | | |
Consumer Staples (0.2%): | |
Beiersdorf AG | | | 933 | | | | 84,790 | | |
Financials (1.4%): | |
Allianz SE | | | 480 | | | | 84,602 | | |
Deutsche Boerse AG | | | 821 | | | | 72,157 | | |
Hannover Rueck SE | | | 754 | | | | 86,087 | | |
Muenchener Rueckversicherungs-Gesellschaft AG | | | 516 | | | | 102,793 | | |
Talanx AG | | | 2,619 | | | | 80,535 | | |
Vonovia SE | | | 1,773 | | | | 54,766 | | |
| | | | 480,940 | | |
Health Care (0.8%): | |
Bayer AG | | | 436 | | | | 54,445 | | |
Fresenius Medical Care AG & Co. KGaA | | | 894 | | | | 75,117 | | |
Fresenius SE & Co. KGaA | | | 911 | | | | 64,884 | | |
Merck KGaA | | | 715 | | | | 69,217 | | |
| | | | 263,663 | | |
Industrials (0.6%): | |
Brenntag AG | | | 1,283 | | | | 66,845 | | |
Deutsche Post AG | | | 2,613 | | | | 73,044 | | |
Siemens AG | | | 794 | | | | 76,806 | | |
| | | | 216,695 | | |
Information Technology (0.7%): | |
Infineon Technologies AG | | | 5,457 | | | | 79,545 | | |
SAP SE | | | 1,160 | | | | 92,037 | | |
United Internet AG | | | 1,177 | | | | 64,702 | | |
| | | | 236,284 | | |
Materials (0.8%): | |
BASF SE | | | 814 | | | | 62,000 | | |
Evonik Industries AG | | | 1,889 | | | | 62,474 | | |
K+S AG | | | 961 | | | | 24,494 | | |
See notes to financial statements.
81
Victory Portfolios II
Victory CEMP International Enhanced Volatility Wtd Index Fund | | Schedule of Portfolio Investments — continued
December 31, 2015 | |
(Unaudited)
Security Description | | Shares | | Fair
Value(a) | |
Linde AG | | | 448 | | | $ | 64,708 | | |
Symrise AG | | | 1,156 | | | | 76,515 | | |
| | | | 290,191 | | |
| | | | 2,059,779 | | |
Hong Kong (5.2%): | |
Consumer Discretionary (0.5%): | |
Chow Tai Fook Jewellery Group Ltd. | | | 60,000 | | | | 38,671 | | |
Galaxy Entertainment Group Ltd. | | | 12,000 | | | | 37,601 | | |
Michael Kors Holdings Ltd. (b) | | | 857 | | | | 34,331 | | |
Techtronic Industries Co. Ltd. | | | 15,000 | | | | 60,726 | | |
| | | | 171,329 | | |
Consumer Staples (0.1%): | |
WH Group Ltd. (b) | | | 84,000 | | | | 46,753 | | |
Financials (2.0%): | |
BOC Hong Kong Holdings Ltd. | | | 18,000 | | | | 54,776 | | |
China Overseas Land & Investment Ltd. | | | 14,000 | | | | 48,741 | | |
China Taiping Insurance Holdings Co. Ltd. (b) | | | 9,800 | | | | 30,082 | | |
Goldin Financial Holdings Ltd. (b) | | | 8,000 | | | | 15,663 | | |
Hong Kong Exchanges and Clearing Ltd. | | | 1,510 | | | | 38,468 | | |
New World Development Co. Ltd. | | | 71,000 | | | | 69,720 | | |
Sino Land Co. Ltd. | | | 44,000 | | | | 64,099 | | |
Swire Pacific Ltd., Class A | | | 8,000 | | | | 89,364 | | |
Swire Properties Ltd. | | | 25,000 | | | | 71,886 | | |
The Bank of East Asia Ltd. | | | 25,400 | | | | 94,224 | | |
The Wharf Holdings Ltd. | | | 12,000 | | | | 66,164 | | |
Wheelock & Co. Ltd. | | | 13,000 | | | | 54,552 | | |
| | | | 697,739 | | |
Industrials (1.0%): | |
Beijing Enterprises Holdings Ltd. | | | 10,000 | | | | 60,285 | | |
Cathay Pacific Airways Ltd. | | | 34,000 | | | | 58,504 | | |
CITIC Ltd. | | | 34,000 | | | | 59,952 | | |
Jardine Strategic Holdings Ltd. | | | 2,900 | | | | 79,047 | | |
MTR Corp. Ltd. | | | 20,000 | | | | 98,759 | | |
| | | | 356,547 | | |
Information Technology (0.0%): (c) | |
Hanergy Thin Film Power Group Ltd. (b) (d) | | | 82,000 | | | | 1,799 | | |
Telecommunication Services (0.3%): | |
China Mobile Ltd. | | | 4,500 | | | | 50,654 | | |
China Unicom Hong Kong Ltd. | | | 34,000 | | | | 41,074 | | |
| | | | 91,728 | | |
Utilities (1.3%): | |
China Gas Holdings Ltd. | | | 28,000 | | | | 40,234 | | |
China Resources Power Holdings Co. Ltd. | | | 18,000 | | | | 34,826 | | |
CLP Holdings Ltd. | | | 15,500 | | | | 131,382 | | |
Guangdong Investment Ltd. | | | 34,000 | | | | 48,017 | | |
See notes to financial statements.
82
Victory Portfolios II
Victory CEMP International Enhanced Volatility Wtd Index Fund | | Schedule of Portfolio Investments — continued
December 31, 2015 | |
(Unaudited)
Security Description | | Shares | | Fair
Value (a) | |
Hong Kong & China Gas Co. Ltd. | | | 66,440 | | | $ | 130,030 | | |
Power Assets Holdings Ltd. | | | 9,500 | | | | 87,095 | | |
| | | | 471,584 | | |
| | | | 1,837,479 | | |
Ireland (2.2%): | |
Consumer Discretionary (0.2%): | |
WPP PLC | | | 3,887 | | | | 89,395 | | |
Consumer Staples (0.3%): | |
Kerry Group PLC | | | 1,169 | | | | 97,575 | | |
Financials (0.4%): | |
Bank of Ireland (b) | | | 119,908 | | | | 44,256 | | |
XL Group PLC | | | 2,951 | | | | 115,620 | | |
| | | | 159,876 | | |
Health Care (0.2%): | |
Jazz Pharmaceuticals PLC (b) | | | 169 | | | | 23,755 | | |
Shire PLC | | | 827 | | | | 56,730 | | |
| | | | 80,485 | | |
Industrials (0.5%): | |
DCC PLC | | | 955 | | | | 79,771 | | |
Experian PLC | | | 4,740 | | | | 83,765 | | |
| | | | 163,536 | | |
Information Technology (0.3%): | |
Accenture PLC, Class A | | | 873 | | | | 91,228 | | |
Materials (0.3%): | |
CRH PLC | | | 1,750 | | | | 50,659 | | |
Smurfit Kappa Group PLC | | | 1,717 | | | | 44,182 | | |
| | | | 94,841 | | |
| | | | 776,936 | | |
Israel (0.6%): | |
Health Care (0.2%): | |
Teva Pharmaceutical Industries Ltd. | | | 1,013 | | | | 66,106 | | |
Information Technology (0.2%): | |
Check Point Software Technologies Ltd. (b) | | | 1,009 | | | | 82,112 | | |
Materials (0.2%): | |
Israel Chemicals Ltd. | | | 12,983 | | | | 52,716 | | |
| | | | 200,934 | | |
Italy (1.9%): | |
Consumer Discretionary (0.3%): | |
Luxottica Group SpA | | | 868 | | | | 56,556 | | |
Prada SpA | | | 16,290 | | | | 50,543 | | |
| | | | 107,099 | | |
See notes to financial statements.
83
Victory Portfolios II
Victory CEMP International Enhanced Volatility Wtd Index Fund | | Schedule of Portfolio Investments — continued
December 31, 2015 | |
(Unaudited)
Security Description | | Shares | | Fair
Value(a) | |
Financials (0.8%): | |
Assicurazioni Generali SpA | | | 3,593 | | | $ | 65,623 | | |
EXOR SpA | | | 1,356 | | | | 61,536 | | |
Intesa Sanpaolo SpA | | | 13,574 | | | | 45,073 | | |
Mediobanca SpA | | | 5,241 | | | | 50,234 | | |
UniCredit SpA | | | 7,267 | | | | 40,172 | | |
| | | | 262,638 | | |
Industrials (0.3%): | |
Atlantia SpA | | | 2,479 | | | | 65,581 | | |
Finmeccanica SpA (b) | | | 3,729 | | | | 51,842 | | |
| | | | 117,423 | | |
Utilities (0.5%): | |
Snam SpA | | | 14,281 | | | | 74,522 | | |
Terna Rete Elettrica Nazionale SpA | | | 17,267 | | | | 88,790 | | |
| | | | 163,312 | | |
| | | | 650,472 | | |
Japan (19.8%): | |
Consumer Discretionary (3.6%): | |
Aisin Seiki Co. Ltd. | | | 1,626 | | | | 69,989 | | |
Bridgestone Corp. | | | 1,958 | | | | 67,171 | | |
Denso Corp. | | | 1,486 | | | | 71,018 | | |
Dentsu, Inc. | | | 800 | | | | 43,775 | | |
Fuji Heavy Industries Ltd. | | | 1,665 | | | | 68,600 | | |
Honda Motor Co. Ltd. | | | 1,943 | | | | 62,109 | | |
Isuzu Motors Ltd. | | | 5,265 | | | | 56,725 | | |
Mazda Motor Corp. | | | 3,500 | | | | 72,231 | | |
Mitsubishi Motors Corp. | | | 7,500 | | | | 63,462 | | |
Nissan Motor Co. Ltd. | | | 6,949 | | | | 72,770 | | |
Nitori Holdings Co. Ltd. | | | 600 | | | | 50,395 | | |
Oriental Land Co. Ltd. | | | 852 | | | | 51,550 | | |
Panasonic Corp. | | | 5,600 | | | | 56,777 | | |
Rakuten, Inc. | | | 3,600 | | | | 41,469 | | |
Sekisui House Ltd. | | | 4,597 | | | | 77,303 | | |
Shimano, Inc. | | | 440 | | | | 67,574 | | |
Sumitomo Electric Industries Ltd. | | | 4,492 | | | | 63,439 | | |
Suzuki Motor Corp. | | | 1,605 | | | | 48,772 | | |
Toyota Industries Corp. | | | 1,181 | | | | 63,160 | | |
Toyota Motor Corp. | | | 1,287 | | | | 79,262 | | |
| | | | 1,247,551 | | |
Consumer Staples (2.2%): | |
Aeon Co. Ltd. | | | 4,100 | | | | 63,179 | | |
Ajinomoto Co., Inc. | | | 3,000 | | | | 71,036 | | |
Asahi Group Holdings Ltd. | | | 2,300 | | | | 72,009 | | |
Japan Tobacco, Inc. | | | 1,587 | | | | 58,272 | | |
Kao Corp. | | | 1,393 | | | | 71,593 | | |
Kirin Holdings Co. Ltd. | | | 5,000 | | | | 67,894 | | |
MEIJI Holdings Co. Ltd. | | | 600 | | | | 49,566 | | |
See notes to financial statements.
84
Victory Portfolios II
Victory CEMP International Enhanced Volatility Wtd Index Fund | | Schedule of Portfolio Investments — continued
December 31, 2015 | |
(Unaudited)
Security Description | | Shares | | Fair
Value(a) | |
Seven & i Holdings Co. Ltd. | | | 1,644 | | | $ | 75,279 | | |
Shiseido Co. Ltd. | | | 2,300 | | | | 47,728 | | |
Suntory Beverage & Food Ltd. | | | 1,800 | | | | 78,807 | | |
Uni-Charm Corp. | | | 3,200 | | | | 65,358 | | |
Yakult Honsha Co. Ltd. | | | 963 | | | | 47,140 | | |
| | | | 767,861 | | |
Financials (3.2%): | |
Daito Trust Construction Co. Ltd. | | | 774 | | | | 89,416 | | |
Daiwa House Industry Co. Ltd. | | | 2,600 | | | | 74,750 | | |
Daiwa Securities Group, Inc. | | | 10,000 | | | | 61,145 | | |
Japan Exchange Group, Inc. | | | 3,400 | | | | 53,155 | | |
Mitsubishi UFJ Financial Group, Inc. | | | 8,784 | | | | 54,417 | | |
Mitsui Fudosan Co. Ltd. | | | 1,772 | | | | 44,479 | | |
Mizuho Financial Group, Inc. | | | 32,752 | | | | 65,512 | | |
Nomura Holdings, Inc. | | | 11,269 | | | | 62,777 | | |
ORIX Corp. | | | 4,040 | | | | 56,682 | | |
Resona Holdings, Inc. | | | 12,931 | | | | 62,804 | | |
Sompo Japan Nipponkoa Holdings, Inc. | | | 1,500 | | | | 49,258 | | |
Sony Financial Holdings, Inc. | | | 3,500 | | | | 62,613 | | |
Sumitomo Mitsui Financial Group, Inc. | | | 1,594 | | | | 60,167 | | |
Sumitomo Mitsui Trust Holdings, Inc. | | | 16,084 | | | | 60,923 | | |
Sumitomo Realty & Development | | | 1,564 | | | | 44,646 | | |
T&D Holdings, Inc. | | | 3,800 | | | | 50,142 | | |
The Bank of Yokohama Ltd. | | | 9,000 | | | | 55,173 | | |
The Dai-ichi Life Insurance Co. Ltd. | | | 2,700 | | | | 44,928 | | |
Tokio Marine Holdings, Inc. | | | 1,400 | | | | 54,081 | | |
| | | | 1,107,068 | | |
Health Care (1.6%): | |
Astellas Pharma, Inc. | | | 4,900 | | | | 69,764 | | |
Chugai Pharmaceutical Co. Ltd. | | | 1,475 | | | | 51,420 | | |
Daiichi Sankyo Co. Ltd. | | | 3,400 | | | | 70,184 | | |
Eisai Co. Ltd. | | | 569 | | | | 37,644 | | |
Hoya Corp. | | | 1,602 | | | | 65,518 | | |
Kyowa Hakko Kirin Co. Ltd. | | | 3,000 | | | | 47,210 | | |
M3, Inc. | | | 2,600 | | | | 53,916 | | |
Otsuka Holdings Co. Ltd. | | | 1,724 | | | | 61,259 | | |
Sysmex Corp. | | | 900 | | | | 57,737 | | |
Terumo Corp. | | | 2,000 | | | | 61,995 | | |
| | | | 576,647 | | |
Industrials (4.4%): | |
Asahi Glass Co. Ltd. | | | 10,000 | | | | 57,296 | | |
Central Japan Railway Co. | | | 288 | | | | 51,136 | | |
Daikin Industries Ltd. | | | 1,100 | | | | 80,114 | | |
FANUC Corp. | | | 230 | | | | 39,632 | | |
Hankyu Hanshin Holdings, Inc. | | | 13,000 | | | | 84,509 | | |
ITOCHU Corp. | | | 4,812 | | | | 56,926 | | |
Japan Airlines Co. Ltd. | | | 1,700 | | | | 60,855 | | |
Komatsu Ltd. | | | 3,868 | | | | 63,298 | | |
See notes to financial statements.
85
Victory Portfolios II
Victory CEMP International Enhanced Volatility Wtd Index Fund | | Schedule of Portfolio Investments — continued
December 31, 2015 | |
(Unaudited)
Security Description | | Shares | | Fair
Value(a) | |
Kubota Corp. | | | 4,105 | | | $ | 63,425 | | |
Makita Corp. | | | 900 | | | | 51,870 | | |
Mitsubishi Corp. | | | 3,568 | | | | 59,354 | | |
Mitsubishi Electric Corp. | | | 7,266 | | | | 76,280 | | |
Mitsubishi Heavy Industries Ltd. | | | 15,000 | | | | 65,596 | | |
Mitsui & Co. Ltd. | | | 6,154 | | | | 73,131 | | |
NGK Insulators Ltd. | | | 2,000 | | | | 45,086 | | |
Nidec Corp. | | | 800 | | | | 58,020 | | |
Recruit Holdings Co. Ltd. | | | 2,200 | | | | 64,674 | | |
Secom Co. Ltd. | | | 1,200 | | | | 81,334 | | |
Seibu Holdings, Inc. | | | 2,500 | | | | 51,062 | | |
Shimizu Corp. | | | 8,000 | | | | 65,242 | | |
SMC Corp. | | | 233 | | | | 60,526 | | |
TAISEI Corp. | | | 12,000 | | | | 79,053 | | |
Tokyu Corp. | | | 9,949 | | | | 78,631 | | |
Toshiba Corp. | | | 17,000 | | | | 34,943 | | |
Toyota Tsusho Corp. | | | 2,658 | | | | 62,186 | | |
| | | | 1,564,179 | | |
Information Technology (2.6%): | |
Canon, Inc. | | | 2,716 | | | | 82,169 | | |
FUJIFILM Holdings Corp. | | | 1,747 | | | | 72,916 | | |
Hitachi Ltd. | | | 12,699 | | | | 71,966 | | |
Keyence Corp. | | | 197 | | | | 108,286 | | |
Kyocera Corp. | | | 1,280 | | | | 59,451 | | |
Murata Manufacturing Co. Ltd. | | | 300 | | | | 43,170 | | |
Nomura Research Institute Ltd. | | | 1,920 | | | | 73,744 | | |
NTT Data Corp. | | | 1,500 | | | | 72,528 | | |
Omron Corp. | | | 1,900 | | | | 63,367 | | |
Renesas Electronics Corp. (b) | | | 8,100 | | | | 50,874 | | |
Ricoh Co. Ltd. | | | 6,500 | | | | 66,938 | | |
TDK Corp. | | | 800 | | | | 51,242 | | |
Tokyo Electron Ltd. | | | 800 | | | | 48,474 | | |
Yahoo Japan Corp. | | | 13,200 | | | | 53,663 | | |
| | | | 918,788 | | |
Materials (1.2%): | |
Asahi Kasei Corp. | | | 8,578 | | | | 58,013 | | |
JFE Holdings, Inc. | | | 3,100 | | | | 48,683 | | |
Nippon Steel & Sumitomo Metal | | | 3,000 | | | | 59,354 | | |
Nitto Denko Corp. | | | 865 | | | | 63,158 | | |
Shin-Etsu Chemical Co. Ltd. | | | 1,298 | | | | 70,576 | | |
Sumitomo Chemical Co. Ltd. | | | 9,000 | | | | 51,694 | | |
Toray Industries, Inc. | | | 7,838 | | | | 72,844 | | |
| | | | 424,322 | | |
Telecommunication Services (0.8%): | |
KDDI Corp. | | | 2,501 | | | | 64,960 | | |
Nippon Telegraph & Telephone Corp. | | | 1,712 | | | | 68,143 | | |
NTT DOCOMO, Inc. | | | 3,400 | | | | 69,748 | | |
See notes to financial statements.
86
Victory Portfolios II
Victory CEMP International Enhanced Volatility Wtd Index Fund | | Schedule of Portfolio Investments — continued
December 31, 2015 | |
(Unaudited)
Security Description | | Shares | | Fair
Value(a) | |
SoftBank Group Corp. | | | 1,475 | | | $ | 74,453 | | |
| | | | 277,304 | | |
Utilities (0.2%): | |
Osaka Gas Co. Ltd. | | | 21,000 | | | | 75,860 | | |
| | | | 6,959,580 | | |
Netherlands (2.6%): | |
Consumer Discretionary (0.5%): | |
RELX NV | | | 5,087 | | | | 85,665 | | |
Wolters Kluwer NV | | | 2,222 | | | | 74,612 | | |
| | | | 160,277 | | |
Consumer Staples (0.4%): | |
Heineken NV | | | 966 | | | | 82,309 | | |
Koninklijke Ahold NV | | | 3,348 | | | | 70,611 | | |
| | | | 152,920 | | |
Financials (0.4%): | |
Aegon NV | | | 9,935 | | | | 56,180 | | |
NN Group NV | | | 2,917 | | | | 102,906 | | |
| | | | 159,086 | | |
Industrials (0.7%): | |
AerCap Holdings NV (b) | | | 1,667 | | | | 71,948 | | |
Boskalis Westminster | | | 1,145 | | | | 46,701 | | |
Randstad Holding NV | | | 955 | | | | 59,461 | | |
Sensata Technologies Holding NV (b) | | | 1,660 | | | | 76,459 | | |
| | | | 254,569 | | |
Information Technology (0.3%): | |
| ASML Holding NV | | | 557 | | | | 49,483 | | |
Gemalto NV | | | 887 | | | | 53,215 | | |
| | | | 102,698 | | |
Materials (0.3%): | |
AKZO Nobel NV | | | 1,012 | | | | 67,611 | | |
OCI NV | | | 1,355 | | | | 33,453 | | |
| | | | 101,064 | | |
| | | | 930,614 | | |
Norway (0.8%): | |
Financials (0.4%): | |
DNB ASA | | | 4,908 | | | | 60,494 | | |
Gjensidige Forsikring ASA | | | 6,028 | | | | 96,512 | | |
| | | | 157,006 | | |
Materials (0.2%): | |
Yara International ASA | | | 1,469 | | | | 63,201 | | |
Telecommunication Services (0.2%): | |
Telenor ASA | | | 3,669 | | | | 61,178 | | |
| | | | 281,385 | | |
See notes to financial statements.
87
Victory Portfolios II
Victory CEMP International Enhanced Volatility Wtd Index Fund | | Schedule of Portfolio Investments — continued
December 31, 2015 | |
(Unaudited)
Security Description | | Shares | | Fair
Value(a) | |
Portugal (0.3%): | |
Consumer Staples (0.1%): | |
Jeronimo Martins SGPS SA | | | 3,394 | | | $ | 44,158 | | |
Utilities (0.2%): | |
EDP — Energias de Portugal SA | | | 18,869 | | | | 67,982 | | |
| | | | 112,140 | | |
Singapore (3.0%): | |
Consumer Discretionary (0.3%): | |
Jardine Cycle & Carriage Ltd. | | | 3,571 | | | | 87,338 | | |
Consumer Staples (0.3%): | |
Wilmar International Ltd. | | | 52,133 | | | | 107,613 | | |
Financials (1.3%): | |
CapitaLand Ltd. | | | 38,551 | | | | 90,652 | | |
DBS Group Holdings Ltd. | | | 7,833 | | | | 91,838 | | |
Global Logistic Properties Ltd. | | | 47,774 | | | | 72,177 | | |
Oversea-Chinese Banking Corp. Ltd. | | | 17,289 | | | | 106,933 | | |
United Overseas Bank Ltd. | | | 7,067 | | | | 97,473 | | |
| | | | 459,073 | | |
Industrials (0.7%): | |
Keppel Corp. Ltd. | | | 16,133 | | | | 73,730 | | |
Singapore Airlines Ltd. | | | 11,300 | | | | 89,076 | | |
Singapore Technologies Engineering Ltd. | | | 38,685 | | | | 81,810 | | |
| | | | 244,616 | | |
Information Technology (0.1%): | |
Avago Technologies Ltd. | | | 356 | | | | 51,673 | | |
Telecommunication Services (0.3%): | |
Singapore Telecommunications Ltd. | | | 35,469 | | | | 91,487 | | |
| | | | 1,041,800 | | |
Spain (3.4%): | |
Consumer Discretionary (0.2%): | |
Industria de Diseno Textil SA | | | 1,987 | | | | 68,252 | | |
Financials (1.0%): | |
Banco Bilbao Vizcaya Argentaria SA | | | 7,390 | | | | 53,990 | | |
Banco de Sabadell SA | | | 27,337 | | | | 48,443 | | |
Banco Popular Espanol SA | | | 13,081 | | | | 43,094 | | |
Banco Santander SA | | | 8,661 | | | | 42,601 | | |
Bankia SA | | | 50,218 | | | | 58,432 | | |
CaixaBank SA | | | 14,932 | | | | 51,965 | | |
Mapfre SA | | | 24,205 | | | | 60,581 | | |
| | | | 359,106 | | |
Health Care (0.2%): | |
Grifols SA | | | 1,685 | | | | 77,873 | | |
See notes to financial statements.
88
Victory Portfolios II
Victory CEMP International Enhanced Volatility Wtd Index Fund | | Schedule of Portfolio Investments — continued
December 31, 2015 | |
(Unaudited)
Security Description | | Shares | | Fair
Value(a) | |
Industrials (0.4%): | |
ACS Actividades de Construccion y Servicios SA | | | 2,034 | | | $ | 59,502 | | |
Ferrovial SA | | | 3,434 | | | | 77,643 | | |
| | | | 137,145 | | |
Information Technology (0.2%): | |
Amadeus IT Holding SA | | | 1,786 | | | | 78,707 | | |
Telecommunication Services (0.2%): | |
Telefonica SA | | | 5,745 | | | | 63,726 | | |
Utilities (1.2%): | |
Enagas SA | | | 2,923 | | | | 82,441 | | |
Endesa SA | | | 3,823 | | | | 76,792 | | |
Gas Natural SDG SA | | | 4,044 | | | | 82,455 | | |
Iberdrola SA | | | 12,895 | | | | 91,400 | | |
Red Electrica Corp. SA | | | 1,015 | | | | 84,771 | | |
| | | | 417,859 | | |
| | | | 1,202,668 | | |
Sweden (3.1%): | |
Consumer Discretionary (0.3%): | |
Electrolux AB | | | 1,710 | | | | 41,287 | | |
Hennes & Mauritz AB | | | 2,108 | | | | 75,034 | | |
| | | | 116,321 | | |
Consumer Staples (0.4%): | |
ICA Gruppen AB | | | 2,295 | | | | 83,404 | | |
Svenska Cellulosa AB SCA, B Shares | | | 2,282 | | | | 66,178 | | |
| | | | 149,582 | | |
Financials (0.8%): | |
Nordea Bank AB | | | 5,562 | | | | 61,067 | | |
Skandinaviska Enskilda Banken AB, Class A | | | 6,573 | | | | 69,173 | | |
Svenska Handelsbanken AB | | | 4,874 | | | | 64,779 | | |
Swedbank AB, A Shares | | | 3,474 | | | | 76,563 | | |
| | | | 271,582 | | |
Industrials (1.0%): | |
ALFA Laval AB | | | 3,642 | | | | 66,534 | | |
| ASSA Abloy AB | | | 3,511 | | | | 73,546 | | |
Atlas Copco AB, A Shares | | | 2,213 | | | | 54,311 | | |
Sandvik AB | | | 5,691 | | | | 49,643 | | |
Skanska AB, Clas B | | | 3,484 | | | | 67,614 | | |
| SKF AB, B Shares | | | 2,848 | | | | 46,031 | | |
| | | | 357,679 | | |
Information Technology (0.4%): | |
Hexagon AB, B Shares | | | 1,858 | | | | 68,780 | | |
Telefonaktiebolaget LM Ericsson, B Shares | | | 6,328 | | | | 61,053 | | |
| | | | 129,833 | | |
See notes to financial statements.
89
Victory Portfolios II
Victory CEMP International Enhanced Volatility Wtd Index Fund | | Schedule of Portfolio Investments — continued
December 31, 2015 | |
(Unaudited)
Security Description | | Shares | | Fair
Value(a) | |
Telecommunication Services (0.2%): | |
TeliaSonera AB | | | 15,212 | | | $ | 75,594 | | |
| | | | 1,100,591 | | |
Switzerland (6.7%): | |
Consumer Discretionary (0.3%): | |
CIE Financiere Richemont SA | | | 712 | | | | 50,975 | | |
The Swatch Group AG | | | 132 | | | | 45,853 | | |
| | | | 96,828 | | |
Consumer Staples (0.8%): | |
Chocoladefabriken Lindt & Spruengli AG, Registered Shares | | | 2 | | | | 149,205 | | |
Coca-Cola HBC AG | | | 2,736 | | | | 58,257 | | |
Nestle SA, Registered Shares | | | 1,149 | | | | 85,322 | | |
| | | | 292,784 | | |
Financials (1.7%): | |
ACE Ltd. | | | 1,047 | | | | 122,342 | | |
Credit Suisse Group AG, Registered Shares | | | 2,400 | | | | 51,716 | | |
Julius Baer Group Ltd. | | | 1,025 | | | | 49,602 | | |
Partners Group Holding AG | | | 152 | | | | 54,681 | | |
Swiss Life Holding AG | | | 317 | | | | 85,410 | | |
Swiss Re AG | | | 1,110 | | | | 108,442 | | |
UBS Group AG, Registered Shares | | | 2,873 | | | | 55,751 | | |
Zurich Insurance Group AG | | | 287 | | | | 73,752 | | |
| | | | 601,696 | | |
Health Care (1.1%): | |
Actelion Ltd. | | | 379 | | | | 52,675 | | |
Galenica AG | | | 53 | | | | 82,946 | | |
Lonza Group AG, Registered Shares | | | 361 | | | | 58,729 | | |
Novartis AG | | | 685 | | | | 58,941 | | |
Roche Holding AG | | | 249 | | | | 69,021 | | |
Sonova Holding AG, Registered Shares | | | 471 | | | | 59,860 | | |
| | | | 382,172 | | |
Industrials (1.3%): | |
ABB Ltd. | | | 3,794 | | | | 67,734 | | |
Adecco SA, Registered Shares | | | 793 | | | | 54,291 | | |
Geberit AG | | | 205 | | | | 69,455 | | |
Kuehne + Nagel International AG | | | 657 | | | | 90,035 | | |
Schindler Holding AG | | | 501 | | | | 83,842 | | |
SGS SA | | | 41 | | | | 77,944 | | |
| | | | 443,301 | | |
Information Technology (0.3%): | |
TE Connectivity Ltd. | | | 1,426 | | | | 92,134 | | |
Materials (1.0%): | |
Clariant AG | | | 3,180 | | | | 60,314 | | |
EMS-Chemie Holding AG | | | 138 | | | | 60,751 | | |
Givaudan SA, Registered shares | | | 41 | | | | 74,436 | | |
LafargeHolcim Ltd. | | | 1,049 | | | | 52,544 | | |
See notes to financial statements.
90
Victory Portfolios II
Victory CEMP International Enhanced Volatility Wtd Index Fund | | Schedule of Portfolio Investments — continued
December 31, 2015 | |
(Unaudited)
Security Description | | Shares | | Fair
Value(a) | |
Sika AG | | | 19 | | | $ | 68,683 | | |
Syngenta AG | | | 117 | | | | 45,808 | | |
| | | | 362,536 | | |
Telecommunication Services (0.2%): | |
Swisscom AG | | | 166 | | | | 83,092 | | |
| | | | 2,354,543 | | |
United Kingdom (13.2%): | |
Consumer Discretionary (3.3%): | |
Barratt Developments PLC | | | 6,382 | | | | 58,800 | | |
Berkeley Group Holdings PLC | | | 1,091 | | | | 59,302 | | |
Burberry Group PLC | | | 3,304 | | | | 58,122 | | |
Compass Group PLC | | | 5,714 | | | | 98,999 | | |
Delphi Automotive PLC | | | 904 | | | | 77,500 | | |
InterContinental Hotels Group PLC | | | 2,017 | | | | 78,609 | | |
ITV PLC | | | 19,103 | | | | 77,764 | | |
Kingfisher PLC | | | 13,114 | | | | 63,509 | | |
Marks & Spencer Group PLC | | | 9,773 | | | | 65,061 | | |
Next PLC | | | 808 | | | | 86,743 | | |
Persimmon PLC (b) | | | 1,987 | | | | 59,271 | | |
RELX PLC | | | 5,423 | | | | 95,626 | | |
Sky PLC | | | 5,352 | | | | 87,722 | | |
Sports Direct International PLC (b) | | | 5,887 | | | | 50,021 | | |
Taylor Wimpey PLC | | | 20,892 | | | | 62,445 | | |
Whitbread PLC | | | 1,319 | | | | 85,481 | | |
| | | | 1,164,975 | | |
Consumer Staples (1.7%): | |
Associated British Foods PLC | | | 1,469 | | | | 72,275 | | |
British American Tobacco PLC | | | 1,551 | | | | 86,121 | | |
Diageo PLC | | | 3,028 | | | | 82,676 | | |
Imperial Tobacco Group PLC | | | 1,494 | | | | 78,898 | | |
Reckitt Benckiser Group PLC | | | 1,011 | | | | 93,531 | | |
SABMiller PLC | | | 1,525 | | | | 91,219 | | |
Unilever PLC | | | 2,138 | | | | 91,691 | | |
| | | | 596,411 | | |
Financials (2.9%): | |
Aon PLC | | | 1,049 | | | | 96,728 | | |
Aviva PLC | | | 9,934 | | | | 75,393 | | |
Direct Line Insurance Group PLC | | | 19,515 | | | | 116,959 | | |
Hargreaves Lansdown PLC | | | 3,020 | | | | 67,036 | | |
HSBC Holdings PLC | | | 9,948 | | | | 78,521 | | |
Legal & General Group PLC | | | 23,123 | | | | 91,228 | | |
London Stock Exchange Group PLC | | | 1,765 | | | | 71,398 | | |
Old Mutual PLC | | | 21,920 | | | | 57,656 | | |
Prudential PLC | | | 3,435 | | | | 77,378 | | |
RSA Insurance Group PLC | | | 7,530 | | | | 47,254 | | |
Schroders PLC | | | 1,559 | | | | 68,273 | | |
St James's Place PLC | | | 4,495 | | | | 66,614 | | |
See notes to financial statements.
91
Victory Portfolios II
Victory CEMP International Enhanced Volatility Wtd Index Fund | | Schedule of Portfolio Investments — continued
December 31, 2015 | |
(Unaudited)
Security Description | | Shares | | Fair
Value(a) | |
Standard Chartered PLC | | | 5,010 | | | $ | 41,563 | | |
Standard Life PLC | | | 11,561 | | | | 66,195 | | |
| | | | 1,022,196 | | |
Health Care (0.5%): | |
GlaxoSmithKline PLC | | | 4,080 | | | | 82,387 | | |
Smith & Nephew PLC | | | 4,079 | | | | 72,686 | | |
| | | | 155,073 | | |
Industrials (2.4%): | |
Ashtead Group PLC | | | 3,994 | | | | 65,723 | | |
Babcock International Group PLC | | | 4,747 | | | | 71,030 | | |
BAE Systems PLC | | | 13,288 | | | | 97,819 | | |
Bunzl PLC | | | 3,776 | | | | 104,748 | | |
Capita PLC | | | 4,399 | | | | 78,258 | | |
| CNH Industrial NV | | | 7,674 | | | | 52,490 | | |
easyJet PLC | | | 2,099 | | | | 53,825 | | |
G4S PLC | | | 24,295 | | | | 80,692 | | |
Intertek Group PLC | | | 1,548 | | | | 63,315 | | |
Royal Mail PLC | | | 9,205 | | | | 60,283 | | |
Smiths Group PLC | | | 4,032 | | | | 55,750 | | |
Travis Perkins PLC | | | 2,608 | | | | 75,649 | | |
| | | | 859,582 | | |
Information Technology (0.4%): | |
ARM Holdings PLC | | | 3,905 | | | | 59,512 | | |
The Sage Group PLC | | | 9,604 | | | | 85,320 | | |
| | | | 144,832 | | |
Materials (0.3%): | |
Johnson Matthey PLC | | | 1,733 | | | | 67,782 | | |
Rio Tinto PLC | | | 1,589 | | | | 46,257 | | |
| | | | 114,039 | | |
Telecommunication Services (0.7%): | |
BT Group PLC | | | 11,957 | | | | 83,013 | | |
Inmarsat PLC | | | 5,096 | | | | 85,419 | | |
Vodafone Group PLC | | | 21,414 | | | | 69,431 | | |
| | | | 237,863 | | |
Utilities (1.0%): | |
National Grid PLC | | | 7,025 | | | | 96,872 | | |
Severn Trent PLC | | | 2,795 | | | | 89,334 | | |
SSE PLC | | | 3,540 | | | | 79,475 | | |
United Utilities Group PLC | | | 6,024 | | | | 82,935 | | |
| | | | 348,616 | | |
| | | | 4,643,587 | | |
See notes to financial statements.
92
Victory Portfolios II
Victory CEMP International Enhanced Volatility Wtd Index Fund | | Schedule of Portfolio Investments — continued
December 31, 2015 | |
(Unaudited)
Security Description | | Shares | | Fair
Value(a) | |
United States (0.8%): | |
Consumer Discretionary (0.5%): | |
Autoliv, Inc. | | | 725 | | | $ | 90,458 | | |
Fiat DaimlerChrysler Automobiles NV (b) | | | 3,574 | | | | 50,001 | | |
lululemon athletica, Inc. (b) | | | 909 | | | | 47,695 | | |
| | | | 188,154 | | |
Health Care (0.3%): | |
Jazz Pharmaceuticals PLC (b) | | | 190 | | | | 26,706 | | |
QIAGEN NV (b) | | | 2,930 | | | | 81,015 | | |
| | | | 107,721 | | |
| | | | 295,875 | | |
Total Common Stocks (Cost $34,879,304) | | | 34,406,468 | | |
Total Investments (Cost $34,879,304) — 97.7% | | | 34,406,468 | | |
Segregated cash with broker — 0.4% (e) | | | 145,931 | | |
Other assets in excess of liabilities — 1.9% | | | 678,617 | | |
NET ASSETS — 100.00% | | $ | 35,231,016 | | |
(a) All securities, except those traded on exchanges in the United States (including ADRs), Brazil, Canada, Cayman Islands, Columbia, and Mexico were fair valued at December 31, 2015.
(b) Non-income producing security.
(c) Amount represents less than 0.05% of net assets.
(d) The Fund's Adviser has deemed this security to be illiquid based upon procedures approved by the Board of Trustees. At December 31, 2015, illiquid securities were less than 0.005% of the Fund's net assets.
(e) Segregated cash with broker represents collateral for futures contracts.
PLC — Public Liability Co.
Futures Contracts Purchased
| | | Number
of
Contracts | | Expiration
Date | | Notional
Amount
at Value | | Unrealized
Depreciation | |
Mini MSCI EAFE Index Futures | | | 10 | | | 3/21/16 | | $ | 849,100 | | | $ | (8,274 | ) | |
See notes to financial statements.
93
Victory Portfolios II
Victory CEMP REC Enhanced Volatility Wtd Index Fund | | Schedule of Portfolio Investments
December 31, 2015 | |
(Unaudited)
Security Description | | Shares | | Value | |
Common Stocks (99.0%) | |
Diversified REITs (9.1%): | |
American Assets Trust, Inc. | | | 2,641 | | | $ | 101,282 | | |
Empire State Realty Trust, Inc. | | | 6,909 | | | | 124,846 | | |
Lexington Realty Trust | | | 11,718 | | | | 93,744 | | |
Liberty Property Trust | | | 3,321 | | | | 103,117 | | |
PS Business Parks, Inc. | | | 1,338 | | | | 116,981 | | |
Select Income REIT | | | 5,409 | | | | 107,206 | | |
W.P. Carey, Inc. | | | 1,959 | | | | 115,581 | | |
Whitestone REIT | | | 8,011 | | | | 96,212 | | |
| | | | 858,969 | | |
Health Care REITs (11.1%): | |
Healthcare Realty Trust, Inc. | | | 4,621 | | | | 130,867 | | |
Healthcare Trust of America, Inc. | | | 4,164 | | | | 112,303 | | |
LTC Properties, Inc. | | | 2,673 | | | | 115,313 | | |
National Health Investors, Inc. | | | 1,846 | | | | 112,366 | | |
Omega Healthcare Investors, Inc. | | | 2,665 | | | | 93,222 | | |
Sabra Health Care REIT, Inc. | | | 3,885 | | | | 78,594 | | |
Senior Housing Properties Trust | | | 6,244 | | | | 92,661 | | |
Universal Health Realty Income Trust | | | 2,029 | | | | 101,470 | | |
Ventas, Inc. | | | 1,797 | | | | 101,405 | | |
Welltower, Inc. | | | 1,597 | | | | 108,644 | | |
| | | | 1,046,845 | | |
Hotel & Resort REITs (5.7%): | |
DiamondRock Hospitality Co. | | | 7,843 | | | | 75,685 | | |
Hospitality Properties Trust | | | 3,426 | | | | 89,590 | | |
Host Hotels & Resorts, Inc. | | | 4,924 | | | | 75,534 | | |
Pebblebrook Hotel Trust | | | 2,097 | | | | 58,758 | | |
RLJ Lodging Trust | | | 3,385 | | | | 73,218 | | |
Ryman Hospitality Properties, Inc. | | | 1,675 | | | | 86,497 | | |
Summit Hotel Properties, Inc. | | | 6,385 | | | | 76,301 | | |
| | | | 535,583 | | |
Industrial REITs (6.0%): | |
DCT Industrial Trust, Inc. | | | 3,111 | | | | 116,258 | | |
EastGroup Properties, Inc. | | | 1,998 | | | | 111,109 | | |
First Industrial Realty Trust | | | 4,812 | | | | 106,490 | | |
Monmouth Real Estate Investment Corp., Class — A | | | 11,475 | | | | 120,029 | | |
Prologis, Inc. | | | 2,627 | | | | 112,751 | | |
| | | | 566,637 | | |
Mortgage REITs (0.4%): | |
United Development Funding IV | | | 3,669 | | | | 40,359 | | |
Office REITs (12.1%): | |
BioMed Realty Trust, Inc. | | | 4,901 | | | | 116,105 | | |
Boston Properties, Inc. | | | 868 | | | | 110,705 | | |
Columbia Property Trust, Inc. | | | 5,207 | | | | 122,260 | | |
Corporate Office Properties Trust | | | 5,077 | | | | 110,831 | | |
Douglas Emmett, Inc. | | | 3,526 | | | | 109,941 | | |
See notes to financial statements.
94
Victory Portfolios II
Victory CEMP REC Enhanced Volatility Wtd Index Fund | | Schedule of Portfolio Investments — continued
December 31, 2015 | |
(Unaudited)
Security Description | | Shares | | Value | |
Franklin Street Properties Corp. | | | 10,669 | | | $ | 110,424 | | |
Highwoods Properties, Inc. | | | 2,857 | | | | 124,565 | | |
Kilroy Realty Corp. | | | 1,514 | | | | 95,806 | | |
Piedmont Office Realty Trust, Inc. | | | 6,581 | | | | 124,249 | | |
Vornado Realty Trust | | | 1,160 | | | | 115,954 | | |
| | | | 1,140,840 | | |
Residential REITs (11.1%): | |
Apartment Investment & Management Co., Class A | | | 2,583 | | | | 103,397 | | |
AvalonBay Communities, Inc. | | | 640 | | | | 117,843 | | |
Camden Property Trust | | | 1,494 | | | | 114,679 | | |
Equity LifeStyle Properties, Inc. | | | 1,892 | | | | 126,140 | | |
Equity Residential | | | 1,390 | | | | 113,410 | | |
Essex Property Trust, Inc. | | | 486 | | | | 116,353 | | |
Mid-America Apartment Communities, Inc. | | | 1,346 | | | | 122,230 | | |
Post Properties, Inc. | | | 1,892 | | | | 111,931 | | |
UDR, Inc. | | | 3,147 | | | | 118,233 | | |
| | | | 1,044,216 | | |
Retail REITs (21.8%): | |
Acadia Realty Trust | | | 3,578 | | | | 118,611 | | |
Agree Realty Corp. | | | 3,951 | | | | 134,294 | | |
Alexander's, Inc. | | | 207 | | | | 79,511 | | |
Brixmor Property Group, Inc. | | | 4,889 | | | | 126,234 | | |
CBL & Associates Properties, Inc. | | | 6,333 | | | | 78,339 | | |
Federal Realty Investment Trust | | | 786 | | | | 114,835 | | |
General Growth Properties, Inc. | | | 3,943 | | | | 107,289 | | |
Kimco Realty Corp. | | | 4,205 | | | | 111,264 | | |
National Retail Properties, Inc. | | | 2,812 | | | | 112,621 | | |
Realty Income Corp. | | | 2,230 | | | | 115,135 | | |
Regency Centers Corp. | | | 1,637 | | | | 111,512 | | |
Retail Opportunity Investments Corp. | | | 6,228 | | | | 111,481 | | |
Saul Centers, Inc. | | | 1,920 | | | | 98,438 | | |
Simon Property Group, Inc. | | | 582 | | | | 113,164 | | |
Tanger Factory Outlet Centers, Inc. | | | 3,508 | | | | 114,712 | | |
Taubman Centers, Inc. | | | 1,360 | | | | 104,339 | | |
The Macerich Co. | | | 1,060 | | | | 85,531 | | |
Urstadt Biddle Properties, Inc., Class A | | | 5,900 | | | | 113,516 | | |
Weingarten Realty Investors | | | 3,010 | | | | 104,086 | | |
| | | | 2,054,912 | | |
Specialized REITs (21.6%): | |
American Tower Corp. | | | 1,120 | | | | 108,584 | | |
CoreSite Realty Corp. | | | 1,714 | | | | 97,218 | | |
Corrections Corp. of America | | | 3,273 | | | | 86,702 | | |
Crown Castle International Corp. | | | 1,532 | | | | 132,441 | | |
CubeSmart | | | 3,848 | | | | 117,826 | | |
DuPont Fabros Technology, Inc. | | | 3,144 | | | | 99,948 | | |
EPR Properties | | | 2,079 | | | | 121,518 | | |
Extra Space Storage, Inc. | | | 1,367 | | | | 120,583 | | |
Gaming and Leisure Properties, Inc. | | | 2,944 | | | | 81,843 | | |
Lamar Advertising Co. | | | 1,909 | | | | 114,502 | | |
See notes to financial statements.
95
Victory Portfolios II
Victory CEMP REC Enhanced Volatility Wtd Index Fund | | Schedule of Portfolio Investments — continued
December 31, 2015 | |
(Unaudited)
Security Description | | Shares | | Value | |
Outfront Media, Inc. | | | 4,622 | | | $ | 100,898 | | |
Plum Creek Timber Co., Inc. | | | 3,864 | | | | 184,389 | | |
Potlatch Corp. | | | 3,737 | | | | 113,007 | | |
Public Storage | | | 543 | | | | 134,501 | | |
QTS Realty Trust, Inc., Class A | | | 1,987 | | | | 89,634 | | |
Sovran Self Storage, Inc. | | | 1,208 | | | | 129,630 | | |
The GEO Group, Inc. | | | 2,775 | | | | 80,225 | | |
Weyerhaeuser Co. | | | 3,904 | | | | 117,042 | | |
| | | | 2,030,491 | | |
Total Common Stocks (Cost $8,879,060) | | | 9,318,852 | | |
Total Investments (Cost $8,879,060) — 99.0% | | | 9,318,852 | | |
Segregated cash with broker — 0.4% (a) | | | 34,249 | | |
Other assets in excess of liabilities — 0.6% | | | 62,376 | | |
NET ASSETS — 100.00% | | $ | 9,415,477 | | |
(a) Segregated cash with broker represents collateral for futures contracts.
REIT — Real Estate Investment Trust
Futures Contracts Purchased
| | | Number of
Contracts | | Expiration
Date | | Notional
Amount
at Value | | Unrealized
Appreciation | |
DJ US Real Estate Index Futures | | | 2 | | | 3/21/16 | | $ | 58,820 | | | $ | 110 | | |
See notes to financial statements.
96
Victory Portfolios II
Victory CEMP Commodity Volatility Wtd Index Strategy Fund | | Schedule of Portfolio Investments
December 31, 2015 | |
(Unaudited)
Security Description | | Shares or
Principal
Amount | | Value | |
U.S. Treasury Obligations (65.5%) | |
U.S. Treasury Bills
0.09%, 3/17/16 (a) (b) | | $ | 500,000 | | | $ | 499,899 | | |
0.25%, 4/28/16 (a) (b) | | | 700,000 | | | | 699,413 | | |
0.42%, 6/2/16 (a) (b) | | | 2,200,000 | | | | 2,196,031 | | |
0.44%, 6/9/16 (a) (b) | | | 1,000,000 | | | | 998,039 | | |
0.60%, 12/8/16 (a) (b) | | | 1,000,000 | | | | 994,322 | | |
U.S. Treasury Note, 0.88%, 7/15/17 (b) | | | 500,000 | | | | 499,160 | | |
Total U.S. Treasury Obligations (Cost $5,885,588) | | | | | 5,886,864 | | |
Cash Equivalents (27.0%) | |
Citibank Money Market Deposit Account, 0.02% (c) | | | 2,429,455 | | | | 2,429,455 | | |
Total Cash Equivalents (Cost $2,429,455) | | | 2,429,455 | | |
Total Investments (Cost $8,315,043) — 92.6% | | | 8,316,319 | | |
Segregated cash with broker — 8.1% (d) | | | 731,085 | | |
Liabilities in excess of other assets — (0.7)% | | | (61,436 | ) | |
NET ASSETS — 100.00% | | $ | 8,985,968 | | |
(a) Rate represents the effective yield at purchase.
(b) All or a portion of this security is being held as collateral for futures contracts.
(c) Rate periodically changes. Rate disclosed is the daily yield on December 31, 2015.
(d) Segregated cash with broker represents collateral for futures contracts.
Futures Contracts Purchased
| | | Number of
Contracts | | Expiration
Date | | Notional
Amount
at Value | | Unrealized
Appreciation/
(Depreciation) | |
Cocoa Future | | | 21 | | | 3/16/16 | | $ | 674,310 | | | $ | (11,838 | ) | |
Coffee 'C' Future | | | 7 | | | 3/21/16 | | | 332,588 | | | | 18,349 | | |
Copper Future | | | 9 | | | 3/30/16 | | | 480,375 | | | | (17,123 | ) | |
Corn Future | | | 26 | | | 3/15/16 | | | 466,375 | | | | (14,350 | ) | |
Cotton No.2 Future | | | 18 | | | 3/09/16 | | | 569,520 | | | | 8,852 | | |
Gasoline RBOB Future | | | 5 | | | 2/01/16 | | | 266,910 | | | | 5,812 | | |
Gold 100 Oz Future | | | 7 | | | 2/26/16 | | | 742,140 | | | | (14,024 | ) | |
Lean Hogs Future | | | 14 | | | 2/15/16 | | | 334,880 | | | | 14,715 | | |
Live Cattle Future | | | 13 | | | 3/01/16 | | | 711,360 | | | | 18,596 | | |
Natural Gas Future | | | 9 | | | 1/28/16 | | | 210,330 | | | | 19,457 | | |
New York Harbor USLD Future | | | 4 | | | 2/01/16 | | | 188,815 | | | | (14,384 | ) | |
NYMEX WTI Crude Future | | | 5 | | | 1/21/16 | | | 185,200 | | | | (7,033 | ) | |
Primary Aluminum Future | | | 15 | | | 3/15/16 | | | 565,406 | | | | (5,983 | ) | |
Silver Future | | | 5 | | | 3/30/16 | | | 345,075 | | | | (13,523 | ) | |
Soybean Future | | | 12 | | | 3/15/16 | | | 518,550 | | | | (8,745 | ) | |
Soybean Meal Future | | | 15 | | | 3/15/16 | | | 398,250 | | | | (15,510 | ) | |
Soybean Oil Future | | | 32 | | | 3/15/16 | | | 590,400 | | | | (14,150 | ) | |
Sugar #11 Future | | | 34 | | | 3/01/16 | | | 580,339 | | | | 96,351 | | |
Wheat Future | | | 16 | | | 3/15/16 | | | 376,000 | | | | (17,835 | ) | |
Zinc Future | | | 12 | | | 3/15/16 | | | 482,700 | | | | (6,047 | ) | |
| | | | | | | | | $ | 21,588 | | |
See notes to financial statements.
97
Victory Portfolios II
Victory CEMP Commodity Enhanced Volatility Wtd Index Strategy Fund | | Schedule of Portfolio Investments
December 31, 2015 | |
(Unaudited)
Security Description | | Shares or
Principal
Amount | | Value | |
U.S. Treasury Obligations (74.0%) | |
U.S. Treasury Bills
0.09%, 3/17/16 (a) (b) | | $ | 500,000 | | | $ | 499,899 | | |
0.42%, 6/2/16 (a) (b) | | | 2,200,000 | | | | 2,196,030 | | |
0.44%, 6/9/16 (a) (b) | | | 1,000,000 | | | | 998,039 | | |
0.60%, 12/8/16 (a) (b) | | | 250,000 | | | | 248,581 | | |
U.S. Treasury Note, 0.88%, 7/15/17 (b) | | | 500,000 | | | | 499,160 | | |
Total U.S. Treasury Obligations (Cost $4,440,797) | | | | | 4,441,709 | | |
Cash Equivalents (15.8%) | |
Citibank Money Market Deposit Account, 0.02% (c) | | | 945,760 | | | | 945,760 | | |
Total Cash Equivalents (Cost $945,760) | | | 945,760 | | |
Total Investments (Cost $5,386,557) — 89.8% | | | 5,387,469 | | |
Segregated cash with broker — 9.9% (d) | | | 594,293 | | |
Other assets in excess of liabilities — 0.3% | | | 17,472 | | |
NET ASSETS — 100.00% | | $ | 5,999,234 | | |
(a) Rate represents the effective yield at purchase.
(b) All or a portion of this security is being held as collateral for futures contracts.
(c) Rate periodically changes. Rate disclosed is the daily yield on December 31, 2015.
(d) Segregated cash with broker represents collateral for futures contracts.
Futures Contracts Purchased
| | | Number of
Contracts | | Expiration
Date | | Notional
Amount
at Value | | Unrealized
Appreciation/
(Depreciation) | |
Cocoa Future | | | 14 | | | 3/16/16 | | $ | 449,539 | | | $ | (11,055 | ) | |
Coffee 'C' Future | | | 5 | | | 3/21/16 | | | 237,563 | | | | 14,513 | | |
Copper Future | | | 6 | | | 3/30/16 | | | 320,250 | | | | (9,913 | ) | |
Corn Future | | | 17 | | | 3/15/16 | | | 304,938 | | | | (10,783 | ) | |
Cotton No.2 Future | | | 12 | | | 3/09/16 | | | 379,680 | | | | 5,745 | | |
Gasoline RBOB Future | | | 3 | | | 2/01/16 | | | 160,146 | | | | 5,216 | | |
Gold 100 Oz Future | | | 4 | | | 2/26/16 | | | 424,080 | | | | (8,018 | ) | |
Lean Hogs Future | | | 10 | | | 2/15/16 | | | 239,200 | | | | 10,862 | | |
Live Cattle Future | | | 8 | | | 3/01/16 | | | 437,760 | | | | 14,526 | | |
Natural Gas Future | | | 6 | | | 1/28/16 | | | 140,220 | | | | 14,505 | | |
New York Harbor USLD Future | | | 3 | | | 2/01/16 | | | 141,611 | | | | (16,313 | ) | |
NYMEX WTI Crude Future | | | 4 | | | 1/21/16 | | | 148,160 | | | | (2,581 | ) | |
Primary Aluminum Future | | | 10 | | | 3/15/16 | | | 376,938 | | | | (388 | ) | |
Silver Future | | | 4 | | | 3/30/16 | | | 276,060 | | | | (8,355 | ) | |
Soybean Future | | | 8 | | | 3/15/16 | | | 345,700 | | | | (6,068 | ) | |
Soybean Meal Future | | | 10 | | | 3/15/16 | | | 265,500 | | | | (11,945 | ) | |
Soybean Oil Future | | | 21 | | | 3/15/16 | | | 387,450 | | | | (10,306 | ) | |
Sugar #11 Future | | | 22 | | | 3/01/16 | | | 375,514 | | | | 62,180 | | |
Wheat Future | | | 10 | | | 3/15/16 | | | 235,000 | | | | (10,875 | ) | |
Zinc Future | | | 8 | | | 3/15/16 | | | 321,800 | | | | (1,555 | ) | |
| | | | | | | | | $ | 19,395 | | |
See notes to financial statements.
98
Victory Portfolios II
Victory CEMP Long/Short Strategy Fund | | Schedule of Portfolio Investments
December 31, 2015 | |
(Unaudited)
Security Description | | Shares | | Value | |
Common Stocks (76.5%) | |
Consumer Discretionary (12.2%): | |
Advance Auto Parts, Inc. | | | 118 | | | $ | 17,760 | | |
AMC Networks, Inc., Class A (a) | | | 263 | | | | 19,641 | | |
Aramark | | | 884 | | | | 28,509 | | |
AutoNation, Inc. (a) | | | 402 | | | | 23,983 | | |
AutoZone, Inc. (a) | | | 42 | | | | 31,161 | | |
Bed Bath & Beyond, Inc. (a) | | | 373 | | | | 17,997 | | |
Best Buy Co., Inc. | | | 384 | | | | 11,693 | | |
BorgWarner, Inc. | | | 465 | | | | 20,102 | | |
Cablevision Systems Corp. | | | 490 | | | | 15,631 | | |
CarMax, Inc. (a) | | | 355 | | | | 19,159 | | |
Carter's, Inc. | | | 249 | | | | 22,168 | | |
CBS Corp., Class B | | | 508 | | | | 23,942 | | |
Chipotle Mexican Grill, Inc. (a) | | | 29 | | | | 13,916 | | |
Coach, Inc. | | | 633 | | | | 20,718 | | |
Comcast Corp., Class A | | | 433 | | | | 24,434 | | |
Dick's Sporting Goods, Inc. | | | 380 | | | | 13,433 | | |
Discovery Communications, Inc., Class A (a) | | | 601 | | | | 16,035 | | |
DISH Network Corp. (a) | | | 368 | | | | 21,042 | | |
Dollar General Corp. | | | 373 | | | | 26,807 | | |
Domino's Pizza, Inc. | | | 190 | | | | 21,138 | | |
DR Horton, Inc. | | | 553 | | | | 17,713 | | |
Dunkin' Brands Group, Inc. | | | 487 | | | | 20,741 | | |
Expedia, Inc. | | | 118 | | | | 14,667 | | |
Foot Locker, Inc. | | | 343 | | | | 22,326 | | |
Ford Motor Co. | | | 1,830 | | | | 25,785 | | |
GameStop Corp., Class A | | | 371 | | | | 10,403 | | |
General Motors Co. | | | 724 | | | | 24,623 | | |
Gentex Corp. | | | 1,475 | | | | 23,615 | | |
Genuine Parts Co. | | | 332 | | | | 28,516 | | |
Hanesbrands, Inc. | | | 627 | | | | 18,453 | | |
Harley-Davidson, Inc. | | | 343 | | | | 15,569 | | |
Harman International Industries, Inc. | | | 118 | | | | 11,117 | | |
Hasbro, Inc. | | | 256 | | | | 17,244 | | |
Hilton Worldwide Holdings, Inc. | | | 882 | | | | 18,875 | | |
Hyatt Hotels Corp., Class A (a) | | | 463 | | | | 21,770 | | |
Johnson Controls, Inc. | | | 539 | | | | 21,285 | | |
Kohl's Corp. | | | 335 | | | | 15,956 | | |
L Brands, Inc. | | | 255 | | | | 24,434 | | |
Las Vegas Sands Corp. | | | 329 | | | | 14,423 | | |
Lear Corp. | | | 203 | | | | 24,934 | | |
Lennar Corp., Class A | | | 351 | | | | 17,167 | | |
Lions Gate Entertainment Corp. | | | 469 | | | | 15,191 | | |
LKQ Corp. (a) | | | 683 | | | | 20,237 | | |
Lowe's Cos., Inc. | | | 368 | | | | 27,983 | | |
Macy's, Inc. | | | 351 | | | | 12,278 | | |
Marriott International, Inc., Class A | | | 297 | | | | 19,911 | | |
McDonald's Corp. | | | 288 | | | | 34,024 | | |
Mohawk Industries, Inc. (a) | | | 114 | | | | 21,590 | | |
See notes to financial statements.
99
Victory Portfolios II
Victory CEMP Long/Short Strategy Fund | | Schedule of Portfolio Investments — continued
December 31, 2015 | |
(Unaudited)
Security Description | | Shares | | Value | |
MSG Networks, Inc., Class A (a) | | | 1,298 | | | $ | 26,998 | | |
Netflix, Inc. (a) | | | 104 | | | | 11,896 | | |
Newell Rubbermaid, Inc. | | | 644 | | | | 28,388 | | |
NIKE, Inc., Class B | | | 481 | | | | 30,062 | | |
Nordstrom, Inc. | | | 350 | | | | 17,434 | | |
NVR, Inc. (a) | | | 19 | | | | 31,217 | | |
Omnicom Group, Inc. | | | 464 | | | | 35,106 | | |
O'Reilly Automotive, Inc. (a) | | | 98 | | | | 24,835 | | |
Panera Bread Co., Class A (a) | | | 105 | | | | 20,452 | | |
Penske Automotive Group, Inc. | | | 362 | | | | 15,327 | | |
Polaris Industries, Inc. | | | 154 | | | | 13,236 | | |
PulteGroup, Inc. | | | 821 | | | | 14,630 | | |
PVH Corp. | | | 164 | | | | 12,079 | | |
Ralph Lauren Corp. | | | 148 | | | | 16,499 | | |
Ross Stores, Inc. | | | 430 | | | | 23,138 | | |
Royal Caribbean Cruises Ltd. | | | 185 | | | | 18,724 | | |
Scripps Networks Interactive, Inc., Class A | | | 433 | | | | 23,906 | | |
Service Corp. International | | | 935 | | | | 24,329 | | |
Sirius XM Holdings, Inc. (a) | | | 7,032 | | | | 28,620 | | |
Skechers U.S.A., Inc. (a) | | | 289 | | | | 8,731 | | |
Starbucks Corp. | | | 411 | | | | 24,672 | | |
Starwood Hotels & Resorts Worldwide, Inc. | | | 271 | | | | 18,775 | | |
TEGNA, Inc. | | | 753 | | | | 19,217 | | |
The Gap, Inc. | | | 778 | | | | 19,217 | | |
The Goodyear Tire & Rubber Co. | | | 619 | | | | 20,223 | | |
The Home Depot, Inc. | | | 221 | | | | 29,227 | | |
The Priceline Group, Inc. (a) | | | 15 | | | | 19,124 | | |
The TJX Cos., Inc. | | | 352 | | | | 24,960 | | |
The Walt Disney Co. | | | 217 | | | | 22,802 | | |
Tiffany & Co. | | | 191 | | | | 14,571 | | |
Time Warner Cable, Inc. | | | 113 | | | | 20,972 | | |
Time Warner, Inc. | | | 322 | | | | 20,824 | | |
Toll Brothers, Inc. (a) | | | 546 | | | | 18,182 | | |
Tractor Supply Co. | | | 254 | | | | 21,717 | | |
TripAdvisor, Inc. (a) | | | 177 | | | | 15,089 | | |
Twenty-First Century Fox, Inc. | | | 797 | | | | 21,647 | | |
Ulta Salon, Cosmetics & Fragrance, Inc. (a) | | | 160 | | | | 29,601 | | |
Under Armour, Inc. (a) | | | 193 | | | | 15,558 | | |
VF Corp. | | | 364 | | | | 22,659 | | |
Whirlpool Corp. | | | 117 | | | | 17,184 | | |
Williams-Sonoma, Inc. | | | 305 | | | | 17,815 | | |
Wyndham Worldwide Corp. | | | 307 | | | | 22,304 | | |
| | | | 1,852,046 | | |
Consumer Staples (7.1%): | |
Altria Group, Inc. | | | 530 | | | | 30,852 | | |
Archer-Daniels-Midland Co. | | | 570 | | | | 20,908 | | |
Brown-Forman Corp., Class B | | | 330 | | | | 32,762 | | |
Campbell Soup Co. | | | 670 | | | | 35,209 | | |
Church & Dwight Co., Inc. | | | 414 | | | | 35,140 | | |
Coca-Cola Enterprises, Inc. | | | 409 | | | | 20,139 | | |
See notes to financial statements.
100
Victory Portfolios II
Victory CEMP Long/Short Strategy Fund | | Schedule of Portfolio Investments — continued
December 31, 2015 | |
(Unaudited)
Security Description | | Shares | | Value | |
Colgate-Palmolive Co. | | | 476 | | | $ | 31,711 | | |
Constellation Brands, Inc., Class A | | | 210 | | | | 29,912 | | |
Costco Wholesale Corp. | | | 202 | | | | 32,623 | | |
CVS Health Corp. | | | 318 | | | | 31,091 | | |
Dr Pepper Snapple Group, Inc. | | | 397 | | | | 37,000 | | |
Flowers Foods, Inc. | | | 916 | | | | 19,685 | | |
General Mills, Inc. | | | 629 | | | | 36,267 | | |
Herbalife Ltd. (a) | | | 159 | | | | 8,526 | | |
Hormel Foods Corp. | | | 441 | | | | 34,874 | | |
Ingredion, Inc. | | | 305 | | | | 29,231 | | |
Keurig Green Mountain, Inc. | | | 163 | | | | 14,667 | | |
McCormick & Co., Inc. | | | 413 | | | | 35,336 | | |
Mead Johnson Nutrition Co. | | | 370 | | | | 29,212 | | |
Mondelez International, Inc. | | | 628 | | | | 28,160 | | |
Monster Beverage Corp. (a) | | | 120 | | | | 17,875 | | |
PepsiCo, Inc. | | | 363 | | | | 36,271 | | |
Philip Morris International, Inc. | | | 341 | | | | 29,977 | | |
Pilgrim's Pride Corp. | | | 487 | | | | 10,758 | | |
Pinnacle Foods, Inc. | | | 614 | | | | 26,070 | | |
Reynolds American, Inc. | | | 576 | | | | 26,582 | | |
Rite Aid Corp. (a) | | | 1,908 | | | | 14,959 | | |
Spectrum Brands Holdings, Inc. | | | 286 | | | | 29,115 | | |
Sysco Corp. | | | 699 | | | | 28,659 | | |
The Clorox Co. | | | 319 | | | | 40,459 | | |
The Coca-Cola Co. | | | 981 | | | | 42,145 | | |
The Estee Lauder Cos., Inc., Class A | | | 303 | | | | 26,682 | | |
The Hain Celestial Group, Inc. (a) | | | 367 | | | | 14,823 | | |
The Kroger Co. | | | 751 | | | | 31,414 | | |
The Procter & Gamble Co. | | | 475 | | | | 37,720 | | |
Tyson Foods, Inc., Class A | | | 468 | | | | 24,958 | | |
Wal-Mart Stores, Inc. | | | 437 | | | | 26,788 | | |
WhiteWave Foods Co., Class A (a) | | | 426 | | | | 16,576 | | |
Whole Foods Market, Inc. | | | 587 | | | | 19,665 | | |
| | | | 1,074,801 | | |
Energy (1.7%): | |
Cameron International Corp. (a) | | | 143 | | | | 9,038 | | |
Cheniere Energy Partners LP Holdings LLC | | | 1,057 | | | | 18,392 | | |
Chevron Corp. | | | 270 | | | | 24,289 | | |
Exxon Mobil Corp. | | | 340 | | | | 26,504 | | |
FMC Technologies, Inc. (a) | | | 418 | | | | 12,126 | | |
Helmerich & Payne, Inc. | | | 247 | | | | 13,227 | | |
Kinder Morgan, Inc. | | | 837 | | | | 12,488 | | |
Marathon Petroleum Corp. | | | 315 | | | | 16,330 | | |
National Oilwell Varco, Inc. | | | 395 | | | | 13,228 | | |
ONEOK, Inc. | | | 391 | | | | 9,642 | | |
Phillips 66 | | | 216 | | | | 17,669 | | |
Plains GP Holdings LP, Class A | | | 605 | | | | 5,717 | | |
Schlumberger Ltd. | | | 278 | | | | 19,391 | | |
Spectra Energy Corp. | | | 782 | | | | 18,721 | | |
Tesoro Corp. | | | 147 | | | | 15,489 | | |
See notes to financial statements.
101
Victory Portfolios II
Victory CEMP Long/Short Strategy Fund | | Schedule of Portfolio Investments — continued
December 31, 2015 | |
(Unaudited)
Security Description | | Shares | | Value | |
The Williams Cos., Inc. | | | 279 | | | $ | 7,170 | | |
Valero Energy Corp. | | | 264 | | | | 18,667 | | |
| | | | 258,088 | | |
Financials (13.5%): | |
Affiliated Managers Group, Inc. (a) | | | 142 | | | | 22,686 | | |
Aflac, Inc. | | | 503 | | | | 30,130 | | |
Alleghany Corp. (a) | | | 65 | | | | 31,065 | | |
American Express Co. | | | 311 | | | | 21,630 | | |
American Financial Group, Inc. | | | 520 | | | | 37,481 | | |
American International Group, Inc. | | | 449 | | | | 27,825 | | |
Ameriprise Financial, Inc. | | | 213 | | | | 22,667 | | |
AmTrust Financial Services, Inc. | | | 346 | | | | 21,307 | | |
Arthur J. Gallagher & Co. | | | 832 | | | | 34,061 | | |
Assurant, Inc. | | | 346 | | | | 27,867 | | |
BB&T Corp. | | | 689 | | | | 26,051 | | |
Berkshire Hathaway, Inc., Class B (a) | | | 273 | | | | 36,047 | | |
BlackRock, Inc. | | | 88 | | | | 29,966 | | |
Brown & Brown, Inc. | | | 1,044 | | | | 33,512 | | |
Capital One Financial Corp. | | | 267 | | | | 19,272 | | |
CBOE Holdings, Inc. | | | 438 | | | | 28,426 | | |
CBRE Group, Inc., Class A (a) | | | 685 | | | | 23,687 | | |
Cincinnati Financial Corp. | | | 550 | | | | 32,544 | | |
CIT Group, Inc. | | | 653 | | | | 25,924 | | |
Citigroup, Inc. | | | 438 | | | | 22,667 | | |
Citizens Financial Group, Inc. | | | 954 | | | | 24,985 | | |
CME Group, Inc. | | | 287 | | | | 26,002 | | |
CNA Financial Corp. | | | 799 | | | | 28,085 | | |
Comerica, Inc. | | | 441 | | | | 18,447 | | |
Discover Financial Services | | | 467 | | | | 25,040 | | |
E*TRADE Financial Corp. (a) | | | 618 | | | | 18,318 | | |
East West Bancorp, Inc. | | | 540 | | | | 22,442 | | |
FactSet Research Systems, Inc. | | | 185 | | | | 30,075 | | |
Fifth Third Bancorp | | | 1,133 | | | | 22,773 | | |
First Republic Bank | | | 387 | | | | 25,565 | | |
Franklin Resources, Inc. | | | 661 | | | | 24,338 | | |
Huntington Bancshares, Inc. | | | 2,216 | | | | 24,509 | | |
Intercontinental Exchange, Inc. | | | 107 | | | | 27,420 | | |
Invesco Ltd. | | | 721 | | | | 24,139 | | |
Jones Lang LaSalle, Inc. | | | 132 | | | | 21,102 | | |
JPMorgan Chase & Co. | | | 389 | | | | 25,686 | | |
KeyCorp | | | 1,499 | | | | 19,772 | | |
Legg Mason, Inc. | | | 579 | | | | 22,714 | | |
Lincoln National Corp. | | | 397 | | | | 19,953 | | |
Loews Corp. | | | 858 | | | | 32,947 | | |
M&T Bank Corp. | | | 389 | | | | 47,138 | | |
Markel Corp. (a) | | | 35 | | | | 30,917 | | |
Marsh & McLennan Cos., Inc. | | | 604 | | | | 33,492 | | |
MetLife, Inc. | | | 461 | | | | 22,225 | | |
Moody's Corp. | | | 259 | | | | 25,988 | | |
MSCI, Inc. | | | 422 | | | | 30,439 | | |
See notes to financial statements.
102
Victory Portfolios II
Victory CEMP Long/Short Strategy Fund | | Schedule of Portfolio Investments — continued
December 31, 2015 | |
(Unaudited)
Security Description | | Shares | | Value | |
NASDAQ, Inc. | | | 529 | | | $ | 30,772 | | |
Navient Corp. | | | 1,359 | | | | 15,561 | | |
New York Community Bancorp, Inc. | | | 1,670 | | | | 27,254 | | |
Northern Trust Corp. | | | 325 | | | | 23,429 | | |
People's United Financial, Inc. | | | 1,943 | | | | 31,379 | | |
Principal Financial Group, Inc. | | | 460 | | | | 20,691 | | |
Raymond James Financial, Inc. | | | 450 | | | | 26,087 | | |
Regions Financial Corp. | | | 2,085 | | | | 20,016 | | |
Reinsurance Group of America, Inc. | | | 316 | | | | 27,034 | | |
Santander Consumer USA Holdings, Inc. (a) | | | 842 | | | | 13,346 | | |
SEI Investments Co. | | | 484 | | | | 25,362 | | |
Signature Bank (a) | | | 167 | | | | 25,613 | | |
StanCorp Financial Group, Inc. | | | 88 | | | | 10,021 | | |
State Street Corp. | | | 305 | | | | 20,240 | | |
SunTrust Banks, Inc. | | | 563 | | | | 24,119 | | |
SVB Financial Group (a) | | | 129 | | | | 15,338 | | |
Synchrony Financial (a) | | | 793 | | | | 24,115 | | |
T. Rowe Price Group, Inc. | | | 423 | | | | 30,240 | | |
TD Ameritrade Holding Corp. | | | 671 | | | | 23,290 | | |
TFS Financial Corp. | | | 2,094 | | | | 39,430 | | |
The Allstate Corp. | | | 422 | | | | 26,202 | | |
The Bank of New York Mellon Corp. | | | 588 | | | | 24,237 | | |
The Charles Schwab Corp. | | | 639 | | | | 21,042 | | |
The Chubb Corp. | | | 135 | | | | 17,906 | | |
The Goldman Sachs Group, Inc. | | | 137 | | | | 24,692 | | |
The PNC Financial Services Group, Inc. | | | 292 | | | | 27,831 | | |
The Progressive Corp. | | | 1,012 | | | | 32,182 | | |
The Travelers Cos., Inc. | | | 298 | | | | 33,632 | | |
Torchmark Corp. | | | 530 | | | | 30,295 | | |
U.S. Bancorp | | | 661 | | | | 28,205 | | |
Voya Financial, Inc. | | | 604 | | | | 22,294 | | |
W.R. Berkley Corp. | | | 509 | | | | 27,868 | | |
Wells Fargo & Co. | | | 521 | | | | 28,322 | | |
| | | | 2,047,371 | | |
Health Care (8.3%): | |
Abbott Laboratories | | | 584 | | | | 26,227 | | |
Acadia Healthcare Co., Inc. (a) | | | 231 | | | | 14,428 | | |
Aetna, Inc. | | | 174 | | | | 18,813 | | |
Agilent Technologies, Inc. | | | 675 | | | | 28,222 | | |
Alexion Pharmaceuticals, Inc. (a) | | | 85 | | | | 16,214 | | |
Align Technology, Inc. (a) | | | 324 | | | | 21,335 | | |
Amgen, Inc. | | | 125 | | | | 20,291 | | |
Anthem, Inc. | | | 157 | | | | 21,892 | | |
Baxter International, Inc. | | | 767 | | | | 29,261 | | |
Becton, Dickinson & Co. | | | 229 | | | | 35,286 | | |
Biogen, Inc. (a) | | | 37 | | | | 11,335 | | |
Cardinal Health, Inc. | | | 321 | | | | 28,656 | | |
Celgene Corp. (a) | | | 137 | | | | 16,407 | | |
Centene Corp. (a) | | | 267 | | | | 17,571 | | |
Cerner Corp. (a) | | | 368 | | | | 22,143 | | |
See notes to financial statements.
103
Victory Portfolios II
Victory CEMP Long/Short Strategy Fund | | Schedule of Portfolio Investments — continued
December 31, 2015 | |
(Unaudited)
Security Description | | Shares | | Value | |
Cigna Corp. | | | 134 | | | $ | 19,608 | | |
Community Health Systems, Inc. (a) | | | 300 | | | | 7,959 | | |
DENTSPLY International, Inc. | | | 515 | | | | 31,338 | | |
Edwards Lifesciences Corp. (a) | | | 279 | | | | 22,035 | | |
Eli Lilly & Co. | | | 275 | | | | 23,172 | | |
Express Scripts Holding Co. (a) | | | 284 | | | | 24,824 | | |
Gilead Sciences, Inc. | | | 172 | | | | 17,405 | | |
HCA Holdings, Inc. (a) | | | 234 | | | | 15,825 | | |
Henry Schein, Inc. (a) | | | 219 | | | | 34,645 | | |
Hologic, Inc. (a) | | | 555 | | | | 21,473 | | |
Humana, Inc. | | | 79 | | | | 14,102 | | |
IDEXX Laboratories, Inc. (a) | | | 193 | | | | 14,074 | | |
Illumina, Inc. (a) | | | 90 | | | | 17,275 | | |
Intuitive Surgical, Inc. (a) | | | 44 | | | | 24,031 | | |
Johnson & Johnson | | | 332 | | | | 34,103 | | |
Laboratory Corp. of America Holdings (a) | | | 246 | | | | 30,415 | | |
McKesson Corp. | | | 134 | | | | 26,429 | | |
MEDNAX, Inc. (a) | | | 365 | | | | 26,156 | | |
Merck & Co., Inc. | | | 462 | | | | 24,403 | | |
Mettler-Toledo International, Inc. (a) | | | 86 | | | | 29,165 | | |
Mylan NV (a) | | | 259 | | | | 14,004 | | |
Patterson Cos., Inc. | | | 610 | | | | 27,578 | | |
PerkinElmer, Inc. | | | 606 | | | | 32,463 | | |
Pfizer, Inc. | | | 930 | | | | 30,020 | | |
Quest Diagnostics, Inc. | | | 340 | | | | 24,188 | | |
Quintiles Transnational Holdings, Inc. (a) | | | 357 | | | | 24,512 | | |
Regeneron Pharmaceuticals, Inc. (a) | | | 32 | | | | 17,372 | | |
ResMed, Inc. | | | 311 | | | | 16,698 | | |
Sirona Dental Systems, Inc. (a) | | | 311 | | | | 34,076 | | |
St. Jude Medical, Inc. | | | 334 | | | | 20,631 | | |
Stryker Corp. | | | 286 | | | | 26,581 | | |
Team Health Holdings, Inc. (a) | | | 234 | | | | 10,270 | | |
Teleflex, Inc. | | | 237 | | | | 31,154 | | |
The Cooper Cos., Inc. | | | 168 | | | | 22,546 | | |
Thermo Fisher Scientific, Inc. | | | 209 | | | | 29,647 | | |
UnitedHealth Group, Inc. | | | 185 | | | | 21,763 | | |
Universal Health Services, Inc., Class B | | | 146 | | | | 17,446 | | |
Varian Medical Systems, Inc. (a) | | | 292 | | | | 23,594 | | |
VCA, Inc. (a) | | | 370 | | | | 20,350 | | |
Waters Corp. (a) | | | 216 | | | | 29,069 | | |
| | | | 1,260,480 | | |
Industrials (13.2%): | |
3M Co. | | | 215 | | | | 32,388 | | |
A.O. Smith Corp. | | | 303 | | | | 23,213 | | |
Acuity Brands, Inc. | | | 119 | | | | 27,822 | | |
Alaska Air Group, Inc. | | | 212 | | | | 17,068 | | |
Allison Transmission Holdings, Inc. | | | 989 | | | | 25,605 | | |
AMERCO, Inc. | | | 66 | | | | 25,707 | | |
American Airlines Group, Inc. | | | 319 | | | | 13,510 | | |
AMETEK, Inc. | | | 492 | | | | 26,366 | | |
See notes to financial statements.
104
Victory Portfolios II
Victory CEMP Long/Short Strategy Fund | | Schedule of Portfolio Investments — continued
December 31, 2015 | |
(Unaudited)
Security Description | | Shares | | Value | |
C.H. Robinson Worldwide, Inc. | | | 299 | | | $ | 18,544 | | |
Carlisle Cos., Inc. | | | 249 | | | | 22,084 | | |
Caterpillar, Inc. | | | 301 | | | | 20,456 | | |
Cintas Corp. | | | 361 | | | | 32,869 | | |
Colfax Corp. (a) | | | 541 | | | | 12,632 | | |
Copart, Inc. (a) | | | 936 | | | | 35,577 | | |
CSX Corp. | | | 737 | | | | 19,125 | | |
Cummins, Inc. | | | 211 | | | | 18,570 | | |
Danaher Corp. | | | 360 | | | | 33,436 | | |
Deere & Co. | | | 312 | | | | 23,796 | | |
Dover Corp. | | | 354 | | | | 21,704 | | |
Eaton Corp. PLC | | | 407 | | | | 21,180 | | |
Emerson Electric Co. | | | 557 | | | | 26,641 | | |
Equifax, Inc. | | | 261 | | | | 29,068 | | |
Expeditors International of Washington, Inc. | | | 540 | | | | 24,354 | | |
Fastenal Co. | | | 589 | | | | 24,043 | | |
Flowserve Corp. | | | 482 | | | | 20,283 | | |
Fluor Corp. | | | 427 | | | | 20,163 | | |
General Dynamics Corp. | | | 197 | | | | 27,060 | | |
Hexcel Corp. | | | 506 | | | | 23,504 | | |
Honeywell International, Inc. | | | 285 | | | | 29,517 | | |
Hubbell, Inc. (a) | | | 334 | | | | 33,748 | | |
Huntington Ingalls Industries, Inc. | | | 162 | | | | 20,550 | | |
IDEX Corp. | | | 443 | | | | 33,939 | | |
IHS, Inc., Class A (a) | | | 189 | | | | 22,383 | | |
Illinois Tool Works, Inc. | | | 349 | | | | 32,345 | | |
Ingersoll-Rand PLC | | | 476 | | | | 26,318 | | |
J.B. Hunt Transport Services, Inc. | | | 355 | | | | 26,044 | | |
Jacobs Engineering Group, Inc. (a) | | | 488 | | | | 20,472 | | |
JetBlue Airways Corp. (a) | | | 577 | | | | 13,069 | | |
Kansas City Southern | | | 203 | | | | 15,158 | | |
KAR Auction Services, Inc. | | | 851 | | | | 31,513 | | |
L-3 Communications Holdings, Inc. | | | 248 | | | | 29,638 | | |
Lennox International, Inc. | | | 237 | | | | 29,601 | | |
Lincoln Electric Holdings, Inc. | | | 397 | | | | 20,600 | | |
Lockheed Martin Corp. | | | 156 | | | | 33,876 | | |
Manpowergroup, Inc. | | | 205 | | | | 17,279 | | |
Masco Corp. | | | 717 | | | | 20,291 | | |
Nielsen Holdings PLC | | | 525 | | | | 24,465 | | |
Norfolk Southern Corp. | | | 302 | | | | 25,546 | | |
Northrop Grumman Corp. | | | 160 | | | | 30,210 | | |
Old Dominion Freight Line, Inc. (a) | | | 362 | | | | 21,383 | | |
Owens Corning | | | 391 | | | | 18,389 | | |
PACCAR, Inc. | | | 405 | | | | 19,197 | | |
Parker-Hannifin Corp. | | | 231 | | | | 22,402 | | |
Precision Castparts Corp. | | | 70 | | | | 16,241 | | |
Quanta Services, Inc. (a) | | | 632 | | | | 12,798 | | |
Raytheon Co. | | | 246 | | | | 30,634 | | |
Republic Services, Inc., Class A | | | 794 | | | | 34,928 | | |
Robert Half International, Inc. | | | 448 | | | | 21,119 | | |
See notes to financial statements.
105
Victory Portfolios II
Victory CEMP Long/Short Strategy Fund | | Schedule of Portfolio Investments — continued
December 31, 2015 | |
(Unaudited)
Security Description | | Shares | | Value | |
Rockwell Automation, Inc. | | | 218 | | | $ | 22,369 | | |
Rockwell Collins, Inc. | | | 368 | | | | 33,967 | | |
Rollins, Inc. | | | 873 | | | | 22,611 | | |
Roper Technologies, Inc. | | | 175 | | | | 33,213 | | |
Ryder System, Inc. | | | 274 | | | | 15,571 | | |
Snap-on, Inc. | | | 178 | | | | 30,515 | | |
Southwest Airlines Co. | | | 411 | | | | 17,697 | | |
Stanley Black & Decker, Inc. | | | 280 | | | | 29,884 | | |
Stericycle, Inc. (a) | | | 228 | | | | 27,497 | | |
Textron, Inc. | | | 539 | | | | 22,643 | | |
The ADT Corp. | | | 634 | | | | 20,909 | | |
The Boeing Co. | | | 180 | | | | 26,026 | | |
The Middleby Corp. (a) | | | 191 | | | | 20,603 | | |
Towers Watson & Co. | | | 201 | | | | 25,820 | | |
Union Pacific Corp. | | | 247 | | | | 19,315 | | |
United Continental Holdings, Inc. (a) | | | 235 | | | | 13,466 | | |
United Parcel Service, Inc. | | | 260 | | | | 25,020 | | |
United Rentals, Inc. (a) | | | 185 | | | | 13,420 | | |
United Technologies Corp. | | | 291 | | | | 27,956 | | |
Verisk Analytics, Inc., Class A (a) | | | 335 | | | | 25,755 | | |
W.W. Grainger, Inc. | | | 129 | | | | 26,134 | | |
WABCO Holdings, Inc. (a) | | | 178 | | | | 18,202 | | |
Wabtec Corp. | | | 240 | | | | 17,069 | | |
Waste Connections, Inc. | | | 636 | | | | 35,819 | | |
Xylem, Inc. | | | 821 | | | | 29,967 | | |
| | | | 2,001,869 | | |
Information Technology (10.5%): | |
Adobe Systems, Inc. (a) | | | 301 | | | | 28,275 | | |
Akamai Technologies, Inc. (a) | | | 303 | | | | 15,947 | | |
Alliance Data Systems Corp. (a) | | | 93 | | | | 25,721 | | |
Alphabet, Inc., Class A (a) | | | 26 | | | | 20,228 | | |
Amdocs Ltd. | | | 582 | | | | 31,760 | | |
Amphenol Corp., Class A | | | 482 | | | | 25,175 | | |
Analog Devices, Inc. | | | 305 | | | | 16,873 | | |
ANSYS, Inc. (a) | | | 292 | | | | 27,010 | | |
Apple, Inc. | | | 175 | | | | 18,421 | | |
Applied Materials, Inc. | | | 1,189 | | | | 22,199 | | |
Arista Networks, Inc. (a) | | | 197 | | | | 15,334 | | |
Arrow Electronics, Inc. (a) | | | 345 | | | | 18,692 | | |
Automatic Data Processing, Inc. | | | 343 | | | | 29,059 | | |
Avnet, Inc. | | | 510 | | | | 21,848 | | |
Broadridge Financial Solutions, Inc. | | | 487 | | | | 26,167 | | |
Brocade Communications Systems, Inc. | | | 1,603 | | | | 14,716 | | |
CA, Inc. | | | 901 | | | | 25,733 | | |
Cadence Design Systems, Inc. (a) | | | 1,009 | | | | 20,997 | | |
CDW Corp. | | | 587 | | | | 24,677 | | |
Cisco Systems, Inc. | | | 857 | | | | 23,272 | | |
Citrix Systems, Inc. (a) | | | 276 | | | | 20,879 | | |
Cognizant Technology Solutions Corp., Class A (a) | | | 322 | | | | 19,326 | | |
CommScope Holding Co., Inc. (a) | | | 438 | | | | 11,340 | | |
See notes to financial statements.
106
Victory Portfolios II
Victory CEMP Long/Short Strategy Fund | | Schedule of Portfolio Investments — continued
December 31, 2015 | |
(Unaudited)
Security Description | | Shares | | Value | |
Corning, Inc. | | | 1,325 | | | $ | 24,221 | | |
eBay, Inc. (a) | | | 871 | | | | 23,935 | | |
Electronic Arts, Inc. (a) | | | 262 | | | | 18,005 | | |
EMC Corp. | | | 840 | | | | 21,571 | | |
F5 Networks, Inc. (a) | | | 166 | | | | 16,095 | | |
Facebook, Inc., Class A (a) | | | 224 | | | | 23,444 | | |
Fidelity National Information Services, Inc. | | | 341 | | | | 20,665 | | |
Fiserv, Inc. (a) | | | 319 | | | | 29,176 | | |
FleetCor Technologies, Inc. (a) | | | 159 | | | | 22,726 | | |
Flextronics International Ltd. (a) | | | 1,874 | | | | 21,008 | | |
Gartner, Inc. (a) | | | 307 | | | | 27,845 | | |
Genpact Ltd. (a) | | | 1,083 | | | | 27,053 | | |
Global Payments, Inc. | | | 403 | | | | 25,998 | | |
HP, Inc. | | | 1,435 | | | | 16,990 | | |
Intel Corp. | | | 1,090 | | | | 37,550 | | |
International Business Machines Corp. | | | 173 | | | | 23,808 | | |
IPG Photonics Corp. (a) | | | 191 | | | | 17,030 | | |
Jack Henry & Associates, Inc. | | | 457 | | | | 35,672 | | |
KLA-Tencor Corp. | | | 393 | | | | 27,255 | | |
Lam Research Corp. | | | 264 | | | | 20,967 | | |
Linear Technology Corp. | | | 552 | | | | 23,443 | | |
MasterCard, Inc., Class A | | | 280 | | | | 27,261 | | |
Microchip Technology, Inc. | | | 493 | | | | 22,944 | | |
Micron Technology, Inc. (a) | | | 621 | | | | 8,793 | | |
Motorola Solutions, Inc. | | | 360 | | | | 24,642 | | |
NVIDIA Corp. | | | 696 | | | | 22,940 | | |
Oracle Corp. | | | 694 | | | | 25,352 | | |
Paychex, Inc. | | | 666 | | | | 35,225 | | |
QUALCOMM, Inc. | | | 373 | | | | 18,644 | | |
Red Hat, Inc. (a) | | | 297 | | | | 24,595 | | |
SanDisk Corp. | | | 197 | | | | 14,970 | | |
Seagate Technology PLC | | | 349 | | | | 12,794 | | |
Skyworks Solutions, Inc. | | | 160 | | | | 12,293 | | |
SS&C Technologies Holdings, Inc. | | | 273 | | | | 18,638 | | |
Symantec Corp. | | | 983 | | | | 20,643 | | |
Synopsys, Inc. (a) | | | 599 | | | | 27,320 | | |
Texas Instruments, Inc. | | | 436 | | | | 23,897 | | |
The Ultimate Software Group, Inc. (a) | | | 117 | | | | 22,875 | | |
The Western Union Co. | | | 1,134 | | | | 20,310 | | |
Total System Services, Inc. | | | 513 | | | | 25,547 | | |
Trimble Navigation Ltd. (a) | | | 879 | | | | 18,855 | | |
Tyler Technologies, Inc. (a) | | | 150 | | | | 26,148 | | |
VeriSign, Inc. (a) | | | 383 | | | | 33,459 | | |
Visa, Inc., Class A | | | 344 | | | | 26,677 | | |
VMware, Inc., Class A (a) | | | 248 | | | | 14,029 | | |
Western Digital Corp. | | | 214 | | | | 12,851 | | |
Xerox Corp. | | | 1,869 | | | | 19,867 | | |
Xilinx, Inc. | | | 508 | | | | 23,861 | | |
| | | | 1,593,536 | | |
See notes to financial statements.
107
Victory Portfolios II
Victory CEMP Long/Short Strategy Fund | | Schedule of Portfolio Investments — continued
December 31, 2015 | |
(Unaudited)
Security Description | | Shares | | Value | |
Materials (4.2%): | |
Air Products & Chemicals, Inc. | | | 172 | | | $ | 22,379 | | |
Airgas, Inc. | | | 288 | | | | 39,837 | | |
Alcoa, Inc. | | | 1,583 | | | | 15,624 | | |
Ashland, Inc. | | | 242 | | | | 24,853 | | |
Avery Dennison Corp. | | | 422 | | | | 26,443 | | |
Ball Corp. | | | 333 | | | | 24,219 | | |
CF Industries Holdings, Inc. | | | 291 | | | | 11,876 | | |
Crown Holdings, Inc. (a) | | | 446 | | | | 22,612 | | |
E.I. du Pont de Nemours & Co. | | | 454 | | | | 30,236 | | |
Eastman Chemical Co. | | | 285 | | | | 19,240 | | |
Ecolab, Inc. | | | 247 | | | | 28,252 | | |
International Flavors & Fragrances, Inc. | | | 226 | | | | 27,039 | | |
International Paper Co. | | | 545 | | | | 20,547 | | |
LyondellBasell Industries NV, Class A | | | 194 | | | | 16,859 | | |
Martin Marietta Materials, Inc. | | | 97 | | | | 13,248 | | |
NewMarket Corp. | | | 61 | | | | 23,225 | | |
Newmont Mining Corp. | | | 767 | | | | 13,798 | | |
Nucor Corp. | | | 462 | | | | 18,619 | | |
Packaging Corp. of America | | | 282 | | | | 17,780 | | |
PPG Industries, Inc. | | | 270 | | | | 26,681 | | |
Praxair, Inc. | | | 315 | | | | 32,256 | | |
Sealed Air Corp. | | | 392 | | | | 17,483 | | |
The Dow Chemical Co. | | | 471 | | | | 24,247 | | |
The Mosaic Co. | | | 615 | | | | 16,968 | | |
The Sherwin-Williams Co. | | | 97 | | | | 25,181 | | |
The Valspar Corp. | | | 376 | | | | 31,189 | | |
W.R. Grace & Co. (a) | | | 227 | | | | 22,607 | | |
Westlake Chemical Corp. | | | 297 | | | | 16,133 | | |
| | | | 629,431 | | |
Telecommunication Services (0.1%): | |
CenturyLink, Inc. | | | 780 | | | | 19,625 | | |
Utilities (5.5%): | |
AES Corp. | | | 1,717 | | | | 16,432 | | |
Alliant Energy Corp. | | | 475 | | | | 29,663 | | |
Ameren Corp. | | | 659 | | | | 28,489 | | |
American Electric Power Co., Inc. | | | 486 | | | | 28,319 | | |
American Water Works Co., Inc. | | | 571 | | | | 34,117 | | |
Aqua America, Inc. | | | 1,057 | | | | 31,499 | | |
Atmos Energy Corp. | | | 484 | | | | 30,511 | | |
CenterPoint Energy, Inc. | | | 1,296 | | | | 23,795 | | |
CMS Energy Corp. | | | 734 | | | | 26,483 | | |
Consolidated Edison, Inc. | | | 444 | | | | 28,536 | | |
Dominion Resources, Inc. | | | 417 | | | | 28,206 | | |
DTE Energy Co. | | | 338 | | | | 27,104 | | |
Duke Energy Corp. | | | 387 | | | | 27,628 | | |
Edison International | | | 421 | | | | 24,927 | | |
Entergy Corp. | | | 400 | | | | 27,344 | | |
Eversource Energy | | | 554 | | | | 28,293 | | |
See notes to financial statements.
108
Victory Portfolios II
Victory CEMP Long/Short Strategy Fund | | Schedule of Portfolio Investments — continued
December 31, 2015 | |
(Unaudited)
Security Description | | Shares | | Value | |
Exelon Corp. | | | 699 | | | $ | 19,411 | | |
ITC Holdings Corp. | | | 738 | | | | 28,967 | | |
NextEra Energy, Inc. | | | 281 | | | | 29,193 | | |
OGE Energy Corp. | | | 927 | | | | 24,371 | | |
Pepco Holdings, Inc. | | | 865 | | | | 22,499 | | |
PG&E Corp. | | | 525 | | | | 27,925 | | |
Pinnacle West Capital Corp. | | | 457 | | | | 29,467 | | |
Public Service Enterprise Group, Inc. | | | 584 | | | | 22,595 | | |
SCANA Corp. | | | 479 | | | | 28,974 | | |
Sempra Energy | | | 286 | | | | 26,887 | | |
TECO Energy, Inc. | | | 739 | | | | 19,694 | | |
The Southern Co. | | | 668 | | | | 31,255 | | |
WEC Energy Group, Inc. | | | 509 | | | | 26,117 | | |
Westar Energy, Inc. | | | 724 | | | | 30,705 | | |
Xcel Energy, Inc. | | | 802 | | | | 28,800 | | |
| | | | 838,206 | | |
Total Common Stocks (Cost $10,828,927) | | | 11,575,453 | | |
Cash Equivalents (20.4%) | |
Citibank Money Market Deposit Account, 0.02% (b) | | | 3,091,112 | | | | 3,091,112 | | |
Total Cash Equivalents (Cost $3,091,112) | | | 3,091,112 | | |
Total Investments (Cost $13,920,039) — 96.9% | | | 14,666,565 | | |
Segregated cash with broker — 2.8% (c) | | | 427,359 | | |
Other assets in excess of liabilities — 0.3% | | | 47,155 | | |
NET ASSETS — 100.00% | | $ | 15,141,079 | | |
(a) Non-income producing security.
(b) Rate periodically changes. Rate disclosed is the daily yield on December 31, 2015.
(c) Segregated cash with broker represents collateral for futures contracts.
LLC — Limited Liability Co.
LP — Limited Partnership
PLC — Public Liability Co.
Futures Contracts Sold
| | | Number of
Contracts | | Expiration
Date | | Notional
Amount
at Value | | Unrealized
Depreciation | |
E-Mini S&P 500 Futures | | | 45 | | | 3/21/16 | | $ | 4,579,650 | | | $ | (4,613 | ) | |
See notes to financial statements.
109
Victory Portfolios II
Victory CEMP Market Neutral Income Fund | | Schedule of Portfolio Investments
December 31, 2015 | |
(Unaudited)
Security Description | | Shares | | Value | |
Common Stocks (84.4%) | |
Consumer Discretionary (9.8%): | |
AMC Entertainment Holdings, Inc. | | | 4,689 | | | $ | 112,536 | | |
BAIC Motor Corp. Ltd. | | | 116,000 | | | | 115,850 | | |
Bayerische Motoren Werke AG | | | 1,163 | | | | 122,507 | | |
Belle International Holdings Ltd. | | | 119,000 | | | | 89,040 | | |
Berkeley Group Holdings PLC | | | 2,114 | | | | 114,908 | | |
Best Buy Co., Inc. | | | 2,264 | | | | 68,939 | | |
Capella Education Co. | | | 2,540 | | | | 117,399 | | |
Cheng Shin Rubber Industry Co. Ltd. | | | 149,000 | | | | 240,866 | | |
Chow Tai Fook Jewellery Group Ltd. | | | 116,600 | | | | 75,150 | | |
Coach, Inc. | | | 3,734 | | | | 122,214 | | |
Drew Industries, Inc. | | | 2,856 | | | | 173,902 | | |
DSW, Inc. | | | 4,757 | | | | 113,502 | | |
Eutelsat Communications SA | | | 5,424 | | | | 162,375 | | |
Ford Motor Co. | | | 10,785 | | | | 151,960 | | |
GameStop Corp., Class A | | | 2,188 | | | | 61,352 | | |
General Motors Co. | | | 4,271 | | | | 145,257 | | |
Great Wall Motor Co. Ltd., Class H | | | 92,000 | | | | 106,266 | | |
Guess?, Inc. | | | 4,869 | | | | 91,927 | | |
Hugo Boss AG | | | 1,182 | | | | 97,513 | | |
Imperial Holdings Ltd. | | | 11,008 | | | | 85,411 | | |
Interval Leisure Group, Inc. | | | 8,477 | | | | 132,326 | | |
ITV PLC | | | 36,911 | | | | 150,256 | | |
Jardine Cycle & Carriage Ltd. | | | 6,900 | | | | 168,757 | | |
Kohl's Corp. | | | 1,973 | | | | 93,974 | | |
L Brands, Inc. | | | 1,504 | | | | 144,113 | | |
Las Vegas Sands Corp. | | | 1,941 | | | | 85,093 | | |
McDonald's Corp. | | | 1,699 | | | | 200,720 | | |
MDC Holdings, Inc. | | | 5,342 | | | | 136,381 | | |
Meredith Corp. | | | 3,169 | | | | 137,059 | | |
Next PLC | | | 1,572 | | | | 168,763 | | |
Nutrisystem, Inc. | | | 3,142 | | | | 67,993 | | |
Omnicom Group, Inc. | | | 2,738 | | | | 207,158 | | |
OPAP SA | | | 7,153 | | | | 62,761 | | |
Pier 1 Imports, Inc. | | | 8,267 | | | | 42,079 | | |
ProSiebenSat.1 Media SE | | | 2,418 | | | | 121,975 | | |
Regal Entertainment Group | | | 9,009 | | | | 170,000 | | |
Rent-A-Center, Inc. | | | 3,766 | | | | 56,377 | | |
Shaw Communications, Inc., Class B | | | 11,800 | | | | 202,992 | | |
Sinclair Broadcast Group, Inc. | | | 5,199 | | | | 169,175 | | |
Starwood Hotels & Resorts Worldwide, Inc. | | | 1,598 | | | | 110,709 | | |
Taylor Wimpey PLC | | | 40,709 | | | | 121,677 | | |
TEGNA, Inc. | | | 4,437 | | | | 113,232 | | |
The Buckle, Inc. | | | 3,406 | | | | 104,837 | | |
The Cato Corp., Class A | | | 4,317 | | | | 158,951 | | |
The Wendy's Co. | | | 16,514 | | | | 177,856 | | |
Tofas Turk Otomobil Fabrikasi AS | | | 25,199 | | | | 163,630 | | |
Truworths International Ltd. | | | 19,612 | | | | 115,723 | | |
Tupperware Brands Corp. | | | 2,568 | | | | 142,909 | | |
See notes to financial statements.
110
Victory Portfolios II
Victory CEMP Market Neutral Income Fund | | Schedule of Portfolio Investments — continued
December 31, 2015 | |
(Unaudited)
Security Description | | Shares | | Value | |
UMW Holdings BHD | | | 120,100 | | | $ | 219,874 | | |
Vivendi Universal SA | | | 6,275 | | | | 134,750 | | |
Yulon Nissan Motor Co. Ltd. | | | 24,000 | | | | 203,728 | | |
| | | | 6,654,702 | | |
Consumer Staples (5.2%): | |
Altria Group, Inc. | | | 3,125 | | | | 181,906 | | |
AVI Ltd. | | | 32,244 | | | | 161,261 | | |
British American Tobacco Malaysia BHD | | | 15,500 | | | | 202,329 | | |
British American Tobacco PLC | | | 3,033 | | | | 168,411 | | |
Cal-Maine Foods, Inc. | | | 1,646 | | | | 76,276 | | |
Casino Guichard Perrachon SA | | | 2,227 | | | | 102,296 | | |
Costco Wholesale Corp. | | | 1,193 | | | | 192,670 | | |
General Mills, Inc. | | | 3,708 | | | | 213,802 | | |
John B. Sanfilippo & Son, Inc. | | | 2,019 | | | | 109,087 | | |
Natura Cosmeticos SA | | | 21,200 | | | | 125,398 | | |
Nu Skin Enterprises, Inc. | | | 1,932 | | | | 73,203 | | |
Philip Morris International, Inc. | | | 2,007 | | | | 176,435 | | |
Pilgrim's Pride Corp. | | | 2,877 | | | | 63,553 | | |
Reynolds American, Inc. | | | 3,395 | | | | 156,679 | | |
Sysco Corp. | | | 4,123 | | | | 169,043 | | |
The Coca-Cola Co. | | | 5,782 | | | | 248,395 | | |
The Procter & Gamble Co. | | | 2,802 | | | | 222,507 | | |
Vector Group Ltd. | | | 10,000 | | | | 235,901 | | |
Wal-Mart Stores, Inc. | | | 2,574 | | | | 157,786 | | |
Weis Markets, Inc. | | | 3,724 | | | | 164,973 | | |
Wesfarmers Ltd. | | | 6,949 | | | | 209,442 | | |
Woolworths Ltd. | | | 7,179 | | | | 127,339 | | |
| | | | 3,538,692 | | |
Energy (3.3%): | |
Atwood Oceanics, Inc. | | | 4,482 | | | | 45,851 | | |
Chevron Corp. | | | 1,593 | | | | 143,306 | | |
China Shenhua Energy Co. Ltd. | | | 79,000 | | | | 123,363 | | |
CNOOC Ltd. | | | 104,000 | | | | 108,244 | | |
Coal India Ltd. | | | 29,833 | | | | 148,014 | | |
Exxon Mobil Corp. | | | 2,004 | | | | 156,211 | | |
Gulf International Services QSC | | | 6,478 | | | | 91,158 | | |
Helmerich & Payne, Inc. | | | 1,456 | | | | 77,969 | | |
Inter Pipeline Ltd. | | | 5,800 | | | | 93,110 | | |
Kinder Morgan, Inc. | | | 4,933 | | | | 73,600 | | |
National Oilwell Varco, Inc. | | | 2,328 | | | | 77,965 | | |
ONEOK, Inc. | | | 2,303 | | | | 56,792 | | |
Pembina Pipeline Corp. | | | 4,600 | | | | 100,246 | | |
PetroChina Co. Ltd. | | | 182,000 | | | | 119,148 | | |
Plains GP Holdings LP, Class A | | | 3,568 | | | | 33,718 | | |
Qatar Fuel Co. QSC | | | 4,231 | | | | 170,839 | | |
Sasol Ltd. | | | 3,729 | | | | 100,771 | | |
Spectra Energy Corp. | | | 4,608 | | | | 110,316 | | |
The Williams Cos., Inc. | | | 1,644 | | | | 42,251 | | |
TransCanada Corp. | | | 4,900 | | | | 160,051 | | |
See notes to financial statements.
111
Victory Portfolios II
Victory CEMP Market Neutral Income Fund | | Schedule of Portfolio Investments — continued
December 31, 2015 | |
(Unaudited)
Security Description | | Shares | | Value | |
US Silica Holdings, Inc. | | | 3,314 | | | $ | 62,071 | | |
Woodside Petroleum Ltd. | | | 5,813 | | | | 121,075 | | |
| | | | 2,216,069 | | |
Financials (17.4%): | |
Abu Dhabi Commercial Bank PJSC | | | 59,835 | | | | 106,757 | | |
American Financial Group, Inc. | | | 3,068 | | | | 221,141 | | |
AMP Ltd. | | | 33,137 | | | | 139,584 | | |
Arthur J. Gallagher & Co. | | | 4,903 | | | | 200,729 | | |
Australia & New Zealand Banking Group Ltd. | | | 7,482 | | | | 150,944 | | |
Banco do Brasil SA | | | 22,100 | | | | 81,876 | | |
Banco Santander Chile | | | 4,990,614 | | | | 225,311 | | |
Banco Santander SA | | | 16,780 | | | | 82,536 | | |
Bank of China Ltd. | | | 309,000 | | | | 137,112 | | |
Bank of Communications Co. Ltd., Class H | | | 175,000 | | | | 122,727 | | |
Bank Pekao SA | | | 4,406 | | | | 161,209 | | |
Barclays Africa Group Ltd. | | | 13,887 | | | | 128,970 | | |
BB Seguridade Participacoes SA | | | 19,900 | | | | 121,653 | | |
Capitol Federal Financial, Inc. | | | 22,704 | | | | 285,163 | | |
China Construction Bank Corp. | | | 234,000 | | | | 159,629 | | |
China Development Financial Holding Corp. | | | 526,000 | | | | 131,223 | | |
Chongqing Rural Commercial Bank Co. Ltd. | | | 174,000 | | | | 104,511 | | |
Cincinnati Financial Corp. | | | 3,247 | | | | 192,125 | | |
CME Group, Inc. | | | 1,694 | | | | 153,476 | | |
CNA Financial Corp. | | | 4,704 | | | | 165,346 | | |
CNP Assurances | | | 10,081 | | | | 135,968 | | |
Cohen & Steers, Inc. | | | 5,685 | | | | 173,279 | | |
Columbia Banking System, Inc. | | | 5,454 | | | | 177,310 | | |
Commonwealth Bank of Australia | | | 3,066 | | | | 189,502 | | |
Country Garden Holdings Co. Ltd. | | | 351,000 | | | | 143,057 | | |
Direct Line Insurance Group PLC | | | 38,344 | | | | 229,805 | | |
Dubai Islamic Bank PJSC | | | 82,487 | | | | 138,051 | | |
Emaar Properties PJSC | | | 68,041 | | | | 104,623 | | |
Evergrande Real Estate Group Ltd. | | | 105,000 | | | | 91,928 | | |
FBL Financial Group, Inc., Class A | | | 2,883 | | | | 183,474 | | |
First Gulf Bank PJSC | | | 48,686 | | | | 167,197 | | |
FNB Corp. | | | 13,760 | | | | 183,558 | | |
Fubon Financial Holding Co. Ltd. | | | 91,000 | | | | 123,803 | | |
Gjensidige Forsikring ASA | | | 11,707 | | | | 187,437 | | |
Glacier Bancorp, Inc. | | | 5,515 | | | | 146,313 | | |
Greenhill & Co., Inc. | | | 4,272 | | | | 122,222 | | |
HFF, Inc. | | | 3,486 | | | | 108,310 | | |
HSBC Holdings PLC | | | 19,411 | | | | 153,213 | | |
Huishang Bank Corp. Ltd. | | | 326,000 | | | | 147,251 | | |
Insurance Australia Group Ltd. | | | 38,614 | | | | 155,032 | | |
Invesco Ltd. | | | 4,249 | | | | 142,257 | | |
Komercni Banka AS | | | 829 | | | | 164,699 | | |
Legal & General Group PLC | | | 45,415 | | | | 179,178 | | |
Macquarie Group Ltd. | | | 2,534 | | | | 151,550 | | |
Malayan Banking BHD | | | 124,200 | | | | 242,737 | | |
Manning & Napier, Inc. | | | 9,709 | | | | 82,429 | | |
See notes to financial statements.
112
Victory Portfolios II
Victory CEMP Market Neutral Income Fund | | Schedule of Portfolio Investments — continued
December 31, 2015 | |
(Unaudited)
Security Description | | Shares | | Value | |
Mapfre SA | | | 47,031 | | | $ | 117,710 | | |
Mega Financial Holding Co. Ltd. | | | 287,000 | | | | 185,066 | | |
MetLife, Inc. | | | 2,719 | | | | 131,083 | | |
National Australia Bank Ltd. | | | 7,573 | | | | 165,212 | | |
Natixis SA | | | 17,732 | | | | 100,298 | | |
Navient Corp. | | | 8,008 | | | | 91,692 | | |
New World Development Co. Ltd. | | | 139,000 | | | | 136,494 | | |
New York Community Bancorp, Inc. | | | 9,839 | | | | 160,572 | | |
Nordea Bank AB | | | 10,796 | | | | 118,533 | | |
Northwest Bancshares, Inc. | | | 19,854 | | | | 265,845 | | |
Old Mutual PLC | | | 42,771 | | | | 112,500 | | |
Park National Corp. | | | 2,178 | | | | 197,065 | | |
People's United Financial, Inc. | | | 11,456 | | | | 185,014 | | |
Powszechny Zaklad Ubezpieczen na Zycie SA | | | 17,990 | | | | 155,479 | | |
Principal Financial Group, Inc. | | | 2,713 | | | | 122,031 | | |
ProAssurance Corp. | | | 6,008 | | | | 291,567 | | |
RLI Corp. | | | 3,250 | | | | 200,688 | | |
Standard Chartered PLC | | | 9,744 | | | | 80,836 | | |
Standard Life PLC | | | 22,559 | | | | 129,166 | | |
Suncorp Group Ltd. | | | 19,818 | | | | 173,955 | | |
Swedbank AB, A Shares | | | 6,755 | | | | 148,872 | | |
Swiss Re AG | | | 2,156 | | | | 210,632 | | |
T. Rowe Price Group, Inc. | | | 2,495 | | | | 178,368 | | |
The Commercial Bank QSC | | | 13,918 | | | | 174,876 | | |
Trustmark Corp. | | | 7,536 | | | | 173,629 | | |
Valley National Bancorp | | | 23,130 | | | | 227,832 | | |
Westpac Banking Corp. | | | 6,723 | | | | 162,920 | | |
Woori Bank | | | 18,071 | | | | 135,187 | | |
Zurich Insurance Group AG | | | 559 | | | | 143,650 | | |
| | | | 11,772,977 | | |
Health Care (2.4%): | |
Baxter International, Inc. | | | 4,519 | | | | 172,400 | | |
GlaxoSmithKline PLC | | | 7,980 | | | | 161,140 | | |
Johnson & Johnson | | | 1,957 | | | | 201,024 | | |
Merck & Co., Inc. | | | 2,721 | | | | 143,723 | | |
Meridian Bioscience, Inc. | | | 9,750 | | | | 200,070 | | |
Owens & Minor, Inc. | | | 6,331 | | | | 227,789 | | |
PDL BioPharma, Inc. | | | 25,129 | | | | 88,957 | | |
Pfizer, Inc. | | | 5,483 | | | | 176,991 | | |
Quality Systems, Inc. | | | 8,189 | | | | 132,007 | | |
Select Medical Holdings Corp. | | | 9,579 | | | | 114,086 | | |
| | | | 1,618,187 | | |
Industrials (11.1%): | |
A.P. Moeller-Maersk A/S, Class B | | | 70 | | | | 91,317 | | |
ACS Actividades de Construccion y Servicios SA | | | 3,943 | | | | 115,347 | | |
Aircastle Ltd. | | | 6,407 | | | | 133,842 | | |
Altra Industrial Motion Corp. | | | 6,539 | | | | 163,998 | | |
American Railcar Industries, Inc. | | | 2,570 | | | | 118,940 | | |
Anhui Expressway Co. Ltd. | | | 88,000 | | | | 74,600 | | |
See notes to financial statements.
113
Victory Portfolios II
Victory CEMP Market Neutral Income Fund | | Schedule of Portfolio Investments — continued
December 31, 2015 | |
(Unaudited)
Security Description | | Shares | | Value | |
Applied Industrial Technologies, Inc. | | | 4,002 | | | $ | 162,041 | | |
Atlas Copco AB, A Shares | | | 4,298 | | | | 105,481 | | |
Aurizon Holdings Ltd. | | | 40,629 | | | | 128,946 | | |
BAE Systems PLC | | | 25,952 | | | | 191,045 | | |
Boskalis Westminster | | | 2,216 | | | | 90,383 | | |
BTS Group Holdings Public Co. Ltd. | | | 957,900 | | | | 241,836 | | |
Caterpillar, Inc. | | | 1,774 | | | | 120,561 | | |
CCR SA | | | 33,200 | | | | 104,932 | | |
China Machinery Engineering Corp. | | | 82,000 | | | | 59,833 | | |
Deere & Co. | | | 1,839 | | | | 140,261 | | |
DMCI Holdings, Inc. | | | 633,000 | | | | 185,154 | | |
Eaton Corp. PLC | | | 2,399 | | | | 124,844 | | |
Emerson Electric Co. | | | 3,281 | | | | 156,930 | | |
GATX Corp. | | | 3,208 | | | | 136,500 | | |
H&E Equipment Services, Inc. | | | 3,016 | | | | 52,720 | | |
HAP Seng Consolidated BHD | | | 130,400 | | | | 196,625 | | |
Herman Miller, Inc. | | | 6,396 | | | | 183,565 | | |
Hillenbrand, Inc. | | | 5,783 | | | | 171,350 | | |
HNI Corp. | | | 2,834 | | | | 102,194 | | |
Industries Qatar QSC | | | 4,408 | | | | 134,075 | | |
Insperity, Inc. | | | 2,698 | | | | 129,909 | | |
Jiangsu Expressway Co. Ltd. | | | 118,000 | | | | 158,374 | | |
Joy Global, Inc. | | | 6,171 | | | | 77,816 | | |
Keppel Corp. Ltd. | | | 31,500 | | | | 143,958 | | |
Kuehne + Nagel International AG | | | 1,275 | | | | 174,726 | | |
Lockheed Martin Corp. | | | 920 | | | | 199,778 | | |
McGrath RentCorp | | | 6,149 | | | | 154,893 | | |
Mitsui & Co. Ltd. | | | 11,900 | | | | 141,414 | | |
MSA Safety, Inc. | | | 2,589 | | | | 112,544 | | |
National Presto Industries, Inc. | | | 2,046 | | | | 169,532 | | |
Norfolk Southern Corp. | | | 1,776 | | | | 150,232 | | |
PACCAR, Inc. | | | 2,385 | | | | 113,049 | | |
Raven Industries, Inc. | | | 6,607 | | | | 103,069 | | |
Resources Connection, Inc. | | | 9,251 | | | | 151,161 | | |
Royal Mail PLC | | | 17,877 | | | | 117,076 | | |
Sandvik AB | | | 11,053 | | | | 96,416 | | |
SGS SA | | | 79 | | | | 150,185 | | |
Siemens AG | | | 1,551 | | | | 150,032 | | |
Sime Darby BHD | | | 136,800 | | | | 246,009 | | |
Singapore Technologies Engineering Ltd. | | | 75,300 | | | | 159,243 | | |
Sinopec Engineering Group Co. Ltd., H Shares | | | 102,500 | | | | 87,193 | | |
Skanska AB, Clas B | | | 6,777 | | | | 131,522 | | |
Steelcase, Inc. | | | 9,433 | | | | 140,552 | | |
Sun Hydraulics Corp. | | | 5,355 | | | | 169,914 | | |
TAL International Group, Inc. | | | 5,771 | | | | 91,759 | | |
United Parcel Service, Inc. | | | 1,534 | | | | 147,617 | | |
Vinci SA | | | 2,061 | | | | 132,081 | | |
West Corp. | | | 4,865 | | | | 104,938 | | |
Zhejiang Expressway Co. Ltd., Class H | | | 94,000 | | | | 112,319 | | |
| | | | 7,504,631 | | |
See notes to financial statements.
114
Victory Portfolios II
Victory CEMP Market Neutral Income Fund | | Schedule of Portfolio Investments — continued
December 31, 2015 | |
(Unaudited)
Security Description | | Shares | | Value | |
Information Technology (7.5%): | |
ADTRAN, Inc. | | | 8,756 | | | $ | 150,778 | | |
Advanced Semiconductor Engineering, Inc. | | | 109,000 | | | | 125,233 | | |
Analog Devices, Inc. | | | 1,795 | | | | 99,299 | | |
Asustek Computer, Inc. | | | 16,000 | | | | 132,134 | | |
AVX Corp. | | | 11,483 | | | | 139,404 | | |
CA, Inc. | | | 5,311 | | | | 151,682 | | |
Canon, Inc. | | | 5,400 | | | | 163,370 | | |
Cisco Systems, Inc. | | | 5,052 | | | | 137,187 | | |
Compal Electronics, Inc. | | | 200,000 | | | | 111,941 | | |
CSG Systems International, Inc. | | | 5,654 | | | | 203,431 | | |
FIH Mobile Ltd. | | | 266,000 | | | | 101,238 | | |
Innolux Corp. | | | 280,000 | | | | 84,175 | | |
Intel Corp. | | | 4,106 | | | | 141,452 | | |
International Business Machines Corp. | | | 1,021 | | | | 140,510 | | |
KLA-Tencor Corp. | | | 2,318 | | | | 160,753 | | |
Lenovo Group Ltd. | | | 124,000 | | | | 125,144 | | |
Linear Technology Corp. | | | 3,259 | | | | 138,410 | | |
Lite-On Technology Corp. | | | 187,515 | | | | 180,870 | | |
ManTech International Corp. | | | 6,389 | | | | 193,203 | | |
MediaTek, Inc. | | | 14,000 | | | | 105,908 | | |
Microchip Technology, Inc. | | | 2,908 | | | | 135,338 | | |
NIC, Inc. | | | 6,381 | | | | 125,578 | | |
Oracle Financial Services | | | 3,513 | | | | 198,180 | | |
Paychex, Inc. | | | 3,926 | | | | 207,647 | | |
QUALCOMM, Inc. | | | 2,197 | | | | 109,817 | | |
Quanta Computer, Inc. | | | 96,000 | | | | 154,036 | | |
Science Applications International Corp. | | | 3,019 | | | | 138,210 | | |
Seagate Technology PLC | | | 2,059 | | | | 75,483 | | |
Siliconware Precision Industries Co. Ltd. | | | 108,000 | | | | 170,583 | | |
Symantec Corp. | | | 5,792 | | | | 121,632 | | |
Telefonaktiebolaget LM Ericsson, B Shares | | | 12,303 | | | | 118,699 | | |
Tessera Technologies, Inc. | | | 3,433 | | | | 103,024 | | |
Texas Instruments, Inc. | | | 2,571 | | | | 140,917 | | |
The Western Union Co. | | | 6,685 | | | | 119,728 | | |
Vishay Intertechnology, Inc. | | | 17,247 | | | | 207,826 | | |
Xilinx, Inc. | | | 2,994 | | | | 140,628 | | |
| | | | 5,053,448 | | |
Materials (5.1%): | |
Asia Cement Corp. | | | 267,000 | | | | 222,212 | | |
BASF SE | | | 1,576 | | | | 120,040 | | |
China Hongqiao Group Ltd. | | | 135,000 | | | | 79,955 | | |
China Molybdenum Co. Ltd. | | | 363,000 | | | | 67,513 | | |
China National Building Material Co. Ltd. | | | 176,000 | | | | 83,728 | | |
Commercial Metals Co. | | | 7,850 | | | | 107,467 | | |
E.I. du Pont de Nemours & Co. | | | 2,677 | | | | 178,288 | | |
Eregli Demir ve Celik Fabrikalari TAS | | | 128,505 | | | | 133,757 | | |
Ferroglobe PLC | | | 7,251 | | | | 77,948 | | |
Greif, Inc., Class A | | | 3,285 | | | | 101,211 | | |
Innophos Holdings, Inc. | | | 3,385 | | | | 98,097 | | |
See notes to financial statements.
115
Victory Portfolios II
Victory CEMP Market Neutral Income Fund | | Schedule of Portfolio Investments — continued
December 31, 2015 | |
(Unaudited)
Security Description | | Shares | | Value | |
International Paper Co. | | | 3,213 | | | $ | 121,130 | | |
Israel Chemicals Ltd. | | | 25,079 | | | | 101,829 | | |
Kumba Iron Ore Ltd. | | | 11,902 | | | | 31,735 | | |
LyondellBasell Industries NV, Class A | | | 1,146 | | | | 99,588 | | |
MMC Norilsk Nickel PJSC | | | 642 | | | | 80,631 | | |
Nucor Corp. | | | 2,724 | | | | 109,777 | | |
Olin Corp. | | | 5,904 | | | | 101,903 | | |
P.H. Glatfelter Co. | | | 9,772 | | | | 180,196 | | |
Potash Corp. of Saskatchewan, Inc. | | | 6,400 | | | | 109,635 | | |
PT Indocement Tunggal Prakarsa TBK | | | 105,200 | | | | 168,761 | | |
Rio Tinto PLC | | | 3,101 | | | | 90,274 | | |
Schweitzer-Mauduit International, Inc. | | | 4,606 | | | | 193,406 | | |
Siam City Cement Public Co. Ltd. | | | 20,200 | | | | 178,654 | | |
Taiwan Cement Corp. | | | 192,000 | | | | 158,977 | | |
The Dow Chemical Co. | | | 2,774 | | | | 142,806 | | |
UPM-Kymmene Oyj | | | 6,469 | | | | 120,083 | | |
Yara International ASA | | | 2,863 | | | | 123,175 | | |
Zijin Mining Group Co. Ltd. | | | 334,000 | | | | 87,441 | | |
| | | | 3,470,217 | | |
Telecommunication Services (6.6%): | |
Advanced Info Service Public Co. Ltd. | | | 34,200 | | | | 143,961 | | |
BCE, Inc. | | | 5,100 | | | | 197,070 | | |
CenturyLink, Inc. | | | 4,594 | | | | 115,585 | | |
DiGi.Com BHD | | | 207,200 | | | | 260,361 | | |
Far EasTone Telecommunications Co. Ltd. | | | 104,000 | | | | 213,781 | | |
Inteliquent, Inc. | | | 4,041 | | | | 71,809 | | |
Intouch Holdings Public Co. Ltd. | | | 130,200 | | | | 187,595 | | |
Mobile TeleSystems PJSC | | | 30,780 | | | | 88,656 | | |
MTN Group Ltd. | | | 11,403 | | | | 98,323 | | |
O2 Czech Republic AS | | | 9,017 | | | | 91,249 | | |
Ooredoo QSC | | | 7,985 | | | | 164,194 | | |
Orange Polska SA | | | 75,581 | | | | 126,421 | | |
Orange SA | | | 6,529 | | | | 109,187 | | |
Philippine Long Distance Telephone Co. | | | 4,410 | | | | 192,858 | | |
Proximus SADP | | | 4,042 | | | | 131,513 | | |
Rogers Communications, Inc. | | | 5,600 | | | | 193,156 | | |
Singapore Telecommunications Ltd. | | | 69,000 | | | | 177,976 | | |
Swisscom AG | | | 322 | | | | 161,178 | | |
Taiwan Mobile Co. Ltd. | | | 69,000 | | | | 209,582 | | |
Telefonica SA | | | 11,063 | | | | 122,715 | | |
Telenor ASA | | | 7,103 | | | | 118,438 | | |
TeliaSonera AB | | | 29,566 | | | | 146,923 | | |
Telstra Corp. Ltd. | | | 50,624 | | | | 205,665 | | |
TELUS Corp. | | | 6,400 | | | | 176,989 | | |
Total Access Communication Public Co. Ltd. | | | 81,900 | | | | 68,392 | | |
Turk Telekomunikasyon AS | | | 86,620 | | | | 162,038 | | |
Turkcell Iletisim Hizmetleri AS | | | 46,969 | | | | 159,253 | | |
Vodacom Group Ltd. | | | 20,601 | | | | 203,231 | | |
Vodafone Group PLC | | | 41,598 | | | | 134,874 | | |
| | | | 4,432,973 | | |
See notes to financial statements.
116
Victory Portfolios II
Victory CEMP Market Neutral Income Fund | | Schedule of Portfolio Investments — continued
December 31, 2015 | |
(Unaudited)
Security Description | | Shares | | Value | |
Utilities (16.0%): | |
Aguas Andinas SA | | | 640,216 | | | $ | 323,515 | | |
ALLETE, Inc. | | | 3,916 | | | | 199,050 | | |
Alliant Energy Corp. | | | 2,802 | | | | 174,985 | | |
Ameren Corp. | | | 3,886 | | | | 167,992 | | |
American Electric Power Co., Inc. | | | 2,863 | | | | 166,827 | | |
American States Water Co. | | | 4,261 | | | | 178,749 | | |
Avista Corp. | | | 6,128 | | | | 216,747 | | |
California Water Service Group | | | 7,078 | | | | 164,705 | | |
CenterPoint Energy, Inc. | | | 7,641 | | | | 140,289 | | |
CEZ AS | | | 9,610 | | | | 171,508 | | |
Chesapeake Utilities Corp. | | | 2,694 | | | | 152,885 | | |
China Resources Power Holdings Co. Ltd. | | | 38,000 | | | | 73,521 | | |
CLP Holdings Ltd. | | | 30,500 | | | | 258,526 | | |
CMS Energy Corp. | | | 4,327 | | | | 156,118 | | |
Consolidated Edison, Inc. | | | 2,619 | | | | 168,323 | | |
Dominion Resources, Inc. | | | 2,458 | | | | 166,259 | | |
DTE Energy Co. | | | 1,989 | | | | 159,498 | | |
Duke Energy Corp. | | | 2,277 | | | | 162,555 | | |
EDP — Energias de Portugal SA | | | 36,614 | | | | 131,915 | | |
El Paso Electric Co. | | | 5,233 | | | | 201,471 | | |
Electricite de France SA | | | 7,026 | | | | 103,461 | | |
Enagas SA | | | 5,678 | | | | 160,143 | | |
Endesa SA | | | 7,461 | | | | 149,868 | | |
Energa SA | | | 29,799 | | | | 96,102 | | |
Entergy Corp. | | | 2,362 | | | | 161,466 | | |
Eversource Energy | | | 3,266 | | | | 166,795 | | |
Exelon Corp. | | | 4,120 | | | | 114,412 | | |
Fortis, Inc. | | | 6,000 | | | | 162,241 | | |
Fortum Oyj | | | 7,686 | | | | 115,785 | | |
Gas Natural SDG SA | | | 7,877 | | | | 160,608 | | |
Huaneng Power International, Inc. | | | 92,000 | | | | 78,781 | | |
Iberdrola SA | | | 25,044 | | | | 177,512 | | |
IDACORP, Inc. | | | 3,158 | | | | 214,744 | | |
MGE Energy, Inc. | | | 4,422 | | | | 205,181 | | |
National Grid PLC | | | 13,823 | | | | 190,614 | | |
NorthWestern Corp. | | | 3,906 | | | | 211,901 | | |
OGE Energy Corp. | | | 5,462 | | | | 143,596 | | |
ONE Gas, Inc. | | | 4,326 | | | | 217,035 | | |
Otter Tail Corp. | | | 6,372 | | | | 169,686 | | |
Pepco Holdings, Inc. | | | 5,097 | | | | 132,573 | | |
PG&E Corp. | | | 3,096 | | | | 164,676 | | |
Pinnacle West Capital Corp. | | | 2,693 | | | | 173,645 | | |
PNM Resources, Inc. | | | 6,573 | | | | 200,937 | | |
Power Assets Holdings Ltd. | | | 18,500 | | | | 169,605 | | |
PT Perusahaan Gas Negara Persero TBK | | | 746,100 | | | | 147,158 | | |
Public Service Enterprise Group, Inc. | | | 3,444 | | | | 133,248 | | |
Ratchaburi Electricity Generating Holdings Public Co. Ltd. | | | 167,500 | | | | 220,498 | | |
Red Electrica Corp. SA | | | 1,971 | | | | 164,615 | | |
SCANA Corp. | | | 2,826 | | | | 170,945 | | |
See notes to financial statements.
117
Victory Portfolios II
Victory CEMP Market Neutral Income Fund | | Schedule of Portfolio Investments — continued
December 31, 2015 | |
(Unaudited)
Security Description | | Shares | | Value | |
| SJW Corp. | | | 5,203 | | | $ | 154,269 | | |
Snam SpA | | | 27,757 | | | | 144,842 | | |
Southwest Gas Corp. | | | 3,528 | | | | 194,604 | | |
SSE PLC | | | 6,898 | | | | 154,864 | | |
Suez Environnement Co. | | | 5,482 | | | | 102,518 | | |
TECO Energy, Inc. | | | 4,357 | | | | 116,114 | | |
Terna Rete Elettrica Nazionale SpA | | | 33,626 | | | | 172,912 | | |
The Empire District Electric Co. | | | 7,906 | | | | 221,920 | | |
The Southern Co. | | | 3,940 | | | | 184,353 | | |
Tractebel Energia SA | | | 17,400 | | | | 146,761 | | |
United Utilities Group PLC | | | 11,688 | | | | 160,913 | | |
Veolia Environnement SA | | | 5,788 | | | | 137,306 | | |
WEC Energy Group, Inc. | | | 3,001 | | | | 153,981 | | |
Westar Energy, Inc. | | | 4,268 | | | | 181,006 | | |
Xcel Energy, Inc. | | | 4,728 | | | | 169,782 | | |
YTL Corp. BHD | | | 576,100 | | | | 210,368 | | |
| | | | 10,819,782 | | |
Total Common Stocks (Cost $62,451,191) | | | 57,081,678 | | |
Cash Equivalents (3.5%) | |
Citibank Money Market Deposit Account, 0.02% (a) | | | 2,349,738 | | | | 2,349,738 | | |
Total Cash Equivalents (Cost $2,349,738) | | | 2,349,738 | | |
Total Investments (Cost $64,800,929) — 87.9% | | | 59,431,416 | | |
Segregated cash with broker — 10.6% (b) | | | 7,138,904 | | |
Other assets in excess of liabilities — 1.5% | | | 1,079,139 | | |
NET ASSETS — 100.00% | | $ | 67,649,459 | | |
(a) Rate periodically changes. Rate disclosed is the daily yield on December 31, 2015.
(b) Segregated cash with broker represents collateral for futures contracts and written options.
LP — Limited Partnership
PLC — Public Liability Co.
Written Options
Exchange-traded options
Description | | Put/
Call | | Strike
Price | | Expiration
Date | | Contracts | | Fair Value | |
E-Mini S&P 500 Option | | Put | | USD | 2,025.00 | | | 1/15/16 | | | 131 | | | $ | (145,738 | ) | |
Total | | | | | | | | | | $ | (145,738 | ) | |
Futures Contracts Purchased
| | | Number of
Contracts | | Expiration
Date | | Notional
Amount
at Value | | Unrealized
Depreciation | |
NASDAQ 100 E-Mini Futures | | | 181 | | | 3/21/16 | | $ | 16,607,655 | | | $ | (84,618 | ) | |
See notes to financial statements.
118
Victory Portfolios II
Victory CEMP Market Neutral Income Fund | | Schedule of Portfolio Investments — continued
December 31, 2015 | |
(Unaudited)
Futures Contracts Sold
| | | Number of
Contracts | | Expiration
Date | | Notional
Amount
at Value | | Unrealized
Appreciation/
(Depreciation) | |
CBOE Volatility Index (VIX) Futures | | | 98 | | | 1/21/16 | | $ | 1,815,450 | | | $ | (12,550 | ) | |
E-Mini MSCI Index Futures | | | 361 | | | 3/21/16 | | | 14,214,375 | | | | (7,807 | ) | |
E-Mini S&P 500 Futures | | | 304 | | | 3/21/16 | | | 30,938,080 | | | | (31,160 | ) | |
Mini MSCI EAFE Index Futures | | | 166 | | | 3/21/16 | | | 14,095,060 | | | | (8,051 | ) | |
Russell 2000 Mini Index Futures | | | 125 | | | 3/21/16 | | | 14,143,750 | | | | 68,438 | | |
| | | | | | | | | $ | 8,870 | | |
See notes to financial statements.
119
Victory Portfolios II
Victory CEMP Enhanced Fixed Income Fund | | Schedule of Portfolio Investments
December 31, 2015 | |
(Unaudited)
Security Description | | Par Value or
Principal
Amount | | Value | |
U.S. Treasury Obligations (37.1%) | |
U.S. Treasury Bills
0.17%, 2/18/16 (a) | | $ | 2,000,000 | | | $ | 1,999,528 | | |
Total U.S. Treasury Obligations (Cost $1,999,523) | | | | | 1,999,528 | | |
Commercial Papers (21.3%) | |
HP, Inc., 1.07%, 1/19/16 (a) (b) | | | 600,000 | | | | 599,661 | | |
Thomson Reuters Corp., 0.29%, 1/5/16 (a) (b) | | | 550,000 | | | | 549,978 | | |
Total Commercial Papers (Cost $1,149,671) | | | 1,149,639 | | |
Total Investments (Cost $3,149,194) — 58.4% | | | 3,149,167 | | |
Segregated cash with broker — 4.1% (c) | | | 221,977 | | |
Other assets in excess of liabilities — 37.5% | | | 2,021,695 | | |
NET ASSETS — 100.00% | | $ | 5,392,839 | | |
(a) Rate represents the effective yield at purchase.
(b) Rule 144A security or other security that is restricted as to resale to institutional investors. The Fund's Adviser has deemed this security to be liquid based upon procedures approved by the Board of Trustees.
(c) Segregated cash with broker represents collateral for futures contracts.
Futures Contracts Purchased
| | | Number of
Contracts | | Expiration
Date | | Notional
Amount
at Value | | Unrealized
Appreciation/
(Depreciation) | |
10-Year U.S. Treasury Note | | | 2 | | | 3/22/16 | | $ | 251,813 | | | $ | (413 | ) | |
2-Year U.S. Treasury Note | | | 1 | | | 4/01/16 | | | 217,234 | | | | (316 | ) | |
5-Year U.S. Treasury Note | | | 3 | | | 4/01/16 | | | 354,961 | | | | (713 | ) | |
Canada 10-Year Bond Future | | | 2 | | | 3/22/16 | | | 203,816 | | | | 2,563 | | |
Long Gilt Future | | | 1 | | | 3/30/16 | | | 172,118 | | | | (717 | ) | |
| | | | | | | | | $ | 404 | | |
See notes to financial statements.
120
Victory Portfolios II
Victory CEMP Ultra Short Term Fixed Income Fund | | Schedule of Portfolio Investments
December 31, 2015 | |
(Unaudited)
Security Description | | Shares or
Par Value or
Principal Amount | | Value | |
U.S. Treasury Obligations (52.8%) | |
U.S. Treasury Bills
0.42%, 6/2/16 (a) | | $ | 2,000,000 | | | $ | 1,996,392 | | |
0.44%, 6/9/16 (a) | | | 1,000,000 | | | | 998,039 | | |
0.52%, 11/10/16 (a) | | | 2,500,000 | | | | 2,488,705 | | |
Total U.S. Treasury Obligations (Cost $5,480,282) | | | | | 5,483,136 | | |
Commercial Papers (39.5%) | |
Amcor Ltd., 1.02%, 2/18/16 (a) (b) | | | 500,000 | | | | 499,307 | | |
American Crystal Sugar, 0.67%, 2/1/16 (a) (b) | | | 500,000 | | | | 499,702 | | |
AutoZone, Inc., 0.58%, 1/11/16 (a) (b) | | | 500,000 | | | | 499,912 | | |
Clorox Co., 0.56%, 2/2/16 (a) (b) | | | 500,000 | | | | 499,744 | | |
Dominion Resources, Inc., 0.36%, 2/4/16 (a) (b) | | | 500,000 | | | | 499,825 | | |
Duke Energy Corp., 0.66%, 1/20/16 (a) (b) | | | 500,000 | | | | 499,816 | | |
HP, Inc., 1.07%, 1/19/16 (a) (b) | | | 600,000 | | | | 599,661 | | |
Volvo Treasury NA, LP, 0.76%, 1/25/16 (a) (b) | | | 500,000 | | | | 499,735 | | |
Total Commercial Papers (Cost $4,097,716) | | | 4,097,701 | | |
Cash Equivalents (7.9%) | |
Citibank Money Market Deposit Account, 0.02% (c) | | | 820,667 | | | | 820,667 | | |
Total Cash Equivalents (Cost $820,667) | | | 820,667 | | |
Total Investments (Cost $10,398,665) — 100.2% | | | 10,401,504 | | |
Liabilities in excess of other assets — (0.2)% | | | (19,973 | ) | |
NET ASSETS — 100.00% | | $ | 10,381,531 | | |
(a) Rate represents the effective yield at purchase.
(b) Rule 144A security or other security that is restricted as to resale to institutional investors. The Fund's Adviser has deemed this security to be liquid based upon procedures approved by the Board of Trustees.
(c) Rate periodically changes. Rate disclosed is the daily yield on December 31, 2015.
LP — Limited Partnership
See notes to financial statements.
121
Victory Portfolios II
Victory CEMP Multi-Asset Balanced Fund | | Schedule of Portfolio Investments
December 31, 2015 | |
(Unaudited)
Security Description | | Shares | | Value | |
Affiliated Exchange-Traded Funds (11.3%) | |
Victory CEMP Developed Enhanced Volatility Wtd Index ETF | | | 899 | | | $ | 28,184 | | |
Victory CEMP International High Div Volatility Wtd Index ETF | | | 1,585 | | | | 51,196 | | |
Victory CEMP International Volatility Wtd Index ETF | | | 1,520 | | | | 51,239 | | |
Victory CEMP US 500 Enhanced Volatility Wtd Index ETF | | | 24,121 | | | | 862,085 | | |
Victory CEMP US 500 Volatility Wtd Index ETF | | | 36,119 | | | | 1,293,059 | | |
Victory CEMP US Discovery Enhanced Volatility Wtd Index ETF | | | 12,431 | | | | 429,491 | | |
Victory CEMP US EQ Income Enhanced Volatility Wtd Index ETF | | | 14,790 | | | | 522,827 | | |
Victory CEMP US Large Cap High Div Volatility Wtd Index ETF | | | 1,484 | | | | 51,079 | | |
Victory CEMP US Small Cap High Div Volatility Wtd Index ETF | | | 1,547 | | | | 50,912 | | |
Victory CEMP US Small Cap Volatility Wtd Index ETF | | | 1,547 | | | | 50,958 | | |
Total Affiliated Exchange-Traded Funds (Cost $3,395,554) | | | | | 3,391,030 | | |
Affiliated Mutual Funds (80.9%) | |
Victory CEMP Commodity Enhanced Volatility Wtd Index Strategy Fund | | | 114,907 | | | | 867,550 | | |
Victory CEMP Commodity Volatility Wtd Index Strategy Fund | | | 145,621 | | | | 866,447 | | |
Victory CEMP Emerging Market Volatility Wtd Index Fund | | | 99,678 | | | | 819,351 | | |
Victory CEMP International Enhanced Volatility Wtd Index Fund | | | 323,047 | | | | 3,246,618 | | |
Victory CEMP International Volatility Wtd Index Fund | | | 230,659 | | | | 2,440,374 | | |
Victory CEMP Long/Short Strategy Index Fund | | | 175,405 | | | | 1,875,082 | | |
Victory CEMP Market Neutral Income Fund | | | 1,023,759 | | | | 9,398,110 | | |
Victory CEMP REC Enhanced Volatility Wtd Index Fund | | | 116,171 | | | | 1,082,717 | | |
Victory CEMP US 500 Enhanced Volatility Wtd Index Fund | | | 145,648 | | | | 1,931,290 | | |
Victory CEMP US 500 Volatility Wtd Index Fund | | | 111,584 | | | | 1,365,787 | | |
Victory CEMP US Small Cap Volatility Wtd Index Fund | | | 38,741 | | | | 459,079 | | |
Total Affiliated Mutual Funds (Cost $26,437,780) | | | 24,352,405 | | |
Cash Equivalents (2.2%) | |
Citibank Money Market Deposit Account, 0.02% (a) | | | 672,913 | | | | 672,913 | | |
Total Cash Equivalents (Cost $672,913) | | | 672,913 | | |
Total Investments (Cost $30,506,247) — 94.4% | | | 28,416,348 | | |
Other assets in excess of liabilities — 5.6% | | | 1,691,826 | | |
NET ASSETS — 100.00% | | $ | 30,108,174 | | |
(a) Rate periodically changes. Rate disclosed is the daily yield on December 31, 2015.
ETF — Exchange-Traded Fund
See notes to financial statements.
122
Victory Portfolios II
Victory CEMP Multi-Asset Growth Fund | | Schedule of Portfolio Investments
December 31, 2015 | |
(Unaudited)
Security Description | | Shares | | Value | |
Affiliated Exchange-Traded Funds (92.1%) | |
Victory CEMP International High Div Volatility Wtd Index ETF | | | 94,221 | | | $ | 3,043,338 | | |
Victory CEMP US EQ Income Enhanced Volatility Wtd Index ETF | | | 69,681 | | | | 2,463,223 | | |
Victory CEMP US Large Cap High Div Volatility Wtd Index ETF | | | 88,913 | | | | 3,060,386 | | |
Victory CEMP US Small Cap High Div Volatility Wtd Index ETF | | | 31,699 | | | | 1,043,214 | | |
Total Affiliated Exchange-Traded Funds (Cost $9,780,814) | | | | | 9,610,161 | | |
Cash Equivalents (62.6%) | |
Citibank Money Market Deposit Account, 0.02% (a) | | | 6,532,478 | | | | 6,532,478 | | |
Total Cash Equivalents (Cost $6,532,478) | | | 6,532,478 | | |
Total Investments (Cost $16,313,292) — 154.7% | | | 16,142,639 | | |
Liabilities in excess of other assets — (54.7)% | | | (5,710,849 | ) | |
NET ASSETS — 100.00% | | $ | 10,431,790 | | |
(a) Rate periodically changes. Rate disclosed is the daily yield on December 31, 2015.
ETF — Exchange-Traded Fund
See notes to financial statements.
123
Victory Portfolios II
Victory CEMP Alternative Strategies Fund | | Schedule of Portfolio Investments
December 31, 2015 | |
(Unaudited)
Security Description | | Shares | | Value | |
Affiliated Mutual Funds (95.7%) | |
Victory CEMP Commodity Enhanced Volatility Wtd Index Strategy Fund | | | 361,760 | | | $ | 2,731,287 | | |
Victory CEMP Commodity Volatility Wtd Index Strategy Fund | | | 458,458 | | | | 2,727,825 | | |
Victory CEMP Long/Short Strategy Index Fund | | | 1,006,233 | | | | 10,756,630 | | |
Victory CEMP Market Neutral Income Fund | | | 1,193,606 | | | | 10,957,306 | | |
Total Affiliated Mutual Funds (Cost $29,922,550) | | | | | 27,173,048 | | |
Cash Equivalents (2.1%) | |
Citibank Money Market Deposit Account, 0.02% (a) | | | 582,658 | | | | 582,658 | | |
Total Cash Equivalents (Cost $582,658) | | | 582,658 | | |
Total Investments (Cost $30,505,208) — 97.7% | | | 27,755,706 | | |
Other assets in excess of liabilities — 2.3% | | | 646,651 | | |
NET ASSETS — 100.00% | | $ | 28,402,357 | | |
(a) Rate periodically changes. Rate disclosed is the daily yield on December 31, 2015.
See notes to financial statements.
124
Victory Portfolios II | | Statements of Assets and Liabilities
December 31, 2015 | |
(Unaudited)
| | | Victory CEMP
US 500
Volatility Wtd
Index Fund | | Victory CEMP
US Small Cap
Volatility Wtd
Index Fund | | Victory CEMP
International
Volatility Wtd
Index Fund | | Victory CEMP
Emerging
Market
Volatility Wtd
Index Fund | | Victory CEMP
US 500
Enhanced
Volatility Wtd
Index Fund | |
ASSETS: | |
Investments, at value (Cost
$26,985,490, $7,039,944,
$8,606,614, $13,839,761
and $181,850,455) | | $ | 29,712,430 | | | $ | 7,323,543 | | | $ | 8,519,157 | | | $ | 11,881,321 | | | $ | 193,580,421 | | |
Foreign currency, at value (Cost $0,
$0, $73,793, $9,811 and $0) | | | — | | | | — | | | | 74,474 | | | | 9,777 | | | | — | | |
Deposit with broker for
future contracts | | | 141,208 | | | | 74,577 | | | | 68,499 | | | | 121,794 | | | | 202,913 | | |
Dividends receivable | | | 37,846 | | | | 8,335 | | | | 17,179 | | | | 14,413 | | | | 232,829 | | |
Receivable for capital shares issued | | | 13,308 | | | | 1,581 | | | | 1,186 | | | | 53,389 | | | | 125,234 | | |
Receivable for investments sold | | | — | | | | — | | | | 8,423,117 | | | | — | | | | — | | |
Reclaims receivable | | | — | | | | — | | | | 23,013 | | | | 1 | | | | — | | |
Receivable from adviser | | | — | | | | 1,648 | | | | — | | | | 9,584 | | | | — | | |
Prepaid expenses | | | 25,497 | | | | 17,291 | | | | 17,837 | | | | 70,856 | | | | 91,029 | | |
Total Assets | | | 29,930,289 | | | | 7,426,975 | | | | 17,144,462 | | | | 12,161,135 | | | | 194,232,426 | | |
LIABILITIES: | |
Due to custodian | | | — | | | | — | | | | 7,768,223 | | | | — | | | | — | | |
Payable for investments purchased | | | — | | | | — | | | | 28,979 | | | | 1,113,298 | | | | — | | |
Payable for capital shares redeemed | | | 234,941 | | | | 75,386 | | | | 135,764 | | | | — | | | | 337,721 | | |
Unrealized depreciation on
variation margin | | | 3,962 | | | | 6,718 | | | | 12,405 | | | | 1,700 | | | | 15,603 | | |
Foreign tax payable | | | — | | | | — | | | | — | | | | 2,111 | | | | — | | |
Accrued expenses and other payables: | |
Investment advisory fees | | | 9,446 | | | | — | | | | 2,239 | | | | — | | | | 67,341 | | |
Administration fees | | | 1,807 | | | | 1,853 | | | | 6,176 | | | | 2,864 | | | | — | | |
Custodian fees | | | 3,182 | | | | — | | | | — | | | | — | | | | 2,639 | | |
Transfer agent fees | | | 6,036 | | | | 4,511 | | | | 3,909 | | | | 5,728 | | | | 24,052 | | |
Trustees' fees | | | 30 | | | | — | | | | 42 | | | | 15 | | | | 198 | | |
| 12b-1 fees | | | 6,730 | | | | 2,975 | | | | 2,364 | | | | 2,505 | | | | 69,598 | | |
Other accrued expenses | | | 6,698 | | | | 11,684 | | | | 4,751 | | | | 694 | | | | 4,101 | | |
Total Liabilities | | | 272,832 | | | | 103,127 | | | | 7,964,852 | | | | 1,128,915 | | | | 521,253 | | |
NET ASSETS: | |
Capital | | | 26,932,660 | | | | 7,395,199 | | | | 10,478,574 | | | | 15,183,439 | | | | 183,115,620 | | |
Accumulated undistributed
(distributions in excess of)
net investment income | | | 23,754 | | | | 10,993 | | | | (32,682 | ) | | | 1,216 | | | | 144,643 | | |
Accumulated net realized
losses from investments | | | (108,911 | ) | | | (364,334 | ) | | | (1,166,134 | ) | | | (2,175,277 | ) | | | (1,273,526 | ) | |
Net unrealized appreciation
(depreciation) on investments | | | 2,809,954 | | | | 281,990 | | | | (100,148 | ) | | | (1,977,158 | ) | | | 11,724,436 | | |
Net Assets | | $ | 29,657,457 | | | $ | 7,323,848 | | | $ | 9,179,610 | | | $ | 11,032,220 | | | $ | 193,711,173 | | |
(continues on next page)
See notes to financial statements.
125
Victory Portfolios II | | Statements of Assets and Liabilities
December 31, 2015 | |
(Unaudited)
| | | Victory CEMP
US 500
Volatility Wtd
Index Fund | | Victory CEMP
US Small Cap
Volatility Wtd
Index Fund | | Victory CEMP
International
Volatility Wtd
Index Fund | | Victory CEMP
Emerging
Market
Volatility Wtd
Index Fund | | Victory CEMP
US 500
Enhanced
Volatility Wtd
Index Fund | |
Net Assets | |
Class A Shares | | $ | 15,436,936 | | | $ | 2,493,766 | | | $ | 3,335,073 | | | $ | 7,286,850 | | | $ | 84,485,445 | | |
Class C Shares | | | 3,862,348 | | | | 2,221,988 | | | | 437,389 | | | | 1,419,534 | | | | 57,628,559 | | |
Class I Shares | | | 10,358,173 | | | | 2,608,094 | | | | 5,407,148 | | | | 2,325,836 | | | | 51,597,169 | | |
Total | | $ | 29,657,457 | | | $ | 7,323,848 | | | $ | 9,179,610 | | | $ | 11,032,220 | | | $ | 193,711,173 | | |
Shares (unlimited number of
shares authorized with a par
value of $0.01 per share): | |
Class A Shares | | | 1,263,454 | | | | 211,074 | | | | 315,918 | | | | 887,000 | | | | 6,369,047 | | |
Class C Shares | | | 320,071 | | | | 189,462 | | | | 41,680 | | | | 174,374 | | | | 4,408,595 | | |
Class I Shares | | | 846,212 | | | | 220,018 | | | | 511,144 | | | | 282,929 | | | | 3,889,730 | | |
Total | | | 2,429,737 | | | | 620,554 | | | | 868,742 | | | | 1,344,303 | | | | 14,667,372 | | |
Net aset value, offering (except
Class A Shares) and redemption
price per share: | |
Class A Shares | | $ | 12.22 | | | $ | 11.81 | | | $ | 10.56 | | | $ | 8.22 | | | $ | 13.27 | | |
Class C Shares (a) | | $ | 12.07 | | | $ | 11.73 | | | $ | 10.49 | | | $ | 8.14 | | | $ | 13.07 | | |
Class I Shares | | $ | 12.24 | | | $ | 11.85 | | | $ | 10.58 | | | $ | 8.22 | | | $ | 13.26 | | |
Maximum Sales Charge —
Class A Shares | | | 5.75 | % | | | 5.75 | % | | | 5.75 | % | | | 5.75 | % | | | 5.75 | % | |
Maximum offering price
(100%/(100%-maximum sales
charge) of net asset value adjusted
to the nearest cent) per share —
Class A Shares | | $ | 12.97 | | | $ | 12.53 | | | $ | 11.20 | | | $ | 8.72 | | | $ | 14.08 | | |
(a) Redemption price per share varies by the length of time shares are held.
See notes to financial statements.
126
Victory Portfolios II | | Statements of Assets and Liabilities
December 31, 2015 | |
(Unaudited)
| | | | | | | Consolidated | |
| | | Victory CEMP
International
Enhanced
Volatility Wtd
Index Fund | | Victory CEMP
REC Enhanced
Volatility Wtd
Index Fund | | Victory CEMP
Commodity
Volatility
Wtd Index
Strategy Fund | | Victory CEMP
Commodity
Enhanced
Volatility
Wtd Index
Strategy Fund | |
ASSETS: | |
Investments, at value (Cost $34,879,304,
$8,879,060, $8,315,043 and $5,386,557) | | $ | 34,406,468 | | | $ | 9,318,852 | | | $ | 8,316,319 | | | $ | 5,387,469 | | |
Foreign currency, at value (Cost $236,019,
$0, $0 and $0) | | | 239,807 | | | | — | | | | — | | | | — | | |
Deposit with broker for future contracts | | | 145,931 | | | | 34,249 | | | | 731,085 | | | | 594,293 | | |
Dividends receivable | | | 46,313 | | | | 53,529 | | | | 2,065 | | | | 2,053 | | |
Receivable for capital shares issued | | | — | | | | 100,000 | | | | 13,060 | | | | — | | |
Receivable for investments sold | | | 9,167,802 | | | | — | | | | — | | | | — | | |
Unrealized appreciation on variation margin | | | — | | | | — | | | | 21,201 | | | | 21,373 | | |
Reclaims receivable | | | 102,267 | | | | — | | | | — | | | | — | | |
Receivable from adviser | | | — | | | | — | | | | — | | | | — | | |
Prepaid expenses | | | 48,997 | | | | 14,924 | | | | 22,576 | | | | 26,432 | | |
Total Assets | | | 44,157,585 | | | | 9,521,554 | | | | 9,106,306 | | | | 6,031,620 | | |
LIABILITIES: | |
Due to custodian | | | 8,655,957 | | | | 68,633 | | | | — | | | | — | | |
Payable for investments purchased | | | 32,118 | | | | — | | | | — | | | | — | | |
Payable for capital shares redeemed | | | 185,980 | | | | 15,326 | | | | 84,492 | | | | 5,283 | | |
Unrealized depreciation on variation margin | | | 13,743 | | | | 540 | | | | 25,401 | | | | 18,724 | | |
Accrued expenses and other payables: | |
Investment advisory fees | | | 6,803 | | | | 4,250 | | | | 760 | | | | 1,010 | | |
Administration fees | | | — | | | | 912 | | | | 1,491 | | | | 1,098 | | |
Custodian fees | | | — | | | | 1,435 | | | | 301 | | | | 282 | | |
Transfer agent fees | | | 18,127 | | | | 5,733 | | | | 3,432 | | | | 2,595 | | |
Trustees' fees | | | 100 | | | | — | | | | — | | | | 7 | | |
| 12b-1 fees | | | 11,259 | | | | 2,604 | | | | 1,082 | | | | 504 | | |
Other accrued expenses | | | 2,482 | | | | 6,644 | | | | 3,379 | | | | 2,883 | | |
Total Liabilities | | | 8,926,569 | | | | 106,077 | | | | 120,338 | | | | 32,386 | | |
NET ASSETS: | |
Capital | | | 44,561,977 | | | | 9,736,618 | | | | 14,261,703 | | | | 8,147,511 | | |
Accumulated undistributed (distributions in
excess of) net investment income | | | 146,402 | | | | 96,012 | | | | (1,569,027 | ) | | | (317,957 | ) | |
Accumulated net realized losses
from investments | | | (8,986,257 | ) | | | (857,105 | ) | | | (3,729,572 | ) | | | (1,850,627 | ) | |
Net unrealized appreciation (depreciation)
on investments | | | (491,106 | ) | | | 439,952 | | | | 22,864 | | | | 20,307 | | |
Net Assets | | $ | 35,231,016 | | | $ | 9,415,477 | | | $ | 8,985,968 | | | $ | 5,999,234 | | |
See notes to financial statements.
127
Victory Portfolios II | | Statements of Assets and Liabilities
December 31, 2015 | |
(Unaudited)
| | | | | | | Consolidated | |
| | | Victory CEMP
International
Enhanced
Volatility Wtd
Index Fund | | Victory CEMP
REC Enhanced
Volatility Wtd
Index Fund | | Victory CEMP
Commodity
Volatility
Wtd Index
Strategy Fund | | Victory CEMP
Commodity
Enhanced
Volatility
Wtd Index
Strategy Fund | |
Net Assets | |
Class A Shares | | $ | 16,547,355 | | | $ | 5,114,991 | | | $ | 3,645,836 | | | $ | 666,554 | | |
Class C Shares | | | 7,151,092 | | | | 1,334,799 | | | | 181,127 | | | | 231,435 | | |
Class I Shares | | | 11,532,569 | | | | 2,965,687 | | | | 5,159,005 | | | | 5,101,245 | | |
Total | | $ | 35,231,016 | | | $ | 9,415,477 | | | $ | 8,985,968 | | | $ | 5,999,234 | | |
Shares (unlimited number of shares authorized
with a par value of $0.01 per share): | |
Class A Shares | | | 1,645,572 | | | | 548,994 | | | | 615,950 | | | | 88,816 | | |
Class C Shares | | | 719,157 | | | | 144,532 | | | | 31,340 | | | | 31,654 | | |
Class I Shares | | | 1,147,211 | | | | 318,106 | | | | 866,803 | | | | 675,608 | | |
Total | | | 3,511,940 | | | | 1,011,632 | | | | 1,514,093 | | | | 796,078 | | |
Net aset value, offering (except Class A Shares)
and redemption price per share: | |
Class A Shares | | $ | 10.06 | | | $ | 9.32 | | | $ | 5.92 | | | $ | 7.50 | | |
Class C Shares (a) | | $ | 9.94 | | | $ | 9.24 | | | $ | 5.78 | | | $ | 7.31 | | |
Class I Shares | | $ | 10.05 | | | $ | 9.32 | | | $ | 5.95 | | | $ | 7.55 | | |
Maximum Sales Charge — Class A Shares | | | 5.75 | % | | | 5.75 | % | | | 5.75 | % | | | 5.75 | % | |
Maximum offering price
(100%/(100%-maximum sales charge)
of net asset value adjusted to the nearest
cent) per share — Class A Shares | | $ | 10.67 | | | $ | 9.89 | | | $ | 6.28 | | | $ | 7.96 | | |
(a) Redemption price per share varies by the length of time shares are held.
See notes to financial statements.
128
Victory Portfolios II | | Statements of Assets and Liabilities
December 31, 2015 | |
(Unaudited)
| | | Victory CEMP
Long/Short
Strategy Fund | | Victory CEMP
Market Neutral
Income Fund | | Victory CEMP
Enhanced
Fixed Income
Fund | | Victory CEMP
Ultra Short
Term Fixed
Income Fund | |
ASSETS: | |
Investments, at value (Cost $13,920,039,
$64,800,929, $3,149,194 and $10,398,665) | | $ | 14,666,565 | | | $ | 59,431,416 | | | $ | 3,149,167 | | | $ | 10,401,504 | | |
Cash | | | — | | | | — | | | | 2,120,567 | | | | — | | |
Foreign currency, at value (Cost $0, $52,400,
$0 and $0) | | | — | | | | 51,708 | | | | — | | | | — | | |
Deposit with broker for future contracts | | | 427,359 | | | | 7,138,904 | | | | 221,977 | | | | — | | |
Dividends receivable | | | 18,313 | | | | 103,673 | | | | 117 | | | | 25 | | |
Receivable for capital shares issued | | | — | | | | 134,285 | | | | — | | | | 2,267 | | |
Receivable for investments sold | | | — | | | | 1,097,351 | | | | — | | | | — | | |
Unrealized appreciation on variation margin | | | 43,200 | | | | 658,440 | | | | 1,809 | | | | — | | |
Reclaims receivable | | | — | | | | 14,141 | | | | — | | | | — | | |
Receivable from adviser | | | — | | | | — | | | | — | | | | 1,811 | | |
Prepaid expenses | | | 9,321 | | | | 26,313 | | | | 5,664 | | | | 13,984 | | |
Total Assets | | | 15,164,758 | | | | 68,656,231 | | | | 5,499,301 | | | | 10,419,591 | | |
LIABILITIES: | |
Written options, at value (Proceeds $0,
$290,948, $0 and $0) | | | — | | | | 145,738 | | | | — | | | | — | | |
Payable for investments purchased | | | — | | | | 348,572 | | | | — | | | | — | | |
Payable for capital shares redeemed | | | — | | | | 242,063 | | | | 97,018 | | | | 33,488 | | |
Payable for income | | | — | | | | — | | | | — | | | | 2,047 | | |
Unrealized depreciation on variation margin | | | — | | | | 228,015 | | | | — | | | | — | | |
Foreign tax payable | | | — | | | | 173 | | | | — | | | | — | | |
Accrued expenses and other payables: | |
Investment advisory fees | | | 10,866 | | | | 21,876 | | | | 430 | | | | — | | |
Administration fees | | | 1,684 | | | | — | | | | 160 | | | | 283 | | |
Custodian fees | | | 820 | | | | 3,472 | | | | 2,835 | | | | — | | |
Transfer agent fees | | | 5,274 | | | | 6,021 | | | | 840 | | | | 929 | | |
Chief Compliance Officer fees | | | — | | | | — | | | | 379 | | | | — | | |
Trustees' fees | | | — | | | | — | | | | 307 | | | | 67 | | |
| 12b-1 fees | | | 623 | | | | 6,804 | | | | 3,304 | | | | 873 | | |
Other accrued expenses | | | 4,412 | | | | 4,038 | | | | 1,189 | | | | 373 | | |
Total Liabilities | | | 23,679 | | | | 1,006,772 | | | | 106,462 | | | | 38,060 | | |
NET ASSETS: | |
Capital | | | 14,593,488 | | | | 72,541,775 | | | | 5,705,549 | | | | 10,383,734 | | |
Accumulated undistributed (distributions in
excess of) net investment income | | | 28,662 | | | | 108,627 | | | | (71,122 | ) | | | 475 | | |
Accumulated net realized gains (losses)
from investments | | | (222,984 | ) | | | 295,015 | | | | (159,358 | ) | | | (5,517 | ) | |
Net unrealized appreciation (depreciation)
on investments | | | 741,913 | | | | (5,295,958 | ) | | | (82,230 | ) | | | 2,839 | | |
Net Assets | | $ | 15,141,079 | | | $ | 67,649,459 | | | $ | 5,392,839 | | | $ | 10,381,531 | | |
See notes to financial statements.
129
Victory Portfolios II | | Statements of Assets and Liabilities
December 31, 2015 | |
(Unaudited)
| | | Victory CEMP
Long/Short
Strategy Fund | | Victory CEMP
Market Neutral
Income Fund | | Victory CEMP
Enhanced
Fixed Income
Fund | | Victory CEMP
Ultra Short
Term Fixed
Income Fund | |
Net Assets | |
Class A Shares | | $ | 824,491 | | | $ | 27,588,675 | | | $ | 3,455,643 | | | $ | 2,359,292 | | |
Class C Shares | | | 80,679 | | | | 448,335 | | | | 505,939 | | | | N/A | | |
Class I Shares | | | 14,235,909 | | | | 39,612,449 | | | | 1,431,257 | | | | 8,022,239 | | |
Total | | $ | 15,141,079 | | | $ | 67,649,459 | | | $ | 5,392,839 | | | $ | 10,381,531 | | |
Shares (unlimited number of shares authorized
with a par value of $0.01 per share): | |
Class A Shares | | | 77,468 | | | | 3,014,210 | | | | 363,029 | | | | 236,076 | | |
Class C Shares | | | 7,786 | | | | 49,255 | | | | 53,734 | | | | N/A | | |
Class I Shares | | | 1,331,986 | | | | 4,313,435 | | | | 150,343 | | | | 802,302 | | |
Total | | | 1,417,240 | | | | 7,376,900 | | | | 567,106 | | | | 1,038,378 | | |
Net aset value, offering (except Class A Shares)
and redemption price per share: | |
Class A Shares | | $ | 10.64 | | | $ | 9.15 | | | $ | 9.52 | | | $ | 9.99 | | |
Class C Shares (a) | | $ | 10.36 | | | $ | 9.10 | | | $ | 9.42 | | | | N/A | | |
Class I Shares | | $ | 10.69 | | | $ | 9.18 | | | $ | 9.52 | | | $ | 10.00 | | |
Maximum Sales Charge — Class A Shares | | | 5.75 | % | | | 5.75 | % | | | 2.00 | % | | | 1.00 | % | |
Maximum offering price
(100%/(100%-maximum sales charge)
of net asset value adjusted to the nearest
cent) per share — Class A Shares | | $ | 11.29 | | | $ | 9.71 | | | $ | 9.71 | | | $ | 10.09 | | |
(a) Redemption price per share varies by the length of time shares are held.
See notes to financial statements.
130
Victory Portfolios II | | Statements of Assets and Liabilities
December 31, 2015 | |
(Unaudited)
| | | Victory CEMP
Multi-Asset
Balanced Fund | | Victory CEMP
Multi-Asset
Growth Fund | | Victory CEMP
Alternative
Strategies
Fund | |
ASSETS: | |
Affiliated investments, at value
(Cost $29,833,334, $9,780,814 and
$29,922,550) | | $ | 27,743,435 | | | $ | 9,610,161 | | | $ | 27,173,048 | | |
Unaffiliated investments, at value
(Cost $672,913, $6,532,478 and $582,658) | | | 672,913 | | | | 6,532,478 | | | | 582,658 | | |
Cash | | | 1,138,462 | | | | — | | | | 772,509 | | |
Dividends receivable | | | 9 | | | | 10 | | | | 6 | | |
Receivable for capital shares issued | | | 2,928 | | | | 3,901 | | | | 56 | | |
Receivable for investments sold | | | 910,705 | | | | 599,522 | | | | — | | |
Receivable from adviser | | | 8,418 | | | | 5,925 | | | | 14,178 | | |
Prepaid expenses | | | 29,719 | | | | 19,475 | | | | 28,084 | | |
Total Assets | | | 30,506,589 | | | | 16,771,472 | | | | 28,570,539 | | |
LIABILITIES: | |
Payable for investments purchased | | | 328,479 | | | | 6,325,484 | | | | — | | |
Payable for capital shares redeemed | | | 42,891 | | | | — | | | | 133,301 | | |
Accrued expenses and other payables: | |
Administration fees | | | 375 | | | | 1,598 | | | | — | | |
Custodian fees | | | 1,657 | | | | 1,004 | | | | 642 | | |
Transfer agent fees | | | 9,698 | | | | 4,365 | | | | 22,277 | | |
Trustees' fees | | | 56 | | | | — | | | | 83 | | |
| 12b-1 fees | | | 13,043 | | | | 4,870 | | | | 9,565 | | |
Other accrued expenses | | | 2,216 | | | | 2,361 | | | | 2,314 | | |
Total Liabilities | | | 398,415 | | | | 6,339,682 | | | | 168,182 | | |
NET ASSETS: | |
Capital | | | 32,084,809 | | | | 11,168,864 | | | | 35,660,601 | | |
Accumulated undistributed (distributions in
excess of) net investment income | | | 112,096 | | | | (12,994 | ) | | | (36,027 | ) | |
Accumulated net realized gains (losses)
from investments | | | 1,168 | | | | (553,427 | ) | | | (4,472,715 | ) | |
Net unrealized depreciation on investments | | | (2,089,899 | ) | | | (170,653 | ) | | | (2,749,502 | ) | |
Net Assets | | $ | 30,108,174 | | | $ | 10,431,790 | | | $ | 28,402,357 | | |
See notes to financial statements.
131
Victory Portfolios II | | Statements of Assets and Liabilities
December 31, 2015 | |
(Unaudited)
| | | Victory CEMP
Multi-Asset
Balanced Fund | | Victory CEMP
Multi-Asset
Growth Fund | | Victory CEMP
Alternative
Strategies
Fund | |
Net Assets | | | | | | | |
Class A Shares | | $ | 20,465,643 | | | $ | 6,605,657 | | | $ | 23,401,272 | | |
Class C Shares | | | 9,642,531 | | | | 3,826,133 | | | | 5,001,085 | | |
Total | | $ | 30,108,174 | | | $ | 10,431,790 | | | $ | 28,402,357 | | |
Shares (unlimited number of shares authorized
with a par value of $0.01 per share): | | | | | | | |
Class A Shares | | | 1,954,935 | | | | 773,208 | | | | 2,496,223 | | |
Class C Shares | | | 939,127 | | | | 464,752 | | | | 546,611 | | |
Total | | | 2,894,062 | | | | 1,237,960 | | | | 3,042,834 | | |
Net aset value, offering (except Class A Shares)
and redemption price per share: | | | | | | | |
Class A Shares | | $ | 10.47 | | | $ | 8.54 | | | $ | 9.37 | | |
Class C Shares (a) | | $ | 10.27 | | | $ | 8.23 | | | $ | 9.15 | | |
Maximum Sales Charge — Class A Shares | | | 5.75 | % | | | 5.75 | % | | | 5.75 | % | |
Maximum offering price
(100%/(100%-maximum sales charge) of
net asset value adjusted to the nearest cent)
per share — Class A Shares | | $ | 11.11 | | | $ | 9.06 | | | $ | 9.94 | | |
(a) Redemption price per share varies by the length of time shares are held.
See notes to financial statements.
132
Victory Portfolios II | | Statements of Operations
For the Six Months Ended December 31, 2015 | |
(Unaudited)
| | | Victory CEMP
US 500
Volatility Wtd
Index Fund | | Victory CEMP
US Small Cap
Volatility Wtd
Index Fund | | Victory CEMP
International
Volatility Wtd
Index Fund | | Victory CEMP
Emerging
Market
Volatility Wtd
Index Fund | | Victory CEMP
US 500
Enhanced
Volatility Wtd
Index Fund | |
Investment Income: | |
Dividend income | | $ | 299,005 | | | $ | 99,501 | | | $ | 180,943 | | | $ | 181,339 | | | $ | 1,855,482 | | |
Securities lending income | | | 2,331 | | | | 10,406 | | | | 274 | | | | 1,247 | | | | 9,152 | | |
Foreign tax withholding | | | — | | | | — | | | | (21,730 | ) | | | (15,509 | ) | | | — | | |
Total Income | | | 301,336 | | | | 109,907 | | | | 159,487 | | | | 167,077 | | | | 1,864,634 | | |
Expenses: | |
Investment advisory fees | | | 116,394 | | | | 47,253 | | | | 76,196 | | | | 59,508 | | | | 713,567 | | |
Administration fees | | | 18,360 | | | | 10,800 | | | | 29,205 | | | | 23,851 | | | | 82,942 | | |
12B-1 fees — Class A Shares | | | 22,206 | | | | 9,692 | | | | 12,928 | | | | 8,998 | | | | 100,123 | | |
12B-1 fees — Class C Shares | | | 11,639 | | | | 10,346 | | | | 950 | | | | 7,195 | | | | 292,781 | | |
12B-1 fees — Class T Shares | | | 477 | | | | 166 | | | | 32 | | | | 454 | | | | 25,911 | | |
Custodian fees | | | 3,798 | | | | 1,137 | | | | 28,029 | | | | 69,360 | | | | 13,418 | | |
Transfer agent fees — Class A Shares | | | 5,031 | | | | 3,936 | | | | 3,345 | | | | 2,981 | | | | 21,944 | | |
Transfer agent fees — Class C Shares | | | 681 | | | | 1,199 | | | | 155 | | | | 1,116 | | | | 14,882 | | |
Transfer agent fees — Class I Shares | | | 3,767 | | | | 1,592 | | | | 3,256 | | | | 3,854 | | | | 21,986 | | |
Transfer agent fees — Class T Shares | | | 56 | | | | 21 | | | | 5 | | | | 57 | | | | — | | |
Trustees' fees | | | 1,723 | | | | 780 | | | | 1,054 | | | | 866 | | | | 10,489 | | |
Chief Compliance Officer fees | | | 1,606 | | | | 785 | | | | 1,046 | | | | 897 | | | | 10,056 | | |
Legal and audit fees | | | 12,542 | | | | 6,321 | | | | 8,018 | | | | 6,771 | | | | 69,982 | | |
State registration and filing fees | | | 12,610 | | | | 12,550 | | | | 10,075 | | | | 10,075 | | | | 25,220 | | |
Other expenses | | | 8,171 | | | | 6,783 | | | | 6,380 | | | | 6,738 | | | | 35,055 | | |
Total Expenses | | | 219,061 | | | | 113,361 | | | | 180,674 | | | | 202,721 | | | | 1,438,356 | | |
Expenses waived/reimbursed
by Adviser | | | (62,234 | ) | | | (43,583 | ) | | | (86,441 | ) | | | (123,175 | ) | | | (273,784 | ) | |
Net Expenses | | | 156,827 | | | | 69,778 | | | | 94,233 | | | | 79,546 | | | | 1,164,572 | | |
Net Investment Income | | | 144,509 | | | | 40,129 | | | | 65,254 | | | | 87,531 | | | | 700,062 | | |
Realized/Unrealized Gains (Losses)
from Investment Transactions: | |
Net realized gains (losses) from
investment transactions | | | 180,074 | | | | (142,536 | ) | | | (840,493 | ) | | | (1,328,366 | ) | | | 830,489 | | |
Net realized gains (losses) from
future contracts | | | 15,183 | | | | (88,508 | ) | | | (63,333 | ) | | | (447,510 | ) | | | 19,473 | | |
Net change in unrealized appreciation
(depreciation) on investments | | | (1,061,376 | ) | | | (911,879 | ) | | | (412,197 | ) | | | (1,471,726 | ) | | | (6,874,146 | ) | |
Net change in unrealized appreciation
(depreciation) from future contracts | | | 11,714 | | | | 2,992 | | | | 19,459 | | | | 9,679 | | | | 77,308 | | |
Net realized/unrealized gains (losses)
from investment transactions | | | (854,405 | ) | | | (1,139,931 | ) | | | (1,296,564 | ) | | | (3,237,923 | ) | | | (5,946,876 | ) | |
Change in net assets resulting
from operations | | $ | (709,896 | ) | | $ | (1,099,802 | ) | | $ | (1,231,310 | ) | | $ | (3,150,392 | ) | | $ | (5,246,814 | ) | |
See notes to financial statements.
133
Victory Portfolios II | | Statements of Operations
For the Six Months Ended December 31, 2015 | |
(Unaudited)
| | | | | | | Consolidated | |
| | | Victory CEMP
International
Enhanced
Volatility Wtd
Index Fund | | Victory CEMP
REC Enhanced
Volatility Wtd
Index Fund | | Victory CEMP
Commodity
Volatility
Wtd Index
Strategy Fund | | Victory CEMP
Commodity
Enhanced
Volatility
Wtd Index
Strategy Fund | |
Investment Income: | |
Dividend income from
affiliated investments | | $ | — | | | $ | — | | | $ | 572 | | | $ | 442 | | |
Dividend income from
unaffiliated investments | | | 614,733 | | | | 234,697 | | | | 794 | | | | 843 | | |
Interest income from
unaffiliated investments | | | — | | | | — | | | | 27,517 | | | | 17,308 | | |
Securities lending income | | | 767 | | | | 16,681 | | | | — | | | | — | | |
Foreign tax withholding | | | (40,228 | ) | | | (735 | ) | | | — | | | | — | | |
Total Income | | | 575,272 | | | | 250,643 | | | | 28,883 | | | | 18,593 | | |
Expenses: | |
Investment advisory fees | | | 255,491 | | | | 86,482 | | | | 40,003 | | | | 29,704 | | |
Administration fees | | | 45,824 | | | | 8,663 | | | | 6,296 | | | | 5,341 | | |
12B-1 fees — Class A Shares | | | 27,531 | | | | 9,231 | | | | 6,326 | | | | 1,928 | | |
12B-1 fees — Class C Shares | | | 36,782 | | | | 7,216 | | | | 986 | | | | 1,229 | | |
12B-1 fees — Class T Shares | | | 6,060 | | | | 437 | | | | 24 | | | | 123 | | |
Custodian fees | | | 45,354 | | | | 1,984 | | | | 737 | | | | 568 | | |
Transfer agent fees — Class A Shares | | | 8,624 | | | | 4,316 | | | | 2,492 | | | | 945 | | |
Transfer agent fees — Class C Shares | | | 3,850 | | | | 953 | | | | 186 | | | | 170 | | |
Transfer agent fees — Class I Shares | | | 14,738 | | | | 4,893 | | | �� | 2,325 | | | | 3,382 | | |
Transfer agent fees — Class T Shares | | | 828 | | | | 92 | | | | 4 | | | | 31 | | |
Trustees' fees | | | 3,779 | | | | 926 | | | | 532 | | | | 394 | | |
Chief Compliance Officer fees | | | 3,728 | | | | 957 | | | | 538 | | | | 358 | | |
Legal and audit fees | | | 25,865 | | | | 7,251 | | | | 5,443 | | | | 4,388 | | |
State registration and filing fees | | | 12,610 | | | | 10,075 | | | | 10,075 | | | | 5,068 | | |
Other expenses | | | 14,084 | | | | 5,419 | | | | 3,870 | | | | 3,115 | | |
Total Expenses | | | 505,148 | | | | 148,895 | | | | 79,837 | | | | 56,744 | | |
Expenses waived/reimbursed
by Adviser | | | (165,090 | ) | | | (36,741 | ) | | | (30,136 | ) | | | (21,973 | ) | |
Net Expenses | | | 340,058 | | | | 112,154 | | | | 49,701 | | | | 34,771 | | |
Net Investment Income | | | 235,214 | | | | 138,489 | | | | (20,818 | ) | | | (16,178 | ) | |
Realized/Unrealized Gains (Losses)
from Investment Transactions: | |
Net realized gains (losses) from
investment transactions | | | (7,571,380 | ) | | | (806,829 | ) | | | (15,346 | ) | | | (2,969 | ) | |
Net realized gains (losses) from
future contracts | | | (348,608 | ) | | | (53,112 | ) | | | (1,756,089 | ) | | | (966,985 | ) | |
Net change in unrealized appreciation
(depreciation) on investments | | | (218,490 | ) | | | 435,814 | | | | 4,814 | | | | (1,101 | ) | |
Net change in unrealized appreciation
(depreciation) from future contracts | | | 74,336 | | | | 25,830 | | | | (32,022 | ) | | | (5,531 | ) | |
Net realized/unrealized gains (losses)
from investment transactions | | | (8,064,142 | ) | | | (398,297 | ) | | | (1,798,643 | ) | | | (976,586 | ) | |
Change in net assets resulting
from operations | | $ | (7,828,928 | ) | | $ | (259,808 | ) | | $ | (1,819,461 | ) | | $ | (992,764 | ) | |
See notes to financial statements.
134
Victory Portfolios II | | Statements of Operations
For the Six Months Ended December 31, 2015 | |
(Unaudited)
| | | Victory CEMP
Long/Short
Strategy Fund | | Victory CEMP
Market Neutral
Income Fund | | Victory CEMP
Enhanced
Fixed Income
Fund | | Victory CEMP
Ultra Short
Term Fixed
Income Fund | |
Investment Income: | |
Dividend income from
affiliated investments | | $ | — | | | $ | — | | | $ | 1,059 | | | $ | — | | |
Dividend income from
unaffiliated investments | | | 127,520 | | | | 943,261 | | | | 2,886 | | | | 437 | | |
Interest income from
unaffiliated investments | | | — | | | | — | | | | 55,219 | | | | 40,374 | | |
Securities lending income | | | 1,962 | | | | 11,246 | | | | 4 | | | | — | | |
Foreign tax withholding | | | — | | | | (39,676 | ) | | | — | | | | — | | |
Total Income | | | 129,482 | | | | 914,831 | | | | 59,168 | | | | 40,811 | | |
Expenses: | |
Investment advisory fees | | | 85,326 | | | | 176,329 | | | | 39,574 | | | | 27,879 | | |
Administration fees | | | 11,427 | | | | 41,153 | | | | 10,782 | | | | 6,928 | | |
12B-1 fees — Class A Shares | | | 3,563 | | | | 38,782 | | | | 19,038 | | | | 5,798 | | |
12B-1 fees — Class C Shares | | | 411 | | | | 2,340 | | | | 2,805 | | | | — | | |
12B-1 fees — Class T Shares | | | 16 | | | | 105 | | | | 396 | | | | — | | |
Custodian fees | | | 1,305 | | | | 10,602 | | | | 3,399 | | | | 795 | | |
Transfer agent fees — Class A Shares | | | 1,536 | | | | 5,431 | | | | 851 | | | | 792 | | |
Transfer agent fees — Class C Shares | | | 100 | | | | 252 | | | | 129 | | | | — | | |
Transfer agent fees — Class I Shares | | | 6,875 | | | | 7,218 | | | | 915 | | | | 1,732 | | |
Transfer agent fees — Class T Shares | | | 5 | | | | 9 | | | | 4 | | | | — | | |
Trustees' fees | | | 745 | | | | 2,845 | | | | 1,359 | | | | 742 | | |
Chief Compliance Officer fees | | | 739 | | | | 2,743 | | | | 1,689 | | | | 649 | | |
Legal and audit fees | | | 6,058 | | | | 19,406 | | | | 8,605 | | | | 5,940 | | |
State registration and filing fees | | | 5,008 | | | | 5,008 | | | | 5,915 | | | | 5,006 | | |
Other expenses | | | 5,705 | | | | 9,950 | | | | 6,419 | | | | 3,893 | | |
Total Expenses | | | 128,819 | | | | 322,173 | | | | 101,880 | | | | 60,154 | | |
Expenses waived/reimbursed
by Adviser | | | (35,969 | ) | | | (89,944 | ) | | | (34,490 | ) | | | (36,992 | ) | |
Net Expenses | | | 92,850 | | | | 232,229 | | | | 67,390 | | | | 23,162 | | |
Net Investment Income | | | 36,632 | | | | 682,602 | | | | (8,222 | ) | | | 17,649 | | |
Realized/Unrealized Gains (Losses)
from Investment Transactions: | |
Net realized gains (losses) from
investment transactions | | | (171,655 | ) | | | (2,469,297 | ) | | | (63,012 | ) | | | (4,885 | ) | |
Net realized gains (losses) from
future contracts | | | 124,586 | | | | 4,511,740 | | | | (68,296 | ) | | | — | | |
Net realized gains (losses) from
written options | | | — | | | | 1,176,791 | | | | — | | | | — | | |
Net change in unrealized appreciation
(depreciation) on investments | | | (199,418 | ) | | | (3,017,174 | ) | | | (5,657 | ) | | | (625 | ) | |
Net change in unrealized appreciation
(depreciation) from future contracts | | | (124,763 | ) | | | (1,177,487 | ) | | | 8,272 | | | | — | | |
Net change in unrealized appreciation
(depreciation) from written options | | | — | | | | 502,215 | | | | — | | | | — | | |
Net realized/unrealized gains (losses)
from investment transactions | | | (371,250 | ) | | | (473,212 | ) | | | (128,693 | ) | | | (5,510 | ) | |
Change in net assets resulting
from operations | | $ | (334,618 | ) | | $ | 209,390 | | | $ | (136,915 | ) | | $ | 12,139 | | |
See notes to financial statements.
135
Victory Portfolios II | | Statements of Operations
For the Six Months Ended December 31, 2015 | |
(Unaudited)
| | | Victory CEMP
Multi-Asset
Balanced Fund | | Victory CEMP
Multi-Asset
Growth Fund | | Victory CEMP
Alternative
Strategies
Fund | |
Investment Income: | |
Dividend income from affiliated investments | | $ | 433,500 | | | $ | 97,316 | | | $ | 560,309 | | |
Dividend income from unaffiliated investments | | | 647 | | | | 300 | | | | 485 | | |
Total Income | | | 434,147 | | | | 97,616 | | | | 560,794 | | |
Expenses: | |
Administration fees | | | 15,917 | | | | 7,420 | | | | 15,639 | | |
12B-1 fees — Class A Shares | | | 25,953 | | | | 8,329 | | | | 34,691 | | |
12B-1 fees — Class C Shares | | | 54,039 | | | | 21,782 | | | | 29,489 | | |
12B-1 fees — Class T Shares | | | 9,876 | | | | 4,890 | | | | 3,077 | | |
Custodian fees | | | 3,688 | | | | 1,814 | | | | 2,841 | | |
Transfer agent fees — Class A Shares | | | 9,267 | | | | 4,259 | | | | 23,079 | | |
Transfer agent fees — Class C Shares | | | 4,278 | | | | 1,886 | | | | 4,669 | | |
Transfer agent fees — Class T Shares | | | 649 | | | | 349 | | | | 403 | | |
Trustees' fees | | | 2,022 | | | | 695 | | | | 2,143 | | |
Chief Compliance Officer fees | | | 1,920 | | | | 672 | | | | 2,077 | | |
Legal and audit fees | | | 13,728 | | | | 5,573 | | | | 14,379 | | |
State registration and filing fees | | | 20,152 | | | | 17,678 | | | | 20,152 | | |
Other expenses | | | 6,832 | | | | 3,900 | | | | 7,928 | | |
Total Expenses | | | 168,321 | | | | 79,247 | | | | 160,567 | | |
Expenses waived/reimbursed by Adviser | | | (34,746 | ) | | | (28,405 | ) | | | (49,455 | ) | |
Net Expenses | | | 133,575 | | | | 50,842 | | | | 111,112 | | |
Net Investment Income | | | 300,572 | | | | 46,774 | | | | 449,682 | | |
Realized/Unrealized Gains (Losses) from
Investment Transactions: | |
Net realized gains (losses) from affiliated
investment transactions | | | 210,974 | | | | (254,984 | ) | | | (216,297 | ) | |
Net change in unrealized depreciation
on affiliated investments | | | (2,072,239 | ) | | | (604,270 | ) | | | (2,221,698 | ) | |
Net realized/unrealized gains (losses)
from investment transactions | | | (1,861,265 | ) | | | (859,254 | ) | | | (2,437,995 | ) | |
Change in net assets resulting from operations | | $ | (1,560,693 | ) | | $ | (812,480 | ) | | $ | (1,988,313 | ) | |
See notes to financial statements.
136
Victory Portfolios II Statements of Changes in Net Assets
| | | Victory
CEMP US 500
Volatility Wtd Index
Fund | | Victory
CEMP US Small Cap
Volatility Wtd Index
Fund | | Victory
CEMP International
Volatility Wtd Index
Fund | |
| | | For the
Six
Months
Ended
December 31,
2015 | | Year
Ended
June 30,
2015 | | For the
Six
Months
Ended
December 31,
2015 | | Year
Ended
June 30,
2015 | | For the
Six
Months
Ended
December 31,
2015 | | Year
Ended
June 30,
2015 | |
| | | (Unaudited) | | | | (Unaudited) | | | | (Unaudited) | | | |
From Investment Activities: | |
Operations: | |
Net investment income | | $ | 144,509 | | | $ | 319,386 | | | $ | 40,129 | | | $ | 84,373 | | | $ | 65,254 | | | $ | 336,667 | | |
Net realized gains
(losses) from
investment
transactions | | | 195,257 | | | | 4,590,533 | | | | (231,044 | ) | | | 1,259,722 | | | | (903,826 | ) | | | (2,585 | ) | |
Distributions of realized
gains from underyling
investment companies | | | — | | | | — | | | | — | | | | 1,441 | | | | — | | | | — | | |
Net change in unrealized
depreciation on
investments | | | (1,049,662 | ) | | | (2,518,389 | ) | | | (908,887 | ) | | | (504,138 | ) | | | (392,738 | ) | | | (2,395,412 | ) | |
Change in net assets resulting
from operations | | | (709,896 | ) | | | 2,391,530 | | | | (1,099,802 | ) | | | 841,398 | | | | (1,231,310 | ) | | | (2,061,330 | ) | |
Distributions to Shareholders: | |
From net investment
income: | |
Class A Shares | | | (61,588 | ) | | | (133,291 | ) | | | (18,539 | ) | | | (43,499 | ) | | | (32,450 | ) | | | (138,887 | ) | |
Class C Shares | | | (3,665 | ) | | | (1,167 | ) | | | (23 | ) | | | (361 | ) | | | (166 | ) | | | (826 | ) | |
Class I Shares | | | (60,517 | ) | | | (177,326 | ) | | | (14,406 | ) | | | (44,254 | ) | | | (36,931 | ) | | | (192,804 | ) | |
Class T Shares | | | — | | | | (1,534 | ) | | | — | | | | (248 | ) | | | (43 | ) | | | (193 | ) | |
From net realized gains: | |
Class A Shares | | | (1,495,734 | ) | | | (1,478,698 | ) | | | (407,378 | ) | | | (559,095 | ) | | | (572 | ) | | | (732,838 | ) | |
Class C Shares | | | (356,473 | ) | | | (105,106 | ) | | | (178,723 | ) | | | (163,961 | ) | | | (26 | ) | | | (7,708 | ) | |
Class I Shares | | | (1,051,727 | ) | | | (2,032,582 | ) | | | (242,064 | ) | | | (636,483 | ) | | | (428 | ) | | | (1,348,626 | ) | |
Class T Shares | | | — | | | | (26,775 | ) | | | — | | | | (6,639 | ) | | | — | | | | (1,107 | ) | |
Change in net assets
resulting from
distributions to
shareholders | | | (3,029,704 | ) | | | (3,956,479 | ) | | | (861,133 | ) | | | (1,454,540 | ) | | | (70,616 | ) | | | (2,422,989 | ) | |
Change in net assets from
capital transactions | | | (428,796 | ) | | | (12,906,131 | ) | | | (8,425,827 | ) | | | (1,355,027 | ) | | | (10,245,615 | ) | | | (10,938,295 | ) | |
Change in net assets | | | (4,168,396 | ) | | | (14,471,080 | ) | | | (10,386,762 | ) | | | (1,968,169 | ) | | | (11,547,541 | ) | | | (15,422,614 | ) | |
Net Assets: | |
Beginning of period | | | 33,825,853 | | | | 48,296,933 | | | | 17,710,610 | | | | 19,678,779 | | | | 20,727,151 | | | | 36,149,765 | | |
End of period | | $ | 29,657,457 | | | $ | 33,825,853 | | | $ | 7,323,848 | | | $ | 17,710,610 | | | $ | 9,179,610 | | | $ | 20,727,151 | | |
Accumulated undistributed
(distributions in excess of)
net investment income | | $ | 23,754 | | | $ | 5,015 | | | $ | 10,993 | | | $ | 3,832 | | | $ | (32,682 | ) | | $ | (28,346 | ) | |
(continues on next page)
See notes to financial statements.
137
Victory Portfolios II Statements of Changes in Net Assets
| | | Victory
CEMP US 500
Volatility Wtd Index
Fund | | Victory
CEMP US Small Cap
Volatility Wtd Index
Fund | | Victory
CEMP International
Volatility Wtd Index
Fund | |
| | | For the
Six
Months
Ended
December 31,
2015 | | Year
Ended
June 30,
2015 | | For the
Six
Months
Ended
December 31,
2015 | | Year
Ended
June 30,
2015 | | For the
Six
Months
Ended
December 31,
2015 | | Year
Ended
June 30,
2015 | |
| | | (Unaudited) | | | | (Unaudited) | | | | (Unaudited) | | | |
Capital Transactions: | |
Class A Shares | |
Proceeds from shares
issued | | $ | 879,254 | | | $ | 3,980,121 | | | $ | 522,746 | | | $ | 5,938,819 | | | $ | 351,053 | | | $ | 1,636,734 | | |
Dividends reinvested | | | 1,326,188 | | | | 1,308,672 | | | | 425,339 | | | | 599,006 | | | | 31,016 | | | | 776,057 | | |
Subscription Exchange | | | 341,906 | | | | — | | | | 121,194 | | | | — | | | | 24,006 | | | | — | | |
Cost of shares redeemed | | | (3,823,651 | ) | | | (6,339,349 | ) | | | (8,821,878 | ) | | | (2,885,451 | ) | | | (7,755,271 | ) | | | (2,755,338 | ) | |
Total Class A Shares | | $ | (1,276,303 | ) | | $ | (1,050,556 | ) | | $ | (7,752,599 | ) | | $ | 3,652,374 | | | $ | (7,349,196 | ) | | $ | (342,547 | ) | |
Class C Shares | |
Proceeds from shares
issued | | $ | 2,507,916 | | | $ | 1,067,783 | | | $ | 461,846 | | | $ | 938,606 | | | $ | 325,003 | | | $ | 53,173 | | |
Dividends reinvested | | | 359,110 | | | | 105,475 | | | | 178,747 | | | | 163,900 | | | | 192 | | | | 7,843 | | |
Cost of shares redeemed | | | (204,562 | ) | | | (347,931 | ) | | | (198,485 | ) | | | (528,686 | ) | | | (9,077 | ) | | | (50,030 | ) | |
Total Class C Shares | | $ | 2,662,464 | | | $ | 825,327 | | | $ | 442,108 | | | $ | 573,820 | | | $ | 316,118 | | | $ | 10,986 | | |
Class I Shares | |
Proceeds from shares
issued | | $ | 1,148,746 | | | $ | 8,094,474 | | | $ | 177,552 | | | $ | 1,848,237 | | | $ | 177,879 | | | $ | 3,800,503 | | |
Dividends reinvested | | | 864,545 | | | | 791,125 | | | | 185,023 | | | | 264,873 | | | | 15,218 | | | | 271,875 | | |
Cost of shares redeemed | | | (3,496,687 | ) | | | (21,575,147 | ) | | | (1,377,537 | ) | | | (7,738,144 | ) | | | (3,388,233 | ) | | | (14,694,885 | ) | |
Total Class I Shares | | $ | (1,483,396 | ) | | $ | (12,689,548 | ) | | $ | (1,014,962 | ) | | $ | (5,625,034 | ) | | $ | (3,195,136 | ) | | $ | (10,622,507 | ) | |
Class T Shares | |
Proceeds from shares
issued | | $ | 10,226 | | | $ | 1,349 | | | $ | 30,151 | | | $ | 37,616 | | | $ | 6,562 | | | $ | 14,473 | | |
Dividends reinvested | | | 119 | | | | 7,359 | | | | 133 | | | | 6,887 | | | | 43 | | | | 1,300 | | |
Cost of shares redeemed | | | — | | | | (62 | ) | | | (9,464 | ) | | | (690 | ) | | | — | | | | — | | |
Redemption Exchange | | | (341,906 | ) | | | — | | | | (121,194 | ) | | | — | | | | (24,006 | ) | | | — | | |
Total Class T Shares | | $ | (331,561 | ) | | $ | 8,646 | | | $ | (100,374 | ) | | $ | 43,813 | | | $ | (17,401 | ) | | $ | 15,773 | | |
Change in net assets from
capital transactions | | $ | (428,796 | ) | | $ | (12,906,131 | ) | | $ | (8,425,827 | ) | | $ | (1,355,027 | ) | | $ | (10,245,615 | ) | | $ | (10,938,295 | ) | |
(continues on next page)
See notes to financial statements.
138
Victory Portfolios II Statements of Changes in Net Assets
| | | Victory
CEMP US 500
Volatility Wtd Index
Fund | | Victory
CEMP US Small Cap
Volatility Wtd Index
Fund | | Victory
CEMP International
Volatility Wtd Index
Fund | |
| | | For the
Six
Months
Ended
December 31,
2015 | | Year
Ended
June 30,
2015 | | For the
Six
Months
Ended
December 31,
2015 | | Year
Ended
June 30,
2015 | | For the
Six
Months
Ended
December 31,
2015 | | Year
Ended
June 30,
2015 | |
| | | (Unaudited) | | | | (Unaudited) | | | | (Unaudited) | | | |
Share Transactions: | |
Class A Shares | |
Issued | | | 65,699 | | | | 288,930 | | | | 38,907 | | | | 446,025 | | | | 32,725 | | | | 143,084 | | |
Reinvested | | | 106,740 | | | | 99,819 | | | | 35,162 | | | | 47,091 | | | | 3,013 | | | | 70,482 | | |
Issued exchange | | | 25,439 | | | | — | | | | 9,292 | | | | — | | | | 2,202 | | | | — | | |
Redeemed | | | (289,492 | ) | | | (456,671 | ) | | | (695,188 | ) | | | (210,534 | ) | | | (715,905 | ) | | | (235,283 | ) | |
Total Class A Shares | | | (91,614 | ) | | | (67,922 | ) | | | (611,827 | ) | | | 282,582 | | | | (677,965 | ) | | | (21,717 | ) | |
Class C Shares | |
Issued | | | 186,931 | | | | 76,985 | | | | 35,086 | | | | 70,015 | | | | 30,397 | | | | 4,429 | | |
Reinvested | | | 29,291 | | | | 8,154 | | | | 14,883 | | | | 13,039 | | | | 18 | | | | 719 | | |
Redeemed | | | (15,614 | ) | | | (24,924 | ) | | | (15,817 | ) | | | (39,491 | ) | | | (870 | ) | | | (3,968 | ) | |
Total Class C Shares | | | 200,608 | | | | 60,215 | | | | 34,152 | | | | 43,563 | | | | 29,545 | | | | 1,180 | | |
Class I Shares | |
Issued | | | 86,084 | | | | 570,110 | | | | 13,117 | | | | 134,776 | | | | 15,998 | | | | 314,519 | | |
Reinvested | | | 69,461 | | | | 60,261 | | | | 15,231 | | | | 20,774 | | | | 1,474 | | | | 24,624 | | |
Redeemed | | | (265,619 | ) | | | (1,574,223 | ) | | | (107,086 | ) | | | (579,391 | ) | | | (313,000 | ) | | | (1,312,300 | ) | |
Total Class I Shares | | | (110,074 | ) | | | (943,852 | ) | | | (78,738 | ) | | | (423,841 | ) | | | (295,528 | ) | | | (973,157 | ) | |
Class T Shares | |
Issued | | | 765 | | | | 95 | | | | 2,218 | | | | 2,831 | | | | 575 | | | | 1,146 | | |
Reinvested | | | 9 | | | | 564 | | | | 11 | | | | 543 | | | | 4 | | | | 118 | | |
Redeemed | | | — | | | | (4 | ) | | | (630 | ) | | | (51 | ) | | | — | | | | — | | |
Redeemed exchange | | | (25,439 | ) | | | — | | | | (9,292 | ) | | | — | | | | (2,202 | ) | | | — | | |
Total Class T Shares | | | (24,665 | ) | | | 655 | | | | (7,693 | ) | | | 3,323 | | | | (1,623 | ) | | | 1,264 | | |
Change in shares | | | (25,745 | ) | | | (950,904 | ) | | | (664,106 | ) | | | (94,373 | ) | | | (945,571 | ) | | | (992,430 | ) | |
See notes to financial statements.
139
Victory Portfolios II Statements of Changes in Net Assets
| | | Victory
CEMP Emerging
Market Volatility
Wtd Index Fund | | Victory
CEMP US 500
Enhanced Volatility
Wtd Index Fund | | Victory
CEMP International
Enhanced Volatility
Wtd Index Fund | |
| | | For the
Six
Months
Ended
December 31,
2015 | | Year
Ended
June 30,
2015 | | For the
Six
Months
Ended
December 31,
2015 | | Year
Ended
June 30,
2015 | | For the
Six
Months
Ended
December 31,
2015 | | Year
Ended
June 30,
2015 | |
| | | (Unaudited) | | | | (Unaudited) | | | | (Unaudited) | | | |
From Investment Activities: | |
Operations: | |
Net investment income
(loss) | | $ | 87,531 | | | $ | 185,088 | | | $ | 700,062 | | | $ | 565,377 | | | $ | 235,214 | | | $ | 870,908 | | |
Net realized gains
from investment
transactions | | | (1,775,876 | ) | | | (169,079 | ) | | | 849,962 | | | | 12,766,098 | | | | (7,919,988 | ) | | | (977,723 | ) | |
Net change in unrealized
appreciation
(depreciation) on
investments | | | (1,462,047 | ) | | | (1,788,075 | ) | | | (6,796,838 | ) | | | (1,711,629 | ) | | | (144,154 | ) | | | (6,447,815 | ) | |
Change in net assets resulting
from operations | | | (3,150,392 | ) | | | (1,772,066 | ) | | | (5,246,814 | ) | | | 11,619,846 | | | | (7,828,928 | ) | | | (6,554,630 | ) | |
Distributions to Shareholders: | |
From net investment
income: | |
Class A Shares | | | (45,947 | ) | | | (78,452 | ) | | | (283,190 | ) | | | (194,828 | ) | | | (43,314 | ) | | | (206,922 | ) | |
Class C Shares | | | (6,836 | ) | | | (4,683 | ) | | | (17,708 | ) | | | (4 | ) | | | (2,639 | ) | | | (37,899 | ) | |
Class I Shares | | | (28,643 | ) | | | (127,931 | ) | | | (265,461 | ) | | | (349,137 | ) | | | (115,132 | ) | | | (574,258 | ) | |
Class T Shares | | | — | | | | (2,381 | ) | | | (21,046 | ) | | | (13,767 | ) | | | — | | | | (30,419 | ) | |
From net realized gains: | |
Class A Shares | | | — | | | | — | | | | (3,201,414 | ) | | | (4,071,390 | ) | | | — | | | | (908,002 | ) | |
Class C Shares | | | — | | | | — | | | | (2,186,914 | ) | | | (2,493,428 | ) | | | — | | | | (271,718 | ) | |
Class I Shares | | | — | | | | — | | | | (1,966,743 | ) | | | (4,174,577 | ) | | | — | | | | (2,309,234 | ) | |
Class T Shares | | | — | | | | — | | | | — | | | | (795,803 | ) | | | — | | | | (129,588 | ) | |
Change in net assets
resulting from
distributions to
shareholders | | | (81,426 | ) | | | (213,447 | ) | | | (7,942,476 | ) | | | (12,092,934 | ) | | | (161,085 | ) | | | (4,468,040 | ) | |
Change in net assets from
capital transactions | | | (5,856,249 | ) | | | 2,519,529 | | | | (5,964,308 | ) | | | (420,603 | ) | | | (35,350,889 | ) | | | (9,998,443 | ) | |
Change in net assets | | | (9,088,067 | ) | | | 534,016 | | | | (19,153,598 | ) | | | (893,691 | ) | | | (43,340,902 | ) | | | (21,021,113 | ) | |
Net Assets: | |
Beginning of period | | | 20,120,287 | | | | 19,586,271 | | | | 212,864,771 | | | | 213,758,462 | | | | 78,571,918 | | | | 99,593,031 | | |
End of period | | $ | 11,032,220 | | | $ | 20,120,287 | | | $ | 193,711,173 | | | $ | 212,864,771 | | | $ | 35,231,016 | | | $ | 78,571,918 | | |
Accumulated undistributed
(distributions in excess of)
net investment income | | $ | 1,216 | | | $ | (4,889 | ) | | $ | 144,643 | | | $ | 31,986 | | | $ | 146,402 | | | $ | 72,273 | | |
(continues on next page)
See notes to financial statements.
140
Victory Portfolios II Statements of Changes in Net Assets
| | | Victory
CEMP Emerging
Market Volatility
Wtd Index Fund | | Victory
CEMP US 500
Enhanced Volatility
Wtd Index Fund | | Victory
CEMP International
Enhanced Volatility
Wtd Index Fund | |
| | | For the
Six
Months
Ended
December 31,
2015 | | Year
Ended
June 30,
2015 | | For the
Six
Months
Ended
December 31,
2015 | | Year
Ended
June 30,
2015 | | For the
Six
Months
Ended
December 31,
2015 | | Year
Ended
June 30,
2015 | |
| | | (Unaudited) | | | | (Unaudited) | | | | (Unaudited) | | | |
Capital Transactions: | |
Class A Shares | |
Proceeds from shares
issued | | $ | 4,710,649 | | | $ | 6,212,905 | | | $ | 14,397,596 | | | $ | 28,739,300 | | | $ | 6,396,273 | | | $ | 6,750,567 | | |
Dividends reinvested | | | 45,660 | | | | 74,609 | | | | 3,423,635 | | | | 4,180,076 | | | | 42,486 | | | | 1,100,420 | | |
Subscription Exchange | | | 317,771 | | | | — | | | | 17,402,807 | | | | — | | | | 4,088,450 | | | | — | | |
Cost of shares redeemed | | | (4,923,407 | ) | | | (6,622,036 | ) | | | (20,792,836 | ) | | | (34,774,122 | ) | | | (13,311,624 | ) | | | (15,684,198 | ) | |
Total Class A Shares | | $ | 150,673 | | | $ | (334,522 | ) | | $ | 14,431,202 | | | $ | (1,854,746 | ) | | $ | (2,784,415 | ) | | $ | (7,833,211 | ) | |
Class C Shares | |
Proceeds from shares
issued | | $ | 276,549 | | | $ | 774,833 | | | $ | 11,838,696 | | | $ | 29,792,498 | | | $ | 1,317,481 | | | $ | 4,809,809 | | |
Dividends reinvested | | | 6,169 | | | | 4,358 | | | | 2,193,223 | | | | 2,395,147 | | | | 2,325 | | | | 281,164 | | |
Cost of shares redeemed | | | (237,223 | ) | | | (567,511 | ) | | | (9,450,083 | ) | | | (8,525,272 | ) | | | (1,220,977 | ) | | | (2,676,007 | ) | |
Total Class C Shares | | $ | 45,495 | | | $ | 211,680 | | | $ | 4,581,836 | | | $ | 23,662,373 | | | $ | 98,829 | | | $ | 2,414,966 | | |
Class I Shares | |
Proceeds from shares
issued | | $ | 1,304,666 | | | $ | 14,914,957 | | | $ | 13,403,794 | | | $ | 40,504,368 | | | $ | 1,972,961 | | | $ | 32,773,546 | | |
Dividends reinvested | | | 14,694 | | | | 28,754 | | | | 1,999,967 | | | | 2,516,287 | | | | 34,493 | | | | 658,598 | | |
Cost of shares redeemed | | | (7,055,327 | ) | | | (12,457,723 | ) | | | (23,334,823 | ) | | | (72,256,367 | ) | | | (30,628,145 | ) | | | (39,529,052 | ) | |
Total Class I Shares | | $ | (5,735,967 | ) | | $ | 2,485,988 | | | $ | (7,931,062 | ) | | $ | (29,235,712 | ) | | $ | (28,620,691 | ) | | $ | (6,096,908 | ) | |
Class T Shares | |
Proceeds from shares
issued | | $ | 9,777 | | | $ | 179,627 | | | $ | 600,414 | | | $ | 6,711,098 | | | $ | 137,535 | | | $ | 1,883,373 | | |
Dividends reinvested | | | 2,012 | | | | 2,340 | | | | 19,918 | | | | 769,769 | | | | 6,729 | | | | 154,275 | | |
Cost of shares redeemed | | | (10,468 | ) | | | (25,584 | ) | | | (263,809 | ) | | | (473,385 | ) | | | (100,426 | ) | | | (520,938 | ) | |
Redemption Exchange | | | (317,771 | ) | | | — | | | | (17,402,807 | ) | | | — | | | | (4,088,450 | ) | | | — | | |
Total Class T Shares | | $ | (316,450 | ) | | $ | 156,383 | | | $ | (17,046,284 | ) | | $ | 7,007,482 | | | $ | (4,044,612 | ) | | $ | 1,516,710 | | |
Change in net assets from
capital transactions | | $ | (5,856,249 | ) | | $ | 2,519,529 | | | $ | (5,964,308 | ) | | $ | (420,603 | ) | | $ | (35,350,889 | ) | | $ | (9,998,443 | ) | |
(continues on next page)
See notes to financial statements.
141
Victory Portfolios II Statements of Changes in Net Assets
| | | Victory
CEMP Emerging
Market Volatility
Wtd Index Fund | | Victory
CEMP US 500
Enhanced Volatility
Wtd Index Fund | | Victory
CEMP International
Enhanced Volatility
Wtd Index Fund | |
| | | For the
Six
Months
Ended
December 31,
2015 | | Year
Ended
June 30,
2015 | | For the
Six
Months
Ended
December 31,
2015 | | Year
Ended
June 30,
2015 | | For the
Six
Months
Ended
December 31,
2015 | | Year
Ended
June 30,
2015 | |
| | | (Unaudited) | | | | (Unaudited) | | | | (Unaudited) | | | |
Share Transactions: | |
Class A Shares | |
Issued | | | 540,204 | | | | 608,456 | | | | 1,022,015 | | | | 2,027,384 | | | | 614,094 | | | | 588,862 | | |
Reinvested | | | 5,568 | | | | 7,528 | | | | 254,280 | | | | 311,186 | | | | 4,256 | | | | 100,563 | | |
Issued exchange | | | 35,545 | | | | — | | | | 1,261,987 | | | | — | | | | 395,401 | | | | — | | |
Redeemed | | | (559,960 | ) | | | (641,144 | ) | | | (1,498,672 | ) | | | (2,460,365 | ) | | | (1,287,630 | ) | | | (1,354,485 | ) | |
Total Class A Shares | | | 21,357 | | | | (25,160 | ) | | | 1,039,610 | | | | (121,795 | ) | | | (273,879 | ) | | | (665,060 | ) | |
Class C Shares | |
Issued | | | 32,728 | | | | 74,788 | | | | 862,601 | | | | 2,118,573 | | | | 128,079 | | | | 414,229 | | |
Reinvested | | | 758 | | | | 438 | | | | 165,154 | | | | 180,766 | | | | 235 | | | | 26,005 | | |
Redeemed | | | (28,313 | ) | | | (56,774 | ) | | | (691,655 | ) | | | (608,986 | ) | | | (118,128 | ) | | | (237,220 | ) | |
Total Class C Shares | | | 5,173 | | | | 18,452 | | | | 336,100 | | | | 1,690,353 | | | | 10,186 | | | | 203,014 | | |
Class I Shares | |
Issued | | | 146,284 | | | | 1,409,739 | | | | 966,331 | | | | 2,856,136 | | | | 183,788 | | | | 2,733,361 | | |
Reinvested | | | 1,792 | | | | 2,904 | | | | 148,666 | | | | 187,091 | | | | 3,441 | | | | 59,884 | | |
Redeemed | | | (831,441 | ) | | | (1,215,587 | ) | | | (1,693,347 | ) | | | (5,119,562 | ) | | | (2,963,821 | ) | | | (3,523,820 | ) | |
Total Class I Shares | | | (683,365 | ) | | | 197,056 | | | | (578,350 | ) | | | (2,076,335 | ) | | | (2,776,592 | ) | | | (730,575 | ) | |
Class T Shares | |
Issued | | | 1,014 | | | | 16,930 | | | | 42,640 | | | | 477,128 | | | | 12,316 | | | | 159,597 | | |
Reinvested | | | 246 | | | | 235 | | | | 1,538 | | | | 57,581 | | | | 676 | | | | 14,150 | | |
Redeemed | | | (1,189 | ) | | | (2,535 | ) | | | (18,792 | ) | | | (33,341 | ) | | | (8,856 | ) | | | — | | |
Redeemed exchange | | | (35,545 | ) | | | — | | | | (1,261,987 | ) | | | — | | | | (395,401 | ) | | | (46,645 | ) | |
Total Class T Shares | | | (35,474 | ) | | | 14,630 | | | | (1,236,601 | ) | | | 501,368 | | | | (391,265 | ) | | | 127,102 | | |
Change in shares | | | (692,309 | ) | | | 204,978 | | | | (439,241 | ) | | | (6,409 | ) | | | (3,431,550 | ) | | | (1,065,519 | ) | |
See notes to financial statements.
142
Victory Portfolios II Statements of Changes in Net Assets
| | | | | Consolidated | |
| | | Victory CEMP
REC Enhanced Volatility
Wtd Index Fund | | Victory CEMP
Commodity Volatility
Wtd Index Strategy Fund | | Victory CEMP
Commodity Enhanced
Volatility Wtd
Index Strategy Fund | |
| | | For the
Six
Months
Ended
December 31,
2015 | | Year
Ended
June 30,
2015 | | For the
Six
Months
Ended
December 31,
2015 | | Year
Ended
June 30,
2015 | | For the
Six
Months
Ended
December 31,
2015 | | Year
Ended
June 30,
2015 | |
| | | (Unaudited) | | | | (Unaudited) | | | | (Unaudited) | | | |
From Investment Activities: | |
Operations: | |
Net investment income
(loss) | | $ | 138,489 | | | $ | 344,923 | | | $ | (20,818 | ) | | $ | (48,937 | ) | | $ | (16,178 | ) | | $ | (68,159 | ) | |
Net realized gains from
investment
transactions | | | (859,941 | ) | | | 2,698,721 | | | | (1,771,435 | ) | | | (2,452,964 | ) | | | (969,954 | ) | | | (975,414 | ) | |
Net change in
unrealized
appreciation
(depreciation)
on investments | | | 461,644 | | | | (1,500,665 | ) | | | (27,208 | ) | | | (210,054 | ) | | | (6,632 | ) | | | (91,658 | ) | |
Change in net assets resulting
from operations | | | (259,808 | ) | | | 1,542,979 | | | | (1,819,461 | ) | | | (2,711,955 | ) | | | (992,764 | ) | | | (1,135,231 | ) | |
Distributions to Shareholders: | |
From net investment
income: | |
Class A Shares | | | (20,591 | ) | | | (133,283 | ) | | | — | | | | (391,394 | ) | | | — | | | | (16,768 | ) | |
Class C Shares | | | (2,567 | ) | | | (7,944 | ) | | | — | | | | (24,325 | ) | | | — | | | | (2,261 | ) | |
Class I Shares | | | (19,319 | ) | | | (200,801 | ) | | | — | | | | (1,041,101 | ) | | | — | | | | (101,708 | ) | |
Class T Shares | | | — | | | | (2,895 | ) | | | — | | | | (2,034 | ) | | | — | | | | (868 | ) | |
From net realized gains: | |
Class A Shares | | | (1,169,452 | ) | | | (205,078 | ) | | | — | | | | — | | | | — | | | | — | | |
Class C Shares | | | (251,108 | ) | | | (26,686 | ) | | | — | | | | — | | | | — | | | | — | | |
Class I Shares | | | (568,951 | ) | | | (295,953 | ) | | | — | | | | — | | | | — | | | | — | | |
Class T Shares | | | — | | | | (5,251 | ) | | | — | | | | — | | | | — | | | | — | | |
Change in net assets resulting
from distributions to
shareholders | | | (2,031,988 | ) | | | (877,891 | ) | | | — | | | | (1,458,854 | ) | | | — | | | | (121,605 | ) | |
Change in net assets from
capital transactions | | | (7,919,932 | ) | | | (9,631,767 | ) | | | (1,421,527 | ) | | | 2,168,851 | | | | (1,302,468 | ) | | | (1,892,332 | ) | |
Change in net assets | | | (10,211,728 | ) | | | (8,966,679 | ) | | | (3,240,988 | ) | | | (2,001,958 | ) | | | (2,295,232 | ) | | | (3,149,168 | ) | |
Net Assets: | |
Beginning of period | | | 19,627,205 | | | | 28,593,884 | | | | 12,226,956 | | | | 14,228,914 | | | | 8,294,466 | | | | 11,443,634 | | |
End of period | | $ | 9,415,477 | | | $ | 19,627,205 | | | $ | 8,985,968 | | | $ | 12,226,956 | | | $ | 5,999,234 | | | $ | 8,294,466 | | |
Accumulated undistributed
(distributions in excess of)
net investment income | | $ | 96,012 | | | $ | — | | | $ | (1,569,027 | ) | | $ | (1,548,209 | ) | | $ | (317,957 | ) | | $ | (301,779 | ) | |
(continues on next page)
See notes to financial statements.
143
Victory Portfolios II Statements of Changes in Net Assets
| | | | | Consolidated | |
| | | Victory CEMP
REC Enhanced Volatility
Wtd Index Fund | | Victory CEMP
Commodity Volatility
Wtd Index Strategy Fund | | Victory CEMP
Commodity Enhanced
Volatility Wtd
Index Strategy Fund | |
| | | For the
Six
Months
Ended
December 31,
2015 | | Year
Ended
June 30,
2015 | | For the
Six
Months
Ended
December 31,
2015 | | Year
Ended
June 30,
2015 | | For the
Six
Months
Ended
December 31,
2015 | | Year
Ended
June 30,
2015 | |
| | | (Unaudited) | | | | (Unaudited) | | | | (Unaudited) | | | |
Capital Transactions: | |
Class A Shares | |
Proceeds from shares
issued | | $ | 892,114 | | | $ | 4,276,791 | | | $ | 1,246,436 | | | $ | 4,584,183 | | | $ | 68,488 | | | $ | 1,249,348 | | |
Dividends reinvested | | | 1,182,914 | | | | 329,945 | | | | — | | | | 377,710 | | | | — | | | | 16,843 | | |
Subscription Exchange | | | 353,696 | | | | — | | | | 16,881 | | | | — | | | | 86,333 | | | | — | | |
Cost of shares redeemed | | | (4,156,350 | ) | | | (9,060,098 | ) | | | (2,821,226 | ) | | | (1,649,349 | ) | | | (1,011,050 | ) | | | (1,158,663 | ) | |
Total Class A Shares | | $ | (1,727,626 | ) | | $ | (4,453,362 | ) | | $ | (1,557,909 | ) | | $ | 3,312,544 | | | $ | (856,229 | ) | | $ | 107,528 | | |
Class C Shares | |
Proceeds from shares
issued | | $ | 148,946 | | | $ | 824,689 | | | $ | 11,167 | | | $ | 120,673 | | | $ | 58,662 | | | $ | 263,535 | | |
Dividends reinvested | | | 232,217 | | | | 29,990 | | | | — | | | | 22,121 | | | | — | | | | 2,237 | | |
Cost of shares redeemed | | | (231,902 | ) | | | (248,072 | ) | | | (19,044 | ) | | | (38,562 | ) | | | (41,750 | ) | | | (55,537 | ) | |
Total Class C Shares | | $ | 149,261 | | | $ | 606,607 | | | $ | (7,877 | ) | | $ | 104,232 | | | $ | 16,912 | | | $ | 210,235 | | |
Class I Shares | |
Proceeds from shares
issued | | $ | 374,425 | | | $ | 2,211,798 | | | $ | 1,367,876 | | | $ | 1,941,743 | | | $ | 929,634 | | | $ | 1,564,741 | | |
Dividends reinvested | | | 341,562 | | | | 78,205 | | | | — | | | | 69,261 | | | | — | | | | 4,670 | | |
Cost of shares redeemed | | | (6,787,373 | ) | | | (8,184,745 | ) | | | (1,207,000 | ) | | | (3,262,731 | ) | | | (1,312,712 | ) | | | (3,785,994 | ) | |
Total Class I Shares | | $ | (6,071,386 | ) | | $ | (5,894,742 | ) | | $ | 160,876 | | | $ | (1,251,727 | ) | | $ | (383,078 | ) | | $ | (2,216,583 | ) | |
Class T Shares | |
Proceeds from shares
issued | | $ | 85,244 | | | $ | 103,823 | | | $ | 302 | | | $ | 1,943 | | | $ | 11,871 | | | $ | 6,752 | | |
Dividends reinvested | | | — | | | | 6,491 | | | | — | | | | 2,035 | | | | — | | | | 586 | | |
Cost of shares redeemed | | | (1,729 | ) | | | (584 | ) | | | (38 | ) | | | — | | | | (5,611 | ) | | | (850 | ) | |
Redemption Exchange | | | (353,696 | ) | | | — | | | | (16,881 | ) | | | (176 | ) | | | (86,333 | ) | | | — | | |
Total Class T Shares | | $ | (270,181 | ) | | $ | 109,730 | | | $ | (16,617 | ) | | $ | 3,802 | | | $ | (80,073 | ) | | $ | 6,488 | | |
Change in net assets from
capital transactions | | $ | (7,919,932 | ) | | $ | (9,631,767 | ) | | $ | (1,421,527 | ) | | $ | 2,168,851 | | | $ | (1,302,468 | ) | | $ | (1,892,332 | ) | |
(continues on next page)
See notes to financial statements.
144
Victory Portfolios II Statements of Changes in Net Assets
| | | | | Consolidated | |
| | | Victory CEMP
REC Enhanced Volatility
Wtd Index Fund | | Victory CEMP
Commodity Volatility
Wtd Index Strategy Fund | | Victory CEMP
Commodity Enhanced
Volatility Wtd
Index Strategy Fund | |
| | | For the
Six
Months
Ended
December 31,
2015 | | Year
Ended
June 30,
2015 | | For the
Six
Months
Ended
December 31,
2015 | | Year
Ended
June 30,
2015 | | For the
Six
Months
Ended
December 31,
2015 | | Year
Ended
June 30,
2015 | |
| | | (Unaudited) | | | | (Unaudited) | | | | (Unaudited) | | | |
Share Transactions: | |
Class A Shares | |
Issued | | | 79,658 | | | | 353,683 | | | | 199,732 | | | | 625,522 | | | | 8,543 | | | | 139,478 | | |
Reinvested | | | 124,574 | | | | 27,590 | | | | — | | | | 51,953 | | | | — | | | | 1,943 | | |
Issued exchange | | | 31,807 | | | | — | | | | 2,654 | | | | — | | | | 10,914 | | | | — | | |
Redeemed | | | (398,730 | ) | | | (751,591 | ) | | | (460,748 | ) | | | (210,786 | ) | | | (132,991 | ) | | | (132,307 | ) | |
Total Class A Shares | | | (162,691 | ) | | | (370,318 | ) | | | (258,362 | ) | | | 466,689 | | | | (113,534 | ) | | | 9,114 | | |
Class C Shares | |
Issued | | | 13,217 | | | | 69,777 | | | | 1,878 | | | | 15,520 | | | | 7,659 | | | | 29,932 | | |
Reinvested | | | 24,687 | | | | 2,494 | | | | — | | | | 3,090 | | | | — | | | | 263 | | |
Redeemed | | | (21,873 | ) | | | (21,457 | ) | | | (3,194 | ) | | | (5,239 | ) | | | (5,653 | ) | | | (6,555 | ) | |
Total Class C Shares | | | 16,031 | | | | 50,814 | | | | (1,316 | ) | | | 13,371 | | | | 2,006 | | | | 23,640 | | |
Class I Shares | |
Issued | | | 35,696 | | | | 186,116 | | | | 228,919 | | | | 232,888 | | | | 118,429 | | | | 176,801 | | |
Reinvested | | | 35,890 | | | | 6,552 | | | | — | | | | 9,501 | | | | — | | | | 537 | | |
Redeemed | | | (615,369 | ) | | | (662,800 | ) | | | (192,120 | ) | | | (433,779 | ) | | | (166,695 | ) | | | (438,359 | ) | |
Total Class I Shares | | | (543,783 | ) | | | (470,132 | ) | | | 36,799 | | | | (191,390 | ) | | | (48,266 | ) | | | (261,021 | ) | |
Class T Shares | |
Issued | | | 7,816 | | | | 8,786 | | | | 47 | | | | 264 | | | | 1,478 | | | | 808 | | |
Reinvested | | | — | | | | 541 | | | | — | | | | 281 | | | | — | | | | 68 | | |
Redeemed | | | (162 | ) | | | (48 | ) | | | (6 | ) | | | — | | | | (721 | ) | | | (101 | ) | |
Redeemed exchange | | | (31,807 | ) | | | — | | | | (2,654 | ) | | | (23 | ) | | | (10,914 | ) | | | — | | |
Total Class T Shares | | | (24,153 | ) | | | 9,279 | | | | (2,613 | ) | | | 522 | | | | (10,157 | ) | | | 775 | | |
Change in shares | | | (714,596 | ) | | | (780,357 | ) | | | (225,492 | ) | | | 289,192 | | | | (169,951 | ) | | | (227,492 | ) | |
See notes to financial statements.
145
Victory Portfolios II Statements of Changes in Net Assets
| | | Victory CEMP
Long/Short Strategy Fund | | Victory CEMP
Market Neutral Income Fund | |
| | | For the
Six
Months
Ended
December 31,
2015 | | Year
Ended
June 30,
2015 | | For the
Six
Months
Ended
December 31,
2015 | | Year
Ended
June 30,
2015 | |
| | | (Unaudited) | | | | (Unaudited) | | | |
From Investment Activities: | |
Operations: | |
Net investment income (loss) | | $ | 36,632 | | | $ | 79,989 | | | $ | 682,602 | | | $ | 1,433,580 | | |
Net realized gains from investment transactions | | | (47,069 | ) | | | 561,438 | | | | 3,219,234 | | | | 847,799 | | |
Net change in unrealized appreciation
(depreciation) on investments | | | (324,181 | ) | | | 137,298 | | | | (3,692,446 | ) | | | (3,277,265 | ) | |
Change in net assets resulting from operations | | | (334,618 | ) | | | 778,725 | | | | 209,390 | | | | (995,886 | ) | |
Distributions to Shareholders: | |
From net investment income: | |
Class A Shares | | | (723 | ) | | | (2,458 | ) | | | (280,827 | ) | | | (647,928 | ) | |
Class C Shares | | | — | | | | — | | | | (2,870 | ) | | | (3,157 | ) | |
Class I Shares | | | (9,316 | ) | | | (77,181 | ) | | | (266,010 | ) | | | (781,173 | ) | |
Class T Shares | | | — | | | | — | | | | (466 | ) | | | (1,269 | ) | |
From net realized gains: | |
Class A Shares | | | (107,696 | ) | | | (10,262 | ) | | | (725,180 | ) | | | (178,488 | ) | |
Class C Shares | | | (3,401 | ) | | | (257 | ) | | | (10,951 | ) | | | (3,141 | ) | |
Class I Shares | | | (559,489 | ) | | | (62,383 | ) | | | (962,746 | ) | | | (229,940 | ) | |
Class T Shares | | | — | | | | (39 | ) | | | — | | | | (485 | ) | |
Change in net assets resulting from
distributions to shareholders | | | (680,625 | ) | | | (152,580 | ) | | | (2,249,050 | ) | | | (1,845,581 | ) | |
Change in net assets from capital transactions | | | 642,667 | | | | (11,123,184 | ) | | | 12,607,702 | | | | (3,116,038 | ) | |
Change in net assets | | | (372,576 | ) | | | (10,497,039 | ) | | | 10,568,042 | | | | (5,957,505 | ) | |
Net Assets: | |
Beginning of period | | | 15,513,655 | | | | 26,010,694 | | | | 57,081,417 | | | | 63,038,922 | | |
End of period | | $ | 15,141,079 | | | $ | 15,513,655 | | | $ | 67,649,459 | | | $ | 57,081,417 | | |
Accumulated undistributed (distributions in excess of)
net investment income | | $ | 28,662 | | | $ | 2,069 | | | $ | 108,627 | | | $ | (23,802 | ) | |
(continues on next page)
See notes to financial statements.
146
Victory Portfolios II Statements of Changes in Net Assets
| | | Victory CEMP
Long/Short Strategy Fund | | Victory CEMP
Market Neutral Income Fund | |
| | | For the
Six
Months
Ended
December 31,
2015 | | Year
Ended
June 30,
2015 | | For the
Six
Months
Ended
December 31,
2015 | | Year
Ended
June 30,
2015 | |
| | | (Unaudited) | | | | (Unaudited) | | | |
Capital Transactions: | |
Class A Shares | |
Proceeds from shares issued | | $ | 40,537 | | | $ | 85,257 | | | $ | 3,707,111 | | | $ | 12,414,378 | | |
Dividends reinvested | | | 108,419 | | | | 12,701 | | | | 1,005,467 | | | | 820,751 | | |
Subscription Exchange | | | 11,444 | | | | — | | | | 74,605 | | | | — | | |
Cost of shares redeemed | | | (2,213,489 | ) | | | (821,334 | ) | | | (7,697,371 | ) | | | (9,495,510 | ) | |
Total Class A Shares | | $ | (2,053,089 | ) | | $ | (723,376 | ) | | $ | (2,910,188 | ) | | $ | 3,739,619 | | |
Class C Shares | |
Proceeds from shares issued | | $ | — | | | $ | 61,200 | | | $ | 385,733 | | | $ | 313,662 | | |
Dividends reinvested | | | 3,401 | | | | 257 | | | | 12,810 | | | | 4,551 | | |
Cost of shares redeemed | | | (12 | ) | | | (10,580 | ) | | | (251,525 | ) | | | (183,385 | ) | |
Total Class C Shares | | $ | 3,389 | | | $ | 50,877 | | | $ | 147,018 | | | $ | 134,828 | | |
Class I Shares | |
Proceeds from shares issued | | $ | 6,757,842 | | | $ | 211,691 | | | $ | 25,349,415 | | | $ | 8,751,686 | | |
Dividends reinvested | | | 1,344 | | | | 830 | | | | 506,631 | | | | 53,762 | | |
Cost of shares redeemed | | | (4,055,375 | ) | | | (10,662,099 | ) | | | (10,343,004 | ) | | | (15,797,722 | ) | |
Total Class I Shares | | $ | 2,703,811 | | | $ | (10,449,578 | ) | | $ | 15,513,042 | | | $ | (6,992,274 | ) | |
Class T Shares | |
Proceeds from shares issued | | $ | — | | | $ | — | | | $ | 140 | | | $ | 1,366 | | |
Dividends reinvested | | | — | | | | 39 | | | | 466 | | | | 1,754 | | |
Cost of shares redeemed | | | — | | | | (1,146 | ) | | | (152 | ) | | | — | | |
Redemption Exchange | | | (11,444 | ) | | | — | | | | (74,605 | ) | | | (1,331 | ) | |
Total Class T Shares | | $ | (11,444 | ) | | $ | (1,107 | ) | | $ | (74,151 | ) | | $ | 1,789 | | |
Change in net assets from capital transactions | | $ | 642,667 | | | $ | (11,123,184 | ) | | $ | 12,675,721 | | | $ | (3,116,038 | ) | |
(continues on next page)
See notes to financial statements.
147
Victory Portfolios II Statements of Changes in Net Assets
| | | Victory CEMP
Long/Short Strategy Fund | | Victory CEMP
Market Neutral Income Fund | |
| | | For the
Six
Months
Ended
December 31,
2015 | | Year
Ended
June 30,
2015 | | For the
Six
Months
Ended
December 31,
2015 | | Year
Ended
June 30,
2015 | |
| | | (Unaudited) | | | | (Unaudited) | | | |
Share Transactions: | |
Class A Shares | |
Issued | | | 3,627 | | | | 7,722 | | | | 396,084 | | | | 1,298,316 | | |
Reinvested | | | 10,103 | | | | 1,148 | | | | 108,973 | | | | 86,184 | | |
Issued exchange | | | 1,025 | | | | — | | | | 7,845 | | | | — | | |
Redeemed | | | (204,758 | ) | | | (73,382 | ) | | | (825,877 | ) | | | (995,644 | ) | |
Total Class A Shares | | | (190,003 | ) | | | (64,512 | ) | | | (312,975 | ) | | | 388,856 | | |
Class C Shares | |
Issued | | | — | | | | 5,599 | | | | 40,707 | | | | 32,650 | | |
Reinvested | | | 326 | | | | 24 | | | | 1,400 | | | | 479 | | |
Redeemed | | | (1 | ) | | | (968 | ) | | | (33,952 | ) | | | (19,438 | ) | |
Total Class C Shares | | | 325 | | | | 4,655 | | | | 8,155 | | | | 13,691 | | |
Class I Shares | |
Issued | | | 606,685 | | | | 18,772 | | | | 2,666,234 | | | | 907,734 | | |
Reinvested | | | 125 | | | | 74 | | | | 55,097 | | | | 5,610 | | |
Redeemed | | | (361,696 | ) | | | (947,132 | ) | | | (1,088,860 | ) | | | (1,648,648 | ) | |
Total Class I Shares | | | 245,114 | | | | (928,286 | ) | | | 1,632,471 | | | | (735,304 | ) | |
Class T Shares | |
Issued | | | — | | | | — | | | | 15 | | | | 145 | | |
Reinvested | | | — | | | | 4 | | | | 49 | | | | 184 | | |
Redeemed | | | — | | | | (100 | ) | | | (16 | ) | | | — | | |
Redeemed exchange | | | (1,025 | ) | | | — | | | | (7,845 | ) | | | (139 | ) | |
Total Class T Shares | | | (1,025 | ) | | | (96 | ) | | | (7,797 | ) | | | 190 | | |
Change in shares | | | 54,411 | | | | (988,239 | ) | | | 1,319,854 | | | | (332,567 | ) | |
See notes to financial statements.
148
Victory Portfolios II Statements of Changes in Net Assets
| | | Victory CEMP Enhanced
Fixed Income Fund | | Victory CEMP
Ultra Short Term
Fixed Income Fund | |
| | | For the
Six
Months
Ended
December 31,
2015 | | Year
Ended
June 30,
2015 | | For the
Six
Months
Ended
December 31,
2015 | | Year
Ended
June 30,
2015 | |
| | | (Unaudited) | | | | (Unaudited) | | | |
From Investment Activities: | |
Operations: | |
Net investment income (loss) | | $ | (8,222 | ) | | $ | (7,516 | ) | | $ | 17,649 | | | $ | 72,805 | | |
Net realized gains (losses) from investment
transactions | | | (131,308 | ) | | | 1,198,016 | | | | (4,885 | ) | | | 469 | | |
Net change in unrealized appreciation
(depreciation) on investments | | | 2,615 | | | | (205,302 | ) | | | (625 | ) | | | 3,464 | | |
Change in net assets resulting from operations | | | (136,915 | ) | | | 985,198 | | | | 12,139 | | | | 76,738 | | |
Distributions to Shareholders: | |
From net investment income: | |
Class A Shares | | | (134,700 | ) | | | — | | | | (2,098 | ) | | | (17,970 | ) | |
Class C Shares | | | (1,154 | ) | | | — | | | | — | | | | — | | |
Class I Shares | | | (18,402 | ) | | | — | | | | (14,640 | ) | | | (55,135 | ) | |
Class T Shares | | | — | | | | — | | | | — | | | | — | | |
In excess of net investment income: | |
Class A Shares | | | — | | | | (440,028 | ) | | | — | | | | — | | |
Class C Shares | | | — | | | | (5,699 | ) | | | — | | | | — | | |
Class I Shares | | | — | | | | (350,363 | ) | | | — | | | | — | | |
Class T Shares | | | — | | | | (3,558 | ) | | | — | | | | — | | |
From net realized gains: | |
Class A Shares | | | (217,641 | ) | | | — | | | | — | | | | (692 | ) | |
Class C Shares | | | (8,250 | ) | | | — | | | | — | | | | — | | |
Class I Shares | | | (22,877 | ) | | | — | | | | — | | | | (1,205 | ) | |
Class T Shares | | | — | | | | — | | | | — | | | | — | | |
Change in net assets resulting from
distributions to shareholders | | | (403,024 | ) | | | (799,648 | ) | | | (16,738 | ) | | | (75,002 | ) | |
Change in net assets from capital transactions | | | (16,330,904 | ) | | | (26,856,243 | ) | | | (4,230,044 | ) | | | (2,196,102 | ) | |
Change in net assets | | | (16,870,843 | ) | | | (26,670,693 | ) | | | (4,234,643 | ) | | | (2,194,366 | ) | |
Net Assets: | |
Beginning of period | | | 22,263,682 | | | | 48,934,375 | | | | 14,616,174 | | | | 16,810,540 | | |
End of period | | $ | 5,392,839 | | | $ | 22,263,682 | | | $ | 10,381,531 | | | $ | 14,616,174 | | |
Accumulated undistributed (distributions in excess of)
net investment income | | $ | (71,122 | ) | | $ | 91,356 | | | $ | 475 | | | $ | (436 | ) | |
(continues on next page)
See notes to financial statements.
149
Victory Portfolios II Statements of Changes in Net Assets
| | | Victory CEMP Enhanced
Fixed Income Fund | | Victory CEMP
Ultra Short Term
Fixed Income Fund | |
| | | For the
Six
Months
Ended
December 31,
2015 | | Year
Ended
June 30,
2015 | | For the
Six
Months
Ended
December 31,
2015 | | Year
Ended
June 30,
2015 | |
| | | (Unaudited) | | | | (Unaudited) | | | |
Capital Transactions: | |
Class A Shares | |
Proceeds from shares issued | | $ | 520,562 | | | $ | 2,661,131 | | | $ | 2,150,855 | | | $ | 1,071,918 | | |
Dividends reinvested | | | 351,582 | | | | 439,981 | | | | 2,007 | | | | 17,030 | | |
Subscription Exchange | | | 277,884 | | | | — | | | | — | | | | — | | |
Cost of shares redeemed | | | (13,667,329 | ) | | | (16,837,816 | ) | | | (4,073,949 | ) | | | (2,771,343 | ) | |
Total Class A Shares | | $ | (12,517,301 | ) | | $ | (13,736,704 | ) | | $ | (1,921,087 | ) | | $ | (1,682,395 | ) | |
Class C Shares | |
Proceeds from shares issued | | $ | 98,832 | | | $ | 346,409 | | | | N/A | | | | N/A | | |
Dividends reinvested | | | 9,404 | | | | 5,513 | | | | N/A | | | | N/A | | |
Cost of shares redeemed | | | (161,285 | ) | | | (175,886 | ) | | | N/A | | | | N/A | | |
Total Class C Shares | | $ | (53,049 | ) | | $ | 176,036 | | | | N/A | | | | N/A | | |
Class I Shares | |
Proceeds from shares issued | | $ | 488,348 | | | $ | 5,102,824 | | | $ | 850,410 | | | $ | 3,375,297 | | |
Dividends reinvested | | | 39,677 | | | | 3,572 | | | | 12,792 | | | | 41,056 | | |
Cost of shares redeemed | | | (4,006,094 | ) | | | (18,438,629 | ) | | | (3,172,159 | ) | | | (3,930,060 | ) | |
Total Class I Shares | | $ | (3,478,069 | ) | | $ | (13,332,233 | ) | | $ | (2,308,957 | ) | | $ | (513,707 | ) | |
Class T Shares | |
Proceeds from shares issued | | $ | 420 | | | $ | 37,646 | | | | N/A | | | | N/A | | |
Dividends reinvested | | | — | | | | 3,128 | | | | N/A | | | | N/A | | |
Cost of shares redeemed | | | (5,021 | ) | | | (4,116 | ) | | | N/A | | | | N/A | | |
Redemption Exchange | | | (277,884 | ) | | | — | | | | N/A | | | | N/A | | |
Total Class T Shares | | $ | (282,485 | ) | | $ | 36,658 | | | | N/A | | | | N/A | | |
Change in net assets from capital transactions | | $ | (16,330,904 | ) | | $ | (26,856,243 | ) | | $ | (4,230,044 | ) | | $ | (2,196,102 | ) | |
(continues on next page)
See notes to financial statements.
150
Victory Portfolios II Statements of Changes in Net Assets
| | | Victory CEMP Enhanced
Fixed Income Fund | | Victory CEMP
Ultra Short Term
Fixed Income Fund | |
| | | For the
Six
Months
Ended
December 31,
2015 | | Year
Ended
June 30,
2015 | | For the
Six
Months
Ended
December 31,
2015 | | Year
Ended
June 30,
2015 | |
| | | (Unaudited) | | | | (Unaudited) | | | |
Share Transactions: | |
Class A Shares | |
Issued | | | 52,588 | | | | 267,756 | | | | 215,100 | | | | 107,192 | | |
Reinvested | | | 36,970 | | | | 44,353 | | | | 201 | | | | 1,703 | | |
Issued exchange | | | 28,154 | | | | — | | | | — | | | | — | | |
Redeemed | | | (1,423,111 | ) | | | (1,688,141 | ) | | | (407,453 | ) | | | (277,134 | ) | |
Total Class A Shares | | | (1,305,399 | ) | | | (1,376,032 | ) | | | (192,152 | ) | | | (168,239 | ) | |
Class C Shares | |
Issued | | | 10,143 | | | | 35,330 | | | | N/A | | | | N/A | | |
Reinvested | | | 999 | | | | 562 | | | | N/A | | | | N/A | | |
Redeemed | | | (16,625 | ) | | | (17,915 | ) | | | N/A | | | | N/A | | |
Total Class C Shares | | | (5,483 | ) | | | 17,977 | | | | N/A | | | | N/A | | |
Class I Shares | |
Issued | | | 49,239 | | | | 515,488 | | | | 85,041 | | | | 337,530 | | |
Reinvested | | | 4,168 | | | | 360 | | | | 1,279 | | | | 4,106 | | |
Redeemed | | | (406,187 | ) | | | (1,843,022 | ) | | | (317,216 | ) | | | (393,007 | ) | |
Total Class I Shares | | | (352,780 | ) | | | (1,327,174 | ) | | | (230,896 | ) | | | (51,371 | ) | |
Class T Shares | |
Issued | | | 43 | | | | 3,810 | | | | N/A | | | | N/A | | |
Reinvested | | | — | | | | 316 | | | | N/A | | | | N/A | | |
Redeemed | | | (511 | ) | | | (417 | ) | | | N/A | | | | N/A | | |
Redeemed exchange | | | (28,154 | ) | | | — | | | | N/A | | | | N/A | | |
Total Class T Shares | | | (28,622 | ) | | | 3,709 | | | | N/A | | | | N/A | | |
Change in shares | | | (1,692,284 | ) | | | (2,681,520 | ) | | | (423,048 | ) | | | (219,610 | ) | |
See notes to financial statements.
151
Victory Portfolios II Statements of Changes in Net Assets
| | | Victory CEMP
Multi-Asset Balanced Fund | | Victory CEMP
Multi-Asset Growth Fund | | Victory CEMP
Alternative Strategies Fund | |
| | | For the
Six
Months
Ended
December 31,
2015 | | Year
Ended
June 30,
2015 | | For the
Six
Months
Ended
December 31,
2015 | | Year
Ended
June 30,
2015 | | For the
Six
Months
Ended
December 31,
2015 | | Year
Ended
June 30,
2015 | |
| | | (Unaudited) | | | | (Unaudited) | | | | (Unaudited) | | | |
From Investment Activities: | |
Operations: | |
Net investment income (loss) | | $ | 300,572 | | | $ | 2,016,794 | | | $ | 46,774 | | | $ | 1,076,431 | | | $ | 449,682 | | | $ | 1,366,986 | | |
Net realized gains (losses)
from affiliated investment
transactions | | | 210,974 | | | | 2,350,425 | | | | (254,984 | ) | | | 2,351,713 | | | | (216,297 | ) | | | 1,024,311 | | |
Distributions of realized
gains from underlying
investment companies | | | — | | | | 1,157,291 | | | | — | | | | 1,196,268 | | | | — | | | | 229,350 | | |
Net change in unrealized
depreciation on
affiliated investments | | | (2,072,239 | ) | | | (6,668,126 | ) | | | (604,270 | ) | | | (5,739,116 | ) | | | (2,221,698 | ) | | | (3,667,693 | ) | |
Change in net assets resulting
from operations | | | (1,560,693 | ) | | | (1,143,616 | ) | | | (812,480 | ) | | | (1,114,704 | ) | | | (1,988,313 | ) | | | (1,047,046 | ) | |
Distributions to Shareholders: | |
From net investment income: | |
Class A Shares | | | (212,490 | ) | | | (1,645,058 | ) | | | (59,695 | ) | | | (925,806 | ) | | | (546,335 | ) | | | (1,064,520 | ) | |
Class C Shares | | | (16,519 | ) | | | (181,327 | ) | | | (73 | ) | | | (95,166 | ) | | | (72,992 | ) | | | (117,166 | ) | |
Class I Shares | | | — | | | | — | | | | — | | | | — | | | | — | | | | (52,030 | ) | |
Class T Shares | | | — | | | | (149,876 | ) | | | — | | | | (77,594 | ) | | | — | | | | — | | |
From net realized gains: | |
Class A Shares | | | (1,703,886 | ) | | | (918,033 | ) | | | (1,528,042 | ) | | | (1,455,357 | ) | | | — | | | | — | | |
Class C Shares | | | (821,705 | ) | | | (163,018 | ) | | | (916,531 | ) | | | (223,777 | ) | | | — | | | | — | | |
Class I Shares | | | — | | | | — | | | | — | | | | — | | | | — | | | | — | | |
Class T Shares | | | — | | | | (97,782 | ) | | | — | | | | (136,416 | ) | | | — | | | | — | | |
Change in net assets resulting from
distributions to shareholders | | | (2,754,600 | ) | | | (3,155,094 | ) | | | (2,504,341 | ) | | | (2,914,116 | ) | | | (619,327 | ) | | | (1,233,716 | ) | |
Change in net assets from capital
transactions | | | (5,404,131 | ) | | | (62,365,453 | ) | | | (866,132 | ) | | | (36,354,195 | ) | | | (10,441,657 | ) | | | (19,401,094 | ) | |
Change in net assets | | | (9,719,424 | ) | | | (66,664,163 | ) | | | (4,182,953 | ) | | | (40,383,015 | ) | | | (13,049,297 | ) | | | (21,681,856 | ) | |
Net Assets: | |
Beginning of period | | | 39,827,598 | | | | 106,491,761 | | | | 14,614,743 | | | | 54,997,758 | | | | 41,451,654 | | | | 63,133,510 | | |
End of period | | $ | 30,108,174 | | | $ | 39,827,598 | | | $ | 10,431,790 | | | $ | 14,614,743 | | | $ | 28,402,357 | | | $ | 41,451,654 | | |
Accumulated undistributed
(distributions in excess of)
net investment income | | $ | 112,096 | | | $ | 40,533 | | | $ | (12,994 | ) | | $ | — | | | $ | (36,027 | ) | | $ | 133,618 | | |
(continues on next page)
See notes to financial statements.
152
Victory Portfolios II Statements of Changes in Net Assets
| | | Victory CEMP
Multi-Asset Balanced Fund | | Victory CEMP
Multi-Asset Growth Fund | | Victory CEMP
Alternative Strategies Fund | |
| | | For the
Six
Months
Ended
December 31,
2015 | | Year
Ended
June 30,
2015 | | For the
Six
Months
Ended
December 31,
2015 | | Year
Ended
June 30,
2015 | | For the
Six
Months
Ended
December 31,
2015 | | Year
Ended
June 30,
2015 | |
| | | (Unaudited) | | | | (Unaudited) | | | | (Unaudited) | | | |
Capital Transactions: | |
Class A Shares | |
Proceeds from shares
issued | | $ | 1,193,402 | | | $ | 9,394,351 | | | $ | 119,192 | | | $ | 2,162,148 | | | $ | 537,755 | | | $ | 6,399,681 | | |
Dividends reinvested | | | 1,860,190 | | | | 2,528,227 | | | | 1,553,987 | | | | 2,363,795 | | | | 495,438 | | | | 868,041 | | |
Subscription Exchange | | | 6,675,042 | | | | — | | | | 3,324,077 | | | | — | | | | 2,090,078 | | | | — | | |
Cost of shares redeemed | | | (6,894,452 | ) | | | (70,505,130 | ) | | | (2,445,876 | ) | | | (39,163,962 | ) | | | (9,885,150 | ) | | | (24,162,522 | ) | |
Total Class A Shares | | $ | 2,834,182 | | | $ | (58,582,552 | ) | | $ | 2,551,380 | | | $ | (34,638,019 | ) | | $ | (6,761,879 | ) | | $ | (16,894,800 | ) | |
Class C Shares | |
Proceeds from shares
issued | | $ | 293,028 | | | $ | 1,411,605 | | | $ | 80,771 | | | $ | 430,030 | | | $ | 68,597 | | | $ | 241,313 | | |
Dividends reinvested | | | 776,100 | | | | 309,236 | | | | 895,281 | | | | 300,169 | | | | 71,112 | | | | 109,675 | | |
Cost of shares redeemed | | | (2,067,124 | ) | | | (3,809,710 | ) | | | (879,174 | ) | | | (2,347,213 | ) | | | (1,487,402 | ) | | | (2,811,195 | ) | |
Total Class C Shares | | $ | (997,996 | ) | | $ | (2,088,869 | ) | | $ | 96,878 | | | $ | (1,617,014 | ) | | $ | (1,347,693 | ) | | $ | (2,460,207 | ) | |
Class T Shares | |
Proceeds from shares
issued | | $ | 92,648 | | | $ | 373,713 | | | $ | 20,491 | | | $ | 396,689 | | | $ | 8,285 | | | $ | 194,252 | | |
Dividends reinvested | | | — | | | | 235,462 | | | | — | | | | 168,065 | | | | — | | | | 47,570 | | |
Cost of shares redeemed | | | (657,923 | ) | | | (2,303,207 | ) | | | (210,804 | ) | | | (663,916 | ) | | | (250,292 | ) | | | (287,909 | ) | |
Redemption Exchange | | | (6,675,042 | ) | | | — | | | | (3,324,077 | ) | | | — | | | | (2,090,078 | ) | | | — | | |
Total Class T Shares | | $ | (7,240,317 | ) | | $ | (1,694,032 | ) | | $ | (3,514,390 | ) | | $ | (99,162 | ) | | $ | (2,332,085 | ) | | $ | (46,087 | ) | |
Change in net assets from
capital transactions | | $ | (5,404,131 | ) | | $ | (62,365,453 | ) | | $ | (866,132 | ) | | $ | (36,354,195 | ) | | $ | (10,441,657 | ) | | $ | (19,401,094 | ) | |
(continues on next page)
See notes to financial statements.
153
Victory Portfolios II Statements of Changes in Net Assets
| | | Victory CEMP
Multi-Asset Balanced Fund | | Victory CEMP
Multi-Asset Growth Fund | | Victory CEMP
Alternative Strategies Fund | |
| | | For the
Six
Months
Ended
December 31,
2015 | | Year
Ended
June 30,
2015 | | For the
Six
Months
Ended
December 31,
2015 | | Year
Ended
June 30,
2015 | | For the
Six
Months
Ended
December 31,
2015 | | Year
Ended
June 30,
2015 | |
| | | (Unaudited) | | | | (Unaudited) | | | | (Unaudited) | | | |
Share Transactions: | |
Class A Shares | |
Issued | | | 98,708 | | | | 769,721 | | | | 6,360 | | | | 178,252 | | | | 51,956 | | | | 621,199 | | |
Reinvested | | | 175,988 | | | | 213,713 | | | | 178,825 | | | | 207,169 | | | | 52,650 | | | | 85,774 | | |
Issued exchange | | | 571,004 | | | | — | | | | 297,058 | | | | — | | | | 214,808 | | | | — | | |
Redeemed | | | (590,987 | ) | | | (5,914,952 | ) | | | (218,430 | ) | | | (3,393,521 | ) | | | (1,005,460 | ) | | | (2,344,462 | ) | |
Total Class A Shares | | | 254,713 | | | | (4,931,518 | ) | | | 263,813 | | | | (3,008,100 | ) | | | (686,046 | ) | | | (1,637,489 | ) | |
Class C Shares | |
Issued | | | 25,529 | | | | 117,679 | | | | 7,359 | | | | 36,830 | | | | 7,221 | | | | 24,072 | | |
Reinvested | | | 74,841 | | | | 26,636 | | | | 106,963 | | | | 27,091 | | | | 7,746 | | | | 11,112 | | |
Redeemed | | | (180,095 | ) | | | (321,052 | ) | | | (81,040 | ) | | | (201,619 | ) | | | (156,438 | ) | | | (280,419 | ) | |
Total Class C Shares | | | (79,725 | ) | | | (176,737 | ) | | | 33,282 | | | | (137,698 | ) | | | (141,471 | ) | | | (245,235 | ) | |
Class T Shares | |
Issued | | | 7,857 | | | | 30,827 | | | | 1,828 | | | | 33,186 | | | | 834 | | | | 19,059 | | |
Reinvested | | | — | | | | 19,954 | | | | — | | | | 14,900 | | | | — | | | | 4,747 | | |
Redeemed | | | (55,723 | ) | | | (190,273 | ) | | | (18,460 | ) | | | (56,608 | ) | | | (25,136 | ) | | | (28,125 | ) | |
Redeemed exchange | | | (571,004 | ) | | | — | | | | (297,058 | ) | | | — | | | | (214,808 | ) | | | — | | |
Total Class T Shares | | | (618,870 | ) | | | (139,492 | ) | | | (313,690 | ) | | | (8,522 | ) | | | (239,110 | ) | | | (4,319 | ) | |
Change in shares | | | (443,882 | ) | | | (5,247,747 | ) | | | (16,595 | ) | | | (3,154,320 | ) | | | (1,066,627 | ) | | | (1,887,043 | ) | |
See notes to financial statements.
154
Victory Portfolios II | | Financial Highlights | |
For a Share Outstanding Throughout Each Period
| | | Victory CEMP US 500 Volatility Wtd Index Fund | |
| | | Class A Shares | |
| | | For the
Six
Months
Ended
December 31,
2015 | | Year
Ended
June 30,
2015 | | Year
Ended
June 30,
2014 | | For the
Period
Ended
June 30,
2013(a) | |
| | | (Unaudited) | | | | | | | |
Net Asset Value, Beginning of Period | | $ | 13.77 | | | $ | 14.17 | | | $ | 11.72 | | | $ | 10.00 | | |
Investment Activities: | |
Net investment income (b) | | | 0.06 | | | | 0.10 | | | | 0.08 | | | | 0.06 | | |
Net realized and unrealized gains (losses)
on investments | | | (0.34 | ) | | | 0.71 | | | | 2.59 | | | | 1.72 | | |
Total from Investment Activities | | | (0.28 | ) | | | 0.81 | | | | 2.67 | | | | 1.78 | | |
Distributions: | |
Net investment income | | | (0.05 | ) | | | (0.10 | ) | | | (0.17 | ) | | | (0.06 | ) | |
Net realized gains from investments | | | (1.22 | ) | | | (1.11 | ) | | | (0.05 | ) | | | — | | |
Total Distributions | | | (1.27 | ) | | | (1.21 | ) | | | (0.22 | ) | | | (0.06 | ) | |
Net Asset Value, End of Period | | $ | 12.22 | | | $ | 13.77 | | | $ | 14.17 | | | $ | 11.72 | | |
Total Return (excludes sales charge) (c) | | | (2.18 | )% | | | 6.18 | % | | | 23.00 | % | | | 17.86 | % | |
Ratios/Supplemental Data: | |
Net Assets at end of period (000) | | $ | 15,437 | | | $ | 18,665 | | | $ | 20,163 | | | $ | 11,641 | | |
Ratio of net expenses to average net assets (d) | | | 0.99 | % | | | 1.18 | % | | | 1.20 | % | | | 1.20 | % | |
Ratio of net investment income to average net assets (d) | | | 0.82 | % | | | 0.67 | % | | | 0.65 | % | | | 0.92 | % | |
Ratio of gross expenses to average net assets (d) (e) | | | 1.36 | % | | | 1.40 | % | | | 1.34 | % | | | 1.63 | % | |
Ratio of net investment income to average net assets (d) (e) | | | 1.20 | % | | | 0.45 | % | | | 0.51 | % | | | 0.49 | % | |
Portfolio turnover (c) | | | 29 | % | | | 34 | % | | | 34 | % | | | 15 | % | |
(a) The Compass EMP U.S. 500 Volatility Weighted Fund Class A commenced operations on November 19, 2012.
(b) Calculated using average shares for the period.
(c) Not annualized for periods less than one year.
(d) Annualized for periods less than one year.
(e) During the period, certain fees were reduced and/or reimbursed. If such see reductions and/or reimbursements had not occurred, the ratios would have been as indicated.
See notes to financial statements.
155
Victory Portfolios II | | Financial Highlights — continued | |
For a Share Outstanding Throughout Each Period
| | | Victory CEMP US 500 Volatility Wtd Index Fund | |
| | | Class C Shares | |
| | | For the
Six
Months
Ended
December 31,
2015 | | Year
Ended
June 30,
2015 | | Year
Ended
June 30,
2014 | | For the
Period
Ended
June 30,
2013(a) | |
| | | (Unaudited) | | | | | | | |
Net Asset Value, Beginning of Period | | $ | 13.63 | | | $ | 14.06 | | | $ | 11.68 | | | $ | 10.00 | | |
Investment Activities: | |
Net investment income (loss) (b) | | | 0.01 | | | | (— | )(c) | | | (0.01 | ) | | | 0.01 | | |
Net realized and unrealized gains (losses)
on investments | | | (0.34 | ) | | | 0.69 | | | | 2.57 | | | | 1.72 | | |
Total from Investment Activities | | | (0.33 | ) | | | 0.69 | | | | 2.56 | | | | 1.73 | | |
Distributions: | |
Net investment income | | | (0.01 | ) | | | (0.01 | ) | | | (0.13 | ) | | | (0.05 | ) | |
Net realized gains from investments | | | (1.22 | ) | | | (1.11 | ) | | | (0.05 | ) | | | — | | |
Total Distributions | | | (1.23 | ) | | | (1.12 | ) | | | (0.18 | ) | | | (0.05 | ) | |
Net Asset Value, End of Period | | $ | 12.07 | | | $ | 13.63 | | | $ | 14.06 | | | $ | 11.68 | | |
Total Return (excludes contingent deferred sales charge) (d) | | | (2.55 | )% | | | 5.36 | % | | | 22.13 | % | | | 17.28 | % | |
Ratios/Supplemental Data: | |
Net Assets at end of period (000) | | $ | 3,862 | | | $ | 1,629 | | | $ | 833 | | | $ | 32 | | |
Ratio of net expenses to average net assets (e) | | | 1.74 | % | | | 1.93 | % | | | 1.95 | % | | | 1.95 | % | |
Ratio of net investment income to average net assets (e) | | | 0.19 | % | | | (0.04 | )% | | | (0.10 | )% | | | 0.13 | % | |
Ratio of gross expenses to average net assets (e) (f) | | | 2.09 | % | | | 2.15 | % | | | 2.09 | % | | | 1.95 | % | |
Ratio of net investment income to average net assets (e) (f) | | | 0.54 | % | | | (0.26 | )% | | | (0.24 | )% | | | (0.30 | )% | |
Portfolio turnover (c) | | | 29 | % | | | 34 | % | | | 34 | % | | | 15 | % | |
(a) The Compass EMP U.S. 500 Volatility Weighted Fund Class C commenced operations on November 19, 2012.
(b) Calculated using average shares for the period.
(c) Less than $0.01 per share.
(d) Not annualized for periods less than one year.
(e) Annualized for periods less than one year.
(f) During the period, certain fees were reduced and/or reimbursed. If such see reductions and/or reimbursements had not occurred, the ratios would have been as indicated.
See notes to financial statements.
156
Victory Portfolios II | | Financial Highlights — continued | |
For a Share Outstanding Throughout Each Period
| | | Victory CEMP US 500 Volatility Wtd Index Fund | |
| | | Class I Shares | |
| | | For the
Six
Months
Ended
December 31,
2015 | | Year
Ended
June 30,
2015 | | Year
Ended
June 30,
2014 | | For the
Period
Ended
June 30,
2013(a) | |
| | | (Unaudited) | | | | | | | |
Net Asset Value, Beginning of Period | | $ | 13.80 | | | $ | 14.19 | | | $ | 11.73 | | | $ | 10.00 | | |
Investment Activities: | |
Net investment income (b) | | | 0.07 | | | | 0.13 | | | | 0.12 | | | | 0.07 | | |
Net realized and unrealized gains (losses)
on investments | | | (0.34 | ) | | | 0.72 | | | | 2.59 | | | | 1.73 | | |
Total from Investment Activities | | | (0.27 | ) | | | 0.85 | | | | 2.71 | | | | 1.80 | | |
Distributions: | |
Net investment income | | | (0.07 | ) | | | (0.13 | ) | | | (0.20 | ) | | | (0.07 | ) | |
Net realized gains from investments | | | (1.22 | ) | | | (1.11 | ) | | | (0.05 | ) | | | — | | |
Total Distributions | | | (1.29 | ) | | | (1.24 | ) | | | (0.25 | ) | | | (0.07 | ) | |
Net Asset Value, End of Period | | $ | 12.24 | | | $ | 13.80 | | | $ | 14.19 | | | $ | 11.73 | | |
Total Return (c) | | | (2.13 | )% | | | 6.51 | % | | | 23.36 | % | | | 18.07 | % | |
Ratios/Supplemental Data: | |
Net Assets at end of period (000) | | $ | 10,358 | | | $ | 13,194 | | | $ | 26,962 | | | $ | 1,221 | | |
Ratio of net expenses to average net assets (d) | | | 0.74 | % | | | 0.93 | % | | | 0.95 | % | | | 0.95 | % | |
Ratio of net investment income to average net assets (d) | | | 1.07 | % | | | 0.92 | % | | | 0.90 | % | | | 0.96 | % | |
Ratio of gross expenses to average net assets (d) (e) | | | 1.11 | % | | | 1.15 | % | | | 1.09 | % | | | 1.38 | % | |
Ratio of net investment income to average net assets (d) (e) | | | 1.45 | % | | | 0.70 | % | | | 0.76 | % | | | 0.53 | % | |
Portfolio turnover (c) | | | 29 | % | | | 34 | % | | | 34 | % | | | 15 | % | |
(a) The Compass EMP U.S. 500 Volatility Weighted Fund Class I commenced operations on November 19, 2012.
(b) Calculated using average shares for the period.
(c) Not annualized for periods less than one year.
(d) Annualized for periods less than one year.
(e) During the period, certain fees were reduced and/or reimbursed. If such see reductions and/or reimbursements had not occurred, the ratios would have been as indicated.
See notes to financial statements.
157
Victory Portfolios II | | Financial Highlights | |
For a Share Outstanding Throughout Each Period
| | | Victory CEMP US Small Cap Volatility Wtd Index Fund | |
| | | Class A Shares | |
| | | For the
Six
Months
Ended
December 31,
2015 | | Year
Ended
June 30,
2015 | | Year
Ended
June 30,
2014 | | For the
Period
Ended
June 30,
2013(a) | |
| | | (Unaudited) | | | | | | | |
Net Asset Value, Beginning of Period | | $ | 13.78 | | | $ | 14.26 | | | $ | 12.14 | | | $ | 10.00 | | |
Investment Activities: | |
Net investment income (b) | | | 0.04 | | | | 0.07 | | | | 0.06 | | | | 0.05 | | |
Net realized and unrealized gains (losses)
on investments | | | (0.95 | ) | | | 0.65 | | | | 2.80 | | | | 2.15 | | |
Total from Investment Activities | | | (0.91 | ) | | | 0.72 | | | | 2.86 | | | | 2.20 | | |
Distributions: | |
Net investment income | | | (0.04 | ) | | | (0.07 | ) | | | (0.63 | ) | | | (0.06 | ) | |
Net realized gains from investments | | | (1.02 | ) | | | (1.13 | ) | | | (0.11 | ) | | | — | | |
Total Distributions | | | (1.06 | ) | | | (1.20 | ) | | | (0.74 | ) | | | (0.06 | ) | |
Net Asset Value, End of Period | | $ | 11.81 | | | $ | 13.78 | | | $ | 14.26 | | | $ | 12.14 | | |
Total Return (excludes sales charge) (c) | | | (6.76 | )% | | | 5.81 | % | | | 23.88 | % | | | 22.04 | % | |
Ratios/Supplemental Data: | |
Net Assets at end of period (000) | | $ | 2,494 | | | $ | 11,344 | | | $ | 7,705 | | | $ | 3,889 | | |
Ratio of net expenses to average net assets (d) | | | 0.99 | % | | | 1.23 | % | | | 1.25 | % | | | 1.25 | % | |
Ratio of net investment income to average net assets (d) | | | 0.62 | % | | | 0.48 | % | | | 0.41 | % | | | 0.73 | % | |
Ratio of gross expenses to average net assets (d) (e) | | | 1.67 | % | | | 1.59 | % | | | 1.65 | % | | | 2.20 | % | |
Ratio of net investment income to average net assets (d) (e) | | | 1.31 | % | | | 0.12 | % | | | 0.01 | % | | | (0.22 | )% | |
Portfolio turnover (c) | | | 104 | % | | | 53 | % | | | 69 | % | | | 25 | % | |
(a) The Compass EMP U.S. Small Cap 500 Volatility Weighted Fund Class A commenced operations on November 19, 2012.
(b) Calculated using average shares for the period.
(c) Not annualized for periods less than one year.
(d) Annualized for periods less than one year.
(e) During the period, certain fees were reduced and/or reimbursed. If such see reductions and/or reimbursements had not occurred, the ratios would have been as indicated.
See notes to financial statements.
158
Victory Portfolios II | | Financial Highlights — continued | |
For a Share Outstanding Throughout Each Period
| | | Victory CEMP US Small Cap Volatility Wtd Index Fund | |
| | | Class C Shares | |
| | | For the
Six
Months
Ended
December 31,
2015 | | Year
Ended
June 30,
2015 | | Year
Ended
June 30,
2014 | | For the
Period
Ended
June 30,
2013(a) | |
| | | (Unaudited) | | | | | | | |
Net Asset Value, Beginning of Period | | $ | 13.70 | | | $ | 14.18 | | | $ | 12.09 | | | $ | 10.00 | | |
Investment Activities: | |
Net investment loss (b) | | | (— | )(c) | | | (0.03 | ) | | | (0.04 | ) | | | (0.04 | ) | |
Net realized and unrealized gains (losses)
on investments | | | (0.95 | ) | | | 0.68 | | | | 2.82 | | | | 2.17 | | |
Total from Investment Activities | | | (0.95 | ) | | | 0.65 | | | | 2.78 | | | | 2.13 | | |
Distributions: | |
Net investment income | | | (— | )(c) | | | (0.00 | ) | | | (0.58 | ) | | | (0.04 | ) | |
Net realized gains from investments | | | (1.02 | ) | | | (1.13 | ) | | | (0.11 | ) | | | — | | |
Total Distributions | | | (1.02 | ) | | | (1.13 | ) | | | (0.69 | ) | | | (0.04 | ) | |
Net Asset Value, End of Period | | $ | 11.73 | | | $ | 13.70 | | | $ | 14.18 | | | $ | 12.09 | | |
Total Return (excludes contingent deferred sales charge) (d) | | | (7.08 | )% | | | 5.35 | % | | | 23.21 | % | | | 21.36 | % | |
Ratios/Supplemental Data: | |
Net Assets at end of period (000) | | $ | 2,222 | | | $ | 2,128 | | | $ | 1,584 | | | $ | 204 | | |
Ratio of net expenses to average net assets (e) | | | 1.74 | % | | | 1.98 | % | | | 2.00 | % | | | 2.00 | % | |
Ratio of net investment income to average net assets (e) | | | (0.06 | )% | | | (0.26 | )% | | | (0.34 | )% | | | (0.61 | )% | |
Ratio of gross expenses to average net assets (e) (f) | | | 2.39 | % | | | 2.34 | % | | | 2.40 | % | | | 2.95 | % | |
Ratio of net investment income to average net assets (e) (f) | | | 0.59 | % | | | (0.62 | )% | | | (0.74 | )% | | | (1.56 | )% | |
Portfolio turnover (d) | | | 104 | % | | | 53 | % | | | 69 | % | | | 25 | % | |
(a) The Compass EMP U.S. Small Cap 500 Volatility Weighted Fund Class C commenced operations on November 19, 2012.
(b) Calculated using average shares for the period.
(c) Less than $0.01 per share.
(d) Not annualized for periods less than one year.
(e) Annualized for periods less than one year.
(f) During the period, certain fees were reduced and/or reimbursed. If such see reductions and/or reimbursements had not occurred, the ratios would have been as indicated.
See notes to financial statements.
159
Victory Portfolios II | | Financial Highlights — continued | |
For a Share Outstanding Throughout Each Period
| | | Victory CEMP US Small Cap Volatility Wtd Index Fund | |
| | | Class I Shares | |
| | | For the
Six
Months
Ended
December 31,
2015 | | Year
Ended
June 30,
2015 | | Year
Ended
June 30,
2014 | | For the
Period
Ended
June 30,
2013(a) | |
| | | (Unaudited) | | | | | | | |
Net Asset Value, Beginning of Period | | $ | 13.83 | | | $ | 14.29 | | | $ | 12.15 | | | $ | 10.00 | | |
Investment Activities: | |
Net investment income (b) | | | 0.06 | | | | 0.09 | | | | 0.09 | | | | 0.03 | | |
Net realized and unrealized gains (losses)
on investments | | | (0.96 | ) | | | 0.68 | | | | 2.83 | | | | 2.18 | | |
Total from Investment Activities | | | (0.90 | ) | | | 0.77 | | | | 2.92 | | | | 2.21 | | |
Distributions: | |
Net investment income | | | (0.06 | ) | | | (0.10 | ) | | | (0.67 | ) | | | (0.06 | ) | |
Net realized gains from investments | | | (1.02 | ) | | | (1.13 | ) | | | (0.11 | ) | | | — | | |
Total Distributions | | | (1.08 | ) | | | (1.23 | ) | | | (0.78 | ) | | | (0.06 | ) | |
Net Asset Value, End of Period | | $ | 11.85 | | | $ | 13.83 | | | $ | 14.29 | | | $ | 12.15 | | |
Total Return (c) | | | (6.68 | )% | | | 6.20 | % | | | 24.32 | % | | | 22.21 | % | |
Ratios/Supplemental Data: | |
Net Assets at end of period (000) | | $ | 2,608 | | | $ | 4,133 | | | $ | 10,327 | | | $ | 1,594 | | |
Ratio of net expenses to average net assets (d) | | | 0.74 | % | | | 0.98 | % | | | 1.00 | % | | | 1.00 | % | |
Ratio of net investment income to average net assets (d) | | | 0.92 | % | | | 0.68 | % | | | 0.66 | % | | | 0.44 | % | |
Ratio of gross expenses to average net assets (d) (e) | | | 1.30 | % | | | 1.34 | % | | | 1.40 | % | | | 1.95 | % | |
Ratio of net investment income to average net assets (d) (e) | | | 1.48 | % | | | 0.32 | % | | | 0.26 | % | | | (0.51 | )% | |
Portfolio turnover (c) | | | 104 | % | | | 53 | % | | | 69 | % | | | 25 | % | |
(a) The Compass EMP U.S. Small Cap 500 Volatility Weighted Fund Class I commenced operations on November 19, 2012.
(b) Calculated using average shares for the period.
(c) Not annualized for periods less than one year.
(d) Annualized for periods less than one year.
(e) During the period, certain fees were reduced and/or reimbursed. If such see reductions and/or reimbursements had not occurred, the ratios would have been as indicated.
See notes to financial statements.
160
Victory Portfolios II | | Financial Highlights | |
For a Share Outstanding Throughout Each Period
| | | Victory CEMP International Volatility Wtd Index Fund | |
| | | Class A Shares | |
| | | For the
Six
Months
Ended
December 31,
2015 | | Year
Ended
June 30,
2015 | | Year
Ended
June 30,
2014 | | For the
Period
Ended
June 30,
2013(a) | |
| | | (Unaudited) | | | | | | | |
Net Asset Value, Beginning of Period | | $ | 11.42 | | | $ | 12.87 | | | $ | 10.88 | | | $ | 10.00 | | |
Investment Activities: | |
Net investment income (b) | | | 0.03 | | | | 0.14 | | | | 0.12 | | | | 0.15 | | |
Net realized and unrealized gains (losses)
on investments | | | (0.85 | ) | | | (0.72 | ) | | | 2.38 | | | | 0.87 | | |
Total from Investment Activities | | | (0.82 | ) | | | (0.58 | ) | | | 2.50 | | | | 1.02 | | |
Distributions: | |
Net investment income | | | (0.04 | ) | | | (0.14 | ) | | | (0.46 | ) | | | (0.14 | ) | |
Net realized gains from investments | | | (— | )(c) | | | (0.73 | ) | | | (0.05 | ) | | | — | | |
Total Distributions | | | (0.04 | ) | | | (0.87 | ) | | | (0.51 | ) | | | (0.14 | ) | |
Net Asset Value, End of Period | | $ | 10.56 | | | $ | 11.42 | | | $ | 12.87 | | | $ | 10.88 | | |
Total Return (excludes sales charge) (d) | | | (7.21 | )% | | | (4.16 | )% | | | 23.43 | % | | | 10.23 | % | |
Ratios/Supplemental Data: | |
Net Assets at end of period (000) | | $ | 3,335 | | | $ | 11,348 | | | $ | 13,073 | | | $ | 8,274 | | |
Ratio of net expenses to average net assets (e) | | | 1.10 | % | | | 1.37 | % | | | 1.40 | % | | | 1.40 | % | |
Ratio of net investment income to average net assets (e) | | | 0.58 | % | | | 1.13 | % | | | 1.03 | % | | | 2.19 | % | |
Ratio of gross expenses to average net assets (e) (f) | | | 1.99 | % | | | 1.95 | % | | | 1.86 | % | | | 3.67 | % | |
Ratio of net investment income to average net assets (e) (f) | | | 1.48 | % | | | 0.55 | % | | | 0.57 | % | | | (0.08 | )% | |
Portfolio turnover (d) | | | 45 | % | | | 38 | % | | | 90 | % | | | 27 | % | |
(a) The Compass EMP International 500 Volatility Weighted Fund Class A commenced operations on November 19, 2012.
(b) Calculated using average shares for the period.
(c) Less than $0.01 per share.
(d) Not annualized for periods less than one year.
(e) Annualized for periods less than one year.
(f) During the period, certain fees were reduced and/or reimbursed. If such see reductions and/or reimbursements had not occurred, the ratios would have been as indicated.
See notes to financial statements.
161
Victory Portfolios II | | Financial Highlights — continued | |
For a Share Outstanding Throughout Each Period
| | | Victory CEMP International Volatility Wtd Index Fund | |
| | | Class C Shares | |
| | | For the
Six
Months
Ended
December 31,
2015 | | Year
Ended
June 30,
2015 | | Year
Ended
June 30,
2014 | | For the
Period
Ended
June 30,
2013(a) | |
| | | (Unaudited) | | | | | | | |
Net Asset Value, Beginning of Period | | $ | 11.36 | | | $ | 12.83 | | | $ | 10.87 | | | $ | 10.00 | | |
Investment Activities: | |
Net investment income (loss) (b) | | | (0.01 | ) | | | 0.05 | | | | 0.13 | | | | 0.22 | | |
Net realized and unrealized gains (losses)
on investments | | | (0.85 | ) | | | (0.72 | ) | | | 2.27 | | | | 0.76 | | |
Total from Investment Activities | | | (0.86 | ) | | | (0.67 | ) | | | 2.40 | | | | 0.98 | | |
Distributions: | |
Net investment income | | | (0.01 | ) | | | (0.07 | ) | | | (0.39 | ) | | | (0.11 | ) | |
Net realized gains from investments | | | (— | )(c) | | | (0.73 | ) | | | (0.05 | ) | | | — | | |
Total Distributions | | | (0.01 | ) | | | (0.80 | ) | | | (0.44 | ) | | | (0.11 | ) | |
Net Asset Value, End of Period | | $ | 10.49 | | | $ | 11.36 | | | $ | 12.83 | | | $ | 10.87 | | |
Total Return (excludes contingent deferred sales charge) (d) | | | (7.58 | )% | | | (4.89 | )% | | | 22.49 | % | | | 9.79 | % | |
Ratios/Supplemental Data: | |
Net Assets at end of period (000) | | $ | 437 | | | $ | 138 | | | $ | 141 | | | $ | 18 | | |
Ratio of net expenses to average net assets (e) | | | 1.85 | % | | | 2.12 | % | | | 2.15 | % | | | 2.15 | % | |
Ratio of net investment income to average net assets (e) | | | (0.23 | )% | | | 0.42 | % | | | 1.09 | % | | | 3.22 | % | |
Ratio of gross expenses to average net assets (e) (f) | | | 2.73 | % | | | 2.70 | % | | | 2.61 | % | | | 4.42 | % | |
Ratio of net investment income to average net assets (e) (f) | | | 0.64 | % | | | (0.16 | )% | | | 0.63 | % | | | 0.95 | % | |
Portfolio turnover (d) | | | 45 | % | | | 38 | % | | | 90 | % | | | 27 | % | |
(a) The Compass EMP International 500 Volatility Weighted Fund Class C commenced operations on November 19, 2012.
(b) Calculated using average shares for the period.
(c) Less than $0.01 per share.
(d) Not annualized for periods less than one year.
(e) Annualized for periods less than one year.
(f) During the period, certain fees were reduced and/or reimbursed. If such see reductions and/or reimbursements had not occurred, the ratios would have been as indicated.
See notes to financial statements.
162
Victory Portfolios II | | Financial Highlights — continued | |
For a Share Outstanding Throughout Each Period
| | | Victory CEMP International Volatility Wtd Index Fund | |
| | | Class I Shares | |
| | | For the
Six
Months
Ended
December 31,
2015 | | Year
Ended
June 30,
2015 | | Year
Ended
June 30,
2014 | | For the
Period
Ended
June 30,
2013(a) | |
| | | (Unaudited) | | | | | | | |
Net Asset Value, Beginning of Period | | $ | 11.43 | | | $ | 12.88 | | | $ | 10.89 | | | $ | 10.00 | | |
Investment Activities: | |
Net investment income (b) | | | 0.05 | | | | 0.14 | | | | 0.16 | | | | 0.24 | | |
Net realized and unrealized gains (losses)
on investments | | | (0.85 | ) | | | (0.69 | ) | | | 2.37 | | | | 0.80 | | |
Total from Investment Activities | | | (0.80 | ) | | | (0.55 | ) | | | 2.53 | | | | 1.04 | | |
Distributions: | |
Net investment income | | | (0.05 | ) | | | (0.17 | ) | | | (0.49 | ) | | | (0.15 | ) | |
Net realized gains from investments | | | (— | )(c) | | | (0.73 | ) | | | (0.05 | ) | | | — | | |
Total Distributions | | | (0.05 | ) | | | (0.90 | ) | | | (0.54 | ) | | | (0.15 | ) | |
Net Asset Value, End of Period | | $ | 10.58 | | | $ | 11.43 | | | $ | 12.88 | | | $ | 10.89 | | |
Total Return (d) | | | (6.99 | )% | | | (3.91 | )% | | | 23.70 | % | | | 10.42 | % | |
Ratios/Supplemental Data: | |
Net Assets at end of period (000) | | $ | 5,407 | | | $ | 9,223 | | | $ | 22,932 | | | $ | 8 | | |
Ratio of net expenses to average net assets (e) | | | 0.85 | % | | | 1.12 | % | | | 1.15 | % | | | 1.15 | % | |
Ratio of net investment income to average net assets (e) | | | 0.83 | % | | | 1.15 | % | | | 1.32 | % | | | 3.46 | % | |
Ratio of gross expenses to average net assets (e) (f) | | | 1.76 | % | | | 1.70 | % | | | 1.61 | % | | | 3.42 | % | |
Ratio of net investment income to average net assets (e) (f) | | | 1.75 | % | | | 0.57 | % | | | 0.86 | % | | | 1.19 | % | |
Portfolio turnover (d) | | | 45 | % | | | 38 | % | | | 90 | % | | | 27 | % | |
(a) The Compass EMP International 500 Volatility Weighted Fund Class I commenced operations on November 19, 2012.
(b) Calculated using average shares for the period.
(c) Less than $0.01 per share.
(d) Not annualized for periods less than one year.
(e) Annualized for periods less than one year.
(f) During the period, certain fees were reduced and/or reimbursed. If such see reductions and/or reimbursements had not occurred, the ratios would have been as indicated.
See notes to financial statements.
163
Victory Portfolios II | | Financial Highlights | |
For a Share Outstanding Throughout Each Period
| | | Victory CEMP Emerging Market Volatility Wtd Index Fund | |
| | | Class A Shares | |
| | | For the
Six
Months
Ended
December 31,
2015 | | Year
Ended
June 30,
2015 | | Year
Ended
June 30,
2014 | | For the
Period
Ended
June 30,
2013(a) | |
| | | (Unaudited) | | | | | | | |
Net Asset Value, Beginning of Period | | $ | 9.88 | | | $ | 10.70 | | | $ | 9.74 | | | $ | 10.00 | | |
Investment Activities: | |
Net investment income (b) | | | 0.05 | | | | 0.10 | | | | 0.07 | | | | 0.08 | | |
Net realized and unrealized gains (losses)
on investments | | | (1.65 | ) | | | (0.83 | ) | | | 0.96 | | | | (0.28 | ) | |
Total from Investment Activities | | | (1.60 | ) | | | (0.73 | ) | | | 1.03 | | | | (0.20 | ) | |
Distributions: | |
Net investment income | | | (0.06 | ) | | | (0.09 | ) | | | (0.07 | ) | | | (0.06 | ) | |
Total Distributions | | | (0.06 | ) | | | (0.09 | ) | | | (0.07 | ) | | | (0.06 | ) | |
Net Asset Value, End of Period | | $ | 8.22 | | | $ | 9.88 | | | $ | 10.70 | | | $ | 9.74 | | |
Total Return (excludes sales charge) (c) | | | (16.16 | )% | | | (6.79 | )% | | | 10.57 | % | | | (1.97 | )% | |
Ratios/Supplemental Data: | |
Net Assets at end of period (000) | | $ | 7,287 | | | $ | 8,555 | | | $ | 9,531 | | | $ | 3,207 | | |
Ratio of net expenses to average net assets (d) | | | 1.15 | % | | | 1.41 | % | | | 1.45 | % | | | 1.45 | % | |
Ratio of net investment income to average net assets (d) | | | 1.12 | % | | | 0.97 | % | | | 0.67 | % | | | 1.18 | % | |
Ratio of gross expenses to average net assets (d) (e) | | | 2.91 | % | | | 2.64 | % | | | 3.37 | % | | | 8.32 | % | |
Ratio of net investment income to average net assets (d) (e) | | | 2.88 | % | | | (0.26 | )% | | | (1.25 | )% | | | (5.69 | )% | |
Portfolio turnover (c) | | | 75 | % | | | 76 | % | | | 49 | % | | | 25 | % | |
(a) The Compass EMP Emerging Market 500 Volatility Weighted Fund Class A commenced operations on November 19, 2012.
(b) Calculated using average shares for the period.
(c) Not annualized for periods less than one year.
(d) Annualized for periods less than one year.
(e) During the period, certain fees were reduced and/or reimbursed. If such see reductions and/or reimbursements had not occurred, the ratios would have been as indicated.
See notes to financial statements.
164
Victory Portfolios II | | Financial Highlights — continued | |
For a Share Outstanding Throughout Each Period
| | | Victory CEMP Emerging Market Volatility Wtd Index Fund | |
| | | Class C Shares | |
| | | For the
Six
Months
Ended
December 31,
2015 | | Year
Ended
June 30,
2015 | | Year
Ended
June 30,
2014 | | For the
Period
Ended
June 30,
2013(a) | |
| | | (Unaudited) | | | | | | | |
Net Asset Value, Beginning of Period | | $ | 9.81 | | | $ | 10.63 | | | $ | 9.72 | | | $ | 10.00 | | |
Investment Activities: | |
Net investment income (loss) (b) | | | 0.02 | | | | 0.01 | | | | (0.01 | ) | | | 0.10 | | |
Net realized and unrealized gains (losses)
on investments | | | (1.64 | ) | | | (0.80 | ) | | | 0.96 | | | | (0.33 | ) | |
Total from Investment Activities | | | (1.62 | ) | | | (0.79 | ) | | | 0.95 | | | | (0.23 | ) | |
Distributions: | |
Net investment income | | | (0.05 | ) | | | (0.03 | ) | | | (0.04 | ) | | | (0.05 | ) | |
Total Distributions | | | (0.05 | ) | | | (0.03 | ) | | | (0.04 | ) | | | (0.05 | ) | |
Net Asset Value, End of Period | | $ | 8.14 | | | $ | 9.81 | | | $ | 10.63 | | | $ | 9.72 | | |
Total Return (excludes contingent deferred sales charge) (c) | | | (16.56 | )% | | | (7.46 | )% | | | 9.77 | % | | | (2.35 | )% | |
Ratios/Supplemental Data: | |
Net Assets at end of period (000) | | $ | 1,420 | | | $ | 1,660 | | | $ | 1,602 | | | $ | 209 | | |
Ratio of net expenses to average net assets (d) | | | 1.90 | % | | | 2.16 | % | | | 2.20 | % | | | 2.20 | % | |
Ratio of net investment income to average net assets (d) | | | 0.34 | % | | | 0.12 | % | | | (0.08 | )% | | | 1.47 | % | |
Ratio of gross expenses to average net assets (d) (e) | | | 3.73 | % | | | 3.39 | % | | | 4.12 | % | | | 9.07 | % | |
Ratio of net investment income to average net assets (d) (e) | | | 2.18 | % | | | (1.11 | )% | | | (2.00 | )% | | | (5.40 | )% | |
Portfolio turnover (c) | | | 75 | % | | | 76 | % | | | 49 | % | | | 25 | % | |
(a) The Compass EMP Emerging Market 500 Volatility Weighted Fund Class C commenced operations on November 19, 2012.
(b) Calculated using average shares for the period.
(c) Not annualized for periods less than one year.
(d) Annualized for periods less than one year.
(e) During the period, certain fees were reduced and/or reimbursed. If such see reductions and/or reimbursements had not occurred, the ratios would have been as indicated.
See notes to financial statements.
165
Victory Portfolios II | | Financial Highlights — continued | |
For a Share Outstanding Throughout Each Period
| | | Victory CEMP Emerging Market Volatility Wtd Index Fund | |
| | | Class I Shares | |
| | | For the
Six
Months
Ended
December 31,
2015 | | Year
Ended
June 30,
2015 | | Year
Ended
June 30,
2014 | | For the
Period
Ended
June 30,
2013(a) | |
| | | (Unaudited) | | | | | | | |
Net Asset Value, Beginning of Period | | $ | 9.89 | | | $ | 10.70 | | | $ | 9.75 | | | $ | 10.00 | | |
Investment Activities: | |
Net investment income (b) | | | 0.08 | | | | 0.11 | | | | 0.09 | | | | 0.14 | | |
Net realized and unrealized gains (losses)
on investments | | | (1.68 | ) | | | (0.80 | ) | | | 0.95 | | | | (0.32 | ) | |
Total from Investment Activities | | | (1.60 | ) | | | (0.69 | ) | | | 1.04 | | | | (0.18 | ) | |
Distributions: | |
Net investment income | | | (0.07 | ) | | | (0.12 | ) | | | (0.09 | ) | | | (0.07 | ) | |
Total Distributions | | | (0.07 | ) | | | (0.12 | ) | | | (0.09 | ) | | | (0.07 | ) | |
Net Asset Value, End of Period | | $ | 8.22 | | | $ | 9.89 | | | $ | 10.70 | | | $ | 9.75 | | |
Total Return (c) | | | (16.18 | )% | | | (6.46 | )% | | | 10.68 | % | | | (1.79 | )% | |
Ratios/Supplemental Data: | |
Net Assets at end of period (000) | | $ | 2,326 | | | $ | 9,556 | | | $ | 8,236 | | | $ | 970 | | |
Ratio of net expenses to average net assets (d) | | | 0.90 | % | | | 1.16 | % | | | 1.20 | % | | | 1.20 | % | |
Ratio of net investment income to average net assets (d) | | | 1.68 | % | | | 1.02 | % | | | 0.92 | % | | | 2.06 | % | |
Ratio of gross expenses to average net assets (d) (e) | | | 2.64 | % | | | 2.39 | % | | | 3.12 | % | | | 8.07 | % | |
Ratio of net investment income to average net assets (d) (e) | | | 3.42 | % | | | (0.21 | )% | | | (1.00 | )% | | | (4.81 | )% | |
Portfolio turnover (c) | | | 75 | % | | | 76 | % | | | 49 | % | | | 25 | % | |
(a) The Compass EMP Emerging Market 500 Volatility Weighted Fund Class I commenced operations on November 19, 2012.
(b) Calculated using average shares for the period.
(c) Not annualized for periods less than one year.
(d) Annualized for periods less than one year.
(e) During the period, certain fees were reduced and/or reimbursed. If such see reductions and/or reimbursements had not occurred, the ratios would have been as indicated.
See notes to financial statements.
166
Victory Portfolios II | | Financial Highlights | |
For a Share Outstanding Throughout Each Period
| | | Victory CEMP US 500 Enhanced Volatility Wtd Index Fund | |
| | | Class A Shares | |
| | | For the
Six
Months
Ended
December 31,
2015 | | Year
Ended
June 30,
2015 | | Year
Ended
June 30,
2014 | | For the
Period
Ended
June 30,
2013(a) | |
| | | (Unaudited) | | | | | | | |
Net Asset Value, Beginning of Period | | $ | 14.15 | | | $ | 14.16 | | | $ | 11.71 | | | $ | 10.00 | | |
Investment Activities: | |
Net investment income (b) | | | 0.06 | | | | 0.05 | | | | 0.03 | | | | 0.04 | | |
Net realized and unrealized gains (losses)
on investments | | | (0.37 | ) | | | 0.74 | | | | 2.58 | | | | 1.71 | | |
Total from Investment Activities | | | (0.31 | ) | | | 0.79 | | | | 2.61 | | | | 1.75 | | |
Distributions: | |
Net investment income | | | (0.05 | ) | | | (0.04 | ) | | | (0.13 | ) | | | (0.04 | ) | |
Net realized gains from investments | | | (0.52 | ) | | | (0.76 | ) | | | (0.03 | ) | | | — | | |
Total Distributions | | | (0.57 | ) | | | (0.80 | ) | | | (0.16 | ) | | | (0.04 | ) | |
Net Asset Value, End of Period | | $ | 13.27 | | | $ | 14.15 | | | $ | 14.16 | | | $ | 11.71 | | |
Total Return (excludes sales charge) (c) | | | (2.26 | )% | | | 5.89 | % | | | 22.39 | % | | | 17.49 | % | |
Ratios/Supplemental Data: | |
Net Assets at end of period (000) | | $ | 84,485 | | | $ | 75,399 | | | $ | 77,212 | | | $ | 20,008 | | |
Ratio of net expenses to average net assets (d) | | | 0.99 | % | | | 1.50 | % | | | 1.60 | % | | | 1.60 | % | |
Ratio of net investment income to average net assets (d) | | | 0.87 | % | | | 0.35 | % | | | 0.25 | % | | | 0.51 | % | |
Ratio of gross expenses to average net assets (d) (e) | | | 1.26 | % | | | 1.67 | % | | | 1.68 | % | | | 1.89 | % | |
Ratio of net investment income to average net assets (d) (e) | | | 1.14 | % | | | 0.18 | % | | | 0.17 | % | | | 0.22 | % | |
Portfolio turnover (c) | | | 23 | % | | | 48 | % | | | 29 | % | | | 13 | % | |
(a) The Compass EMP U.S. 500 Enhanced Volatility Weighted Fund Class A commenced operations on November 19, 2012.
(b) Calculated using average shares for the period.
(c) Not annualized for periods less than one year.
(d) Annualized for periods less than one year.
(e) During the period, certain fees were reduced and/or reimbursed. If such see reductions and/or reimbursements had not occurred, the ratios would have been as indicated.
See notes to financial statements.
167
Victory Portfolios II | | Financial Highlights — continued | |
For a Share Outstanding Throughout Each Period
| | | Victory CEMP US 500 Enhanced Volatility Wtd Index Fund | |
| | | Class C Shares | |
| | | For the
Six
Months
Ended
December 31,
2015 | | Year
Ended
June 30,
2015 | | Year
Ended
June 30,
2014 | | For the
Period
Ended
June 30,
2013(a) | |
| | | (Unaudited) | | | | | | | |
Net Asset Value, Beginning of Period | | $ | 13.95 | | | $ | 14.05 | | | $ | 11.67 | | | $ | 10.00 | | |
Investment Activities: | |
Net investment income (loss) (b) | | | 0.01 | | | | (0.05 | ) | | | (0.07 | ) | | | (0.03 | ) | |
Net realized and unrealized gains (losses)
on investments | | | (0.37 | ) | | | 0.71 | | | | 2.57 | | | | 1.72 | | |
Total from Investment Activities | | | (0.36 | ) | | | 0.66 | | | | 2.50 | | | | 1.69 | | |
Distributions: | |
Net investment income | | | (— | )(c) | | | — | | | | (0.09 | ) | | | (0.02 | ) | |
Net realized gains from investments | | | (0.52 | ) | | | (0.76 | ) | | | (0.03 | ) | | | — | | |
Total Distributions | | | (0.52 | ) | | | (0.76 | ) | | | (0.12 | ) | | | (0.02 | ) | |
Net Asset Value, End of Period | | $ | 13.07 | | | $ | 13.95 | | | $ | 14.05 | | | $ | 11.67 | | |
Total Return (excludes contingent deferred sales charge) (d) | | | (2.64 | )% | | | 5.01 | % | | | 21.52 | % | | | 16.98 | % | |
Ratios/Supplemental Data: | |
Net Assets at end of period (000) | | $ | 57,629 | | | $ | 56,826 | | | $ | 33,464 | | | $ | 2,673 | | |
Ratio of net expenses to average net assets (e) | | | 1.74 | % | | | 2.25 | % | | | 2.35 | % | | | 2.35 | % | |
Ratio of net investment income to average net assets (e) | | | 0.10 | % | | | (0.37 | )% | | | (0.50 | )% | | | (0.34 | )% | |
Ratio of gross expenses to average net assets (e) (f) | | | 2.00 | % | | | 2.42 | % | | | 3.43 | % | | | 2.64 | % | |
Ratio of net investment income to average net assets (e) (f) | | | 0.36 | % | | | (0.54 | )% | | | (0.58 | )% | | | (0.63 | )% | |
Portfolio turnover (d) | | | 23 | % | | | 48 | % | | | 29 | % | | | 13 | % | |
(a) The Compass EMP U.S. 500 Enhanced Volatility Weighted Fund Class C commenced operations on November 19, 2012.
(b) Calculated using average shares for the period.
(c) Less than $0.01 per share.
(d) Not annualized for periods less than one year.
(e) Annualized for periods less than one year.
(f) During the period, certain fees were reduced and/or reimbursed. If such see reductions and/or reimbursements had not occurred, the ratios would have been as indicated.
See notes to financial statements.
168
Victory Portfolios II | | Financial Highlights — continued | |
For a Share Outstanding Throughout Each Period
| | | Victory CEMP US 500 Enhanced Volatility Wtd Index Fund | |
| | | Class I Shares | |
| | | For the
Six
Months
Ended
December 31,
2015 | | Year
Ended
June 30,
2015 | | Year
Ended
June 30,
2014 | | For the
Period
Ended
June 30,
2013(a) | |
| | | (Unaudited) | | | | | | | |
Net Asset Value, Beginning of Period | | $ | 14.15 | | | $ | 14.16 | | | $ | 11.71 | | | $ | 10.00 | | |
Investment Activities: | |
Net investment income (b) | | | 0.08 | | | | 0.08 | | | | 0.07 | | | | 0.05 | | |
Net realized and unrealized gains (losses)
on investments | | | (0.38 | ) | | | 0.74 | | | | 2.57 | | | | 1.71 | | |
Total from Investment Activities | | | (0.30 | ) | | | 0.82 | | | | 2.64 | | | | 1.76 | | |
Distributions: | |
Net investment income | | | (0.07 | ) | | | (0.07 | ) | | | (0.16 | ) | | | (0.05 | ) | |
Net realized gains from investments | | | (0.52 | ) | | | (0.76 | ) | | | (0.03 | ) | | | — | | |
Total Distributions | | | (0.59 | ) | | | (0.83 | ) | | | (0.19 | ) | | | (0.05 | ) | |
Net Asset Value, End of Period | | $ | 13.26 | | | $ | 14.15 | | | $ | 14.16 | | | $ | 11.71 | | |
Total Return (c) | | | (2.21 | )% | | | 6.16 | % | | | 22.66 | % | | | 17.65 | % | |
Ratios/Supplemental Data: | |
Net Assets at end of period (000) | | $ | 51,597 | | | $ | 63,213 | | | $ | 92,699 | | | $ | 4,205 | | |
Ratio of net expenses to average net assets (d) | | | 0.74 | % | | | 1.25 | % | | | 1.35 | % | | | 1.35 | % | |
Ratio of net investment income to average net assets (d) | | | 1.07 | % | | | 0.60 | % | | | 0.50 | % | | | 0.63 | % | |
Ratio of gross expenses to average net assets (d) (e) | | | 1.02 | % | | | 1.42 | % | | | 1.43 | % | | | 1.64 | % | |
Ratio of net investment income to average net assets (d) (e) | | | 1.35 | % | | | 0.43 | % | | | 0.42 | % | | | 0.34 | % | |
Portfolio turnover (c) | | | 23 | % | | | 48 | % | | | 29 | % | | | 13 | % | |
(a) The Compass EMP U.S. 500 Enhanced Volatility Weighted Fund Class I commenced operations on November 19, 2012.
(b) Calculated using average shares for the period.
(c) Not annualized for periods less than one year.
(d) Annualized for periods less than one year.
(e) During the period, certain fees were reduced and/or reimbursed. If such see reductions and/or reimbursements had not occurred, the ratios would have been as indicated.
See notes to financial statements.
169
Victory Portfolios II | | Financial Highlights | |
For a Share Outstanding Throughout Each Period
| | | Victory CEMP International Enhanced Volatility Wtd Index Fund | |
| | | Class A Shares | |
| | | For the
Six
Months
Ended
December 31,
2015 | | Year
Ended
June 30,
2015 | | Year
Ended
June 30,
2014 | | For the
Period
Ended
June 30,
2013(a) | |
| | | (Unaudited) | | | | | | | |
Net Asset Value, Beginning of Period | | $ | 11.33 | | | $ | 12.44 | | | $ | 10.46 | | | $ | 10.00 | | |
Investment Activities: | |
Net investment income (b) | | | 0.04 | | | | 0.10 | | | | 0.10 | | | | 0.12 | | |
Net realized and unrealized gains (losses)
on investments | | | (1.29 | ) | | | (0.70 | ) | | | 2.24 | | | | 0.44 | | |
Total from Investment Activities | | | (1.25 | ) | | | (0.60 | ) | | | 2.34 | | | | 0.56 | | |
Distributions: | |
Net investment income | | | (0.02 | ) | | | (0.10 | ) | | | (0.34 | ) | | | (0.10 | ) | |
Net realized gains from investments | | | — | | | | (0.41 | ) | | | (0.02 | ) | | | — | | |
Total Distributions | | | (0.02 | ) | | | (0.51 | ) | | | (0.36 | ) | | | (0.10 | ) | |
Net Asset Value, End of Period | | $ | 10.06 | | | $ | 11.33 | | | $ | 12.44 | | | $ | 10.46 | | |
Total Return (excludes sales charge) (c) | | | (10.99 | )% | | | (4.65 | )% | | | 22.73 | % | | | 5.61 | % | |
Ratios/Supplemental Data: | |
Net Assets at end of period (000) | | $ | 16,547 | | | $ | 21,738 | | | $ | 32,139 | | | $ | 11,815 | | |
Ratio of net expenses to average net assets (d) | | | 1.10 | % | | | 1.58 | % | | | 1.65 | % | | | 1.65 | % | |
Ratio of net investment income to average net assets (d) | | | 0.75 | % | | | 0.88 | % | | | 0.91 | % | | | 1.88 | % | |
Ratio of gross expenses to average net assets (d) (e) | | | 1.60 | % | | | 1.88 | % | | | 1.65 | % | | | 3.59 | % | |
Ratio of net investment income to average net assets (d) (e) | | | 1.26 | % | | | 0.58 | % | | | 0.59 | % | | | (0.06 | )% | |
Portfolio turnover (c) | | | 47 | % | | | 52 | % | | | 81 | % | | | 27 | % | |
(a) The Compass EMP International 500 Enhanced Volatility Weighted Fund Class A commenced operations on November 19, 2012.
(b) Calculated using average shares for the period.
(c) Not annualized for periods less than one year.
(d) Annualized for periods less than one year.
(e) During the period, certain fees were reduced and/or reimbursed. If such see reductions and/or reimbursements had not occurred, the ratios would have been as indicated.
See notes to financial statements.
170
Victory Portfolios II | | Financial Highlights — continued | |
For a Share Outstanding Throughout Each Period
| | | Victory CEMP International Enhanced Volatility Wtd Index Fund | |
| | | Class C Shares | |
| | | For the
Six
Months
Ended
December 31,
2015 | | Year
Ended
June 30,
2015 | | Year
Ended
June 30,
2014 | | For the
Period
Ended
June 30,
2013(a) | |
| | | (Unaudited) | | | | | | | |
Net Asset Value, Beginning of Period | | $ | 11.22 | | | $ | 12.36 | | | $ | 10.43 | | | $ | 10.00 | | |
Investment Activities: | |
Net investment income (b) | | | — | (c) | | | 0.03 | | | | 0.04 | | | | 0.18 | | |
Net realized and unrealized gains (losses)
on investments | | | (1.28 | ) | | | (0.71 | ) | | | 2.19 | | | | 0.34 | | |
Total from Investment Activities | | | (1.28 | ) | | | (0.68 | ) | | | 2.23 | | | | 0.52 | | |
Distributions: | |
Net investment income | | | (— | )(c) | | | (0.05 | ) | | | (0.28 | ) | | | (0.09 | ) | |
Net realized gains from investments | | | — | | | | (0.41 | ) | | | (0.02 | ) | | | — | | |
Total Distributions | | | (0.00 | )(c) | | | (0.46 | ) | | | (0.30 | ) | | | (0.09 | ) | |
Net Asset Value, End of Period | | $ | 9.94 | | | $ | 11.22 | | | $ | 12.36 | | | $ | 10.43 | | |
Total Return (excludes contingent deferred sales charge) (d) | | | (11.37 | )% | | | (5.33 | )% | | | 21.70 | % | | | 5.20 | % | |
Ratios/Supplemental Data: | |
Net Assets at end of period (000) | | $ | 7,151 | | | $ | 7,953 | | | $ | 6,255 | | | $ | 429 | | |
Ratio of net expenses to average net assets (e) | | | 1.85 | % | | | 2.33 | % | | | 2.40 | % | | | 2.40 | % | |
Ratio of net investment income to average net assets (e) | | | — | %(f) | | | 0.20 | % | | | 0.38 | % | | | 2.77 | % | |
Ratio of gross expenses to average net assets (e) (g) | | | 2.39 | % | | | 2.63 | % | | | 2.72 | % | | | 4.34 | % | |
Ratio of net investment income to average net assets (e) (g) | | | 0.54 | % | | | (0.10 | )% | | | 0.06 | % | | | 0.83 | % | |
Portfolio turnover (d) | | | 47 | % | | | 52 | % | | | 81 | % | | | 27 | % | |
(a) The Compass EMP International 500 Enhanced Volatility Weighted Fund Class C commenced operations on November 19, 2012.
(b) Calculated using average shares for the period.
(c) Less than $0.01 per share.
(d) Not annualized for periods less than one year.
(e) Annualized for periods less than one year.
(f) Less than 0.005% of average net assets.
(g) During the period, certain fees were reduced and/or reimbursed. If such see reductions and/or reimbursements had not occurred, the ratios would have been as indicated.
See notes to financial statements.
171
Victory Portfolios II | | Financial Highlights — continued | |
For a Share Outstanding Throughout Each Period
| | | Victory CEMP International Enhanced Volatility Wtd Index Fund | |
| | | Class I Shares | |
| | | For the
Six
Months
Ended
December 31,
2015 | | Year
Ended
June 30,
2015 | | Year
Ended
June 30,
2014 | | For the
Period
Ended
June 30,
2013(a) | |
| | | (Unaudited) | | | | | | | |
Net Asset Value, Beginning of Period | | $ | 11.33 | | | $ | 12.44 | | | $ | 10.46 | | | $ | 10.00 | | |
Investment Activities: | |
Net investment income (b) | | | 0.05 | | | | 0.12 | | | | 0.14 | | | | 0.16 | | |
Net realized and unrealized gains (losses)
on investments | | | (1.29 | ) | | | (0.69 | ) | | | 2.23 | | | | 0.41 | | |
Total from Investment Activities | | | (1.24 | ) | | | (0.57 | ) | | | 2.37 | | | | 0.57 | | |
Distributions: | |
Net investment income | | | (0.04 | ) | | | (0.13 | ) | | | (0.37 | ) | | | (0.11 | ) | |
Net realized gains from investments | | | — | | | | (0.41 | ) | | | (0.02 | ) | | | — | | |
Total Distributions | | | (0.04 | ) | | | (0.54 | ) | | | (0.39 | ) | | | (0.11 | ) | |
Net Asset Value, End of Period | | $ | 10.05 | | | $ | 11.33 | | | $ | 12.44 | | | $ | 10.46 | | |
Total Return (c) | | | (10.95 | )% | | | (4.41 | )% | | | 22.99 | % | | | 5.67 | % | |
Ratios/Supplemental Data: | |
Net Assets at end of period (000) | | $ | 11,533 | | | $ | 44,461 | | | $ | 57,920 | | | $ | 7,063 | | |
Ratio of net expenses to average net assets (d) | | | 0.85 | % | | | 1.33 | % | | | 1.40 | % | | | 1.40 | % | |
Ratio of net investment income to average net assets (d) | | | 0.91 | % | | | 1.05 | % | | | 1.16 | % | | | 2.49 | % | |
Ratio of gross expenses to average net assets (d) (e) | | | 1.37 | % | | | 1.63 | % | | | 1.72 | % | | | 3.34 | % | |
Ratio of net investment income to average net assets (d) (e) | | | 1.43 | % | | | 0.75 | % | | | 0.84 | % | | | 0.55 | % | |
Portfolio turnover (c) | | | 47 | % | | | 52 | % | | | 81 | % | | | 27 | % | |
(a) The Compass EMP International 500 Enhanced Volatility Weighted Fund Class I commenced operations on November 19, 2012.
(b) Calculated using average shares for the period.
(c) Not annualized for periods less than one year.
(d) Annualized for periods less than one year.
(e) During the period, certain fees were reduced and/or reimbursed. If such see reductions and/or reimbursements had not occurred, the ratios would have been as indicated.
See notes to financial statements.
172
Victory Portfolios II | | Financial Highlights | |
For a Share Outstanding Throughout Each Period
| | | Victory CEMP REC Enhanced Volatility Wtd Index Fund | |
| | | Class A Shares | |
| | | For the
Six
Months
Ended
December 31,
2015 | | Year
Ended
June 30,
2015 | | Year
Ended
June 30,
2014 | | For the
Period
Ended
June 30,
2013(a) | |
| | | (Unaudited) | | | | | | | |
Net Asset Value, Beginning of Period | | $ | 11.37 | | | $ | 11.41 | | | $ | 10.89 | | | $ | 10.00 | | |
Investment Activities: | |
Net investment income (b) | | | 0.10 | | | | 0.15 | | | | 0.07 | | | | 0.12 | | |
Net realized and unrealized gains (losses)
on investments | | | (0.13 | ) | | | 0.22 | | | | 0.69 | | | | 0.97 | | |
Total from Investment Activities | | | (0.03 | ) | | | 0.37 | | | | 0.76 | | | | 1.09 | | |
Distributions: | |
Net investment income | | | (0.03 | ) | | | (0.16 | ) | | | (0.06 | ) | | | (0.12 | ) | |
In excess of net investment income | | | — | | | | — | | | | — | | | | (0.08 | ) | |
Net realized gains from investments | | | (1.99 | ) | | | (0.25 | ) | | | (0.16 | ) | | | — | | |
Tax return of capital | | | — | | | | — | | | | (0.02 | ) | | | — | | |
Total Distributions | | | (2.02 | ) | | | (0.41 | ) | | | (0.24 | ) | | | (0.20 | ) | |
Net Asset Value, End of Period | | $ | 9.32 | | | $ | 11.37 | | | $ | 11.41 | | | $ | 10.89 | | |
Total Return (excludes sales charge) (c) | | | (0.48 | )% | | | 3.13 | % | | | 7.14 | % | | | 10.82 | % | |
Ratios/Supplemental Data: | |
Net Assets at end of period (000) | | $ | 5,115 | | | $ | 8,094 | | | $ | 12,343 | | | $ | 3,395 | | |
Ratio of net expenses to average net assets (d) | | | 1.41 | % | | | 1.40 | % | | | 1.40 | % | | | 1.40 | % | |
Ratio of net investment income to average net assets (d) | | | 1.86 | % | | | 1.30 | % | | | 0.67 | % | | | 1.84 | % | |
Ratio of gross expenses to average net assets (d) (e) | | | 1.85 | % | | | 1.68 | % | | | 1.67 | % | | | 1.99 | % | |
Ratio of net investment income to average net assets (d) (e) | | | 2.30 | % | | | 1.02 | % | | | 0.40 | % | | | 1.25 | % | |
Portfolio turnover (c) | | | 236 | % | | | 44 | % | | | 63 | % | | | 35 | % | |
(a) The Compass EMP REC Enhanced Volatility Weighted Fund Class A commenced operations on November 19, 2012.
(b) Calculated using average shares for the period.
(c) Not annualized for periods less than one year.
(d) Annualized for periods less than one year.
(e) During the period, certain fees were reduced and/or reimbursed. If such see reductions and/or reimbursements had not occurred, the ratios would have been as indicated.
See notes to financial statements.
173
Victory Portfolios II | | Financial Highlights — continued | |
For a Share Outstanding Throughout Each Period
| | | Victory CEMP REC Enhanced Volatility Wtd Index Fund | |
| | | Class C Shares | |
| | | For the
Six
Months
Ended
December 31,
2015 | | Year
Ended
June 30,
2015 | | Year
Ended
June 30,
2014 | | For the
Period
Ended
June 30,
2013(a) | |
| | | (Unaudited) | | | | | | | |
Net Asset Value, Beginning of Period | | $ | 11.32 | | | $ | 11.36 | | | $ | 10.88 | | | $ | 10.00 | | |
Investment Activities: | |
Net investment income (loss) (b) | | | 0.07 | | | | 0.07 | | | | (0.01 | ) | | | 0.09 | | |
Net realized and unrealized gains (losses)
on investments | | | (0.14 | ) | | | 0.22 | | | | 0.68 | | | | 0.96 | | |
Total from Investment Activities | | | (0.07 | ) | | | 0.29 | | | | 0.67 | | | | 1.05 | | |
Distributions: | |
Net investment income | | | (0.02 | ) | | | (0.08 | ) | | | — | | | | (0.09 | ) | |
In excess of net investment income | | | — | | | | — | | | | — | | | | (0.08 | ) | |
Net realized gains from investments | | | (1.99 | ) | | | (0.25 | ) | | | (0.16 | ) | | | — | | |
Tax return of capital | | | — | | | | — | | | | (0.03 | ) | | | — | | |
Total Distributions | | | (2.01 | ) | | | (0.33 | ) | | | (0.19 | ) | | | (0.17 | ) | |
Net Asset Value, End of Period | | $ | 9.24 | | | $ | 11.32 | | | $ | 11.36 | | | $ | 10.88 | | |
Total Return (excludes contingent deferred sales charge) (c) | | | (0.87 | )% | | | 2.42 | % | | | 6.25 | % | | | 10.45 | % | |
Ratios/Supplemental Data: | |
Net Assets at end of period (000) | | $ | 1,335 | | | $ | 1,455 | | | $ | 883 | | | $ | 337 | | |
Ratio of net expenses to average net assets (d) | | | 2.17 | % | | | 2.15 | % | | | 2.15 | % | | | 2.15 | % | |
Ratio of net investment income to average net assets (d) | | | 1.24 | % | | | 0.60 | % | | | (0.04 | )% | | | 1.24 | % | |
Ratio of gross expenses to average net assets (d) (e) | | | 2.61 | % | | | 2.43 | % | | | 2.42 | % | | | 2.74 | % | |
Ratio of net investment income to average net assets (d) (e) | | | 1.68 | % | | | 0.32 | % | | | (0.31 | )% | | | 0.65 | % | |
Portfolio turnover (c) | | | 236 | % | | | 44 | % | | | 63 | % | | | 35 | % | |
(a) The Compass EMP REC Enhanced Volatility Weighted Fund Class C commenced operations on November 19, 2012.
(b) Calculated using average shares for the period.
(c) Not annualized for periods less than one year.
(d) Annualized for periods less than one year.
(e) During the period, certain fees were reduced and/or reimbursed. If such see reductions and/or reimbursements had not occurred, the ratios would have been as indicated.
See notes to financial statements.
174
Victory Portfolios II | | Financial Highlights — continued | |
For a Share Outstanding Throughout Each Period
| | | Victory CEMP REC Enhanced Volatility Wtd Index Fund | |
| | | Class I Shares | |
| | | For the
Six
Months
Ended
December 31,
2015 | | Year
Ended
June 30,
2015 | | Year
Ended
June 30,
2014 | | For the
Period
Ended
June 30,
2013(a) | |
| | | (Unaudited) | | | | | | | |
Net Asset Value, Beginning of Period | | $ | 11.38 | | | $ | 11.41 | | | $ | 10.89 | | | $ | 10.00 | | |
Investment Activities: | |
Net investment income (loss) (b) | | | 0.09 | | | | 0.19 | | | | 0.08 | | | | 0.19 | | |
Net realized and unrealized gains (losses)
on investments | | | (0.12 | ) | | | 0.22 | | | | 0.70 | | | | 0.91 | | |
Total from Investment Activities | | | (0.03 | ) | | | 0.41 | | | | 0.78 | | | | 1.10 | | |
Distributions: | |
Net investment income | | | (0.04 | ) | | | (0.19 | ) | | | (0.08 | ) | | | (0.18 | ) | |
In excess of net investment income | | | — | | | | — | | | | — | | | | (0.03 | ) | |
Net realized gains from investments | | | (1.99 | ) | | | (0.25 | ) | | | (0.16 | ) | | | — | | |
Tax return of capital | | | — | | | | — | | | | (0.02 | ) | | | — | | |
Total Distributions | | | (2.03 | ) | | | (0.44 | ) | | | (0.26 | ) | | | (0.21 | ) | |
Net Asset Value, End of Period | | $ | 9.32 | | | $ | 11.38 | | | $ | 11.41 | | | $ | 10.89 | | |
Total Return (c) | | | (0.52 | )% | | | 3.47 | % | | | 7.36 | % | | | 11.00 | % | |
Ratios/Supplemental Data: | |
Net Assets at end of period (000) | | $ | 2,966 | | | $ | 9,805 | | | $ | 15,199 | | | $ | 608 | | |
Ratio of net expenses to average net assets (d) | | | 1.15 | % | | | 1.15 | % | | | 1.15 | % | | | 1.15 | % | |
Ratio of net investment income to average net assets (d) | | | 1.63 | % | | | 1.55 | % | | | 0.74 | % | | | 2.56 | % | |
Ratio of gross expenses to average net assets (d) (e) | | | 1.61 | % | | | 1.43 | % | | | 1.42 | % | | | 1.74 | % | |
Ratio of net investment income to average net assets (d) (e) | | | 2.08 | % | | | 1.27 | % | | | 0.47 | % | | | 1.97 | % | |
Portfolio turnover (c) | | | 236 | % | | | 44 | % | | | 63 | % | | | 35 | % | |
(a) The Compass EMP REC Enhanced Volatility Weighted Fund Class I commenced operations on November 19, 2012.
(b) Calculated using average shares for the period.
(c) Not annualized for periods less than one year.
(d) Annualized for periods less than one year.
(e) During the period, certain fees were reduced and/or reimbursed. If such see reductions and/or reimbursements had not occurred, the ratios would have been as indicated.
See notes to financial statements.
175
Victory Portfolios II | | Financial Highlights | |
For a Share Outstanding Throughout Each Period
| | | Victory CEMP Commodity Volatility Wtd Index Strategy Fund | |
| | | Class A Shares | |
| | | For the
Six
Months
Ended
December 31,
2015 | | Year
Ended
June 30,
2015 | | Year
Ended
June 30,
2014 | | For the
Period
Ended
June 30,
2013(a) | |
| | | (Unaudited) | | | | | | | |
Net Asset Value, Beginning of Period | | $ | 7.02 | | | $ | 9.78 | | | $ | 8.86 | | | $ | 10.00 | | |
Investment Activities: | |
Net investment loss (b) | | | (0.02 | ) | | | (0.04 | ) | | | (0.05 | ) | | | (0.03 | ) | |
Net realized and unrealized gains (losses)
on investments | | | (1.08 | ) | | | (1.75 | ) | | | 0.97 | | | | (1.11 | ) | |
Total from Investment Activities | | | (1.10 | ) | | | (1.79 | ) | | | 0.92 | | | | (1.14 | ) | |
Distributions: | |
Net investment income | | | — | | | | (0.97 | ) | | | — | | | | — | | |
Total Distributions | | | — | | | | (0.97 | ) | | | — | | | | — | | |
Net Asset Value, End of Period | | $ | 5.92 | | | $ | 7.02 | | | $ | 9.78 | | | $ | 8.86 | | |
Total Return (excludes sales charge) (c) | | | (15.67 | )% | | | (18.63 | )% | | | 10.38 | % | | | (11.40 | )% | |
Ratios/Supplemental Data: | |
Net Assets at end of period (000) | | $ | 3,646 | | | $ | 6,135 | | | $ | 3,987 | | | $ | 3,309 | | |
Ratio of net expenses to average net assets (d) | | | 1.10 | % | | | 1.36 | % | | | 1.40 | % | | | 1.40 | % | |
Ratio of net investment income to average net assets (d) | | | (0.52 | )% | | | (0.54 | )% | | | (0.52 | )% | | | (0.54 | )% | |
Ratio of gross expenses to average net assets (d) (e) | | | 1.71 | % | | | 1.73 | % | | | 1.70 | % | | | 1.53 | % | |
Ratio of net investment income to average net assets (d) (e) | | | 0.09 | % | | | (0.91 | )% | | | (0.82 | )% | | | (0.67 | )% | |
Portfolio turnover (c) | | | 169 | % | | | 0 | % | | | 13 | % | | | 0 | % | |
(a) The Compass EMP Commodity Strategies Volatility Weighted Fund Class A commenced operations on November 19, 2012.
(b) Calculated using average shares for the period.
(c) Not annualized for periods less than one year.
(d) Annualized for periods less than one year.
(e) During the period, certain fees were reduced and/or reimbursed. If such see reductions and/or reimbursements had not occurred, the ratios would have been as indicated.
See notes to financial statements.
176
Victory Portfolios II | | Financial Highlights — continued | |
For a Share Outstanding Throughout Each Period
| | | Victory CEMP Commodity Volatility Wtd Index Strategy Fund | |
| | | Class C Shares | |
| | | For the
Six
Months
Ended
December 31,
2015 | | Year
Ended
June 30,
2015 | | Year
Ended
June 30,
2014 | | For the
Period
Ended
June 30,
2013(a) | |
| | | (Unaudited) | | | | | | | |
Net Asset Value, Beginning of Period | | $ | 6.88 | | | $ | 9.66 | | | $ | 8.82 | | | $ | 10.00 | | |
Investment Activities: | |
Net investment loss (b) | | | (0.04 | ) | | | (0.10 | ) | | | (0.12 | ) | | | (0.07 | ) | |
Net realized and unrealized gains (losses)
on investments | | | (1.06 | ) | | | (1.72 | ) | | | 0.96 | | | | (1.11 | ) | |
Total from Investment Activities | | | (1.10 | ) | | | (1.82 | ) | | | 0.84 | | | | (1.18 | ) | |
Distributions: | |
Net investment income | | | — | | | | (0.96 | ) | | | — | | | | — | | |
Total Distributions | | | — | | | | (0.96 | ) | | | — | | | | — | | |
Net Asset Value, End of Period | | $ | 5.78 | | | $ | 6.88 | | | $ | 9.66 | | | $ | 8.82 | | |
Total Return (excludes contingent deferred sales charge) (c) | | | (15.99 | )% | | | (19.28 | )% | | | 9.52 | % | | | (11.80 | )% | |
Ratios/Supplemental Data: | |
Net Assets at end of period (000) | | $ | 181 | | | $ | 225 | | | $ | 186 | | | $ | 73 | | |
Ratio of net expenses to average net assets (d) | | | 1.85 | % | | | 2.11 | % | | | 2.15 | % | | | 2.15 | % | |
Ratio of net investment income to average net assets (d) | | | (1.28 | )% | | | (1.29 | )% | | | (1.27 | )% | | | (1.29 | )% | |
Ratio of gross expenses to average net assets (d) (e) | | | 2.58 | % | | | 2.48 | % | | | 2.45 | % | | | 2.28 | % | |
Ratio of net investment income to average net assets (d) (e) | | | (0.55 | )% | | | (1.66 | )% | | | (1.57 | )% | | | (1.42 | )% | |
Portfolio turnover (c) | | | 169 | % | | | 0 | % | | | 13 | % | | | 0 | % | |
(a) The Compass EMP Commodity Strategies Volatility Weighted Fund Class C commenced operations on November 19, 2012.
(b) Calculated using average shares for the period.
(c) Not annualized for periods less than one year.
(d) Annualized for periods less than one year.
(e) During the period, certain fees were reduced and/or reimbursed. If such see reductions and/or reimbursements had not occurred, the ratios would have been as indicated.
See notes to financial statements.
177
Victory Portfolios II | | Financial Highlights — continued | |
For a Share Outstanding Throughout Each Period
| | | Victory CEMP Commodity Volatility Wtd Index Strategy Fund | |
| | | Class I Shares | |
| | | For the
Six
Months
Ended
December 31,
2015 | | Year
Ended
June 30,
2015 | | Year
Ended
June 30,
2014 | | For the
Period
Ended
June 30,
2013(a) | |
| | | (Unaudited) | | | | | | | |
Net Asset Value, Beginning of Period | | $ | 7.05 | | | $ | 9.82 | | | $ | 8.87 | | | $ | 10.00 | | |
Investment Activities: | |
Net investment loss (b) | | | (0.01 | ) | | | (0.02 | ) | | | (0.03 | ) | | | (0.02 | ) | |
Net realized and unrealized gains (losses)
on investments | | | (1.09 | ) | | | (1.76 | ) | | | 0.98 | | | | (1.11 | ) | |
Total from Investment Activities | | | (1.10 | ) | | | (1.78 | ) | | | 0.95 | | | | (1.13 | ) | |
Distributions: | |
Net investment income | | | — | | | | (0.99 | ) | | | — | | | | — | | |
Total Distributions | | | — | | | | (0.99 | ) | | | — | | | | — | | |
Net Asset Value, End of Period | | $ | 5.95 | | | $ | 7.05 | | | $ | 9.82 | | | $ | 8.87 | | |
Total Return (c) | | | (15.60 | )% | | | (18.42 | )% | | | 10.71 | % | | | (11.30 | )% | |
Ratios/Supplemental Data: | |
Net Assets at end of period (000) | | $ | 5,159 | | | $ | 5,849 | | | $ | 10,035 | | | $ | 6,379 | | |
Ratio of net expenses to average net assets (d) | | | 0.85 | % | | | 1.11 | % | | | 1.15 | % | | | 1.15 | % | |
Ratio of net investment income to average net assets (d) | | | (0.27 | )% | | | (0.29 | )% | | | (0.27 | )% | | | (0.35 | )% | |
Ratio of gross expenses to average net assets (d) (e) | | | 1.44 | % | | | 1.48 | % | | | 1.45 | % | | | 1.28 | % | |
Ratio of net investment income to average net assets (d) (e) | | | 0.31 | % | | | (0.66 | )% | | | (0.57 | )% | | | (0.48 | )% | |
Portfolio turnover (c) | | | 169 | % | | | 0 | % | | | 13 | % | | | 0 | % | |
(a) The Compass EMP Commodity Strategies Volatility Weighted Fund Class I commenced operations on November 19, 2012.
(b) Calculated using average shares for the period.
(c) Not annualized for periods less than one year.
(d) Annualized for periods less than one year.
(e) During the period, certain fees were reduced and/or reimbursed. If such see reductions and/or reimbursements had not occurred, the ratios would have been as indicated.
See notes to financial statements.
178
Victory Portfolios II | | Financial Highlights | |
For a Share Outstanding Throughout Each Period
| | | Victory CEMP Commodity Enhanced Volatility Wtd Index Strategy Fund | |
| | | Class A Shares | |
| | | For the
Six
Months
Ended
December 31,
2015 | | Year
Ended
June 30,
2015 | | Year
Ended
June 30,
2014 | | For the
Period
Ended
June 30,
2013(a) | |
| | | (Unaudited) | | | | | | | |
Net Asset Value, Beginning of Period | | $ | 8.57 | | | $ | 9.55 | | | $ | 9.39 | | | $ | 10.00 | | |
Investment Activities: | |
Net investment loss (b) | | | (0.02 | ) | | | (0.07 | ) | | | (0.08 | ) | | | (0.05 | ) | |
Net realized and unrealized gains (losses)
on investments | | | (1.05 | ) | | | (0.84 | ) | | | 0.24 | | | | (0.56 | ) | |
Total from Investment Activities | | | (1.07 | ) | | | (0.91 | ) | | | 0.16 | | | | (0.61 | ) | |
Distributions: | |
Net investment income | | | — | | | | (0.07 | ) | | | — | | | | — | | |
Total Distributions | | | — | | | | (0.07 | ) | | | — | | | | — | | |
Net Asset Value, End of Period | | $ | 7.50 | | | $ | 8.57 | | | $ | 9.55 | | | $ | 9.39 | | |
Total Return (excludes sales charge) (c) | | | (12.49 | )% | | | (9.49 | )% | | | 1.70 | % | | | (6.10 | )% | |
Ratios/Supplemental Data: | |
Net Assets at end of period (000) | | $ | 667 | | | $ | 1,734 | | | $ | 1,845 | | | $ | 3,505 | | |
Ratio of net expenses to average net assets (d) | | | 1.10 | % | | | 1.54 | % | | | 1.60 | % | | | 1.60 | % | |
Ratio of net investment income to average net assets (d) | | | (0.60 | )% | | | (0.85 | )% | | | (0.97 | )% | | | (0.77 | )% | |
Ratio of gross expenses to average net assets (d) (e) | | | 1.70 | % | | | 1.87 | % | | | 1.98 | % | | | 1.71 | % | |
Ratio of net investment income
to average net assets (d) (e) | | | 0.01 | % | | | (1.18 | )% | | | (1.35 | )% | | | (0.88 | )% | |
Portfolio turnover (c) | | | 15 | % | | | 0 | % | | | 42 | % | | | 0 | % | |
(a) The Compass EMP Commodity Strategy Enhanced Volatility Weighted Fund Class A commenced operations on November 19, 2012.
(b) Calculated using average shares for the period.
(c) Not annualized for periods less than one year.
(d) Annualized for periods less than one year.
(e) During the period, certain fees were reduced and/or reimbursed. If such see reductions and/or reimbursements had not occurred, the ratios would have been as indicated.
See notes to financial statements.
179
Victory Portfolios II | | Financial Highlights — continued | |
For a Share Outstanding Throughout Each Period
| | | Victory CEMP Commodity Enhanced Volatility Wtd Index Strategy Fund | |
| | | Class C Shares | |
| | | For the
Six
Months
Ended
December 31,
2015 | | Year
Ended
June 30,
2015 | | Year
Ended
June 30,
2014 | | For the
Period
Ended
June 30,
2013(a) | |
| | | (Unaudited) | | | | | | | |
Net Asset Value, Beginning of Period | | $ | 8.37 | | | $ | 9.43 | | | $ | 9.34 | | | $ | 10.00 | | |
Investment Activities: | |
Net investment loss (b) | | | (0.05 | ) | | | (0.15 | ) | | | (0.16 | ) | | | (0.09 | ) | |
Net realized and unrealized gains (losses)
on investments | | | (1.01 | ) | | | (0.82 | ) | | | 0.25 | | | | (0.57 | ) | |
Total from Investment Activities | | | (1.06 | ) | | | (0.97 | ) | | | 0.09 | | | | (0.66 | ) | |
Distributions: | |
Net investment income | | | — | | | | (0.09 | ) | | | — | | | | — | | |
Total Distributions | | | — | | | | (0.09 | ) | | | — | | | | — | | |
Net Asset Value, End of Period | | $ | 7.31 | | | $ | 8.37 | | | $ | 9.43 | | | $ | 9.34 | | |
Total Return (excludes contingent
deferred sales charge) (c) | | | (12.66 | )% | | | (10.29 | )% | | | 0.96 | % | | | (6.60 | )% | |
Ratios/Supplemental Data: | |
Net Assets at end of period (000) | | $ | 231 | | | $ | 248 | | | $ | 57 | | | $ | 16 | | |
Ratio of net expenses to average net assets (d) | | | 1.85 | % | | | 2.29 | % | | | 2.35 | % | | | 2.35 | % | |
Ratio of net investment income to average net assets (d) | | | (1.35 | )% | | | (1.78 | )% | | | (1.72 | )% | | | (1.51 | )% | |
Ratio of gross expenses to average net assets (d) (e) | | | 2.50 | % | | | 2.62 | % | | | 2.73 | % | | | 2.46 | % | |
Ratio of net investment income
to average net assets (d) (e) | | | (0.70 | )% | | | (2.11 | )% | | | (2.10 | )% | | | (1.62 | )% | |
Portfolio turnover (c) | | | 15 | % | | | 0 | % | | | 42 | % | | | 0 | % | |
(a) The Compass EMP Commodity Strategy Enhanced Volatility Weighted Fund Class C commenced operations on November 19, 2012.
(b) Calculated using average shares for the period.
(c) Not annualized for periods less than one year.
(d) Annualized for periods less than one year.
(e) During the period, certain fees were reduced and/or reimbursed. If such see reductions and/or reimbursements had not occurred, the ratios would have been as indicated.
See notes to financial statements.
180
Victory Portfolios II | | Financial Highlights — continued | |
For a Share Outstanding Throughout Each Period
| | | Victory CEMP Commodity Enhanced Volatility Wtd Index Strategy Fund | |
| | | Class I Shares | |
| | | For the
Six
Months
Ended
December 31,
2015 | | Year
Ended
June 30,
2015 | | Year
Ended
June 30,
2014 | | For the
Period
Ended
June 30,
2013(a) | |
| | | (Unaudited) | | | | | | | |
Net Asset Value, Beginning of Period | | $ | 8.60 | | | $ | 9.60 | | | $ | 9.41 | | | $ | 10.00 | | |
Investment Activities: | |
Net investment loss (b) | | | (0.01 | ) | | | (0.05 | ) | | | (0.07 | ) | | | (0.04 | ) | |
Net realized and unrealized gains (losses)
on investments | | | (1.04 | ) | | | (0.85 | ) | | | 0.26 | | | | (0.55 | ) | |
Total from Investment Activities | | | (1.05 | ) | | | (0.90 | ) | | | 0.19 | | | | (0.59 | ) | |
Distributions: | |
Net investment income | | | — | | | | (0.10 | ) | | | — | | | | — | | |
Total Distributions | | | — | | | | (0.10 | ) | | | — | | | | — | | |
Net Asset Value, End of Period | | $ | 7.55 | | | $ | 8.60 | | | $ | 9.60 | | | $ | 9.41 | | |
Total Return (c) | | | (12.21 | )% | | | (9.37 | )% | | | 2.02 | % | | | (5.90 | )% | |
Ratios/Supplemental Data: | |
Net Assets at end of period (000) | | $ | 5,101 | | | $ | 6,227 | | | $ | 9,452 | | | $ | 13,844 | | |
Ratio of net expenses to average net assets (d) | | | 0.85 | % | | | 1.29 | % | | | 1.35 | % | | | 1.35 | % | |
Ratio of net investment income to average net assets (d) | | | (0.35 | )% | | | (0.60 | )% | | | (0.72 | )% | | | (0.65 | )% | |
Ratio of gross expenses to average net assets (d) (e) | | | 1.44 | % | | | 1.62 | % | | | 1.73 | % | | | 1.46 | % | |
Ratio of net investment income
to average net assets (d) (e) | | | 0.24 | % | | | (0.93 | )% | | | (1.10 | )% | | | (0.76 | )% | |
Portfolio turnover (c) | | | 15 | % | | | 0 | % | | | 42 | % | | | 0 | % | |
(a) The Compass EMP Commodity Strategy Enhanced Volatility Weighted Fund Class I commenced operations on November 19, 2012.
(b) Calculated using average shares for the period.
(c) Not annualized for periods less than one year.
(d) Annualized for periods less than one year.
(e) During the period, certain fees were reduced and/or reimbursed. If such see reductions and/or reimbursements had not occurred, the ratios would have been as indicated.
See notes to financial statements.
181
Victory Portfolios II | | Financial Highlights | |
For a Share Outstanding Throughout Each Period
| | | Victory CEMP Long/Short Strategy Fund | |
| | | Class A Shares | |
| | | For the
Six
Months
Ended
December 31,
2015 | | Year
Ended
June 30,
2015 | | Year
Ended
June 30,
2014 | | For the
Period
Ended
June 30,
2013(a) | |
| | | (Unaudited) | | | | | | | |
Net Asset Value, Beginning of Period | | $ | 11.36 | | | $ | 11.02 | | | $ | 10.36 | | | $ | 10.00 | | |
Investment Activities: | |
Net investment income (loss) (b) | | | 0.01 | | | | 0.02 | | | | (0.09 | ) | | | (0.05 | ) | |
Net realized and unrealized gains (losses)
on investments | | | (0.27 | ) | | | 0.36 | | | | 0.75 | | | | 0.41 | | |
Total from Investment Activities | | | (0.26 | ) | | | 0.38 | | | | 0.66 | | | | 0.36 | | |
Distributions: | |
Net investment income | | | (— | )(c) | | | (0.01 | ) | | | — | | | | — | | |
Net realized gains from investments | | | (0.46 | ) | | | (0.03 | ) | | | — | | | | — | | |
Total Distributions | | | (0.46 | ) | | | (0.04 | ) | | | — | | | | — | | |
Net Asset Value, End of Period | | $ | 10.64 | | | $ | 11.36 | | | $ | 11.02 | | | $ | 10.36 | | |
Total Return (excludes sales charge) (d) | | | (2.33 | )% | | | 3.49 | % | | | 6.37 | % | | | 3.60 | % | |
Ratios/Supplemental Data: | |
Net Assets at end of period (000) | | $ | 824 | | | $ | 3,039 | | | $ | 3,658 | | | $ | 6,022 | | |
Ratio of net expenses to average net assets (e) | | | 1.45 | % | | | 1.58 | % | | | 1.60 | % | | | 1.60 | % | |
Ratio of net investment income to average net assets (e) | | | 0.24 | % | | | 0.16 | % | | | (0.86 | )% | | | (0.71 | )% | |
Ratio of gross expenses to average net assets (e) (f) | | | 1.93 | % | | | 1.87 | % | | | 1.76 | % | | | 2.06 | % | |
Ratio of net investment income to average net assets (e) (f) | | | 0.73 | % | | | (0.13 | )% | | | (1.02 | )% | | | (1.71 | )% | |
Portfolio turnover (d) | | | 47 | % | | | 29 | % | | | 87 | % | | | 0 | % | |
(a) The Compass EMP Long/Short Strategies Fund Class A commenced operations on November 19, 2012.
(b) Calculated using average shares for the period.
(c) Less than $0.01 per share.
(d) Not annualized for periods less than one year.
(e) Annualized for periods less than one year.
(f) During the period, certain fees were reduced and/or reimbursed. If such see reductions and/or reimbursements had not occurred, the ratios would have been as indicated.
See notes to financial statements.
182
Victory Portfolios II | | Financial Highlights — continued | |
For a Share Outstanding Throughout Each Period
| | | Victory CEMP Long/Short Strategy Fund | |
| | | Class C Shares | |
| | | For the
Six
Months
Ended
December 31,
2015 | | Year
Ended
June 30,
2015 | | Year
Ended
June 30,
2014 | | For the
Period
Ended
June 30,
2013(a) | |
| | | (Unaudited) | | | | | | | |
Net Asset Value, Beginning of Period | | $ | 11.10 | | | $ | 10.85 | | | $ | 10.27 | | | $ | 10.00 | | |
Investment Activities: | |
Net investment loss (b) | | | (0.03 | ) | | | (0.06 | ) | | | (0.14 | ) | | | (0.09 | ) | |
Net realized and unrealized gains
(losses) on investments | | | (0.25 | ) | | | 0.34 | | | | 0.72 | | | | 0.36 | | |
Total from Investment Activities | | | (0.28 | ) | | | 0.28 | | | | 0.58 | | | | 0.27 | | |
Distributions: | |
Net realized gains from investments | | | (0.46 | ) | | | (0.03 | ) | | | — | | | | — | | |
Total Distributions | | | (0.46 | ) | | | (0.03 | ) | | | — | | | | — | | |
Net Asset Value, End of Period | | $ | 10.36 | | | $ | 11.10 | | | $ | 10.85 | | | $ | 10.27 | | |
Total Return (excludes contingent
deferred sales charge) (c) | | | (2.59 | )% | | | 2.63 | % | | | 5.65 | % | | | 2.70 | % | |
Ratios/Supplemental Data: | |
Net Assets at end of period (000) | | $ | 81 | | | $ | 83 | | | $ | 30 | | | $ | 5 | | |
Ratio of net expenses to average net assets (d) | | | 2.20 | % | | | 2.33 | % | | | 2.35 | % | | | 2.35 | % | |
Ratio of net investment income to average net assets (d) | | | (0.48 | )% | | | (0.59 | )% | | | (1.33 | )% | | | (1.43 | )% | |
Ratio of gross expenses to average net assets (d) (e) | | | 2.80 | % | | | 2.62 | % | | | 2.51 | % | | | 2.81 | % | |
Ratio of net investment income to average net assets (d) (e) | | | 0.13 | % | | | (0.88 | )% | | | (1.49 | )% | | | (1.89 | )% | |
Portfolio turnover (c) | | | 47 | % | | | 29 | % | | | 87 | % | | | 0 | % | |
(a) The Compass EMP Long/Short Strategies Fund Class C commenced operations on November 19, 2012.
(b) Calculated using average shares for the period.
(c) Not annualized for periods less than one year.
(d) Annualized for periods less than one year.
(e) During the period, certain fees were reduced and/or reimbursed. If such see reductions and/or reimbursements had not occurred, the ratios would have been as indicated.
See notes to financial statements.
183
Victory Portfolios II | | Financial Highlights — continued | |
For a Share Outstanding Throughout Each Period
| | | Victory CEMP Long/Short Strategy Fund | |
| | | Class I Shares | |
| | | For the
Six
Months
Ended
December 31,
2015 | | Year
Ended
June 30,
2015 | | Year
Ended
June 30,
2014 | | For the
Period
Ended
June 30,
2013(a) | |
| | | (Unaudited) | | | | | | | |
Net Asset Value, Beginning of Period | | $ | 11.39 | | | $ | 11.07 | | | $ | 10.37 | | | $ | 10.00 | | |
Investment Activities: | |
Net investment income (loss) (b) | | | 0.03 | | | | 0.05 | | | | (0.07 | ) | | | (0.03 | ) | |
Net realized and unrealized gains (losses)
on investments | | | (0.26 | ) | | | 0.36 | | | | 0.77 | | | | 0.40 | | |
Total from Investment Activities | | | (0.23 | ) | | | 0.41 | | | | 0.70 | | | | 0.37 | | |
Distributions: | |
Net investment income | | | (0.01 | ) | | | (0.06 | ) | | | — | | | | — | | |
Net realized gains from investments | | | (0.46 | ) | | | (0.03 | ) | | | — | | | | — | | |
Total Distributions | | | (0.47 | ) | | | (0.09 | ) | | | — | | | | — | | |
Net Asset Value, End of Period | | $ | 10.69 | | | $ | 11.39 | | | $ | 11.07 | | | $ | 10.37 | | |
Total Return (c) | | | (2.08 | )% | | | 3.77 | % | | | 6.75 | % | | | 3.70 | % | |
Ratios/Supplemental Data: | |
Net Assets at end of period (000) | | $ | 14,236 | | | $ | 12,380 | | | $ | 22,310 | | | $ | 4,650 | | |
Ratio of net expenses to average net assets (d) | | | 1.20 | % | | | 1.33 | % | | | 1.35 | % | | | 1.35 | % | |
Ratio of net investment income to average net assets (d) | | | 0.56 | % | | | 0.41 | % | | | (0.61 | )% | | | (0.48 | )% | |
Ratio of gross expenses to average net assets (d) (e) | | | 1.68 | % | | | 1.62 | % | | | 1.51 | % | | | 1.81 | % | |
Ratio of net investment income to average net assets (d) (e) | | | 1.05 | % | | | 0.12 | % | | | (0.77 | )% | | | (0.94 | )% | |
Portfolio turnover (c) | | | 47 | % | | | 29 | % | | | 87 | % | | | 0 | % | |
(a) The Compass EMP Long/Short Strategies Fund Class I commenced operations on November 19, 2012.
(b) Calculated using average shares for the period.
(c) Not annualized for periods less than one year.
(d) Annualized for periods less than one year.
(e) During the period, certain fees were reduced and/or reimbursed. If such see reductions and/or reimbursements had not occurred, the ratios would have been as indicated.
See notes to financial statements.
184
Victory Portfolios II | | Financial Highlights | |
For a Share Outstanding Throughout Each Period
| | | Victory CEMP Market Neutral Income Fund | |
| | | Class A Shares | |
| | | For the
Six
Months
Ended
December 31,
2015 | | Year
Ended
June 30,
2015 | | Year
Ended
June 30,
2014 | | For the
Period
Ended
June 30,
2013(a) | |
| | | (Unaudited) | | | | | | | |
Net Asset Value, Beginning of Period | | $ | 9.41 | | | $ | 9.84 | | | $ | 9.78 | | | $ | 10.00 | | |
Investment Activities: | |
Net investment income (loss) (b) | | | 0.10 | | | | 0.22 | | | | 0.11 | | | | (0.01 | ) | |
Net realized and unrealized gains (losses)
on investments | | | (0.04 | ) | | | (0.38 | ) | | | 0.00 | | | | (0.21 | ) | |
Total from Investment Activities | | | 0.06 | | | | (0.16 | ) | | | 0.11 | | | | (0.22 | ) | |
Distributions: | |
Net investment income | | | (0.09 | ) | | | (0.21 | ) | | | (0.05 | ) | | | — | | |
Net realized gains from investments | | | (0.23 | ) | | | (0.06 | ) | | | — | | | | — | | |
Total Distributions | | | (0.32 | ) | | | (0.27 | ) | | | (0.05 | ) | | | — | | |
Net Asset Value, End of Period | | $ | 9.15 | | | $ | 9.41 | | | $ | 9.84 | | | $ | 9.78 | | |
Total Return (excludes sales charge) (c) | | | 0.55 | % | | | (1.62 | )% | | | 1.15 | % | | | (2.20 | )% | |
Ratios/Supplemental Data: | |
Net Assets at end of period (000) | | $ | 27,589 | | | $ | 31,313 | | | $ | 28,924 | | | $ | 11,648 | | |
Ratio of net expenses to average net assets (d) | | | 0.90 | % | | | 1.13 | % | | | 1.15 | % | | | 1.15 | % | |
Ratio of net investment income to average net assets (d) | | | 2.18 | % | | | 2.23 | % | | | 1.09 | % | | | (0.23 | )% | |
Ratio of gross expenses to average net assets (d) (e) | | | 1.20 | % | | | 1.27 | % | | | 1.25 | % | | | 1.35 | % | |
Ratio of net investment income to average net assets (d) (e) | | | 2.49 | % | | | 2.09 | % | | | 0.99 | % | | | (0.43 | )% | |
Portfolio turnover (c) | | | 47 | % | | | 135 | % | | | 190 | % | | | 0 | % | |
(a) The Compass EMP Market Neutral Income Fund Class A commenced operations on November 19, 2012.
(b) Calculated using average shares for the period.
(c) Not annualized for periods less than one year.
(d) Annualized for periods less than one year.
(e) During the period, certain fees were reduced and/or reimbursed. If such see reductions and/or reimbursements had not occurred, the ratios would have been as indicated.
See notes to financial statements.
185
Victory Portfolios II | | Financial Highlights — continued | |
For a Share Outstanding Throughout Each Period
| | | Victory CEMP Market Neutral Income Fund | |
| | | Class C Shares | |
| | | For the
Six
Months
Ended
December 31,
2015 | | Year
Ended
June 30,
2015 | | Year
Ended
June 30,
2014 | | For the
Period
Ended
June 30,
2013(a) | |
| | | (Unaudited) | | | | | | | |
Net Asset Value, Beginning of Period | | $ | 9.36 | | | $ | 9.74 | | | $ | 9.74 | | | $ | 10.00 | | |
Investment Activities: | |
Net investment income (loss) (b) | | | 0.07 | | | | 0.14 | | | | 0.01 | | | | (0.06 | ) | |
Net realized and unrealized gains (losses)
on investments | | | (0.04 | ) | | | (0.38 | ) | | | 0.02 | | | | (0.20 | ) | |
Total from Investment Activities | | | 0.03 | | | | (0.24 | ) | | | 0.03 | | | | (0.26 | ) | |
Distributions: | |
Net investment income | | | (0.06 | ) | | | (0.08 | ) | | | (0.03 | ) | | | — | | |
Net realized gains from investments | | | (0.23 | ) | | | (0.06 | ) | | | — | | | | — | | |
Total Distributions | | | (0.29 | ) | | | (0.14 | ) | | | (0.03 | ) | | | — | | |
Net Asset Value, End of Period | | $ | 9.10 | | | $ | 9.36 | | | $ | 9.74 | | | $ | 9.74 | | |
Total Return (excludes contingent
deferred sales charge) (c) | | | 0.21 | % | | | (2.42 | )% | | | 0.34 | % | | | 0.00 | % | |
Ratios/Supplemental Data: | |
Net Assets at end of period (000) | | $ | 448 | | | $ | 385 | | | $ | 267 | | | $ | 137 | | |
Ratio of net expenses to average net assets (d) | | | 1.65 | % | | | 1.88 | % | | | 1.90 | % | | | 1.90 | % | |
Ratio of net investment income to average net assets (d) | | | 1.37 | % | | | 1.43 | % | | | 0.06 | % | | | (0.93 | )% | |
Ratio of gross expenses to average net assets (d) (e) | | | 2.05 | % | | | 2.02 | % | | | 2.00 | % | | | 2.10 | % | |
Ratio of net investment income to average net assets (d) (e) | | | 1.77 | % | | | 1.29 | % | | | (0.04 | )% | | | (1.13 | )% | |
Portfolio turnover (c) | | | 47 | % | | | 135 | % | | | 190 | % | | | 0 | % | |
(a) The Compass EMP Market Neutral Income Fund Class C commenced operations on November 19, 2012.
(b) Calculated using average shares for the period.
(c) Not annualized for periods less than one year.
(d) Annualized for periods less than one year.
(e) During the period, certain fees were reduced and/or reimbursed. If such see reductions and/or reimbursements had not occurred, the ratios would have been as indicated.
See notes to financial statements.
186
Victory Portfolios II | | Financial Highlights — continued | |
For a Share Outstanding Throughout Each Period
| | | Victory CEMP Market Neutral Income Fund | |
| | | Class I Shares | |
| | | For the
Six
Months
Ended
December 31,
2015 | | Year
Ended
June 30,
2015 | | Year
Ended
June 30,
2014 | | For the
Period
Ended
June 30,
2013(a) | |
| | | (Unaudited) | | | | | | | |
Net Asset Value, Beginning of Period | | $ | 9.44 | | | $ | 9.89 | | | $ | 9.81 | | | $ | 10.00 | | |
Investment Activities: | |
Net investment income (b) | | | 0.12 | | | | 0.23 | | | | 0.10 | | | | — | (c) | |
Net realized and unrealized gains (losses)
on investments | | | (0.05 | ) | | | (0.37 | ) | | | 0.04 | | | | (0.19 | ) | |
Total from Investment Activities | | | 0.07 | | | | (0.14 | ) | | | 0.14 | | | | (0.19 | ) | |
Distributions: | |
Net investment income | | | (0.10 | ) | | | (0.25 | ) | | | (0.06 | ) | | | — | | |
Net realized gains from investments | | | (0.23 | ) | | | (0.06 | ) | | | — | | | | — | | |
Total Distributions | | | (0.33 | ) | | | (0.31 | ) | | | (0.06 | ) | | | — | | |
Net Asset Value, End of Period | | $ | 9.18 | | | $ | 9.44 | | | $ | 9.89 | | | $ | 9.81 | | |
Total Return (d) | | | 0.67 | % | | | (1.41 | )% | | | 1.44 | % | | | (1.90 | )% | |
Ratios/Supplemental Data: | |
Net Assets at end of period (000) | | $ | 39,612 | | | $ | 25,310 | | | $ | 33,773 | | | $ | 9,095 | | |
Ratio of net expenses to average net assets (e) | | | 0.65 | % | | | 0.88 | % | | | 0.90 | % | | | 0.90 | % | |
Ratio of net investment income to average net assets (e) | | | 2.50 | % | | | 2.39 | % | | | 0.97 | % | | | 0.00 | % | |
Ratio of gross expenses to average net assets (e) (f) | | | 0.96 | % | | | 1.02 | % | | | 1.00 | % | | | 1.10 | % | |
Ratio of net investment income to average net assets (e) (f) | | | 2.81 | % | | | 2.25 | % | | | 0.87 | % | | | (0.20 | )% | |
Portfolio turnover (d) | | | 47 | % | | | 135 | % | | | 190 | % | | | 0 | % | |
(a) The Compass EMP Market Neutral Income Fund Class I commenced operations on November 19, 2012.
(b) Calculated using average shares for the period.
(c) Less than $0.01 per share.
(d) Not annualized for periods less than one year.
(e) Annualized for periods less than one year.
(f) During the period, certain fees were reduced and/or reimbursed. If such see reductions and/or reimbursements had not occurred, the ratios would have been as indicated.
See notes to financial statements.
187
Victory Portfolios II | | Financial Highlights | |
For a Share Outstanding Throughout Each Period
| | | Victory CEMP Enhanced Fixed Income Fund | |
| | | Class A Shares | |
| | | For the
Six
Months
Ended
December 31,
2015 | | Year
Ended
June 30,
2015 | | Year
Ended
June 30,
2014 | | For the
Period
Ended
June 30,
2013(a) | |
| | | (Unaudited) | | | | | | | |
Net Asset Value, Beginning of Period | | $ | 9.85 | | | $ | 9.90 | | | $ | 9.71 | | | $ | 10.00 | | |
Investment Activities: | |
Net investment income (loss) (b) | | | (0.01 | ) | | | (0.01 | ) | | | — | (c) | | | 0.01 | | |
Net realized and unrealized gains (losses)
on investments | | | (0.06 | ) | | | 0.12 | | | | 0.19 | | | | (0.29 | ) | |
Total from Investment Activities | | | (0.07 | ) | | | 0.11 | | | | 0.19 | | | | (0.28 | ) | |
Distributions: | |
Net investment income | | | (0.10 | ) | | | — | | | | (— | )(c) | | | (0.01 | ) | |
In excess of net investment income | | | — | | | | (0.16 | ) | | | — | | | | — | | |
Net realized gains from investments | | | (0.16 | ) | | | — | | | | — | | | | — | | |
Total Distributions | | | (0.26 | ) | | | (0.16 | ) | | | (— | )(c) | | | (0.01 | ) | |
Net Asset Value, End of Period | | $ | 9.52 | | | $ | 9.85 | | | $ | 9.90 | | | $ | 9.71 | | |
Total Return (excludes sales charge) (d) | | | (0.78 | )% | | | 1.05 | % | | | 2.00 | % | | | (2.76 | )% | |
Ratios/Supplemental Data: | |
Net Assets at end of period (000) | | $ | 3,456 | | | $ | 16,438 | | | $ | 30,145 | | | $ | 36,826 | | |
Ratio of net expenses to average net assets (e) | | | 0.71 | % | | | 0.84 | % | | | 0.85 | % | | | 0.85 | % | |
Ratio of net investment income to average net assets (e) | | | (0.12 | )% | | | (0.10 | )% | | | 0.03 | % | | | 0.23 | % | |
Ratio of gross expenses to average net assets (e) (f) | | | 1.04 | % | | | 0.98 | % | | | 0.94 | % | | | 1.02 | % | |
Ratio of net investment income to average net assets (e) (f) | | | 0.22 | % | | | (0.24 | )% | | | (0.06 | )% | | | 0.06 | % | |
Portfolio turnover (d) | | | 0 | % | | | 0 | % | | | 27 | % | | | 0 | % | |
(a) The Compass EMP Enhanced Fixed Income Fund Class A commenced operations on November 19, 2012.
(b) Calculated using average shares for the period.
(c) Less than $0.01 per share.
(d) Not annualized for periods less than one year.
(e) Annualized for periods less than one year.
(f) During the period, certain fees were reduced and/or reimbursed. If such see reductions and/or reimbursements had not occurred, the ratios would have been as indicated.
See notes to financial statements.
188
Victory Portfolios II | | Financial Highlights — continued | |
For a Share Outstanding Throughout Each Period
| | | Victory CEMP Enhanced Fixed Income Fund | |
| | | Class C Shares | |
| | | For the
Six
Months
Ended
December 31,
2015 | | Year
Ended
June 30,
2015 | | Year
Ended
June 30,
2014 | | For the
Period
Ended
June 30,
2013(a) | |
| | | (Unaudited) | | | | | | | |
Net Asset Value, Beginning of Period | | $ | 9.71 | | | $ | 9.80 | | | $ | 9.68 | | | $ | 10.00 | | |
Investment Activities: | |
Net investment loss (b) | | | (0.04 | ) | | | (0.08 | ) | | | (0.07 | ) | | | (0.03 | ) | |
Net realized and unrealized gains (losses)
on investments | | | (0.07 | ) | | | 0.11 | | | | 0.19 | | | | (0.28 | ) | |
Total from Investment Activities | | | (0.11 | ) | | | 0.03 | | | | 0.12 | | | | (0.31 | ) | |
Distributions: | |
Net investment income | | | (0.02 | ) | | | — | | | | — | | | | (0.01 | ) | |
In excess of net investment income | | | — | | | | (0.12 | ) | | | — | | | | — | | |
Net realized gains from investments | | | (0.16 | ) | | | — | | | | — | | | | — | | |
Total Distributions | | | (0.18 | ) | | | (0.12 | ) | | | — | | | | (0.01 | ) | |
Net Asset Value, End of Period | | $ | 9.42 | | | $ | 9.71 | | | $ | 9.80 | | | $ | 9.68 | | |
Total Return (excludes contingent deferred sales charge) (c) | | | (1.15 | )% | | | 0.31 | % | | | 1.24 | % | | | (3.15 | )% | |
Ratios/Supplemental Data: | |
Net Assets at end of period (000) | | $ | 506 | | | $ | 575 | | | $ | 404 | | | $ | 282 | | |
Ratio of net expenses to average net assets (d) | | | 1.46 | % | | | 1.59 | % | | | 1.60 | % | | | 1.60 | % | |
Ratio of net investment income to average net assets (d) | | | (0.87 | )% | | | (0.85 | )% | | | (0.72 | )% | | | (0.41 | )% | |
Ratio of gross expenses to average net assets (d) (e) | | | 1.84 | % | | | 1.73 | % | | | 1.69 | % | | | 1.77 | % | |
Ratio of net investment income to average net assets (d) (e) | | | (0.49 | )% | | | (0.99 | )% | | | (0.81 | )% | | | (0.58 | )% | |
Portfolio turnover (c) | | | 0 | % | | | 0 | % | | | 27 | % | | | 0 | % | |
(a) The Compass EMP Enhanced Fixed Income Fund Class C commenced operations on November 19, 2012.
(b) Calculated using average shares for the period.
(c) Not annualized for periods less than one year.
(d) Annualized for periods less than one year.
(e) During the period, certain fees were reduced and/or reimbursed. If such see reductions and/or reimbursements had not occurred, the ratios would have been as indicated.
See notes to financial statements.
189
Victory Portfolios II | | Financial Highlights — continued | |
For a Share Outstanding Throughout Each Period
| | | Victory CEMP Enhanced Fixed Income Fund | |
| | | Class I Shares | |
| | | For the
Six
Months
Ended
December 31,
2015 | | Year
Ended
June 30,
2015 | | Year
Ended
June 30,
2014 | | For the
Period
Ended
June 30,
2013(a) | |
| | | (Unaudited) | | | | | | | |
Net Asset Value, Beginning of Period | | $ | 9.88 | | | $ | 9.91 | | | $ | 9.72 | | | $ | 10.00 | | |
Investment Activities: | |
Net investment income (b) | | | 0.01 | | | | 0.01 | | | | 0.03 | | | | 0.03 | | |
Net realized and unrealized gains (losses)
on investments | | | (0.08 | ) | | | 0.13 | | | | 0.19 | | | | (0.29 | ) | |
Total from Investment Activities | | | (0.07 | ) | | | 0.14 | | | | 0.22 | | | | (0.26 | ) | |
Distributions: | |
Net investment income | | | (0.13 | ) | | | — | | | | (0.03 | ) | | | (0.02 | ) | |
In excess of net investment income | | | — | | | | (0.17 | ) | | | — | | | | — | | |
Net realized gains from investments | | | (0.16 | ) | | | — | | | | — | | | | — | | |
Total Distributions | | | (0.29 | ) | | | (0.17 | ) | | | (0.03 | ) | | | (0.02 | ) | |
Net Asset Value, End of Period | | $ | 9.52 | | | $ | 9.88 | | | $ | 9.91 | | | $ | 9.72 | | |
Total Return (c) | | | (0.79 | )% | | | 1.39 | % | | | 2.25 | % | | | (2.60 | )% | |
Ratios/Supplemental Data: | |
Net Assets at end of period (000) | | $ | 1,431 | | | $ | 4,970 | | | $ | 18,139 | | | $ | 1 | | |
Ratio of net expenses to average net assets (d) | | | 0.46 | % | | | 0.59 | % | | | 0.60 | % | | | 0.60 | % | |
Ratio of net investment income to average net assets (d) | | | 0.17 | % | | | 0.15 | % | | | 0.28 | % | | | 0.48 | % | |
Ratio of gross expenses to average net assets (d) (e) | | | 0.85 | % | | | 0.73 | % | | | 0.69 | % | | | 0.77 | % | |
Ratio of net investment income to average net assets (d) (e) | | | 0.56 | % | | | 0.01 | % | | | 0.19 | % | | | 0.31 | % | |
Portfolio turnover (c) | | | 0 | % | | | 0 | % | | | 27 | % | | | 0 | % | |
(a) The Compass EMP Enhanced Fixed Income Fund Class I commenced operations on November 19, 2012.
(b) Calculated using average shares for the period.
(c) Not annualized for periods less than one year.
(d) Annualized for periods less than one year.
(e) During the period, certain fees were reduced and/or reimbursed. If such see reductions and/or reimbursements had not occurred, the ratios would have been as indicated.
See notes to financial statements.
190
Victory Portfolios II | | Financial Highlights | |
For a Share Outstanding Throughout Each Period
| | | Victory CEMP Ultra Short Term Fixed Income Fund | |
| | | Class A Shares | |
| | | For the
Six
Months
Ended
December 31,
2015 | | Year
Ended
June 30,
2015 | | Year
Ended
June 30,
2014 | | For the
Period
Ended
June 30,
2013(a) | |
| | | (Unaudited) | | | | | | | |
Net Asset Value, Beginning of Period | | $ | 10.00 | | | $ | 10.00 | | | $ | 10.00 | | | $ | 10.00 | | |
Investment Activities: | |
Net investment income (b) | | | — | (c) | | | 0.03 | | | | 0.03 | | | | 0.03 | | |
Net realized and unrealized gains (losses)
on investments | | | (0.01 | ) | | | 0.01 | | | | 0.00 | (c) | | | 0.00 | (c) | |
Total from Investment Activities | | | (0.01 | ) | | | 0.04 | | | | 0.03 | | | | 0.03 | | |
Distributions: | |
Net investment income | | | (— | )(c) | | | (0.04 | ) | | | (0.03 | ) | | | (0.03 | ) | |
Net realized gains from investments | | | — | | | | (— | )(c) | | | — | | | | — | | |
Total Distributions | | | (— | )(c) | | | (0.04 | ) | | | (0.03 | ) | | | (0.03 | ) | |
Net Asset Value, End of Period | | $ | 9.99 | | | $ | 10.00 | | | $ | 10.00 | | | $ | 10.00 | | |
Total Return (excludes sales charge) (d) | | | (0.05 | )% | | | 0.39 | % | | | 0.30 | % | | | 0.25 | % | |
Ratios/Supplemental Data: | |
Net Assets at end of period (000) | | $ | 2,359 | | | $ | 4,283 | | | $ | 5,965 | | | $ | 5,161 | | |
Ratio of net expenses to average net assets (e) | | | 0.50 | % | | | 0.50 | % | | | 0.50 | % | | | 0.55 | % | |
Ratio of net investment income to average net assets (e) | | | 0.08 | % | | | 0.35 | % | | | 0.32 | % | | | 0.45 | % | |
Ratio of gross expenses to average net assets (e) (f) | | | 1.03 | % | | | 0.94 | % | | | 0.96 | % | | | 1.06 | % | |
Ratio of net investment income to average net assets (e) (f) | | | 0.62 | % | | | (0.09 | )% | | | (0.14 | )% | | | (0.06 | )% | |
Portfolio turnover (d) | | | 0 | % | | | 0 | % | | | 0 | % | | | 0 | % | |
(a) The Compass EMP Ultra Short-Term Fixed Income Fund Class A commenced operations on November 19, 2012.
(b) Calculated using average shares for the period.
(c) Less than $0.01 per share.
(d) Not annualized for periods less than one year.
(e) Annualized for periods less than one year.
(f) During the period, certain fees were reduced and/or reimbursed. If such see reductions and/or reimbursements had not occurred, the ratios would have been as indicated.
See notes to financial statements.
191
Victory Portfolios II | | Financial Highlights — continued | |
For a Share Outstanding Throughout Each Period
| | | Victory CEMP Ultra Short Term Fixed Income Fund | |
| | | Class I Shares | |
| | | For the
Six
Months
Ended
December 31,
2015 | | Year
Ended
June 30,
2015 | | Year
Ended
June 30,
2014 | | For the
Period
Ended
June 30,
2013(a) | |
| | | (Unaudited) | | | | | | | |
Net Asset Value, Beginning of Period | | $ | 10.00 | | | $ | 10.00 | | | $ | 10.00 | | | $ | 10.00 | | |
Investment Activities: | |
Net investment income (b) | | | 0.02 | | | | 0.06 | | | | 0.06 | | | | 0.03 | | |
Net realized and unrealized gains (losses)
on investments | | | (— | )(c) | | | — | (c) | | | — | (c) | | | — | (c) | |
Total from Investment Activities | | | 0.02 | | | | 0.06 | | | | 0.06 | | | | 0.03 | | |
Distributions: | |
Net investment income | | | (0.02 | ) | | | (0.06 | ) | | | (0.06 | ) | | | (0.03 | ) | |
Net realized gains from investments | | | — | | | | (0.00 | )(c) | | | — | | | | — | | |
Total Distributions | | | (0.02 | ) | | | (0.06 | ) | | | (0.06 | ) | | | (0.03 | ) | |
Net Asset Value, End of Period | | $ | 10.00 | | | $ | 10.00 | | | $ | 10.00 | | | $ | 10.00 | | |
Total Return (d) | | | 0.17 | % | | | 0.64 | % | | | 0.61 | % | | | 0.40 | % | |
Ratios/Supplemental Data: | |
Net Assets at end of period (000) | | $ | 8,022 | | | $ | 10,334 | | | $ | 10,846 | | | $ | 4,642 | | |
Ratio of net expenses to average net assets (e) | | | 0.25 | % | | | 0.25 | % | | | 0.25 | % | | | 0.30 | % | |
Ratio of net investment income to average net assets (e) | | | 0.34 | % | | | 0.60 | % | | | 0.57 | % | | | 0.76 | % | |
Ratio of gross expenses to average net assets (e) (f) | | | 0.78 | % | | | 0.69 | % | | | 0.71 | % | | | 0.81 | % | |
Ratio of net investment income to average net assets (e) (f) | | | 0.87 | % | | | 0.16 | % | | | 0.11 | % | | | 0.25 | % | |
Portfolio turnover (d) | | | 0 | % | | | 0 | % | | | 0 | % | | | 0 | % | |
(a) The Compass EMP Ultra Short-Term Fixed Income Fund Class I commenced operations on November 19, 2012.
(b) Calculated using average shares for the period.
(c) Less than $0.01 per share.
(d) Not annualized for periods less than one year.
(e) Annualized for periods less than one year.
(f) During the period, certain fees were reduced and/or reimbursed. If such see reductions and/or reimbursements had not occurred, the ratios would have been as indicated.
See notes to financial statements.
192
Victory Portfolios II | | Financial Highlights | |
For a Share Outstanding Throughout Each Period
| | | Victory CEMP Multi-Asset Balanced Fund | |
| | | Class A Shares | |
| | | For the
Six
Months
Ended
December 31,
2015 | | Year
Ended
June 30,
2015 | | For the
Seven
Months
Period
Ended
June 30,
2014 | | Year
Ended
November 30,
2013(a) | | Year
Ended
November 30,
2012(a) | | Year
Ended
November 30,
2011(a) | | For the
Five
Months
Period
Ended
November 30,
2010 | |
| | | (Unaudited) | | | | | | | | | | | | | |
Net Asset Value,
Beginning of Period | | $ | 12.02 | | | $ | 12.45 | | | $ | 12.70 | | | $ | 12.36 | | | $ | 12.18 | | | $ | 12.64 | | | $ | 11.86 | | |
Investment Activities: | |
Net investment
income | | | 0.13 | (b) | | | 0.36 | (b) | | | 0.14 | (b) | | | 0.04 | (b) | | | 0.01 | (b) | | | 0.12 | | | | 0.02 | | |
Net realized and
unrealized gains
(losses) on
investments | | | (0.61 | ) | | | (0.40 | ) | | | 0.45 | | | | 0.84 | | | | 0.24 | | | | 0.07 | (c) | | | 0.78 | | |
Total from
Investment
Activities | | | (0.48 | ) | | | (0.04 | ) | | | 0.59 | | | | 0.88 | | | | 0.25 | | | | 0.19 | | | | 0.80 | | |
Distributions: | |
Net investment
income | | | (0.12 | ) | | | (0.25 | ) | | | — | | | | (0.16 | ) | | | — | | | | (0.10 | ) | | | (0.02 | ) | |
Net realized gains
from investments | | | (0.95 | ) | | | (0.14 | ) | | | (0.84 | ) | | | (0.38 | ) | | | (0.07 | ) | | | (0.55 | ) | | | — | | |
Total
Distributions | | | (1.07 | ) | | | (0.39 | ) | | | (0.84 | ) | | | (0.54 | ) | | | (0.07 | ) | | | (0.65 | ) | | | (0.02 | ) | |
Paid in capital from
redemption fees | | | — | | | | — | | | | — | | | | — | | | | 0.00 | (d) | | | 0.00 | (d) | | | 0.00 | (d) | |
Net Asset Value, End of
Period | | $ | 10.47 | | | $ | 12.02 | | | $ | 12.45 | | | $ | 12.70 | | | $ | 12.36 | | | $ | 12.18 | | | $ | 12.64 | | |
Total Return (excludes
sales charge) (e) | | | (4.19 | )% | | | (0.29 | )%(f) | | | 5.10 | % | | | 7.36 | % | | | 2.03 | % | | | 1.40 | % | | | 6.73 | % | |
Ratios/Supplemental Data: | |
Net Assets at end of
period (000) | | $ | 20,466 | | | $ | 20,441 | | | $ | 82,534 | | | $ | 77,160 | | | $ | 87,255 | | | $ | 75,842 | | | $ | 35,516 | | |
Ratio of net expenses to
average net assets (g) (h) | | | 0.50 | % | | | 0.50 | % | | | 0.50 | % | | | 0.92 | % | | | 1.15 | % | | | 1.15 | % | | | 1.15 | % | |
Ratio of net investment
income to average net
assets (g) (h) | | | 2.16 | % | | | 2.91 | % | | | 1.93 | % | | | 0.29 | % | | | 0.06 | % | | | 0.68 | % | | | 0.39 | % | |
Ratio of gross expenses to
average net
assets (g) (h) (i) | | | 0.70 | % | | | 0.50 | % | | | 0.49 | % | | | 1.08 | % | | | 1.13 | % | | | 1.22 | % | | | 1.32 | % | |
Ratio of net investment
income to average net
assets (g) (h) (i) | | | 2.36 | % | | | 2.91 | % | | | 1.94 | % | | | 0.13 | % | | | 0.08 | % | | | 0.61 | % | | | 0.22 | % | |
Portfolio turnover (e) | | | 32 | % | | | 22 | % | | | 12 | % | | | 111 | % | | | 58 | % | | | 235 | % | | | 16 | % | |
(a) The period includes the consolidation of a wholly owned subsidiary.
(b) Calculated using average shares for the period.
(c) Realized and unrealized gain per share does not correlate to the aggregate of the realized and unrealized gains on the Consolidated Statements of Operations for the Year Ended November 30, 2011, primarily due to the timing of sales and repurchases of the Fund's shares in relation to fluctuating market values for the Fund's portfolio.
(d) Less than $0.01 per share.
(e) Not annualized for periods less than one year.
(f) Had the Advisor not reimbursed the trade error, total return would have been (0.45)%.
(g) These ratios exclude the impact of the expenses of the other investment companies in which the Fund invests.
(h) Annualized for periods less than one year.
(i) During the period, certain fees were reduced and/or reimbursed. If such see reductions and/or reimbursements had not occurred, the ratios would have been as indicated.
See notes to financial statements.
193
Victory Portfolios II | | Financial Highlights — continued | |
For a Share Outstanding Throughout Each Period
| | | Victory CEMP Multi-Asset Balanced Fund | |
| | | Class C Shares | |
| | | For the
Six
Months
Ended
December 31,
2015 | | Year
Ended
June 30,
2015 | | For the
Seven
Months
Period
Ended
June 30,
2014 | | Year
Ended
November 30,
2013(a) | | Year
Ended
November 30,
2012(a) | | Year
Ended
November 30,
2011(a) | | For the
Five
Months
Period
Ended
November 30,
2010 | |
| | | (Unaudited) | | | | | | | | | | | | | |
Net Asset Value,
Beginning of Period | | $ | 11.76 | | | $ | 12.18 | | | $ | 12.50 | | | $ | 12.13 | | | $ | 12.05 | | | $ | 12.58 | | | $ | 11.82 | | |
Investment Activities: | |
Net investment
income (loss) | | | 0.07 | (b) | | | 0.20 | (b) | | | 0.09 | (b) | | | (0.05 | )(b) | | | (0.09 | )(b) | | | 0.04 | | | | (0.02 | ) | |
Net realized and
unrealized gains
(losses) on
investments | | | (0.59 | ) | | | (0.33 | ) | | | 0.43 | | | | 0.83 | | | | 0.24 | | | | 0.06 | (c) | | | 0.78 | | |
Total from
Investment
Activities | | | (0.52 | ) | | | (0.13 | ) | | | 0.52 | | | | 0.78 | | | | 0.15 | | | | 0.10 | | | | 0.76 | | |
Distributions: | |
Net investment
income | | | (0.02 | ) | | | (0.15 | ) | | | — | | | | (0.03 | ) | | | — | | | | (0.08 | ) | | | — | | |
Net realized gains
from investments | | | (0.95 | ) | | | (0.14 | ) | | | (0.84 | ) | | | (0.38 | ) | | | (0.07 | ) | | | (0.55 | ) | | | — | | |
Total
Distributions | | | (0.97 | ) | | | (0.29 | ) | | | (0.84 | ) | | | (0.41 | ) | | | (0.07 | ) | | | (0.63 | ) | | | — | | |
Paid in capital from
redemption fees | | | — | | | | — | | | | — | | | | — | | | | 0.00 | (d) | | | 0.00 | (d) | | | 0.00 | (d) | |
Net Asset Value, End of
Period | | $ | 10.27 | | | $ | 11.76 | | | $ | 12.18 | | | $ | 12.50 | | | $ | 12.13 | | | $ | 12.05 | | | $ | 12.58 | | |
Total Return (excludes
contingent deferred
sales charge) (e) | | | (4.61 | )% | | | (1.01 | )%(f) | | | 4.59 | % | | | 6.64 | % | | | 1.22 | % | | | 0.65 | % | | | 6.43 | % | |
Ratios/Supplemental Data: | |
Net Assets at end of
period (000) | | $ | 9,643 | | | $ | 11,977 | | | $ | 14,559 | | | $ | 16,455 | | | $ | 24,847 | | | $ | 21,383 | | | $ | 10,691 | | |
Ratio of net expenses to
average net assets (g) (h) | | | 1.25 | % | | | 1.25 | % | | | 1.25 | % | | | 1.67 | % | | | 1.90 | % | | | 1.90 | % | | | 1.90 | % | |
Ratio of net investment
income to average net
assets (g) (h) | | | 1.29 | % | | | 1.67 | % | | | 1.33 | % | | | (0.46 | )% | | | (0.69 | )% | | | (0.06 | )% | | | (0.36 | )% | |
Ratio of gross expenses to
average net
assets (g) (h) (i) | | | 1.44 | % | | | 1.25 | % | | | 1.24 | % | | | 1.83 | % | | | 1.88 | % | | | 1.97 | % | | | 2.07 | % | |
Ratio of net investment
income to average net
assets (g) (h) (i) | | | 1.48 | % | | | 1.67 | % | | | 1.34 | % | | | (0.62 | )% | | | (0.67 | )% | | | (0.13 | )% | | | (0.53 | )% | |
Portfolio turnover (e) | | | 32 | % | | | 22 | % | | | 12 | % | | | 111 | % | | | 58 | % | | | 235 | % | | | 16 | % | |
(a) The period includes the consolidation of a wholly owned subsidiary.
(b) Calculated using average shares for the period.
(c) Realized and unrealized gain per share does not correlate to the aggregate of the realized and unrealized gains on the Consolidated Statements of Operations for the Year Ended November 30, 2011, primarily due to the timing of sales and repurchases of the Fund's shares in relation to fluctuating market values for the Fund's portfolio.
(d) Less than $0.01 per share.
(e) Not annualized for periods less than one year.
(f) Had the Advisor not reimbursed the trade error, total return would have been (1.18)%.
(g) These ratios exclude the impact of the expenses of the other investment companies in which the Fund invests.
(h) Annualized for periods less than one year.
(i) During the period, certain fees were reduced and/or reimbursed. If such see reductions and/or reimbursements had not occurred, the ratios would have been as indicated.
See notes to financial statements.
194
Victory Portfolios II | | Financial Highlights | |
For a Share Outstanding Throughout Each Period
| | | Victory CEMP Multi-Asset Growth Fund | |
| | | Class A Shares | |
| | | For the
Six
Months
Ended
December 31,
2015 | | Year
Ended
June 30,
2015 | | For the
Seven
Months
Period
Ended
June 30,
2014 | | Year
Ended
November 30,
2013(a) | | Year
Ended
November 30,
2012(a) | | Year
Ended
November 30,
2011(a) | | For the
Five
Months
Period
Ended
November 30,
2010 | |
| | | (Unaudited) | | | | | | | | | | | | | |
Net Asset Value,
Beginning of Period | | $ | 11.82 | | | $ | 12.54 | | | $ | 13.97 | | | $ | 11.66 | | | $ | 11.98 | | | $ | 12.80 | | | $ | 11.38 | | |
Investment Activities: | |
Net investment
income (loss) | | | 0.06 | (b) | | | 0.41 | (b) | | | 0.26 | (b) | | | 0.08 | (b) | | | (0.03 | )(b) | | | 0.10 | | | | (0.03 | ) | |
Net realized and
unrealized gains
(losses) on
investments | | | (0.70 | ) | | | (0.41 | ) | | | 0.61 | | | | 2.23 | | | | (0.29 | ) | | | (0.04 | ) | | | 1.45 | | |
Total from
Investment
Activities | | | (0.64 | ) | | | — | | | | 0.87 | | | | 2.31 | | | | (0.32 | ) | | | 0.06 | | | | 1.42 | | |
Distributions: | |
Net investment
income | | | (0.10 | ) | | | (0.28 | ) | | | (0.35 | ) | | | — | | | | — | | | | (0.10 | ) | | | — | | |
Net realized gains
from investments | | | (2.54 | ) | | | (0.44 | ) | | | (1.95 | ) | | | — | | | | — | | | | (0.78 | ) | | | — | | |
Total
Distributions | | | (2.64 | ) | | | (0.72 | ) | | | (2.30 | ) | | | — | | | | — | | | | (0.88 | ) | | | — | | |
Paid in capital from
redemption fees | | | — | | | | — | | | | — | | | | — | | | | — | (c) | | | — | (c) | | | — | (c) | |
Net Asset Value, End of
Period | | $ | 8.54 | | | $ | 11.82 | | | $ | 12.54 | | | $ | 13.97 | | | $ | 11.66 | | | $ | 11.98 | | | $ | 12.80 | | |
Total Return (excludes
sales charge) (d) | | | (5.84 | )% | | | 0.22 | %(e) | | | 7.82 | % | | | 19.81 | % | | | 2.67 | %(f) | | | 0.08 | % | | | 12.48 | % | |
Ratios/Supplemental Data: | |
Net Assets at end of
period (000) | | $ | 6,606 | | | $ | 6,022 | | | $ | 44,095 | | | $ | 46,693 | | | $ | 48,959 | | | $ | 54,198 | | | $ | 15,832 | | |
Ratio of net expenses to
average net assets (g) (h) | | | 0.50 | % | | | 0.50 | % | | | 0.50 | % | | | 1.09 | % | | | 1.45 | % | | | 1.45 | % | | | 1.45 | % | |
Ratio of net investment
income to average net
assets (g) (h) | | | 1.10 | % | | | 3.39 | % | | | 3.69 | % | | | 0.58 | % | | | (0.22 | )% | | | 0.26 | % | | | (0.64 | )% | |
Ratio of gross expenses to
average net
assets (g) (h) (i) | | | 0.97 | % | | | 0.54 | % | | | 0.56 | % | | | 1.09 | % | | | 1.51 | % | | | 1.68 | % | | | 1.93 | % | |
Ratio of net investment
income to average net
assets (g) (h) (i) | | | 1.57 | % | | | 3.35 | % | | | 3.63 | % | | | 0.58 | % | | | (0.28 | )% | | | 0.03 | % | | | (1.12 | )% | |
Portfolio turnover (d) | | | 106 | % | | | 32 | % | | | 4 | % | | | 151 | % | | | 108 | % | | | 341 | % | | | 31 | % | |
(a) The period includes the consolidation of a wholly owned subsidiary.
(b) Calculated using average shares for the period.
(c) Less than $0.01 per share.
(d) Not annualized for periods less than one year.
(e) Had the Advisor not reimbursed the trade error, total return would have been (0.20)%.
(f) Includes adjustments in accordance with accounting principles generally accepted in the United States and, consequently, the net asset value for financial reporting purposes and the returns based upon those net asset values may differ from the net asset values and returns for shareholder transactions.
(g) These ratios exclude the impact of the expenses of the other investment companies in which the Fund invests.
(h) Annualized for periods less than one year.
(i) During the period, certain fees were reduced and/or reimbursed. If such see reductions and/or reimbursements had not occurred, the ratios would have been as indicated.
See notes to financial statements.
195
Victory Portfolios II | | Financial Highlights — continued | |
For a Share Outstanding Throughout Each Period
| | | Victory CEMP Multi-Asset Growth Fund | |
| | | Class C Shares | |
| | | For the
Six
Months
Ended
December 31,
2015 | | Year
Ended
June 30,
2015 | | For the
Seven
Months
Period
Ended
June 30,
2014 | | Year
Ended
November 30,
2013(a) | | Year
Ended
November 30,
2012(a) | | Year
Ended
November 30,
2011(a) | | For the
Five
Months
Period
Ended
November 30,
2010 | |
| | | (Unaudited) | | | | | | | | | | | | | |
Net Asset Value,
Beginning of Period | | $ | 11.43 | | | $ | 12.15 | | | $ | 13.55 | | | $ | 11.40 | | | $ | 11.80 | | | $ | 12.65 | | | $ | 11.28 | | |
Investment Activities: | |
Net investment
income (loss) | | | 0.02 | (b) | | | 0.20 | (b) | | | 0.19 | (b) | | | (0.02 | )(b) | | | (0.11 | )(b) | | | (0.02 | ) | | | (0.07 | ) | |
Net realized and
unrealized gains
(losses) on
investments | | | (0.68 | ) | | | (0.29 | ) | | | 0.61 | | | | 2.17 | | | | (0.29 | ) | | | (0.02 | ) | | | 1.44 | | |
Total from
Investment
Activities | | | (0.66 | ) | | | (0.09 | ) | | | 0.80 | | | | 2.15 | | | | (0.40 | ) | | | (0.04 | ) | | | 1.37 | | |
Distributions: | |
Net investment
income | | | (0.00 | ) | | | (0.19 | ) | | | (0.25 | ) | | | — | | | | — | | | | (0.03 | ) | | | — | | |
Net realized gains
from investments | | | (2.54 | ) | | | (0.44 | ) | | | (1.95 | ) | | | — | | | | — | | | | (0.78 | ) | | | — | | |
Total
Distributions | | | (2.54 | ) | | | (0.63 | ) | | | (2.20 | ) | | | — | | | | — | | | | (0.81 | ) | | | — | | |
Paid in capital from
redemption fees | | | — | | | | — | | | | — | | | | — | | | | — | (c) | | | — | (c) | | | — | (c) | |
Net Asset Value, End of
Period | | $ | 8.23 | | | $ | 11.43 | | | $ | 12.15 | | | $ | 13.55 | | | $ | 11.40 | | | $ | 11.80 | | | $ | 12.65 | | |
Total Return (excludes
contingent deferred
sales charge) (d) | | | (6.18 | )% | | | (0.58 | )%(e) | | | 7.36 | % | | | 18.86 | % | | | (3.39 | )%(f) | | | (0.71 | )% | | | 1.15 | % | |
Ratios/Supplemental Data: | |
Net Assets at end of
period (000) | | $ | 3,826 | | | $ | 4,934 | | | $ | 6,913 | | | $ | 5,787 | | | $ | 7,480 | | | $ | 7,432 | | | $ | 4,085 | | |
Ratio of net expenses to
average net assets (g) (h) | | | 1.25 | % | | | 1.25 | % | | | 1.25 | % | | | 1.84 | % | | | 2.20 | % | | | 2.20 | % | | | 2.20 | % | |
Ratio of net investment
income to average net
assets (g) (h) | | | 0.30 | % | | | 1.75 | % | | | 2.94 | % | | | (0.16 | )% | | | (0.97 | )% | | | (0.34 | )% | | | (1.39 | )% | |
Ratio of gross expenses to
average net
assets (g) (h) (i) | | | 1.67 | % | | | 1.29 | % | | | 1.31 | % | | | 1.84 | % | | | 2.26 | % | | | 2.43 | % | | | 2.68 | % | |
Ratio of net investment
income to average net
assets (g) (h) (i) | | | 0.72 | % | | | 1.71 | % | | | 2.88 | % | | | (0.16 | )% | | | (1.03 | )% | | | (0.57 | )% | | | (1.87 | )% | |
Portfolio turnover | | | 106 | % | | | 32 | % | | | 4 | % | | | 151 | % | | | 108 | % | | | 341 | % | | | 31 | % | |
(a) The period includes the consolidation of a wholly owned subsidiary.
(b) Calculated using average shares for the period.
(c) Less than $0.01 per share.
(d) Not annualized for periods less than one year.
(e) Had the Advisor not reimbursed the trade error, total return would have been (1.02)%.
(f) Includes adjustments in accordance with accounting principles generally accepted in the United States and, consequently, the net asset value for financial reporting purposes and the returns based upon those net asset values may differ from the net asset values and returns for shareholder transactions.
(g) These ratios exclude the impact of the expenses of the other investment companies in which the Fund invests.
(h) Annualized for periods less than one year.
(i) During the period, certain fees were reduced and/or reimbursed. If such see reductions and/or reimbursements had not occurred, the ratios would have been as indicated.
See notes to financial statements.
196
Victory Portfolios II | | Financial Highlights | |
For a Share Outstanding Throughout Each Period
| | | Victory CEMP Alternative Strategies Fund | |
| | | Class A Shares | |
| | | For the
Six
Months
Ended
December 31,
2015 | | Year
Ended
June 30,
2015 | | For the
Seven
Months
Period
Ended
June 30,
2014 | | Year
Ended
November 30,
2013(a) | | Year
Ended
November 30,
2012(a) | | Year
Ended
November 30,
2011(a) | | For the
Five
Months
Period
Ended
November 30,
2010 | |
| | | (Unaudited) | | | | | | | | | | | | | |
Net Asset Value,
Beginning of Period | | $ | 10.14 | | | $ | 10.58 | | | $ | 10.07 | | | $ | 9.69 | | | $ | 10.28 | | | $ | 10.37 | | | $ | 9.46 | | |
Investment Activities: | |
Net investment
income (loss) | | | 0.14 | (b) | | | 0.27 | (b) | | | 0.06 | (b) | | | (0.02 | )(b) | | | (0.07 | )(b) | | | (0.01 | ) | | | (0.02 | ) | |
Net realized and
unrealized gains
(losses) on
investments | | | (0.69 | ) | | | (0.47 | ) | | | 0.45 | | | | 0.40 | | | | (0.52 | ) | | | 0.03 | (c) | | | 0.93 | | |
Total from
Investment
Activities | | | (0.55 | ) | | | (0.20 | ) | | | 0.51 | | | | 0.38 | | | | (0.59 | ) | | | 0.02 | | | | 0.91 | | |
Distributions: | |
Net investment
income | | | (0.22 | ) | | | (0.24 | ) | | | — | | | | — | | | | — | | | | — | | | | — | | |
Tax return of capital | | | — | | | | — | | | | — | | | | — | | | | — | | | | (0.11 | ) | | | — | | |
Total
Distributions | | | (0.22 | ) | | | (0.24 | ) | | | — | | | | — | | | | — | | | | (0.11 | ) | | | — | | |
Paid in capital from
redemption fees | | | — | | | | — | | | | — | | | | — | | | | — | (d) | | | — | (d) | | | — | (d) | |
Net Asset Value, End of
Period | | $ | 9.37 | | | $ | 10.14 | | | $ | 10.58 | | | $ | 10.07 | | | $ | 9.69 | | | $ | 10.28 | | | $ | 10.37 | | |
Total Return (excludes
sales charge) (e) | | | (5.43 | )% | | | (1.88 | )% | | | 5.06 | % | | | 3.92 | % | | | (5.74 | )% | | | 0.17 | % | | | 9.62 | % | |
Ratios/Supplemental Data: | |
Net Assets at end of
period (000) | | $ | 23,401 | | | $ | 32,275 | | | $ | 51,003 | | | $ | 59,079 | | | $ | 118,926 | | | $ | 187,460 | | | $ | 4,776 | | |
Ratio of net expenses to
average net assets (f) (g) | | | 0.50 | % | | | 0.50 | % | | | 0.50 | % | | | 1.19 | % | | | 1.41 | % | | | 1.45 | % | | | 1.45 | % | |
Ratio of net investment
income to average net
assets (f) (g) | | | 2.80 | % | | | 2.64 | % | | | 1.03 | % | | | (0.25 | )% | | | (0.71 | )% | | | (0.10 | )% | | | (0.75 | )% | |
Ratio of gross expenses to
average net
assets (f) (g) (h) | | | 0.79 | % | | | 0.56 | % | | | 0.59 | % | | | 1.19 | % | | | 1.37 | % | | | 1.45 | % | | | 4.21 | % | |
Ratio of net investment
income to average net
assets (f) (g) (h) | | | 3.09 | % | | | 2.58 | % | | | 0.94 | % | | | (0.25 | )% | | | (0.67 | )% | | | (0.10 | )% | | | (3.51 | )% | |
Portfolio turnover | | | 60 | % | | | 11 | % | | | 49 | % | | | 153 | % | | | 137 | % | | | 278 | % | | | 24 | % | |
(a) The period includes the consolidation of a wholly owned subsidiary.
(b) Calculated using average shares for the period.
(c) Realized and unrealized gain per share does not correlate to the aggregate of the realized and unrealized gains on the Consolidated Statements of Operations for the Year Ended November 30, 2011, primarily due to the timing of sales and repurchases of the Fund's shares in relation to fluctuating market values for the Fund's portfolio.
(d) Less than $0.01 per share.
(e) Not annualized for periods less than one year.
(f) These ratios exclude the impact of the expenses of the other investment companies in which the Fund invests.
(g) Annualized for periods less than one year.
(h) During the period, certain fees were reduced and/or reimbursed. If such see reductions and/or reimbursements had not occurred, the ratios would have been as indicated.
See notes to financial statements.
197
Victory Portfolios II | | Financial Highlights — continued | |
For a Share Outstanding Throughout Each Period
| | | Victory CEMP Alternative Strategies Fund | |
| | | Class C Shares | |
| | | For the
Six
Months
Ended
December 31,
2015 | | Year
Ended
June 30,
2015 | | For the
Seven
Months
Period
Ended
June 30,
2014 | | Year
Ended
November 30,
2013(a) | | Year
Ended
November 30,
2012(a) | | Year
Ended
November 30,
2011(a) | | For the
Five
Months
Period
Ended
November 30,
2010 | |
| | | (Unaudited) | | | | | | | | | | | | | |
Net Asset Value,
Beginning of Period | | $ | 9.85 | | | $ | 10.27 | | | $ | 9.82 | | | $ | 9.51 | | | $ | 10.17 | | | $ | 10.29 | | | $ | 9.41 | | |
Investment Activities: | |
Net investment
income (loss) | | | 0.10 | (b) | | | 0.18 | (b) | | | 0.02 | (b) | | | (0.09 | )(b) | | | (0.15 | )(b) | | | (0.04 | ) | | | (0.05 | ) | |
Net realized and
unrealized gains
(losses) on
investments | | | (0.67 | ) | | | (0.45 | ) | | | 0.43 | | | | 0.40 | | | | (0.51 | ) | | | (0.02 | ) | | | 0.93 | | |
Total from
Investment
Activities | | | (0.57 | ) | | | (0.27 | ) | | | 0.45 | | | | 0.31 | | | | (0.66 | ) | | | (0.06 | ) | | | 0.88 | | |
Distributions: | |
Net investment
income | | | (0.13 | ) | | | (0.15 | ) | | | — | | | | — | | | | — | | | | — | | | | — | | |
Tax return of capital | | | — | | | | — | | | | — | | | | — | | | | — | | | | (0.06 | ) | | | — | | |
Total
Distributions | | | (0.13 | ) | | | (0.15 | ) | | | — | | | | — | | | | — | | | | (0.06 | ) | | | — | | |
Paid in capital from
redemption fees | | | — | | | | — | | | | — | | | | — | | | | — | (c) | | | — | (c) | | �� | — | (c) | |
Net Asset Value, End of
Period | | $ | 9.15 | | | $ | 9.85 | | | $ | 10.27 | | | $ | 9.82 | | | $ | 9.51 | | | $ | 10.17 | | | $ | 10.29 | | |
Total Return (excludes
contingent deferred
sales charge) (d) | | | (5.75 | )% | | | (2.65 | )% | | | 4.58 | % | | | 3.26 | % | | | (6.49 | )% | | | (0.61 | )% | | | 9.35 | % | |
Ratios/Supplemental Data: | |
Net Assets at end of
period (000) | | $ | 5,001 | | | $ | 6,778 | | | $ | 9,581 | | | $ | 12,918 | | | $ | 24,340 | | | $ | 23,893 | | | $ | 1,183 | | |
Ratio of net expenses to
average net assets (e) (f) | | | 1.25 | % | | | 1.25 | % | | | 1.25 | % | | | 1.94 | % | | | 2.16 | % | | | 2.20 | % | | | 2.20 | % | |
Ratio of net investment
income to average net
assets (e) (f) | | | 2.06 | % | | | 1.81 | % | | | 0.31 | % | | | (1.00 | )% | | | (1.46 | )% | | | (1.05 | )% | | | (1.50 | )% | |
Ratio of gross expenses to
average net
assets (e) (f) (g) | | | 1.54 | % | | | 1.31 | % | | | 1.34 | % | | | 1.94 | % | | | 2.12 | % | | | 2.20 | % | | | 4.96 | % | |
Ratio of net investment
income to average net
assets (e) (f) (g) | | | 2.35 | % | | | 1.75 | % | | | 0.22 | % | | | (1.00 | )% | | | (1.42 | ) | | | (1.05 | )% | | | (4.26 | )% | |
Portfolio turnover | | | 60 | % | | | 11 | % | | | 49 | % | | | 153 | % | | | 137 | % | | | 278 | % | | | 24 | % | |
(a) The period includes the consolidation of a wholly owned subsidiary.
(b) Calculated using average shares for the period.
(c) Less than $0.01 per share.
(d) Not annualized for periods less than one year.
(e) These ratios exclude the impact of the expenses of the other investment companies in which the Fund invests.
(f) Annualized for periods less than one year.
(g) During the period, certain fees were reduced and/or reimbursed. If such see reductions and/or reimbursements had not occurred, the ratios would have been as indicated.
See notes to financial statements.
198
Victory Portfolios II | | Notes to Financial Statements
December 31, 2015 | |
(Unaudited)
1. Organization:
Victory Portfolios II (formerly Compass EMP Funds Trust) (the "Trust"), was organized on April 11, 2012 as a Delaware statutory trust (formerly a Delaware business trust). The Trust is registered under the Investment Company Act of 1940, as amended (the "1940 Act"), as an open-end investment company and thus follows accounting and reporting guidance for investment companies. The Trust is authorized to issue an unlimited number of shares, which are units of beneficial interest with no par value. As of December 31, 2015, the Trust offered shares of 26 funds (each a "Fund" and collectively, the "Funds"). Each Fund is classified as diversified under the 1940 Act.
The accompanying financial statements are those of the following funds. The investment objective of each Fund is set forth below.
Funds* | | Former Fund Names | | Investment Objectives | |
Victory CEMP US 500 Volatility
Wtd Index Fund
| | Compass EMP U.S. 500
Volatility Weighted Fund
| | Track performance of the
CEMP US Large Cap 500
Volatility Weighted Index
before expenses. | |
Victory CEMP US Small Cap
Volatility Wtd Index Fund
| | Compass EMP U.S. Small
Cap 500 Volatility Weighted
Fund
| | Track performance of the
CEMP US Small Cap 500
Volatility Weighted Index
before expenses. | |
Victory CEMP International
Volatility Wtd Index Fund
| | Compass EMP International
500 Volatility Weighted Fund
| | Track performance of the
CEMP International 500
Volatility Weighted Index
before expenses. | |
Victory CEMP Emerging Market
Volatility Wtd Index Fund
| | Compass EMP Emerging
Market 500 Volatility
Weighted Fund
| | Track performance of the
CEMP Emerging Market 500
Volatility Weighted Index
before expenses. | |
Victory CEMP US 500 Enhanced
Volatility Wtd Index Fund
| | Compass EMP U.S. 500
Enhanced Volatility Weighted
Fund
| | Track performance of the
CEMP US Large Cap 500
Long/Cash Volatility
Weighted Index before
expenses. | |
Victory CEMP International
Enhanced Volatility Wtd
Index Fund
| | Compass EMP International
500 Enhanced Volatility
Weighted Fund
| | Track performance of the
CEMP International 500
Long/Cash Volatility
Weighted Index before
expenses. | |
Victory CEMP REC Enhanced
Volatility Wtd Index Fund
| | Compass EMP REC Enhanced
Volatility Weighted Fund
| | Track performance of the
CEMP US REIT Long/Cash
Volatility Weighted Index
before expenses. | |
Victory CEMP Commodity
Volatility Wtd Index
Strategy Fund
| | Compass EMP Commodity
Strategies Volatility Weighted
Fund
| | Track performance of the
CEMP Commodity Volatility
Weighted Index before
expenses. | |
Victory CEMP Commodity
Enhanced Volatility Wtd
Index Strategy Fund
| | Compass EMP Commodity
Strategies Enhanced Volatility
Weighted Fund
| | Track performance of the
CEMP Commodity Long/Cash
Volatility Weighted Index
before expenses. | |
199
Victory Portfolios II | | Notes to Financial Statements — continued
December 31, 2015 | |
(Unaudited)
Funds* | | Former Fund Names | | Investment Objectives | |
Victory CEMP Long/Short
Strategy Fund | | Compass EMP Long/Short
Strategies Fund | |
Seeks capital appreciation. | |
Victory CEMP Market Neutral
Income Fund
| | Compass EMP Market Neutral
Income Fund
| | Seeks to achieve high current
income while maintaining a
low correlation to the
fluctuations of the equity
and bond markets. | |
Victory CEMP Enhanced Fixed
Income Fund | | Compass EMP Enhanced
Fixed Income Fund | |
Total return. | |
Victory CEMP Ultra Short Term
Fixed Income Fund
| | Compass EMP Ultra
Short Term Fixed Income
Fund
| | Designed to invest in fixed
income instruments which
average 12 months or less
in maturity. | |
Victory CEMP Multi-Asset
Balanced Fund ("Balanced Fund")
| | Compass EMP Multi-Asset
Balanced Fund
| | Moderate asset allocation
fund offering exposure to
multiple asset classes
(growth and income) within
one mutual fund. | |
Victory CEMP Multi-Asset
Growth Fund ("Growth Fund") | | Compass EMP Multi-Asset
Growth Fund | | Long term capital
appreciation. | |
Victory CEMP Alternative
Strategies Fund ("Alternative Fund") | | Compass EMP Alternative
Strategies Fund | | Long term capital
appreciation. | |
* Name changes were effective November 9, 2015 for each Fund.
The financial statements of the Victory CEMP Commodity Volatility Wtd Index Strategy Fund and Victory CEMP Commodity Enhanced Volatility Wtd Index Strategy Fund are consolidated and include the accounts of CEMPCLSSF Fund Ltd. and CEMPCSVWF Fund Ltd., respectively, each a wholly-owned and controlled Cayman Islands subsidiary (the "Subsidiaries"), which invest in commodity futures and other investments intended to serve as margin or collateral for the Subsidiaries' derivatives positions. The Funds wholly own and control the Subsidiaries, and the Funds and Subsidiaries are both managed by Victory Capital Management, LLC. ("VCM" or "Adviser"). The Funds may invest up to 25% of their total assets at the end of each fiscal quarter in their respective Subsidiaries which act as investment vehicles in order for the Funds to indirectly invest in certain investments that are consistent with their respective investment objectives and policies. Significant intercompany accounts and transactions have been eliminated in consolidation for the Funds. The accompanying financial statements reflect the financial positions of the Funds and the results of operations on a consolidated basis with the Subsidiaries.
For tax purposes, the Subsidiaries are exempted Cayman investment companies. The Subsidiaries have received an undertaking from the Government of the Cayman Islands exempting them from all local income, profits and capital gains taxes. No such taxes are levied in the Cayman Islands at the present time. For U.S. income tax purposes, the Subsidiaries are Controlled Foreign Corporations ("CFCs") and as such are not subject to U.S. income tax. However, as wholly-owned CFCs, the Subsidiaries' net income and capital gains, to the extent of their earnings and profits, will be included each year in the Funds' taxable income.
Each Fund currently offers Class A, Class C and Class I shares with the exception of the Victory CEMP Ultra Short Term Fixed Income Fund which offers Class A and Class I shares and the Balanced Fund, Growth Fund, and Alternative Fund which offer Class A and Class C shares. On October 12, 2015, Class T Shares were closed. Each class of shares in a Fund has substantially identical rights and privileges except with respect to sales charges, fees paid under distribution plans, expenses allocable exclusively to each class of shares, voting rights on matters solely affecting a single class of shares, and the exchange privilege of each class of shares.
200
Victory Portfolios II | | Notes to Financial Statements — continued
December 31, 2015 | |
(Unaudited)
Under the Trust's organizational documents, its officers and trustees are indemnified against certain liabilities arising out of the performance of their duties to the Trust. In addition, in the normal course of business, the Trust enters into contracts with its vendors and others that provide for general indemnifications. The Trust and Funds' maximum exposure under these arrangements is unknown, as this would involve future claims that may be made against the Funds. However, based on experience, the Funds expect that risk of loss to be remote.
2. Significant Accounting Policies:
The following is a summary of significant accounting policies followed by the Trust in the preparation of its financial statements. The policies are in conformity with accounting principles generally accepted in the United States of America ("GAAP"). The preparation of financial statements requires management to make estimates and assumptions that affect the reported amounts of assets and liabilities at the date of the financial statements and the reported amounts of income and expenses for the period. Actual results could differ from those estimates.
Investment Valuation:
The Funds record investments at fair value. Fair value is defined as the price that would be received to sell an asset or paid to transfer a liability in an orderly transaction between market participants at the measurement date.
The valuation techniques described below maximize the use of observable inputs and minimize the use of unobservable inputs in determining fair value. The inputs used for valuing the Funds' investments are summarized in the three broad levels listed below:
• Level 1 — quoted prices in active markets for identical securities
• Level 2 — other significant observable inputs (including quoted prices for similar securities or interest rates applicable to those securities, etc.)
• Level 3 — significant unobservable inputs (including the Fund's own assumptions in determining the fair value of investments)
Changes in valuation techniques may result in transfers in or out of an assigned level within the disclosure hierarchy. The Trust determines transfers between fair value hierarchy levels at the reporting period end. The inputs or methodology used for valuing investments are not necessarily an indication of the risk associated with investing in those investments.
Equity securities, rights, exchange-traded funds, and options listed or traded on securities exchanges or the NASDAQ National Market System are valued at the official closing price if available, or the last sales price, on the exchange or system where the security is principally traded or at the NASDAQ Official Closing Price. If there have been no sales for that day on the exchange or system, a security is valued at the last available bid quotation on the exchange or system where the security is principally traded. These valuations are typically categorized as Level 1 in the fair value hierarchy.
In accordance with procedures adopted by the Board of Trustees (the "Board"), fair value pricing may be used if events materially affecting the value of foreign securities occur between the time the exchange on which they are traded closes and the time the Funds' net asset values are calculated. The Victory CEMP International Volatility Wtd Index Fund, Victory CEMP Emerging Market Volatility Wtd Index Fund and Victory International Enhanced Volatility Wtd Index Fund use a systemic valuation model, provided daily by an independent third party to fair value their international equity securities. These valuations are considered as Level 2 in the fair value hierarchy.
Debt securities of U.S. issuers (other than short-term investments maturing in 60 days or less), including corporate and municipal securities, are generally valued on the basis of bid valuations provided by dealers or an independent pricing service approved by the Trust's Board. Short-term fixed-income investments maturing in 60 days or less may be valued at amortized cost, which approximates market value. Under amortized cost method, premium or discount, if any, is amortized
201
Victory Portfolios II | | Notes to Financial Statements — continued
December 31, 2015 | |
(Unaudited)
or accreted, respectively, on a constant basis to the maturity of the security. These valuations are typically categorized as Level 2 in the fair value hierarchy.
Short-term money market instruments (such as certificates of deposit, bankers' acceptances and commercial paper) are generally valued by bid quotations or by reference to bid quotations of available yields for similar instruments of issuers with similar credit ratings. All these prices are obtained from services, which collect and disseminate such market prices. Bid quotations for short-term money market instruments reported by such a service are the bid quotations reported to it by the major dealers. These valuations are typically categorized as Level 1 in the fair value hierarchy.
Futures contracts are generally valued at the settlement price established each day by the board of trade or an exchange on which they are traded. These valuations are typically categorized as Level 1 in the fair value hierarchy.
Investments in other open-end investment companies are valued at net asset value as reported by such companies. These valuations are typically categorized as Level 1 or Level 2 in the fair value hierarchy.
Investments for which there are no such quotations, or for which quotations do not appear reliable, are valued as determined in good faith by the Pricing Committee under the direction of the Board. These valuations are typically categorized as Level 2 or Level 3 in the fair value hierarchy.
In accordance with the Trust's good faith pricing guidelines, the Adviser is required to consider all appropriate factors relevant to the value of securities for which it has determined other pricing sources are not available or reliable. No single standard for determining fair value exists, since fair value depends upon the circumstances of each individual case. As a general principle, the current fair value of securities being valued by the Adviser would appear to be the amount which the owner might reasonably expect to receive for them upon their current sale. Methods which are in accord with this principle may, for example, be based on (i) a multiple of earnings; (ii) a discount from market of a similar freely traded security (including a derivative security or a basket of securities traded on other markets, exchanges or among dealers); or (iii) yield to maturity with respect to debt issues, or a combination of these and other methods.
The following is a summary of the inputs used to value the Funds' investments as of December 31, 2015, while the breakdown, by category, of equity securities are disclosed on the Schedules of Portfolio Investments for each Fund:
| | | LEVEL 1 —
Quoted Prices | | LEVEL 2 —
Other Significant
Observable Inputs | | LEVEL 3 —
Other Significant
Unobservable Inputs | | Total | |
| | | Investments
in
Securities | | Other
Financial
Investments^ | | Investments
in
Securities | | Other
Financial
Investments^ | | Investments
in
Securities | | Other
Financial
Investments^ | | Investments
in
Securities | | Other
Financial
Investments^ | |
Victory CEMP US 500 Volatility Wtd Index Fund | |
Common
Stocks | | $ | 29,496,283 | | | $ | — | | | $ | — | | | $ | — | | | $ | — | | | $ | — | | | $ | 29,496,283 | | | $ | — | | |
Cash
Equivalents | | | — | | | | — | | | | 216,147 | | | | — | | | | — | | | | — | | | | 216,147 | | | | — | | |
Futures
Contracts | | | — | | | | (6,986 | ) | | | — | | | | — | | | | — | | | | — | | | | — | | | | (6,986 | ) | |
Total | | | 29,496,283 | | | | (6,986 | ) | | | 216,147 | | | | — | | | | — | | | | — | | | | 29,712,430 | | | | (6,986 | ) | |
202
Victory Portfolios II | | Notes to Financial Statements — continued
December 31, 2015 | |
(Unaudited)
| | | LEVEL 1 —
Quoted Prices | | LEVEL 2 —
Other Significant
Observable Inputs | | LEVEL 3 —
Other Significant
Unobservable Inputs | | Total | |
| | | Investments
in
Securities | | Other
Financial
Investments^ | | Investments
in
Securities | | Other
Financial
Investments^ | | Investments
in
Securities | | Other
Financial
Investments^ | | Investments
in
Securities | | Other
Financial
Investments^ | |
Victory CEMP US Small Cap Volatility Wtd Index Fund | |
Common
Stocks | | $ | 6,865,484 | | | $ | — | | | $ | — | | | $ | — | | | $ | — | | | $ | — | | | $ | 6,865,484 | | | $ | — | | |
Cash
Equivalents | | | — | | | | — | | | | 458,059 | | | | — | | | | — | | | | — | | | | 458,059 | | | | — | | |
Futures
Contracts | | | — | | | | (1,609 | ) | | | — | | | | — | | | | — | | | | — | | | | — | | | | (1,609 | ) | |
Total | | | 6,865,484 | | | | (1,609 | ) | | | 458,059 | | | | — | | | | — | | | | — | | | | 7,323,543 | | | | (1,609 | ) | |
Victory CEMP International Volatility Wtd Index Fund | |
Common
Stocks | | | 1,105,672 | (a) | | | — | | | | 7,413,002 | | | | — | | | | 483 | | | | — | | | | 8,519,157 | | | | — | | |
Futures
Contracts | | | — | | | | (9,321 | ) | | | — | | | | — | | | | — | | | | — | | | | — | | | | (9,321 | ) | |
Total | | | 1,105,672 | | | | (9,321 | ) | | | 7,413,002 | | | | — | | | | 483 | | | | — | | | | 8,519,157 | | | | (9,321 | ) | |
Victory CEMP Emerging Market Volatility Wtd Index Fund | |
Common
Stocks | | | 485,369 | (b) | | | — | | | | 9,724,689 | | | | — | | | | 30,954 | | | | — | | | | 10,241,012 | | | | — | | |
Rights | | | — | | | | — | | | | 266 | | | | — | | | | — | | | | — | | | | 266 | | | | — | | |
Cash
Equivalents | | | — | | | | — | | | | 1,640,043 | | | | — | | | | — | | | | — | | | | 1,640,043 | | | | — | | |
Futures
Contracts | | | — | | | | (2,162 | ) | | | — | | | | — | | | | — | | | | — | | | | — | | | | (2,162 | ) | |
Total | | | 485,369 | | | | (2,162 | ) | | | 11,364,998 | | | | — | | | | 30,954 | | | | — | | | | 11,881,321 | | | | (2,162 | ) | |
Victory CEMP US 500 Enhanced Volatility Wtd Index Fund | |
Common
Stocks | | | 192,127,016 | | | | — | | | | — | | | | — | | | | — | | | | — | | | | 192,127,016 | | | | — | | |
Cash
Equivalents | | | — | | | | — | | | | 1,453,405 | | | | — | | | | — | | | | — | | | | 1,453,405 | | | | — | | |
Futures
Contracts | | | — | | | | (5,530 | ) | | | — | | | | — | | | | — | | | | — | | | | — | | | | (5,530 | ) | |
Total | | | 192,127,016 | | | | (5,530 | ) | | | 1,453,405 | | | | — | | | | — | | | | — | | | | 193,580,421 | | | | (5,530 | ) | |
Victory CEMP International Enhanced Volatility Wtd Index Fund | |
Common
Stocks | | | 4,525,252 | (a) | | | — | | | | 29,879,417 | | | | — | | | | 1,799 | | | | — | | | | 34,406,468 | | | | — | | |
Futures
Contracts | | | — | | | | (8,274 | ) | | | — | | | | — | | | | — | | | | — | | | | — | | | | (8,274 | ) | |
Total | | | 4,525,252 | | | | (8,274 | ) | | | 29,879,417 | | | | — | | | | 1,799 | | | | — | | | | 34,406,468 | | | | (8,274 | ) | |
Victory CEMP REC Enhanced Volatility Wtd Index Fund | |
Common
Stocks | | | 9,318,852 | | | | — | | | | — | | | | — | | | | — | | | | — | | | | 9,318,852 | | | | — | | |
Futures
Contracts | | | — | | | | 110 | | | | — | | | | — | | | | — | | | | — | | | | — | | | | 110 | | |
Total | | | 9,318,852 | | | | 110 | | | | — | | | | — | | | | — | | | | — | | | | 9,318,852 | | | | 110 | | |
203
Victory Portfolios II | | Notes to Financial Statements — continued
December 31, 2015 | |
(Unaudited)
| | | LEVEL 1 —
Quoted Prices | | LEVEL 2 —
Other Significant
Observable Inputs | | LEVEL 3 —
Other Significant
Unobservable Inputs | | Total | |
| | | Investments
in
Securities | | Other
Financial
Investments^ | | Investments
in
Securities | | Other
Financial
Investments^ | | Investments
in
Securities | | Other
Financial
Investments^ | | Investments
in
Securities | | Other
Financial
Investments^ | |
Victory CEMP Commodity Volatility Wtd Index Strategy Fund | |
U.S. Treasury
Obligations | | $ | — | | | $ | — | | | $ | 5,886,864 | | | $ | — | | | $ | — | | | $ | — | | | $ | 5,886,864 | | | $ | — | | |
Cash
Equivalents | | | — | | | | — | | | | 2,429,455 | | | | — | | | | — | | | | — | | | | 2,429,455 | | | | — | | |
Futures
Contracts | | | — | | | | 21,588 | | | | — | | | | — | | | | — | | | | — | | | | — | | | | 21,588 | | |
Total | | | — | | | | 21,588 | | | | 8,316,319 | | | | — | | | | — | | | | — | | | | 8,316,319 | | | | 21,588 | | |
Victory CEMP Commodity Enhanced Volatility Wtd Index Strategy Fund | |
U.S. Treasury
Obligations | | | — | | | | — | | | | 4,441,709 | | | | — | | | | — | | | | — | | | | 4,441,709 | | | | — | | |
Cash
Equivalents | | | — | | | | — | | | | 945,760 | | | | — | | | | — | | | | — | | | | 945,760 | | | | — | | |
Futures
Contracts | | | — | | | | 19,395 | | | | — | | | | — | | | | — | | | | — | | | | — | | | | 19,395 | | |
Total | | | — | | | | 19,395 | | | | 5,387,469 | | | | — | | | | — | | | | — | | | | 5,387,469 | | | | 19,395 | | |
Victory CEMP Long/Short Strategy Fund | |
Common
Stocks | | | 11,575,453 | | | | — | | | | — | | | | — | | | | — | | | | — | | | | 11,575,453 | | | | — | | |
Cash
Equivalents | | | — | | | | — | | | | 3,091,112 | | | | — | | | | — | | | | — | | | | 3,091,112 | | | | — | | |
Futures
Contracts | | | — | | | | (4,613 | ) | | | — | | | | — | | | | — | | | | — | | | | — | | | | (4,613 | ) | |
Total | | | 11,575,453 | | | | (4,613 | ) | | | 3,091,112 | | | | — | | | | — | | | | — | | | | 14,666,565 | | | | (4,613 | ) | |
Victory CEMP Market Neutral Income Fund | |
Common
Stocks | | | 29,846,230 | | | | — | | | | 27,235,448 | | | | — | | | | — | | | | — | | | | 57,081,678 | | | | — | | |
Cash
Equivalents | | | — | | | | — | | | | 2,349,738 | | | | — | | | | — | | | | — | | | | 2,349,738 | | | | — | | |
Written
Options | | | — | | | | — | | | | — | | | | (145,738 | ) | | | — | | | | — | | | | — | | | | (145,738 | ) | |
Futures
Contracts | | | — | | | | (75,748 | ) | | | — | | | | — | | | | — | | | | — | | | | — | | | | (75,748 | ) | |
Total | | | 29,846,230 | | | | (75,748 | ) | | | 29,439,448 | | | | (145,738 | ) | | | — | | | | — | | | | 59,285,678 | | | | (221,486 | ) | |
Victory CEMP Enhanced Fixed Income Fund | |
U.S. Treasury
Obligations | | | — | | | | — | | | | 1,999,528 | | | | — | | | | — | | | | — | | | | 1,999,528 | | | | — | | |
Commercial
Papers | | | — | | | | — | | | | 1,149,639 | | | | — | | | | — | | | | — | | | | 1,149,639 | | | | — | | |
Futures
Contracts | | | — | | | | 404 | | | | — | | | | — | | | | — | | | | — | | | | — | | | | 404 | | |
Total | | | — | | | | 404 | | | | 3,149,167 | | | | — | | | | — | | | | — | | | | 3,149,167 | | | | 404 | | |
204
Victory Portfolios II | | Notes to Financial Statements — continued
December 31, 2015 | |
(Unaudited)
| | | LEVEL 1 —
Quoted Prices | | LEVEL 2 —
Other Significant
Observable Inputs | | LEVEL 3 —
Other Significant
Unobservable Inputs | | Total | |
| | | Investments
in
Securities | | Other
Financial
Investments^ | | Investments
in
Securities | | Other
Financial
Investments^ | | Investments
in
Securities | | Other
Financial
Investments^ | | Investments
in
Securities | | Other
Financial
Investments^ | |
Victory CEMP Ultra Short Term Fixed Income Fund | |
U.S. Treasury
Obligations | | $ | — | | | $ | — | | | $ | 5,483,136 | | | $ | — | | | $ | — | | | $ | — | | | $ | 5,483,136 | | | $ | — | | |
Commercial
Papers | | | — | | | | — | | | | 4,097,701 | | | | — | | | | — | | | | — | | | | 4,097,701 | | | | — | | |
Cash
Equivalents | | | — | | | | — | | | | 820,667 | | | | — | | | | — | | | | — | | | | 820,667 | | | | — | | |
Total | | | — | | | | — | | | | 10,401,504 | | | | — | | | | — | | | | — | | | | 10,401,504 | | | | — | | |
Victory CEMP Multi-Asset Balanced Fund | |
Affiliated
Exchange-
Traded
Funds | | | 3,391,030 | | | | — | | | | — | | | | — | | | | — | | | | — | | | | 3,391,030 | | | | — | | |
Affiliated
Mutual
Funds | | | 17,846,062 | | | | — | | | | 6,506,343 | | | | — | | | | — | | | | — | | | | 24,352,405 | | | | — | | |
Cash
Equivalents | | | — | | | | — | | | | 672,913 | | | | — | | | | — | | | | — | | | | 672,913 | | | | — | | |
Total | | | 21,237,092 | | | | — | | | | 7,179,256 | | | | — | | | | — | | | | — | | | | 28,416,348 | | | | — | | |
Victory CEMP Multi-Asset Growth Fund | |
Affiliated
Exchange-
Traded
Funds | | | 9,610,161 | | | | — | | | | — | | | | — | | | | — | | | | — | | | | 9,610,161 | | | | — | | |
Cash
Equivalents | | | — | | | | — | | | | 6,532,478 | | | | — | | | | — | | | | — | | | | 6,532,478 | | | | — | | |
Total | | | 9,610,161 | | | | — | | | | 6,532,478 | | | | — | | | | — | | | | — | | | | 16,142,639 | | | | — | | |
Victory CEMP Alternative Strategies Fund | |
Affiliated
Mutual
Funds | | | 27,173,048 | | | | — | | | | — | | | | — | | | | — | | | | — | | | | 27,173,048 | | | | — | | |
Cash
Equivalents | | | — | | | | — | | | | 582,658 | | | | — | | | | — | | | | — | | | | 582,658 | | | | — | | |
Total | | | 27,173,048 | | | | — | | | | 582,658 | | | | — | | | | — | | | | — | | | | 27,755,706 | | | | — | | |
^ Other Financial instruments include any derivative instruments not reflected in the Schedules of Portfolio Investments as Investment Securities, such as futures contracts and written options. These instruments are generally recorded in the financial statements at the unrealized gain or loss on the investment.
(a) Consists of holdings: All ADRs traded on U.S. securities exchanges and all securities listed under Canada.
(b) Consists of holdings: All ADRs traded on U.S. securities exchanges and all securities listed under Mexico.
205
Victory Portfolios II | | Notes to Financial Statements — continued
December 31, 2015 | |
(Unaudited)
Significant transfers occurred between Levels 1 and 2 based on recognition dates of June 30, 2015 and December 31, 2015. The Funds' current policy is to look through to the underlying investments in Investment Companies to determine the ASC 820 Level. On June 30, 2015, all international securities, except as noted above, were fair valued and are listed as Level 2 investments.
| | Transfer from
Level 1 to Level 2 | | Transfer from
Level 2 to Level 1 | |
Victory CEMP International Volatility Wtd Index Fund | |
Common Stocks | | $ | — | | | $ | 6,344,434 | | |
Victory CEMP Emerging Market Volatility Wtd Index Fund | |
Common Stocks | | | — | | | | 7,739,191 | | |
Victory CEMP International Enhanced Volatility Wtd Index Fund | |
Common Stocks | | | — | | | | 25,572,130 | | |
Victory CEMP Market Neutral Income Fund | |
Common Stocks | | | 1,233,250 | | | | 2,934,301 | | |
The following is a reconciliation of assets in which significant unobservable inputs (Level 3) were used in determining fair value:
| | Victory CEMP
Emerging
Market
Volatility Wtd
Index Fund | | Victory CEMP
International
Enhanced
Volatility Wtd
Index Fund | | Victory CEMP
International
Volatility Wtd
Index Fund | |
Investments in Securities | | Common Stocks | | Common Stocks | | Common Stocks | |
Balance as of June 30, 2015 | | $ | 14,166 | | | $ | — | | | $ | — | | |
Realized Gain/(Loss) | | | — | | | | — | | | | — | | |
Change in Unrealized Appreciation/
(Depreciation) | | | (2,233 | ) | | | — | | | | — | | |
Purchases | | | — | | | | — | | | | — | | |
Sales Proceeds | | | — | | | | — | | | | — | | |
Transfer into Level 3 | | | 19,021 | | | | 1,799 | | | | 483 | | |
Transfer out of Level 3 | | | — | | | | — | | | | — | | |
Balance as of December 31, 2015 | | $ | 30,954 | | | $ | 1,799 | | | $ | 483 | | |
Exchange Traded Funds:
Each Fund may invest in exchange-traded funds ("ETFs"). ETFs are a type of index fund bought and sold on a securities exchange. An ETF trades like common stock and represents a fixed portfolio of securities designed to track the performance and dividend yield of a particular domestic or foreign market index. The Fund may purchase an ETF to temporarily gain exposure to a portion of the U.S. or a foreign market while awaiting purchase of underlying securities. The risks of owning an ETF generally reflect the risks of owning the underlying securities they are designed to track, although the lack of liquidity on an ETF could result in it being more volatile. Additionally, ETFs have fees and expenses that reduce their value.
Investment Companies:
Each Fund may invest in portfolios of open-end or closed-end investment companies (the "Underlying Funds"). The Underlying Funds value securities in their portfolios for which market quotations are readily available at their market values (generally the last reported sale price) and
206
Victory Portfolios II | | Notes to Financial Statements — continued
December 31, 2015 | |
(Unaudited)
all other securities and assets at their fair value by the methods established by the board of directors of the Underlying Funds.
Open-end funds are valued at their respective net asset values as reported by such investment companies. The shares of many closed-end investment companies, after their initial public offering, frequently trade at a price per share which is different than the net asset value per share. The difference represents a market premium or market discount of such shares. There can be no assurances that the market discount or market premium on shares of any closed-end investment company purchased by the Funds will not change.
Foreign Currency Contracts:
Each Fund may enter into foreign currency exchange contracts in order to hedge against foreign currency exchange rate risks or as an investment strategy consistent with that Fund's investment objective. A foreign currency contract is an obligation by a Fund to purchase or sell a specific currency at a future date at a price (in U.S. dollars) set at the time of the contract. The Funds' foreign currency contracts might be considered spot contracts (typically a contract of one week or less) or forward contract (typically a contract term over one week). A spot contract is entered into for purposes of hedging against foreign currency fluctuations relating to a specific portfolio transaction, such as the delay between a security transaction trade date and settlement date. Forward contracts are entered into for purposes of hedging portfolio holdings or concentrations of such holdings. Each foreign currency contract is adjusted daily by the prevailing spot or forward rate of the underlying currency, and any appreciation or depreciation is recorded for financial statement purposes as unrealized until the contract settlement date, at which time the Fund records realized gains or losses equal to the difference between the value of a contract at the time it was opened and the value at the time it was closed. A Fund could be exposed to risk if a counterparty is unable to meet the terms of a forward foreign currency contract or if the value of the foreign currency changes unfavorably. In addition, the use of forward currency contracts does not eliminate fluctuations in the underlying prices of the securities. As of December 31, 2015, the Funds had no open forward foreign currency contracts
Option Transactions:
Each Fund may purchase or sell options to aid in hedging against equity price risk incurred in the normal course of pursuing its investment objective. When the Fund writes a call option, an amount equal to the premium received is included in the statement of assets and liabilities as a liability. The amount of the liability is subsequently marked-to-market to reflect the current market value of the option. If an option expires on its stipulated expiration date or if the Fund enters into a closing purchase transaction, a gain or loss is realized. If a written call option is exercised, a gain or loss is realized for the sale of the underlying security and the proceeds from the sale are increased by the premium originally received. As a writer of an option, the Fund has no control over whether the option will be exercised and, as a result, retains the market risk of an unfavorable change in the price of the security underlying the written option.
Each Fund may purchase put and call options. Put options are purchased to hedge against a decline in the value of securities held in the Fund's portfolio. If such a decline occurs, the put options will permit the Fund to sell the securities underlying such options at the exercise price, or to close out the options at a profit. The premium paid for a put or call option plus any transaction costs will reduce the benefit, if any, realized by the Fund upon exercise of the option, and, unless the price of the underlying security rises or declines sufficiently, the option may expire worthless to the Fund. In addition, in the event that the price of the security in connection with which an option was purchased moves in a direction favorable to the Fund, the benefits realized by the Fund as a result of such favorable movement will be reduced by the amount of the premium paid for the option and related transaction costs. Written and purchased options are non-income producing securities. With purchased options, there is minimal counterparty risk to the Fund since these options are exchange traded.
207
Victory Portfolios II | | Notes to Financial Statements — continued
December 31, 2015 | |
(Unaudited)
The number of put option contracts written and the premiums received by the Funds during the six months ended December 31, 2015, were as follows:
| | | Victory CEMP Market Neutral Fixed
Income Fund | |
| | | Number of Contracts | | Premiums Received | |
Options outstanding, beginning of year | | | 204 | | | $ | 267,745 | | |
Options written | | | 1,197 | | | | 1,948,503 | | |
Options exercised | | | (130 | ) | | | (305,500 | ) | |
Options expired | | | — | | | | — | | |
Options closed | | | (1,140 | ) | | | (1,619,800 | ) | |
Options outstanding, end of year | | | 131 | | | $ | 290,948 | | |
Futures Contracts:
Each Fund may enter into contracts to hedge or manage risks associated with the Funds' security investments or to gain exposure to certain asset classes or markets. A futures contract on a securities index is an agreement obligating either party to pay, and entitling the other party to receive, while the contract is outstanding, cash payments based on the level of a specific securities index. No physical delivery of the underlying asset is made. A Fund may enter into futures contracts in an effort to hedge against market risks. Futures transactions involve brokerage costs and require the Fund to segregate assets to cover contracts that would require it to purchase securities or currencies. A good faith margin deposit, known as initial margin, of cash or government securities with a broker or custodian is required to initiate and maintain open positions in futures contracts. Subsequent payments, known as variation margin, are made or received by the Fund based on the change in the market value of the position are recorded as unrealized appreciation or depreciation until the contract is closed out at which time the gain or loss is realized. A Fund may lose the expected benefit of futures transactions if interest rates, exchange rates or securities prices change in an unanticipated matter. Such unanticipated changes may also result in lower overall performance than if the Fund had not entered into any futures transactions. In addition, the value of a Fund's future positions may not prove to be perfectly or even highly correlated with the value of its portfolio securities or foreign currencies, limiting a Fund's ability to hedge effectively against interest rate, exchange rate and/or market risk and giving rise to additional risks. There is no assurance of liquidity in the secondary market for purposes of closing out futures positions.
Summary of Derivative Instruments:
The following table summarizes the fair values of derivative instruments on the Statement of Assets and Liabilities, categorized by risk exposure, as of December 31, 2015.
Risk Exposure | | Asset Location | | Fair Value | | Liability Locations | | Fair Value | |
Victory CEMP US 500 Volatility Wtd Index Fund | |
Equity Contracts
(Futures) | | Unrealized appreciation
on variation margin | | $ | — | | | Unrealized depreciation
on variation margin | | $ | 3,962 | | |
Victory CEMP US Small Cap Volatility Wtd Index Fund | |
Equity Contracts
(Futures) | | Unrealized appreciation
on variation margin | | $ | — | | | Unrealized depreciation
on variation margin | | $ | 6,718 | | |
Victory CEMP International Volatility Wtd Index Fund | |
Equity Contracts
(Futures) | | Unrealized appreciation
on variation margin | | $ | — | | | Unrealized depreciation
on variation margin | | $ | 12,405 | | |
Victory CEMP Emerging Market Volatility Wtd Index Fund | |
Equity Contracts
(Futures) | | Unrealized appreciation
on variation margin | | $ | — | | | Unrealized depreciation
on variation margin | | $ | 1,700 | | |
208
Victory Portfolios II | | Notes to Financial Statements — continued
December 31, 2015 | |
(Unaudited)
Risk Exposure | | Asset Location | | Fair Value | | Liability Locations | | Fair Value | |
Victory CEMP US 500 Enhanced Volatility Wtd Index Fund | |
Equity Contracts
(Futures) | | Unrealized appreciation
on variation margin | | $ | — | | | Unrealized depreciation
on variation margin | | $ | 15,603 | | |
Victory CEMP International Enhanced Volatility Wtd Index Fund | |
Equity Contracts
(Futures) | | Unrealized appreciation
on variation margin | | $ | — | | | Unrealized depreciation
on variation margin | | $ | 13,743 | | |
Victory CEMP REC Enhanced Volatility Wtd Index Fund | |
Equity Contracts
(Futures) | | Unrealized appreciation
on variation margin | | $ | — | | | Unrealized depreciation
on variation margin | | $ | 540 | | |
Victory CEMP Commodity Volatility Wtd Index Strategy Fund | |
Commodity
Contracts
(Futures) | | Unrealized appreciation
on variation margin | | $ | 21,201 | | | Unrealized depreciation
on variation margin | | $ | 25,401 | | |
Victory CEMP Commodity Enhanced Volatility Wtd Index Strategy Fund | |
Commodity
Contracts
(Futures) | | Unrealized appreciation
on variation margin | | $ | 21,373 | | | Unrealized depreciation
on variation margin | | $ | 18,724 | | |
Victory CEMP Long/Short Strategy Fund | |
Equity Contracts
(Futures) | | Unrealized appreciation
on variation margin | | $ | 43,200 | | | Unrealized depreciation
on variation margin | | $ | — | | |
Victory CEMP Market Neutral Income | |
Equity Contracts
(Futures) | | Unrealized appreciation
on variation margin | | $ | 658,440 | | | Unrealized depreciation
on variation margin | | $ | 228,015 | | |
Equity Contracts
(Written Options) | | N/A | | | N/A | | | Written options, at value | | $ | 145,738 | | |
Victory CEMP Enhanced Fixed Income Fund | |
Equity Contracts
(Futures) | | Unrealized appreciation
on variation margin | | $ | 1,809 | | | Unrealized depreciation
on variation margin | | $ | — | | |
The following table presents the effect of derivative instruments on the Statement of Operations, categorized by risk exposure, for the six months ended December 31, 2015.
Risk Exposure | | Statement of Operations | | Realized
Gains (Losses)
on Derivatives
Recognized
in Income | | Change in
Unrealized
Appreciation
(Depreciation)
on Derivatives
Recognized
in Income | |
Victory CEMP US 500 Volatility Wtd Index Fund | |
Equity Contracts
(Futures)
| | Net realized gains (losses) on future
contracts/Net change in unrealized
appreciation (depreciation) on
future contracts | | $ | 15,183 | | | $ | 11,714 | | |
Victory CEMP US Small Cap Volatility Wtd Index Fund | |
Equity Contracts
(Futures)
| | Net realized gains (losses) on future
contracts/Net change in unrealized
appreciation (depreciation) on
future contracts | | $ | (88,508 | ) | | $ | 2,992 | | |
Victory CEMP International Volatility Wtd Index Fund | |
Equity Contracts
(Futures)
| | Net realized gains (losses) on future
contracts/Net change in unrealized
appreciation (depreciation) on
future contracts | | $ | (63,333 | ) | | $ | 19,459 | | |
209
Victory Portfolios II | | Notes to Financial Statements — continued
December 31, 2015 | |
(Unaudited)
Risk Exposure | | Statement of Operations | | Realized
Gains (Losses)
on Derivatives
Recognized
in Income | | Change in
Unrealized
Appreciation
(Depreciation)
on Derivatives
Recognized
in Income | |
Victory CEMP Emerging Market Volatility Wtd Index Fund | |
Equity Contracts
(Futures)
| | Net realized gains (losses) on future
contracts/Net change in unrealized
appreciation (depreciation) on
future contracts | | $ | (447,510 | ) | | $ | 9,679 | | |
Victory CEMP US 500 Enhanced Volatility Wtd Index Fund | |
Equity Contracts
(Futures)
| | Net realized gains (losses) on future
contracts/Net change in unrealized
appreciation (depreciation) on
future contracts | | $ | 19,473 | | | $ | 77,308 | | |
Victory CEMP International Enhanced Volatility Wtd Index Fund | |
Equity Contracts
(Futures)
| | Net realized gains (losses) on future
contracts/Net change in unrealized
appreciation (depreciation) on
future contracts | | $ | (348,608 | ) | | $ | 74,336 | | |
Victory CEMP REC Enhanced Volatility Wtd Index Fund | |
Equity Contracts
(Futures)
| | Net realized gains (losses) on future
contracts/Net change in unrealized
appreciation (depreciation) on
future contracts | | $ | (53,112 | ) | | $ | 25,830 | | |
Victory CEMP Commodity Volatility Wtd Index Strategy Fund | |
Commodity
Contracts
(Futures)
| | Net realized gains (losses) on future
contracts/Net change in unrealized
appreciation (depreciation) on
future contracts | | $ | (1,756,089 | ) | | $ | (32,022 | ) | |
Victory CEMP Commodity Enhanced Volatility Wtd Index Strategy Fund | |
Commodity
Contracts
(Futures)
| | Net realized gains (losses) on future
contracts/Net change in unrealized
appreciation (depreciation) on
future contracts | | $ | (966,985 | ) | | $ | (5,531 | ) | |
Victory CEMP Long/Short Strategy Fund | |
Equity Contracts
(Futures)
| | Net realized gains (losses) on future
contracts/Net change in unrealized
appreciation (depreciation) on
future contracts | | $ | 124,586 | | | $ | (124,763 | ) | |
Victory CEMP Market Neutral Income Fund | |
Equity Contracts
(Futures)
| | Net realized gains (losses) on future
contracts/Net change in unrealized
appreciation (depreciation) on
future contracts | | $ | 4,511,740 | | | $ | (1,177,487 | ) | |
Equity Contracts
(Purchased Options)
| | Net realized gain (losses) from
investment transactions/Net change
in unrealized appreciation
(depreciation) on investments | | $ | 4,905 | | | $ | (4,050 | ) | |
Equity Contracts
(Written Options)
| | Net realized gains (losses) on written
options/Net change in unrealized
appreciation (depreciation) on
written options | | $ | 1,176,791 | | | $ | 502,215 | | |
210
Victory Portfolios II | | Notes to Financial Statements — continued
December 31, 2015 | |
(Unaudited)
Risk Exposure | | Statement of Operations | | Realized
Gains (Losses)
on Derivatives
Recognized
in Income | | Change in
Unrealized
Appreciation
(Depreciation)
on Derivatives
Recognized
in Income | |
Victory CEMP Enhanced Fixed Income Fund | |
Equity Contracts
(Futures)
| | Net realized gains (losses) on future
contracts/Net change in unrealized
appreciation (depreciation) on
future contracts | | $ | (68,296 | ) | | $ | 8,272 | | |
All open derivative positions at period end are reflected on each respective Fund's Schedule of Portfolio Investments. The notional amount of open derivative positions relative to each Fund's net assets at period end is generally representative of the notional amount of open positions to net assets through the period. For the six months ended December 31, 2015, the Victory CEMP Enhanced Fixed Income Fund had an average notional amount of $10,191,585.
Investment Transactions and Related Income:
Changes in holdings of investments are accounted for no later than one business day following the trade date. For financial reporting purposes, however, investment transactions are accounted for on trade date on the last business day of the reporting period. Interest income is recognized on an accrual basis and includes, where applicable, the amortization of premium or accretion of discount. Dividend income is recorded on the ex-dividend date. Gains or losses realized on sales of securities are determined by comparing the identified cost of the security lot sold with the net sales proceeds.
Withholding taxes on dividends as a result of certain investments in foreign securities by the Funds have been provided for in accordance with each investment's applicable country's tax rules and rates.
Foreign Currency Translations:
The accounting records of the Funds are maintained in U.S. dollars. Investment securities and other assets and liabilities of a Fund denominated in a foreign currency are translated into U.S. dollars at current exchange rates. Purchases and sales of securities, income receipts and expense payments are translated into U.S. dollars at the exchange rates on the date of the transaction. The Funds do not isolate the portion of the results of operations resulting from changes in foreign exchange rates on investments from fluctuations arising from changes in market prices of securities held. Such fluctuations are included with the change in unrealized appreciation/depreciation on investments. Any realized gain or loss from these fluctuations are disclosed as net realized gains or losses from foreign currency translations on the Statements of Operations.
Distributions to Shareholders:
Each of the Funds (except the Victory CEMP REC Enhanced Volatility Wtd Index Fund, Victory CEMP Ultra Short Term Fixed Income Fund, Balanced Fund, Growth Fund, and Alternative Fund) declare and distribute dividends from net investment income at least quarterly, if any. The Victory CEMP REC Enhanced Volatility Wtd Index Fund and Victory CEMP Ultra Short Term Fixed Income Fund declare and distribute dividends from net investment income monthly, if any. The Balanced Fund, Growth Fund, and Alternative Fund declare and distribute dividends from net investment income at least annually, if any. Distributable net realized gains, if any, are declared and distributed at least annually.
The amounts of dividends from net investment income and distributions from net realized gains are determined in accordance with federal income tax regulations, which may differ from GAAP. These "book/tax" differences are either considered temporary or permanent in nature. To the extent these differences are permanent in nature, such amounts are reclassified within the components of net assets based on their federal tax-basis treatment; temporary differences (e.g., wash sales) do
211
Victory Portfolios II | | Notes to Financial Statements — continued
December 31, 2015 | |
(Unaudited)
not require reclassification. To the extent dividends and distributions exceed net investment income and net realized gains for tax purposes, they are reported as distributions of capital. Net investment losses incurred by a Fund may be reclassified as an offset to capital on the accompanying Statements of Assets and Liabilities.
Federal Income Taxes:
It is the policy of each Fund to continue to qualify, except as described below, as a regulated investment company by complying with the provisions available to certain investment companies, as defined in applicable sections of the Internal Revenue Code, and to make distributions of net investment income and net realized gains sufficient to relieve it from all, or substantially all, federal income taxes. The Funds have a tax year end of June 30.
During the year ended November 30, 2012, the Balanced Fund inadvertently failed to distribute to its shareholders its undistributed ordinary taxable income from the year ended November 30, 2011, resulting in the Balanced Fund failing to meet the distribution requirements under Subchapter M of the Internal Revenue Code and causing its status as a RIC to terminate. The Internal Revenue Code contains curative provisions that allowed the Balanced Fund to re-establish its status as a RIC retroactive to the year ended November 30, 2011. In order to qualify for this relief, the Balanced Fund paid to its shareholders a "deficiency dividend" and will need to pay interest and penalties to the Internal Revenue Service. The interest and penalties on the deficiency dividend will not be borne by the Balanced Fund and will be reimbursed by the Administrator. As of June 30, 2015 interest and penalties are estimated to be $224,411.
Management of the Funds has reviewed tax positions taken in tax years that remain subject to examination by all major tax jurisdictions, including federal (i.e., the last four tax year ends and the interim tax period since then). Management believes that there is no tax liability resulting from unrecognized tax benefits related to uncertain tax positions taken.
Other:
Expenses that are directly related to a Fund are charged directly to that Fund. Other operating expenses of the Trust are prorated to each Fund in the Trust, or jointly with an affiliated truston the basis of relative net assets or another appropriate basis.
Income, expenses (other than class specific expenses such as transfer agent fees, state registration fees, printing and 12b-1 fees), realized and unrealized gains or losses on investments of a Fund are allocated to each class of shares based upon relative net assets on the date income is earned or expenses and realized and unrealized gains and losses are incurred.
Subsequent Events:
The Victory CEMP REC Enhanced Volatility Wtd Index Fund, Victory CEMP Enhanced Fixed Income Fund and Victory CEMP Ultra Short Term Fixed Income Fund are expected to liquidate on or about February 26, 2016.
3. Purchases and Sales of Securities:
Purchases and sales of securities (excluding securities maturing less than one year from acquisition) for the period ended December 31, 2015 were as follows:
| | Purchases
(excluding U.S.
Government
Securities) | | Sales
(excluding U.S.
Government
Securities) | | Purchases
of U.S.
Government
Securities | | Sales
of U.S.
Government
Securities | |
Victory CEMP US 500 Volatility
Wtd Index Fund | | $ | 13,156,614 | | | $ | 9,368,453 | | | $ | — | | | $ | — | | |
Victory CEMP US Small Cap Volatility
Wtd Index Fund | | | 13,223,066 | | | | 12,892,585 | | | | — | | | | — | | |
Victory CEMP International Volatility
Wtd Index Fund | | | 7,705,159 | | | | 13,265,522 | | | | — | | | | — | | |
212
Victory Portfolios II | | Notes to Financial Statements — continued
December 31, 2015 | |
(Unaudited)
| | Purchases
(excluding U.S.
Government
Securities) | | Sales
(excluding U.S.
Government
Securities) | | Purchases
of U.S.
Government
Securities | | Sales
of U.S.
Government
Securities | |
Victory CEMP Emerging Market
Volatility Wtd Index Fund | | $ | 12,560,245 | | | $ | 9,737,326 | | | $ | — | | | $ | — | | |
Victory CEMP US 500 Enhanced
Volatility Wtd Index Fund | | | 44,739,374 | | | | 54,700,969 | | | | — | | | | — | | |
Victory CEMP International Enhanced
Volatility Wtd Index Fund | | | 47,436,480 | | | | 25,021,115 | | | | — | | | | — | | |
Victory CEMP REC Enhanced
Volatility Wtd Index Fund | | | 27,653,513 | | | | 36,695,330 | | | | — | | | | — | | |
Victory CEMP Commodity Volatility
Wtd Index Strategy Fund | | | 4,448,359 | | | | 20,171,993 | | | | 499,453 | | | | — | | |
Victory CEMP Commodity Enhanced
Volatility Wtd Index Strategy Fund | | | — | | | | 366,705 | | | | 499,453 | | | | — | | |
Victory CEMP Long/Short Strategy
Fund | | | 6,118,676 | | | | 7,999,411 | | | | — | | | | — | | |
Victory CEMP Market Neutral
Income Fund | | | 36,154,570 | | | | 23,458,627 | | | | — | | | | — | | |
Victory CEMP Enhanced Fixed
Income Fund | | | — | | | | 3,436,866 | | | | — | | | | — | | |
Victory CEMP Ultra Short Term
Fixed Income Fund | | | — | | | | — | | | | — | | | | — | | |
Balanced Fund | | | 10,820,523 | | | | 13,514,617 | | | | — | | | | — | | |
Growth Fund | | | 12,973,843 | | | | 14,303,038 | | | | — | | | | — | | |
Alternative Strategies Fund | | | 20,177,407 | | | | 23,129,227 | | | | — | | | | — | | |
4. Fees and Transactions with Affiliates and Related Parties:
Investment advisory services are provided to the Funds by VCM, a New York corporation registered as an investment adviser with the Securities and Exchange Commission. The Adviser is a wholly owned subsidiary of Victory Capital Holdings, Inc. ("VCH"). A majority of the interest in VCH is owned by Crestview Partners II, L.P. and its affiliated funds with the remaining portion owned by Victory employees and a limited number of outside investors.
Under the terms of the Investment Advisory Agreement (the "Advisory Agreement"), the Adviser is entitled to receive fees based on a percentage of the average daily assets of each Fund. The rates at which the Adviser is paid by each Fund are included in the table below. The Adviser does not receive any management fees from the Balanced Fund, Growth Fund, or Alternative Strategies Fund. The Adviser may use its resources to assist with the Funds' distribution and marketing expenses.
| | | Adviser Fee Rate | |
Victory CEMP US 500 Volatility Wtd Index Fund | | | 0.70 | % | |
Victory CEMP US Small Cap Volatility Wtd Index Fund | | | 0.70 | % | |
Victory CEMP International Volatility Wtd Index Fund | | | 0.80 | % | |
Victory CEMP Emerging Market Volatility Wtd Index Fund | | | 0.85 | % | |
Victory CEMP US 500 Enhanced Volatility Wtd Index Fund | | | 0.70 | % | |
Victory CEMP International Enhanced Volatility Wtd Index Fund | | | 0.80 | % | |
Victory CEMP REC Enhanced Volatility Wtd Index Fund | | | 1.05 | % | |
Victory CEMP Commodity Volatility Wtd Index Strategy Fund | | | 0.80 | % | |
Victory CEMP Commodity Enhanced Volatility Wtd Index Strategy Fund | | | 0.80 | % | |
| Victory CEMP Long/Short Strategy Fund | | | 1.15 | % | |
| Victory CEMP Market Neutral Income Fund | | | 0.60 | % | |
Victory CEMP Enhanced Fixed Income Fund | | | 0.40 | % | |
Victory CEMP Ultra Short Term Fixed Income Fund | | | 0.40 | % | |
213
Victory Portfolios II | | Notes to Financial Statements — continued
December 31, 2015 | |
(Unaudited)
Effective November 2, 2015, VCM also serves as the Funds' administrator and fund accountant. Under an Administration and Fund Accounting Agreement, VCM is paid for its services based on the average daily net assets of the Trust, Victory Portfolios Trust and Variable Insurance Funds (collectively, the "Trusts"):
Prior to November 2, 2015 (November 9, 2015 for transfer agent), Gemini Fund Services, LLC ("GFS") served as the Funds' administrator, fund accountant, and transfer agent. Under an Investment Company Services Agreement (the "Services Agreement'), GFS was paid for its services based on the average daily net assets of the Trust. GFS also received other transaction-based charges from the Trust and was reimbursed for all reasonable out-of pocket expenses incurred in providing these services.
Effective November 9, 2015, SunGard Investor Services LLC acts as the Funds' transfer agent. The Funds also pay fees to certain intermediaries or financial institutions for record keeping, sub-accounting services, transfer agency and other administrative services. Fees paid to GFS, SunGard Investor Services LLC and other intermediaries or financial institutions for these services for the six months ended December 31, 2015 are reflected on the Statements of Operations as Transfer agent fees.
Victory Capital Advisers, Inc. (the "Distributor"), an affiliate of the Adviser, serves as distributor for the continuous offering of shares of the Funds pursuant to a Distribution Agreement between the Distributor and the Trust. Prior to November 2, 2015 Northern Lights Distributors, LLC served as distributor.
Pursuant to the Distribution and Service Plans adopted in accordance with Rule 12b-1 under the 1940 Act, the Distributor may receive a monthly distribution and service fee, at an annual rate of up to 0.25% and 1.00% of the average daily net assets for Class A and Class C Shares of each of the respective Funds. The distribution and service fees paid to the Distributor may be used by the Distributor to pay for activities primarily intended to result in the sale of Class A or Class C Shares of the Funds.
In addition, the Distributor is entitled to receive commission on the sales of Class A Shares. For the period ended December 31, 2015, the Distributor received approximately $37,635 from commissions earned on sales of Class A Shares. A $15 redemption fee may be charged for redemptions made by wire. The redemption fee is paid directly to and retained by the Funds, and is designed to deter excessive short-term trading and to offset brokerage commissions, market impact and other costs that may be associated with short- term money movement in and out of the Funds.
The Adviser has entered into contractual expense limitation agreements with certain Funds. Under the terms of the agreements, to the extent that ordinary operating expenses incurred by certain classes of a Fund in any fiscal year exceed the annual expense limits as listed below for such classes of the Fund, such excess amount will be the liability of the Adviser. Interest, taxes, brokerage commissions, other expenditures which are capitalized in accordance with GAAP, and other extraordinary expenses not incurred in the ordinary course of a Fund's business are excluded from the expense limitation agreement. As of December 31, 2015, the expense limits are as follows:
| | | In Effect Until At Least October 31, 2017 | |
| | | Class A | | Class C | | Class I | |
Victory CEMP US 500 Volatility Wtd Index Fund | | | 0.99 | % | | | 1.74 | % | | | 0.74 | % | |
Victory CEMP US Small Cap Volatility Wtd Index
Fund | | | 0.99 | % | | | 1.74 | % | | | 0.74 | % | |
Victory CEMP International Volatility Wtd Index
Fund | | | 1.10 | % | | | 1.85 | % | | | 0.85 | % | |
Victory CEMP Emerging Market Volatility Wtd
Index Fund | | | 1.15 | % | | | 1.90 | % | | | 0.90 | % | |
Victory CEMP US 500 Enhanced Volatility Wtd
Index Fund | | | 0.99 | % | | | 1.74 | % | | | 0.74 | % | |
Victory CEMP International Enhanced Volatility
Wtd Index Fund | | | 1.10 | % | | | 1.85 | % | | | 0.85 | % | |
214
Victory Portfolios II | | Notes to Financial Statements — continued
December 31, 2015 | |
(Unaudited)
| | | In Effect Until At Least October 31, 2017 | |
| | | Class A | | Class C | | Class I | |
Victory CEMP REC Enhanced Volatility Wtd
Index Fund | | | 1.46 | % | | | 2.21 | % | | | 1.21 | % | |
Victory CEMP Commodity Volatility Wtd Index
Strategy Fund | | | 1.10 | % | | | 1.85 | % | | | 0.85 | % | |
Victory CEMP Commodity Enhanced Volatility
Wtd Index Strategy Fund | | | 1.10 | % | | | 1.85 | % | | | 0.85 | % | |
Victory CEMP Long/Short Strategy Fund | | | 1.45 | % | | | 2.20 | % | | | 1.20 | % | |
Victory CEMP Market Neutral Income Fund | | | 0.90 | % | | | 1.65 | % | | | 0.65 | % | |
Victory CEMP Enhanced Fixed Income Fund | | | 0.71 | % | | | 1.46 | % | | | 0.46 | % | |
The Funds have agreed to repay fees that were waived or reimbursed by the Adviser for a period up to three fiscal years after such waiver or reimbursement was made. Such repayments shall be made only to the extent that such repayments would not cause current annualized operating expenses of the Fund to exceed the original expense limit for the applicable period. As of December 31, 2015, the following amounts are available to be repaid to the Adviser. Amounts repaid to the Adviser during the year, if any, are reflected on the Statements of Operations as "Recoupment of prior expenses waiver/reimbursed by Adviser".
| Fund | | Amount
Waived or
Reimbursed
Available to
Recoup | | Expires
June 30, | |
Victory CEMP US 500 Volatility Wtd Index Fund | | $ | 22,927 | | | | 2016 | | |
Victory CEMP US 500 Volatility Wtd Index Fund | | | 60,111 | | | | 2017 | | |
Victory CEMP US 500 Volatility Wtd Index Fund | | | 97,927 | | | | 2018 | | |
Victory CEMP US 500 Volatility Wtd Index Fund | | | 61,903 | | | | 2019 | | |
Victory CEMP US Small Cap Volatility Wtd Index Fund | | $ | 20,528 | | | | 2016 | | |
Victory CEMP US Small Cap Volatility Wtd Index Fund | | | 62,236 | | | | 2017 | | |
Victory CEMP US Small Cap Volatility Wtd Index Fund | | | 65,552 | | | | 2018 | | |
Victory CEMP US Small Cap Volatility Wtd Index Fund | | | 43,413 | | | | 2019 | | |
Victory CEMP International Volatility Wtd Index Fund | | $ | 109,220 | | | | 2016 | | |
Victory CEMP International Volatility Wtd Index Fund | | | 156,294 | | | | 2017 | | |
Victory CEMP International Volatility Wtd Index Fund | | | 177,626 | | | | 2018 | | |
Victory CEMP International Volatility Wtd Index Fund | | | 86,379 | | | | 2019 | | |
Victory CEMP Emerging Market Volatility Wtd Index Fund | | $ | 150,002 | | | | 2016 | | |
Victory CEMP Emerging Market Volatility Wtd Index Fund | | | 282,199 | | | | 2017 | | |
Victory CEMP Emerging Market Volatility Wtd Index Fund | | | 245,843 | | | | 2018 | | |
Victory CEMP Emerging Market Volatility Wtd Index Fund | | | 121,680 | | | | 2019 | | |
Victory CEMP REC Enhanced Volatility Wtd Index Fund | | $ | 10,798 | | | | 2016 | | |
Victory CEMP REC Enhanced Volatility Wtd Index Fund | | | 55,433 | | | | 2017 | | |
Victory CEMP REC Enhanced Volatility Wtd Index Fund | | | 69,609 | | | | 2018 | | |
Victory CEMP REC Enhanced Volatility Wtd Index Fund | | | 36,430 | | | | 2019 | | |
Victory CEMP US 500 Enhanced Volatility Wtd Index Fund | | $ | 23,076 | | | | 2016 | | |
Victory CEMP US 500 Enhanced Volatility Wtd Index Fund | | | 113,611 | | | | 2017 | | |
Victory CEMP US 500 Enhanced Volatility Wtd Index Fund | | | 351,266 | | | | 2018 | | |
Victory CEMP US 500 Enhanced Volatility Wtd Index Fund | | | 262,133 | | | | 2019 | | |
215
Victory Portfolios II | | Notes to Financial Statements — continued
December 31, 2015 | |
(Unaudited)
Fund | | Amount
Waived or
Reimbursed
Available to
Recoup | | Expires
June 30, | |
Victory CEMP Long/Short Strategy Fund | | $ | 14,806 | | | | 2016 | | |
Victory CEMP Long/Short Strategy Fund | | | 44,987 | | | | 2017 | | |
Victory CEMP Long/Short Strategy Fund | | | 61,653 | | | | 2018 | | |
Victory CEMP Long/Short Strategy Fund | | | 35,953 | | | | 2019 | | |
Victory CEMP International Enhanced Volatility Wtd Index Fund | | $ | 130,961 | | | | 2016 | | |
Victory CEMP International Enhanced Volatility Wtd Index Fund | | | 214,072 | | | | 2017 | | |
Victory CEMP International Enhanced Volatility Wtd Index Fund | | | 281,326 | | | | 2018 | | |
Victory CEMP International Enhanced Volatility Wtd Index Fund | | | 159,522 | | | | 2019 | | |
Victory CEMP Commodity Enhanced Volatility Wtd Index Strategy Fund | | $ | 14,579 | | | | 2016 | | |
Victory CEMP Commodity Enhanced Volatility Wtd Index Strategy Fund | | | 59,019 | | | | 2017 | | |
Victory CEMP Commodity Enhanced Volatility Wtd Index Strategy Fund | | | 33,501 | | | | 2018 | | |
Victory CEMP Commodity Enhanced Volatility Wtd Index Strategy Fund | | | 21,840 | | | | 2019 | | |
Victory CEMP Commodity Volatility Wtd Index Strategy Fund | | $ | 13,511 | | | | 2016 | | |
Victory CEMP Commodity Volatility Wtd Index Strategy Fund | | | 49,104 | | | | 2017 | | |
Victory CEMP Commodity Volatility Wtd Index Strategy Fund | | | 47,451 | | | | 2018 | | |
Victory CEMP Commodity Volatility Wtd Index Strategy Fund | | | 30,111 | | | | 2019 | | |
Victory CEMP Market Neutral Income Fund | | $ | 13,054 | | | | 2016 | | |
Victory CEMP Market Neutral Income Fund | | | 43,172 | | | | 2017 | | |
Victory CEMP Market Neutral Income Fund | | | 95,075 | | | | 2018 | | |
Victory CEMP Market Neutral Income Fund | | | 89,878 | | | | 2019 | | |
Victory CEMP Enhanced Fixed Income Fund | | $ | 24,387 | | | | 2016 | | |
Victory CEMP Enhanced Fixed Income Fund | | | 55,861 | | | | 2017 | | |
Victory CEMP Enhanced Fixed Income Fund | | | 56,961 | | | | 2018 | | |
Victory CEMP Enhanced Fixed Income Fund | | | 34,235 | | | | 2019 | | |
Victory CEMP Ultra Short Term Fixed Income Fund | | $ | 17,354 | | | | 2016 | | |
Victory CEMP Ultra Short Term Fixed Income Fund | | | 71,367 | | | | 2017 | | |
Victory CEMP Ultra Short Term Fixed Income Fund | | | 62,903 | | | | 2018 | | |
Victory CEMP Ultra Short Term Fixed Income Fund | | | 36,992 | | | | 2019 | | |
Balanced Fund | | $ | 26,758 | | | | 2019 | | |
Growth Fund | | $ | 7,117 | | | | 2017 | | |
Growth Fund | | | 21,061 | | | | 2018 | | |
Growth Fund | | | 20,355 | | | | 2019 | | |
Alternative Strategies Fund | | $ | 22,842 | | | | 2017 | | |
Alternative Strategies Fund | | | 36,386 | | | | 2018 | | |
Alternative Strategies Fund | | | 48,427 | | | | 2019 | | |
The Adviser, Citi, or other service providers may voluntarily waiver or reimburse additional fees to assist the Funds in maintaining competitive expense ratios. Voluntary waivers and reimbursements applicable to the Funds are not available to be recouped at a future time. For the six months ended December 31, 2015, Victory CEMP Ultra Short Term Fixed Income Fund, Balanced Fund, Growth Fund and Alternative Strategies Fund waived fees.
216
Victory Portfolios II | | Notes to Financial Statements — continued
December 31, 2015 | |
(Unaudited)
5. Risks:
Each Fund may be subject to other risks in addition to these identified risks.
The Victory CEMP International Volatility Wtd Index Fund, Victory CEMP Emerging Market Volatility Wtd Index Fund and Victory International Enhanced Volatility Wtd Index Fund invests in securities of foreign issuers in various countries. Investing on an international basis involves certain risks not involved in domestic investments including the risk of nationalization or expropriation of assets, imposition of currency exchange controls or restrictions on the repatriation of foreign currency, confiscatory taxation, political or financial instability and diplomatic developments, which could affect the value of a Fund's investments in certain foreign countries. Governments of many countries have exercised and continue to exercise substantial influence over many aspects of the private sector through the ownership or control of many companies, including some of the largest in these countries. As a result, government actions in the future could have a significant effect on economic conditions which may adversely affect prices of certain portfolio securities. There is also generally less government supervision and regulation of stock exchanges, brokers, and listed companies than in the U.S. Dividends or interest on, or proceeds from the sale of, foreign securities may be subject to foreign withholding taxes, and special U.S. tax considerations may apply. Moreover, foreign economies may differ favorably or unfavorably from the U.S. economy in such respects as growth of gross national product, rate of inflation, capital re-investment, resource self-sufficiency and balance of payments position. The Schedule of Portfolio Investments includes information on each Fund's holdings, including industry and/or geographical composition, as relevant.
The Funds will be subject to credit risk with respect to the amount each expects to receive from counterparties to financial instruments entered into by the Funds. The Funds may be negatively impacted if a counterparty becomes bankrupt or otherwise fails to perform its obligations due to financial difficulties. The Funds may experience significant delays in obtaining any recovery in bankruptcy or other reorganization proceeding and the Funds may obtain only limited recovery or may obtain no recovery in such circumstances. The Funds typically enter into transactions with counterparties whose credit ratings are investment grade, as determined by a nationally recognized statistical rating organization or, if unrated, judged by the Adviser to be of comparable quality.
6. Line of Credit:
On November 2, 2015, the Trust, Victory Portfolios, Victory Variable Insurance Funds and Victory Institutional Funds (collectively, the "Trusts"), participate in a short-term, demand note "Line of Credit" agreement with Citibank N.A. ("Citibank"). Under the agreement with Citibank, the Trusts may borrow up to $100 million, of which $50 million is committed and $50 million is uncommitted. The purpose of the agreement is to meet temporary or emergency cash needs, including redemption requests that might otherwise require the untimely disposition of securities. Citibank receives an annual commitment fee of 0.10% on $50 million for providing the Line of Credit. For the six months ended December 31, 2015, Citibank earned from the Trusts approximately $25,000 for Line of Credit Fees. Each fund covered by the facility pays a pro-rata portion of this commitment fee plus any interest on amounts borrowed. During the six months ended December 31, 2015, the Funds had no loans outstanding.
Prior to November 2, 2015, the Trust participated in a $15 million secured Revolving Credit Agreement (the "Agreement") with U.S. Bank, National Association ("U.S. Bank"). Under the terms of the Agreement, each Fund could not exceed the limit on borrowing money set forth in the Registration Statement of that Fund and the borrowing were used only for temporary or emergency purposes including the financing of redemptions. Interest was charged to each Fund based on the prevailing market rates in effect at the time of the borrowing. The Funds collateralized the borrowings with certain securities the Funds held at the time of borrowing. During the six months ended December 31, 2015, the Funds had no loans outstanding.
217
Victory Portfolios II | | Notes to Financial Statements — continued
December 31, 2015 | |
(Unaudited)
7. Securities Lending:
Prior to November 2, 2015, the Trust was a party to a securities lending arrangement with U.S. Bank National Association (the "Agent"). Under the terms of the agreement, the Funds were authorized to loan securities to certain broker dealers and banks that had securities lending agreements with the Agent. In exchange, the Funds receive cash collateral in the amount of at least 102% of the value of securities loaned or at least 105% of the value of foreign securities loaned. The cash collateral was invested during the period in short-term instruments. Securities lending income is disclosed in the Funds' Statements of Operations. Although risk is mitigated by the collateral, the Funds could experience a delay in recovering its securities and possible loss of income or value if the borrower fails to return them. The agreement provided that the Funds received a guaranteed amount in securities lending revenue annually. As of December 31, 2015, the Trust has no securities lending arrangements with any Agents.
8. Federal Income Tax Information:
The tax character of distributions paid during the tax years ended, as noted below, were as follows (total distributions paid may differ from the Statements of Changes in Net Assets because, for tax purposes, dividends are recognized when actually paid):
For the period ended June 30, 2015:
| | Ordinary
Income | | Long-Term
Capital Gains | | Return of
Capital | | Total | |
Victory CEMP US 500 Volatility Wtd
Index Fund | | $ | 1,456,002 | | | $ | 2,500,477 | | | $ | — | | | $ | 3,956,479 | | |
Victory CEMP US Small Cap Volatility
Wtd Index Fund | | | 699,927 | | | | 754,613 | | | | — | | | | 1,454,540 | | |
Victory CEMP International Volatility
Wtd Index Fund | | | 1,503,506 | | | | 919,483 | | | | — | | | | 2,422,989 | | |
Victory CEMP Emerging Market
Volatility Wtd Index Fund | | | 213,447 | | | | — | | | | — | | | | 213,447 | | |
Victory CEMP US 500 Enhanced
Volatility Wtd Index Fund | | | 4,530,652 | | | | 7,562,282 | | | | — | | | | 12,092,934 | | |
Victory CEMP International Enhanced
Volatility Wtd Index Fund | | | 3,409,955 | | | | 1,058,085 | | | | — | | | | 4,468,040 | | |
Victory CEMP REC Enhanced Volatility
Wtd Index Fund | | | 866,949 | | | | 10,942 | | | | — | | | | 877,891 | | |
Victory CEMP Commodity Volatility
Wtd Index Strategy Fund | | | 1,456,795 | | | | 2,059 | | | | — | | | | 1,458,854 | | |
Victory CEMP Commodity Enhanced
Volatility Wtd Index Strategy Fund | | | 121,605 | | | | — | | | | — | | | | 121,605 | | |
Victory CEMP Long/Short Strategy
Fund | | | 128,698 | | | | 23,882 | | | | — | | | | 152,580 | | |
Victory CEMP Market Neutral Income
Fund | | | 1,845,581 | | | | — | | | | — | | | | 1,845,581 | | |
Victory CEMP Enhanced Fixed Income
Fund | | | 799,648 | | | | — | | | | — | | | | 799,648 | | |
Victory CEMP Ultra Short Term Fixed
Income Fund | | | 75,002 | | | | — | | | | — | | | | 75,002 | | |
Balanced Fund | | | 3,031,185 | | | | 123,909 | | | | — | | | | 3,155,094 | | |
Growth Fund | | | 2,376,188 | | | | 537,928 | | | | — | | | | 2,914,116 | | |
Alternative Strategies Fund | | | 1,233,716 | | | | — | | | | — | | | | 1,233,716 | | |
218
Victory Portfolios II | | Notes to Financial Statements — continued
December 31, 2015 | |
(Unaudited)
As of the most recent tax year ended June 30, 2015, the components of accumulated earnings / (deficit) on a tax basis were as follows:
| | Undistributed
Ordinary
Income | | Undistributed
Long-Term
Gains | | Capital Loss
Carry
Forwards | | Other
Book/Tax
Differences | | Post October
Loss and
Late Year Loss | | Unrealized
Appreciation
(Depreciation) | | Total
Accumulated
Earnings
(Deficits) | |
Victory CEMP US 500
Volatility Wtd Index
Fund | | $ | 4,498 | | | $ | 2,608,871 | | | $ | — | | | $ | — | | | $ | — | | | $ | 3,851,028 | | | $ | 6,464,397 | | |
Victory CEMP US
Small Cap Volatility
Wtd Index Fund | | | 182,895 | | | | 518,566 | | | | — | | | | — | | | | — | | | | 1,188,123 | | | | 1,889,584 | | |
Victory CEMP
International
Volatility Wtd Index
Fund | | | 7,399 | | | | 198 | | | | — | | | | — | | | | (260,258 | ) | | | 255,623 | | | | 2,962 | | |
Victory CEMP
Emerging Market
Volatility Wtd Index
Fund | | | 11,482 | | | | — | | | | (166,065 | ) | | | — | | | | (243,203 | ) | | | (521,615 | ) | | | (919,401 | ) | |
Victory CEMP US 500
Enhanced Volatility
Wtd Index Fund | | | 557,923 | | | | 4,670,746 | | | | — | | | | — | | | | — | | | | 18,556,174 | | | | 23,784,843 | | |
Victory CEMP
International
Enhanced Volatility
Wtd Index Fund | | | 168,344 | | | | — | | | | (208,826 | ) | | | — | | | | (940,029 | ) | | | (360,437 | ) | | | (1,340,948 | ) | |
Victory CEMP REC
Enhanced Volatility
Wtd Index Fund | | | 1,228,716 | | | | 760,794 | | | | — | | | | — | | | | — | | | | (18,855 | ) | | | 1,970,655 | | |
Victory CEMP
Commodity Volatility
Wtd Index Strategy
Fund | | | — | | | | — | | | | — | | | | (3,428,915 | ) | | | (23,821 | ) | | | (3,538 | ) | | | (3,456,274 | ) | |
Victory CEMP
Commodity
Enhanced Volatility
Wtd Index Strategy
Fund | | | — | | | | — | | | | (73,166 | ) | | | (1,056,012 | ) | | | (28,348 | ) | | | 2,013 | | | | (1,155,513 | ) | |
Victory CEMP
Long/Short Strategy
Fund | | | 616,672 | | | | — | | | | — | | | | — | | | | — | | | | 946,162 | | | | 1,562,834 | | |
Victory CEMP Market
Neutral Income
Fund | | | 32,980 | | | | — | | | | — | | | | — | | | | (519,697 | ) | | | (2,365,939 | ) | | | (2,852,656 | ) | |
Victory CEMP
Enhanced Fixed
Income Fund | | | 161,753 | | | | 137,799 | | | | — | | | | — | | | | — | | | | (72,323 | ) | | | 227,229 | | |
Victory CEMP Ultra
Short Term Fixed
Income Fund | | | — | | | | — | | | | — | | | | (436 | ) | | | (632 | ) | | | 3,464 | | | | 2,396 | | |
Balanced Fund | | | 286,261 | | | | 2,130,967 | | | | — | | | | — | | | | — | | | | (78,570 | ) | | | 2,338,658 | | |
Growth Fund | | | 339,821 | | | | 1,837,725 | | | | — | | | | — | | | | — | | | | 402,201 | | | | 2,579,747 | | |
Alternative Strategies
Fund | | | 133,618 | | | | — | | | | (4,235,649 | ) | | | — | | | | — | | | | (548,573 | ) | | | (4,650,604 | ) | |
219
Victory Portfolios II | | Notes to Financial Statements — continued
December 31, 2015 | |
(Unaudited)
The difference between book basis and tax basis unrealized appreciation/(depreciation) is primarily attributable to the tax deferral of losses on wash sales, the mark-to-market on open futures contracts, passive foreign investment companies and the Funds' wholly-owned subsidiaries.
Late year losses incurred after December 31 within the fiscal year are deemed to arise on the first business day of the following fiscal year for tax purposes. The Funds incurred and elected to defer such capital losses as follows:
| | Late Year
Losses | |
Victory CEMP US 500 Volatility Wtd Index Fund | | $ | — | | |
Victory CEMP US Small Cap Volatility Wtd Index Fund | | | — | | |
Victory CEMP International Volatility Wtd Index Fund | | | — | | |
Victory CEMP Emerging Market Volatility Wtd Index Fund | | | — | | |
Victory CEMP US 500 Enhanced Volatility Wtd Index Fund | | | — | | |
Victory CEMP International Enhanced Volatility Wtd Index Fund | | | — | | |
Victory CEMP REC Enhanced Volatility Wtd Index Fund | | | — | | |
Victory CEMP Commodity Volatility Wtd Index Strategy Fund | | | 19,463 | | |
Victory CEMP Commodity Enhanced Volatility Wtd Index Strategy Fund | | | 27,332 | | |
Victory CEMP Long/Short Strategy Fund | | | — | | |
Victory CEMP Market Neutral Income Fund | | | 32,374 | | |
Victory CEMP Enhanced Fixed Income Fund | | | — | | |
Victory CEMP Ultra Short Term Fixed Income Fund | | | — | | |
Balanced Fund | | | — | | |
Growth Fund | | | — | | |
Alternative Strategies Fund | | | — | | |
Under current tax law, capital ordinary losses realized after October 31 may be deferred and treated as occurring on the first business day of the following tax fiscal year. As of the most recent tax year ended June 30, 2015, the following Funds had deferred losses, which will be treated as arising on the first day of the tax fiscal years ending in June 30, 2016.
| | Post October
Losses | |
Victory CEMP US 500 Volatility Wtd Index Fund | | $ | — | | |
Victory CEMP US Small Cap Volatility Wtd Index Fund | | | — | | |
Victory CEMP International Volatility Wtd Index Fund | | | 260,258 | | |
Victory CEMP Emerging Market Volatility Wtd Index Fund | | | 243,203 | | |
Victory CEMP US 500 Enhanced Volatility Wtd Index Fund | | | — | | |
Victory CEMP International Enhanced Volatility Wtd Index Fund | | | 940,029 | | |
Victory CEMP REC Enhanced Volatility Wtd Index Fund | | | — | | |
Victory CEMP Commodity Volatility Wtd Index Strategy Fund | | | 4,358 | | |
Victory CEMP Commodity Enhanced Volatility Wtd Index Strategy Fund | | | 1,016 | | |
Victory CEMP Long/Short Strategy Fund | | | — | | |
Victory CEMP Market Neutral Income Fund | | | 487,323 | | |
Victory CEMP Enhanced Fixed Income Fund | | | — | | |
Victory CEMP Ultra Short Term Fixed Income Fund | | | 632 | | |
Balanced Fund | | | — | | |
Growth Fund | | | — | | |
Alternative Strategies Fund | | | — | | |
As of the most recent tax year ended June 30, 2015, the following Funds had net capital loss carryforwards ("CLCFS") as summarized in the table below. CLCFs subject to expiration are applied as short-term capital loss regardless of whether the originating capital loss was short-term or
220
Victory Portfolios II | | Notes to Financial Statements — continued
December 31, 2015 | |
(Unaudited)
long-term. CLCFs that are not subject to expiration must be utilized before those that are subject to expiration.
| | Expiring FYE | | Short-Term | | Long-Term | | Total | |
Victory CEMP US 500 Volatility Wtd
Index Fund | | | | $ | — | | | $ | — | | | $ | — | | |
Victory CEMP US Small Cap Volatility
Wtd Index Fund | | | | | — | | | | — | | | | — | | |
Victory CEMP International Volatility
Wtd Index Fund | | | | | — | | | | — | | | | — | | |
Victory CEMP Emerging Market Volatility
Wtd Index Fund | | Non-expiring | | | 100,600 | | | | 65,465 | | | | 166,065 | | |
Victory CEMP US 500 Enhanced Volatility
Wtd Index Fund | | | | | — | | | | — | | | | — | | |
Victory CEMP International Enhanced
Volatility Wtd Index Fund | | Non-expiring | | | 208,826 | | | | — | | | | 208,826 | | |
Victory CEMP REC Enhanced Volatility
Wtd Index Fund | | | | | — | | | | — | | | | — | | |
Victory CEMP Commodity Volatility Wtd
Index Strategy Fund | | | | | — | | | | — | | | | — | | |
Victory CEMP Commodity Enhanced
Volatility Wtd Index Strategy Fund | | Non-expiring | | | 73,166 | | | | — | | | | 73,166 | | |
Victory CEMP Long/Short Strategy Fund | | | | | — | | | | — | | | | — | | |
Victory CEMP Market Neutral Income
Fund | | | | | — | | | | — | | | | — | | |
Victory CEMP Enhanced Fixed Income
Fund | | | | | — | | | | — | | | | — | | |
Victory CEMP Ultra Short Term Fixed
Income Fund | | | | | — | | | | — | | | | — | | |
Balanced Fund | | | | | — | | | | — | | | | — | | |
Growth Fund | | | | | — | | | | — | | | | — | | |
Alternative Strategies Fund | | 11/30/19 | | | 4,235,649 | | | | — | | | | 4,235,649 | | |
The cost basis for federal income tax purposes, gross unrealized appreciation, gross unrealized depreciation and net unrealized appreciation/depreciation as of December 31, 2015 were as follows:
| | Tax Cost | | Tax
Unrealized
Appreciation | | Tax
Unrealized
Depreciation | | Net Unrealized
Appreciation
(Depreciation) | |
Victory CEMP US 500 Volatility
Wtd Index Fund | | $ | 27,002,393 | | | $ | 4,242,060 | | | $ | (1,532,023 | ) | | $ | 2,710,037 | | |
Victory CEMP US Small Cap
Volatility Wtd Index Fund | | | 7,193,780 | | | | 576,428 | | | | (446,665 | ) | | | 129,763 | | |
Victory CEMP International
Volatility Wtd Index Fund | | | 8,660,733 | | | | 640,209 | | | | (781,785 | ) | | | (141,576 | ) | |
Victory CEMP Emerging Market
Volatility Wtd Index Fund | | | 14,232,096 | | | | 122,146 | | | | (2,472,921 | ) | | | (2,350,775 | ) | |
Victory CEMP US 500 Enhanced
Volatility Wtd Index Fund | | | 182,209,402 | | | | 21,737,053 | | | | (10,366,034 | ) | | | 11,371,019 | | |
Victory CEMP International
Enhanced Volatility Wtd
Index Fund | | | 35,148,183 | | | | 731,972 | | | | (1,473,687 | ) | | | (741,715 | ) | |
Victory CEMP REC Enhanced
Volatility Wtd Index Fund | | | 9,250,981 | | | | 201,194 | | | | (133,323 | ) | | | 67,871 | | |
Victory CEMP Commodity
Volatility Wtd Index Strategy
Fund | | | 8,315,043 | | | | 162,127 | | | | (160,851 | ) | | | 1,276 | | |
221
Victory Portfolios II | | Notes to Financial Statements — continued
December 31, 2015 | |
(Unaudited)
| | Tax Cost | | Tax
Unrealized
Appreciation | | Tax
Unrealized
Depreciation | | Net Unrealized
Appreciation
(Depreciation) | |
Victory CEMP Commodity
Enhanced Volatility Wtd Index
Strategy Fund | | $ | 5,386,557 | | | $ | 109,371 | | | $ | (108,459 | ) | | $ | 912 | | |
Victory CEMP Long/Short
Strategy Fund | | | 13,919,172 | | | | 1,295,243 | | | | (547,850 | ) | | | 747,393 | | |
Victory CEMP Market Neutral
Income Fund | | | 64,813,168 | | | | 1,505,596 | | | | (6,887,348 | ) | | | (5,381,752 | ) | |
Victory CEMP Enhanced Fixed
Income Fund | | | 3,149,194 | | | | 2,648 | | | | (2,675 | ) | | | (27 | ) | |
Victory CEMP Ultra Short Term
Fixed Income Fund | | | 10,398,665 | | | | 2,989 | | | | (150 | ) | | | 2,839 | | |
Balanced Fund | | | 30,564,919 | | | | 81,672 | | | | (2,230,243 | ) | | | (2,148,571 | ) | |
Growth Fund | | | 16,344,352 | | | | — | | | | (201,713 | ) | | | (201,713 | ) | |
Alternative Strategies Fund | | | 30,516,677 | | | | — | | | | (2,760,971 | ) | | | (2,760,971 | ) | |
9. Affiliated Funds
The term "affiliated company" includes funds which are managed by VCM which are affiliates of the Funds'. Transactions during the period ended December 31, 2015 with funds which are affiliates are as follows:
| | | | Purchased | | Sold | | | | | | | |
| | Value at
June 30,
2015 | | Shares | | Cost | | Shares | | Proceeds | | Value at
December 31,
2015 | | Dividend
Income | | Net
Realized
Gains
(Losses) | |
Victory CEMP Commodity Volatility Wtd Index Strategy Fund | |
Victory CEMP Ultra
Short Term
Fixed Income
Fund —
Class I | | $ | 479,132 | | | | — | | | $ | — | | | | (47,913 | ) | | $ | (479,132 | ) | | $ | — | | | $ | 572 | | | $ | — | | |
Victory CEMP Commodity Enhanced Volatility Wtd Index Strategy Fund | |
Victory CEMP Ultra
Short Term
Fixed Income
Fund —
Class I | | $ | 366,705 | | | | — | | | $ | — | | | | (36,670 | ) | | $ | (366,705 | ) | | $ | — | | | $ | 442 | | | $ | — | | |
Victory CEMP Enhanced Fixed Income Fund | |
Victory CEMP Ultra
Short Term
Fixed Income
Fund —
Class I | | $ | 841,037 | | | | — | | | $ | — | | | | (84,104 | ) | | $ | (841,037 | ) | | $ | — | | | $ | 1,059 | | | $ | — | | |
Balanced Fund | |
Victory CEMP
Commodity
Enhanced
Volatility Wtd
Index Strategy
Fund —
Class I | | $ | 1,193,591 | | | | 4,324 | | | $ | 33,280 | | | | (28,205 | ) | | $ | (264,374 | ) | | $ | 867,550 | | | $ | — | | | $ | (41,908 | ) | |
222
Victory Portfolios II | | Notes to Financial Statements — continued
December 31, 2015 | |
(Unaudited)
| | | | | Purchased | | Sold | | | | | | | |
| | | Value at
June 30,
2015 | | Shares | | Cost | | Shares | | Proceeds | | Value at
December 31,
2015 | | Dividend
Income | | Net
Realized
Gains
(Losses) | |
Victory CEMP
Commodity
Volatility Wtd
Index Strategy
Fund —
Class I | | $ | 1,192,910 | | | | 6,695 | | | $ | 40,689 | | | | (30,278 | ) | | $ | (277,726 | ) | | $ | 866,447 | | | $ | — | | | $ | (87,662 | ) | |
Victory CEMP
Developed
Enhanced
Volatility Wtd
Index ETF | | | 43,725 | | | | 120 | | | | 3,961 | | | | (452 | ) | | | (16,428 | ) | | | 28,184 | | | | 269 | | | | (1,885 | ) | |
Victory CEMP
Emerging
Market
Volatility Wtd
Index Fund —
Class I | | | 1,087,310 | | | | 2,057 | | | | 17,777 | | | | (12,313 | ) | | | (125,121 | ) | | | 819,351 | | | | 7,674 | | | | (19,809 | ) | |
Victory CEMP
Enhanced
Fixed Income
Fund —
Class I | | | 3,801,024 | | | | — | | | | — | | | | (384,716 | ) | | | (3,770,248 | ) | | | — | | | | — | | | | 23,568 | | |
Victory CEMP
International
Enhanced
Volatility Wtd
Index Fund —
Class I | | | 4,336,451 | | | | 5,790 | | | | 59,244 | | | | (65,480 | ) | | | (763,918 | ) | | | 3,246,618 | | | | 14,195 | | | | (82,814 | ) | |
Victory CEMP
International
High Div
Volatility Wtd
Index ETF | | | — | | | | 1,735 | | | | 56,248 | | | | (150 | ) | | | (5,023 | ) | | | 51,196 | | | | 36 | | | | (209 | ) | |
Victory CEMP
International
Volatility Wtd
Index ETF | | | — | | | | 1,620 | | | | 54,659 | | | | (100 | ) | | | (3,360 | ) | | | 51,239 | | | | 22 | | | | (125 | ) | |
Victory CEMP
International
Volatility Wtd
Index Fund —
Class I | | | 3,282,614 | | | | 3,578 | | | | 38,711 | | | | (60,108 | ) | | | (721,432 | ) | | | 2,440,374 | | | | 13,152 | | | | (65,465 | ) | |
Victory CEMP
Long/Short
Strategy
Index Fund —
Class I | | | 2,727,880 | | | | — | | | | — | | | | (64,094 | ) | | | (690,927 | ) | | | 1,875,082 | | | | 80,068 | | | | 32,819 | | |
223
Victory Portfolios II | | Notes to Financial Statements — continued
December 31, 2015 | |
(Unaudited)
| | | | | Purchased | | Sold | | | | | | | |
| | | Value at
June 30,
2015 | | Shares | | Cost | | Shares | | Proceeds | | Value at
December 31,
2015 | | Dividend
Income | | Net
Realized
Gains
(Losses) | |
Victory CEMP
Market Neutral
Income
Fund —
Class I | | $ | 8,764,117 | | | | 408,468 | | | $ | 3,909,003 | | | | (313,107 | ) | | $ | (3,136,677 | ) | | $ | 9,398,109 | | | $ | 87,281 | | | $ | 64,690 | | |
Victory CEMP REC
Enhanced
Volatility Wtd
Index Fund —
Class I | | | 1,576,474 | | | | 14,670 | | | | 143,222 | | | | (37,028 | ) | | | (408,294 | ) | | | 1,082,717 | | | | 149,119 | | | | 77,383 | | |
Victory CEMP
US 500
Enhanced
Volatility Wtd
Index ETF | | | 1,383,500 | | | | 72 | | | | 2,629 | | | | (13,587 | ) | | | (485,416 | ) | | | 862,085 | | | | 8,500 | | | | 8,685 | | |
Victory CEMP
US 500
Enhanced
Volatility Wtd
Index Fund —
Class I | | | 2,784,588 | | | | — | | | | — | | | | (51,143 | ) | | | (665,757 | ) | | | 1,931,290 | | | | 16,992 | | | | 117,554 | | |
Victory CEMP
US 500
Volatility
Wtd Index
ETF | | | 2,092,820 | | | | — | | | | — | | | | (20,813 | ) | | | (743,242 | ) | | | 1,293,060 | | | | 11,816 | | | | 14,502 | | |
Victory CEMP
US 500
Volatility
Wtd Index
Fund —
Class I | | | 2,087,128 | | | | — | | | | — | | | | (39,658 | ) | | | (511,846 | ) | | | 1,365,787 | | | | 8,708 | | | | 162,573 | | |
Victory CEMP US
Discovery
Enhanced
Volatility Wtd
Index ETF | | | 708,211 | | | | — | | | | — | | | | (5,631 | ) | | | (209,252 | ) | | | 429,491 | | | | 3,319 | | | | (4,786 | ) | |
Victory CEMP
US EQ Income
Enhanced
Volatility Wtd
Index ETF | | | 1,359,941 | | | | 912 | | | | 32,857 | | | | (24,571 | ) | | | (894,336 | ) | | | 522,827 | | | | 20,557 | | | | (15,751 | ) | |
Victory CEMP US
Large Cap High
Div Volatility
Wtd Index
ETF | | | — | | | | 1,659 | | | | 57,147 | | | | (175 | ) | | | (5,836 | ) | | | 51,079 | | | | 61 | | | | (8 | ) | |
224
Victory Portfolios II | | Notes to Financial Statements — continued
December 31, 2015 | |
(Unaudited)
| | | | | Purchased | | Sold | | | | | | | |
| | | Value at
June 30,
2015 | | Shares | | Cost | | Shares | | Proceeds | | Value at
December 31,
2015 | | Dividend
Income | | Net
Realized
Gains
(Losses) | |
Victory CEMP US
Small Cap High
Div Volatility
Wtd Index
ETF | | $ | — | | | | 1,547 | | | $ | 51,243 | | | | — | | | $ | — | | | $ | 50,912 | | | $ | 86 | | | $ | — | | |
Victory CEMP US
Small Cap
Volatility Wtd
Index ETF | | | — | | | | 1,722 | | | | 57,020 | | | | (175 | ) | | | (5,770 | ) | | | 50,958 | | | | 34 | | | | (163 | ) | |
Victory CEMP US
Small Cap
Volatility Wtd
Index Fund —
Class I | | | 714,375 | | | | — | | | | — | | | | (12,913 | ) | | | (173,696 | ) | | | 459,079 | | | | 11,611 | | | | 29,785 | | |
| | $ | 39,136,659 | | | | 454,969 | | | $ | 4,557,690 | | | | (1,164,697 | ) | | $ | (13,878,679 | ) | | $ | 27,743,435 | | | $ | 433,500 | | | $ | 210,974 | | |
Growth Fund | |
Victory CEMP
Developed
Enhanced
Volatility Wtd
Index ETF | | $ | 7,104 | | | | 19,266 | | | $ | 614,537 | | | | (19,466 | ) | | $ | (621,207 | ) | | $ | — | | | $ | 1,722 | | | $ | (3,870 | ) | |
Victory CEMP
Emerging
Market
Volatility Wtd
Index Fund —
Class I | | | 798,020 | | | | — | | | | — | | | | (80,689 | ) | | | (799,872 | ) | | | — | | | | 5,632 | | | | (124,558 | ) | |
Victory CEMP
International
Enhanced
Volatility Wtd
Index Fund —
Class I | | | 2,920,593 | | | | — | | | | — | | | | (257,775 | ) | | | (2,868,284 | ) | | | — | | | | 8,212 | | | | (227,257 | ) | |
Victory CEMP
International
High Div
Volatility Wtd
Index ETF | | | — | | | | 97,418 | | | | 3,212,727 | | | | (3,197 | ) | | | (106,164 | ) | | | 3,043,338 | | | | 7,186 | | | | (1,112 | ) | |
Victory CEMP
International
Volatility Wtd
Index Fund —
Class I | | | 2,342,106 | | | | — | | | | — | | | | (204,909 | ) | | | (2,408,727 | ) | | | — | | | | 8,864 | | | | (188,883 | ) | |
Victory CEMP
US 500
Enhanced
Volatility Wtd
Index ETF | | | 1,016,083 | | | | — | | | | — | | | | (27,641 | ) | | | (1,008,130 | ) | | | — | | | | 5,278 | | | | (5,100 | ) | |
225
Victory Portfolios II | | Notes to Financial Statements — continued
December 31, 2015 | |
(Unaudited)
| | | | | Purchased | | Sold | | | | | | | |
| | | Value at
June 30,
2015 | | Shares | | Cost | | Shares | | Proceeds | | Value at
December 31,
2015 | | Dividend
Income | | Net
Realized
Gains
(Losses) | |
Victory CEMP
US 500
Enhanced
Volatility Wtd
Index Fund —
Class I | | $ | 1,998,148 | | | | — | | | $ | — | | | | (141,212 | ) | | $ | (1,776,247 | ) | | $ | — | | | $ | 6,980 | | | $ | 198,459 | | |
Victory CEMP
US 500
Volatility Wtd
Index ETF | | | 1,568,843 | | | | — | | | | — | | | | (42,678 | ) | | | (1,515,649 | ) | | | — | | | | 7,683 | | | | 34,580 | | |
Victory CEMP
US 500
Volatility Wtd
Index Fund —
Class I | | | 1,525,034 | | | | — | | | | — | | | | (110,510 | ) | | | (1,398,541 | ) | | | — | | | | 5,867 | | | | 107,414 | | |
Victory CEMP US
Discovery
Enhanced
Volatility Wtd
Index ETF | | | 536,432 | | | | — | | | | — | | | | (13,681 | ) | | | (503,433 | ) | | | — | | | | 2,321 | | | | (16,315 | ) | |
Victory CEMP
US EQ Income
Enhanced
Volatility Wtd
Index ETF | | | 999,238 | | | | 66,694 | | | | 2,397,855 | | | | (25,264 | ) | | | (915,017 | ) | | | 2,463,223 | | | | 18,430 | | | | (15,842 | ) | |
Victory CEMP US
Large Cap High
Div Volatility
Wtd Index
ETF | | | — | | | | 91,967 | | | | 3,220,295 | | | | (3,054 | ) | | | (107,032 | ) | | | 3,060,385 | | | | 6,272 | | | | (1,395 | ) | |
Victory CEMP US
Small Cap
Volatility Wtd
Index ETF | | | — | | | | 1,170 | | | | 41,008 | | | | (1,170 | ) | | | (41,008 | ) | | | — | | | | 88 | | | | (852 | ) | |
Victory CEMP US
Small Cap High
Div Volatility
Wtd Index
ETF | | | — | | | | 33,618 | | | | 1,135,886 | | | | (1,919 | ) | | | (66,245 | ) | | | 1,043,214 | | | | 5,611 | | | | (2,218 | ) | |
Victory CEMP US
Small Cap
Volatility Wtd
Index Fund —
Class I | | | 518,510 | | | | 3,698 | | | | 49,624 | | | | (41,187 | ) | | | (552,057 | ) | | | — | | | | 7,170 | | | | (8,035 | ) | |
| | $ | 14,230,111 | | | | 313,831 | | | $ | 10,671,932 | | | | (974,352 | ) | | $ | (14,687,613 | ) | | $ | 9,610,160 | | | $ | 97,316 | | | $ | (254,984 | ) | |
226
Victory Portfolios II | | Notes to Financial Statements — continued
December 31, 2015 | |
(Unaudited)
| | | | | Purchased | | Sold | | | | | | | |
| | | Value at
June 30,
2015 | | Shares | | Cost | | Shares | | Proceeds | | Value at
December 31,
2015 | | Dividend
Income | | Net
Realized
Gains
(Losses) | |
Alternative Strategies Fund | |
Victory CEMP
Commodity
Enhanced
Volatility Wtd
Index Strategy
Fund —
Class I | | $ | 4,151,057 | | | | — | | | $ | — | | | | (120,923 | ) | | $ | (1,138,084 | ) | | $ | 2,731,287 | | | $ | — | | | $ | (185,763 | ) | |
Victory CEMP
Commodity
Volatility Wtd
Index Strategy
Fund —
Class I | | | 4,232,244 | | | | 909 | | | | 5,493 | | | | (142,766 | ) | | | (1,301,203 | ) | | | 2,727,825 | | | | — | | | | (402,363 | ) | |
Victory CEMP
Developed
Enhanced
Volatility Wtd
Index ETF | | | 658,079 | | | | — | | | | — | | | | (18,527 | ) | | | (643,935 | ) | | | — | | | | 2,043 | | | | (45,622 | ) | |
Victory CEMP
International
Enhanced
Volatility Wtd
Index Fund —
Class I | | | 3,742,554 | | | | — | | | | — | | | | (330,320 | ) | | | (3,680,144 | ) | | | — | | | | 9,570 | | | | (268,121 | ) | |
Victory CEMP
Long/Short
Strategy
Index Fund —
Class I | | | 9,514,184 | | | | 458,306 | | | | 5,165,098 | | | | (286,942 | ) | | | (3,157,395 | ) | | | 10,756,630 | | | | 442,520 | | | | 98,419 | | |
Victory CEMP
Market Neutral
Income
Fund —
Class I | | | 7,082,415 | | | | 762,110 | | | | 7,293,369 | | | | (318,759 | ) | | | (3,133,395 | ) | | | 10,957,306 | | | | 81,462 | | | | 161,884 | | |
Victory CEMP REC
Enhanced
Volatility Wtd
Index Fund —
Class I | | | 5,695,592 | | | | — | | | | — | | | | (500,490 | ) | | | (5,556,584 | ) | | | — | | | | 6,401 | | | | (31,365 | ) | |
Victory CEMP
US 500
Enhanced
Volatility Wtd
Index ETF | | | 1,230,394 | | | | — | | | | — | | | | (33,471 | ) | | | (1,167,385 | ) | | | — | | | | 2,948 | | | | 53,702 | | |
Victory CEMP
US 500
Enhanced
Volatility Wtd
Index Fund —
Class I | | | 3,046,174 | | | | — | | | | — | | | | (214,925 | ) | | | (2,652,175 | ) | | | — | | | | 6,242 | | | | 365,704 | | |
227
Victory Portfolios II | | Notes to Financial Statements — continued
December 31, 2015 | |
(Unaudited)
| | | | | Purchased | | Sold | | | | | | | |
| | | Value at
June 30,
2015 | | Shares | | Cost | | Shares | | Proceeds | | Value at
December 31,
2015 | | Dividend
Income | | Net
Realized
Gains
(Losses) | |
Victory CEMP US
EQ Income
Enhanced
Volatility Wtd
Index ETF | | $ | 1,232,149 | | | | — | | | $ | — | | | | (34,836 | ) | | $ | (1,214,644 | ) | | $ | — | | | $ | 9,123 | | | $ | 37,228 | | |
| | $ | 40,584,842 | | | | 1,221,325 | | | $ | 12,463,960 | | | | (2,001,959 | ) | | $ | (23,644,944 | ) | | $ | 27,173,048 | | | $ | 560,309 | | | $ | (216,297 | ) | |
10. Change in Accounting Policy:
During the year ended November 30, 2013 and the period ended June 30, 2014, the Alternative Fund had a controlling interest in each of the Compass EMP Long Short Strategies Fund, Compass EMP Commodity Strategies Enhanced Volatility Weighted Fund and the Compass EMP Commodity Strategies Volatility Weighted Fund. The Compass EMP Commodity Strategies Enhanced Volatility Weighted Fund and the Compass EMP Commodity Strategies Volatility Weighted Fund each have investments in wholly owned CFCs and report their financial statements on a consolidated basis with their respective wholly owned CFCs. As a result of this controlling interest the Financial Statements of the Alternative Fund included the Compass EMP Long Short Strategies Fund, Compass EMP Commodity Strategies Enhanced Volatility Weighted Fund (and its respective CFC) and the Compass EMP Commodity Strategies Volatility Weighted Fund (and its respective CFC).
On July 1, 2014, the Board made the determination that the financial presentation that would be most meaningful to shareholders going forward for the Alternative Fund was on an unconsolidated basis as the financials of the Compass EMP Long Short Strategies Fund, Compass EMP Commodity Strategies Enhanced Volatility Weighted Fund (and its respective CFC) and the Compass EMP Commodity Strategies Volatility Weighted Fund (and its respective CFC) were now presented in the same report. Previously the Alternative Fund had a fiscal year end of November 30th and presented its financials in a separate report from the other Funds in which it had a controlling interest.
As a result on July 1, 2014, the Financial Statements of the Compass EMP Long Short Strategies Fund, Compass EMP Commodity Strategies Enhanced Volatility Weighted Fund (and its respective CFC) and the Compass EMP Commodity Strategies Volatility Weighted Fund (and its respective CFC) were deconsolidated. The non-controlling interest on the date of deconsolidation was $16,677,714. As a result of Board determination, the 2014 Statement of Changes in Net Assets and the Seven Month Period Ended June 30, 2014 of the Financial Highlights have been changed from the prior audited amounts, to not include the consolidation.
The Statements of Assets and Liabilities as of June 30, 2014 and November 30, 2013, the Statements of Operations for the periods ended June 30, 2014 and November 30, 2013 and the Statements of Changes in Net Assets for the periods ended June 30, 2014 and November 30, 2013 are not presented herein as the periods are no longer required to be disclosed in the financial statements.
228
Victory Portfolios II | | Notes to Financial Statements — continued
December 31, 2015 | |
(Unaudited)
A summary of the effects of the change in accounting policy to the Financial Highlights is as follows:
Financial Highlights for the period ended June 30, 2014
| | | Previously
Reported | | Restated | |
Class A | |
Net Asset Value, Beginning of Period | | | 10.07 | | | | 10.07 | | |
Net Investment Income (Loss) | | | 0.03 | | | | 0.06 | | |
Net realized and unrealized gain (loss) | | | 0.66 | | | | 0.45 | | |
Total income(loss) from investment operations | | | 0.69 | | | | 0.51 | | |
Distributions to shareholders from: | |
Net Investment Income | | | — | | | | — | | |
Return of Capital | | | — | | | | — | | |
Total Distributions | | | — | | | | — | | |
Less (gain) loss attributable to non-controlling interest | | | (0.18 | ) | | | — | | |
Net Asset Value, End of Period | | | 10.58 | | | | 10.58 | | |
Total Return (%) | | | 5.06 | % | | | 5.06 | % | |
Ratios of expenses to average net assets: | |
Before fees waived and expenses absorbed/recouped | | | 1.73 | % | | | 0.59 | % | |
After fees waived and expenses absorbed/recouped | | | 1.47 | % | | | 0.50 | % | |
Ratios of net investment income (loss) to average net assets: | |
Before fees waived and expenses absorbed/recouped | | | 0.31 | % | | | 0.94 | % | |
After fees waived and expenses absorbed/recouped | | | 0.57 | % | | | 1.03 | % | |
Class C | |
Net Asset Value, Beginning of Period | | | 9.82 | | | | 9.82 | | |
Net Investment Income (Loss) | | | (0.01 | ) | | | 0.02 | | |
Net realized and unrealized gain (loss) | | | 0.64 | | | | 0.43 | | |
Total income(loss) from investment operations | | | 0.63 | | | | 0.45 | | |
Distributions to shareholders from: | |
Net Investment Income | | | — | | | | — | | |
Return of Capital | | | — | | | | — | | |
Total Distributions | | | — | | | | — | | |
Less (gain) loss attributable to non-controlling interest | | | (0.18 | ) | | | — | | |
Net Asset Value, End of Period | | | 10.27 | | | | 10.27 | | |
Total Return (%) | | | 4.58 | % | | | 4.58 | % | |
Ratios of expenses to average net assets: | |
Before fees waived and expenses absorbed/recouped | | | 2.48 | % | | | 1.34 | % | |
After fees waived and expenses absorbed/recouped | | | 2.22 | % | | | 1.25 | % | |
Ratios of net investment income (loss) to average net assets: | |
Before fees waived and expenses absorbed/recouped | | | (0.41 | )% | | | 0.22 | % | |
After fees waived and expenses absorbed/recouped | | | (0.15 | )% | | | 0.31 | % | |
229
Victory Portfolios II | | Notes to Financial Statements — continued
December 31, 2015 | |
(Unaudited)
Financial Highlights for the period ended June 30, 2014 (continued)
| | | Previously
Reported | | Restated | |
Class T | |
Net Asset Value, Beginning of Period | | | 9.98 | | | | 9.98 | | |
Net Investment Income (Loss) | | | 0.02 | | | | 0.05 | | |
Net realized and unrealized gain (loss) | | | 0.65 | | | | 0.44 | | |
Total income(loss) from investment operations | | | 0.67 | | | | 0.49 | | |
Distributions to shareholders from: | |
Net Investment Income | | | — | | | | — | | |
Return of Capital | | | — | | | | — | | |
Total Distributions | | | — | | | | — | | |
Less (gain) loss attributable to non-controlling interest | | | (0.18 | ) | | | — | | |
Net Asset Value, End of Period | | | 10.47 | | | | 10.47 | | |
Total Return (%) | | | 4.91 | % | | | 4.91 | % | |
Ratios of expenses to average net assets: | |
Before fees waived and expenses absorbed/recouped | | | 1.98 | % | | | 0.84 | % | |
After fees waived and expenses absorbed/recouped | | | 1.72 | % | | | 0.75 | % | |
Ratios of net investment income (loss) to average net assets: | |
Before fees waived and expenses absorbed/recouped | | | 0.07 | % | | | 0.69 | % | |
After fees waived and expenses absorbed/recouped | | | 0.33 | % | | | 0.78 | % | |
Financial Highlights for the period ended November 30, 2013
| | | Previously
Reported | | Restated | |
Class A | |
Net Asset Value, Beginning of Period | | | 9.69 | | | | 9.69 | | |
Net Investment Income (Loss) | | | (0.04 | ) | | | (0.02 | ) | |
Net realized and unrealized gain (loss) | | | 0.38 | | | | 0.40 | | |
Total income(loss) from investment operations | | | 0.34 | | | | 0.38 | | |
Distributions to shareholders from: | |
Net Investment Income | | | — | | | | — | | |
Return of Capital | | | — | | | | — | | |
Total Distributions | | | — | | | | — | | |
Less (gain) loss attributable to non-controlling interest | | | 0.04 | | | | — | | |
Net Asset Value, End of Period | | | 10.07 | | | | 10.07 | | |
Total Return (%) | | | 3.92 | % | | | 3.92 | % | |
Ratios of expenses to average net assets: | |
Before fees waived and expenses absorbed/recouped | | | 1.68 | % | | | 1.19 | % | |
After fees waived and expenses absorbed/recouped | | | 1.61 | % | | | 1.19 | % | |
Ratios of net investment income (loss) to average net assets: | |
Before fees waived and expenses absorbed/recouped | | | (0.46 | )% | | | (0.25 | )% | |
After fees waived and expenses absorbed/recouped | | | (0.39 | )% | | | (0.25 | )% | |
230
Victory Portfolios II | | Notes to Financial Statements — continued
December 31, 2015 | |
(Unaudited)
Financial Highlights for the period ended November 30, 2013 (continued)
| | | Previously
Reported | | Restated | |
Class C | |
Net Asset Value, Beginning of Period | | | 9.51 | | | | 9.51 | | |
Net Investment Income (Loss) | | | (0.11 | ) | | | (0.09 | ) | |
Net realized and unrealized gain (loss) | | | 0.38 | | | | 0.40 | | |
Total income(loss) from investment operations | | | 0.27 | | | | 0.31 | | |
Distributions to shareholders from: | |
Net Investment Income | | | — | | | | — | | |
Return of Capital | | | — | | | | — | | |
Total Distributions | | | — | | | | — | | |
Less (gain) loss attributable to non-controlling interest | | | 0.04 | | | | — | | |
Net Asset Value, End of Period | | | 9.82 | | | | 9.82 | | |
Total Return (%) | | | 3.26 | % | | | 3.26 | % | |
Ratios of expenses to average net assets: | |
Before fees waived and expenses absorbed/recouped | | | 2.43 | % | | | 1.94 | % | |
After fees waived and expenses absorbed/recouped | | | 2.36 | % | | | 1.94 | % | |
Ratios of net investment income (loss) to average net assets: | |
Before fees waived and expenses absorbed/recouped | | | (1.21 | )% | | | (1.00 | )% | |
After fees waived and expenses absorbed/recouped | | | (1.14 | )% | | | (1.00 | )% | |
Class T | |
Net Asset Value, Beginning of Period | | | 9.62 | | | | 9.62 | | |
Net Investment Income (Loss) | | | (0.06 | ) | | | (0.04 | ) | |
Net realized and unrealized gain (loss) | | | 0.38 | | | | 0.40 | | |
Total income(loss) from investment operations | | | 0.32 | | | | 0.36 | | |
Distributions to shareholders from: | |
Net Investment Income | | | — | | | | — | | |
Return of Capital | | | — | | | | — | | |
Total Distributions | | | — | | | | — | | |
Less (gain) loss attributable to non-controlling interest | | | 0.04 | | | | — | | |
Net Asset Value, End of Period | | | 9.98 | | | | 9.98 | | |
Total Return (%) | | | 3.74 | % | | | 3.74 | % | |
Ratios of expenses to average net assets: | |
Before fees waived and expenses absorbed/recouped | | | 1.93 | % | | | 1.37 | % | |
After fees waived and expenses absorbed/recouped | | | 1.86 | % | | | 1.37 | % | |
Ratios of net investment income (loss) to average net assets: | |
Before fees waived and expenses absorbed/recouped | | | (0.71 | )% | | | (0.50 | )% | |
After fees waived and expenses absorbed/recouped | | | (0.64 | )% | | | (0.50 | )% | |
231
| Victory Portfolios II | | Supplemental Information
December 31, 2015 | |
(Unaudited)
Trustee and Officer Information
Board of Trustees:
Overall responsibility for management of the Trust rests with the Board. The Trust is managed by the Board in accordance with the laws of the State of Delaware. There are currently eight Trustees, seven of whom are not "interested persons" of the Trust within the meaning of that term under the 1940 Act ("Independent Trustees") and one of whom is an "interested person" of the Trust within the meaning of that term under the 1940 Act ("Interested Trustee"). The Trustees, in turn, elect the officers of the Trust to actively supervise its day-to-day operations.
The following tables list the Trustees, their ages, position with the Trust, commencement of service, principal occupations during the past five years and any directorships of other investment companies or companies whose securities are registered under the Securities Exchange Act of 1934, as amended, or who file reports under that Act. Each Trustee oversees 26 portfolios in the Trust, one portfolio in Victory Variable Insurance Funds, one portfolio in Victory Institutional Funds and 25 portfolios in Victory Portfolios II, each a registered investment company that, together with the Trust, comprise the Victory Fund Complex. Each Trustee's address is c/o Victory Portfolios, 3435 Stelzer Road, Columbus, Ohio 43219. Each Trustee has an indefinite term.
| Name and Age | | Position
Held with
the Trust | | Date
Commenced
Service | | Principal Occupation
During Past 5 Years | | Other
Directorships
Held During
Past 5 Years | |
Independent Trustees. | |
David Brooks Adcock, 64 | | Trustee | | May 2015 | | Consultant (since 2006). | | FBR Funds (2011-2012). | |
Nigel D. T. Andrews, 68 | | Vice Chair and Trustee | | May 2015 | | Retired. | | Carlyle GMS Finance, Inc. (since 2012); Old Mutual plc. (2002-2011); Old Mutual US Asset Management (2002-2014). | |
E. Lee Beard, 64 | | Trustee | | May 2015 | | Retired (since 2015); Consultant, The Henlee Group, LLC (consulting) (2005-2015). | | Penn Millers Holding Corporation (January 2011-November 2011). | |
Sally M. Dungan, 61 | | Trustee | | May 2015 | | Chief Investment Officer, Tufts University (since 2002). | | ProCredit Holding Supervisory Board (2006-2011). | |
232
| Victory Portfolios II | | Supplemental Information — continued
December 31, 2015 | |
(Unaudited)
| Name and Age | | Position
Held with
the Trust | | Date
Commenced
Service | | Principal Occupation
During Past 5 Years | | Other
Directorships
Held During
Past 5 Years | |
John L. Kelly, 62 | | Trustee | | May 2015 | | Bulk physical commodities broker, Endgate Commodities LLC (since 2014); Chief Operating Officer, Liquidnet Holdings, Inc. (2011-2014); Managing Member, Crossroad LLC (Consultants) (2009-2011). | | Director, Caledonia Mining Corporation (since May 2012); Managing Member, Crossroad LLC (since May 2009). | |
David L. Meyer, 58 | | Trustee | | May 2015 | | Retired. | | None. | |
Leigh A. Wilson, 71 | | Chair and Trustee | | May 2015 | | Private Investor. | | Chair (since 2013) and Director (since 2012 and March-October 2008), Caledonia Mining Corporation; Director, The Mutual Fund Directors Forum (2004-2013). | |
Interested Trustee. | |
David C. Brown, 43 | | Trustee | | May 2015 | | Chief Executive Officer (since August 2013), Co-Chief Executive Officer (2011-2013), President — Investments and Operations (2010-2011) and Chief Operating Officer (2004-2011), the Adviser; Chief Executive Officer (since 2013), Victory Capital Holdings, Inc. | | None. | |
Mr. Brown is an "Interested Person" by reason of his relationship with the Adviser.
The Board has designated Mr. Meyer and Ms. Beard as its Audit Committee Financial Experts.
The Statement of Additional Information includes additional information about the Trustees of the Trust and is available, without charge, by calling 800-539-3863.
233
Victory Portfolios II | | Supplemental Information — continued
December 31, 2015 | |
(Unaudited)
Officers:
The officers of the Trust, their ages, commencement of service and their principal occupations during the past five years, are detailed in the following table. Each individual holds the same position with the other registered investment companies in the Victory Fund Complex, and each officer serves until the earlier of his or her resignation, removal, retirement, death, or the election of a successor. The mailing address of each officer of the Trust is 3435 Stelzer Road, Columbus, Ohio 43219. Except for the Chief Compliance Officer, the officers of the Trust receive no compensation directly from the Trust for performing the duties of their offices.
Name and Age | | Position with
the Trust | | Date
Commenced
Service | | Principal Occupation During Past 5 Years | |
Christopher K. Dyer, 54 | | President | | May 2015 | | Director of Mutual Fund Administration, the Adviser. | |
Scott A. Stahorsky, 46 | | Vice President | | May 2015 | | Manager, Fund Administration, the Adviser (since 2015); Senior Analyst, Fund Administration, the Adviser (prior to 2015). | |
Erin G. Wagner, 42 | | Secretary | | May 2015 | | Associate General Counsel, the Adviser (since 2013). | |
Christopher A. Ponte, 31 | | Treasurer | | May 2015 | | Senior Analyst, Fund Administration, the Adviser; Registered Principal, Victory Capital Advisers, Inc. (since 2011). | |
Edward J. Veilleux, 72 | | Chief Compliance Officer | | May 2015 | | President of EJV Financial Services (mutual fund consulting). | |
Chuck Booth, 55 | | Anti-Money Laundering Compliance Officer and Identity Theft Officer | | May 2015 | | Director, Regulatory Administration and CCO Support Services, Citi Fund Services Ohio, Inc. | |
Jay G. Baris, 62 | | Assistant Secretary | | May 2015 | | Partner, Morrison & Foerster LLP (since 2011). | |
234
Victory Portfolios II | | Supplemental Information — continued
December 31, 2015 | |
(Unaudited)
Proxy Voting and Form N-Q Information
Proxy Voting:
Information regarding the policies and procedures that the Funds use to determine how to vote proxies relating to portfolio securities is available without charge, upon request, by calling 800-539-3863. The information is also included in the Funds' Statement of Additional Information, which is available on the Securities and Exchange Commission's ("SEC") website at www.sec.gov.
Information relating to how the Funds voted proxies relating to portfolio securities held during the most recent twelve months ended June 30 is available on the SEC's website at www.sec.gov.
Availability of Schedules of Investments:
The Trust files a complete list of schedules of investments with the SEC for the first and third quarters of each fiscal year on Form N-Q. Forms N-Q are available on the SEC's website at www.sec.gov. You may also review or, for a fee, copy those documents by visiting the SEC's Public Reference Room in Washington, D.C. Information on the operation of the Public Reference Room can be obtained by calling the SEC at 202-551-8090.
Expense Examples
As a shareholder of the Funds, you incur two types of costs: (1) transaction costs, including sales charges (loads) on purchases and (2) ongoing costs, including management fees; distribution and service (12b-1) fees; and other Fund expenses. These examples are intended to help you understand your ongoing costs (in dollars) of investing in the Funds and to compare these costs with the ongoing costs of investing in other mutual funds.
These examples are based on an investment of $1,000 invested at the beginning of the period and held for the entire period (unless otherwise noted) from July 1, 2015, through December 31, 2015.
Actual Expenses:
The table below provides information about actual account values and actual expenses. You may use the information below, together with the amount you invested, to estimate the expenses that you paid over the period. Simply divide your account value by $1,000 (for example, an $8,600 account value divided by $1,000 = 8.6), then multiply the result by the number in the table under the heading entitled "Expenses Paid During Period" to estimate the expenses you paid on your account during this period.
| | | Beginning
Account Value
7/1/15 | | Ending
Account Value
12/31/15 | | Expenses Paid
During Period*
7/1/15-12/31/15 | | Expense Ratio
During Period**
7/1/15-12/31/15 | |
Victory CEMP US 500 Volatility Wtd Index Fund | |
Class A Shares | | $ | 1,000.00 | | | $ | 978.20 | | | $ | 4.92 | | | | 0.99 | % | |
Class C Shares | | | 1,000.00 | | | | 974.50 | | | | 8.64 | | | | 1.74 | % | |
Class I Shares | | | 1,000.00 | | | | 978.70 | | | | 3.68 | | | | 0.74 | % | |
Victory CEMP US Small Cap Volatility Wtd Index Fund | |
Class A Shares | | | 1,000.00 | | | | 932.40 | | | | 4.81 | | | | 0.99 | % | |
Class C Shares | | | 1,000.00 | | | | 929.20 | | | | 8.44 | | | | 1.74 | % | |
Class I Shares | | | 1,000.00 | | | | 933.20 | | | | 3.60 | | | | 0.74 | % | |
Victory CEMP International Volatility Wtd Index Fund | |
Class A Shares | | | 1,000.00 | | | | 927.90 | | | | 5.33 | | | | 1.10 | % | |
Class C Shares | | | 1,000.00 | | | | 924.20 | | | | 8.95 | | | | 1.85 | % | |
Class I Shares | | | 1,000.00 | | | | 930.10 | | | | 4.12 | | | | 0.85 | % | |
Victory CEMP Emerging Market Volatility Wtd Index Fund | |
Class A Shares | | | 1,000.00 | | | | 838.40 | | | | 5.31 | | | | 1.15 | % | |
Class C Shares | | | 1,000.00 | | | | 834.40 | | | | 8.76 | | | | 1.90 | % | |
Class I Shares | | | 1,000.00 | | | | 838.20 | | | | 4.16 | | | | 0.90 | % | |
* Expenses are equal to the average account value multiplied by the Fund's annualized expense ratio multiplied by 184/366 (the number of days in the most recent fiscal half-year divided by the number of days in the fiscal year).
** Annualized
235
Victory Portfolios II | | Supplemental Information — continued
December 31, 2015 | |
(Unaudited)
| | Beginning
Account Value
7/1/15 | | Ending
Account Value
12/31/15 | | Expenses Paid
During Period*
7/1/15-12/31/15 | | Expense Ratio
During Period**
7/1/15-12/31/15 | |
Victory CEMP US 500 Enhanced Volatility Wtd Index Fund | |
Class A Shares | | $ | 1,000.00 | | | $ | 977.40 | | | $ | 4.92 | | | | 0.99 | % | |
Class C Shares | | | 1,000.00 | | | | 973.60 | | | | 8.63 | | | | 1.74 | % | |
Class I Shares | | | 1,000.00 | | | | 977.90 | | | | 3.68 | | | | 0.74 | % | |
Victory CEMP International Enhanced Volatility Wtd Index Fund | |
Class A Shares | | | 1,000.00 | | | | 890.10 | | | | 5.23 | | | | 1.10 | % | |
Class C Shares | | | 1,000.00 | | | | 886.30 | | | | 8.77 | | | | 1.85 | % | |
Class I Shares | | | 1,000.00 | | | | 890.50 | | | | 4.04 | | | | 0.85 | % | |
Victory CEMP REC Enhanced Volatility Wtd Index Fund | |
Class A Shares | | | 1,000.00 | | | | 995.20 | | | | 7.07 | | | | 1.41 | % | |
Class C Shares | | | 1,000.00 | | | | 991.30 | | | | 10.86 | | | | 2.17 | % | |
Class I Shares | | | 1,000.00 | | | | 994.80 | | | | 5.77 | | | | 1.15 | % | |
Victory CEMP Commodity Volatility Wtd Index Strategy Fund | |
Class A Shares | | | 1,000.00 | | | | 843.30 | | | | 5.10 | | | | 1.10 | % | |
Class C Shares | | | 1,000.00 | | | | 840.10 | | | | 8.56 | | | | 1.85 | % | |
Class I Shares | | | 1,000.00 | | | | 844.00 | | | | 3.94 | | | | 0.85 | % | |
Victory CEMP Commodity Enhanced Volatility Wtd Index Strategy Fund | |
Class A Shares | | | 1,000.00 | | | | 875.10 | | | | 5.18 | | | | 1.10 | % | |
Class C Shares | | | 1,000.00 | | | | 873.40 | | | | 8.71 | | | | 1.85 | % | |
Class I Shares | | | 1,000.00 | | | | 877.90 | | | | 4.01 | | | | 0.85 | % | |
Victory CEMP Long/Short Strategy Fund | |
Class A Shares | | | 1,000.00 | | | | 976.70 | | | | 7.20 | | | | 1.45 | % | |
Class C Shares | | | 1,000.00 | | | | 974.10 | | | | 10.92 | | | | 2.20 | % | |
Class I Shares | | | 1,000.00 | | | | 979.20 | | | | 5.97 | | | | 1.20 | % | |
Victory CEMP Market Neutral Income Fund | |
Class A Shares | | | 1,000.00 | | | | 1,005.50 | | | | 4.54 | | | | 0.90 | % | |
Class C Shares | | | 1,000.00 | | | | 1,002.10 | | | | 8.30 | | | | 1.65 | % | |
Class I Shares | | | 1,000.00 | | | | 1,006.70 | | | | 3.28 | | | | 0.65 | % | |
Victory CEMP Enhanced Fixed Income Fund | |
Class A Shares | | | 1,000.00 | | | | 992.20 | | | | 3.56 | | | | 0.71 | % | |
Class C Shares | | | 1,000.00 | | | | 988.50 | | | | 7.30 | | | | 1.46 | % | |
Class I Shares | | | 1,000.00 | | | | 992.10 | | | | 2.30 | | | | 0.46 | % | |
Victory CEMP Ultra Short Term Fixed Income Fund | |
Class A Shares | | | 1,000.00 | | | | 999.50 | | | | 2.51 | | | | 0.50 | % | |
Class I Shares | | | 1,000.00 | | | | 1,001.70 | | | | 1.26 | | | | 0.25 | % | |
Balanced Fund | |
Class A Shares | | | 1,000.00 | | | | 958.10 | | | | 2.46 | | | | 0.50 | % | |
Class C Shares | | | 1,000.00 | | | | 953.90 | | | | 6.14 | | | | 1.25 | % | |
Growth Fund | |
Class A Shares | | | 1,000.00 | | | | 941.60 | | | | 2.44 | | | | 0.50 | % | |
Class C Shares | | | 1,000.00 | | | | 938.20 | | | | 6.09 | | | | 1.25 | % | |
Alternative Strategies Fund | |
Class A Shares | | | 1,000.00 | | | | 945.70 | | | | 2.45 | | | | 0.50 | % | |
Class C Shares | | | 1,000.00 | | | | 942.50 | | | | 6.10 | | | | 1.25 | % | |
* Expenses are equal to the average account value multiplied by the Fund's annualized expense ratio multiplied by 184/366 (the number of days in the most recent fiscal half-year divided by the number of days in the fiscal year).
** Annualized
236
Victory Portfolios II | | Supplemental Information — continued
December 31, 2015 | |
(Unaudited)
Hypothetical Example for Comparison Purposes:
The table below provides information about hypothetical account values and hypothetical expenses based on each Fund's actual expense ratio and an assumed rate of return of 5% per year before expenses, which is not the Fund's actual return. The hypothetical account values and expenses may not be used to estimate the actual ending account balance or expenses you paid for the period. You may use this information to compare this 5% hypothetical example with the 5% hypothetical examples that appear in the shareholder reports of other funds.
Please note that the expenses shown in the table are meant to highlight your ongoing costs only and do no reflect any transactional costs. Therefore, the table is useful in comparing ongoing costs only, and will not help you determine the relative total costs of owning different funds. In addition, if these transactional costs were included, your costs would have been higher.
| | | Beginning
Account Value
7/1/15 | | Ending
Account Value
12/31/15 | | Expenses Paid
During Period*
7/1/15-12/31/15 | | Expense Ratio
During Period**
7/1/15-12/31/15 | |
Victory CEMP US 500 Volatility Wtd Index Fund | |
Class A Shares | | $ | 1,000.00 | | | $ | 1,020.16 | | | $ | 5.03 | | | | 0.99 | % | |
Class C Shares | | | 1,000.00 | | | | 1,016.39 | | | | 8.82 | | | | 1.74 | % | |
Class I Shares | | | 1,000.00 | | | | 1,021.42 | | | | 3.76 | | | | 0.74 | % | |
Victory CEMP US Small Cap Volatility Wtd Index Fund | |
Class A Shares | | | 1,000.00 | | | | 1,020.16 | | | | 5.03 | | | | 0.99 | % | |
Class C Shares | | | 1,000.00 | | | | 1,016.39 | | | | 8.82 | | | | 1.74 | % | |
Class I Shares | | | 1,000.00 | | | | 1,021.42 | | | | 3.76 | | | | 0.74 | % | |
Victory CEMP International Volatility Wtd Index Fund | |
Class A Shares | | | 1,000.00 | | | | 1,019.61 | | | | 5.58 | | | | 1.10 | % | |
Class C Shares | | | 1,000.00 | | | | 1,015.84 | | | | 9.37 | | | | 1.85 | % | |
Class I Shares | | | 1,000.00 | | | | 1,020.86 | | | | 4.32 | | | | 0.85 | % | |
Victory CEMP Emerging Market Volatility Wtd Index Fund | |
Class A Shares | | | 1,000.00 | | | | 1,019.36 | | | | 5.84 | | | | 1.15 | % | |
Class C Shares | | | 1,000.00 | | | | 1,015.58 | | | | 9.63 | | | | 1.90 | % | |
Class I Shares | | | 1,000.00 | | | | 1,020.61 | | | | 4.57 | | | | 0.90 | % | |
Victory CEMP US 500 Enhanced Volatility Wtd Index Fund | |
Class A Shares | | | 1,000.00 | | | | 1,020.16 | | | | 5.03 | | | | 0.99 | % | |
Class C Shares | | | 1,000.00 | | | | 1,016.39 | | | | 8.82 | | | | 1.74 | % | |
Class I Shares | | | 1,000.00 | | | | 1,021.42 | | | | 3.76 | | | | 0.74 | % | |
Victory CEMP International Enhanced Volatility Wtd Index Fund | |
Class A Shares | | | 1,000.00 | | | | 1,019.61 | | | | 5.58 | | | | 1.10 | % | |
Class C Shares | | | 1,000.00 | | | | 1,015.84 | | | | 9.37 | | | | 1.85 | % | |
Class I Shares | | | 1,000.00 | | | | 1,020.86 | | | | 4.32 | | | | 0.85 | % | |
Victory CEMP REC Enhanced Volatility Wtd Index Fund | |
Class A Shares | | | 1,000.00 | | | | 1,018.05 | | | | 7.15 | | | | 1.41 | % | |
Class C Shares | | | 1,000.00 | | | | 1,014.23 | | | | 10.99 | | | | 2.17 | % | |
Class I Shares | | | 1,000.00 | | | | 1,019.36 | | | | 5.84 | | | | 1.15 | % | |
Victory CEMP Commodity Volatility Wtd Index Strategy Fund | |
Class A Shares | | | 1,000.00 | | | | 1,019.61 | | | | 5.58 | | | | 1.10 | % | |
Class C Shares | | | 1,000.00 | | | | 1,015.84 | | | | 9.34 | | | | 1.85 | % | |
Class I Shares | | | 1,000.00 | | | | 1,020.86 | | | | 4.32 | | | | 0.85 | % | |
Victory CEMP Commodity Enhanced Volatility Wtd Index Strategy Fund | |
Class A Shares | | | 1,000.00 | | | | 1,019.61 | | | | 5.58 | | | | 1.10 | % | |
Class C Shares | | | 1,000.00 | | | | 1,015.84 | | | | 9.34 | | | | 1.85 | % | |
Class I Shares | | | 1,000.00 | | | | 1,020.86 | | | | 4.32 | | | | 0.85 | % | |
* Expenses are equal to the average account value multiplied by the Fund's annualized expense ratio multiplied by 184/366 (the number of days in the most recent fiscal half-year divided by the number of days in the fiscal year).
** Annualized
237
Victory Portfolios II | | Supplemental Information — continued
December 31, 2015 | |
(Unaudited)
| | Beginning
Account Value
7/1/15 | | Ending
Account Value
12/31/15 | | Expenses Paid
During Period*
7/1/15-12/31/15 | | Expense Ratio
During Period**
7/1/15-12/31/15 | |
Victory CEMP Long/Short Strategy Fund | |
Class A Shares | | $ | 1,000.00 | | | $ | 1,017.85 | | | $ | 7.35 | | | | 1.45 | % | |
Class C Shares | | | 1,000.00 | | | | 1,014.08 | | | | 11.14 | | | | 2.20 | % | |
Class I Shares | | | 1,000.00 | | | | 1,019.10 | | | | 6.09 | | | | 1.20 | % | |
Victory CEMP Market Neutral Income Fund | |
Class A Shares | | | 1,000.00 | | | | 1,020.61 | | | | 4.57 | | | | 0.90 | % | |
Class C Shares | | | 1,000.00 | | | | 1,016.84 | | | | 8.36 | | | | 1.65 | % | |
Class I Shares | | | 1,000.00 | | | | 1,021.87 | | | | 3.30 | | | | 0.65 | % | |
Victory CEMP Enhanced Fixed Income Fund | |
Class A Shares | | | 1,000.00 | | | | 1,021.57 | | | | 3.61 | | | | 0.71 | % | |
Class C Shares | | | 1,000.00 | | | | 1,017.80 | | | | 7.41 | | | | 1.46 | % | |
Class I Shares | | | 1,000.00 | | | | 1,022.82 | | | | 2.34 | | | | 0.46 | % | |
Victory CEMP Ultra Short Term Fixed Income Fund | |
Class A Shares | | | 1,000.00 | | | | 1,022.62 | | | | 2.54 | | | | 0.50 | % | |
Class I Shares | | | 1,000.00 | | | | 1,023.88 | | | | 1.27 | | | | 0.25 | % | |
Balanced Fund | |
Class A Shares | | | 1,000.00 | | | | 1,022.62 | | | | 2.54 | | | | 0.50 | % | |
Class C Shares | | | 1,000.00 | | | | 1,018.85 | | | | 6.34 | | | | 1.25 | % | |
Growth Fund | |
Class A Shares | | | 1,000.00 | | | | 1,022.62 | | | | 2.54 | | | | 0.50 | % | |
Class C Shares | | | 1,000.00 | | | | 1,018.85 | | | | 6.34 | | | | 1.25 | % | |
Alternative Strategies Fund | |
Class A Shares | | | 1,000.00 | | | | 1,022.62 | | | | 2.54 | | | | 0.50 | % | |
Class C Shares | | | 1,000.00 | | | | 1,018.85 | | | | 6.34 | | | | 1.25 | % | |
* Expenses are equal to the average account value multiplied by the Fund's annualized expense ratio multiplied by 184/366 (the number of days in the most recent fiscal half-year divided by the number of days in the fiscal year).
** Annualized
Change in Independent Registered Public Accounting Firm:
BBD LLP was previously the principal accountant for Compass EMP Funds. On August 19, 2015 that firm resigned and Cohen Fund Audit Services, LTD was engaged as principal accountants. The decision to change accountants was approved by the audit committee of the Board of Trustees.
During the fiscal year ended June 30, 2015, there were no: (1) disagreements with BBD LLP on any matter of accounting principles or practices, financial statement disclosure or auditing scope or procedures, which disagreements if not resolved to their satisfaction would have caused them to make reference in connection with their opinion to the subject matter of the disagreements, or (2) reportable events.
The audit reports of BBD LLP on the financial statements of Compass EMP Funds as of and for the year ended June 30, 2015 did not contain any adverse opinion or disclaimer of opinion, nor were they qualified or modified as to uncertainty, audit scope or accounting principles.
238
Victory Portfolios II | | Supplemental Information — continued
December 31, 2015 | |
(Unaudited)
Portfolio Holdings:
(As a Percentage of Total Investments)
Victory CEMP US 500 Volatility Wtd Index Fund | | Victory CEMP US Small Cap Volatility Wtd Index Fund | |

| | 
| |
Victory CEMP International Volatility Wtd
Index Fund | | Victory CEMP Emerging Market Volatility Wtd
Index Fund | |
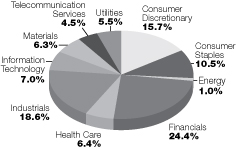
| | 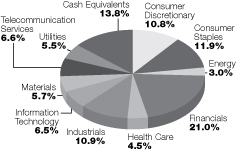
| |
Victory CEMP US 500 Enhanced Volatility Wtd
Index Fund | | Victory CEMP International Enhanced
Volatility Wtd Index Fund | |
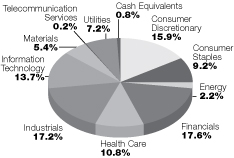
| | 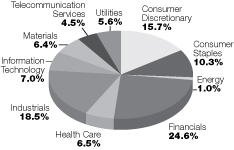
| |
239
Victory Portfolios II | | Supplemental Information — continued
December 31, 2015 | |
(Unaudited)
Victory CEMP REC Enhanced Volatility Wtd
Index Fund | | Victory CEMP Commodity Volatility Wtd Index
Strategy Fund | |
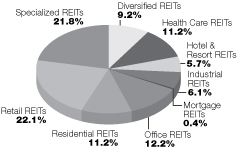
| | 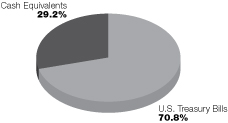
| |
Victory CEMP Commodity Enhanced Volatility Wtd
Index Strategy Fund | | Victory CEMP Long/Short Strategy Fund | |
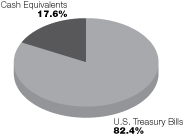
| | 
| |
Victory CEMP Market Neutral Income Fund | | Victory CEMP Enhanced Fixed Income Fund | |
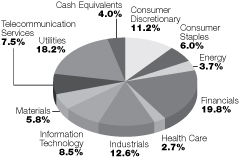
| | 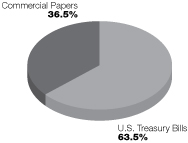
| |
240
Victory Portfolios II | | Supplemental Information — continued
December 31, 2015 | |
(Unaudited)
Victory CEMP Ultra Short Term Fixed Income Fund | | Victory CEMP Multi-Asset Balanced Fund | |
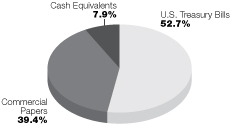
| | 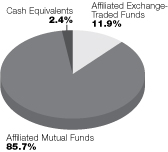
| |
Victory CEMP Multi-Asset Growth Fund | | Victory CEMP Alternative Strategies Fund | |
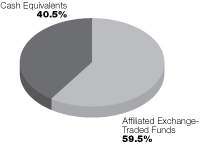
| | 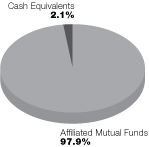
| |
241
The Victory Funds
P.O. Box 182593
Columbus, Ohio 43218-2593

Visit our website at: | | Call Victory at: | |
www.compassempfunds.com | | 800-539-FUND (800-539-3863) | |
VP-COMPASS-SAR (12/15)
Item 2. Code of Ethics.
Not applicable — only for annual reports.
Item 3. Audit Committee Financial Expert.
Not applicable — only for annual reports.
Item 4. Principal Accountant Fees and Services.
Not applicable — only for annual reports.
Item 5. Audit Committee of Listed Registrants.
Not applicable.
Item 6. Investments.
(a) Not applicable.
(b) Not applicable.
Item 7. Disclosure of Proxy Voting Policies and Procedures for Closed-End Management Investment Companies.
Not applicable.
Item 8. Portfolio Managers of Closed-End Management Investment Companies.
Not applicable.
Item 9. Purchases of Equity Securities by Closed-End Management Investment Company and Affiliated Purchasers.
Not applicable.
Item 10. Submission of Matters to a Vote of Security Holders.
Not applicable.
Item 11. Controls and Procedures.
(a)The registrant’s principal executive officer and principal financial officer have concluded, based on their evaluation of the registrant’s disclosure controls and procedures as conducted within 90 days of the filing date of this report, that these disclosure controls and procedures are adequately designed and are operating effectively to ensure that information required to be disclosed by the registrant on Form N-CSR is recorded, processed, summarized and reported within the time periods specified in the Securities and Exchange Commission’s rules and forms.
(b)There were no changes in the registrant’s internal control over financial reporting (as defined in Rule 30a-3(d) under the Investment Company Act of 1940 (17 CFR 270.30a-3(d)) that occurred during the second fiscal quarter of the period covered by this report that have materially affected or are reasonably likely to materially affect, the registrant’s internal control over financial reporting.
Item 12. Exhibits.
(a)(1) Not applicable.
(a)(2) Certifications pursuant to Rule 30a-2(a) are attached hereto.
(a)(3) Not applicable.
(b) Certifications pursuant to Rule 30a-2(b) are furnished herewith.
SIGNATURES
Pursuant to the requirements of the Securities Exchange Act of 1934 and the Investment Company Act of 1940, the registrant has duly caused this report to be signed on its behalf by the undersigned, thereunto duly authorized. |
| |
(Registrant) | Victory Portfolios II | |
| |
By (Signature and Title)* | /s/ Christopher A. Ponte | |
| Christopher A. Ponte, Principal Financial Officer | |
| |
Date | March 1, 2016 | |
|
|
Pursuant to the requirements of the Securities Exchange Act of 1934 and the Investment Company Act of 1940, this report has been signed below by the following persons on behalf of the registrant and in the capacities and on the dates indicated. |
| |
By (Signature and Title)* | /s/ Christopher K. Dyer | |
| Christopher K. Dyer, Principal Executive Officer | |
| |
Date | March 1, 2016 | |
| | |
By (Signature and Title)* | /s/ Christopher A. Ponte | |
| Christopher A. Ponte, Principal Financial Officer | |
| |
Date | March 1, 2016 | |
| | | | |